Embed Size (px)
Citation preview
Soybean Transportation Guide: Brazil 2016
AgriculturalMarketing Service
May 2017
United States Department of AgricultureMarketing and Regulatory ProgramsAgricultural Marketing ServiceTransportation and Marketing Programs
May 2017
Author:Delmy L. Salin, USDA, Agricultural Marketing Service
Graphic Designer:Jessica E. Ladd, USDA, Agricultural Marketing Service
Preferred CitationSalin, Delmy. Soybean Transportation Guide: Brazil 2016. May 2017. U.S. Dept. of Agriculture, Agricultural Marketing Service. Web. <http://dx.doi.org/10.9752/TS048.05-2017>
In accordance with Federal civil rights law and U.S. Department of Agriculture (USDA) civil rights regulations and policies, the USDA, its Agencies, offices, and employees, and institutions participating in or administering USDA programs are prohibited from discriminating based on race, color, national origin, religion, sex, gender identity (including gender expres-sion), sexual orientation, disability, age, marital status, family/parental status, income derived from a public assistance pro-gram, political beliefs, or reprisal or retaliation for prior civil rights activity, in any program or activity conducted or funded by USDA (not all bases apply to all programs). Remedies and complaint filing deadlines vary by program or incident.
Persons with disabilities who require alternative means of communication for program information (e.g., Braille, large print, audiotape, American Sign Language, etc.) should contact the responsible Agency or USDA’s TARGET Center at (202) 720-2600 (voice and TTY) or contact USDA through the Federal Relay Service at (800) 877-8339. Additionally, program information may be made available in languages other than English.
To file a program discrimination complaint, complete the USDA Program Discrimination Complaint Form, AD-3027, found online at How to File a Program Discrimination Complaint and at any USDA office or write a letter addressed to USDA and provide in the letter all of the information requested in the form. To request a copy of the complaint form, call (866) 632-9992. Submit your completed form or letter to USDA by: (1) mail: U.S. Department of Agriculture, Office of the Assistant Secretary for Civil Rights, 1400 Independence Avenue, SW, Washington, D.C. 20250-9410; (2) fax: (202) 690-7442; or (3) email: [email protected].
USDA is an equal opportunity provider, employer, and lender.
Contents
Executive Summary............................................................................................................................................ ii
General Information............................................................................................................................................. 1
2016 Summary..................................................................................................................................................... 2
Transportation Infrastructural Developments........................................................................................................ 18
Transportation Indicators..................................................................................................................................... 23
Soybean Production............................................................................................................................................. 34
Exports................................................................................................................................................................. 36
Exports to China.................................................................................................................................................. 41
Transportation Modes.......................................................................................................................................... 50
Reference Material............................................................................................................................................... 69
i
Soybean Transportation Guide: Brazil
ii
Executive Summary
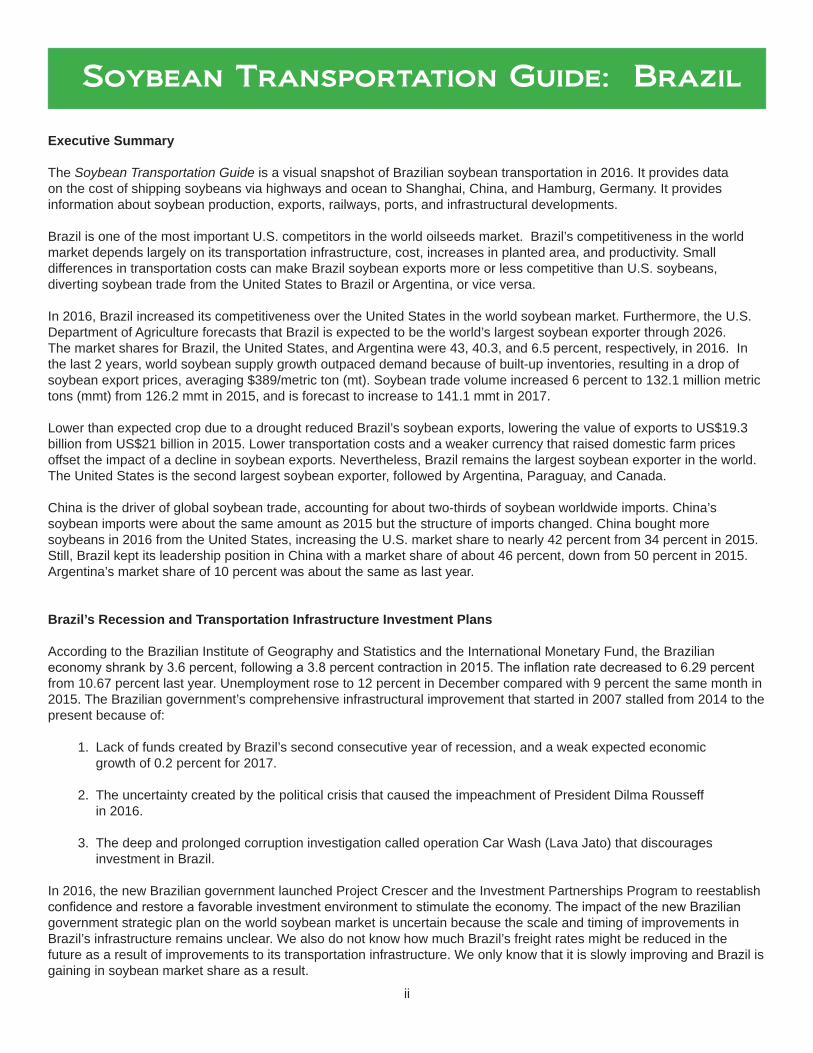
The Soybean Transportation Guide is a visual snapshot of Brazilian soybean transportation in 2016. It provides data on the cost of shipping soybeans via highways and ocean to Shanghai, China, and Hamburg, Germany. It provides information about soybean production, exports, railways, ports, and infrastructural developments.
Brazil is one of the most important U.S. competitors in the world oilseeds market. Brazil’s competitiveness in the world market depends largely on its transportation infrastructure, cost, increases in planted area, and productivity. Small differences in transportation costs can make Brazil soybean exports more or less competitive than U.S. soybeans, diverting soybean trade from the United States to Brazil or Argentina, or vice versa.
In 2016, Brazil increased its competitiveness over the United States in the world soybean market. Furthermore, the U.S. Department of Agriculture forecasts that Brazil is expected to be the world’s largest soybean exporter through 2026. The market shares for Brazil, the United States, and Argentina were 43, 40.3, and 6.5 percent, respectively, in 2016. In the last 2 years, world soybean supply growth outpaced demand because of built-up inventories, resulting in a drop of soybean export prices, averaging $389/metric ton (mt). Soybean trade volume increased 6 percent to 132.1 million metric tons (mmt) from 126.2 mmt in 2015, and is forecast to increase to 141.1 mmt in 2017.
Lower than expected crop due to a drought reduced Brazil’s soybean exports, lowering the value of exports to US$19.3 billion from US$21 billion in 2015. Lower transportation costs and a weaker currency that raised domestic farm prices offset the impact of a decline in soybean exports. Nevertheless, Brazil remains the largest soybean exporter in the world. The United States is the second largest soybean exporter, followed by Argentina, Paraguay, and Canada.
China is the driver of global soybean trade, accounting for about two-thirds of soybean worldwide imports. China’s soybean imports were about the same amount as 2015 but the structure of imports changed. China bought more soybeans in 2016 from the United States, increasing the U.S. market share to nearly 42 percent from 34 percent in 2015. Still, Brazil kept its leadership position in China with a market share of about 46 percent, down from 50 percent in 2015. Argentina’s market share of 10 percent was about the same as last year.
Brazil’s Recession and Transportation Infrastructure Investment Plans
According to the Brazilian Institute of Geography and Statistics and the International Monetary Fund, the Brazilian economy shrank by 3.6 percent, following a 3.8 percent contraction in 2015. The inflation rate decreased to 6.29 percent from 10.67 percent last year. Unemployment rose to 12 percent in December compared with 9 percent the same month in 2015. The Brazilian government’s comprehensive infrastructural improvement that started in 2007 stalled from 2014 to the present because of:
1. Lack of funds created by Brazil’s second consecutive year of recession, and a weak expected economic growth of 0.2 percent for 2017.
2. The uncertainty created by the political crisis that caused the impeachment of President Dilma Rousseff in 2016.
3. The deep and prolonged corruption investigation called operation Car Wash (Lava Jato) that discourages investment in Brazil.
In 2016, the new Brazilian government launched Project Crescer and the Investment Partnerships Program to reestablish confidence and restore a favorable investment environment to stimulate the economy. The impact of the new Brazilian government strategic plan on the world soybean market is uncertain because the scale and timing of improvements in Brazil’s infrastructure remains unclear. We also do not know how much Brazil’s freight rates might be reduced in the future as a result of improvements to its transportation infrastructure. We only know that it is slowly improving and Brazil is gaining in soybean market share as a result.
iii
Soybean Transportation Cost and Export Demand
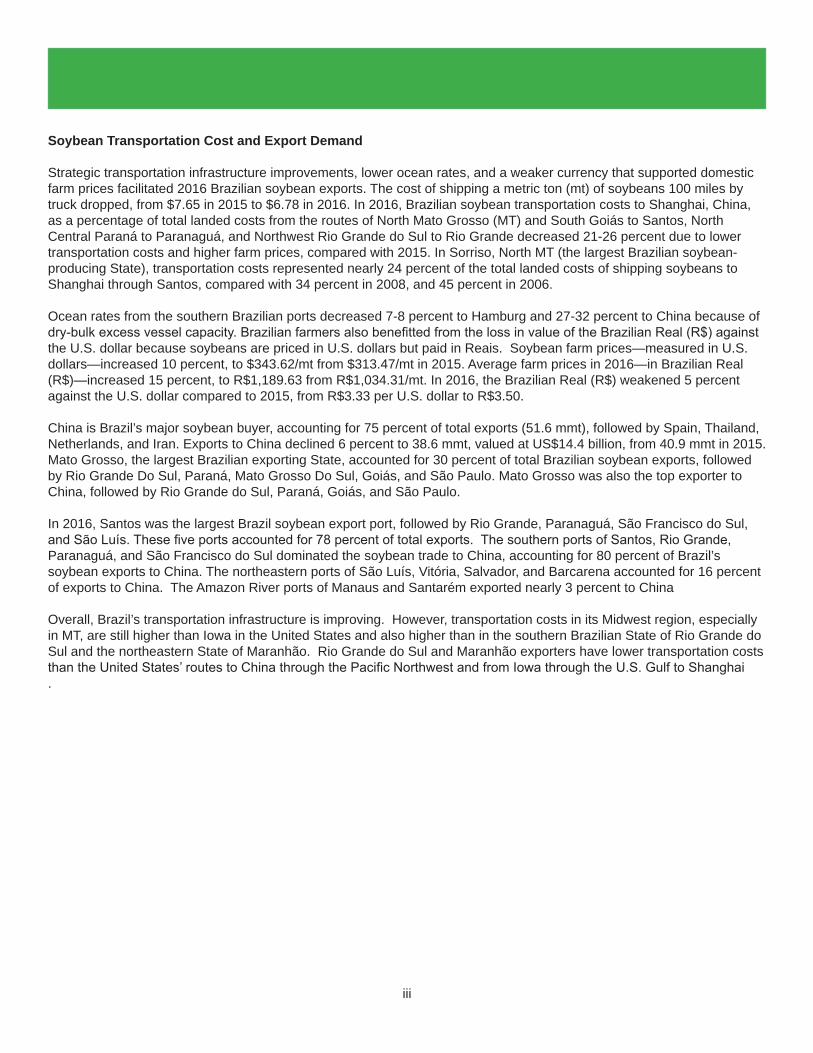
Strategic transportation infrastructure improvements, lower ocean rates, and a weaker currency that supported domestic farm prices facilitated 2016 Brazilian soybean exports. The cost of shipping a metric ton (mt) of soybeans 100 miles by truck dropped, from $7.65 in 2015 to $6.78 in 2016. In 2016, Brazilian soybean transportation costs to Shanghai, China, as a percentage of total landed costs from the routes of North Mato Grosso (MT) and South Goiás to Santos, North Central Paraná to Paranaguá, and Northwest Rio Grande do Sul to Rio Grande decreased 21-26 percent due to lower transportation costs and higher farm prices, compared with 2015. In Sorriso, North MT (the largest Brazilian soybean-producing State), transportation costs represented nearly 24 percent of the total landed costs of shipping soybeans to Shanghai through Santos, compared with 34 percent in 2008, and 45 percent in 2006.
Ocean rates from the southern Brazilian ports decreased 7-8 percent to Hamburg and 27-32 percent to China because of dry-bulk excess vessel capacity. Brazilian farmers also benefitted from the loss in value of the Brazilian Real (R$) against the U.S. dollar because soybeans are priced in U.S. dollars but paid in Reais. Soybean farm prices—measured in U.S. dollars—increased 10 percent, to $343.62/mt from $313.47/mt in 2015. Average farm prices in 2016—in Brazilian Real (R$)—increased 15 percent, to R$1,189.63 from R$1,034.31/mt. In 2016, the Brazilian Real (R$) weakened 5 percent against the U.S. dollar compared to 2015, from R$3.33 per U.S. dollar to R$3.50.
China is Brazil’s major soybean buyer, accounting for 75 percent of total exports (51.6 mmt), followed by Spain, Thailand, Netherlands, and Iran. Exports to China declined 6 percent to 38.6 mmt, valued at US$14.4 billion, from 40.9 mmt in 2015. Mato Grosso, the largest Brazilian exporting State, accounted for 30 percent of total Brazilian soybean exports, followed by Rio Grande Do Sul, Paraná, Mato Grosso Do Sul, Goiás, and São Paulo. Mato Grosso was also the top exporter to China, followed by Rio Grande do Sul, Paraná, Goiás, and São Paulo.
In 2016, Santos was the largest Brazil soybean export port, followed by Rio Grande, Paranaguá, São Francisco do Sul, and São Luís. These five ports accounted for 78 percent of total exports. The southern ports of Santos, Rio Grande, Paranaguá, and São Francisco do Sul dominated the soybean trade to China, accounting for 80 percent of Brazil’s soybean exports to China. The northeastern ports of São Luís, Vitória, Salvador, and Barcarena accounted for 16 percent of exports to China. The Amazon River ports of Manaus and Santarém exported nearly 3 percent to China
Overall, Brazil’s transportation infrastructure is improving. However, transportation costs in its Midwest region, especially in MT, are still higher than Iowa in the United States and also higher than in the southern Brazilian State of Rio Grande do Sul and the northeastern State of Maranhão. Rio Grande do Sul and Maranhão exporters have lower transportation costs than the United States’ routes to China through the Pacific Northwest and from Iowa through the U.S. Gulf to Shanghai.

Acknowledgments
The author would like to acknowledge Francisco P. Magalhães Gomes, (National Agency of Inland Transportation, ANTT), Rodrigo Vilaça and Juliano Dian (National Association of Railroads, ANTF), the Escola Superior de Agricultura “Luiz de Queiroz”/ Grupo de Pesquisa e Extensão em Logística Agroindustrial, ESALQ-LOG, the Assesoria de Comunicação dos Portos de Paranaguá e Antonina, ASSCOM-APPA, Maria Anulacion (USDA, Foreign Agricultural Service, International Production Assessment Division) for providing regional information and maps of Brazil. Comments and critiques by Keith Menzie and David Stallings (USDA, Office of the Chief Economist), Mark Ash (USDA, Economic Research Service), Nicolas Rubio (USDA, Foreign Agricultural Service (FAS), Agricultural Attaché, Brasilia), Pierre Bahizi (USDA, Agricultural Marketing Service), Bill George and Agata Kingsbury (USDA, FAS, Office of Global Analysis), are greatly appreciated. The author would also like to thank Becky Unkenholz, editor, and Jessica Ladd, graphic designer.
iv
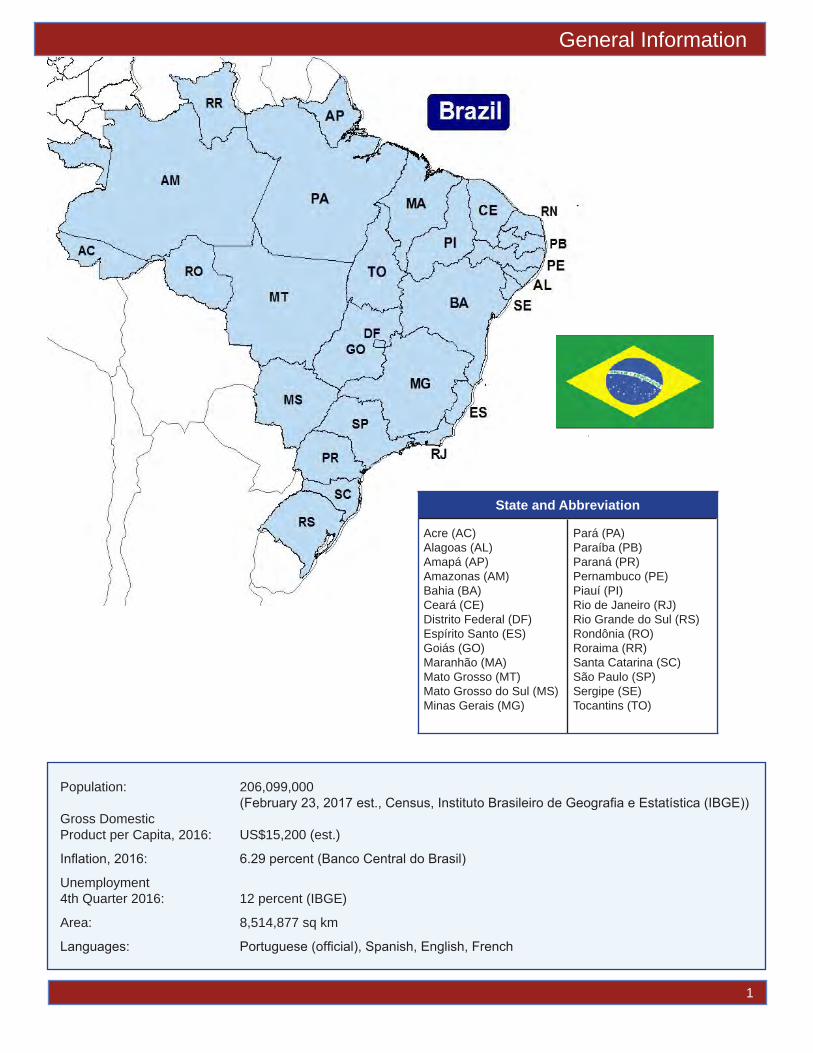
General Information
1
State and Abbreviation
Acre (AC)Alagoas (AL)Amapá (AP)Amazonas (AM)Bahia (BA)Ceará (CE)Distrito Federal (DF)Espírito Santo (ES)Goiás (GO)Maranhão (MA)Mato Grosso (MT)Mato Grosso do Sul (MS)Minas Gerais (MG)
Pará (PA) Paraíba (PB)Paraná (PR)Pernambuco (PE)Piauí (PI)Rio de Janeiro (RJ)Rio Grande do Sul (RS)Rondônia (RO)Roraima (RR)Santa Catarina (SC)São Paulo (SP)Sergipe (SE)Tocantins (TO)
Population: 206,099,000 (February 23, 2017 est., Census, Instituto Brasileiro de Geografia e Estatística (IBGE))
Gross Domestic Product per Capita, 2016: US$15,200 (est.)
Inflation, 2016: 6.29 percent (Banco Central do Brasil)
Unemployment 4th Quarter 2016: 12 percent (IBGE)
Area: 8,514,877 sq km
Languages: Portuguese (official), Spanish, English, French

Routes1 and regions considered in the Brazilian soybean export transportation indicators2
2016 Summary
1Table defining routes by number is shown on page 272Regions comprised about 81 percent of Brazilian soybean production, 2015Source: USDA/AMS & ESALQ - University of São Paulo (USP), Brazil
Source: USDA/AMS 2
Regions considered in the Brazilian soybean export transportation indicators.

2016
Sum
mar
y
Source: USDA/AMS 3
Cos
t of t
rans
port
ing
soyb
eans
from
Bra
zil t
o Sh
angh
ai, C
hina
2010
2011
2012
2013
2014
2015
2016
Perc
ent
chan
ge15
-16
2010
2011
2012
2013
2014
2015
2016
Perc
ent
chan
ge15
-16
Nor
th M
T1 - S
anto
s2
—U
S$/m
t—N
orth
wes
t RS1 -
Rio
Gra
nde2
—U
S$/m
t—
Truc
k11
6.78
123.
3111
1.78
116.
4010
3.90
86.0
475
.49
-14.
028
.18
38.9
425
.83
23.2
624
.56
26.3
718
.38
-30.
3
Oce
an55
.84
50.5
049
.70
40.9
636
.85
23.8
116
.63
-43.
258
.21
51.1
049
.69
41.5
237
.02
25.3
120
.50
-19.
0
Tota
l tra
nspo
rtatio
n17
2.62
173.
8116
1.48
157.
3614
0.75
109.
8692
.12
-19.
386
.39
90.0
375
.51
64.7
961
.58
51.6
838
.88
-24.
8
Farm
pric
e 331
8.15
392.
1048
3.31
415.
2838
8.33
295.
1733
1.91
11.1
344.
9041
5.87
483.
2245
9.33
442.
5233
1.55
352.
696.
4
Land
ed c
ost
490.
7756
5.91
644.
8057
2.64
529.
0840
5.02
424.
034.
543
1.29
505.
9055
8.73
524.
1150
4.10
383.
2339
1.57
2.2
Tran
spor
t %
of la
nded
cos
t38
.630
.628
.428
.427
.827
.121
.9-2
3.7
20.1
17.8
13.7
12.3
12.2
13.5
9.9
-26.
3
Nor
th C
ente
r PR
1 - P
aran
aguá
2
—U
S$/m
t—So
uth
GO
1 - S
anto
s2
—U
S$/m
t—
Truc
k34
.51
39.5
434
.76
32.2
630
.98
24.0
721
.31
-12.
964
.71
63.9
255
.02
58.9
062
.57
39.8
234
.66
-13.
0
Oce
an58
.92
57.3
255
.20
43.8
839
.21
24.9
218
.13
-37.
555
.84
50.5
049
.70
40.9
636
.85
23.8
116
.63
-30.
2
Tota
l tra
nspo
rtatio
n93
.43
96.8
689
.96
76.1
570
.19
48.9
939
.44
-24.
212
0.56
114.
4210
4.72
99.8
699
.42
63.6
351
.28
-19.
4
Farm
pric
e 335
0.44
431.
6651
3.81
470.
6643
3.91
323.
1534
0.74
5.2
324.
2741
2.89
479.
8042
8.06
401.
4930
4.36
329.
158.
1
Land
ed c
ost
443.
8752
8.52
603.
7654
6.80
504.
1037
2.14
380.
182.
144
4.82
527.
3158
4.52
527.
9350
0.91
368.
0038
0.43
3.4
Tran
spor
t %
of la
nded
cos
t21
.218
.415
.113
.913
.913
.110
.4-2
5.8
27.4
21.7
18.1
18.9
19.8
17.2
13.6
-21.
2
1 Pro
duci
ng re
gion
s: R
S =
Rio
Gra
nde
do S
ul, M
T= M
ato
Gro
sso,
GO
= G
oiás
, PR
= P
aran
á 2 E
xpor
t por
ts3 S
ourc
e: C
ompa
nhia
Nac
iona
l de
Aba
stec
imen
to (C
ON
AB
) ww
w.c
onab
.gov
.br
Sou
rce:
ES
ALQ
/ US
P (U
nive
rsity
of S
ão P
aulo
, Bra
zil)
and
US
DA
/AM
S
In 2
016,
Bra
zilia
n so
ybea
n tra
nspo
rtatio
n co
sts
to S
hang
hai,
Chi
na, a
s a
perc
enta
ge o
f tot
al la
nded
cos
ts fr
om th
e ro
utes
of N
orth
Mat
o G
ross
o (M
T) a
nd
Sou
th G
oiás
to S
anto
s, N
orth
Cen
tral P
aran
á to
Par
anag
uá, a
nd N
orth
wes
t Rio
Gra
nde
do S
ul to
Rio
Gra
nde
decr
ease
d 21
-26
perc
ent b
ecau
se o
f low
er
trans
porta
tion
cost
s an
d hi
gher
farm
pric
es, c
ompa
red
with
201
5. In
Sor
riso,
Nor
th M
T (th
e la
rges
t Bra
zilia
n so
ybea
n-pr
oduc
ing
stat
e) tr
ansp
orta
tion
cost
s re
pres
ente
d ne
arly
22
perc
ent o
f the
tota
l lan
ded
cost
s of
shi
ppin
g so
ybea
ns to
Sha
ngha
i thr
ough
San
tos,
com
pare
d w
ith 3
4 pe
rcen
t in
2008
and
45
perc
ent
in 2
006.
201
6 S
umm
ary
Source: USDA/AMS 4
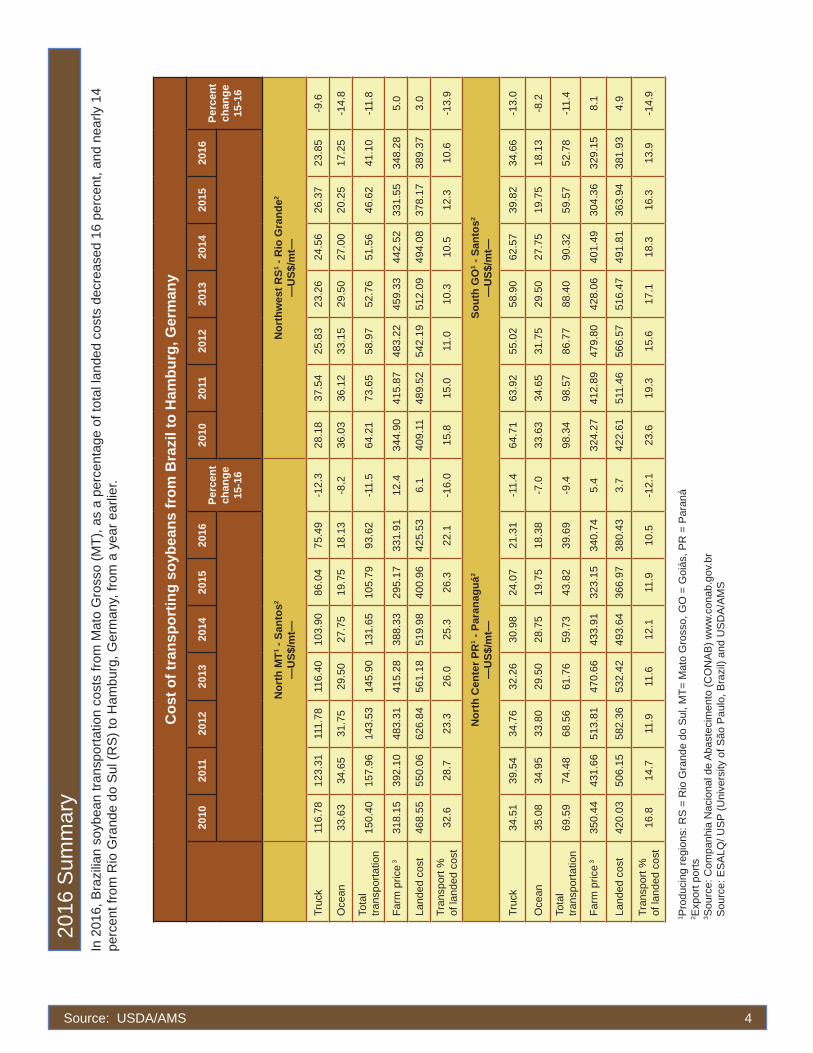
In 2
016,
Bra
zilia
n so
ybea
n tra
nspo
rtatio
n co
sts
from
Mat
o G
ross
o (M
T), a
s a
perc
enta
ge o
f tot
al la
nded
cos
ts d
ecre
ased
16
perc
ent,
and
near
ly 1
4 pe
rcen
t fro
m R
io G
rand
e do
Sul
(RS
) to
Ham
burg
, Ger
man
y, fr
om a
yea
r ear
lier.
1 Pro
duci
ng re
gion
s: R
S =
Rio
Gra
nde
do S
ul, M
T= M
ato
Gro
sso,
GO
= G
oiás
, PR
= P
aran
á 2 E
xpor
t por
ts
3 Sou
rce:
Com
panh
ia N
acio
nal d
e A
bast
ecim
ento
(CO
NA
B) w
ww
.con
ab.g
ov.b
r S
ourc
e: E
SA
LQ/ U
SP
(Uni
vers
ity o
f São
Pau
lo, B
razi
l) an
d U
SD
A/A
MS
Cos
t of t
rans
port
ing
soyb
eans
from
Bra
zil t
o H
ambu
rg, G
erm
any
2010
2011
2012
2013
2014
2015
2016
Perc
ent
chan
ge15
-16
2010
2011
2012
2013
2014
2015
2016
Perc
ent
chan
ge15
-16
Nor
th M
T1 - S
anto
s2
—U
S$/m
t—N
orth
wes
t RS1 -
Rio
Gra
nde2
—U
S$/m
t—
Truc
k11
6.78
123.
3111
1.78
116.
4010
3.90
86.0
475
.49
-12.
328
.18
37.5
425
.83
23.2
624
.56
26.3
723
.85
-9.6
Oce
an33
.63
34.6
531
.75
29.5
027
.75
19.7
518
.13
-8.2
36.0
336
.12
33.1
529
.50
27.0
020
.25
17.2
5-1
4.8
Tota
l tra
nspo
rtatio
n15
0.40
157.
9614
3.53
145.
9013
1.65
105.
7993
.62
-11.
564
.21
73.6
558
.97
52.7
651
.56
46.6
241
.10
-11.
8
Farm
pric
e 331
8.15
392.
1048
3.31
415.
2838
8.33
295.
1733
1.91
12.4
344.
9041
5.87
483.
2245
9.33
442.
5233
1.55
348.
285.
0
Land
ed c
ost
468.
5555
0.06
626.
8456
1.18
519.
9840
0.96
425.
536.
140
9.11
489.
5254
2.19
512.
0949
4.08
378.
1738
9.37
3.0
Tran
spor
t %
of la
nded
cos
t32
.628
.723
.326
.025
.326
.322
.1-1
6.0
15.8
15.0
11.0
10.3
10.5
12.3
10.6
-13.
9
Nor
th C
ente
r PR
1 - P
aran
aguá
2
—U
S$/m
t—So
uth
GO
1 - S
anto
s2
—U
S$/m
t—
Truc
k34
.51
39.5
434
.76
32.2
630
.98
24.0
721
.31
-11.
464
.71
63.9
255
.02
58.9
062
.57
39.8
234
.66
-13.
0
Oce
an35
.08
34.9
533
.80
29.5
028
.75
19.7
518
.38
-7.0
33.6
334
.65
31.7
529
.50
27.7
519
.75
18.1
3-8
.2
Tota
l tra
nspo
rtatio
n69
.59
74.4
868
.56
61.7
659
.73
43.8
239
.69
-9.4
98.3
498
.57
86.7
788
.40
90.3
259
.57
52.7
8-1
1.4
Farm
pric
e 335
0.44
431.
6651
3.81
470.
6643
3.91
323.
1534
0.74
5.4
324.
2741
2.89
479.
8042
8.06
401.
4930
4.36
329.
158.
1
Land
ed c
ost
420.
0350
6.15
582.
3653
2.42
493.
6436
6.97
380.
433.
742
2.61
511.
4656
6.57
516.
4749
1.81
363.
9438
1.93
4.9
Tran
spor
t %
of la
nded
cos
t16
.814
.711
.911
.612
.111
.910
.5-1
2.1
23.6
19.3
15.6
17.1
18.3
16.3
13.9
-14.
9

2016 Summary
Source: USDA/AMS 5
Transportation costs from the northern and northeastern ports to Shanghai, China, and Hamburg declined.
Costs of transporting Brazilian soybeans from the northern and northeastern ports to Shanghai, China
2015 2016 percentchange 2015 2016 percent
changeNorth MT1 - Santarém2
--US$/mt-- South MA1 - São Luís2
--US$/mt--
Truck 58.12 49.60 -14.7 36.15 31.04 -14.1
Ocean 26.56 21.54 -18.9 26.56 19.48 -26.7
Total transportation 84.68 71.14 -16.0 62.72 50.52 -19.5
Farm price 3 295.17 331.91 12.4 314.43 376.89 19.9
Landed cost 379.84 403.05 6.1 377.14 427.41 13.3
Transport % of landed cost 23.3 17.8 -23.5 16.6 12.0 -28.2
Southwest PI1 - São Luís2
--US$/mt--
Truck 43.0 34.23 -20.5
Ocean 26.6 19.48 -26.7
Total transportation 69.6 53.71 -22.8
Farm price 3 314.9 344.78 9.5
Landed cost 384.5 398.49 3.6
Transport % of landed cost 18.1 13.6 -24.4
1Producing regions: MT= Mato Grosso, PI = Piauí, MA = Maranhão 2Export ports3Source: Companhia Nacional de Abastecimento (CONAB) www.conab.gov.br Source: ESALQ/ USP (University of São Paulo, Brazil) and USDA/AMS
2016 Summary
Source: USDA/AMS 6
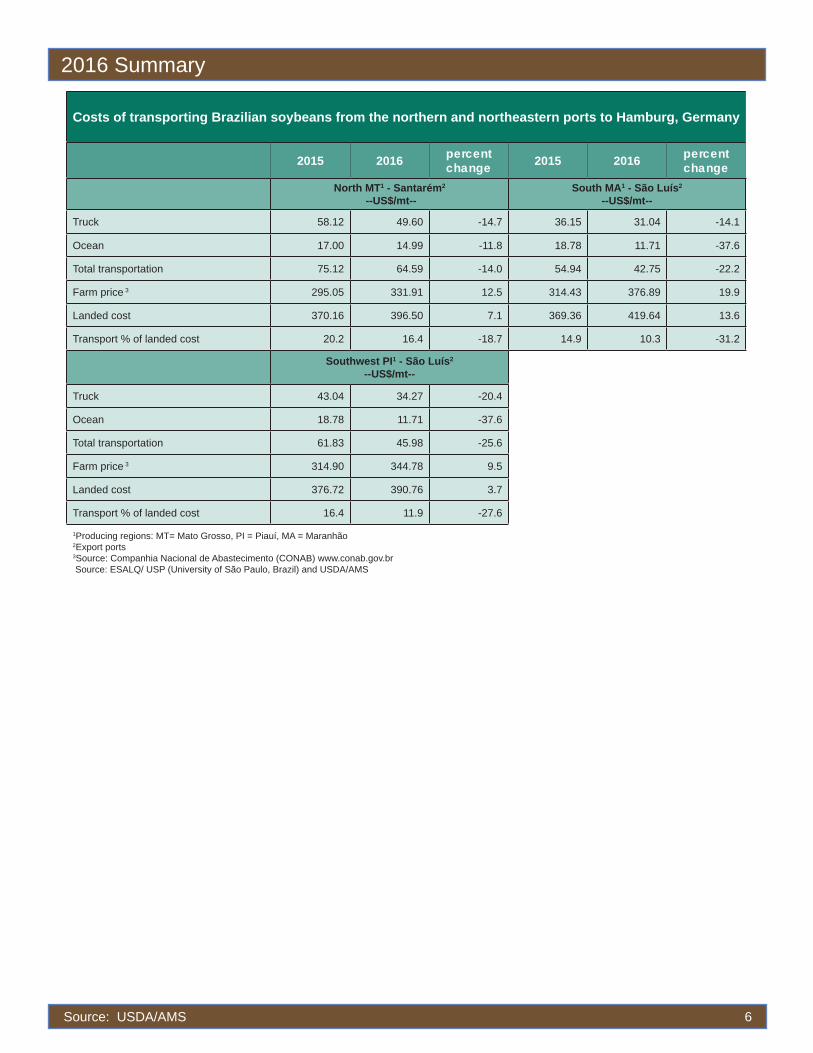
Costs of transporting Brazilian soybeans from the northern and northeastern ports to Hamburg, Germany
2015 2016 percentchange 2015 2016 percent
changeNorth MT1 - Santarém2
--US$/mt-- South MA1 - São Luís2
--US$/mt--
Truck 58.12 49.60 -14.7 36.15 31.04 -14.1
Ocean 17.00 14.99 -11.8 18.78 11.71 -37.6
Total transportation 75.12 64.59 -14.0 54.94 42.75 -22.2
Farm price 3 295.05 331.91 12.5 314.43 376.89 19.9
Landed cost 370.16 396.50 7.1 369.36 419.64 13.6
Transport % of landed cost 20.2 16.4 -18.7 14.9 10.3 -31.2
Southwest PI1 - São Luís2
--US$/mt--
Truck 43.04 34.27 -20.4
Ocean 18.78 11.71 -37.6
Total transportation 61.83 45.98 -25.6
Farm price 3 314.90 344.78 9.5
Landed cost 376.72 390.76 3.7
Transport % of landed cost 16.4 11.9 -27.6
1Producing regions: MT= Mato Grosso, PI = Piauí, MA = Maranhão 2Export ports3Source: Companhia Nacional de Abastecimento (CONAB) www.conab.gov.br Source: ESALQ/ USP (University of São Paulo, Brazil) and USDA/AMS
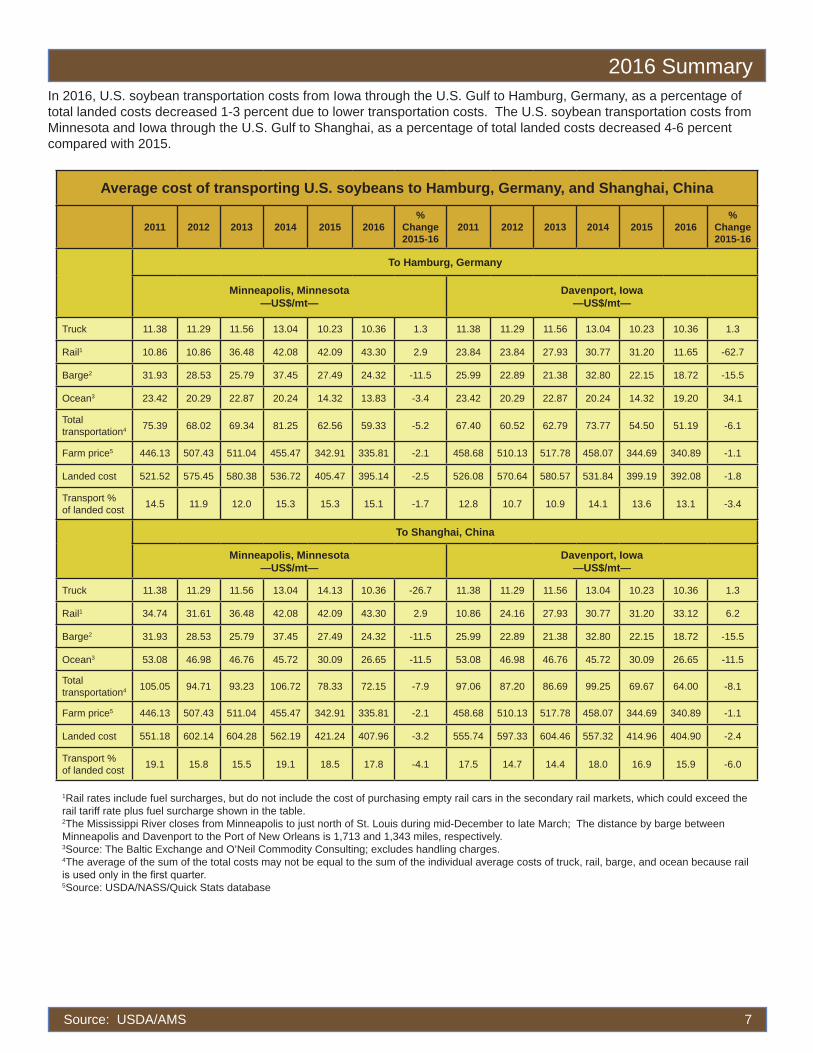
Average cost of transporting U.S. soybeans to Hamburg, Germany, and Shanghai, China
2011 2012 2013 2014 2015 2016%
Change 2015-16
2011 2012 2013 2014 2015 2016%
Change 2015-16
To Hamburg, Germany
Minneapolis, Minnesota—US$/mt—
Davenport, Iowa—US$/mt—
Truck 11.38 11.29 11.56 13.04 10.23 10.36 1.3 11.38 11.29 11.56 13.04 10.23 10.36 1.3
Rail1 10.86 10.86 36.48 42.08 42.09 43.30 2.9 23.84 23.84 27.93 30.77 31.20 11.65 -62.7
Barge2 31.93 28.53 25.79 37.45 27.49 24.32 -11.5 25.99 22.89 21.38 32.80 22.15 18.72 -15.5
Ocean3 23.42 20.29 22.87 20.24 14.32 13.83 -3.4 23.42 20.29 22.87 20.24 14.32 19.20 34.1
Total transportation4 75.39 68.02 69.34 81.25 62.56 59.33 -5.2 67.40 60.52 62.79 73.77 54.50 51.19 -6.1
Farm price5 446.13 507.43 511.04 455.47 342.91 335.81 -2.1 458.68 510.13 517.78 458.07 344.69 340.89 -1.1
Landed cost 521.52 575.45 580.38 536.72 405.47 395.14 -2.5 526.08 570.64 580.57 531.84 399.19 392.08 -1.8
Transport % of landed cost 14.5 11.9 12.0 15.3 15.3 15.1 -1.7 12.8 10.7 10.9 14.1 13.6 13.1 -3.4
To Shanghai, China
Minneapolis, Minnesota—US$/mt—
Davenport, Iowa—US$/mt—
Truck 11.38 11.29 11.56 13.04 14.13 10.36 -26.7 11.38 11.29 11.56 13.04 10.23 10.36 1.3
Rail1 34.74 31.61 36.48 42.08 42.09 43.30 2.9 10.86 24.16 27.93 30.77 31.20 33.12 6.2
Barge2 31.93 28.53 25.79 37.45 27.49 24.32 -11.5 25.99 22.89 21.38 32.80 22.15 18.72 -15.5
Ocean3 53.08 46.98 46.76 45.72 30.09 26.65 -11.5 53.08 46.98 46.76 45.72 30.09 26.65 -11.5
Total transportation4 105.05 94.71 93.23 106.72 78.33 72.15 -7.9 97.06 87.20 86.69 99.25 69.67 64.00 -8.1
Farm price5 446.13 507.43 511.04 455.47 342.91 335.81 -2.1 458.68 510.13 517.78 458.07 344.69 340.89 -1.1
Landed cost 551.18 602.14 604.28 562.19 421.24 407.96 -3.2 555.74 597.33 604.46 557.32 414.96 404.90 -2.4
Transport % of landed cost 19.1 15.8 15.5 19.1 18.5 17.8 -4.1 17.5 14.7 14.4 18.0 16.9 15.9 -6.0
1Rail rates include fuel surcharges, but do not include the cost of purchasing empty rail cars in the secondary rail markets, which could exceed the rail tariff rate plus fuel surcharge shown in the table.
2The Mississippi River closes from Minneapolis to just north of St. Louis during mid-December to late March; The distance by barge between Minneapolis and Davenport to the Port of New Orleans is 1,713 and 1,343 miles, respectively.3Source: The Baltic Exchange and O’Neil Commodity Consulting; excludes handling charges.4The average of the sum of the total costs may not be equal to the sum of the individual average costs of truck, rail, barge, and ocean because rail is used only in the first quarter.5Source: USDA/NASS/Quick Stats database
2016 SummaryIn 2016, U.S. soybean transportation costs from Iowa through the U.S. Gulf to Hamburg, Germany, as a percentage of total landed costs decreased 1-3 percent due to lower transportation costs. The U.S. soybean transportation costs from Minnesota and Iowa through the U.S. Gulf to Shanghai, as a percentage of total landed costs decreased 4-6 percent compared with 2015.
Source: USDA/AMS 7

In 2016, the cost per metric ton to ship soybeans from Sorriso, North Mato Grosso (MT) to Shanghai, China, was $28.11 more than from Davenport, IA. Sorriso is located 1,190 miles from the port of Santos. Davenport is about 900, 908, and 1,343 miles from the Port of New Orleans by truck, rail, and barge, respectively.
Transportation cost differences between Mato Grosso (MT) and Iowa (IA) to Shanghai, China
Average costs of transporting U.S. soybeans to Shanghai, China
2012 2013 2014 2015 2016%
change 2015-16
2012 2013 2014 2015 2016%
change 2015-16
To Shanghai, China via PNW
Fargo, ND --US$/mt--
Sioux Falls, SD--US$/mt--
Truck 11.29 11.56 13.04 10.23 10.36 1.3 11.29 11.56 13.04 10.23 10.44 2.0
Rail1 55.24 57.92 59.19 55.98 53.04 -5.3 57.01 59.38 60.74 57.20 54.02 -5.6
Ocean2 24.93 24.93 24.21 16.34 14.90 -8.8 24.93 24.93 24.21 16.34 14.85 -9.1
Total transportation 91.46 94.41 96.43 82.55 78.30 -5.1 93.23 95.87 97.99 83.77 79.31 -5.3
Farm price3 496.65 497.79 421.91 322.98 327.42 1.4 502.78 504.56 437.89 329.87 328.98 -0.3
Landed cost 588.11 592.20 518.34 405.52 405.72 0.0 596.00 600.43 535.88 413.64 408.29 -1.3
Transport % of landed cost 15.6 16.0 18.8 20.4 19.3 -5.1 15.7 16.0 18.5 20.3 19.4 -4.0
1Rail rates include fuel surcharges, but do not include the cost of purchasing empty rail cars in the secondary rail markets, which could exceed the rail tariff rate plus fuel surcharge shown in the table.2Source: O’Neil Commodity Consulting3Source: USDA/NASS/Quick Stats database
2016 SummaryThe U.S. soybean transportation costs from North and South Dakota via the Pacific Norwest to Shanghai, China, as a percentage of total landed cost decreased 4-5 percent from a year earlier.
Source: USDA/AMS 8
2015 2016Sorriso, North MT, through Santos 109.86 92.12Davenport, IA, through U.S. Gulf 69.67 64.00
0.00
20.00
40.00
60.00
80.00
100.00
120.00
US$/
met
ric to
n
+$40.19
+$28.11MT
IA
MT
IA

2016 Summary
In 2016, the cost of shipping a metric ton of soybeans from Cruz Alta, Northwest Rio Grande do Sul (RS), to Shanghai, China, was $25.12 less than from Davenport, IA. The distance from Cruz Alta to the port of Rio Grande is 288 miles.
Transportation cost differences between Rio Grande do Sul (RS) and Iowa (IA) to Shanghai, China
Source: USDA/AMS 9
During 2016, Sorriso, North MT, soybean shippers to Shanghai paid $13-$28 per metric ton more than U.S. exporters through the U.S. Gulf and PNW routes; $53 more than the transportation cost paid by Cruz Alta (RS) shippers; and nearly $42 more than the transportation cost paid by South Maranhão (MA) shippers.
Transportation cost differences between selected Brazil-United States Routes to Shanghai, China, 2016
2015 2016Northwest RS, through Rio Grande 51.68 38.88Davenport, IA through U.S. Gulf 69.67 64.00
0.00
10.00
20.00
30.00
40.00
50.00
60.00
70.00
80.00US
$/m
etric
ton
-$17.99-$25.12
RS
IA
RS
IA
Sorriso, North MT, through Santos 92.12Sioux Falls, SD through PNW 79.31Fargo, ND through PNW 78.30Davenport, IA, through U.S. Gulf 64.00South MA, through São Luís 50.52Northwest RS, through Rio Grande 38.88
0.00
10.00
20.00
30.00
40.00
50.00
60.00
70.00
80.00
90.00
100.00
U.S
.$/m
etric
ton
ND MAMTSD IA RSMT SD ND IA MA RS

In 2016, truck rates (valued in reais) from Cruz Alta, Rio Grande do Sul (RS) to Rio Grande, and from Sorriso, North Mato Grosso (MT) to Santos and Paranaguá decreased 4-8 percent compared with 2015.
Truck rates for selected Brazilian soybean export routes, 2010-2016
Route #
Origin1 (reference city) Destination Distance
(miles)2
2010 2011 2012 2013 2014 2015 2016 Percent Change 15-16Reais/metric ton
1 Northwest RS3(Cruz Alta) Rio Grande 288 49.58 62.44 50.35 49.90 57.52 87.26 83.70 -4.1
2 North MT(Sorriso) Santos 1190 205.40 206.03 218.00 250.60 243.68 283.84 263.26 -7.3
3 North MT(Sorriso) Paranaguá 1262 195.09 197.09 212.49 241.25 236.81 282.66 259.49 -8.2
4 South GO(Rio Verde) Santos 587 113.85 106.57 107.31 126.98 146.51 130.98 121.33 -7.4
6 North Center PR(Londrina) Paranaguá 268 60.70 66.07 67.92 69.02 72.47 79.44 74.77 -5.9
11 Southeast MT(Primavera do Leste) Santos 901 164.18 159.93 164.92 190.65 185.01 193.85 179.27 -7.5
29 North MT(Sorriso) Santarém 876 --na-- --na-- --na-- --na-- --na-- 190.47 174.02 -8.6
30 South MA(Balsas) São Luís 482 --na-- --na-- --na-- --na-- --na-- 119.23 107.94 -9.5
31 Southwest PI (Bom Jesus) São Luís 606 --na-- --na-- --na-- --na-- --na-- 141.03 119.74 -15.1
32 Southeast PA(Paragominas) Barcarena 249 --na-- --na-- --na-- --na-- --na-- 65.77 62.95 -4.3
33 East TO(Campos Lindos) São Luís 842 --na-- --na-- --na-- --na-- --na-- 184.72 175.24 -5.1
1Although each origin region comprises several cities, the main city is considered as a reference to establish the freight price.2Distance from the main city of the considered region to the mentioned ports.3RS = Rio Grande do Sul, MT= Mato Grosso, GO = Goiás, PR = Paraná, MG = Minas Gerais, BA = Bahia, MS = Mato Grosso do Sul, SP = São PauloSource: ESALQ/USP (University of São Paulo, Brazil) and USDA/AMS
2016 Summary
Source: USDA/AMS 10
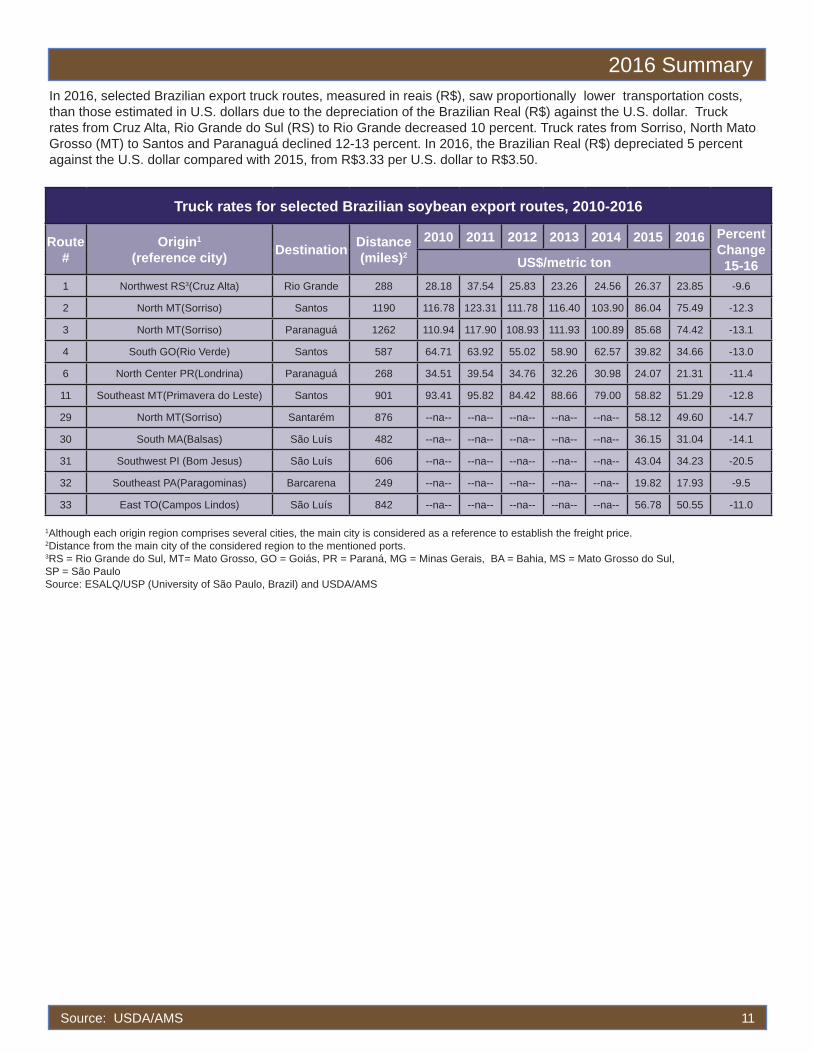
In 2016, selected Brazilian export truck routes, measured in reais (R$), saw proportionally lower transportation costs, than those estimated in U.S. dollars due to the depreciation of the Brazilian Real (R$) against the U.S. dollar. Truck rates from Cruz Alta, Rio Grande do Sul (RS) to Rio Grande decreased 10 percent. Truck rates from Sorriso, North Mato Grosso (MT) to Santos and Paranaguá declined 12-13 percent. In 2016, the Brazilian Real (R$) depreciated 5 percent against the U.S. dollar compared with 2015, from R$3.33 per U.S. dollar to R$3.50.
Truck rates for selected Brazilian soybean export routes, 2010-2016
Route #
Origin1 (reference city) Destination Distance
(miles)2
2010 2011 2012 2013 2014 2015 2016 Percent Change 15-16US$/metric ton
1 Northwest RS3(Cruz Alta) Rio Grande 288 28.18 37.54 25.83 23.26 24.56 26.37 23.85 -9.6
2 North MT(Sorriso) Santos 1190 116.78 123.31 111.78 116.40 103.90 86.04 75.49 -12.3
3 North MT(Sorriso) Paranaguá 1262 110.94 117.90 108.93 111.93 100.89 85.68 74.42 -13.1
4 South GO(Rio Verde) Santos 587 64.71 63.92 55.02 58.90 62.57 39.82 34.66 -13.0
6 North Center PR(Londrina) Paranaguá 268 34.51 39.54 34.76 32.26 30.98 24.07 21.31 -11.4
11 Southeast MT(Primavera do Leste) Santos 901 93.41 95.82 84.42 88.66 79.00 58.82 51.29 -12.8
29 North MT(Sorriso) Santarém 876 --na-- --na-- --na-- --na-- --na-- 58.12 49.60 -14.7
30 South MA(Balsas) São Luís 482 --na-- --na-- --na-- --na-- --na-- 36.15 31.04 -14.1
31 Southwest PI (Bom Jesus) São Luís 606 --na-- --na-- --na-- --na-- --na-- 43.04 34.23 -20.5
32 Southeast PA(Paragominas) Barcarena 249 --na-- --na-- --na-- --na-- --na-- 19.82 17.93 -9.5
33 East TO(Campos Lindos) São Luís 842 --na-- --na-- --na-- --na-- --na-- 56.78 50.55 -11.0
1Although each origin region comprises several cities, the main city is considered as a reference to establish the freight price.2Distance from the main city of the considered region to the mentioned ports.3RS = Rio Grande do Sul, MT= Mato Grosso, GO = Goiás, PR = Paraná, MG = Minas Gerais, BA = Bahia, MS = Mato Grosso do Sul, SP = São PauloSource: ESALQ/USP (University of São Paulo, Brazil) and USDA/AMS
2016 Summary
Source: USDA/AMS 11
Source: ESALQ/ USP (University of São Paulo, Brazil) and USDA/AMS
Brazilian soybean export truck cost index
Source: USDA/AMS 12
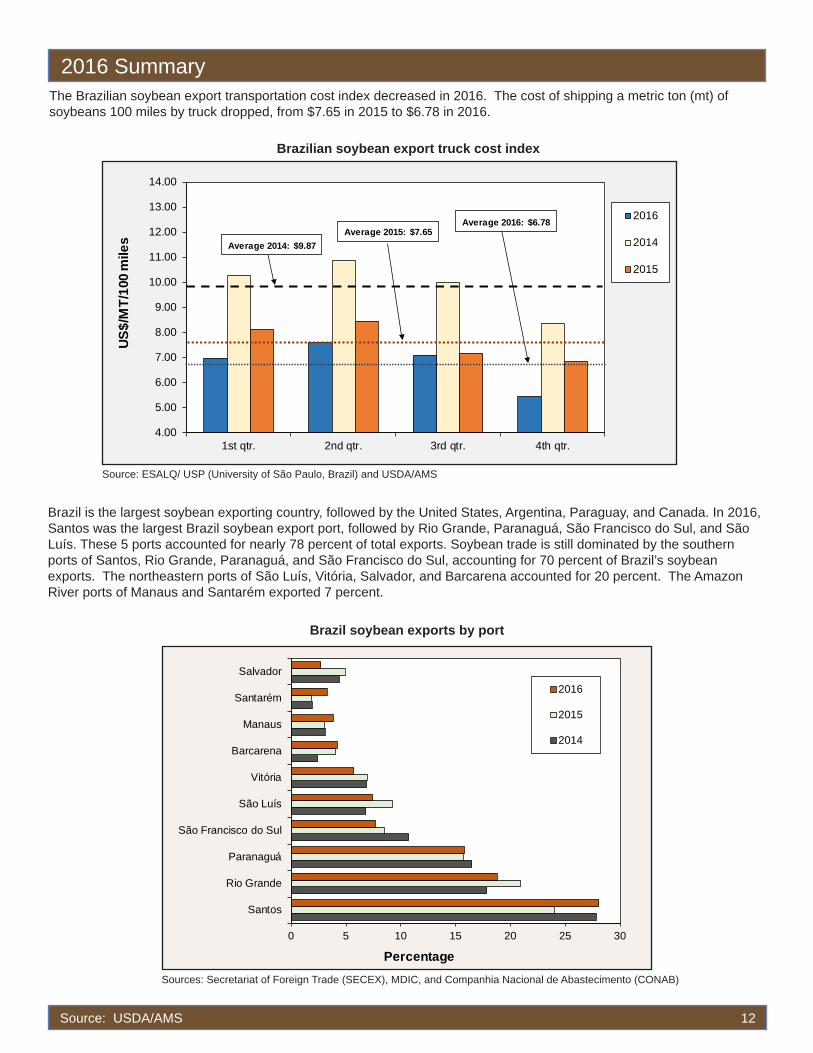
The Brazilian soybean export transportation cost index decreased in 2016. The cost of shipping a metric ton (mt) of soybeans 100 miles by truck dropped, from $7.65 in 2015 to $6.78 in 2016.
Sources: Secretariat of Foreign Trade (SECEX), MDIC, and Companhia Nacional de Abastecimento (CONAB)
Brazil soybean exports by port
Brazil is the largest soybean exporting country, followed by the United States, Argentina, Paraguay, and Canada. In 2016, Santos was the largest Brazil soybean export port, followed by Rio Grande, Paranaguá, São Francisco do Sul, and São Luís. These 5 ports accounted for nearly 78 percent of total exports. Soybean trade is still dominated by the southern ports of Santos, Rio Grande, Paranaguá, and São Francisco do Sul, accounting for 70 percent of Brazil’s soybean exports. The northeastern ports of São Luís, Vitória, Salvador, and Barcarena accounted for 20 percent. The Amazon River ports of Manaus and Santarém exported 7 percent.
2016 Summary
4.00
5.00
6.00
7.00
8.00
9.00
10.00
11.00
12.00
13.00
14.00
1st qtr. 2nd qtr. 3rd qtr. 4th qtr.
US$/
MT/
100
mile
s
2016
2014
2015
Average 2015: $7.65Average 2016: $6.78
Average 2014: $9.87
0 5 10 15 20 25 30
Santos
Rio Grande
Paranaguá
São Francisco do Sul
São Luís
Vitória
Barcarena
Manaus
Santarém
Salvador
Percentage
2016
2015
2014

2016 Summary
Source: USDA/AMS 13
Brazilian soybean ocean freight from Santos to Shanghai and Hamburg, 2016
Source: ESALQ/ USP (University of São Paulo, Brazil) and USDA/AMS
In 2016, ocean rates from the Port of Santos to Shanghai, China, declined 30 percent compared with 2015 rates, averaging $16.63/mt. Ocean rates to Hamburg decreased 8 percent from 2015 rates, averaging $18.13/mt. Ocean rates from the southern Brazilian ports plunged 7-8 percent to Hamburg and 27-32 percent to China because of a dry-bulk’s excess vessel capacity.
Brazilian soybean ocean freight from selected ports to Shanghai, China, 2016
Source: ESALQ/ USP (University of São Paulo, Brazil) and USDA/AMS
0.00
5.00
10.00
15.00
20.00
25.00
1st qtr 2nd qtr 3rd qtr 4th qtr
US$/
met
ric to
n
Santos-Hamburg Santos-Shanghai
10.00
12.00
14.00
16.00
18.00
20.00
22.00
24.00
1st qtr 2nd qtr 3rd qtr 4th qtr
US$/
met
ric to
n
Santos
São LuísRio Grande

The cost to ship 1 mt of soybeans from Brazil to Hamburg by ocean-going vessel fell on average 8 percent from $19.75/mt to $18.21/mt.
Ocean rates from Brazil to Hamburg, Germany, decreased in 2016
Source: ESALQ/ USP (University of São Paulo, Brazil) and USDA/AMS
Ocean rates from Brazil to Shanghai, China, declined in 2016
Source: ESALQ/ USP (University of São Paulo, Brazil) and USDA/AMS
Source: USDA/AMS 14
In 2016, the cost to ship 1 mt of soybeans from Brazil to Shanghai by ocean vessel dropped 30 percent on average from $24.68/mt to $17.33/mt.
2016 Summary
0.00
5.00
10.00
15.00
20.00
25.00
30.00
35.00
40.00
Santos Paranagua Rio Grande
US$/
met
ric to
n
Port of origin
2015
2016
3-port average 2015: $19.75
3-port average 2016 $18.21
10.00
12.00
14.00
16.00
18.00
20.00
22.00
24.00
26.00
28.00
Santos Paranagua Rio Grande
US$/
met
ric to
n
Port of origin
2015
2016
3-port average 2016: $17.33
3-port average 2015: $24.68

In 2016 farm prices in the Brazilian real (R$) increased on average 15 percent. Mato Grosso (MT) and Rio Grande do Sul (RS) farm prices increased 10 and 17 percent, respectively, in 2016. However, when farm prices are measured in U.S. dollars, they increased proportionally less, about 5 and 12 percent, respectively, from a year earlier, due to a 5 percent loss in value of the Brazilian real against the U.S. dollar.
RS = Rio Grande do Sul, MT = Mato Grosso, GO = Goiás, PR = Paraná Source: Companhia Nacional de Abastecimento (CONAB)
Selected Brazilian farm prices
RS = Rio Grande do Sul, MT = Mato Grosso, GO = Goiás, PR = Paraná Source: Companhia Nacional de Abastecimento (CONAB)
Selected Brazilian farm prices
Source: USDA/AMS 15
2016 Summary
RS MT GO PR PI PA MA2015 1,097 978 1,006 1,069 1,046 1,004 1,0462016 1,209 1,148 1,140 1,183 1,192 1,152 1,303
0
200
400
600
800
1,000
1,200
1,400
Rea
is/m
etric
ton
+10%
+17%
+13%
+11%
+14%
+15%
+25%
RS MT GO PR PI PA MA2015 331.55 295.17 304.36 323.15 314.90 310.74 314.432016 348.28 331.91 329.15 340.74 344.78 333.57 376.89
0.00
50.00
100.00
150.00
200.00
250.00
300.00
350.00
400.00
US$/
met
ric to
n
+5%
+12%
+8%+5%
+9%
+7%
+20%
Source: USDA/AMS 16
Source: Banco Central do Brasil
Average quarterly exchange rate, real per U.S. dollar
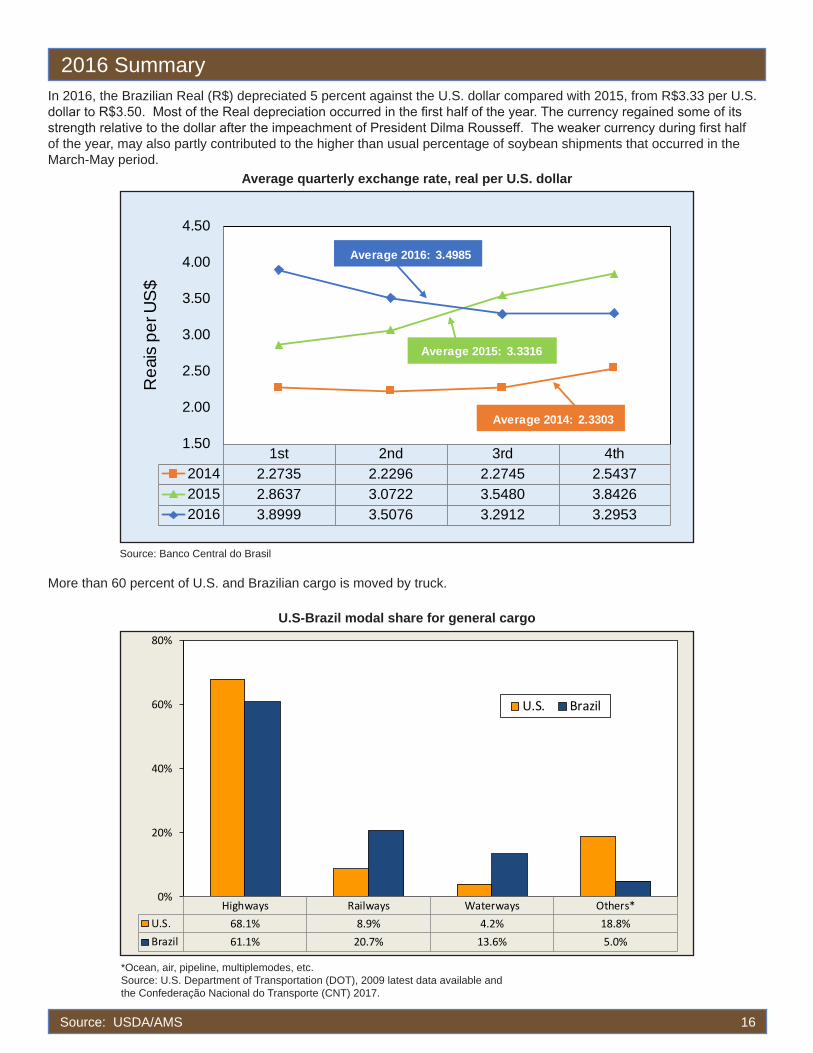
In 2016, the Brazilian Real (R$) depreciated 5 percent against the U.S. dollar compared with 2015, from R$3.33 per U.S. dollar to R$3.50. Most of the Real depreciation occurred in the first half of the year. The currency regained some of its strength relative to the dollar after the impeachment of President Dilma Rousseff. The weaker currency during first half of the year, may also partly contributed to the higher than usual percentage of soybean shipments that occurred in the March-May period.
More than 60 percent of U.S. and Brazilian cargo is moved by truck.
*Ocean, air, pipeline, multiplemodes, etc.Source: U.S. Department of Transportation (DOT), 2009 latest data available and the Confederação Nacional do Transporte (CNT) 2017.
U.S-Brazil modal share for general cargo
2016 Summary
1st 2nd 3rd 4th2014 2.2735 2.2296 2.2745 2.54372015 2.8637 3.0722 3.5480 3.84262016 3.8999 3.5076 3.2912 3.2953
1.50
2.00
2.50
3.00
3.50
4.00
4.50
Rea
is p
er U
S$
Average 2016: 3.4985
Average 2014: 2.3303
Average 2015: 3.3316
Highways Railways Waterways Others*U.S. 68.1% 8.9% 4.2% 18.8%Brazil 61.1% 20.7% 13.6% 5.0%
0%
20%
40%
60%
80%
U.S. Brazil

Source: USDA/AMS 17
Brazil New Hours-of-Service Rule. On July 17, 2012, the Brazilian government implemented the first hours-of-service rules, called the “Driver’s Law,” to address safety issues. The new law reduced the number of hours a truck driver can work in a 24-hour period, likely raising transportation costs. The law is enforced by the Ministry of Labor and Transportation. Noncompliance with the law would result in a fine to the driver and the vehicle may be withheld until full rest is reached or the driver is replaced.
U.S.-Brazil Hours of Service Rules. The Brazilian rules are based on a 24-hour duty limit; the United States rules are based on a daily window of 14 hours with a maximum of 11 hours of driving and a 60/70-hour weekly on-duty limit (table 1). Brazilian drivers have a daily duty window of 13 hours with a maximum of 10 hours driving limit for every 24 hours of travel and a mandatory 35 hour weekly rest period. The U.S. duty limits are based on 60 hours over 7 consecutive days or 70 hours over 8 consecutive days with a voluntary 34 consecutive hour restart provision to begin a new weekly on−duty limit period. Brazilian rules require a 30−minute break every 4 hours of uninterrupted driving. Effective July 1, 2013, U.S. drivers are required to take a 30-minute break if 8 hours have passed since their last off−duty period.
The United States first hours-of-service rules were issued in 1938. Since then, the law has been revised several times. In 1995, an agricultural exception for the planting and harvesting season was added. The current agricultural exemption states that drivers transporting agricultural commodities or farm supplies for agricultural purposes are exempt from hours-of-service rules within a 150-air-mile radius of the source of the agricultural commodity or the wholesale/retail distribution point of the farm supplies, within or across State lines, during the planting and harvesting seasons as determined by each state.
Regulation United States Brazil
Daily duty limit* 14 consecutive hours 13 consecutive hours
Driving limitMaximum of 11 hours (after 10 consecutive hours off duty) within the 14 hour daily duty limit
10 hours ( 8 hrs. regular time + 2 hours of compensatory time) within the 13 hours limit
Daily rest requirement 10 hours, not based on a 24-hour period 11 hours every 24 hours
Weekly restVoluntary 34 consecutive hour or more restart provision to begin a new 7 or 8 day on−duty** period (see weekly limits)
35 hours
Breaks30 minute off-duty break before 8 hours have passed since their last of off-duty period. Effective July 1, 2013
30 minute break every 4 hours of driving and 1 hour for meals
Weekly limits
60/70−Duty limit: drivers are not allowed to be on−duty more than 60 hours over 7 consecutive days or 70 hours over 8 consecutive days
Restart provisionDrivers are allowed to use the voluntary 34-hour restart provision to begin a new 7 or 8 day on-duty**
Adverse driving conditions exception1 2 extra hours more than allowed under normal conditions 1 extra hour
*Include work, meals, and mandatory rest **On- duty time includes all time drivers are working for a motor carrier, whether paid or not, and all time the driver is doing paid work for anyone else such as time at plant terminal, loading, unloading, handling paper work, drug and alcohol testing, inspecting or servicing the truck (fueling and washing the truck); The restart provision can only be used once per week and must include two periods from 1:00 AM to 5:00 AM, based on home terminal time. It is intended to provide sufficient time for a driver to recuperate from cumulative fatigue if they work beyond the weekly maximum on-duty limits. 1 Means the driver did not know about the conditions when starting the run such as snow, fog or shutdown traffic due to a crash. It does not include situations that the driver should know about, like congested traffic during typical rush hour.
2016 Summary
The Brazilian government plans to change the current cargo transportation matrix by developing an integrated intermodal system. The intention is that within 15 to 20 years, railways’ participation will increase from 25 to 35 percent; waterways from 13 to 29 percent; and truck shipments will be reduced by 28 percent, from 58 to 30 percent. To modify the transportation matrix, in January 2007, the Brazilian government created the Growth Acceleration Plan 1 (PAC 1) to promote sustainable social and economic development by generating employment, income, and reducing regional inequalities. During the same year, the PAC was integrated into the National Plan of Logistic and Transportation (PNLT). The Ministry of Transportation and Defense executes the PNLT by allocating funds in three phases from 2008 to 2023. By March 2010, the Government announced the second Growth Acceleration Plan (PAC 2), 2011-2014.
During 2015, the Brazilian government created the Integrated Logistic National Plan (PNLI). The PNLI’s major objective is to identify, analyze and determine the critical points of the cargo and passenger transportation infrastructure, and propose solutions to the country’s demands for transport. The government implemented a strategic planning technique to leverage existing programs and projects and the important guidelines set by the plans of the Federal government such as the Growth Acceleration Program, the Logistics Investment Program (LIP), and the PNLI to increase transportation efficiencies. It adjusted the transport matrix by focusing on increasing the capacity of transport routes to achieve greater competitiveness at national and international levels.
The 2015 Transportation assessment report and the ninth evaluation results of Growth Acceleration Program 2 (PAC 2), 2011-2015, showed that Brazil did not finish the projects as planned. However, the Midwest agricultural exporters in Brazil gained from selected strategic port improvements, extended railways miles, and a new intermodal grain terminal. For the last 10 years, Brazil’s transportation infrastructure did not improve as planned. From 2003 to 2013, Brazil’s economy grew on average 3.8 percent and the transportation infrastructure improvement continued. However, from 2014 to present, three major events disrupted Brazil infrastructure improvements:
1. Economic crisis during the last 2 years, caused by a fall in commodity prices and Brazil’s inability to make necessary policy adjustments. According to the World Bank, Brazil’s fiscal adjustment is undermined by budget rigidities and a difficult political environment. Most public spending is rigidly determined (by rules in the Constitution or other legislation) and cannot legally be reduced. Less than 15 percent of Brazil’s expenditure is discretionary.
2. The uncertainty created by the political crisis that brought about the impeachment of President Dilma Rousseff in 2016.
3. The deep and prolonged corruption investigation called operation Car Wash (Lava Jato) that hindered ongoing and new Brazilian infrastructure improvement projects.
In 2016, the Brazilian government launched Project Crescer and the Investment Partnerships Program to reestablish confidence and restore a favorable investment environment to stimulate the economy. With both projects, the government set a new decision making process for prioritization and follow-up that will be executed through concession, public-private partnership, and privatizations. The government also established guidelines to manage the projects’ portfolios with maximum transparency and efficiency.
On March 2017, the Brazilian government narrowed the scope of the infrastructure plan by offering technically and economically feasible projects to the private sector to improve quality of services. The list of infrastructure projects includes port terminals, transmission lines, railways, sanitation companies, and highways, with estimated investments exceeding $14.5 billion1 (R$ 45 billion).
1 Exchange rate of R$3.1143 per U.S. dollar, March 24, 2017.
Source: USDA/AMS 18
Transportation Infrastructure Developments

Transportation Infrastructure Developments
Source: USDA/AMS 19
Project Crescer: selected infrastructure projects that facilitate exports of agricultural products
The plan includes three Railroads:
1. The North-South (EF-151) railroad: Porto National, Tocantins (TO)-Estela D’Oeste, São Paulo (SP). This railroad integrates four States: TO, Goiás (GO), Minas Gerais (MG), and SP with access to the northeastern port of Itaquí-Sâo Luis, Maranhão (MA). This is a work in progress with more than 90 percent of infrastructure finished.
2. The West-East Integration (FIOL) Railroad (EF-334): Ilheusin-Caetité-Port of Ilhéus Bahia (BA). It is designed to interconnect the North and Northeast regions of Brazil. FIOL will haul grains from West Bahia (BA) and iron ore typical of the Caetité region, Central BA. The project is being studied.
3. Ferrogrão Railroad (EF-170) Railroad. The purpose is to consolidate the new Brazilian export rail corridor of the “Arco Norte” by connecting the grain-producing region of the Midwest to the State of Pará, ending at Miritituba Port. The EF-170 is expected to increase transport capacity and competitiveness to the corridor and alleviate traffic conditions on highway BR-163 by opening a new route for soybean and corn exports.
By March 31, 2017, the 619 miles of highway BR-163 (began in PAC 1), connecting Brazil’s Midwest to the Amazon River, were not completed. BR-163 will significantly reduce transportation costs to the Amazon River ports, and thus, on the Brazil―Europe route. The route is already shifting some soybeans exports to Europe, the Middle East, and Northern Africa from the southern ports to the north. However, it is less likely that the Brazil–China route would be significantly affected because it requires a major cost reduction of inland transportation to offset the increase in ocean rates. This is due to 7 or 8 additional days at sea—through South Africa’s Cape of Good Hope to China.
Port of Santos: the Brazilian government plans to improve efficiency by adding new investments to the “Santos CV’s Terminal XXXIX-Caramuru”, Ponta da Praia. This will increase capacity from 2.5 to 5 million tons per year. This terminal is located on the most important area for grain exports at the Port of Santos, São Paulo, which is the top Brazilian public port.
Port of Rio de Janeiro: Consórcio Maravilha (Bunge Alimentos S/A and M. Dias Branco Indústria e Comércio de Alimentos) will build “Terminal RDJ XX - Rio de Janeiro”. The terminal will handle solid bulk of plant origin, especially wheat. It is located inside the Port of Rio de Janeiro (RJ). Brazil’s wheat production is not enough to satisfy its domestic market, importing wheat mostly from Argentina with a maximum cargo of 30,000 tons/ship.
Source: Projeto Crescer, http://www.projetocrescer.gov.br/projects, accessed 4-17-17

Select infrastructural improvements status, Project Crescer and the Investment Partnerships Program (PPI), 2016-2017
Transportation Mode2016 Estimated
Current status/noteskm miles R$ US$1
Railways1. North-South Railroad (EF-151)-SP / MG / GO / TO
North-South (EF-151) Railroad: Porto National, Tocantins (TO) - Estela D'Oeste, Sȃo Paulo (SP). Capacity: 68.4 mmt (Est. to year 2051).
1,536 952 757 million
243 million
It integrates 4 states: TO, Goiás (GO), Minas Gerais (MG),and SP with access to the northestern port of Itaquí-Sâo Luis, Maranhão (MA).
Work in progress: include 2 segments 1254 777
Segment I: National Port-Palmas (TO) - Anápolis (GO): total 855 km 855 530 Completed and authorized for comercial
traffic.
Segment II: Ouro Verde (GO)-Estela D'Oeste (SP) 682 424 Work in progress. 90% completed.
Future benefits of the North-South Railroad , EF-151, is the interconnection of railroad North-South to other rail sections
Açailândia (MA) - Bacarena (PA): has the possibility of connecting to the Port of Vila de Conde, which is close to international markets and shows a logistical alternative for foreign trade through the country's Northern Arc.
477 296 NA NA
Estrela d'Oeste (SP) - Três Lagoas (MS): is a crossing region for transportation of grains and cellulose. NA NA NA NA
Campinorte (GO) - Água Boa (MT): provides an alternative logistic grain flow by connecting to existing Mid-West region rail network.
NA NA NA NA
2. West-East-FIOL Integration Railroad (EF-334): Ilhéus (BA) and Caetité (BA)
The West-East Integration (FIOL) Railroad (EF-334): Ilheusin-Caetité-Port of Ilhéus Bahia (BA). It is designed to interconnect the North and Northeast regions of Brazil. FIOL will haul grains from West Bahia (BA) and iron ore production typical of the Caetité region, Central BA.
1,022 634 2.8 billion
899 billion
The main purpose of this project is to haul iron ore from the region (where Bahia Mineração - BAMIN is located) through the South Port (an important port complex to be built in the vicinity of Ilhéus). Project is being studied.
Completed 505 314 1.8 billion
578 millon Invested.
Unfinished due to lack of funding 517 321 1 billion
321 million
Investment is needed to finish the project.
3. Ferrogrão Railroad (EF-170) from Mato Grossot (MT) to Pará (PA), in studyFerrogrão Railroad (EF-170) Railroad: The purpose is to consolidate the new Brazilian export rail corridor of the “Arco Norte” by connecting the grain-producing region of the Midwest to the State of Pará, ending at Miritituba Port. The EF-170 is expected to increase transport capacity and competitiveness to the corridor and alleviate traffic conditions on highway BR-163 by opening a new route for the Soybean and corn exports.
1,142 710 12.6 billion
4 billion
The project is being studied and underscores the expansion of the Brazilian agricultural frontier and the need for an integrated cargo infrastructure transportation demand with high socio-economic benefits impact between Sinop in Mato Groso and Itaituba in Pará.
Source: USDA/AMS 20
1 Exchange rate of R$3.1143 per U.S. dollar, March 24, 2017Source:Projeto Crescer, Brazil Federal Government, http://www.projetocrescer.gov.br/index.php; Accessed 3-28-2017.
Transportation Infrastructure Developments
Transportation Infrastructure Developments
Source: USDA/AMS 21
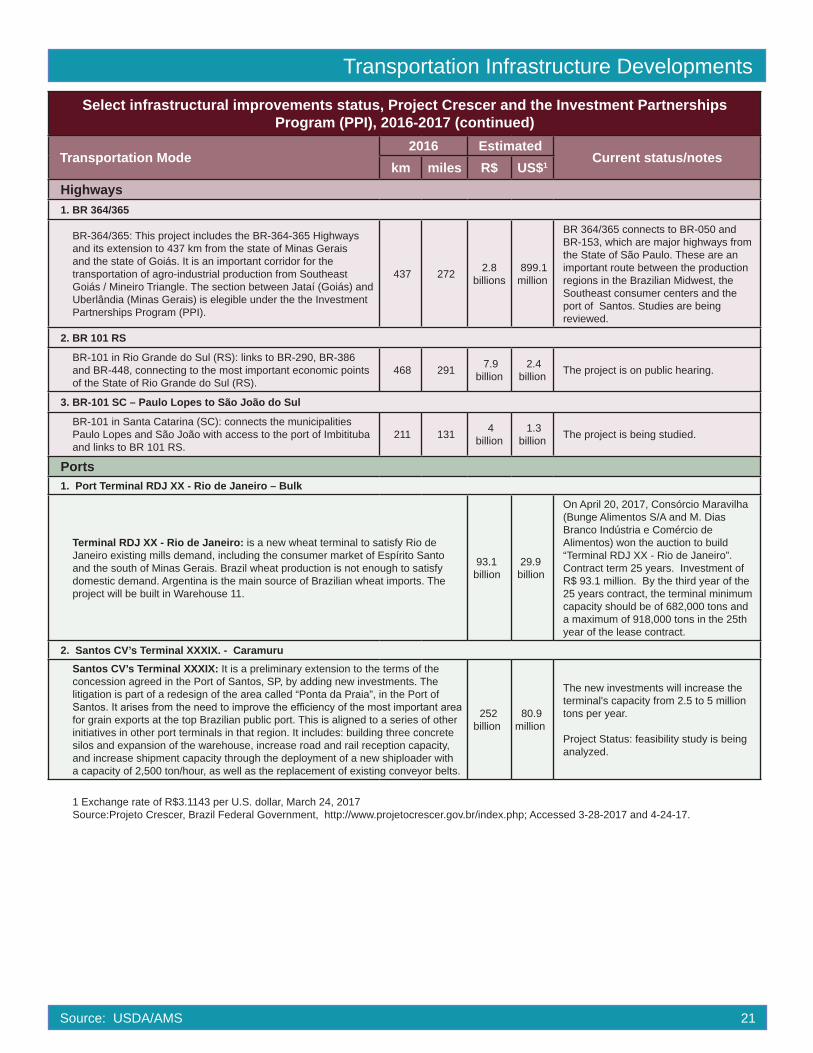
Select infrastructural improvements status, Project Crescer and the Investment Partnerships Program (PPI), 2016-2017 (continued)
Transportation Mode2016 Estimated
Current status/noteskm miles R$ US$1
Highways1. BR 364/365
BR-364/365: This project includes the BR-364-365 Highways and its extension to 437 km from the state of Minas Gerais and the state of Goiás. It is an important corridor for the transportation of agro-industrial production from Southeast Goiás / Mineiro Triangle. The section between Jataí (Goiás) and Uberlândia (Minas Gerais) is elegible under the the Investment Partnerships Program (PPI).
437 272 2.8 billions
899.1 million
BR 364/365 connects to BR-050 and BR-153, which are major highways from the State of São Paulo. These are an important route between the production regions in the Brazilian Midwest, the Southeast consumer centers and the port of Santos. Studies are being reviewed.
2. BR 101 RS
BR-101 in Rio Grande do Sul (RS): links to BR-290, BR-386 and BR-448, connecting to the most important economic points of the State of Rio Grande do Sul (RS).
468 291 7.9 billion
2.4 billion The project is on public hearing.
3. BR-101 SC – Paulo Lopes to São João do Sul
BR-101 in Santa Catarina (SC): connects the municipalities Paulo Lopes and São João with access to the port of Imbitituba and links to BR 101 RS.
211 131 4 billion
1.3 billion The project is being studied.
Ports1. Port Terminal RDJ XX - Rio de Janeiro – Bulk
Terminal RDJ XX - Rio de Janeiro: is a new wheat terminal to satisfy Rio de Janeiro existing mills demand, including the consumer market of Espírito Santo and the south of Minas Gerais. Brazil wheat production is not enough to satisfy domestic demand. Argentina is the main source of Brazilian wheat imports. The project will be built in Warehouse 11.
93.1 billion
29.9 billion
On April 20, 2017, Consórcio Maravilha (Bunge Alimentos S/A and M. Dias Branco Indústria e Comércio de Alimentos) won the auction to build “Terminal RDJ XX - Rio de Janeiro”. Contract term 25 years. Investment of R$ 93.1 million. By the third year of the 25 years contract, the terminal minimum capacity should be of 682,000 tons and a maximum of 918,000 tons in the 25th year of the lease contract.
2. Santos CV’s Terminal XXXIX. - CaramuruSantos CV’s Terminal XXXIX: It is a preliminary extension to the terms of the concession agreed in the Port of Santos, SP, by adding new investments. The litigation is part of a redesign of the area called “Ponta da Praia”, in the Port of Santos. It arises from the need to improve the efficiency of the most important area for grain exports at the top Brazilian public port. This is aligned to a series of other initiatives in other port terminals in that region. It includes: building three concrete silos and expansion of the warehouse, increase road and rail reception capacity, and increase shipment capacity through the deployment of a new shiploader with a capacity of 2,500 ton/hour, as well as the replacement of existing conveyor belts.
252 billion
80.9 million
The new investments will increase the terminal's capacity from 2.5 to 5 million tons per year. Project Status: feasibility study is being analyzed.
1 Exchange rate of R$3.1143 per U.S. dollar, March 24, 2017Source:Projeto Crescer, Brazil Federal Government, http://www.projetocrescer.gov.br/index.php; Accessed 3-28-2017 and 4-24-17.

Source: USDA/AMS 22
Brazil modal share for general cargo, 2017-2025
Source: Brazil Ministry of Transportation, National Plan of Logistics & Transportation (PNLT) and Confederação Nacional do Transporte (CNT) 2017
Transportation Infrastructure Developments
2017 2025Highways 61% 30%Railways 21% 35%Waterways 14% 29%Others 5% 6%
0%
10%
20%
30%
40%
50%
60%
70%
Perc
enta
ge sh
aare
-31%+14%
+15%
+1%
Source: USDA/AMS 23
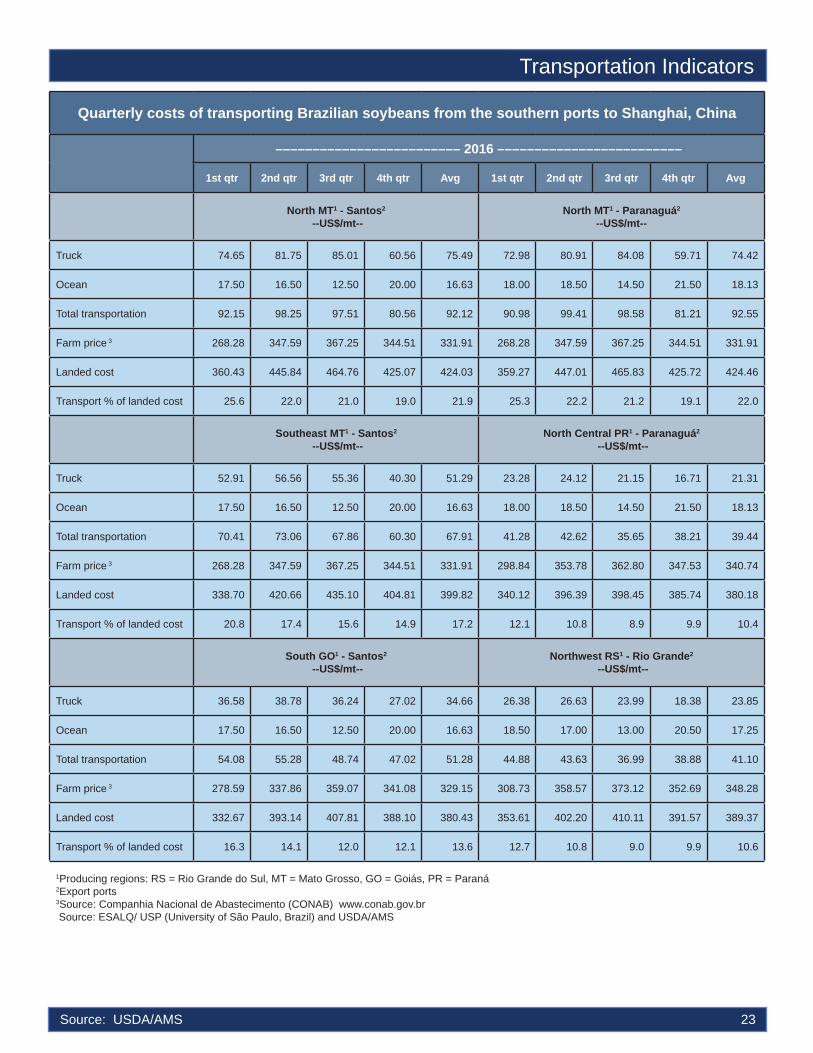
Quarterly costs of transporting Brazilian soybeans from the southern ports to Shanghai, China
––––––––––––––––––––––––– 2016 –––––––––––––––––––––––––
1st qtr 2nd qtr 3rd qtr 4th qtr Avg 1st qtr 2nd qtr 3rd qtr 4th qtr Avg
North MT1 - Santos2
--US$/mt-- North MT1 - Paranaguá2
--US$/mt--
Truck 74.65 81.75 85.01 60.56 75.49 72.98 80.91 84.08 59.71 74.42
Ocean 17.50 16.50 12.50 20.00 16.63 18.00 18.50 14.50 21.50 18.13
Total transportation 92.15 98.25 97.51 80.56 92.12 90.98 99.41 98.58 81.21 92.55
Farm price 3 268.28 347.59 367.25 344.51 331.91 268.28 347.59 367.25 344.51 331.91
Landed cost 360.43 445.84 464.76 425.07 424.03 359.27 447.01 465.83 425.72 424.46
Transport % of landed cost 25.6 22.0 21.0 19.0 21.9 25.3 22.2 21.2 19.1 22.0
Southeast MT1 - Santos2
--US$/mt-- North Central PR1 - Paranaguá2
--US$/mt--
Truck 52.91 56.56 55.36 40.30 51.29 23.28 24.12 21.15 16.71 21.31
Ocean 17.50 16.50 12.50 20.00 16.63 18.00 18.50 14.50 21.50 18.13
Total transportation 70.41 73.06 67.86 60.30 67.91 41.28 42.62 35.65 38.21 39.44
Farm price 3 268.28 347.59 367.25 344.51 331.91 298.84 353.78 362.80 347.53 340.74
Landed cost 338.70 420.66 435.10 404.81 399.82 340.12 396.39 398.45 385.74 380.18
Transport % of landed cost 20.8 17.4 15.6 14.9 17.2 12.1 10.8 8.9 9.9 10.4
South GO1 - Santos2
--US$/mt-- Northwest RS1 - Rio Grande2
--US$/mt--
Truck 36.58 38.78 36.24 27.02 34.66 26.38 26.63 23.99 18.38 23.85
Ocean 17.50 16.50 12.50 20.00 16.63 18.50 17.00 13.00 20.50 17.25
Total transportation 54.08 55.28 48.74 47.02 51.28 44.88 43.63 36.99 38.88 41.10
Farm price 3 278.59 337.86 359.07 341.08 329.15 308.73 358.57 373.12 352.69 348.28
Landed cost 332.67 393.14 407.81 388.10 380.43 353.61 402.20 410.11 391.57 389.37
Transport % of landed cost 16.3 14.1 12.0 12.1 13.6 12.7 10.8 9.0 9.9 10.6
1Producing regions: RS = Rio Grande do Sul, MT = Mato Grosso, GO = Goiás, PR = Paraná 2Export ports 3Source: Companhia Nacional de Abastecimento (CONAB) www.conab.gov.br Source: ESALQ/ USP (University of São Paulo, Brazil) and USDA/AMS
Transportation Indicators
Source: USDA/AMS 24
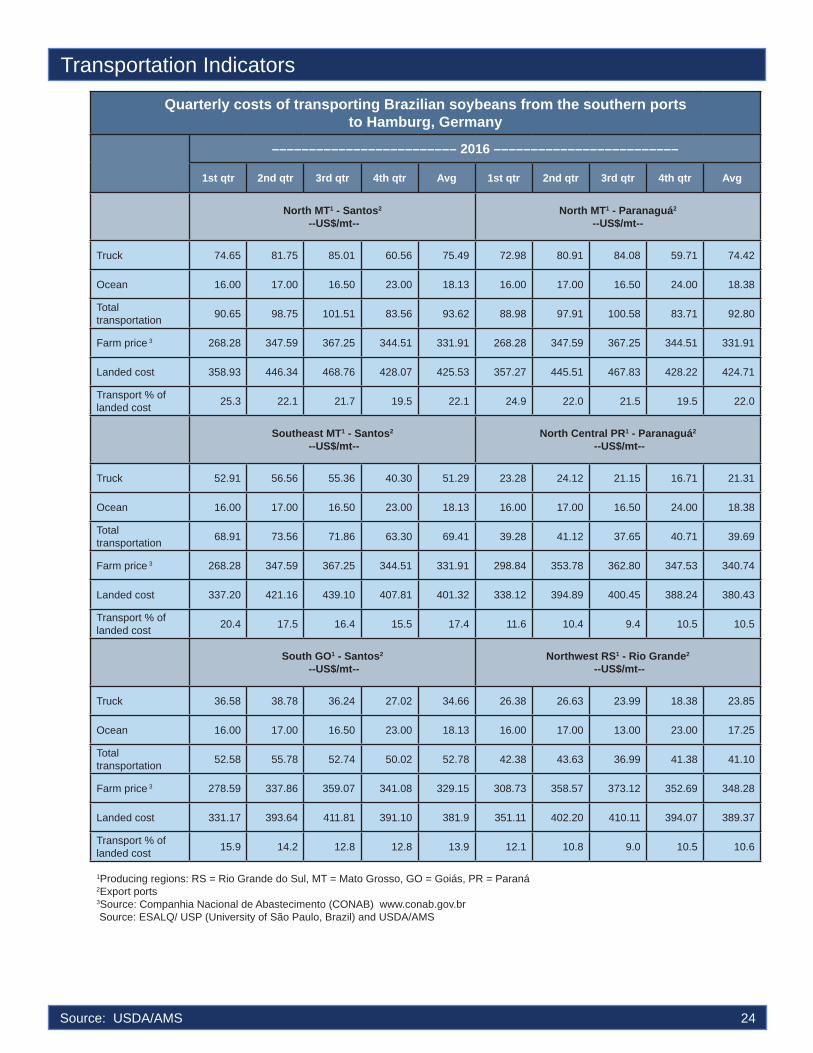
Quarterly costs of transporting Brazilian soybeans from the southern ports to Hamburg, Germany
––––––––––––––––––––––––– 2016 –––––––––––––––––––––––––
1st qtr 2nd qtr 3rd qtr 4th qtr Avg 1st qtr 2nd qtr 3rd qtr 4th qtr Avg
North MT1 - Santos2
--US$/mt-- North MT1 - Paranaguá2
--US$/mt--
Truck 74.65 81.75 85.01 60.56 75.49 72.98 80.91 84.08 59.71 74.42
Ocean 16.00 17.00 16.50 23.00 18.13 16.00 17.00 16.50 24.00 18.38
Total transportation 90.65 98.75 101.51 83.56 93.62 88.98 97.91 100.58 83.71 92.80
Farm price 3 268.28 347.59 367.25 344.51 331.91 268.28 347.59 367.25 344.51 331.91
Landed cost 358.93 446.34 468.76 428.07 425.53 357.27 445.51 467.83 428.22 424.71
Transport % of landed cost 25.3 22.1 21.7 19.5 22.1 24.9 22.0 21.5 19.5 22.0
Southeast MT1 - Santos2
--US$/mt-- North Central PR1 - Paranaguá2
--US$/mt--
Truck 52.91 56.56 55.36 40.30 51.29 23.28 24.12 21.15 16.71 21.31
Ocean 16.00 17.00 16.50 23.00 18.13 16.00 17.00 16.50 24.00 18.38
Total transportation 68.91 73.56 71.86 63.30 69.41 39.28 41.12 37.65 40.71 39.69
Farm price 3 268.28 347.59 367.25 344.51 331.91 298.84 353.78 362.80 347.53 340.74
Landed cost 337.20 421.16 439.10 407.81 401.32 338.12 394.89 400.45 388.24 380.43
Transport % of landed cost 20.4 17.5 16.4 15.5 17.4 11.6 10.4 9.4 10.5 10.5
South GO1 - Santos2
--US$/mt-- Northwest RS1 - Rio Grande2
--US$/mt--
Truck 36.58 38.78 36.24 27.02 34.66 26.38 26.63 23.99 18.38 23.85
Ocean 16.00 17.00 16.50 23.00 18.13 16.00 17.00 13.00 23.00 17.25
Total transportation 52.58 55.78 52.74 50.02 52.78 42.38 43.63 36.99 41.38 41.10
Farm price 3 278.59 337.86 359.07 341.08 329.15 308.73 358.57 373.12 352.69 348.28
Landed cost 331.17 393.64 411.81 391.10 381.9 351.11 402.20 410.11 394.07 389.37
Transport % of landed cost 15.9 14.2 12.8 12.8 13.9 12.1 10.8 9.0 10.5 10.6
1Producing regions: RS = Rio Grande do Sul, MT = Mato Grosso, GO = Goiás, PR = Paraná 2Export ports 3Source: Companhia Nacional de Abastecimento (CONAB) www.conab.gov.br Source: ESALQ/ USP (University of São Paulo, Brazil) and USDA/AMS
Transportation Indicators

Transportation Indicators
Source: USDA/AMS 25
Quarterly costs of transporting Brazilian soybeans from the northern and northeastern ports to Shanghai, China
–––––––––––––––––––––––––2016–––––––––––––––––––––––––
1st qtr 2nd qtr 3rd qtr 4th qtr Avg 1st qtr 2nd qtr 3rd qtr 4th qtr Avg
North MT1 - Santarém2
--US$/mt-- South MA1 - São Luís2
--US$/mt--
Truck 52.62 58.93 48.27 38.58 49.60 27.80 33.86 32.12 30.38 31.04
Ocean 22.00 21.00 19.40 23.75 21.54 20.00 18.40 17.50 22.00 19.48
Total transportation 74.62 79.93 67.67 62.33 71.14 47.80 52.26 49.62 52.38 50.52
Farm price 3 268.28 347.59 367.25 344.51 331.91 310.69 378.45 447.42 370.99 376.89
Landed cost 342.90 427.53 434.91 406.84 403.05 358.49 430.72 497.05 423.37 427.41
Transport % of landed cost 21.8 18.7 15.6 15.3 20.2 13.3 12.1 10.0 12.4 12.0
Southwest PI1 - São Luís2
--US$/mt--
Truck 34.96 39.61 35.91 26.44 34.23
Ocean 20.00 18.40 17.50 22.00 19.48
Total transportation 54.96 58.01 53.41 48.44 53.71
Farm price 3 281.05 342.05 378.98 377.05 344.78
Landed cost 336.01 400.05 432.39 425.49 398.49
Transport % of landed cost 16.4 14.5 12.4 11.4 13.6
1Producing regions: MT= Mato Grosso, PI = Piauí, MA = Maranhão 2Export ports3Source: Companhia Nacional de Abastecimento (CONAB) www.conab.gov.br Source: ESALQ/ USP (University of São Paulo, Brazil) and USDA/AMS
Source: USDA/AMS 26
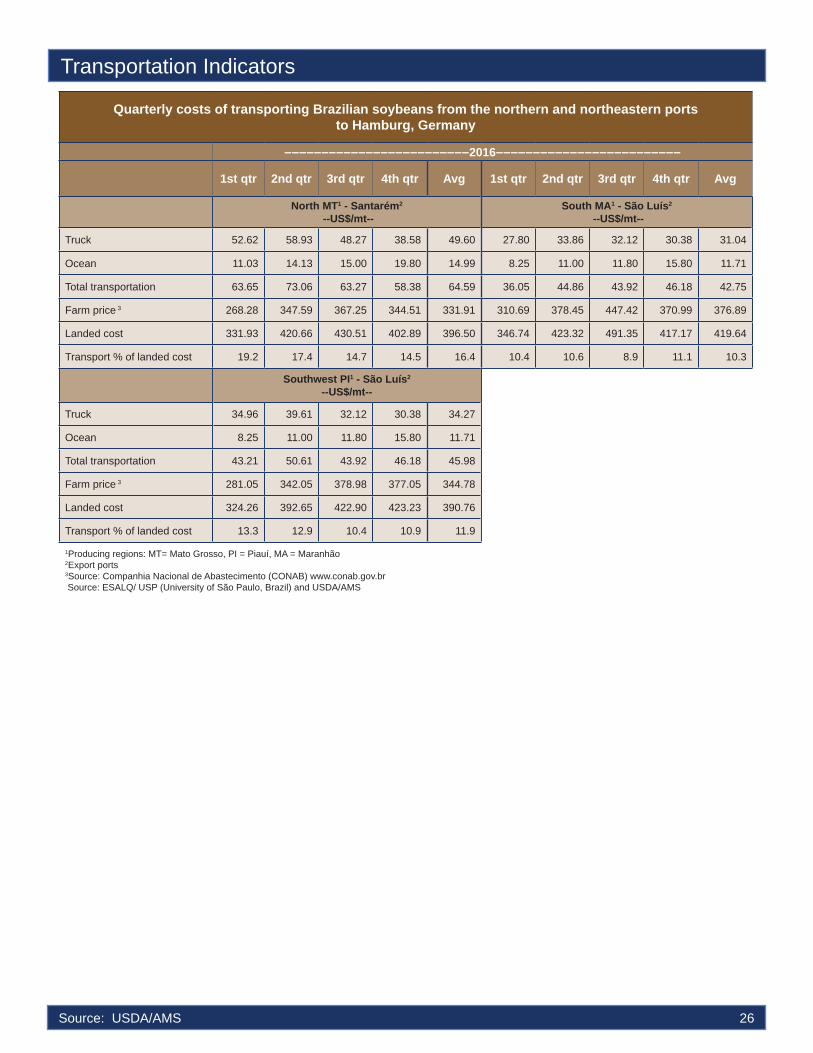
Quarterly costs of transporting Brazilian soybeans from the northern and northeastern ports to Hamburg, Germany
–––––––––––––––––––––––––2016–––––––––––––––––––––––––
1st qtr 2nd qtr 3rd qtr 4th qtr Avg 1st qtr 2nd qtr 3rd qtr 4th qtr Avg
North MT1 - Santarém2
--US$/mt-- South MA1 - São Luís2
--US$/mt--
Truck 52.62 58.93 48.27 38.58 49.60 27.80 33.86 32.12 30.38 31.04
Ocean 11.03 14.13 15.00 19.80 14.99 8.25 11.00 11.80 15.80 11.71
Total transportation 63.65 73.06 63.27 58.38 64.59 36.05 44.86 43.92 46.18 42.75
Farm price 3 268.28 347.59 367.25 344.51 331.91 310.69 378.45 447.42 370.99 376.89
Landed cost 331.93 420.66 430.51 402.89 396.50 346.74 423.32 491.35 417.17 419.64
Transport % of landed cost 19.2 17.4 14.7 14.5 16.4 10.4 10.6 8.9 11.1 10.3
Southwest PI1 - São Luís2
--US$/mt--
Truck 34.96 39.61 32.12 30.38 34.27
Ocean 8.25 11.00 11.80 15.80 11.71
Total transportation 43.21 50.61 43.92 46.18 45.98
Farm price 3 281.05 342.05 378.98 377.05 344.78
Landed cost 324.26 392.65 422.90 423.23 390.76
Transport % of landed cost 13.3 12.9 10.4 10.9 11.9
1Producing regions: MT= Mato Grosso, PI = Piauí, MA = Maranhão 2Export ports3Source: Companhia Nacional de Abastecimento (CONAB) www.conab.gov.br Source: ESALQ/ USP (University of São Paulo, Brazil) and USDA/AMS
Transportation Indicators
Transportation Indicators
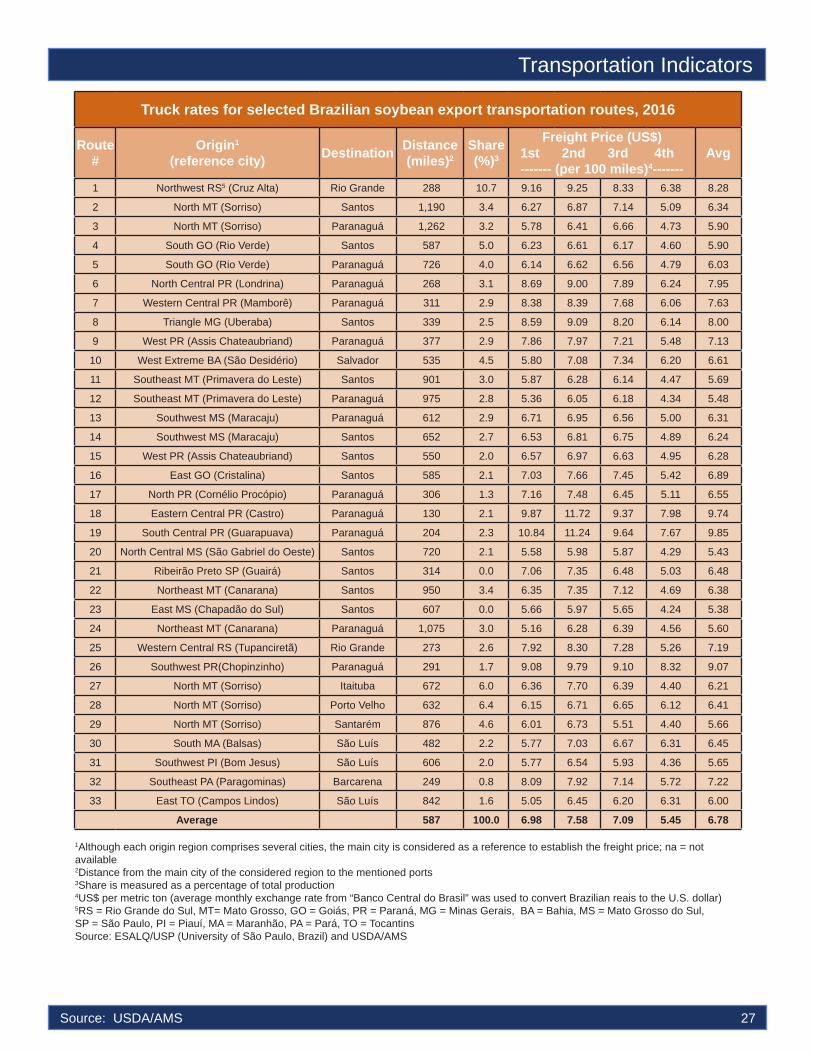
Truck rates for selected Brazilian soybean export transportation routes, 2016
Route #
Origin1 (reference city) Destination Distance
(miles)2Share (%)3
Freight Price (US$) 1st 2nd 3rd 4th
------- (per 100 miles)4-------Avg
1 Northwest RS5 (Cruz Alta) Rio Grande 288 10.7 9.16 9.25 8.33 6.38 8.28
2 North MT (Sorriso) Santos 1,190 3.4 6.27 6.87 7.14 5.09 6.34
3 North MT (Sorriso) Paranaguá 1,262 3.2 5.78 6.41 6.66 4.73 5.90
4 South GO (Rio Verde) Santos 587 5.0 6.23 6.61 6.17 4.60 5.90
5 South GO (Rio Verde) Paranaguá 726 4.0 6.14 6.62 6.56 4.79 6.03
6 North Central PR (Londrina) Paranaguá 268 3.1 8.69 9.00 7.89 6.24 7.95
7 Western Central PR (Mamborê) Paranaguá 311 2.9 8.38 8.39 7.68 6.06 7.63
8 Triangle MG (Uberaba) Santos 339 2.5 8.59 9.09 8.20 6.14 8.00
9 West PR (Assis Chateaubriand) Paranaguá 377 2.9 7.86 7.97 7.21 5.48 7.13
10 West Extreme BA (São Desidério) Salvador 535 4.5 5.80 7.08 7.34 6.20 6.61
11 Southeast MT (Primavera do Leste) Santos 901 3.0 5.87 6.28 6.14 4.47 5.69
12 Southeast MT (Primavera do Leste) Paranaguá 975 2.8 5.36 6.05 6.18 4.34 5.48
13 Southwest MS (Maracaju) Paranaguá 612 2.9 6.71 6.95 6.56 5.00 6.31
14 Southwest MS (Maracaju) Santos 652 2.7 6.53 6.81 6.75 4.89 6.24
15 West PR (Assis Chateaubriand) Santos 550 2.0 6.57 6.97 6.63 4.95 6.28
16 East GO (Cristalina) Santos 585 2.1 7.03 7.66 7.45 5.42 6.89
17 North PR (Cornélio Procópio) Paranaguá 306 1.3 7.16 7.48 6.45 5.11 6.55
18 Eastern Central PR (Castro) Paranaguá 130 2.1 9.87 11.72 9.37 7.98 9.74
19 South Central PR (Guarapuava) Paranaguá 204 2.3 10.84 11.24 9.64 7.67 9.85
20 North Central MS (São Gabriel do Oeste) Santos 720 2.1 5.58 5.98 5.87 4.29 5.43
21 Ribeirão Preto SP (Guairá) Santos 314 0.0 7.06 7.35 6.48 5.03 6.48
22 Northeast MT (Canarana) Santos 950 3.4 6.35 7.35 7.12 4.69 6.38
23 East MS (Chapadão do Sul) Santos 607 0.0 5.66 5.97 5.65 4.24 5.38
24 Northeast MT (Canarana) Paranaguá 1,075 3.0 5.16 6.28 6.39 4.56 5.60
25 Western Central RS (Tupanciretã) Rio Grande 273 2.6 7.92 8.30 7.28 5.26 7.19
26 Southwest PR(Chopinzinho) Paranaguá 291 1.7 9.08 9.79 9.10 8.32 9.07
27 North MT (Sorriso) Itaituba 672 6.0 6.36 7.70 6.39 4.40 6.21
28 North MT (Sorriso) Porto Velho 632 6.4 6.15 6.71 6.65 6.12 6.41
29 North MT (Sorriso) Santarém 876 4.6 6.01 6.73 5.51 4.40 5.66
30 South MA (Balsas) São Luís 482 2.2 5.77 7.03 6.67 6.31 6.45
31 Southwest PI (Bom Jesus) São Luís 606 2.0 5.77 6.54 5.93 4.36 5.65
32 Southeast PA (Paragominas) Barcarena 249 0.8 8.09 7.92 7.14 5.72 7.22
33 East TO (Campos Lindos) São Luís 842 1.6 5.05 6.45 6.20 6.31 6.00
Average 587 100.0 6.98 7.58 7.09 5.45 6.78
1Although each origin region comprises several cities, the main city is considered as a reference to establish the freight price; na = not available2Distance from the main city of the considered region to the mentioned ports3Share is measured as a percentage of total production4US$ per metric ton (average monthly exchange rate from “Banco Central do Brasil” was used to convert Brazilian reais to the U.S. dollar)5RS = Rio Grande do Sul, MT= Mato Grosso, GO = Goiás, PR = Paraná, MG = Minas Gerais, BA = Bahia, MS = Mato Grosso do Sul, SP = São Paulo, PI = Piauí, MA = Maranhão, PA = Pará, TO = TocantinsSource: ESALQ/USP (University of São Paulo, Brazil) and USDA/AMS
Source: USDA/AMS 27

Truck rates for selected Brazilian soybean export transportation routes, 2011-2016
Route #
Origin1 (reference city) Destination Distance
(miles)2Share (%)3
2011 2012 2013 2014 2015 2016Percent change 2015-16
Freight price
--------- (US$ per metrc ton)4---------1 Northwest RS5 (Cruz Alta) Rio Grande 288 10.7 37.54 25.83 23.26 24.56 26.4 23.8 -9.6
2 North MT (Sorriso) Santos 1190 3.4 123.31 111.78 116.40 103.90 86.0 75.5 -12.3
3 North MT (Sorriso) Paranaguá 1262 3.2 117.90 108.93 111.93 100.89 85.7 74.4 -13.1
4 South GO (Rio Verde) Santos 587 5.0 63.92 55.02 58.90 62.57 39.8 34.7 -13.0
5 South GO (Rio Verde) Paranaguá 726 4.0 62.90 52.94 68.08 60.73 49.7 43.8 -11.9
6 North Central PR (Londrina) Paranaguá 268 3.1 39.54 34.76 32.26 30.98 24.1 21.3 -11.4
7 Western Central PR (Mamborê) Paranaguá 311 2.9 38.14 31.02 33.23 33.68 27.0 23.7 -12.2
8 Triangle MG (Uberaba) Santos 339 2.5 57.43 45.04 40.42 57.45 31.8 27.1 -14.7
9 West PR (Assis Chateaubriand) Paranaguá 377 2.9 46.12 38.39 39.53 43.83 30.1 26.9 -10.6
10 West Extreme BA (São Desidério) Ilhéus 544 4.5 57.85 58.00 56.96 54.80 40.7 35.3 -13.1
11 Southeast MT (Primavera do Leste) Santos 901 3.0 95.82 84.42 88.66 79.00 58.8 51.3 -12.8
12 Southeast MT(Primavera do Leste) Paranaguá 975 2.8 93.55 76.93 75.43 67.65 61.6 53.5 -13.2
13 Southwest MS (Maracaju) Paranaguá 612 2.9 64.59 58.87 57.46 55.70 43.3 38.6 -10.8
14 Southwest MS (Maracaju) Santos 652 2.7 71.73 67.83 66.82 66.79 46.4 40.7 -12.2
15 West PR (Assis Chateaubriand) Santos 550 2.0 73.04 55.31 46.89 43.84 39.2 34.5 -11.9
16 Western Central RS (Tupanciretã) Rio Grande 273 2.1 31.40 62.73 67.47 69.48 45.7 40.3 -11.8
17 Southwest PR (Chopinzinho) Paranaguá 291 1.3 34.02 29.85 38.48 37.73 22.6 20.0 -11.4
18 Eastern Central PR (Castro) Paranaguá 130 2.1 26.55 23.87 25.08 24.65 15.1 12.7 -16.3
19 South Central PR (Guarapuava) Paranaguá 204 2.3 36.23 32.37 30.46 29.08 22.2 20.1 -9.6
20 North Central MS (São Gabriel do Oeste) Santos 720 2.1 70.45 63.40 64.58 64.67 44.9 39.1 -12.9
21 Ribeirão Preto SP (Guairá) Santos 314 0.0 42.16 37.18 35.15 34.91 23.3 20.3 -12.8
22 Northeast MT (Canarana) Santos 950 3.4 114.22 97.31 99.10 87.11 63.7 60.6 -4.9
23 Assis SP (Palmital) Santos 285 0.0 30.23 62.88 69.28 71.05 38.3 32.7 -14.6
24 Northeast MT (Canarana) Paranaguá 1075 3.0 115.15 86.74 53.29 56.47 70.3 60.2 -14.4
25 Western Central RS (Tupanciretã) Rio Grande 273 2.6 40.92 30.84 28.20 26.44 21.7 19.6 -9.5
26 Southwest PR (Chopinzinho) Paranaguá 291 1.7 44.03 37.04 36.59 37.05 30.3 26.4 -13.0
27 North MT (Sorriso) Itaituba 672 6.0 --na-- --na-- --na-- --na-- 41.7 41.7 0.0
28 North MT (Sorriso) Porto Velho 632 6.4 --na-- --na-- --na-- --na-- 40.3 40.5 0.5
29 North MT (Sorriso) Santarém 876 4.6 --na-- --na-- --na-- --na-- 58.1 49.6 -14.7
30 South MA (Balsas) São Luís 482 2.2 --na-- --na-- --na-- --na-- 36.2 31.0 -14.1
31 Southwest PI (Bom Jesus) São Luís 606 2.0 --na-- --na-- --na-- --na-- 43.0 34.2 -20.5
32 Southeast PA (Paragominas) Barcarena 249 0.8 --na-- --na-- --na-- --na-- 19.8 17.9 -9.5
33 East TO (Campos Lindos) São Luís 842 1.6 --na-- --na-- --na-- --na-- 56.8 50.5 -11.0
Average 587 100.0 73.32 58.23 58.24 57.03 45.0 39.8 -11.5
1Although each origin region comprises several cities, the main city is considered as a reference to establish the freight price; na = not available2Distance from the main city of the considered region to the mentioned ports3Share is measured as a percentage of total production4US$ per metric ton (average monthly exchange rate from “Banco Central do Brasil” was used to convert Brazilian reais to the U.S. dollar)5RS = Rio Grande do Sul, MT= Mato Grosso, GO = Goiás, PR = Paraná, MG = Minas Gerais, BA = Bahia, MS = Mato Grosso do Sul, SP = São Paulo, PI = Piauí, MA = Maranhão, PA = Pará, TO = TocantinsSource: ESALQ/USP (University of São Paulo, Brazil) and USDA/AMS
Source: USDA/AMS 28
Transportation Indicators

Transportation Indicators
Truck rates for selected Brazilian soybean export transportation routes
Source: ESALQ/USP (University of São Paulo, Brazil) and USDA/AMS
Source: USDA/AMS 29
Truck rates for selected north, south, and northeastern Brazilian soybean export transportation route
Source: ESALQ/USP (University of São Paulo, Brazil) and USDA/AMS
$2
$3
$4
$5
$6
$7
$8
$9
$10
$11
$12
$13
Jan-
14
Ma
y-14
Sep
-14
Jan-
15
Ma
y-15
Sep
-15
Jan-
16
Ma
y-16
Sep
-16
US$/
MT /
100
mile
s
Western Center PR to Paranaguá
North MT to Paranaguá
Southwest MS to Paranaguá
South GO to Paranaguá
South GO to Santos
$3
$4
$5
$6
$7
$8
$9
$10
$11
Jan-
15
Feb-
15
Mar
-15
Apr
-15
May
-15
Jun-
15
Jul-1
5
Aug
-15
Sep
-15
Oct
-15
Nov
-15
Dec
-15
Jan-
16
Feb-
16
Mar
-16
Apr
-16
May
-16
Jun-
16
Jul-1
6
Aug
-16
Sep
-16
Oct
-16
Nov
-16
Dec
-16
US$/
MT/
100
mile
s
North MT(Sorriso) toItaituba
North MT(Sorriso) to PortoVelho
East TO(Campos Lindos)to São Luis
North MT(Sorriso) toSantos
Southeast PA(Paragominas) toBarcarena
Southwest PI(Bom Jesus) toSão Luís

Source: USDA/AMS 30
Brazilian soybean export truck transportation weighted average prices, 2014/16
Source: ESALQ/USP (University of São Paulo, Brazil) and USDA/AMS
$2
$4
$6
$8
$10
$12
Jan-
14
Ap
r-14
Jul-1
4
Oct
-14
Jan-
15
Ap
r-15
Jul-1
5
Oct
-15
Jan-
16
Ap
r-16
Jul-1
6
Oct
-16
US$/
MT/
100
mile
s
Brazilian soybean export increases and truck cost declines for selected routes
Source: ESALQ/ USP (University of São Paulo, Brazil) and USDA/AMS. Secretariat of Foreign Trade (SECEX), MDIC
0
10,000
20,000
30,000
40,000
50,000
60,000
0.00
20.00
40.00
60.00
80.00
100.00
120.00
140.00
2005 2006 2007 2008 2009 2010 2011 2012 2013 2014 2015 2016
Truc
k co
sts
in U
S$/m
etric
ton
Soyb
ean
expo
rts in
thou
sand
met
ric to
nBrazil soybean exports
North MT (Sorriso) to Santos
Northwest RS (Cruz Alta) to Rio Grande
Transportation Indicators
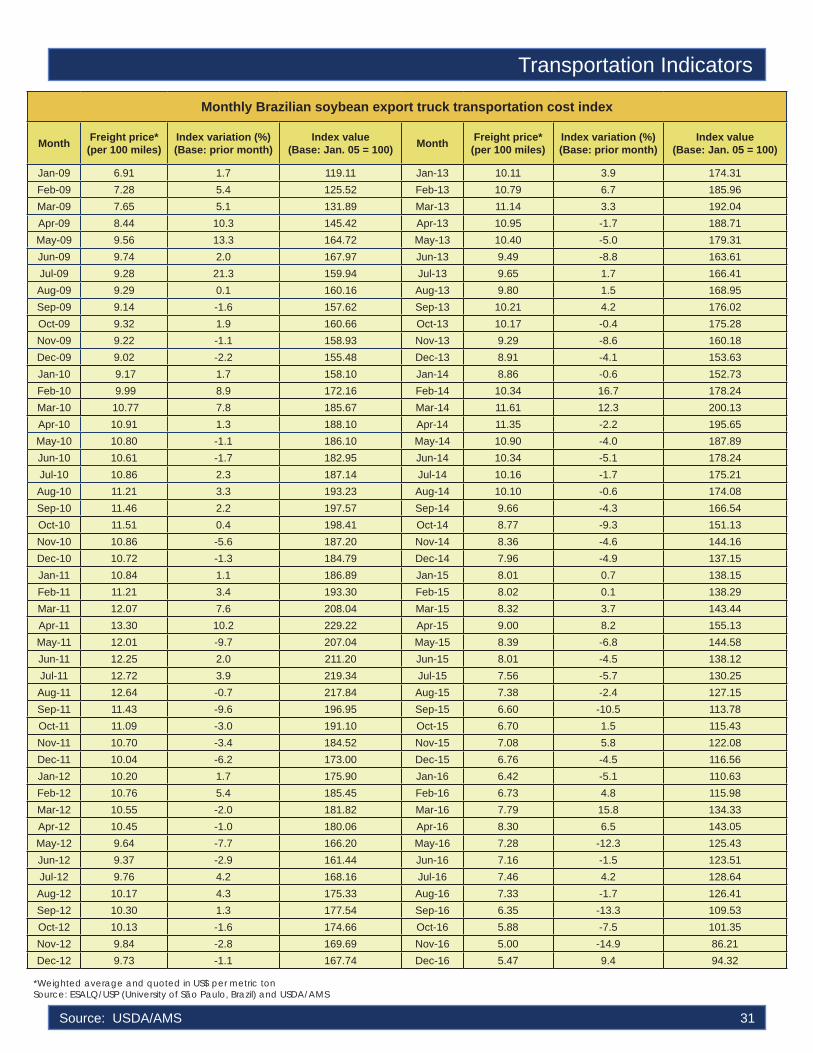
Transportation Indicators
Source: USDA/AMS 31
Monthly Brazilian soybean export truck transportation cost index
Month Freight price* (per 100 miles)
Index variation (%) (Base: prior month)
Index value (Base: Jan. 05 = 100) Month Freight price*
(per 100 miles)Index variation (%) (Base: prior month)
Index value (Base: Jan. 05 = 100)
Jan-09 6.91 1.7 119.11 Jan-13 10.11 3.9 174.31Feb-09 7.28 5.4 125.52 Feb-13 10.79 6.7 185.96Mar-09 7.65 5.1 131.89 Mar-13 11.14 3.3 192.04Apr-09 8.44 10.3 145.42 Apr-13 10.95 -1.7 188.71May-09 9.56 13.3 164.72 May-13 10.40 -5.0 179.31Jun-09 9.74 2.0 167.97 Jun-13 9.49 -8.8 163.61Jul-09 9.28 21.3 159.94 Jul-13 9.65 1.7 166.41Aug-09 9.29 0.1 160.16 Aug-13 9.80 1.5 168.95Sep-09 9.14 -1.6 157.62 Sep-13 10.21 4.2 176.02Oct-09 9.32 1.9 160.66 Oct-13 10.17 -0.4 175.28Nov-09 9.22 -1.1 158.93 Nov-13 9.29 -8.6 160.18Dec-09 9.02 -2.2 155.48 Dec-13 8.91 -4.1 153.63Jan-10 9.17 1.7 158.10 Jan-14 8.86 -0.6 152.73Feb-10 9.99 8.9 172.16 Feb-14 10.34 16.7 178.24Mar-10 10.77 7.8 185.67 Mar-14 11.61 12.3 200.13Apr-10 10.91 1.3 188.10 Apr-14 11.35 -2.2 195.65May-10 10.80 -1.1 186.10 May-14 10.90 -4.0 187.89Jun-10 10.61 -1.7 182.95 Jun-14 10.34 -5.1 178.24Jul-10 10.86 2.3 187.14 Jul-14 10.16 -1.7 175.21Aug-10 11.21 3.3 193.23 Aug-14 10.10 -0.6 174.08Sep-10 11.46 2.2 197.57 Sep-14 9.66 -4.3 166.54Oct-10 11.51 0.4 198.41 Oct-14 8.77 -9.3 151.13Nov-10 10.86 -5.6 187.20 Nov-14 8.36 -4.6 144.16Dec-10 10.72 -1.3 184.79 Dec-14 7.96 -4.9 137.15Jan-11 10.84 1.1 186.89 Jan-15 8.01 0.7 138.15Feb-11 11.21 3.4 193.30 Feb-15 8.02 0.1 138.29Mar-11 12.07 7.6 208.04 Mar-15 8.32 3.7 143.44Apr-11 13.30 10.2 229.22 Apr-15 9.00 8.2 155.13May-11 12.01 -9.7 207.04 May-15 8.39 -6.8 144.58Jun-11 12.25 2.0 211.20 Jun-15 8.01 -4.5 138.12Jul-11 12.72 3.9 219.34 Jul-15 7.56 -5.7 130.25Aug-11 12.64 -0.7 217.84 Aug-15 7.38 -2.4 127.15Sep-11 11.43 -9.6 196.95 Sep-15 6.60 -10.5 113.78Oct-11 11.09 -3.0 191.10 Oct-15 6.70 1.5 115.43Nov-11 10.70 -3.4 184.52 Nov-15 7.08 5.8 122.08Dec-11 10.04 -6.2 173.00 Dec-15 6.76 -4.5 116.56Jan-12 10.20 1.7 175.90 Jan-16 6.42 -5.1 110.63Feb-12 10.76 5.4 185.45 Feb-16 6.73 4.8 115.98Mar-12 10.55 -2.0 181.82 Mar-16 7.79 15.8 134.33Apr-12 10.45 -1.0 180.06 Apr-16 8.30 6.5 143.05May-12 9.64 -7.7 166.20 May-16 7.28 -12.3 125.43Jun-12 9.37 -2.9 161.44 Jun-16 7.16 -1.5 123.51Jul-12 9.76 4.2 168.16 Jul-16 7.46 4.2 128.64Aug-12 10.17 4.3 175.33 Aug-16 7.33 -1.7 126.41Sep-12 10.30 1.3 177.54 Sep-16 6.35 -13.3 109.53Oct-12 10.13 -1.6 174.66 Oct-16 5.88 -7.5 101.35Nov-12 9.84 -2.8 169.69 Nov-16 5.00 -14.9 86.21Dec-12 9.73 -1.1 167.74 Dec-16 5.47 9.4 94.32
*Weighted average and quoted in US$ per metric ton Source: ESALQ/USP (University of São Paulo, Brazil) and USDA/AMS

Quarterly ocean freight rates for shipping soybeans from selected Brazilian ports to Shanghai, China
(US$/metric ton)*
Ports
Santos Paranaguá Rio Grande Santarém São Luís Barcarena20101st qtr 52.33 52.50 53.00
2nd qtr 55.08 58.58 58.75
3rd qtr 58.17 63.10 63.27
4th qtr 57.79 61.50 57.83
2010 Average 55.84 58.92 58.21 --na-- --na-- --na--20111st qtr 50.00 56.25 50.50
2nd qtr 50.05 57.62 50.60
3rd qtr 52.31 59.61 53.02
4th qtr 49.65 55.80 50.26
2011 Average 50.50 57.32 51.10 --na-- --na-- --na--20121st qtr 46.62 52.32 47.92
2nd qtr 51.35 57.63 52.78
3rd qtr 50.42 55.42 49.02
4th qtr 50.42 55.42 49.02
2012 Average 49.70 55.20 49.69 --na-- --na-- --na--20131st qtr 52.34 56.03 51.34
2nd qtr 34.50 36.75 35.25
3rd qtr 34.50 36.75 35.25
4th qtr 42.50 46.00 44.25
2013 Average 40.96 43.88 41.52 --na-- --na-- --na--20141st qtr 44.83 47.22 44.83
2nd qtr 38.07 41.13 38.75
3rd qtr 34.00 36.00 32.50
4th qtr 30.50 32.50 30.50
2014 Average 36.85 39.21 36.65 --na-- --na-- --na--20151st qtr 29.50 31.50 29.50 32.00 32.00 32.00
2nd qtr 22.50 23.50 25.00 25.00 25.00 25.00
3rd qtr 23.25 24.18 25.75 25.75 25.75 25.75
4th qtr 20.00 20.50 21.00 23.50 23.50 23.50
2015 Average 23.81 24.92 25.31 26.56 26.56 26.56 20161st qtr 17.50 18.00 18.50 22.00 20.00 22.50
2nd qtr 16.50 18.50 17.00 21.00 18.40 21.50
3rd qtr 12.50 14.50 13.00 19.40 17.50 20.00
4th qtr 20.00 21.50 20.50 23.75 22.00 23.75
2016 Average 16.63 18.13 17.25 21.54 19.48 21.94
*Correspond to the average actual values negotiated between shippers and carriers and weighted according to the magnitude of the shipped volume Source: Sistema de Informações de Fretes, SIFRECA, ESALQ/USP (University of São Paulo, Brazil)
Source: USDA/AMS 32
Transportation Indicators

Transportation IndicatorsQuarterly ocean freight rates for shipping soybeans from selected Brazilian ports to Hamburg, Germany
(US$/metric ton)*
Ports
Santos Paranaguá Rio Grande Santarém São Luís Barcarena20101st qtr 32.25 31.83 33.50
2nd qtr 36.17 38.08 39.00
3rd qtr 34.42 36.92 37.08
4th qtr 31.67 33.50 34.54
2010 Average 33.63 35.08 36.03 --na-- --na-- --na--20111st qtr 34.96 33.86 35.43
2nd qtr 35.00 36.00 36.00
3rd qtr 36.65 37.29 37.81
4th qtr 32.00 32.63 35.22
2011 Average 34.65 34.95 36.12 --na-- --na-- --na--20121st qtr 32.00 31.58 32.08
2nd qtr 35.00 35.00 36.50
3rd qtr 32.00 34.30 32.00
4th qtr 28.00 34.30 32.00
2012 Average 31.75 33.80 33.15 --na-- --na-- --na--20131st qtr 30.00 30.00 30.00
2nd qtr 29.00 29.00 29.00
3rd qtr 29.00 29.00 29.00
4th qtr 30.00 30.00 30.00
2013 Average 29.50 29.50 29.50 --na-- --na-- --na--20141st qtr 31.00 31.00 31.00
2nd qtr 30.00 30.00 30.00
3rd qtr 26.00 28.00 24.50
4th qtr 24.00 26.00 22.50
2014 Average 27.75 28.75 27.00 --na-- --na-- --na--20151st qtr 22.00 22.00 22.00 20.00 20.00 20.00
2nd qtr 21.00 21.00 21.00 14.50 18.25 16.00
3rd qtr 19.00 19.00 19.00 13.50 16.38 15.20
4th qtr 17.00 17.00 17.00 20.00 20.50 21.00
2015 Average 19.75 19.75 19.75 17.00 18.78 18.05 20161st qtr 16.00 16.00 16.00 11.03 8.25 9.60
2nd qtr 17.00 17.00 17.00 14.13 11.00 12.45
3rd qtr 16.50 16.50 16.50 15.00 11.80 13.20
4th qtr 23.00 24.00 23.00 19.80 15.80 17.35
2016 Average 18.13 18.38 18.13 14.99 11.71 13.15
*Correspond to the average actual values negotiated between shippers and carriers and weighted according to the magnitude of the shipped volume Source: Sistema de Informações de Fretes, SIFRECA, ESALQ/USP (University of São Paulo, Brazil)
Source: USDA/AMS 33
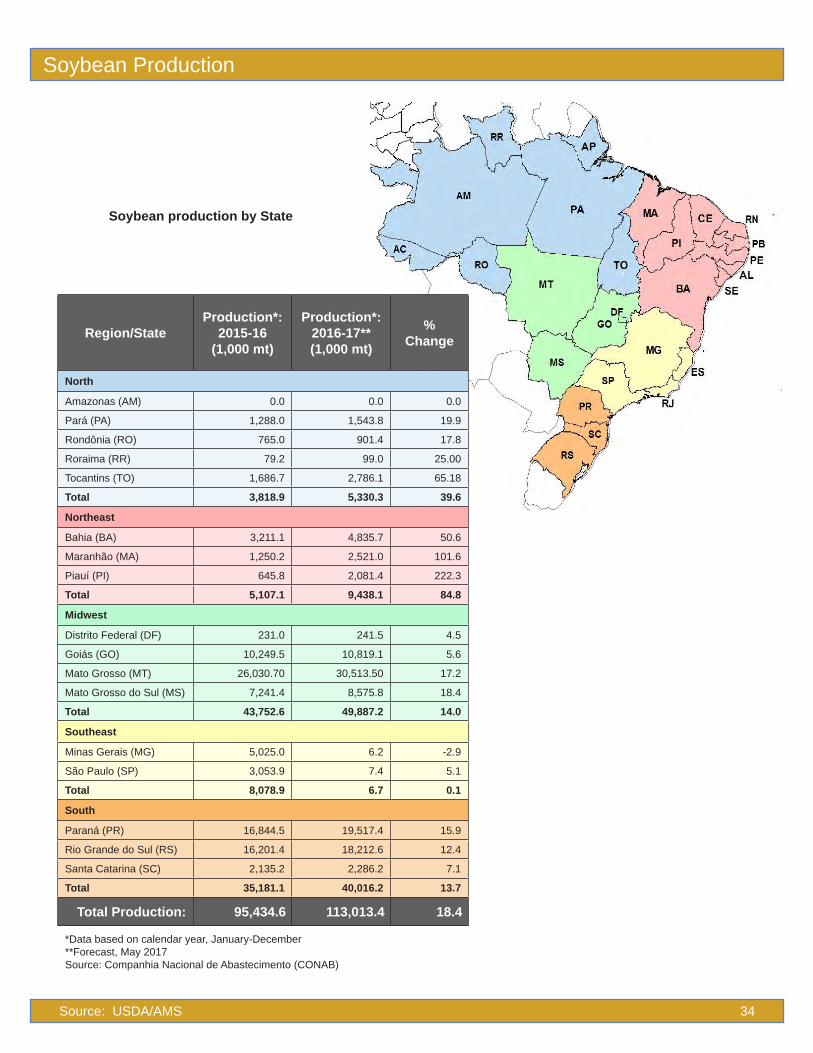
Region/StateProduction*:
2015-16 (1,000 mt)
Production*: 2016-17** (1,000 mt)
% Change
North
Amazonas (AM) 0.0 0.0 0.0
Pará (PA) 1,288.0 1,543.8 19.9
Rondônia (RO) 765.0 901.4 17.8
Roraima (RR) 79.2 99.0 25.00
Tocantins (TO) 1,686.7 2,786.1 65.18
Total 3,818.9 5,330.3 39.6
Northeast
Bahia (BA) 3,211.1 4,835.7 50.6
Maranhão (MA) 1,250.2 2,521.0 101.6
Piauí (PI) 645.8 2,081.4 222.3
Total 5,107.1 9,438.1 84.8
Midwest
Distrito Federal (DF) 231.0 241.5 4.5
Goiás (GO) 10,249.5 10,819.1 5.6
Mato Grosso (MT) 26,030.70 30,513.50 17.2
Mato Grosso do Sul (MS) 7,241.4 8,575.8 18.4
Total 43,752.6 49,887.2 14.0
Southeast
Minas Gerais (MG) 5,025.0 6.2 -2.9
São Paulo (SP) 3,053.9 7.4 5.1
Total 8,078.9 6.7 0.1
South
Paraná (PR) 16,844.5 19,517.4 15.9
Rio Grande do Sul (RS) 16,201.4 18,212.6 12.4
Santa Catarina (SC) 2,135.2 2,286.2 7.1
Total 35,181.1 40,016.2 13.7
Total Production: 95,434.6 113,013.4 18.4
*Data based on calendar year, January-December **Forecast, May 2017 Source: Companhia Nacional de Abastecimento (CONAB)
Soybean production by State
Source: USDA/AMS 34
Soybean Production

Soybean Production
Brazil soybean supply and distribution
Year* Area Harvested
Beginning Stocks Production Imports Total
Supply Exports Crush Domestic Consumption
Ending Stocks
1,000 hectares ---------- 1,000 metric tons ----------
2003/04 21,520 3,898 51,000 364 55,262 19,257 28,914 31,457 4,548
2004/05 22,917 4,548 53,000 352 57,900 22,799 29,728 32,413 2,688
2005/06 22,229 2,688 57,000 40 59,728 24,770 28,756 31,506 3,452
2006/07 20,700 3,452 59,000 108 62,560 23,805 31,511 34,261 4,494
2007/08 21,300 4,494 61,000 83 65,577 24,515 31,895 34,695 6,367
2008/09 21,700 6,367 57,800 124 64,291 28,041 30,779 33,579 2,671
2009/10 23,500 2,671 69,000 150 71,821 29,188 35,700 38,550 4,083
2010/11 24,200 4,083 75,300 40 79,423 33,789 37,264 40,164 5,470
2011/12 25,000 5,470 66,500 298 72,268 31,905 36,230 39,130 1,233
2012/13 27,700 1,233 82,000 240 83,473 42,826 36,432 39,378 1,269
2013/14 30,100 1,269 86,700 579 88,548 45,747 38,195 41,345 1,456
2014/15 32,100 1,456 97,200 325 98,981 54,635 40,348 43,696 650
2015/16 33,300 650 96,500 380 97,530 52,100 39,220 42,720 2,710
2016/17 34,000 2,710 111,600 550 114,860 63,600 42,000 45,560 5,700
2017/18** 34,700 5,700 107,000 350 113,050 63,500 42,000 45,710 3,840
*Data based on Brazil’s local February/January Marketing Year (MY) Where February 2012 - January 2013 is the 2011/12 MY. **Forecast: May 10, 2017Source: USDA/Foreign Agricultural Service/Market and Trade/Reports/PSD Reports/Oilseeds
Source: USDA/AMS 35

State2014 2015 2016
Rank-------metric ton-------
Mato Grosso 14,211,027 14,514,829 15,222,273 1
Rio Grande Do Sul 7,698,506 10,653,865 9,529,430 2
Paraná 6,621,838 7,779,670 7,970,946 3
Mato Grosso Do Sul 3,323,395 3,225,232 3,549,416 4
Goiás 2,064,171 2,655,176 3,152,092 5
São Paulo 2,430,893 3,447,470 2,892,712 6
Bahia 1,418,299 1,957,116 2,281,776 7
Minas Gerais 1,629,386 1,509,219 1,564,279 8
Maranhão 1,725,152 2,609,868 1,402,068 9
Tocantins 1,243,223 1,570,491 1,081,074 10
Santa Catarina 1,476,770 1,781,110 941,587 11
Pará 642,934 830,509 825,297 12
Rondônia 608,660 762,629 766,114 13
Piauί 350,464 736,989 260,652 14
Distrito Federal 178,708 227,077 44,640 15
Others 65,424 61,352 93,108
Total 45,688,848 54,322,601 51,577,465
Sources: Bureau of Foreign Trade (SECEX), MDIC
Source: USDA/AMS 36
Top 15 Brazilian soybean exporting states
Exports
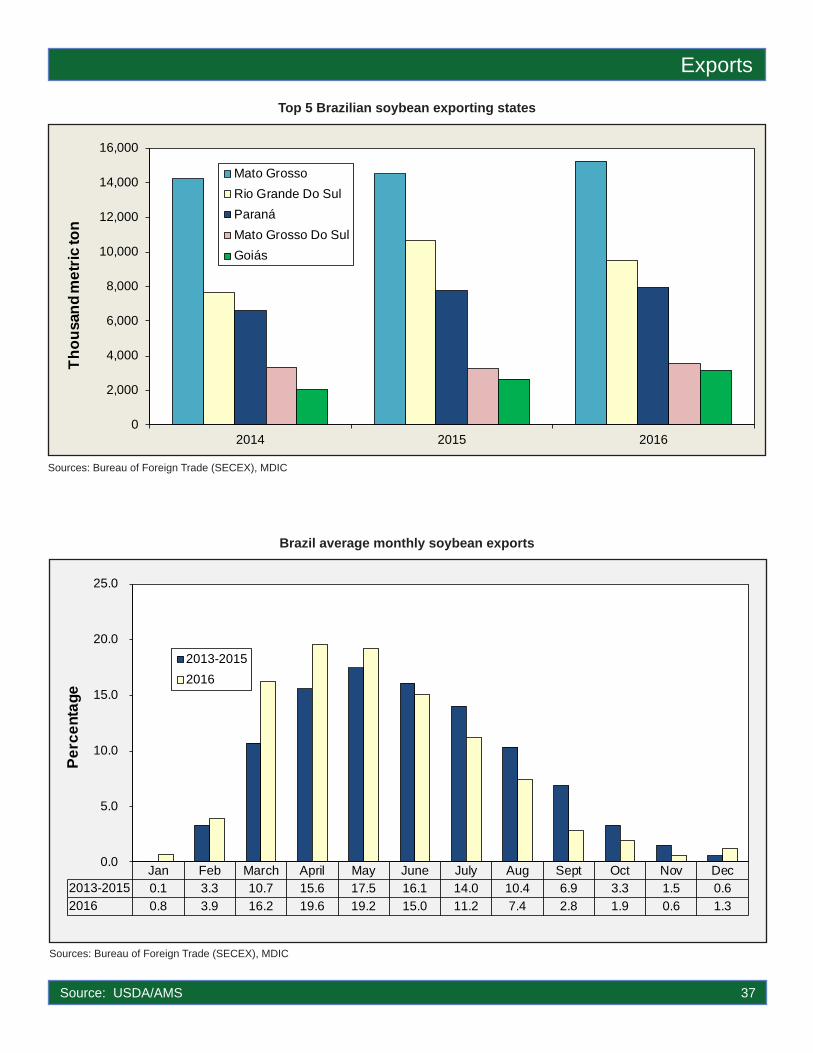
Exports
Source: USDA/AMS 37
Sources: Bureau of Foreign Trade (SECEX), MDIC
Brazil average monthly soybean exports
Top 5 Brazilian soybean exporting states
Sources: Bureau of Foreign Trade (SECEX), MDIC
0
2,000
4,000
6,000
8,000
10,000
12,000
14,000
16,000
2014 2015 2016
Thou
sand
met
ric to
n
Mato GrossoRio Grande Do SulParanáMato Grosso Do SulGoiás
Jan Feb March April May June July Aug Sept Oct Nov Dec2013-2015 0.1 3.3 10.7 15.6 17.5 16.1 14.0 10.4 6.9 3.3 1.5 0.62016 0.8 3.9 16.2 19.6 19.2 15.0 11.2 7.4 2.8 1.9 0.6 1.3
0.0
5.0
10.0
15.0
20.0
25.0
Perc
enta
ge
2013-20152016
Brazil average monthly soybean exports

Main export routes for soybeans
Source: USDA/AMS 38
Brazilian Institute of Geography and Statistics– Produção Agricola Municipal, Lloyd’s Ports, and World Wildlife Fund (WWF)Source: USDA/Agricultural Marketing Service & Foreign Agricultural Service
Exports

Exports
Source: Bureau of Foreign Trade (SECEX), MDIC
Source: USDA/AMS 39
World export routes for Brazilian soybeans
Top 5 Brazilian soybean export destinations
Source: USDA/Agricultural Marketing Service & Foreign Agricultural Service
0
5,000
10,000
15,000
20,000
25,000
30,000
35,000
40,000
45,000
China Spain Thailand Netherlands Iran
Thou
sand
met
ric to
n
2014 2015 2016

Source: USDA/AMS 40
Top 5 world soybean exporting countries
*Forecast: May 10, 2017 Source: USDA/Foreign Agricultural Service/Market and Trade Data/Reports/Oilseeds
In 2016, Brazil was the top soybean exporter followed by the United States, Argentina, Paraguay, and Canada. USDA forecasts that Brazil will sustain its leadership position in 2017.
Exports
0 6,000 12,000 18,000 24,000 30,000 36,000 42,000 48,000 54,000 60,000 66,000
Brazil
United States
Argentina
Canada
Paraguay
(1,000 metric tons)
2017/18* 2016/17 2015/16

Source: USDA/AMS 41
China is Brazil’s largest soybean buyer, accounting for nearly 75 percent of total soybean exports in 2016. Brazil soybean exports to China usually peak in May and finish by the end of October. Over 90 percent of Brazil soybeans exports to China originated from Mato Grosso, Rio Grande do Sul, Paraná, Goiás, São Paulo, Mato Grosso do Sul, Minas Gerais, and Santa Catarina in 2016.
Brazil average monthly soybean exports to China
Source: Bureau of Foreign Trade (SECEX), MDIC
Jan Feb March April May June July Aug Sept Oct Nov Dec2013-2015 0.3 4.1 13.8 16.0 16.4 14.3 11.5 7.7 4.2 2.0 0.9 0.72016 0.8 4.1 17.1 20.7 18.6 15.0 10.7 6.8 2.2 2.1 0.5 1.2
0.0
5.0
10.0
15.0
20.0
25.0
Perc
enta
ge
2013-2015
2016
Exports to China
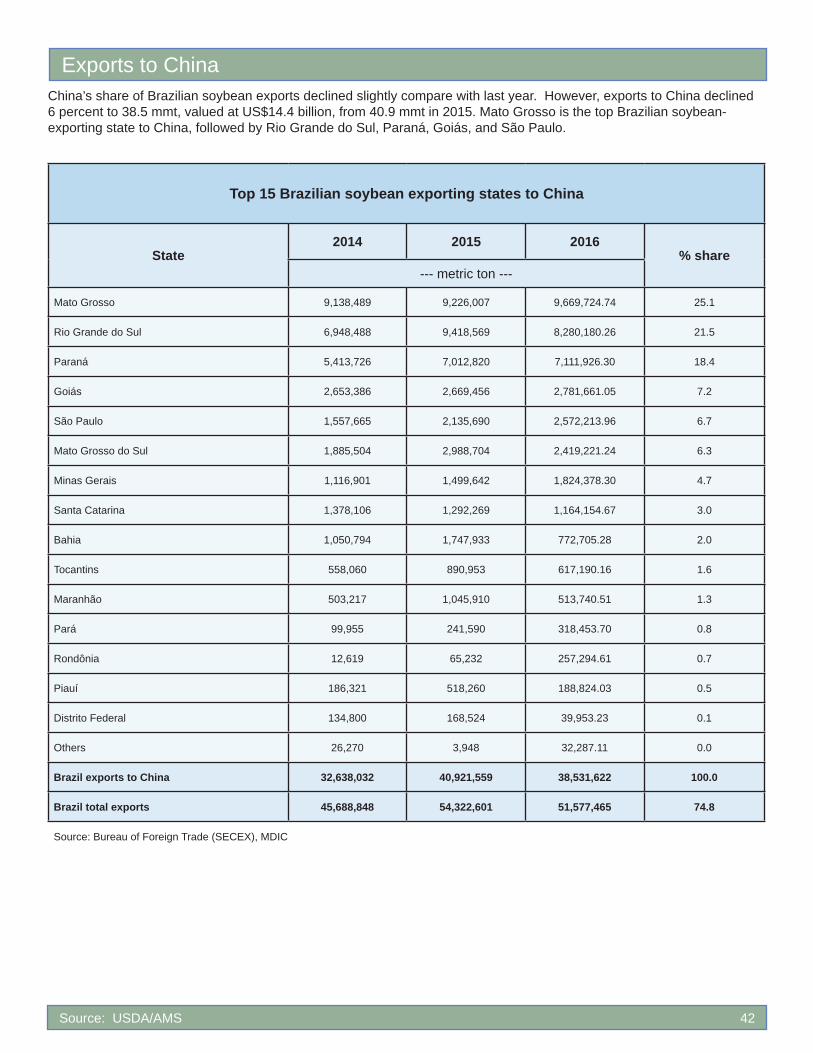
Source: USDA/AMS 42
Top 15 Brazilian soybean exporting states to China
State2014 2015 2016
% share--- metric ton ---
Mato Grosso 9,138,489 9,226,007 9,669,724.74 25.1
Rio Grande do Sul 6,948,488 9,418,569 8,280,180.26 21.5
Paraná 5,413,726 7,012,820 7,111,926.30 18.4
Goiás 2,653,386 2,669,456 2,781,661.05 7.2
São Paulo 1,557,665 2,135,690 2,572,213.96 6.7
Mato Grosso do Sul 1,885,504 2,988,704 2,419,221.24 6.3
Minas Gerais 1,116,901 1,499,642 1,824,378.30 4.7
Santa Catarina 1,378,106 1,292,269 1,164,154.67 3.0
Bahia 1,050,794 1,747,933 772,705.28 2.0
Tocantins 558,060 890,953 617,190.16 1.6
Maranhão 503,217 1,045,910 513,740.51 1.3
Pará 99,955 241,590 318,453.70 0.8
Rondônia 12,619 65,232 257,294.61 0.7
Piauí 186,321 518,260 188,824.03 0.5
Distrito Federal 134,800 168,524 39,953.23 0.1
Others 26,270 3,948 32,287.11 0.0
Brazil exports to China 32,638,032 40,921,559 38,531,622 100.0
Brazil total exports 45,688,848 54,322,601 51,577,465 74.8
Source: Bureau of Foreign Trade (SECEX), MDIC
China’s share of Brazilian soybean exports declined slightly compare with last year. However, exports to China declined 6 percent to 38.5 mmt, valued at US$14.4 billion, from 40.9 mmt in 2015. Mato Grosso is the top Brazilian soybean-exporting state to China, followed by Rio Grande do Sul, Paraná, Goiás, and São Paulo.
Exports to China

Exports to China
Source: USDA/AMS 43
Top 15 Mato Grosso (MT) soybean export destinations
State2014 2015 2016 %
share Rank
China 9,138,489 9,226,007 9,669,725 63.5 1
Spain 912,663 986,513 1,011,000 6.6 2
Netherlands 826,466 445,503 573,992 3.8 3
Thailand 390,421 635,042 547,487 3.6 4
Russia 413,189 369,443 508,405 3.3 5
Iran 4,663 179,450 333,488 2.2 6
Germany 102,592 147,910 303,802 2.0 7
Italy 232,162 62,625 284,208 1.9 8
United Kingdom 153,628 187,362 263,668 1.7 9
Norway 281,897 322,499 253,851 1.7 10
Saudi Arabia 115,329 240,347 246,429 1.6 11
Taiwan 144,082 314,198 238,936 1.6 12
France 24,952 112,007 182,252 1.2 13
Turkey 224,346 88,559 156,856 1.0 14
South Korea 113,875 340,727 141,615 0.9 15
Others 1,132,275 856,636 506,559 3.3
Mato Grosso total 14,211,027 14,514,829 15,222,273 100.0
MT % share of Brazil exports to China 28.0 22.5 25.1
Brazil exports to China 32,664,302 40,925,507 38,563,909
Brazil total exports 45,688,848 54,322,601 51,577,465
China % share of Brazil total exports 71.5 75.2 74.8
Source: Bureau of Foreign Trade (SECEX), MDIC
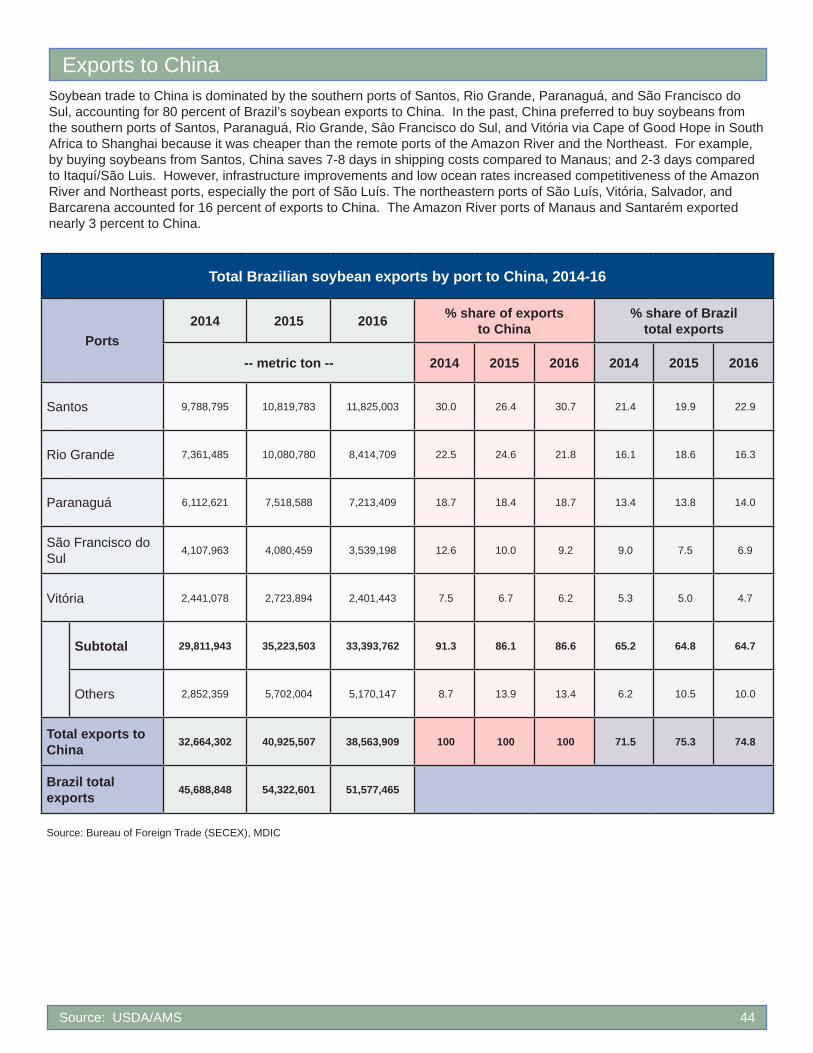
Source: USDA/AMS 44
Soybean trade to China is dominated by the southern ports of Santos, Rio Grande, Paranaguá, and São Francisco do Sul, accounting for 80 percent of Brazil’s soybean exports to China. In the past, China preferred to buy soybeans from the southern ports of Santos, Paranaguá, Rio Grande, Sâo Francisco do Sul, and Vitória via Cape of Good Hope in South Africa to Shanghai because it was cheaper than the remote ports of the Amazon River and the Northeast. For example, by buying soybeans from Santos, China saves 7-8 days in shipping costs compared to Manaus; and 2-3 days compared to Itaquí/São Luis. However, infrastructure improvements and low ocean rates increased competitiveness of the Amazon River and Northeast ports, especially the port of São Luís. The northeastern ports of São Luís, Vitória, Salvador, and Barcarena accounted for 16 percent of exports to China. The Amazon River ports of Manaus and Santarém exported nearly 3 percent to China.
Total Brazilian soybean exports by port to China, 2014-16
Ports2014 2015 2016 % share of exports
to China% share of Brazil
total exports
-- metric ton -- 2014 2015 2016 2014 2015 2016
Santos 9,788,795 10,819,783 11,825,003 30.0 26.4 30.7 21.4 19.9 22.9
Rio Grande 7,361,485 10,080,780 8,414,709 22.5 24.6 21.8 16.1 18.6 16.3
Paranaguá 6,112,621 7,518,588 7,213,409 18.7 18.4 18.7 13.4 13.8 14.0
São Francisco do Sul
4,107,963 4,080,459 3,539,198 12.6 10.0 9.2 9.0 7.5 6.9
Vitória 2,441,078 2,723,894 2,401,443 7.5 6.7 6.2 5.3 5.0 4.7
Subtotal 29,811,943 35,223,503 33,393,762 91.3 86.1 86.6 65.2 64.8 64.7
Others 2,852,359 5,702,004 5,170,147 8.7 13.9 13.4 6.2 10.5 10.0
Total exports to China 32,664,302 40,925,507 38,563,909 100 100 100 71.5 75.3 74.8
Brazil total exports 45,688,848 54,322,601 51,577,465
Source: Bureau of Foreign Trade (SECEX), MDIC
Exports to China
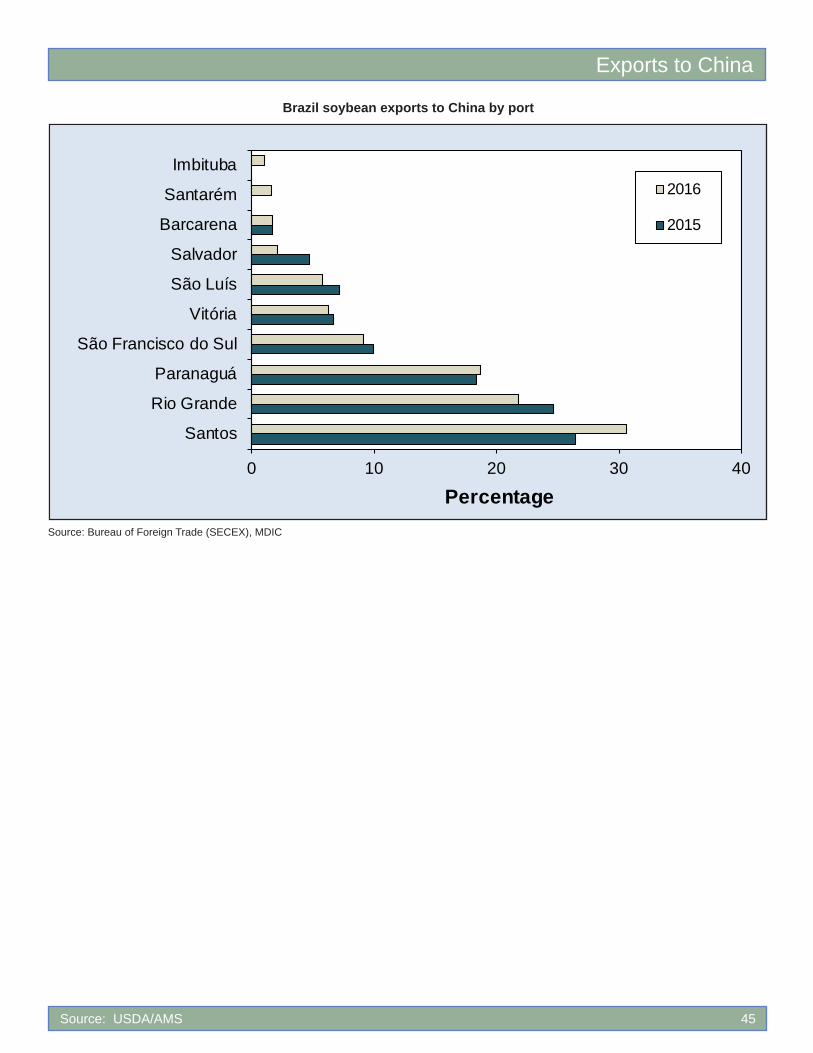
Exports to China
Source: USDA/AMS 45
Brazil soybean exports to China by port
Source: Bureau of Foreign Trade (SECEX), MDIC
0 10 20 30 40
Santos
Rio Grande
Paranaguá
São Francisco do Sul
Vitória
São Luís
Salvador
Barcarena
Santarém
Imbituba
Percentage
2016
2015
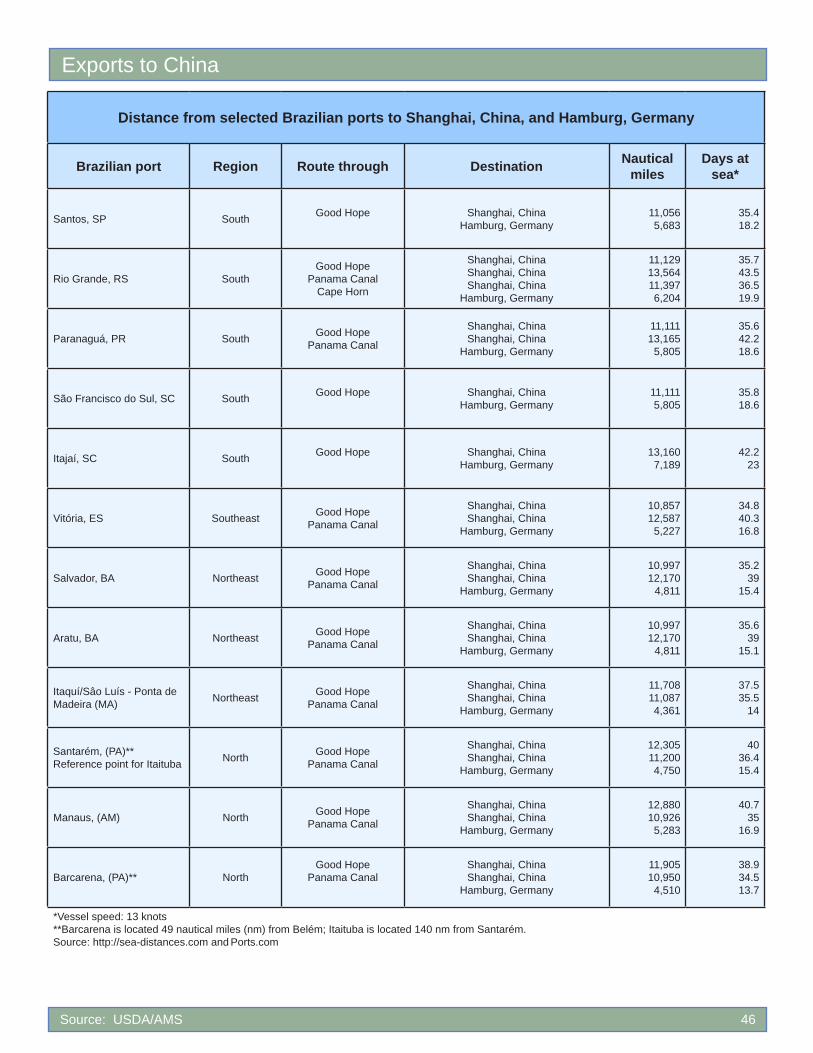
Source: USDA/AMS 46
Distance from selected Brazilian ports to Shanghai, China, and Hamburg, Germany
Brazilian port Region Route through Destination Nautical miles
Days at sea*
Santos, SP South Good Hope Shanghai, ChinaHamburg, Germany
11,0565,683
35.418.2
Rio Grande, RS SouthGood Hope
Panama CanalCape Horn
Shanghai, ChinaShanghai, ChinaShanghai, China
Hamburg, Germany
11,12913,56411,3976,204
35.743.536.519.9
Paranaguá, PR South Good HopePanama Canal
Shanghai, ChinaShanghai, China
Hamburg, Germany
11,11113,1655,805
35.642.218.6
São Francisco do Sul, SC South Good Hope Shanghai, ChinaHamburg, Germany
11,1115,805
35.818.6
Itajaí, SC South Good Hope Shanghai, ChinaHamburg, Germany
13,1607,189
42.223
Vitória, ES Southeast Good HopePanama Canal
Shanghai, ChinaShanghai, China
Hamburg, Germany
10,85712,5875,227
34.840.316.8
Salvador, BA Northeast Good HopePanama Canal
Shanghai, ChinaShanghai, China
Hamburg, Germany
10,99712,170
4,811
35.239
15.4
Aratu, BA Northeast Good HopePanama Canal
Shanghai, ChinaShanghai, China
Hamburg, Germany
10,99712,170
4,811
35.639
15.1
Itaquí/Sâo Luís - Ponta de Madeira (MA) Northeast Good Hope
Panama Canal
Shanghai, ChinaShanghai, China
Hamburg, Germany
11,70811,0874,361
37.535.5
14
Santarém, (PA)**Reference point for Itaituba North Good Hope
Panama Canal
Shanghai, ChinaShanghai, China
Hamburg, Germany
12,30511,2004,750
4036.415.4
Manaus, (AM) North Good HopePanama Canal
Shanghai, ChinaShanghai, China
Hamburg, Germany
12,88010,9265,283
40.735
16.9
Barcarena, (PA)** NorthGood Hope
Panama CanalShanghai, ChinaShanghai, China
Hamburg, Germany
11,90510,9504,510
38.934.513.7
*Vessel speed: 13 knots**Barcarena is located 49 nautical miles (nm) from Belém; Itaituba is located 140 nm from Santarém.Source: http://sea-distances.com and Ports.com
Exports to China

Exports to China
Source: USDA/AMS 47
In 2016, China was the major destination of Brazilian soybeans through the port of Santos, Brazil’s largest soybean exporting port, followed by Thailand, Taiwan, Iran, and South Korea. The peak of soybean shipments to China from Santos usually occurs during March―May. The majority of soybean exports through Santos were originated from Mato Grosso (49%), São Paulo (20%), Goiás (14%), Minas Gerais (9%), Mato Grosso do Sul (6%), and Paraná (1%).
Port of Santos soybean exports by country
Source: Bureau of Foreign Trade (SECEX), MDIC
Port of Santos soybean average monthly exports to China
Source: Bureau of Foreign Trade (SECEX)
0.0
5.0
10.0
15.0
20.0
25.0
30.0
Jan Feb March April May June July Aug Sept Oct Nov Dec2013-2015 0.0 3.7 18.2 16.5 23.0 17.5 12.4 5.4 1.8 0.8 0.7 0.12016 4.8 28.0 23.7 20.3 11.6 8.6 3.0 0.0 0.0 0.0 0.0 0.0
Perc
enta
ge
0.0 20.0 40.0 60.0 80.0 100.0
China
Thailand
Taiwan
Iran
South Korea2016
2015
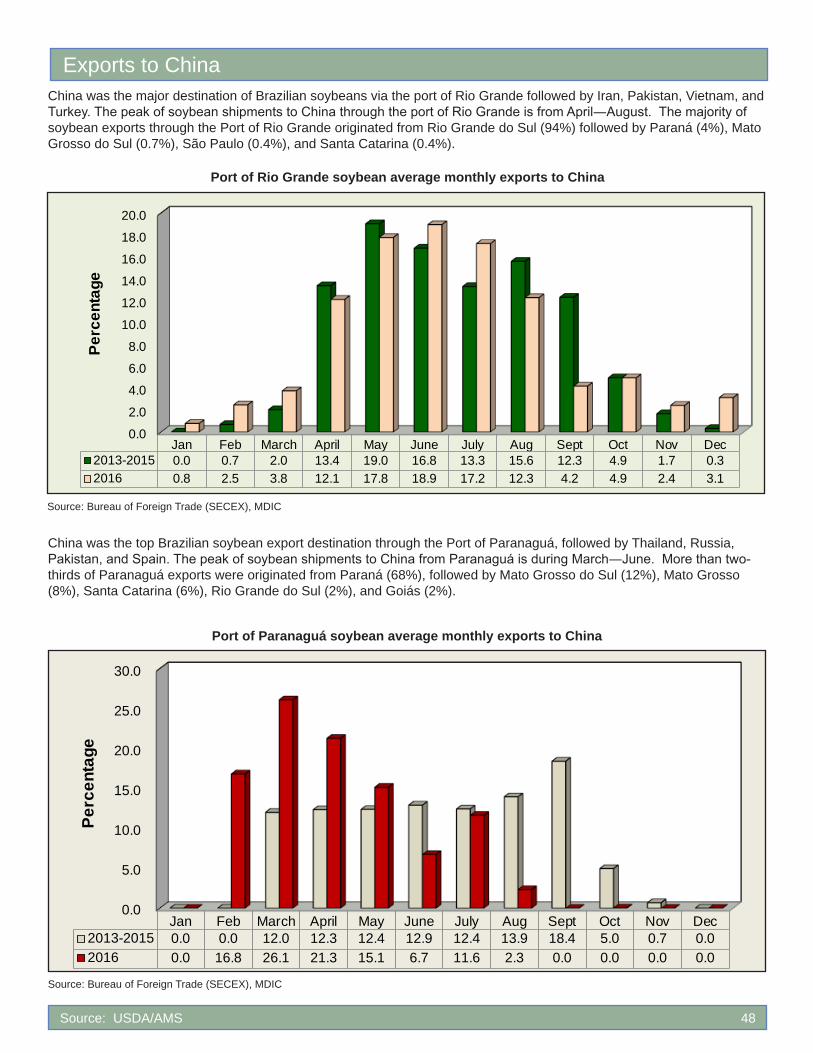
Source: USDA/AMS 48
Source: Bureau of Foreign Trade (SECEX), MDIC
Port of Rio Grande soybean average monthly exports to China
Source: Bureau of Foreign Trade (SECEX), MDIC
Port of Paranaguá soybean average monthly exports to China
China was the major destination of Brazilian soybeans via the port of Rio Grande followed by Iran, Pakistan, Vietnam, and Turkey. The peak of soybean shipments to China through the port of Rio Grande is from April―August. The majority of soybean exports through the Port of Rio Grande originated from Rio Grande do Sul (94%) followed by Paraná (4%), Mato Grosso do Sul (0.7%), São Paulo (0.4%), and Santa Catarina (0.4%).
China was the top Brazilian soybean export destination through the Port of Paranaguá, followed by Thailand, Russia, Pakistan, and Spain. The peak of soybean shipments to China from Paranaguá is during March―June. More than two-thirds of Paranaguá exports were originated from Paraná (68%), followed by Mato Grosso do Sul (12%), Mato Grosso (8%), Santa Catarina (6%), Rio Grande do Sul (2%), and Goiás (2%).
0.0
2.0
4.0
6.0
8.0
10.0
12.0
14.0
16.0
18.0
20.0
Jan Feb March April May June July Aug Sept Oct Nov Dec2013-2015 0.0 0.7 2.0 13.4 19.0 16.8 13.3 15.6 12.3 4.9 1.7 0.32016 0.8 2.5 3.8 12.1 17.8 18.9 17.2 12.3 4.2 4.9 2.4 3.1
Perc
enta
ge
0.0
5.0
10.0
15.0
20.0
25.0
30.0
Jan Feb March April May June July Aug Sept Oct Nov Dec2013-2015 0.0 0.0 12.0 12.3 12.4 12.9 12.4 13.9 18.4 5.0 0.7 0.02016 0.0 16.8 26.1 21.3 15.1 6.7 11.6 2.3 0.0 0.0 0.0 0.0
Perc
enta
ge Exports to China

Exports to China
Source: USDA/AMS 49
China was the top Brazilian soybean export destination through the Port of São Luís, followed by the Netherlands, Spain, Portugal, and Thailand. São Luís is the top northeastern soybean exporting port, accounting for 9 percent of Brazilian total soybean exports and 7 percent of exports to China, followed by Vitória, Barcarena, Manaus, and Santarém. These 4 ports accounted for 15 percent of exports to China. Soybean trade from Mato Grosso to the Southern ports of Vitória, Paranaguá, and São Francisco do Sul, and Rio Grande, is mostly diverted to the Northeastern port of Barcarena, Manaus, São Luís, and Santarém to expedite soybean exports. Infrastructure improvements and low transportation costs, especially ocean rates, facilitated exports through the port of São Luís. More than one-third of exports of the port of São Luís originated from Mato Grosso (34%), followed by Tocantins (25%), Maranhão (22%), Pará (9%), and Piauí (6%).
Source: Bureau of Foreign Trade (SECEX)
Port of São Luís average monthly soybean exports to China
0.0
5.0
10.0
15.0
20.0
25.0
30.0
Jan Feb March April May June July Aug Sept Oct Nov Dec2013-2015 0.0 0.0 12.0 12.3 12.4 12.9 12.4 13.9 18.4 5.0 0.7 0.02016 0.0 16.8 26.1 21.3 15.1 6.7 11.6 2.3 0.0 0.0 0.0 0.0
Perc
enta
ge

Brazilian ports
Sources: Companhia Nacional de Abastecimento (CONAB) Ministério dos Transportes, Brazil
In Brazil, there are 40 water and sea ports and 42 private terminals. The Port of Santos Channel is 426.4 ft wide and 42.64 ft deep. The Port of Paranaguá’s entrance strip is 656 ft wide and 39.36 ft deep. It has 3 access channels. Galheta, the major access channel, extends 17.7 miles and has a width ranging from 492 to 656 ft, and a depth of 39.36 ft. The Port of Vitória’s entry strip is 820 ft wide and 62.32 ft deep. Its access channel extends 4.34 miles, and is 393.6 ft wide and 36.08 ft deep. The port of Santarém access channel is 5,905 ft wide and 49.2 ft deep. The port of Manaus access channel is 1,640 ft wide and 114.8 ft deep. Santarém and Manaus have the capacity to handle Panamax vessels that require a draft of up to 39.5 ft.
Source: USDA/AMS 50
Ports
Sea Port
River Port
Survey Port*
*Brazilian port where cargo data are collected. These ports are responsible for more than 98% of the Brazilian cargo movement.
Transportation Modes

Transportation Modes
Major rivers of the Amazonian Basin
Source: National Agency for Waterway Transportation (ANTAQ)
Source: USDA/AMS 51
Brazil has 39,060 miles of river-lake surface water and 27,280 miles of navigable rivers, but only 8,060 miles are commercially navigated.
Brazil waterway system
Extension Miles
River-lake surface water 39,060
National river network 27,280
Naturally navigable waterways 17,980 (100%)
Commercial navigations 8,060 (45%)
Vessel owned 1,148
Source: Confederação Nacional do Transporte (CNT) National Agency for Waterway Transporation (ANTAQ)

Brazilian river system
Source: National Agency for Waterway Transportation (ANTAQ)
Legend
Source: USDA/AMS 52
Navigable stretchesStretches with little navigation
Obstacles to navigation
Transportation Modes

Transportation Modes
Brazilian river system
Source: USDA/AMS 53
SantaremManaus
Porto Velho
Caceres
Ladário
River Port
The Port of Manaus access channel is 1,640 ft wide and 114.8 ft deep. Porto Velho’s access channel depth varies from 8.2 to 57.4 ft. The Port of Santarém’s access channel is 5,904 ft wide and 49.2 ft deep.
Corumba
Pirapora
Sources: Ministério dos Transportes, Brazil Companhia Nacional de Abastecimento (CONAB)

Brazilian river basins
Source: Ministério dos Transportes, Brazil
Amazônica Basin
Northeast Basin
Tocantins Araguaia Basin
São Francisco Basin
East Basin
South Basin
Paraguay Basin
Tietê-Paraná Basin
Brazil’s river system comprises eight basins: Amazônica, Northeast, Tocantins Araguaia, São Francisco, East, Tietê-Paraná, Paraguay, and South. The Amazônica and Paraguay Basin account for 72 percent of the total area of the Brazilian basins. The Paraguay Basin serves Argentina, Brazil, Bolivia, Paraguay, and Uruguay. Its navigable portion is comparable with the Mississippi River in the United States and the Rhine River in Europe.
Source: USDA/AMS 54
Transportation Modes
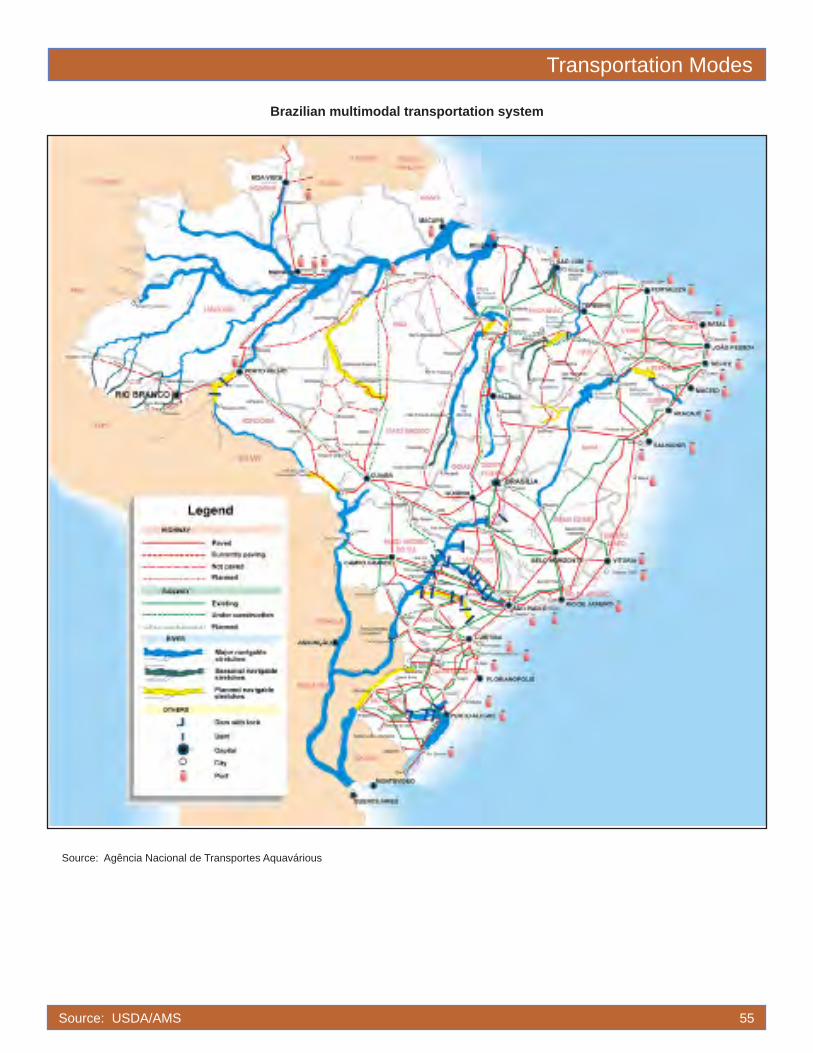
Transportation Modes
Brazilian multimodal transportation system
Source: Agência Nacional de Transportes Aquavárious
Source: USDA/AMS 55
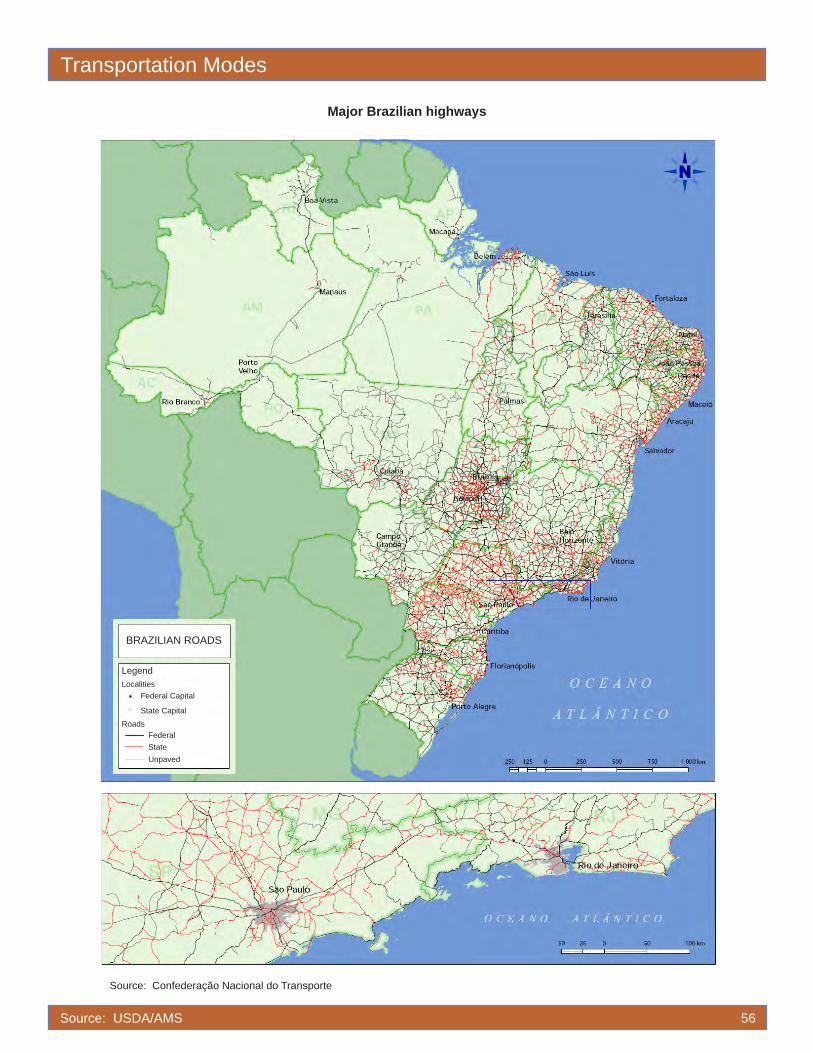
Major Brazilian highways
Source: Confederação Nacional do Transporte
Source: USDA/AMS 56
BRAZILIAN ROADS
LegendLocalities
State Capital
Federal Capital
Roads
UnpavedStateFederal
Transportation Modes
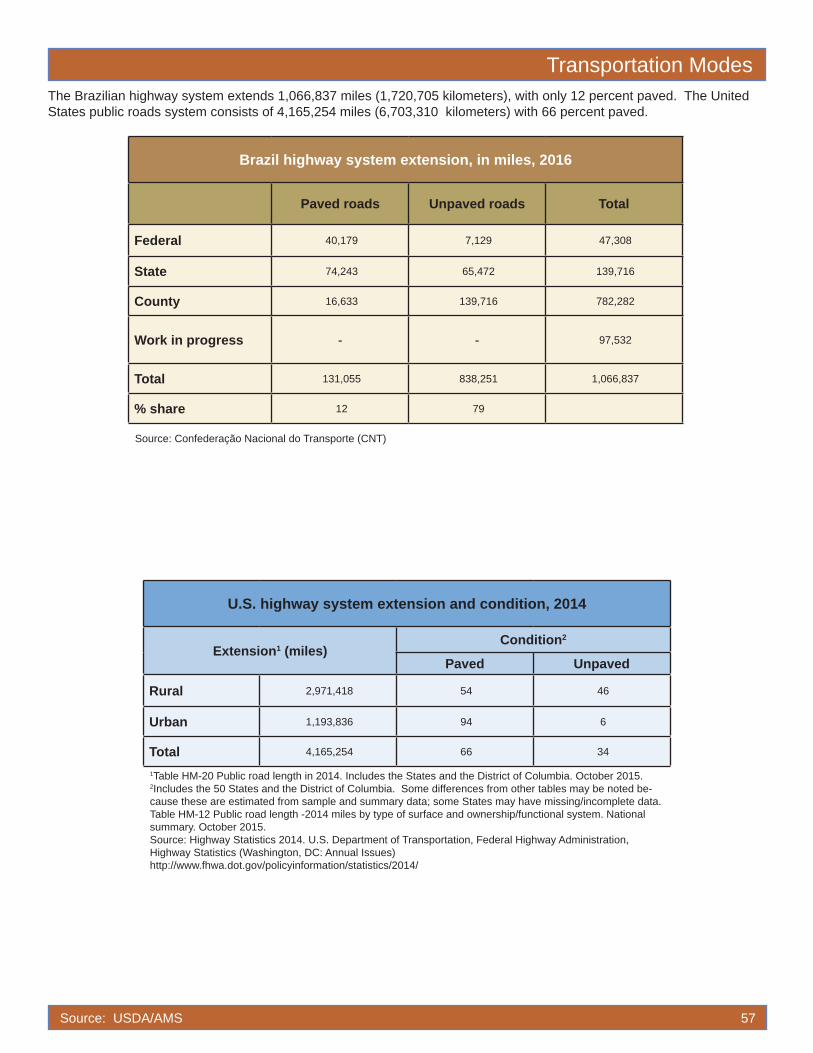
Transportation Modes
Source: USDA/AMS 57
The Brazilian highway system extends 1,066,837 miles (1,720,705 kilometers), with only 12 percent paved. The United States public roads system consists of 4,165,254 miles (6,703,310 kilometers) with 66 percent paved.
Brazil highway system extension, in miles, 2016
Paved roads Unpaved roads Total
Federal 40,179 7,129 47,308
State 74,243 65,472 139,716
County 16,633 139,716 782,282
Work in progress - - 97,532
Total 131,055 838,251 1,066,837
% share 12 79
Source: Confederação Nacional do Transporte (CNT)
U.S. highway system extension and condition, 2014
Extension1 (miles)Condition2
Paved Unpaved
Rural 2,971,418 54 46
Urban 1,193,836 94 6
Total 4,165,254 66 34
1Table HM-20 Public road length in 2014. Includes the States and the District of Columbia. October 2015.2Includes the 50 States and the District of Columbia. Some differences from other tables may be noted be-cause these are estimated from sample and summary data; some States may have missing/incomplete data. Table HM-12 Public road length -2014 miles by type of surface and ownership/functional system. National summary. October 2015.Source: Highway Statistics 2014. U.S. Department of Transportation, Federal Highway Administration, Highway Statistics (Washington, DC: Annual Issues)http://www.fhwa.dot.gov/policyinformation/statistics/2014/
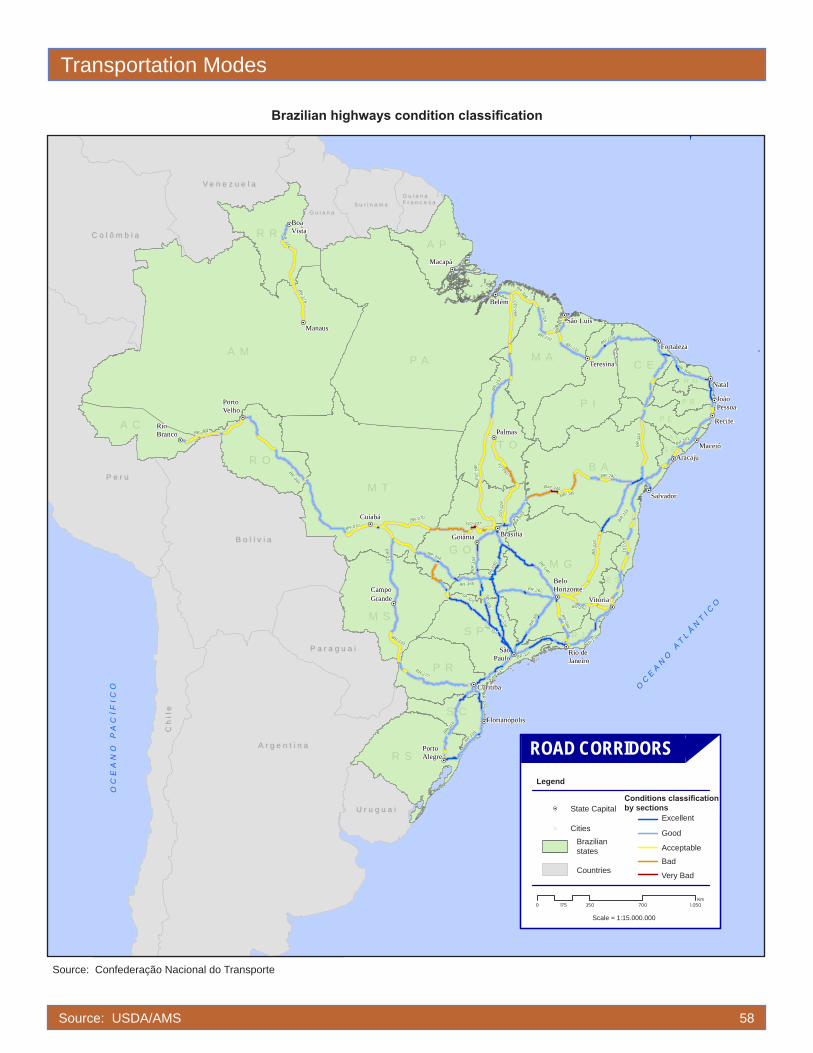
Brazilian highways condition classification
Source: Confederação Nacional do Transporte
2007 Classification Survey of the Highway System
(54,307 miles)
Source: USDA/AMS 58
ConditionExcellent
State CapitalVery BadBadAcceptable
Good
Transportation Modes
!H
!H
!H
!H
!H
!H
!H!H
!H
!H
!H
!H
!H
!H
!H
!H
!H
!H
!H
!H
!H
!H
!H
!H
!H
!H
!H
SãoPaulo
Florianópolis
PortoAlegre
Curitiba
Rio deJaneiro
Vitória
BeloHorizonteCampo
Grande
Cuiabá
Goiânia
Palmas
Salvador
AracajuMaceió
Recife
JoãoPessoa
Natal
Fortaleza
São Luís
Belém
Macapá
Manaus
RioBranco
PortoVelho
Teresina
Brasília
BoaVista
B o l í v i aB o l í v i a
P a r a g u a iP a r a g u a i
U r u g u a iU r u g u a i
A r g e n t i n aA r g e n t i n a
P e r uP e r u
C o l ô m b i aC o l ô m b i a
Ch
ile
Ch
i le
V e n e z u e l aV e n e z u e l a
G u i a n aG u i a n aS u r i n a m eS u r i n a m e
G u i a n aG u i a n aF r a n c e s aF r a n c e s a
A M
A C
R R
R O
M S
P A
A P
C EM A
P I
G O
M T
M G
B A
P R
R S
S C
R J
E S
P B
P E
A L
S E
R N
S P
T O
BR-174B
R-0
10
BR
-153BR-222
BR-3
81 BR-040
BR
-101
BR
-163
BR-316
BR-0
50
BR-304
GO-427
BR-349BR
-153
SP-310
BR-116
SP
-326
BR-163
TO-050
BR-1
35
BR-174
BAT-349
BR-116
BR-364
BR-1
16
BR-262
BR-116
BR
-116
BR
-101
SP-320
BR
-116
BR-222
BR
-153
BR
-316
SP-330
BR-101
BR-242
BR-070
BR-316
BR-364
BR-101
BR-070
BR-365
BR-364
BR-277
BR-262
BR-040
BR-020
BR-101
GO
-118
OC
EA
NO
AT
LÂ
NT
I CO
OC
EA
NO
PA
CÍF
ICO
G O I Á S
0 350 700 1.050175Km
Escala= 1:15.000.000
EstadosBrasileiros
Países
CapitalEstadual
!H
Cidades(
LEGENDA
Bom
Ótimo
Regular
Ruim
Péssimo
CORREDORES RODOVIÁRIOS
Classificação dos TrechosEstado Geral
Excellent
Very Bad
Bad
Acceptable
Good
Legend
State Capital
CitiesBrazilian states
Countries
Scale = 1:15.000.000
ROAD CORRIDORS
Conditions classification by sections
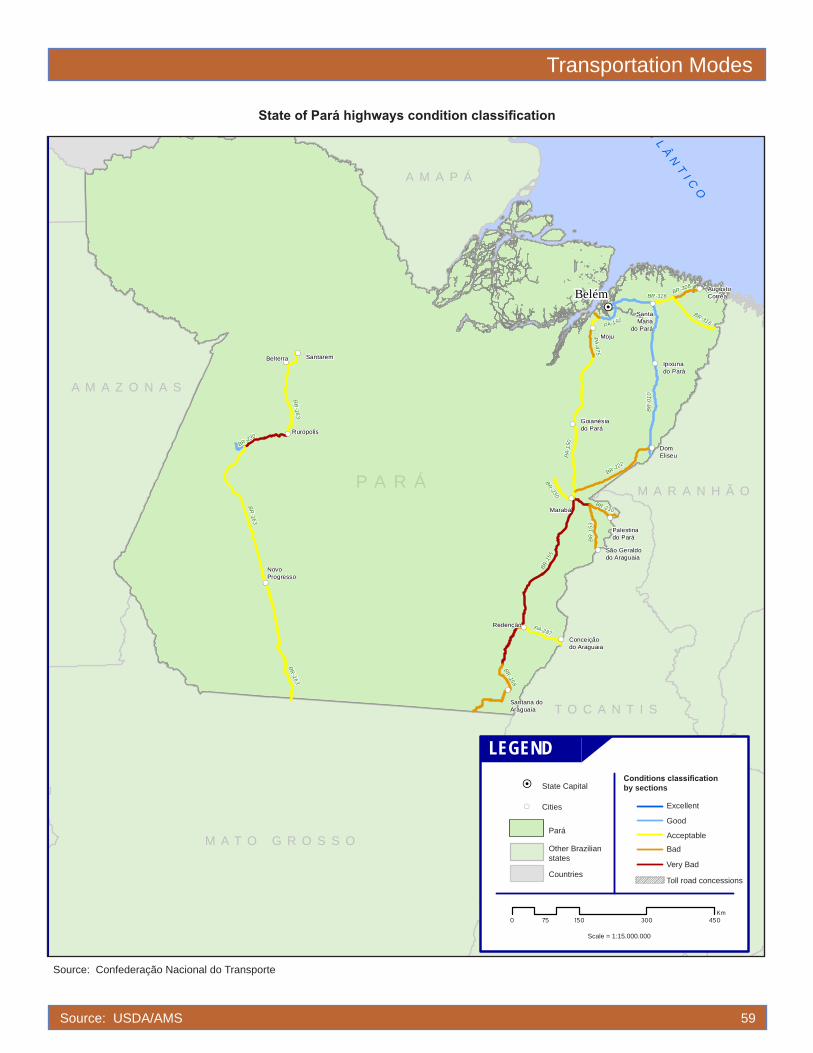
Transportation Modes
State of Pará highways condition classification
2007 Classification Survey of Public Highways
(47,588 miles)
Source: Confederação Nacional do Transporte
Source: USDA/AMS 59
ConditionExcellent
State CapitalVery BadBadAcceptable
Good
BR-316
BR
-010
PA-475
PA-287
BR-308
PA-150
BR-230
BR
-153
BR-1
55
BR-158
BR-163
BR-163
BR-222
PA-1
50
BR-316
BR-230
BR-230
BR-163
!(
!(
!(
!(
!(
!(
!(
!(
!(
!(
!(
!(
!(
!(
!(
!(
!H
G u i a n aG u i a n aS u r i n a m eS u r i n a m e
G u i a n aG u i a n aF r a n c e s aF r a n c e s a
Belterra Santarém
Santana doAraguaia
Redenção
Conceiçãodo Araguaia
São Geraldodo Araguaia
Marabá
Palestinado Pará
Goianésiado Pará
DomEliseu
Moju
Ipixunado Pará
SantaMaria
do Pará
AugustoCorrêa
Rurópolis
NovoProgresso
Belém
PARÁ
M A T O G R O S S O
A M A Z O N A S
A M A P Á
M A R A N H Ã O
T O C A N T I S
OC
EA
NO
AT
LÂ
NT
I CO
P A R Á
Países
Pará
LEGENDA
CapitalEstadual
Cidades!(
!H
0 150 300 45075Km
Escala= 1:8.000.000
Classificação dos TrechosEstado geral
Outros EstadosBrasileiros
Bom
Ótimo
Regular
Ruim
Péssimo
Concessionados
Excellent
Very Bad
Bad
Acceptable
Good
Conditions classification by sectionsState Capital
Cities
Other Brazilian states
Countries
Scale = 1:15.000.000
LEGEND
Pará
Toll road concessions

Nor
ther
n re
gion
hig
hway
s co
nditi
on c
lass
ifica
tion
Sou
rce:
Con
fede
raçã
o N
acio
nal d
o Tr
ansp
orte
Sou
rce:
US
DA
/AM
S
6
0
Tran
spor
tatio
n M
odes
! (
! (
! (
! (
! (
! (! (
! (
! (
! (
! (
! (
! (
! (
! (
! (
! (
! (
! (
! (
! (
! (
! (
! (
! (
! (
! (
! (
! (
! (
! (
! (
! (! (
! (
! (
! (
! (
! (
! (
! (! (! (
! (
! (
! (
! (
! (
! H
! H
! H
! H
! H
! H
! H
! (
! (
! (
! (! (
! (
! (! (
! (
BR-174
BR-174
BR-010
BR-3
16
BR-307
BR
-435
AC-4
05
AC-040
BR-010
AP-010
BR-174
TO-3
42
BR
-230
TO-0
40
BR-153
TO-050
BR-432
BR-3
16
BR-174TO
-336
PA-475
TO-3
36
TO-050
BR-421
BR-153
BR-1
74
TO-2
22
PA-2
87
BR-3
08
AC-010
BR-2
42TO-0
80
BR-319
TO-020
BR-317
BR-230
BR-2
26
TO-010
BR-2
30
BR-163
TO-2
80
BR-435
BR-319
BR-174
BR-401
BR-156
BR-153
BR-425
BR-010
BR-174
BR
-242
BR-155
BR
-010
BR-158
BR-2
10
BR-3
64
TO-3
35
TO-2
80
BR-153
BR-153
BR-364
BR-364
BR-2
22
BR-3
64
BR-230
BR-364
PA-150
BR-364
TO-0
80
BR
-158
BR-010
BR-364
AM-0
10
BR-3
64
BR-3
17
BR
-156
BR-4
29
BR-163
BR-3
64
BR-2
42
BR-2
42TO
-373
BR-153
BR-153
BR-2
30
CCoollôômm
bbiiaa
VVee
nnee
zzuu
eell aa
Gu
ian
aG
uia
na
Su
rin
am
eS
uri
na
me
Gu
ian
aG
uia
na
Fra
nc
es
aF
ran
ce
sa
PP ee rr uu
BBoo ll íí vv
ii aa
Boa
Vis
ta
Rio
Bra
nco
Port
o Ve
lho
Man
aus
Palm
asBel
ém
Mac
apá
Feijó
Car
acar
aí
Ror
ainó
polis
Bonf
im
Porto
Gra
nde
Bras
iléia
Sena
Mad
urei
ra
Porto
Acre
Cru
zeiro
do
Sul
Gua
jará
-Miri
m
Acre
lând
ia
Serin
guei
ras
Mon
teN
egro
Ariq
uem
es
Vilh
ena
Belte
rra
Sant
arém
Maz
agão
Pres
iden
teM
édic
i
Sant
ana
do A
ragu
aia
Itaco
atia
ra
Pim
enta
Buen
o
Jaru
Hum
aitá
Car
eiro
Car
eiro
da V
árze
a
Pres
iden
teFi
guei
redo
Arra
ias
Form
oso
doAr
agua
ia
Par
aíso
do
Toca
ntin
s
Mira
norte
Gua
raí
Gur
upi
Dia
nópo
lis
Red
ençã
o
Arag
uaín
a
Mar
abá
São
Dom
ingo
s do
Ara
guai
a
Goi
anés
iado
Par
á
Wan
derlâ
ndia
Car
olin
a
Estre
ito
Dom
Elis
eu
Moj
u
Ipix
una
do P
aráCap
anem
aC
acho
eira
do P
iriá
Augu
sto
Cor
rêa
São
João
da
Baliz
a
Rur
ópol
is
Nov
oPr
ogre
sso
Talis
mã
Para
nã
São
Valé
rio d
aN
ativ
idad
e
Nov
aO
linda
PI
AU
Í
MA
RA
NH
ÃO
MA
TO
G
RO
SS
O
BA
HI
A
GO
IÁ
S
OC
EA
NO
AT
LÂ
NT
I CO
Paí
ses
Cap
ital
Est
adu
al! H
Cid
ades
(
Est
ados
da
Reg
ião
No
rte
LEGE
NDA
Bo
m
Óti
mo
Reg
ula
r
Ru
im
Pés
sim
o
REGI
ÃO N
ORTE
018
036
05
40
90
Km
Esc
ala
=1:8
.50
0.0
00
Ou
tro
s E
stad
os
Bra
sile
iro
s
Cla
ssif
icaç
ão d
os T
rech
os
Pav
imen
to Co
nce
ssio
nad
os
! H
! (
! (
! (! (
! (
PA-1
50BR-0
10
PA-4
83
Bel
ém
Barc
aren
a
Anan
inde
ua
Mar
ituba
Bene
vide
s
Bel
ém
1 cm
= 8
km
Exc
elle
nt
Very
Bad
Bad
Acc
epta
ble
Goo
d
Con
ditio
ns c
lass
ifica
-tio
n by
sec
tions
Sta
te C
apita
l
Citi
es
Oth
er B
razi
lian
stat
esC
ount
ries
Sca
le =
1:1
5.00
0.00
0
NORT
HERN
REG
ION
Nor
ther
n re
gion
sta
tes
Lege
nd
Toll
road
co
nces
sion
s

Transportation Modes
Source: USDA/AMS 61
Midwestern region highways condition classification
Source: Confederação Nacional do Transporte
!(
!(
!(
!(
!(
!(
!(
!(
!(
!(
!(
!(
!(
!(
!(
!(
!(
!(
!(
!(!(
!(
!(
!(
!(
!(
!(
!(
!(
!(
!(!(
!(
!(
!(
!(
!(
!(
!(
!(
!(
!(
!(
!(
!(
!(
!(
!(
!(
!(
!(
!(
!(
!(
!(
!( !(
!(
!(
!(
!(
!(
!(
!H
!H
!H
!H
BR-174
BR-0
60
BR-497
BR
-163
BR-436
MS
-480
MT-240
BR-1
63
MT-
130
BR-070
BR
-153
BR-376
BR-070BR
-158
BR-4
14
MS-276
BR-364
BR-163
BR-050
BR-251
MT-
343
BR-153
GO
-164
MT-208
BR-0
60
GO
-139
BR-163
BR-070BR-163
MT-358
MS-306
BR-163
BR-4
14
BR-487
GO-213
GO-217
GO-060
BR-163
BR-158
GO
-174
BR-1
58
BR
-153
BR-262
MS
-134
BR-364
BR-070
BR-040
GO
-330
GO-213
MT-320
GO
-184
MS-395
BR-060
BR-1
63
GO
-139
BR-153
BR
-163
GOT-070
BR-1
63
BR
-364
MS-240
MT-246
BR-158
BR-174
BR-070BR
-419
BR-070
BR-158
BR-158
GO-237
BR-060
BR-060
BR-080
BR-080 BR-4
14
BR-163
BR-1
63
GO
-080
GO-060
BR-174
BR-267
MT-255
BR-262
BR-364
BR
-163
GO-118
BR-070
GO-341
BR-463
BR-1
63
BR-267
BR-060
BR-262
BR
-158
MS-377
BR-364
BR
-050
BR-267
GO-020
BR-020
BR-174
BR-364
BR-267
BR-070
BR-262
BR-364
BR-452
GO
-118
BR-359
BR-364
BR-060
BR-1
58
GO-302
GO-1
78GO
-206
BR-364
GO-206
GO-164
GO-210GO-0
80
GO-164BR-080
GO
-164
GOT-251
GO
-164
BR-060
BB oo ll íí vv ii aa
PP
aa rr aa gg uu aa ii
BR-060
BR-1
58
BR-060
BR-153
BR-1
53
GO-427
GO-206
Bataguassu
Sidrolândia
Coxim
Sonora
Camapuã
ÁguaClara
TrêsLagoas
PortoMurtinho
BelaVista
Guaíra
AltoAraguaia
PontaPorã
Jardim
Caarapó
RioBrilhante
Corumbá
Anastácio
Paranaíba
SãoSimão
Jataí
RioVerde
Vila Bela daSantíssimaTrindade
Pontes eLacerda
Comodoro
Naviraí
Nova Alvoradado Sul
Nova Andradina
Piresdo Rio
Cassilândia
Aparecidado Taboado
VilaRica
Guarantãdo Norte
Cáceres
Barra doBugres
Campo Novodo Parecis
Rondonópolis
CampoVerde
Diamantino
Lucas doRio Verde
Sinop
AltaFloresta
NovaXavantina
Água Boa
Primaverado Leste
Aragarças
Piranhas
São Luísde MontesBelos
Indiara
Itumbiara
Morrinhos
Catalão
Goiás
Ceres
Pirenópolis
PadreBernardo
UruaçuNiquelândia
Porangatu
Luziânia
Cristalina
Formosa
Posse
CamposBelos
Brasília
Campo Grande
Cuiabá
Goiânia
S Ã O P A U L O
T O C A N T I N S
P A R A N Á
P A R Á
M I N A S G E R A I S
A M A Z Ô N A S
R O N D Ô N I A
G O I Á S
0 140 280 42070Km
Escala= 1:6.000.000
Outros EstadosBrasileiros
Países
CapitalEstadual
!H
Cidades(
Estados da Região Centro-Oeste
LEGENDA
Classificação dos TrechosPavimento
Bom
Ótimo
Regular
Ruim
Péssimo
REGIÃO CENTRO-OESTE
Concessionados
!H
!(
!(
!( !(
!(
!(
!(
!(
!(
!(
!(
!(
!(
!(
Goiânia
BR-1
53
BR-153
BR-4
14
GO-020
GO-060
BR-060
GO
-080
GO
-070
BR-060
Guapó Aparecidade Goiânia
Bela Vistade Goiás
Abadiade Goiás
Petrolinade Goiás
NerópolisAnápolis
Abadiânia
Alexânia
Goiânia - Anápolis
1 cm = 18 km
Excellent
Very Bad
Bad
Acceptable
Good
Conditions classification by sections
State CapitalCities
Other Brazilian statesCountries
Scale = 1:15.000.000
MIDWESTERN REGION
Midwestern region states
Legend
Toll road concessions

Source: USDA/AMS 62
Transportation Modes
Northeastern region highways condition classification
Source: Confederação Nacional do Transporte
BR-349
PE-090
BR-230
BR-316
BR-030
BR-0
20
BR-101
BR-330
BR
-101
BA-1
30
SE-170
BR-235
BR-110
BR-1
01
BA-142
BR-405
BR-230
BR-324
BR
-101
BR-222
PI-140
BR-361
MA-106
BR-0
20
BR
-135
RN-023
BR-4
23
BAT-
122
BR
-403
BR-402
BR-101
BR-3
43
BR-232
BR-1
16
CE-292
BR-1
16
BR-407
BR-304
PI-141
BR-242
BR-1
01
BR-226
BR-1
01
BR-232
BR
-110
BR-242
BA-026
BR-408
BR-1
16
BR-3
43
BR-226
BR-135
BA-052
BA-1
61
SE-302
PE
-265
BAT-242
BR-1
35
BR-232
MA-303
SE-220
SE-210
RN-079
BR-410
BAT-415
BA
-160
PE-337
BR
-110
PE-096
BR-230
BR-324
BAT-324
RNT-226
BAT-349
SE-270
CE-386
BA-263
BR-226
BR-316
BR-404
BR-230
PB
-400
BR-316
RN-233
PB-066
BR-324
BR-424
BR-242
PE-177
BR
-104
BA-0
99
BAT-330
MA-006
BR-222
BA-262
BR-135
PB-386
BR-135
BR-1
22
BR
-010
CE-085
BR-226
BR-420
BR-226
MAT-402
BA
-131
BR-116
BR-316
BA-130
CE-1
78BR
-122
PE-2
75
BR-402
BR-1
16
BR-316
BR-412
BA-1
60
RN-118
PB-238
BR-020
PE-545
BA-1
44
BR-418
BR-230
PE-555
BR-428
BR-1
01
BR-367
CE-085
BR-402
CE-060
BR-316
BR-222
BR-242
BR-316
BR-304
BA-052
BR-1
16
BR
-010
MA
-006
CE-362
PE-360
MA-
034
MA
-006 BR-226
BR
-122
CE
-187
MA-006
BR-235
BR-104
CE-040
BR-430
BR-222
BR
-407
BR-427
BR-235
PI-140
BR-235
BR-406
BR-020
BA-093
PE-0
60
PB-262
SE-318
RN-177
BR-498
BR-367
BR-030BR-030
BAT-
122
BR-030
BA-460
BR-415
BR-324
BR-1
10
BR-423
BR-423
BR-101
BR-030
BA-130
BR-110BR-316
BR-235
BR-235
BR-235
BR-316BR-232
RN
T-104
BR-4
26
BR
-135
BR-1
22
BR-122
CE-0
60
BR-116
BR-304
BR-110
BR-101
CE-085
MA-315
BR-226
BR-316
BR-226BR-424
BR-230
BR-230
BR-427
MA-345
BR-404
BR-3
43
BR-222
MA-106
BR-2
30BR-230
BR-349
BR-0
20
BR-135
!H
!H
!H
!H
!H
!H
!H
!H
!H
!(
!(
!(
!(
!(
!(
!(
!(
!(
!(
!(
!(
!(
!(
!(
!(
!(
!(
!(
!(
!(
!(
!(
!(
!(
!(
!(
!(
!(
!(
!(
!(
!(
!(
!(
!(
!(
!(
!(
!(!(
!(
!(
!(
!(
!(
!(
!( !(
!(
!(
!(!(
!(
!(
!(
!(
!(
!(
!(
!(
!(
!(
!( !(
!(
!(
!(
!(
!(
!(
!(
!(
!(
!(
!(
!(
!(
!(
!(
!(
!(
!(
!(
!(
!(
!( !(
!(
!(
!(
!(
!(
!(
!(
!(
!(
!(
!(
!(
!(
!(
!(
Teresina
São Luís
Aracaju
Maceió
Recife
JoãoPessoa
Natal
Fortaleza
Salvador
Teixeira de Freitas
Monte Alegre do Piauí
AltoParnaíba
Ibotirama
Xique-Xique
Presidente Dutra
Carinhanha
Bom Jesusda Lapa
Guanambi
Correntina
Barreiras
BomJesus
Remanso
São RaimundoNonato
Carolina
PortoFranco
Açailândia
Itinga doMaranhão
Grajaú
Buriticupu
Balsas
PastosBons
Barra doCorda
Arame
Peritoró
Bertolínia
Floriano
Canto doBuriti
Ubaitaba
ÁguaBranca
SantaInês
GovernadorNunesFreire
Mirandado Norte
Cururupu
Chapadinha
CândidoSales
Vitória da Conquista
Brumado
Jequié
Eunápolis
PortoSeguro
Ilhéus
PresidenteTancredoNeves
Simão Dias
JoaquimGomes
Itaberaba
BaixaGrande
MiguelCalmon
Capim Grosso
Afrânio
Petrolina
Feira deSantana Alagoinhas
Tucano
Canudos
Floresta
PauloAfonso
Indiaroba
Japaratuba
Estrelade Alagoas
FariasBrito
Macau
TeotônioVilela
Garanhuns
Barreiros
SimplícioMendes
Picos
Valençado Piauí
Ouricuri
Piripiri
Tauá
Crateús
Salgueiro
Conceição
Quixadá
Canindé
Alexandria
Pombal
Solonópole
Pereiro
Chorozinho
RussasAracati
Buritidos Lopes
Parnaíba
Sobral
Camocim Acaraú
Umirim
Teixeira
Paracuru
Sertânia
Caicó
Caruaru
Taquaritingado Norte
Queimadas
Açu
Mossoró
AreiaBranca
SantaCruz
Carpina
Canguaretama
Touros
E S P Í R I T OS A N T O
M I N A S G E R A I S
T O C A N T I N S
D I S T R I T OF E D E R A L
O C E A N O A T L Â N T I C O
G O I Á S
P A R Á
G O I Á S
0 130 260 39065Km
Escala= 1:5.800.000
Países
CapitalEstadual
!H
Cidades(
Estados da Região Nordeste
LEGENDA
Bom
Ótimo
Regular
Ruim
Péssimo
REGIÃO NORDESTE
Classificação dos TrechosPavimento
Outros EstadosBrasileiros
Concessionados
!(
!(
!H
!(
!(
!(
!(
!(
!(!(
!(
!(
Feirade Santana
Alagoinhas
Salvador
BA-0
93
BR-324
BA-524
BR-324
BA-526
BA-5
21
BR-101
BR-101
BA-0
99
BR-101
BAT-242
BA-052
BR-1
01
BA-5
35
BR-110
BR-116
BA-099Sapeaçu
GovernadorMangabeira
Itaparica
Lauro deFreitas
Camaçari
AntônioCardoso
AméliaRodrigues Catu
Pojuca
Salvador - Feira de Santana
!H
!(
!(
PE-0
60
BR-1
01
PE-052
PE
-009
PE
-060
PE-028
BR-408
BR-232
PE-0
24
BR-101
BR-101
BR-1
01
PE-060
PE-0
09
Recife
Ipojuca
Jaboatão dosGuararapes
Recife - Ipojuca
1 cm = 10 km
1 cm = 13 km
M I N A S G E R A I S
Excellent
Very BadBad
Acceptable
Good
Conditions classification by sectionsState Capital
Cities
Other Brazilian statesCountries
Scale = 1:15.000.000
NORTHERN REGION
Northern region states
Legend
Toll road concessions
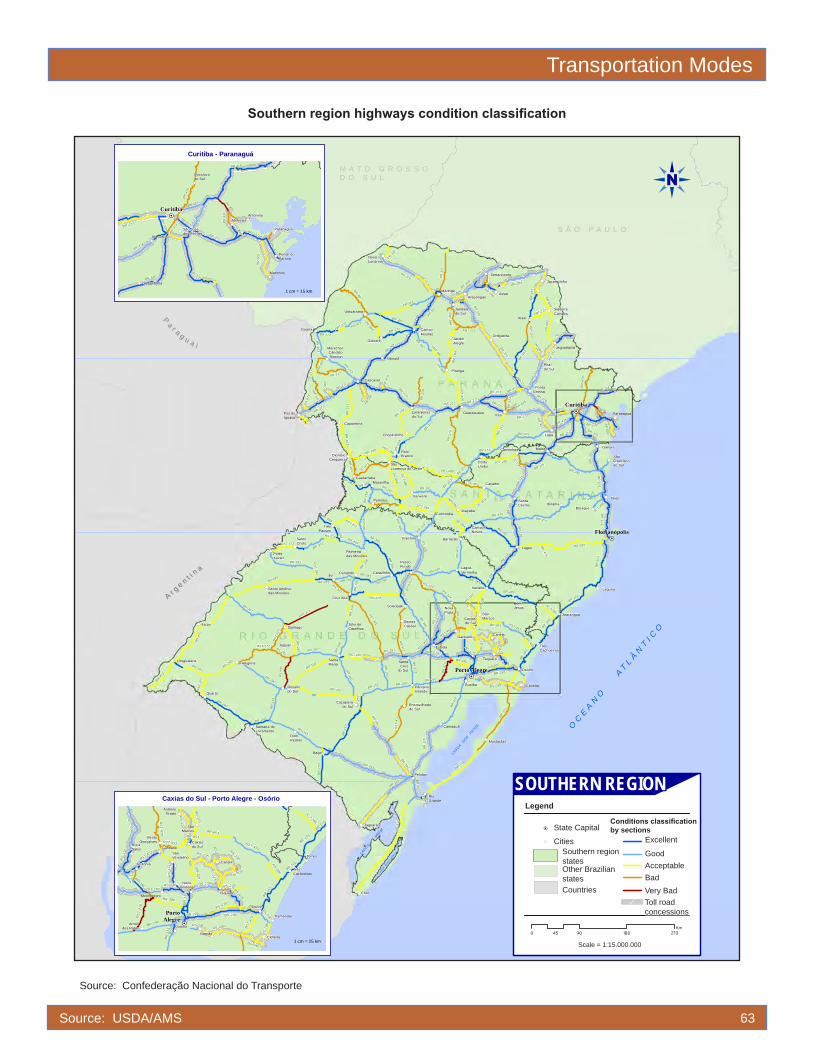
Transportation Modes
Source: USDA/AMS 63
Southern region highways condition classification
Source: Confederação Nacional do Transporte
RS-030
BR-476
RS
T-392
BR-475
PR-239
RS
-734
RST-472
BR-153
PRT-487
BR-386
BR-373
BR
-163
RS-122
PRT-272
BR-163
RS
-020
BR-369
BR-277
BR-469
BR-468
BR-487
BR
-101
PR-090
RST-287
RS
-135
BR-1
58
BR-282
BR
-153
PR-182
PR-090
BR-470
BR-116
BR-369
BR-1
53
BR-153
BR
-101
PR-444
BR-153
RS-486
BR-1
58
SCT-486
BR-468
PR-508
PR-468
RS-235
BR-376
BR-158
RS-210
BR-153
PR-323
RST-453
BR-1
53
BR-163
RS-324
BR-280
BR-285
PRT-280
BR-153
BR-153
BR-287
RS-342
BR-386
BR-277
BR-290
BR-285 BR-1
16
BR-471
SCT-477
RS
T-15
3
PRT-466
SCT-285
BR
-116
RS
-115
BR-101
RS-241
RS-122
RST-453
RST-377
PRT-272
BR-386
PR-1
51
RS-287
BR-282
PR-427
BR-392
RST-287
BR-272
BR-392
BR-285
BR-277
BR
-153
BR-472
RS-324
PR-323
BR-277
BR-290
BR-1
16
RS
T-37
7
BR-280
BR-285
BR-290
BR-282
BR-282
BR
-163
BR-1
58
BR
-101
BR-392
BR-453
BR-116
BR-376
BR-116
BR-277
BR-272
SC-473
RS-040BR-153
RS-1
29
BR-1
58
BR-468
BR-116
BR-290
BR
-153
RST-453
BR-373
SC-451
BR-1
01
RS
T-47
0
BR-116
BR-1
58
BR-158
PRT-280
BR-285
BR-472
BR-376
BR-116
RS
-640
PR-3
17
BR-376
BR-1
58
BR-282
BR-373
BR-470
BR-4
76
BR-290
BR-1
16
PR-1
51
BR
-158
BR-293
BR-470B
R-287
BR
-470
BR-487
BR-392
BR-1
53
BR-1
58
PR
-317
BR-101
SCT-280
BR-290
BR-1
53
BR-392
BR-277SC
-468
SCT-283
RS-223
BR-369
PRT-466
BR-285
BR-386
BR-101
BR-376
RST-377
PRT-466
BR-282
BR-116
BR
-471
BR-1
01
BR-285
BR-290
RS
-471
BR-285
BR-1
16
BR-158
PR-0
92
RS
T-47
1
BR-277
BR-277
PR-323
BR-476
BR-1
01
BR
-116
BR-376
BR-287
BR-293
BR-282
PR-1
70
BR-293
BR
-163
BR-4
72
BR-4
70
BR-277
PR-1
80
BR-487
PR-460PR-4
95
PR-317
PR-3
17
PR-4
95 PR
-590
PR-8
74
BR-1
53
PR-092
PRT-272
PR-4
74
PR-438
RST-
377
RST-481
BR-1
58
RS
T-480
SC-284
RST-472
Chuí
Uruguaiana
Quaraí
Alegrete
Santana doLivramento
DomPedrito
Rosáriodo Sul
Jaguari
Itaqui
Bagé
Santo Antôniodas Missões
Santiago
PortoXavier
SantoCristo
Foz doIguaçu
Jaguarão
Caçapavado Sul
SantaMaria
Encruzilhadado Sul
Palmeiradas Missões
LagoaVermelha
Barracão
Caxiasdo Sul
SantaCruz
do Sul
RioGrande
Pelotas
Camaquã
NovaPrata
PântanoGrande
Estrela
Caçador
PortoUnião
SantaCecília
Canoinhas
Mostardas
Guaíba
Taquara
Júlio deCastilhos
Ijuí
Cruz Alta
Panambi
TrêsPassos
BarrosCassal
Soledade
Carazinho
Capanema
Ubiratã
Goioerê
Guaraciaba
DionísioCerqueira
IratiLaranjeirasdo Sul
Guarapuava
MarechalCândidoRondon
Guaíra
Cascavel
Pitanga
JardimAlegre
CampoMourão
Maringá
Palmitos
Maravilha
SãoLourenço do Oeste
PatoBranco
Chopinzinho
Garibaldi
PassoFundo
Erechim
SãoMarcos
Vacaria
Canela
BomJesus
CamposNovos
Xanxerê
ConcórdiaJoaçaba
Jandaiado Sul
Ibirama
Cidreira
Osório
Arapongas
Ortigueira
Umuarama
NovaLondrina
Assaí
Sertanópolis
TrêsCachoeiras
Araranguá
Lages
Laguna
Mafra
Lapa
Brusque
Itajaí
SãoFranciscodo Sul
Garuva
Paranaguá
PontaGrossa
Piraído Sul
Jaguariaíva
Ibaiti
SiqueiraCampos
Jacarezinho
!(
!(
!(
!(
!(
!(
!(
!(
!(
!(
!(
!(
!(!(
!(
!(
!(
!(
!(
!(
!(
!(
!(
!(
!(
!(
!(
!(
!(
!(
!(
!(
!(
!(
!(
!(
!(
!(
!(
!(
!(
!(
!(
!(
!(
!(
!(
!(
!(
!(
!(!( !(
!(
!(
!(
!(
!(
!(
!(
!(
!(
!(
!(
!(
!(
!(
!(
!(
!(
!(
!(
!(
!(
!(
!(!(
!(
!(
!(
!(
!(
!(
!(
!(
!(
!(
!(
!(
!(
!(
!(
!(
!(
!(
!(
!(
!(
!(
!(
!(
!(
!(
!(
!H
!H
!H
PPaa rr aa gg uu aa ii
U r u g u a iU r u g u a i
AA rr gg ee nn tt ii nn aa
SC-350
SC-303
SCT-480
Porto Alegre
Florianópolis
Curitiba
OC
EA
NO
AT
LÂ
NT
I CO
LAGOA
DOS PA
TOS
S Ã O P A U L O
G O I Á S
0 90 180 27045Km
Escala= 1:4.000.000
Países
CapitalEstadual
!H
Cidades(
Estados da Região Sul
LEGENDA
Bom
Ótimo
Regular
Ruim
Péssimo
REGIÃO SUL
Classificação dos TrechosPavimento
Outros EstadosBrasileiros
Concessionados
M A T O G R O S S OD O S U L
!H
!(
!(
!(
!(
!(
!(
!(
!(
!(
BR-101PR-408BR
-476
PR
-411
BR-277
BR-277
PR-410
BR-277
BR-376
BR-4
76
PR-407
BR-116
BR-277
PR
-508
BR-277
BR-476
BR-116
BR-376
BR
-476
BR-116
Curitiba
Quitandinha
Araucária
São Josédos Pinhais
Bocaiúvado Sul
Morretes
Matinhos
Antonina
Pontal doParaná
Paranaguá
Curitiba - Paranaguá
LAGOA
M
IRIM
LAG
OA MANG
UEIRA
1 cm = 15 km
!H
!(
!(
!(
!(
!(
!(
!(!(
!(
!(!(
!(
!(
!(
!(
!(
!(
!(
!(
!(
BR-453
RS-020
RS-466
BR-1
16
BR-290
RS-040
RS-239
RS
-128
RS-239
BR-101
BR-1
16
RST-453
BR-386
RS-030
RS-240
RS
-786
RS-1
30
RS
-122
RS-040
BR-1
16
RST-287 RS-474
RS
-122
RS-486
RS-235
RST-453
RS-235
RS
-129
RST-
101
BR-101
SCT-285
BR-116
BR-386
BR-101
RS
-115
RS-122
RST-453
RS-030
RS-324
BR-290
BR-290
BR-453
BR-290
BR-116
RS-040
RS
-129
RS
T-47
0
RST-453
BR-1
01
RS
T-470BR-386
BR-1
16
BR-285
PortoAlegre
Caxiasdo Sul
NovoHamburgo
SãoVendelino
Arroiodos Ratos
Teutônia
Montenegro
Guaíba
Viamão
Taquara
RocaSales Garibaldi
BentoGonçalves
AntônioPrado
SãoMarcos
Canela
Cidreira
Osório
Tramandaí
TrêsCachoeiras
Torres
1 cm = 25 km
Caxias do Sul - Porto Alegre - Osório
Excellent
Very BadBadAcceptableGood
Conditions classification by sectionsState Capital
Cities
Other Brazilian statesCountries
Scale = 1:15.000.000
SOUTHERN REGION
Southern region states
Legend
Toll road concessions

Sou
rce:
US
DA
/AM
S
6
4
Tran
spor
tatio
n M
odes
Sout
heas
tern
regi
on h
ighw
ays
cond
ition
cla
ssifi
catio
n
Sou
rce:
Con
fede
raçã
o N
acio
nal d
o Tr
ansp
orte
BR-354
MG
-290
SP-2
70SP
-425
SP-334
SP-0
65
SP-3
27
SP-4
25
BR-3
65
SP-3
44
BR-116
BR-135
BR-153
BR-0
40
BR
-493
BR-153
BR-381
SP-350
BR-116
SP-255
SP-2
70
BR-1
01
MGT-36
4
BR-354
BR-4
59
BR-050
ES-164
RJ-
106
BR-4
82
MG
T-26
7BR-3
81
BR
-265
MG
T-38
1
BR-1
16
MG
T-45
2
BR-494
SP-300
BR-1
01
BR-116
MG
T-49
7
SP-310
BR-154
MG
T-25
9
SP-425
BR
-381
SP-463
SP-330
SP-563
MGT-352
SP-2
94
SP-3
45
BR-1
01
BR-3
65
RJ-
158
MG-123
SP
-310
SP-3
20
SP-322
MG
-285
SP-322
BR-040
MG-129
MGT-122
MG
T-48
2
MG-179
BR-146
SP-0
55
BR-040
BR-101
SP-348
SP
-300
BR
-381
SP-330
SP-070
ES-060
BR-2
62
BR-2
62
SP-332
BR-3
93
SP-3
33
BR
-265
SP-310
BR-3
67
BR-364
BR-4
91
BR-120
SP-461
MG
T-25
9
RJ-155
SP
-215 SP
-147
BR-352
MG
T-41
8
BR-2
65
BR-116
MG
T-26
5
SP-250
SP-225
BR-354
RJ-
130
MG
-448
MG-188
BR-153
SP-1
91
ES-2
64
MGT-120
MGT-367
BR-393
RJ-1
92
MG
T-35
6
MG-308
SP-342
SP-3
51
ES-4
46
BR-1
16
MG
-164
MG
-251
MG-190
ES-4
90
ES
-257
MG
-401
BR-452
BR-2
62
BR-3
56
MGT-120
ES-3
81
BR-2
62
EST-484
MG-188
SP-2
25
SP-326
SP-127
MG
-413
MG-167
SP-340
SP-098
MG
-420
BR-135
BR-116
MG
T-38
3
ES-137
RJ-1
16
BR-2
59
SP-323
SP-318
BR-352
BR
-458
BR-259
SP-0
55
BR-491
LMG
-633
BR-2
67
RJ-148
BR-381
BR-3
93
ES-080
SP-255
BR-2
62
BR-2
51
MG
T-49
1
BR-153
SP-3
51
MG
-262
BR-1
20
MG
-427
MG
T-36
9M
GT-
482
MGT-154
RJ-
124
ES-010
SP-5
95
MGT-135
MG
T-45
2
ES
T-48
2
SP-171
BR
-262
MG-050
MGT-462
MGT-342
SP-099
BR-3
69
MG
-050
BR-040
BR-342
SP-2
70
BR-3
65SP-333
MGT-455
BR-356
MG
T-49
7
BR
-267
BR-4
60
MGT-496
RJ-18
6
BR-3
65
SP-125
MGT-494
SP-2
80
BR-365
SP-079
BR-381
SP-3
00
BR-2
51
MGT-122
SP-2
94
BR
-367
BR-146
SP-2
58
BR-2
51
MG
T-35
4
BR-4
74
MG135
MG
-329
SP-340
MG-188
BR-2
51
BR-040
BR-116
BR-116
BR-1
16
BR-1
01
BR-3
56
BR-101
BR-101
BR-367
MG
T-25
9
MG
T-45
2
SP-463
SP-563
SP-330
BR
-265
BR-356
SP
-225
SP-2
94
SP-255
SP-326
SP-425
SP-3
33
SPA
-074
SP-463
SP-6
13
SPA-079
MG
-818
MGT-383
BR-354 M
GT-
369
BR-3
64
BR-2
65
BR-459
BR-040
RJ-140
! (
! (
! (
! (
! (
! (
! (
! (
! (
! (
! (! (
! (
! (
! (! (
! (
! (
! (
! (
! (
! (
! (
! (
! (
! (
! (
! (
! (
! (
! (
! (
! (
! (
! (
! (
! (
! (
! (
! (
! (
! (
! (
! (
! (
! (! (! (
! (
! (! (
! (
! (
! (
! (
! (
! (
! (
! (
! (
! (
! (
! (
! (
! (
! (
! (
! (
! (
! (! (
! (
! (
! (
! (
! (
! (
! (
! (
! (
! (
! (
! (
! (
! (
! (
! (
! (
! (
! (
! (
! (
! (
! (
! (
! (
! (
! (
! (
! (
! (! (
! (
! (! (
! (
! (
! (
! (
! (
! (
! (
! (
! (
! (
! (
! (
! (
! (
! (
! (
! (
! (
! (
! (! (
! (
! (
! (
! (
! (
! (
! (
! (! (
! (
! (
! H
! H
! H
! H
Pres
iden
te P
rude
nte
Pano
ram
a
Para
puã
Araç
atub
a
Itara
ré
Ros
ana
Cap
ãoBo
nito
Lim
eira
São
João
Del
Rei
Assi
s
Andr
adin
aIlha
Solte
ira
Sant
a Fé
do S
ul
Apia
íAvar
éAt
ibai
a
Pira
cica
ba
Our
inho
s
Mar
ília
Lins
Tiet
ê Soro
caba
Mau
á
Baur
u
Botu
catuJa
ú
Borb
orem
a
Cat
andu
vaJa
botic
abal
Caj
ati
Juqu
iá
Itape
tinin
ga
Sant
os
Arar
aqua
ra
Rib
eirã
o P
reto
Porto
Fer
reira
Cam
pina
s
São
José
do
Rio
Pret
o
Cam
pina
Verd
e
Frut
al
Barr
etos
Ube
rlând
ia
Sant
aVi
tória
Moj
i-Miri
m
Pous
o A
legr
e
Taub
até
Cam
pos
doJo
rdão
Lore
na
Mac
hado
Cam
panh
a
Varg
inha
Perd
ões
Itatia
ia Angr
ado
s R
eis
Gua
xupé
Poço
sde
Cal
das
Barb
acen
a
Juiz
de
Fora
Pira
úba Rio
Bon
ito
Tere
sópo
lisN
ova
Frib
urgo
Arra
ial
do C
abo
Além
Para
íba
Leop
oldi
na
Bata
tais
Fran
ca
Ube
raba
Pass
os
Arax
áPatro
cíni
o
Cam
pos
Alto
s
Arag
uari
Vaza
nte
Pato
s de
Min
as
Para
catu
Jaca
reí
Ilhab
ela
Uba
tuba
Cun
ha
Barr
aM
ansa
Cax
ambu
Mur
iaé
Ilicí
nea
Form
iga
Para
opeb
a
Sant
a M
aria
do S
uaçu
í
Una
í
Itabi
ra
Viço
sa
Rio
Cas
ca
Taru
miri
m
Dia
man
tina
Vend
aN
ova
doIm
igra
nte
Aim
orés
Gua
rapa
ri
Sant
a M
aria
de J
etib
á
Ibira
çu
Man
tena
Abae
té
Oliv
eira
Div
inóp
olis
Três
Mar
ias
Cur
velo
Cor
into
Pira
pora
Con
selh
eiro
Lafa
iete
Car
atin
ga
Linh
ares
Teóf
iloO
toni
Man
huaç
u
Ipat
inga
Rio
Pira
cica
baGua
nhãe
s
Gov
erna
dor V
alad
ares G
uaçu
í
São
Fidé
lis
Bom
Jesu
s do
Nor
te
Cam
pos
dos
Goy
taca
zes
Mar
ataí
zes
Cac
hoei
ro d
e Ita
pem
irim
Min
asN
ovas
Araç
uaí
Ecop
oran
ga
Nov
aVe
néci
a
São
Mat
eus
Nan
uque
Itaob
im
Mira
bela
Espi
nosa
São
João
das
Mis
sões
Mon
tes
Cla
ros
Jana
úba
Salin
asJa
cint
oPe
dra
Azul
Ferv
edou
ro
São
Paul
o
Rio
de
Jane
iro
Bel
oH
oriz
onte
Vitó
ria
GO
IÁ
S
PA
RA
NÁ
OC
EA
NO
AT
LÂ
NT
ICO
BA
HI
A
MA
TO
G
RO
SS
OD
O
SU
L
DI
ST
RI
TO
FE
DE
RA
L
GO
IÁ
S
010
020
030
05
0K
m
Esc
ala
=1:4
.50
0.0
00
Paí
ses
Cap
ital
Est
adu
al! H
Cid
ades
(
Est
ados
da
Reg
ião
Su
des
te
LEGE
NDA
REGI
ÃO S
UDES
TE
Cla
ssif
ica
ção
do
s Tr
ech
os
Pav
imen
to
Ou
tro
s E
stad
os
Bra
sile
iro
s
Bo
m
Óti
mo
Reg
ula
r
Ru
im
Pés
sim
o
Co
nce
ssio
nad
os
! H
!(
!(
!(!(
!(
!(
!(
!(
!(
!(
!(
!(
!(
!(
!(
!(
!(
!(
!(
!(
!(!(
!(
!(
!(
!(!(
!(
!(
!(
!(
BR-381
SP-330
SP-0
79
SP-021
SP-075
SP-1
60
SP-1
50
SP-348
SP-1
13
SP-075
SP-330
SP-075
SP-160
SP-127
SP-063
SP-150
SP-348
SP-1
47
SP
-304
SP-308
SP
-300
SP-360
SP-308SP-330
SP-330
SP-2
80
SP
-055
SP-1
01
SP-3
48
SP-127
SP-070
SP-348
SP-021
SP-021
SP-3
00
SP-127
SP-1
27
SP-340
SP
-055
SP
-065
SP-0
65
BR-381BR-381
SP-332
SP-0
65
SP-0
65
BR-1
16
BR-1
16
SP-312
SP
-280
SP-2
80
SP-127
SP-0
55
SP-0
55
SP
-270
SP
-270
BR-1
16
BR-1
16SP
-099
SP-0
70
SP-0
70
SP
-270
SP-2
70
SP-2
80S
P-2
80
SP-079
SP-079
SP-079
SP
-300
SP-3
00
BR-381
BR-381
SP
-055
SP
-055
SP-2
70
BR-116
BR-116
BR-116BR
-116
SP-083
SP-127
SP-097
SP
-101
SP-098
São
Paul
o
Hor
tolâ
ndia
Berti
oga
Gua
rulh
os
Atib
aia
Itaqu
aque
cetu
baM
oji d
asC
ruze
s
Naz
aré
Paul
ista
Tatu
í
Tiet
ê
Tapi
raí
Araç
oiab
ada
Ser
ra
Boitu
va
Porto
Feliz
Soro
caba
ItuInda
iatu
ba
Juqu
itiba
Cot
ia
Itape
ceric
ada
Ser
ra
Tabo
ão d
a S
erra
São
Roq
ueBa
ruer
iO
sasc
o
Jund
iaí
Cub
atão
Dia
dem
aM
auá
Sant
os
Cam
pina
sBr
agan
çaPa
ulis
ta
Jaca
reí
Sant
os -
São
Paul
o - C
ampi
nas
1 cm
= 2
0 km
GO
IA
S
Very
Bad
Bad
Acc
epta
ble
Goo
dE
xcel
lent
Con
ditio
ns c
lass
ifica
tion
by s
ectio
nsS
tate
C
apita
lC
ities
Oth
er B
razi
lian
stat
esC
ount
ries
Sca
le =
1:1
5.00
0.00
0
SOUT
HEAS
TERN
REG
ION
Sou
thea
ster
n re
gion
sta
tes
Lege
nd
Toll
road
co
nces
sion
s

Transportation Modes
The 2016 Confederação Nacional do Transporte (CNT) survey of the overall highway condition in Brazil shows that 41.8 percent of the roads ranged from good to excellent in 2016 compared to 37.9 percent in 2014. Still, 58.2 percent ranged from acceptable to very bad. The survey also shows that half of the paved roads were in good to excellent and about 48.3 percent ranged from acceptable to very bad condition; 51.7 percent of traffic road signs had problems; and 86.2 percent of the paved roads evaluated are two lanes. The survey sample of paved roads increased 2.5 percent from 62,473 miles in 2015 to 64,021 miles in 2016.
Brazilian highways
Source: Confederação Nacional do Transporte (CNT)
Brazilian paved highway conditions, 2014-2016
Brazilian highway conditions, 2014-2016
Source: USDA/AMS 65
Source: Confederação Nacional do Transporte (CNT)
10.1 12.5 11.6
27.830.2 30.2
38.2 34.9 34.6
17.0 16.1 17.3
6.9 6.3 6.3
0%
20%
40%
60%
80%
100%
2014 2015 2016
Very Bad
Bad
Acceptable
Good
Excellent
41.8%37.9 % 42.7%
57.3%62.1% 58.2%
42.4 41.6 44.5
7.7 9.8 7.2
36.7 35.4 35.8
9.8 10.1 9.93.4 3.1 2.6
0%
20%
40%
60%
80%
100%
2014 2015 2016
Very Bad
Bad
Acceptable
Good
Excellent
48.3%
51.75%
48.5%
50.5%
49.9%
50.1%
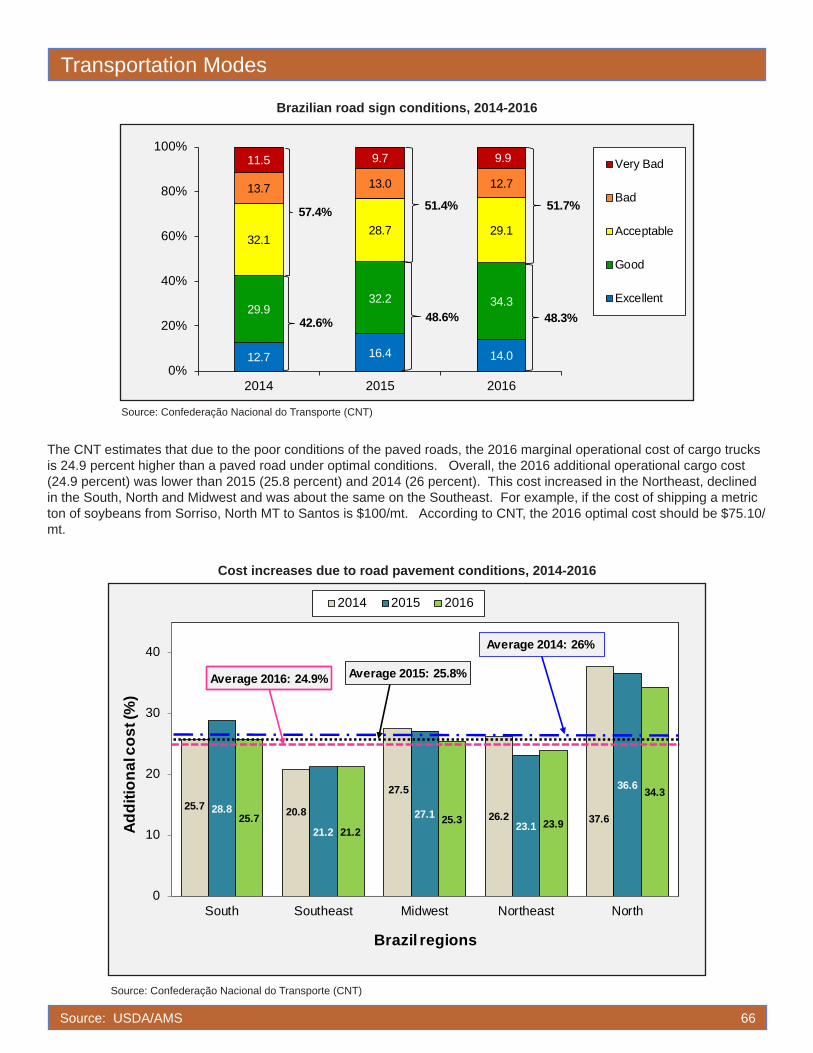
Brazilian road sign conditions, 2014-2016
Source: USDA/AMS 66
The CNT estimates that due to the poor conditions of the paved roads, the 2016 marginal operational cost of cargo trucks is 24.9 percent higher than a paved road under optimal conditions. Overall, the 2016 additional operational cargo cost (24.9 percent) was lower than 2015 (25.8 percent) and 2014 (26 percent). This cost increased in the Northeast, declined in the South, North and Midwest and was about the same on the Southeast. For example, if the cost of shipping a metric ton of soybeans from Sorriso, North MT to Santos is $100/mt. According to CNT, the 2016 optimal cost should be $75.10/mt.
Cost increases due to road pavement conditions, 2014-2016
Source: Confederação Nacional do Transporte (CNT)
Source: Confederação Nacional do Transporte (CNT)
25.7 20.8
27.5
26.2 37.628.8
21.227.1
23.1
36.6
25.721.2
25.3 23.9
34.3
0
10
20
30
40
South Southeast Midwest Northeast North
Addi
tiona
l cos
t (%
)
Brazil regions
2014 2015 2016
Average 2015: 25.8%
Average 2014: 26%
Average 2016: 24.9%
Transportation Modes
12.7 16.4 14.0
29.932.2 34.3
32.128.7 29.1
13.7 13.0 12.7
11.5 9.7 9.9
0%
20%
40%
60%
80%
100%
2014 2015 2016
Very Bad
Bad
Acceptable
Good
Excellent
57.4%
42.6%
51.4%
48.6%
51.7%
48.3%

Transportation Modes
Brazilian railway expansion: ongoing projects
The Brazilian railroad system consists of 12 railroads with an extension of 18,957 miles, mostly concentrated in the South, Southeast, and Northeast.
Source: National Association of Rail Transporters (ANTF)
Source: USDA/AMS 67

Brazilian rail system: gauge sizes
The gauge system (distance between two rails) varies by region, creating difficulties in integrating the system like the North American region which uses a standard gauge. There are three types of gauge: metric (39”), broad (63”) and mixed (39”-63”). The metric gauge accounts for 86 percent of the total Brazilian rail miles, and predominates in the Southern region. The broad gauge accounts for 12 percent of total railroads and prevails in the Southeast region, leaving about 2 percent mixed.
Source: National Association of Rail Transporters (ANTF)
Source: USDA/AMS 68
Existing Railways
Railway Projects Contracted and Awarded
State and Federal Projects
Regions and RailwaysNorth
EFC: Estrada de Ferro CarajásEFJ: Estrada de Ferro JariEFT: Estrada de Ferro TrombetasEFA: Estrada de Ferro Amapá
Northeast
Ferrovia Norte-SulTLSA: Transnordestina LogisticaFCA: Ferrovia Centro Atlântica S/A
Midwest
FERRONORTE: Ferrovias Norte Brasil S/AFerrovia Novoeste S/A
Southeast
FERROBAN: Ferrovia Bandeirantes S/AMRS Logistica S/AEFVM: Estrada de Ferro Vitória a Minas
South
ALL: América Latina Logistica do Brasil S/AFTC: Ferrovia Tereza Cristina S/AFERROESTE: Estrada de Ferro Paraná Oeste S/A
Transportation Modes

United States: soybean supply and distribution(1,000 metric tons)
Year* Area Harvested
Beginning Stocks Production Imports Total
Supply Exports Crush Domestic Consumption
Ending Stocks
2003/04 29,330 4,853 66,783 151 71,787 24,128 41,632 44,600 3,059
2004/05 29,930 3,059 85,016 152 88,227 29,860 46,160 51,407 6,960
2005/06 28,834 6,960 83,507 92 90,559 25,579 47,324 52,751 12,229
2006/07 30,190 12,229 87,001 246 99,476 30,386 49,198 53,473 15,617
2007/08 25,959 15,617 72,859 269 88,745 31,538 49,081 51,627 5,580
2008/09 30,222 5,580 80,749 361 86,690 34,817 45,230 48,112 3,761
2009/10 30,907 3,761 91,470 397 95,628 40,798 47,673 50,724 4,106
2010/11 31,003 4,106 90,663 393 95,162 40,959 44,851 48,351 5,852
2011/12 29,856 5,852 84,291 439 90,582 37,186 46,348 48,786 4,610
2012/13 30,814 4,610 82,791 1,103 88,504 36,129 45,967 48,550 3,825
2013/14 30,858 3,825 91,389 1,954 97,168 44,594 47,192 50,070 2,504
2014/15 33,423 2,504 106,878 904 110,286 50,143 50,975 54,955 5,188
2015/16 33,076 5,188 106,857 640 112,685 52,688 51,335 54,643 5,354
2016/17 33482 5354 117208 680 123242 55792 52390 55598 11852
2017/18** 35855 11852 115802 680 128334 58513 53070 56745 13076
*Data based on Local Marketing Year (MY). Soybeans are on a September/August MY**Forecast: May 10, 2017Source: USDA/Foreign Agricultural Service/Market and Trade/Reports/PSD Reports/Oilseeds
Soybean production(1,000 metric tons)
Country* 2012/13 2013/14 2014/15 2015/16 2016/17 2017/18**United States 82,791 91,389 106,878 106,857 117,208 115,802
Brazil 82,000 86,700 97,200 96,500 111,600 107,000
Argentina 49,300 53,400 61,400 56,800 57,000 57,000
China 13,011 11,951 12,154 11,785 12,900 13,800
India 12,186 9,477 8,711 7,125 11,500 11,500
Paraguay 8,202 8,190 8,154 9,200 10,300 9,400
Canada 5,086 5,359 6,049 6,371 6,550 8,400
Other 15,875 16,008 19,011 18,412 20,980 21,774
Total 268,451 282,474 319,557 313,050 348,038 344,676 *Most countries are on an October/September Marketing Year (MY). The United States, Mexico, and Thailand are on a September/August MY. Canada is on an August/July MY. Paraguay is on a March/February MY and Turkey is on an March/February MY. **Forecast: May 10, 2017Source: USDA/Foreign Agricultural Service/Market and Trade/Reports/PSD Reports/Oilseeds
Source: USDA/AMS 69
Reference Material
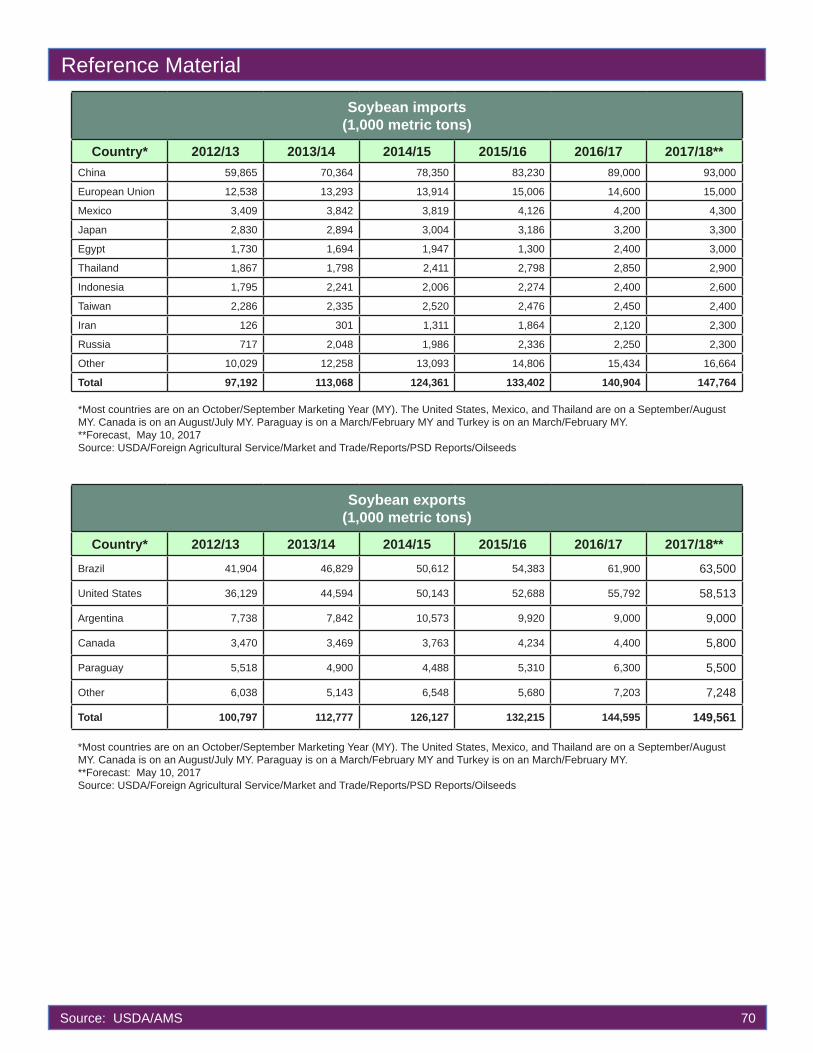
Soybean imports(1,000 metric tons)
Country* 2012/13 2013/14 2014/15 2015/16 2016/17 2017/18**China 59,865 70,364 78,350 83,230 89,000 93,000
European Union 12,538 13,293 13,914 15,006 14,600 15,000
Mexico 3,409 3,842 3,819 4,126 4,200 4,300
Japan 2,830 2,894 3,004 3,186 3,200 3,300
Egypt 1,730 1,694 1,947 1,300 2,400 3,000
Thailand 1,867 1,798 2,411 2,798 2,850 2,900
Indonesia 1,795 2,241 2,006 2,274 2,400 2,600
Taiwan 2,286 2,335 2,520 2,476 2,450 2,400
Iran 126 301 1,311 1,864 2,120 2,300
Russia 717 2,048 1,986 2,336 2,250 2,300
Other 10,029 12,258 13,093 14,806 15,434 16,664
Total 97,192 113,068 124,361 133,402 140,904 147,764 *Most countries are on an October/September Marketing Year (MY). The United States, Mexico, and Thailand are on a September/August MY. Canada is on an August/July MY. Paraguay is on a March/February MY and Turkey is on an March/February MY. **Forecast, May 10, 2017Source: USDA/Foreign Agricultural Service/Market and Trade/Reports/PSD Reports/Oilseeds
Soybean exports (1,000 metric tons)
Country* 2012/13 2013/14 2014/15 2015/16 2016/17 2017/18**
Brazil 41,904 46,829 50,612 54,383 61,900 63,500
United States 36,129 44,594 50,143 52,688 55,792 58,513
Argentina 7,738 7,842 10,573 9,920 9,000 9,000
Canada 3,470 3,469 3,763 4,234 4,400 5,800
Paraguay 5,518 4,900 4,488 5,310 6,300 5,500
Other 6,038 5,143 6,548 5,680 7,203 7,248
Total 100,797 112,777 126,127 132,215 144,595 149,561 *Most countries are on an October/September Marketing Year (MY). The United States, Mexico, and Thailand are on a September/August MY. Canada is on an August/July MY. Paraguay is on a March/February MY and Turkey is on an March/February MY. **Forecast: May 10, 2017Source: USDA/Foreign Agricultural Service/Market and Trade/Reports/PSD Reports/Oilseeds
Source: USDA/AMS 70
Reference Material
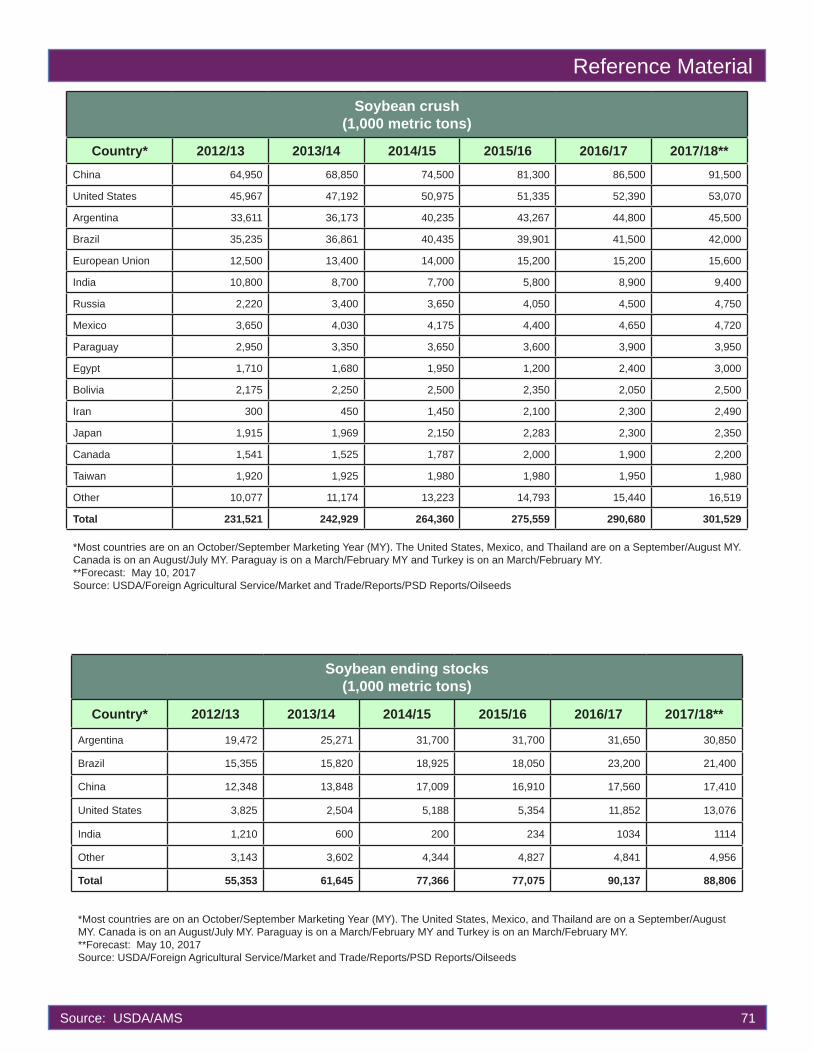
Reference Material
Soybean crush(1,000 metric tons)
Country* 2012/13 2013/14 2014/15 2015/16 2016/17 2017/18**China 64,950 68,850 74,500 81,300 86,500 91,500
United States 45,967 47,192 50,975 51,335 52,390 53,070
Argentina 33,611 36,173 40,235 43,267 44,800 45,500
Brazil 35,235 36,861 40,435 39,901 41,500 42,000
European Union 12,500 13,400 14,000 15,200 15,200 15,600
India 10,800 8,700 7,700 5,800 8,900 9,400
Russia 2,220 3,400 3,650 4,050 4,500 4,750
Mexico 3,650 4,030 4,175 4,400 4,650 4,720
Paraguay 2,950 3,350 3,650 3,600 3,900 3,950
Egypt 1,710 1,680 1,950 1,200 2,400 3,000
Bolivia 2,175 2,250 2,500 2,350 2,050 2,500
Iran 300 450 1,450 2,100 2,300 2,490
Japan 1,915 1,969 2,150 2,283 2,300 2,350
Canada 1,541 1,525 1,787 2,000 1,900 2,200
Taiwan 1,920 1,925 1,980 1,980 1,950 1,980
Other 10,077 11,174 13,223 14,793 15,440 16,519
Total 231,521 242,929 264,360 275,559 290,680 301,529 *Most countries are on an October/September Marketing Year (MY). The United States, Mexico, and Thailand are on a September/August MY. Canada is on an August/July MY. Paraguay is on a March/February MY and Turkey is on an March/February MY. **Forecast: May 10, 2017Source: USDA/Foreign Agricultural Service/Market and Trade/Reports/PSD Reports/Oilseeds
Soybean ending stocks(1,000 metric tons)
Country* 2012/13 2013/14 2014/15 2015/16 2016/17 2017/18**
Argentina 19,472 25,271 31,700 31,700 31,650 30,850
Brazil 15,355 15,820 18,925 18,050 23,200 21,400
China 12,348 13,848 17,009 16,910 17,560 17,410
United States 3,825 2,504 5,188 5,354 11,852 13,076
India 1,210 600 200 234 1034 1114
Other 3,143 3,602 4,344 4,827 4,841 4,956
Total 55,353 61,645 77,366 77,075 90,137 88,806
*Most countries are on an October/September Marketing Year (MY). The United States, Mexico, and Thailand are on a September/August MY. Canada is on an August/July MY. Paraguay is on a March/February MY and Turkey is on an March/February MY. **Forecast: May 10, 2017Source: USDA/Foreign Agricultural Service/Market and Trade/Reports/PSD Reports/Oilseeds
Source: USDA/AMS 71

Quarterly costs of transporting U.S. soybeans to Hamburg, Germany, and Shanghai, China
2016 2016
1st qtr 2nd qtr 3rd qtr 4th qtr Avg 1st qtr 2nd qtr 3rd qtr 4th qtr Avg
To Hamburg, Germany (via U.S. Gulf)
Minneapolis, Minnesota --US$/mt--
Davenport, Iowa--US$/mt--
Truck 8.18 12.10 10.58 10.58 10.36 8.18 12.10 10.58 10.58 10.36
Rail1 43.30 - - - 43.30 11.65 - - - 11.65
Barge2 7.96 24.43 32.96 31.93 24.32 7.96 17.83 25.45 23.63 18.72
Ocean3 11.65 13.72 15.10 14.83 13.83 33.12 13.75 15.10 14.83 19.20
Total transportation4 71.09 50.25 58.64 57.34 59.33 60.91 43.68 51.13 49.04 51.19
Farm price5 301.54 349.92 353.84 337.92 335.81 309.63 349.56 359.48 344.90 340.89
Landed cost 372.63 400.17 412.48 395.26 395.14 370.54 393.24 410.61 393.94 392.08
Transport % of landed cost 19.1 12.6 14.2 14.5 15.1 16.4 11.1 12.5 12.4 13.1
To Shanghai, China (via U.S. Gulf)
Minneapolis, Minnesota --US$/mt--
Davenport, Iowa--US$/mt--
Truck 8.18 12.10 10.58 10.58 10.36 8.18 12.10 10.58 10.58 10.36
Rail1 43.30 - - - 43.30 33.12 - - - 33.12
Barge2 7.96 24.43 32.96 31.93 24.32 7.96 17.83 25.45 23.63 18.72
Ocean3 21.34 24.37 28.27 32.60 26.65 21.34 24.37 28.27 32.60 26.65
Total transportation4 80.78 60.90 71.81 75.11 72.15 70.60 54.30 64.30 66.81 64.00
Farm price5 301.54 349.92 353.84 337.92 335.81 309.63 349.56 359.48 344.90 340.89
Landed cost 382.32 410.82 425.65 413.03 407.96 380.23 403.86 423.78 411.71 404.90
Transport % of landed cost 21.1 14.8 16.9 18.2 17.8 18.6 13.4 15.2 16.2 15.9
To Shanghai, China (via PNW)
Fargo, ND --US$/mt--
Sioux Falls, SD--US$/mt--
Truck 8.18 12.10 10.58 10.58 10.36 8.18 12.40 10.58 10.58 10.44
Rail1 52.83 51.93 53.08 54.32 53.04 53.85 52.84 54.13 55.27 54.02
Ocean3 12.30 14.26 15.53 17.51 14.90 12.30 14.26 15.33 17.51 14.85
Total transportation4 73.31 78.29 79.19 82.41 78.30 74.33 79.50 80.04 83.36 79.31
Farm price5 298.60 339.02 342.70 329.35 327.42 303.01 336.33 344.04 332.53 328.98
Landed cost 371.91 417.31 421.89 411.76 405.72 377.34 415.83 424.08 415.89 408.29
Transport % of landed cost 19.7 18.8 18.8 20.0 19.3 19.7 19.1 18.9 20.0 19.4
1Rail service is required due to seasonal closure of the Minneapolis segment of the Mississippi River.2The Mississippi River closes from Minneapolis to just north of St. Louis during mid-December to late March. 3Source: O’Neil Commodity Consulting; Excludes handling charges4The average of the sum of the total costs may not be equal to the sum of the individual average costs of truck, rail, barge, and ocean because rail is used only in the first quarter.5Source: USDA/NASS
Source: USDA/AMS 72
Reference Material

Reference Material
Average quarterly exchange rate
1st qtr
2nd qtr
3rd qtr
4th qtr 2006 1st
qtr2nd qtr
3rd qtr
4th qtr 2007 1st
qtr2nd qtr
3rd qtr
4th qtr 2008
Real per US$ 2.1974 2.1879 2.1711 2.1520 2.1771 2.1085 1.9818 1.9175 1.7861 1.9485 1.7379 1.6560 1.6674 2.2766 1.8345
1st qtr
2nd qtr
3rd qtr
4th qtr 2009 1st
qtr2nd qtr
3rd qtr
4th qtr 2010 1st
qtr2nd qtr
3rd qtr
4th qtr 2011
Real per US$ 2.3113 2.0728 1.8680 1.7386 1.9977 1.8003 1.7927 1.7487 1.6963 1.7595 1.6673 1.5962 1.6357 1.8012 1.6751
1st qtr
2nd qtr
3rd qtr
4th qtr 2012 1st
qtr2nd qtr
3rd qtr
4th qtr 2013 1st
qtr2nd qtr
3rd qtr
4th qtr 2014
Real per US$ 1.7701 1.9641 2.0288 2.0576 1.9551 1.9977 2.0673 2.2880 2.2735 2.1566 2.2735 2.2296 2.2745 2.5437 2.3303
1st qtr
2nd qtr
3rd qtr
4th qtr 2015 1st
qtr2nd qtr
3rd qtr
4th qtr 2016
Real per US$ 2.8637 3.0722 3.5480 3.8426 3.3316 3.8999 3.5076 3.2912 3.2953 3.4985
Source: Banco Central do Brasil
Source: USDA/AMS 73

Selected quarterly Brazilian farm prices(US$/metric ton)*
Year Rio Grande do Sul Mato Grosso Goiás Paraná Piauí Pará Maranhão
20101st qtr 331.49 261.05 309.89 325.22
2nd qtr 304.36 269.58 271.15 300.32
3rd qtr 342.98 328.51 315.43 350.41
4th qtr 400.78 413.46 400.62 425.79
Average 344.90 318.15 324.27 350.44
20111st qtr 431.68 406.96 441.07 459.96
2nd qtr 425.42 386.58 413.15 435.53
3rd qtr 428.53 416.62 417.65 440.47
4th qtr 377.84 358.24 379.70 390.69
Average 415.87 392.10 412.89 431.66
20121st qtr 405.07 377.70 401.58 428.80
2nd qtr 448.47 448.29 428.40 475.69
3rd qtr 557.90 570.66 566.91 593.20
4th qtr 521.43 536.60 522.33 557.54
Average 483.22 483.31 479.80 513.81
20131st qtr 460.13 419.35 445.56 476.22
2nd qtr 459.96 391.58 419.62 461.97
3rd qtr 448.29 404.93 405.90 453.28
4th qtr 458.54 426.00 442.20 481.71
Average 456.73 410.46 428.32 468.29
20141st qtr 482.75 375.58 420.52 463.81
2nd qtr 464.19 417.02 441.74 471.00
3rd qtr 455.08 398.98 394.07 416.92
4th qtr 368.05 361.74 349.62 383.90
Average 442.52 388.33 401.49 433.91
20151st qtr 336.85 312.34 329.95 340.69 330.99 357.47 326.75
2nd qtr 360.56 295.94 310.64 333.27 300.93 312.03 310.26
3rd qtr 314.06 285.95 287.19 313.28 314.26 288.72 293.97
4th qtr 314.70 286.43 289.68 305.35 313.41 284.75 326.72
Average 331.55 295.17 304.36 323.15 314.90 310.74 314.43
20161st qtr 308.73 268.28 278.59 298.84 281.05 264.90 310.69
2nd qtr 358.57 347.59 337.86 353.78 342.05 329.13 378.45
3rd qtr 373.12 367.25 359.07 362.80 378.98 384.42 447.42
4th qtr 352.69 344.51 341.08 347.53 377.05 355.82 370.99
Average 348.28 331.91 329.15 340.74 344.78 333.57 376.89
Source: Companhia Nacional de Abastecimento (CONAB)
Source: USDA/AMS 74
Reference Material
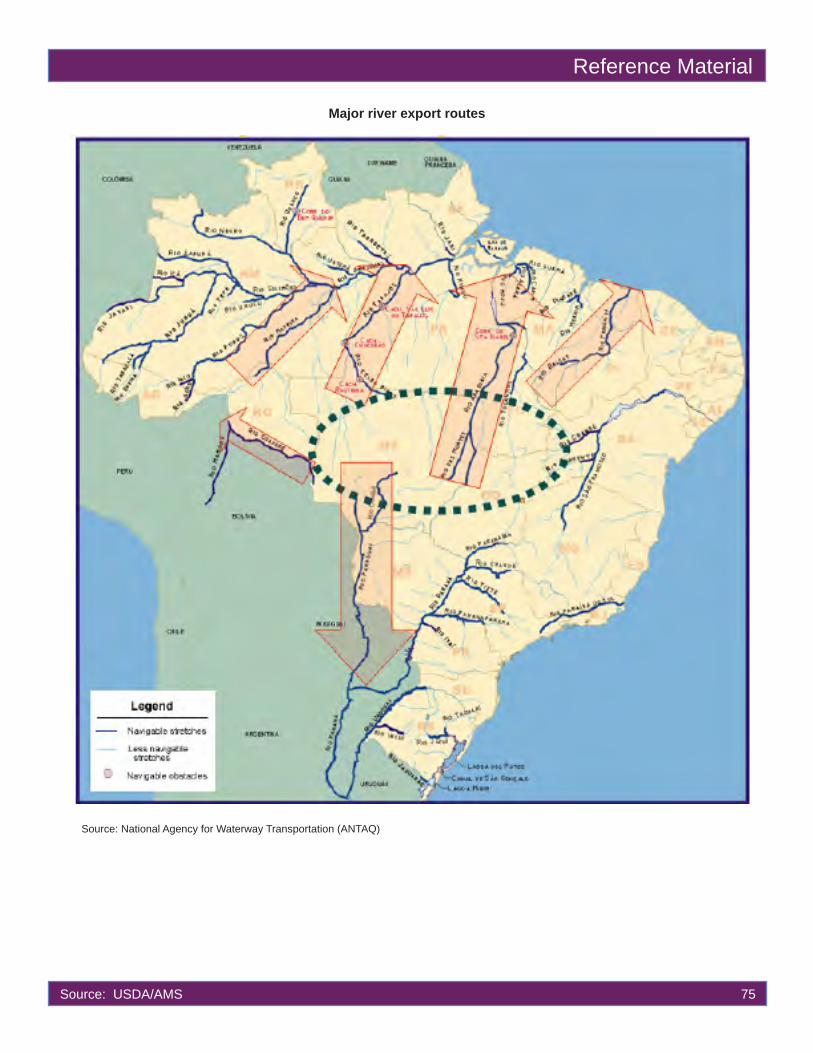
Reference Material
Major river export routes
Source: National Agency for Waterway Transportation (ANTAQ)
Source: USDA/AMS 75
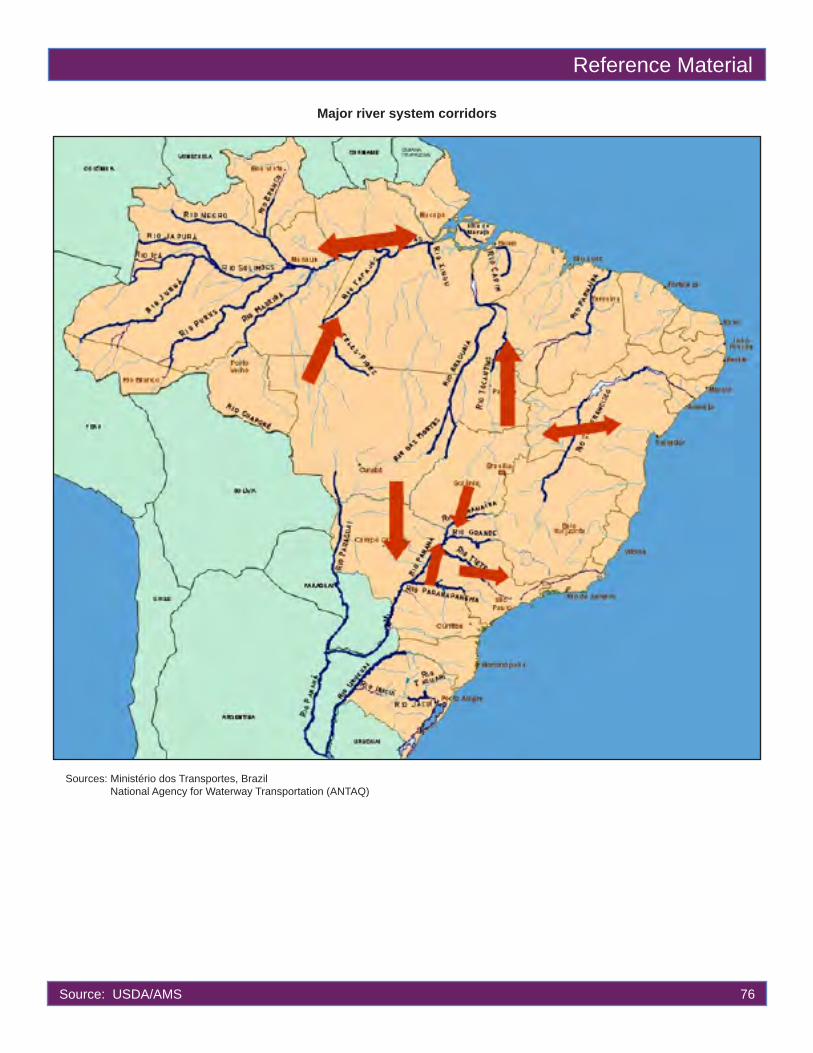
Reference Material
Sources: Ministério dos Transportes, Brazil National Agency for Waterway Transportation (ANTAQ)
Major river system corridors
Source: USDA/AMS 76
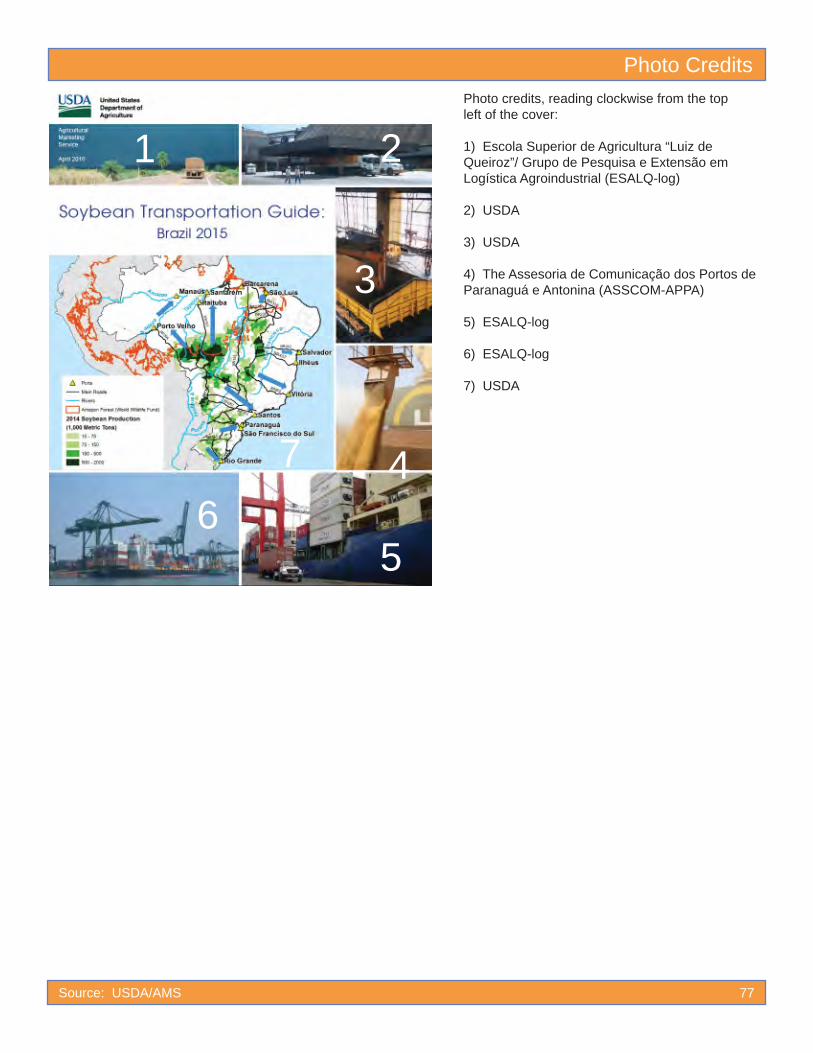
Photo Credits
Source: USDA/AMS 77
1 2
3
4
56
Photo credits, reading clockwise from the top left of the cover: 1) Escola Superior de Agricultura “Luiz de Queiroz”/ Grupo de Pesquisa e Extensão em Logística Agroindustrial (ESALQ-log) 2) USDA
3) USDA
4) The Assesoria de Comunicação dos Portos de Paranaguá e Antonina (ASSCOM-APPA)
5) ESALQ-log
6) ESALQ-log
7) USDA
7


Soybean Transportation G
uide: Brazil 2016


![Diapositivas Del Matrimonio Delmy[1]](https://img.pdfslide.net/doc/110x75/577d25da1a28ab4e1e9fb73f/diapositivas-del-matrimonio-delmy1.jpg)