Embed Size (px)
Citation preview

ROBERT D. MCHUGH, JR., Ph.D. Weekend Market Newsletter
A Publication of Main Line Investors, Inc. P.O. Box 1026 Issue No. 1127 Email Address: Kimberton, PA 19442 Friday, July 24th, 2009 [email protected]
Sep 8 9 2 9 1 1 Sep 9 9 2 1 1 1 Sep 10 9 2 1 1 1 Sep 11 9 2 1 1 1 Sep 12 9 2 9 1 1
Status of Demand Power/Supply Pressure Key Trend-finder Indicator First Current Current Fullest Extent of Index Term * Signal Date of Signal Demand Pr. Supply Pr. Index Move Since Signal S&P 500/DJIA Short Enter Long 7/15/2009 418 353 Rose 47 Points ( 5.1 %) NDX Short Enter Long 7/15/2009 423 381 Rose 104 Points ( 6.9 %) * We consider a new entry point for a signal the day when one measure crosses more than 10 points above the other. We like to exit when (or before if conservative) the two measures return to an intersection.
Page 1
Visit Our Website At www.technicalindicatorindex.com
SUMMARY OF INDEX DAILY CLOSINGS FOR FRIDAY, July 24th, 2009
NASDAQ NASDAQ Russell 30 Yr Treas Date DJIA Transports S&P COMPQ 100 2000 Bonds July 17 8743.94 3313.95 940.38 1886.61 1527.26 519.22 116^09 July 20 8848.15 3385.14 951.13 1909.29 1544.00 526.96 117^06 July 21 8915.94 3360.14 954.58 1916.20 1553.01 525.22 118^11 July 22 8881.26 3394.83 954.07 1926.38 1565.00 528.70 117^09 July 23 9069.29 3506.12 976.29 1973.60 1601.52 545.85 115^20 July 24 9093.24 3536.48 979.26 1965.96 1599.06 548.46 116^03
S&P 500 vs: Demand Power & Supply Pressure April 2009 to July 2009
750
850
950
1050
1150
1250
1350
4/24/09 5/24/09 6/24/09 7/24/09150.0200.0250.0300.0350.0400.0450.0500.0550.0600.0
S&P 500
When Demand Power Crosses 10 Pts above the Supply Pressure Line, we get a Buy Signal. When Supply Pressure rises 10 Points above Demand Power, we get a Sell Signal. Exit signals occur when DP or SP lines return to intersection after an entry signal.
S&P 500
Demand Power/ Supply Pressure
Supply Pressure
Demand Power
copyright © 2009 Robert McHugh, Ph.D.
We received an "Enter Long Positions" Signal July 15th, 2009EnterLong Enter
Short. ExitShor
Enter Short7/2/09
Enter Long7/15/09

MCHUGH’S DAILY MARKET BRIEFING Friday, July 24th, 2009
Page 2
Stocks are in the final wave of the eye of a hurricane of a Bear Market. The eye is the calm before the second half of a terrible storm. Once this rally finishes, we expect a severe stock market decline again. That decline should be the end of the Bear Market that started in late 2007. This Bear Market is a Grand Supercycle Bear Market, one for the ages. The first part of the storm was wave (A) down, which lasted from October 2007 to March 2009. The Second of three parts, the eye, wave (B) up, started on March 6th, and this rally could last several more months. The third and likely final part will be wave (C ) down, and will hurt. Given the discovery of an additional pattern, this weekend, which we show on page 7, we want to focus on just how high this middle part, wave (B) up could send prices before wave (C ) down hits. Wave (B) up is taking the form of an A-up, B-down, C-up move, a powerful recovery like we saw back in 2003. Waves A-up and B-down have finished. Wave C-up is underway. Wave C-up will be a five wave move, with waves (1), (3) and (5) driving markets higher, while waves (2) and (4) retrace the progress, cleaning out overbought conditions. Wave C-up has a lot of power inside it. It is a substantial move, and we believe the upside could be higher than initially thought. Here is why: Wave (1) up has been very strong, and taken the Industrials up 12.5 percent so far, or about 1,000 points. Wave (1)’s are not usually the largest waves, rather wave (3)’s are. Wave (5)’s tend toward equality with wave (1)’s. So, for sake of discussion, let’s say that wave (5) will also be 1,000 points. Let’s say wave (3) is a Fibonacci 1.618 times wave (1), that would be a 1,600 point move. Therefore, the upside potential would be 11,700ish. Now, let’s figure wave (2) down will be weak, based upon the strong action of the Advance Decline Line and our A/D Indicator, maybe somewhere between a Fibo-nacci .236 and .382 of wave (1) up, or a pullback of 200 to 400 points. Further, let’s consider that wave (4) alternates in pattern, which usually is the case, with wave (2)’s pattern, and generates a sideways triangle, not producing much of a pullback. That means this wave C-up, and wave (B)’s top could ar-rive around the 11,000 to 11,500ish area.
Summary of McHugh’s Proprietary Index Key Trend-finder Buy/Sell Signals Fullest Extent of Index Term Signal Date Current Signal Index Move Since Signal Plunge Protection Team Indic DJIA Short Sell Jan 30th, 2009 Fell 1531 Points ( 19.1 %) Purchasing Power Indicator DJIA/S&P Short Buy July 13th, 2009 Rose 769 Points ( 9.2 %) DJIA 14 Day Stochastic DJIA Short Buy July 13th, 2009 Rose 769 Points ( 9.2%) DJIA 30 Day Stochastic DJIA Short Buy July 13th, 2009 Rose 769 Points ( 9.2 %) DJIA Primary Trend Indicator DJIA Long Sell Sept 30th, 2008 DJIA Fell 4380 Points ( 40.4 %) Secondary Trend Indicator DJIA/S&P Short Buy Dec 26th, 2008 DJIA Rose 585 Points ( 6.9 %) NDX Purchase Power Indic NASDAQ 100 Short Buy July 13th, 2009 Rose 157 Points ( 10.9 %) NDX 14 Day Stochastic NASDAQ 100 Short Buy July 13th, 2009 Rose 157 Points ( 10.9 %) RUT Purchase Power Indic RUT Short Buy July 15th, 2009 Rose 33 Points ( 6.4 %) HUI Purchasing Power Indic HUI Short Buy July 15th, 2009 Rose 24 Points ( 6.9 %) HUI 30 Day Stochastic HUI Short Buy July 15th, 2009 Rose 24 Points ( 6.9 %)

MCHUGH’S DAILY MARKET BRIEFING Friday, July 24th, 2009
Page 3
Also, there is a larger degree Bullish Head & Shoulders Pattern than the one we have been showing lately, that has just completed, from October 2008, that has an upside target of 11,500ish, believe it or not. See page 7. Therefore, there is an increasing probability that this rally has another 2,500 points left in it, enough to turn the majority of investors strongly Bullish, a contrary sentiment con-dition that sets up (is often seen at) the start of a catastrophic decline. As stated before, Stocks Markets world-wide are in a Grand Supercycle degree wave {IV} Bear Market. This is a huge Bear Market, meaning either in terms of time, or in terms of decline, it will be one for the ages. We believe it will be relatively short in time, but deep in decline. This Bear Market can take shape as one of three patterns, which we show again this weekend, a massive sideways triangle, a flat, or a catastrophic zig-zag. If it is a Triangle, it will be a five wave supercycle pattern, and the low price has been reached on March 6th, 2009. That is the best case scenario. However, our fear is that we are going to get a zig-zag pattern, with a potential downside target close to zero. Maybe zero to 1,000 in the Industrials, and zero to 100 in the S&P 500. As a positive, if we reach 11,500ish during this rally, it means the Triangle scenario remains in play. Stated differently, the Industrials have to hit the 11,500ish area for the Triangle scenario to oc-cur. For reasons of proportionality, if the Industrials wave C-up move fails to hit 11,500ish, the Tri-angle scenario cannot happen, and we lose the hope that the low in stock prices were reached on March 6th. However, hitting 11,500ish does not guarantee the Triangle scenario is occurring, it just means that pattern remains in the game. Further, hitting 11,500ish does not preclude the Zig-zag scenario from unfolding. The Zig-zag catastrophic wave (C ) down scenario remains alive and well even if 11,500 is reached. If this is the case, that wave (B) up is going to reach 11,500ish, the next question is, when would be the most likely time frame for a top? Well, so far wave (B) up has been a fast mover. Two of its three waves, A-up, and B-down, have completed in just 4 months. And, the first leg of C-up, wave (1) up looks to be very close to completion. If it tops early next week as we suspect, wave (1) would’ve lasted only about two weeks. This puts wave C-up and (B) up on a pace to top this autumn, 2009, possi-bly around our September phi mate turn date, maybe at a later phi mate turn date scheduled in autumn 2009. If the pace of this move changes, we will let you know. No matter how high C-up of (B) up takes prices, the subsequent decline under any pattern will be deep, and very painful. If a Zig-zag pattern is unfolding, which is still a likely possibility even if wave (B) up hits 11,500, we are talking devastation here. Over the past few weeks we have shown dangerous massive Head & Shoulders Top patterns of lar-ger degree than the Bullish H&S patterns we show this weekend. Those larger degree topping patterns, the Zig-zag scenario, are suggesting stocks are headed close to zero if they become confirmed. The presence of these dangerous patterns provides greater than equal odds that the catastrophic Zig-zag wave (C ) down scenario is coming. If the Triangle pattern unfolds, (C ) down could still lose 2,500 points. Looking at all the patterns, all the momentum measures, the stochastics, and everything at this point, I’d place the odds of the sideways triangle pattern at about 30 percent, and the Zig-zag pattern at about 70 percent. We’ll show you all the charts and data this weekend, and you can draw your own con-clusions. Back in the Great Depression of 1929 through the 1930’s, we saw a similar Zig-zag pattern. There was a crash in 1929, followed by a nice rally, but then the most devastating part of the market col-lapse followed into the 1930’s. That Bear Market was a Supercycle degree wave (IV). This one is one degree larger, which means it should be worse. There is great risk to the status quo political structure of
MCHUGH’S DAILY MARKET BRIEFING Friday, July 24th, 2009
Page 4
governments internationally with this Bear Market. That is why gold is an attractive investment for di-versified conservative portfolios, as it has been considered a monetary equivalent throughout the ages, surviving the rise and fall of fiat currencies of nation state powers. Fundamentals are a mess at this time in our economy, regardless of all the hoopla nonsense we hear from the mainstream financial press, who hope to jawbone this economy to health, so their ratings rise. Truth is, we have 10 percent admitted unemployment at this time, with the actual rate much higher if you include discouraged workers no longer seeking employment. That figure will get worse. A lot of those good folks are collecting severances or unemployment checks, which have expiration dates. This means consumer spending, which accounts for 70 percent of GDP, is not going to rise much any time soon. Comparative corporate earnings reports that we hear “beat expectations” are beating pathetic ex-pectations, not robust expectations. A lot of the earnings improvements are due to labor cost savings from downsizing, not growth. Health insurance has been the topic dujour this week. From the Secretary of Health and Human Resources' own lips, the United States is now spending $2.5 trillion on health care, about 17 percent of GDP. So where are we headed? Will 50 percent of all jobs in America eventually be either in the healthcare industry or the government? That is no framework for a prosperous nation. Famed economist Dr. Robert Shiller, who called the housing bust just before it hit, is now warn-ing that stock prices “could fall dramatically.” We agree. Commercial Real Estate is facing a looming credit crisis as lenders will be reluctant, or not have the liquidity, to lend for new projects. Loan renewals are at risk of being rejected. There are now some studies suggesting that the total bailout of the U.S. economy may exceed $20 trillion. That is about one and a half times one year’s GDP. Criticism of the recent Central Planner Bailout programs is that they are failing to trickle down to households and are being effectuated too slowly. Seriously, does anyone see much in the way of infrastructure spending going on? The major problem with the Central Planner’s stimulus programs is they simply have replaced bad assets in a hand-ful of large corporations with cash from the Fed or Treasury. This is essentially keeping large institutions alive, but not getting money into the hands of small businesses or consumers. A $13 trillion tax rebate program would instantly revive this economy, a refund of three years income taxes to every house-hold, with a minimum payment of $50,000. Half the rebate should be required to pay back debt, which would clean up credit markets, and restore capital levels, asset quality, and liquidity of lenders. It is a no brainer, but political agendas and power grabs will dismiss this common sense solution. Shorter-term, we saw a small five wave rally Friday, which either completed the fifth and final subwave of (1) up, or was the first of five small waves that will complete (1) up by the middle of next week. The Dow Industrials rose 23.92 points, closing at 9,093.24 Friday. NYSE volume fell to 88 per-cent of its 10 day average. Upside volume led at 64 percent, with advancing issues leading at 63 per-cent, with upside points at 70 percent. S&P 500 Demand Power rose 1 point to 418, while Supply Pressure fell 3 points to 353, telling us the rally was weak and due to a lack of selling. The 15, 30 and 60 minute Full Stochastics suggest prices are overbought. In an interesting development, the Daily Full Stochastics actually generated a new “sell” signal Thursday. Our feeling is that wave (1) up is close to finishing, and a decline that lasts several days, wave (2) down could start by early this coming week. The rising Advance Decline Line suggests wave (2) ‘s decline may not be very severe.
MCHUGH’S DAILY MARKET BRIEFING Friday, July 24th, 2009
Page 5
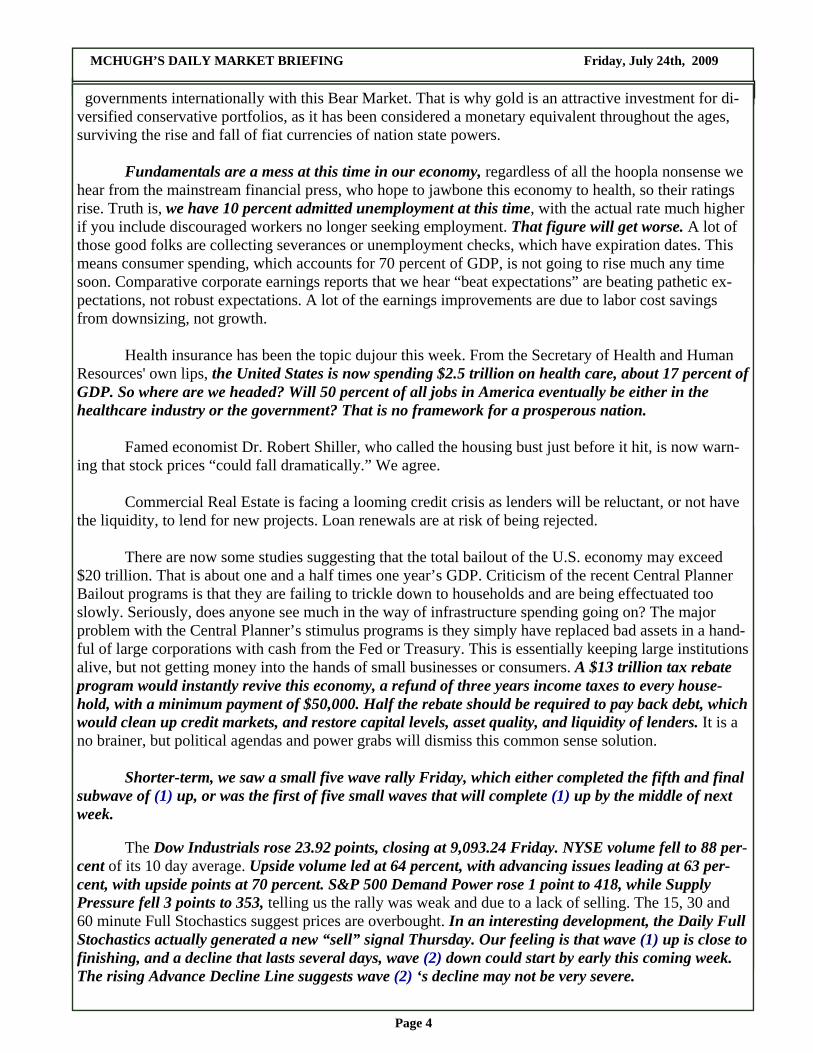
The above chart show the Supercycle Degree wave (IV) decline that kicked off the Great De-pression of the 1930’s. The point we want to make here is that the initial crash was merely wave A down of an A-down, B-up, C-down move that lasted in full about three and a half years. Wave A down lasted about three months, from September 1929 through November 1929. Wave B-up corrected half the decline from Wave A down, and lasted about six months into April 1930. At that point, it was a critical error to assume the worst was over. In fact, it was far from over. A catastrophic Wave C-down started in April 1930 and lasted into the summer of 1932. That two plus year decline was destined to wipe out more than the crash did, and take prices down to the point where the total damage from wave (IV) was 90 percent from its wave (III) peak in 1929. The economy then was stuck in the throes of the Depression for the rest of the decade, only to be pulled out by the onset of World War II in the early 1940s, all the associated spending that war re-quired. The point here is we cannot be fooled by this Grand Supercycle degree wave (IV) that started in October 2007. Wave (A)-down is over, and Wave (B)-up is underway. However, a catastrophic Wave (C)-down is coming, just like one did in 1930 through 1932. As a note: Most Depressions throughout history led to massive wars. The Depression of the 1850s led to the Civil War.
The Dow Industrials During the Great Depression 1929 through 1930s
40
90
140
190
240
290
340
390
1/2/29 1/2/30 1/2/31 1/2/32 1/2/33 1/2/34
After the Stock Market Crash of 1929, A Corrective Wave B Rally Unfolded, Lasting about Six Months, then a Catastrophic Wave C Down Followed that Lasted Over Two Years.
A
(III)
B
C, (IV)
The Great Depression Started With Supercycle Wave (IV) Down, Lasting from 1929 through 1932, an A Down, B-Up, C-Down Move. Wave C Down Lasted Over 2 Years and Was Worse Than the Wave A Crash of 1929.

MCHUGH’S DAILY MARKET BRIEFING Friday, July 24th, 2009
Page 6
The Big Picture Elliott Wave Long-term Count in the Dow Industrials 1900 to 2008
Here is a Big Picture Historical Elliott Wave Labeling for the Dow Industrials. It now appears that Armageddon is right around the corner, once wave C-up of (B) up completes, which would suggest the above labeling, placing us deep inside a developing Grand Supercycle Wave {IV} down, that Grand Supercycle wave {III} up is over, at the October 2007 top. Because the S&P 500 broke below the Octo-ber 2002 lows, we believe the worst case wave {IV} scenario is occurring. If in fact Grand Supercycle {IV} is occurring, we believe it could change the international political landscape like never before, with totalitarian regimes a possibility in previously democratic nations. Grand Supercycle waves change na-tions and governments. The Great Depression was of Supercycle degree, wave (IV) down, and was not of Grand Supercycle degree, like the current Bear Market is, which means this Bear Market will be worse. It led to the rise of the Third Reich.
(IV) 1932
(III) 1929
5 of (5) of V of (V) of {III}
I
II
III
IV
(1)
(2)
(3)
(4)
1 2
3
4
{III} Grand Supercycle Degree (from 1718) (V) Supercycle Degree (from 1932) V Cycle Degree (from 1974) (5) Primary Degree (from 2002) 5 Intermediate Degree (from Oct 2004)
(1) (2)
(5)
(4(3) A
B
C
Logarithmic Scale
5
The Great Depression was of Supercycle degree, one lesser than the current Bear Market, which is of Grand Supercycle degree.
{IV}
(A)
(B)

MCHUGH’S DAILY MARKET BRIEFING Friday, July 24th, 2009
Page 7
Below we show the latest Bullish Head & Shoulders bottom pattern in the Dow Industrials, one with a higher upside target than the slightly smaller pattern that developed a few weeks ago, and we were showing over the past few weeks. The recent price rally to 9,100 completed this pattern. The pat-tern is confirmed meaning the probability of the upside target of 11,500ish being met is high. Further, also evident on this chart is a Bullish crossover of the 50 day moving average above the 200 day mov-ing average, the first such crossover since January 2008. This fits with our wave C-up wave count, and the likelihood of another 20 percent rally from current levels before the next major downleg starts. This weekend, we also present a dangerous large degree pattern that has shown up in the U.S. Dow Industrials, Russell 2000 (RUT), and international stock markets, Germany’s DAX, Japan’s To-kyo NIKK, and Australia’s SPASX200, warning there is a greater than preferred risk that stock markets are going to experience a collapse later in 2009 or 2010, perhaps lasting into 2011 or even 2012, after this current wave C-up of (B) up completes. Each has a massive Bearish Head & Shoulders top pat-tern, with downside targets of near zero. These patterns are not yet complete, and not confirmed yet, meaning prices have not fallen from a right shoulder top, below the neckline. If they do get confirmed, it means the probability of the downside targets being met are high. Don’t miss charts on pages 20 and 21. Dow Theory still has a primary degree sell signal. In last weekend’s report we showed that our Primary Trend Indicator and its confirming 20 month / 40 month indicator are also looking for a substan-tial decline over the next few years., likely after this wave C-up move finishes later in 2009.
Left Shoulder
Right Shoulder
Head
Daily Chart Bullish Head & Shoulders Bottom with an Upside Target of 11,500ish. The pattern is confirmed, so the probability of hitting the upside target is high.

MCHUGH’S DAILY MARKET BRIEFING Friday, July 24th, 2009
Page 8
We got a small change in the McClellan Oscillator Friday, a 6.33 point decline to positive + 223.81. This suggests we are likely to see a large price move early this coming week. The Summation Index rose to positive + 3625.52. The Demand Power/Supply Pressure indicators remain on a buy signal Friday, July 24th. NYSE New Highs fell to 63, with New Lows at 4. We believe markets are setting themselves up for an-other series of Hindenburg Omens, probably in late summer, or early autumn. Getting one would be a strong sell signal and warning catastrophic wave (C ) down was dead ahead. The percent of DJIA stocks above their 30 day moving average fell to 83.33 from 93.33. The percent above 10 day fell to 83.33 from 93.33. The percent above 5 day rose to 86.67 from 80.00. The NYSE 10 day average Advance/Decline Line Indicator rose to positive + 1,213.4, remaining on a “buy” signal from July 15th, when it rose above the positive +120.00 threshold necessary for a new “buy.” The rise in the A/D indicator suggests higher prices are coming. Our three Blue Chip key trend-finder indicators (other than the Demand Power/Supply Pres-sure Indicator) remain on a “buy” signal Friday. The DJIA 30 day Stochastic Fast fell to 83.33, equal to the Slow at 80.00, remaining on a “buy” signal from July 13th. The DJIA 14 day Stochastic was 93.33, equal to the Slow at 93.33, remaining on a “buy” signal from July 13th. The Fast had to rise more than 10 points above the Slow for a new “buy.” The S&P 500 Purchasing Power Indicator rose to negative –79.12, remaining on a “buy” signal from July 13th. The Plunge Protection Team Risk Indicator was flat at positive + 7.52, Friday July 24th, re-maining on a sell signal from February 2nd, 2009. This indicator is telling us not to trust the rally from March 6th, 2009. A rise above positive + 20.0 or a drop below negative –16.0 triggers a new “buy” signal. Since the PPT Indicator generated a sell signal on January 30th, 2009, the Industrials have plunged 1,456.76, or 18.2 percent. When the reading rises above positive + 20.00, or falls below negative –16.00, we usually see multi-week rallies. On the other hand, declines can (don’t have to) oc-cur when this reading falls within the range of negative –16.00 to positive + 20.00. The PPT Indicator was in the range where declines typically occur, between negative –16.00 and positive + 20.00 for most of the late December/January decline, which saw the DJIA drop over 1,100 points. It then rose above + 20.00 January 14th. Rallies usually start about a week or two after this measure exceeds positive +20.00. When this indicator last went below negative –16.00, triggering a new “buy” signal, on February 7th, 2008, the Industrials closed at 12,247. After that the Industrials rose 509 points. After they rose above negative –16.00 on March 3rd, the DJIA dropped over 500 points. From May to July 2008 we saw a sig-nificant decline within this range, 1,650 points. After this indicator generated a sell signal October 1st, the Industrials declined 2,948 points. After this indicator generated a sell signal November 17th, the Industrials fell 824 points, or 10 percent. The DJIA Call/Put Ratio rose to 1.23 Friday, remaining on a “buy” signal from January 28th,(moving below 1.00 and above 1.40 is neutral, while rising decisively above 1.00 (above 1.10) triggers a new “buy”). On Friday, the Secondary Trend Indicator fell 2 points to positive + 42, remaining on a buy signal from December 26th when it went positive for the first time in three months, but trending down. Above zero is Bullish. Below zero is Bearish. The closer it moves toward zero, the greater the risk of a developing trend turn, thus caution with open positions would be recommended. After it turned Bearish on December 31st, 2007, the Industrials fell 1,630 Points, or 12.3 percent. After it generated a sell, on June 17th, the Industrials fell 1,200 points. After it triggered a sell signal on October 2nd, the Industrials fell 2,600 points. This indicator correlates well with price trends.

MCHUGH’S DAILY MARKET BRIEFING Friday, July 24th, 2009
Page 9
Treasury Bonds should be approaching a short-term bottom, as the Daily Full Stochastics are bottoming. There is a potential Head & Shoulders top forming, which if so, will require a relabeling of Bonds, and would portend sharply falling prices. We will update that situation as moves develop. At this time, this is an alternate possibility. If that alternate occurs, it will have catastrophic consequences for the economy. Gold has nearly completed a very Bullish Head and Shoulders Bottom. Gold has started its wave 3 up. The upside target is 1,325ish, and the probability of reaching that level rises dramatically with an upside breakout above 1,050ish. Gold’s Daily Full Stochastics are topping, suggesting a short-term corrective decline is coming. The HUI has formed a Bullish Head & Shoulders bottom pattern, with an upside target of 525ish. The pattern is confirmed, meaning the probability of the upside target being reached is high. There is a potential larger Head & Shoulders Bottom pattern nearing completion. Once prices rise above 400, that would give an upside target of 650ish. The HUI is on a buy signal in our key trend-finder indicators. Both the PPI and the 30 Day Stochastic are now on new buy signals. The Dollar has started primary degree wave (3) down. The Dollar is in trouble, due to all the money being printed and injected into various Central Planner programs. Short-term, it could bounce to the 84ish area, before an accelerated decline unfolds. A lot more money will be printed by the Central Planners, devaluing the Dollar. What is a crying shame is, if they were going to print 10 trillion dollars, they would have done a lot more good rebating it to households, rather than sending it down the black hole of too big too fail institutions. In the hands of consumers, that cash would have trickled up to the larger institutions. What a blown opportunity. If the Central Planners change policy and decide to defend the Dollar rather than let it devalue, interest rates will rise sharply and destroy what is left of this fragile economy. Oil could soon resume its decline. The Daily Full Stochastics are topping. The Weekly Full Sto-chastics are falling, and on a sell signal, suggesting wave C of (2) down has further to go. The monthly Full Stochastics warn that once this next down-leg finishes, Oil should rise significantly. So a buying opportunity is approaching in several months.
MCHUGH’S DAILY MARKET BRIEFING Friday, July 24th, 2009
Page 10
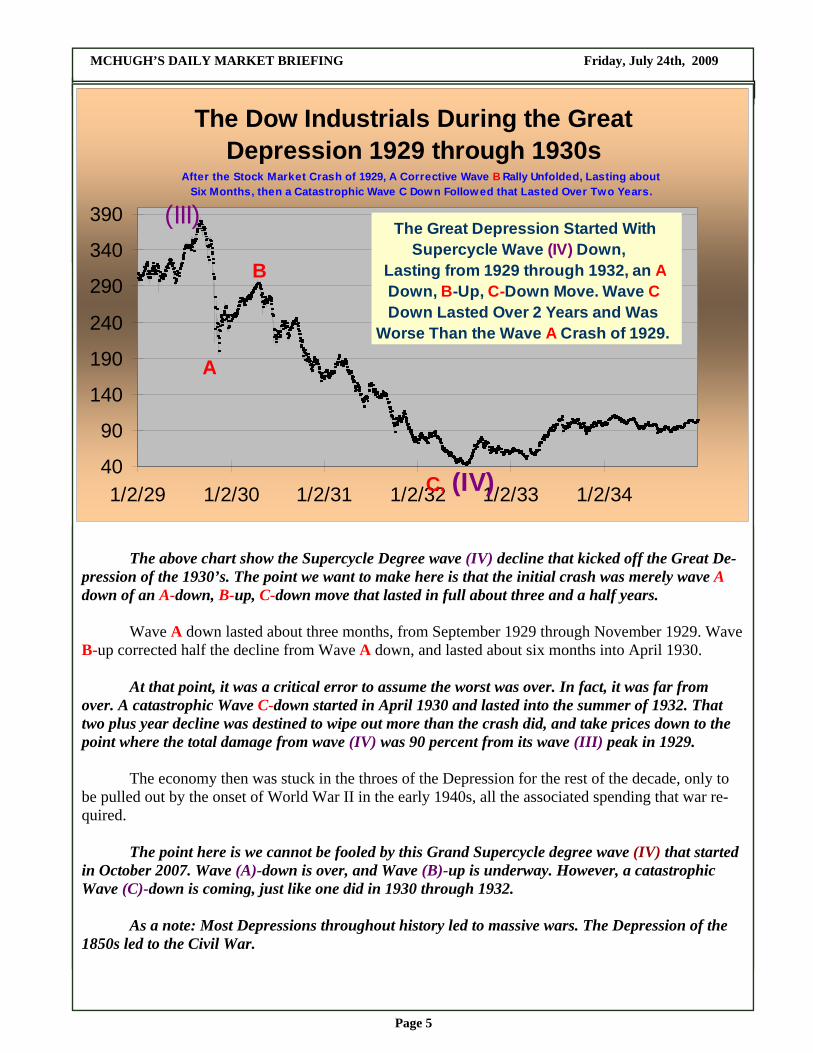
SUMMARY PAST WEEK’S DEMAND POWER/SUPPLY PRESSURE STATISTICS Blue Chips S&P 500/DJIA Demand Supply Purchasing Secondary Date Power Pressure Power Indicator Trend Indicator July 17 Up 3 to 400 Flat 0 at 371 Flat 0 at –90 Flat 0 at + 35 July 20 Up 6 to 406 Down 6 to 365 Up 2 to -88 Up 3 to + 38 July 21 Down 1 to 405 Down 1 to 364 Up 1 to –87 Up 1 to + 39 July 22 Flat 0 at 405 Down 1 to 363 Flat 0 at –87 Up 1 to + 40 July 23 Up 12 to 417 Down 7 to 356 Up 7 to –80 Up 4 to + 44 July 24 Up 1 to 418 Down 3 to 353 Up 1 to –79 Down 2 to + 42 NASDAQ 100 PPT Risk Indicator Demand Supply Purchasing (Above +18% Means High Date Power Pressure Power Indicator Risk of a Short-covering Rally) July 17 Flat 0 at 408 Down 1 to 389 Up 2 to –2 + 7.53 July 20 Up 4 to 412 Down 4 to 385 Up 3 to + 1 + 9.12 July 21 Up 1 to 413 Down 1 to 384 Up 1 to + 1 + 7.66 July 22 Up 1 to 414 Down 1 to 383 Up 3 to + 4 + 4.55 July 23 Up 10 to 424 Down 3 to 380 Up 10 to + 14 + 7.53 July 24 Down 1 to 423 Up 1 to 381 Flat 0 at + 14 + 7.52 10 Day Average Short-term Advance/Decline Signals July 24th Fullest Extent of Index A/D Indicator Signal Date of Signal Index Move Since Signal NYSE/S&P 500 + 1213.4 Buy July 15th, 2009 Rose 47 Points ( 5.1 %) NASDAQ 100 + 37.4 Buy July 15th, 2009 Rose 104 Points ( 6.9 %) Russell 2000 + 600.0 Buy July 20th, 2009 Rose 21 Points ( 4.1%)
Shorting should only be done with funds that are speculative and the investor is willing to accept a substantial loss on. That is because the PPT is very active at this time. Gold has nearly completed a very Bullish Head and Shoulders Bottom. Gold has started its wave 3 up. The upside target is 1,325ish, and the probability of reaching that level rises dramatically with an upside breakout above 1,050ish. There is also a Bullish Head & Shoulders bottom in the HUI with an upside target of 525ish, which is confirmed. Check out our Summer Specials, good through Sunday, July 26th, including a fabulous new 14 month offering, only $259, a little over $18 a month. If you are enjoying your subscription, please tell a friend.
MCHUGH’S DAILY MARKET BRIEFING Friday, July 24th, 2009
Page 11
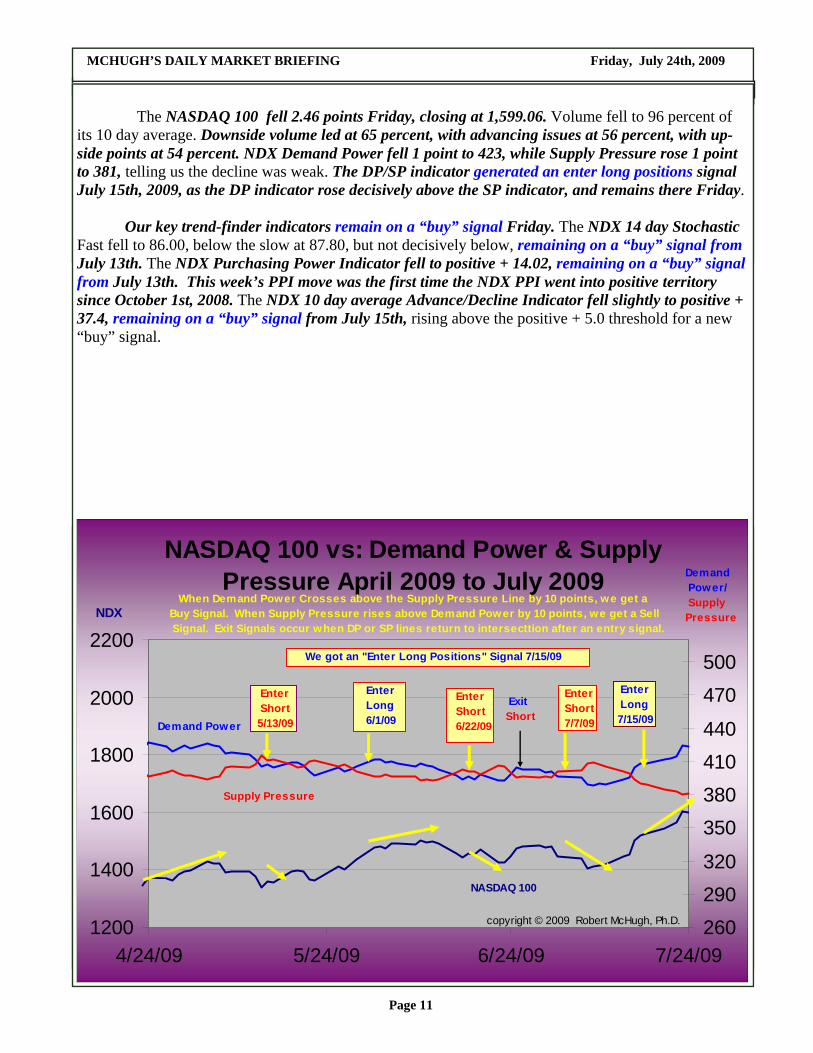
The NASDAQ 100 fell 2.46 points Friday, closing at 1,599.06. Volume fell to 96 percent of its 10 day average. Downside volume led at 65 percent, with advancing issues at 56 percent, with up-side points at 54 percent. NDX Demand Power fell 1 point to 423, while Supply Pressure rose 1 point to 381, telling us the decline was weak. The DP/SP indicator generated an enter long positions signal July 15th, 2009, as the DP indicator rose decisively above the SP indicator, and remains there Friday. Our key trend-finder indicators remain on a “buy” signal Friday. The NDX 14 day Stochastic Fast fell to 86.00, below the slow at 87.80, but not decisively below, remaining on a “buy” signal from July 13th. The NDX Purchasing Power Indicator fell to positive + 14.02, remaining on a “buy” signal from July 13th. This week’s PPI move was the first time the NDX PPI went into positive territory since October 1st, 2008. The NDX 10 day average Advance/Decline Indicator fell slightly to positive + 37.4, remaining on a “buy” signal from July 15th, rising above the positive + 5.0 threshold for a new “buy” signal.
NASDAQ 100 vs: Demand Power & Supply Pressure April 2009 to July 2009
1200
1400
1600
1800
2000
2200
4/24/09 5/24/09 6/24/09 7/24/09260290320
350380410440
470500
NASDAQ 100
NDX
Demand Power/ Supply Pressure
Supply Pressure
Demand Power
copyright © 2009 Robert McHugh, Ph.D.
When Demand Power Crosses above the Supply Pressure Line by 10 points, we get a Buy Signal. When Supply Pressure rises above Demand Power by 10 points, we get a Sell Signal. Exit Signals occur when DP or SP lines return to intersecttion after an entry signal.
We got an "Enter Long Positions" Signal 7/15/09
Enter Short 7/7/09
Enter Short 5/13/09
Enter Long 6/1/09
Enter Short 6/22/09
ExitShort
Enter Long7/15/09

MCHUGH’S DAILY MARKET BRIEFING Friday, July 24th, 2009
Page 12
The Russell 2000 rose 2.61 points Friday, closing at 548.46. Volume fell to 105 percent of its 10 day average, with upside volume leading at 65 percent, with advancing issues leading at 53 percent. The RUT Purchasing Power Indicator rose to positive + 21.28, remaining on a “buy” signal Friday, July 24th, 2009. The RUT 10 day average Advance/Decline Line Indicator rose to positive + 604.3, remain-ing on a “buy” signal from Monday, July 20th, 2009, when it rose above the positive + 180.00 thresh-old for a new “buy” signal. The HUI Amex Gold Bugs Index rose 0.78 points Friday, closing at 361.15. Volume fell to 75 percent of its 10 day average. Upside volume led at 71 percent, with advancing issues at 50 percent, with upside points at 57 percent. Our key trend-finder indicators remain on a “buy” signal Friday. The HUI 30 day Stochastic Fast remained at 95.00, above the Slow at 71.11, remaining on a “buy” signal from July 15th. The Fast had to rise more than 20 points above the Slow to trigger a new “buy.” The HUI Purchasing Power Indicator rose to 243.13, remaining on a “buy” signal from July 15th. August Gold rose to 953.1. Silver rose to 13.87, while September Oil rose to 68.11. The Dollar fell 0.31 to 78.75. Bonds rose half a point to 116^03. The PPT has to buy the long end to keep Bonds headed in the right direction, to support the housing market, especially now that AMBAC and MBIA are no longer rated AAA, Fannie Mae and Freddie Mac — who hold half of all mortgages - have collapsed, and credit markets have frozen, requiring lower interest rates, and Master Planner interest rate (bond) intervention. Bernanke finally suggested they will. The powerful rally in Bonds confirms they are monetizing Treas-ury debt. The VIX fell 0.34 to 23.09. The Australia SPASX200 rose 25.70 points, or 0.63 percent to 4,089.80 Friday. Click on the Weekend Australia Report, which includes EW charts of the FTSE and DAX, for the latest analysis. Bottom Line: The Fed has to continue hyperinflating to bail out this sick economy, feeding a major trend up in precious metals. Households, not just Wall Street, must be bailed out. If this doesn’t happen we are headed for an economic depression.
Summer Specials: 5 Months for $99 6 Months for $175, or 11 Months for $249, or, 12 Months for $325, or 14 Months for $259, or 18 Months for $359, or * 24 Months for $449 * Good through Sunday, July 26th, 2009 Simply go to www.technicalindicatorindex.com and click on the Subscribe Today or Renew Today buttons.

MCHUGH’S DAILY MARKET BRIEFING Friday, July 24th, 2009
Page 13
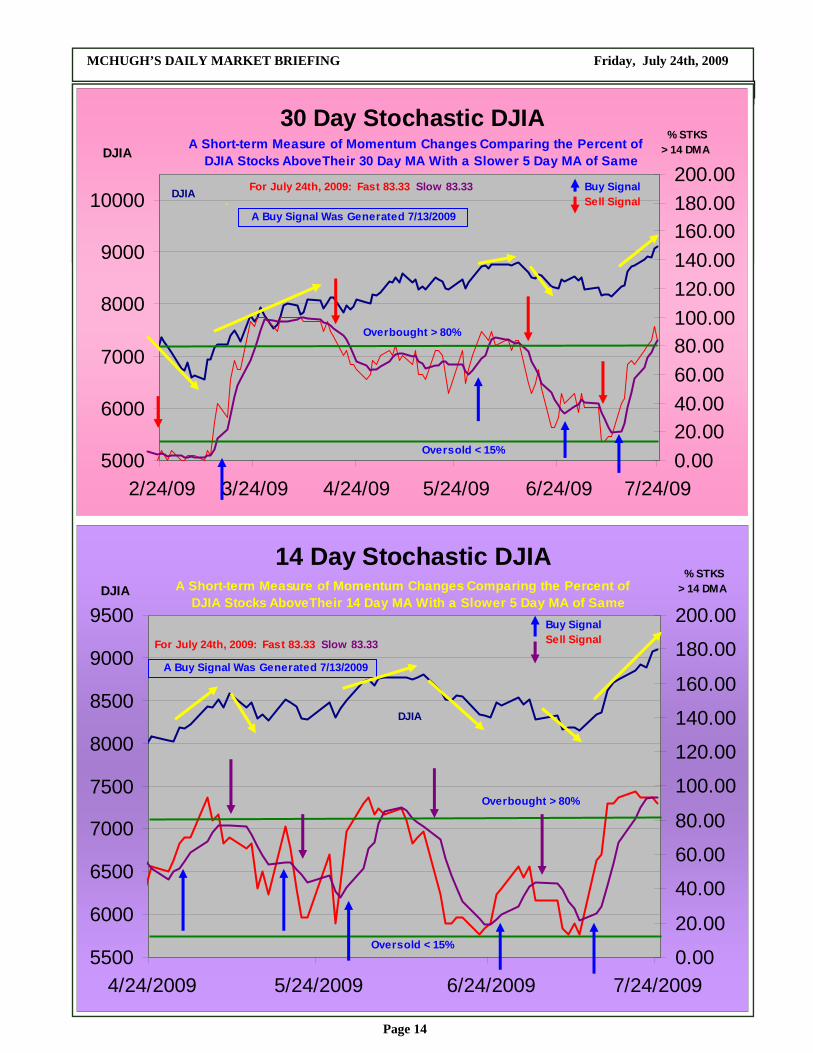
The chart shown above and the two charts on the next page are our key trend-finder indica-tors that identify high probability trends by generating signals based upon high momentum changes that meet our proprietary requirements. These key indicators are measured after the close of business each night and reported in each newsletter. These indicators do not pick the precise tops and bottoms, but are designed to generate signals within a day or two after a key turn has occurred that has a high probability of seeing at least a 2 percent move, and more than likely a much greater than 2 percent move. If momentum is not strong enough in a new direction, it will not trigger a new signal, will con-sider that move noise, and will hold off until a significant trend is a higher probability. When all three indicators, the Purchasing Power Indicator, the 30 Day Stochastic, and the 14 Day Stochastic are all in agreement, the probability that a significant move is starting is high. If they are in disagreement, it means we are likely going to see a sideways back and forth move, or a trend turn is approaching. The above chart of the Purchasing Power Indicator has a terrific correlation to significant tradable price moves, as you can see by looking at the length of the moves that occurred after signals were generated, the yellow arrows. About 80 percent of the time it finds significant moves, and about 20 percent of the time the moves it identifies are not significant. Price moves almost never occur in the opposite direction of the signal. The Industrials rose 1,264 points, 18.3 percent, since the PPI indicator generated a new buy signal March 10th. The 14 and 30 Day Stochastic Indicators spotted an 18 per-cent, 1,419 point decline with sell signals on February 10th, 2009. They then switched to buys on March 10th and March 12th. The Industrials rose 1,264 points, 18.3 percent, and 1,020 points, 14.2 percent afterwards. While Elliott Wave charts are helpful mapping tools, these momentum indicators keep us honest and do a good job spotting tradable trends, with no emotion or conjecture possible. They are strict mathematical formula indicators, cold and unemotional.
S&P/DJIA Purchasing Power Indicator TM
500
600
700
800
900
1000
1100
4/24/09 5/24/09 6/24/09 7/24/09-180-160-140-120-100-80-60-40-20020
PPI is a Short-term Momentum Measure of Purchasing Power, Generating Buy and Sell Signals When Changes Suggest Sustainable Multi-Week Moves are Likely.
July 24th, 2009's PPI is -79.12
S&P 500
PPI
The PPI Issued a "Buy" Signal on July 13th, 2009.
copyright © 2009 Robert McHugh, Ph.D.
Sell Signal Buy Signal
MCHUGH’S DAILY MARKET BRIEFING Friday, July 24th, 2009
Page 14
30 Day Stochastic DJIA
5000
6000
7000
8000
9000
10000
2/24/09 3/24/09 4/24/09 5/24/09 6/24/09 7/24/090.0020.0040.0060.0080.00100.00120.00140.00160.00180.00200.00
DJIA
A Short-term Measure of Momentum Changes Comparing the Percent of DJIA Stocks AboveTheir 30 Day MA With a Slower 5 Day MA of Same
Overbought > 80%
Oversold < 15%
For July 24th, 2009: Fast 83.33 Slow 83.33 .
DJIA % STKS > 14 DMA
Buy SignalSell Signal
A Buy Signal Was Generated 7/13/2009
14 Day Stochastic DJIA
5500
6000
6500
7000
7500
8000
8500
9000
9500
4/24/2009 5/24/2009 6/24/2009 7/24/20090.00
20.00
40.00
60.00
80.00
100.00
120.00
140.00
160.00
180.00
200.00
DJIA
A Short-term Measure of Momentum Changes Comparing the Percent of DJIA Stocks AboveTheir 14 Day MA With a Slower 5 Day MA of Same
Overbought > 80%
Oversold < 15%
For July 24th, 2009: Fast 83.33 Slow 83.33
DJIA % STKS > 14 DMA
Buy SignalSell Signal
A Buy Signal Was Generated 7/13/2009

MCHUGH’S DAILY MARKET BRIEFING Friday, July 24th, 2009
Page 15
The above chart shows there is a Bearish Divergence recently formed between the S&P 500 and the 10 Day Average Advance/Decline Line Indicator. And, as expected, a decline followed. There are no new Divergences at this time. At the top of the next page, we show that the Russell 2000 also formed a Bearish Divergence against its 10 day Average Advance/Decline Line Indicator, suggesting stocks were going to fall. That declining leg, B-down, followed as expected. At the bottom of the next page, we show that the NASDAQ 100 also formed a Bearish Diver-gence against its 10 day Average Advance/Decline Line Indicator, suggesting stocks were going to fall. That declining leg also occurred.
NYSE 10 Day Moving Average Advance/Decline Line vs. the S&P 500
400
500
600
700
800
900
1000
1100
2/24/09 3/24/09 4/24/09 5/24/09 6/24/09 7/24/09-1500-1000-500050010001500200025003000
Bullish Divergence Bearish Divergence
Oftentimes Trend Reversals are Forewarned By Bullish and Bearish Divergences Between the NYSE 10 Day MA Adv/Dec Line and the Prices of of Equities.
S&P 500
NYSE A/D S&P 500
A/D
BearishDivergence

MCHUGH’S DAILY MARKET BRIEFING Friday, July 24th, 2009
Page 16
RUT 10 Day Moving Average Advance/Decline Line vs. the Russell 2000
100.00
200.00
300.00
400.00
500.00
600.00
700.00
2/24/09 3/24/09 4/24/09 5/24/09 6/24/09 7/24/09-1100
-600
-100
400
900
1400
1900Bullish Divergence Bearish Divergence
Oftentimes Trend Reversals are Forewarned By Bullish and Bearish Divergences Between the NYSE 10 Day MA Adv/Dec Line and the Prices of of Equities.
Russell 2000
RUT A/D
Russell 2000
A/D 0
A Bearish Divergence.
NASDAQ 100 10 Day Moving Average Advance/Decline Line vs. the NASDAQ 100
400
550
700
850
1000
1150
1300
1450
1600
1750
1900
4/24/09 5/24/09 6/24/09 7/24/09-50
-25
0
25
50
75
100Bullish Divergence Bearish Divergence
Oftentimes Trend Reversals are Forewarned By Bullish and Bearish Divergences Between the $NDX 10 Day MA Adv/Dec Line and the Prices of $NDX Equities.
NASDAQ 100
$NDX A/D
NASDAQ 100
A/D Line
Bearish Divergence

MCHUGH’S DAILY MARKET BRIEFING Friday, July 24th, 2009
Page 17
The above chart is a closer look at the big picture. We originally hoped that the decline we are seeing now would be the bottom of wave 2, however with the “Sell” signal in our long-term PTI sig-nal, clearly there is more substantial downside coming. This fits with the recent development where both Industrials and the S&P 500 fell decisively below their 2002 lows, confirming we are in Grand Supercycle wave {IV} down. If Grand Supercycle wave {IV} down forms a Zig-zag pattern, it means time-wise, the Grand Supercycle wave could be short relative to other Grand Supercycle degree waves, however price-wise the decline will be dramatic, and therefore worthy of Grand Supercycle degree status. Above, we show the Zig-zag scenario. Under this scenario, a multi-month bottom occurred in March 2009. The November 20th bottom was the bottom of Cycle degree wave 3 down of (A) down. Wave (B) up is un-derway. This rally should consist of three waves, A-up, B-down, C-up within wave (B)-up. A-up may be completing now as the Weekly Full Stochastics are topping. The bad news is, that once this wave (B) rally finishes, maybe by mid 2009, perhaps as late as the autumn 2009, a nasty decline will follow, the third leg of the Bear Market, wave (C) down. That bottom suggests something along the lines of Armageddon could transpire, that we are in its early stages, which if so, could lead to change in our political structure, installing either fascism or social-ism to a degree never before imagined. We are witnessing some socialistic policies already now. What we are saying is, this should be worse than the 1930’s, which led to World War II. That politi-cal environment is where holding actual gold coins would be beneficial.
C of (4)
1
2
3
4 b d
c a
(3)
A
B
C
X
A
B
C
X
A B
Here’s the Big Picture “Bear Market” Zig-zag Worst Case Scenario
(B)
(C ), {IV}
(A)
e of 5 of (5) of V (V) {III}

MCHUGH’S DAILY MARKET BRIEFING Friday, July 24th, 2009
Page 18
The above chart depicts the scenario where Grand Supercycle wave {IV} forms a sideways triangle pattern. This pattern would provide clear alternation with wave {II}’s pattern, which was ei-ther a flat or a zigzag, so its odds of occurring have to be taken seriously. However, this scenario re-quires wave (A) down to be a three wave move, A-down, B-up, C-down, and although possible to la-bel, the decline from October 2007 is looking more and more like a five wave decline, which if so, eliminates this pattern. If happening, It is a good news, bad news pattern. The good news is the lowest prices for this Bear market occurred in March 2009. The good news is that every Supercycle declining degree wave left to complete this pattern will be shorter than its prior wave, so price damage will be contained. The bad news is this pattern will be drawn out, take time, and likely last 4 to 6 years. It’s a five-waver. Now maybe the worst for the stock market is over with this pattern price wise, but the worst would not be over for the economy with this pattern. For the Bear Market to last 4 to 6 years, it means many more years of distress, of rising unemployment, of weak economic growth, of redefinition of our economic system, of social discord that comes with Bear Markets. It means economic depres-sion will occur. It means a tug of war between perilous economic events and government interven-tion aimed at pulling us out of the abyss. But it means a great deal of change because of this un-precedented intervention. If this pattern is not occurring, it means a deeper decline will follow wave (B) up. That would suggest a zigzag is forming with the high probability that wave (C ) down could take the Industrials below 4,000, and could drop them to 1,500, a 90 percent decline, like seen in the 1929 through 1932 Bear Market plunge, which led to the Great Depression.
C of (4)
1
2
3
4 b
d
c a
(3)
A
B
C
X
A
B
C
X
A B
Here’s the Big Picture “Bear Market” Triangle Scenario
(B)
(E ), {IV}
(A)
e of 5 of (5) of V (V) {III}
(C)
(D)
In this scenario, the Bear Market would last 4 to 6 years.
MCHUGH’S DAILY MARKET BRIEFING Friday, July 24th, 2009
Page 19
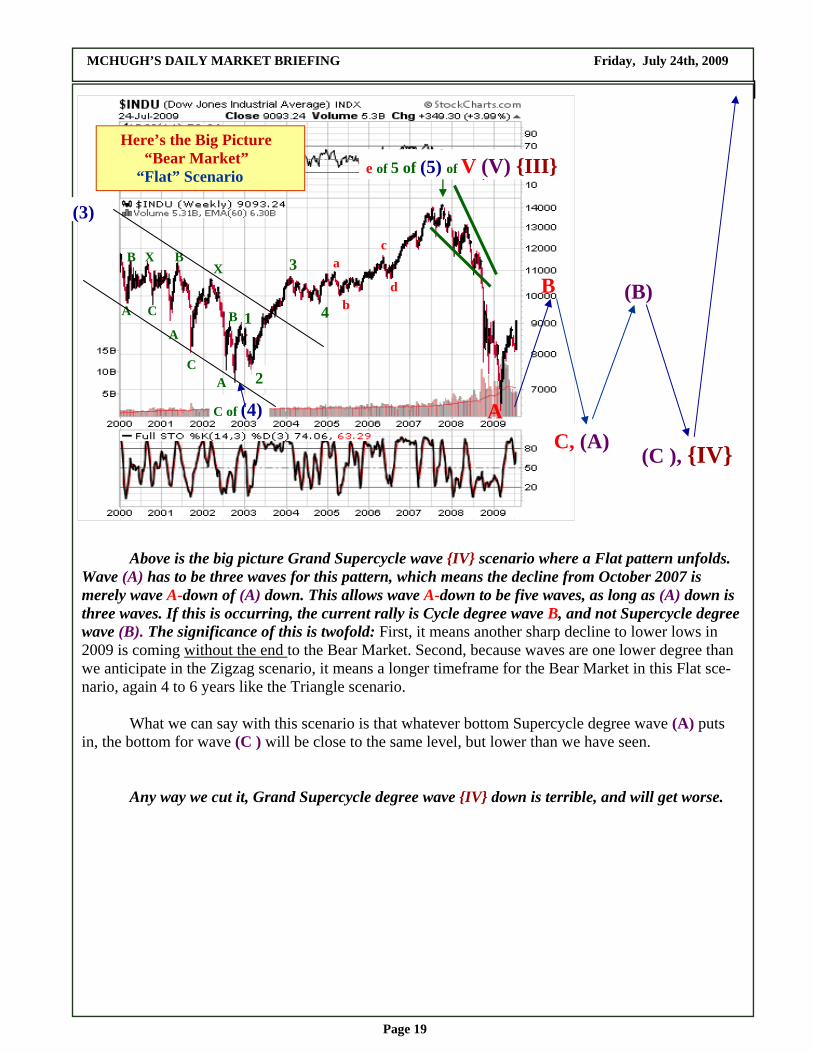
Above is the big picture Grand Supercycle wave {IV} scenario where a Flat pattern unfolds. Wave (A) has to be three waves for this pattern, which means the decline from October 2007 is merely wave A-down of (A) down. This allows wave A-down to be five waves, as long as (A) down is three waves. If this is occurring, the current rally is Cycle degree wave B, and not Supercycle degree wave (B). The significance of this is twofold: First, it means another sharp decline to lower lows in 2009 is coming without the end to the Bear Market. Second, because waves are one lower degree than we anticipate in the Zigzag scenario, it means a longer timeframe for the Bear Market in this Flat sce-nario, again 4 to 6 years like the Triangle scenario. What we can say with this scenario is that whatever bottom Supercycle degree wave (A) puts in, the bottom for wave (C ) will be close to the same level, but lower than we have seen. Any way we cut it, Grand Supercycle degree wave {IV} down is terrible, and will get worse.
C of (4)
1
2
3
4 b d
c a
(3)
A
B
C
X
A
B
C
X
A B
Here’s the Big Picture “Bear Market” “Flat” Scenario
(B)
(C ), {IV} C, (A)
e of 5 of (5) of V (V) {III}
A
B
MCHUGH’S DAILY MARKET BRIEFING Friday, July 24th, 2009
Page 20
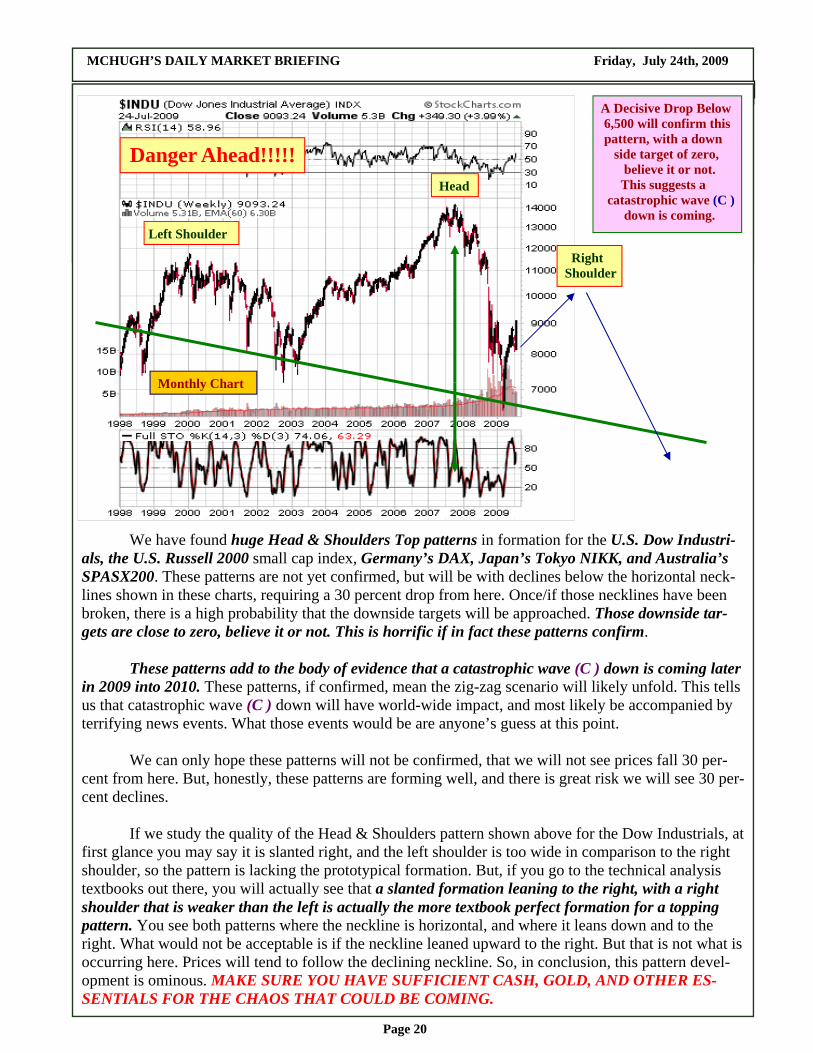
We have found huge Head & Shoulders Top patterns in formation for the U.S. Dow Industri-als, the U.S. Russell 2000 small cap index, Germany’s DAX, Japan’s Tokyo NIKK, and Australia’s SPASX200. These patterns are not yet confirmed, but will be with declines below the horizontal neck-lines shown in these charts, requiring a 30 percent drop from here. Once/if those necklines have been broken, there is a high probability that the downside targets will be approached. Those downside tar-gets are close to zero, believe it or not. This is horrific if in fact these patterns confirm. These patterns add to the body of evidence that a catastrophic wave (C ) down is coming later in 2009 into 2010. These patterns, if confirmed, mean the zig-zag scenario will likely unfold. This tells us that catastrophic wave (C ) down will have world-wide impact, and most likely be accompanied by terrifying news events. What those events would be are anyone’s guess at this point. We can only hope these patterns will not be confirmed, that we will not see prices fall 30 per-cent from here. But, honestly, these patterns are forming well, and there is great risk we will see 30 per-cent declines. If we study the quality of the Head & Shoulders pattern shown above for the Dow Industrials, at first glance you may say it is slanted right, and the left shoulder is too wide in comparison to the right shoulder, so the pattern is lacking the prototypical formation. But, if you go to the technical analysis textbooks out there, you will actually see that a slanted formation leaning to the right, with a right shoulder that is weaker than the left is actually the more textbook perfect formation for a topping pattern. You see both patterns where the neckline is horizontal, and where it leans down and to the right. What would not be acceptable is if the neckline leaned upward to the right. But that is not what is occurring here. Prices will tend to follow the declining neckline. So, in conclusion, this pattern devel-opment is ominous. MAKE SURE YOU HAVE SUFFICIENT CASH, GOLD, AND OTHER ES-SENTIALS FOR THE CHAOS THAT COULD BE COMING.
Left Shoulder
Right Shoulder
Head
A Decisive Drop Below 6,500 will confirm this pattern, with a down side target of zero, believe it or not. This suggests a catastrophic wave (C ) down is coming.
Monthly Chart
Danger Ahead!!!!!

MCHUGH’S DAILY MARKET BRIEFING Friday, July 24th, 2009
Page 21
(4)
Weekly Bar Chart
Russell 2000
As of 7/24/09
The Weeky Full Stochastics are on a Sell signal.
5, 5, of (5) of V of (V), {IV}
(A) (C ), {IV}
A Massive Head & Shoulders Top is forming for the RUT, which points to the coming catastrophic wave (C ) down for Grand Supercycle Bear Market {IV} down. The downside target is zero, believe it or not.
Left Shoulder Right Shoulder
Head
(B)
4 i
ii
iii
iv
v, 3
(4)
1
2
Weekly Bar Chart
Germany’s DAX
As of 7/23/09
The Weeky Full Stochastics are on a Buy signal.
5, 5, of (5) of V of (V), {IV}
(A) (C ), {IV}
(B)
A Massive Head & Shoulders Top is forming for the DAX, which points to the coming catastrophic wave (C ) down for Grand Supercycle Bear Market {IV} down. The downside target is zero, believe it or not.
Left Shoulder
Right Shoulder
Head

MCHUGH’S DAILY MARKET BRIEFING Friday, July 24th, 2009
Page 22
Left Shoulder Right Shoulder
Head
A Decisive Drop Below 7,000 will confirm this pattern, with a down side target of zero, believe it or not. This also suggests a catastrophic wave (C ) down is coming.
Monthly Chart
The Monthly Full Stochastics are rising From a bottom, suggesting, A strong rally is underway.
Left Shoulder
Right Shoulder
Head
A Decisive Drop Below 3,000 will confirm this pattern, with a down side target of 500, believe it or not. This also suggests a catastrophic wave (C ) down is coming.
Monthly Chart
The Monthly Full Stochastics are rising From a bottom, suggesting, A strong rally is underway.

MCHUGH’S DAILY MARKET BRIEFING Friday, July 24th, 2009
Page 23
(C ), {IV}
{V}
{III}
C, (A)
(A)
(B)
(C)
(D)
(E), A
B
C, (B)
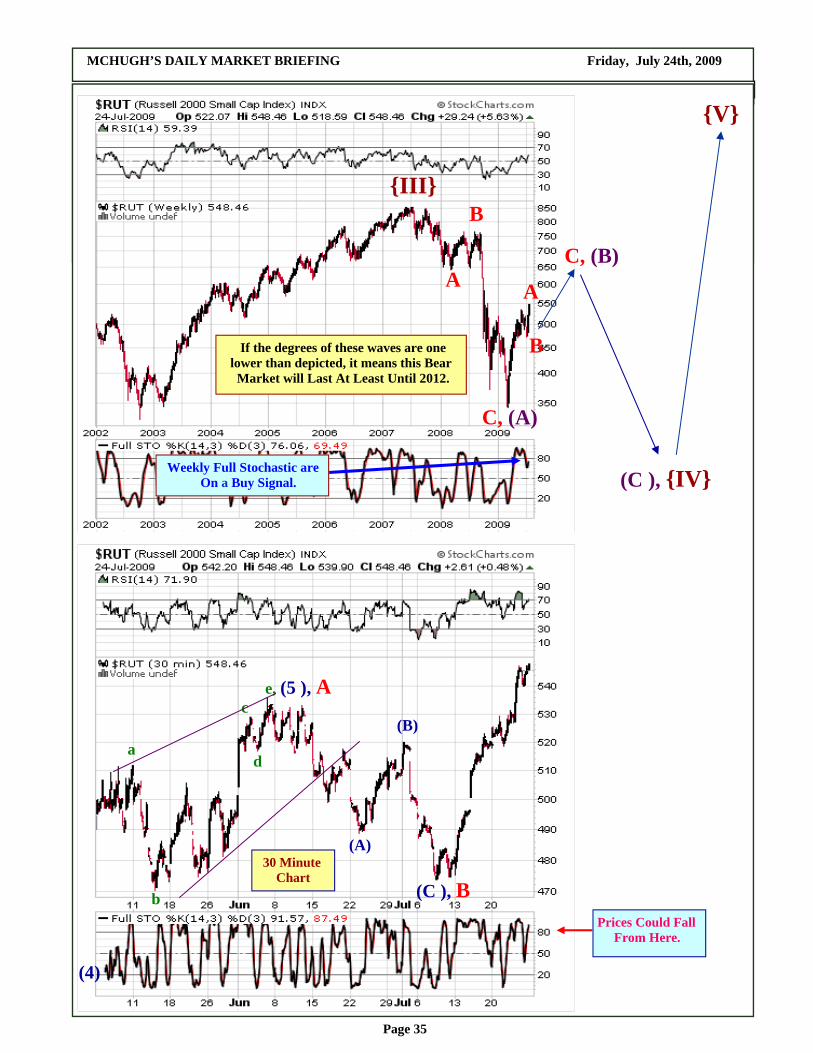
If the degrees of these waves are one lower than depicted, it means this Bear Market will Last At Least Until 2012.
Weekly Full Stochastic are On a Buy Signal.
A
B
(C ), {IV}
{III}
C, (A)
(A)
(B)
(C)
(D)
(E), A
B
C, (B)
If the degrees of these waves are one lower than depicted, it means this Bear Market will Last At Least Until 2012.
Weekly Full Stochastic On a Buy Signal.
A
B
{V}

MCHUGH’S DAILY MARKET BRIEFING Friday, July 24th, 2009
Page 24
{III}
5, (A)
(1)
(2)
(3)
(4)
(5), 1
2
(5), 3
4
(1)
(2)
(3)
(4)
C, (B)
A
B
Daily Full Stochastics On a Buy Signal, But Topping.
{III}
5, (A)
(1)
(2)
(3)
(4)
(5), 1
2
(5), 3
4
(1)
(2)
(3)
(4)
C, (B)
A
B
Daily Full Stochastics On a Sell Signal, But Topping.

MCHUGH’S DAILY MARKET BRIEFING Friday, July 24th, 2009
Page 25
e, (5 ), A
a
b
c
d
30 Minute Chart
(4)
(A)
(B)
(C), B 2
3
1
5, (1)
(2)
(3)
4
Prices Could Decline From Here.
Prices Could Decline From Here.
e, (5 ), A
a
b
c
d
30 Minute Chart
(4)
(A)
(B)
(C), B 2
3
1
5, (1)
(2)
(3)
4
Prices Could Decline From Here.
Prices Could Decline From Here.

MCHUGH’S DAILY MARKET BRIEFING Friday, July 24th, 2009
Page 26
(A)
(B)
(C), B
1
(3)
4
2 Prices Could Decline From Here.
15 Minute Chart
5, 5, (1)
(2)
1
2
3
4
Prices Could Decline From Here.
1
2
3 4
5, 3
(A)
(B)
(C), B
1
(3)
4
2 Prices Could Decline From Here.
15 Minute Chart
5, 5, (1)
(2)
1
2
3
4
Prices Could Decline From Here.
1
2
3
4
5, 3

MCHUGH’S DAILY MARKET BRIEFING Friday, July 24th, 2009
Page 27
Bullish Head & Shoulders Bottom with an Upside Target of 11,500ish.
Left Shoulder
Right Shoulder
Head
60 Minute Chart
Prices Could Fall Monday.
Prices Could Fall Monday.
Wave C-up of (B) up’s Upside Target 11,500ish.
Bullish Head & Shoulders Bottom with an Upside Target of 1,200ish.
Left Shoulder
Right Shoulder
Head
60 Minute Chart
Prices Could Fall Monday.
Prices Could Fall Monday.
Wave C-up of (B) up’s Upside Target 1,200ish.

MCHUGH’S DAILY MARKET BRIEFING Friday, July 24th, 2009
Page 28
2003’s V Shaped Rebound
2009’s V Shaped Rebound
MCHUGH’S DAILY MARKET BRIEFING Friday, July 24th, 2009
Page 29
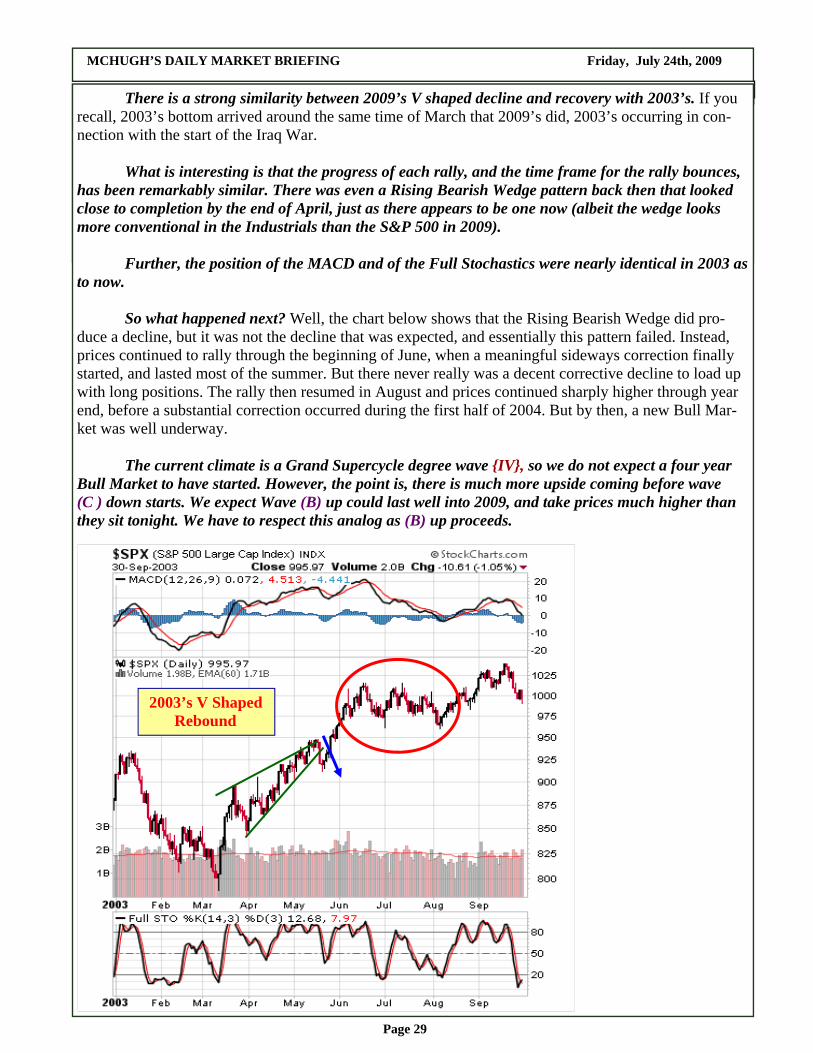
There is a strong similarity between 2009’s V shaped decline and recovery with 2003’s. If you recall, 2003’s bottom arrived around the same time of March that 2009’s did, 2003’s occurring in con-nection with the start of the Iraq War. What is interesting is that the progress of each rally, and the time frame for the rally bounces, has been remarkably similar. There was even a Rising Bearish Wedge pattern back then that looked close to completion by the end of April, just as there appears to be one now (albeit the wedge looks more conventional in the Industrials than the S&P 500 in 2009). Further, the position of the MACD and of the Full Stochastics were nearly identical in 2003 as to now. So what happened next? Well, the chart below shows that the Rising Bearish Wedge did pro-duce a decline, but it was not the decline that was expected, and essentially this pattern failed. Instead, prices continued to rally through the beginning of June, when a meaningful sideways correction finally started, and lasted most of the summer. But there never really was a decent corrective decline to load up with long positions. The rally then resumed in August and prices continued sharply higher through year end, before a substantial correction occurred during the first half of 2004. But by then, a new Bull Mar-ket was well underway. The current climate is a Grand Supercycle degree wave {IV}, so we do not expect a four year Bull Market to have started. However, the point is, there is much more upside coming before wave (C ) down starts. We expect Wave (B) up could last well into 2009, and take prices much higher than they sit tonight. We have to respect this analog as (B) up proceeds.
2003’s V Shaped Rebound

MCHUGH’S DAILY MARKET BRIEFING Friday, July 24th, 2009
Page 30
Monthly Full Stochastics Suggest a Multi-month Rally is occurring.
Monthly Full Stochastics Suggest a Multi-month Rally is occurring.

MCHUGH’S DAILY MARKET BRIEFING Friday, July 24th, 2009
Page 31
C, (C ), {IV}
{V}
(5), C, (A)
A
B
(B) (1)
(2)
(3)
(4)
The Weekly Full Stochastics on a buy signal.
Left Shoulder
Head Right Shoulder
V (V) {III}
(5), C, (A)
A
B
C, (B) (1)
(2)
(3)
(4)
The Daily Full Stochastics On a buy signal, But Topping.
A
B

MCHUGH’S DAILY MARKET BRIEFING Friday, July 24th, 2009
Page 32
The above pattern is an inverse Head & Shoulders, Bullish, with an upside target for Trannies of 4,500ish. This should be a nice upside target for the completion of wave (B). Then catastrophic wave (C ) down follows.
Bullish Head & Shoulders Bottom with an Upside Target of 4,500ish.
Left Shoulder Right Shoulder
Head
Prices Could Fall Monday.
Prices Could Fall Monday.
MCHUGH’S DAILY MARKET BRIEFING Friday, July 24th, 2009
Page 33
(A)
a
b
e, 5, A
1
c
d
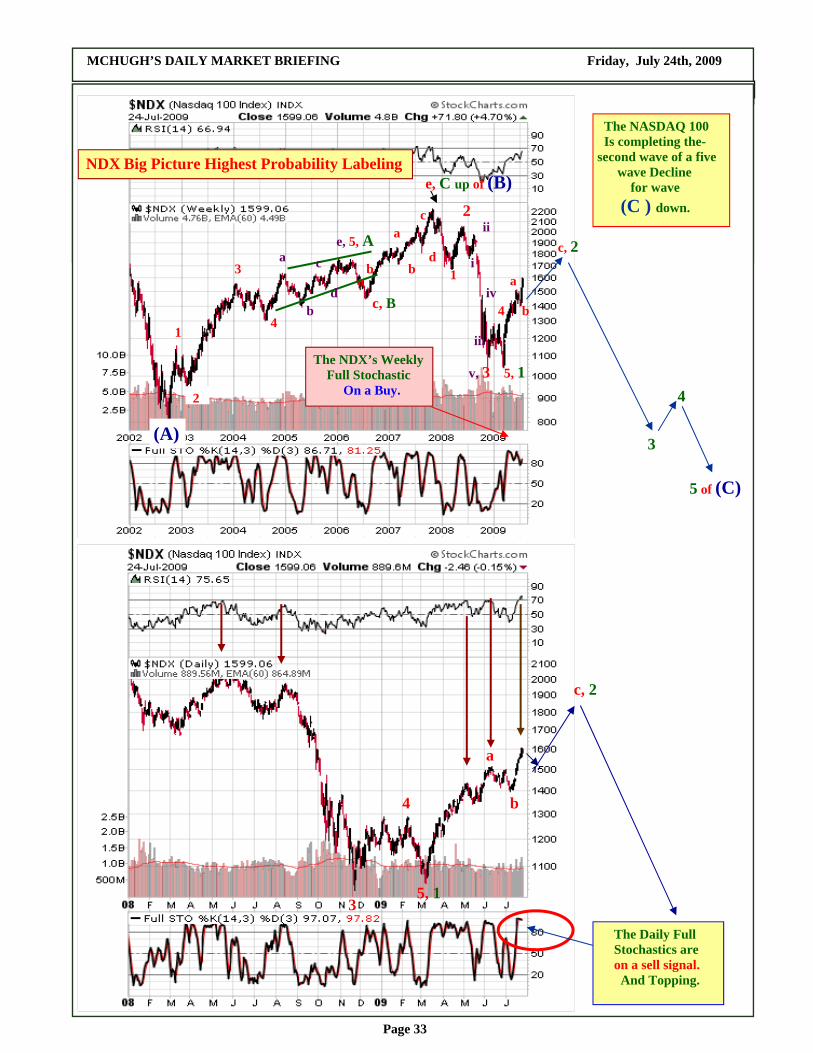
The NASDAQ 100 Is completing the-second wave of a five wave Decline for wave (C ) down.
c, B
e, C up of (B)
a b
2
3
4
a
b
c
d 1
2
NDX Big Picture Highest Probability Labeling
The NDX’s Weekly Full Stochastic On a Buy.
i
ii
iii
iv
v, 3
c, 2
5, 1
3
5 of (C)
a
4
b 4
The Daily Full Stochastics are on a sell signal. And Topping.
4
3
c, 2
5, 1
a
b
MCHUGH’S DAILY MARKET BRIEFING Friday, July 24th, 2009
Page 34
e, e, a
c, b
c
d
c, 2
a
b
c
d
a
b
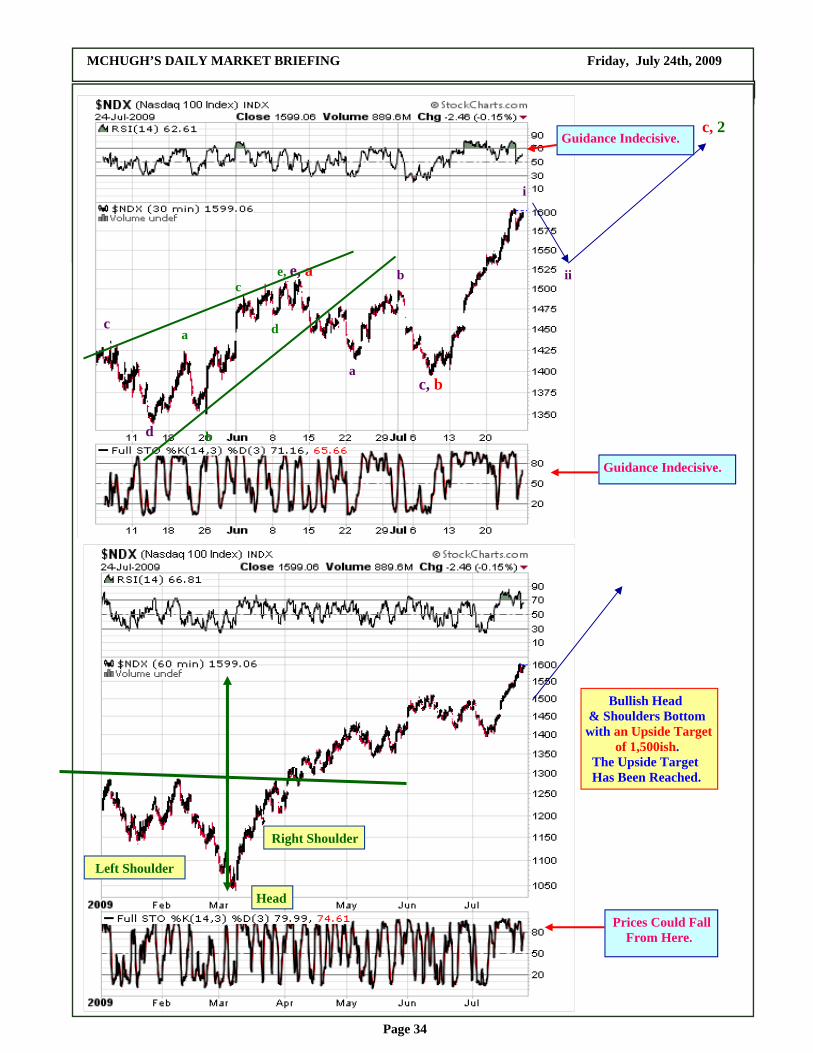
Guidance Indecisive.
i
ii
Guidance Indecisive.
Bullish Head & Shoulders Bottom with an Upside Target of 1,500ish. The Upside Target Has Been Reached.
Left Shoulder
Right Shoulder
Head
Prices Could Fall From Here.
MCHUGH’S DAILY MARKET BRIEFING Friday, July 24th, 2009
Page 35
(C ), {IV}
{V}
{III}
C, (A)
A
B
C, (B)
If the degrees of these waves are one lower than depicted, it means this Bear Market will Last At Least Until 2012.
Weekly Full Stochastic are On a Buy Signal.
A
B
e, (5 ), A
a
b
c
d
30 Minute Chart
(4)
(C ), B
(A)
(B)
Prices Could Fall From Here.

MCHUGH’S DAILY MARKET BRIEFING Friday, July 24th, 2009
Page 36
Left Shoulder
Head
Right Shoulder
We had a decisive break below 80.00 giving us a minimum downside target for the U.S. Dollar of 40.00, another 50 % devaluation of the Dollar.
Neckline at 80.00
Monthly
A Massive Devaluation of the Dollar is Coming Due to this Current Financial Crisis
Monthly Full Stochastics top, and are on a sell. Major decline starting.
5, 5, (1)
1
2
3
c, 4 c, (2) a
b
(3)
1
2
(5), V
3
4
The Weekly Full Stochastics are on a sell signal, But bottoming. A short-term bounce is coming.
a
b

MCHUGH’S DAILY MARKET BRIEFING Friday, July 24th, 2009
Page 37
The Monthly Full Stochastics are on a Sell, falling from the level where major tops start.
Monthly RSI Gives an Early Warning of a Major Top. The Dollar should Plunge Over the Next Two to Four Years.
The Daily Full Stochastics are on a Buy Signal, And Bottoming.
c, (2) 5, a
c, b
5, 5, (1)
1
2
3
4
b
a
1
c, 2 a
b
i
ii
iii

MCHUGH’S DAILY MARKET BRIEFING Friday, July 24th, 2009
Page 38
5, 1
2
5, 3
1
2
3
4
5, 5, (1)
Natural Gas Stocks Correct in Wave (2) down.
a
b Weekly
c, 4
1
2
3
4
Natural Gas Stocks Weekly Full Stochastics On a buy signal.
A
B
C, (2)
5, 5, (1)
3
4
c, A
e, a
C, (2)
a
b
a
b
Natural Gas Stocks Daily Full Stochastics are on a Buy signal, And Topping.
c
d
b
a
b
c, c, B
The Topping Daily Full Stochastics means the XNG can be expected to decline short-term, within a large degree falling trend, wave C of 2 down.

MCHUGH’S DAILY MARKET BRIEFING Friday, July 24th, 2009
Page 39
The Monthly Full Stochastics are on a Buy signal.
The Monthly Full Stochastics are on a Buy signal.

MCHUGH’S DAILY MARKET BRIEFING Friday, July 24th, 2009
Page 40
The Weekly Full Stochastics are on a Sell signal.
c, 4
a
b
iii
1
2
3
c, 4
The Daily Full Stochastics are on a Buy signal But Topping.
a
b
c, A
i
ii
Oil Hit an All-time High of $147 a barrel Friday, July 11th, 2008.
v, 5, 5, (1)
iv b
a e, B
C, (2)
a
b
c
d

MCHUGH’S DAILY MARKET BRIEFING Friday, July 24th, 2009
Page 41
30 Day Stochastic HUI GOLD BUGS
050
100150200250300350400450500550
2/24/09 3/24/09 4/24/09 5/24/09 6/24/09 7/24/09-40
0
40
80
120
160
200
240
HUI
A Short-term Measure of Momentum Changes Comparing the Percent of HUI Stocks AboveTheir 30 Day MA With a Slower 9 Day MA of Same
Overbought > 80%
Oversold < 15%
For July 24th, 2009: Fast 95.00 Slow 71.11 .
DJIA % STKS > 30 DMA
Buy Signal Sell Signal
A Signal Cross Over/Under Requires a 20 point Fast/Slow Spread Move
A Buy Signal Was Generated July 15th, 2009
HUI Gold Bugs Purchasing Power Indicator
0
50
100
150
200
250
300
350
400
450
500
3/24/09 4/24/09 5/24/09 6/24/09 7/24/09160
180
200
220
240
260
280
300
320
PPI is a Short-term Momentum Measure of Purchasing Power, Generating Buy and Sell Signals When Changes Suggest Sustainable Multi-week Moves are Likely. HUI PPI
Buy SignalSell Signal
July 24th, 2009's HUI PPI is 243.13
PPI
HUI
A Buy Signal Was Registered on 7/15//09
copyright © 2009 Robert D. McHugh, Jr. Ph.D.

MCHUGH’S DAILY MARKET BRIEFING Friday, July 24th, 2009
Page 42
c, (A)
1 a
b 5, (5) I
2
3
4 (B)
(C ) II
e, 5, (1)
(2)
1
2
3
4
a
b
c
d
The Daily Full Stochastics Are on a Sell signal.
(3)
1
2
3
4
5, (1)
c, (2) a
b
(3)
The HUI Big Picture
Intermediate Degree
Primary Degree
Weekly (4)
(5) I
II
Alt. (A) (B) (C) II down
The Weekly Full Stochastics Are on a Buy signal.
(1)
(2)
(3)

MCHUGH’S DAILY MARKET BRIEFING Friday, July 24th, 2009
Page 43
There are two HUI Bullish Head & Shoulders Bottom patterns, shown above, the smaller one is complete and confirmed, with an upside target of 525ish. The larger pattern is still in formation. Once it completes, a decisive break above 400 will confirm that pattern, giving an upside target of 650ish.
Left Shoulder
Right Shoulder
Head
Daily Chart
Bullish Head & Shoulders Bottom with an Upside Target of 525ish In the HUI. This pattern is confirmed. Confirmation means the probability of the upside target being reached rises dramatically.
Left Shoulder
Right Shoulder

MCHUGH’S DAILY MARKET BRIEFING Friday, July 24th, 2009
Page 44
The Monthly Full Stochastics are on a Buy signal.
The Monthly Full Stochastics are on a Buy signal.

MCHUGH’S DAILY MARKET BRIEFING Friday, July 24th, 2009
Page 45
a
b
c
d
e, 4
v, 5, 1
c, 2
3 i
ii
iii
iv a
b
Gold’s Weekly Full Stochastics are on a Buy.
1
2
3, 3 of (1), III

MCHUGH’S DAILY MARKET BRIEFING Friday, July 24th, 2009
Page 46
v, 5, 1
c, 2
iv
c, a
c, b
a
b
a
b
Daily Full STO On a Sell signal.
i
ii
iii
iv
v, 1
c, 2 a
b i
ii
Left Shoulder
Right Shoulder
Head
Daily Chart
Bullish Head & Shoulders Bottom with an Upside Target of 1,325ish In Gold. This pattern will be confirmed with an upside breakout above 1,050ish. Confirmation means the probability of the upside target being reached rises dramatically.

MCHUGH’S DAILY MARKET BRIEFING Friday, July 24th, 2009
Page 47
The Daily Full Stochastics are on a Buy Signal, But Topping.
3
a
b
c
d
e, 4
3 of 5
a
Weekly
c, 2
e, 1
b
c
d
Weekly Full Stochastics on a Buy signal.
a
b

MCHUGH’S DAILY MARKET BRIEFING Friday, July 24th, 2009
Page 48
5, iii, 1, 5, (1)
c, e, 4
5, 3
c, a a
b a
b
c, b
a
b
c, c
a
b
c,
a
b a
b
c
d
e, i
ii
The Weekly Full Stochastics on a sell.
1
2
3
4
c, ii a
{a}
{b}
{ c}, b
(5), 1
The Daily Full Stochastics are On a Sell signal, And Bottoming.
i
{1}
{2}
{3}
{4}
(c), 2
{a}
{b}
3, iii, 1, 5, (1)

MCHUGH’S DAILY MARKET BRIEFING Friday, July 24th, 2009
Page 49
Above we see a potential Head & Shoulders Top forming in U.S. Bonds. If, and this is a very important if, Bond prices drop decisively below the neckline, below 112.50, then this Bearish pattern will be completed and confirmed, meaning the forecast for Bonds would change from Bullish to Bear-ish, with a downside target of 82.50ish. This timing for that decline would be 2010. If this occurs, it means the Central Planners will fail to keep interest rates low, fail to buy Bonds, fail to protect the American Household from dramatically rising interest rates at a time when economic recession/depression has its grip on our economy. It would mean the Central Planners de-cided to protect the Dollar at the expense of credit markets. It would be a catastrophic policy decision. The lesser of two evils would be to monetize the debt and devalue the Dollar. This would essen-tially cut the debt of America in half, including the debt of households, but should be accompanied by massive tax rebates to effectively set this sinking economic ship right.
Possible Bearish Head & Shoulders Top with A Downside Target of 82ish.
Left Shoulder Right Shoulder
Head

MCHUGH’S DAILY MARKET BRIEFING Friday, July 24th, 2009
Page 50
Summer Specials: 5 Months for $99 6 Months for $175, or 11 Months for $249, or, 12 Months for $325, or 14 Months for $259, or 18 Months for $359, or * 24 Months for $449 * Good through Sunday, July 26th, 2009 Simply go to www.technicalindicatorindex.com and click on the Subscribe Today or Renew Today buttons.
Conservative Balanced Portfolio Recent Transactions As of Friday July 24th, 2009 * On 6/18/09 we sold 100 shares of DIA, the ETF for the Dow Industrials, which we had purchased on 4/2/09 at $80.75 per share, for $85.93 per share. Also on June 18th, we sold 100 shares of SPY, the ETF for the S&P 500, which we had purchased on 4/2/09 at $ 84.50 per share, for $92.43 per share, in the Market Timing segment allocation of our conservative portfolio. The SPY trade generated a 9.38 percent profit in two and a half months. The DIA trade generated a 6.41 percent profit. These are annualized returns for the period held of 45 percent and 30.76 percent. Note: Our Conservative Portfolio Model substantially outperformed the S&P 500 in 2008. Check it out! Click on the Conservative Portfolio button at the left side of the home page. We posted an updated Balances/Market Value Portfolio as of December 31st , 2008, available in the Conserva-tive Portfolio section.
Key Economic Statistics 1 Week Avg. Date VIX U.S. $ Euro CRB Gold Silver Crude Oil M-3 7/10/09 29.02 80.24 139.33 233.51 912.2 12.64 59.66 Hidden 7/17/09 24.34 79.51 140.96 245.05 937.5 13.40 63.42 Hidden 7/24/09 23.09 78.75 142.01 251.91 953.1 13.87 68.11 HIdden Note: VIX and Dollar fall; Inflation assets rise.

MCHUGH’S DAILY MARKET BRIEFING Friday, July 24th, 2009
Page 51
Robert McHugh Ph.D. is President and CEO of Main Line Investors, Inc., a registered investment advisor in the Commonwealth of Pennsylvania, and can be reached at www.technicalindicatorindex.com. The statements, opinions, buy and sell signals, and analyses presented in this newsletter are provided as a general information and education service only. Opinions, estimates, buy and sell signals, and probabilities expressed herein constitute the judgment of the author as of the date indicated and are subject to change without notice. The information contained in the newsletter is expressed in good faith, but its accuracy is not guaranteed. Nothing contained in this newsletter is intended to be, nor shall it be construed as, investment ad-vice, nor is it to be relied upon in making any investment or other deci-sion. Prior to making any investment decision, you are advised to consult with your broker, investment advisor or other appropriate tax or financial professional to determine the suitability of any investment. Neither Main Line Investors, Inc. nor Robert D. McHugh, Jr., Ph.D. Editor shall be re-sponsible or have any liability for investment decisions based upon, or the results obtained from, the information provided. Copyright 2009, Main Line Investors, Inc. All Rights Reserved. “Jesus said to them, “I am the bread of life; he who comes to Me shall not hunger, and he who believes in Me shall never thirst. For I have come down from heaven, For this is the will of My Father, that everyone who beholds the Son and believes in Him, may have eternal life; and I Myself will raise him up on the last day.” John 6: 35, 38, 40 If you are enjoying your subscription, please tell a friend. Let them know about our free — one time — 30 day trial subscription.
Here are the symbols for Exchange Traded Funds for the Major Indices: DIA Dow Industrials IYT Trannies SPY S&P 500 GDX HUI Amex Gold Bugs* QQQQ NASDAQ 100 GLD Gold IWM Russell 2000 SLV Silver EWA Australia * Note: The GDX actually tracks the GDM, a grouping of 45 mining stocks, but the GDX has very high correlation to the HUI so we mention that as a suitable ETF for the HUI.