Embed Size (px)
Citation preview

1 ATLANTIC QUAY, ROBERTSON STREET, GLASGOW, G2 8SP, SC189125
SP DISTRIBUTION PLC FEBRUARY 2015 – V1
SP DISTRIBUTION PLC
Use of System Charging Statement
FINAL NOTICE
Effective from 1st April 2015
Version 1.0
This statement is in a form approved by the Gas and Electricity Markets Authority.

1 ATLANTIC QUAY, ROBERTSON STREET, GLASGOW, G2 8SP, SC189125
SP DISTRIBUTION PLC FEBRUARY 2015 – V1
Version Control
Version Date Description of version and any changes made
A change-marked version of this statement can be provided upon request.

PAGE 3 OF 52 SP DISTRIBUTION PLC FEBRUARY 2015 – V1
Contents
1. Introduction 5
Validity period 6 Contact details 6
2. Charge application and definitions 8
Supercustomer billing and payment 8 Supercustomer charges 8 Site-specific billing and payment 10 Site-specific billed charges 10 Time periods for half-hourly metered properties 11 Time periods for pseudo half-hourly unmetered properties 11 Application of capacity charges 12 Chargeable capacity 12 Exceeded capacity 12 Demand exceeded capacity 12 Generation exceeded capacity 13 Standby capacity for additional security on site 13 Minimum capacity levels 14 Application of charges for excess reactive power 14 Demand chargeable reactive power 14 Generation chargeable reactive power 15 Incorrectly allocated charges 15 Generation charges for pre-2005 Designated EHV Properties 17 Provision of billing data 17 Out of area use of system charges 18 Licensed distribution network operator charges 18 Licence exempt distribution networks 18 Full settlement metering 19 Difference metering 19
3. Schedule of charges for use of the distribution system 21
4. Schedule of line loss factors 22
Role of line loss factors in the supply of electricity 22 Calculation of line loss factors 22 Line loss factor time periods 23 Line loss factor tables 23
5. Notes for Designated EHV Properties 24
EDCM network group costs 24 Charges for new Designated EHV Properties 24 Charges for amended Designated EHV Properties 24 Demand-side management 25
6. Electricity distribution rebates 26
7. Accounting and administration services 26
8. Charges for electrical plant provided ancillary to the grant of use of system 26
Appendix 1 - Glossary 27
Appendix 2 - Guidance notes 33
Background 33 Meter point administration 33 Your charges 35 Reducing your charges 35 Reactive power and reactive power charges 36

PAGE 4 OF 52 SP DISTRIBUTION PLC FEBRUARY 2015 – V1
Site-specific EDCM charges 37 Annex 1 - Schedule of charges for use of the distribution system by LV and HV Designated Properties 39
Annex 2 - Schedule of charges for use of the distribution system by Designated EHV Properties (including LDNOs with Designated EHV Properties/end-users) 40
Annex 3 - Schedule of charges for use of the distribution system by preserved/additional LLF classes 44
Annex 4 - Charges applied to LDNOs with LV and HV end-users 45
Annex 5 - Schedule of line loss factors 49
Annex 6 - Addendum to charging statement detailing charges for new Designated EHV Properties 53

PAGE 5 OF 52 SP DISTRIBUTION PLC FEBRUARY 2015 – V1
1. Introduction
1.1. This statement tells you about our charges and the reasons behind them. It has
been prepared consistent with Standard Licence Condition 14 of our Electricity
Distribution Licence. The main purpose of this statement is to provide our
schedule of charges1 for the use of our Distribution System and to provide the
schedule of adjustment factors2 that should be applied in Settlement to account
for losses from the Distribution System. We have also included guidance notes
in Appendix 2 to help improve your understanding of the charges we apply.
1.2. Within this statement we use terms such as ‘Users’ and ‘Customers’ as well as
other terms which are identified with initial capitalisation. These terms are
defined in the glossary.
1.3. The charges in this statement are calculated using the Common Distribution
Charging Methodology (CDCM) for Low Voltage and High Voltage (LV and HV)
Designated Properties and the Extra-high Voltage (EHV) Distribution Charging
Methodology (EDCM) for Designated EHV Properties.
1.4. Separate charges are calculated depending on the characteristics of the
connection and whether the use of the Distribution System is for demand or
generation purposes. Where a generation connection is seen to support the
Distribution System the charges will be negative and the Supplier will receive
credits for exported energy.
1.5. The application of charges to premises can usually be referenced using the
Line Loss Factor Class (LLFC) contained in the charge tables. Further
information on how to identify and calculate the charge that will apply for your
premise is provided in the guidance notes in Appendix 2.
1.6. All charges in this statement are shown exclusive of VAT. Invoices will include
VAT at the applicable rate.
1.7. The annexes that form part of this statement are also available in spreadsheet
format. This spreadsheet contains supplementary information used for charging
purposes and a simple model to assist you to calculate charges. This
spreadsheet can be downloaded from
1 Charges can be positive or negative.
2 Also known as Loss Adjustment Factors or Line Loss Factors

PAGE 6 OF 52 SP DISTRIBUTION PLC FEBRUARY 2015 – V1
http://www.scottishpower.com/pages/connections_use_of_system_and_meterin
g_services.asp.
Validity period
1.8. This charging statement is valid for services provided from the effective date
stated on the front of the statement and remains valid until updated by a revised
version or superseded by a statement with a later effective date.
1.9. When using this charging statement care should be taken to ensure that the
statement or statements covering the period that is of interest are used.
1.10. Notice of any revision to the statement will be provided to Users of our
Distribution System. The latest statements can be downloaded from
http://www.scottishpower.com/pages/connections_use_of_system_and_meterin
g_services.asp.
Contact details
1.11. If you have any questions about this statement please contact us at this
address:
SP Energy Networks, Regulation and Commercial
Prenton Way
Birkenhead, Merseyside
CH43 3ET
Email: [email protected]
Telephone: 0141 614 5851
1.12. All enquiries regarding connection agreements and changes to maximum
capacities should be addressed to:
SP Energy Networks
Ochil House
10 Technology Avenue
Hamilton International Technology Park
Blantyre
G72 0HT
Email: [email protected]
Telephone: 0141 614 1605

PAGE 7 OF 52 SP DISTRIBUTION PLC FEBRUARY 2015 – V1
1.13. For all other queries please contact our general enquiries telephone number:
0330 10 10 4444.

PAGE 8 OF 52 SP DISTRIBUTION PLC FEBRUARY 2015 – V1
2. Charge application and definitions
2.1. The following section details how the charges in this statement are applied and
billed to Users of our Distribution System.
2.2. We utilise two billing approaches depending on the type of metering data
received. The ‘Supercustomer’ approach is used for Non-Half-Hourly (NHH)
metered, NHH unmetered or aggregated Half-Hourly (HH) metered premises
and the ‘Site-specific’ approach is used for HH metered or pseudo HH
unmetered premises.
2.3. Typically NHH metered are domestic and small businesses, HH metered are
larger businesses and unmetered premises are normally streetlights.
Supercustomer billing and payment
2.4. Supercustomer billing and payment applies to metering points registered as
NHH metered, NHH unmetered or aggregated HH metered. The
Supercustomer approach makes use of aggregated data obtained from
Suppliers using the ‘Non Half Hourly Distribution Use of System (DUoS) Report’
data flow.
2.5. Invoices are calculated on a periodic basis and sent to each User for whom we
transport electricity through our distribution system. Invoices are reconciled,
over a period of approximately 14 months to reflect later and more accurate
consumption figures.
2.6. The charges are applied on the basis of the LLFC assigned to a Meter Point
Administration Number (MPAN), and the units consumed within the time
periods specified in this statement. These time periods may not necessarily be
the same as those indicated by the Time Pattern Regimes (TPRs) assigned to
the Standard Settlement Configuration (SSC). All LLFCs are assigned at our
sole discretion.
Supercustomer charges
2.7. Supercustomer charges include the following components:
a fixed charge - pence/MPAN/day; there will be only one fixed charge
applied to each MPAN; and
unit charges, pence/kWh; more than one unit charge may apply depending
on the type of tariff for which the MPAN is registered.

PAGE 9 OF 52 SP DISTRIBUTION PLC FEBRUARY 2015 – V1
2.8. Users who supply electricity to a Customer whose metering system is:
Measurement Class A or B, and settled on Profile Classes (PC) 1 through to
8;
or
Measurement Class F or G;
will be allocated the relevant charge structure set out in Annex 1.
2.9. Measurement Class A charges apply to Exit/Entry Points where NHH metering
is used for Settlement.
2.10. Measurement Class B charges apply to Exit Points deemed to be suitable as
Unmetered Supplies as permitted in the Electricity (Unmetered Supply)
Regulations 20013 and where operated in accordance with Balancing and
Settlement Code (BSC) procedure 5204.
2.11. Measurement Class F and G charges apply to Exit/Entry Points where HH
aggregated metering data is used for Settlement.
2.12. Identification of the appropriate charge can be made by cross-reference to the
LLFC.
2.13. Valid Settlement PC/SSC/ Meter Timeswitch Code (MTC) combinations for
LLFCs where the Metering System is Measurement Class A and B are detailed
in Market Domain Data (MDD).
2.14. Where an MPAN has an invalid Settlement combination, the ‘Domestic
Unrestricted’ fixed and unit charges will be applied as default until the invalid
combination is corrected. Where there are multiple SSC/TPR combinations,
the default ‘Domestic Unrestricted’ fixed and unit charges will be applied for
each invalid TPR combination.
2.15. The time periods for unit charges where the Metering System is Measurement
Class A and B are as specified by the SSC. To determine the appropriate
charge rate for each SSC/TPR a lookup table is provided in the spread sheet
that accompanies this statement5.
3 The Electricity (Unmetered Supply) Regulations 2001 available from http://www.legislation.gov.uk/uksi/2001/3263/made
4 Balancing and Settlement Code Procedures on unmetered supplies are available from
http://www.elexon.co.uk/pages/bscps.aspx 5 SPD - Schedule of charges and other tables – Dec 14.xlsx
PAGE 10 OF 52 SP DISTRIBUTION PLC FEBRUARY 2015 – V1
2.16. The time periods for unit charges where the Metering System is Measurement
Class F and G are set out in the table ‘Time Bands for Half Hourly Metered
Properties’ in Annex 1.
2.17. The ‘Domestic Off-Peak’ and ‘Small Non-Domestic Off-Peak’ charges are
additional to either an unrestricted or a two-rate charge.
Site-specific billing and payment
2.18. Site-specific billing and payment applies to Measurement Class C, D and E
metering points settled as HH metered. The site-specific billing and payment
approach to Use of System (UoS) billing makes use of HH metering data at
premise level received through Settlement.
2.19. Invoices are calculated on a periodic basis and sent to each User for whom we
transport electricity through our Distribution System. Where an account is
based on estimated data, the account shall be subject to any adjustment that
may be necessary following the receipt of actual data from the User.
2.20. The charges are applied on the basis of the LLFCs assigned to the MPAN (or
the Meter System Identifier (MSID) for Central Volume Allocation (CVA) sites),
and the units consumed within the time periods specified in this statement.
2.21. All LLFCs are assigned at our sole discretion. Where an incorrectly applied
LLFC is identified, we may at our sole discretion apply the correct LLFC and/or
charges.
Site-specific billed charges
2.22. Site-specific billed charges may include the following components:
a fixed charge pence/MPAN/day or pence/MSID/day;
a capacity charge, pence/kVA/day, for Maximum Import Capacity (MIC)
and/or Maximum Export Capacity (MEC);
an excess capacity charge, pence/kVA/day, if a site exceeds its MIC and/or
MEC;
unit charges, pence/kWh, more than one unit charge may be applied;
and
an excess reactive power charge, pence/kVArh, for each unit in excess of
the reactive charge threshold.

PAGE 11 OF 52 SP DISTRIBUTION PLC FEBRUARY 2015 – V1
2.23. Users who wish to supply electricity to customers whose metering system is
Measurement Class C, D or E or CVA will be allocated the relevant charge
structure dependent upon the voltage and location of the metering point.
2.24. Measurement Class C, E or CVA charges apply to Exit/Entry Points where HH
metering, or an equivalent meter, is used for Settlement purposes.
2.25. Measurement Class D charges apply to Exit points deemed to be suitable as
Unmetered Supplies as permitted in the Electricity (Unmetered Supply)
Regulations 20016 and where operated in accordance with BSC procedure
5207.
2.26. Fixed charges are generally levied on a pence per MPAN/ MSID basis.
2.27. LV and HV Designated Properties will be charged in accordance with the
CDCM and allocated the relevant charge structure set out in Annex 1.
2.28. Designated EHV Properties will be charged in accordance with the EDCM and
allocated the relevant charge structure set out in Annex 2.
2.29. Where LV and HV Designated Properties or Designated EHV Properties have
more than one point of connection (as identified in the Connection Agreement)
then separate charges will be applied to each point of connection.
Time periods for half-hourly metered properties
2.30. The time periods for the application of unit charges to LV and HV Designated
Properties that are HH metered are detailed in Annex 1. We have not issued a
notice to change the time bands.
2.31. The time periods for the application of unit charges to Designated EHV
Properties are detailed in Annex 2. We have not issued a notice to change the
time bands.
Time periods for pseudo half-hourly unmetered properties
2.32. The time periods for the application of unit charges to connections that are
pseudo HH metered are detailed in Annex 1. We have not issued a notice to
change the time bands.
6 The Electricity (Unmetered Supply) Regulations 2001 available from http://www.legislation.gov.uk/uksi/2001/3263/made
7 Balancing and Settlement Code Procedures on unmetered supplies and available from
http://www.elexon.co.uk/pages/bscps.aspx

PAGE 12 OF 52 SP DISTRIBUTION PLC FEBRUARY 2015 – V1
Application of capacity charges
2.33. The following sections explain the application of capacity charges and
exceeded capacity charges.
Chargeable capacity
2.34. The chargeable capacity is, for each billing period, the MIC/MEC, as detailed
below.
2.35. The MIC/MEC will be agreed with us at the time of connection or pursuant to a
later change in requirements. Following such an agreement (be it at the time of
connection or later) no reduction in MIC/MEC will be allowed for a period of one
year.
2.36. Reductions to the MIC/MEC may only be permitted once in a 12 month period.
Where MIC/MEC is reduced the new lower level will be agreed with reference
to the level of the customer’s maximum demand. The new MIC/MEC will be
applied from the start of the next billing period after the date that the request
was received. It should be noted that, where a new lower level is agreed, the
original capacity may not be available in the future without the need for network
reinforcement and associated charges.
2.37. In the absence of an agreement, the chargeable capacity, save for error or
omission, will be based on the last MIC and/or MEC previously agreed by the
distributor for the relevant premise’s connection. A customer can seek to agree
or vary the MIC and/or MEC by contacting us using the contact details in
section 1.
Exceeded capacity
2.38. Where a customer takes additional unauthorised capacity over and above the
MIC/MEC, the excess will be classed as exceeded capacity. The exceeded
portion of the capacity will be charged at the excess capacity charge p/kVA/day
rate, based on the difference between the MIC/MEC and the actual capacity
used. This will be charged for the full duration of the month in which the breach
occurs.
Demand exceeded capacity
),),max(max(2 capacity exceeded Demand 2 02 MICRERIAI
Where:

PAGE 13 OF 52 SP DISTRIBUTION PLC FEBRUARY 2015 – V1
AI = Active Import (kWh)
RI = Reactive import (kVArh)
RE = Reactive export (kVArh)
MIC = Maximum import capacity (kVA)
2.39. Only reactive import and reactive export values occurring at times of active
import are used in the calculation. For sites which are importing and exporting
in the same HH, i.e. where active import is not equal to zero and active export
is not equal to zero, use zero for reactive import and reactive export when
calculating capacity taken.
2.40. This calculation is completed for every half hour and the maximum value from
the billing period is applied.
Generation exceeded capacity
),),max(max(2 capacity exceeded Generation 02 MECRERIAE 2
Where:
AE = Active Export (kWh)
RI = Reactive import (kVArh)
RE = Reactive export (kVArh)
MEC = Maximum export capacity (kVA)
2.41. Only reactive import and reactive export values occurring at times of active
export are used in the calculation. For sites which are importing and exporting
in the same HH, i.e. where active import is not equal to zero and active export
is not equal to zero, use zero for reactive import and reactive export when
calculating capacity taken.
2.42. This calculation is completed for every half hour and the maximum value from
the billing period is applied.
Standby capacity for additional security on site
2.43. Where standby capacity charges are applied, the charge will be set at the same
rate as that applied to normal MIC. Where, at the customer’s request, for
additional security of supplies requiring sterilisation of capacity at two different

PAGE 14 OF 52 SP DISTRIBUTION PLC FEBRUARY 2015 – V1
sources of supply, we reserve the right to charge for the capacity held at each
source.
Minimum capacity levels
2.44. There is no minimum capacity threshold.
Application of charges for excess reactive power
2.45. When an individual HH metered MPAN’s reactive power (measured in kVArh) at
LV and HV Designated Properties exceeds 33% of total active power
(measured in kWh), excess reactive power charges will apply. This threshold is
equivalent to an average power factor of 0.95 during the period. Any reactive
units in excess of the 33% threshold are charged at the rate appropriate to the
particular charge.
2.46. Power Factor is calculated as follows:
Cos θ = Power Factor
2.47. The chargeable reactive power is calculated as follows:
Demand chargeable reactive power
,01
0.95
1maxmax kVArh chargeable Demand
2AIRI,RE
Where:
AI = Active import (kWh)
RI = Reactive import (kVArh)
RE = Reactive export (kVArh)
2.48. Only reactive import and reactive export values occurring at times of active
import are used in the calculation. For sites which are importing and exporting
in the same HH i.e. where active import is not equal to zero and active export is
kWh
kVArh
θ

PAGE 15 OF 52 SP DISTRIBUTION PLC FEBRUARY 2015 – V1
not equal to zero, no calculation for that HH is made and the result for that HH
would be zero.
2.49. The square root calculation will be to two decimal places.
2.50. This calculation is completed for every half hour and the values summated over
the billing period.
Generation chargeable reactive power
,01
20.95
1maxmax kVArh chargeable Generation AERI,RE
Where:
AE = Active Export (kWh)
RI = Reactive Import (kVArh)
RE = Reactive Export (kVArh)
2.51. Only reactive import and reactive export values occurring at times of active
export are used in the calculation. For sites which are importing and exporting
in the same HH i.e. where active import is not equal to zero and active export is
not equal to zero, no calculation for that HH is made and the result for that HH
would be zero.
2.52. The square root calculation will be to two decimal places.
2.53. This calculation is completed for every half hour and the values summated over
the billing period.
Incorrectly allocated charges
2.54. It is our responsibility to apply the correct charges to each MPAN/MSID. The
allocation of charges is based on the voltage of connection and metering
information. We are responsible for deciding the voltage of connection while
the Supplier determines and provides the metering information.
2.55. Generally, the voltage of connection is determined by where the metering is
located and where responsibility for the electrical equipment transfers from us
to the connected customer. This is normally established when the MPAN/MSID
is created and will include information about whether the MPAN/MSID is for
import or export purposes. Where an MPAN/MSID is used for export purposes
the type of generation (intermittent or non-intermittent) will also be determined.

PAGE 16 OF 52 SP DISTRIBUTION PLC FEBRUARY 2015 – V1
2.56. The Supplier provides us with metering information which enables us to allocate
charges where there is more than one charge per voltage level. This metering
data is likely to change over time if, for example, a Supplier changes from a two
rate meter to a single rate meter. When this happens we will change the
allocation of charges accordingly.
2.57. Where it has been identified that a charge is likely to be incorrectly allocated
due to the wrong voltage of connection (or import/export details) then a
correction request must be made to us. Requests from persons other than the
current Supplier must be accompanied by a Letter of Authority from the
Customer; the existing Supplier must also be informed. Any request must be
supported by an explanation of why it is believed that the current charge is
wrongly applied along with supporting information, including, where appropriate
photographs of metering positions or system diagrams. Any request to correct
the current charge that also includes a request to backdate the correction must
include justification as to why it is considered appropriate to backdate the
change.
2.58. If it has been identified that a charge has been incorrectly allocated due to the
metering data then a correction request should be made to the Supplier.
2.59. Where we agree that an MPAN/MSID has been assigned to the wrong voltage
level then we will correct it by allocating the correct set of charges for that
voltage level. Any adjustment for incorrectly applied charges will be as follows:
Any credit or additional charge will be issued to the Supplier/s who were
effective during the period of the change.
The correction will be applied from the date of the request, back to the date
of the incorrect allocation or, up to the maximum period specified by the
Prescription and Limitation (Scotland) Act 1973, which covers a five year
period, whichever is the shorter.
2.60. Should we reject the request a justification will be provided to the requesting
Party.
2.61. We shall not unreasonably withhold or delay any agreement to correct the
charges applied and would expect to reach agreement within three months from
the date of request.

PAGE 17 OF 52 SP DISTRIBUTION PLC FEBRUARY 2015 – V1
Generation charges for pre-2005 designated EHV properties
2.62. Designated EHV Properties that were connected to the distribution system
under a pre-2005 connection charging policy are eligible for exemption from
UoS charges for generation unless one of the following criteria has been met:
25 years have passed since their first energisation/connection date (i.e.
Designated EHV Properties with connection agreements dated prior to 1st
April 2005, and for which 25 years has passed since their first
energisation/connection date will receive use of system charges for
generation from the next charging year following the expiry of their 25 years
exemption, (starting 1st April), or
the person responsible for the Designated EHV Property has provided
notice to us that they wish to opt in to UoS charges for generation.
If a notice to opt in has been provided there will be no further opportunity to opt
out.
2.63. Furthermore, if an exempt customer makes an alteration to its export
requirement then the customer may be eligible to be charged for the additional
capacity required or energy imported or exported. For example, where a
generator increases its export capacity the incremental increase in export
capacity will attract UoS charges as with other non-exempt generators.
Provision of billing data
2.64. Where HH metering data is required for UoS charging and this is not provided
in accordance with the BSC or the Distribution Connection and Use of System
Agreement (DCUSA), such metering data shall be provided to us by the User of
the system in respect of each calendar month within five working days of the
end of that calendar month.
2.65. The metering data shall identify the amount consumed and/or produced in each
half hour of each day and shall separately identify active and reactive import
and export. Metering data provided to us shall be consistent with that received
through the metering equipment installed.
2.66. Metering data shall be provided in an electronic format specified by us from
time to time and, in the absence of such specification, metering data shall be
provided in a comma-separated text file in the format of Master Registration

PAGE 18 OF 52 SP DISTRIBUTION PLC FEBRUARY 2015 – V1
Agreement (MRA) data flow D0036 (as agreed with us). The data shall be
emailed to [email protected].
2.67. We require details of reactive power imported or exported to be provided for all
Measurement Class C and E sites. It is also required for CVA sites and Exempt
Distribution Network boundaries with difference metering. We reserve the right
to levy a charge on Users who fail to provide such reactive data. In order to
estimate missing reactive data, a power factor of 0.95 lag will be applied to the
active consumption in any half hour.
Out of area use of system charges
2.68. We do not operate networks outside our Distribution Service Area.
Licensed distribution network operator charges
2.69. Licenced Distribution Network Operator (LDNO) charges are applied to LDNOs
who operate Embedded Networks within our Distribution Service Area.
2.70. The charge structure for LV and HV Designated Properties embedded in
networks operated by LDNOs will mirror the structure of the ‘all-the-way’ charge
and is dependent upon the voltage of connection of each embedded network to
the host DNO’s network. The same charge elements will apply as those that
match the LDNO’s end customer charges. The relevant charge structures are
set out in Annex 4.
2.71. Where an MPAN has an invalid Settlement combination, the ‘LDNO LV:
Domestic Unrestricted’ fixed and unit charges will be applied as default until the
invalid combination is corrected. Where there are multiple SSC/TPR
combinations, the default ‘LDNO LV: Domestic Unrestricted’ fixed and unit
charges will be applied for each invalid TPR combination.
2.72. The charge structure for Designated EHV Properties embedded in networks
operated by LDNOs will be calculated individually using the EDCM. The
relevant charge structures are set out in Annex 2.
2.73. For Nested Networks the relevant charging principles set out in DCUSA
Schedule 21 will apply.
Licence exempt distribution networks
2.74. The Electricity and Gas (Internal Market) Regulations 2011 introduced new
obligations on owners of licence exempt distribution networks (sometimes

PAGE 19 OF 52 SP DISTRIBUTION PLC FEBRUARY 2015 – V1
called private networks) including a duty to facilitate access to electricity and
gas suppliers for customers within those networks.
2.75. When customers (both domestic and commercial) are located within an exempt
distribution network and require the ability to choose their own supplier this is
called ‘third party access’. These embedded customers will require an MPAN so
that they can have their electricity supplied by a Supplier of their choice.
2.76. Licence exempt distribution networks owners can provide third party access
using either full settlement metering or the difference metering approach.
Full settlement metering
2.77. This is where a licence exempt distribution network is set up so that each
embedded installation has an MPAN and Metering System and therefore all
customers purchase electricity from their chosen Supplier. In this case there are
no Settlement Metering Systems at the boundary between the licensed
Distribution System and the exempt distribution network.
2.78. In this approach our UoS charges will be applied to each MPAN.
Difference metering
2.79. This is where one or more, but not all, customers on a licence exempt
distribution network choose their own Supplier for electricity supply to their
premise. Under this approach the customers requiring third part access on the
exempt distribution network will have their own MPAN and must have a HH
Metering System.
2.80. Unless agreed otherwise, our UoS charges will be applied using gross
settlement.
Gross settlement
2.81. Where one of our MPANs (provide details of MPAN prefix relevant to DNO’s
licence) is embedded within a licence exempt distribution network connected to
our Distribution System, and difference metering is in place for Settlement
purposes and we receive gross measurement data for the boundary MPAN, we
will continue to charge the boundary MPAN Supplier for use of our Distribution
System. No charges will be levied by us directly to the Customer or Supplier of
the embedded MPAN(s) connected within the licence exempt distribution
network .
PAGE 20 OF 52 SP DISTRIBUTION PLC FEBRUARY 2015 – V1
2.82. We require that gross metered data for the boundary of the connection is
provided to us. Until a new industry data flow is introduced for the sending of
such gross data, gross metered data shall:
be provided in a text file in the format of the D0036 or D0275 MRA data
flow;
the text file shall be emailed to [email protected];
the title of the email should also contain the phrase “gross data for
difference metered private network”.
the text file and the title of the email shall contain the metering reference
specified by us in place of the Settlement MPAN, i.e. a dummy
alphanumeric reference to enable the relating of the gross metered data to
a given boundary MPAN;
the text filename shall be formed of the metering reference specified by us
followed by a hyphen and followed by a timestamp in the format
YYYYMMDDHHMMSS and followed by “.txt”; and
2.83. For the avoidance of doubt, the reduced difference metered measurement data
for the boundary connection that is to enter Settlement should continue to be
sent using the Settlement MPAN.

PAGE 21 OF 52 SP DISTRIBUTION PLC FEBRUARY 2015 – V1
3. Schedule of charges for use of the distribution system
3.1. Tables listing the charges for the distribution of electricity for UoS are published
in the annexes to this document.
3.2. These charges are also listed in a spreadsheet which is published with this
statement and can be downloaded from:
http://www.scottishpower.com/pages/connections_use_of_system_and_meterin
g_services.asp
3.3. Annex 1 contains charges applied to LV and HV Designated Properties.
3.4. Annex 2 contains the charges applied to our Designated EHV Properties and
charges applied to LDNOs for Designated EHV Properties connected within
their embedded Distribution System.
3.5. Annex 3 contains details of any preserved and additional charges that are valid
at this time. Preserved charges are mapped to an appropriate charge and are
closed to new customers.
3.6. Annex 4 contains the charges applied to LDNOs in respect of LV and HV
Designated Properties connected in their embedded Distribution System.

PAGE 22 OF 52 SP DISTRIBUTION PLC FEBRUARY 2015 – V1
4. Schedule of line loss factors
Role of line loss factors in the supply of electricity
4.1. Electricity entering or exiting our Distribution System is adjusted to take account
of energy that is lost8 as it is distributed through the network. This adjustment
does not affect distribution charges but is used in energy settlement to take
metered consumption to a notional grid supply point so that suppliers’
purchases take account for the energy lost on the Distribution System.
4.2. We are responsible for calculating the Line Loss Factors9 (LLFs) and providing
these to Elexon. Elexon is the company that manages the BSC. This code
covers the governance and rules for the balancing and settlement
arrangements.
4.3. Annex 5 provides the LLFs that are used to adjust the metering system
volumes to take account of losses on the distribution network.
Calculation of line loss factors
4.4. LLFs are calculated in accordance with BSC procedure 128 that determines the
principles with which we must comply when calculating LLFs.
4.5. LLFs are calculated using either a generic method or a site-specific method.
The generic method is used for sites connected at LV or HV and the site-
specific method is used for sites connected at EHV or where a request for site-
specific LLFs has been agreed. Generic LLFs will be applied as a default to all
new EHV sites until sufficient data is available for a site-specific calculation.
4.6. The definition of EHV used for LLF purposes differs from the definition used for
defining Designated EHV Properties that is used in the EDCM. The definition
used for LLF purposes can be found in our LLF methodology.
4.7. The Elexon website (http://www.elexon.co.uk/reference/technical-
operations/losses/) contains more information on LLFs. This page also has
links to BSC procedure 128 and to our LLF methodology.
8 Energy can be lost for technical and non-technical reasons and losses normally occur by heat dissipation through power
flowing in conductors and transformers. Losses can also reduce if a customer’s action reduces power flowing in the
distribution network. This might happen when a customer generates electricity and the produced energy is consumed
locally. 9 Also referred to as Loss Adjustment Factors.

PAGE 23 OF 52 SP DISTRIBUTION PLC FEBRUARY 2015 – V1
Line loss factor time periods
4.8. LLFs are calculated for a set number of time periods during the year and are
detailed in Annex 5.
Line loss factor tables
4.9. When using the LLF tables in Annex 5 reference should be made to the LLFC
allocated to the MPAN to find the appropriate LLF.
4.10. The Elexon portal website, https://www.elexonportal.co.uk, contains the LLFs in
standard industry data format (D0265). A user guide with details on registering
and using the portal can be downloaded from:
www.elexonportal.co.uk/Userguide

PAGE 24 OF 52 SP DISTRIBUTION PLC FEBRUARY 2015 – V1
5. Notes for Designated EHV Properties
EDCM network group costs
5.1. A table is provided in the accompanying spreadsheet which shows the
underlying FCP network group costs used to calculate the current EDCM
charges. This spreadsheet “SPD – Schedule of Charges and Other
Tables.xlsx” is available to download from our website.
5.2. These are illustrative of the modelled costs at the time that this statement was
published. A new connection will result in changes to current network
utilisations, which will then form the basis of future prices: the charge
determined in this statement will not necessarily be the charge in subsequent
years because of the interaction between new and existing network
connections and any other changes made to our Distribution System which may
affect charges.
Charges for new Designated EHV Properties
5.3. Charges for any new Designated EHV Properties calculated after publication of
the current statement will be published in an addendum to that statement as
and when necessary.
5.4. The form of the addendum is detailed in Annex 6 to this statement.
5.5. The addendum will be sent to relevant DCUSA parties and published as a
revised ‘Schedule of Charges and Other Tables’ spreadsheet on our website.
The addendum will include charge information that under enduring
circumstances would be found in Annex 2 and line loss factors that would
normally be found in Annex 5.
5.6. The new Designated EHV Properties charges will be added to Annex 2 in the
next full statement released.
Charges for amended Designated EHV Properties
5.7. Where an existing Designated EHV Property is modified and energised in the
charging year, we may revise the EDCM charges for the modified Designated
EHV Property. If revised charges are appropriate, an addendum will be sent to
relevant DCUSA parties and published as a revised ‘Schedule of Charges and
Other Tables' spreadsheet on our website. The modified Designated EHV
Property charges will be added to Annex 2 in the next full statement released.

PAGE 25 OF 52 SP DISTRIBUTION PLC FEBRUARY 2015 – V1
Demand-side management
5.1. For those premises where use of system is charged under the EDCM, some
customers may be able to benefit from entering into a Demand Side
Management ("DSM") Agreement with SP Distribution, whereby part or all of
your MIC will become interruptible by us for active network management
purposes other than normal planned outages.
5.2. The DSM Agreement will be based upon a contractual commitment by the
customer to materially reduce their MIC in certain time periods (determined by
SP Distribution) in return for reduced Use of System Charges. Where a DSM
Agreement is entered into, the applicable demand capacity costs will be based
on the MIC minus the capacity subject to interruption.
5.3. If you are interested in making part or all of your MIC interruptible as an integral
irrevocable feature of a new connection or modification to an existing
connection, you should in the first instance contact our Commercial team:
The Distribution Policy Team
Regulation & Commercial
SP Distribution Plc
Ochil House
10 Technology Avenue
Hamilton International Technology Park
Blantyne
G72 0HT
Email: [email protected]

PAGE 26 OF 52 SP DISTRIBUTION PLC FEBRUARY 2015 – V1
6. Electricity distribution rebates
6.1. We have neither given nor announced any DUoS rebates to Users in the 12
months preceding the date of publication of this revision of the statement.
7. Accounting and administration services
7.1. We reserve the right to impose payment default remedies. The remedies are as
set out in DCUSA where applicable or else as detailed in the following
paragraph.
7.2. If any invoices that are not subject to a valid dispute remain unpaid on the due
date, late payment interest (calculated at base rate plus 8%) and administration
charges may be imposed.
7.3. Our administration charges are detailed in the following table. These charges
are set at a level which is in line with the Late Payment of Commercial Debts
Act which can be viewed on:
http://www.legislation.gov.uk/uksi/2002/1674/regulation/2/made
Size of Unpaid Debt Late Payment Fee
Up to £999.99 £40.00
£1,000 to £9,999.99 £70.00
£10,000 or more £100.00
8. Charges for electrical plant provided ancillary to the grant of use of
system
8.1. None

PAGE 27 OF 52 SP DISTRIBUTION PLC FEBRUARY 2015 – V1
Appendix 1 - Glossary
1.1. The following definitions, which can extend to grammatical variations
and cognate expressions, are included to aid understanding:
Term Definition
All-the-way charge
A charge that is applicable to an end user rather than an LDNO. An end user in this context is a Supplier/User who has a registered MPAN or MSID and is using the Distribution System to transport energy on behalf of a Customer.
Balancing and Settlement Code (BSC)
The BSC contains the governance arrangements for electricity balancing and settlement in Great Britain. An overview document is available from
www.elexon.co.uk/ELEXON Documents/trading_arrangements.pdf.
Common Distribution Charging Methodology (CDCM)
The CDCM used for calculating charges to Designated Properties as required by standard licence condition 13A of the electricity distribution licence.
Central volume allocation (CVA)
As defined in the BSC.
Customer
A person to whom a User proposes to supply, or for the time being supplies, electricity through an exit point, or from who, a User or any relevant exempt supplier, is entitled to recover charges, compensation or an account of profits in respect of electricity supplied through an exit point;
Or
A person from whom a User purchases, or proposes to purchase, electricity, at an entry point (who may from time to time be supplied with electricity as a Customer of that User (or another electricity supplier) through an exit point).
Designated EHV Properties As defined in standard condition 13B of the electricity distribution licence.
Designated Properties As defined in standard condition 13A of the electricity distribution licence.

PAGE 28 OF 52 SP DISTRIBUTION PLC FEBRUARY 2015 – V1
Term Definition
Distributor IDs
These are unique IDs that can be used, with reference to the MPAN, to identify your LDNO. The charges for other network operators can be found on their website.
ID Name Operator
10 Eastern Power Networks
UK Power Networks
11 East Midlands Western Power Distribution
12 London Power Networks
UK Power Networks
13 Merseyside and North Wales
Scottish Power
14 Midlands Western Power Distribution
15 Northern Northern Powergrid
16 North Western Electricity North West
17 Scottish Hydro Electric
Scottish Hydro Electric Power Distribution plc
18 South Scotland Scottish Power
19 South Eastern Power Networks
UK Power Networks
20 Southern Electric Southern Electric Power Distribution plc
21 South Wales Western Power Distribution
22 South Western Western Power Distribution
23 Yorkshire Northern Powergrid
24 GTC Independent Power Networks
25 ESP Electricity ESP Electricity
26 Energetics Energetics Electricity Ltd
27 GTC The Electricity Network Company Ltd
29 Harlaxton Energy Networks
Harlaxton Energy Networks
Distribution Connection and Use of System Agreement (DCUSA)
The DCUSA is a multi-party contract between the licensed electricity distributors, suppliers, generators and Offshore Transmission Owners of Great Britain.
It is a requirement that all licensed electricity distributors and suppliers become parties to the DCUSA.
Distribution Network Operator (DNO)
An electricity distributor that operates one of the 14 distribution services areas and in whose electricity distribution licence the requirements of Section B of the standard conditions of that licence have effect.
Distribution Services Area The area specified by the Gas and Electricity Markets Authority within which each DNO must provide specified distribution services.

PAGE 29 OF 52 SP DISTRIBUTION PLC FEBRUARY 2015 – V1
Term Definition
Distribution System
The system consisting (wholly or mainly) of electric lines owned or operated by an authorised distributor that is used for the distribution of electricity from:
Grid Supply Points or generation sets or other entry points
to the points of delivery to:
Customers or Users or any transmission licensee in its capacity as operator of that licensee’s transmission system or the Great Britain (GB) transmission system and includes any remote transmission assets (owned by a transmission licensee within England and Wales)
that are operated by that authorised distributor and any electrical plant, electricity meters, and metering equipment owned or operated by it in connection with the distribution of electricity, but does not include any part of the GB transmission system.
EHV Distribution Charging Methodology (EDCM)
The EDCM used for calculating charges to Designated EHV Properties as required by standard licence condition 13B of the Electricity Distribution Licence.
Electricity Distribution Licence The Electricity Distribution Licence granted or treated as granted pursuant to section 6(1) of the Electricity Act 1989.
Electricity Distributor Any person who is authorised by an Electricity Distribution Licence to distribute electricity.
Embedded LDNO This refers to an LDNO operating a distribution network which is embedded within another distribution network.
Embedded Network An electricity Distribution System operated by an LDNO and embedded within another distribution network.
Entry Point
A boundary point at which electricity is exported onto a Distribution System from a connected installation or from another Distribution System, not forming part of the total system (boundary point and total system having the meaning given to those terms in the BSC).
Exit Point
A point of connection at which a supply of electricity may flow from the Distribution System to the customer’s installation or User’s installation or the Distribution System of another person.
Extra-High Voltage (EHV) Nominal voltages of 22kV and above.
Gas and Electricity Markets Authority (GEMA)
As established by the Utilities Act 2000.
Grid Supply Point (GSP) A metered connection between the National Grid Electricity Transmission system and the licensee’s distribution system at which electricity flows to or from the Distribution System.

PAGE 30 OF 52 SP DISTRIBUTION PLC FEBRUARY 2015 – V1
Term Definition
GSP group A distinct electrical system that is supplied from one or more GSPs for which total supply into the GSP group can be determined for each half hour.
High Voltage (HV) Nominal voltages of at least 1kV and less than 22kV.
Invalid Settlement Combination
A Settlement combination that is not recognised as a valid combination in market domain data - see https://www.elexonportal.co.uk/MDDVIEWER.
kVA Kilovolt amperes.
kVArh Kilovolt ampere reactive hour.
kW Kilowatt.
kWh Kilowatt hour (equivalent to one “unit” of electricity).
Licensed Distribution Network Operator (LDNO)
The holder of a licence in respect of distribution activities in Great Britain.
Line Loss Factor (LLF) The factor that is used in Settlement to adjust the metering system volumes to take account of losses on the Distribution System.
Line Loss Factor Class (LLFC) An identifier assigned to an SVA metering system which is used to assign the LLF and use of system charges.
Load Factor =𝑎𝑛𝑛𝑢𝑎𝑙 𝑐𝑜𝑛𝑠𝑢𝑚𝑝𝑡𝑖𝑜𝑛 (𝑘𝑊ℎ)
𝑚𝑎𝑥𝑖𝑚𝑢𝑚 𝑑𝑒𝑚𝑎𝑛𝑑 (𝑘𝑊) × ℎ𝑜𝑢𝑟𝑠 𝑖𝑛 𝑦𝑒𝑎𝑟
Low Voltage (LV) Nominal voltages below 1kV.
Market Domain Data (MDD) MDD is a central repository of reference data available to all Users involved in Settlement. It is essential to the operation of SVA trading arrangements.
Maximum Export Capacity (MEC)
The MEC of apparent power expressed in kVA that has been agreed can flow through the entry point to the Distribution System from the Customer’s installation as specified in the connection agreement.
Maximum Import Capacity (MIC)
The MIC of apparent power expressed in kVA that has been agreed can flow through the exit point from the Distribution System to the Customer’s installation as specified in the connection agreement.
PAGE 31 OF 52 SP DISTRIBUTION PLC FEBRUARY 2015 – V1
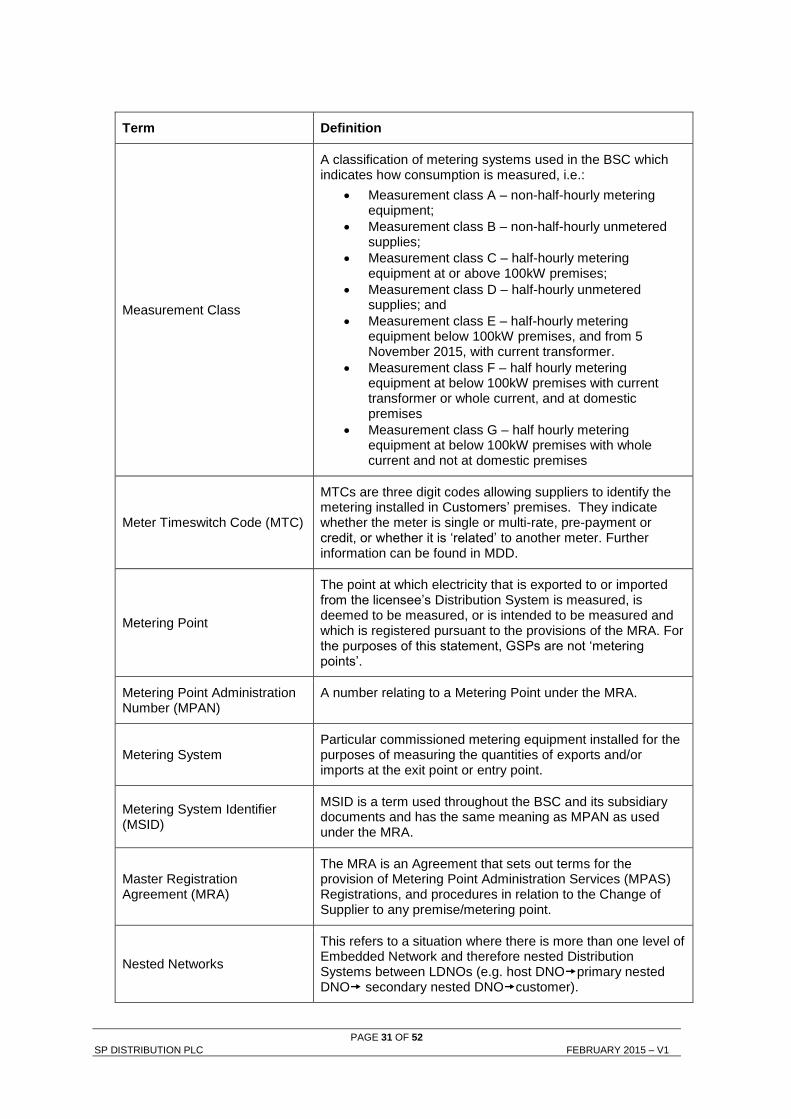
Term Definition
Measurement Class
A classification of metering systems used in the BSC which indicates how consumption is measured, i.e.:
Measurement class A – non-half-hourly metering equipment;
Measurement class B – non-half-hourly unmetered supplies;
Measurement class C – half-hourly metering equipment at or above 100kW premises;
Measurement class D – half-hourly unmetered supplies; and
Measurement class E – half-hourly metering equipment below 100kW premises, and from 5 November 2015, with current transformer.
Measurement class F – half hourly metering equipment at below 100kW premises with current transformer or whole current, and at domestic premises
Measurement class G – half hourly metering equipment at below 100kW premises with whole current and not at domestic premises
Meter Timeswitch Code (MTC)
MTCs are three digit codes allowing suppliers to identify the metering installed in Customers’ premises. They indicate whether the meter is single or multi-rate, pre-payment or credit, or whether it is ‘related’ to another meter. Further information can be found in MDD.
Metering Point
The point at which electricity that is exported to or imported from the licensee’s Distribution System is measured, is deemed to be measured, or is intended to be measured and which is registered pursuant to the provisions of the MRA. For the purposes of this statement, GSPs are not ‘metering points’.
Metering Point Administration Number (MPAN)
A number relating to a Metering Point under the MRA.
Metering System Particular commissioned metering equipment installed for the purposes of measuring the quantities of exports and/or imports at the exit point or entry point.
Metering System Identifier (MSID)
MSID is a term used throughout the BSC and its subsidiary documents and has the same meaning as MPAN as used under the MRA.
Master Registration Agreement (MRA)
The MRA is an Agreement that sets out terms for the provision of Metering Point Administration Services (MPAS) Registrations, and procedures in relation to the Change of Supplier to any premise/metering point.
Nested Networks
This refers to a situation where there is more than one level of Embedded Network and therefore nested Distribution Systems between LDNOs (e.g. host DNOprimary nested DNO secondary nested DNOcustomer).
PAGE 32 OF 52 SP DISTRIBUTION PLC FEBRUARY 2015 – V1
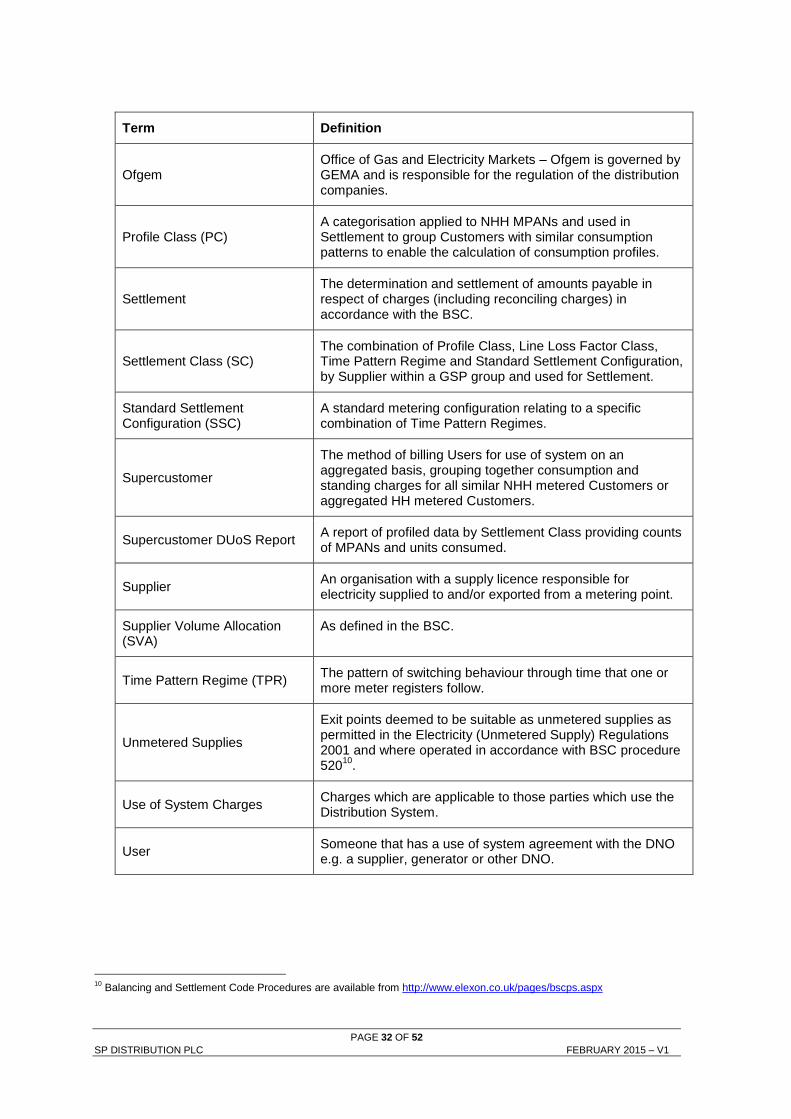
Term Definition
Ofgem Office of Gas and Electricity Markets – Ofgem is governed by GEMA and is responsible for the regulation of the distribution companies.
Profile Class (PC) A categorisation applied to NHH MPANs and used in Settlement to group Customers with similar consumption patterns to enable the calculation of consumption profiles.
Settlement The determination and settlement of amounts payable in respect of charges (including reconciling charges) in accordance with the BSC.
Settlement Class (SC) The combination of Profile Class, Line Loss Factor Class, Time Pattern Regime and Standard Settlement Configuration, by Supplier within a GSP group and used for Settlement.
Standard Settlement Configuration (SSC)
A standard metering configuration relating to a specific combination of Time Pattern Regimes.
Supercustomer
The method of billing Users for use of system on an aggregated basis, grouping together consumption and standing charges for all similar NHH metered Customers or aggregated HH metered Customers.
Supercustomer DUoS Report A report of profiled data by Settlement Class providing counts of MPANs and units consumed.
Supplier An organisation with a supply licence responsible for electricity supplied to and/or exported from a metering point.
Supplier Volume Allocation (SVA)
As defined in the BSC.
Time Pattern Regime (TPR) The pattern of switching behaviour through time that one or more meter registers follow.
Unmetered Supplies
Exit points deemed to be suitable as unmetered supplies as permitted in the Electricity (Unmetered Supply) Regulations 2001 and where operated in accordance with BSC procedure 520
10.
Use of System Charges Charges which are applicable to those parties which use the Distribution System.
User Someone that has a use of system agreement with the DNO e.g. a supplier, generator or other DNO.
10
Balancing and Settlement Code Procedures are available from http://www.elexon.co.uk/pages/bscps.aspx

PAGE 33 OF 52 SP DISTRIBUTION PLC FEBRUARY 2015 – V1
Appendix 2 - Guidance notes11
Background
1.1. The electricity bill from your Supplier contains an element of charge to cover
electricity distribution costs. This distribution charge covers the cost of
operating and maintaining a safe and reliable Distribution System that forms the
‘wires’ that transport electricity between the national transmission system and
end users such as homes and businesses. Our Distribution System includes
overhead lines, underground cables, as well as substations and transformers.
1.2. In most cases, your Supplier is invoiced for the distribution charge and this is
normally part of your total bill. In some cases, for example business users, the
supplier may pass through the distribution charge as an identifiable line item on
the electricity bill.
1.3. Where electricity is generated at a property your Supplier may receive a credit
for energy that is exported on to the Distribution System. These credits are
intended to reflect that the exported generation may reduce the need for
traditional demand led reinforcement of the Distribution System.
1.4. Understanding your distribution charges could help you reduce your costs and
increase your credits. This is achieved by understanding the components of the
charge to help you identify whether there may be opportunities to change the
way you use the Distribution System.
Meter point administration
1.5. We are responsible for managing the electricity supply points that are
connected to our Distribution System. Typically every supply point is identified
by a Meter Point Administration Number (MPAN). A few supply points may have
more than one MPAN depending on the metering configuration (e.g. a school
which may have an MPAN for the main supply and a MPAN for catering).
1.6. The full MPAN is a 21 digit number, preceded by an ‘S’. The MPAN applicable
to a supply point is found on the electricity bill from your Supplier. This number
enables you to establish who your electricity distributor is, details of the
characteristics of the supply and importantly the distribution charges that are
applicable to your premise.
11
These guidance notes are provided for additional information and do not form part of the application of charges.

PAGE 34 OF 52 SP DISTRIBUTION PLC FEBRUARY 2015 – V1
1.7. The 21-digit number is normally presented in two sections as shown in the
following diagram. The top section is supplementary data which gives
information about the characteristics of supply, while the bottom ‘core’ is the
unique identifier.
Full MPAN diagram
1.8. Generally, you will only need to know the Distributor ID and line loss factor
class (LLFC) to identify the distribution charges for your premise. However,
there are some premises where charges are specific to that site. In these
instances the charges are identified by the core MPAN. The Distributor ID for
SP Distribution is 18. Other Distributor IDs can be referenced in the glossary.
1.9. Additionally it can be useful to understand the profile class provided in the
supplementary data. The profile class will be a number between 00 and 08.
The following list provides details of the allocation of profile classes to types of
customers:
‘01’ – Domestic customers with unrestricted supply
‘02’ – Domestic customers with restricted load, for example off-peak heating
‘03’ – Non-domestic customers with unrestricted supply
‘04’ – Non-domestic customers with restricted load, for example off-peak heating
‘05’ – Non-domestic maximum demand customers with a Load Factor of less than 20%
‘06’ – Non-domestic maximum demand customers with a Load Factor between 20% and 30%
S
02 811 100
18 6186 7856 552
Profile class Meter time-switch code
Line loss factor class
Distributor ID Unique ID Check digit
Supplementary data
Core MPAN

PAGE 35 OF 52 SP DISTRIBUTION PLC FEBRUARY 2015 – V1
‘07’ – Non-domestic maximum demand customers with a Load Factor between 30% and 40%
‘08’ – Non-domestic maximum demand customers with a Load Factor over 40% or non-half-hourly metered generation customers
‘00’ – Half-hourly metered demand and generation customers
1.10. Unmetered Supplies will be allocated to profile class 01, 08 and 00 depending
on the type of load or the measurement method of the load.
1.11. The allocation of the profile class will affect your charges. If you feel that you
have been allocated the wrong profile class, please contact your Supplier as
they are responsible for this.
Your charges
1.12. All distribution charges that relate to our Distributor ID 18 are provided in this
statement.
1.13. You can identify your charges by referencing your line loss factor class, from
Annex 1. If the MPAN is for a Designated EHV Property then the charges will
be found in Annex 2. In a few instances, the charges maybe contained in
Annex 3. When identifying charges in Annex 2, please note that some line loss
factor classes have more than one charge. In this instance you will need to
select the correct charge by cross referencing with the core MPAN provided in
the table.
1.14. Once you have identified which charge structure applies to your MPAN then
you will be able to calculate an estimate of your distribution charge using the
calculator provided in the spreadsheet ‘Schedule of charges and other tables’
found in the sheet called ‘Charge Calculator’. This spreadsheet can be
downloaded from:
http://www.scottishpower.com/pages/connections_use_of_system_and_meterin
g_services.asp
Reducing your charges
1.15. The most effective way to reduce your energy charges is to reduce your
consumption by switching off or using more energy efficient appliances.
However, there are also other potential opportunities to reduce your distribution
charges; for example, it may be beneficial to shift demand or generation to a
better time period where demand use is likely to be cheaper outside peak
PAGE 36 OF 52 SP DISTRIBUTION PLC FEBRUARY 2015 – V1
periods and generation credits more beneficial, although the ability to directly
benefit will be linked to the structure of your supply charges.
1.16. The calculator mentioned above provides the opportunity to establish a forecast
of the change in distribution charges that could be achieved if you are able to
change any of the consumption related inputs.
Reactive power and reactive power charges
1.17. Reactive power is a separately charged component of connections that are
half-hourly metered. Reactive power charges are generally avoidable if best
practice design of the properties’ electrical installation has been provided in
order to maintain a power factor between 0.95 and unity at the Metering Point.
1.18. Reactive Power (kVArh) is the difference between working power (active power
measured in kW) and total power consumed (apparent power measured in
kVA). Essentially it is a measure of how efficiently electrical power is
transported through an electrical installation or a Distribution System.
1.19. Power flowing with a power factor of unity results in the most efficient loading of
the Distribution System. Power flowing with a power factor of less than 0.95
results in much higher losses in the Distribution System, a need to potentially
provide higher capacity electrical equipment and consequently a higher bill for
you the consumer. A comparatively small improvement in power factor can
bring about a significant reduction in losses since losses are proportional to the
square of the current.
1.20. Different types of electrical equipment require some ‘reactive power’ in addition
to ‘active power’ in order to work effectively. Electric motors, transformers and
fluorescent lighting, for example, may produce poor power factors due to the
nature of their inductive load. However, if good design practice is applied then
the poor power factor of appliances can be corrected as near as possible to
source. Alternatively poor power factor can be corrected centrally near to the
meter.
1.21. There are many advantages that can be achieved by correcting poor power
factor. These include: reduced energy bills through lower reactive charges,
lower capacity charges and reduced power consumption and reduced voltage
drop in long cable runs.

PAGE 37 OF 52 SP DISTRIBUTION PLC FEBRUARY 2015 – V1
Site-specific EDCM charges
1.22. A site classified as a Designated EHV Property is subject to a locational based
charging methodology (referred to as EDCM) for higher voltage network users.
Distributors use two approved approaches: Long Run Incremental Cost Pricing
(LRIC) and Forward Cost Pricing (FCP) and we use the FCP. The EDCM will
apply to Customers connected at Extra High Voltage or connected at High
Voltage and metered at a high voltage substation.
1.23. EDCM charges are site-specific, reflecting the degree to which the local and
higher voltage networks have the capacity to serve more demand or generation
without the need to upgrade the electricity infrastructure. The charges also
reflect the networks specifically used to deliver the electricity to the site as well
as the usage at the site. Generators with non-intermittent output and deemed
to be providing beneficial support to our networks may qualify to receive
payment.
1.24. The charges under the EDCM comprise of the following individual components:
a) Fixed charge - This charge recovers operational costs associated with those
connection assets that are provided for the ‘sole’ use of the customer. The
value of these assets is used as a basis to derive the charge.
b) Capacity charge (pence/kVA/day) -This charge comprises the relevant FCP
component, the National Grid Electricity Transmission cost and other regulated
costs.
Capacity charges are levied on the MIC, MEC, or any exceeded capacity. You
may wish to review your MIC or MEC periodically to ensure it remains
appropriate for your needs as you may be paying for more capacity than you
require. If you wish to make changes contact us via the details in paragraph
1.12.
The FCP cost is locational and reflects our assessment of future network
reinforcement necessary at voltage of connection (local) and beyond at all
higher voltages (remote) relevant to the customer’s connection. This results in
the allocation of higher costs in more capacity congested parts of the network
reflecting the greater likelihood of future reinforcement in these areas, and the
allocation of lower costs in less congested parts of the network. The local FCP
cost is included in the capacity charge.

PAGE 38 OF 52 SP DISTRIBUTION PLC FEBRUARY 2015 – V1
Our regulated costs include direct and indirect operational costs and a residual
amount to ensure recovery of our regulated allowed revenue. The capacity
charge recovers these costs using the customer usage profile and the relevant
assets being used to transport electricity between the source substation and
customer’s Metering Point.
c) Super-red unit charge (pence/kWh) - This charge recovers the remote FCP
component. The charge is positive for import and negative for export which
means you can either reduce your charges by minimising consumption or
increasing export at those times. The charge is applied on consumption during
the Super-red time period as detailed in Annex 2.
1.25. Future charge rates may be affected by consumption during the Super-red
period. Therefore reducing consumption in the Super-red time period may be
beneficial.
1.26. Reactive Power -The EDCM does not include a separate charge component
for any reactive power flows (kVAr) for either demand or generation. However,
the EDCM charges do reflect the effect on the network of the customer’s power
factor, for example unit charges can increase if your site power factor is poor
(lower than 0.95). Improving your site’s power factor will also reduce the
maximum demand (kVA) for the same power consumed in kW thus providing
scope to reduce your agreed capacity requirements.

PAGE 39 OF 52 SP DISTRIBUTION PLC FEBRUARY 2015 – V1
Annex 1 - Schedule of charges for use of the distribution system by LV and HV Designated Properties
Time periods Red Time Band Green Time Band Black Time Band Yellow Time Band Green Time Band
Monday to Friday
(Including Bank Holidays)
All Year
16.30 - 19.3000.00 - 08.00
22.30 - 00.0008.00 - 22.30
00.00 - 08.00
22.30 - 00.00
Saturday and Sunday
All Year
00.00 - 16.00
20.00 - 00.0016.30 - 19.30
08.00 - 16.30
19.30 - 22.30
00.00 - 08.00
22.30 - 00.00
Notes 08.00 - 22.3000.00 - 08.00
22.30 - 00.00
16.00 - 20.0000:00-16:00
20:00-00:00
Open LLFCs PCs
Unit rate 1
p/kWh
(red/black)
Unit rate 2
p/kWh
(amber/yellow)
Unit rate 3
p/kWh
(green)
Fixed charge
p/MPAN/day
Capacity
charge
p/kVA/day
Reactive power
charge
p/kVArh
Excess capacity
charge
p/kVA/day
Closed LLFCs
Domestic Unrestricted100, 101, 110,
111, 160, 1611 2.517 4.99
Domestic Two Rate
114, 115, 118,
119, 120, 121,
162, 163
2 3.109 0.300 4.99
Domestic Off Peak (related MPAN)
112, 113, 116,
117, 132, 133,
136, 137, 164,
165, 166
2 0.239 130, 134, 135
Small Non Domestic Unrestricted 201, 204 3 2.197 6.39 200, 202, 203, 205
Small Non Domestic Two Rate 221, 224, 260 3&4 3.068 0.366 6.39 220, 222
Small Non Domestic Off Peak (related MPAN)225, 240, 241,
301, 3024 0.860
223, 242, 243,
244, 245, 246
LV Medium Non-Domestic 400, 402 5-8 1.937 0.256 29.84
LV Sub Medium Non-Domestic 404 5-8 1.436 0.175 0.00
LV Network Domestic 180 14.304 1.272 0.250 4.99
LV Network Non-Domestic Non-CT 280 13.386 1.166 0.224 6.39
LV HH Metered 500, 504 11.312 0.883 0.145 25.38 2.50 0.310 2.50
LV Sub HH Metered 506, 507 9.689 0.588 0.051 8.96 4.57 0.228 4.57
HV HH Metered 501, 505 7.725 0.416 0.018 135.62 5.00 0.164 5.00
NHH UMS category A 900 8 1.593 904, 908, 909
NHH UMS category B 901 1 2.086 905
NHH UMS category C 902 1 3.388 906
NHH UMS category D 903 1 1.211 907
LV UMS (Pseudo HH Metered) 910 24.485 1.220 0.620
LV Generation NHH or Aggregate HH781, 782, 783,
784, 7858&0 -0.778
LV Sub Generation NHH 602 8 -0.684
LV Generation Intermittent 603, 608 -0.778 0.175
LV Generation Non-Intermittent 604, 607 -5.225 -0.598 -0.149 0.175
LV Sub Generation Intermittent 609 -0.684 0.155
LV Sub Generation Non-Intermittent 610 -4.722 -0.509 -0.121 0.155
HV Generation Intermittent 611, 612 -0.411 99.03 0.126
HV Generation Non-Intermittent 605, 606 -3.414 -0.232 -0.029 99.03 0.126
Saturday and Sunday
All year
All the above times are in UK Clock timeNotes
SP Distribution - Effective from 1 April 2015 - FINAL LV and HV charges
Amber Time Band
08.00 - 16.30
19.30 - 22.30
Monday to Friday
(Including Bank Holidays)
June to August Inclusive
Time Bands for Half Hourly Unmetered PropertiesTime Bands for Half Hourly Metered Properties
16.00 - 20.00
All the above times are in UK Clock time
Monday to Friday
(Including Bank Holidays)
November to February
Inclusive
Monday to Friday
(Including Bank Holidays)
March, April, May and
September, October

PAGE 40 OF 52 SP DISTRIBUTION PLC FEBRUARY 2015 – V1
Annex 2 - Schedule of charges for use of the distribution system by Designated EHV Properties (including LDNOs with Designated EHV Properties/end-users)
Import
Unique
Identifier
LLFCImport
MPANs/MSIDs
Export Unique
IdentifierLLFC
Export
MPANs/MSIDsName
Import
Super Red
unit rate
(p/kWh)
Import
fixed charge
(p/day)
Import
capacity rate
(p/kVA/day)
Import
exceeded
capacity rate
(p/kVA/day)
Export
Super Red
unit rate
(p/kWh)
Export
fixed charge
(p/day)
Export
capacity rate
(p/kVA/day)
Export
exceeded
capacity rate
(p/kVA/day)
801 801 1800060004220 MSID 8182 MSID 8182 MSID 8182 Minsca 426.92
802 802 1800060539962 683 683 1800060539971 Bankend Rig 136.87 3.95 3.95 4579.12 0.05 0.05
803 803 1800060532708 684 684 1800060532717 Barlockhart Moor 177.90 2.10 2.10 8317.96 0.05 0.05
804 804 1800060532726 685 685 1800060532735 Blantyre Muir 344.37 0.80 0.80 5426.66 0.05 0.05
805 805 1800060587850 693 693 1800060587869 Hunterston WF 98.77 0.83 0.83 7372.87 0.05 0.05
806 806 1800060532647 688 688 1800060532656 Middleton Farm 213.58 2.12 2.12 4852.31 0.05 0.05
807 807 1800060532665 689 689 1800060532674 Neilston Community 126.11 2.08 2.08 5952.95 0.05 0.05
808 808 1800053653870 681 681 1800053653880 Garlaff Landfill 109.58 0.79 0.79
809 809 1800054992968 629 629 1800054992977 Hagshaw Hill Extension 667.99 0.80 0.80 16869.17 0.05 0.05
811 811 1800060328035 671 671 1800060328044 Muirhall 317.64 2.31 2.31 7623.39 0.05 0.05
812 812 1800060372113 672 672 1800060372122 Burnfoot 106.76 0.79 0.79 7450.01 0.05 0.05
813 813 1800060532498 690 690 1800060532503 Westfield WF 56.46 2.03 2.03 6632.80 0.05 0.05
814 814 1800060532683 691 691 1800060532692 Barmoor WF 177.27 2.12 2.12 17726.87 0.05 0.05
815 815 1800060566984 692 692 1800060566993 Nutberry WF 754.31 2.03 2.03 14280.29 0.05 0.05
816 816 1800060652454 695 695 1800060652463 Carcreugh WF 292.40 0.90 0.90 5968.43 0.05 0.05
817 817 1800060567668 Magnox 344.28 1.29 1.29
818 818 1800060642767 700 700 1800060642776 West Browncastle WF 471.82 0.90 0.90 26708.93 0.05 0.05
819 819 1800060632661 699 699 1800060632670 Viridor (Waste energy) 1380.72 2.13 2.13 8272.79 0.05 0.05
820 820 1800060289486 620 620 1800060289510 Craigengelt 140.54 1.55 1.55 19197.14 0.05 0.05
821 821 1800054865132 621 621 1800054865141 Greenknowes 577.93 0.84 0.84 34675.96 0.05 0.05
822 822 1800060683754 703 703 1800060683763 Ewe Hill Dumfries WF 440.80 2.07 2.07 19886.37 0.05 0.05
823 823 1800060697223 704 704 1800060697232 Langhope Rig (D) WF 39.67 1.69 1.69 1300.95 0.05 0.05
824 824 1800060674253 705 705 1800060674262 Muirhall Extension WF 50.85 2.31 2.31 3030.15 0.05 0.05
825 825 1800060159192 625 625 1800060159208 Aikengall 1397.96 34536.97 0.05 0.05
826 826 1800053646251 626 626 1800053646260 Hagshaw Hill 40.32 2.10 2.10
827 827 1800053646190 627 627 1800053646206 Gallow Rig 140.59 2.04 2.04
828 828 1800053646172 628 628 1800053646181 Polwhat Rig 167.23 2.03 2.03
829 829 1800054738267 624 624 1800054738276 Greendykeside 49.41 2.09 2.09 3467.27 0.05 0.05
16:30 - 19:30
All the above times are in UK Clock time
Time periods
Monday to Friday
(Including Bank Holidays)
June to August Inclusive
Monday to Friday
(Including Bank Holidays)
November to February Inclusive
Notes
Time Periods for Designated EHV Properties
Super Red Time Band
SP Distribution - Effective from 1 April 2015 - FINAL EDCM charges

PAGE 41 OF 52 SP DISTRIBUTION PLC FEBRUARY 2015 – V1
830 830 1800053647237 630 630 1800053647246 Dun Law 35.05 2.11 2.11
831 831 1800053647194 631 631 1800053647200 EPR Scotland Ltd 280.19 3.10 3.10
832 832 1800053648027 632 632 1800053648036 Bowbeat (Emly Bank) 181.56 3.00 3.00
833 833 1800053648045 633 633 1800053648054 Bowbeat (Roughsidehill) 126.73 3.01 3.01
834 834 1800053647380 634 634 1800053647399 Harehill 126.29 2.05 2.05
835 835 1800053647618 635 635 1800053647627 Shanks & McEwan 3&4 118.41 2.04 2.04
836 836 1800053647636 636 636 1800053647645 Shanks & McEwan 5 27.79 2.02 2.02
837 837 1800053653843 637 637 1800053653852 Crystal Rig 648.07 0.79 0.79
838 838 1800053694167 638 638 1800053694440 Haupland Muir (Ardrossan) 7.33 0.87 0.87 198.36 0.05 0.05
839 839 1800053950949 639 639 1800053950958 Wetherhill 1141.54
840 840 1800053434271 640 640 1800053883993 Artfield WF 884.32
841 841 1800054152982 641 641 1800054152991 Wardlaw Wood 84.55 2.11 2.11
842 842 1800054198365 642 642 1800054198374 Earlsburn 1194.56
843 843 1800054244570 643 643 1800054244598 Blackhill 1684.12 21078.97 0.05 0.05
844 844 1800054451603 MSID 8183 MSID 8183 MSID 8183 Dalswinton 470.79 0.82 0.82
845 845 1800054498470 645 645 1800054498480 Steven's Croft Biomass 4590.32 0.80 0.80
850 850 1800060251872 650 650 1800060251881 Longpark 838.06 19070.96 0.05 0.05
851 851 1800035140431 BOC 6953.73 2.71 2.71
852 852 1800060642702 696 696 1800060642711 Calder Water WF 209.40 0.88 0.88 25531.14 0.05 0.05
853 853 1800035234188 Babcock Thorn 21627.03 3.40 3.40
854 854 1800035261359 654 654 1800053946507 Lafarge UK 12167.67 3.79 3.79
855 855 1800060241304 655 655 1800060241313 Pateshill 21.11 2.35 2.35 1182.43 0.05 0.05
856 856 1800035239460 Clydeport 28116.61 1.89 1.89
857 857 1800035313389 Freescale 9931.69 3.10 3.10
858 858 1800035327257 Tesco 878.60 5.98 5.98
859 859 1800035320127 697 697 1800060630637 GlaxoSmithKline 28762.89 2.17 2.17 2302.26 0.05 0.05
861 861 1800035324780 Weir Pumps 1584.84 3.22 3.22
862 862 1800035317453 Dupont (UK) Ltd 77591.98 2.70 2.70
863 863 1800060207438 663 663 1800060207447 North Rhins 275.41 2.05 2.05 8277.41 0.05 0.05
864 864 1800060709038 698 698 1800060709047 Tod Hills Windfarm 69.61 3.36 3.36 7648.03 0.05 0.05
866 866 1800051523646 Calachem 9168.78 10.04 10.04
867 867 1800035325436 Norbord 18537.98 1.94 1.94
873 873 1800060450481 673 673 1800060450490 Millour Hill 187.16 0.81 0.81 13853.93 0.05 0.05
874 874 1800060441380 674 674 1800060441399 Glenkerie 356.05 2.05 2.05 13792.83 0.05 0.05
875 875 1800060450524 675 675 1800060450533 Kelburn (A) 164.21 2.08 2.08 8203.21 0.05 0.05
876 876 1800060450542 676 676 1800060450551 Kelburn (B) 164.21 2.08 2.08 8203.21 0.05 0.05
877 877 1800060450506 677 677 1800060450515 Little Raith 180.24 0.83 0.83 4956.52 0.05 0.05
878 878 1800060445640 678 678 1800060445659 Drone Hill 498.19 0.85 0.85 24433.46 0.05 0.05
879 879 680 680 Andershaw WF 37.89 2.14 2.14 24487.63 0.05 0.05
880 880 1800060673222 701 701 1800060673231 Earlseat WF 147.39 2.84 2.84 11182.56 0.05 0.05
881 881 1800060740288 702 702 1800060740297 Dungavel WF 492.05 0.84 0.84 29424.76 0.05 0.05
882 882 687 687 Burnhead Bathgate WF 14.86 2.07 2.07 4016.97 0.05 0.05
883 883 1800053647742 636 636 1800053647751 Shanks & McEwan 6 80.37 2.02 2.02
884 884 1800060683693 679 679 1800060683709 Ardoch & Over Enoch WF 103.21 0.81 0.81 11255.45 0.05 0.05
886 886 686 686 Sneddon Law WF 452.64 0.82 0.82 27152.25 0.05 0.05
887 887 1800060749661 706 706 1800060749670 Polmadie (Waste Energy A) 1220.87 2.39 2.39 -0.364 4473.36 0.05 0.05

PAGE 42 OF 52 SP DISTRIBUTION PLC FEBRUARY 2015 – V1
868 868 664 664 MuirHall Extension II WF 49.20 2.04 2.04 4439.76 0.05 0.05
800 800 644 644 Rhodders 243.76 0.86 0.86 4993.71 0.05 0.05
888 888 707 707 Glenchamber 112.69 0.86 0.86 13457.05 0.05 0.05
869 869 709 709 Harehill Extension 222.67 2.06 2.06 7839.62 0.05 0.05
889 889 708 708 Penmansheill 199.08 0.94 0.94 33360.85 0.05 0.05
870 870 710 710 Assel Valley 1439.29 0.90 0.90 44639.87 0.05 0.05
871 871 665 665 Whiteside Hill 196.04 2.23 2.23 17402.87 0.05 0.05
872 872 1800060749680 694 694 1800060749699 Polmadie (Waste energy B) 217.30 2.29 2.29 -0.364 2223.08 0.05 0.05
MSID 8083 MSID 8083 MSID 8083 Dumbarton 3.41 3.41
MSID 8085 MSID 8085 MSID 8085 Stirling Road 1.69 1.69
MSID 8334 MSID 8334 MSID 8334 MSID 8334 MSID 8334 MSID 8334 Markinch 8463.78 0.79 0.79 15152.90 0.05 0.05
310 310 1800036579036 Magco 363.32 7.33 7.33
311 311 1800035324497 Stirling University 0.827 363.32 6.28 6.28
312 312 1800035324530 Glenochil Distillery 363.32 5.87 5.87
313 313 1800053648310 Longannet Power Station 363.32 16.14 16.14
314 314 1800035327674 Cameron Ironworks 0.846 363.32 4.27 4.27
315 315 1800035313398 Shin-Etsu 14233.15 3.72 3.72
316 316 1800035344100 United Biscuits 363.32 5.35 5.35
318 318 1800035337584 Balfours 363.32 2.20 2.20
319 319 1800035331634 NB Distillery 363.32 3.63 3.63
320 320 1800035340220 Finnart BP 15545.21 1.88 1.88
321 321 1800035346589 Texas Instruments 726.63 5.51 5.51
322 322 1800035346817 Glasgow Airport 363.32 9.34 9.34
323 323 1800035326848 BP Dalmeny 10824.65 1.76 1.76
324 324 1800035334227 Edinburgh Dock North 22360.88 2.95 2.95
326 326 1800053646215 755 755 1800053646224 Bonnington Power Station 3.27 6.06 6.06 -4.440 360.04 0.05 0.05
327 327 1800060613543 SGB Lurgie 4846.84 5.20 5.20
328 328 1800060586917 750 750 1800060586926 Cathkin Braes Wind Farm 323.74 1.49 1.49 5111.93 0.05 0.05
329 329 1800060397697 New Glasgow South Hospital 9510.09 2.52 2.52
330 330 1800060614714 752 752 1800060614741 Torrance WF 77.80 1.50 1.50 6640.15 0.05 0.05
331 331 1800060613543 754 754 1800060613552 Scottish Enterprise (Samsung WTTF) 1.503 135.71 2.08 2.08 5001.02 0.05 0.05
332 332 1800060709010 756 756 1800060709029 Torrance Windfarm Extension 118.01 1.50 1.50 6714.65 0.05 0.05

PAGE 43 OF 52 SP DISTRIBUTION PLC FEBRUARY 2015 – V1
Annex 3 - Schedule of charges for use of the distribution system by preserved/additional LLF classes
Closed LLFCs PCs Unit rate 1 p/kWh Unit rate 2 p/kWh Unit rate 3 p/kWhFixed charge
p/MPAN/day
Domestic Off Peak (related MPAN) 130, 134, 135 0.239
Small Non Domestic Unrestricted200, 202, 203,
2052.197 6.39
Small Non Domestic Two Rate 220, 222 3.068 0.366 6.39
Small Non Domestic Off Peak (related
MPAN)
223, 242, 243,
244, 245, 2460.860
HV Medium Non Domestic 401 1.175 0.051 317.68
SP Distribution - Effective from 1 April 2015 - FINAL LV and HV tariffs
NHH preserved charges/additional LLFCs
Unit time periods are as specified in the SSC.
SP Distribution uses a default tariff for invalid settlement combinations these will be charged at the Domestic Unrestricted Rates.
The Domestic and Non-Domestic Off Peak (related MPAN) tariffs are supplementary to a standard published tariff and therefore only available under these conditions.
Preserved tariffs are only available to existing supplies, subject to certain conditions:
a) Suppliers may not normally transfer a meter point from one preserved tariff to another preserved tariff;
b) If a supply under a preserved tariff should cease, other than on change of tenancy, the preserved tariff may not normally be restored;
c) Any additional load requried to be supplied on the preserved tariff must be within the existing supply capacity.
Notes:

PAGE 44 OF 52 SP DISTRIBUTION PLC FEBRUARY 2015 – V1
Annex 4 - Charges applied to LDNOs with LV and HV end-users
Time periods Red Time BandAmber Time
BandGreen Time Band Black Time Band Yellow Time Band Green Time Band
Monday to Friday
(Including Bank Holidays)
All Year
16.30 - 19.3008.00 - 16.30
19.30 - 22.30
00.00 - 08.00
22.30 - 00.0008.00 - 22.30
00.00 - 08.00
22.30 - 00.00
Saturday and Sunday
All Year16.00 - 20.00
00.00 - 16.00
20.00 - 00.0016.30 - 19.30
08.00 - 16.30
19.30 - 22.30
00.00 - 08.00
22.30 - 00.00
Notes 08.00 - 22.3000.00 - 08.00
22.30 - 00.00
16.00 - 20.0000:00-16:00
20:00-00:00
Unique billing
identifierPCs
Unit rate 1
p/kWh
(red/black)
Unit rate 2
p/kWh
(amber/yellow)
Unit rate 3
p/kWh
(green)
Fixed charge
p/MPAN/day
Capacity charge
p/kVA/day
Reactive power
charge
p/kVArh
Excess capacity
charge
p/kVA
LDNO LV: Domestic Unrestricted 1 1.641 3.25
LDNO LV: Domestic Two Rate 2 2.027 0.196 3.25
LDNO LV: Domestic Off Peak (related MPAN) 2 0.156
LDNO LV: Small Non Domestic Unrestricted 3 1.432 4.17
LDNO LV: Small Non Domestic Two Rate 4 2.000 0.239 4.17
LDNO LV: Small Non Domestic Off Peak (related
MPAN)4 0.561
LDNO LV: LV Medium Non-Domestic 5-8 1.263 0.167 19.45
LDNO LV: LV Network Domestic 9.324 0.829 0.163 3.25
LDNO LV: LV Network Non-Domestic Non-CT 8.726 0.760 0.146 4.17
LDNO LV: LV HH Metered 7.374 0.576 0.095 16.54 1.63 0.202 1.63
LDNO LV: NHH UMS category A 8 1.038
LDNO LV: NHH UMS category B 1 1.360
LDNO LV: NHH UMS category C 1 2.208
LDNO LV: NHH UMS category D 1 0.789
LDNO LV: LV UMS (Pseudo HH Metered) 15.960 0.795 0.404
LDNO LV: LV Generation NHH or Aggregate HH 8&0 -0.778
LDNO LV: LV Generation Intermittent -0.778 0.175
LDNO LV: LV Generation Non-Intermittent -5.225 -0.598 -0.149 0.175
LDNO HV: Domestic Unrestricted 1 0.847 1.68
LDNO HV: Domestic Two Rate 2 1.046 0.101 1.68
LDNO HV: Domestic Off Peak (related MPAN) 2 0.080
LDNO HV: Small Non Domestic Unrestricted 3 0.739 2.15
LDNO HV: Small Non Domestic Two Rate 4 1.032 0.123 2.15
LDNO HV: Small Non Domestic Off Peak (related
MPAN)4 0.289
LDNO HV: LV Medium Non-Domestic 5-8 0.652 0.086 10.04
LDNO HV: LV Network Domestic 4.813 0.428 0.084 1.68
LDNO HV: LV Network Non-Domestic Non-CT 4.504 0.392 0.075 2.15
LDNO HV: LV HH Metered 3.806 0.297 0.049 8.54 0.84 0.104 0.84
LDNO HV: LV Sub HH Metered 5.273 0.320 0.028 4.88 2.49 0.124 2.49
LDNO HV: HV HH Metered 4.809 0.259 0.011 84.42 3.11 0.102 3.11
LDNO HV: NHH UMS category A 8 0.536
LDNO HV: NHH UMS category B 1 0.702
LDNO HV: NHH UMS category C 1 1.140
LDNO HV: NHH UMS category D 1 0.407
LDNO HV: LV UMS (Pseudo HH Metered) 8.238 0.410 0.209
LDNO HV: LV Generation NHH or Aggregate HH 8&0 -0.778
LDNO HV: LV Sub Generation NHH 8 -0.684
LDNO HV: LV Generation Intermittent -0.778 0.175
LDNO HV: LV Generation Non-Intermittent -5.225 -0.598 -0.149 0.175
LDNO HV: LV Sub Generation Intermittent -0.684 0.155
LDNO HV: LV Sub Generation Non-Intermittent -4.722 -0.509 -0.121 0.155
LDNO HV: HV Generation Intermittent -0.411 0.126
LDNO HV: HV Generation Non-Intermittent -3.414 -0.232 -0.029 0.126
SP Distribution - Effective from 1 April 2015 - FINAL LDNO tariffs
Time Bands for Half Hourly Unmetered Properties
Monday to Friday
(Including Bank Holidays)
June to August Inclusive
Monday to Friday
(Including Bank Holidays)
November to February Inclusive
Monday to Friday
(Including Bank Holidays)
March to May, & September to
October, Inclusive
Saturday and Sunday
Notes All the above times are in UK Clock time
All the above times are in UK Clock time
Time Bands for Half Hourly Metered Properties

PAGE 45 OF 52 SP DISTRIBUTION PLC FEBRUARY 2015 – V1
LDNO HVplus: Domestic Unrestricted 1 0.605 1.20
LDNO HVplus: Domestic Two Rate 2 0.748 0.072 1.20
LDNO HVplus: Domestic Off Peak (related MPAN) 2 0.057
LDNO HVplus: Small Non Domestic Unrestricted 3 0.528 1.54
LDNO HVplus: Small Non Domestic Two Rate 4 0.738 0.088 1.54
LDNO HVplus: Small Non Domestic Off Peak (related MPAN) 4 0.207
LDNO HVplus: LV Medium Non-Domestic 5-8 0.466 0.062 7.18
LDNO HVplus: LV Sub Medium Non-Domestic 5-8 0.546 0.067 0.00
LDNO HVplus: HV Medium Non-Domestic 5-8 0.507 0.022 137.15
LDNO HVplus: LV Network Domestic 3.440 0.306 0.060 1.20
LDNO HVplus: LV Network Non-Domestic Non-CT 3.219 0.280 0.054 1.54
LDNO HVplus: LV HH Metered 2.720 0.212 0.035 6.10 0.60 0.075 0.60
LDNO HVplus: LV Sub HH Metered 3.686 0.224 0.019 3.41 1.74 0.087 1.74
LDNO HVplus: HV HH Metered 3.335 0.180 0.008 58.55 2.16 0.071 2.16
LDNO HVplus: NHH UMS category A 8 0.383
LDNO HVplus: NHH UMS category B 1 0.502
LDNO HVplus: NHH UMS category C 1 0.815
LDNO HVplus: NHH UMS category D 1 0.291
LDNO HVplus: LV UMS (Pseudo HH Metered) 5.888 0.293 0.149
LDNO HVplus: LV Generation NHH or Aggregate HH 8&0 -0.296 0.00
LDNO HVplus: LV Sub Generation NHH 8 -0.295 0.00
LDNO HVplus: LV Generation Intermittent -0.296 0.00 0.067
LDNO HVplus: LV Generation Non-Intermittent -1.988 -0.227 -0.057 0.00 0.067
LDNO HVplus: LV Sub Generation Intermittent -0.295 0.00 0.067
LDNO HVplus: LV Sub Generation Non-Intermittent -2.039 -0.220 -0.052 0.00 0.067
LDNO HVplus: HV Generation Intermittent -0.411 99.03 0.126
LDNO HVplus: HV Generation Non-Intermittent -3.414 -0.232 -0.029 99.03 0.126
LDNO EHV: Domestic Unrestricted 1 0.279 0.55
LDNO EHV: Domestic Two Rate 2 0.344 0.033 0.55
LDNO EHV: Domestic Off Peak (related MPAN) 2 0.026
LDNO EHV: Small Non Domestic Unrestricted 3 0.243 0.71
LDNO EHV: Small Non Domestic Two Rate 4 0.340 0.041 0.71
LDNO EHV: Small Non Domestic Off Peak (related MPAN) 4 0.095
LDNO EHV: LV Medium Non-Domestic 5-8 0.215 0.028 3.31
LDNO EHV: LV Sub Medium Non-Domestic 5-8 0.252 0.031 0.00
LDNO EHV: HV Medium Non-Domestic 5-8 0.234 0.010 63.18
LDNO EHV: LV Network Domestic 1.585 0.141 0.028 0.55
LDNO EHV: LV Network Non-Domestic Non-CT 1.483 0.129 0.025 0.71
LDNO EHV: LV HH Metered 1.253 0.098 0.016 2.81 0.28 0.034 0.28
LDNO EHV: LV Sub HH Metered 1.698 0.103 0.009 1.57 0.80 0.040 0.80
LDNO EHV: HV HH Metered 1.536 0.083 0.004 26.97 0.99 0.033 0.99
LDNO EHV: NHH UMS category A 8 0.176
LDNO EHV: NHH UMS category B 1 0.231
LDNO EHV: NHH UMS category C 1 0.375
LDNO EHV: NHH UMS category D 1 0.134
LDNO EHV: LV UMS (Pseudo HH Metered) 2.713 0.135 0.069
LDNO EHV: LV Generation NHH or Aggregate HH 8&0 -0.136 0.00
LDNO EHV: LV Sub Generation NHH 8 -0.136 0.00
LDNO EHV: LV Generation Intermittent -0.136 0.00 0.031
LDNO EHV: LV Generation Non-Intermittent -0.916 -0.105 -0.026 0.00 0.031
LDNO EHV: LV Sub Generation Intermittent -0.136 0.00 0.031
LDNO EHV: LV Sub Generation Non-Intermittent -0.939 -0.101 -0.024 0.00 0.031
LDNO EHV: HV Generation Intermittent -0.189 45.62 0.058
LDNO EHV: HV Generation Non-Intermittent -1.573 -0.107 -0.013 45.62 0.058
LDNO 132kV/EHV: Domestic Unrestricted 1
LDNO 132kV/EHV: Domestic Two Rate 2
LDNO 132kV/EHV: Domestic Off Peak (related MPAN) 2
LDNO 132kV/EHV: Small Non Domestic Unrestricted 3
LDNO 132kV/EHV: Small Non Domestic Two Rate 4
LDNO 132kV/EHV: Small Non Domestic Off Peak (related
MPAN)4
LDNO 132kV/EHV: LV Medium Non-Domestic 5-8
LDNO 132kV/EHV: LV Sub Medium Non-Domestic 5-8
LDNO 132kV/EHV: HV Medium Non-Domestic 5-8

PAGE 46 OF 52 SP DISTRIBUTION PLC FEBRUARY 2015 – V1
LDNO 132kV/EHV: LV Network Domestic
LDNO 132kV/EHV: LV Network Non-Domestic Non-CT
LDNO 132kV/EHV: LV HH Metered
LDNO 132kV/EHV: LV Sub HH Metered
LDNO 132kV/EHV: HV HH Metered
LDNO 132kV/EHV: NHH UMS category A 8
LDNO 132kV/EHV: NHH UMS category B 1
LDNO 132kV/EHV: NHH UMS category C 1
LDNO 132kV/EHV: NHH UMS category D 1
LDNO 132kV/EHV: LV UMS (Pseudo HH Metered)
LDNO 132kV/EHV: LV Generation NHH or Aggregate HH 8&0
LDNO 132kV/EHV: LV Sub Generation NHH 8
LDNO 132kV/EHV: LV Generation Intermittent
LDNO 132kV/EHV: LV Generation Non-Intermittent
LDNO 132kV/EHV: LV Sub Generation Intermittent
LDNO 132kV/EHV: LV Sub Generation Non-Intermittent
LDNO 132kV/EHV: HV Generation Intermittent
LDNO 132kV/EHV: HV Generation Non-Intermittent
LDNO 132kV: Domestic Unrestricted 1
LDNO 132kV: Domestic Two Rate 2
LDNO 132kV: Domestic Off Peak (related MPAN) 2
LDNO 132kV: Small Non Domestic Unrestricted 3
LDNO 132kV: Small Non Domestic Two Rate 4
LDNO 132kV: Small Non Domestic Off Peak (related MPAN) 4
LDNO 132kV: LV Medium Non-Domestic 5-8
LDNO 132kV: LV Sub Medium Non-Domestic 5-8
LDNO 132kV: HV Medium Non-Domestic 5-8
LDNO 132kV: LV Network Domestic
LDNO 132kV: LV Network Non-Domestic Non-CT
LDNO 132kV: LV HH Metered
LDNO 132kV: LV Sub HH Metered
LDNO 132kV: HV HH Metered
LDNO 132kV: NHH UMS category A 8
LDNO 132kV: NHH UMS category B 1
LDNO 132kV: NHH UMS category C 1
LDNO 132kV: NHH UMS category D 1
LDNO 132kV: LV UMS (Pseudo HH Metered)
LDNO 132kV: LV Generation NHH or Aggregate HH 8&0
LDNO 132kV: LV Sub Generation NHH 8
LDNO 132kV: LV Generation Intermittent
LDNO 132kV: LV Generation Non-Intermittent
LDNO 132kV: LV Sub Generation Intermittent
LDNO 132kV: LV Sub Generation Non-Intermittent
LDNO 132kV: HV Generation Intermittent
LDNO 132kV: HV Generation Non-Intermittent
LDNO 0000: Domestic Unrestricted 1
LDNO 0000: Domestic Two Rate 2
LDNO 0000: Domestic Off Peak (related MPAN) 2
LDNO 0000: Small Non Domestic Unrestricted 3
LDNO 0000: Small Non Domestic Two Rate 4
LDNO 0000: Small Non Domestic Off Peak (related MPAN) 4

PAGE 47 OF 52 SP DISTRIBUTION PLC FEBRUARY 2015 – V1
LDNO 0000: LV Medium Non-Domestic 5-8
LDNO 0000: LV Sub Medium Non-Domestic 5-8
LDNO 0000: HV Medium Non-Domestic 5-8
LDNO 0000: LV Network Domestic
LDNO 0000: LV Network Non-Domestic Non-CT
LDNO 0000: LV HH Metered
LDNO 0000: LV Sub HH Metered
LDNO 0000: HV HH Metered
LDNO 0000: NHH UMS category A 8
LDNO 0000: NHH UMS category B 1
LDNO 0000: NHH UMS category C 1
LDNO 0000: NHH UMS category D 1
LDNO 0000: LV UMS (Pseudo HH Metered)
LDNO 0000: LV Generation NHH or Aggregate HH 8&0
LDNO 0000: LV Sub Generation NHH 8
LDNO 0000: LV Generation Intermittent
LDNO 0000: LV Generation Non-Intermittent
LDNO 0000: LV Sub Generation Intermittent
LDNO 0000: LV Sub Generation Non-Intermittent
LDNO 0000: HV Generation Intermittent
LDNO 0000: HV Generation Non-Intermittent

PAGE 48 OF 52 SP DISTRIBUTION PLC FEBRUARY 2015 – V1
Annex 5 - Schedule of line loss factors
Period 1 Period 2 Period 3 Period 4
(Name 1) (Name 2) (Name 3) (Name 4)
Monday to Friday
March to October23:30 – 07:30 07:30 – 23:30
Monday to Friday
November to February23:30 – 07:30 20:00 – 23:30
07:30 – 16:00
19:00 – 20:00
16:00 – 19:00
Saturday and Sunday
All Year23:30 – 07:30 07:30 – 23:30
Notes
Metered voltage Period 1 Period 2 Period 3 Period 4 Associated LLFC
Low Voltage NHH 1.079 1.093 1.104 1.118
100,101,110,111,112,113,114,115,116,11
7,118,119,120,121,130,132,133,134,135,1
36,137,160,161,162,163,164,165,166,200,
201,202,203,204,205,220,221,222,223,22
4,225,240,241,242,243,244,245,246,260,4
00,402,404,602,781,782,783,784,785,900,
901,902,903,910
Low Voltage HH 1.078 1.092 1.104 1.118500,504,506,507,603,604,607,608,609,61
0
High Voltage Network 1.023 1.027 1.030 1.032 301,302,401,501,505,605,606,611,612
High Voltage Substation 1.013 1.012 1.013 1.013
310,311,312,313,314,315,316,317,318,31
9,320,321,322,323,324,325,326,327,328,3
29,330,331,332,333,334,335,336,337,338,
339,340,750,751,752,753,754,755,756,75
7,758,759,760,761,762,763,764,765,862,8
66,867
33kV Generic (demand) 1.003 1.004 1.005 1.005
33kV Generic (generation) 1.000 1.000 1.000 1.000
132kV Generic (demand)
132kV Generic (generation)
Site Period 1 Period 2 Period 3 Period 4 Associated LLFC
Minsca 1.000 1.001 1.001 1.002 801
Bankend Rig 1.006 1.010 1.012 1.014 802
Barlockhart Moor 1.000 1.000 1.000 1.002 803
Blantyre Muir 1.000 1.000 1.000 1.001 804
Hunterston WF 1.003 1.004 1.005 1.005 805
Middleton Farm 1.001 1.001 1.002 1.002 806
Neilston Community 1.001 1.002 1.002 1.003 807
Garlaff Landfill 0.999 1.000 1.001 1.019 808
Hagshaw Hill Extension 1.000 1.000 1.000 1.000 809
Muirhall 1.000 1.000 1.000 1.000 811
Burnfoot 1.000 1.000 1.000 1.000 812
Westfield WF 1.000 1.000 1.000 1.000 813
Barmoor WF 1.003 1.004 1.005 1.005 814
Nutberry WF 1.003 1.004 1.005 1.005 815
Carcreugh WF 1.003 1.004 1.005 1.005 816
Magnox 1.001 1.001 1.002 1.003 817
All the above times are in UK Clock time
SP Distribution - Effective from 1 April 2015 - FINAL LLF Time Periods
Time periods
Generic demand and generation LLFs
Metered voltage, respective periods and associated LLFCs
EHV site specific LLFs
Demand

PAGE 49 OF 52 SP DISTRIBUTION PLC FEBRUARY 2015 – V1
West Browncastle WF 1.003 1.004 1.005 1.005 818
Viridor (Waste energy) 1.003 1.004 1.005 1.005 819
Craigengelt 1.000 1.000 1.000 1.000 820
Greenknowes 1.000 1.000 1.000 1.000 821
Ewe Hill Dumfries WF 1.003 1.004 1.005 1.005 822
Langhope Rig (D) WF 1.003 1.004 1.005 1.005 823
Muirhall Extention WF 1.003 1.004 1.005 1.005 824
Aikengall 1.000 1.000 1.000 1.000 825
Hagshaw Hill 1.006 1.009 1.010 1.013 826
Gallow Rig 1.019 1.026 1.031 1.037 827
Polwhat Rig 1.019 1.026 1.031 1.037 828
Greendykeside 1.000 1.000 1.000 1.001 829
Dun Law 1.003 1.003 1.004 1.006 830
EPR Scotland Ltd 1.000 1.000 1.000 1.000 831
Bowbeat (Emly Bank) 1.015 1.020 1.024 1.029 832
Bowbeat (Roughsidehill) 1.015 1.020 1.024 1.029 833
Harehill 1.019 1.026 1.031 1.037 834
Shanks & McEwan 3&4 1.000 1.000 1.000 1.000 835
Shanks & McEwan 5 1.001 1.001 1.001 1.001 836
Crystal Rig 1.000 1.000 1.000 1.000 837
Haupland Muir (Ardrossan) 1.003 1.003 1.003 1.003 838
Wetherhill 1.006 1.010 1.012 1.014 839
Artfield WF 1.000 1.000 1.000 1.002 840
Wardlaw Wood 1.010 1.014 1.017 1.021 841
Earlsburn 1.000 1.000 1.000 1.001 842
Blackhill 1.014 1.020 1.024 1.029 843
Dalswinton 1.000 1.000 1.000 1.000 844
Steven's Croft Biomass 1.000 1.000 1.001 1.002 845
Longpark 1.000 1.000 1.000 1.000 850
BOC 1.001 1.001 1.001 1.001 851
Calder Water WF 1.003 1.004 1.005 1.005 852
Babcock Thorn 1.003 1.003 1.005 1.004 853
Lafarge UK 1.003 1.003 1.003 1.003 854
Pateshill 1.000 1.000 1.000 1.000 855
Clydeport 1.000 1.000 1.000 1.000 856
Freescale 1.000 1.000 1.000 1.000 857
Tesco 1.000 1.000 1.000 1.000 858
GlaxoSmithKline 1.008 1.008 1.008 1.008 859
Weir Pumps 1.003 1.004 1.005 1.005 861
North Rhins 1.013 1.017 1.020 1.026 863
Tod Hills Windfarm 1.003 1.004 1.005 1.005 864
MuirHall Extension II WF 1.003 1.004 1.005 1.005 868
Harehill Extension 1.003 1.004 1.005 1.005 869
Assall Valley 1.003 1.004 1.005 1.005 870
Whiteside Hill 1.003 1.004 1.005 1.005 871
Polmadie (Waste energy B) 1.003 1.004 1.005 1.005 872
Millour Hill 1.003 1.003 1.003 1.003 873
Glenkerie 1.011 1.016 1.019 1.023 874
Kelburn (A) 1.020 1.028 1.033 1.042 875
Kelburn (B) 1.021 1.031 1.037 1.047 876
Little Raith 1.000 1.000 1.000 1.000 877
Drone Hill 1.001 1.003 1.003 1.003 878
Andershaw WF 1.003 1.004 1.005 1.005 879
Earlseat WF 1.003 1.004 1.005 1.005 880
Dungavel WF 1.003 1.004 1.005 1.005 881

PAGE 50 OF 52 SP DISTRIBUTION PLC FEBRUARY 2015 – V1
Burnhead Bathgate WF 1.003 1.004 1.005 1.005 882
Shanks & McEwan 6 1.003 1.004 1.005 1.005 883
Ardoch & Over Enoch WF 1.003 1.004 1.005 1.005 884
Sneddon Law WF 1.003 1.004 1.005 1.005 886
Polmadie (Waste energy A) 1.003 1.004 1.005 1.005 887
Rhodders 1.003 1.004 1.005 1.005 800
Glenchamber 1.003 1.004 1.005 1.005 888
Penmansheill 1.003 1.004 1.005 1.005 889
Dumbarton 0.998 0.998 0.998 0.998 MSID 8083
Stirling Road 1.000 1.000 1.000 1.000 MSID 8085
Markinch 0.999 0.999 0.998 0.997 MSID 8334
Site Period 1 Period 2 Period 3 Period 4 Associated LLFC
Minsca 0.991 0.991 0.989 0.989 MSID 8182
Bankend Rig 0.993 0.995 0.993 0.995 683
Barlockhart Moor 0.998 0.998 0.997 0.997 684
Blantyre Muir 0.997 0.997 0.996 0.996 685
Hunterston WF 1.000 1.000 1.000 1.000 693
Middleton Farm 0.996 0.997 0.995 0.996 688
Neilston Community 0.996 0.996 0.995 0.995 689
Garlaff Landfill 0.997 0.997 0.997 0.997 681
Hagshaw Hill Extension 0.995 0.995 0.994 0.993 629
Muirhall 0.990 0.990 0.988 0.988 671
Burnfoot 0.992 0.993 0.991 0.991 672
Westfield WF 0.998 0.997 0.997 0.997 690
Barmoor WF 1.000 1.000 1.000 1.000 691
Nutberry WF 1.000 1.000 1.000 1.000 692
Carcreugh WF 1.000 1.000 1.000 1.000 695
West Browncastle WF 1.000 1.000 1.000 1.000 700
Viridor (Waste energy) 1.000 1.000 1.000 1.000 699
Craigengelt 0.998 0.998 0.997 0.996 620
Greenknowes 0.991 0.991 0.989 0.988 621
Ewe Hill Dumfries WF 1.000 1.000 1.000 1.000 703
Langhope Rig (D) WF 1.000 1.000 1.000 1.000 704
Muirhall Extension WF 1.000 1.000 1.000 1.000 705
Aikengall 0.996 0.996 0.996 0.996 625
Hagshaw Hill 1.001 1.003 1.003 1.005 626
Gallow Rig 1.008 1.014 1.017 1.022 627
Polwhat Rig 1.007 1.013 1.017 1.021 628
Greendykeside 0.999 0.999 0.999 0.999 624
Dun Law 0.983 0.982 0.977 0.978 630
EPR Scotland Ltd 0.999 0.999 1.000 1.000 631
Bowbeat (Emly Bank) 1.003 1.008 1.008 1.011 632
Bowbeat (Roughsidehill) 1.000 1.004 1.004 1.008 633
Harehill 1.000 1.006 1.008 1.013 634
Shanks & McEwan 3&4 0.999 0.999 0.999 0.999 635
Shanks & McEwan 5 0.997 0.997 0.996 0.996 636
Crystal Rig 1.000 1.000 1.000 1.000 637
Haupland Muir (Ardrossan) 0.999 0.999 0.999 1.000 638
Wetherhill 0.988 0.991 0.988 0.990 639
Artfield WF 0.999 0.999 0.999 1.000 640
Wardlaw Wood 0.993 0.996 0.995 0.998 641
Generation
EHV sites specific LLFs
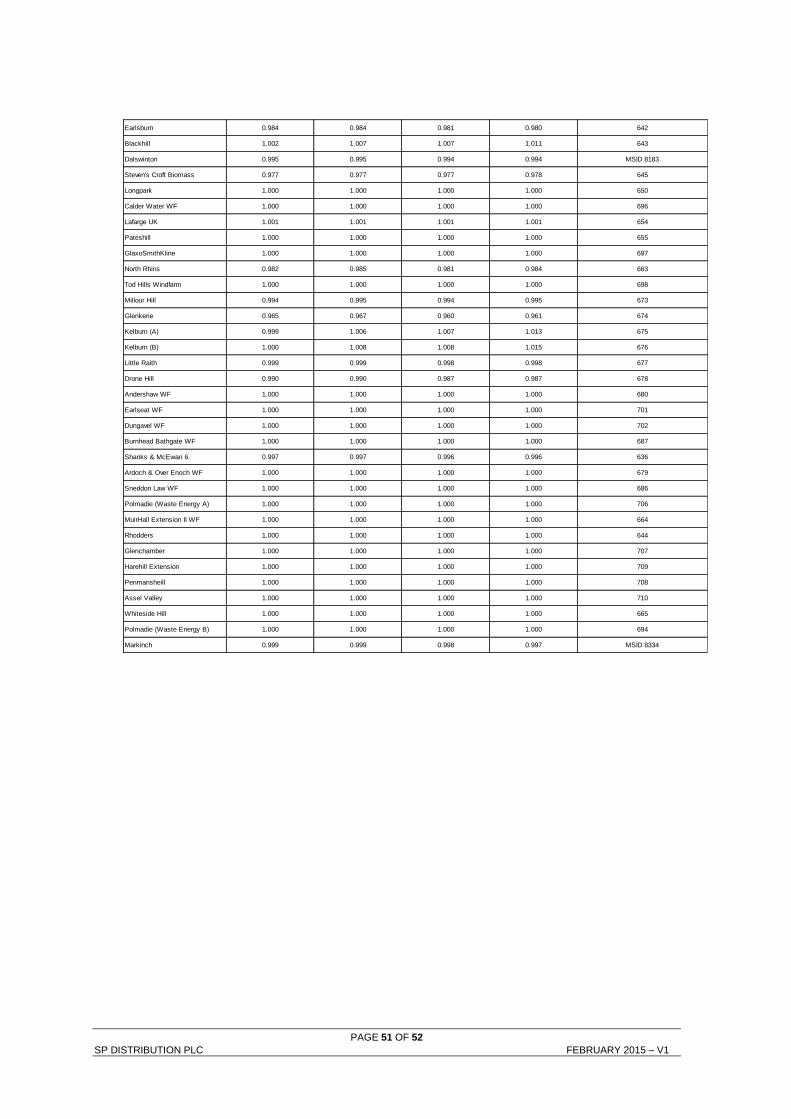
PAGE 51 OF 52 SP DISTRIBUTION PLC FEBRUARY 2015 – V1
Earlsburn 0.984 0.984 0.981 0.980 642
Blackhill 1.002 1.007 1.007 1.011 643
Dalswinton 0.995 0.995 0.994 0.994 MSID 8183
Steven's Croft Biomass 0.977 0.977 0.977 0.978 645
Longpark 1.000 1.000 1.000 1.000 650
Calder Water WF 1.000 1.000 1.000 1.000 696
Lafarge UK 1.001 1.001 1.001 1.001 654
Pateshill 1.000 1.000 1.000 1.000 655
GlaxoSmithKline 1.000 1.000 1.000 1.000 697
North Rhins 0.982 0.985 0.981 0.984 663
Tod Hills Windfarm 1.000 1.000 1.000 1.000 698
Millour Hill 0.994 0.995 0.994 0.995 673
Glenkerie 0.965 0.967 0.960 0.961 674
Kelburn (A) 0.999 1.006 1.007 1.013 675
Kelburn (B) 1.000 1.008 1.008 1.015 676
Little Raith 0.999 0.999 0.998 0.998 677
Drone Hill 0.990 0.990 0.987 0.987 678
Andershaw WF 1.000 1.000 1.000 1.000 680
Earlseat WF 1.000 1.000 1.000 1.000 701
Dungavel WF 1.000 1.000 1.000 1.000 702
Burnhead Bathgate WF 1.000 1.000 1.000 1.000 687
Shanks & McEwan 6 0.997 0.997 0.996 0.996 636
Ardoch & Over Enoch WF 1.000 1.000 1.000 1.000 679
Sneddon Law WF 1.000 1.000 1.000 1.000 686
Polmadie (Waste Energy A) 1.000 1.000 1.000 1.000 706
MuirHall Extension II WF 1.000 1.000 1.000 1.000 664
Rhodders 1.000 1.000 1.000 1.000 644
Glenchamber 1.000 1.000 1.000 1.000 707
Harehill Extension 1.000 1.000 1.000 1.000 709
Penmansheill 1.000 1.000 1.000 1.000 708
Assel Valley 1.000 1.000 1.000 1.000 710
Whiteside Hill 1.000 1.000 1.000 1.000 665
Polmadie (Waste Energy B) 1.000 1.000 1.000 1.000 694
Markinch 0.999 0.999 0.998 0.997 MSID 8334

PAGE 52 OF 52 SP DISTRIBUTION PLC FEBRUARY 2015 – V1
Annex 6 - Addendum to charging statement detailing charges for new Designated EHV Properties
Import
Unique Identifier
Import
MPANs/MSIDs
Import
LLFC
Export
Unique Identifier
Export
LLFC
Export
MPANs/MSIDsName
Import
super-red
unit rate
p/kWh
Import fixed
charge
p/day
Import
capacity rate
p/kVA/day
Import
exceeded
capacity rate
p/kVA/day
Export
super-red
unit rate
p/kWh
Export
fixed
charge
p/day
Export
capacity rate
p/kVA/day
Export
exceeded
capacity rate
p/kVA/day
Import
Unique Identifier
Import
MPANs/MSIDs
Import
LLFC
Export
Unique Identifier
Export
LLFC
Export
MPANs/MSIDsName
Import LLF
period 1
Import LLF
period 2
Import LLF
period 3
Import LLF
period 4
Import LLF
period 5
Export LLF
period 1
Export LLF
period 2
Export LLF
period 3
Export LLF
period 4
Export LLF
period 5
SP Distribution - Effective from 1 April 2015 - FINAL new designated EHV charges
Annex 6 - Addendum to Annex 2 EHV charges
SP Distribution - Effective from 1 April 2015 - FINAL new designated EHV line loss factors