Embed Size (px)
Citation preview

19
SP Energy Networks 2015–2023 Business Plan Updated March 2014
Annex Risk and UncertaintySP Energy Networks March 2014
Risk and Uncertainty
March 2014
Issue Date Issue No. Document Owner Amendment Details
15th March 2014 1.0 Haren Thillainathan First issue
1. Scope 5
2. Table of Linkages 5
3. Overview 6
4. Structure of this annex 7
5. SPEN’s approach to risk assessment and management 8
5.1. Risk identification 8 5.2. Risk Analysis 8 5.3. Risk Response 8 5.4. Risk Monitoring and Control 9 5.4.1. Risk Scoring 9
6. SPEN’s approach to risk allocation 9
6.1. Allocation of risk between SPEN and customers 9
7. SPEN’s key business processes and approaches 10
7.1. Asset Management 10 7.2. Health and Safety 10 7.3. Operational Management 10 7.4. Customer Satisfaction 10 7.5. Purchasing and contract management 10 7.6. Governance and Monitoring 11
8. RIIO-ED1 Risks and Uncertainties 11
8.1. Risks borne and managed by SPEN 11 8.1.1. Major system or asset failure 12 8.1.2. Safety 13 8.1.3. Extreme weather resilience (storms and floods) 13 8.1.4. Adverse Customer service 14

8.1.5. Adopting new technologies and solutions 15 8.1.6. Real Price Effects (RPEs) and productivity 16 8.2. Risks shared with customers via RIIO-ED1 Uncertainty
Mechanisms 17
9. Load related expenditure (LRE) 19 9.1. Overview 19 9.2. Low Carbon Technologies (LCTs) 19 9.3. Underlying Load Growth (excluding LCTs) 21 9.4. RIIO-ED1 LRE re-opener windows 22
10. Streetworks 23 10.1. Overview 23 10.2. RIIO-ED1 Streetworks re-opener window 24
11. Enhanced Physical Site Security 24
12. High Value Projects 24
13. Innovation Roll Out Mechanism 25
14. Established Pension Deficit 25
15. Smart Meters and DCC Charges 25 15.1. Overview 25 15.2. RIIO-ED1 Smart Meter Uncertainty Mechanisms 26 15.2.1. Smart meter Volume driver 26 15.2.2. DCC Fixed Charge pass through 27
16. Corporate Tax 27
17. Debt 27
18. RPI 27
19. RIIO-ED1 Pass through costs 27

20. Modelling of Financial Risk 28
21. Conclusions 28
Risk and Uncertainty
1. Scope This annex details our approach our strategy for identifying key risks and uncertainties affecting our business plan over 2015-23, the scale of their impact and determining what controls are or can be put in place to manage these risks and uncertainties
2. Table of Linkages This strategy supports our ED1 Business Plan. For ease of navigation, the following table links this strategy to other relevant parts of our plan.
Document Chapter / Section
SP Energy Networks Business Plan 2015-2023
Chapter C4 – Preparing our 2015-23 Plan c. Governance, Assurance and Approval
SP Energy Networks Business Plan 2015-2023
Chapter C5 – Outputs and Incentives f. Customer Satisfaction
SP Energy Networks Business Plan 2015-2023
Chapter C6 – Expenditure b. Asset Stewardship d. Load Related Investment e. Non Load Related Investment k. Real Price Effects
SP Energy Networks Business Plan 2015-2023
Chapter C7 – Business Readiness
SP Energy Networks Business Plan 2015-2023
Chapter C9 - Financing
SP Energy Networks Business Plan 2015-2023 Annexes
Annex B3 – Stakeholder Engagement – SPEN
SP Energy Networks Business Plan 2015-2023 Annexes
Annex B3 – Stakeholder Engagement Further Detail – SPEN
SP Energy Networks Business Plan 2015-2023 Annexes
Annex C5 – Customer Satisfaction Strategy – SPEN
SP Energy Networks Business Plan 2015-2023 Annexes
Annex C6 – Expenditure Supplementary Annex – SPEN
SP Energy Networks Business Plan 2015-2023 Annexes
Annex C6 – Asset Health and Criticality Strategy – SPEN
SP Energy Networks Business Plan 2015-2023 Annexes
Annex C6 – Real Price Effects 2014/15 to 2022/23 – First Economics
SP Energy Networks Business Plan 2015-2023 Annexes
Annex C6 – Load Related Investment Strategy – SPEN
SP Energy Networks Business Plan 2015-2023 Annexes
Annex C6 – Heat pump and energy efficiency scenarios – Frontier Economics
SP Energy Networks Business Plan 2015-2023 Annexes
Annex C7 – Innovation Strategy – SPEN
SP Energy Networks Business Plan 2015-2023 Annexes
Annex C7 – Smart Meter Strategy – SPEN
SP Energy Networks Business Plan 2015-2023 Annexes
Annex C8 – Risk Modelling for RIIO-ED1 – NERA
5

Risk and Uncertainty
3. Overview All successful businesses must be able to identify key risks and uncertainties and wherever possible mitigate the potential impacts. In developing our RIIO-ED1 business plan we have utilised the SPEN framework for risk management to:
• identify key risks and uncertainties affecting our business plan over 2015-23 and the identify the scale of their impact
• determine what controls are or can be put in place to manage these risks and uncertainties
SPEN is best placed to manage the majority of risks to the delivery of the business plan in RIIO-ED1, this includes most business as usual risks and new ones emerging during 2015-23. There are however, a few exceptions where risks are either partially or completely outside SPEN’s control, in these instances it is necessary to make an allowance for these risks within the regulatory framework. Ofgem has considered the risks likely to fall into this category during RIIO-ED1 and included a number of uncertainty mechanisms these were set out in its March 2013 decision document1. The table below summarises the risks we have given particular consideration in our assessment.
Risk Uncontrolled Risk Rating
Mitigation Risk Bearer Controlled Risk Rating*
Major system/asset failure
Very High SPEN’s Asset Management approach
SPEN Low^
Safety High SPEN’s Health and Safety approach SPEN Low^
Extreme Weather Resilience
High OHL upgrades, vegetation, remote control switching, management, flood protection
SPEN Low
Poor Customer Service Medium SPEN’s Customer Satisfaction approach
SPEN Low
Adoption of New Technologies
Medium SPEN’s Innovation Strategy, cost benefit analysis and engineering approvals process
SPEN Low
Real Price Effects (RPEs)
High SPEN’s purchasing and contracting strategies
SPEN and consumers
Low
Load Related Expenditure
Medium Flexibility in baseline expenditure, monitoring of leading indicators of significant change
SPEN and consumers
Low
Streetworks High SPEN’s Streetworks Approach SPEN and consumers
Low-Medium
Smart Meters High SPEN’s Smart Meter Strategy SPEN and consumers
Very Low
*after application of identified mitigation and uncertainty mechanism where applicable ^within tolerable risk
1 Strategy decision for the RIIO-ED1 electricity distribution price control: Uncertainty mechanisms, March 2013 https://www.ofgem.gov.uk/ofgem-publications/47070/riioed1decuncertaintymechanisms.pdf
6
Risk and Uncertainty
Having undertaken a holistic assessment of risk in RIIO-ED1 we have concluded that:
• no additional uncertainty mechanisms are required nor amendments to existing ones; and
• we recognise these uncertainty mechanisms offset some risk but SPEN is nevertheless managing the majority of risk in RIIO-ED1 and this requires a commensurate cost of equity.
4. Structure of this annex In the remainder of this annex we set out:
• SPEN’s framework for risk assessment and management
• SPEN’s approach to risk allocation
• SPEN’s key business processes and approaches
• the key risks around our RIIO-ED1 business plan, their impacts and how they can be controlled or mitigated, which are split into:
− key risks managed wholly by SPEN; and
− risks managed through RIIO-ED1 uncertainty mechanisms
• modelling of financial risk in RIIO-ED1
• our conclusions on the risk borne by SPEN during RIIO-ED1 and the implications of the cost of equity
7
Risk and Uncertainty
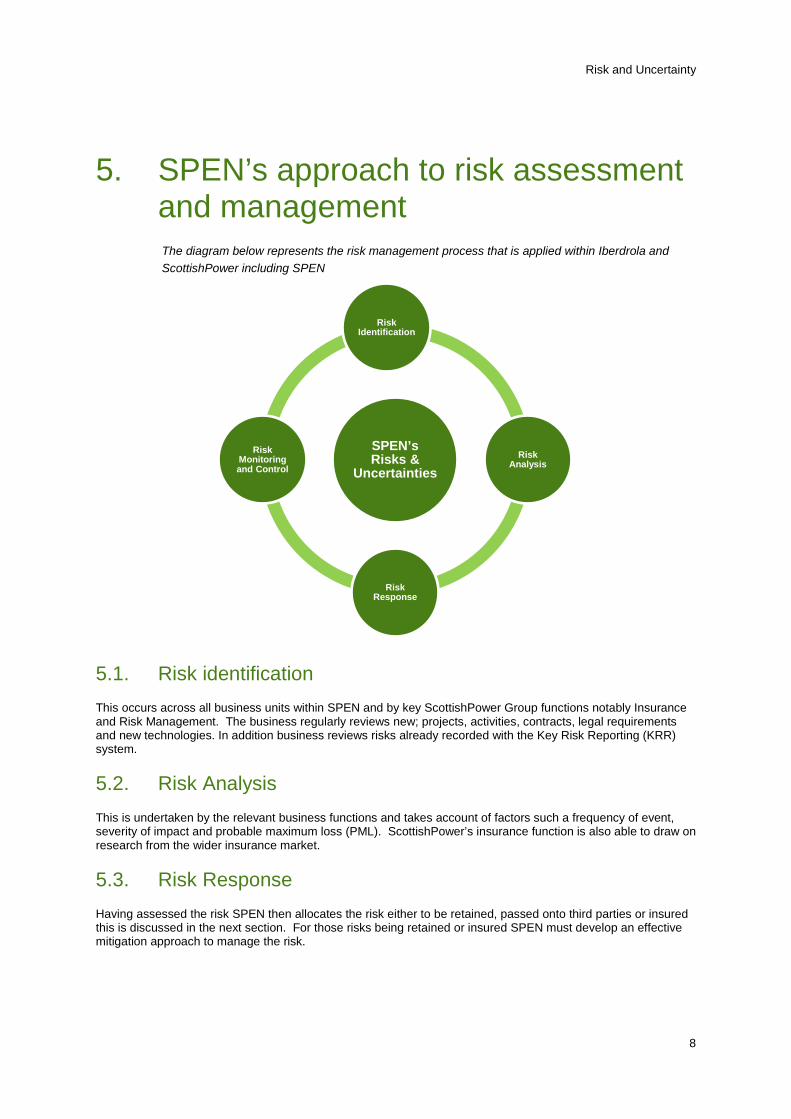
5. SPEN’s approach to risk assessment and management The diagram below represents the risk management process that is applied within Iberdrola and ScottishPower including SPEN
5.1. Risk identification This occurs across all business units within SPEN and by key ScottishPower Group functions notably Insurance and Risk Management. The business regularly reviews new; projects, activities, contracts, legal requirements and new technologies. In addition business reviews risks already recorded with the Key Risk Reporting (KRR) system.
5.2. Risk Analysis This is undertaken by the relevant business functions and takes account of factors such a frequency of event, severity of impact and probable maximum loss (PML). ScottishPower’s insurance function is also able to draw on research from the wider insurance market.
5.3. Risk Response Having assessed the risk SPEN then allocates the risk either to be retained, passed onto third parties or insured this is discussed in the next section. For those risks being retained or insured SPEN must develop an effective mitigation approach to manage the risk.
SPEN’s Risks &
Uncertainties
Risk Identification
Risk Analysis
Risk Response
Risk Monitoring and Control
8

Risk and Uncertainty
5.4. Risk Monitoring and Control Identified risks and responses are recorded within SPEN’s KRR. SPEN’s risk reporting is cascaded down and across all areas of the business it also feeds up into the ScottishPower and Iberdrola’s risk reporting. Recorded risks are reviewed regularly by all levels of management. Risk Management monitor and co-ordinate application of the framework ensuring compliance with ScottishPower and Iberdrola risk policies.
5.4.1. Risk Scoring
In line with the industry standard approach, the KRR uses a five point scale (very low to very high) to evaluate the likelihood of occurrence and potential impact, these scores are combined to produce the overall risk score. We have used this approach in the risk assessments throughout this annex. The assessment of potential includes:
• financial;
• health & safety;
• operational performance
• environment; and
• stakeholders
6. SPEN’s approach to risk allocation SPEN’s approach to allocating risk for those that can’t be eliminated, is driven by Iberdrola’s group approach the key features of which are:
• risks are retained in line with the risk appetite of the Iberdrola Group, whereby attritional losses are retained by the business and only major, unforeseeable losses are insured;
• where contractual [third] parties are involved we ensure that we pass on all risks that are reasonable for them to bear. This is assessed case by case, involving the review of relevant liability and indemnity provisions and consideration of factors such as commercial pressures, industry standards and legal advice etc;
• insurance is sought in the final instance. We are able to leverage SPEN’s position by placing insurance as part of Iberdrola’s global policies and achieve lower insurance premiums. Premiums are then allocated back to SPEN to ensure focussed and effective risk management
6.1. Allocation of risk between SPEN and customers Where risks are judged to be uninsurable and wholly or partially outside of SPEN’s control, we may need to consider pricing the risk into the business plan however this may expose our customers to greater prices than necessary. Conversely if we do not accommodate such risks, it may be displaced to investors and this may adversely impact SPEN’s perceived financeability, limiting the extent to which SPEN is able to deliver its business plan, this outcome would be detrimental to our customers and stakeholders. In such circumstances the best solution is to accommodate risk in the regulatory framework via uncertainty mechanisms. We discuss RIIO-ED1 uncertainty mechanisms later in this annex.
9
Risk and Uncertainty
7. SPEN’s key business processes and approaches
SPEN is best placed to manage the majority of risks that confront the business and its ability to deliver this business plan. SPEN’s key business approaches are central to its risk management and they feature in many of the mitigation and controls of the key RIIO-ED1 risks discussed in this annex. The approaches are summarised below more detail can be found in the relevant chapters of the business plan.
7.1. Asset Management Our asset management strategy is designed around the concept of “whole life” management of network assets. Our approach focuses on the management of assets prioritised by their determined criticality. Key measures of criticality combine asset health based on condition information and our assessment of asset risk. Asset criticality enables us to determine which assets to replace or refurbish as part of our capital investment and which to continue managing through our asset maintenance programme. Our approach is underpinned by our inspection regimes which collect and record asset condition information at all stages of the asset life cycle. By focussing on asset criticality we are able to maintain system and asset integrity and manage the associated risk to at least, what is considered the tolerable level (see health and safety below).
7.2. Health and Safety Health & Safety is at the heart of SPEN’s business, in particular minimising the risk of harm to our employees and members of the public. We adopt UK and international best practice by following the principle of reducing risks to people to “as low a level as is reasonably practicable” (ALARP). In practice this means that we seek to ensure we are proportionately investing to manage risks within the range that is considered tolerable. This means that wherever possible we aim to reduce risk to the point where we would incur a cost that is disproportionate to the risk reduction. Health and safety is a key factor in the asset risk and criticality process detailed in our asset management approach described above, it also applies to all other areas of our operations and interfaces with the public.
7.3. Operational Management This covers important functions such inspections and maintenance. Operations also cover our response to faults and interruptions including those caused by severe weather e.g. storms. Operations have a number of drivers including our asset management approach with respect to inspections and maintenance and delivering network resilience. Our operations management approach optimises the deployment of our resources so that the various operational requirements are delivered efficiently whilst retaining the flexibility to respond to sudden changes such as the weather.
7.4. Customer Satisfaction We have a multifaceted approach that has been successful in delivering sustained improvements in our customer satisfaction scores from 2012. Our approach utilises stakeholder engagement to ensure we are delivering a service that meets the actual needs of our customers. We have recruited experienced customer service professionals including our Director of Service to drive forward our strategy. Our customer service staff are trained to recognise potential problems impacting customer experience and rectify them before they materialise. More generally we have a programme of training and awareness, to ensure our operations are aligned to our customer satisfaction objectives particularly on unplanned and planned interruptions and faults. We ensure we have sufficient resources to respond to all customer enquiries, including at times of increased volumes of contacts such as severe weather events.
7.5. Purchasing and contract management Our purchasing strategy is driven by the objective of achieving efficient and sustainable costs in RIIO-ED1. A key factor in achieving this is our ability to leverage SPEN’s position by utilising Iberdrola’s global purchasing power to acquire goods and services for SPEN. Our purchasing is supported by our contract management
10
Risk and Uncertainty
approach, in particular we are reviewing our contract renewals to try to secure sufficient resources to deliver our RIIO-ED1 plan at the best prices possible. Much of this work is already completed or underway and will be in place for RIIO-ED1.
7.6. Governance and Monitoring In order for SPEN to deliver against its corporate objectives including customers, regulatory and investors it is essential that that SPEN’s key business processes are robust and effective. A critical factor in achieving this is our assurance framework, we have utilised this to ensure SPEN’s business plan is robust, realistic and accurate, so that our stakeholders can have confidence in what we are aiming to deliver in RIIO-ED1. Specifically the plan and its assumptions have been rigorously challenged within SPEN and Iberdrola. In addition the business processes and data underpinning this plan has been subject our audit and validation procedures. Further details can be found in Chapter B4 – Preparing our 2015-23 Plan – c. Governance, Assurance and Approval.
8. RIIO-ED1 Risks and Uncertainties Based on our risk assessment and management framework, we have identified the key risks and uncertainties that may impact SPEN’s delivery of this business plan in RIIO-ED1. The risks below are a selection that is representative of the risks managed by SPEN they are reflected our risk reports. For ease of presentation we have split risks into those which can be managed by SPEN and those which are partially or completely outside SPEN’s control. In the case of the latter they correspond to the RIIO-ED1 uncertainty mechanisms. For each risk we have identified the impact and controls and mitigations to deal with that risk.
8.1. Risks borne and managed by SPEN The risks identified here are those that SPEN is best placed to retain and manage as part of business as usual and new risks emerging in RIIO-ED1. We have indicated how our RIIO-ED1 baseline expenditure in our business plan relates to our management of each of these risks.
11

Risk and Uncertainty
8.1.1. Major system or asset failure
For a business that operates and manages two distribution networks our highest priority is to ensure that the risk of system or critical asset failure is minimal is managed within what is considered to be tolerable risk. The consequences of such failures are significant i.e. very high or 5 on our grading. These include adverse impacts to:
• health and safety
• customers and stakeholders;
• financial; and
• the environment
Risk Mitigation and control
SPEN has developed an effective asset management approach, summarised above. This is discussed in detail in Annex C6 – Expenditure Supplementary Annex – SPEN. The key features of this include:
• continued risk assessment of all key network assets; sub-stations. OHL, cables etc, covering all relevant factors that contribute to the risk of failure and the probability of that failure occurring.
• comprehensive Inspection regimes to collect asset condition and operational data which informs the risk assessment.
• assets prioritised according to their criticality and then included for replacement in the investment programme or managed through the refurbishment and maintenance plans
• use of cost/benefit analysis to demonstrate risk reduction is not disproportionate to costs of investment or refurbishment.
SPENs asset health and criticality framework is a key driver of SPM’s and SPD’s RIIO-ED1 baseline:
• asset replacement and refurbishment expenditure £816m in total; and
• Inspections and maintenance expenditure £120m in total.
Our asset health and criticality indices show how the above expenditure impacts the risk of failure over the period RIIO-ED1 these are discussed further in Annex C6 – Asset Health and Criticality Strategy – SPEN. The charts below illustrate the overall impact of our RIIO-ED1 on asset risk (red line) the counterfactual i.e. no investment (blue line) is shown for comparison.
2015 Start of RIIO ED1 2019 Mid RIIO ED1 2023 End of RIIO ED1
Overall Risk - SPD
Risk No Intervention Risk With Intervention
2015 Start of RIIO ED1 2019 Mid RIIO ED1 2023 End of RIIO ED1
Overall Risk - SPM
Risk No Intervention Risk With Intervention
12
Risk and Uncertainty
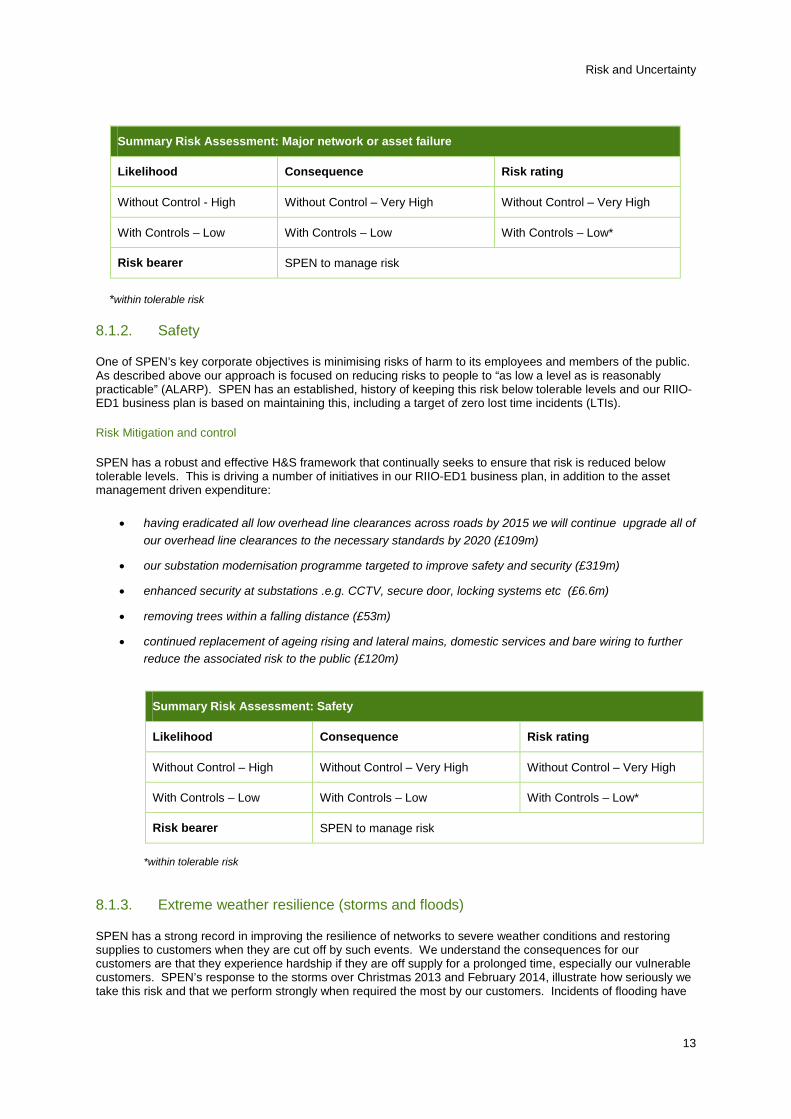
Summary Risk Assessment: Major network or asset failure
Likelihood Consequence Risk rating
Without Control - High Without Control – Very High Without Control – Very High
With Controls – Low With Controls – Low With Controls – Low*
Risk bearer SPEN to manage risk
*within tolerable risk
8.1.2. Safety
One of SPEN’s key corporate objectives is minimising risks of harm to its employees and members of the public. As described above our approach is focused on reducing risks to people to “as low a level as is reasonably practicable” (ALARP). SPEN has an established, history of keeping this risk below tolerable levels and our RIIO-ED1 business plan is based on maintaining this, including a target of zero lost time incidents (LTIs).
Risk Mitigation and control
SPEN has a robust and effective H&S framework that continually seeks to ensure that risk is reduced below tolerable levels. This is driving a number of initiatives in our RIIO-ED1 business plan, in addition to the asset management driven expenditure:
• having eradicated all low overhead line clearances across roads by 2015 we will continue upgrade all of our overhead line clearances to the necessary standards by 2020 (£109m)
• our substation modernisation programme targeted to improve safety and security (£319m)
• enhanced security at substations .e.g. CCTV, secure door, locking systems etc (£6.6m)
• removing trees within a falling distance (£53m)
• continued replacement of ageing rising and lateral mains, domestic services and bare wiring to further reduce the associated risk to the public (£120m)
Summary Risk Assessment: Safety
Likelihood Consequence Risk rating
Without Control – High Without Control – Very High Without Control – Very High
With Controls – Low With Controls – Low With Controls – Low*
Risk bearer SPEN to manage risk
*within tolerable risk
8.1.3. Extreme weather resilience (storms and floods)
SPEN has a strong record in improving the resilience of networks to severe weather conditions and restoring supplies to customers when they are cut off by such events. We understand the consequences for our customers are that they experience hardship if they are off supply for a prolonged time, especially our vulnerable customers. SPEN’s response to the storms over Christmas 2013 and February 2014, illustrate how seriously we take this risk and that we perform strongly when required the most by our customers. Incidents of flooding have
13
Risk and Uncertainty
become increasingly prevalent in the UK over recent years; flooding can adversely impact sub-stations causing associated loss of supply.
Risk Mitigation and control
SPEN has been addressing areas of the networks most at risk to severe weather, since the 1990s the key aspects of SPEN’s strategy and approach have been:
• setting industry best practice in vegetation management, having implemented a 3 year cycle of tree cutting
• upgrading overhead lines to meet a greater technical specification for resilience:
• deploying over 3000 remote control switches to ensure supplies can be restored quickly.
• currently upgrading key substations at risk to ensure they are resilient to flood risk of between 1 in 100 years and 1 in 1000.
In RIIO-ED1 we will build on our achievements and aim to improve our performance even further by:
• continuing our vegetation management programme clearing tree spans to maintain safety and improve performance (£100m)
• increasing battery life at critical substations to 72 hours to strengthen our black start capability (£9m)
• increasing the resilience of 25% of our rural high voltage OHL network and 32% of our rural low voltage networks (£232m)
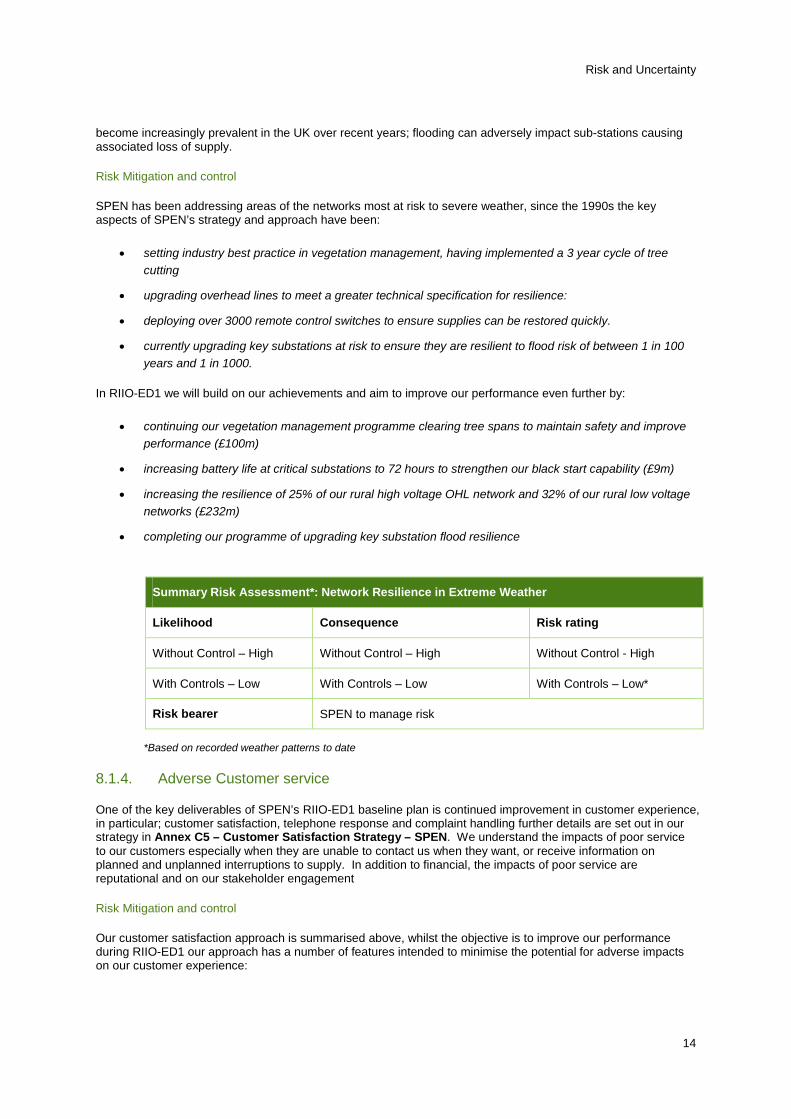
• completing our programme of upgrading key substation flood resilience
Summary Risk Assessment*: Network Resilience in Extreme Weather
Likelihood Consequence Risk rating
Without Control – High Without Control – High Without Control - High
With Controls – Low With Controls – Low With Controls – Low*
Risk bearer SPEN to manage risk
*Based on recorded weather patterns to date
8.1.4. Adverse Customer service
One of the key deliverables of SPEN’s RIIO-ED1 baseline plan is continued improvement in customer experience, in particular; customer satisfaction, telephone response and complaint handling further details are set out in our strategy in Annex C5 – Customer Satisfaction Strategy – SPEN. We understand the impacts of poor service to our customers especially when they are unable to contact us when they want, or receive information on planned and unplanned interruptions to supply. In addition to financial, the impacts of poor service are reputational and on our stakeholder engagement
Risk Mitigation and control
Our customer satisfaction approach is summarised above, whilst the objective is to improve our performance during RIIO-ED1 our approach has a number of features intended to minimise the potential for adverse impacts on our customer experience:
14

Risk and Uncertainty
• we have a proven plan for responding to severe weather events which involves ensuring resources are in place to deal with a significant increase in customer calls during a severe weather event. This plan is annually reviewed to ensure its continued effectiveness;
• we have robust corporate governance in place for SPEN’s customer service involving SPEN’s CEO and director of customer service, this helps ensure measures to safeguard customer services can be implemented effectively across the business;
• we are implementing a new customer relationship management (CRM) system so that we can track our customers’ experience to identify and rectify problems quickly and efficiently; and
• we are augmenting our staff training in complaint handling and customer service so they can identify potential problems and mitigate them before they materialise.
Summary Risk Assessment: Adverse customer service
Likelihood Consequence Risk rating
Without Control – High Without Control – medium Without Control - medium
With Controls – Low With Controls – Low With Controls - Low
Risk bearer SPEN to manage risk
8.1.5. Adopting new technologies and solutions
SPEN has a track record of trialling and adopting innovative solutions on its networks. Our business plan includes a number of “smart grid solutions” e.g. phase shifting transformers, HV stat-comms, commercial solutions e.g. demand side response (DSR). The adoption of new technology has a number of associated risks given its immaturity in particular:
• they may not function or provide the capacity as expected this has knock impacts for the network in the worst case it may lead to loss of supply
• the associated costs may be higher than expected either at installation or maintenance
• commercial solutions such as DSR have the risk that the required behaviour may not materialise i.e. demand reduction, especially if this a new way of using the network. This can have wider implications similar to new technology e.g. loss of supply
Risk Mitigation and control
• such innovative, solutions are subject to a robust cost benefit analysis (CBA) which considers the trade-off between capital and operating costs i.e. on a totex basis over the expected lifetime. The CBAs also evaluate risk by considering evidence on its deployment in the UK and internationally and support from available vendors. The CBA also evaluates the solution against all alternatives.
• where applicable we draw on learning from LCNF and IFI projects e.g. innovative commercial frameworks other technologies.
• we are involved in the current review of ER P2/6 considering the role of demand side response and other solutions as viable alternatives to delivering security of supply.
15

Risk and Uncertainty
• all new technology goes through an extensive engineering approval process, as detailed in our asset management policy, includes an assessment of health, safety and environmental risk. .
Given the scale of the cost of these solutions we are comfortable managing the associated risks. Where better alternative solutions deliver greater net benefits but at a significantly greater cost we may consider use of the Innovation Rollout Mechanism (IRM) to offset the some off the risk.
Summary Risk Assessment: Adoption of new technology and solutions
Likelihood Consequence Risk rating
Without Control – High Without Control – medium Without Control – medium
With Controls – Low With Controls – Low With Controls – Low
Risk bearer SPEN to manage risk but consider use of the IRM for larger projects
8.1.6. Real Price Effects (RPEs) and productivity
Detail on RPEs is set out in Chapter C6 – Expenditure – k. Real Price Effects; First Economics’ forecasts (see Annex C6 – Real Price Effects 2014/15 to 2022/23 – First Economics) are incorporated into this plan and amount to a total of £159m for SPEN over RIIO-ED1. Our estimate of RPEs is offset by our productivity assumption of 1.0% p.a.; the latter amounts to £146m of cost reductions for SPEN over RIIO-ED1.
The table below provides an indication of how variances around our RPE and productivity assumptions would impact our business plan e.g. the impact if RPEs are 2% instead of our estimate for RIIO-ED1 etc.
Table 1 Impact of variance to our RPE and productivity assumption
The impact of a variance to RPE over RIIO-ED1 for SPEN
% Impact on baseline totex (£m)
2.0 133.2
0.0 (158.8)
The impact of a variance to productivity over RIIO-ED1 for SPEN
% Impact on baseline totex (£m)
2.0 (146.0)
0.0 146.0
The sensitivities regarding RPEs arise because prices are partly driven by wider economic trends, for example increased demand for labour and materials outside the UK electricity distribution can drive up prices and vice versa. Similarly, an element of productivity is driven by trends in the wider economy.
Risk Mitigation and control
In spite of the wider economic pressures we believe we have sufficient measures in place to guard against increased prices or reduced productivity:
16

Risk and Uncertainty
• our purchasing strategy is crucial to our ability to withstand price increases over our assumed RPEs. We have renewed our key contracts to ensure we can manage our suppliers and contractors, effectively and at an efficient cost throughout RIIO-ED1. We have systems in place to manage the whole supply chain providing further mitigation against price increases. We are also able to leverage SPEN’s position, using Iberdrola’s global purchasing power to procure certain goods and services at cheaper prices,
• our key management approaches and processes as set out in the relevant chapters of the business plan, will ensure that we deliver our outputs efficiently over RIIO-ED1 including our productivity targets. Our preparation for the delivery of RIIO-ED1 will also be important to ensuring productivity gains over the period, in particular through our contracting strategy we are re-aligning contracts with our suppliers to embed our productivity requirements.
Customers’ exposure to the impact of RPEs will be significantly reduced even further, through the IQI mechanism. Should there be a cost increase due to RPEs in RIIO-ED1 SPEN will bear the majority of this under the IQI sharing factors.
Summary Risk Assessment: Real Price Effects
Likelihood Consequence Risk rating
Without Control – High Without Control – High Without Control – High
With Controls – Medium With Controls – Medium With Controls – Medium
With controls & IQI - Medium With controls & IQI - Low With controls & IQI - Low
Risk bearer SPEN and consumers, SPEN to bear majority of the risk
8.2. Risks shared with customers via RIIO-ED1 Uncertainty Mechanisms
In our approach to risk allocation described earlier, we noted that where risks cannot be fully controlled by SPEN it is appropriate to share such risks with customers by use of uncertainty mechanisms. As we noted the alternative would be to price in risk to the cost of capital or to transfer the risk to investors both of which are likely to be more detrimental to our customers. In considering any potential uncertainty mechanism SPEN adopts the following principles:
• the mechanism appropriately captures the uncontrollable element of risk
• customers exposure to costs should be limited and defined around the relevant risk
• where DNOs can exert some control on the risk concerned they are incentivised to do so.
Ofgem set out what it considered to be the appropriate uncertainty mechanisms for RIIO-ED1 in its March 2013 Strategy Decision2 which DNOs were to consider as part of their RIIO-ED1 business plans. SPEN has reviewed
2 Strategy decision for the RIIO-ED1 electricity distribution price control: Uncertainty mechanisms, March 2013 https://www.ofgem.gov.uk/ofgem-publications/47070/riioed1decuncertaintymechanisms.pdf
17
Risk and Uncertainty
these uncertainty mechanisms against the stated principles above in addition we have included the relevant mechanisms in our modelling of financial risk.
In summary our assessment is that the proposed mechanisms meet the above principles and are appropriate for inclusion in our business plan in their proposed form. Taking into account the risk SPEN is bearing and managing in RIIO-ED1 we do not propose any additional uncertainty mechanisms but as discussed later this assessment is predicated on receiving a post-tax, cost of equity of 6.4%
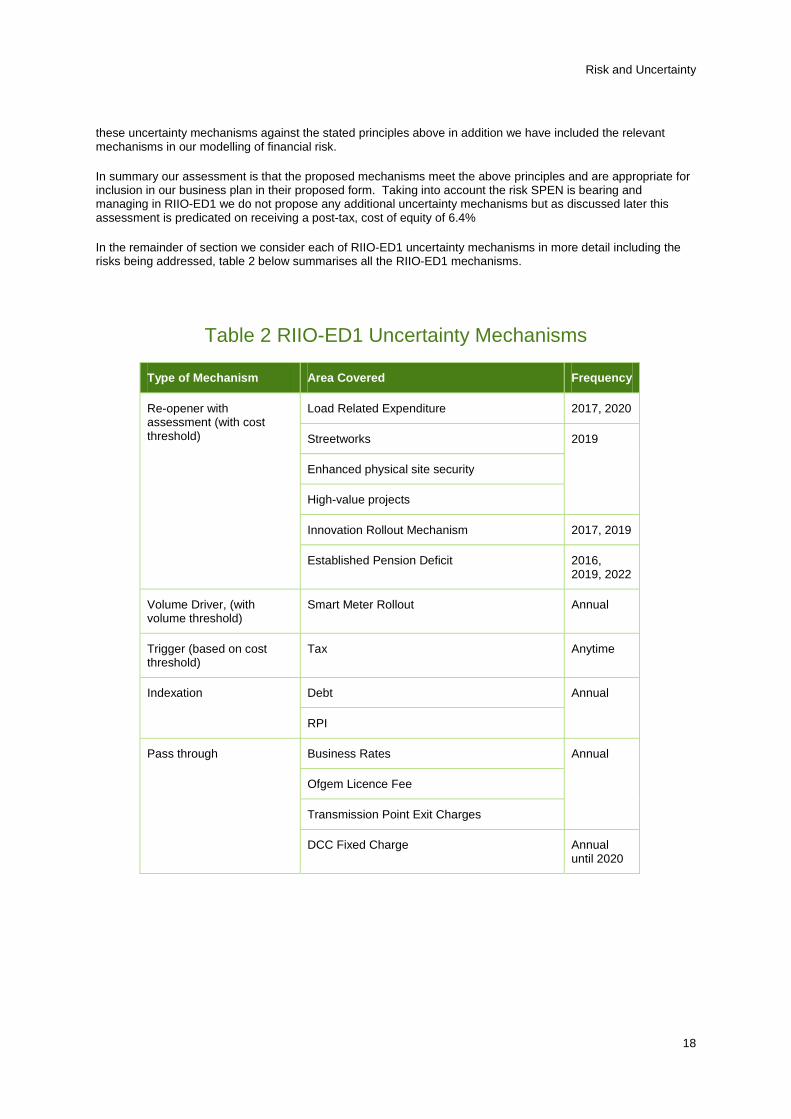
In the remainder of section we consider each of RIIO-ED1 uncertainty mechanisms in more detail including the risks being addressed, table 2 below summarises all the RIIO-ED1 mechanisms.
Table 2 RIIO-ED1 Uncertainty Mechanisms
Type of Mechanism Area Covered Frequency
Re-opener with assessment (with cost threshold)
Load Related Expenditure 2017, 2020
Streetworks 2019
Enhanced physical site security
High-value projects
Innovation Rollout Mechanism 2017, 2019
Established Pension Deficit 2016, 2019, 2022
Volume Driver, (with volume threshold)
Smart Meter Rollout Annual
Trigger (based on cost threshold)
Tax Anytime
Indexation Debt Annual
RPI
Pass through Business Rates Annual
Ofgem Licence Fee
Transmission Point Exit Charges
DCC Fixed Charge Annual until 2020
18
Risk and Uncertainty
9. Load related expenditure (LRE) 9.1. Overview Details of our LRE projections for 2015-23, are set out in Chapter C6 – Expenditure – d. Load Related Investment, Annex C6 – Expenditure Supplementary Annex – SPEN and Annex C6 – Load Related Investment Strategy – SPEN. We identified the following factors having the biggest impact on our LRE requirements during RIIO-ED1:
• the take up of low carbon technologies (LCTs) across our networks, in particular heat pumps, electric vehicles and solar panels (photo voltaic cells);
• economic growth and its relationship with electricity demand;
• improvements in energy efficiency, this comprises household insulation and efficiency of domestic electrical appliances; and
• the connection of distributed generation across our networks (excluding PV cells)
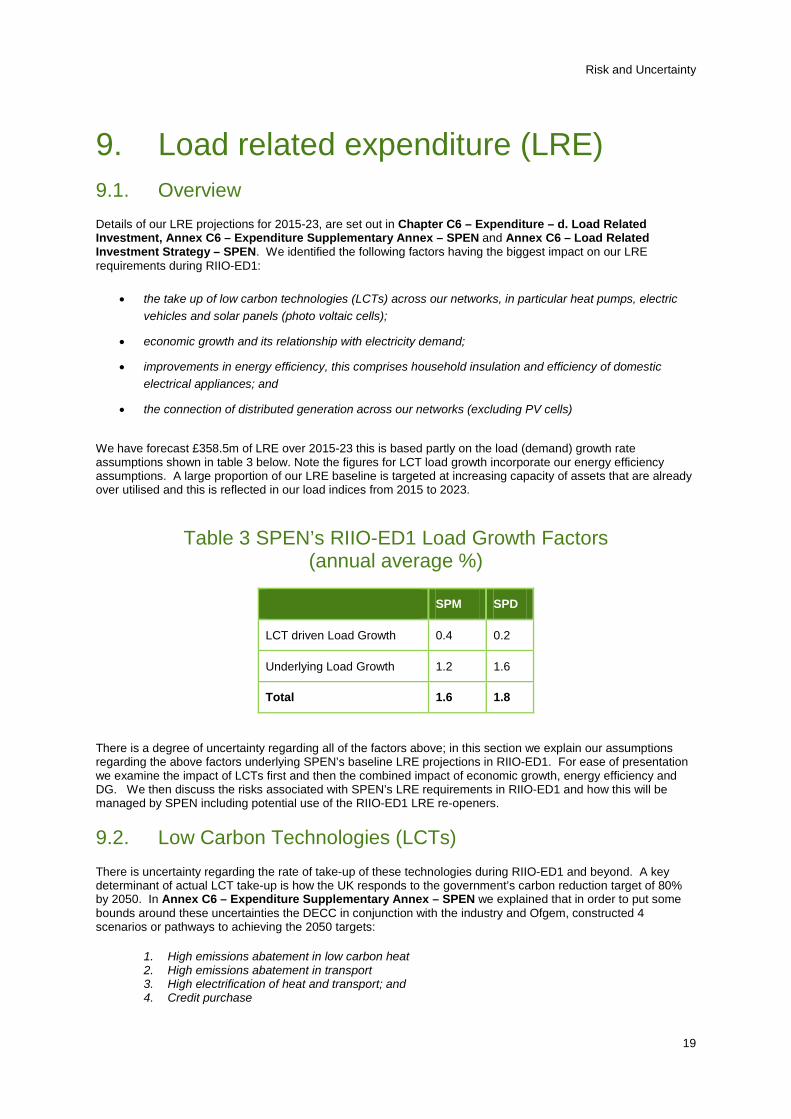
We have forecast £358.5m of LRE over 2015-23 this is based partly on the load (demand) growth rate assumptions shown in table 3 below. Note the figures for LCT load growth incorporate our energy efficiency assumptions. A large proportion of our LRE baseline is targeted at increasing capacity of assets that are already over utilised and this is reflected in our load indices from 2015 to 2023.
Table 3 SPEN’s RIIO-ED1 Load Growth Factors (annual average %)
SPM SPD
LCT driven Load Growth 0.4 0.2
Underlying Load Growth 1.2 1.6
Total 1.6 1.8
There is a degree of uncertainty regarding all of the factors above; in this section we explain our assumptions regarding the above factors underlying SPEN’s baseline LRE projections in RIIO-ED1. For ease of presentation we examine the impact of LCTs first and then the combined impact of economic growth, energy efficiency and DG. We then discuss the risks associated with SPEN’s LRE requirements in RIIO-ED1 and how this will be managed by SPEN including potential use of the RIIO-ED1 LRE re-openers.
9.2. Low Carbon Technologies (LCTs) There is uncertainty regarding the rate of take-up of these technologies during RIIO-ED1 and beyond. A key determinant of actual LCT take-up is how the UK responds to the government’s carbon reduction target of 80% by 2050. In Annex C6 – Expenditure Supplementary Annex – SPEN we explained that in order to put some bounds around these uncertainties the DECC in conjunction with the industry and Ofgem, constructed 4 scenarios or pathways to achieving the 2050 targets:
1. High emissions abatement in low carbon heat 2. High emissions abatement in transport 3. High electrification of heat and transport; and 4. Credit purchase
19
Risk and Uncertainty
These scenarios are explained in further detail in Annex C6 – Expenditure Supplementary Annex – SPEN, it should be noted that these scenarios also include projected trends of energy efficiency (insulation and electrical appliances). To enable companies to make practical use of these scenarios, the DNOs devised three investment strategies for achieving any of the 4 DECC scenarios; Top Down, Incremental and Business as Usual (BAU). These strategies are detailed in Annex C6 – Expenditure Supplementary Annex – SPEN.
The DNOs in conjunction with EA Technology have developed the Transform Model which maps the DECC scenarios and investment strategies to each DNO’s network projecting required capex up to 2050. The output of the Transform Model presents a range of potential capex forecasts over RIIO-ED1 and out to 2050 further detail is in Annex C6 – Expenditure Supplementary Annex – SPEN.
Identifying the risk and impact
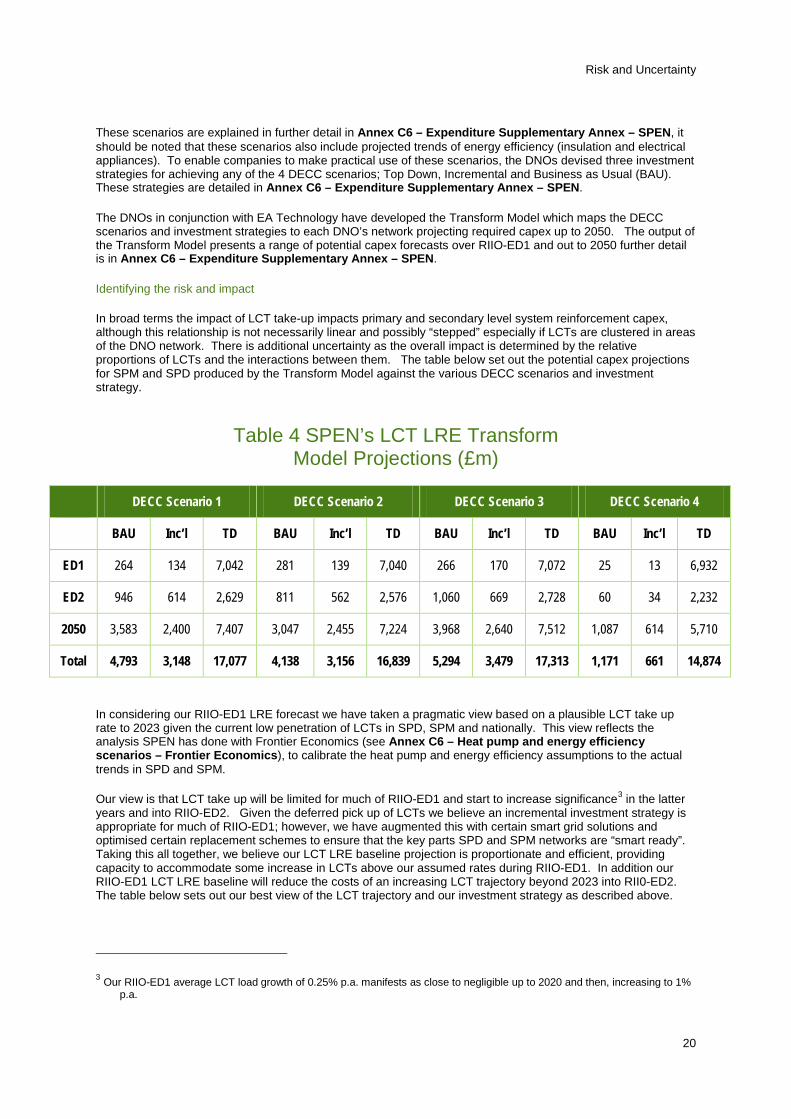
In broad terms the impact of LCT take-up impacts primary and secondary level system reinforcement capex, although this relationship is not necessarily linear and possibly “stepped” especially if LCTs are clustered in areas of the DNO network. There is additional uncertainty as the overall impact is determined by the relative proportions of LCTs and the interactions between them. The table below set out the potential capex projections for SPM and SPD produced by the Transform Model against the various DECC scenarios and investment strategy.
Table 4 SPEN’s LCT LRE Transform Model Projections (£m)
DECC Scenario 1 DECC Scenario 2 DECC Scenario 3 DECC Scenario 4
BAU Inc’l TD BAU Inc’l TD BAU Inc’l TD BAU Inc’l TD
ED1 264 134 7,042 281 139 7,040 266 170 7,072 25 13 6,932
ED2 946 614 2,629 811 562 2,576 1,060 669 2,728 60 34 2,232
2050 3,583 2,400 7,407 3,047 2,455 7,224 3,968 2,640 7,512 1,087 614 5,710
Total 4,793 3,148 17,077 4,138 3,156 16,839 5,294 3,479 17,313 1,171 661 14,874
In considering our RIIO-ED1 LRE forecast we have taken a pragmatic view based on a plausible LCT take up rate to 2023 given the current low penetration of LCTs in SPD, SPM and nationally. This view reflects the analysis SPEN has done with Frontier Economics (see Annex C6 – Heat pump and energy efficiency scenarios – Frontier Economics), to calibrate the heat pump and energy efficiency assumptions to the actual trends in SPD and SPM.
Our view is that LCT take up will be limited for much of RIIO-ED1 and start to increase significance3 in the latter years and into RIIO-ED2. Given the deferred pick up of LCTs we believe an incremental investment strategy is appropriate for much of RIIO-ED1; however, we have augmented this with certain smart grid solutions and optimised certain replacement schemes to ensure that the key parts SPD and SPM networks are “smart ready”. Taking this all together, we believe our LCT LRE baseline projection is proportionate and efficient, providing capacity to accommodate some increase in LCTs above our assumed rates during RIIO-ED1. In addition our RIIO-ED1 LCT LRE baseline will reduce the costs of an increasing LCT trajectory beyond 2023 into RII0-ED2. The table below sets out our best view of the LCT trajectory and our investment strategy as described above.
3 Our RIIO-ED1 average LCT load growth of 0.25% p.a. manifests as close to negligible up to 2020 and then, increasing to 1% p.a.
20
Risk and Uncertainty
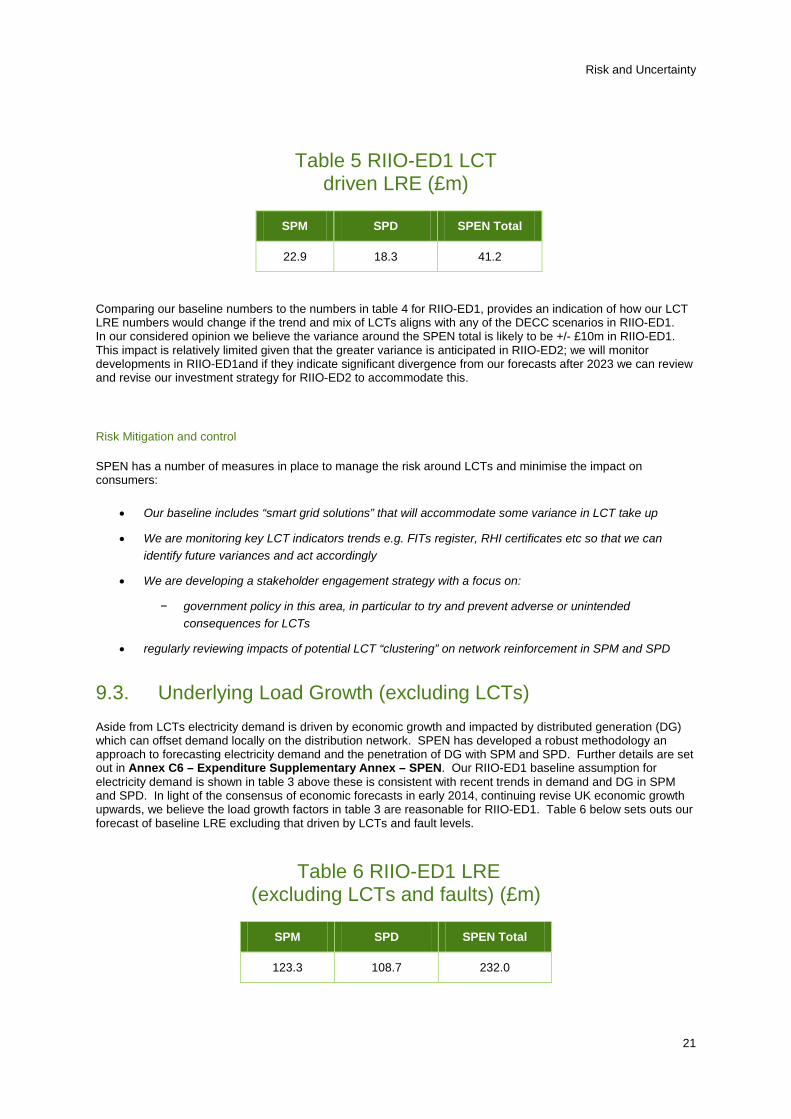
Table 5 RIIO-ED1 LCT
driven LRE (£m)
SPM SPD SPEN Total
22.9 18.3 41.2
Comparing our baseline numbers to the numbers in table 4 for RIIO-ED1, provides an indication of how our LCT LRE numbers would change if the trend and mix of LCTs aligns with any of the DECC scenarios in RIIO-ED1. In our considered opinion we believe the variance around the SPEN total is likely to be +/- £10m in RIIO-ED1. This impact is relatively limited given that the greater variance is anticipated in RIIO-ED2; we will monitor developments in RIIO-ED1and if they indicate significant divergence from our forecasts after 2023 we can review and revise our investment strategy for RIIO-ED2 to accommodate this.
Risk Mitigation and control
SPEN has a number of measures in place to manage the risk around LCTs and minimise the impact on consumers:
• Our baseline includes “smart grid solutions” that will accommodate some variance in LCT take up
• We are monitoring key LCT indicators trends e.g. FITs register, RHI certificates etc so that we can identify future variances and act accordingly
• We are developing a stakeholder engagement strategy with a focus on:
− government policy in this area, in particular to try and prevent adverse or unintended consequences for LCTs
• regularly reviewing impacts of potential LCT “clustering” on network reinforcement in SPM and SPD
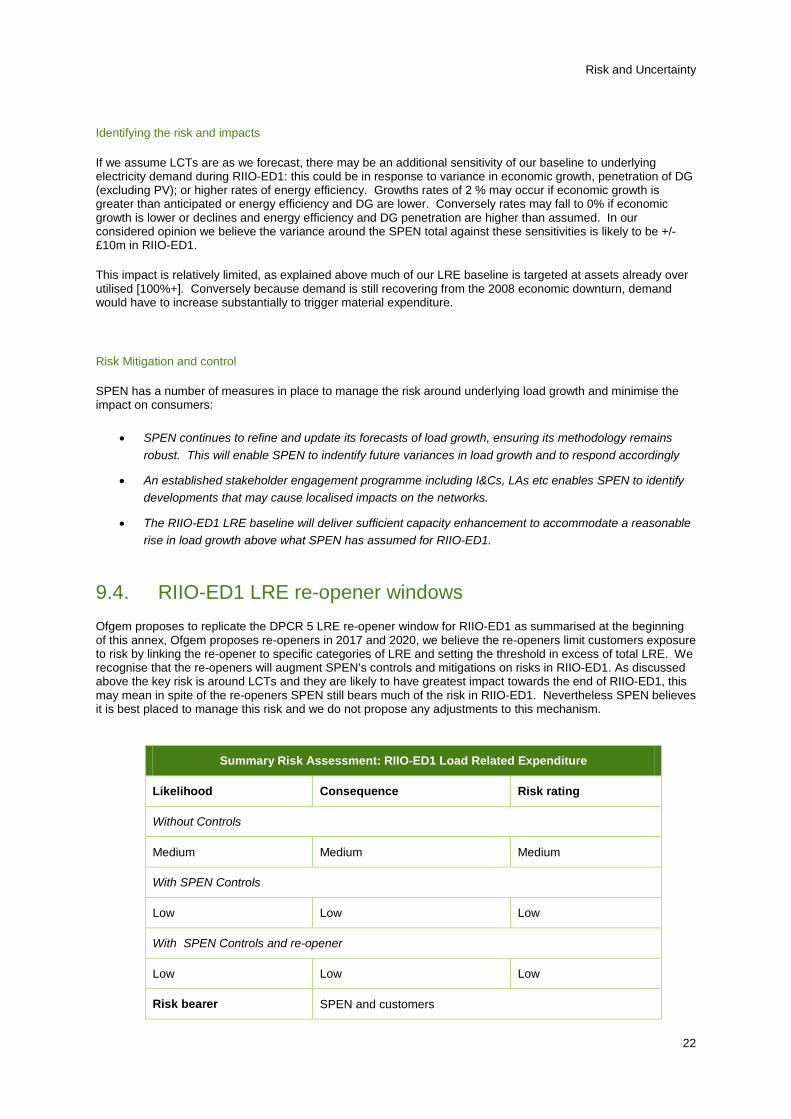
9.3. Underlying Load Growth (excluding LCTs) Aside from LCTs electricity demand is driven by economic growth and impacted by distributed generation (DG) which can offset demand locally on the distribution network. SPEN has developed a robust methodology an approach to forecasting electricity demand and the penetration of DG with SPM and SPD. Further details are set out in Annex C6 – Expenditure Supplementary Annex – SPEN. Our RIIO-ED1 baseline assumption for electricity demand is shown in table 3 above these is consistent with recent trends in demand and DG in SPM and SPD. In light of the consensus of economic forecasts in early 2014, continuing revise UK economic growth upwards, we believe the load growth factors in table 3 are reasonable for RIIO-ED1. Table 6 below sets outs our forecast of baseline LRE excluding that driven by LCTs and fault levels.
Table 6 RIIO-ED1 LRE (excluding LCTs and faults) (£m)
SPM SPD SPEN Total
123.3 108.7 232.0
21
Risk and Uncertainty
Identifying the risk and impacts
If we assume LCTs are as we forecast, there may be an additional sensitivity of our baseline to underlying electricity demand during RIIO-ED1: this could be in response to variance in economic growth, penetration of DG (excluding PV); or higher rates of energy efficiency. Growths rates of 2 % may occur if economic growth is greater than anticipated or energy efficiency and DG are lower. Conversely rates may fall to 0% if economic growth is lower or declines and energy efficiency and DG penetration are higher than assumed. In our considered opinion we believe the variance around the SPEN total against these sensitivities is likely to be +/- £10m in RIIO-ED1.
This impact is relatively limited, as explained above much of our LRE baseline is targeted at assets already over utilised [100%+]. Conversely because demand is still recovering from the 2008 economic downturn, demand would have to increase substantially to trigger material expenditure.
Risk Mitigation and control
SPEN has a number of measures in place to manage the risk around underlying load growth and minimise the impact on consumers:
• SPEN continues to refine and update its forecasts of load growth, ensuring its methodology remains robust. This will enable SPEN to indentify future variances in load growth and to respond accordingly
• An established stakeholder engagement programme including I&Cs, LAs etc enables SPEN to identify developments that may cause localised impacts on the networks.
• The RIIO-ED1 LRE baseline will deliver sufficient capacity enhancement to accommodate a reasonable rise in load growth above what SPEN has assumed for RIIO-ED1.
9.4. RIIO-ED1 LRE re-opener windows Ofgem proposes to replicate the DPCR 5 LRE re-opener window for RIIO-ED1 as summarised at the beginning of this annex, Ofgem proposes re-openers in 2017 and 2020, we believe the re-openers limit customers exposure to risk by linking the re-opener to specific categories of LRE and setting the threshold in excess of total LRE. We recognise that the re-openers will augment SPEN’s controls and mitigations on risks in RIIO-ED1. As discussed above the key risk is around LCTs and they are likely to have greatest impact towards the end of RIIO-ED1, this may mean in spite of the re-openers SPEN still bears much of the risk in RIIO-ED1. Nevertheless SPEN believes it is best placed to manage this risk and we do not propose any adjustments to this mechanism.
Summary Risk Assessment: RIIO-ED1 Load Related Expenditure
Likelihood Consequence Risk rating
Without Controls
Medium Medium Medium
With SPEN Controls
Low Low Low
With SPEN Controls and re-opener
Low Low Low
Risk bearer SPEN and customers
22

Risk and Uncertainty
10. Streetworks 10.1. Overview Authorities can utilise powers under various legislation, notably the New Roads and Street Works Act (NRSWA), the Traffic Management Act (TMA) and the Transport Scotland Act (TSA), to operate schemes to assist their road management. In general these street work schemes, constrain SPEN’s access to roads for example to repair cable faults or install connections, there are also restrictions on the durations of associated road works. SPEN has developed an effective strategy and approach to mitigate the impact of street works schemes on its operations and investment programme, in turn minimising costs to consumers. SPEN will maintain this approach throughout RIIO-ED1 but will be facing a potential for costs to increase significantly from current levels, this is an increased risk SPEN will manage in RIIO-ED1.
Identifying the risk and impacts
At present SPEN incurs street work costs of around £1.5m p.a. mainly associated with installing connections, capex and repairs to underground cable faults. These costs are associated with certain sections of NRSWA e.g. notices, reinstatement, overstay fines etc. Our baseline expenditure for RIIO-ED1 is based on a projection holding street work scheme and our administration costs to this level to 2023.
Authorities in England and Wales are starting to introduce permit schemes under the TMA; in 2012 St Helens was the first authority in SPM’s region to do so. We expect by 2015 all authorities in SPM’s region will have introduced permit schemes, accordingly we estimate total TMA permit costs for SPM could be up to £1.6m per year and totalling £11m for RIIO-ED1.
In Scotland Transport Scotland is consulting on a number of areas associated with street works including proposals to introduce a Contribution to Long Term Damage [of roads] scheme, available under NRSWA (s78). This would apply nationally, impacting all utilities in Scotland including SPD. Based on the information in the consultation we estimate SPD may face liabilities of £3.9m per year under the Long Term Damage scheme, we believe the scheme could be operational by late 2015 which would leave SPD incurring over £29m of costs in RIIO-ED1. As the Long Term Damage scheme is available under NRSWA it could also be introduced in England,
NRSWA also allows authorities to implement Lane Rental schemes which require utilities to pay the authority a rental for road works on any road in the area, prices are highest for those roads deemed to be sensitive routes. Our view is that there is still some way to go before Lane Rentals schemes are widely introduced. However we think it is plausible that some of the urban authorities in SPM’s region such as Liverpool, St Helens and Warrington may have introduced lane rental schemes by the latter years of RIIO-ED1. We estimate the annual costs of such schemes for SPEN could be around £18m by 2023.
Taking the combination of permits, long term damage and lane rentals, in RIIO-ED1 SPEN may be facing total costs in a plausible range of £14m up to £84m. For the avoidance of doubt these costs are not included in our baseline (ex-ante) allowance and therefore are risks that SPEN will manage during RIIO-ED1.
Risk Mitigation and control
SPEN has a proven and effective strategy and approach for minimising street works costs. The main features include:
• effective management of such schemes with authorities e.g. efficient noticing, challenging fines and penalties etc;
• planning and scheduling works and operations to minimise potential street work costs;
• robust operational management of road works in progress, to ensure fines and variations are minimised;
• promoting awareness with staff and contractors. involved in operations such faults and connections, so they don’t incur unnecessary costs;
23
Risk and Uncertainty
• management of our contractors to ensure they bear costs of inefficient performance e.g. fines and variations;
• stakeholder engagement e.g. with authorities, Transport Scotland, DfT etc to ensure schemes are only introduced where sufficiently justified and do not impose unduly onerous conditions on SPEN’s operations.
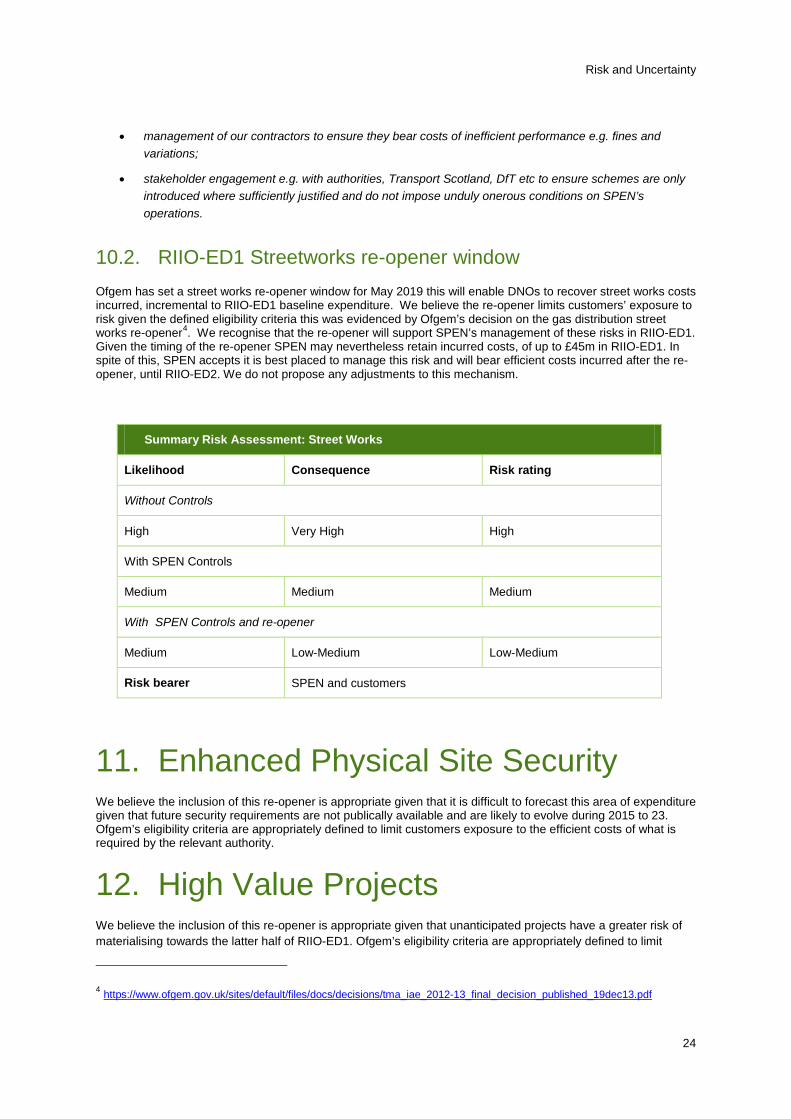
10.2. RIIO-ED1 Streetworks re-opener window Ofgem has set a street works re-opener window for May 2019 this will enable DNOs to recover street works costs incurred, incremental to RIIO-ED1 baseline expenditure. We believe the re-opener limits customers’ exposure to risk given the defined eligibility criteria this was evidenced by Ofgem’s decision on the gas distribution street works re-opener4. We recognise that the re-opener will support SPEN’s management of these risks in RIIO-ED1. Given the timing of the re-opener SPEN may nevertheless retain incurred costs, of up to £45m in RIIO-ED1. In spite of this, SPEN accepts it is best placed to manage this risk and will bear efficient costs incurred after the re-opener, until RIIO-ED2. We do not propose any adjustments to this mechanism.
Summary Risk Assessment: Street Works
Likelihood Consequence Risk rating
Without Controls
High Very High High
With SPEN Controls
Medium Medium Medium
With SPEN Controls and re-opener
Medium Low-Medium Low-Medium
Risk bearer SPEN and customers
11. Enhanced Physical Site Security We believe the inclusion of this re-opener is appropriate given that it is difficult to forecast this area of expenditure given that future security requirements are not publically available and are likely to evolve during 2015 to 23. Ofgem’s eligibility criteria are appropriately defined to limit customers exposure to the efficient costs of what is required by the relevant authority.
12. High Value Projects We believe the inclusion of this re-opener is appropriate given that unanticipated projects have a greater risk of materialising towards the latter half of RIIO-ED1. Ofgem’s eligibility criteria are appropriately defined to limit
4 https://www.ofgem.gov.uk/sites/default/files/docs/decisions/tma_iae_2012-13_final_decision_published_19dec13.pdf
24

Risk and Uncertainty
customers exposure to the efficient costs of the projects in question. SPEN does not have any HVPs in its RIIO-ED1 expenditure baseline.
13. Innovation Roll Out Mechanism As discussed earlier adoption of new technologies and solutions is a risk that SPEN manages as part of its business as usual approach. Such innovative solutions have a degree of risk associated with them given their early stage on the learning curve. We have outlined the approaches SPEN adopts to reduce these risks. We note that where we deal with innovations that are considerably greater in terms of costs and benefits we may seek to utilise the IRM re-opener windows to help manage this. We do not propose any changes to the IRM.
14. Established Pension Deficit We believe the proposed re-opener windows are appropriate given the occurrence of the DNOs’ triennial pension valuations over 2015-23. Ofgem’s pension principles are well established providing customers protection that they will only be exposed to efficiently incurred pension deficit costs. This mechanism is a continuation of Ofgem’s approach from DPCR 5.
15. Smart Meters and DCC Charges 15.1. Overview The government has mandated the Smart Meter Implementation Programme (SMIP) to start in 2015 and be completed by April 2020. Suppliers have statutory obligations to install smart meters in every household in the UK by 2020. SPEN recognises that the installation phase will present a number of risks and costs that must be managed effectively. Our smart meter strategy in Annex C7 – Smart Meter Strategy – SPEN sets out how we will achieve this. In contrast post rollout, SPEN believe smart meters present an opportunity to achieve benefits by enabling SPEN to innovate and improve its operations which offsets the costs that it will incur for the use of smart meter data.
Identifying the risks and impacts
Meter Installation
The main impact of smart meter rollout on SPEN will be the callouts to a percentage of households where there are problems to be rectified upstream of the meter, to enable the supplier to successfully install the smart meter. Issues include repositioning meter boxes, inspecting and altering services (cable heads) and replacing asbestos meter boards. In addition there will be callouts to incidents triggered by faulty installation of smart meters and erroneous call outs where a problem is mistakenly attributed to SPEN. We have based our estimates on the Ofgem guidance of around 2% of installations, or 82,000 households, between 2015 and 2020 will result in callouts. The total RIIO-ED1 costs associated with these callouts are around £17m and are included in our baseline expenditure. The uncertainties around this forecast comprise:
• Unit cost related – as set out in our smart meter strategy, SPEN is planning to optimise its resources so it can respond to callouts at an efficient cost. SPEN’s planning is dependent on the suppliers’ smart meter rollout profiles if these change significantly between 2015 and 2020 this may require SPEN to revise its resourcing at short notice which would impose additional costs. In addition there may be unforeseen problems arising from smart meter installations which require different actions from DNOs or may cause the identified callout issues to be more complex
• Volume related – we presently forecast around 2%-3% of installations will trigger a call out however there have been very few smart meters installed to date on which to verify this assumption. An increase of callouts by an additional 1% would increase costs by £12.4m. There will also be instances of aborted call outs where we attend but cannot assist the supplier. We will look to recover such costs from
25
Risk and Uncertainty
suppliers as they have unduly caused us to incur the cost.
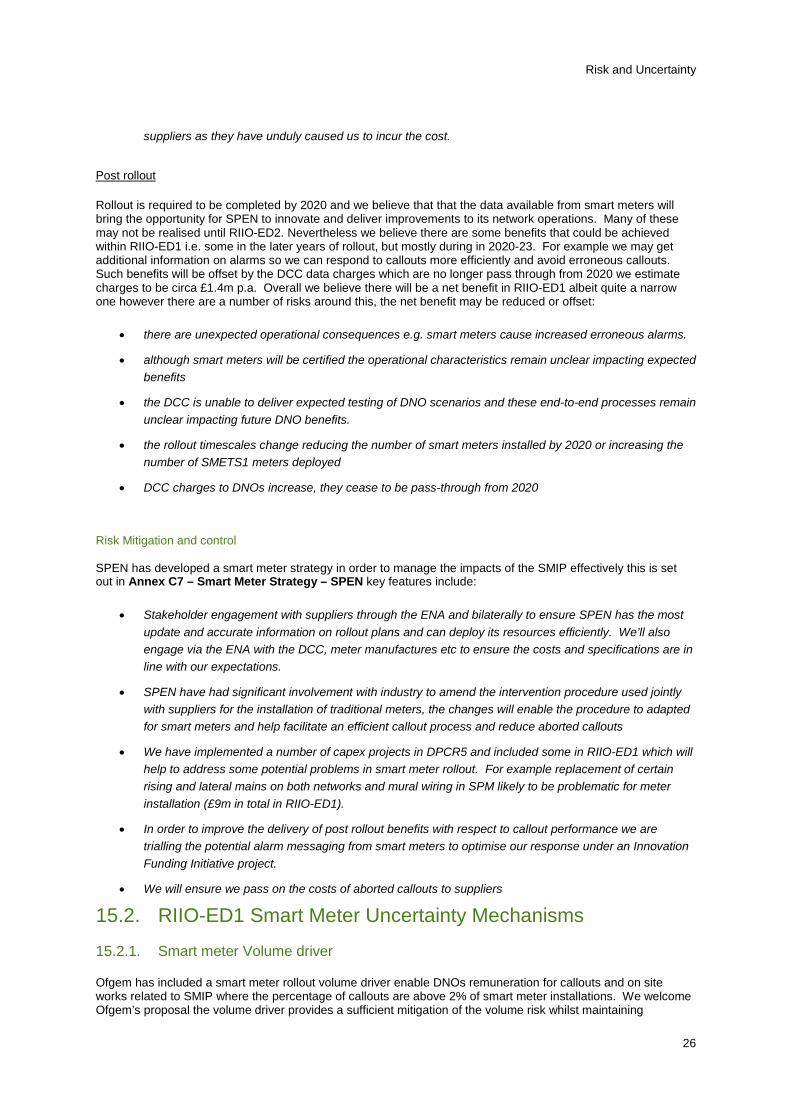
Post rollout
Rollout is required to be completed by 2020 and we believe that that the data available from smart meters will bring the opportunity for SPEN to innovate and deliver improvements to its network operations. Many of these may not be realised until RIIO-ED2. Nevertheless we believe there are some benefits that could be achieved within RIIO-ED1 i.e. some in the later years of rollout, but mostly during in 2020-23. For example we may get additional information on alarms so we can respond to callouts more efficiently and avoid erroneous callouts. Such benefits will be offset by the DCC data charges which are no longer pass through from 2020 we estimate charges to be circa £1.4m p.a. Overall we believe there will be a net benefit in RIIO-ED1 albeit quite a narrow one however there are a number of risks around this, the net benefit may be reduced or offset:
• there are unexpected operational consequences e.g. smart meters cause increased erroneous alarms.
• although smart meters will be certified the operational characteristics remain unclear impacting expected benefits
• the DCC is unable to deliver expected testing of DNO scenarios and these end-to-end processes remain unclear impacting future DNO benefits.
• the rollout timescales change reducing the number of smart meters installed by 2020 or increasing the number of SMETS1 meters deployed
• DCC charges to DNOs increase, they cease to be pass-through from 2020
Risk Mitigation and control SPEN has developed a smart meter strategy in order to manage the impacts of the SMIP effectively this is set out in Annex C7 – Smart Meter Strategy – SPEN key features include:
• Stakeholder engagement with suppliers through the ENA and bilaterally to ensure SPEN has the most update and accurate information on rollout plans and can deploy its resources efficiently. We’ll also engage via the ENA with the DCC, meter manufactures etc to ensure the costs and specifications are in line with our expectations.
• SPEN have had significant involvement with industry to amend the intervention procedure used jointly with suppliers for the installation of traditional meters, the changes will enable the procedure to adapted for smart meters and help facilitate an efficient callout process and reduce aborted callouts
• We have implemented a number of capex projects in DPCR5 and included some in RIIO-ED1 which will help to address some potential problems in smart meter rollout. For example replacement of certain rising and lateral mains on both networks and mural wiring in SPM likely to be problematic for meter installation (£9m in total in RIIO-ED1).
• In order to improve the delivery of post rollout benefits with respect to callout performance we are trialling the potential alarm messaging from smart meters to optimise our response under an Innovation Funding Initiative project.
• We will ensure we pass on the costs of aborted callouts to suppliers
15.2. RIIO-ED1 Smart Meter Uncertainty Mechanisms
15.2.1. Smart meter Volume driver
Ofgem has included a smart meter rollout volume driver enable DNOs remuneration for callouts and on site works related to SMIP where the percentage of callouts are above 2% of smart meter installations. We welcome Ofgem’s proposal the volume driver provides a sufficient mitigation of the volume risk whilst maintaining
26
Risk and Uncertainty
appropriate incentives on the DNOs to maintain cost efficiency throughout the SMIP. Given our smart meter strategy SPEN is confident it can manage the unit cost risks during the SMIP, we are not proposing any further amendments to this uncertainty mechanism,
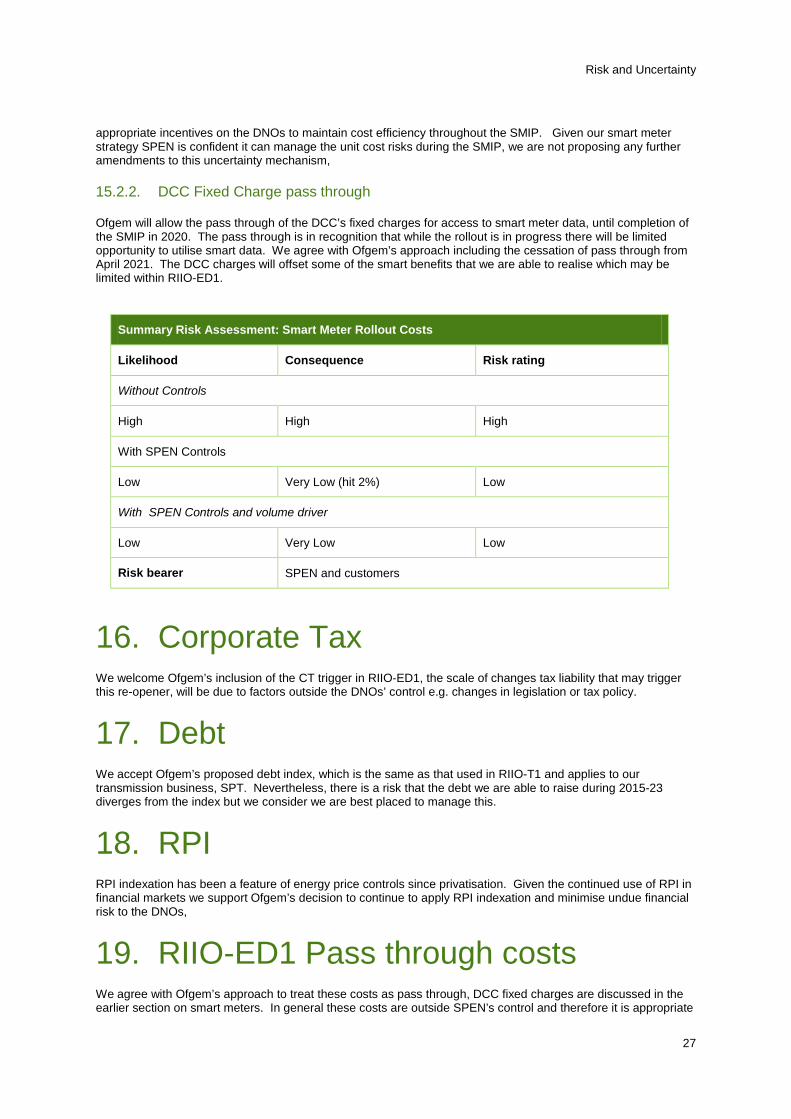
15.2.2. DCC Fixed Charge pass through
Ofgem will allow the pass through of the DCC’s fixed charges for access to smart meter data, until completion of the SMIP in 2020. The pass through is in recognition that while the rollout is in progress there will be limited opportunity to utilise smart data. We agree with Ofgem’s approach including the cessation of pass through from April 2021. The DCC charges will offset some of the smart benefits that we are able to realise which may be limited within RIIO-ED1.
Summary Risk Assessment: Smart Meter Rollout Costs
Likelihood Consequence Risk rating
Without Controls
High High High
With SPEN Controls
Low Very Low (hit 2%) Low
With SPEN Controls and volume driver
Low Very Low Low
Risk bearer SPEN and customers
16. Corporate Tax We welcome Ofgem’s inclusion of the CT trigger in RIIO-ED1, the scale of changes tax liability that may trigger this re-opener, will be due to factors outside the DNOs’ control e.g. changes in legislation or tax policy.
17. Debt We accept Ofgem’s proposed debt index, which is the same as that used in RIIO-T1 and applies to our transmission business, SPT. Nevertheless, there is a risk that the debt we are able to raise during 2015-23 diverges from the index but we consider we are best placed to manage this.
18. RPI RPI indexation has been a feature of energy price controls since privatisation. Given the continued use of RPI in financial markets we support Ofgem’s decision to continue to apply RPI indexation and minimise undue financial risk to the DNOs,
19. RIIO-ED1 Pass through costs We agree with Ofgem’s approach to treat these costs as pass through, DCC fixed charges are discussed in the earlier section on smart meters. In general these costs are outside SPEN’s control and therefore it is appropriate
27

Risk and Uncertainty
for them as pass through. We accept that in relation to business rates we can have an influence on the rateable value and therefore we agree with Ofgem’s decision to assess DNO’s performance at the 2017 valuations as a pre-condition of continued pass through.
20. Modelling of Financial Risk In assessing the financial risk around our RII0-ED1 business plan, we looked at the likely impacts on financeability with reference to credit ratings. We commissioned economic consultants (NERA) to develop a financeability risk model to enable us to undertake this assessment. NERA’s report, describing their modelling methodology is included in Annex C8 – Risk Modelling for RIIO-ED1 – NERA. We used this risk model to demonstrate that our preferred financeability scenario delivers an efficiently financeable plan that will offer an adequate return to investors at the lowest possible cost to customers. The model simulates (by Monte Carlo) the individual and aggregate credit metrics over the full range of plausible outcomes as described in the risk analysis section of Chapter C9 – Financing.
For each risk, we identified what we believe to be the plausible distribution of outcomes for an average network business. Our benchmark overall credit rating (‘overall’ meaning including non-financial ratio components) for is one solidly within the A to Baa (Moody’s) range of credit rating, more specifically A3 or Baa1. As part of our core assumption we used a post-tax, cost of equity of 6.4% and notional gearing of 65%.
The results of this modelling show that the median credit rating achieved by SPM and SPD over 2015 to 2023, against the risks, were in broad terms, consistently within the target range A3 to Baa1. However, for SP Manweb there is a considerable downside risk of its credit rating falling below investment grade, which will likely require an equity injection, in mitigation.
21. Conclusions The purpose of this Annex has been to demonstrate SPEN has identified and understands the risks it facing in delivering this business plan in RIIO-ED1. We have also identified the risks that SPEN are managing wholly or partially (and we have set out how we will do this) and those which are managed through the RIIO-ED1. We have modelled the financial risk associated with delivering this business plan in terms of the expected credit ratings.
The risk that a company is perceived to face is a key factor in determining its equity risk premium (ERP) which in turn is part of the cost of equity. In Chapter C9 – Financing, we detail evidence of the market’s view of SPEN’s ERP. In this annex we have clearly identified that SPEN is managing a substantial level of risk, the RIIO-ED1 uncertainty mechanism mitigate some this risk but this still leaves the majority as residual risk that SPEN has chosen to bear and manage rather than impose on consumers. We believe this level of residual risk is appropriate to be placed on SPEN but this requires a commensurate cost of equity of 6.4%, as a minimum, to finance the delivery of this business plan.
28