Embed Size (px)
Citation preview
Water distribution tests using different water spray nozzles
Magnus Arvidson
SP Arbetsrapport 2009:04
SP
Tec
hnic
al R
esea
rch
Inst
itute
of S
wed
en

Water distribution tests using different water spray nozzles Magnus Arvidson
3
Abstract Water distribution tests using different water spray nozzles The objective of the tests was to determine the water distribution characteristics of two different water spray systems and a high-pressure water mist system under non-fire conditions, simulating a ro-ro vehicle deck on board a ship. The results indicate that a reasonably uniform distribution of water was achieved when the vertical distance from the top of a trailer to the tips of the nozzles was 650 mm. When this vertical distance was reduced to 250 mm, the distribution was rather non-uniform over the area between the nozzles. Key words: Ships, ro-ro decks, sprinklers, water mist, water distribution, discharge tests SP Sveriges Tekniska Forskningsinstitut SP Technical Research Institute of Sweden SP Arbetsrapport 2009:04 ISBN ISSN 0284-5172 Borås 2009
4
Contents Abstract 3
Contents 4
Preface 5
Sammanfattning 6
1 Objective 7
2 The test set-up 7
3 The nozzles used in the tests 8 3.1 Medium velocity nozzles 8 3.2 Medium to high velocity nozzles 9 3.3 High-pressure water mist nozzles 10
4 Discussion and conclusions 10
Appendix A: The test set-up 11
Appendix B: Water discharge diagrams and photos 12
5
Preface The tests described within this report were conducted as part of the IMPRO-project, “Improved water-based fire suppression and drainage systems for ro-ro vehicle decks”. The project is sponsored by VINNOVA, the Swedish Governmental Agency for Innovation Systems (project number P31711-1), the Swedish Mercantile Marine Foundation, Brandforsk, the Fire Research Board (project number 401-081) and the Swedish Maritime Administration. The input and work by Ultra Fog AB for the delivery and installation of the high-pressure water mist system and of TYCO Fire Suppression & Building Products (Sweden AB) and Viking SA for the delivery of the water spray nozzles is acknowledged. The help from Ms Ulrika Beckman during the fire tests is gratefully acknowledged. The internal SP project number was BRd 6001.
6
Sammanfattning Rapporten beskriver en serie vattendistributionsförsök med vattenspraymunstycken av typen ’medium velocity, ’medium to high velocity’ och vattendimma (högtryck). Försöken genomfördes med en försöksuppställning som efterliknade två stycken trailers, sida vid sida på ett ro-ro däck. Fyra alternativt fem stycken munstycken installerades ovanför uppställning och försök genomfördes med olika vattentryck och vattenflöde. Det vertikala avståndet från toppen av en trailer till munstyckena var antingen 250 mm eller 650 mm. Vattnet samlades upp i ett antal uppsamlingskärl och vattenfördelningen beräknades. Resultaten visar att en någorlunda jämn fördelning av vattnet uppnås när det vertikala avståndet från toppen av en trailer till munstyckena är 650 mm. När avståndet var 250 mm når relativt lite vatten området mellan munstyckena.
7
1 Objective The objective of the tests was to determine the water distribution characteristics of two different water spray systems and a high-pressure water mist system under non-fire conditions, simulating a ro-ro vehicle deck on board a ship. The tests were conducted at system operating pressures that corresponded to nominal water discharge densities ranging from 5 mm/min to 15 mm/min for the water spray systems and 2,8 mm/min for the high-pressure water mist system. The majority of the tests with the water spray systems were conducted at water pressures in excess of the recommended (by the manufacturer) maximum operating pressures. The intent of this approach was to generate smaller water droplets and higher velocity water sprays. Whether this will improve the fire suppression, gas cooling and heat attenuation capabilities of the systems would need to be determined in actual fire testing. This evaluation is planned as part of an upcoming part of the project.
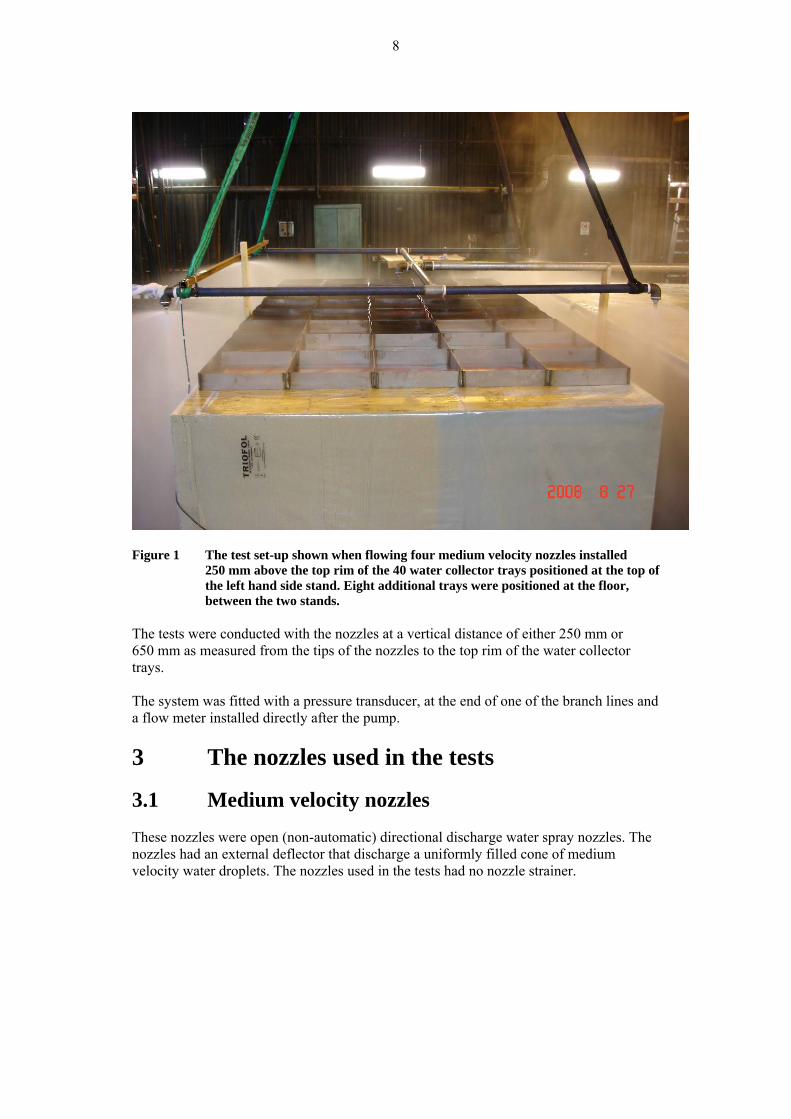
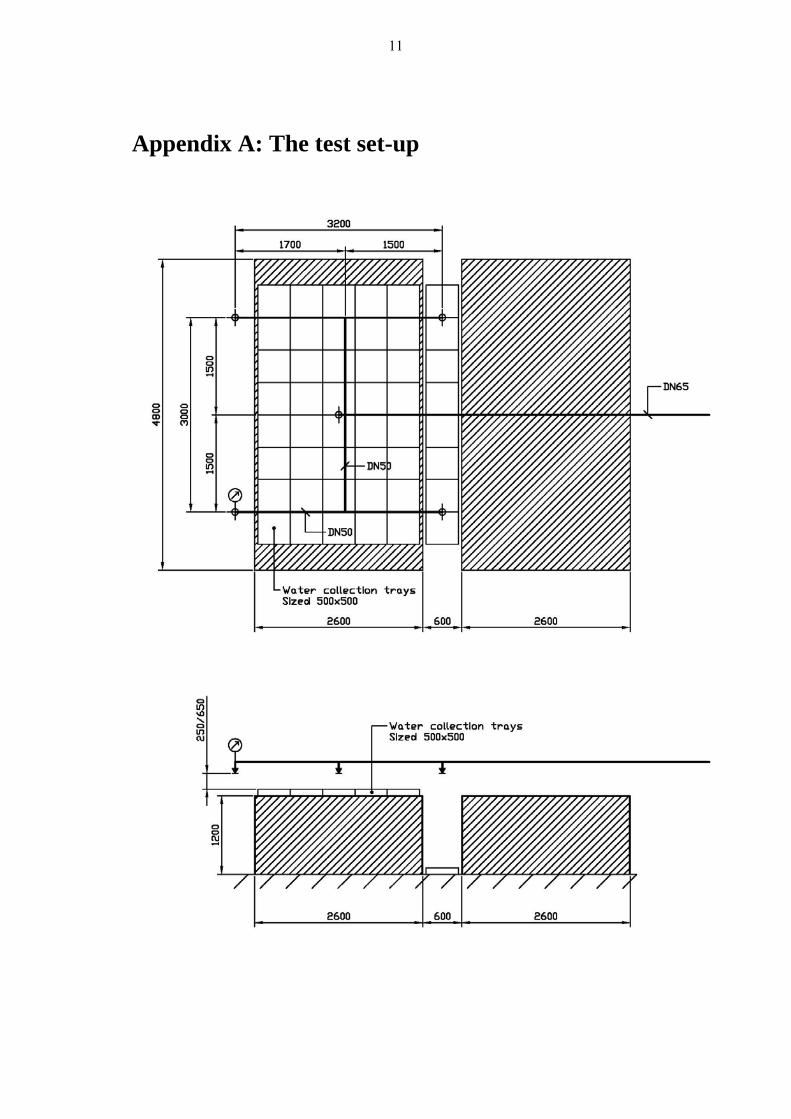
2 The test set-up The test set-up consisted of two ‘stands’ positioned side-by-side in order to simulate the top parts of two freight truck trailers on a ro-ro deck. Each stand measured 4800 mm by 2600 mm (L × W) and the height was 1200 mm. The horizontal distance measured between the parallel long sides of the stands was 600 mm. The water discharge densities were measured at the top of one of the stands and at floor level, between the stands with a total of 48 water collector trays. Each tray measured 500 mm by 500 mm and had a height of 100 mm. The individual discharge tests was conducted for either one or two minutes and the amount of water in each tray was determined by weighing the water collected. A piping arrangement was fabricated consisting of a single feed tree system. The system consisted of two DN50 (2″) branch lines with nozzle connections for four nozzles at a 3,2 m by 3,0 m nozzle spacing, i.e. a coverage area of 9,6 m2 per nozzle. An additional nozzle connection was installed at the centre point between the four nozzles to allow for a total of five nozzles. The system was fed through a DN65 (1½″) main that was connected to the public main via a pump. A photo of the test set-up is shown in figure 1 and a detailed drawing in Appendix 1.
8
Figure 1 The test set-up shown when flowing four medium velocity nozzles installed
250 mm above the top rim of the 40 water collector trays positioned at the top of the left hand side stand. Eight additional trays were positioned at the floor, between the two stands.
The tests were conducted with the nozzles at a vertical distance of either 250 mm or 650 mm as measured from the tips of the nozzles to the top rim of the water collector trays. The system was fitted with a pressure transducer, at the end of one of the branch lines and a flow meter installed directly after the pump.
3 The nozzles used in the tests 3.1 Medium velocity nozzles These nozzles were open (non-automatic) directional discharge water spray nozzles. The nozzles had an external deflector that discharge a uniformly filled cone of medium velocity water droplets. The nozzles used in the tests had no nozzle strainer.
9
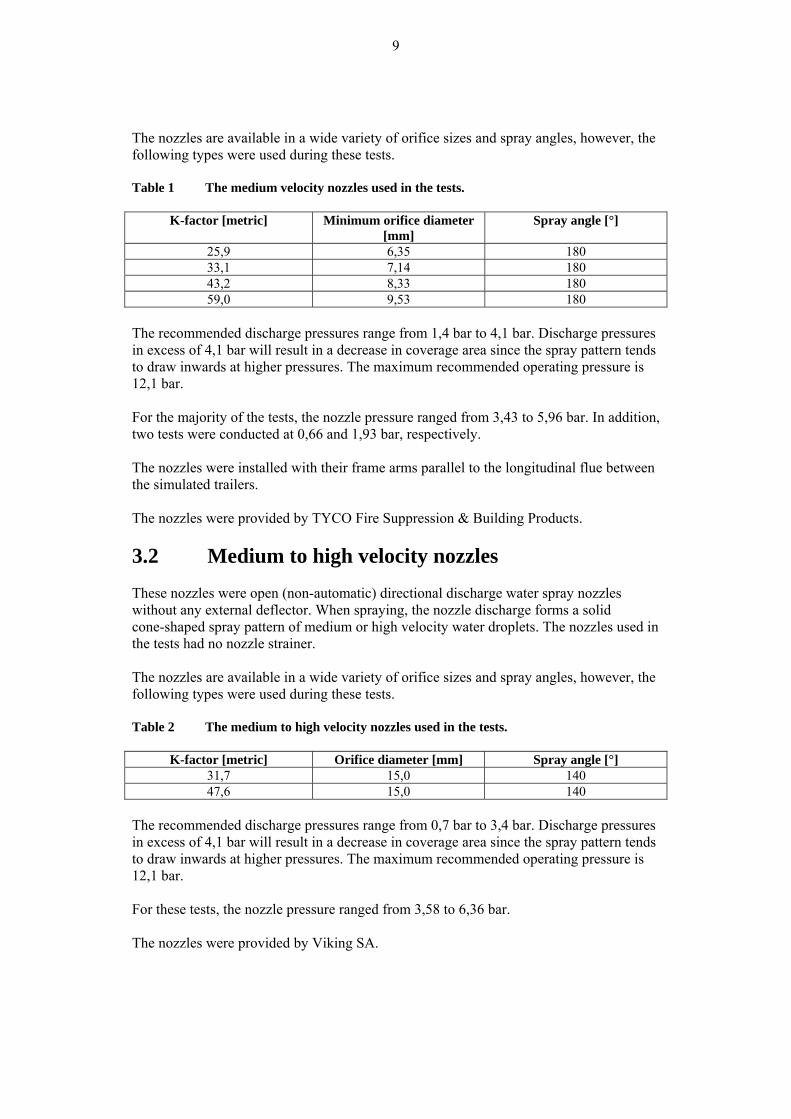
The nozzles are available in a wide variety of orifice sizes and spray angles, however, the following types were used during these tests. Table 1 The medium velocity nozzles used in the tests.
K-factor [metric] Minimum orifice diameter [mm]
Spray angle [°]
25,9 6,35 180 33,1 7,14 180 43,2 8,33 180 59,0 9,53 180
The recommended discharge pressures range from 1,4 bar to 4,1 bar. Discharge pressures in excess of 4,1 bar will result in a decrease in coverage area since the spray pattern tends to draw inwards at higher pressures. The maximum recommended operating pressure is 12,1 bar. For the majority of the tests, the nozzle pressure ranged from 3,43 to 5,96 bar. In addition, two tests were conducted at 0,66 and 1,93 bar, respectively. The nozzles were installed with their frame arms parallel to the longitudinal flue between the simulated trailers. The nozzles were provided by TYCO Fire Suppression & Building Products. 3.2 Medium to high velocity nozzles These nozzles were open (non-automatic) directional discharge water spray nozzles without any external deflector. When spraying, the nozzle discharge forms a solid cone-shaped spray pattern of medium or high velocity water droplets. The nozzles used in the tests had no nozzle strainer. The nozzles are available in a wide variety of orifice sizes and spray angles, however, the following types were used during these tests. Table 2 The medium to high velocity nozzles used in the tests.
K-factor [metric] Orifice diameter [mm] Spray angle [°] 31,7 15,0 140 47,6 15,0 140
The recommended discharge pressures range from 0,7 bar to 3,4 bar. Discharge pressures in excess of 4,1 bar will result in a decrease in coverage area since the spray pattern tends to draw inwards at higher pressures. The maximum recommended operating pressure is 12,1 bar. For these tests, the nozzle pressure ranged from 3,58 to 6,36 bar. The nozzles were provided by Viking SA.
10
3.3 High-pressure water mist nozzles One type of high-pressure water mist nozzle was tested. This nozzle was an open (non-automatic) multi-orifice nozzle without any external deflector. When spraying, the nozzle discharge forms a solid cone-shaped spray pattern of small high velocity water droplets with a spray angle of approximately 160°. The K-factor of the nozzle was 2,7 (metric). The recommended discharge pressures range from 60 bar to 120 bar, however, all tests were conducted at 100 bar. For some of the tests, a 300 mm by 300 mm thin steel plate was installed directly above the nozzles. The intent was to change the airflow around the nozzles, thereby increasing the spray angle. The nozzles were provided by ULTRA FOG AB, and can be identified in drawing no. 950606-020 with washer 0.8 (drawings not included).
4 Discussion and conclusions The following could be concluded from the tests: • The discharge of the medium velocity nozzles was rather non-uniform at the 250 mm
clearance as the water distribution over the area between the nozzles was fairly poor. However, the overall uniformity improved significantly at a clearance of 650 mm.
• The same conclusion holds for the high to medium velocity nozzles and it can be concluded that the 140° spray angle was too narrow for the low clearance.
• The use of five nozzles improved the uniformity for both the medium and medium to high velocity nozzles. However, the measured density was high directly under the fifth nozzle, especially at the low clearance. The primary reason for this higher density directly under the fifth nozzle at low clearance was not a higher degree of discharge directly under the nozzle, rather that the rims of the closest trays caught water from the water spray and prevented it from being distributed to the adjacent trays.
• The discharge of the high-pressure water mist nozzles was rather non-uniform at the 250 mm clearance, but improved at a clearance of 650 mm. The small steel plate installed directly above the high-pressure water mist nozzles increased the spray angle and improved the uniformity of the discharge.
• Visually, the high-pressure water mist nozzles created a cloud of small droplets above the top of the stand. These droplets had high mobility and followed the air stream generated by the nozzles.
11
Appendix A: The test set-up
12
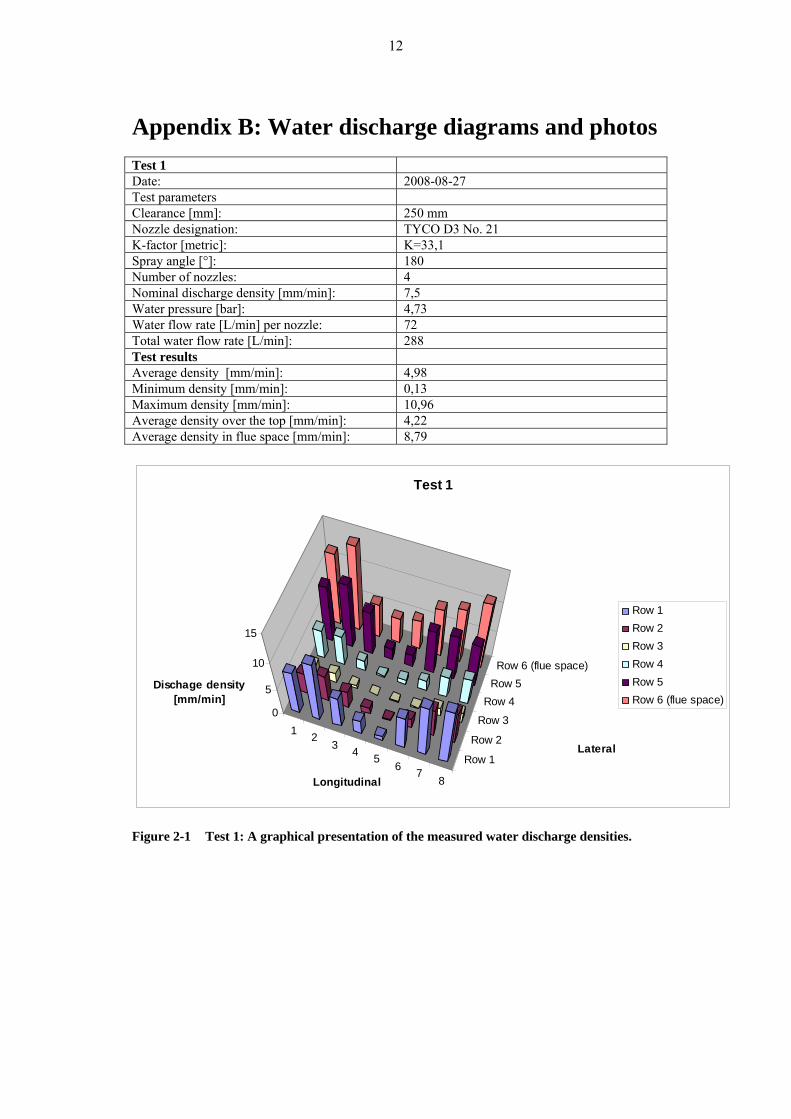
Appendix B: Water discharge diagrams and photos Test 1 Date: 2008-08-27 Test parameters Clearance [mm]: 250 mm Nozzle designation: TYCO D3 No. 21 K-factor [metric]: K=33,1 Spray angle [°]: 180 Number of nozzles: 4 Nominal discharge density [mm/min]: 7,5 Water pressure [bar]: 4,73 Water flow rate [L/min] per nozzle: 72 Total water flow rate [L/min]: 288 Test results Average density [mm/min]: 4,98 Minimum density [mm/min]: 0,13 Maximum density [mm/min]: 10,96 Average density over the top [mm/min]: 4,22 Average density in flue space [mm/min]: 8,79
1 23 4 5
6 78
Row 1
Row 2
Row 3
Row 4Row 5Row 6 (flue space)
0
5
10
15
Dischage density [mm/min]
Longitudinal
Lateral
Test 1
Row 1Row 2Row 3Row 4Row 5Row 6 (flue space)
Figure 2-1 Test 1: A graphical presentation of the measured water discharge densities.
13
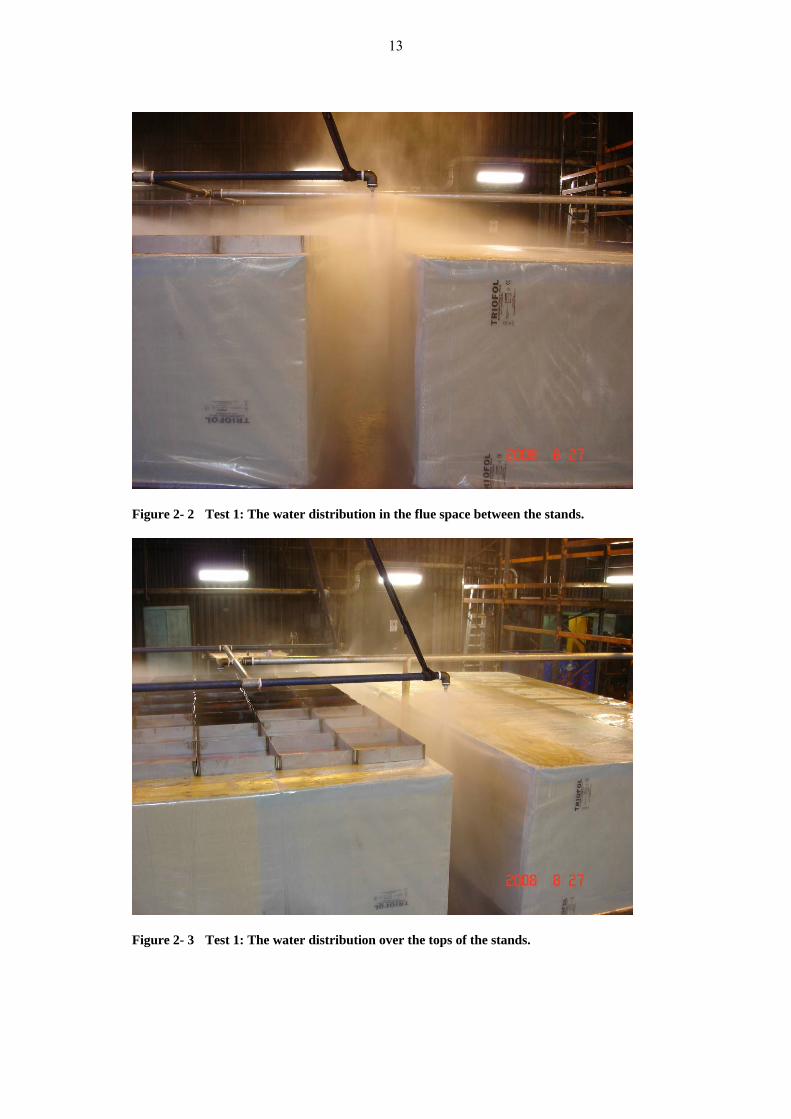
Figure 2- 2 Test 1: The water distribution in the flue space between the stands.
Figure 2- 3 Test 1: The water distribution over the tops of the stands.
14
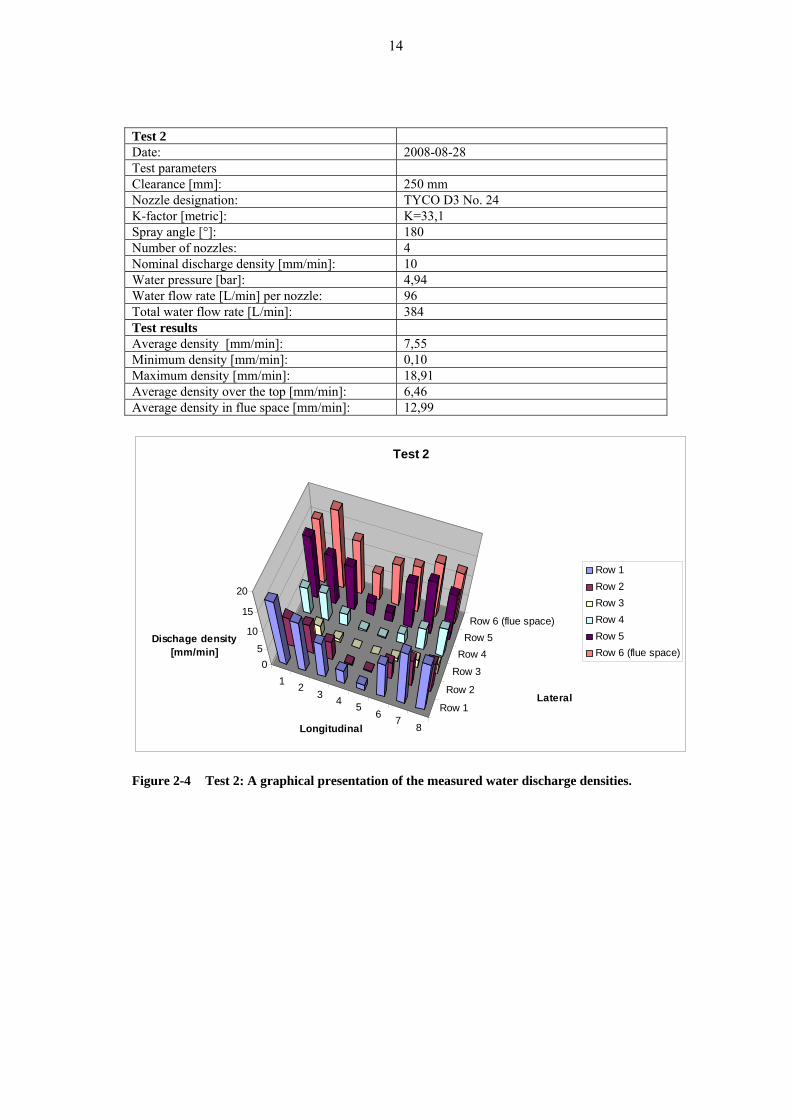
Test 2 Date: 2008-08-28 Test parameters Clearance [mm]: 250 mm Nozzle designation: TYCO D3 No. 24 K-factor [metric]: K=33,1 Spray angle [°]: 180 Number of nozzles: 4 Nominal discharge density [mm/min]: 10 Water pressure [bar]: 4,94 Water flow rate [L/min] per nozzle: 96 Total water flow rate [L/min]: 384 Test results Average density [mm/min]: 7,55 Minimum density [mm/min]: 0,10 Maximum density [mm/min]: 18,91 Average density over the top [mm/min]: 6,46 Average density in flue space [mm/min]: 12,99
1 23 4 5
6 78
Row 1
Row 2
Row 3
Row 4Row 5Row 6 (flue space)
05
10
15
20
Dischage density [mm/min]
Longitudinal
Lateral
Test 2
Row 1Row 2Row 3Row 4Row 5Row 6 (flue space)
Figure 2-4 Test 2: A graphical presentation of the measured water discharge densities.
15
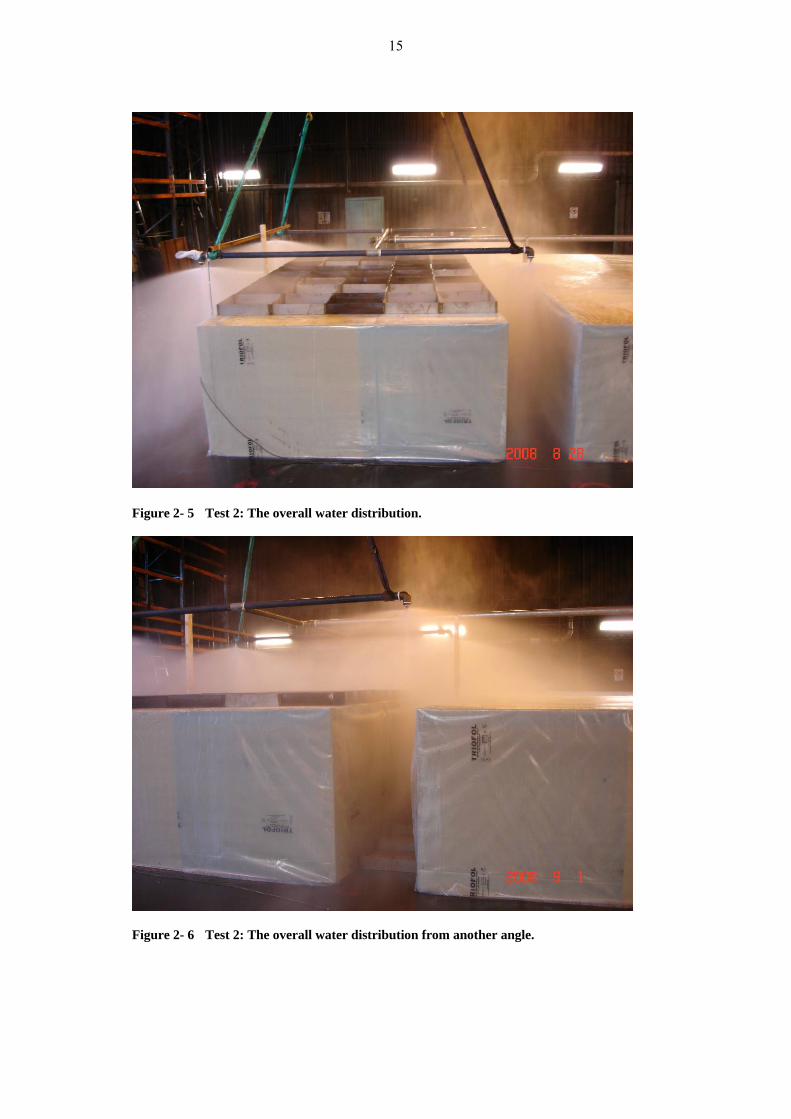
Figure 2- 5 Test 2: The overall water distribution.
Figure 2- 6 Test 2: The overall water distribution from another angle.

16
Test 3 Date: 2008-08-28 Test parameters Clearance [mm]: 250 mm Nozzle designation: TYCO D3 No. 28 K-factor [metric]: K=59,0 Spray angle [°]: 180 Number of nozzles: 4 Nominal discharge density [mm/min]: 12,5 Water pressure [bar]: 4,14 Water flow rate [L/min] per nozzle: 120 Total water flow rate [L/min]: 480 Test results Average density [mm/min]: 9,25 Minimum density [mm/min]: 0,07 Maximum density [mm/min]: 22,28 Average density over the top [mm/min]: 8,72 Average density in flue space [mm/min]: 11,88
1 23 4 5
6 78
Row 1
Row 2
Row 3
Row 4Row 5Row 6 (flue space)
0
10
20
30
Dischage density [mm/min]
Longitudinal
Lateral
Test 3
Row 1Row 2Row 3Row 4Row 5Row 6 (flue space)
Figure 2-7 Test 3: A graphical presentation of the measured water discharge densities.
17
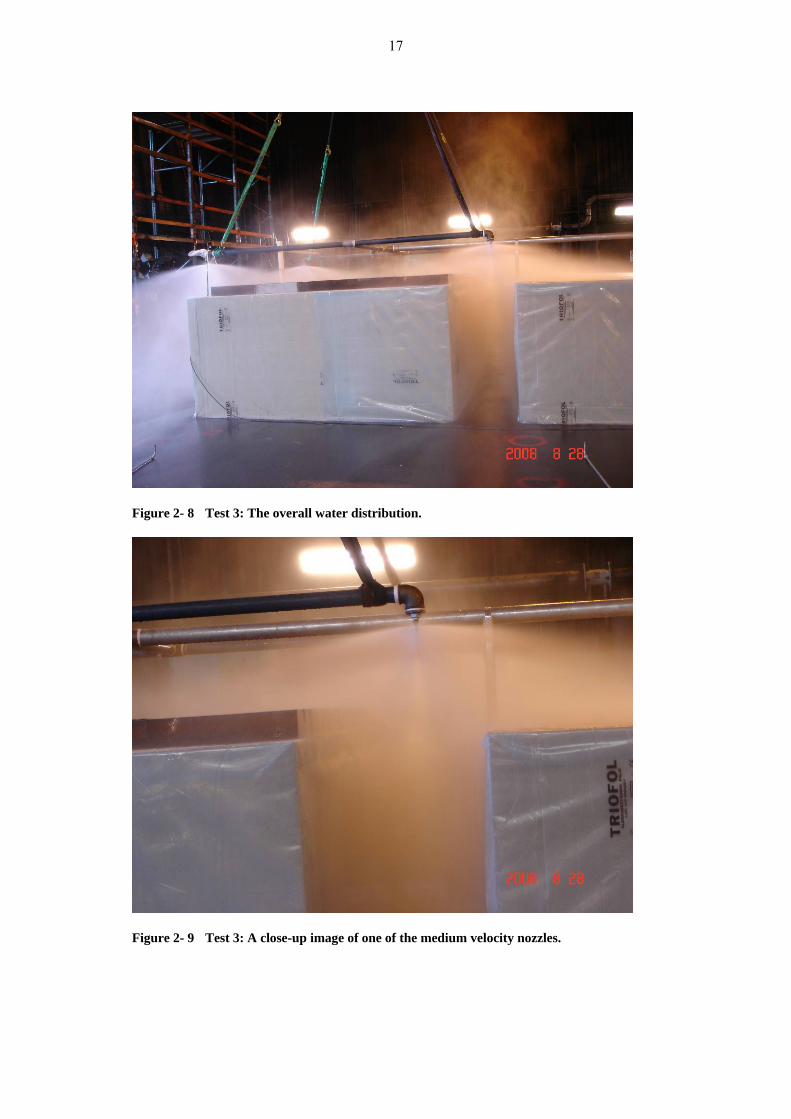
Figure 2- 8 Test 3: The overall water distribution.
Figure 2- 9 Test 3: A close-up image of one of the medium velocity nozzles.

18
Test 4 Date: 2008-08-28 Test parameters Clearance [mm]: 250 mm Nozzle designation: Ultra Fog type B K-factor [metric]: 2,7 Spray angle [°]: 160 Number of nozzles: 4 Nominal discharge density [mm/min]: 2,8 Water pressure [bar]: 100 Water flow rate [L/min] per nozzle: 27 Total water flow rate [L/min]: 108 Test results Average density [mm/min]: 1,86 Minimum density [mm/min]: 0,08 Maximum density [mm/min]: 4,75 Average density over the top [mm/min]: 1,97 Average density in flue space [mm/min]: 1,29
12 3
4 56 7
8
Row 1
Row 2
Row 3
Row 4
Row 5Row 6 (flue space)
02
4
6
8
Dischage density [mm/min]
Longitudinal
Lateral
Test 4
Row 1Row 2Row 3Row 4Row 5Row 6 (flue space)
Figure 2-10 Test 4: A graphical presentation of the measured water discharge densities.
19
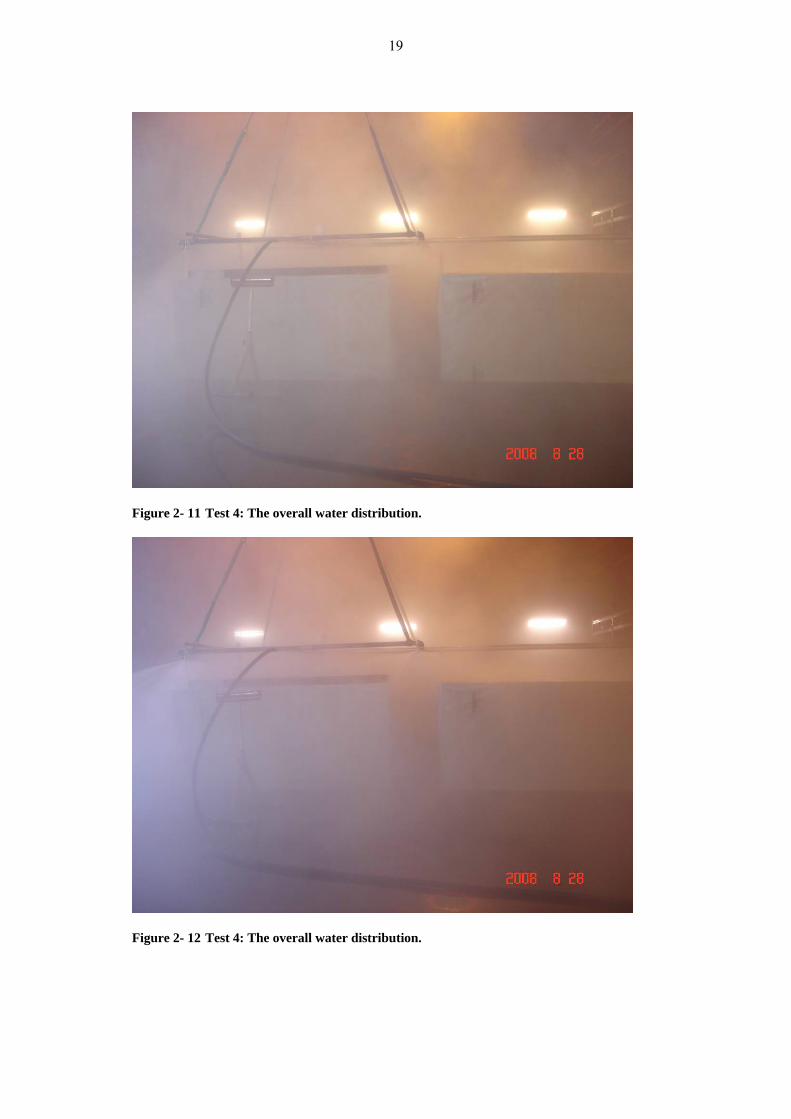
Figure 2- 11 Test 4: The overall water distribution.
Figure 2- 12 Test 4: The overall water distribution.

20
Test 5 Date: 2008-08-29 Test parameters Clearance [mm]: 250 mm Nozzle designation: Ultra Fog type B, with a small steel plate above
the nozzles K-factor [metric]: 2,7 Spray angle [°]: 160 Number of nozzles: 4 Nominal discharge density [mm/min]: 2,8 Water pressure [bar]: 100 Water flow rate [L/min] per nozzle: 27 Total water flow rate [L/min]: 108 Test results Average density [mm/min]: 2,05 Minimum density [mm/min]: 0,34 Maximum density [mm/min]: 7,69 Average density over the top [mm/min]: 2,19 Average density in flue space [mm/min]: 1,31
12 3
4 56 7
8
Row 1
Row 2
Row 3
Row 4
Row 5Row 6 (flue space)
02
4
6
8
Dischage density [mm/min]
Longitudinal
Lateral
Test 5
Row 1Row 2Row 3Row 4Row 5Row 6 (flue space)
Figure 2-13 Test 5: A graphical presentation of the measured water discharge densities.
21
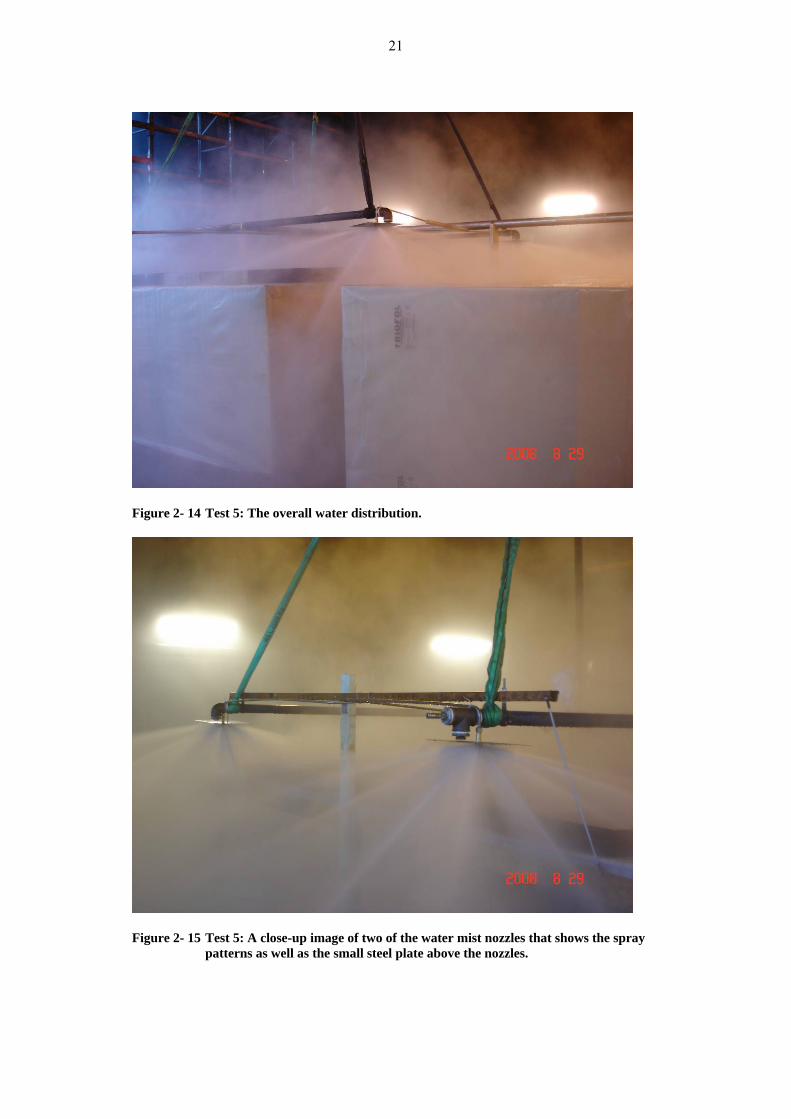
Figure 2- 14 Test 5: The overall water distribution.
Figure 2- 15 Test 5: A close-up image of two of the water mist nozzles that shows the spray
patterns as well as the small steel plate above the nozzles.
22
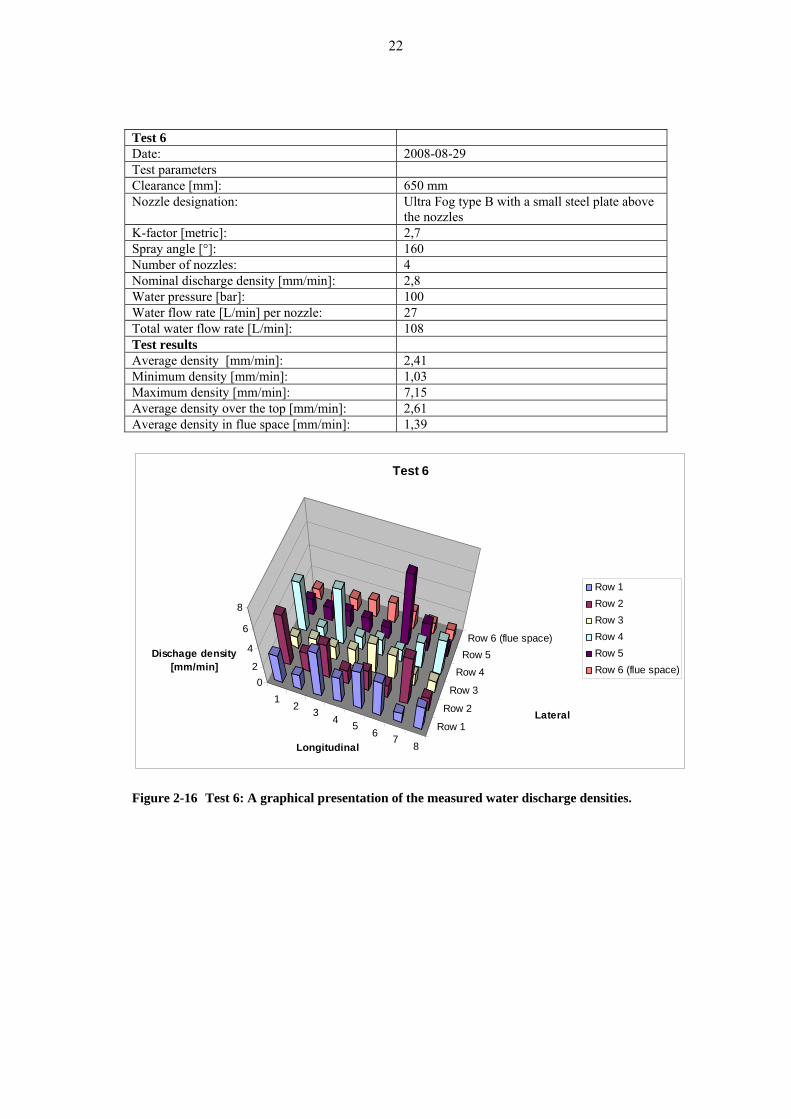
Test 6 Date: 2008-08-29 Test parameters Clearance [mm]: 650 mm Nozzle designation: Ultra Fog type B with a small steel plate above
the nozzles K-factor [metric]: 2,7 Spray angle [°]: 160 Number of nozzles: 4 Nominal discharge density [mm/min]: 2,8 Water pressure [bar]: 100 Water flow rate [L/min] per nozzle: 27 Total water flow rate [L/min]: 108 Test results Average density [mm/min]: 2,41 Minimum density [mm/min]: 1,03 Maximum density [mm/min]: 7,15 Average density over the top [mm/min]: 2,61 Average density in flue space [mm/min]: 1,39
12 3
4 56 7
8
Row 1
Row 2
Row 3
Row 4
Row 5Row 6 (flue space)
02
4
6
8
Dischage density [mm/min]
Longitudinal
Lateral
Test 6
Row 1Row 2Row 3Row 4Row 5Row 6 (flue space)
Figure 2-16 Test 6: A graphical presentation of the measured water discharge densities.
23
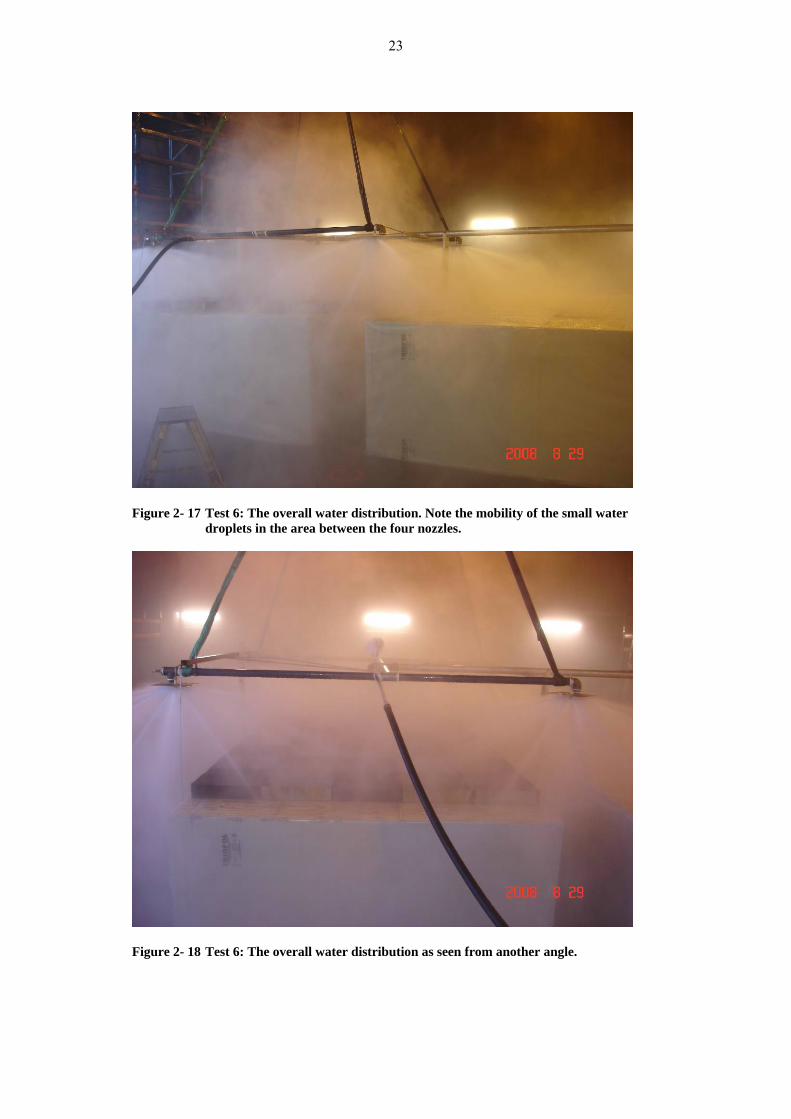
Figure 2- 17 Test 6: The overall water distribution. Note the mobility of the small water
droplets in the area between the four nozzles.
Figure 2- 18 Test 6: The overall water distribution as seen from another angle.

24
Test 7 Date: 2008-08-29 Test parameters Clearance [mm]: 650 mm Nozzle designation: TYCO D3, No. 21 K-factor [metric]: 33,1 Spray angle [°]: 180 Number of nozzles: 4 Nominal discharge density [mm/min]: 7,5 Water pressure [bar]: 4,73 Water flow rate [L/min] per nozzle: 72 Total water flow rate [L/min]: 288 Test results Average density [mm/min]: 6,79 Minimum density [mm/min]: 3,13 Maximum density [mm/min]: 12,57 Average density over the top [mm/min]: 6,73 Average density in flue space [mm/min]: 7,08
1 23 4 5
6 78
Row 1
Row 2
Row 3
Row 4Row 5Row 6 (flue space)
0
5
10
15
Dischage density [mm/min]
Longitudinal
Lateral
Test 7
Row 1Row 2Row 3Row 4Row 5Row 6 (flue space)
Figure 2-19 Test 7: A graphical presentation of the measured water discharge densities.
25
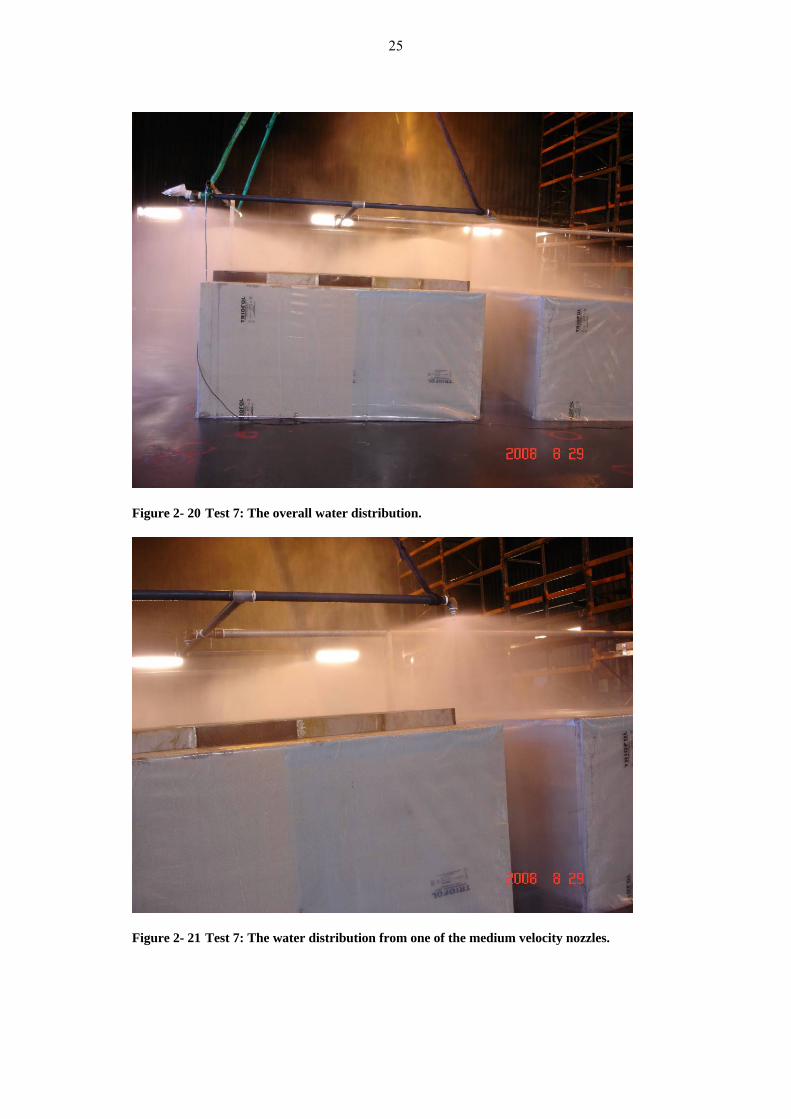
Figure 2- 20 Test 7: The overall water distribution.
Figure 2- 21 Test 7: The water distribution from one of the medium velocity nozzles.

26
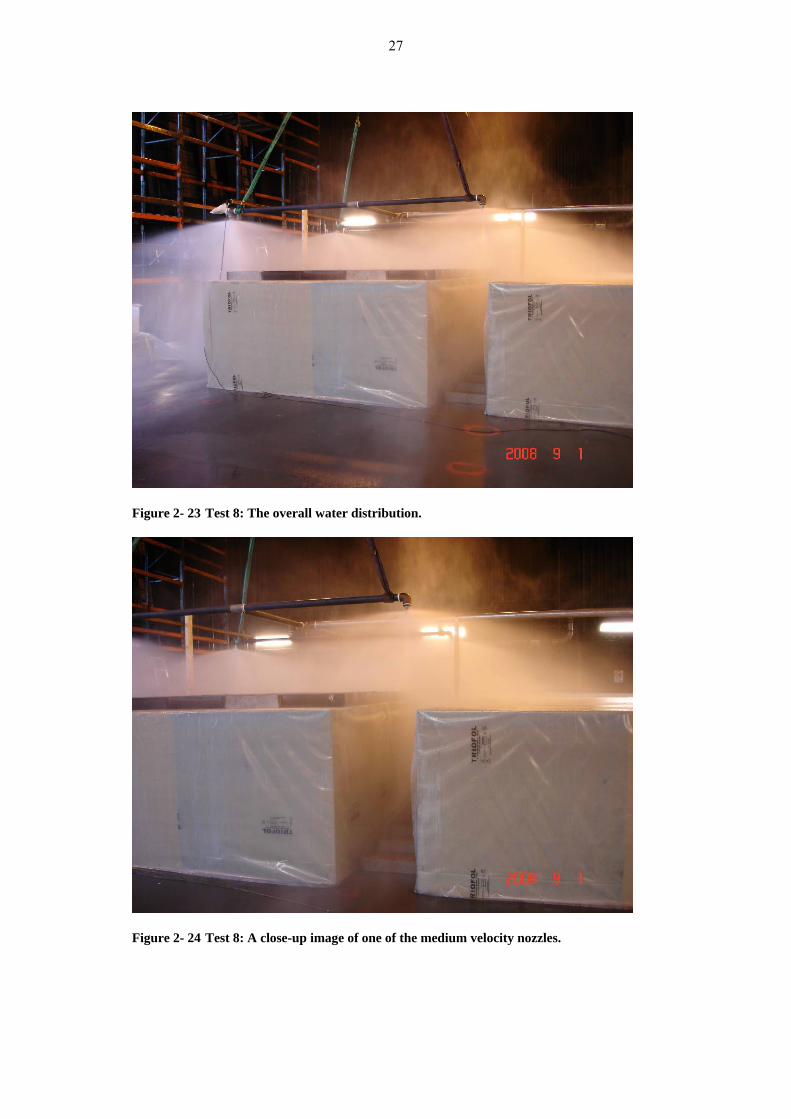
Test 8 Date: 2008-09-01 Test parameters Clearance [mm]: 650 mm Nozzle designation: TYCO D3, No. 24 K-factor [metric]: 43,2 Spray angle [°]: 180 Number of nozzles: 4 Nominal discharge density [mm/min]: 10 Water pressure [bar]: 4,94 Water flow rate [L/min] per nozzle: 96 Total water flow rate [L/min]: 384 Test results Average density [mm/min]: 8,31 Minimum density [mm/min]: 3,25 Maximum density [mm/min]: 15,09 Average density over the top [mm/min]: 8,31 Average density in flue space [mm/min]: 8,31
1 23 4 5
6 78
Row 1
Row 2
Row 3
Row 4Row 5Row 6 (flue space)
05
10
15
20
Dischage density [mm/min]
Longitudunal
Lateral
Test 8
Row 1Row 2Row 3Row 4Row 5Row 6 (flue space)
Figure 2-22 Test 8: A graphical presentation of the measured water discharge densities.
27
Figure 2- 23 Test 8: The overall water distribution.
Figure 2- 24 Test 8: A close-up image of one of the medium velocity nozzles.

28
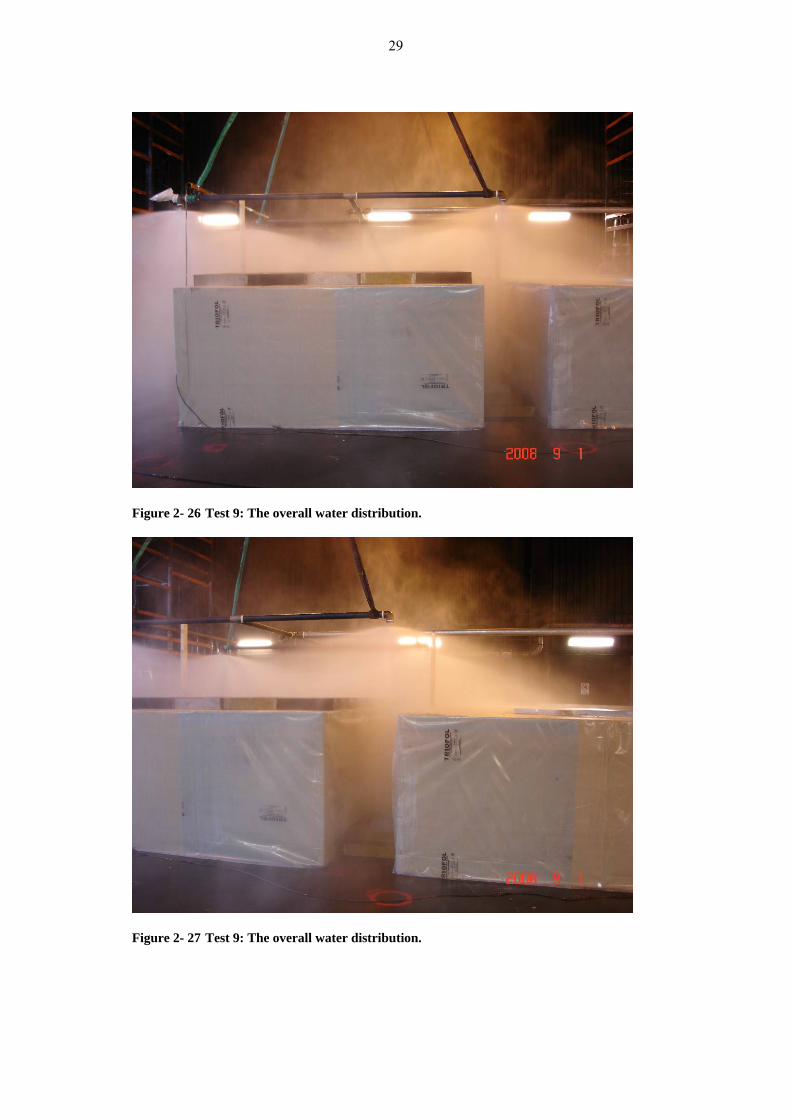
Test 9 Date: 2008-09-01 Test parameters Clearance [mm]: 650 mm Nozzle designation: TYCO D3, No. 28 K-factor [metric]: 59,0 Spray angle [°]: 180 Number of nozzles: 4 Nominal discharge density [mm/min]: 12,5 Water pressure [bar]: 4,14 Water flow rate [L/min] per nozzle: 120 Total water flow rate [L/min]: 480 Test results Average density [mm/min]: 11,22 Minimum density [mm/min]: 7,16 Maximum density [mm/min]: 18,58 Average density over the top [mm/min]: 11,61 Average density in flue space [mm/min]: 9,30
1 23 4 5
6 78
Row 1
Row 2
Row 3
Row 4Row 5Row 6 (flue space)
05
10
15
20
Dischage density [mm/min]
Longitudinal
Lateral
Test 9
Row 1Row 2Row 3Row 4Row 5Row 6 (flue space)
Figure 2-25 Test 9: A graphical presentation of the measured water discharge densities.
29
Figure 2- 26 Test 9: The overall water distribution.
Figure 2- 27 Test 9: The overall water distribution.

30
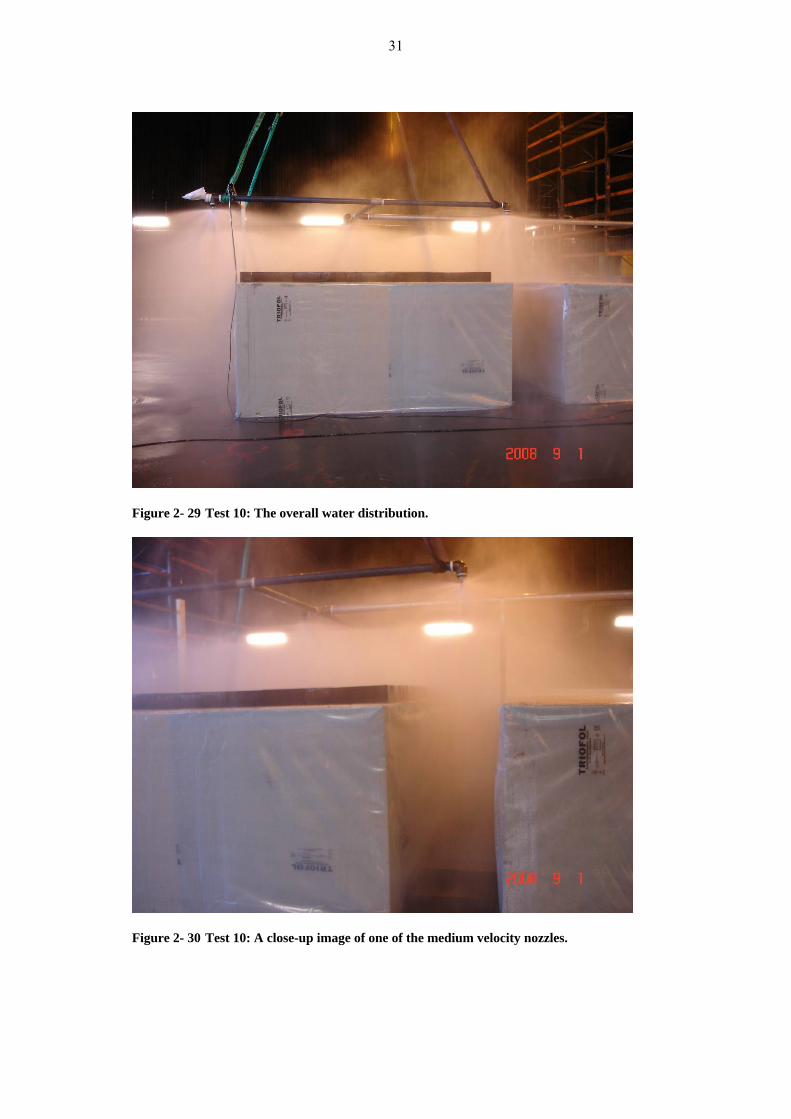
Test 10 Date: 2008-09-01 Test parameters Clearance [mm]: 650 mm Nozzle designation: TYCO D3, No. 18 K-factor [metric]: Spray angle [°]: 180 Number of nozzles: 5 Nominal discharge density [mm/min]: 12,5 Water pressure [bar]: 5,37 Water flow rate [L/min] per nozzle: 60 Total water flow rate [L/min]: 300 Test results Average density [mm/min]: 9,34 Minimum density [mm/min]: 5,30 Maximum density [mm/min]: 30,58 Average density over the top [mm/min]: 10,26 Average density in flue space [mm/min]: 8,34
1 23 4 5
6 78
Row 1
Row 2
Row 3
Row 4Row 5Row 6 (flue space)
010
20
30
40
Dischage density [mm/min]
Longitudinal
Lateral
Test 10
Row 1Row 2Row 3Row 4Row 5Row 6 (flue space)
Figure 2-28 Test 10: A graphical presentation of the measured water discharge densities.
31
Figure 2- 29 Test 10: The overall water distribution.
Figure 2- 30 Test 10: A close-up image of one of the medium velocity nozzles.

32
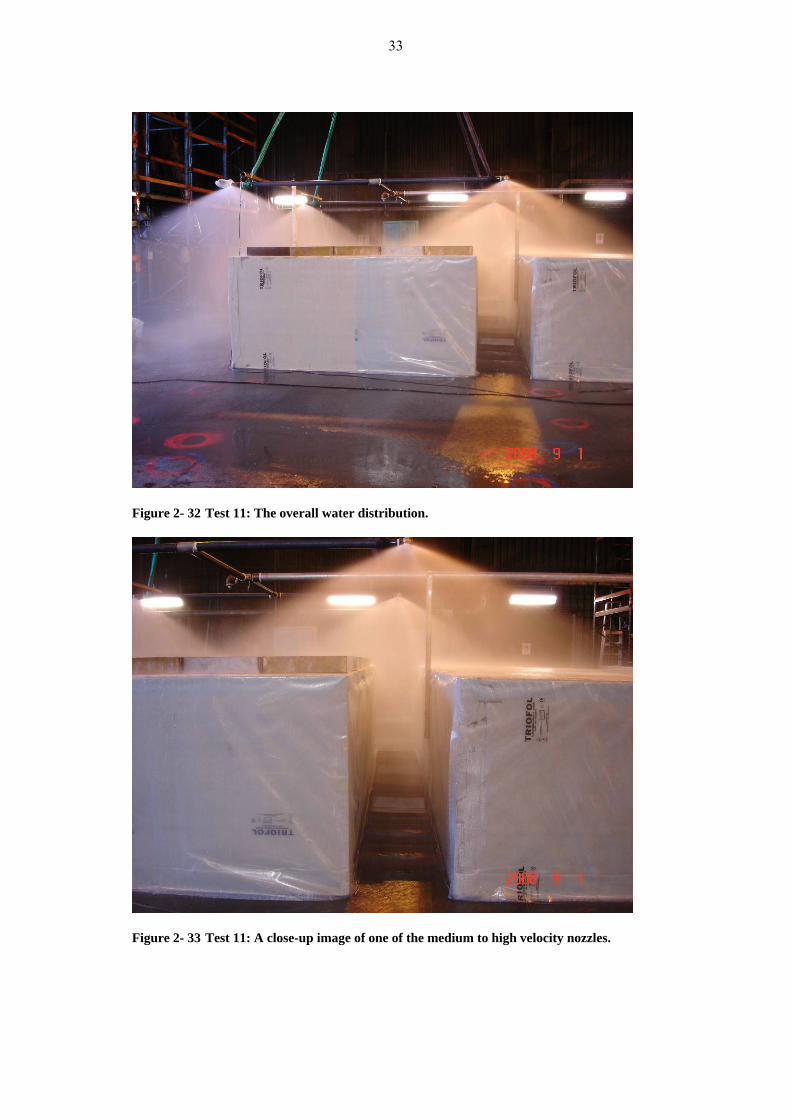
Test 11 Date: 2008-09-01 Test parameters Clearance [mm]: 650 mm Nozzle designation: Viking A-2X K-factor [metric]: 31,7 Spray angle [°]: 140 Number of nozzles: 4 Nominal discharge density [mm/min]: 7,5 Water pressure [bar]: 5,16 Water flow rate [L/min] per nozzle: 72 Total water flow rate [L/min]: 288 Test results Average density [mm/min]: 6,12 Minimum density [mm/min]: 0,14 Maximum density [mm/min]: 15,18 Average density over the top [mm/min]: 6,12 Average density in flue space [mm/min]: 6,16
1 23 4 5
6 78
Row 1
Row 2
Row 3
Row 4Row 5Row 6 (flue space)
0
10
20
30
Dischage density [mm/min]
Logitudinal
Lateral
Test 11
Row 1Row 2Row 3Row 4Row 5Row 6 (flue space)
Figure 2-31 Test 11: A graphical presentation of the measured water discharge densities.
33
Figure 2- 32 Test 11: The overall water distribution.
Figure 2- 33 Test 11: A close-up image of one of the medium to high velocity nozzles.

34
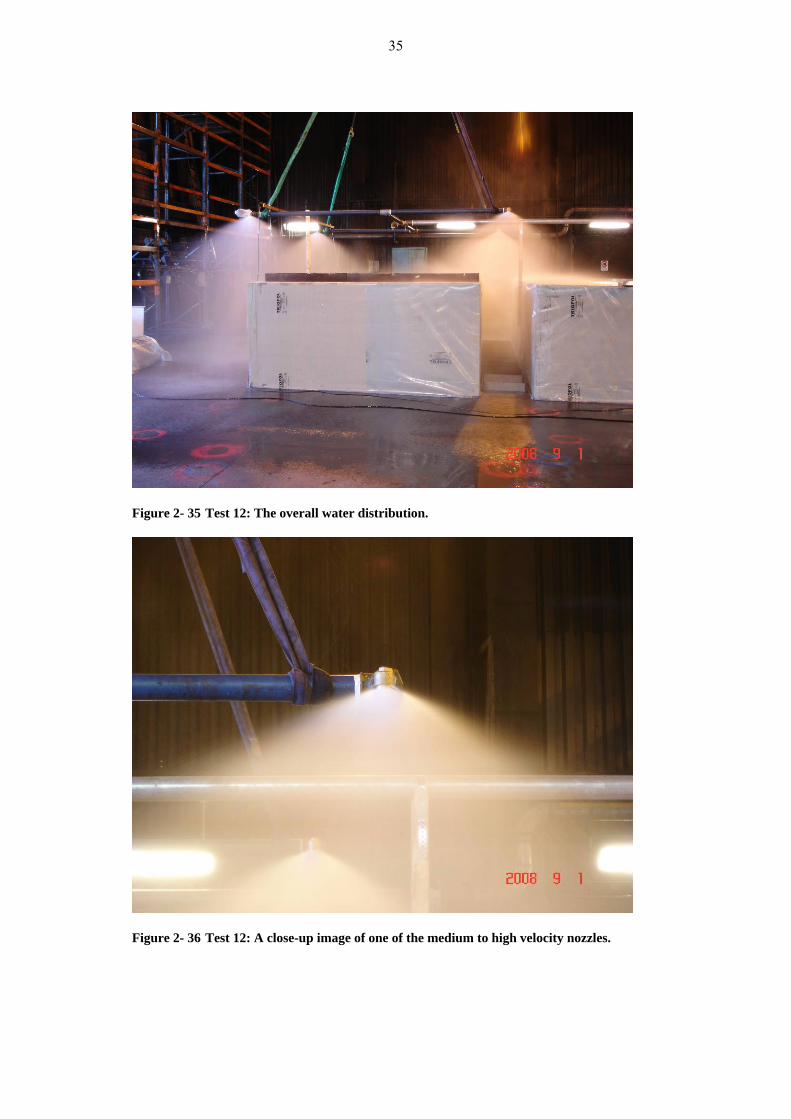
Test 12 Date: 2008-09-01 Test parameters Clearance [mm]: 650 mm Nozzle designation: Viking B-2 K-factor [metric]: 47,6 Spray angle [°]: 140 Number of nozzles: 4 Nominal discharge density [mm/min]: 10,0 Water pressure [bar]: 4,07 Water flow rate [L/min] per nozzle: 96 Total water flow rate [L/min]: 384 Test results Average density [mm/min]: 8,45 Minimum density [mm/min]: 0,08 Maximum density [mm/min]: 31,04 Average density over the top [mm/min]: 7,04 Average density in flue space [mm/min]: 15,48
1 23 4 5
6 78
Row 1
Row 2
Row 3
Row 4Row 5Row 6 (flue space)
010
20
30
40
Dischage density [mm/min]
Longitudinal
Lateral
Test 12
Row 1Row 2Row 3Row 4Row 5Row 6 (flue space)
Figure 2-34 Test 12: A graphical presentation of the measured water discharge densities.
35
Figure 2- 35 Test 12: The overall water distribution.
Figure 2- 36 Test 12: A close-up image of one of the medium to high velocity nozzles.

36
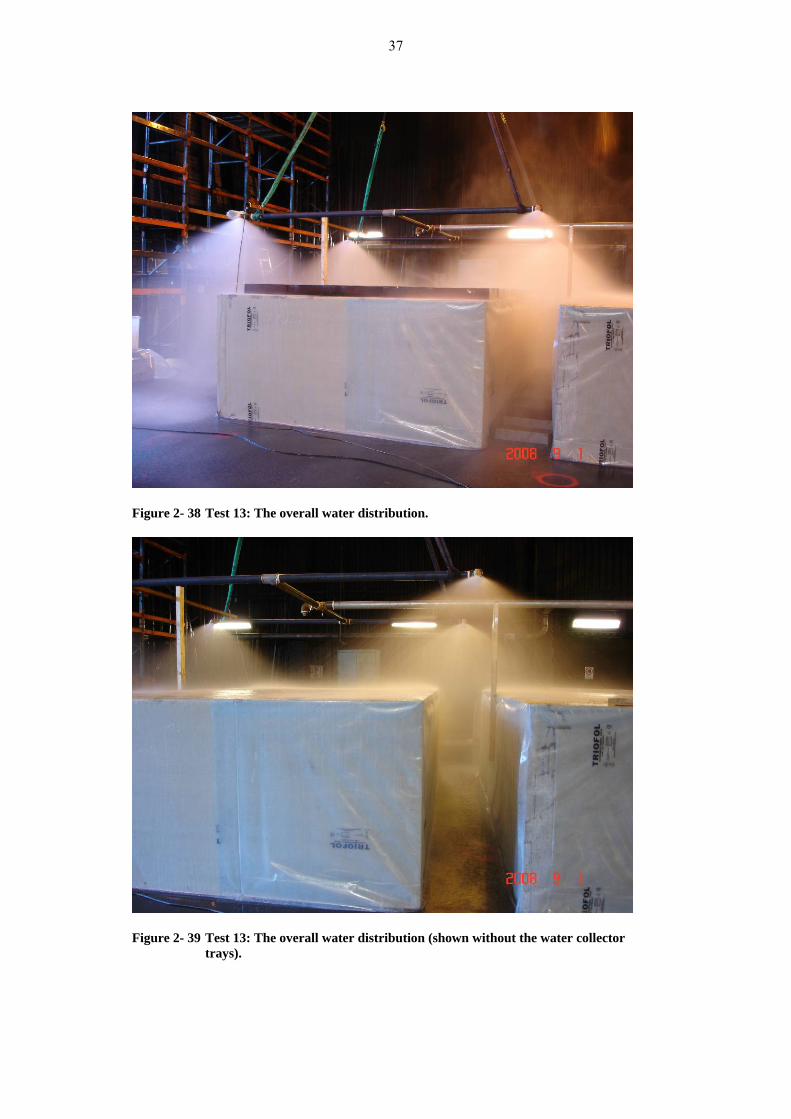
Test 13 Date: 2008-09-01 Test parameters Clearance [mm]: 650 mm Nozzle designation: Viking B-2 K-factor [metric]: 47,6 Spray angle [°]: 140 Number of nozzles: 4 Nominal discharge density [mm/min]: 12,5 Water pressure [bar]: 6,36 Water flow rate [L/min] per nozzle: 120 Total water flow rate [L/min]: 480 Test results Average density [mm/min]: 10,61 Minimum density [mm/min]: 0,06 Maximum density [mm/min]: 32,22 Average density over the top [mm/min]: 8,91 Average density in flue space [mm/min]: 19,11
1 23 4 5
6 78
Row 1
Row 2
Row 3
Row 4Row 5Row 6 (flue space)
0
20
40
60
Dischage density [mm/min]
Longitudinal
Lateral
Test 13
Row 1Row 2Row 3Row 4Row 5Row 6 (flue space)
Figure 2-37 Test 13: A graphical presentation of the measured water discharge densities.
37
Figure 2- 38 Test 13: The overall water distribution.
Figure 2- 39 Test 13: The overall water distribution (shown without the water collector
trays).

38
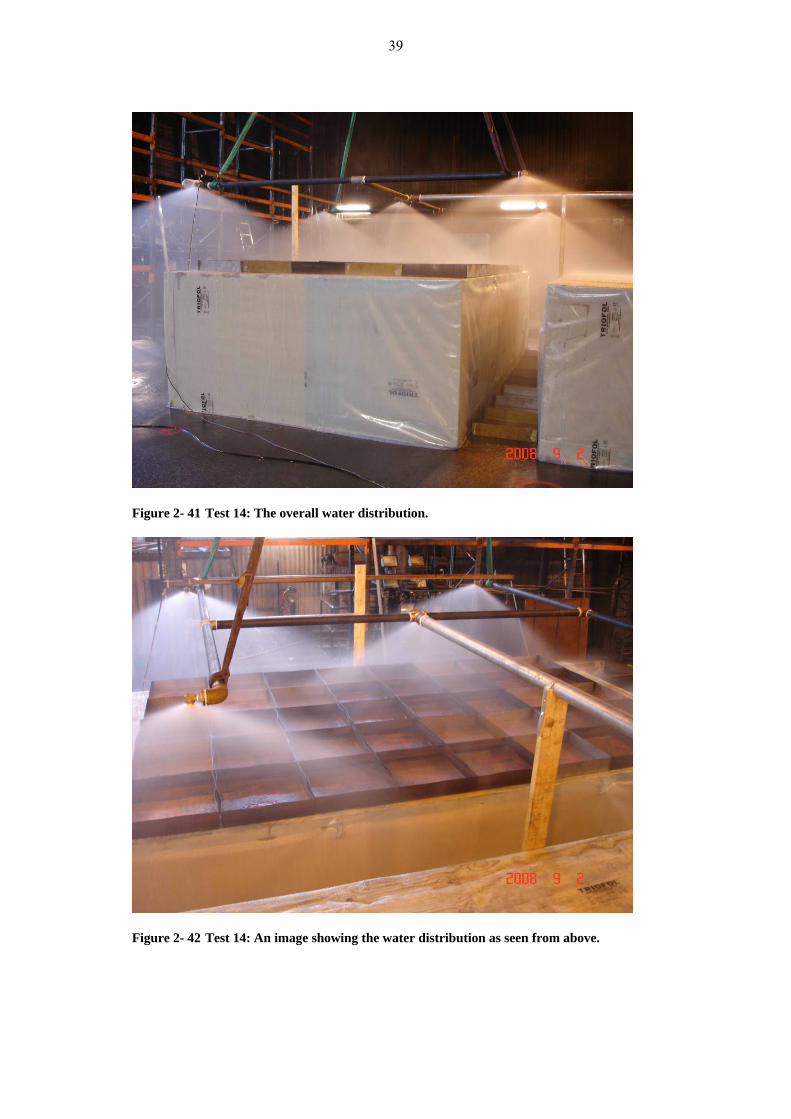
Test 14 Date: 2008-09-02 Test parameters Clearance [mm]: 650 mm Nozzle designation: Viking A-2X K-factor [metric]: 31,7 Spray angle [°]: 140 Number of nozzles: 5 Nominal discharge density [mm/min]: 12,5 Water pressure [bar]: 3,58 Water flow rate [L/min] per nozzle: 60 Total water flow rate [L/min]: 300 Test results Average density [mm/min]: 10,84 Minimum density [mm/min]: 1,31 Maximum density [mm/min]: 30,31 Average density over the top [mm/min]: 11,88 Average density in flue space [mm/min]: 5,68
1 23 4 5
6 78
Row 1
Row 2
Row 3
Row 4Row 5Row 6 (flue space)
010
20
30
40
Dischage density [mm/min]
Longitudinal
Lateral
Test 14
Row 1Row 2Row 3Row 4Row 5Row 6 (flue space)
Figure 2-40 Test 14: A graphical presentation of the measured water discharge densities.
39
Figure 2- 41 Test 14: The overall water distribution.
Figure 2- 42 Test 14: An image showing the water distribution as seen from above.

40
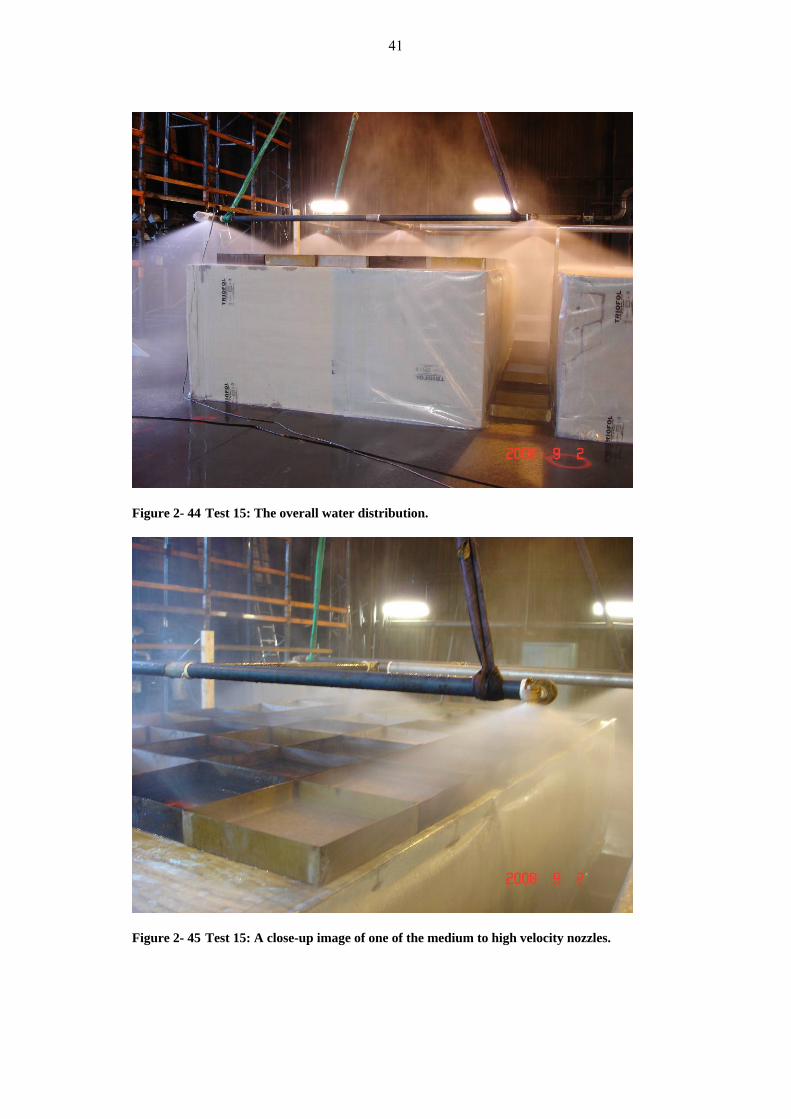
Test 15 Date: 2008-09-02 Test parameters Clearance [mm]: 250 mm Nozzle designation: Viking A-2X K-factor [metric]: 31,7 Spray angle [°]: 140 Number of nozzles: 5 Nominal discharge density [mm/min]: 12,5 Water pressure [bar]: 3,58 Water flow rate [L/min] per nozzle: 60 Total water flow rate [L/min]: 300 Test results Average density [mm/min]: 10,01 Minimum density [mm/min]: 0,11 Maximum density [mm/min]: 50,18 Average density over the top [mm/min]: 10,53 Average density in flue space [mm/min]: 7,43
1 23 4 5
6 78
Row 1
Row 2
Row 3
Row 4Row 5Row 6 (flue space)
0
20
40
60
Dischage density [mm/min]
Longitudinal
Lateral
Test 15
Row 1Row 2Row 3Row 4Row 5Row 6 (flue space)
Figure 2-43 Test 15: A graphical presentation of the measured water discharge densities.
41
Figure 2- 44 Test 15: The overall water distribution.
Figure 2- 45 Test 15: A close-up image of one of the medium to high velocity nozzles.
42
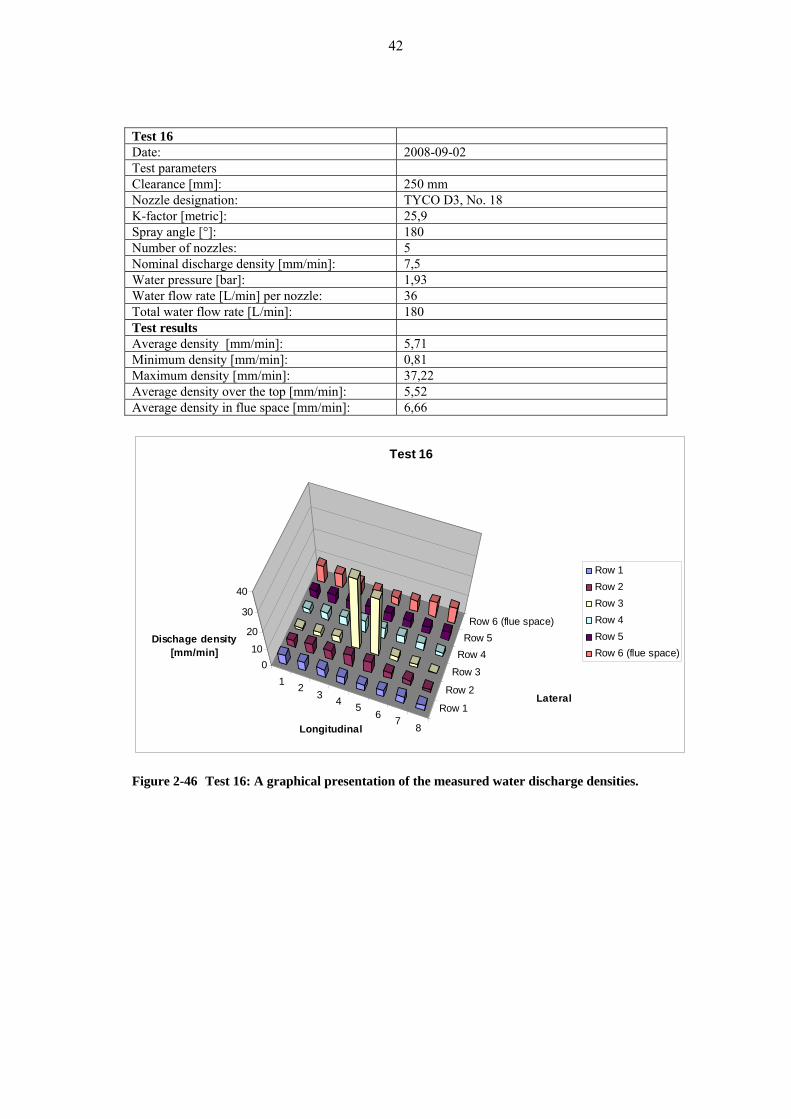
Test 16 Date: 2008-09-02 Test parameters Clearance [mm]: 250 mm Nozzle designation: TYCO D3, No. 18 K-factor [metric]: 25,9 Spray angle [°]: 180 Number of nozzles: 5 Nominal discharge density [mm/min]: 7,5 Water pressure [bar]: 1,93 Water flow rate [L/min] per nozzle: 36 Total water flow rate [L/min]: 180 Test results Average density [mm/min]: 5,71 Minimum density [mm/min]: 0,81 Maximum density [mm/min]: 37,22 Average density over the top [mm/min]: 5,52 Average density in flue space [mm/min]: 6,66
1 23 4 5
6 78
Row 1
Row 2
Row 3
Row 4Row 5Row 6 (flue space)
010
20
30
40
Dischage density [mm/min]
Longitudinal
Lateral
Test 16
Row 1Row 2Row 3Row 4Row 5Row 6 (flue space)
Figure 2-46 Test 16: A graphical presentation of the measured water discharge densities.
43
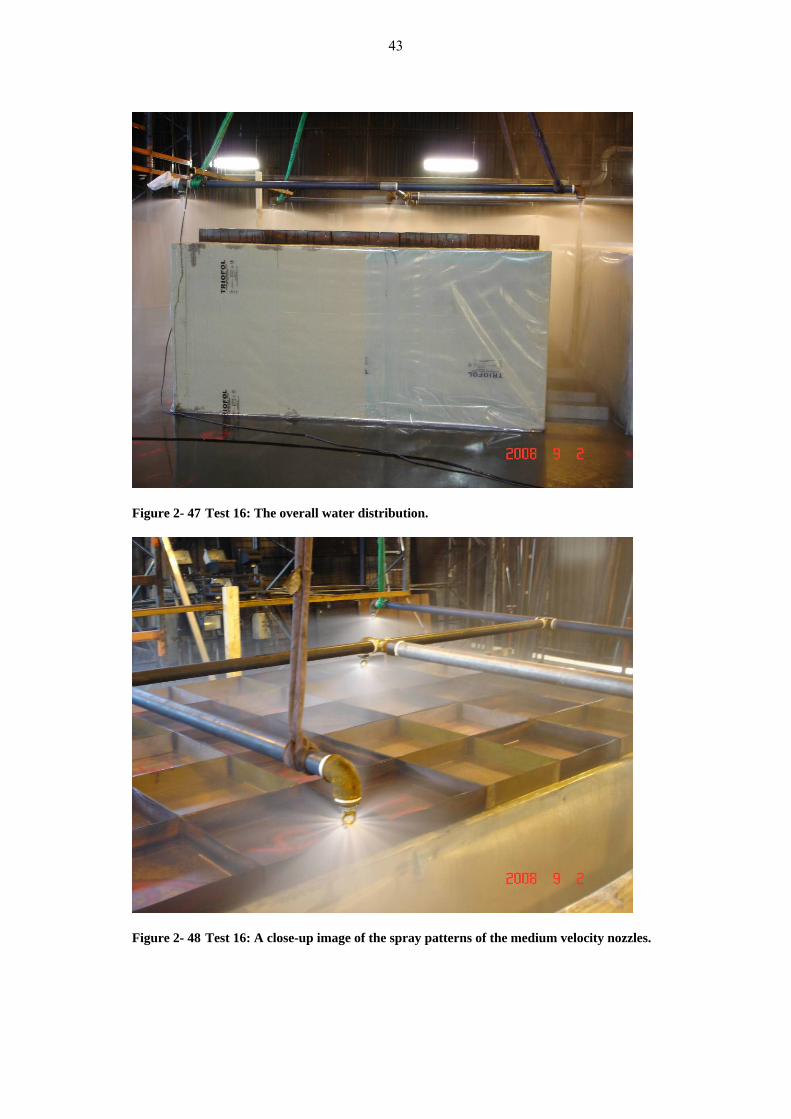
Figure 2- 47 Test 16: The overall water distribution.
Figure 2- 48 Test 16: A close-up image of the spray patterns of the medium velocity nozzles.

44
Test 17 Date: 2008-09-02 Test parameters Clearance [mm]: 250 mm Nozzle designation: TYCO D3, No. 18 K-factor [metric]: 25,9 Spray angle [°]: 180 Number of nozzles: 5 Nominal discharge density [mm/min]: 10 Water pressure [bar]: 3,43 Water flow rate [L/min] per nozzle: 48 Total water flow rate [L/min]: 240 Test results Average density [mm/min]: 6,72 Minimum density [mm/min]: 1,3 Maximum density [mm/min]: 43,25 Average density over the top [mm/min]: 6,51 Average density in flue space [mm/min]: 7,81
1 23 4 5
6 78
Row 1
Row 2
Row 3
Row 4Row 5Row 6 (flue space)
0
20
40
60
Dischage density [mm/min]
Longitudinal
Lateral
Test 17
Row 1Row 2Row 3Row 4Row 5Row 6 (flue space)
Figure 2-49 Test 17: A graphical presentation of the measured water discharge densities.
45
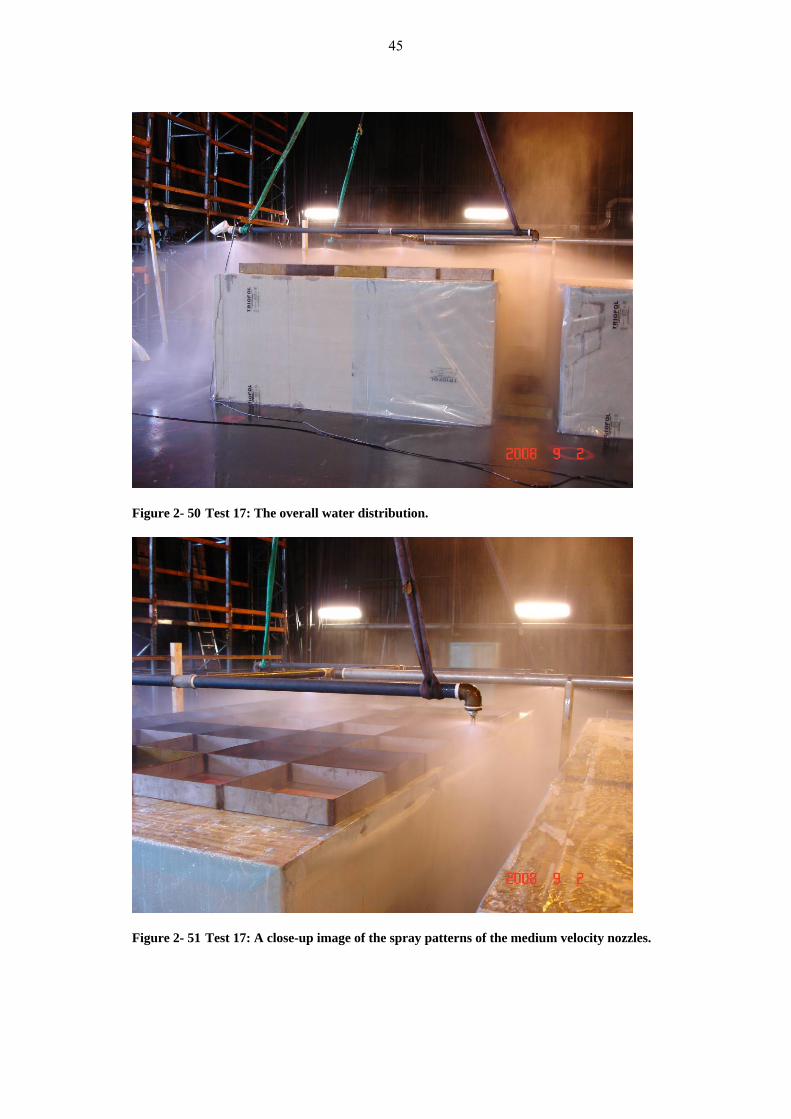
Figure 2- 50 Test 17: The overall water distribution.
Figure 2- 51 Test 17: A close-up image of the spray patterns of the medium velocity nozzles.

46
Test 18 Date: 2008-09-02 Test parameters Clearance [mm]: 250 mm Nozzle designation: TYCO D3, No. 18 K-factor [metric]: 25,9 Spray angle [°]: 180 Number of nozzles: 5 Nominal discharge density [mm/min]: 12,5 Water pressure [bar]: 5,37 Water flow rate [L/min] per nozzle: 60 Total water flow rate [L/min]: 300 Test results Average density [mm/min]: 10,40 Minimum density [mm/min]: 1,34 Maximum density [mm/min]: 71,34 Average density over the top [mm/min]: 10,67 Average density in flue space [mm/min]: 9,06
1 23 4 5
6 78
Row 1
Row 2
Row 3
Row 4Row 5Row 6 (flue space)
020
40
60
80
Dischage density [mm/min]
Longitudinal
Lateral
Test 18
Row 1Row 2Row 3Row 4Row 5Row 6 (flue space)
Figure 2-52 Test 18: A graphical presentation of the measured water discharge densities.
47
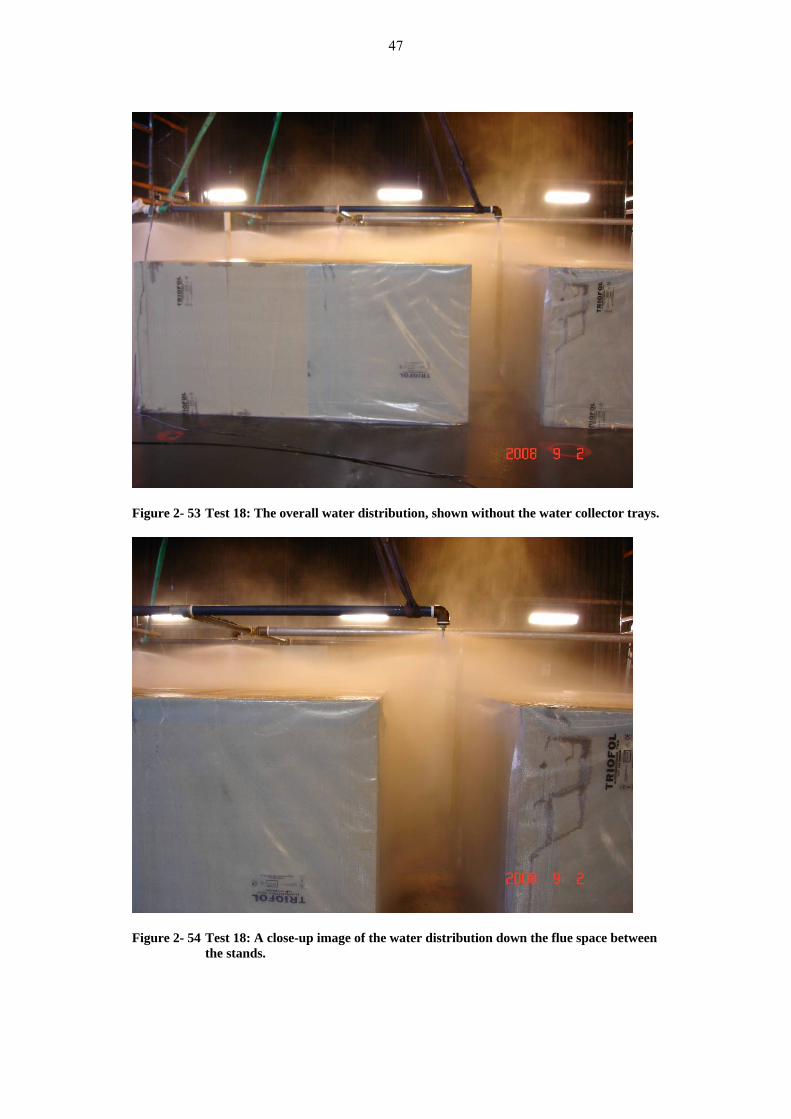
Figure 2- 53 Test 18: The overall water distribution, shown without the water collector trays.
Figure 2- 54 Test 18: A close-up image of the water distribution down the flue space between
the stands.

48
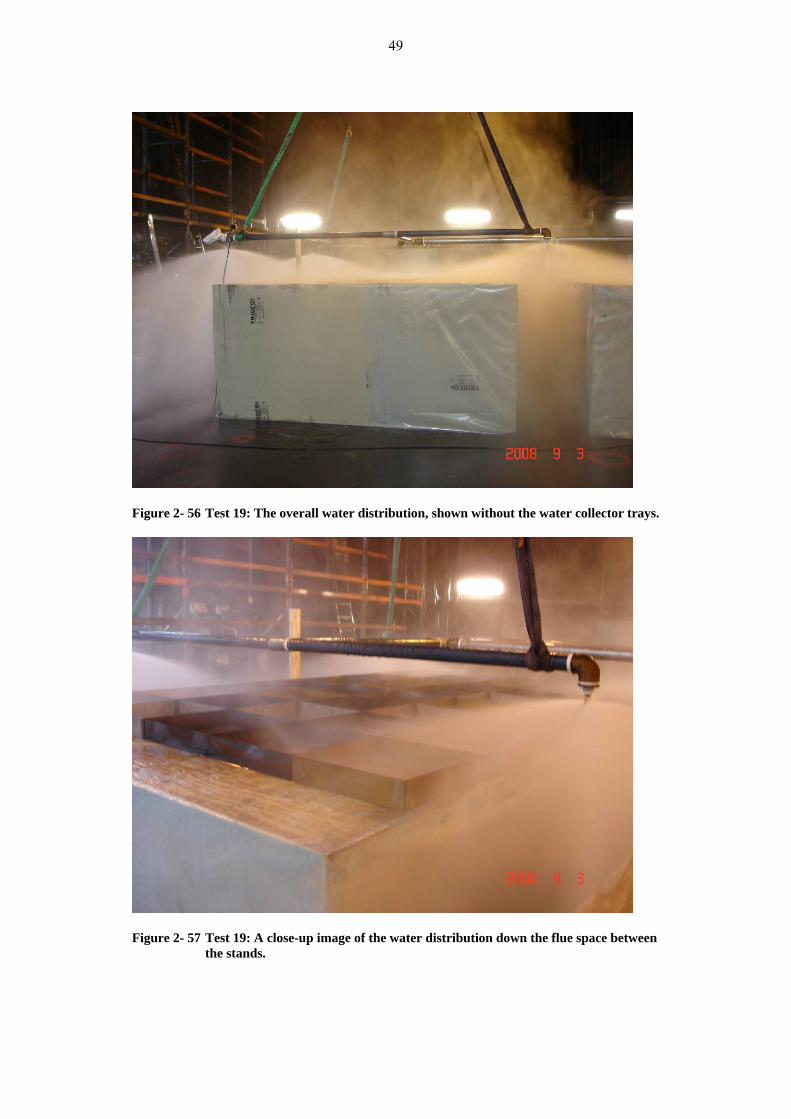
Test 19 Date: 2008-09-03 Test parameters Clearance [mm]: 250 mm Nozzle designation: TYCO D3, No. 28 K-factor [metric]: 59,0 Spray angle [°]: 180 Number of nozzles: 4 Nominal discharge density [mm/min]: 15 Water pressure [bar]: 5,96 Water flow rate [L/min] per nozzle: 144 Total water flow rate [L/min]: 576 Test results Average density [mm/min]: 10,68 Minimum density [mm/min]: 0,06 Maximum density [mm/min]: 36,6 Average density over the top [mm/min]: 10,34 Average density in flue space [mm/min]: 12,39
1 23 4 5
6 78
Row 1
Row 2
Row 3
Row 4Row 5Row 6 (flue space)
010
20
30
40
Dischage density [mm/min]
Longitudinal
Lateral
Test 19
Row 1Row 2Row 3Row 4Row 5Row 6 (flue space)
Figure 2-55 Test 19: A graphical presentation of the measured water discharge densities.
49
Figure 2- 56 Test 19: The overall water distribution, shown without the water collector trays.
Figure 2- 57 Test 19: A close-up image of the water distribution down the flue space between
the stands.

50
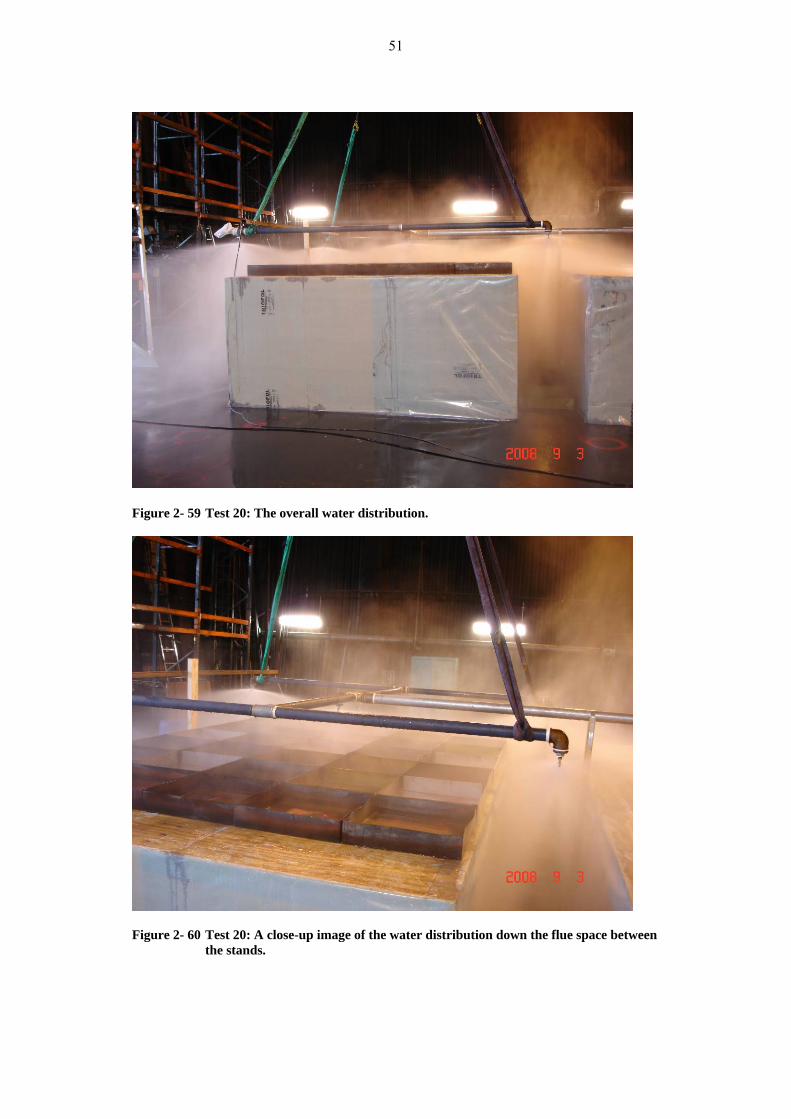
Test 20 Date: 2008-09-03 Test parameters Clearance [mm]: 250 mm Nozzle designation: TYCO D3, No. 21 K-factor [metric]: 33,1 Spray angle [°]: 180 Number of nozzles: 5 Nominal discharge density [mm/min]: 15 Water pressure [bar]: 4,73 Water flow rate [L/min] per nozzle: 72 Total water flow rate [L/min]: 360 Test results Average density [mm/min]: 10,33 Minimum density [mm/min]: 0,84 Maximum density [mm/min]: 54,04 Average density over the top [mm/min]: 10,46 Average density in flue space [mm/min]: 9,69
1 23 4 5
6 78
Row 1
Row 2
Row 3
Row 4Row 5Row 6 (flue space)
0
20
40
60
Dischage density [mm/min]
Longitudinal
Lateral
Test 20
Row 1Row 2Row 3Row 4Row 5Row 6 (flue space)
Figure 2-58 Test 20: A graphical presentation of the measured water discharge densities.
51
Figure 2- 59 Test 20: The overall water distribution.
Figure 2- 60 Test 20: A close-up image of the water distribution down the flue space between
the stands.

52
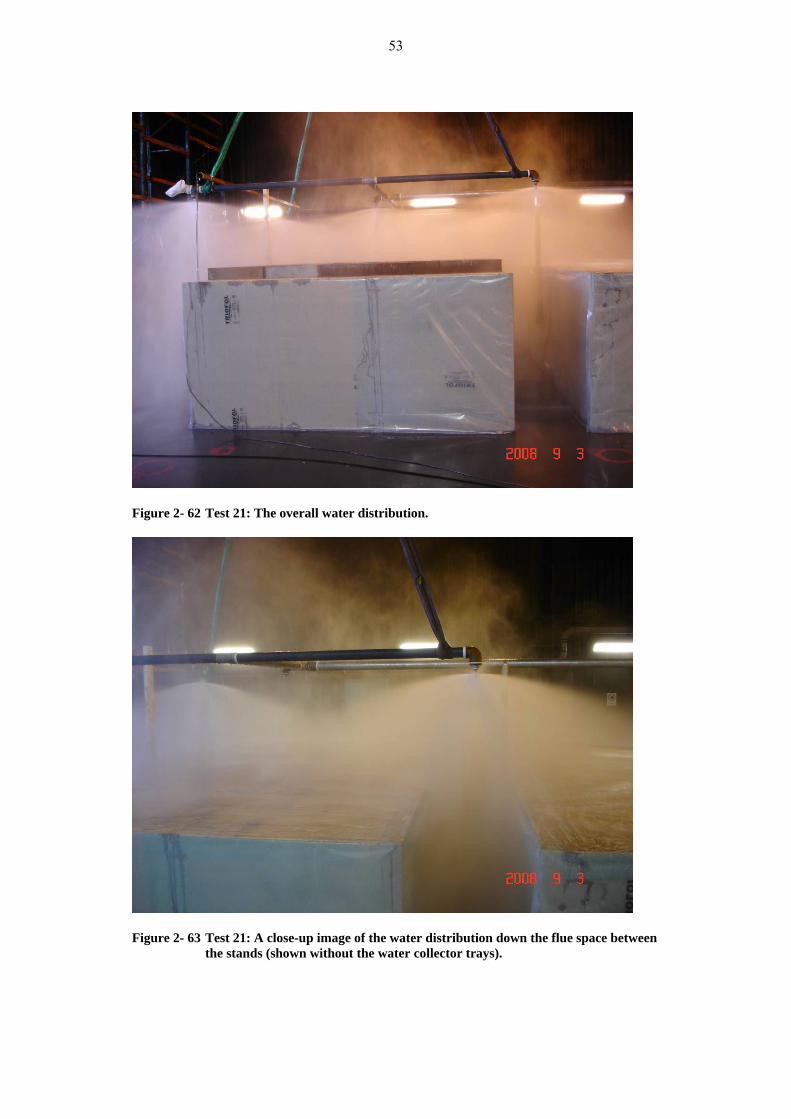
Test 21 Date: 2008-09-03 Test parameters Clearance [mm]: 650 mm Nozzle designation: TYCO D3, No. 21 K-factor [metric]: 33,1 Spray angle [°]: 180 Number of nozzles: 5 Nominal discharge density [mm/min]: 15 Water pressure [bar]: 4,73 Water flow rate [L/min] per nozzle: 72 Total water flow rate [L/min]: 360 Test results Average density [mm/min]: 10,99 Minimum density [mm/min]: 5,59 Maximum density [mm/min]: 27,75 Average density over the top [mm/min]: 11,55 Average density in flue space [mm/min]: 8,18
1 23 4 5
6 78
Row 1
Row 2
Row 3
Row 4Row 5Row 6 (flue space)
0
10
20
30
Dischage density [mm/min]
Longitudinal
Lateral
Test 21
Row 1Row 2Row 3Row 4Row 5Row 6 (flue space)
Figure 2-61 Test 21: A graphical presentation of the measured water discharge densities.
53
Figure 2- 62 Test 21: The overall water distribution.
Figure 2- 63 Test 21: A close-up image of the water distribution down the flue space between
the stands (shown without the water collector trays).
54
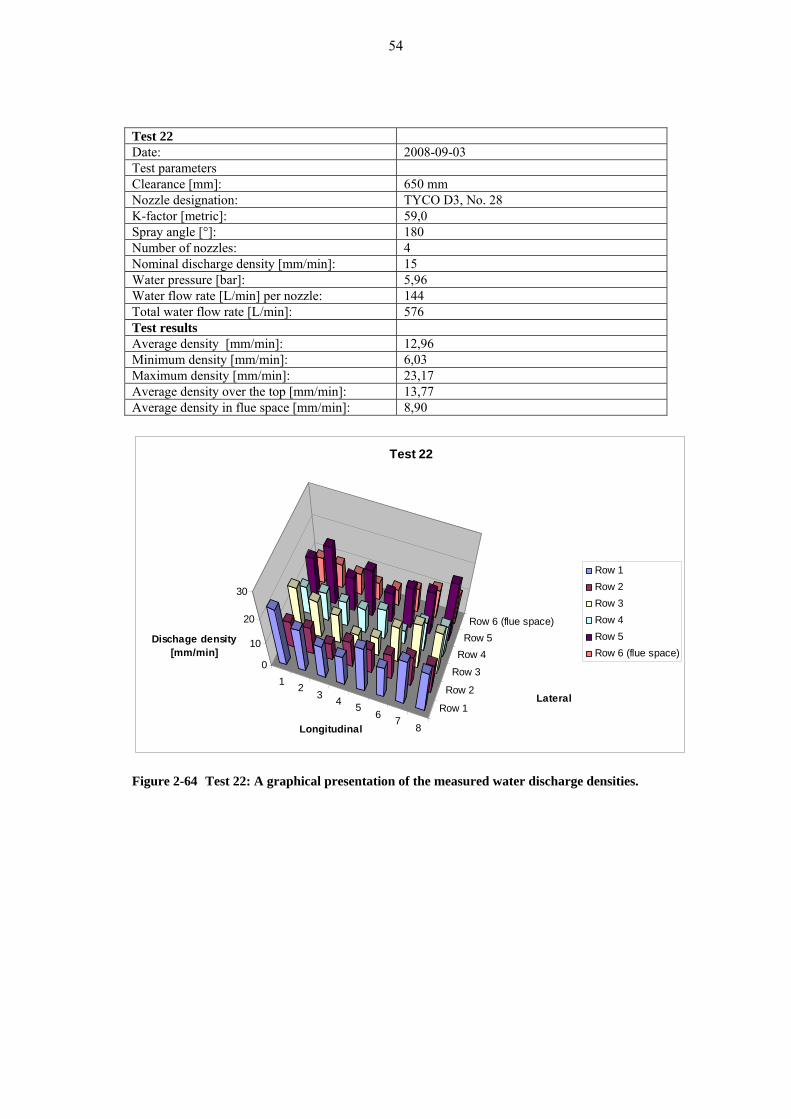
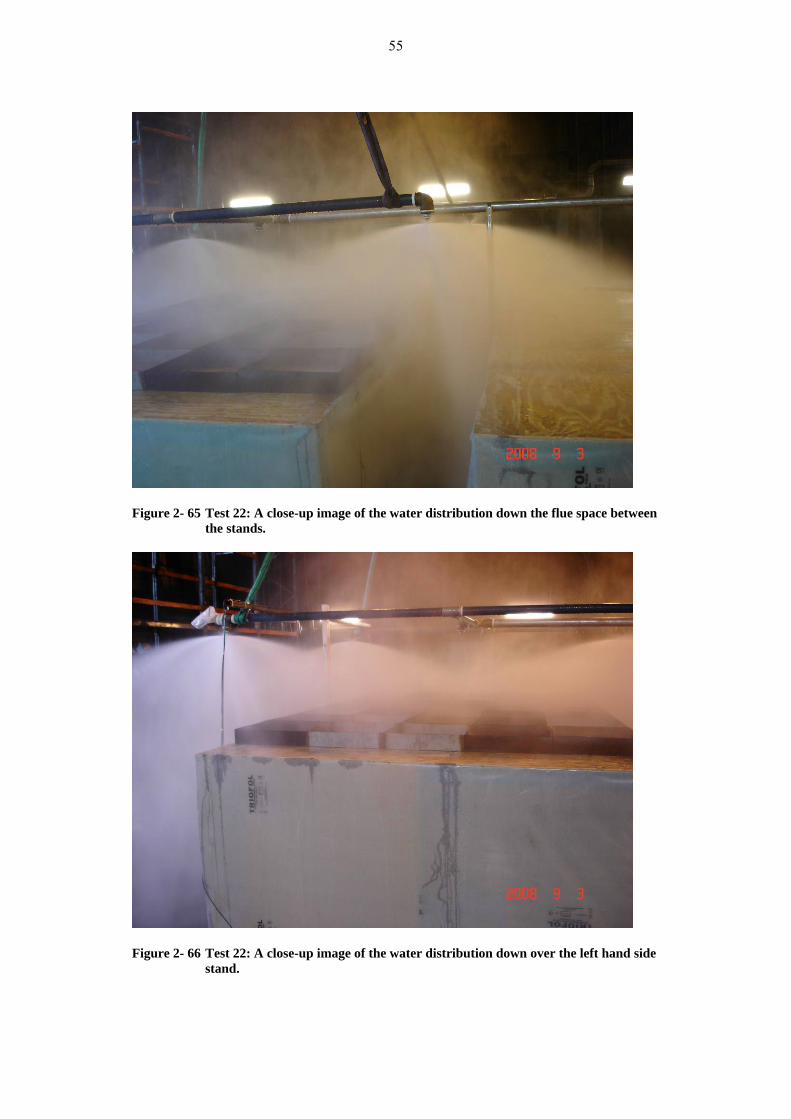
Test 22 Date: 2008-09-03 Test parameters Clearance [mm]: 650 mm Nozzle designation: TYCO D3, No. 28 K-factor [metric]: 59,0 Spray angle [°]: 180 Number of nozzles: 4 Nominal discharge density [mm/min]: 15 Water pressure [bar]: 5,96 Water flow rate [L/min] per nozzle: 144 Total water flow rate [L/min]: 576 Test results Average density [mm/min]: 12,96 Minimum density [mm/min]: 6,03 Maximum density [mm/min]: 23,17 Average density over the top [mm/min]: 13,77 Average density in flue space [mm/min]: 8,90
1 23 4 5
6 78
Row 1
Row 2
Row 3
Row 4Row 5Row 6 (flue space)
0
10
20
30
Dischage density [mm/min]
Longitudinal
Lateral
Test 22
Row 1Row 2Row 3Row 4Row 5Row 6 (flue space)
Figure 2-64 Test 22: A graphical presentation of the measured water discharge densities.
55
Figure 2- 65 Test 22: A close-up image of the water distribution down the flue space between
the stands.
Figure 2- 66 Test 22: A close-up image of the water distribution down over the left hand side
stand.

56
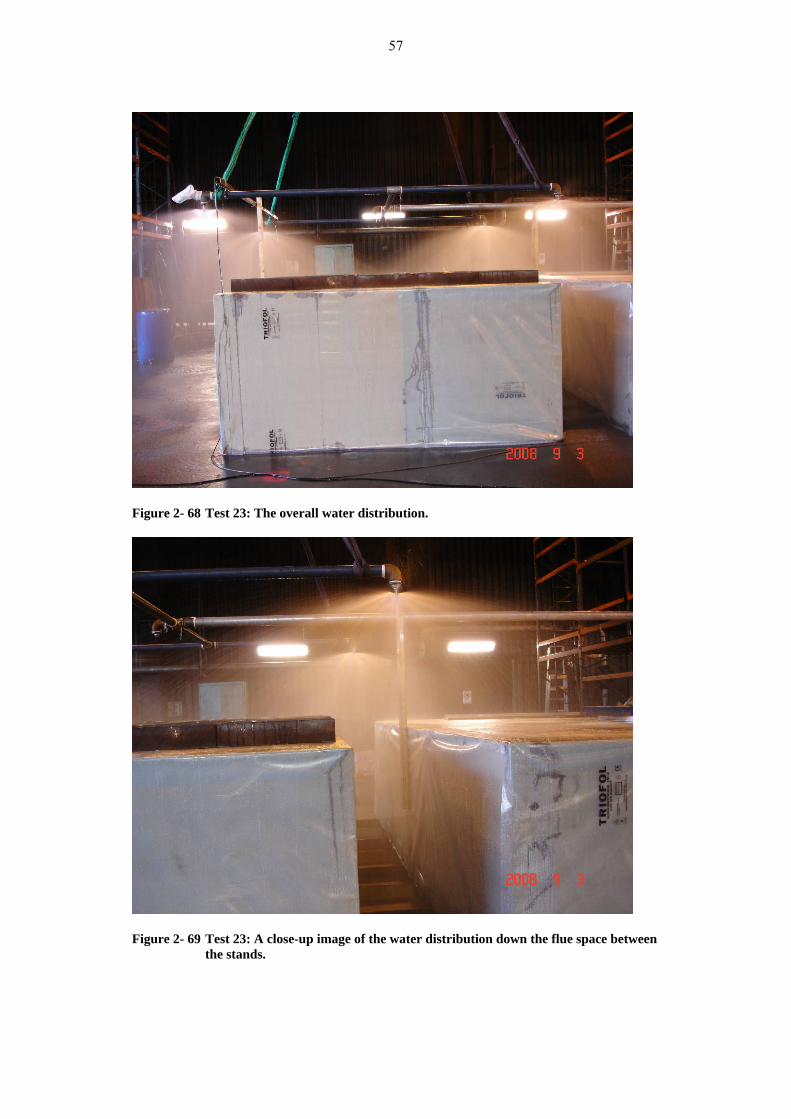
Test 23 Date: 2008-09-03 Test parameters Clearance [mm]: 650 mm Nozzle designation: TYCO D3, No. 28 K-factor [metric]: 59,0 Spray angle [°]: 180 Number of nozzles: 4 Nominal discharge density [mm/min]: 5 Water pressure [bar]: 0,66 Water flow rate [L/min] per nozzle: 48 Total water flow rate [L/min]: 192 Test results Average density [mm/min]: 4,69 Minimum density [mm/min]: 1,23 Maximum density [mm/min]: 9,82 Average density over the top [mm/min]: 4,54 Average density in flue space [mm/min]: 5,42
1 23 4 5
6 78
Row 1
Row 2
Row 3
Row 4Row 5Row 6 (flue space)
0
5
10
Dischage density [mm/min]
Longitudinal
Lateral
Test 23
Row 1Row 2Row 3Row 4Row 5Row 6 (flue space)
Figure 2-67 Test 23: A graphical presentation of the measured water discharge densities.
57
Figure 2- 68 Test 23: The overall water distribution.
Figure 2- 69 Test 23: A close-up image of the water distribution down the flue space between
the stands.

SP Technical Research Institute of Sweden Box 857, SE-501 15 BORÅS, SWEDEN Telephone: +46 10 516 50 00, Telefax: +46 33 13 55 02 E-mail: [email protected], Internet: www.sp.se www.sp.se
SP Arbetsrapport 2009:04 ISBN 91-7848- ISSN 0284-5172
SP Technical Research Institute of Sweden develops and transfers technology for improving competitiveness and quality in industry, and for safety, conservation of resources and good environment in society as a whole. With Sweden’s widest and most sophisticated range of equipment and expertise for technical investigation, measurement, testing and certification, we perform research and development in close liaison with universities, institutes of technology and international partners. SP is a EU-notified body and accredited test laboratory. Our headquarters are in Borås, in the west part of Sweden.