Embed Size (px)
Citation preview

Space Geodesy in the intraplate New Madrid Seismic Zone and Central US
60th Meeting of the Civil GPS Service Interface Committeeand the
Virtual ION GNSS+ 2021 conference
September 20-21, 2021
Robert Smalley, Jr.
Center for Earthquake Research & Information (CERI), The University of Memphis
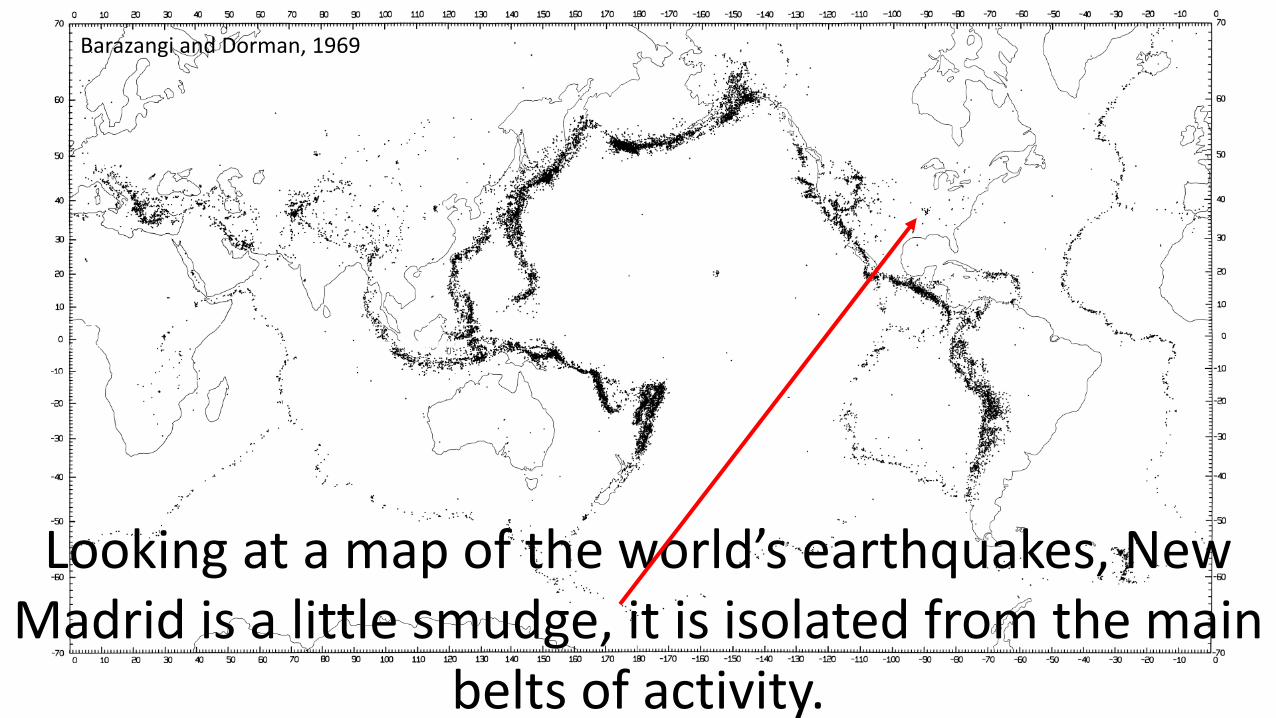
Looking at a map of the world’s earthquakes, New Madrid is a little smudge, it is isolated from the main
belts of activity.
Barazangi and Dorman, 1969

So, why do we have earthquakes in New Madrid?
Wright, 2002Thomas, 2005

There is evidence for earthquake “cycle” behavior at the few
thousand-year time scale.
Is there an elastic rebound deformation cycle happening there?
Wright, 2002

Calais, 2005
Is the New Madrid seismic zone deforming with respect to the plate tectonic stable N. America plate?
How can one tell?In N. America we have an additional consideration due to GIA.

v
Hao et al. 2013
New Madrid Seismic zone – most active seismic zone east of Rockies

GNSS sites – stably monumented antennas (green,
GAMA). Most antennas mounted on buildings and other unstable structures, yellow/gray w/ &
w/out velocity solution.
Seismicity and geologic structures also shown.
Space Geodetic Infrastructure in the New Madrid Seismic Zone and surrounding mid-continent.
0 1 2 3 4 5 6 7 8 9 10-5
0
5
10
15
20
25
x
y
0 1 2 3 4 5 6 7 8 9 10-5
0
5
10
15
20
25
x
y
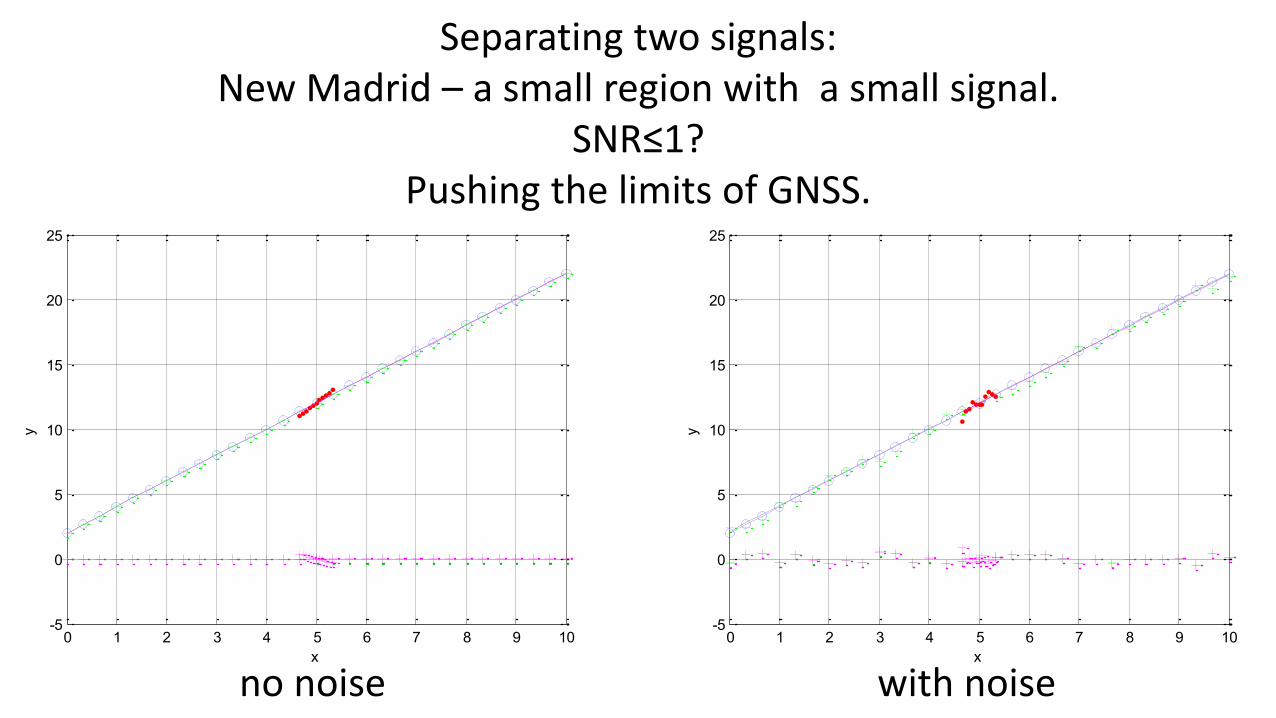
Separating two signals:New Madrid – a small region with a small signal.
SNR≤1?Pushing the limits of GNSS.
no noise with noise

Site velocities with respect to a stable North America Plate Reference frame.
Left - velocities with respect to a Stable N. America Plate.
After 20 years, GAMA velocities ~1-1.5 mm/yr
with error ellipse radii ~1/3 of magnitude, but
difference in velocities (strain) is less than the
errors.
1 mm/yr

Elastic response of Earth’s crust to loads.In addition to isostatic adjustment, the crust responds elastically to applied loads
and GPS can estimate this response to determine the elastic properties of the crust or “weigh” the load.
2015.5 2016 2016.5 2017 2017.5 2018 2018.5 2019 2019.5time
-40
-20
0
20
40
60
posi
tion
(mm
)
bra.amua_gamit.json (u)GPS position time series, SSA and TM fits
time seriesSSA fitTM cyclics fit
Left – response to Mississippi River floods. Below – 10 cm peak to peak vertical response to Amazon river loading.

High Rate - Kinematic GPSGPS absolute displacement seismograms and co-located
broadband seismic recording of – Love wave of 2004 M9.0, Sumatra-Andaman earthquake in Portageville,
AR., at 14,000 km distance.
Davis and Smalley, 2009

12
~100 Absolute displacement, sidereally filtered seismograms. Left side, record section where the slope, “move-out”, gives the velocity of the
surface waves.Right side, same data displayed as surface (not a record section, slope not meaningful).
Davis and Smalley, 2009

13Davis and Smalley, 2009
We can estimate wave properties such as apparent velocity and azimuth by array processing (beam steering, fk filtering).
Peak position provides estimate of azimuth and slowness of plane (surface) waves crossing array.
.
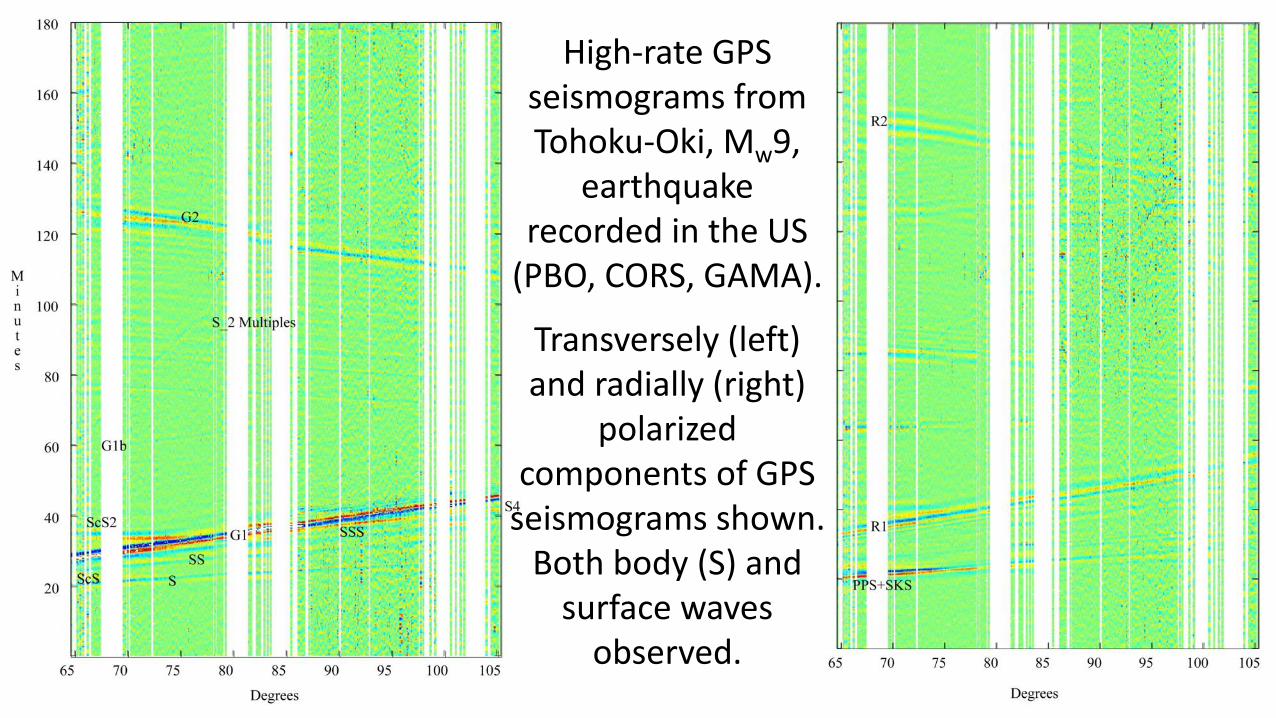
High-rate GPS seismograms from Tohoku-Oki, Mw9,
earthquake recorded in the US
(PBO, CORS, GAMA).
Transversely (left) and radially (right)
polarized components of GPS
seismograms shown.Both body (S) and
surface waves observed.

− 5 0 − − 4 9 − − 4 8 − − 4 7 − − 4 6 − − 4 5 − − 4 4 − − 4 3 − − 4 2 − − 4 1 − − 4 0 −
− 6 1 −
− 6 0 −
5 0 0 m m di sp lace m e n t
5 m m / yr
S eis mi cit y of S. Or k n e y Isl a n ds si n c e i nst all ati o n of a c o nti n u o us G P S st ati o n i n 1 9 9 9. L ar g e
e art h q u a k es – e ast – 2 0 0 3, M 7. 6, w est – 2 0 1 3, M 7. 8: i nt er -, c o-, a n d p ost-s eis mi c si g n als.
N ort h, e ast a n d u p, d ail y p ositi o n ti m e s eri es ( bl u e) a n d ”tr aj e ct or y ” m o d els – r e d.

1 Hz GPS seismogramsNS E W UD
Before this event a common question was what were the overshoots?
Static coseismic displacements were N~-0.325 m, E~0.56 m, U~0 m.
Raw seismogram in blue.Sidereally filtered seismogram in green, sidereal filter in red.

Rotate horizontals for maximum polarization
into Radially and Transversely polarized
waves.
H1 vs H2 now radial & transverse (=Love wave)
directions.
V vs H1 – retrograde elliptical particle motion
(= Rayleigh wave).
Surface waves pass DURING development of the coseismic offset.
GPS/GNSS Space Geodesy is continuing to improve in terms of the hardware (satellites and receivers) and processing.
The slow signals will require more time, and we might not personally live to see it (think of it like the building of the famous Cathedrals in Europe),
but Space Geodesy will contribute to solving the enigma of the New Madrid Seismic Zone.
Thank you.


![Editorial Board - GeoPreVi · Journal of Geodesy, Cartography and Cadastre 4 Fig.2 Seismic swarm localization (in red) [7] Table 1 Statistics of the seismic activity (October 2013)](https://img.pdfslide.net/doc/110x75/5f9388e584de6571591a34c5/editorial-board-geoprevi-journal-of-geodesy-cartography-and-cadastre-4-fig2.jpg)