Embed Size (px)
Citation preview
SPACE TECHNOLOGY & APPLICATIONS INTERNATIONAL FORUM (STAIF -98)
Conference on Next Generation Launch VehiclesE5 - Cost & Operations
A NOVEL METHODOLOGY FOR ESTIMATING UPPER LIMITS OF MAJOR COST DRIVERS FOR PROFITABLE
CONCEPTUAL LAUNCH SYSTEM ARCHITECTURES
January 25-29, 1998 Albuquerque, N.M.
RUSSEL RHODES/NASA
RAYMOND BYRD/BOEING
KENNEDY SPACE CENTER, FL.

A NOVEL METHODOLOGY FOR ESTIMATING UPPER LIMITS OF MAJOR COST DRIVERS FOR PROFITABLE
CONCEPTUAL LAUNCH SYSTEM ARCHITECTURES
Introduction:• Process enables "quick look" estimations and evaluations to effectively determine
if a concept provides focus for leapfrog improvement (Relies on existing cost estimating tools for input)
• A back of the envelope technique for fast, timely, on-the-spot, assessment of affordability (profitability) of commercial space transportation concepts
• Cost Charts are provided to determine relationships and/or upper limits
• Process will enable user to develop "cost and price per payload unit to orbit" supplemental to basic vehicle cost estimates for determining concept's ability to achieve system-profitability goals
• Technique will allow architectural concept developer or user to easily determine concepts' conformance to system required objectives

EARTH ORBIT TRANSPORT SERVICE CORPORATION
INVESTORS $ $ $ $ $ $
CUSTOMERS $ $ $ $ $
PAYLOADS
CAPITAL INVESTMENT• REAL PROPERTY• EQUIPMENT• PEOPLE
REVENUESTREAM
CORPORATEOPERATIONSCOST
GROSS INCOME NET PROFIT
$$
OPERATIONS• NON-RECURRING COST• RECURRING COST
RECURRING• DEBT SERVICE• LABOR• HARDWARE• PROPELLANTS• INSURANCE
NON-RECURRING• REAL PROPERTY• FLIGHT VEHICLE(S)• GSE
TAXES
Visualization Diagram of the Business Process

A NOVEL METHODOLOGY FOR ESTIMATING UPPER LIMITS OF MAJOR COST DRIVERS FOR PROFITABLE
CONCEPTUAL LAUNCH SYSTEM ARCHITECTURESDiscussion on the Use of Charts and Assumptions That Apply to Each:
COST • Non-recurring cost
– Acquisition Cost
• Recurring Cost
– Acquisition Payback Cost
– Labor Cost
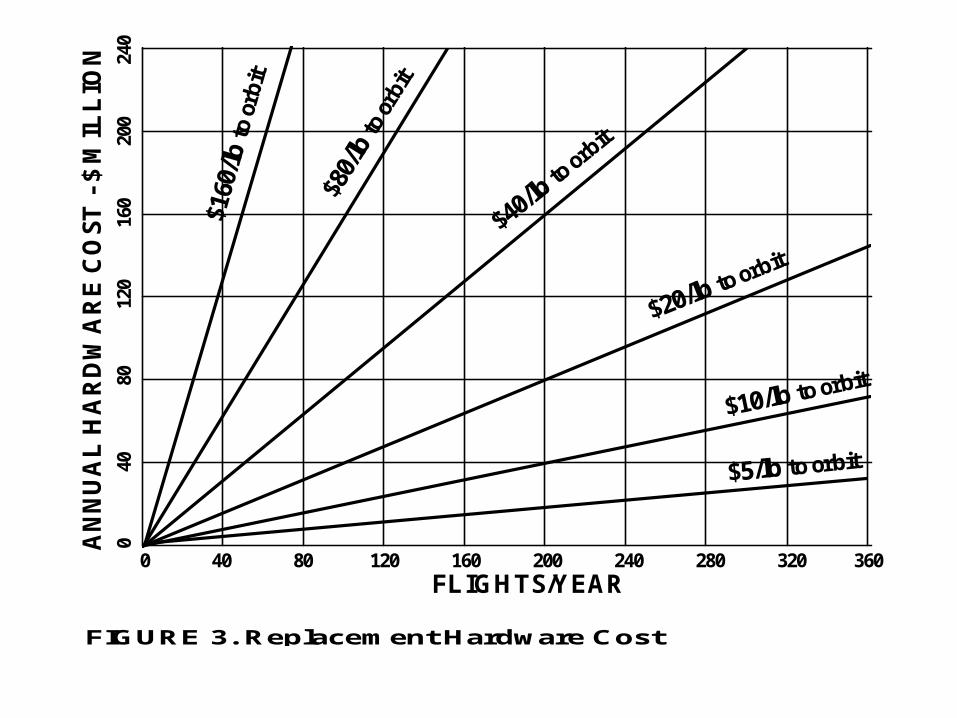
– Replacement Hardware Cost
– Propellant Cost
PRICE • Recurring Factors
– Debt Service
– Insurance
– Profit
PAYLOAD CAPACITY IS ASSUMED TO BE 20,000 LB. TO LOW EARTH ORBIT, IF PAYLOAD CAPACITY IS 2X ASSUMED, COST/UNIT TO ORBIT VALUES ARE 1/2 THOSE SHOWN; OR, IF PAYLOAD CAPACITY IS 1/2 ASSUMED, THE VALUES ARE 2X THOSE SHOWN

A NOVEL METHODOLOGY FOR ESTIMATING UPPER LIMITS OF MAJOR COST DRIVERS FOR PROFITABLE
CONCEPTUAL LAUNCH SYSTEM ARCHITECTURES• Tutorial Exercise Using the Charts to Understand the Bounds for
Major Cost Related to a Profitable Space Transportation System:
ASSIGNED ASSUMPTIONS– Investment where recurring cost are controlled at $200/pound to orbit– Price controlled at $400/pound to orbit– One (1) Billion dollar vehicle investment for two (2) vehicles total– One (1) Billion dollar ground infrastructure investment– Labor cost goal @ 10% of total cost ($20/pound to orbit)– Replacement hardware cost goal @ 10% of total cost ($20/pound to orbit)– Propellant cost goal @ 10% of total cost ($20/pound to orbit)– Acquisition investment payback in 5 years– Flight rate @ 50 times per year per vehicle (100 flights/year total) – Vehicle payload delivery to orbit of 20,000 pounds each flight– Investment mony acquired at 20% simple interest for 5 years ($1 billion)– Insurance cost @ 1% vehicle investment exposed ($500 million/year)

A NOVEL METHODOLOGY FOR ESTIMATING UPPER LIMITS OF MAJOR COST DRIVERS FOR PROFITABLE
CONCEPTUAL LAUNCH SYSTEM ARCHITECTURES• Assessment From The Charts:
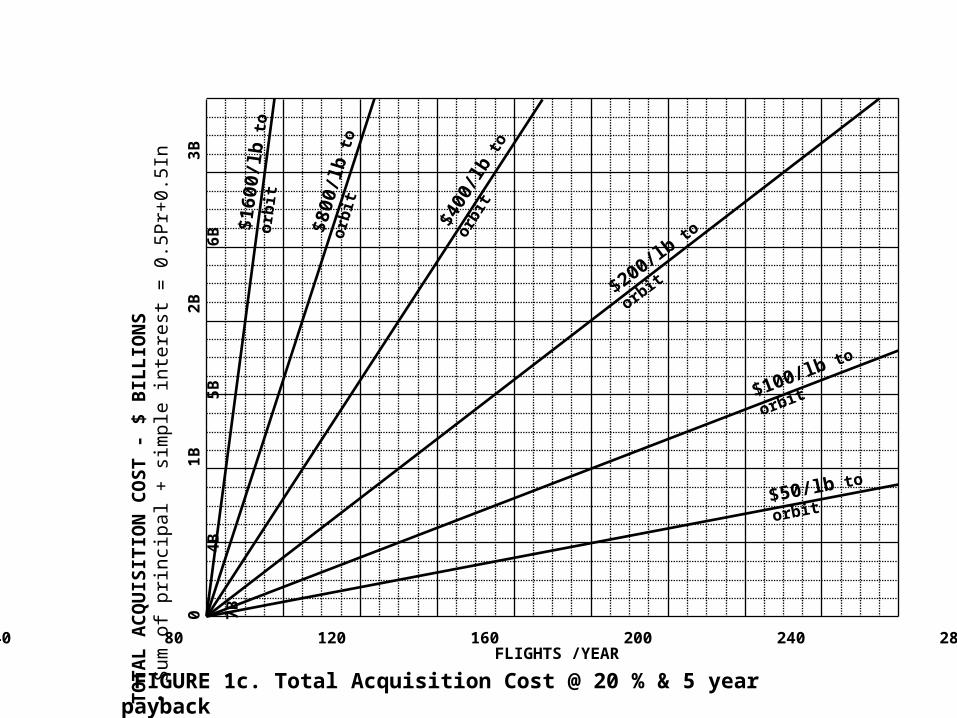
– From the acquisition chart for 5 year payback, yields $100/pound to orbit
and left $100/pound for other operating costs
– Infrastructure investment by Spaceport and charged through fees
– Labor, replacement hardware, and propellant cost = $60/pound to orbit
– Debit service accounts for $1billion over 5 yrs. or $100/pound to orbit which leaves $100/pound to cover insurance
– Profit was a loss of $110/pound because insurance cost of $250/pound to orbit
• Limit vehicle cost to 1/2 of assigned ($250 million/each) and check– Now acquisition chart for 5 years payback yields $50/pound to orbit
– Debit service now is $1/2 billion over 5 years or $50/pound to orbit
– Total operating cost is $110/pound to orbit
– Insurance cost $125/pound to orbit plus debit service of $50/pound
– Gross income would be $400 - 285 = $115/pound to orbit (reasonable?) High !

0
4
B
8
B
1
2B
16
B
20
B
24
B
28
B
$800
/lb t
o or
bit
$400
/lb to
orb
it
$200
/lb to
orbit
$100/lb to orbit
$50/lb to orbit
0 200 400 600 800 1000 1200 1400 1600 1800
0 1 2 3 4 5FLIGHTS/YEAR
TO
TA
L A
CQ
UIS
ITIO
N C
OS
T -
$ B
ILL
ION
S•
Su
m o
f p
rin
cip
al +
sim
ple
inte
rest
= 0
.5P
r+0.
5In
$160
0/lb
to
orbi
t
FLIGHTS /DAY
FIGURE 1. Total Acquisition Cost @ 20% & 5 year payback
0
1
B
2
B
3
B
4
B
5
B
6
B
7
B
0 40 80 120 160 200 240 280 320 360 FLIGHTS /YEAR
$800
/lb t
o or
bit
$400
/lb to
orb
it
$200/lb to
orbit
$100/lb to orbit
$50/lb to orbit
TO
TA
L A
CQ
UIS
ITIO
N C
OS
T -
$ B
ILL
ION
S•
Sum
of
prin
cipa
l + s
impl
e in
tere
st =
0.5
Pr+
0.5I
n
$160
0/lb
to
orb
it
FIGURE 1c. Total Acquisition Cost @ 20 % & 5 year payback

0 200 400 600 800 1000 1200 1400 1600 1800
0 1 2 3 4 5
FLIGHTS/YEAR
FLIGHTS /DAY
TO
TA
L A
CQ
UIS
ITIO
N C
OS
T -
$ B
ILL
ION
S•
Sum
of
prin
cipa
l + s
impl
e in
tere
st =
0.3
3Pr+
0.67
In
0
8
B
1
6B
24B
32B
40B
48B
5
6B
$800
/lb t
o or
bit
$400
/lb to
orb
it
$200
/lb to
orbit
$100/lb to orbit
$50/lb to orbit
$160
0/lb
to
orb
it
FIGURE 1d. Total Acquisition Cost @ 20 % 10 year payback

0
2
B
4
B
6B
8
B
1
0B
12
B
14B
0 40 80 120 160 200 240 280 320 360 FLIGHTS /YEAR
TO
TA
L A
CQ
UIS
ITIO
N C
OS
T -
$ B
ILL
ION
S•
Sum
of
prin
cipa
l + s
impl
e in
tere
st =
0.3
3Pr+
0.67
In $800
/lb t
o or
bit
$400
/lb to
orb
it
$200/lb to
orbit
$100/lb to orbit
$50/lb to orbit
$160
0/lb
to
orbi
t
FIGURE 1b. Total Acquisition Cost @ 20 % & 10 year payback

0 40 80 120 160 200 240 280 320 360 FLIGHTS /YEAR
TO
TA
L A
CQ
UIS
ITIO
N C
OS
T -
$ B
ILL
ION
S•
Sum
of
prin
cipa
l + s
impl
e in
tere
st =
0.5
Pr+
0.5I
n
0
2
B
4
B
6B
8
B
10
B
1
2B
14B
$800
/lb t
o or
bit
$400
/lb to
orb
it
$200/lb to
orbit
$100/lb to orbit
$50/lb to orbit
$160
0/lb
to
orbi
t
FIGURE 1a. Total Acquisition Cost @ 10% & 10 year payback

0 40 80 120 160 200 240 280 320 360FLIGHTS/YEAR
23
4
7
9
4
1
88
3
75
75
0
150
0
300
0M
AN
PO
WE
R (
HE
AD
CO
UN
T)
2.0
3.9
7.8
15.
6
31.
2
62.
5
12
5
250
AN
NU
AL
LA
BO
R C
OST
- $
MIL
LIO
NS
FIGURE 2. Recurring Labor Cost @ $40/hr average rate

MA
NP
OW
ER
(H
EA
DC
OU
NT
)
1.95
3
.9
7.8
1
5.6
31
.2
62.5
1
25
250
$5/lb to orbit$10/lb to orbit$20/lb to orbit
$40/lb to orbit
$80/lb to orbit
24
47
94
1
88
375
7
50
1500
3
K
0 40 80 120 160 200 240 280 320 360FLIGHTS/YEAR
$20,000/lb to orbit (Early 1990's Shuttle curve)
$5,000/lb to orbit (Early 1990's KSC ops contractor curve)500
1
000
2
000
4
000
6,00
0
1
2,00
0
2
4,00
0
4
8000
AN
NU
AL
LA
BO
R C
OS
T -
$ M
ILL
ION
S
FIGURE 2a. Recurring Labor Cost @ $ 40/hr average rate
0 40 80 120 160 200 240 280 320 360FLIGHTS/YEAR
0
4
0
8
0
120
1
60
200
2
40
AN
NU
AL
HA
RD
WA
RE
CO
ST
- $
MIL
LIO
N
$160
/lb to
orb
it
$80/
lb to
orb
it
$40/lb to
orbit
$20/lb to orbit
$10/lb to orbit
$5/lb to orbit
FIGURE 3. Replacement Hardware Cost

0 40 80 120 160 200 240 280 320 360FLIGHTS/YEAR
0
4
0
80
120
1
80
200
2
40
AN
NU
AL
PR
OP
EL
LA
NT
CO
ST
- $
MIL
LIO
N
$80/
lb to
orb
it
$40/lb to
orbit
$20/lb to orbit
$10/lb to orbit
$5/lb to orbit
$160
/lb to
orb
it
FIGURE 4. Recurring Propellant Cost

0 40 80 120 160 200 240 280 320 360
FLIGHTS/YEAR
AN
NU
AL
IN
SU
RA
NC
E C
OS
T -
$M
ILL
ION
S1.
0
2.0
4.
0
8.0
1
6
32
6
4
128
25
6
512
1.
0k
2.0k
4.
1k
FIGURE 5. Insurance Cost

0 40 80 120 160 200 240 280 320 360FLIGHTS/YEAR
0
6
4
128
1
92
256
3
20
38
4
A
NN
UA
L P
RO
FIT
- $
MIL
LIO
N(A
ssu
med
Op
erat
ion
s C
ost
@ $
200/
lb t
o or
bit
)
25% or $50/lb
to orbit
20% or $40/lb to orbit
15% or $30/lb to orbit
10% or $20/lb to orbit
FIGURE 6. Annual Profit @ $200/lb to orbit cost

0 40 80 120 160 200 240 280 320 360FLIGHTS/YEAR
0
25
6
512
7
68
1024
1
280
153
6
A
NN
UA
L P
RO
FIT
- $
MIL
LIO
N(A
ssum
ed O
pera
tion
s C
ost
@ $
800/
lb t
o or
bit)
25% or $200/lb to
orbit
20% or $160/lb to orbit
15% or $120/lb to orbit
10% or $80/lb to orbit
FIGURE 6a. Annual Profit @ $800/lb to orbit cost
A NOVEL METHODOLOGY FOR ESTIMATING UPPER LIMITS OF MAJOR COST DRIVERS FOR PROFITABLE
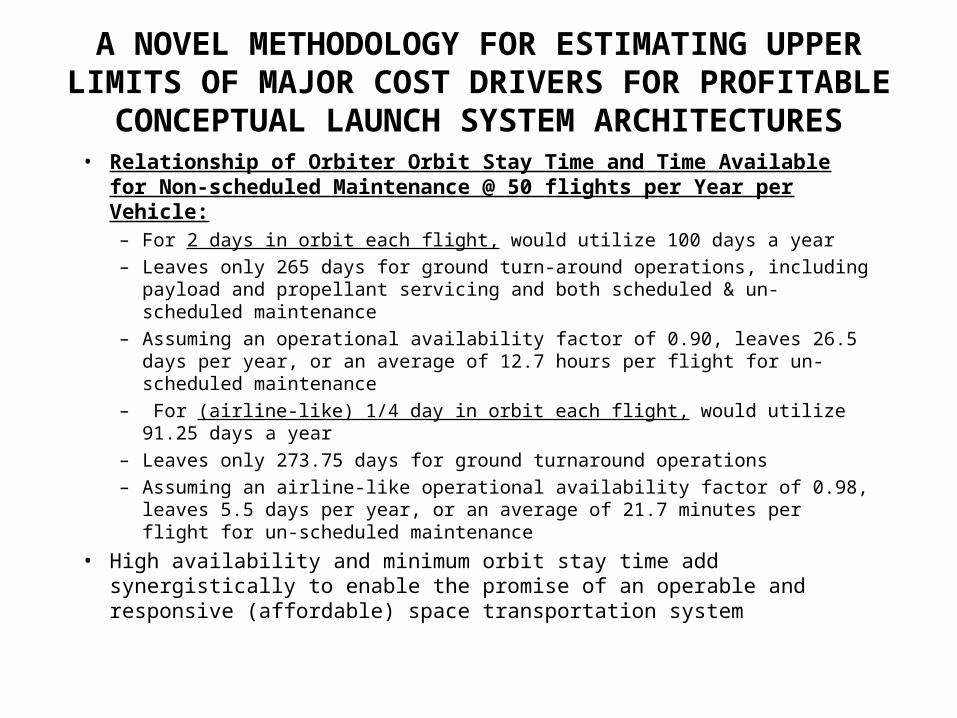
CONCEPTUAL LAUNCH SYSTEM ARCHITECTURES• Relationship of Orbiter Orbit Stay Time and Time Available for Non-
scheduled Maintenance @ 50 flights per Year per Vehicle:– For 2 days in orbit each flight, would utilize 100 days a year– Leaves only 265 days for ground turn-around operations, including payload
and propellant servicing and both scheduled & un-scheduled maintenance– Assuming an operational availability factor of 0.90, leaves 26.5 days per year,
or an average of 12.7 hours per flight for un-scheduled maintenance– For (airline-like) 1/4 day in orbit each flight, would utilize 91.25 days a year – Leaves only 273.75 days for ground turnaround operations– Assuming an airline-like operational availability factor of 0.98, leaves 5.5 days
per year, or an average of 21.7 minutes per flight for un-scheduled maintenance
• High availability and minimum orbit stay time add synergistically to enable the promise of an operable and responsive (affordable) space transportation system

A NOVEL METHODOLOGY FOR ESTIMATING UPPER LIMITS OF MAJOR COST DRIVERS FOR PROFITABLE
CONCEPTUAL LAUNCH SYSTEM ARCHITECTURESMAJOR COST DRIVER RELATIONSHIPS
"1994" SHUTTLE BENCH MARKS
• Total Program Budget $ 4,973.4 Million– Labor Cost $ 3,445.9 Million or Headcount of 37,147 FTE's
– Hardware & Materials $ 1,527.4 Million
$ 14,210/# to Orbit or $ 710.49 Million/Flight
• Shuttle Operations Only $ 3,375.7 Million
– Hardware & Materials $ 920.9 Million
– Labor Cost $ 2,454.7 or Headcount of 28,461 FTE's
• Labor– Total Program $ 3,445.9 Million or Headcount of 37,147 FTE's
$ 9,846/# to Orbit or $ 492.27 Million/Flight
• Shuttle Operations only $ 2,454.7 Million or Headcount of 28,461 FTE's
$ 7,014/# to Orbit or $ 35.67 Million/Flight
– Located @ KSC Labor Cost $ 637 Million or 8,657 FTE's
$ 1820/# to Orbit or $ 91 Million/Flight
• Launch Operations $ 503.5 Million or 7,547 FTE's
• Orbiter Logistics $ 133.5 Million or 1110 FTE's
– SSME Logistics $ 121.6 Million or 869 FTE's
A NOVEL METHODOLOGY FOR ESTIMATING UPPER LIMITS OF MAJOR COST DRIVERS FOR PROFITABLE
CONCEPTUAL LAUNCH SYSTEM ARCHITECTURES
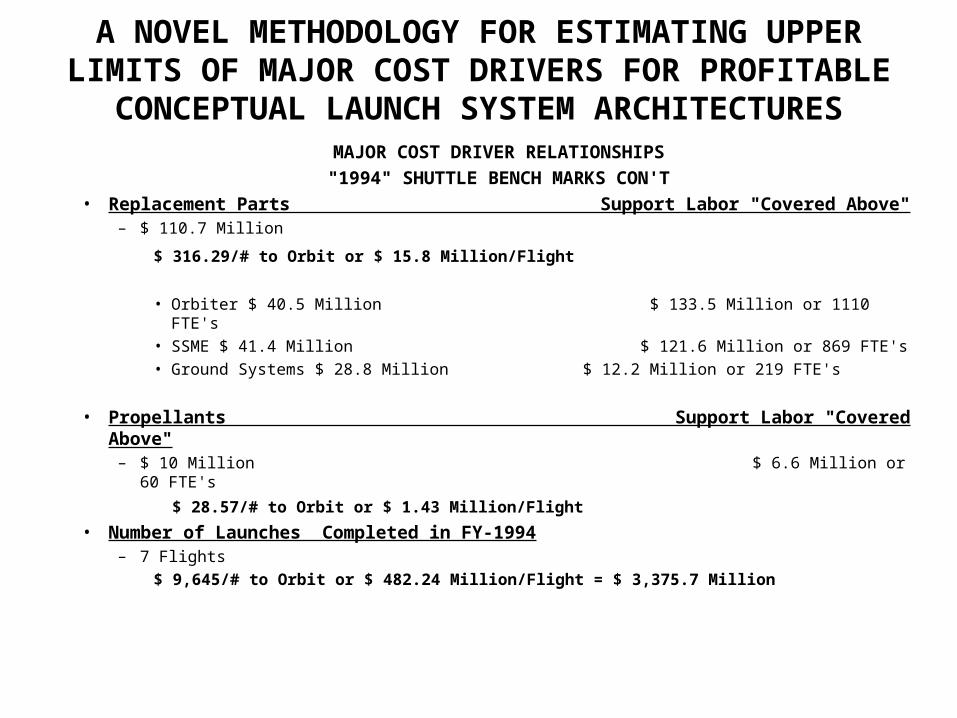
MAJOR COST DRIVER RELATIONSHIPS
"1994" SHUTTLE BENCH MARKS CON'T
• Replacement Parts Support Labor "Covered Above"– $ 110.7 Million
$ 316.29/# to Orbit or $ 15.8 Million/Flight • Orbiter $ 40.5 Million $ 133.5 Million or 1110 FTE's
• SSME $ 41.4 Million $ 121.6 Million or 869 FTE's
• Ground Systems $ 28.8 Million $ 12.2 Million or 219 FTE's
• Propellants Support Labor "Covered Above"– $ 10 Million $ 6.6 Million or 60 FTE's
$ 28.57/# to Orbit or $ 1.43 Million/Flight
• Number of Launches Completed in FY-1994– 7 Flights
$ 9,645/# to Orbit or $ 482.24 Million/Flight = $ 3,375.7 Million


![%E5%af%b9%e5%a4%96%e6%b1%89%e8%af%ad%e6%95%99%e5%ad%a6+%e6%af%94%e5%ad%97%e5%8 f%a5[1]](https://img.pdfslide.net/doc/110x75/5497a2b7ac795959288b552e/e5afb9e5a496e6b189e8afade69599e5ada6e6af94e5ad97e58-fa51.jpg)