Embed Size (px)
Citation preview
7/25/2019 SpaGoBI and MAPS
http://slidepdf.com/reader/full/spagobi-and-maps 1/75
SPAGOBI & IS
Location Analytics with SpagoBI
Community Edition
S t e p h e n O g u t u

7/25/2019 SpaGoBI and MAPS
http://slidepdf.com/reader/full/spagobi-and-maps 2/75
DEDICATION
To all the fathers. I salute you.
7/25/2019 SpaGoBI and MAPS
http://slidepdf.com/reader/full/spagobi-and-maps 3/75
SpagoBI & GIS. Copyright © 2015 by Stephen Ogutu.
All rights reserved, including the right to reproduce this book or portionsthereof in any form whatsoever.
For information, address:
Stephen Ogutu,P.O.Box 8031-00200
Nairobi Kenya.
www.ogutu.org
Trademarks:All other trademarks are the property of their respective owners. The
author is not associated with any product or vendor mentioned in this book.
Limit of Liability/Disclaimer of Warranty:
While the publisher and author have used their best efforts in preparingthis book, they make no representations or warranties with respect to theaccuracy or completeness of the contents of this book and specifically
disclaim any implied warranties or merchantability or fitness for a
particular purpose. No warranty may be createdor extended by sales
representatives or written sales materials. The advice and strategiescontained herein may not be suitable for your situation. You should
consult with a professional where appropriate. Neither the publisher nor
author shall be liable for any loss of profit or any other commercial
damages, including but not limited to special, incidental, consequential,or other damages.
First Edition: May 2015
7/25/2019 SpaGoBI and MAPS
http://slidepdf.com/reader/full/spagobi-and-maps 4/75
CONTENTS
INTRODUCTION ............................................................................................1
QGIS ...............................................................................................................5
GEOSERVER ................................................................................................ 11
SPAGOBI ...................................................................................................... 18
THE ATTRIBUTE TABLE ............................................................................. 26
TEMPLATE ................................................................................................. 41
CROSS NAVIGATION ................................................................................... 47
I

7/25/2019 SpaGoBI and MAPS
http://slidepdf.com/reader/full/spagobi-and-maps 5/75
The Author.
Stephen Ogutu is a technologist and educator
from Kenya. He has worked with various
companies including Essar Telecom, IST,
ICDC, Airtel then Zain , Neptune software
PLC and others in different capacities.He
currently lives in Nairobi Kenya and consults
on Core banking systems, Business
Intelligence and database related technologies.
He can be reached on [email protected]

7/25/2019 SpaGoBI and MAPS
http://slidepdf.com/reader/full/spagobi-and-maps 6/75
7/25/2019 SpaGoBI and MAPS
http://slidepdf.com/reader/full/spagobi-and-maps 7/75
Introduction
Kung Fu means supreme ski l l from hard work. Preparation, endlessrepetition, until your mind is weary, and your bones ache, until you're
too tired to sweat, too wasted to breathe. That is the way, the only way
one acquires kung fu.
Hundred Eyes - Marco Polo (2014) Season 1
n this book, we will learn how to integrate SpagoBI
business intelligence software and a geographic
information system (GIS).
Business Intelligence systems are used to provide usefulinformation from the millions of transactions done by
businesses daily while GIS systems are used to analyze all
types of geographical data. The marriage of these two systems
provides a powerful platform that provides a visual analysis of
the data that can be appreciated by even non technical users.
This is not a book on GIS but rather a book on integration ofGIS and Business Intelligence. However, the reader do not
need to have any background training on GIS or SpagoBI
because we will be introducing these concepts gradually and
even readers new to these technologies will be able to pick up.
Introduction to GIS
So what is GIS? We can say that it is any system that stores
and analyses geographical data. Several software do exist in
the market that fills this role. Such software include both
desktop and browser based variants such as Bing Maps,
I
1
7/25/2019 SpaGoBI and MAPS
http://slidepdf.com/reader/full/spagobi-and-maps 8/75
For support and projects [email protected] WEB: www.learn-spagobi.com
2
ArcServer, Google Earth, Arcmap and QGIS. We will be using
the free QGIS for this tutorial.
When dealing with GIS, we normally store two types of data:
1. Attribute data – This is textual data that describes
features in the map for example population information
about countries. It basically says what a feature is.
2. Spatial data – This describes where the feature is to be
found and is made up of coordinates and other
information about map features. Further, spatial data
can either be vector based or raster based. Vector based
data uses paths to render the image while raster uses
pixels. In this book, we will see how to represent several
features in a map as vector consisting of points, lines,
and areas. We will also use raster data. Do not worry
about this versbose description, it will become clearer
once we begin the practical exercise.
Scenario one
The SpagoBI training website www.learn-spabobi.com has
several students from different countries all over the world.
The owner wants to map the students in a map of the world sothat he can easily see which countries has the most users to his
website. This will allow him to customize the courses to better
suit his audience. How can we use SpagoBI to achieve this?
7/25/2019 SpaGoBI and MAPS
http://slidepdf.com/reader/full/spagobi-and-maps 9/75
3
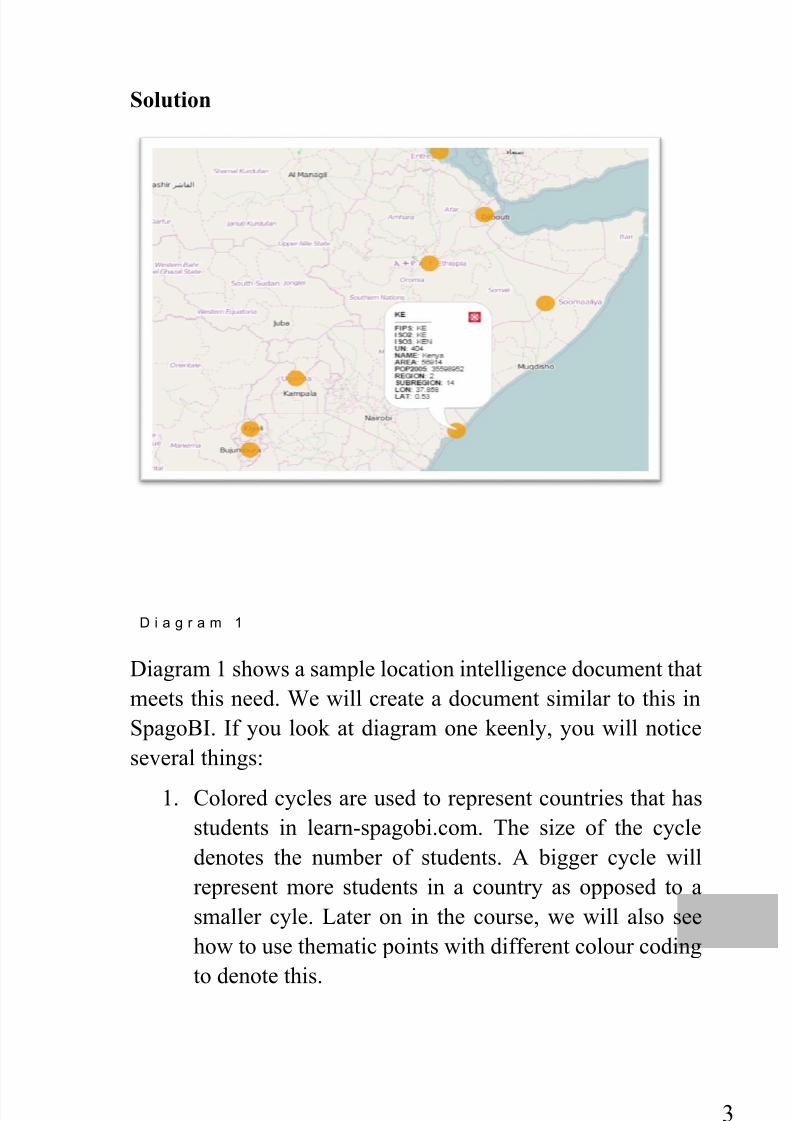
Solution
D i a g r a m 1
Diagram 1 shows a sample location intelligence document that
meets this need. We will create a document similar to this in
SpagoBI. If you look at diagram one keenly, you will notice
several things:
1. Colored cycles are used to represent countries that has
students in learn-spagobi.com. The size of the cycle
denotes the number of students. A bigger cycle will
represent more students in a country as opposed to a
smaller cyle. Later on in the course, we will also see
how to use thematic points with different colour codingto denote this.
7/25/2019 SpaGoBI and MAPS
http://slidepdf.com/reader/full/spagobi-and-maps 10/75
For support and projects [email protected] WEB: www.learn-spagobi.com
4
2. The map has attribute data that gives more information
about a country if a cycle is clicked. For example, when
we click on the cyce on Kenya, it tells us that the ISO
code for Kenya is KE, it gives us the population,longitude and latitude e.t.c. We will learn how to add
our own attribute data, how to modify existing attribute
data and how to reat attribute data from a relational
database to make it dynamic.
3. Lastly, we note that this map came from existing
sources like google map or any other source with uptodate maps. We will use maps from
http://thematicmapping.org but you can follow
along with maps from your own sources.
7/25/2019 SpaGoBI and MAPS
http://slidepdf.com/reader/full/spagobi-and-maps 11/75
5
QGIS
To help us provide a solution to what have been described in
scenario one, get started with SpagoBI and GIS, we will first
need to download and setup a GIS software that we will need
to manipulate and view the maps that we will then be analysed
together with additional data, by SpagoBI.
So what is QGIS? Wikipedia gives a very good summary of
what this software is. Here is what they say about it. QGIS
(previously known as "Quantum GIS") is a cross-platform free
and open-source desktop geographic information system (GIS)
application that provides data viewing, editing, and analysis
capabilities
Similar to other software GIS systems QGIS allows users to
create maps with many layers using different map projections.
Maps can be assembled in different formats and for different
uses. QGIS allows maps to be composed of raster or vector
layers. Typical for this kind of software the vector data is stored
as either point, line, or polygon-feature. Different kinds of
raster images are supported and the software can perform
georeferencing of images.
(http://en.wikipedia.org/wiki/QGIS)
Now if you check our requirements for scenario one above, you
see that the first thing we need is a world map. It is in thecountries in this map that we will put cycles to denote a country
where a student resides, the bigger the cycle, the more
2
7/25/2019 SpaGoBI and MAPS
http://slidepdf.com/reader/full/spagobi-and-maps 12/75
For support and projects [email protected] WEB: www.learn-spagobi.com
6
studennts we have in that country. Since we are not in the
business of creating maps, we will need to download the world
map from somewhere. Again as we do not want to pay for this
map, we can get one from a reputed public source. Then oncewe have the map, we can use QGIS to modify its attributes.
Follow these steps.
1. Download QGIS Desktop 2.8.2 from
https://www.qgis.org/en/site/forusers/download.html
2. Install the QGIS software in your machine. It will
come with several other software that we will not be
using e.g GRASS GIS 6.4.3, MSYS and QGIS
Browser 2.8.2 and SAGA GIS (2.1.2). We are only
interested in QGIS Desktop 2.8.2.
3. From your desktop or start menu, click on QGIS
Desktop 2.8.2. icon. It has the icon similar to the one
below.
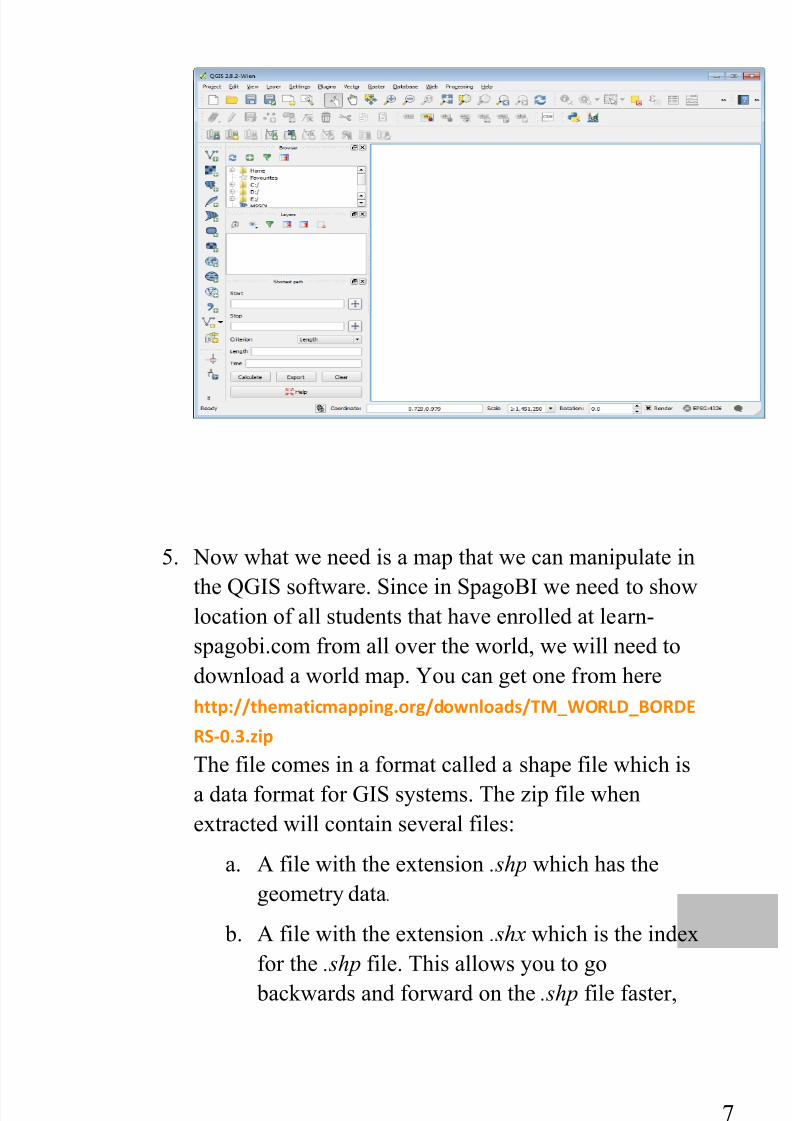
4. This will open the QGIS desktop.
7/25/2019 SpaGoBI and MAPS
http://slidepdf.com/reader/full/spagobi-and-maps 13/75
7
5. Now what we need is a map that we can manipulate in
the QGIS software. Since in SpagoBI we need to show
location of all students that have enrolled at learn-
spagobi.com from all over the world, we will need to
download a world map. You can get one from here
http://thematicmapping.org/downloads/TM_WORLD_BORDE
RS-0.3.zip
The file comes in a format called a shape file which isa data format for GIS systems. The zip file when
extracted will contain several files:
a. A file with the extension .shp which has the
geometry data.
b. A file with the extension .shx which is the index
for the .shp file. This allows you to go
backwards and forward on the .shp file faster,
7/25/2019 SpaGoBI and MAPS
http://slidepdf.com/reader/full/spagobi-and-maps 14/75
For support and projects [email protected] WEB: www.learn-spagobi.com
8
much like indexes do in a book or a relational
database.
c. A file with the extension .dbf which stores
attributes for each shape. This file is in the
dBase format.
d. A file with the extension .prj which has the
coordinate system and projection information in
the Well-known text (WKT) format.
6. Extract the map to the location
E:\BI\TM_WORLD_BORDERS-0.3. You will notice
that the map comes as several files as discussed above.
a. TM_WORLD_BORDERS-0.3.dbf
b. TM_WORLD_BORDERS-0.3.prj
c. TM_WORLD_BORDERS-0.3.shp
d. TM_WORLD_BORDERS-0.3.shx
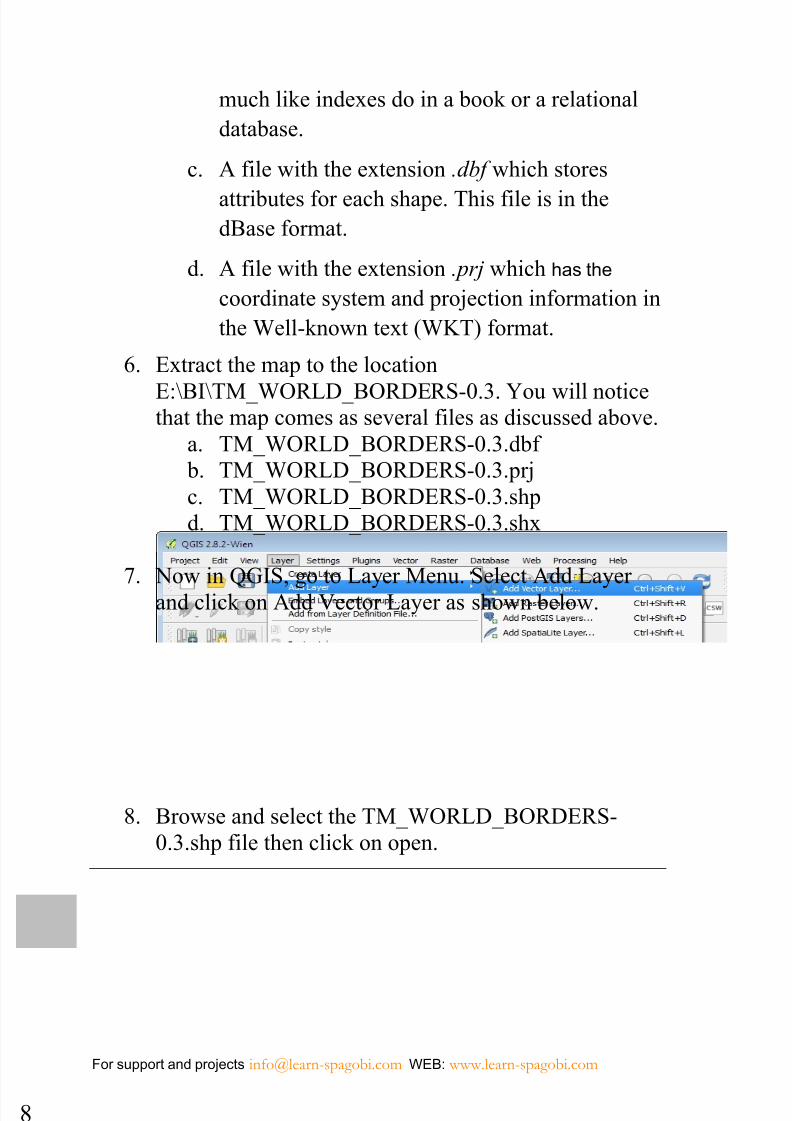
7. Now in QGIS, go to Layer Menu. Select Add Layerand click on Add Vector Layer as shown below.
8. Browse and select the TM_WORLD_BORDERS-
0.3.shp file then click on open.
7/25/2019 SpaGoBI and MAPS
http://slidepdf.com/reader/full/spagobi-and-maps 15/75
9
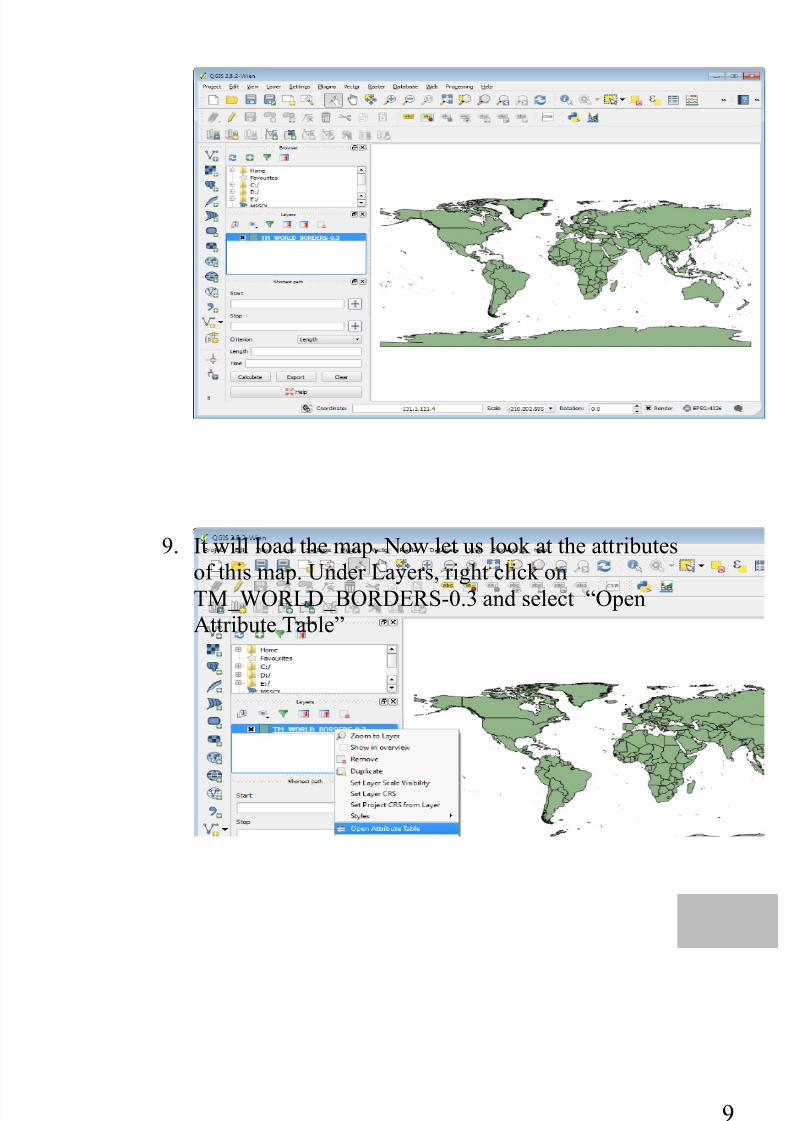
9. It will load the map. Now let us look at the attributes
of this map. Under Layers, right click onTM_WORLD_BORDERS-0.3 and select “Open
Attribute Table”
7/25/2019 SpaGoBI and MAPS
http://slidepdf.com/reader/full/spagobi-and-maps 16/75
For support and projects [email protected] WEB: www.learn-spagobi.com
10
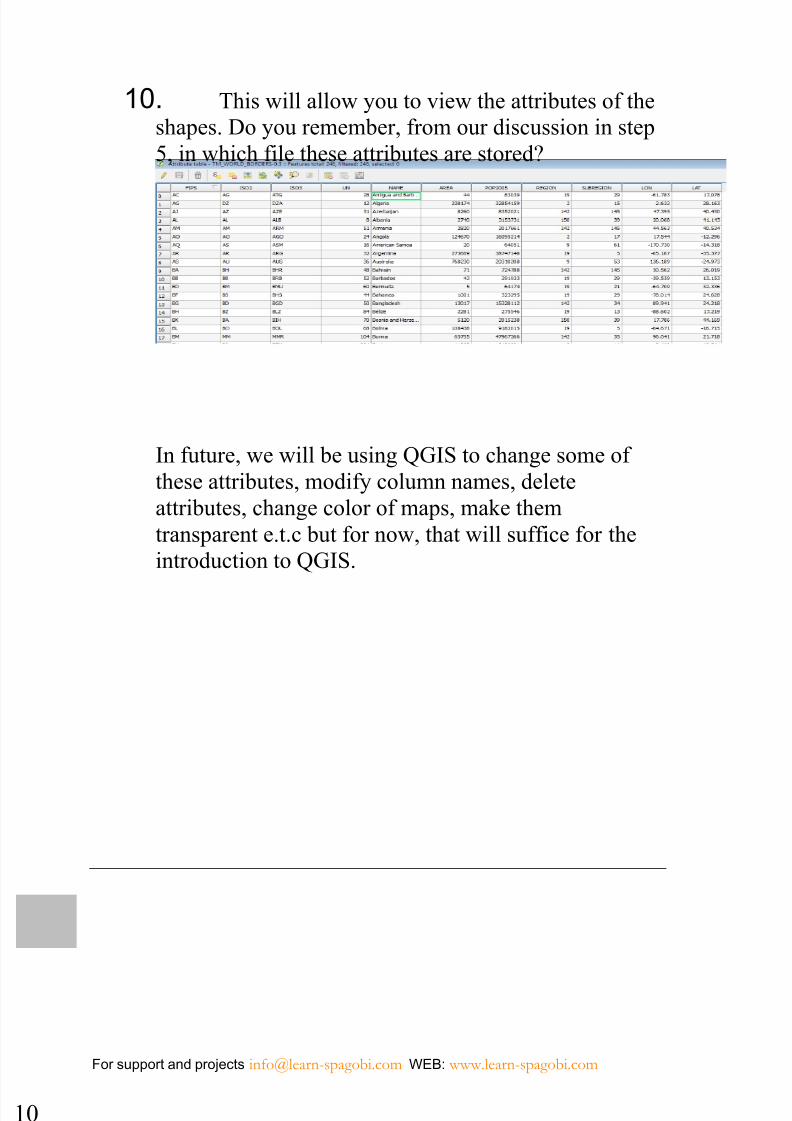
10. This will allow you to view the attributes of the
shapes. Do you remember, from our discussion in step
5, in which file these attributes are stored?
In future, we will be using QGIS to change some of
these attributes, modify column names, delete
attributes, change color of maps, make them
transparent e.t.c but for now, that will suffice for the
introduction to QGIS.
7/25/2019 SpaGoBI and MAPS
http://slidepdf.com/reader/full/spagobi-and-maps 17/75
11
GeoServer
Once we have modified the attributes of the map we had
downloaded in QGIS, we will need a way of publishing or
distributing it to SpagoBI. We do this using another software
called GeoServer. This server allows you to share your map
with a large audience who will just need a URL to be able to
access it. So now let us go to http://geoserver.org/ and
download the latest version of GeoServer in my case version
2.7.1.
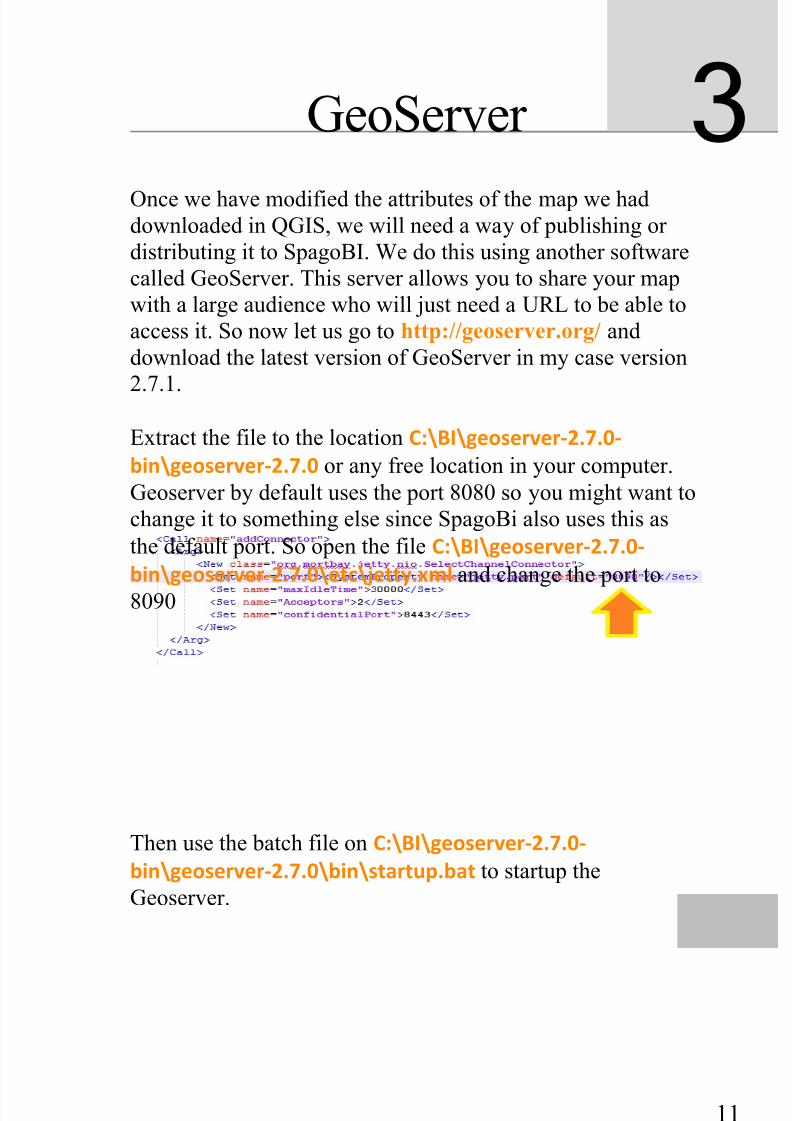
Extract the file to the location C:\BI\geoserver-2.7.0-
bin\geoserver-2.7.0 or any free location in your computer.
Geoserver by default uses the port 8080 so you might want to
change it to something else since SpagoBi also uses this as
the default port. So open the file C:\BI\geoserver-2.7.0-
bin\geoserver-2.7.0\etc\jetty.xml and change the port to8090
Then use the batch file on C:\BI\geoserver-2.7.0-
bin\geoserver-2.7.0\bin\startup.bat to startup the
Geoserver.
3
7/25/2019 SpaGoBI and MAPS
http://slidepdf.com/reader/full/spagobi-and-maps 18/75
For support and projects [email protected] WEB: www.learn-spagobi.com
12
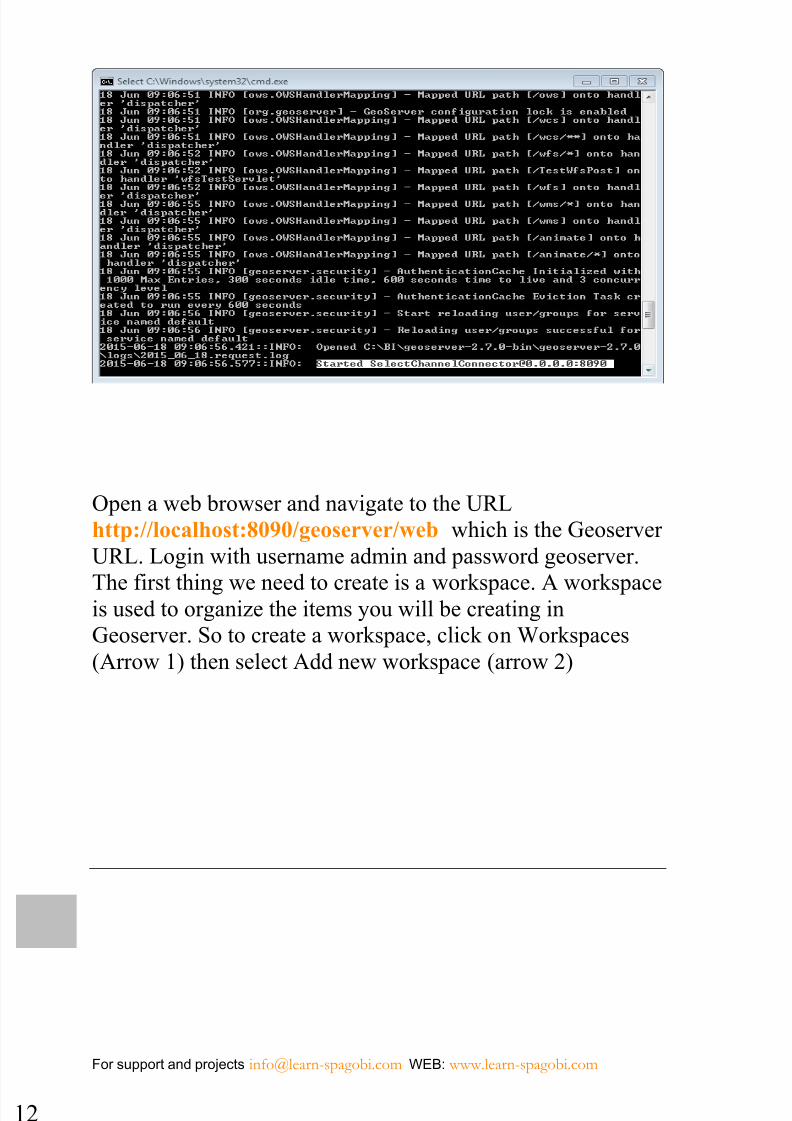
Open a web browser and navigate to the URL
http://localhost:8090/geoserver/web which is the Geoserver
URL. Login with username admin and password geoserver.
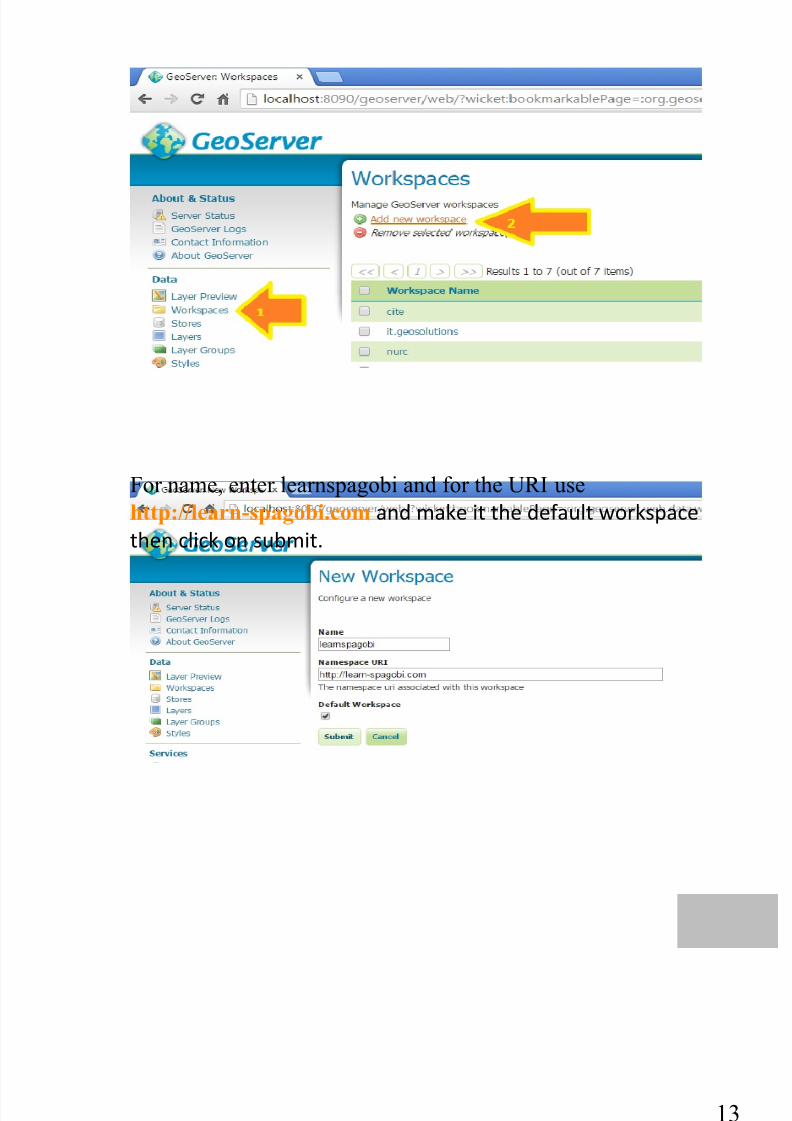
The first thing we need to create is a workspace. A workspace
is used to organize the items you will be creating in
Geoserver. So to create a workspace, click on Workspaces
(Arrow 1) then select Add new workspace (arrow 2)
7/25/2019 SpaGoBI and MAPS
http://slidepdf.com/reader/full/spagobi-and-maps 19/75
7/25/2019 SpaGoBI and MAPS
http://slidepdf.com/reader/full/spagobi-and-maps 20/75
For support and projects [email protected] WEB: www.learn-spagobi.com
14
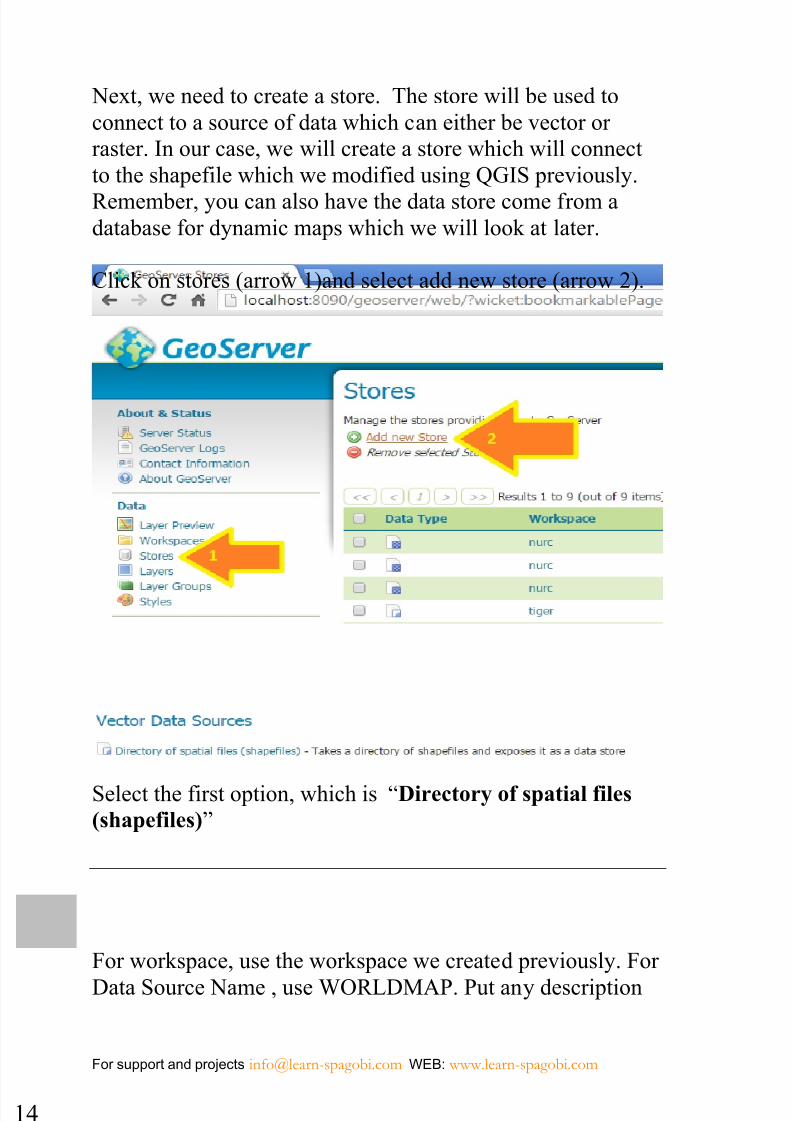
Next, we need to create a store. The store will be used to
connect to a source of data which can either be vector or
raster. In our case, we will create a store which will connect
to the shapefile which we modified using QGIS previously.
Remember, you can also have the data store come from a
database for dynamic maps which we will look at later.
Click on stores (arrow 1)and select add new store (arrow 2).
Select the first option, which is “Directory of spatial files
(shapefiles)”
For workspace, use the workspace we created previously. For
Data Source Name , use WORLDMAP. Put any description
7/25/2019 SpaGoBI and MAPS
http://slidepdf.com/reader/full/spagobi-and-maps 21/75
15
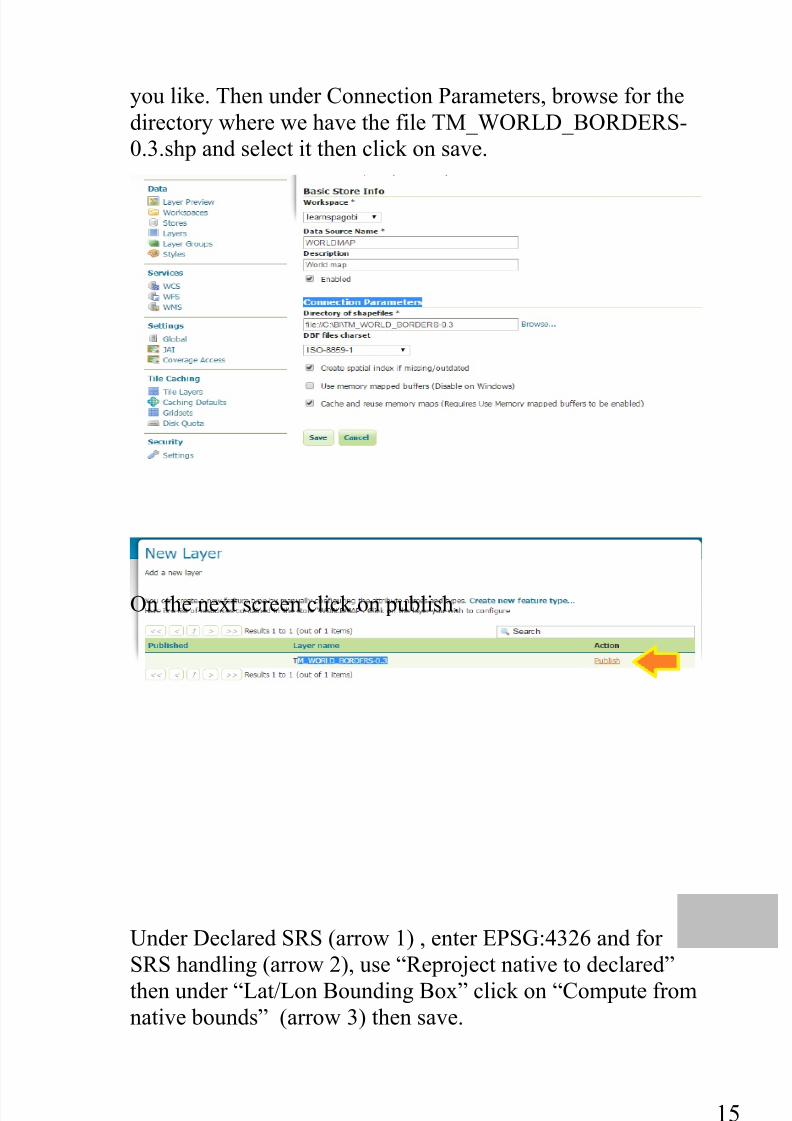
you like. Then under Connection Parameters, browse for the
directory where we have the file TM_WORLD_BORDERS-
0.3.shp and select it then click on save.
On the next screen click on publish.
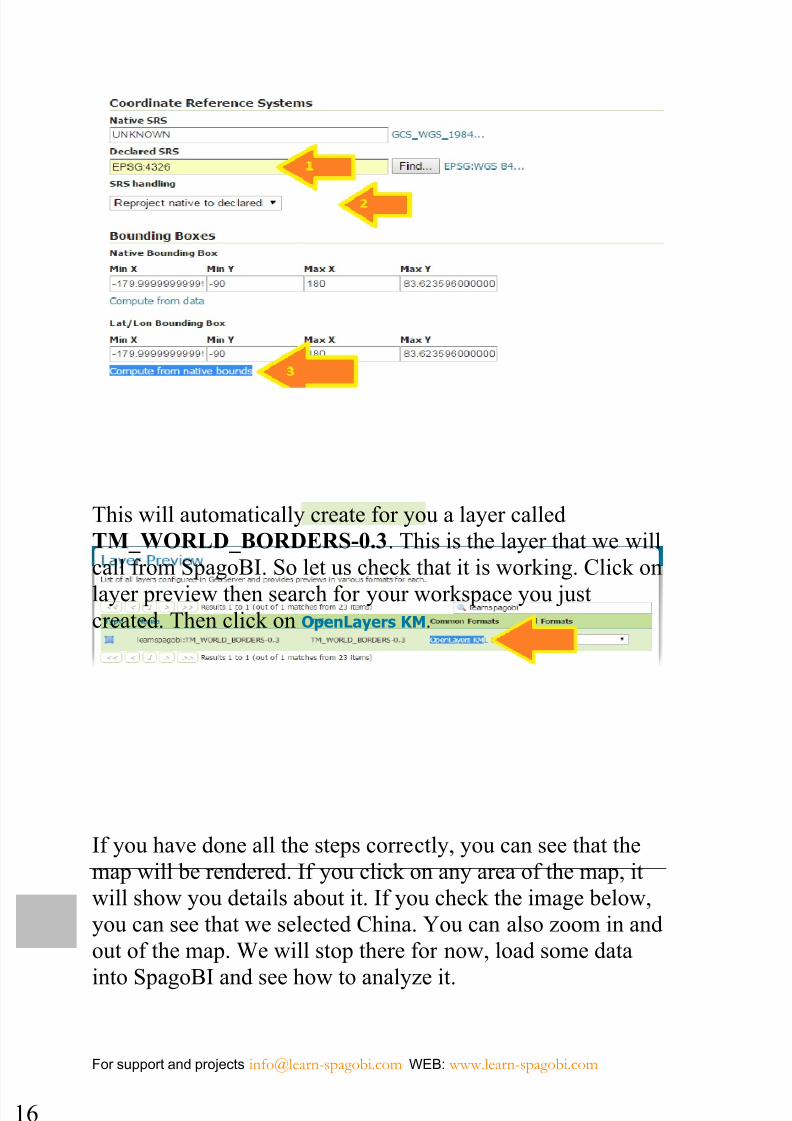
Under Declared SRS (arrow 1) , enter EPSG:4326 and for
SRS handling (arrow 2), use “Reproject native to declared”
then under “Lat/Lon Bounding Box” click on “Compute from
native bounds” (arrow 3) then save.
7/25/2019 SpaGoBI and MAPS
http://slidepdf.com/reader/full/spagobi-and-maps 22/75
For support and projects [email protected] WEB: www.learn-spagobi.com
16
This will automatically create for you a layer called
TM_WORLD_BORDERS-0.3. This is the layer that we will
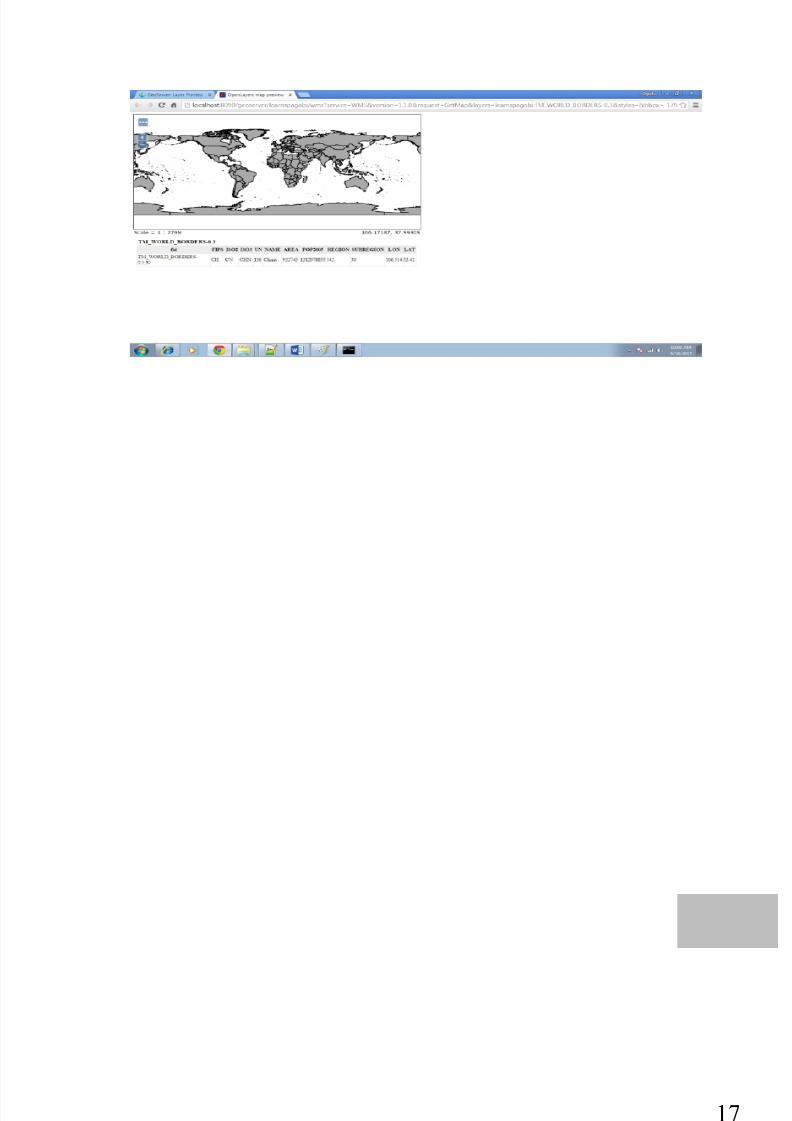
call from SpagoBI. So let us check that it is working. Click onlayer preview then search for your workspace you just
created. Then click on OpenLayers KM.
If you have done all the steps correctly, you can see that the
map will be rendered. If you click on any area of the map, it
will show you details about it. If you check the image below,
you can see that we selected China. You can also zoom in and
out of the map. We will stop there for now, load some datainto SpagoBI and see how to analyze it.
7/25/2019 SpaGoBI and MAPS
http://slidepdf.com/reader/full/spagobi-and-maps 23/75
17
7/25/2019 SpaGoBI and MAPS
http://slidepdf.com/reader/full/spagobi-and-maps 24/75
For support and projects [email protected] WEB: www.learn-spagobi.com
18
SpagoBI
We have now learnt how to modify our map data using QGIS
and how to publish this map in the Geoserver ready for use by
any map consuming application like SpagoBI.
Like we had stated before, we will use the following scenario
to help us make a sample map.The scenario:
The SpagoBI training website www.learn-spabobi.com has
several students from different countries all over the world.
The owner wants to map the students in a map of the world so
that he can easily see which countries has the most users to his
website. This will allow him to customize the courses to better suit his audience. How can we use SpagoBI to achieve this?
From the scenario above, you can see that we need several
things.
1. We need a world map. We have already loaded one in
Geoserver and is ready to be used by SpagoBI.
2. We need the student data that contains which countrythey come from so that we can link it to the map data.
To achive number two above, that is load the student data, we
will need to login to SpagoBI and create a dataset called
“SpagoBI Students” with the contents of the file Learn-
spagobi.com Users.csv which came with this book if you
purchased it.
Proceed as follows:
4
7/25/2019 SpaGoBI and MAPS
http://slidepdf.com/reader/full/spagobi-and-maps 25/75
19
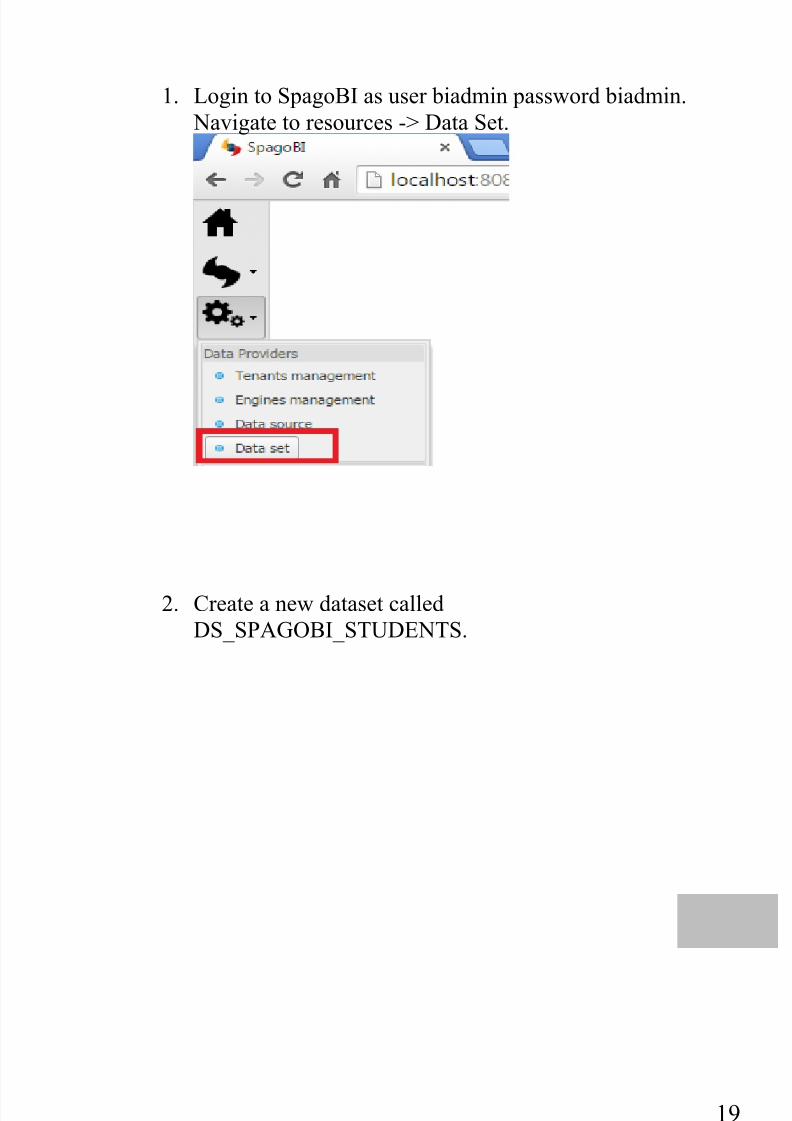
1. Login to SpagoBI as user biadmin password biadmin.
Navigate to resources -> Data Set.
2. Create a new dataset called
DS_SPAGOBI_STUDENTS.
7/25/2019 SpaGoBI and MAPS
http://slidepdf.com/reader/full/spagobi-and-maps 26/75
For support and projects [email protected] WEB: www.learn-spagobi.com
0
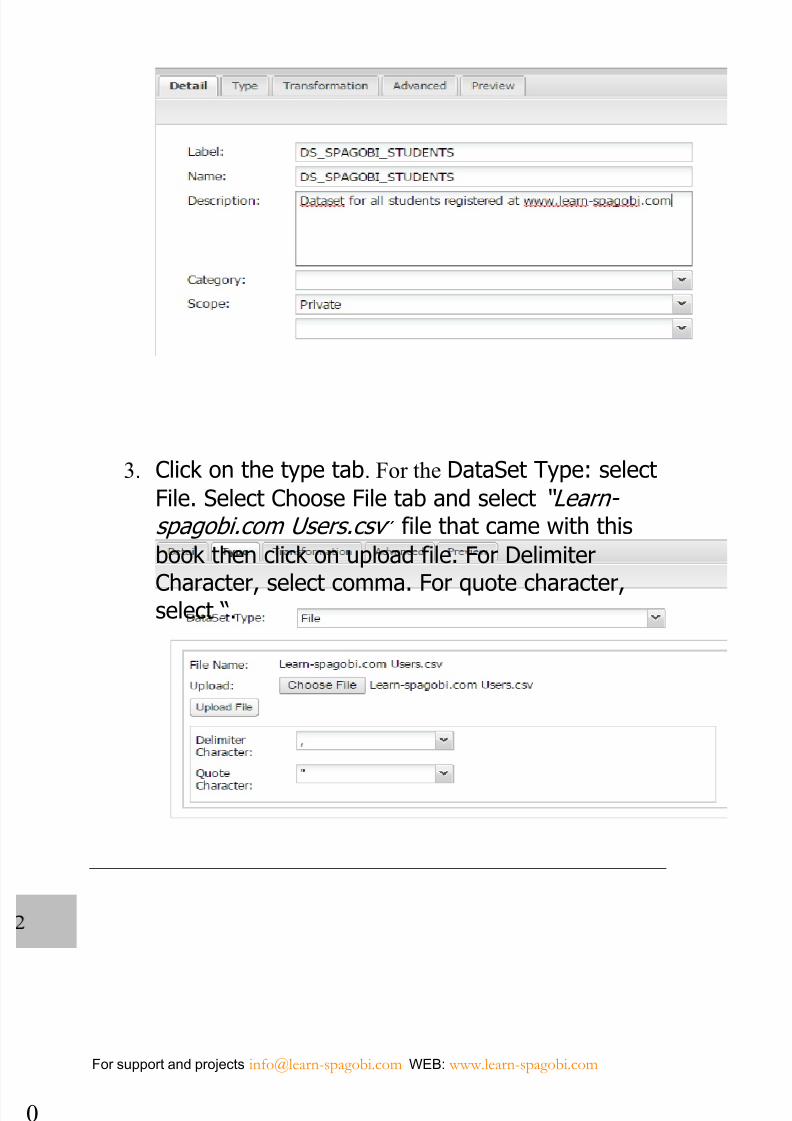
3. Click on the type tab. For the DataSet Type: select
File. Select Choose File tab and select “Learn -
spagobi.com Users.csv ” file that came with this
book then click on upload file. For Delimiter
Character, select comma. For quote character,
select “.
7/25/2019 SpaGoBI and MAPS
http://slidepdf.com/reader/full/spagobi-and-maps 27/75
21
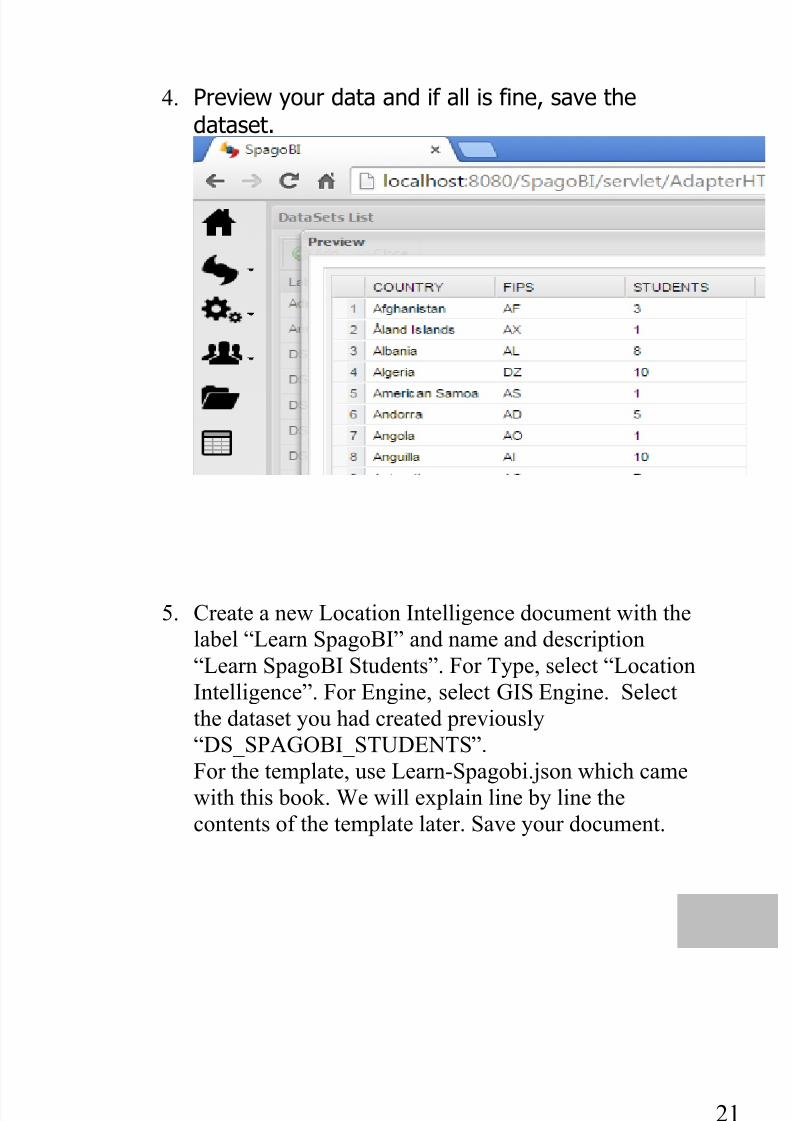
4. Preview your data and if all is fine, save the
dataset.
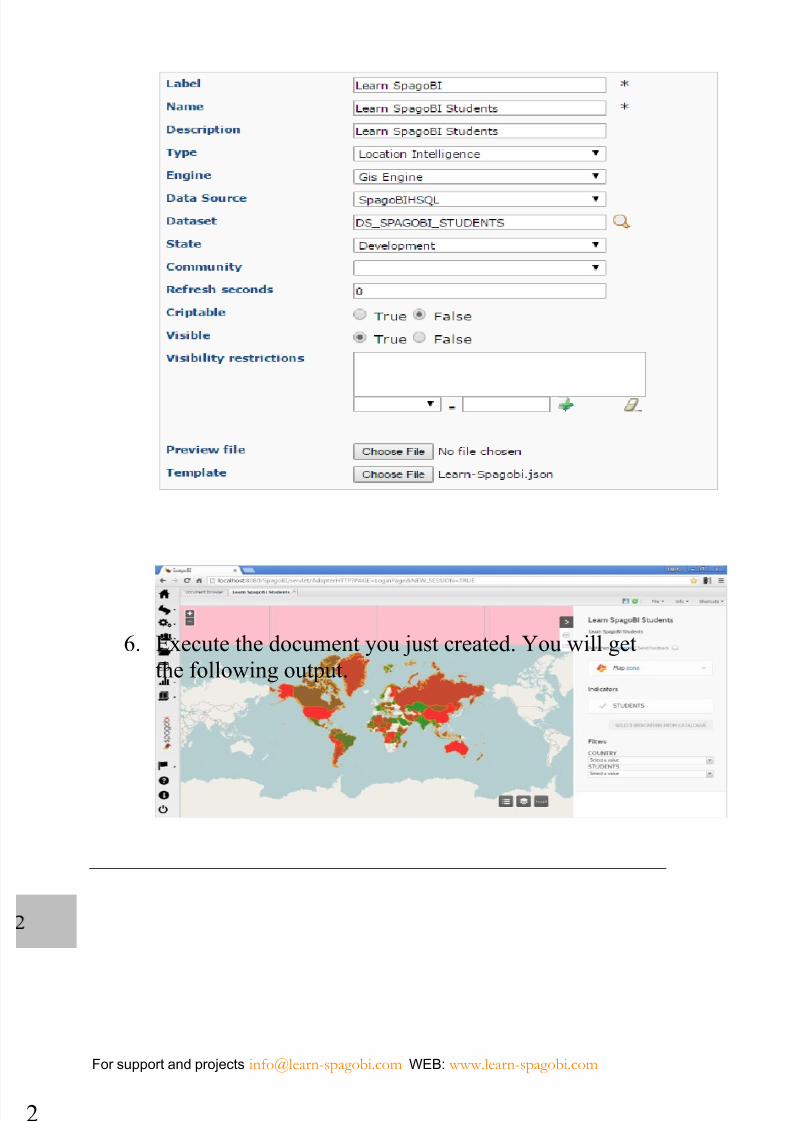
5. Create a new Location Intelligence document with the
label “Learn SpagoBI” and name and description
“Learn SpagoBI Students”. For Type, select “Location
Intelligence”. For Engine, select GIS Engine. Select
the dataset you had created previously
“DS_SPAGOBI_STUDENTS”.
For the template, use Learn-Spagobi.json which came
with this book. We will explain line by line the
contents of the template later. Save your document.
7/25/2019 SpaGoBI and MAPS
http://slidepdf.com/reader/full/spagobi-and-maps 28/75
For support and projects [email protected] WEB: www.learn-spagobi.com
2
6. Execute the document you just created. You will get
the following output.
7/25/2019 SpaGoBI and MAPS
http://slidepdf.com/reader/full/spagobi-and-maps 29/75
23
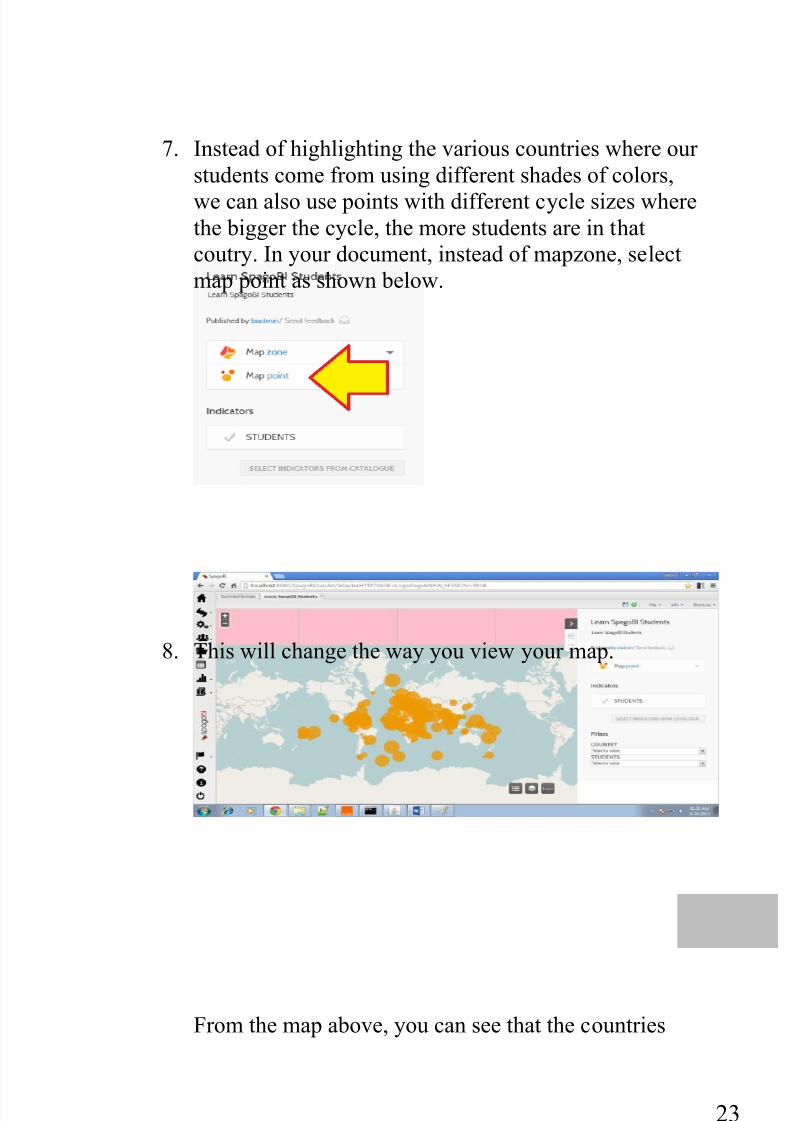
7. Instead of highlighting the various countries where our
students come from using different shades of colors,
we can also use points with different cycle sizes where
the bigger the cycle, the more students are in that
coutry. In your document, instead of mapzone, select
map point as shown below.
8. This will change the way you view your map.
From the map above, you can see that the countries
7/25/2019 SpaGoBI and MAPS
http://slidepdf.com/reader/full/spagobi-and-maps 30/75
For support and projects [email protected] WEB: www.learn-spagobi.com
4
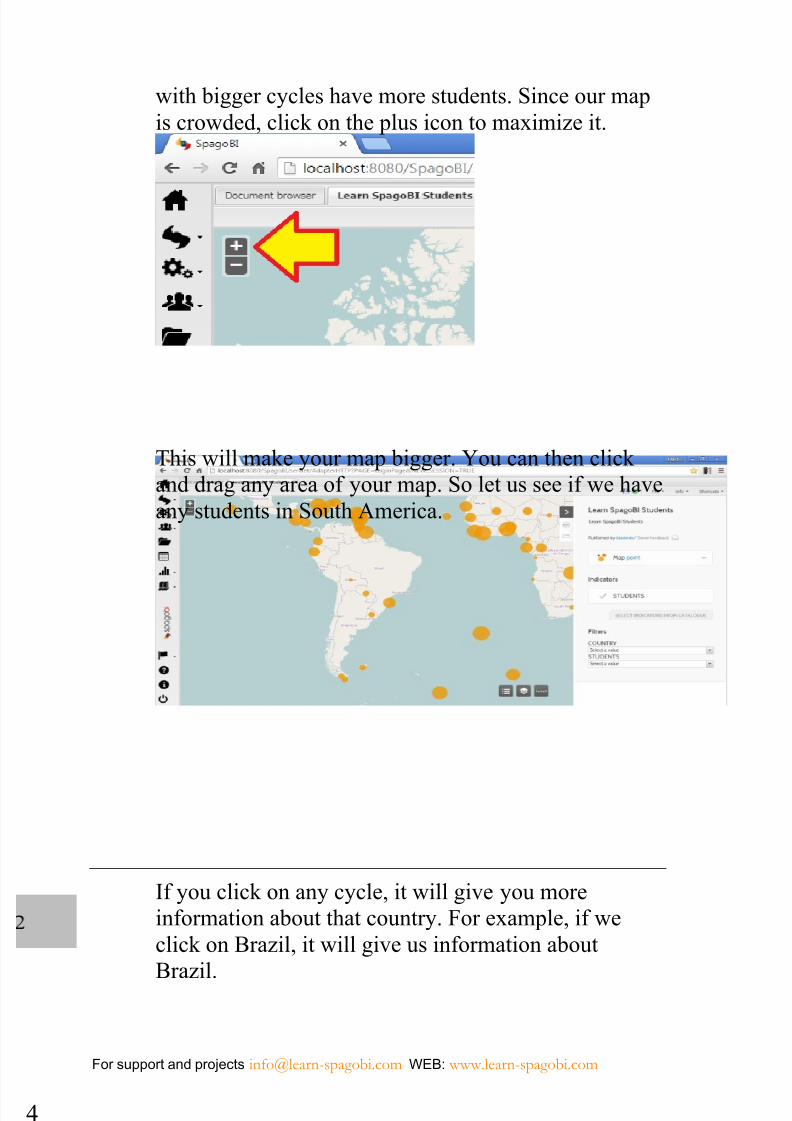
with bigger cycles have more students. Since our map
is crowded, click on the plus icon to maximize it.
This will make your map bigger. You can then click
and drag any area of your map. So let us see if we have
any students in South America.
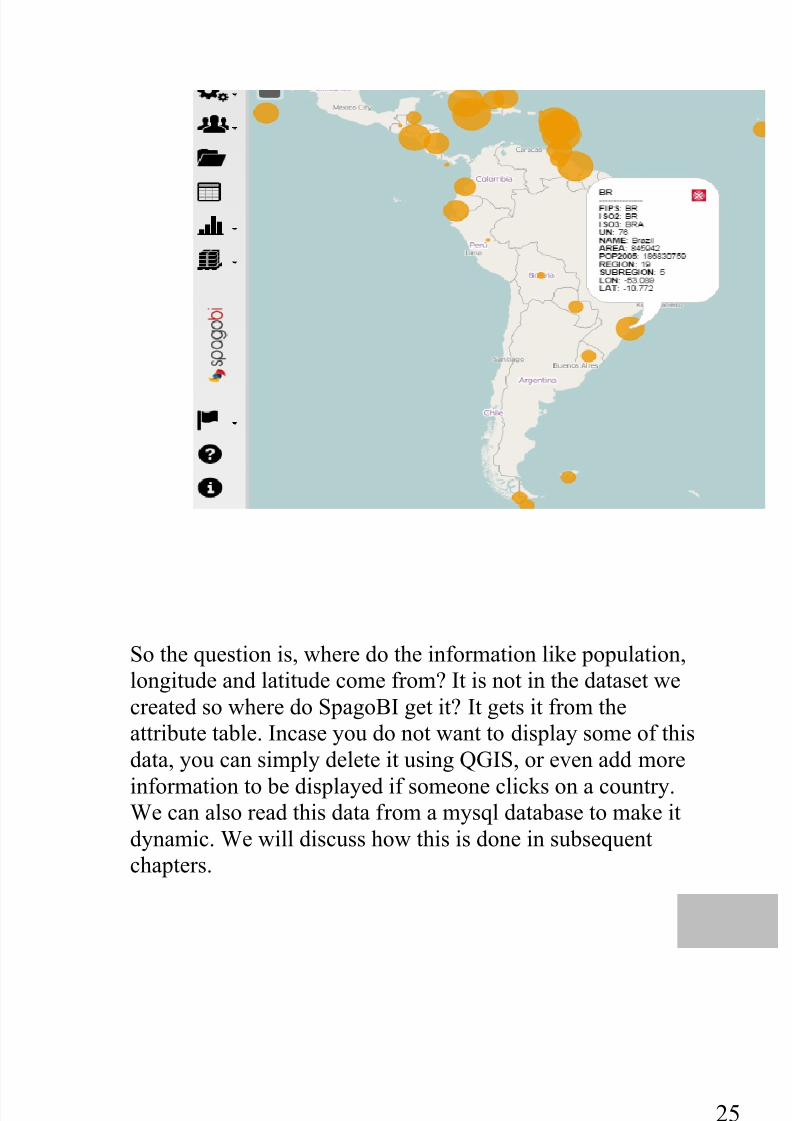
If you click on any cycle, it will give you more
information about that country. For example, if we
click on Brazil, it will give us information aboutBrazil.
7/25/2019 SpaGoBI and MAPS
http://slidepdf.com/reader/full/spagobi-and-maps 31/75
25
So the question is, where do the information like population,
longitude and latitude come from? It is not in the dataset we
created so where do SpagoBI get it? It gets it from the
attribute table. Incase you do not want to display some of this
data, you can simply delete it using QGIS, or even add moreinformation to be displayed if someone clicks on a country.
We can also read this data from a mysql database to make it
dynamic. We will discuss how this is done in subsequent
chapters.
7/25/2019 SpaGoBI and MAPS
http://slidepdf.com/reader/full/spagobi-and-maps 32/75
For support and projects [email protected] WEB: www.learn-spagobi.com
6
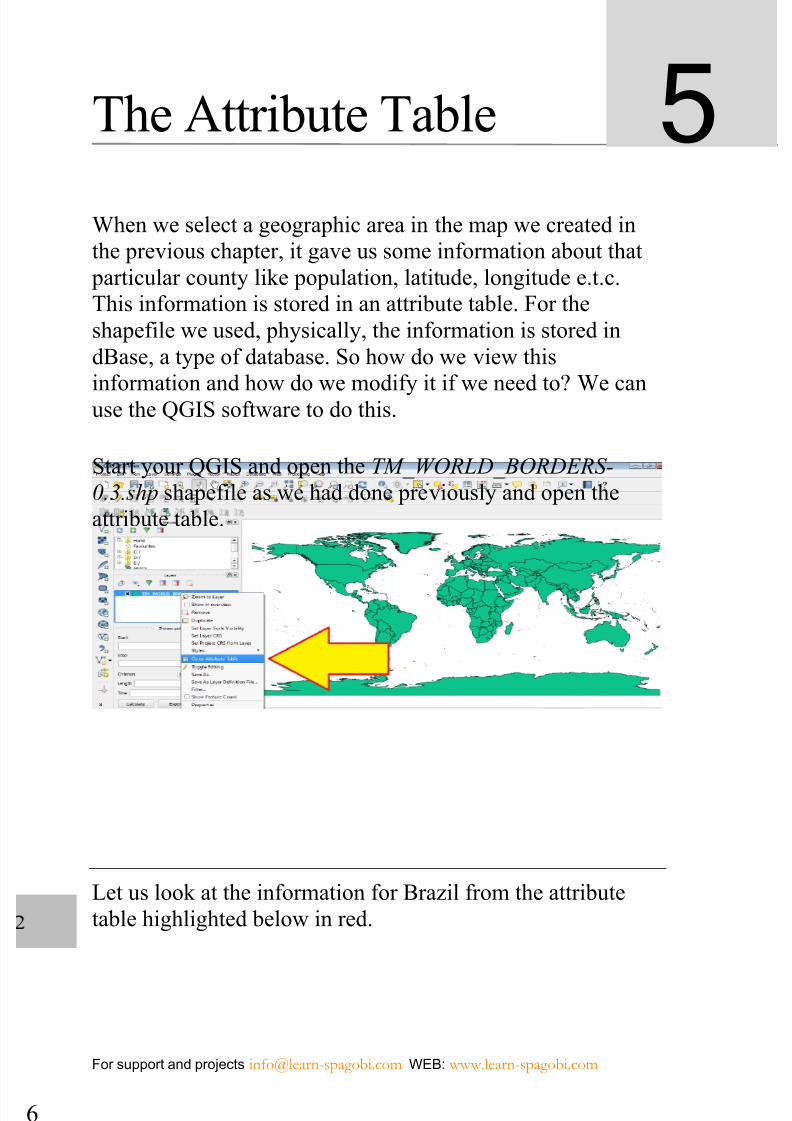
The Attribute Table
When we select a geographic area in the map we created in
the previous chapter, it gave us some information about that
particular county like population, latitude, longitude e.t.c.
This information is stored in an attribute table. For the
shapefile we used, physically, the information is stored in
dBase, a type of database. So how do we view this
information and how do we modify it if we need to? We canuse the QGIS software to do this.
Start your QGIS and open the TM_WORLD_BORDERS-
0.3.shp shapefile as we had done previously and open the
attribute table.
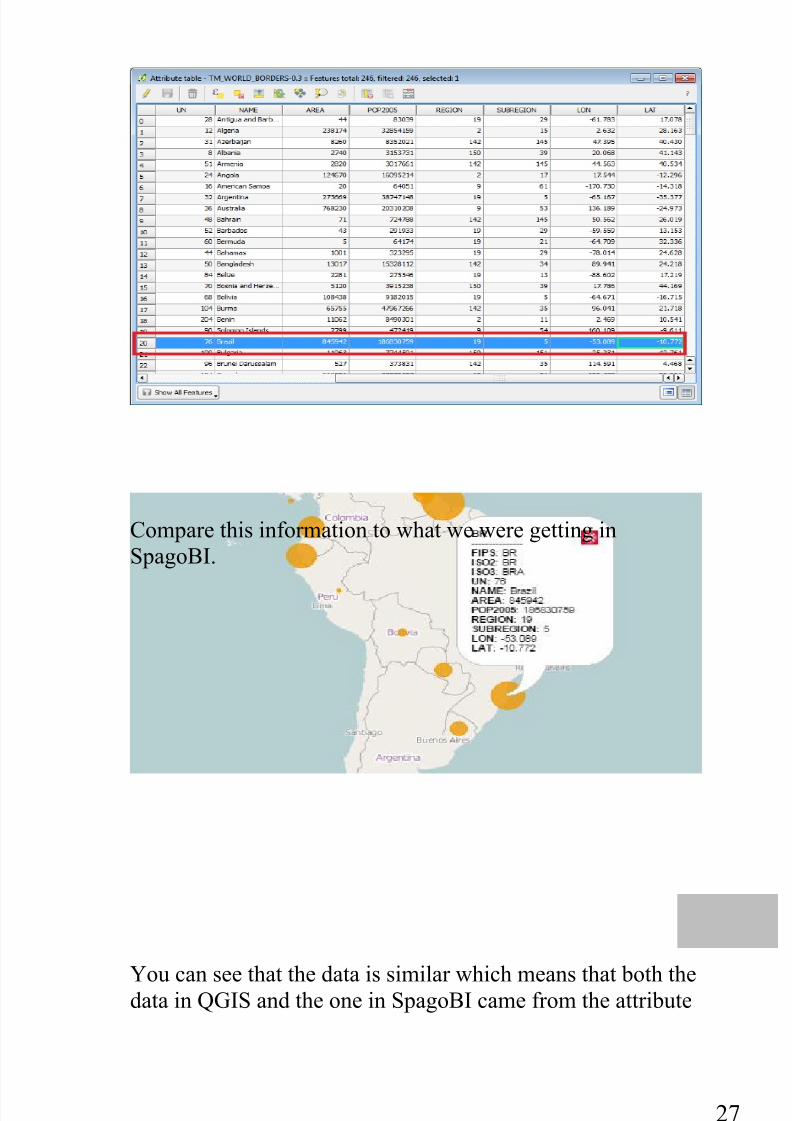
Let us look at the information for Brazil from the attribute
table highlighted below in red.
5
7/25/2019 SpaGoBI and MAPS
http://slidepdf.com/reader/full/spagobi-and-maps 33/75
27
Compare this information to what we were getting in
SpagoBI.
You can see that the data is similar which means that both the
data in QGIS and the one in SpagoBI came from the attribute
7/25/2019 SpaGoBI and MAPS
http://slidepdf.com/reader/full/spagobi-and-maps 34/75
For support and projects [email protected] WEB: www.learn-spagobi.com
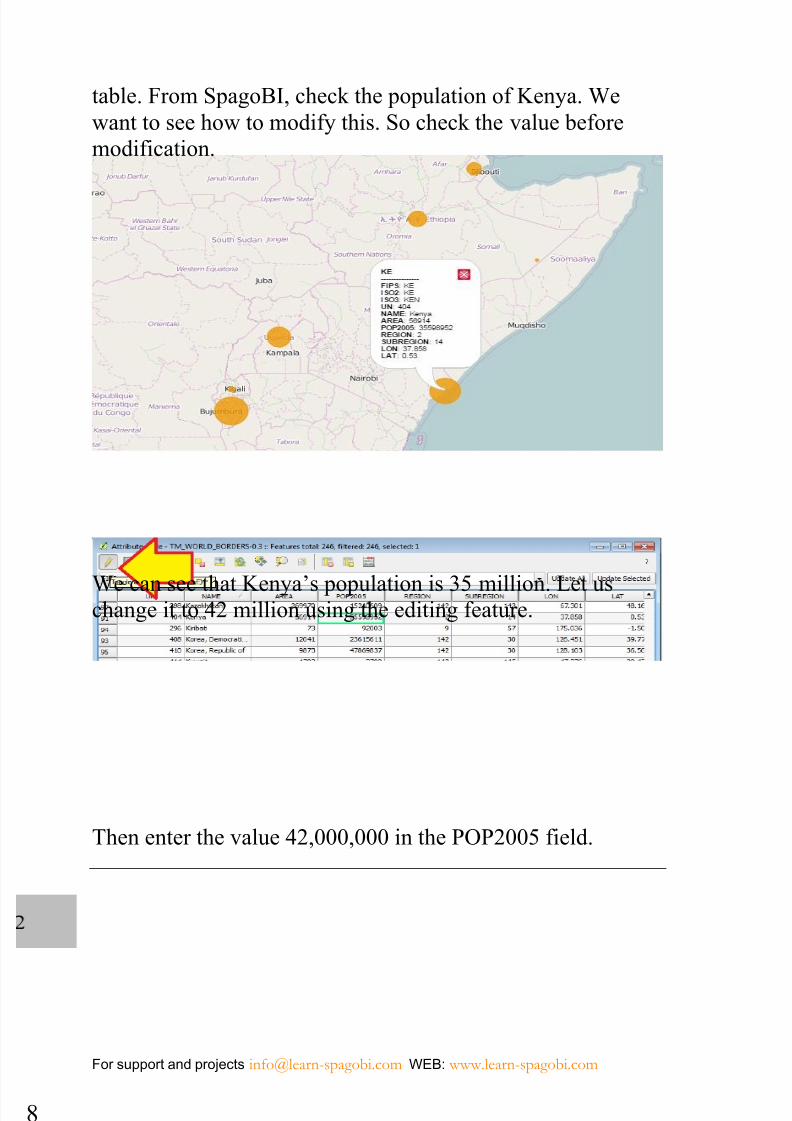
8
table. From SpagoBI, check the population of Kenya. We
want to see how to modify this. So check the value before
modification.
We can see that Kenya’s population is 35 million. Let us
change it to 42 million using the editing feature.
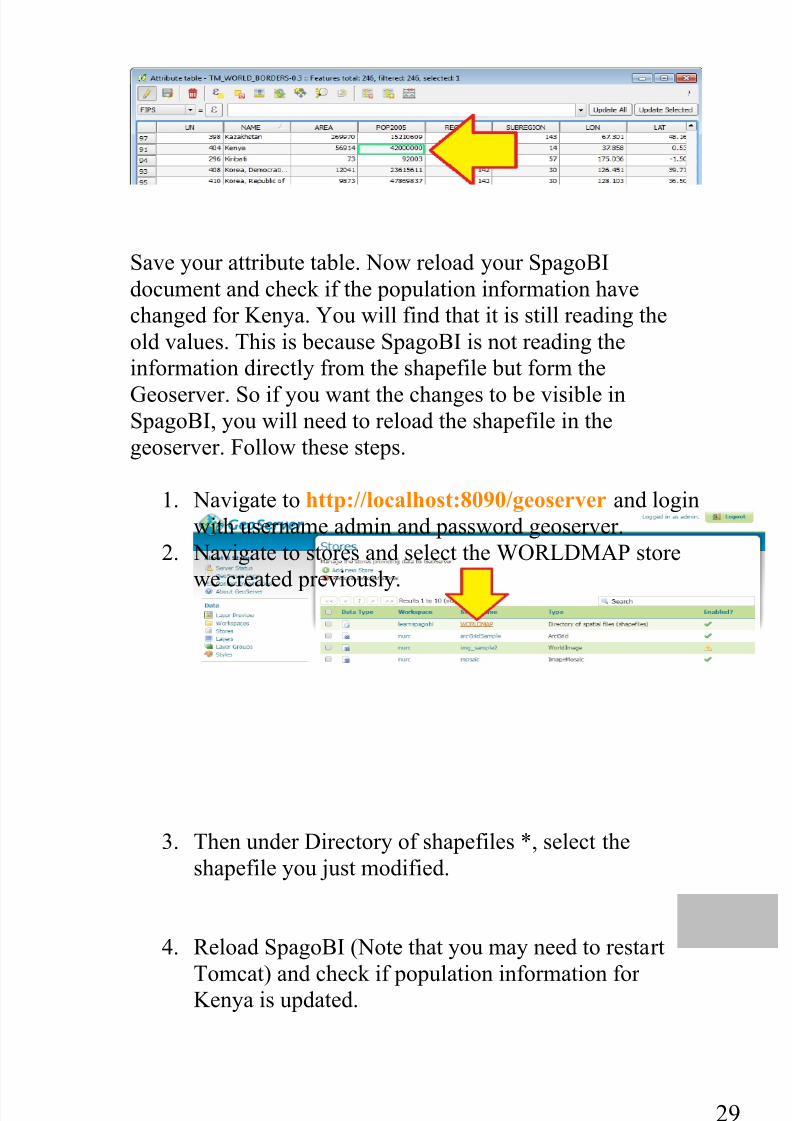
Then enter the value 42,000,000 in the POP2005 field.
7/25/2019 SpaGoBI and MAPS
http://slidepdf.com/reader/full/spagobi-and-maps 35/75
29
Save your attribute table. Now reload your SpagoBI
document and check if the population information have
changed for Kenya. You will find that it is still reading the
old values. This is because SpagoBI is not reading the
information directly from the shapefile but form the
Geoserver. So if you want the changes to be visible in
SpagoBI, you will need to reload the shapefile in the
geoserver. Follow these steps.
1. Navigate to http://localhost:8090/geoserver and login
with username admin and password geoserver.
2. Navigate to stores and select the WORLDMAP store
we created previously.
3. Then under Directory of shapefiles *, select the
shapefile you just modified.
4. Reload SpagoBI (Note that you may need to restartTomcat) and check if population information for
Kenya is updated.
7/25/2019 SpaGoBI and MAPS
http://slidepdf.com/reader/full/spagobi-and-maps 36/75
For support and projects [email protected] WEB: www.learn-spagobi.com
0
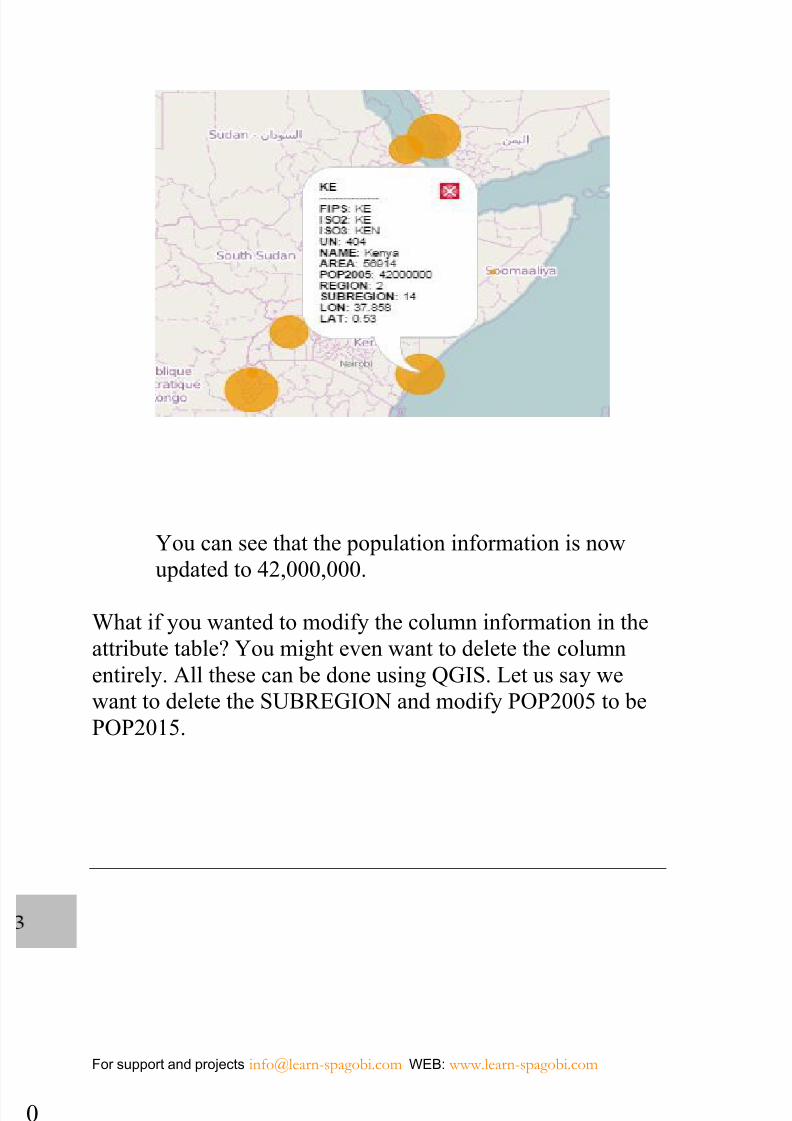
You can see that the population information is now
updated to 42,000,000.
What if you wanted to modify the column information in the
attribute table? You might even want to delete the column
entirely. All these can be done using QGIS. Let us say we
want to delete the SUBREGION and modify POP2005 to be
POP2015.
7/25/2019 SpaGoBI and MAPS
http://slidepdf.com/reader/full/spagobi-and-maps 37/75
31
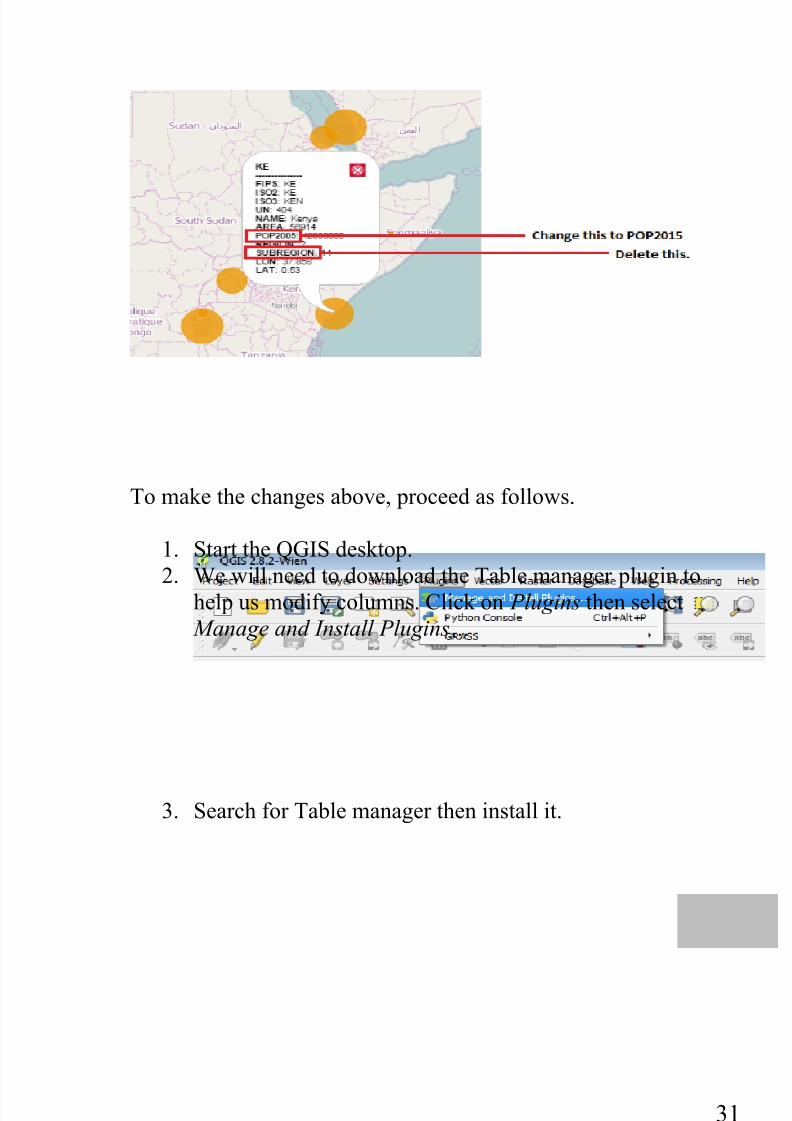
To make the changes above, proceed as follows.
1. Start the QGIS desktop.
2. We will need to download the Table manager plugin tohelp us modify columns. Click on Plugins then select
Manage and Install Plugins…
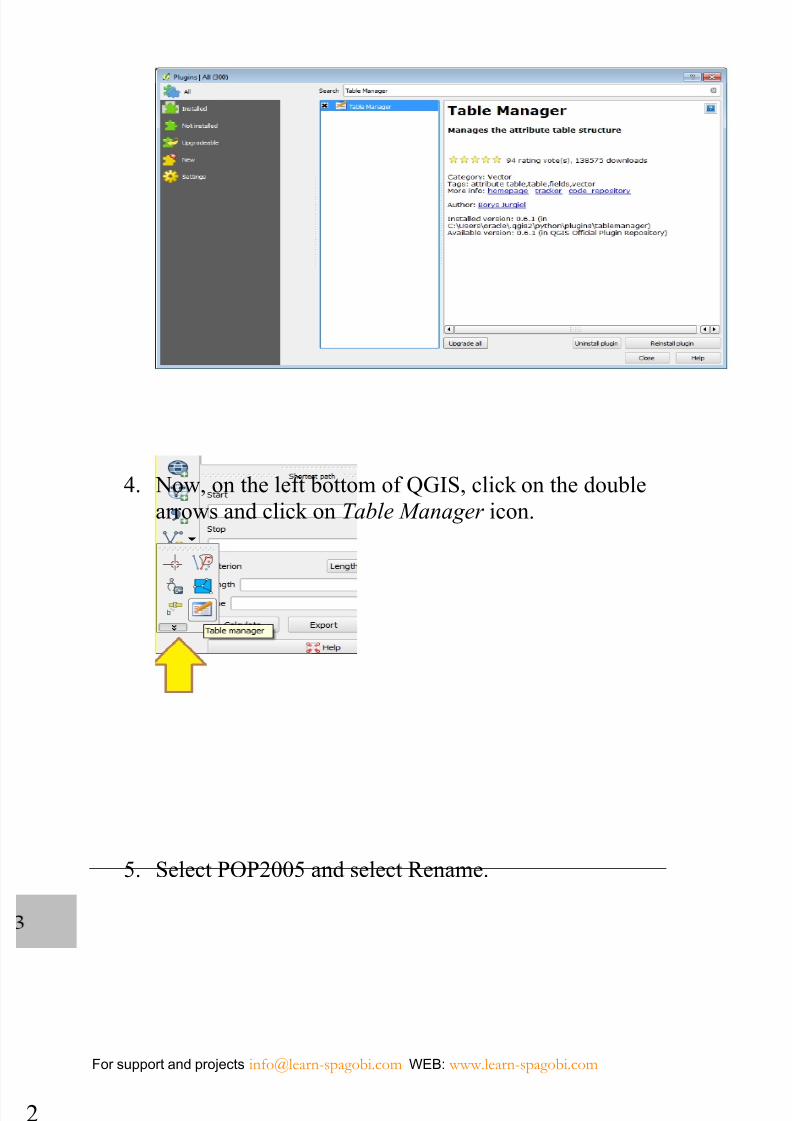
3. Search for Table manager then install it.
7/25/2019 SpaGoBI and MAPS
http://slidepdf.com/reader/full/spagobi-and-maps 38/75
For support and projects [email protected] WEB: www.learn-spagobi.com
2
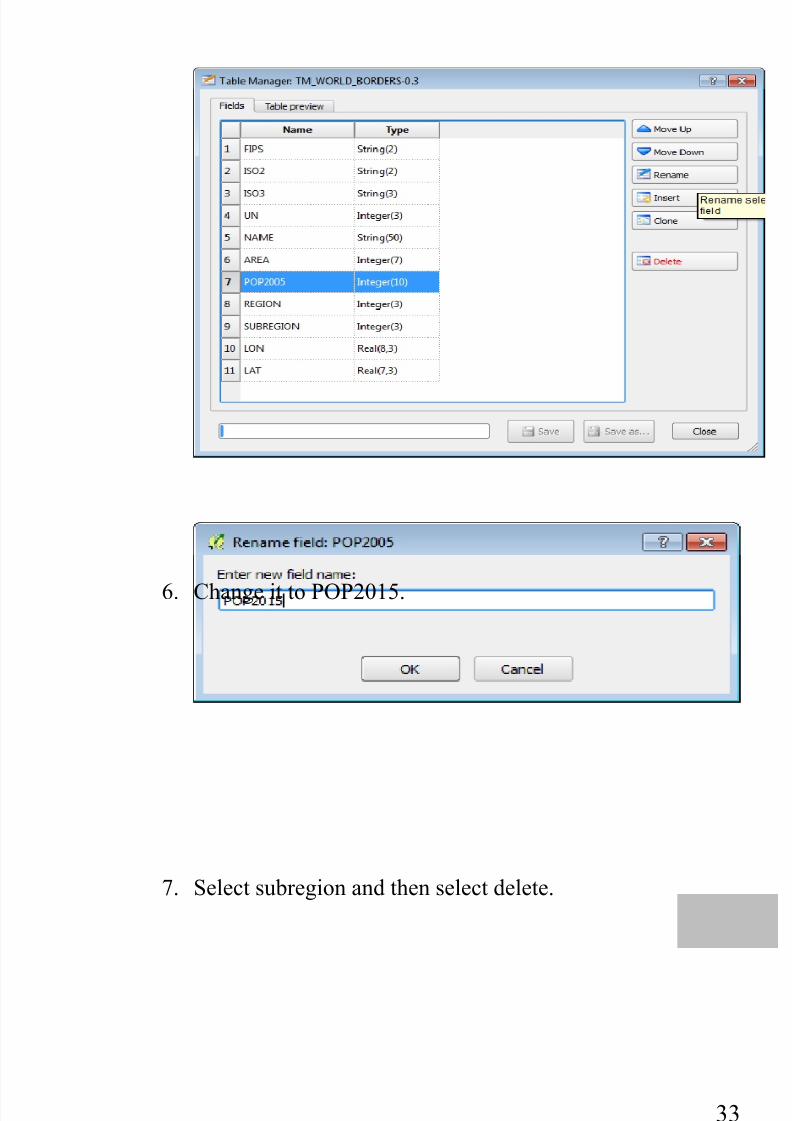
4. Now, on the left bottom of QGIS, click on the double
arrows and click on Table Manager icon.
5. Select POP2005 and select Rename.
7/25/2019 SpaGoBI and MAPS
http://slidepdf.com/reader/full/spagobi-and-maps 39/75
33
6. Change it to POP2015.
7. Select subregion and then select delete.
7/25/2019 SpaGoBI and MAPS
http://slidepdf.com/reader/full/spagobi-and-maps 40/75
For support and projects [email protected] WEB: www.learn-spagobi.com
4
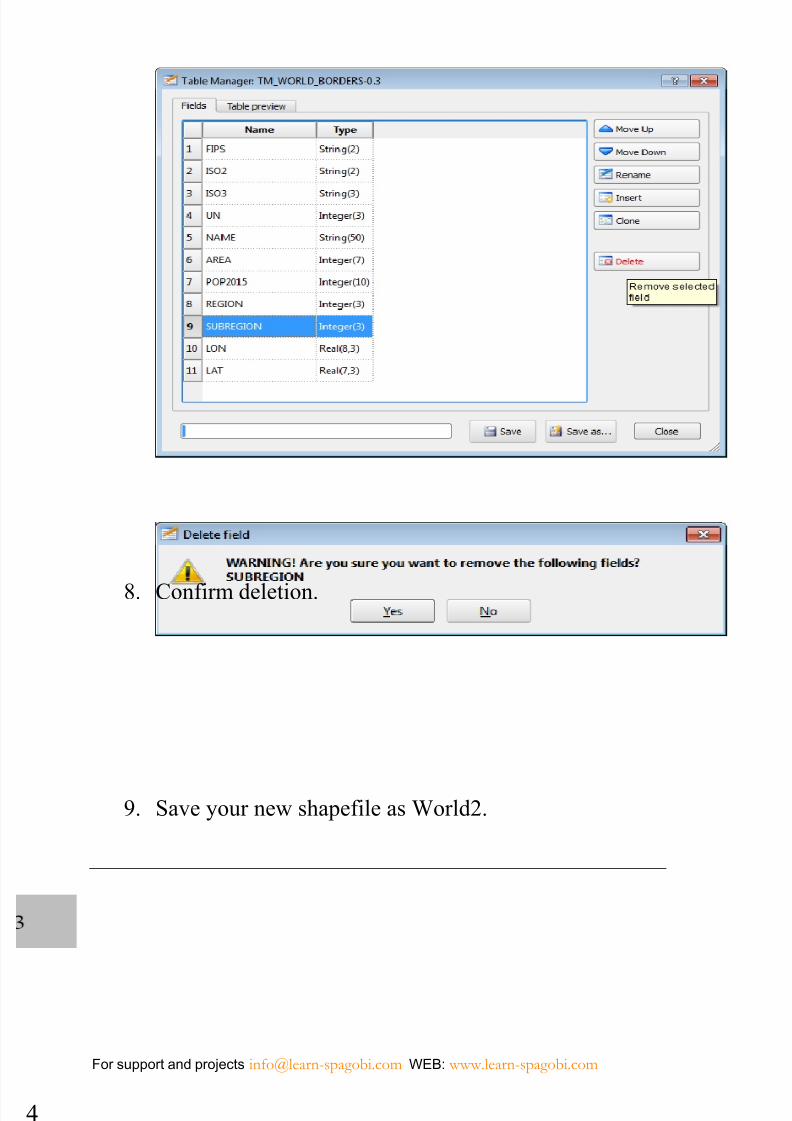
8. Confirm deletion.
9. Save your new shapefile as World2.
7/25/2019 SpaGoBI and MAPS
http://slidepdf.com/reader/full/spagobi-and-maps 41/75
35
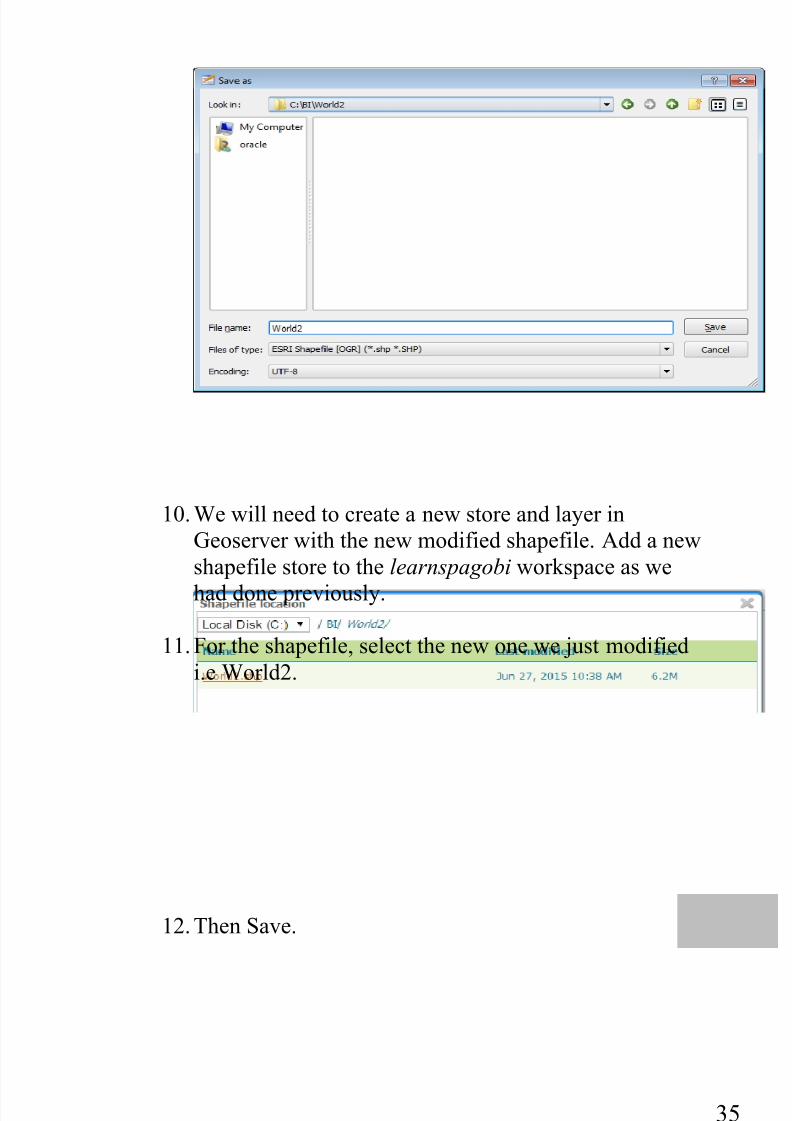
10. We will need to create a new store and layer in
Geoserver with the new modified shapefile. Add a new
shapefile store to the learnspagobi workspace as wehad done previously.
11. For the shapefile, select the new one we just modified
i.e World2.
12. Then Save.
7/25/2019 SpaGoBI and MAPS
http://slidepdf.com/reader/full/spagobi-and-maps 42/75
For support and projects [email protected] WEB: www.learn-spagobi.com
6
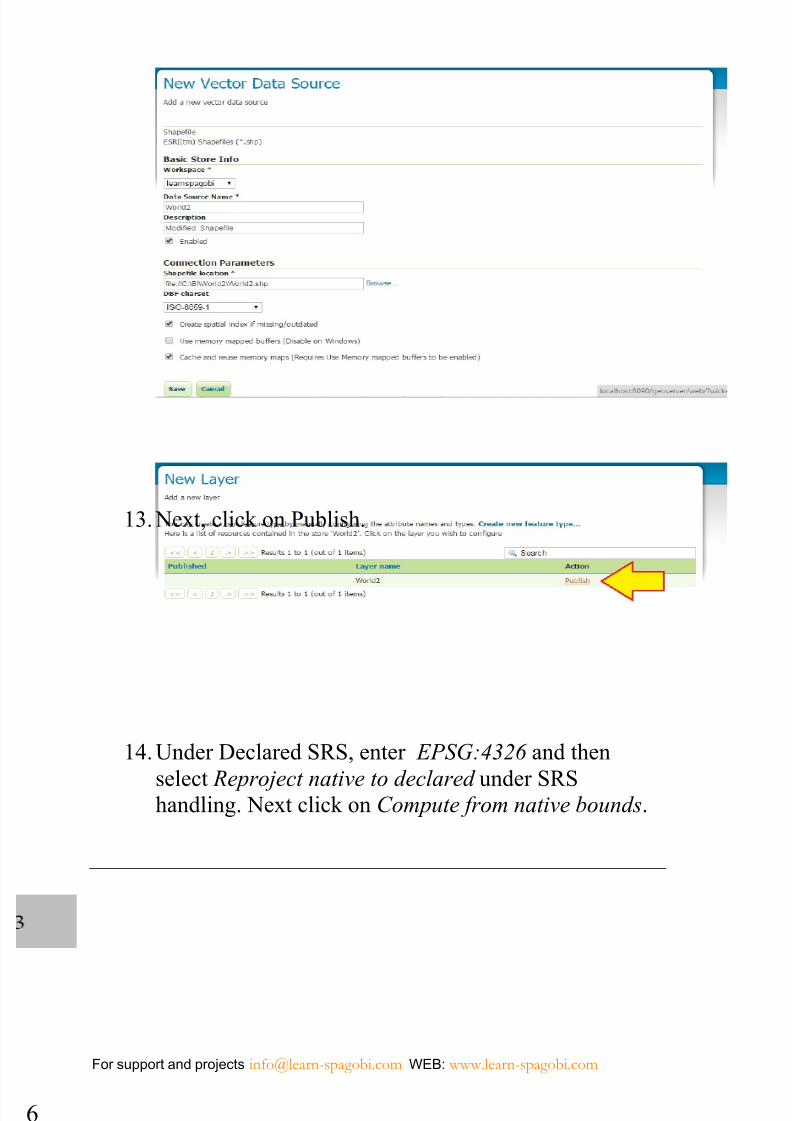
13. Next, click on Publish.
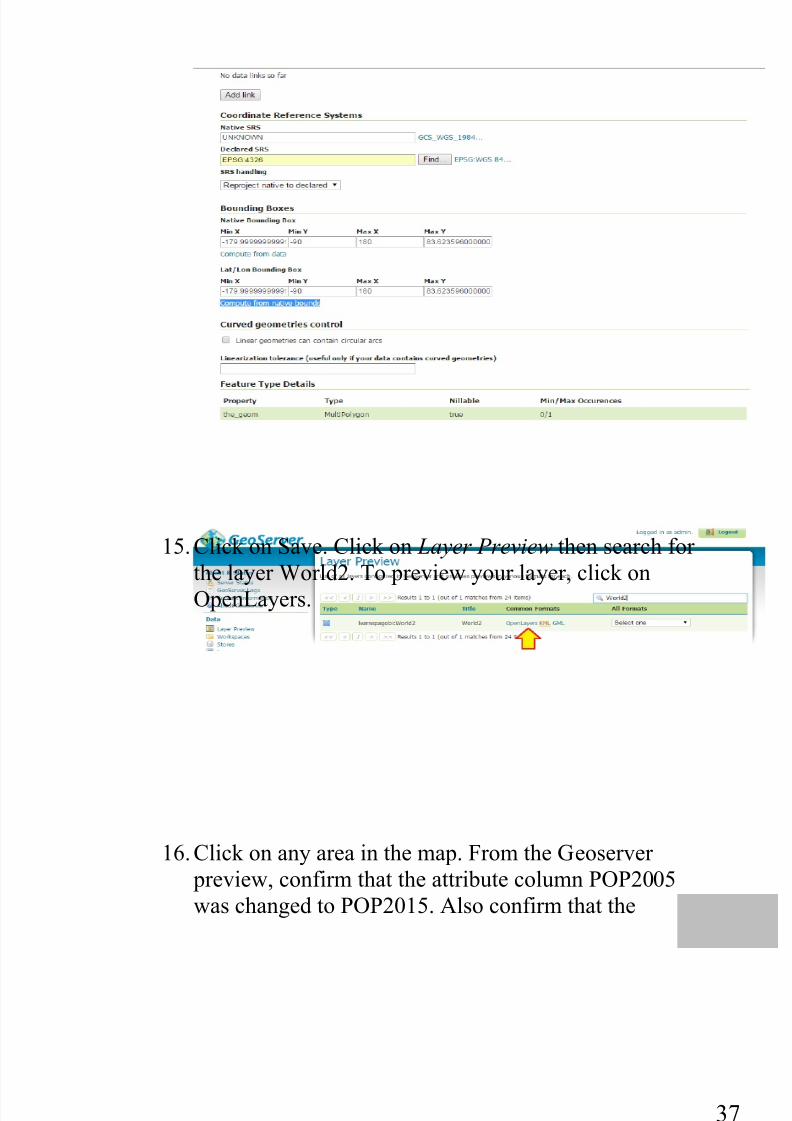
14. Under Declared SRS, enter EPSG:4326 and thenselect Reproject native to declared under SRS
handling. Next click on Compute from native bounds.
7/25/2019 SpaGoBI and MAPS
http://slidepdf.com/reader/full/spagobi-and-maps 43/75
37
15. Click on Save. Click on Layer Preview then search for
the layer World2. To preview your layer, click onOpenLayers.
16. Click on any area in the map. From the Geoserver
preview, confirm that the attribute column POP2005
was changed to POP2015. Also confirm that the
7/25/2019 SpaGoBI and MAPS
http://slidepdf.com/reader/full/spagobi-and-maps 44/75
For support and projects [email protected] WEB: www.learn-spagobi.com
8
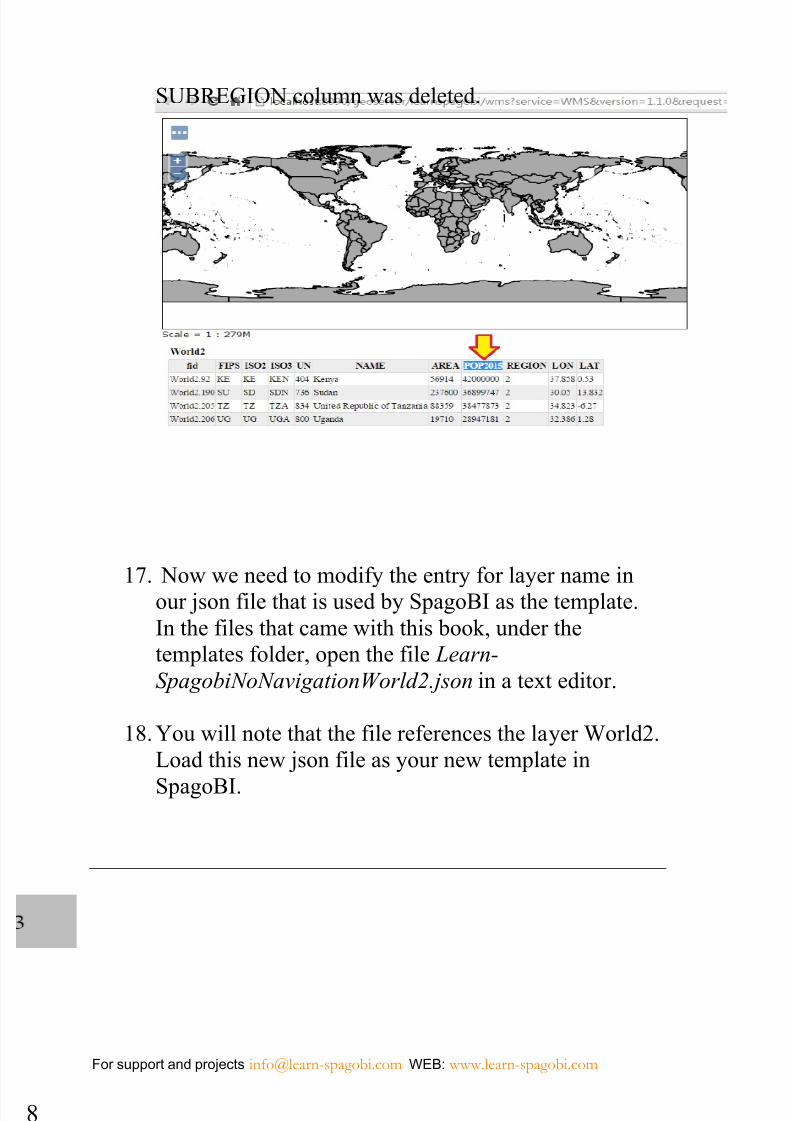
SUBREGION column was deleted.
17. Now we need to modify the entry for layer name inour json file that is used by SpagoBI as the template.
In the files that came with this book, under the
templates folder, open the file Learn-
SpagobiNoNavigationWorld2.json in a text editor.
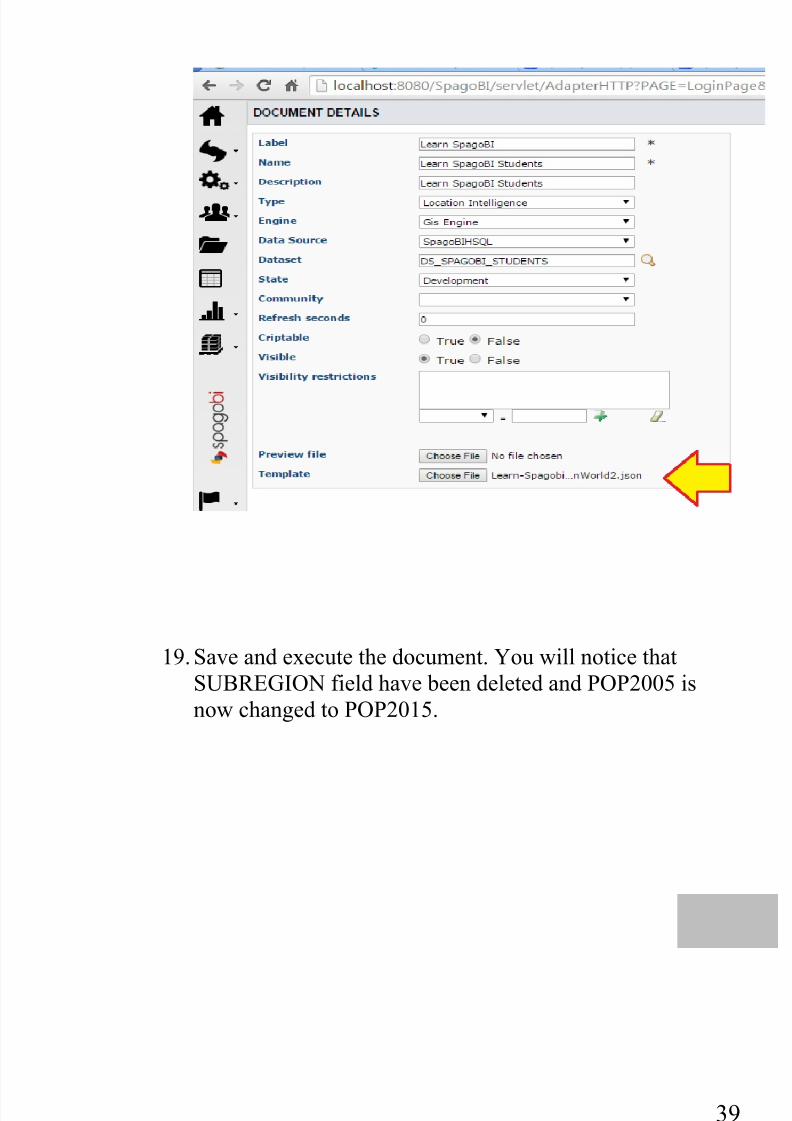
18. You will note that the file references the layer World2.
Load this new json file as your new template inSpagoBI.
7/25/2019 SpaGoBI and MAPS
http://slidepdf.com/reader/full/spagobi-and-maps 45/75
39
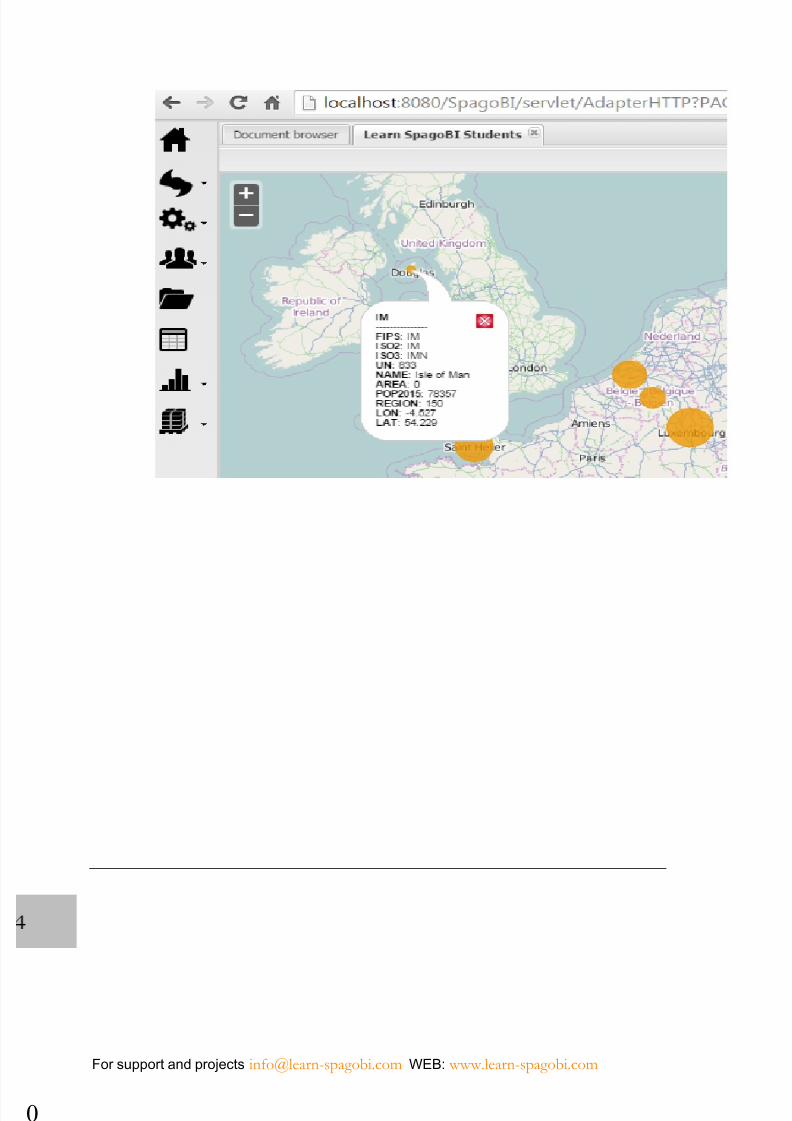
19. Save and execute the document. You will notice that
SUBREGION field have been deleted and POP2005 is
now changed to POP2015.
7/25/2019 SpaGoBI and MAPS
http://slidepdf.com/reader/full/spagobi-and-maps 46/75
For support and projects [email protected] WEB: www.learn-spagobi.com
0
7/25/2019 SpaGoBI and MAPS
http://slidepdf.com/reader/full/spagobi-and-maps 47/75
41
Template
We now have some understanding of how to use SpagoBI
with GIS but we have not yet discussed the template we used
for this exercise. We will do so in this chapter. Here is the
template we used in the previous chapters discussed line by
line. You can get the full file in the folder template in the CDthat came with this book. The file is called Learn-
SpagobiNoNavigationWorld2.json.
The first line is just an opening bracket for the json file. The
second line mapName: "Students", is the name of the map panel. You can give any string here. We have called ours
Students. Remember this is not a map that exists in SpagoBI,
it is just a name of a panel.
Line 3, analysisType: "choropleth", means the thematistion
method used. It can be:
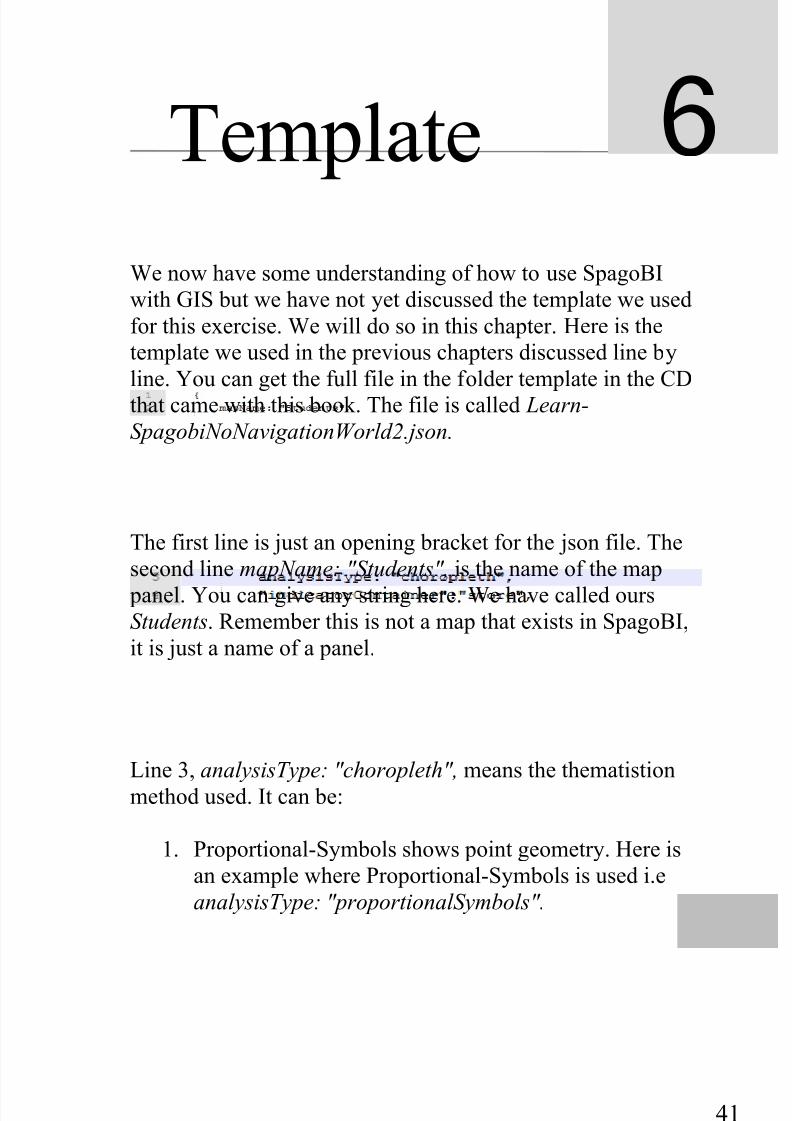
1. Proportional-Symbols shows point geometry. Here is
an example where Proportional-Symbols is used i.e
analysisType: "proportionalSymbols".
6
7/25/2019 SpaGoBI and MAPS
http://slidepdf.com/reader/full/spagobi-and-maps 48/75
For support and projects [email protected] WEB: www.learn-spagobi.com
2
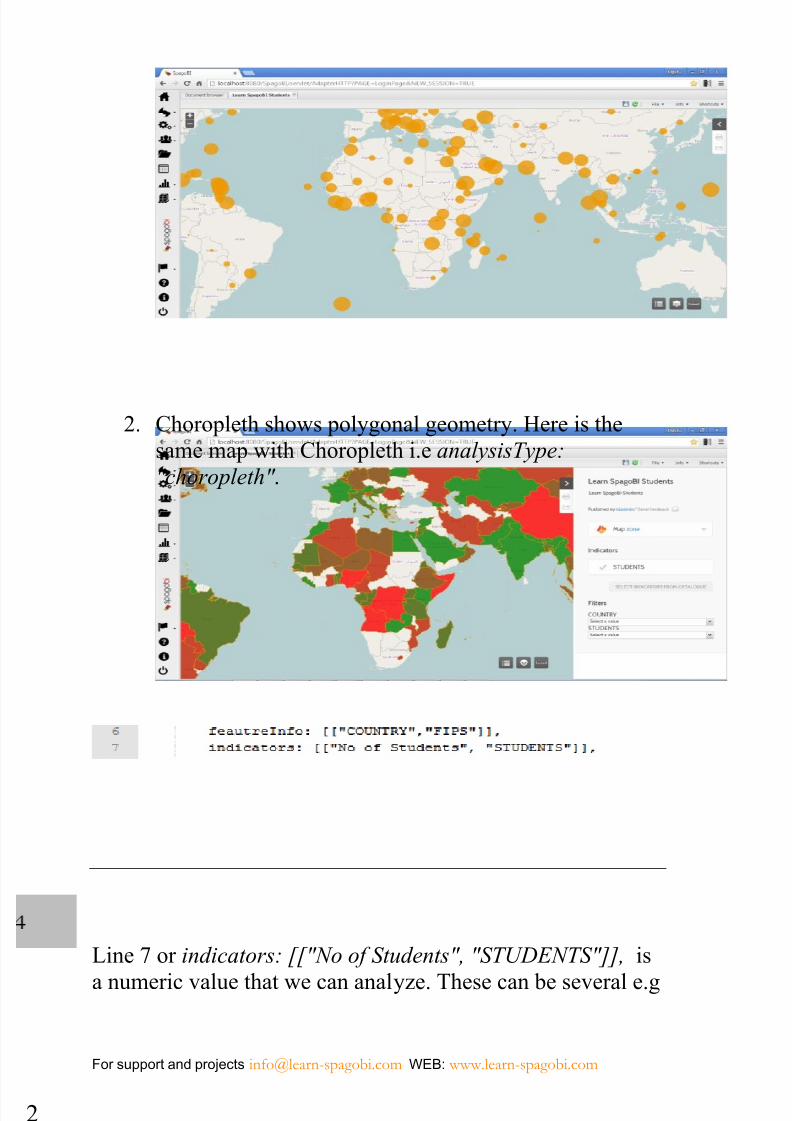
2. Choropleth shows polygonal geometry. Here is the
same map with Choropleth i.e analysisType:
"choropleth" .
Line 7 or indicators: [["No of Students", "STUDENTS"]], isa numeric value that we can analyze. These can be several e.g
7/25/2019 SpaGoBI and MAPS
http://slidepdf.com/reader/full/spagobi-and-maps 49/75
43
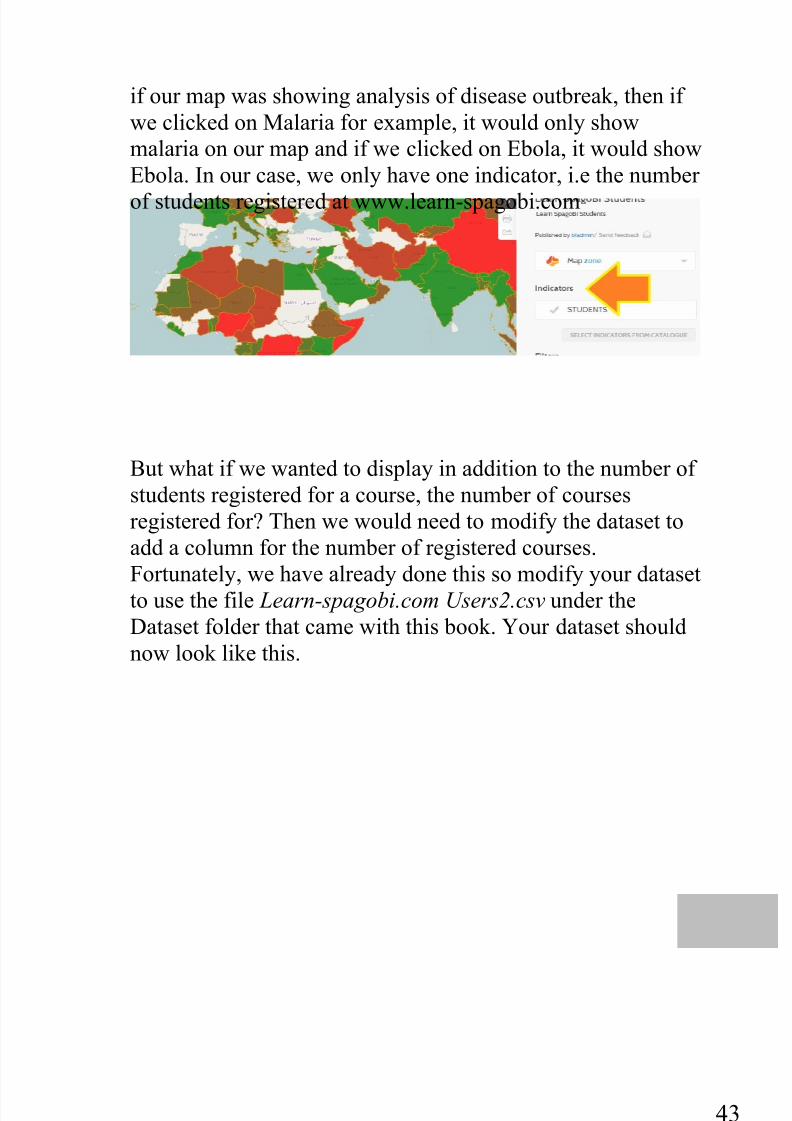
if our map was showing analysis of disease outbreak, then if
we clicked on Malaria for example, it would only show
malaria on our map and if we clicked on Ebola, it would show
Ebola. In our case, we only have one indicator, i.e the number
of students registered at www.learn-spagobi.com
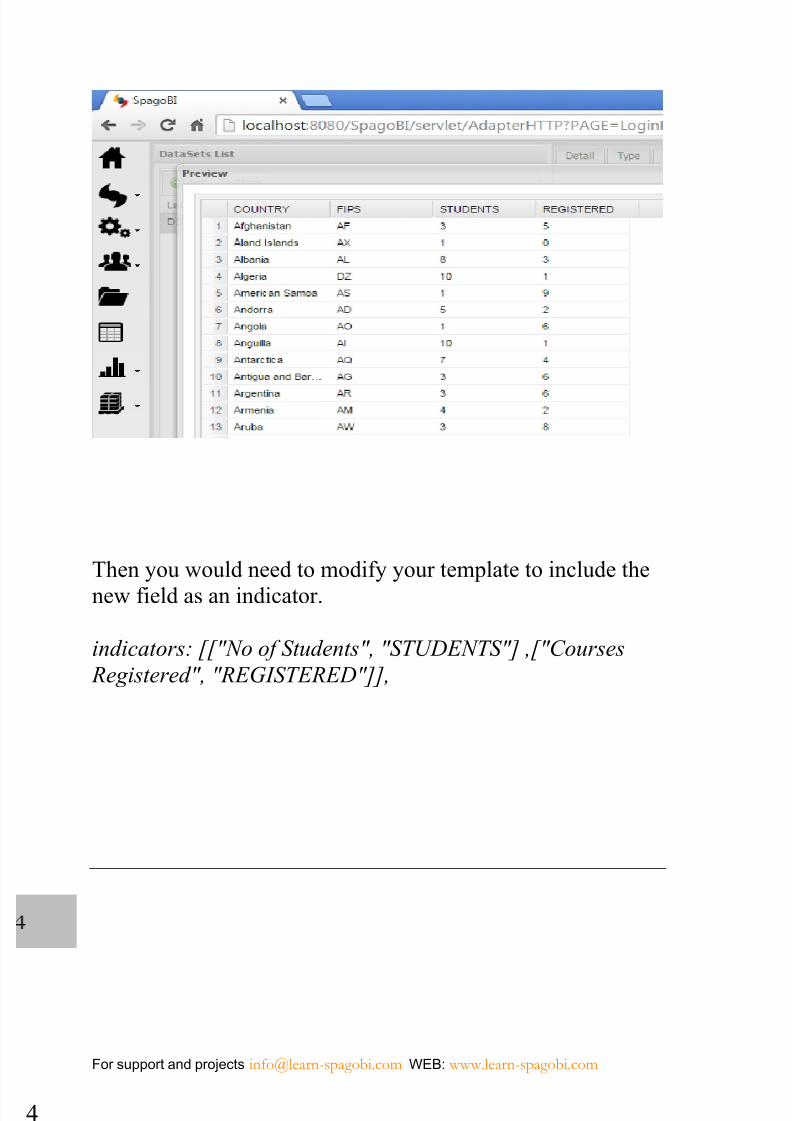
But what if we wanted to display in addition to the number of
students registered for a course, the number of courses
registered for? Then we would need to modify the dataset to
add a column for the number of registered courses.
Fortunately, we have already done this so modify your datasetto use the file Learn-spagobi.com Users2.csv under the
Dataset folder that came with this book. Your dataset should
now look like this.
7/25/2019 SpaGoBI and MAPS
http://slidepdf.com/reader/full/spagobi-and-maps 50/75
For support and projects [email protected] WEB: www.learn-spagobi.com
4
Then you would need to modify your template to include thenew field as an indicator.
indicators: [["No of Students", "STUDENTS"] ,["Courses
Registered", "REGISTERED"]],
7/25/2019 SpaGoBI and MAPS
http://slidepdf.com/reader/full/spagobi-and-maps 51/75
45
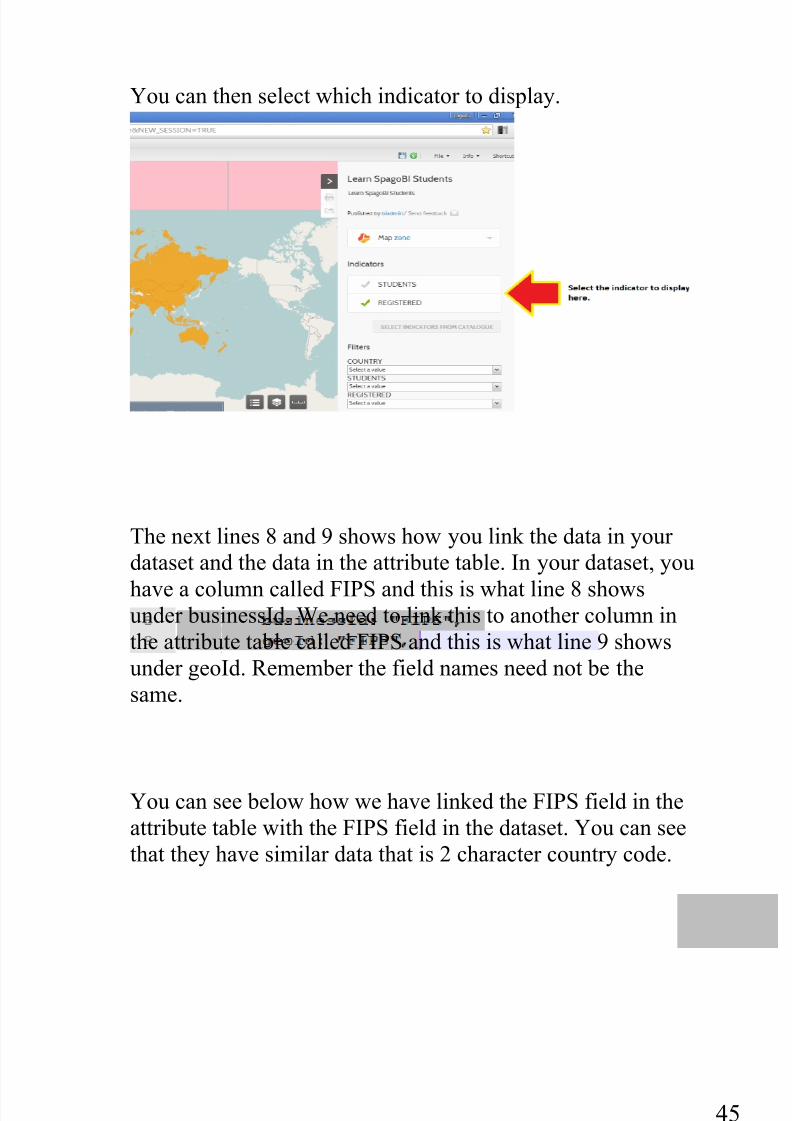
You can then select which indicator to display.
The next lines 8 and 9 shows how you link the data in your
dataset and the data in the attribute table. In your dataset, youhave a column called FIPS and this is what line 8 shows
under businessId. We need to link this to another column in
the attribute table called FIPS and this is what line 9 shows
under geoId. Remember the field names need not be the
same.
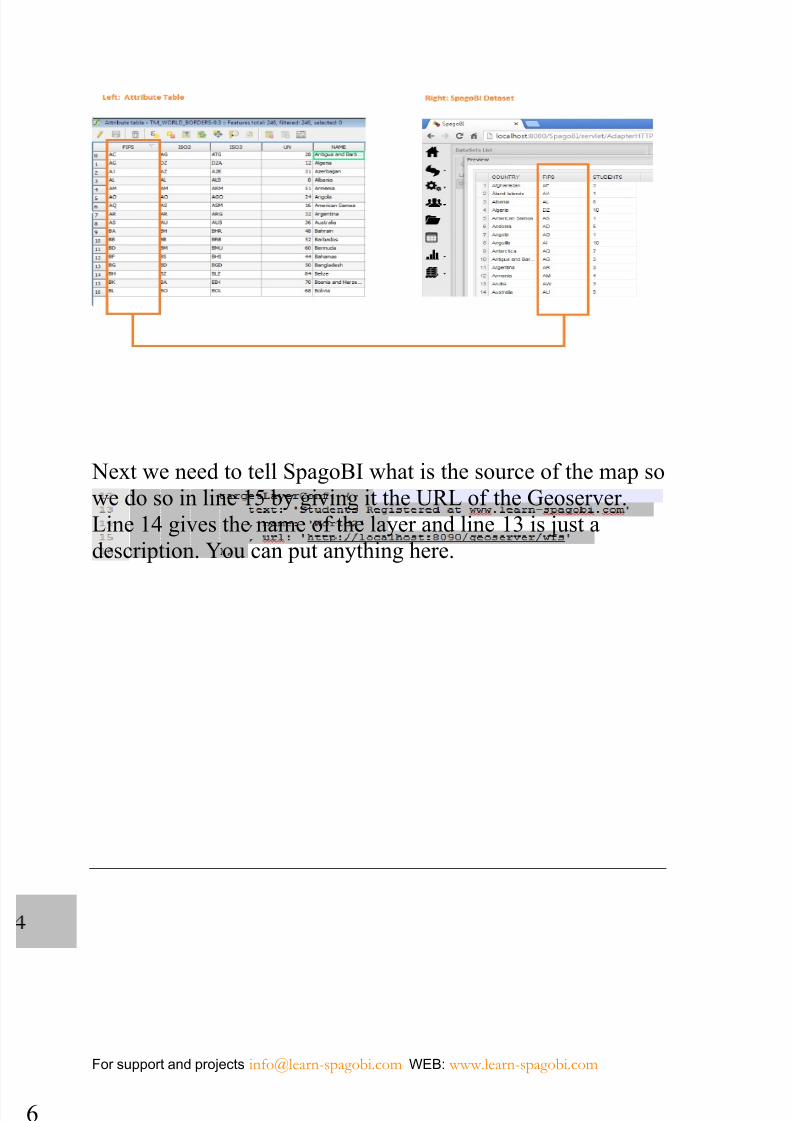
You can see below how we have linked the FIPS field in the
attribute table with the FIPS field in the dataset. You can see
that they have similar data that is 2 character country code.
7/25/2019 SpaGoBI and MAPS
http://slidepdf.com/reader/full/spagobi-and-maps 52/75
For support and projects [email protected] WEB: www.learn-spagobi.com
6
Next we need to tell SpagoBI what is the source of the map so
we do so in line 15 by giving it the URL of the Geoserver.
Line 14 gives the name of the layer and line 13 is just a
description. You can put anything here.
7/25/2019 SpaGoBI and MAPS
http://slidepdf.com/reader/full/spagobi-and-maps 53/75
47
Cross Navigation A boat capsizes when it is just about to reach the shore. – A Luo proverb.
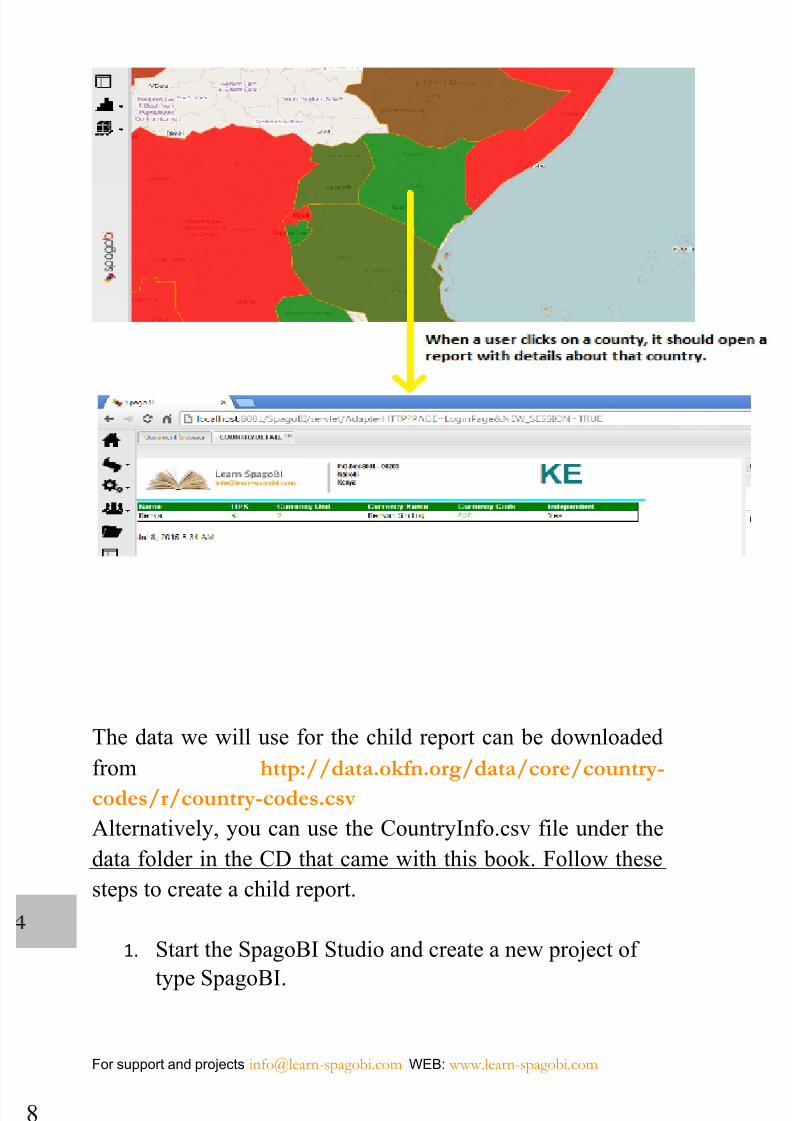
n this chapter, we will see how to navigate from our
map document to a child document such that when a
user clicks on any area of the map, it will open a
detailed document with more information about the
selected area. This can be used, for example, to display sales
reports for various regions in details. It can also be used to
provide more information than can be provided in an attribute
table. Here is an image that explains what we want to achieve.
I
7
7/25/2019 SpaGoBI and MAPS
http://slidepdf.com/reader/full/spagobi-and-maps 54/75
For support and projects [email protected] WEB: www.learn-spagobi.com
8
The data we will use for the child report can be downloaded
from http://data.okfn.org/data/core/country-
codes/r/country-codes.csv
Alternatively, you can use the CountryInfo.csv file under the
data folder in the CD that came with this book. Follow these
steps to create a child report.
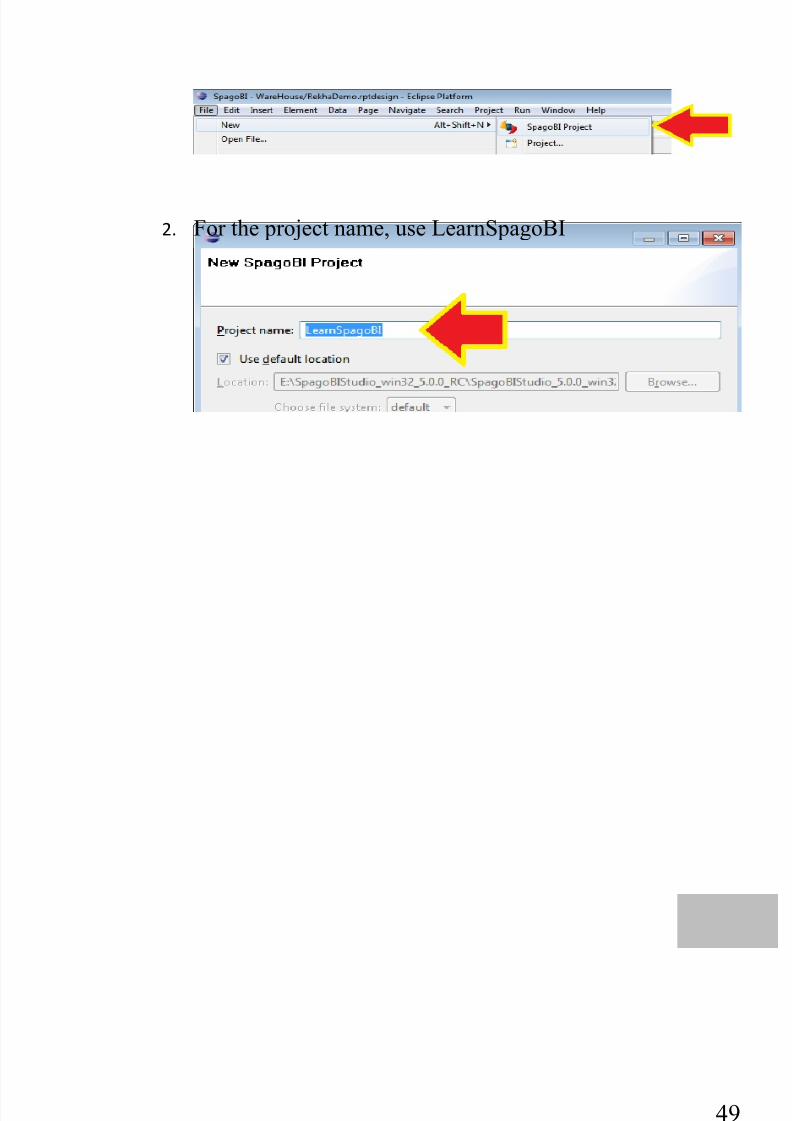
1. Start the SpagoBI Studio and create a new project oftype SpagoBI.
7/25/2019 SpaGoBI and MAPS
http://slidepdf.com/reader/full/spagobi-and-maps 55/75
49
2. For the project name, use LearnSpagoBI
7/25/2019 SpaGoBI and MAPS
http://slidepdf.com/reader/full/spagobi-and-maps 56/75
For support and projects [email protected] WEB: www.learn-spagobi.com
0
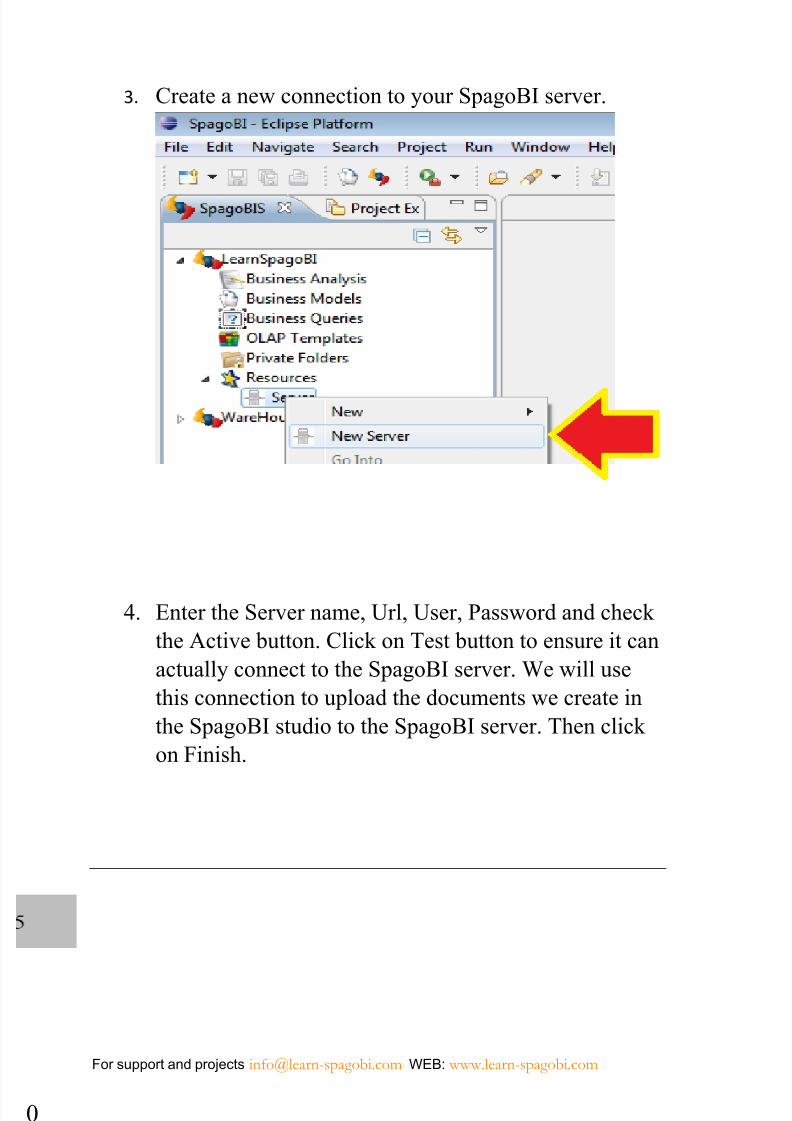
3. Create a new connection to your SpagoBI server.
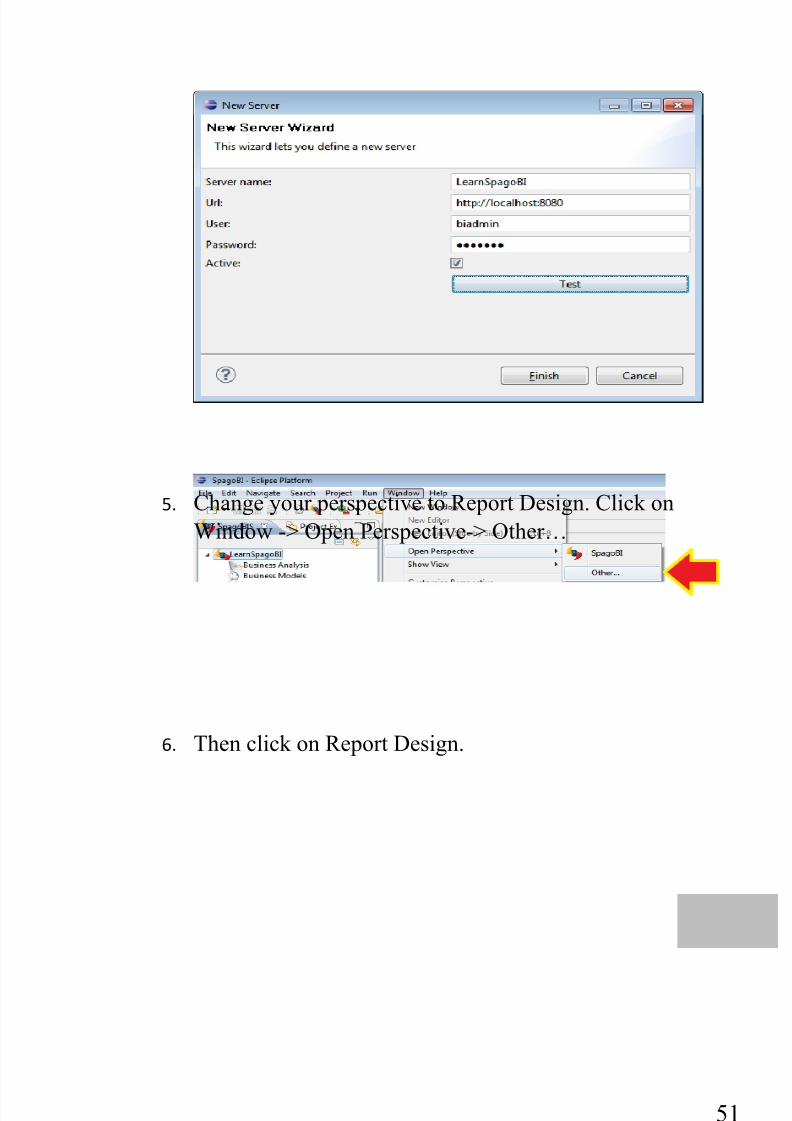
4. Enter the Server name, Url, User, Password and check
the Active button. Click on Test button to ensure it can
actually connect to the SpagoBI server. We will use
this connection to upload the documents we create in
the SpagoBI studio to the SpagoBI server. Then click
on Finish.
7/25/2019 SpaGoBI and MAPS
http://slidepdf.com/reader/full/spagobi-and-maps 57/75
51
5. Change your perspective to Report Design. Click on
Window -> Open Perspective-> Other…
6. Then click on Report Design.
7/25/2019 SpaGoBI and MAPS
http://slidepdf.com/reader/full/spagobi-and-maps 58/75
For support and projects [email protected] WEB: www.learn-spagobi.com
2
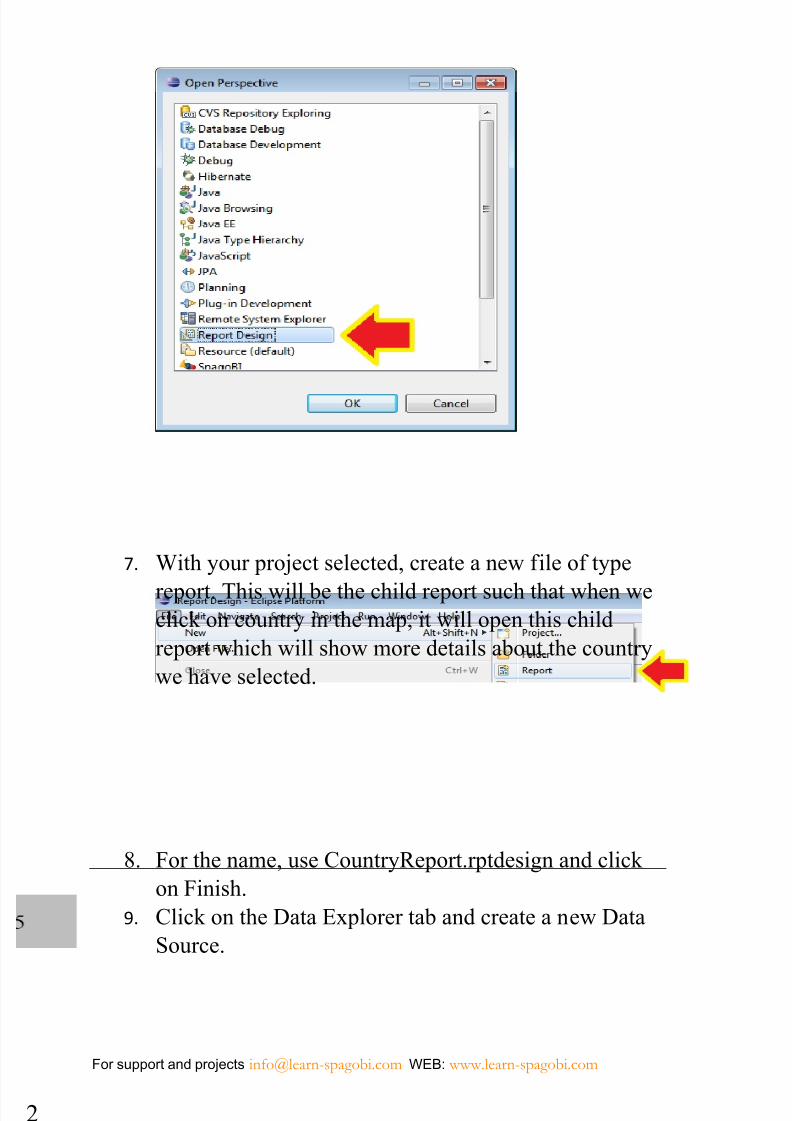
7. With your project selected, create a new file of typereport. This will be the child report such that when we
click on country in the map, it will open this child
report which will show more details about the country
we have selected.
8. For the name, use CountryReport.rptdesign and click
on Finish.
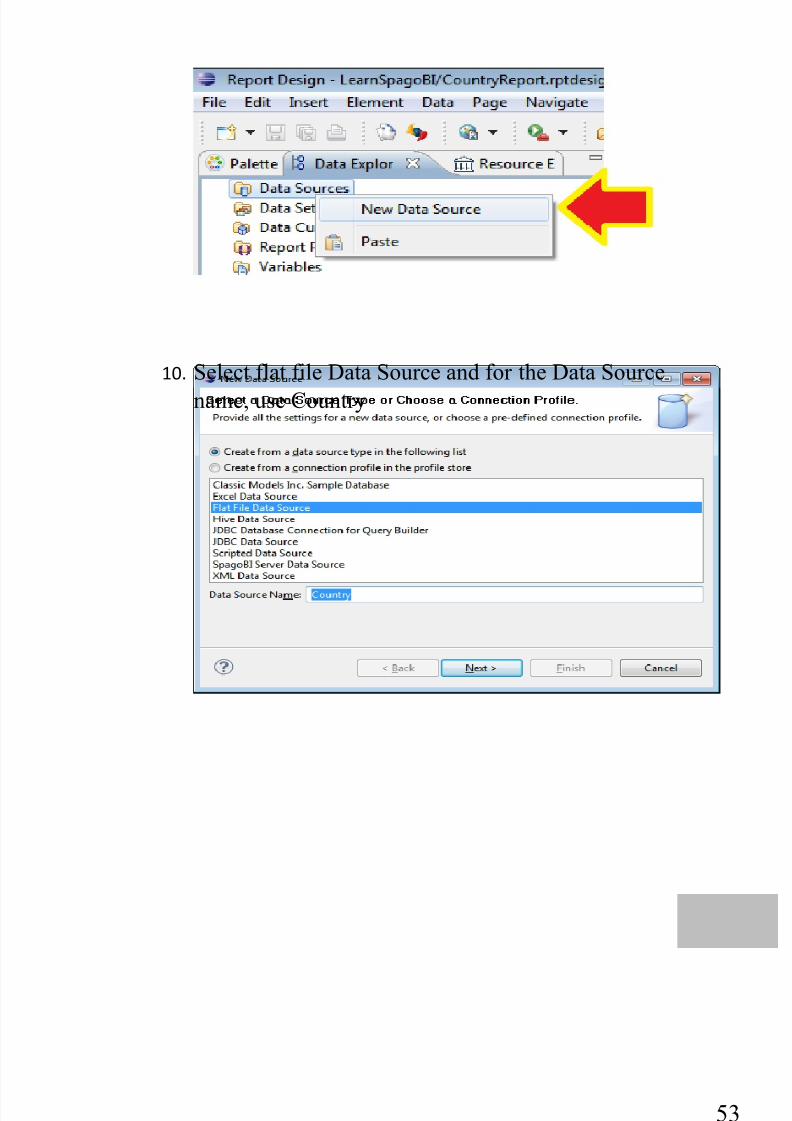
9. Click on the Data Explorer tab and create a new Data
Source.
7/25/2019 SpaGoBI and MAPS
http://slidepdf.com/reader/full/spagobi-and-maps 59/75
53
10. Select flat file Data Source and for the Data Sourcename, use Country
7/25/2019 SpaGoBI and MAPS
http://slidepdf.com/reader/full/spagobi-and-maps 60/75
For support and projects [email protected] WEB: www.learn-spagobi.com
4
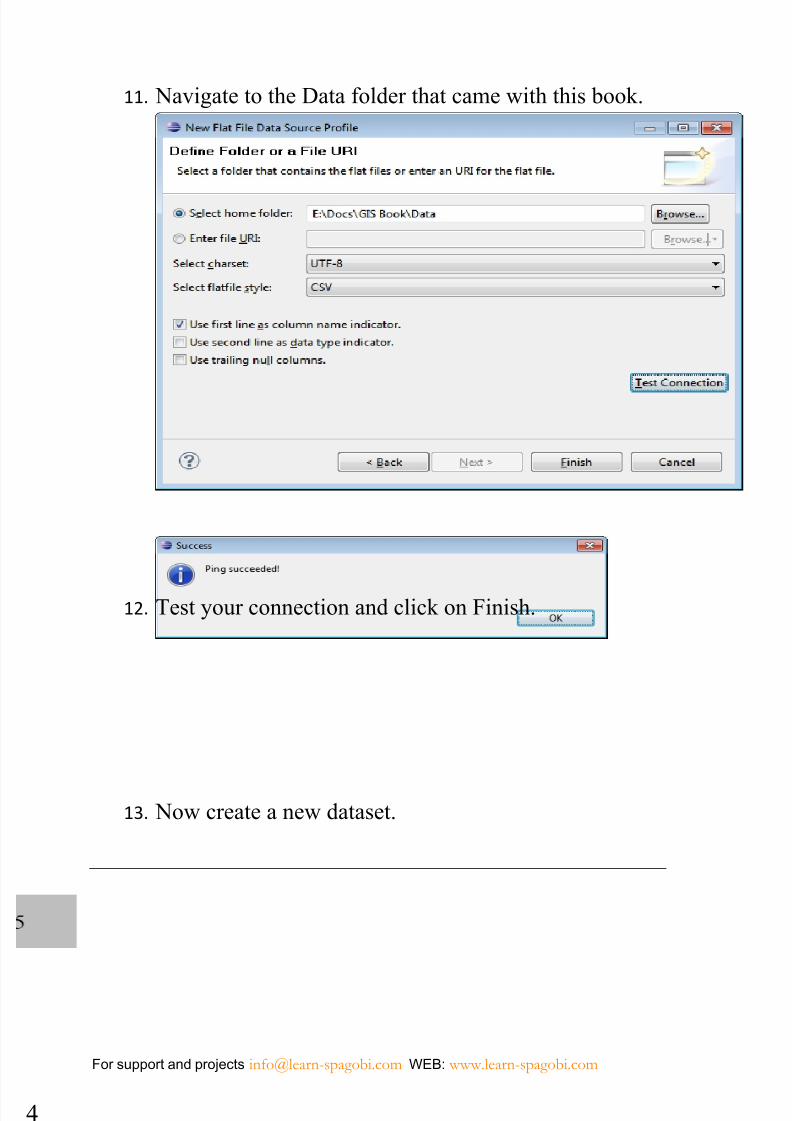
11. Navigate to the Data folder that came with this book.
12. Test your connection and click on Finish.
13. Now create a new dataset.
7/25/2019 SpaGoBI and MAPS
http://slidepdf.com/reader/full/spagobi-and-maps 61/75
55
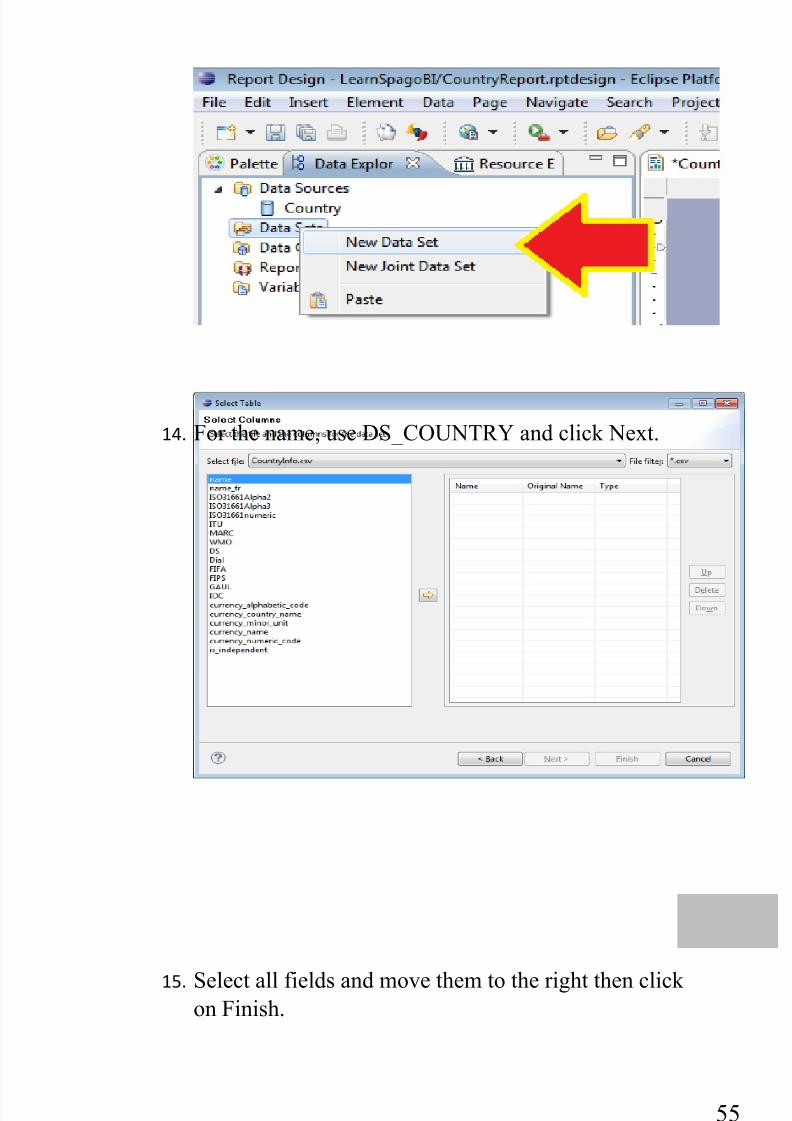
14. For the name, use DS_COUNTRY and click Next.
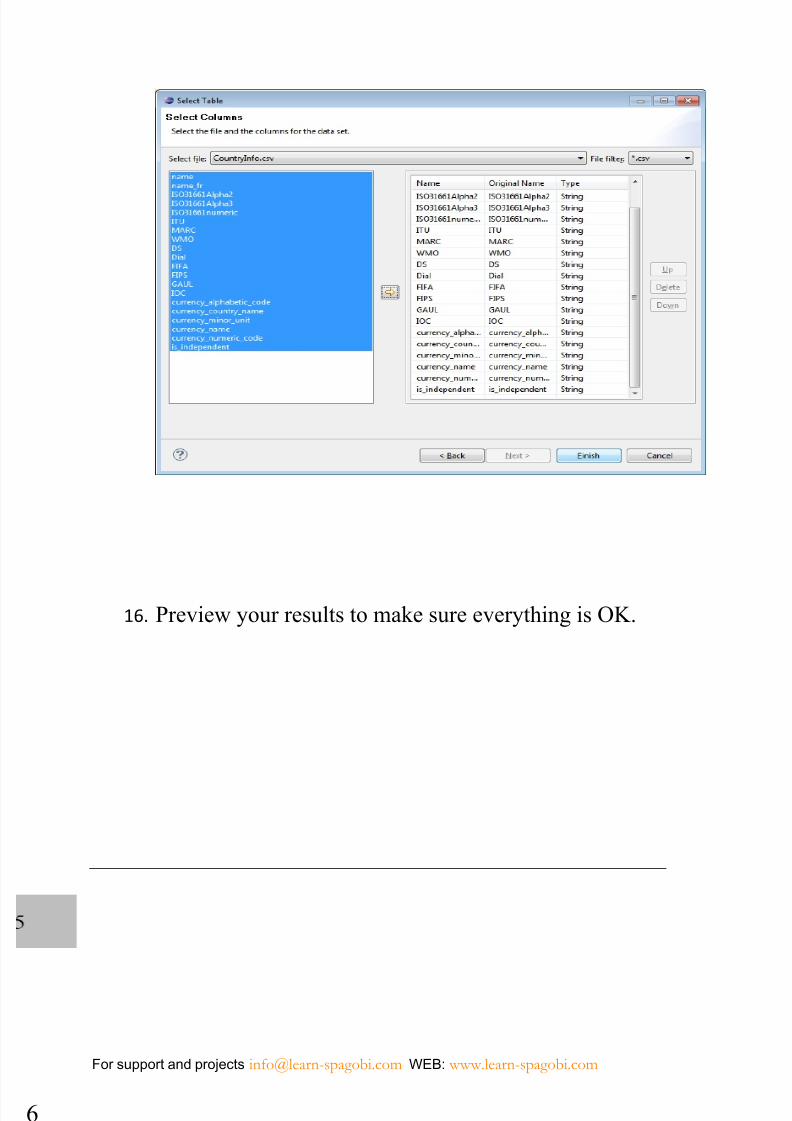
15. Select all fields and move them to the right then click
on Finish.
7/25/2019 SpaGoBI and MAPS
http://slidepdf.com/reader/full/spagobi-and-maps 62/75
For support and projects [email protected] WEB: www.learn-spagobi.com
6
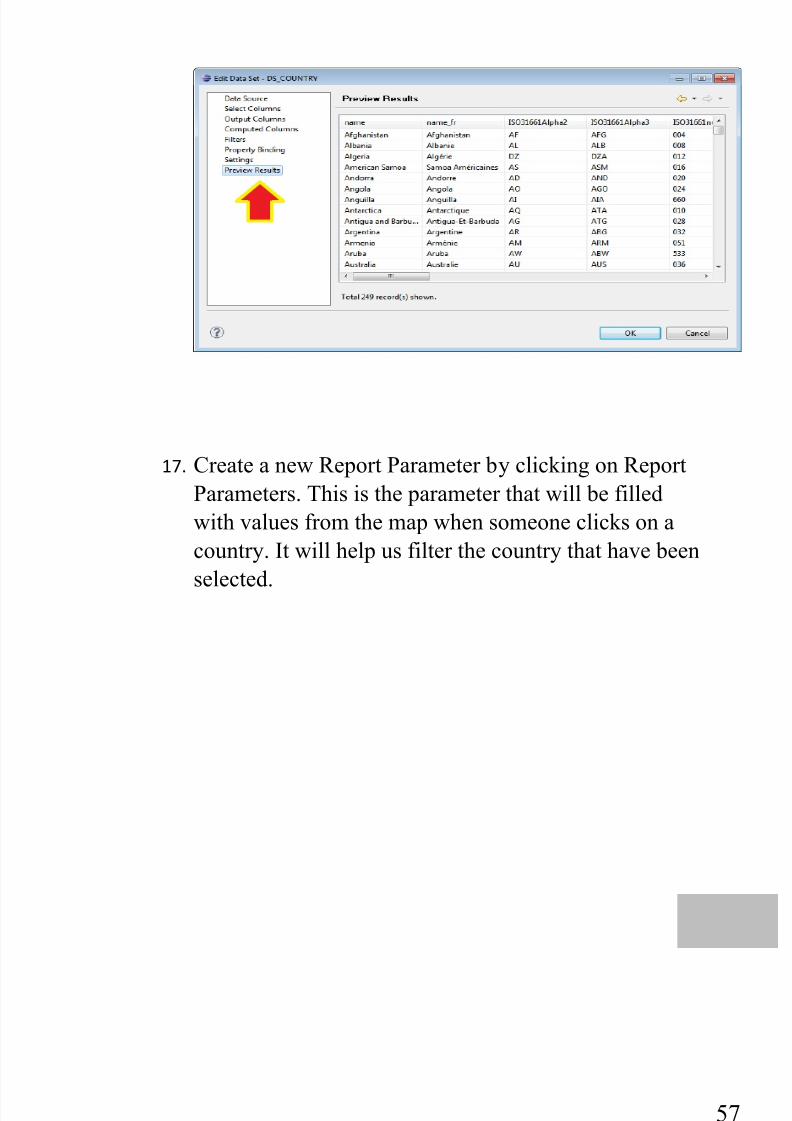
16. Preview your results to make sure everything is OK.
7/25/2019 SpaGoBI and MAPS
http://slidepdf.com/reader/full/spagobi-and-maps 63/75
57
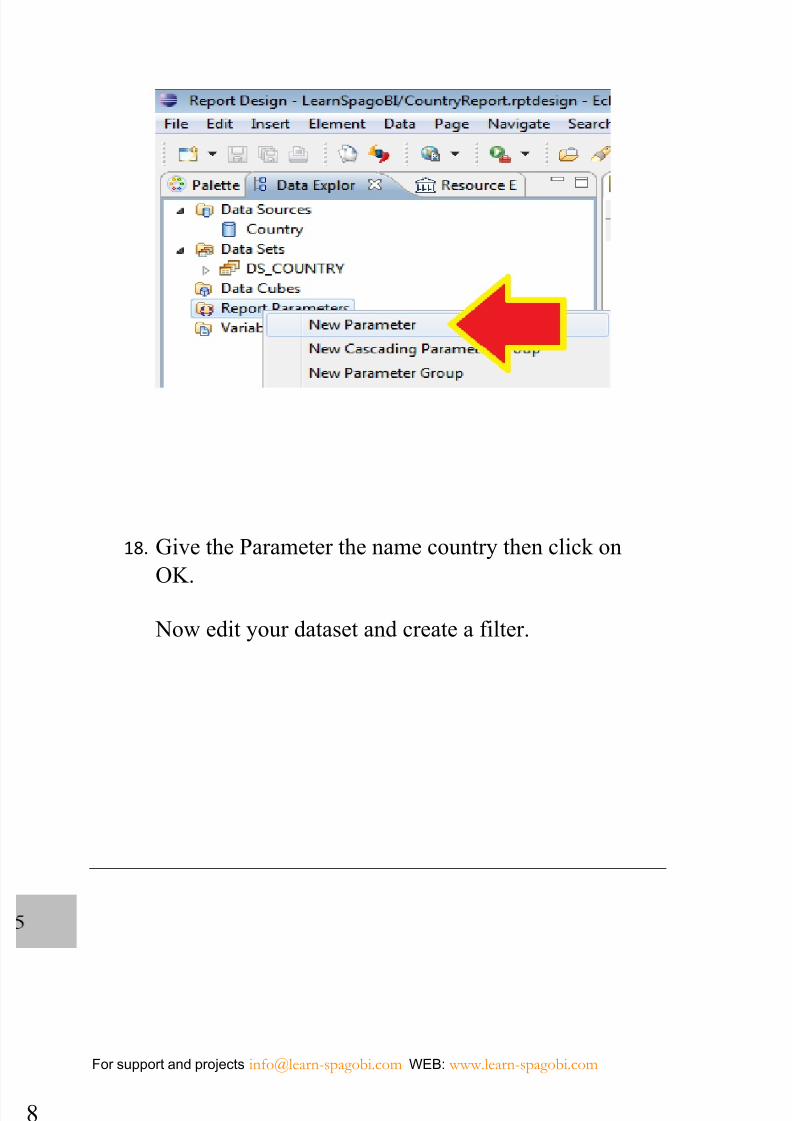
17. Create a new Report Parameter by clicking on Report
Parameters. This is the parameter that will be filled
with values from the map when someone clicks on a
country. It will help us filter the country that have been
selected.
7/25/2019 SpaGoBI and MAPS
http://slidepdf.com/reader/full/spagobi-and-maps 64/75
For support and projects [email protected] WEB: www.learn-spagobi.com
8
18. Give the Parameter the name country then click on
OK.
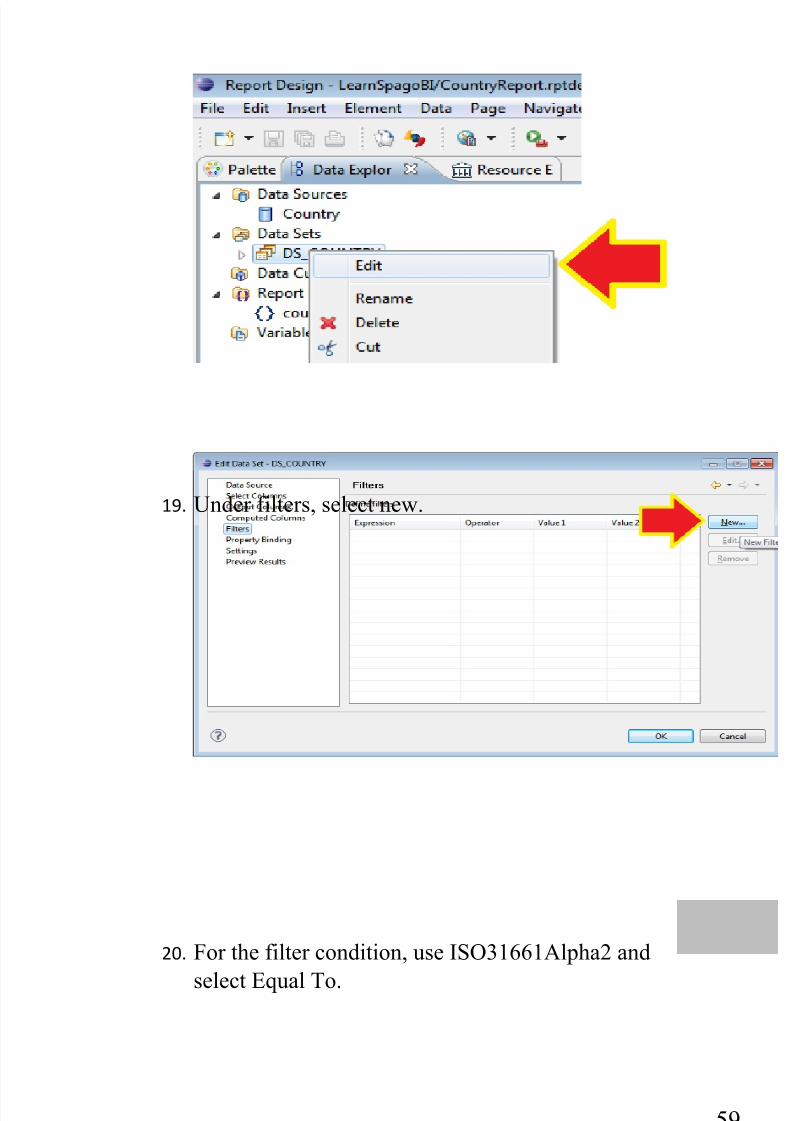
Now edit your dataset and create a filter.
7/25/2019 SpaGoBI and MAPS
http://slidepdf.com/reader/full/spagobi-and-maps 65/75
59
19. Under filters, select new.
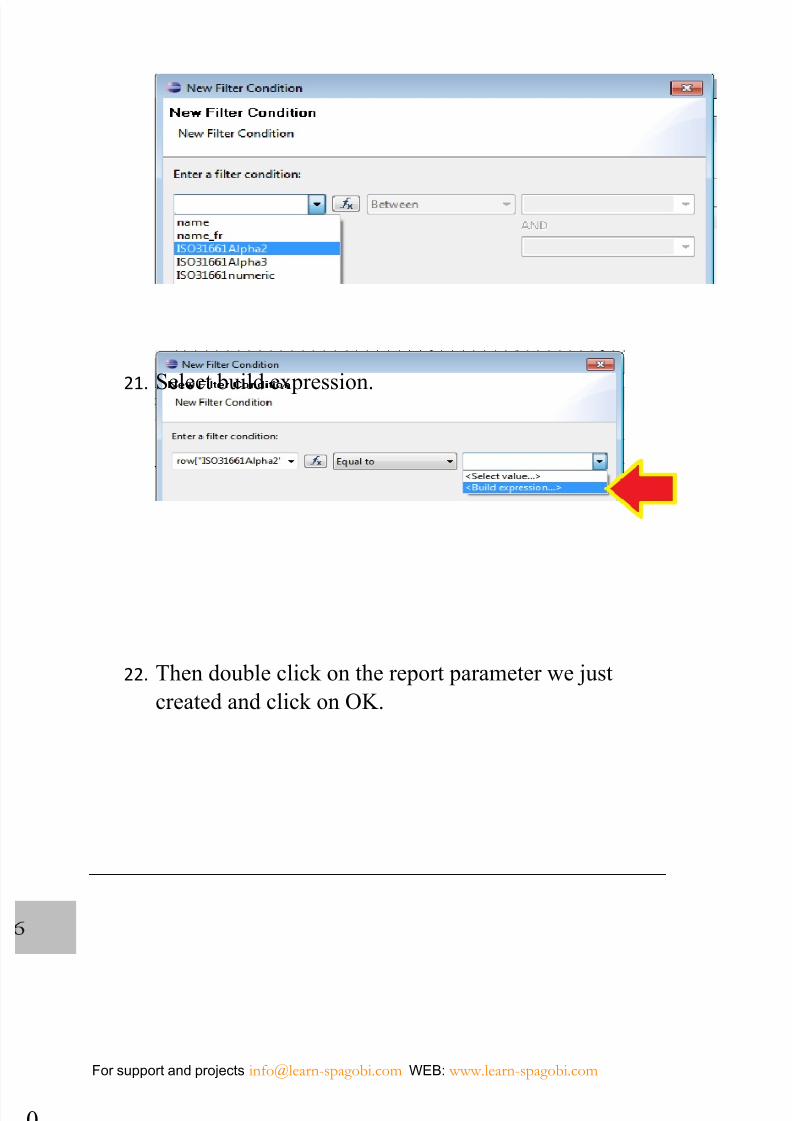
20. For the filter condition, use ISO31661Alpha2 andselect Equal To.
7/25/2019 SpaGoBI and MAPS
http://slidepdf.com/reader/full/spagobi-and-maps 66/75
For support and projects [email protected] WEB: www.learn-spagobi.com
0
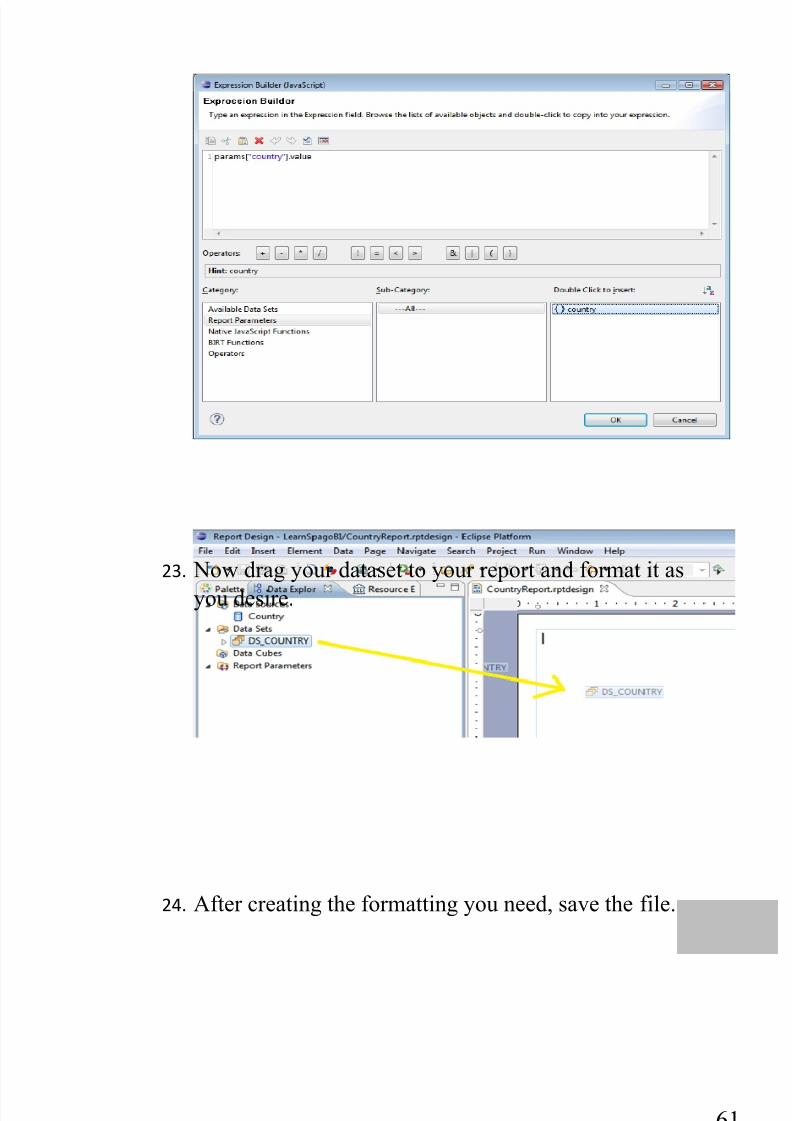
21. Select build expression.
22. Then double click on the report parameter we just
created and click on OK.
7/25/2019 SpaGoBI and MAPS
http://slidepdf.com/reader/full/spagobi-and-maps 67/75
61
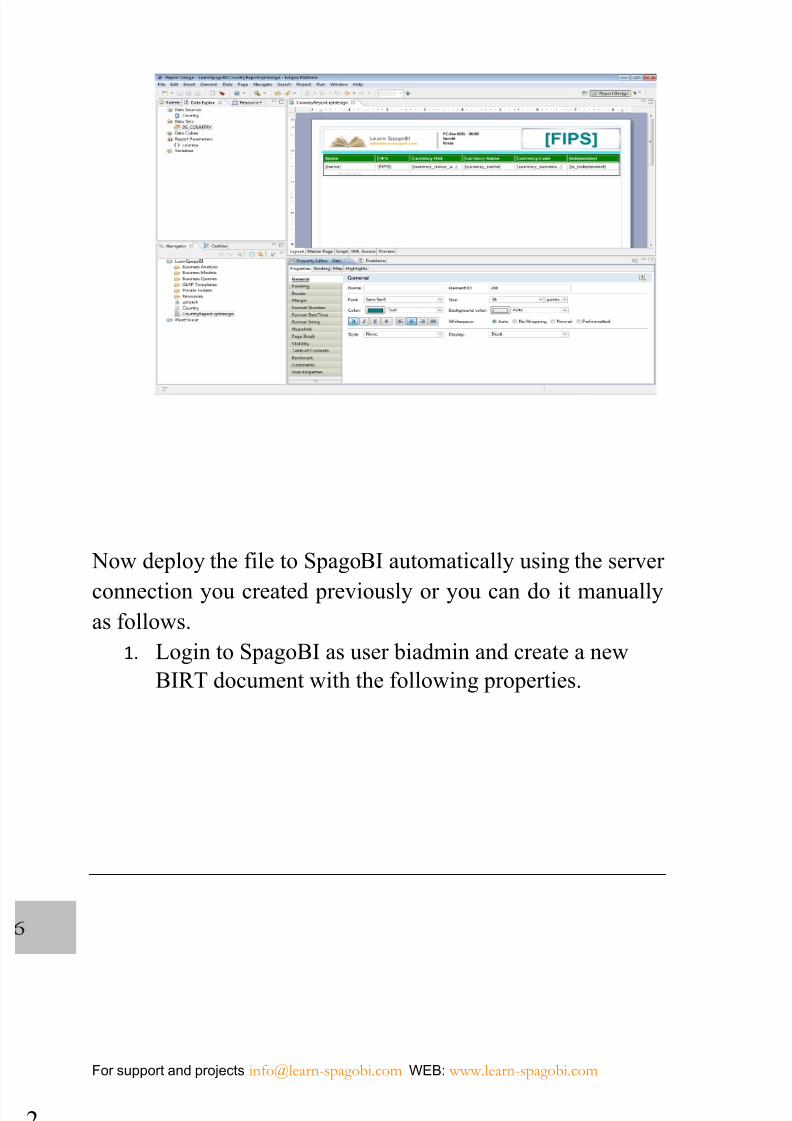
23. Now drag your dataset to your report and format it asyou desire.
24. After creating the formatting you need, save the file.
7/25/2019 SpaGoBI and MAPS
http://slidepdf.com/reader/full/spagobi-and-maps 68/75
For support and projects [email protected] WEB: www.learn-spagobi.com
2
Now deploy the file to SpagoBI automatically using the server
connection you created previously or you can do it manually
as follows.
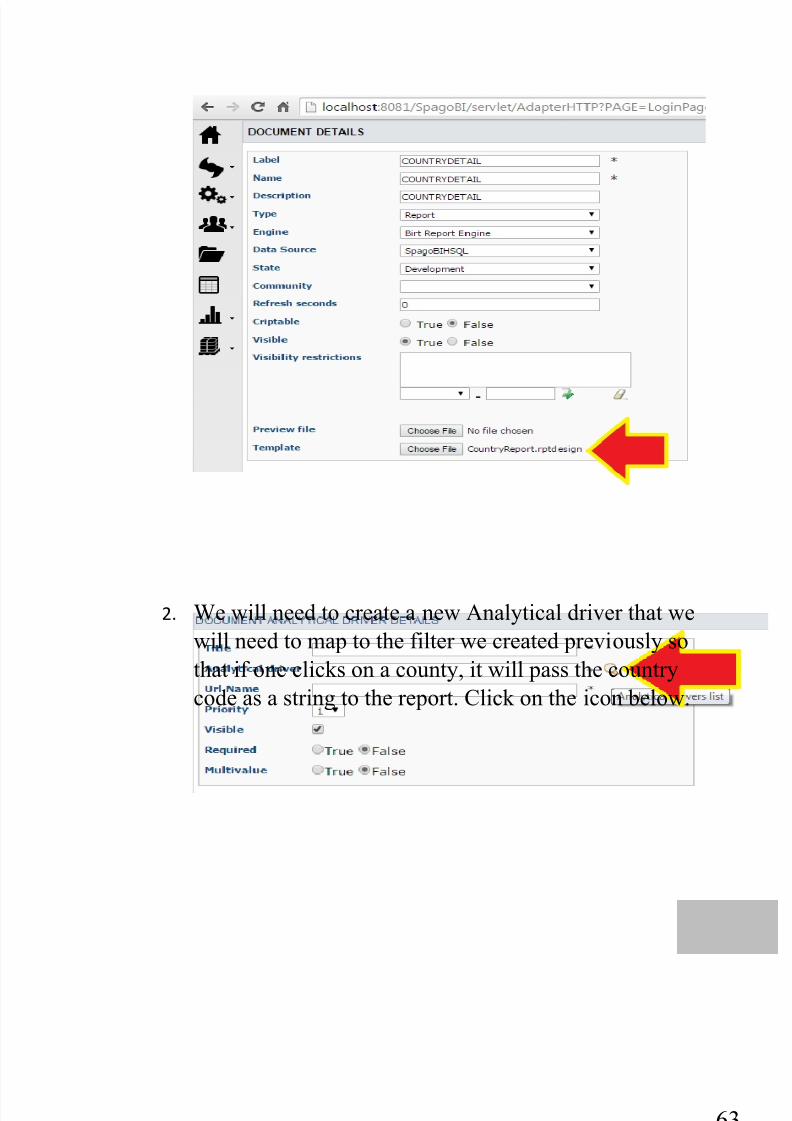
1. Login to SpagoBI as user biadmin and create a new
BIRT document with the following properties.
7/25/2019 SpaGoBI and MAPS
http://slidepdf.com/reader/full/spagobi-and-maps 69/75
63
2. We will need to create a new Analytical driver that we
will need to map to the filter we created previously so
that if one clicks on a county, it will pass the country
code as a string to the report. Click on the icon below.
7/25/2019 SpaGoBI and MAPS
http://slidepdf.com/reader/full/spagobi-and-maps 70/75
For support and projects [email protected] WEB: www.learn-spagobi.com
4
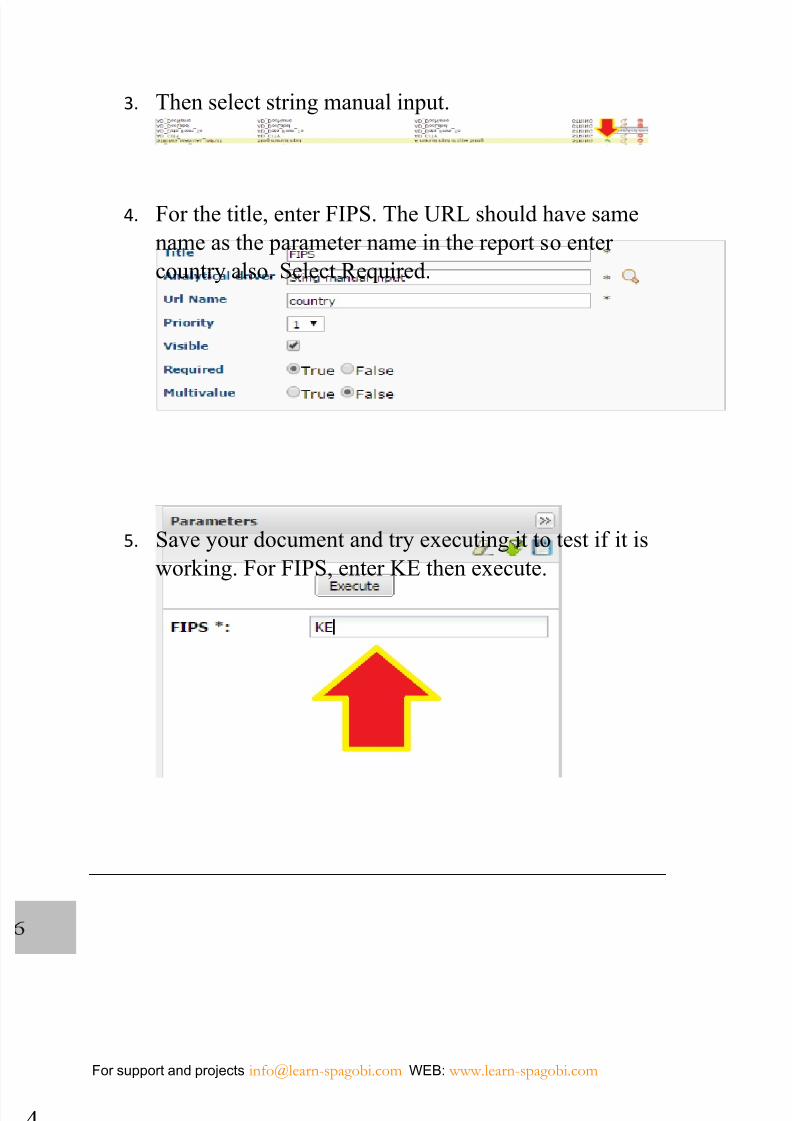
3. Then select string manual input.
4. For the title, enter FIPS. The URL should have same
name as the parameter name in the report so enter
country also. Select Required.
5. Save your document and try executing it to test if it is
working. For FIPS, enter KE then execute.
7/25/2019 SpaGoBI and MAPS
http://slidepdf.com/reader/full/spagobi-and-maps 71/75
65
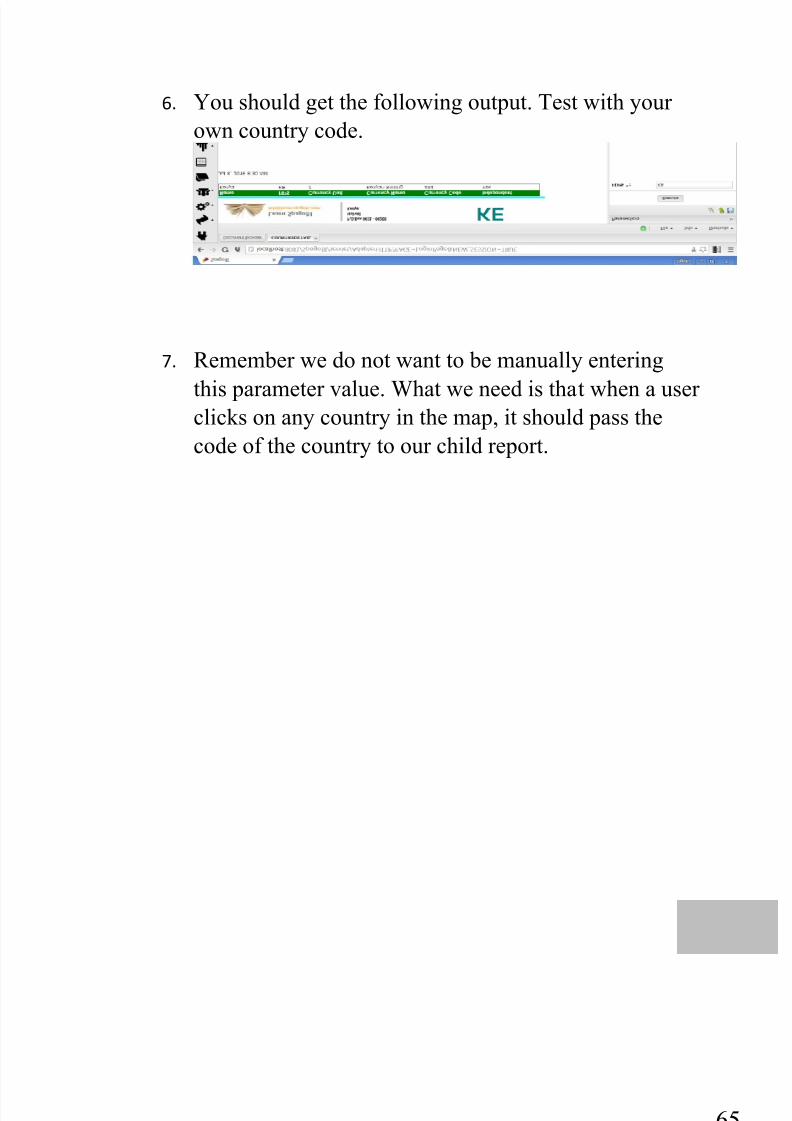
6. You should get the following output. Test with your
own country code.
7. Remember we do not want to be manually entering
this parameter value. What we need is that when a userclicks on any country in the map, it should pass the
code of the country to our child report.
7/25/2019 SpaGoBI and MAPS
http://slidepdf.com/reader/full/spagobi-and-maps 72/75
For support and projects [email protected] WEB: www.learn-spagobi.com
6
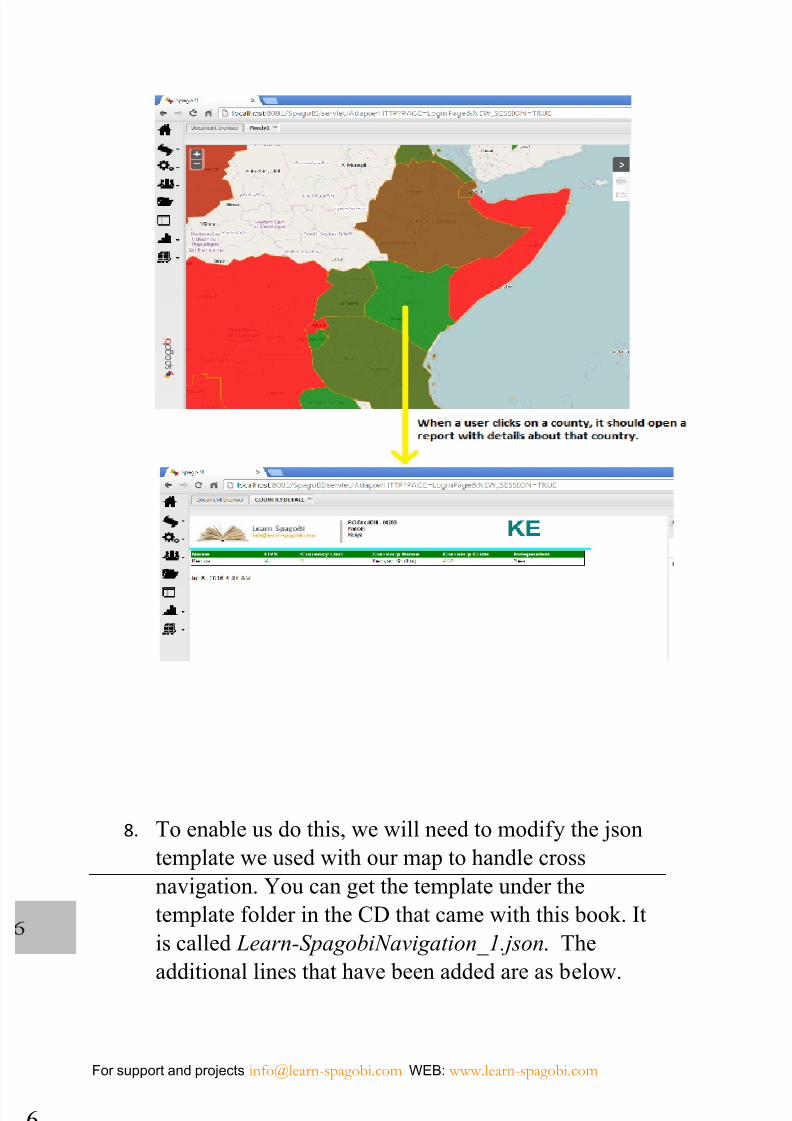
8. To enable us do this, we will need to modify the json
template we used with our map to handle cross
navigation. You can get the template under the
template folder in the CD that came with this book. It
is called Learn-SpagobiNavigation_1.json. The
additional lines that have been added are as below.
7/25/2019 SpaGoBI and MAPS
http://slidepdf.com/reader/full/spagobi-and-maps 73/75
67
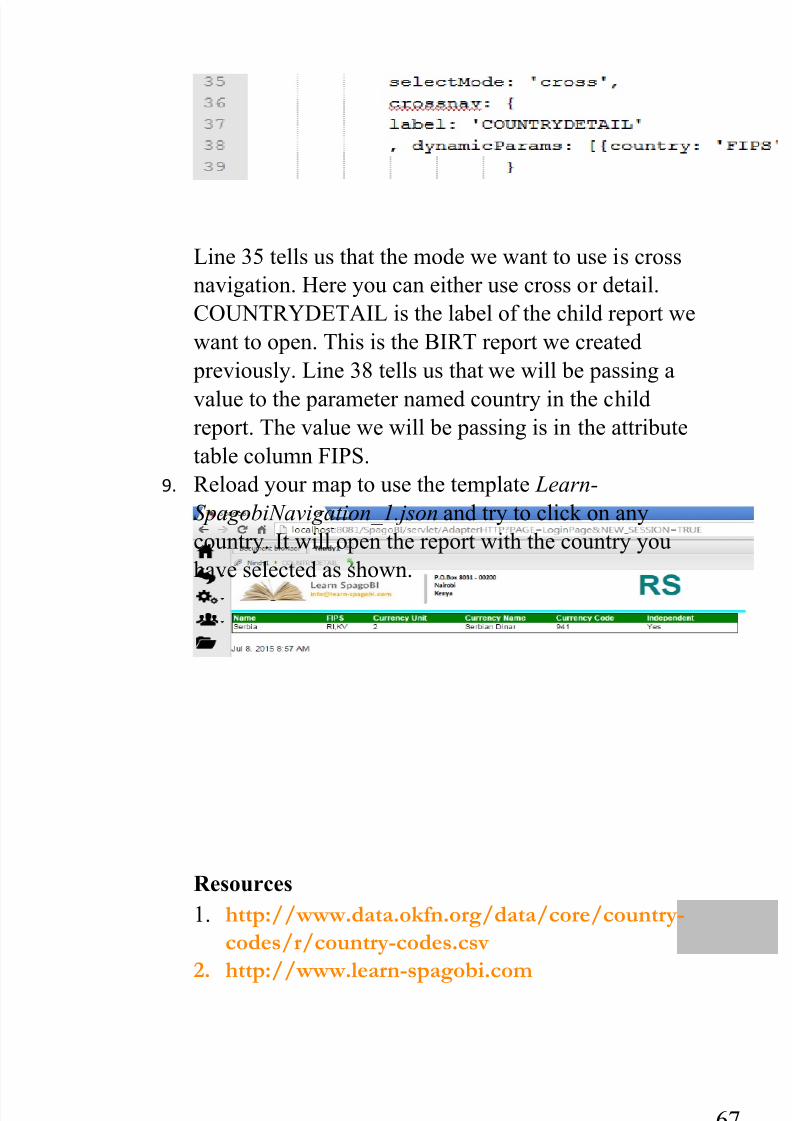
Line 35 tells us that the mode we want to use is cross
navigation. Here you can either use cross or detail.
COUNTRYDETAIL is the label of the child report we
want to open. This is the BIRT report we created
previously. Line 38 tells us that we will be passing a
value to the parameter named country in the child
report. The value we will be passing is in the attribute
table column FIPS.
9. Reload your map to use the template Learn-
SpagobiNavigation_1.json and try to click on any
country. It will open the report with the country you
have selected as shown.
Resources
1. http://www.data.okfn.org/data/core/country-
codes/r/country-codes.csv
2. http:// www.learn-spagobi.com
7/25/2019 SpaGoBI and MAPS
http://slidepdf.com/reader/full/spagobi-and-maps 74/75
For support and projects [email protected] WEB: www.learn-spagobi.com
8
INDEX
Arcmap , 2
ArcServer , 2
Attribute data , 2
Bing Maps , 1
CountryInfo.csv , 48
EPSG:4326 , 15
Geoserver , 12
GIS , 1
Google Earth , 2
http://localhost:8090/geoserver ,
29
Kenya , 28
Layer , 37
Learn-spagobi.com Users.csv ,
18
Learn-
SpagobiNavigation_1.json , 69
Learn-
SpagobiNoNavigationWorld2.js
on , 38
Plugins , 31
QGIS , 2
shapefiles , 14
So what is QGIS? , 5
SpagoBI , 17
Spatial data , 2
store , 14Table Manager , 32
TM_WORLD_BORDERS-
0.3.shp , 26

7/25/2019 SpaGoBI and MAPS
http://slidepdf.com/reader/full/spagobi-and-maps 75/75