Embed Size (px)
Citation preview
University of New MexicoUNM Digital Repository
Native Health Database Full Text Health Sciences Center Archives and SpecialCollections
1995
Span of Control and IHS Staffing PatternsInformation & Management Technologies, Inc.
Follow this and additional works at: https://digitalrepository.unm.edu/nhd
This Article is brought to you for free and open access by the Health Sciences Center Archives and Special Collections at UNM Digital Repository. Ithas been accepted for inclusion in Native Health Database Full Text by an authorized administrator of UNM Digital Repository. For more information,please contact [email protected].
Recommended CitationSpan of control and IHS staffing patterns - final report. Indian Health Service, Staff Office of Planning, Evaluation and Research,Rockville, MD 20857 (SSI-02). 1995
,/ ,/
FINALREPQRT '(
\, , :
( ,
,
f: 1-\
I
'/ <
/ ---- ,,- " \
-,..
.DEPARTMENT OF HEALTH AND HUMAN SERVICES ~..~. Public Health Service-- Indian Health Service ~
SPAN OF CONTROL AND IHS STAFFING PATTERNS
FINAL REPORT
SUBMITTED BY:
Infonnation & Management Technologies, Inc. Suite 750, 3 Bethesda Metro Center
Bethesda, Maryland 20814 (30 I) 961-1912
Purchase Order Number 941F356366 February 1995
DEPARTMENT OF HEALTH AND HUMAN SERVICES PUBLIC HEALTH SERVICE INDIAN HEALTH SERVICE
OFFICE OF PLANNING, EVALUATION, AND LEGISLATION Acting Associate Director: Ed Simenneyer
Division of Program Evaluation and Policy Analysis Director: Leo J. Nolan
OFFICE OF ADMINISTRATION AND MANAGEMENT Acting Deputy Associate Director: Jack Markowitz

•
THIS PAGE LEFT INTENTIONALL Y BLANK

ANALYSIS
SPAN OF CONTROL &
IRS STAFFING PATTERNS
Prepared for
Indian Health Service Rockville, Maryland
Prepared by:
Information & Management Technologies, Inc Suite 750, 3 Bethesda Metro Center
Bethesda, Maryland 20814 (301)-961-1912
January, 1995

•
THIS PAGE LEFT INTENTIONALLY BLANK
Page
§ 1.0 Scope of Work and Methodology . . . I
§ 2.0 Supervisory Span of Control , .. ... 3
§ 3.0 Regulatory Requirements Affecting Span of Control . 9
§ 4.0 Analysis ofHealth Industry Staffing Patterns 17
§ 5.0 Analysis of Indian Health Service Staffing Patterns .. 19
§ 6.0 Findings and Recommendations 31
APPENDIX A. Analysis Data Tables . . A-I
APPENDIX B. IHS Hospital Staff Profiles B-1
APPENDIX C. IHS Health Center Staff Profiles C-l

o
THIS PAGE LEFT INTENTION ALL Y BLANK
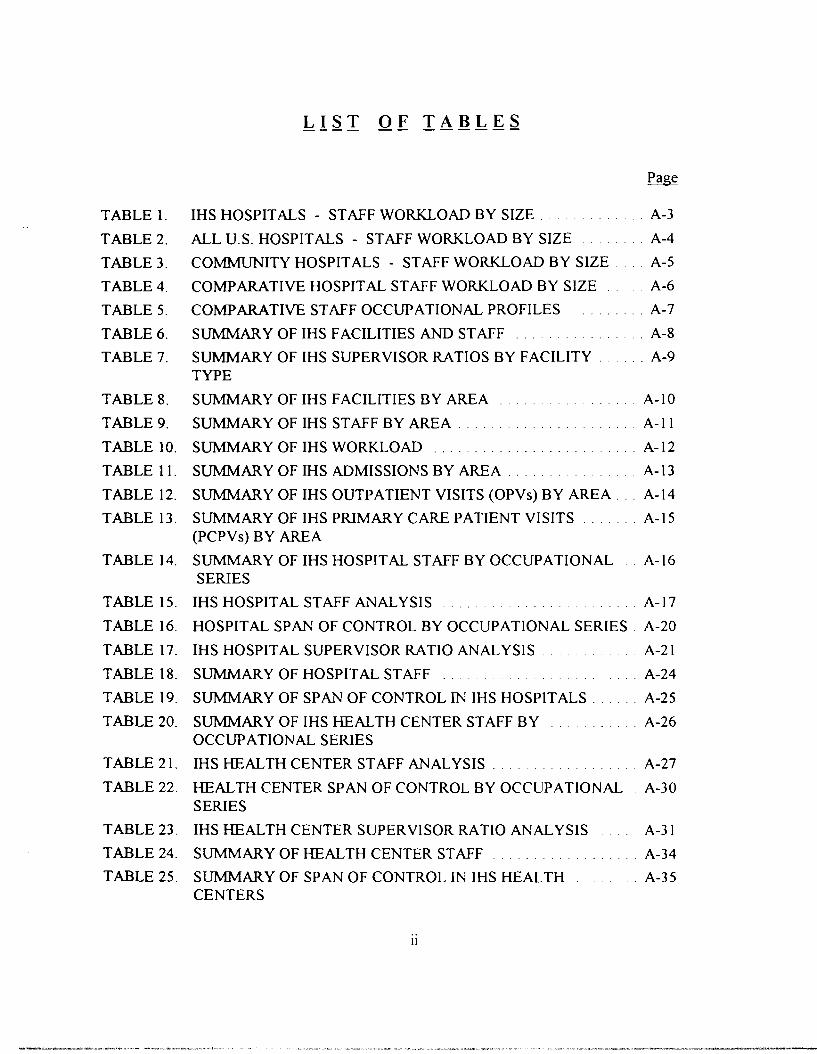
TABLE I.
TABLE 2.
TABLE 3.
TABLE 4.
TABLE 5.
TABLE 6.
TABLE 7.
TABLE 8.
TABLE 9.
TABLE 10.
TABLE II.
TABLE 12.
TABLE 13.
TABLE 14.
TABLE 15.
TABLE 16.
TABLE 17.
TABLE 18.
TABLE 19.
TABLE 20.
TABLE 21.
TABLE 22.
TABLE 23.
TABLE 24.
TABLE 25.
IHS HOSPITALS - STAFF WORKLOAD BY SIZE. . . . . . . . .. . A-3
ALL U.S. HOSPITALS - STAFF WORKLOAD BY SIZE ..... A-4
COMMUNITY HOSPITALS - STAFF WORKLOAD BY SIZE. . A-5
COMPARATIVE HOSPITAL STAFF WORKLOAD BY SIZE A-6
COMPARATIVE STAFF OCCUPATIONAL PROFILES A-7
SUMMARY OF IHS FACILITIES AND STAFF . A-8
SUMMARY OF IHS SUPERVISOR RATIOS BY FACILITY A-9 TYPE
SUMMARY OF IHS FACILITIES BY AREA .. A-IO
SUMMARY OF IHS STAFF BY AREA . . . . . . ..... A-II
SUMMARY OF IHS WORKLOAD . A-12
SUMMARY OF IHS ADMISSIONS BY AREA. . . . A-13
SUMMARY OF IHS OUTPATIENT VISITS (OPVs) BY AREA ... A-14
SUMMARY OF IHS PRIMARY CARE PATIENT VISITS. . . A-IS (PCPVs) BY AREA
SUMMARY OF IHS HOSPITAL STAFF BY OCCUPATIONAL .. A-\6 SERIES
IHS HOSPITAL STAFF ANALYSIS . . . . . . . . . . . .... A-17
HOSPITAL SPAN OF CONTROL BY OCCUPATIONAL SERIES. A-20
IHS HOSPITAL SUPERVISOR RATIO ANALYSIS.. .. A-2\
SUMMARY OF HOSPITAL STAFF ... . A-24
SUMMARY OF SPAN OF CONTROL IN IHS HOSPITALS. . A-25
SUMMARY OF IHS HEALTH CENTER STAFF BY . A-26 OCCUPATIONAL SERIES
IHS HEALTH CENTER STAFF ANALYSIS. . .. A-27
HEALTH CENTER SPAN OF CONTROL BY OCCUPATIONAL . A-30 SERIES
IHS HEALTH CENTER SUPERVISOR RATIO ANALYSIS A-31
SUMMARY OF HEALTH CENTER STAFF . . . . .. . A-34
SUMMARY OF SPAN OF CONTROL IN IHS HEALTH A-35 CENTERS
II

THIS PAGE LEFT INTENTIONALLY BLANK
1.0 Scope of Work and Methodology
The objective of this study was to research the subject of "span of control" as it applies to the management of work, to assess factors impacting on supervisory ratios, to assess Indian Health Service (IHS) staffing data to determine supervisory ratios, to identify relevant industry span of control supervisory ratios, and to make findings and recommendations. The purpose for the study was to assess whether or not the IHS' s span of control is consistent with industry standards.
The analysis required research on managerial span of control standards and ratios from a variety of sources, including health care organization literature, Office of Personnel Management (OPM) documentary material, Joint Commission on Accreditation of Healthcare Organizations (JCARO) standards and manuals, and health care industry staffing data. The analysis also involved obtaining, processing, tabulating, and summarizing IHS agency-wide staffing data by occupational series, location, and function to determine span of control supervisory ratios; and similar data from the American Hospital Association (AHA) on staffing patterns.
Several hundred MEDLARS citations to health studies were researched on the subjects of "span of control", "supervision", "staffing", "organization" and "personnel" in order to identify literature on the subject of supervisory ratios. Relevant literature was obtained and reviewed. Some LEXIS research was performed to identify recent legal changes in supervisory requirements for health industry personnel. Information on job analysis, position classification, and supervisory criteria were obtained from the OPM. JCAHO manuals and standards were also reviewed to identify accreditation requirements that might impact on supervisory span ofcontrol. Data were obtained from the AHA and subjected to a number of analyses in order to create a comparative basis for assessing industry supervisory ratios. IHS staffing data were collected from the Public Health Service (PHS) Work Force On-Line Data System; the [HS Ambulatory Patient Care Computer Data system; and from other IHS Offices and sources.
The principle source of IHS staffing data was the IHS Workforce Database, extracted from the PHS Work Force On-Line Data System. I This system includes data records for all IHS employees. The data fields in each record contain all payroll elements, including:
o Organization o Position Title o Occupational Series o Functional Classification Code o Supervisory Category o Type of Service (Paid or non-paid; full-time or part-time)
Interpretation of the coding for each record was based on descriptions of data fields contained in the PHS Work Force On-Line Data System Glossary, dated February 23, 1987; the PHS Standard Administrative Code System Hierarchical Sequence Listing, dated August 9, 1993; and the OPM
I IHS Office ofAdministration and Management. Data Run ofAugust 20, /99./.
Handbook of Occupational Groups and Series, dated 1990. This data was summed by various categories and cross-cuts using dBASE IV and tabulated and charted using Excel 5.0 commercial PC software.
The data summaries obtained by processing the IHS Workforce Database were supplemented and validated using other IHS materials; including, Hospital Data Summaries and Outpatient Tabulations prepared by the IHS Office of Planning, Evaluation, and Legislation (OPEL) from data contained in the Ambulatory Patient Care Computer Data System, and Supervisor to Non-Supervisor ratios contained in draft tables prepared by the IHS Office of Administration and Management (OAM).
Staffing data was also obtained from Area Profiles prepared by IHS Area Offices for OPEL. Area profile staffing data was at times dissimilar to IHS Workforce Database. Some discrepancies between Area Profiles and IHS work force data were traced to the fact that Area Profile data is not standardized. Some Areas report staffing based on positions that were authorized for budget purposes. Moreover, Area Profile data tended to treat vacant positions as if they were filled.
Two reports by the AHA had valuable information used in this study. These reports are: The 1994 AHA Guide and the AHA Profile of United States Hospitals. The 1994 AHA Guide contains specific descriptions of services, size, workload, expenses, and personnel for every hospital in the United States. These data are reported to the AHA through hospital surveys. The AHA Hospital Statistics reports on the average size, workload, and personnel for U.S hospitals, by State, by statistical metropolitan area (SMSA), by hospital size (number of beds), by type of services, and \by FederalfNon-Federal category. Personnel statistics are categorized according to medical, nursing, and other staff The AHA data do not include information on supervisors.
One of the major difficulties in performing the analysis required, has been the availability of data to support the analysis. Data sources maintain data for their own unique purposes and it is frequently difficult to reformat data in ways that make comparisons valid 2 For example, personnel data provided by the AHA is primarily "inpatient" staffing data. Making a direct comparison between AHA occupational data for hospitals, to IHS occupational data for hospitals is risky, especially when IHS hospitals have significant "outpatient" and "community outreach" staff components. Comparative analysis requires that the same items or measures be compared in the same way. Numerous reformulations of data were performed in order to develop adequate bases for perfonning comparative analyses, but the lack of sufficient data from compatible sources made quantitative comparative analyses difficult
2 For example, the AHA does not col1.ect data on supervisor.1' ratios simp(1' hecause someone else is doing research on this subject It collects the types ofdata t!lat are ~'aLuahie to it.~ memhership.
2

2.0 Supervisory Span of Control
Supervisory span of control is management's response to controlling complexity within an organization. In simple organizations composed of two people, it is possible to control and direct technical work processes through informal means of communication such as "mutual adjustment". As organizations grow in size they become more complex. 3 Complexity occurs for a number of reasons. Technical work processes may become more complicated due to selection of enhanced technologies. Technical work processes may become complicated by the addition of newer or different processes. And, the addition of staff deployed along a newer or expanded line of work needs to be coordinated. Complexity requires effective coordination, communication, and control; if task activities are to achieve the particular strategy of the organization. Span of control is a management concept aimed at effectively controlling organizational complexity. Span of control has been viewed as a limit on the number of subordinates that a supervisor can effectively manage within the complexity of a particular working environment.
Working from the bottom up, span of control is imposed upon key task activities which are organized into structural building blocks. These building blocks are aggregated at each level, until they typically form a hierarchical pyramid. The height of the organizational pyramid can become quite steep however, with continuous layering of building block units As a result. very long lines ofcommunication can be created, from top to bottom, testing the ability of top management to control multiple task activities in relation to the organization's strategic goals. Steep hierarchies with numerous unit levels have communication and control problems where top management may lose touch with its daily operations and customers. Typically, top management will seek to shorten the line of communication vertically by eliminating span of control building block units. The most effective way of doing this is to "standardize" the work of units, reorganizing workers into larger units that have wider spans of control. Technological innovation in the form of new process, procedures, machines, information technology, etc. has been a valuable tool for enabling standardization of worker processes, outputs, and skills. With fewer building block units, spans of control are widened, layers of the pyramid are removed, and lines of management communication are shortened from top to bottom.
Managing work complexity is an organizational process that moves through stages of early mutual adjustment, to span of control, to standardization of work processes, outputs, and skills; and back a~ain to mutual adjustment. When work across an organization is difficult to standardize, because of widespread technical complexity and because large numbers of staff have varying technical specialties, steep hierarchical pyramids are created that cannot be easily flattened. When top management cannot eliminate layering by "standardizing" work, it can often reorganize by employing hybrid organizing principles that produce better top down communication. Hospital corporations are good examples of a hybrid organization. Corporate functions are organized functionally, but direct health care operations are performed on a "team"
3 Designing Effecti~'e Organizations, J993, Henry Mintzberg, p.J36. See also, Management. tasks, responsibilities. practices. J985, Peter Drucker, Chapter ./J.
3

basis. On the surface, the existence of hospital departments makes the organization appear to be functionally designed, but operationally each service department fIelds technical specialists to the patient. This is organizational design based upon team principles. Irrespective of the composite character of an organization, the goal is to improve coordination, communication, and control. This means that within hybrid structures, spans of control need to be developed that are as short as possible, but it is important to note that "shortness" is not defined in terms of a particular number of subordinates. In other words, a span of 10 I can be a short span of control, if it is effective. Appropriateness then, depends upon how work is organized and not upon some magic number, since the effectiveness of any span of control unit, including standardized work process units, will depend once again upon its ability to function by means of "mutual adjustment U4
• Span of Control Principle
The limit on the number of persons that a supervisor can effectively control is a function of technical work complexity and technical worker coordination. Complexity is inherent to managing the interrelationships and interactions of technical workers. 5 Early research work on supervisory span of control focused almost exclusively on industrial engineering of positions within mining and manufacturing processes that had been heavily standardized 6 Henry Fayol, who owned his own coal mine, made engineering studies to determine effective spans of control for mining processes. He believed, based upon his own observations, that supervisors should have fewer than 6 subordinates reporting to them, but for standardized operations, supervisors should have fewer than 20 to 30 workers reporting to them. Fayol's research led to generalizations about span of control.
Fayol's observations were frequently abstracted from their mining and manufacturing context and applied to other processes, without regard to the complexity inherent to other lines of work. Generalizations about span of control began to center on the number of people supervised, instead of on the reasons for work complexity and on methods for controlling such complexity through development of appropriate spans of control. As a consequence, it is still common to see management text books that focus on numbers supervised, with an after thought given to the reason for the span or ratio: "The span of control refers to the number of employees a supervisor can effectively manage. ,,7
4 The Structurine o(Organizations, 1979, Henry Mintzberg, p. 7.
5 See e.g., Management _ A Hook ofReadings, "Making Theory Operational: The Span 0/Management," 1980, Harold Koontz, 1'1'.131-1.10.
6 See e.g., General and industrial Management, 1951, H. FayoL
7 Supervision. 1986, l.eslie W. Rue and Lloyd L. Byars. p. 35. See also, Management - A Global Perspective, 1993, Heinz Weihrich, recounting sources that/ocus on numbers o/subordinates, p. 1.18.
4

Peter Drucker, a current authority on modern day management science, offers some valuable insight into the issue of numbers and complexity
"In the first place, the principle of span of control is rarely cited properly It is not how many people report to a manager that matters It is how many people who have to work with each other report to a manager What counts are the number of relationships rather than the number of men."s
The number of relationships can vary from the number of persons in a unit for two important reasons. First, the technical nature of work may be such as to require greater interaction among a set number of persons. Second, the number of relationships among persons includes relationships that go up, down, sideways, and out (external). In other words, interrelationships and interactions are not limited to internal interrelationships, but include all organizational (internal and external) relationships. Drucker concluded that "What is needed, therefore, is to replace the concept of span of control with another and more relevant concept· the span of managerial relationships. ,,9
One way of viewing supervisory span of control therefore, is to see it as a limit on the mathematical number of interactions that a supervisor can effectively manage for a given type of technical work. For non-mechanized or standardized work, this view concludes that span of control should not exceed 6 or 7 subordinates. 10 Related studies, including research conducted by the American Management Association, have found that in large corporations, the span of
. control at the ~ level of management had a median number of 9 subordinates. In smaller companies the span of control was 8 subordinates. But, below top management, studies have found that middle levels have a shorter span of controlll Variation in managerial span of control is due therefore, to the complexity of work and to the complexity of worker reporting relationships. The span of control principle needs to be amended to clarifY that numbers of subordinates supervised depends an assessment of complexity. This in turn depends upon
S Management, tasks, responsibilities, practices, 1985, Peter Drucker, p. ./ I2./Emphasis supplied/.
9 Ibid., Drucker,p. 413.
10 See e,g" Nursing Economics, "Span ofControl on Nursing Inpatient Units, " March-April, 1993, VoL II, No, 1, Mary K, Pabst /Citing Graicunas' use ofa mathematical model to demonstrate changes in communkations patterns due to complexity... "He showed that as the number ofsubordinates reporting to a manager increased, the number ofinteractions WQuld increase in geometric proportions." Graicunas concluded that a span ofsix or seven employees was aU that a manager could effective(v handle. p.87.
11 Management _ A Global Perspective, 1993, Heinz Weihrich, p. 2./8. "Indeed, a study ofmore than 100 companies ofaU sizes revealed a much narrower span in the middle levels ofmanagement than at the top. In addition, thefact that apparent(~' weU-managed companies have. among them and certain(r within them, lIJide(~'
varying spans indicates that mere(r counting the numhers in existing spans is not enough to establi.sh what a span ought to be. "
5
evaluating the impact of certain underlying factors. The principle should state "that there is a limit to the number of subordinates a manager can effectively supervise, but the exact number will depend upon the impact of the underlying factors. ,,12
• Complexity - Underlying Factors
Factors affecting the span of control are: training; clarity of authority; clarity of plans; use of objective standards; rate of change; communication techniques; amount of personal contact needed; variation by organizational level; and other factors such as competency, complexity of tasks, attitudes, etc. 13 In an organizational unit with a wide span of control, the following underlying factors would have been successfully addressed
o Thorough training of staff for all positions o Clear delegations of authority for well-defined tasks o Plans are well-defined and well-controlled o Objectives are verifiable o Changes in working environment are slow o Communication process, procedure, and structure is effective o Supervisor interactions are effective in relation to work outputs o Meetings are effective o Specialty skills are at higher levels o Managers are competent and well trained o Tasks are simple, mechanized, standardized o Responsibility is willingly taken by subordinates o Subordinates are mature and experienced
To the extent that factors affecting complexity have not been completely addressed, then a narrower span of control would be necessary to assure that task activity performance conforms to organizational strategy. 14
What is the risk of manipulating span of control ratios through prescription, when the underlying factors have not been addressed for each organizational unit? Widening a span of control would have the effect of placing the performance of task activities beyond the control of the supervisor. When complexity is not managed, risk attaches itself to the organization's mission because performance is not synchronized with organizational strategy. To rely on a prescribed supervisory ratio whose factual basis is found in studies of different industries, risks under
12 Ibid., Weihrich, p. 248.
13 Ibid.. Weihrich, p. 250.
14 See Infra "OPM Evaluation Criteria for Supervisory Positions." OPM's approach is simililr, but not as detailed as thai offered by Heinz Weiluich.
6
controlling or over-controlling different units within a health care delivery system that can result in system dysfunction and failure to comply with statutory mandates IS
• Complexity - "Information Highway" Impact
Increasing use of management information systems composed of computerized databases, telecommunications networks, and on-line personal computer connectivity has made the boundaries of organizations more permeable. In a research project conducted by the Massachusetts Institute of Technology (MIT) on the impact of information technology on organizations in the 1990's, it offered the view that organizations are being redefined by their use of such technology.
"Organizations have always managed some form of matrix structure, a matrix involving functions, products, markets, and geography in some combination. With the new Information Technology, unit costs of coordination are declining significantly This means that over the next decade we can afford more coordination for the same dollar cost. In addition, Information Technology is causing changing economies of scale....enabling a breakUp, a disintegration, of traditional organizational forms. 16
Researchers foresee "networked" organizations where relationship patterns among workers, can be networked up, down, sideways, and out, as they are needed. Interactive Networking promotes complexity as it shrinks time and distance, but also lower costs that permit faster response times. Information technology is increasing technical work complexity and the complexity of interactions. Increasing the metabolic rate of organizational change will not reduce complexity nor will it widen the span of control, except in areas where it has already widened the span of control, such as in those areas where human clerks have been replaced by database entry clerks. Utilization of Information Technology will more than likely increase the demand for highly trained technical personnel at the expert level, working within a dynamic "team" environment of interactive complexity. Organizations may continue to be structured along functional lines, but similar to hospital service departments, they will matrix technical workers on teams, creating "virtual" organizations that are chartered for the task at hand. Team units of higher level technical experts, engaged in interactive complexity will occupy organizational units that are poised above the machine standardized units composed of data entry clerks. Even in hospital and health services environments, human-machine interfacing will only intensify technical and interactive
IS Nursing Management. "Invest, A Plan for Developing New Managers," December, 1991, Georgia Manning. Commenting on supervisor control: "Without a competent nurse manager at the helm, the level ofcare delivered on the unit can deteriorate rapid(r. It doesn't take wng for a nursing unil's poor operations to cowr the public's perception ofthe entire hospilal "p. 26.
16 The Corporation ofthe 1990s - Information TechnoloKr anti Organizational Transformation, 199/. Michael Scott Morton., p. /7.
7
relationships, as computerized patient records systems, diagnosis based systems, and integrated financial management systems are more fully developed 17
Managing an organization's span of control in the 1990's cannot be done by recourse to prescribed supervisory ratios based upon archaic generalizations developed from studies conducted on mining, manufacturing, or top management units. The rules on "reengineering" a corporation favor small, highly technical, high information component, networked, fast turnaround time, short span of control units. Reengineering focuses on streamlining key activities and organization strategy. Rapid and effective response to customers is the acid test. Rigidly conforming to design parameters that view work as something that is supposed to move from one functional unit to the next, instead of organizing and networking resources to solve tasks, runs the risk of losing its customers. Adhering to a traditional organizational structure that is functional and that has low spans of control on top and wide spans of control on the bottom, has high costs. While there may be cost savings associated with widening spans of control for units at the bottom, the downside is higher costs because you have too many employees in those units. Higher technicalleve1 employees whose work has higher information components would require units with shorter spans of control, but cost savings would result from elimination of excess employees.
•
Finally, in the field of health care delivery systems, no research or study could be found that specified spans of control for health care organizations IH Manipulation of supervisory ratios for reasons of cost-cutting has been done However, changing the supervisory ratio without assessing the underlying factors can result in unwanted changes in the skill mix needed to offer a particular "standard of care" modality.19 An unfortunate result from changing a standard of care's skill mix, could be to offer substandard care.](l
17 See The Computerized Patient Record, Institute ofMedicine, 1993.
18 See Nursing Economics. Ibid., p. 90. Discusses the absence ofany optimal span ofcontrol model and the need to define parameters for such a model relevallt to the heaLJIr care system.
19 See Nursing Economics, Ibid., p. 90. "The skill mix ftied to diagnoses and acuitiesf. the experience level ofthe staff, and the duties ofthe charge nurse on shifts where tire lread nurse is not present, may be just a few ofthefactors contributing to the existing fhigher supervisory/ ratio. (:'hanging these factors may not be possible to the extent that lVould be necessary to generate the desired fcost/ savings. ..
20 This could produce charges of "negligell1 admini.s1rat;olt" II'hich is tI tort under the Federal Tort Claims Liability Act.
s
..,
3.0 Regulatory Requirements Affecting Span of Control
There are a number of sources of authority that affect whether or not a given position within the Federal service should or should not be classified as "supervisory". These authorities affect the technical complexity of work and the technical complexity of worker interaction. First and foremost is the statutory authority upon which technical work is based. Next, comes the authority that oversees whether or not the performance of such work meets the technical requirements and standards for such work. Third, judicial clarification of regulatory requirements affecting supervisory positions offers valuable insight. Finally, the Federal Office of Personnel Management's guidelines for assessing the supervisory nature of a position are applicable. These sources of regulatory authority are important because they affect the underlying factors of complexity upon which the span of control principle rests. They are also important because Congress has not legislated specific regulatory requirements for "supervisory ratios" within the Federal service.
• Statutory Mission and Organizational Complexity
The statutory mandates authorizing Indian Health Service activity create a unique statutory mission that does not exist in any other agency. This mission is at once focused on elevating the health care of American Indians and Alaska Natives to the highest possible level, and it is equally focused on contracting or compacting out this mission to eligible Indian organizations. The primary mission to elevate health care status requires significant technical work complexity, since it encompasses not just medical programs, but also public health, environment, engineering and construction. Providing comprehensive services to hundreds of tribal groups with fewer than 500 members and many with memberships in the tens of thousands, located in most States, requires a high degree of communication and customer interaction that increase complexity. Finally, contracting and compacting increase complexity Certainly, the Secretary of the Air Force does not have to consult with every county over which his aircraft fly; nor is he required to maintain a high state of military preparedness while simultaneously contracting his readiness out to Santa Clara county, California. Without some explanation of the technical complexity inherent to the IHS statutory mandate, it is difficult to appreciate the complexity inherent in daily task activities.
In 1954, The Indian Health Transfer Act 21 relocated the Indian Health Service from the Bureau of Indian Affairs because of widespread failures by the Indian Bureau to meet the health care needs of Indians. The Transfer Act provided the initial authority for contracting the operation and maintenance of Indian hospitals and health facilities to eligible organizations 22
Since 1970, the Indian health care policy of the United States has consistently favored Indian self
21 p.L. 83-568. August 5, 195./
22 42 U.S.c.§ 2002. See also. Act ofAugust 16.1957, P.L. 85-151• ./2 U.S.c.§ 2005 authoru.urg contracts to State and local governments for Indian health care: and P.l.. 86-121 (1959) authorizing matching grants to local governments for sanitation facilities.
9
determination in health care,2J although it continued to authorize contracts to health care providers, with Indian consent. 2~ The self determination policy in Indian health care was enacted into law in 1975 by passage of the Indian Self Determination and Educational Assistance Act 25
Within a year another seminal piece of legislation was passed, the Indian Health Care Improvement Act. 26 This Act sought to overcome the appalling deficiencies in the Federal Indian Health care program by providing a comprehensive program for elevating Indian health care Four years later, the 1980 Amendments to the Act were passed authorizing additional appropriations and making substantive changes, providing Buy-Indian Act contracting opportunities, and providing access to Medicare and Medicaid health programs. n Congress acted again in 1988 to amend the Indian Self Determination Act to authorize easier contracting of IHS health programs to Indian tribes,28 and to amend the Indian Sanitation Facilities Act 29 Congress has also acted to enhance contracting ofIndian Health care services through compacting, in the Tribal Self Govemance Demonstration Project Amendments30 Most recently, Congress has sought to simplifY contracting and increase contracting opportunities by amending P.L. 93-638 31
The statutory mission of the Indian Health Service is to elevate Indian health to the highest possible level and to provide assumption of control by Indian tribes over Indian health care programs. This statutory mission is extraordinary complex because it requires the Indian Health Service to perform at the very highest standards while simultaneously transitioning responsibility to American Indian tribes and Alaska Native organizations As a result, the responsibility for managing significant complexity arises within the agency On the one hand, the IHS must provide
23 See Message From the President ofthe United States Transmitting Recommendations For Indian Policy, H.R. Doc. No. 363, 91st Cong., 2d Sess. (1970), ..... The time has come to break decisive(~' with the past and to create the conditions for a new era in which the Indian future is determined by Indian acts and Indian decisions. "
24 Health Maintenance Organization Act, Act ofDecember 29,1973, P.L. 93-222,87 Stat. 935, amending Section I ofP.L 83-568, Indian Health Transfer Act.
25 P.L 93-638, 25 U.S.c.§ 450 (/975).
26 P.L. 94-437, 90 Stat. 1406,25 U.S.c.§ 1601 ~ mi.., ./2 U.S.c.§ 1395-1396,200./.
27 See 25 U.S.c.§ 1601 ~ mi.. See also Title IVofthe Indian Health Care Improvement Act "Access to
Health Services", authorizing the Indian Health Service to receive Medicare and Medicaid reimbursementsfor services provided to Indians eligible for Social Security A(1 programs, when the service was performed in IHS facilities. See Section 1880 "Indian Health Service Facilitiel"" ullder Title XVIII ofthe Sodal Security Act.
28 See P.L. 100-./72, October 5,/988.102 Stat. 2285.
29 See P.L. 86-121, as amended.
30 See Tribal Self Governance Demonstratioll Project Amendments. Senate Bill 26./5. regarding negotiatum ofAnnual Funding Agreements.
31 P.L. 93-638, as amended, (See P.L /03-./13).
10

technically adequate services that are designed to elevate health care to the highest level, and on the other hand it must manage an organizational structure that is a by-product of its technical mandate and its mandate to transfer responsibilities to American Indian tribes and Alaska Native organizations.
Operationally speaking, the Indian Health Service administers a comprehensive health care program for American Indians and Alaska Natives The IHS utilizes a combination of direct service delivery through hospitals, clinics, and health stations, and contract health services through physician and hospital providers. The combination of direct service delivery and contract health services creates a comprehensive health care services program. In addition to care that is provided through IHS and contract health services, care is also provided under contracts with tribal governments. A fiscal intermediary is used to manage claims processing and utilization review. The IRS system is complex and includes support for a wide variety of clinical and public health services, such as: maternal and child health; fetal alcohol syndrome; diabetes; alcoholism; mental health; emergency medical services; community health representatives; environmental health and sanitation; maintenance and repair of facilities; construction of hospitals and clinics; housing; hepatitis B and plague eradication; dental services; and many others. The service population, which frequently resides in remote geographic areas, has much less access to health care than the general population. 32 Not surprisingly, mortality and morbidity rates are higher than national averages. 33 The Indian Health Service provides limited health care services to Indians residing in urban areas. 34
The statutory mandates that bifurcate the IHS mission have produced an organization that is extraordinarily complex in its technical responsibilities; complex in its multimodal methods for organizationally delivering health care; and complex in terms of its mandate to "consult" externally with the Indian populations. No other agency in the United States Government has such a complex mission. The complexity is evident in IHS hospitals that function as focal points not only for inpatient care, but also for outpatient, community outreach services, mental health, sanitation and environmental engineering, centers for health promotion and disease prevention, emergency medical services, and even construction. Unique organizations with staff deployed among numerous technical specialties, organized in matrix fashion, into teams, often under the sunlight of external review boards, and under the "supervision" of different occupational series supervisors, are organizations that have no counterpart in Government or the private sector.
Generally speaking, wide spans of control are not advisable when higher technical specialties are involved in lower organizational units. In the case of hospitals and health centers
32 "National Health Care Reform and Indian Health Care," Roundtable, Indian Health Service. February 17, 1993; Access needs to include transportation costs in remote areas as a basic benefit, p. 14.
33 "Trends in Indian Health" Department ofHeaLJh and Human Services, 1993
34 p.L. 101-573 Indian Health Amendments, Tille V, Section 501 "HeaLJIr Services For Urban Indians," October 19,1991.
II
with technically complex missions, the most appropriate organizational structure is the "team" not a functional structure. 35 Peter Drucker noted that in hospitals, the "team" structure is most appropriate, with each individual taking responsibility for the success of the whole team's effort. 36
While the IHS Headquarters and its Area Offices may be organized along traditional "functional" lines, most agency staff are located at hospitals and health centers, which are operate according to hospital "team" structure parameters.
The application of a prescribed span of control ratio of 10 I does not appear to be appropriate for the IHS Headquarters and Area Offices, nor for its 142 hospital and health centers. First, the upper levels of organizations normally have shorter spans of control of 6-8. Second, the lower levels of the IHS organization are not mechanized, or standardized because every patient that arrives is different, with every individual diagnosis requiring different standards of care. Hospitals and health clinics operate according to team design parameters, notwithstanding the hospital's functional organization into service departments. Team designed units typically have shorter spans of control as a result. If most of the IHS were composed of lower organizational units that were not medical or health care in nature, a wider span of control ratio might be appropriate, depending upon the underlying factors cited in §20 .
• JCAHO Accreditation Oversight & Statutory Compliance
The Joint Commission on the Accreditation of Health care Organizations (JCAHO) provides accreditation standards for health care organizations. Health care organizations that seek accreditation from JCAHO must comply with the standards it promulgates. The JCAHO evaluates health care organization performance, on a standard by standard basis. Utilizing a specialized scoring grid, JCAHO evaluates the performance of applicants. An official accreditation decision report is provided to each health care organization that is evaluated Deficiencies are stated in the form of recommendations for each standard and sub-standard where compliance was below acceptable levels. Certificates awarded to health care organizations are the property of the JCAHD. Once accredited, health care organizations are given a scheduled amount of time in which to cure their deficiencies. Health care organizations are then revisited and reevaluated, to determine compliance with standards.
The JCAHO evaluation process is important to health care organizations because the Certificate of Accreditation is important to qualifying under State law for participation in Title
35 Ibid., Peter Drucker, p. 56-1. "The team is also a principle for permanent structuraL design. The mission ofthe team is a specific task, but the team itselfcan be permanent Its composition may vary from task to task; its base remains, however,fair(,,· consta"t even though individuaL members may scatter between tasks or belong, at one and the same time, to a number ofteams. The hospitaL may be the simplest example."
36 See Labor Relations discussion below on "independent judgment" ofLicensed PracticaL Nurses functioning as a team and their de {acto LegaL status as "supenoisorJ ".
12
XVIII (Medicare) and Title XIX (Medicaid) Social Security Act programs·\7 In addition to State licensing, § I86I(e)(9) requires that hospitals be accredited by the JCAHO J8 The IHS and Indian tribes may continue to be eligible for Social Security Act reimbursement for services provided to Indian beneficiaries, while their facilities are in a state of noncompliance, provided that they develop plans for compliance with JCAHO standards.
The JCAHO Accreditation Manual is composed of two volumes, Volume I Standards and Volume II Scoring Guidelines.39 Volume I contains Standards for the following: Patient Rights and Organization Ethics; Assessment of Patients; Care of Patients; Education; Continuum of Care; Improving Organizational Performance; Leadership; Management of the Environment of Care; Management of Human Resources; Management of Information; Surveillance, Prevention and Control of Infection; Governance; Management; Medical Staff; and Nursing. The JCAHO has not written standards for supervisory span ofcontrol, but other standards that it sets would make it difficult to avoid span of control issues. For example, Patient Care Standards require that fonnulation, maintenance, and implementation of patient-specific treatment plans be carried out in accordance with "standards of practice" for such care~o Standards of practice and their scope of practice encompass "standards of care" that are statements about skill mix disciplines and intensities for specific procedures.~' The "covered professionals" to which this standard applies include the complete range of medical and health care providers
The JCAHO Management of Human Resources Standard requires development of appropriate staffing plans that have staffing ratios appropriate to their case mixes. Human Resources Standard number one, HR. 1 requires that master staffing plans be developed for each department that define the qualifications, competencies, and the number of staff members needed. Staffing plans under this Standard also require that "supervision" be addressed 42 The Nursing Standards require sufficient qualified nursing staff and accountability for assigning responsibility to individuals or to groups of nursing staff membersH Even in situations where organizational
31 See IHS Capitation ofMedicaid Anall'sis. February, 1991, SRMlFAR, Pl'. 11-/5.
38 The Secretary DHHS may re~v upon certification by other organizations provided that their stondards are comparahk to the lCAHD.
39 The loint Commission 1995 Accreditation Manualfor Hospitals, Vols. 1& JJ.
40 lCAHD, VoL 11., Care ofPatients. p. 63.
41 See lCAHD, VoL 1/., Intent of 7X. 1.3 "The objecti~'e ofcollaborative and interdisciplinary patient care planning and delivery by qualified individuals is to coordinate the support ofpatient needs and care goals and to assist in achieving optimal outcomes. The mix ofdisciplinel involved and the intensity ofthe collaboration will vary as appropriate to each patient.
42 lCAHD, VoL lJ., Managemento{Human Resources, HR.I,p. 292.
43 lCAHD, VoL lJ. Nursing, NR.I, p. ./52.
13
structures are very decentralized, the standards require an "identified nurse leader" to provide authority, accountability, and coordination of nurse executive functions H
While the JCAHO Accreditation Manual does not set specific standards for supervisory span of control ratios for medical and health care professional staff, it does set standards that would make it extraordinarily difficult for any facility to impose a span of control ratio that was not appropriate to what the standards of care and practice would require. In order to appreciate this statement, it is only necessary to read a JCAHO decision report to see the thoroughness and level of detail evaluated. Inappropriate span of control ratios for the supervision of staff would not be missed.45 A finding of noncompliance, coupled with an inability to readjust supervisory ratios, could jeopardize accreditation and the access that it provides to Social Security Act program reimbursement.
• NLRB v. Health Care & Retirement Corp. 114 S.Ct. 1778, May 23, 1994
In the National Labor Relations Board (NLRB) case recently decided by the United States Supreme Court, the Court found that four Licensed Practical Nurses were "supervisors" under the definition of"Supervisor"46 in the National Labor Relations Act. Generally speaking, only supervisors and managerial employees are excepted from coverage by the Act. Employees such as medical doctors, faculty members, pharmacists, librarians, social workers, lawyers, television station directors, architects, and engineers are considered Professional employees ~7 Licensed Practical Nurses (LPNs) had been considered as Technical employees. While the LPNs involved in this case lacked line authority over others, they did possess sufficient authority to direct the work of others, that the Court found them to be "supervisors" within the meaning of the Act. Dissenting Justices pointed out that the Courts decision meant that calling someone a "lead person" makes her a supervisor. "The Court's opinion has implications far beyond the nurses involved in this case. If any person who may use independent judgment to assign tasks to others or direct their work is a supervisor, then few professionals employed by organizations subject to the Act will receive its protections. ,,~8
44 JCAHO, VoL II. Nursing. NR 1.1, p.454.
45 Contractor I&MT Inc. reviewed a number ofJCAHO Office Accreditation Decision Reports on IHS health carefacUities. As an example ofdetail, in relation to Standard NC3.4.1., the JCAHO found: "It was noted thai Registered Nurse Staffurg was reviewedfor the following weeks: , It was noted that the Registered Nurse Staffurg on the 3-11 shift for the 2 East Unit was approximate~1' 70% ofthe staffing required by the Hospital's Plan." IdentifICation Number 000004190, p. 11.
46 29 U.S.C § 152(11)
47 29 U.S.C § 152(12)
48 1994 U.S. LEXIS 3775; p. 1-1.
14
While the National Labor Relations Act applies to Industry, the views expressed by the Court could have impact on the Federal labor relations system as well, since the issue of what constitutes a supervisor is essentially the same under public labor law as it is under private labor law. Widening a span of control at lower levels to eliminate "supervisors" and then creating lead persons to fulfill the same supervisory functions needed to deliver a specific standard of care, would have no effect on the Supreme Court's view of who the supervisor really was.
• OPM Evaluation Criteria for Supervisory Positions
The Federal Office of Personnel Management provides evaluation criteria for assessing whether or not a position is "supervisory" in nature. Many factors go into the determination of organization structure and staffing. Those organizations which carry out core government functions are structured in accordance with functional areas of responsibility. The structure of organizations responsible for the delivery of health care services are organized in response to patient morbidities and health care service needs
The Indian Health Service follows the directives of the Office of Personnel Management for the determination of supervisory positions within health care facilities The New General Schedule Supervisory Guide, issued in January, 1993, clearly states the criteria for supervisory positions. The two key factors for supervisory positions are supervision of others and technical competence related to the work being directed. Positions which have the potential to be classified as supervisory positions are evaluated for six factors
o Factor 1 - Program scope and effect o Factor 2 - Organizational setting o Factor 3 - Supervisory and managerial authority exercised o Factor 4 - Personal contacts o Factor 5 - Difficulty of typical work directed o Factor 6 - Other Conditions
Factor I, program scope and effect measures the complexity of the activities being directed and the extent to which these activities have external impact Since IHS facilities serve a client base equivalent to several rural towns, the appropriate rating for the Factor I criteria is typically at least Level 3.
Factor 2, the organizational setting measures the level of the position within an organization. Most supervisors in a health care facility report to a Department Director, who reports to the Facility Director. This position in the organization qualifies as rating level I for Factor 2.
Factor 3, supervisory and management authority exercised, evaluates the extent to which supervisory and managerial authority has been delegated to this position Most supervisory
IS
positions in health care facilities involve the scheduling of work, the direct supervision of work and the evaluation of its performance, and non-routine, life-and-death decisions Consequently, the minimum level for rating Factor 3 is Level 2.
Factor 4, personal contacts measures the organizational relationships with the public. Since everyone in a health care facility is in continuous contact with the general public, supervisory positions qualify for at least Level 2 for this factor.
Factor 5, the difficulty of the typical work directed deals with two issues: the complexity of the work being directed and the pOl1ion of time being devoted to supervisory activities. The complexity of work being supervised refers to the grade level of the stafTbeing directed. The medical and nursing staff at IHS health facilities is usually graded at GS-9 and above. The critical time factor is that 25% or more of the supervisor's workload is spent directing the activities of subordinates. The rating level for Factor 5 is likely to be at least Level 8.
Factor 6, other conditions, involves special situations. Review of the criteria indicates that a medical treatment setting probably warrants at least Level 3 for this factor.
The application of criteria from the aPM Supervisory Guide appears to provide sufficient justification for the designation of supervisor to every work team within a clinical setting in both IHS hospitals and health centers.
16
4.0 Analysis of Health Industry Staffing Patterns
An analysis of the comparison on staffing between IHS hospitals and private hospitals provided important insight into the nature of the workload and services being provided. The IHS workload was derived from tabulations prepared by the IHS Patient Care Statistics Branch. Table 149 shows the average staff, admissions, and outpatient visits for IHS hospitals, grouped in accordance with size categories (number of beds) used by the AHA. The two workload measures of admissions and outpatient visits are characteristics of inpatient services and outpatient services, respectively. The average admissions per staff and the average outpatient visits per staff grow substantially as the hospital size grows. The larger IHS hospitals service about three times as many patients per staff as the smaller size hospitals.
4.1 Analysis of American Hospital Association Data
The average staff, admissions, and outpatient visits for all U.S. hospitals was tabulated from AHA data. This data is reported in Table 2. 50 Similar data was tabulated for U.S. hospitals classified as Community Hospitals (i.e. al1 non-Federal short-term general and other special hospitals whose services are open to the general public), and reported in Table 351 In both cases, the average admissions per staff and the outpatient visits per staff are reasonably constant, independent of hospital size.
Table 452 includes the summary statistics for the three aforementioned data tables, plus the comparable AHA data for Federal hospitals. Several interesting results may be observed in Table 4. The average admissions for non-IHS categories is about 5,000 admissions per year. IHS hospitals average about 1,500 admissions per year. The average staff of IHS hospitals is 234 Full Time Equivalents (FTE), whereas the average staff of all Federal hospitals is 930 FTEs. The average staff of other categories is about 650 FTEs. The average outpatient visits (OPY) at IHS hospitals is about 63,000; at all Federal hospitals the average OPYs is almost 180,000, whereas the average at all U.S. and community hospitals is about 50,000 OPYs The OPYs per staff at IHS hospitals is about 271, at al1 Federal hospitals it is about 193, and for all U.S. and all community hospitals the average OPYs per staffis about 75, annually.
The service profile at IHS hospitals is uniquely different from either other Federal hospitals or from private hospitals. The IHS hospitals have far less inpatient workload from any other category. This observation may be explained by the size of IHS hospitals All but three of
49 See Appendix A.for Ana(rsis Data Tabl£s.
50 See Appendix A. for Ana(rsis Data Tables.
51 See Appendix A. for Ana(rsis Data Tabl£s.
5~ See Appendix A. for Ana(l'sis Dala Tables.
17
the 42IHS hospitals have less than 100 beds. The roughly 3,000 U.S. hospitals with less than 100 beds is about 45% of the total number of US. hospitals Over one-half of the hospitals in the U.S. are larger than any IHS hospitaL
The IHS hospitals handle about 50% of the admissions of other hospitals of comparable size; however, the IHS hospitals handle a workload ofOPVs which is enormously higher than any other category of hospital. The Federal hospitals have a very different service profile from the private hospitals. The IHS hospitals are even unique among Federal hospitals since the IHS hospitals average almost 50% more outpatient visits per FTE than the Federal hospital average.
The staff occupations at IHS hospitals appears to be similar to the staff occupations at private hospitals, although the AHA data does not give much detail. Table 5S
) shows the percentages of physicians/dentists, nurses, and others for IHS hospitals compared to all U.S. hospitals. The only difference is that the U.S. hospitals have a lower percentage of doctors and dentists. This is probably due to the fact that the IHS hospitals are so much smal1er than the average U.S. hospital in size.
No data were available from the AHA on supervisor ratios, so no comparisons could be made. Moreover, data were unavailable for health centers and medical clinics, so no comparison with IHS health centers could be made.
4.2 Comparison to Veterans Administration Staffing Patterns
Discussions were held with several officials in the Office of Administration of the Veterans Administration (VA) regarding staffing analysis and supervisor ratios S~ These officials confirmed that the VA has been doing analysis of staffing and supervisory ratios as part of the mandate from OMB to develop a streamlining plan The VA operates about 400 facilities. Of these, 172 are Medical Centers. The total VA staff is about 210,000 employees. The supervisory ratio in the 172 hospitals/medical centers is currently about I: 13. These hospitals are considerably larger than IHS hospitals. They offer long-term care as wel1 as short-term care, and they can have as many as 2,000 employees in one facility.
The VA has about 30 small hospitals (of the 172) which may be comparable to IHS size; about 200 special counseling centers (which are "store front" operations), and about 170 outpatient clinics and satellite health centers. These small VA facilities have staffing profiles and supervisory ratios similar to IHS. The VA does not consider the staffing or supervisory ratios to be a significant problem because the small facility imbalances are masked by the weight of the numbers from their large facilities.
SJ See Appendix A. for Analysis Data Tables.
S4 Contractor I&MT Inc. held telephone discussions ...ith Mr. Brian Thacker and Mr. Ray Wilhurn ofthe VA Office ofAdministration, January, /995; discussions notes are reported.
18
5.0 Analysis of Indian Health Service Staffing Patterns
The IHS work force database was studied to determine the staffing characteristics at IHS health service facilities and the IHS supervisor span of control The data was classified by Headquarters, Area Offices, Hospitals, and Health Centers The primary focus of this analysis was the IHS health services facilities. Most of the analysis detailed the staffing at IHS hospitals and health centers.
5.1 illS Staffing Analysis - Overview
Staffing analyses were performed from data provided by the PHS Work Force On-Line Data System;" Ambulatory Patient Care Computer Data System for FY 1993; and IHS staff analysis draft tables produced from the PHS Work Force On-Line Data System Data Run. S6
The Indian Health Service carries out its duties and responsibilities with a total paid staff of about 15,800 employees. These employees include full-time permanent, full-time temporary, part-time, and intermittent staff. Health services facilities also have staff of about 600 volunteers. Approximately 80% of IHS staff is directly involved in providing direct health care to Indians at 142 IHS health care facilities.
A summary of IHS facilities and staff is presented in Table 6. 57 Headquarters staff only represent about 5% of the total. Staff in the IHS Area Offices represent another 15% of the staff total. The remaining 80% of IHS staff are employed at IHS hospitals, health centers, health facilities at Indian Schools, health stations, field sites, and other health facilities
The supervisor ratios were calculated for each facility type These ratios are presented in Table 7. 58 The IHS overall supervisor ratio is approximately I: 5. The supervisor ratios range from I: II for the Perry Point Supply Depot to 1:2 at the other health facilities. Two observations should be made about the data which was used for these calculations. The organization codes for each individual employee in the work force database did not always refer to a unique facility. Consequently, the differentiation of staff for each and every IHS Health Center could not be made. The unresolved and ambiguous organization codes were grouped within the "Other Health Facilities" category. The indicated supervisor ratio for "Other Health Facilities" of 1·2 is not particularly meaninsful. Also the "supervisor" designation in the PHS Work Force On-Line System is not clearly defined in available PHS documentation The codes for "manager",
55 Data Run, August 20,199./.
56 The workforce database is not 100% accurate in its listing oforganizational codes, making staffcounts for each facility subject to small errors.
57 See Appendix A.for Ana(l'sis Data 7'ables.
58 See Appendix A. For Alla(rsis Data 7'ahle.~.
19
supervisor", and "work leader" used within the supervisor classification. It appears that the coding, definitions, and usage of supervisor classification is not standardized throughout the agency.
A summary of the number ofIHS facilities by Area is presented in Table 8 59 IHS staff at 42 IHS hospitals is about 10,396, with an average staff size of about 250 FTEs IHS staff at 65 IHS health centers is 1,825, with an average of about 30 FTEs per health center The remaining health services staff of 1,064 is distributed among 35 Service Units, health stations, field sites, and other health facilities. As noted earlier, the coding of IHS workforce data does not provide sufficient detail to differentiate staff by facility for these sites.
IHS staff for each Area is set forth in Table 9.60 The size of the IHS Areas is very different, both geographically and demographically. As a result, the number and size of health care facilities operated by IHS are different in each Area.
5.2 Staffing at Non-Health Care Facilities
The Indian Health Service is organized with a Headquarters staff and twelve (12) Area Offices. While only 5% of IHS staff is assigned to the Headquarters organization, the organization itself exists in twelve distinct locations where it performs executive direction of activities. Headquarters' activities do not involve direct health care operations since it is not a health care facility. The IHS Headquarters organization includes three locations for the Offtce of Engineering Services designated as the Regional Office with a staff of 68 employees.
The IHS Area Offices perform a variety of functions, among which are the management and direction of IHS health care facility operations, core public health functions; facility engineering, and environment. Each Area Office is responsible for a specific geographic area of the country. Area Offices have subdivided their regional coverage into geographical units of service, denominated as Service Units (SUDs). Each Service Unit is directly responsible for the facilities within its geographic area and is accountable for all services provided to Indian beneficiaries residing within that unit.
IHS Area Offices have very little direct responsibility for the direct medical operation of health care facilities, although several Area Offices have centralized some direct services, such as laboratory services, to minimize operating costs. The staffing level for direct health care services by Area Offices is minimal. The overall staffing level for IHS Area Offices is 2,40 I employees, which is approximately 15% of the IHS staff total
59 See Appendix A.for Ana(}'sis Data Tables.
60 See Appendix A.for Ana(l'sis Dala Tahles.
20
5.3 Staffing at Health Care Facilities
There are 142 IHS health care facilities. The Indian Health Service operates 42 hospitals and 65 health centers, and 35 other health facilities including field offices and health centers within Indian schools. Two of the IHS hospitals are accredited Medical Centers (Phoenix and Anchorage). IHS hospitals provide inpatient and outpatient care, and community outreach services. IHS health centers provide emergency medical services. outpatient services, and a variety of community outreach services.
The IHS Service Units reported 60,575 admissions, 2,699,657 Primary Care Provider Visits (PCPVs), and 4,079,655 total Outpatient Visits for FY 1993. 61 These services were primarily provided by IHS hospitals and health centers, although data from tribal health centers operating within IHS SUDs are included. Table 1062 shows a summary of IHS workload. Tables 11, 12, and 1363 show the distribution of workload among IHS Areas.
IHS Health Centers provide outpatient services to communities that lack ready access to a hospital. The 65 IHS health centers employ a staff of 1,825 (1,762 are IHS employees, and 63 are volunteers). The IHS Health Centers provided 1,270,826 OPVs, which is 31% of the total IHS OPV services; and 708,172 PCPVs, which is 26% of the total IHS PCPV services.
Most of the IHS staff is employed at IHS hospitals where they provide direct health care services. These hospitals provide inpatient and outpatient care services, and a variety of community outreach services. IHS hospitals reported 60,575 patient admissions (100%); 2,668,277 Outpatient Visits (65% of the IHS total); and, 1,883,600 Primary Care Patient Visits (PCPVs) (70% of the IHS total).64 IHS staff at hospitals includes administrative, clinical, facilities management, records management, community outreach, and facilities engineering, maintenance and services personnel.
The primary purpose of this Report is to explore issues related to staff size and span of control. The IHS Workforce Database provides data for each IHS employee which includes employee title, occupational series, organization code, functional code, supervisory code, and other payroll profile data. The analysis focussed on occupational series, functional code, and supervisory code. The detailed findings are discussed below.
61 IRS ana{vsis ofdata tabulatedfrom the IHS Ambulatory Patient Care Computer Data System.
62 See Appendix A. for Analysis Data Tables.
63 See Appendix A.for Ana~vsis Data Tables.
64 Data reported isfor Fiscal Year 1993.
21
5.4 Staffing Analysis for IHS Hospitals
The staffing at IHS hospitals accounts for 63% of the total paid staff65 In many locations, the IHS hospital is the focal point for all Indian health services, not just the traditional inpatient or outpatient services. Hospitals frequently provide preventive and community outreach services as well. From available data sources, it is difficult to ascertain the which hospital staff are dedicated to traditional medical care services and which are dedicated to ancillary or community outreach services. While it is likely that staff in fact dedicate their time to both types of services, data are unavailable to determine the precise allocation of staff time to the mix of staff duties.
Analysis of IHS hospital staff according to their occupational series shows that approximately 71% are in the medically related occupational series.66 Within the medically related series, approximately 10% of staff is composed of physicians or physician's assistants while 44% of this staff series is composed of nurses, and 8% of staff are dental related Table 1467 shows the breakdown ofIHS hospital staffby occupational series.
The IHS workforce database also includes a code for "functional class" This code refers to the nature of the work being performed. One of the functional class codes is "clinical practice, counseling and ancillary medical services". Table 14 provides staffmg data for personnel assigned to the "clinical" functional class by occupational series at IHS hospitals Approximately 40% of the staff at IHS hospitals is classified as performing clinical functions Out of a total hospital staff of9,852 , only 3,901 are classified as "clinical". Nearly 95% of the clinical employees are in the medical occupational series.
The methodological basis for classifying staff as "clinical" is not always obvious. For example, physicians (GS-0602 and GS-0603 series) and nurses (GS-061 0 series) are classified as clinical, but practical (vocational) nurses and nursing assistants (GS-0621 ) are classified as "nonclinical" functions. Similarly, medical technologists (GS-0644) are classified as "clinical", but medical technicians (GS-0645) and diagnostic radiological technicians (GS-0647) are classified as "non-clinical" .
:In order to examine the IHS workforce data on a facility by facility basis, a hospital staff analysis tabulation was prepared. Table 1568 shows the total FTEs at each IHS hospital. the number of supervisors and non-supervisors, and the tabulation of staff by generalized occupational categories. The data in this table cannot be considered as totally reliable, since the database key was organization code. In some cases, there was no way to differentiate staff for a
65 When volunteer staffis added,/HS hospital stuffillg rises to appTOxinrute(1' 66% ofuUpersonneL
66 This is the 600 series cUtssijicutioll.
67 See Appendix A. for Alla(l'sis Data Tables.
68 See Appendix A.for Alla(l'sis Data Tables.
22
health center located in the same Service Unit In other cases, it was not clear whether the "hospital" staff was assigned to the hospital or to the Service Unit Furthermore, it is known that some hospital staff are assigned to services satellite facilities, Indian School Health Centers, other Indian Clinics, and community service (at least on a part time basis)69
A facility profile sheet has been prepared for each IHS hospital to summarize the workforce staffing data. 70 The profile sheets show that staff size typically grows in proportion to the number of beds and the number of admissions. The "clinical" to "non-clinical" staff ratios however, do not appear to correlate with changes in workload.
The IHS workforce database was examined for supervisory codes. There are three categories which can be differentiated: "supervisor", "manager", and "work leader". Detailed definitions for these categories were not made available. It is assumed that managers have defined organizational management responsibilities; that supervisors plan, organize, and direct the work of subordinates, and that work leaders monitor and lead group activities, whether the group is composed of same series peers or a mix of staff series. Table 16. provides data on the number of staff within each supervisory category according to their occupational series.
The average span of control at IHS hospitals was calculated as 7.03 Table 16 shows the span of control for each occupational series and the percentage of supervisory staff in each of the three supervisory categories Over 90% of the supervisory staff is classified as "supervisor" About 5% of the supervisory staff is classified as "manager". Table 16 also shows the span of control within each occupational series. The supervisory span of control within an occupational series only applies if a supervisor in one occupational series can not and does not supervise personnel in other occupational series. Although there is no data on the organization structure within each individual hospital, it seems reasonable to assume that doctors may be supervising nurses, registered nurses may be supervising practical nurses, and staff administrators may be supervising custodial staff. Consequently, the span of control calculations within occupational series have little value, if any.
For examination of supervisor ratios on a facility by facility basis, the IHS workforce data was tabulated by organization code. A supervisor ratio analysis was conducted. Table 1771
shows the total FTEs at each IHS hospital, the number of non-supervisors and supervisors, and their ratio; the number of clinical FTEs at each IHS hospital, the number of clinical nonsupervisors and clinical supervisors, and their ratio; and, the number of non-clinical FTEs at each IHS hospital, the number of non-clinical non-supervisors and non-clinical supervisors, and their ratio. The data in this table shows the overall supervisor ratio to be 5-7; the clinical supervisory
69 IHS Area Profiles reference ancillary services prtwided by IHS hospital staffat otherfaciJitjes.
70 See Appendi.x: B.for Hospital Profile Sheets.
71 See Appendix A. for Ana(l'sis Data Tables.
23
ratio to be about 3-4; and the non-clinical supervisory ratio to be 8-12. However, one must immediately point out that the supervisory ratios have little or no meaning without supporting data which confirms an organizational structure of who is supervising whom
Although many aspects were examined and many data cross-cuts were calculated, data do not exist to support analysis of supervisory administrative series (300) relationships of supervisors to non-300 series employees, nor to support analysis of one supervisory series to multiple series of subordinate personnel when such mixes exist. As a result, the supervisory staff and staff numbers for IHS hospitals, summarized in Table 18,n are based upon a same-series tabulation. The tabulated subtotals were used to compute the span of control ratios on a same-series basis in Table 1973 because data on mixed series supervision does not exist.
The agency-wide ratio of all supervisors to all employees is approximately 6.5, with 1,947 employees classified as supervisory out of 12,609. The hospital staff ratio of all hospital supervisors to all hospital staff is about 7.0 Examining the ratio of all "clinical" supervisors to all "clinical" staff, and all "non-clinical" supervisors to all "non-clinical" staff, the hospital ratios are, respectively, 4.6 and 10.7.
A cursory assessment of this data might suggest that clinical staff have many more supervisors than do non-clinical staff, possibly due to the nature of the work and greater levels of responsibility. Intrinsic to such a conclusion is belief that clinical staff only supervise other clinical staff, and that non-clinical staff only supervise non-clinical staff. This does not appear to be the case however, since both physician's assistants and practical nurses are classified as non-clinical and are almost certainly being supervised by "clinical" physicians and registered nurses, who are classified as clinical staff.
One explanation of the disproportionately large number of supervisors in the physician, nurse, and pharmacist occupational series is that the nature of the work justifies a "supervisor" designation even though the responsibilities for directing other staff are minimal. The IHS has a difficult time filling vacant positions for physicians, nurses, and pharmacists, so the supervisory classification allows a higher pay rate for these employees. Thus, the low span of control in hospitals may be due in part to issues which are not organizational
The true staff size at IHS hospitals is not truly reflected in the IHS employee data. The statistics derived for this report include only IHS paid employees. Hospitals may also have volunteers, tribal employees, and contract employees as part of the staff Thus, the span of control statistics are probably understated.
72 See Appendix A. for Ana(rsis Data Tables.
H See Appendix A. for Ana(rsis Data Tables.
24

Discrepancies in data existed among the three sources of IHS hospital staffing data used in this study. Data were analyzed from the IHS workforce database, IHS Area Profiles (prepared by the IHS Area Offices for the IHS Office of Planning, Evaluation, and Legislation (OPEL), and from the American Hospital Association Guide, containing data on IHS facilities. For common data elements, data reported by these sources typically varied by less than 15%; but in several cases, reported staff data were as great as 40%. The discrepancies may be explained by a number of reasons. The IHS workforce data only contains IHS employees. The organization code may be outdated or the code may be inaccurate. The Area Profile data may (1) include unfilled vacancies, or (2) be reporting authorized positions from budget data as opposed to actual staffing for a facility. The AHA Guide reports survey data which may be inaccurate or mis-coded
5.5 Staffing Analysis for IHS Health Centers
Staffing at IHS health centers accounts for 11 % of the total staff. In many locations, the IHS health center is the only source of Indian health services. The health centers provide outpatient services, plus preventive and community outreach services. It is difficult to ascertain what portion of a health center's staff is devoted to preventive and community services, and even more difficult to determine whether some of the staff split their time among different duties.
An analysis of IHS health center staff according to their occupational series shows that about 69% of the staff have medical related occupations ( 600 series). This is very close to the medically related occupations in IHS hospitals. About 11 % of the medical occupation staff is made up of physicians or physician's assistants, while another 24% of such staff is made up of nurses, and 16% of the staff is made up of dental related personnel. Table 2014 shows the breakdown of IHS health center staff by occupational series This Table also shows the staffing assigned to the "clinical" functional class by occupational series at IHS health centers. About 36% of the staff at IHS health centers is classified as performing"clinical" functions. Out of a total health center staff of 1,762 , only 636 are classified as "clinical". Approximately 93% of the clinical employees are in the medical occupational series.
The IHS workforce database was examined for supervisory codes There are three categories that can be differentiated. "supervisor", "manager", and "work leader". Detailed definitions of these categories were not made available. It is assumed that managers have defined organizational management responsibilities; that supervisors plan, organize, and direct the work of subordinates, and that work leaders monitor and lead group activities, whether the group is composed of same series peers or a mix of staff series. Table 20 provides data on the number of staff within each supervisory category according to their occupational series.
14 See Appendix A. for Ana(.·sis Data Tables.
25
In order to examine the IHS workforce data on a facility by facility basis, a health center staff analysis tabulation was prepared. Table 21 75 shows the total FTEs at 37 of the 65 IHS health centers. The data for the remaining 28 health centers could not be determined from the IHS work force data. Either no organization code was found in the IHS hierarchical listing of organizations or the organization code used did not correspond. The accuracy of this data is somewhat suspect, as discussed in section 5.6 .
A facility profile sheet has been prepared for each IHS health center to summarize workforce staffing data. 76 The profile sheets show that the staff size typically grows in proportion to the number of beds and the number of admissions. The mix between "clinical" and "nonclinical" staff and the mix occupational series do not appear to exhibit a discernable pattern, in relation to changes in hospital staff size or admissions.
The average span of control at IHS health centers was calculated as 5.93. Table 2277
shows the span of control for each occupational series and the percentage of supervisory staff in each of the three supervisory categories. About 93% of the supervisory staff is classified as "supervisor", while about 6% of the supervisory staff is classified as "manager" Table 22 also shows the span of control within each occupational series. The supervisory span of control within an occupational series only applies if a supervisor in one occupational series can not and does not supervise personnel in other occupational series. Although there is no data on the organization structure within each individual health center, it seems reasonable to assume that doctors may be supervising nurses, registered nurses may be supervising practical nurses, and staff administrators may be supervising custodial staff. Consequently, the span of control calculations within occupational series have little value, if any
For examination of supervisor ratios on a facility by facility basis, the IHS workforce data a health center supervisor ratio analysis tabulation was prepared. Table 23 78 shows the total FTEs at each IHS health center, the number of non-supervisors and supervisors, and their ratio; the number of clinical FTEs at each IHS health center, the number of clinical non-supervisors and clinical supervisors, and their ratio; and, the number of non-clinical FTEs at each IHS health center, the number of non-clinical non-supervisors and non-clinical supervisors, and their ratio. The data in this table shows the overall supervisor ratio to be 5-7; the clinical supervisory ratio to be about 3-4; and the non-clinical supervisory ratio to be 8-12 These supervisory ratios are similar to the ratios for hospitals
75 See Appendix A.for Ana(rsis Data Tables.
76 See Appendix C.for Health Center Profile Sheets.
77 See Appendix A.for Ana(rsis Data Tables.
78 See Appendix A.for Ana(rsis Data Tables.
26
Although many aspects were examined and many data cross-cuts were calculated, data do not exist to support analysis of supervisory administrative series (300) relationships of supervisors to non-300 series employees, nor to support analysis of one supervisory series to multiple series of subordinate personnel when such mixes exist. As a result, the supervisory staff and staff numbers for IHS health centers, summarized in Table 24,79 are based upon a same-series tabulation. The tabulated subtotals were used to compute the span of control ratios on a sameseries basis in Table 2580 because data on mixed series supervision does not exist.
The agency-wide ratio for all supervisors to all employees is approximately 6.5, with 1,947 employees classified as supervisory out of 12,609. The health center staff ratio of all health center supervisors to all health center staff is about 5.9. Examining the ratio of all "clinical" supervisors to all "clinical" staff, and all "non-clinical" supervisors to all "non-clinical" staff, the health center ratios are, respectively, 3.6 and 9.2.
The results of analyzing the staffing data at IHS health centers are similar to the results of analyzing IHS health centers. The use of"supervisor" classification to increase pay rates to attract and retain physicians, nurses, and pharmacists is probably consistent; since the Area Office personnel departments are in charge of hiring for both hospitals and health centers. Data anomalies are probably the same for hospitals data and health center data.
The true staff size at IHS health centers may not be totally reflected in the IHS employee data. The statistics derived for this report include only IHS paid employees. Health centers, as well as hospitals, may also have tribal employees, and contract employees as part of the staff. Thus, the span of control statistics are probably understated
The only other source of data about staffing at IHS health centers is the Area Profiles. The profiles usually do not provide a definite count of staff at health centers. Consequently, the IHS workforce database can only be taken at face value without validation by other sources.
5.6 Supervisory Staff Positions
The services being offered at IHS health care facilities vary dramatically from location to location. Hospitals !'ave as few as seven or eight beds to as many as 142 beds Small hospitals provide only ambulatory and minimal in-patient care. Many hospitals provide surgical services, intensive care, and a full range of obstetric and gynecological services. There does not appear to be any prescribed staffing size or organization based on the level of service (although the IHS Resource Allocation Methodology is formulated on the basis of services supplied)
79 See Appendix A. for Ana(rsis Data Tahles.
80 See Appendix A.for Ana(l'sis Data Tables.
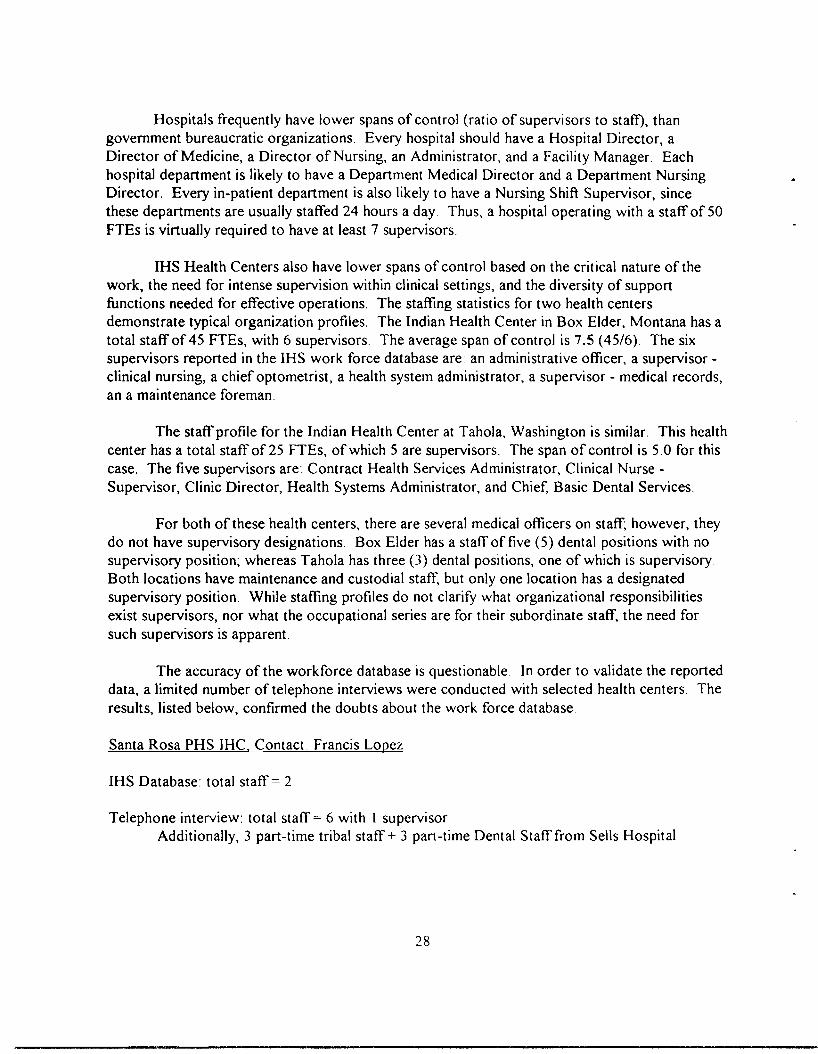
Hospitals frequently have lower spans of control (ratio of supervisors to statl), than government bureaucratic organizations. Every hospital should have a Hospital Director, a Director of Medicine, a Director of Nursing, an Administrator, and a Facility Manager Each hospital department is likely to have a Department Medical Director and a Department Nursing Director. Every in-patient department is also likely to have a Nursing Shift Supervisor, since these departments are usually staffed 24 hours a day. Thus, a hospital operating with a staff of 50 FTEs is virtually required to have at least 7 supervisors.
IHS Health Centers also have lower spans of control based on the critical nature of the work, the need for intense supervision within clinical settings, and the diversity of support functions needed for effective operations. The staffing statistics for two health centers demonstrate typical organization profiles. The Indian Health Center in Box Elder, Montana has a total staff of 45 FTEs, with 6 supervisors. The average span of control is 7.5 (45/6) The six supervisors reported in the IHS work force database are an administrative officer, a supervisor clinical nursing, a chief optometrist, a health system administrator, a supervisor - medical records, an a maintenance foreman.
The staff profile for the Indian Health Center at Tahola, Washington is similar. This health center has a total staff of25 FTEs, of which 5 are supervisors. The span of control is 5.0 for this case. The five supervisors are: Contract Health Services Administrator, Clinical Nurse Supervisor, Clinic Director, Health Systems Administrator, and Chief, Basic Dental Services.
For both of these health centers, there are several medical officers on staff; however, they do not have supervisory designations. Box Elder has a staff of five (5) dental positions with no supervisory position; whereas Tahola has three (3) dental positions, one of which is supervisory. Both locations have maintenance and custodial staff, but only one location has a designated supervisory position. While staffing profiles do not clarify what organizational responsibilities exist supervisors, nor what the occupational series are for their subordinate staff, the need for such supervisors is apparent.
The accuracy of the workforce database is questionable In order to validate the reported data, a limited number of telephone interviews were conducted with selected health centers. The results, listed below, confirmed the doubts about the work force database
Santa Rosa PHS IHe, Contact: Francis Lopez
IHS Database: total staff = 2
Telephone interview: total staff = 6 with 1 supervisor Additionally, 3 part-time tribal staff + 3 part-time Dental Staff from Sells Hospital
28
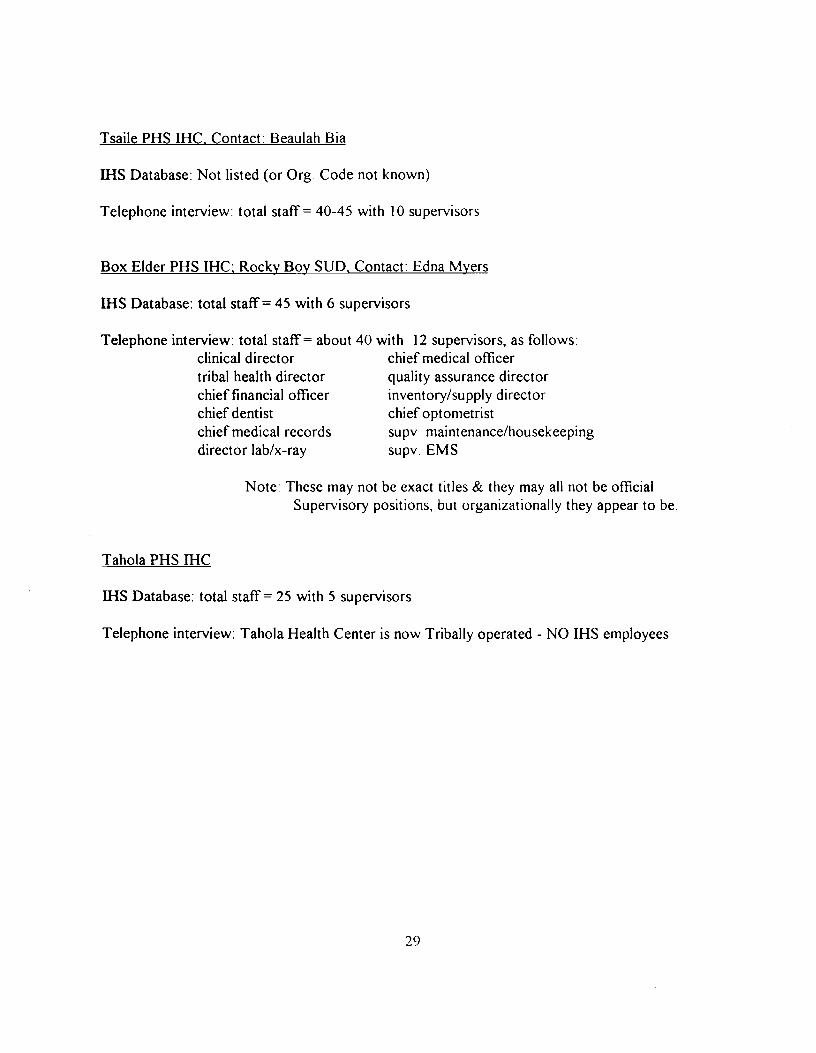
Tsaile PHS IHe. Contact: Beaulah Bia
IRS Database: Not listed (or Org. Code not known)
Telephone interview: total staff = 40-45 with 10 supervisors
Box Elder PHS !HC; Rocky Boy SUD, Contact: Edna Myers
IDS Database: total staff = 45 with 6 supervisors
Telephone interview: total staff= about 40 with 12 supervisors, as follows: clinical director chief medical officer tribal health director quality assurance director chief financial officer inventory/supply director chief dentist chief optometrist chief medical records supv maintenance/housekeeping director lab/x-ray supv. EMS
Note: These may not be exact titles & they may all not be official Supervisory positions, but organizationally they appear to be.
Tahola PHS IHC
IRS Database: total staff = 25 with 5 supervisors
Telephone interview: Tahola Health Center is now Tribally operated - NO IHS employees
29

THIS PAGE LEFT INTENTIONALLY BLANK
30
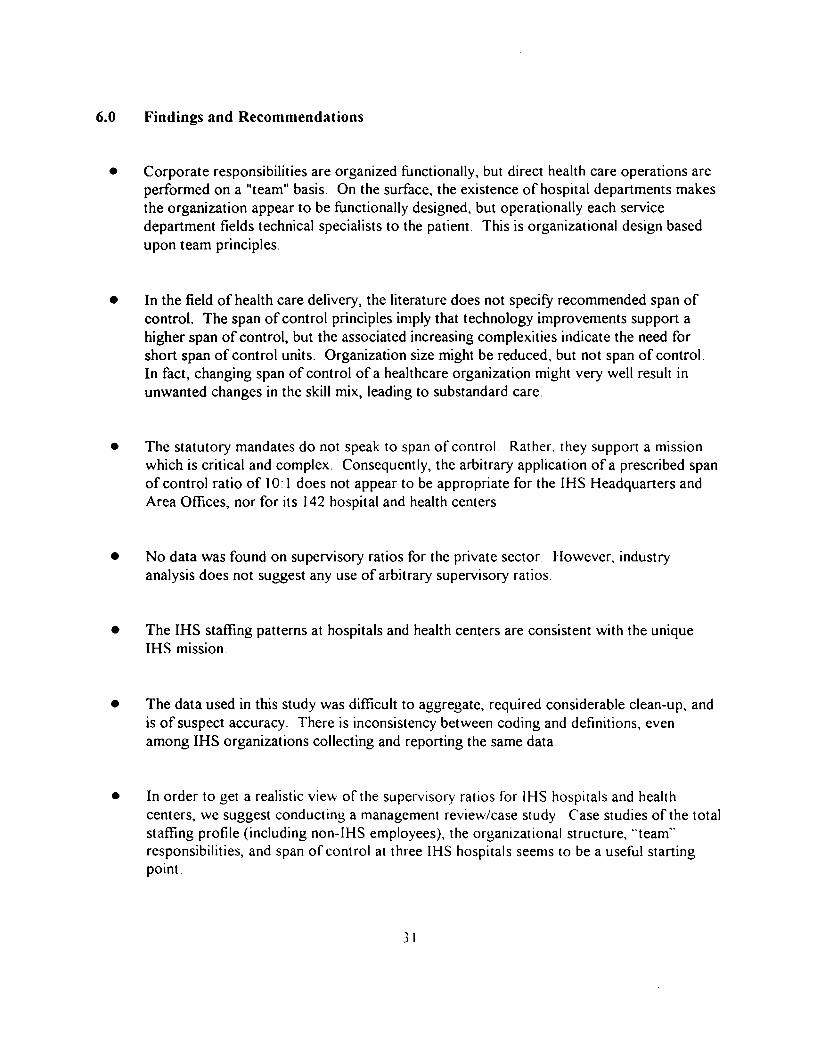
6.0 Findings and Recommendations
• Corporate responsibilities are organized functionally, but direct health care operations are performed on a "team" basis. On the surface, the existence of hospital departments makes the organization appear to be functionally designed, but operationally each service department fields technical specialists to the patient This is organizational design based upon team principles.
• In the field of health care delivery, the literature does not specify recommended span of control. The span of control principles imply that technology improvements support a higher span of control, but the associated increasing complexities indicate the need for short span of control units. Organization size might be reduced, but not span of control. In fact, changing span of control of a healthcare organization might very well result in unwanted changes in the skill mix, leading to substandard care.
• The statutory mandates do not speak to span of control Rather, they support a mission which is critical and complex. Consequently, the arbitrary application of a prescribed span of control ratio of 10: I does not appear to be appropriate for the IHS Headquarters and Area Offices, nor for its 142 hospital and health centers
• No data was found on supervisory ratios for the private sector However, industry analysis does not suggest any use of arbitrary supervisory ratios.
• The IHS staffing patterns at hospitals and health centers are consistent with the unique IHS mission.
• The data used in this study was difficult to aggregate, required considerable clean-up, and is of suspect accuracy. There is inconsistency between coding and definitions, even among IHS organizations collecting and reporting the same data
• In order to get a realistic view of the supervisory ratios for IHS hospitals and health centers, we suggest conducting a management review/case study Case studies of the total staffing profile (including non-IHS employees), the organizational structure, "team" responsibilities, and span of control at three IHS hospitals seems to be a useful starting point.
31

• A round-table conference on organization issues for health care delivery facilities may prove beneficial to the IHS argument. The conference could include representatives of the Department of Health and Human Services, tribal health representatives, the Veterans Administration, the Department of Defense, the American Hospital Association, the American Medical Association, the American Nursing Association, private (GHOIHMO) providers, State and local government, and financial analysts from major accounting firms
• Furthermore, this study suggests the need for an IHS health facility profile database. The illS plan for the "IRM System of the Future" is some time away. We recommend the immediate design and implementation of a facility profile database with information on locations, organizations, FTEs, budget, program descriptions, workload measures, contracting/compacting data, CHS/fiscal intermediary data, etc. to support IHS Headquarters management and analysis needs.

APPENDIX A
ANALYSIS DATA TABLES
A-I

THIS PAGE LEFT INTENTIONALLY BLANK
A-2
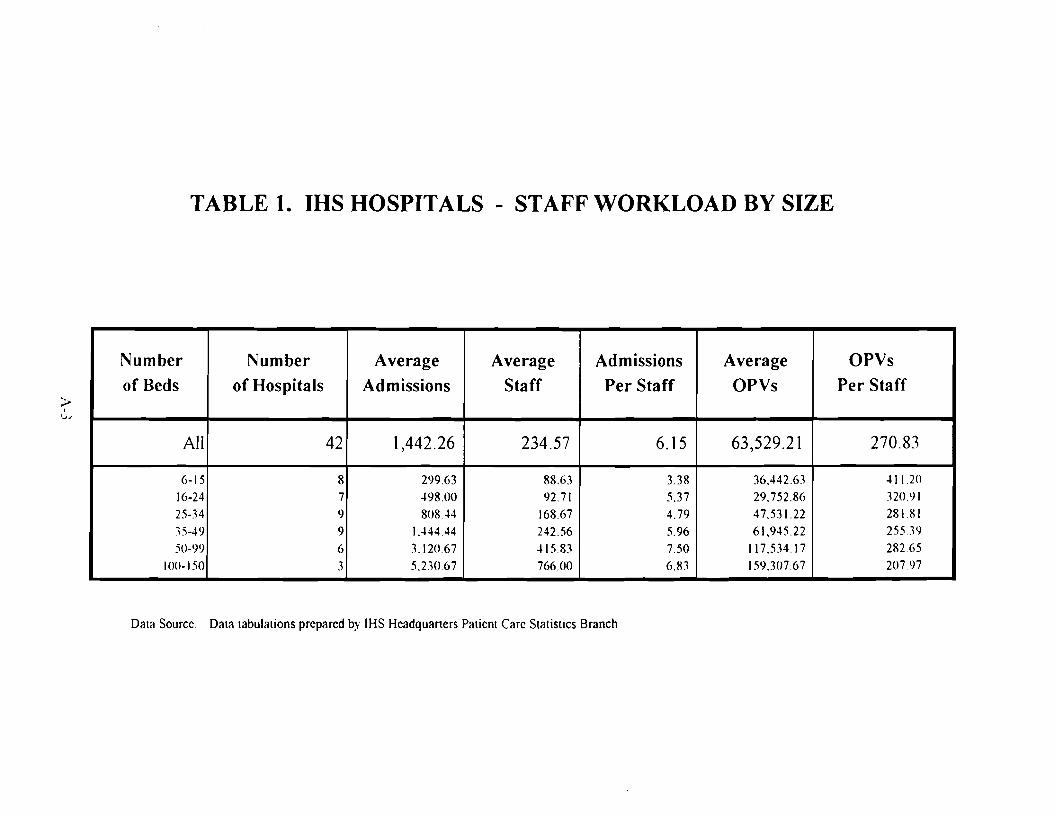
TABLE 1. IHS HOSPITALS - STAFF WORKLOAD BY SIZE
Number
of Beds
All
6-15
16-24 25-34
15-49 50-99
100-150
Number
of Hospitals ~ , '~J
42
8 7 <)
9
6
3
Average
Admissions
Average
Staff
Admissions
Per Staff
Average
OPVs
OPVs
Per Staff
1,442.26 234.57 6.15 63,529.21 270.83
299.63 .l98.00
808.44 1.444.44
3.120.67 5.2.10.67
88.63 92.71
168.67
242.56 .l 15.83
766.00
3.38
5.37 4.79
5.96 7.50
6.83
36.442.63 29.752.86 47.531.22 61,945.22
117.53417
159.307.67
.l I 1.20 320.91
28181 255.19
282.65 20797
Data Source Data tabulations prepared by IHS Headquarters Patient Care Statistics Branch
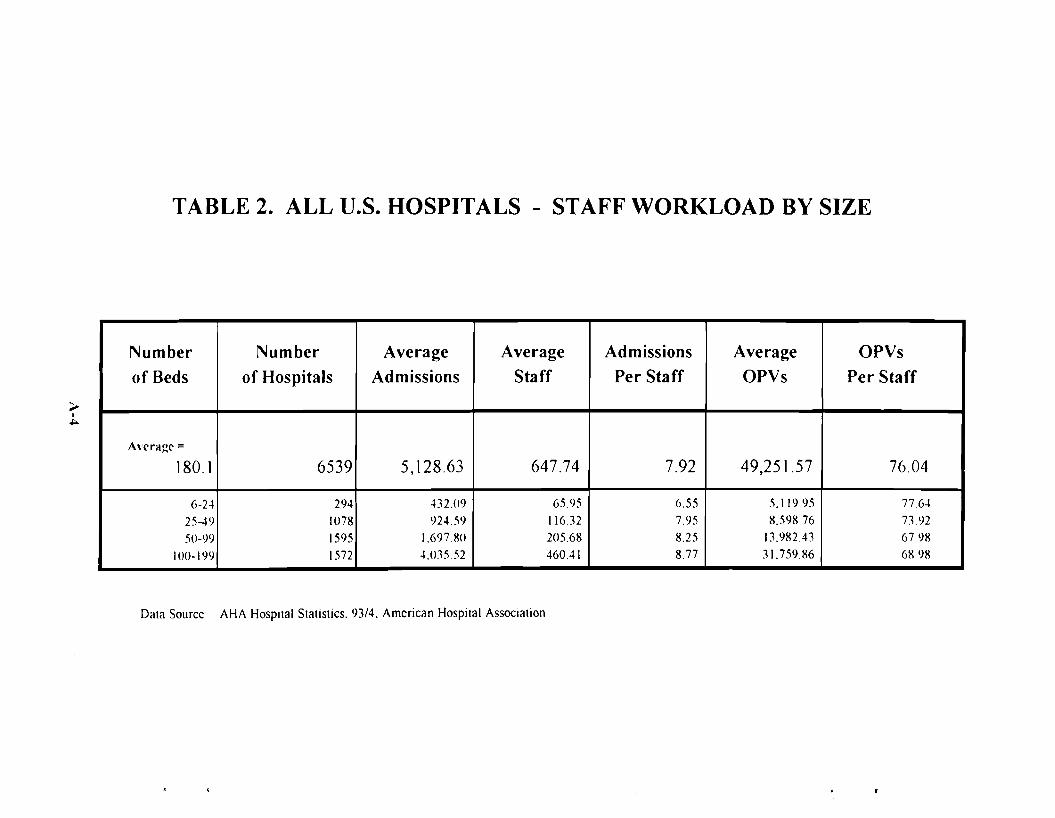
I
TABLE 2. ALL U.S. HOSPITALS - STAFF WORKLOAD BY SIZE
~
~
Number Number Average Average Admissions Average OPVs
of Beds of Hospitals Admissions Staff Per Staff OPVs Per Staff
Average = 180.1 6539 5,128.63 647.74 7.92 49,251.57 76.04
6-24 294 43209 65.95 6.55 5.119.95 7764
25-49 1078 924.59 11632 7.95 8.598.76 73.92
50-99 1595 1.69780 205.68 8.25 13.982.43 67.98
100-199 1572 4.035.52 460.41 8.77 31.759.86 68.98
Data Source AHA Hospital Statistics. 93/4. American Hospital ASSOCiation

TABLE 3. COMMUNITY HOSPITALS - STAFF WORKLOAD BY SIZE
>I
U1
Number Number Average Average Admissions Average OPVs
of Beds of Hospitals Admissions Staff Per Staff OPVs Per Staff
Avcragc =
174.03 5292 5,864.24 684.02 8.57 48,706.17 71.21
6-24 2.10 .199.31 54.56 7..12 6.544.63 11996
25-49 <)00 941.08 108.90 8.64 10,299.41 94.57
50-99 1210 1.929.32 214.23 9.0 I 18,431.38 86.03
100-199 1.121 4.424.34 476.94 9.28 37.794.48 79.24
DClta Source AHA HospilClI SICltlsliCS. 9.\14. American Hospital Association
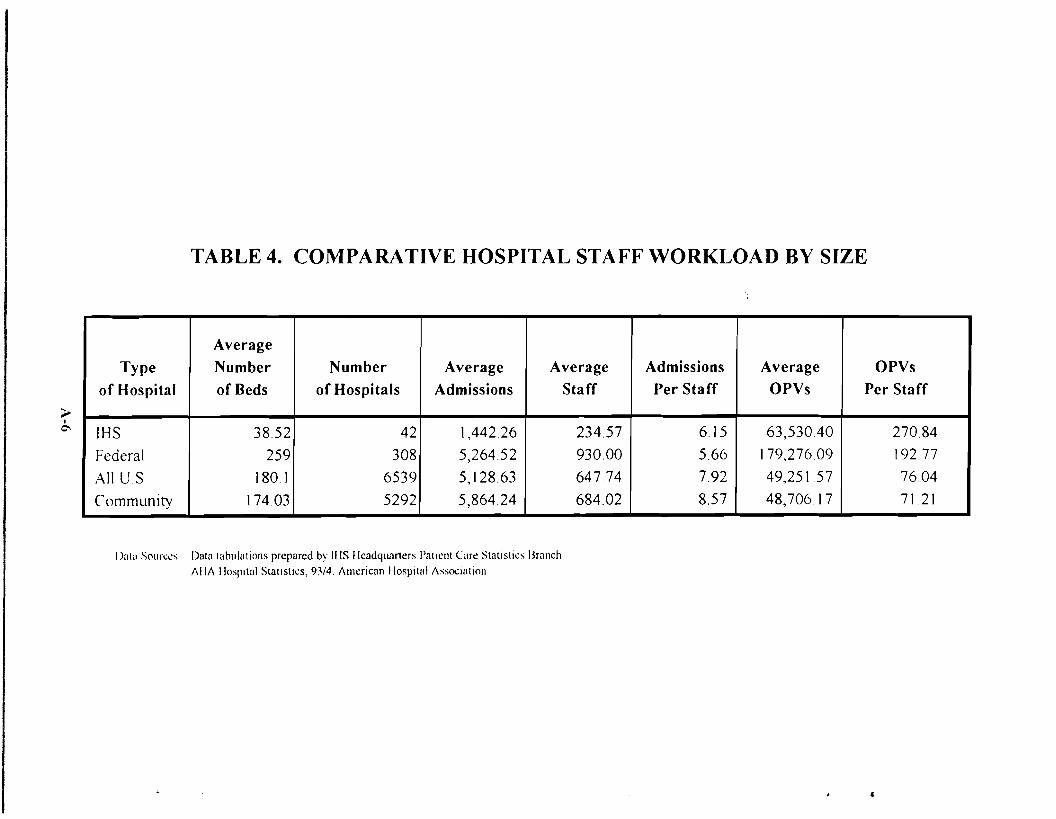
TABLE 4. COMPARATIVE HOSPITAL STAFF WORKLOAD BY SIZE
~ I
0-,
Average Type Number Number Average Average Admissions Average OPVs
of Hospital of Beds of Hospitals Admissions Staff Per Staff OPVs Per Staff
IHS 38.52 42 1,442.26 234.57 6.15 63,530.40 270.84
Federal 259 308 5,264.52 930.00 5.66 179,276.09 192.77
All US 180.1 6539 5,128.63 647.74 7.92 49,251.57 76.04
Community 174.03 5292 5,864.24 684.02 8.57 48,706.17 7121
I)ala Sources Data tahulatlons prepared by IllS Headqum1ers I'atll:nt Carc Statistics Branch AliA HospItal Statistics, 9V4. Amcrican IlospttalAssoclallOn
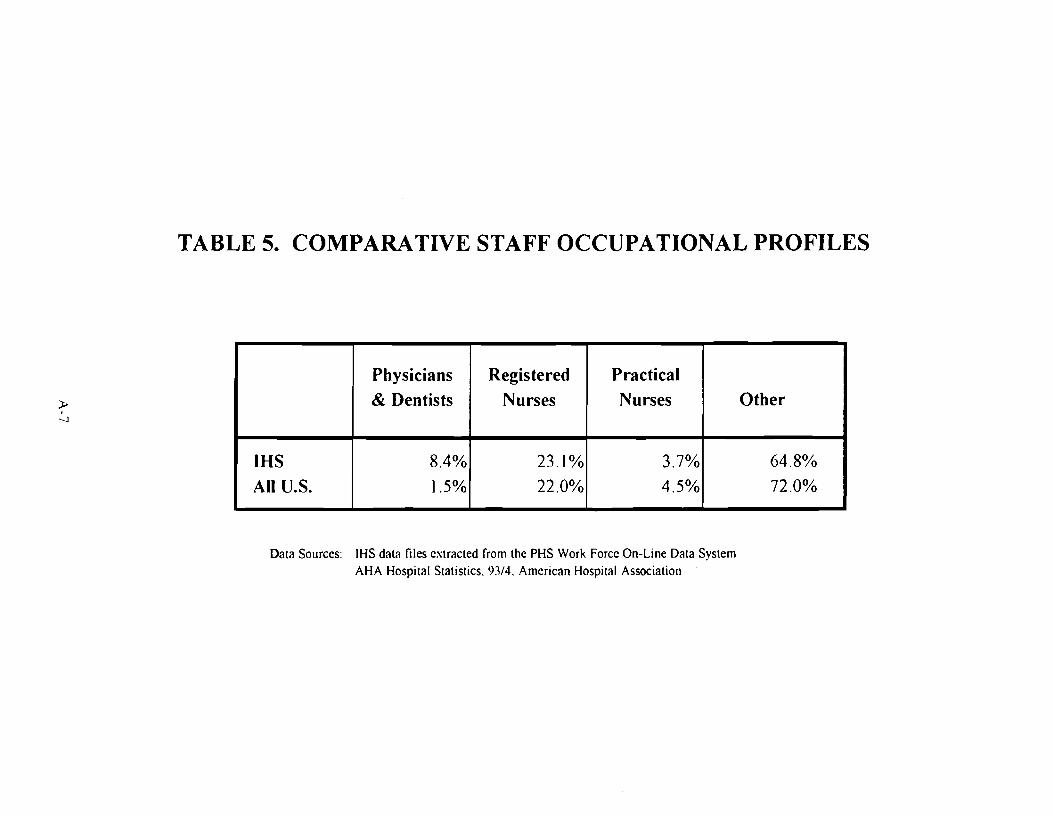
TABLE 5. COMPARATIVE STAFF OCCUPATIONAL PROFILES
;t. I
--.J
Physicians
& Dentists
Registered
Nurses
Practical
Nurses Other
IHS All U.S.
8.4%
1.5%
23.1%
22.0%
3.7%
4.5%
64.8%
72.0%
Data Sources: IHS data files extracted from the PHS Work Force On-Line Data System AHA Hospital Statistics. 93/4. American Hospital Association

TABLE 6. SUMMARY OF IUS FACILITIES AND STAFF
Number of Locations
Total Staff
16411
(%)
Paid Staff Volunteers
TOTAL IHS 240 100% 15803 608
HEADQUARTERS - EAST (AP94) I 438 3% 438 0
HEADQUARTERS - WEST I 179 1% 179 0
HEADQUARTERS-TUCSON I 123 1% 36 0
HEADQUARTERS - SUPPLY DEPOT I 48 0% 48 0
HEADQUARTERS - ABD,NAV,OKL,PHX,OTH 5 24 0% 24 ()
REGIONAL OFFICES - OES 3 68 0% 68 0
AREA OFFICES 12 2401 15% 2401 0
SERVICE UNITS 74 nla nla l1/a Ilia
HOSPITALS 42 10397 63% 9852 545
HEALTH CENTERS 65 1825 11% 1762 63
OTHER HEALTH FACILITIES 35 995 6% 995 ()
)., 00
I)ata Sources Stall' labulations prepared from PI IS Work Force On-Line Data System, as of 8/20/94 Faclllt\ counts from data tabulations prepared by n-ls Ileadquarters Patient Care Statistrcs Branch
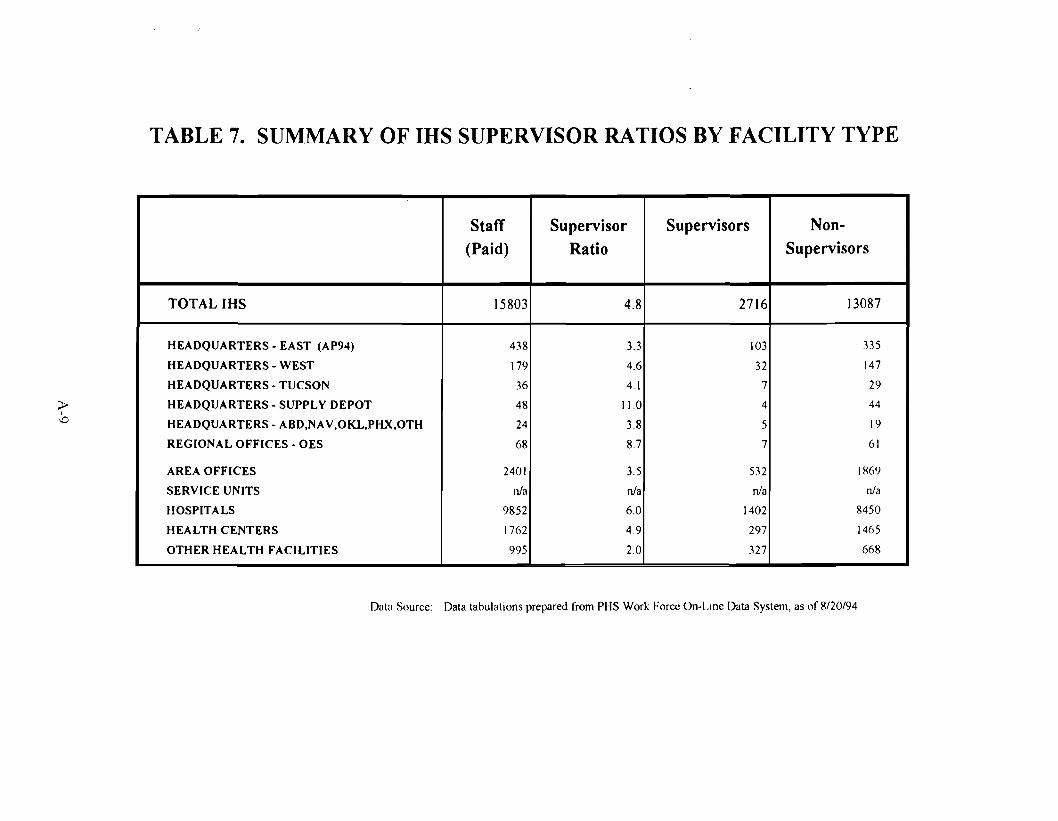
TABLE 7. SUMMARY OF IRS SUPERVISOR RATIOS BY FACILITY TYPE
Staff (Paid)
15803
Supervisor Ratio
Supervisors Non-Supervisors
TOTALIHS 4.8 2716 13087
HEADQUARTERS - EAST (AP94) 438 3.3 103 335
HEADQUARTERS - WEST 179 4.6 32 147
HEADQUARTERS-TUCSON 36 4.1 7 29
HEADQUARTERS - SUPPLY DEPOT 48 11.0 4 44
HEADQUARTERS - ABD,NAV,OKL,PHX,OTH 24 3.8 5 19
REGIONAL OFFICES - OES 68 8.7 7 61
AREA OFFICES 2401 3.5 532 IH69
SERVICE UNITS nJa nJa nJa nJa
HOSPITALS 9852 6.0 1402 8450
HEALTH CENTERS 1762 49 297 1465
OTHER HEALTH FACILITIES 995 2.0 327 668
;:t> I
-.0
Data Source Data tabulations prepared from PHS Work Force On-Lme Data System, as of 8/20/94
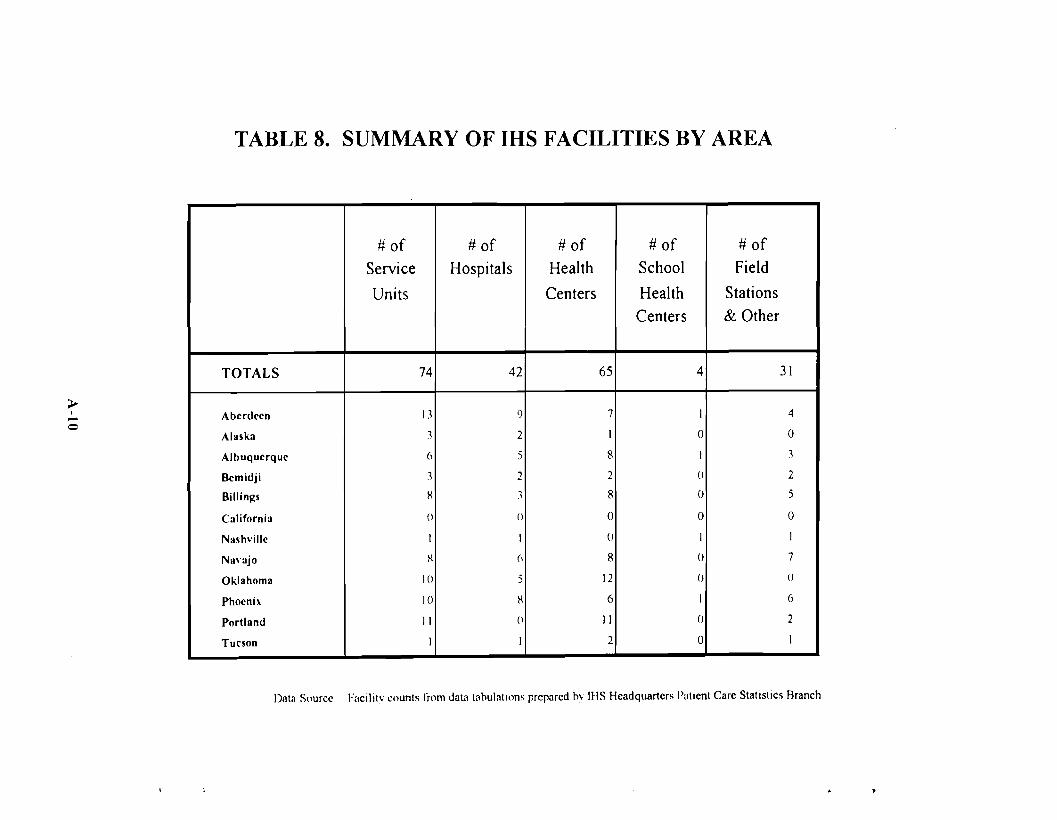
TABLE 8. SUMMARY OF IRS FACILITIES BY AREA
# of Service
Units
74
# of Hospitals
# of Health
Centers
65
# of School
Health Centers
4TOTALS 42
Aberdeen I J 'J 7 I
Alaska J 2 I 0
Albuquerque 6 5 8 I
Bemidji .1 2 2 0
Billings H J 8 0
C:llifornia (l () 0 0
Nashville I I (J I
N:I\':Ijo H (, 8 0
Oklahoma 10 5 12 ()
Phoenix 10 H 6 I
Portland II () 11 0
Tucson 1 I 2 0
# of Field
Stations & Other
31
-~ I 4 o
0
J
2
5
0
J
7
()
6
2
I
Data Source Fllcilitv counts from daUltabulatllms prepared bv IHS Headquarters Patient Care Statistics Aranch
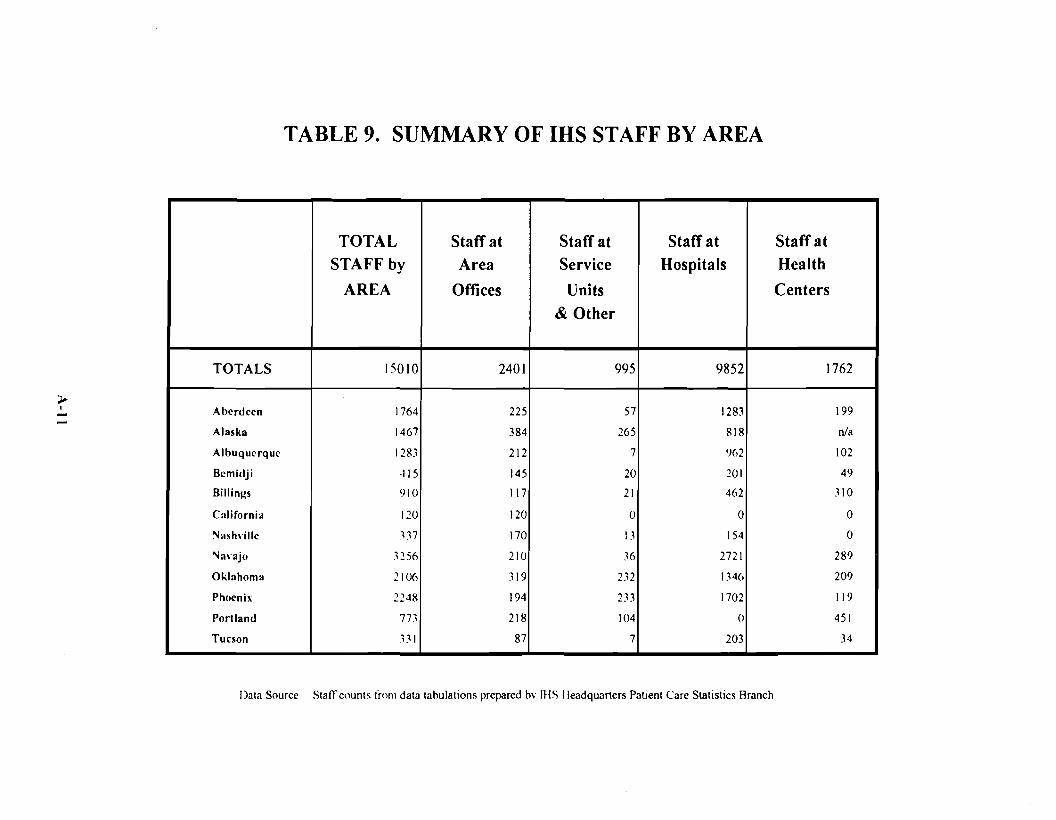
TABLE 9. SUMMARY OF IHS STAFF BY AREA
-~ I
TOTAL
STAFF by
AREA
Staff at
Area
Offices
2401
Staff at
Service
Units
& Other
Staff at
Hospitals
Staff at
Health
Centers
TOTALS 15010 995 9852 1762
Aberdeen 1764 225 57 1283 199
Alaska 1467 384 265 818 nla
Albuquerque 1283 212 7 ')62 102
Bemidji ~15 145 20 201 49
Billings ')10 117 21 462 310
California 120 120 0 0 0
Nash\'ille ~"17 170 13 154 0
Na\"ajo ~256 210 36 2721 289
Oklahoma 210(, 319 2"~2 1346 209
PhO<'nix 2248 194 233 1702 119
Portland 773 218 104 0 451
Tucson 331 87 7 203 34
Data Source StafT counts frol11 data tahulations prepared hv IllS Ileadquarters PatIent Care Statistics Branch

I
TABLE 10. SUMMARY OF IRS WORKLOAD
~
N
ADMISSIONS (%) OPVs (%) PCPVs (%)
TOTALS 60,575 100% 4,079,655 100% 2,699,657 100%
HOSPITALS 60,575 100% 2.66X.277 65% 1,883.600 70%
HEALTH CENTERS -- 1.270.826 31% 708,172 26%
OTHER HEALTH -_. '·W.552 3% 107,885 4%
FACILITIES
Dala Source Data tabulations prepared by IHS Headquaners Patient Care Statistics Branch

TABLE 11. SUMMARY OF IRS ADMISSIONS BY AREA
>I-(;.l
ADMISSIONS (%)
TOTALS 60,575 100%
Aberdeen 6,984 12%
Alllsl<a 5.559 9%
Albuquerque 4,525 7%
Bemid.ii 1.140 2%
Billings 3.060 5~/o
California 0 0%
Nash"ille 864 1%
Na\'ll.i0 18.794 3I 'v"
Oklahoma 9.691 16%
Phoenix 9.407 16'Yo
Portlllnd 0 0°1.,
Tucson 551 1%
Data Source D:Jt:J I:Jbulations prcp:Jred by 1HS HC:Jdquarters Patient Care Statistics Branch
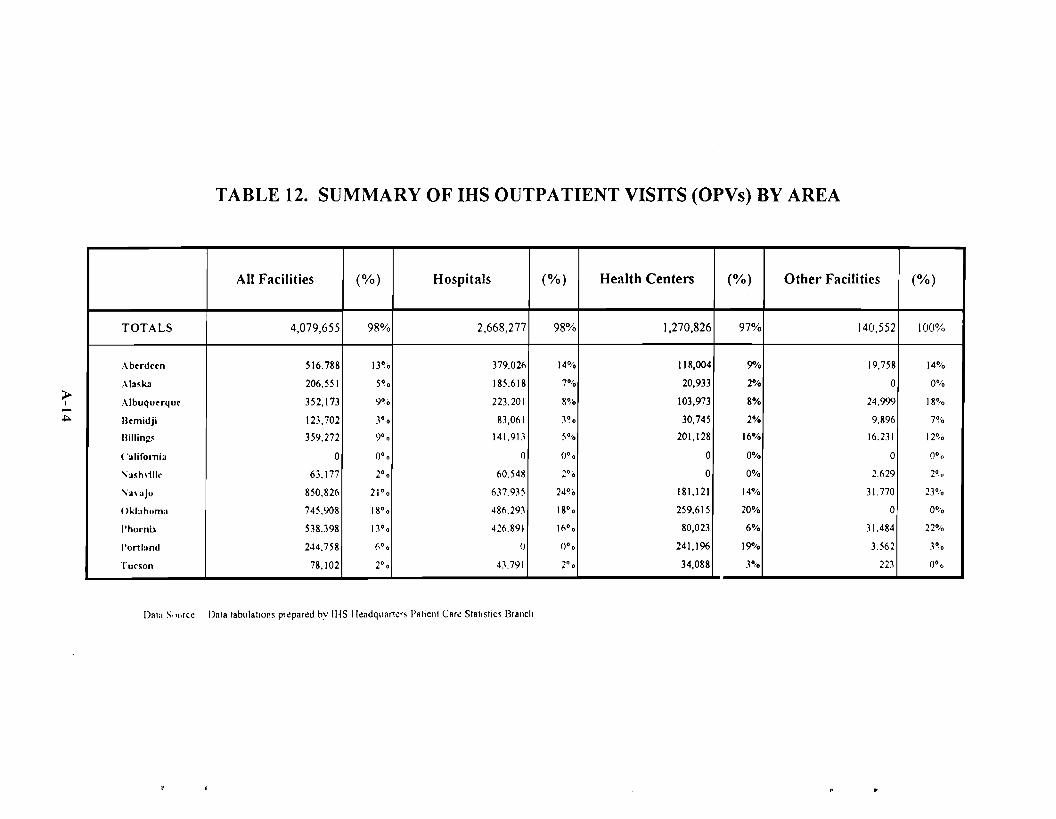
I
TABLE 12. SUMMARY OF IHS OUTPATIENT VISITS (OPVs) BY AREA
~
~
All Facilities (%) Hospitals (%) Health Centers (%) Other Facilities (%)
TOTALS 4,079,655 98% 2,668,277 98% 1,270,826 97% 140,552 100%
Aberdeen 516.788 13~0 379.02(, 14% 118,004 9% 19,758 14%
Ala~1uI 206.551 5° ° 185.618 7°10 20,933 2% 0 0%
Albuquerque 352,173 9°'0 223.201 8% 103,973 8% 24.999 18°/0
Bemidji 123,702 3° ° 83,061 3°0 30,745 2% 9.896 7~/O
Billing~ 359,272 9°0 141.913 5~/O 201,128 16% 16.231 12~0
( 'alifornia 0 0°0 0 (J°'O 0 0% 0 0°0
" a~h\ill,' 63.177 2°0 60.548 2% 0 0% 2.629 2°,0
\;an,jo 850,826 21 °° 637.935 24% 181,121 14% 31.770 23%
()lJahllma 745.908 18°0 48(,.291 18° ° 259,615 20% 0 0%
I'hocnh 538.398 1.1° ° 426.89\ )(,°0 80,023 6% 31.484 22%
I'ortland 244.758 6°0 (J (J°o 241,196 19% 3.562 30,0
Tucson 78,102 2°0 43.791 2° ° 34,088 3°;0 223 0°'0
Dala S,,"rc~ Data lablllal1ol1~ pr~pared bv IHS II~adquart~r~ Pallenl Car~ Slall~lics Branch
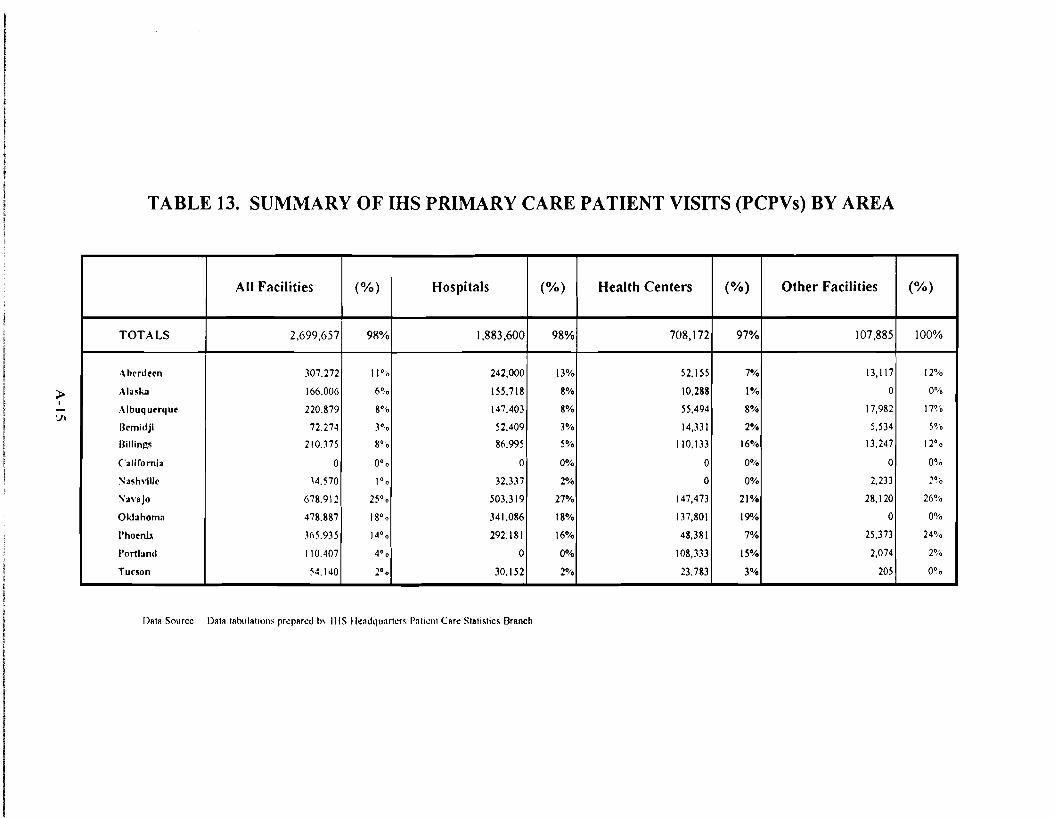
I
TABLE 13. SUMMARY OF IHS PRIMARY CARE PATIENT VISITS (PCPVs) BY AREA
~
'Jl
All Facilities (%) Hospitals (%) Health Centers (%) Other Facilities (%)
TOTALS 2,699,657 98% 1,883,600 98% 708,172 97% 107,885 100%
Abenlern 307.272 11°'0 242,000 13% 52,155 7% 13,1\7 12%
Alask2 166.006 6% 155.718 8% 10,288 1% 0 0%
Albuquerque 220.879 8°'0 147,403 8% 55,494 8% 17,982 17%
Bemidji 72.274 3°0 52.409 3% 14,331 2% 5,534 S°,.0
Billings 210.375 8°'0 86.995 5% 110.133 16% 13.247 12° °
California 0 0°0 0 0% 0 0% 0 0%
:'Iiash\ille ~4.570 1°o 32.337 2% 0 0% 2,233 2%
:"a\'ajo 678.912 25°0 503.319 27% 147,473 21% 28,120 26%
Oklahoma 478.887 18° ° 341.086 18% 137,801 19"10 0 0%
I'hoenb ](,5.935 14° ° 292.181 \6% 48,381 7% 25,373 24%
Portland I 10.407 4°. 0 0% 108,333 15% 2,074 2°'.0
Tucson 54.140 2°0 30.152 2% 23.783 3% 205 0%
I)"," Source Data tahula'iom Jlr~JlRr~d h\ IHS IkndC]unrt~r~ Jln'I~1\1 CRr~ Statis'ics Branch
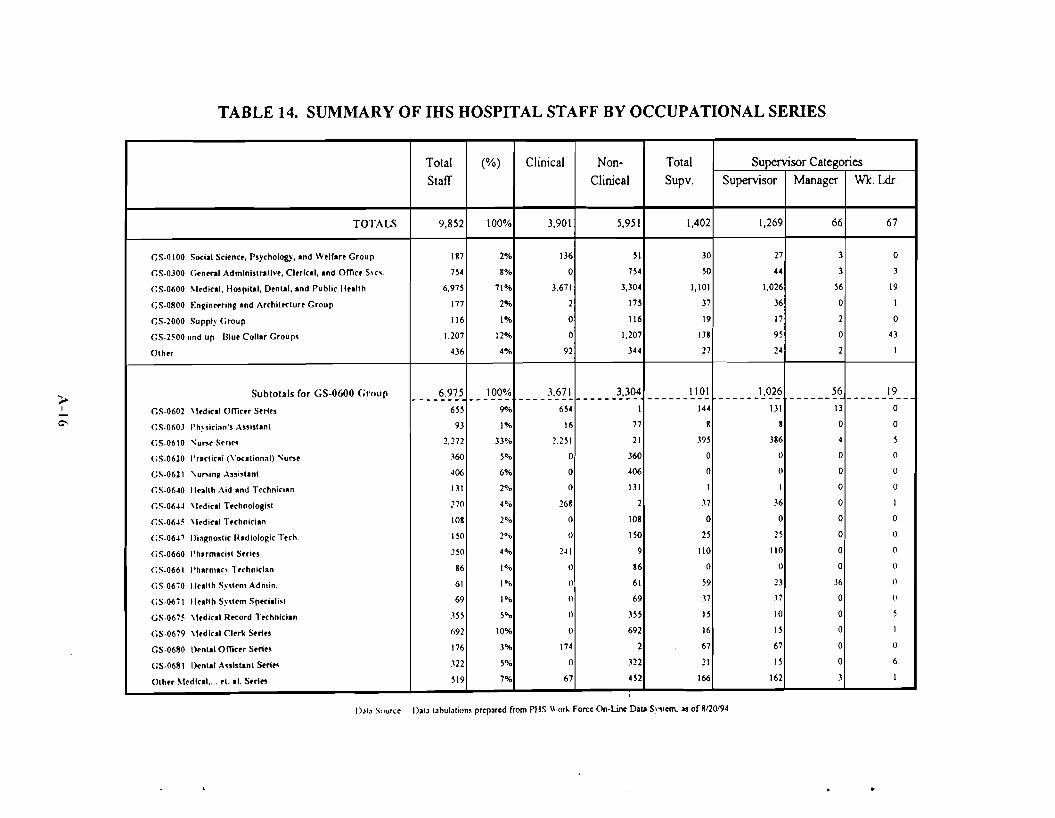
TABLE 14. SUMMARY OF IHS HOSPITAL STAFF BY OCCUPATIONAL SERIES
> I
C'
Total (%) Clinical Non- Total Supervisor Categories Staff Clinical Supv. Supervisor Manager Wk. Ldr.
TOTALS 9.852 100% 3,901 5,951 1,402 1,269 66 67
GS-OIOO Social Science, P,ychology, ond We,rA" Group 187 2% 136 ~I 30 27 3 0
GS-0300 ('..,nerol Admlni,lro!lve, Cltrlcol, ond omce Svr\. 7~4 8% 0 7S4 ~O 44 3 3
<:S·0600 "edieol, Ho,pilol, Denlol, ond Public lIullh 6,97~ 71% 3,671 3,304 1,101 1,026 56 19
GS·0800 Engin..ring ond Archiltelu" Group 177 2% 2 17S 37 36 0 I
GS·2000 Supply Group 116 1% 0 116 19 17 2 0
GS·2~00 lind up I3lue Collar Group, 1.207 12% 0 1,207 U8 95 0 43
Olhtr 436 4% 92 344 27 24 2 I
Subtotals (or GS-0600 Group ____ ~,~~5 100% :'.671 -----}-'~~ 1101 ______ 1.:~2!i 56 19 ----- ------- -------- ------ --------
GS·0602 \Iedieo' omc.. S..ln 6~~ 9"A> 6~4 1 144 131 13 0
(;S·0603 I'h"ic;.n', A"i'lOnl 93 1% 16 77 8 8 0 0
GS·0610 \;ur.. Srri.. 2,272 33% 2.2~ I 21 39~ 386 4 5
(;S·0620 I'rlclicAI (\'ocolion.l) I"u"e .~60 So~ 0 360 0 0 0 0
GS·0621 \;u"in~ A"i,llnl 406 6% 0 406 0 0 0 U
GS·0640 I1..llh Aid And Technician 131 2% 0 131 I J 0 0
GS·0644 \Icdieol Technoiogisl 270 4°10 268 2 .n .16 0 1
GS·064~ \lcdico' TechniciAn 108 2% 0 108 0 0 0 0
<:S·0647 lli.gno,lic Rodlologic Tteh. 150 2°-0 0 150 25 25 0 0
<:S·0660 Pharmocisl S..in 250 4°..-0 241 9 110 110 0 0
<:S·0661 I'horn,oc' TtehniciAn 86 1°-'0 0 86 0 0 0 0
GS·0670 licollh Sy,lcm Admin. 61 I ~'O 0 61 59 23 36 0
<:S·0671 II..Ilh Sy·,lcm Spteioli\' 69 1oil 0 69 .n .17 0 0
GS·067~ \ledieol Rteord Technlcion .155 50.. 0 35S J5 10 0 5
GS·0679 \ledlcol CI..k Sort.. 692 10% 0 692 16 15 0 I
GS·0680 Ilenlol omc.. Sert.. 176 3% 174 2 67 67 0 0
GS·0681 I>cnlol Asslslonl Sort... .'22 5% 0 322 21 15 0 6
Olh.. ~Icdlcol,... el. 01. 5..1.. 519 7% 67 452 166 162 3 1
DOl. Sou.-. D.,. ,"hul.,iom prep.red from PHS Work Force On-Line 0.10 S"Slcm. os of 8/20194
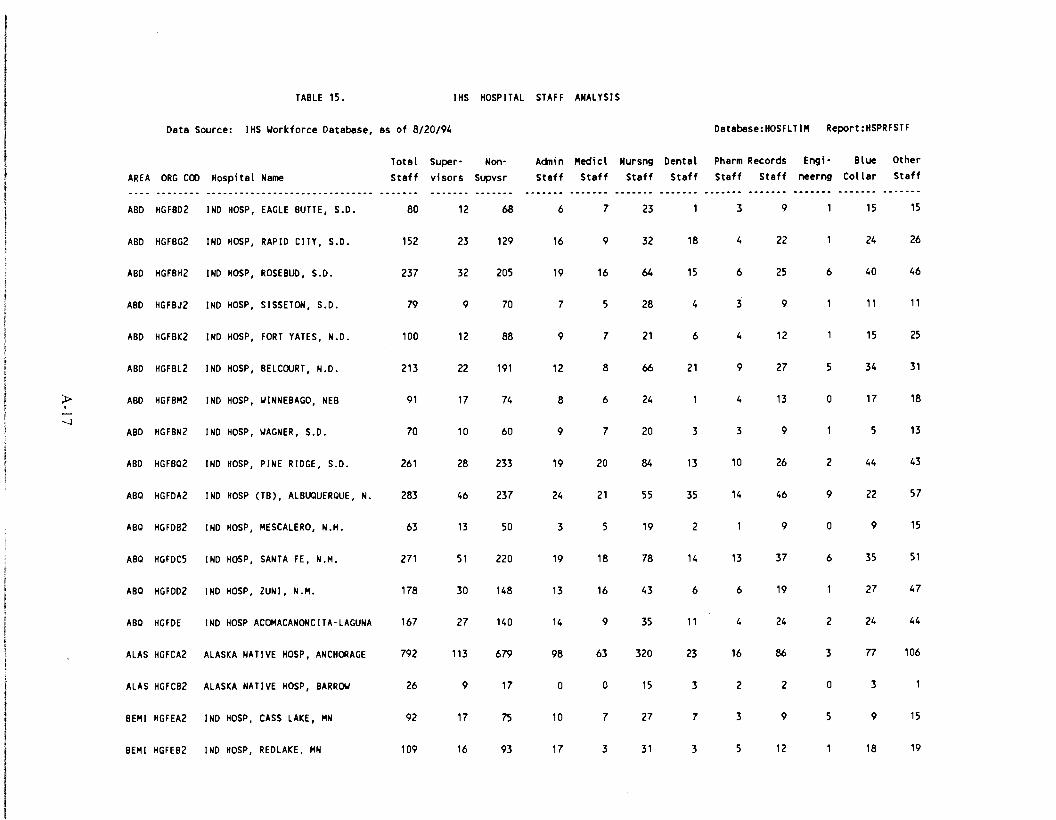
TABLE 15. IHS HOSPITAL STAFF ANALYSIS
Data Source: IHS ~orkforce Database, as of 8/20/94 Database:HOSFLTIM Report:HSPRFSTF
AREA ORG COO Hospi tal Name Totel Steff
Supervisors
NonSupvsr
Adnin Staff
Medici Staff
Nursng Steff
Dental Staff
Pharm Records Staff Staff
Engineerng
Blue Collar
Other Steff
ABO HGFB02 INo HOSP, EAGLE BUTTE, S.D. 80 12 68 6 7 23 3 9 15 15
ABO HGFBG2 INo HOSP, RAPID CITY, S.D. 152 23 129 16 9 32 18 4 22 24 26
ABO HGFBH2 INo HOSP, ROSEBUD, S.D. 237 32 205 19 16 64 15 6 25 6 40 46
ABO HGFBJ2 INo HOSP, SISSETON, S.D. 79 9 70 7 5 28 4 3 9 11 11
ABO HGFBK2 INo HOSP, FORT YATES, N.D. 100 12 88 9 7 21 6 4 12 15 25
ABO HGFBL2 INo HOSP, BELCOURT, N.D. 213 22 191 12 8 66 21 9 27 5 34 31
;p I
--.J
ABO
ABO
HGFBM2
HGFBN2
tND
tNo
HOSP,
HOSP,
~INNEBAGO, NEB
~AGNER, S.D.
91
70
17
10
74
60
8
9
6
7
24
20 3
4
3
13
9
o 17
5
18
13
ABO HGFBQ2 INo HOSP, PINE RIDGE, S.D. 261 28 233 19 20 84 13 10 26 2 44 43
ABQ HGFoA2 INo HOSP (TB), ALBUQUERQUE, N. 283 46 237 24 21 55 35 14 46 9 22 57
ABQ HGFoB2 tNo HOSP, MESCALERO, N.M. 63 13 50 3 5 19 2 9 o 9 15
ABQ HGfoC5 tNo HOSP, SANTA FE, N.M. 271 51 220 19 18 78 14 13 37 6 35 51
ABQ HGFo02 INo HOSP, ZUNI, N.M. 178 30 148 13 16 43 6 6 19 27 47
ABQ HGFoE tND HOSP ACOMACANONCITA-LAGUNA 167 27 140 14 9 35 11 4 24 2 24 44
ALAS HGFCA2 ALASKA NATIVE HOSP, ANCHORAGE 792 113 679 98 63 320 23 16 86 3 n 106
ALAS HGFCB2 ALASKA NATIVE HOSP, BARR~ 26 9 17 o o 15 3 2 2 o 3
BEMI HGFEA2 INo HOSP, CASS LAKE, MN 92 17 75 10 7 27 7 3 9 5 9 15
BEMI HGFEB2 INo HOSP, REDLAKE, MN 109 16 93 17 3 31 3 5 12 18 19
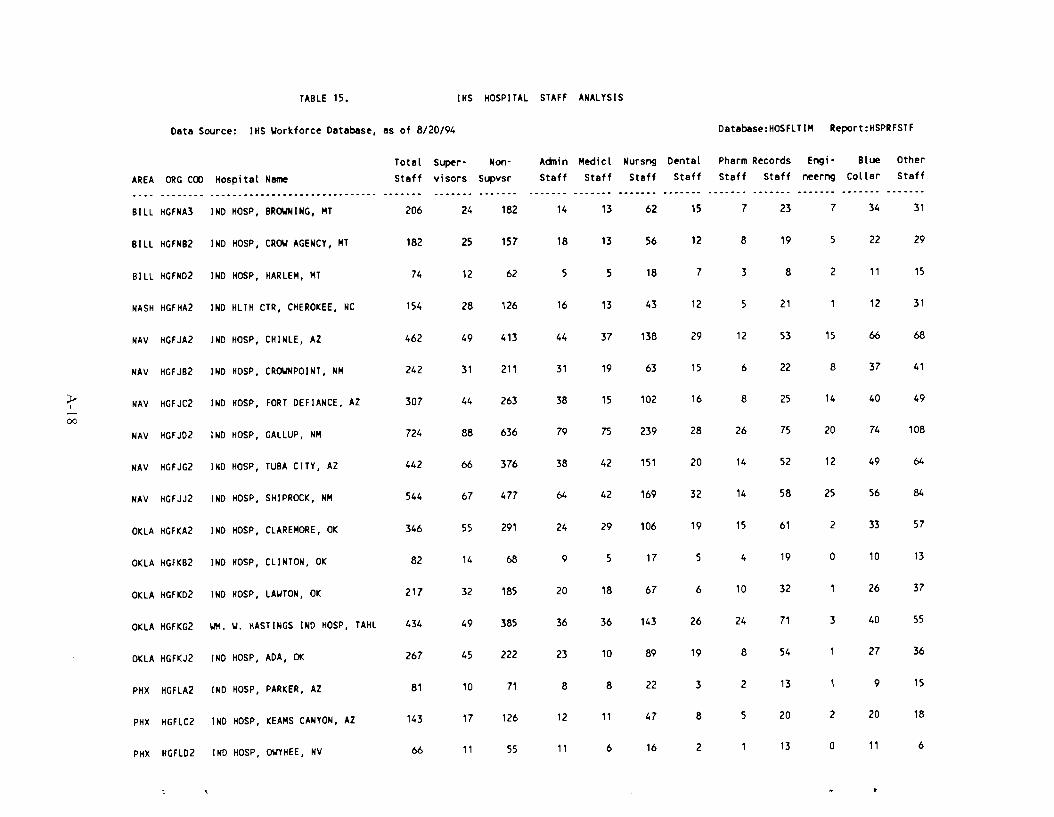
TABLE 15. IHS HOSPITAL STAFF ANALYSIS
Data Source: IHS ~orkforce Database, as of 8/20/94 Oatabase:HOSFLTIM Report:HSPRFSTF
AREA ORG COD Hospital Name
Total Staff
Supervisors
NonSupvsr
Acinin Staff
Medicl Staff
Nursng Staff
Dental Staff
Pharm Records Staff Staff
Engineerng
Blue Collar
Other Staff
BILL HGFNA3 INO HOSP, BR~NING, MT 206 24 182 14 13 62 15 7 23 7 34 31
BILL HGFNB2 INO HOSP, CR~ AGENCY, MT 182 25 157 18 13 56 12 8 19 5 22 29
BILL HGFN02 INO HOSP, HARLEM, MT 74 12 62 5 5 18 7 3 8 2 11 15
NASH HGFHA2 INO HLTH CTR, CHEROKEE, NC 154 28 126 16 13 43 12 5 21 12 31
NAV HGFJA2 IND HOSP, CHINLE, AZ 462 49 413 44 37 138 29 12 53 15 66 68
NAV HGFJB2 INO HOSP, CR~NPOINT, NM 242 31 211 31 19 63 15 6 22 8 37 41
;y I
00
NAV
NAV
HGFJC2
HGFJ02
IND
IND
HOSP,
HOSP,
FORT DEFIANCE,
GALLUP, NM
AZ 307
724
44
88
263
636
38
79
15
75
102
239
16
28
8
26
25
75
14
20
40
74
49
108
NAV HGFJG2 IND HOSP, TUBA CITY, AZ 442 66 376 38 42 151 20 14 52 12 49 64
NAV HGFJJ2 INO HOSP, SHIPROCK, NM 544 67 477 64 42 169 32 14 58 25 56 84
OKLA HGFKA2 INO HOSP, CLAREMORE, OK 346 55 291 24 29 106 19 15 61 2 33 57
OKLA HGFKB2 INO HOSP, CLINTON, OK 82 14 68 9 5 17 5 4 19 o 10 13
OKLA HGFK02 INO HOSP, LAWTON, OK 217 32 185 20 18 67 6 10 32 26 37
OKLA HGFKG2 WH. W. HASTINGS IND HOSP, TAHL 434 49 385 36 36 143 26 24 71 3 40 55
OKLA HGFKJ2 INO HOSP, ADA, OK 267 45 222 23 10 89 19 8 54 27 36
PHX HGFLA2 INO HOSP, PARKER, AZ 81 10 71 8 8 22 3 2 13 9 15
PHX
PHX
HGFLC2
HGFL02
INO
IND
HOSP,
HOSP,
KEAMS CANYON,
~YHEE, NV
AZ 143
66
17
11
126
55
12
11
11
6
47
16
8
2
5 20
13
2
o
20
11
18
6

TABLE 15. IHS HOSPITAL STAFF ANALYSIS
Data Source: IHS Workforce Database, as of 8/20/94 Oatabase:HOSFlTIM Report:HSPRFSTF
Total Super- Non- Adnin Medici Nursng Dental Pharm Records Engi Blue Other AREA ORGCOO Hospi ta I Name Staff visors Supvsr Staff Staff Staff Staff Staff Staff neerng Collar Staff
.................................................................................... _...
PHX HGFlG2 INO HOSP, SAN CARLOS, AZ 135 21 114 10 9 38 8 5 22 2 17 24
PHX HGFlJ4 INO HOSP, WHITERIVER, AZ 257 43 214 17 16 83 13 13 39 2 38 36
PHX HGFlK2 INO HOSP, YUMA, AZ 63 10 53 11 3 20 2 2 9 0 5 11
PHX HGFll2 INO HOSP, SACATON, AZ 175 26 149 12 10 45 15 8 28 2 24 31
PHX HGFlM2 PHOENIX INO MEO CTR, PHOENIX, 782 121 661 76 71 270 23 19 75 4 85 159
rue HGA77F6 INO HOSP, SEllS, AZ 203 27 176 14 15 49 13 7 25 3 32 45
>I- ...
-.D GRAND TOTALS: 9,852 1,402 8,450 933 748 3,038 534 336 1,233 177 1,207 1,646
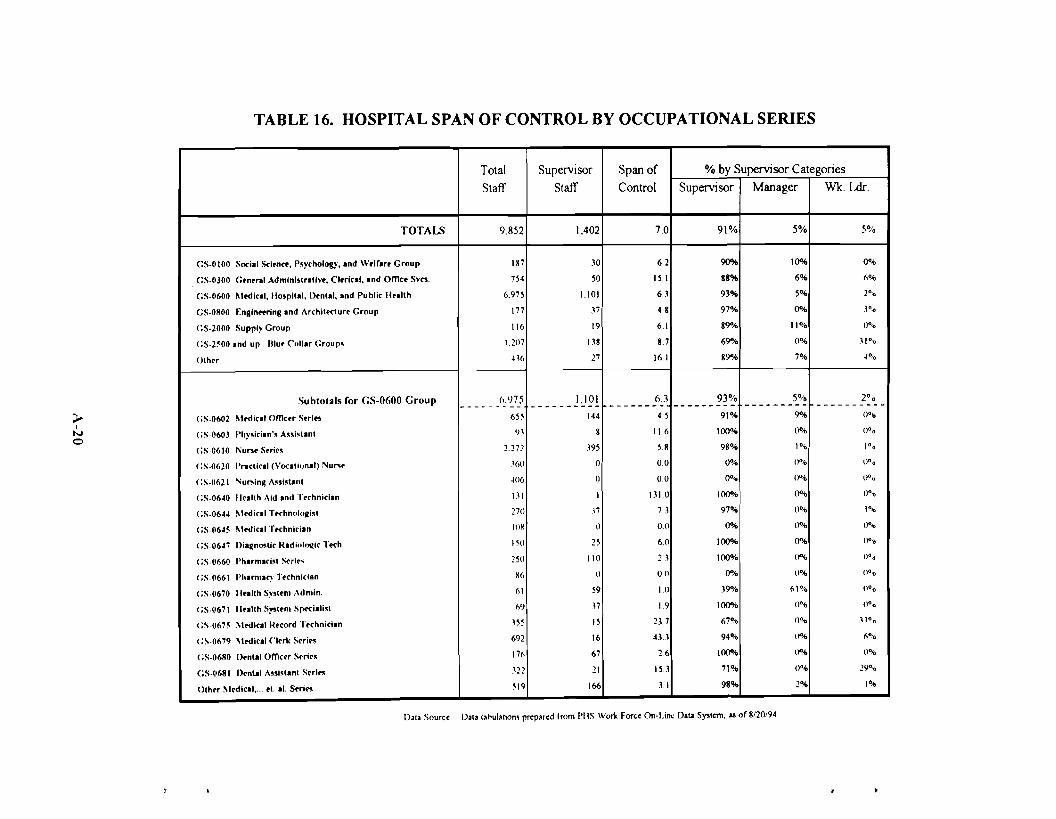
TABLE 16. HOSPITAL SPAN OF CONTROL BY OCCUPATIONAL SERIES
;l.I
N o
Total Staff
9.852
Supervisor Staff
Span of Control
% by Supervisor Categories
Supervisor Manager Wk. Ldr.
TOTALS 1,402 7.0 91% 5% 5%
GS·OIOO Socii I Sd.ne., P.~'Chology, Ind W.lflr. Group
GS·0300 Grn.rol Admlnl.lrotlv., Clrricll, Ind Orne. Svcs.
GS·0600 Mrdlcll, lIo.pllal, I).nlal, Ind Public H.. llh
GS·0800 F:nginnring Ind !\rehllrclur. Group
<:S·2000 Supply Group
(;S·2~00 Ind up Illu. Cflilar Group.
Olhrr
187
754
6.975
177
1\6
1.207
H6
30
50
1.101
.n 19
138
17
6.2
15.1
63
4.8
6.1
8.7
16.1
90%
88%
93%
97°...
89""
69""
89"...
100...
6%
s·... 0%
11%
0%
7%
00",
6°",
2°'0
y~o
UO/o
.'1°'0
.a°lo
Subtotals for GS-0600 Group
(;S·0602 Mrdical Orne.r S.rl••
(;S·0603 Phy.iclln'. A..isllnt
<:S·0610 ,.,u .... S.ri..
(;S·0620 Proeliell (VOClliunalj Nul'S.
(;S·0621 Nu..in~ " ..i.Unl
(;S·06~0 llrallh Aid Ind '!'.chniclln
(;S·06~~ ~t.dicil T.chnulu~i.1
<:S·06~~ ~trdicil T.chniciln
(;S·06~7 Ilia~n"'lir I{ldiulflllir Trch.
<:S·0660 Pharmlcl.l Srrir.
(;S·0661 Pharn,"c)' '!'.chnidan
<:S.0670 11.lllh Sy.l.n, Adn.ln.
(; S·0671 11.lllh S)"l.m Sprcllli.t
(;S.0675 Mrdlrall{.cord '!'.chniclln
(:S·0679 Mrdicll ('I.rk S.rl••
(;S·0680 I).nlal omc.r Srri",
GS.0681 l).nUI " ..I.lant S.rl..
Olhrr M.dicll,." .1. II. S.ri..
(>.<)75--------
655
').1
2.272
.1(,0
~06
1.11
270
1O~
I SO
150
~6
(,)
69
155
692
176
.121
519
1,101---------144
8
.195
0
0
1
,17
0
15
1\0
0
59
,17
IS
16
67
11
166
6.3------- 4.5
11.6
5.8
0.0
00
131.0
73
0.0
6.0
13
00
I.()
1.9
23 7
43.1
26
153
31
93% --------91%
100%
98%
OOA>
0%
1000.,
97%
00.,
100%
100%
00.,
39"10
100%
67%
94%
100%
71%
98%
5% --------9"...
0%
1%
0°.-0
0°.,
0°"
0·"
0%
00"
0%
0°"
61%
()O;,
()OIQ
0%
0%
0°;'
1%
20 0 ---------
0°"
()O'o
1°o
noo
0°0
0°'0
1°"
0°'1)
()O/O
flOo
()O,o
(1°'0
0°'0
-' '°0 6°"0
lJo~
:!YO'o
1°",
Dala Sourer Dala I.hulalion, prrpared from PI IS WoO< Fore. (m·Line ()I~ Syol<m, .. of 8/20194
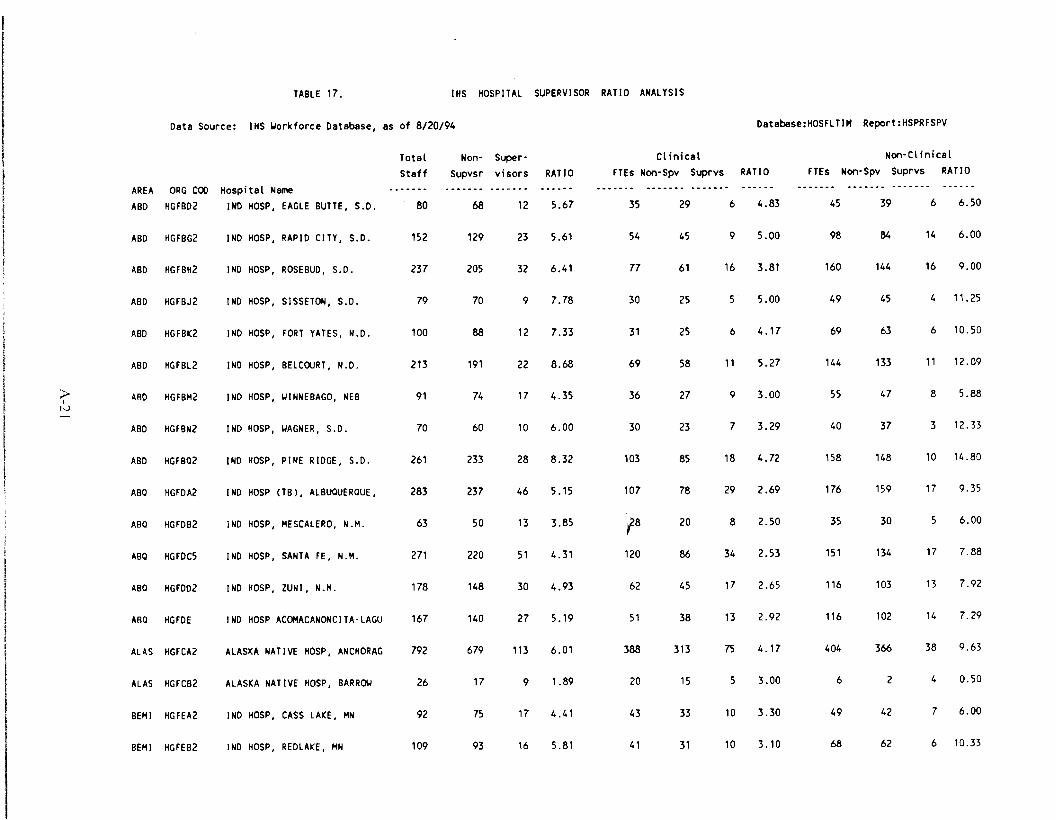
TABLE 17. IHS HOSPITAL SUPERVISOR RATIO ANALYSIS
Data Source: IHS ~orktorce Database, as ot 8/20/94 Oatabase:HOSFLTIM Report:HSPRFSPV
AREA
ABO
ORG COD HGFB02
Hospital Name INO HOSP, EAGLE BUTTE, S.D.
Total StaH
80
Non-Supvsr
68
Supervisors
12
RATIO
5.67
Clinical FTEs Non-Spv Suprvs
35 29 6
RATIO
4.83
Non-Clinical
FTEs Non-Spv Suprvs RATIO
45 39 6 6.50
ABO HGFBG2 INO HOSP, RAPID CITY, S.D. 152 129 23 5.61 54 45 9 5.00 98 84 14 6.00
ABO HGFBH2 INO HOSP, ROSEBUD, S.D. 237 205 32 6.41 77 61 16 3.81 160 144 16 9.00
ABO HGFBJ2 INO HOSP, SISSETON, S.D. 79 70 9 7.78 30 25 5 5.00 49 45 4 11.25
ABO HGFBK2 INO HOSP, FORT YATES, N.D. 100 88 12 7.33 31 25 6 4.17 69 63 6 10.50
ABO HGFBL2 INO HOSP, BELCOURT, N.D. 213 191 22 8.68 69 58 11 5.27 144 133 11 12.09
;... I
1-.) ABO
ABO
HGFBM2
HGFBN2
INO
INO
HOSP,
HOSP,
~INNEBAGO, NEB
~AGNER, S.D.
91
70
74
60
17
10
4.35
6.00
36
30
27
23
9
7
3.00
3.29
55
40
47
37
8
3
5.88
12.33
ABO HGFBQ2 INO HOSP, PINE RIDGE, S.D. 261 233 28 8.32 103 85 18 4.72 158 148 10 14.80
ABQ HGFOA2 INO HOSP (TB), ALBUQUERQUE, 283 237 46 5.15 107 78 29 2.69 176 159 17 9.35
ABQ
ABQ
HGFOB2
HGFOC5
INO
INO
HOSP,
HOSP,
MESCALERO, N.M.
SANTA FE, N.M.
63
271
50
220
13
51
3.85
4.31
'18
120
20
86
8
34
2.50
2.53
35
151
30
134
5
17
6.00
7.88
ABQ HGF002 INO HOSP, ZUNI, N.M. 178 148 30 4.93 62 45 17 2.65 116 103 13 7.92
ABQ HGFOE INO HOSP ACOMACANONCITA-LAGU 167 140 27 5.19 51 38 13 2.92 116 102 14 7.29
ALAS HGFCA2 ALASKA NATIVE HOSP, ANCHORAG 792 679 113 6.01 388 313 75 4.17 404 366 38 9.63
ALAS HGFCB2 ALASKA NATIVE HOSP, BARR~ 26 17 9 1.89 20 15 5 3.00 6 2 4 0.50
BEM I HGFEA2 INO HOSP, CASS LAKE, MN 92 75 17 4.41 43 33 10 3.30 49 42 7 6.00
BEM I HGFEB2 INO HOSP, REDLAKE, MN 109 93 16 5.81 41 31 10 3.10 68 62 6 10.33

TABLE 17. IHS HOSPITAL SUPERVISOR RATIO ANALYSIS
Data Source: IHS Workforce Database, as of 8/20/94 Oatabase:HOSFLTIH Report:HSPRFSPV
AREA BILL
ORG COD HGFNA3
Hospital Name INO HOSP, BROWNING, HT
Total Staff
206
Non-Supvsr
182
Supervisors
24
RATIO
7.58
CI inical FTEs Non-Spv Suprvs
7S 61 14
RATIO
4.36
Non-Cl inical FTEs Non-Spv Suprvs RATIO
131 121 10 12.10
BILL HGFNB2 INO HOSP, CROW AGENCY, HT 182 157 25 6.28 72 58 14 4.14 110 99 11 9.00
BILL HGFN02 INO HOSP, HARLEM, MT 74 62 12 5.17 29 23 6 3.83 45 39 6 6.50
NASH HGFHA2 INO HLTH CTR, CHEROKEE, NC 154 126 28 4.50 59 45 14 3.21 95 81 14 5.79
NAV HGFJA2 INO HOSP, CHINLE, AZ 462 413 49 8.43 183 155 28 5.54 279 258 21 12.29
NAV HGFJB2 INO HOSP, CROWNPOINT, NM 242 211 31 6.81 73 55 18 3.06 169 156 13 12.00
).>, l-J I-J
NAV
NAV
HGFJC2
HGFJ02
INO
INO
HOSP,
HOSP,
FORT DEFIANCE,
GALLUP, NM
AZ 307
724
263
636
44
88
5.98
7.23
116
283
85
225
31
58
2.74
3.88
191
441
178
411
13
30
13 .69
13.70
NAV HGFJG2 INO HOSP, TUBA CITY, AZ 442 376 66 5.70 185 148 37 4.00 257 228 29 7.86
NAV HGFJJ2 INO HOSP, SHIPROCK, NM 544 477 67 7.12 205 160 45 3.56 339 317 22 14.41
OKLA HGFKA2 INO HOSP, CLAREMORE, OK 346 291 55 5.29 143 109 34 3.21 203 182 21 8.67
OKLA HGFKB2 INO HOSP, CLINTON, OK 82 68 14 4.86 30 20 10 2.00 52 48 4 12.00
OKLA HGFK02 INO HOSP, LAWTON, OK 217 185 32 5.78 87 67 20 3.35 130 118 12 9.83
OKLA HGFKG2 WH. W. HASTINGS INO HOSP, TA 434 385 49 7.86 176 145 31 4.68 258 240 18 13.33
OKLA HGFKJ2 INO HOSP, ADA, OK 267 222 45 4.93 100 7S 25 3.00 167 147 20 7.35
PHX HGF LA2 INO HOSP, PARKER, AZ 81 71 10 7.10 29 25 4 6.25 52 46 6 7.67
PHX HGFLC2 INO HOSP, KEAHS CANYON, AZ 143 126 17 7.41 51 42 9 4.67 92 84 8 10.50
PHX HGFL02 INO HOSP, OWYHEE, NV 66 55 11 5.00 22 18 4 4.50 44 37 7 5.29
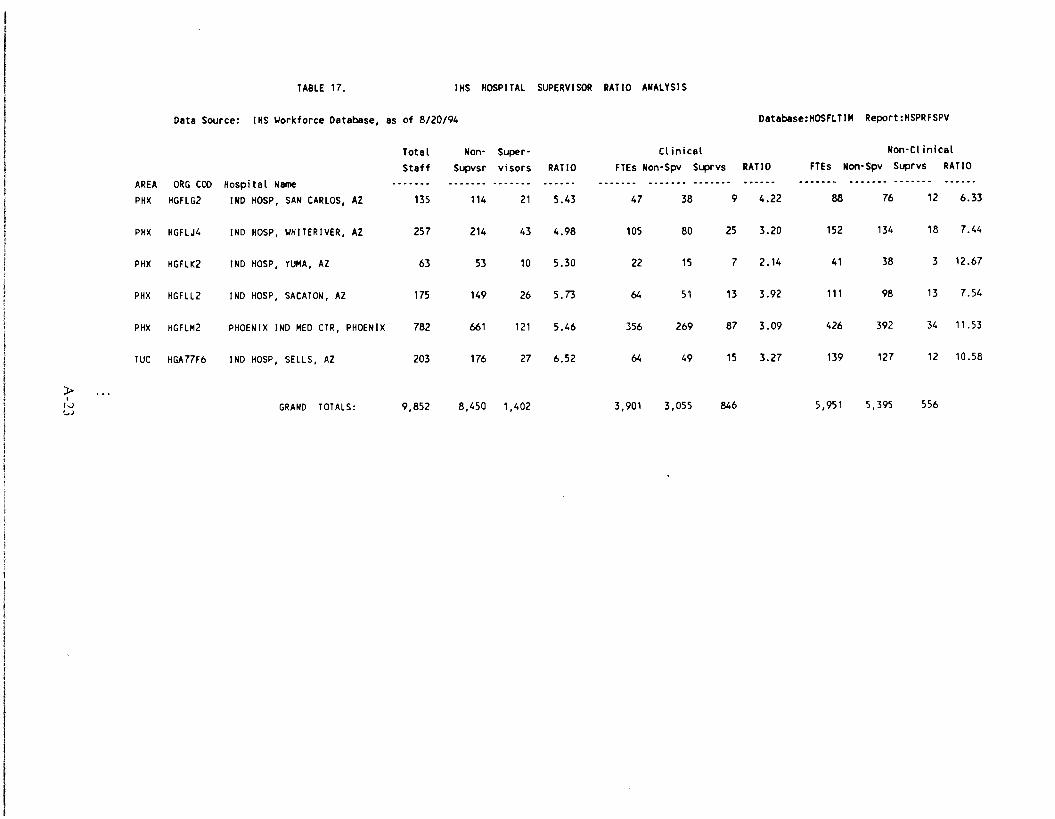
TABLE 17. IHS HOSPITAL SUPERVISOR RATIO ANALYSIS
Data Source: IHS ~orkforce Database, as of 8/20/94 Database: HOSFLT1M Report:HSPRFSPV
Total Non- Super- Clinical Non-Cl inical
Staff Supvsr visors RATIO FTEs Non-Spv Suprvs RATIO FTEs Non-Spv Suprvs RATIO
AREA ORG COO Hospital Name .. ... .. ...... .. .. .............. - ..... _-. ............. - .. -- .. ...... _................ . ...... _ ................ ......... - -_ ........... PHX HGFLG2 IND HOSP, SAN CARLOS, AZ 135 114 21 5.43 47 38 9 4.22 88 76 12 6.33
PHX HGFLJ4 INO HOSP, ~HITERIVER, AZ 257 214 43 4.98 105 80 25 3.20 152 134 18 7.44
PHX HGFLK2 INO HOSP, YUMA, AZ 63 53 10 5.30 22 15 7 2.14 41 38 3 12.67
PHX HGFLL2 INO HOSP, SACATON, AZ 175 149 26 5.73 64 51 13 3.92 111 98 13 7.54
PHX HGFLM2 PHOENIX INO MED CTR, PHOENIX 782 661 121 5.46 356 269 87 3.09 426 392 34 '1.53
ruc HGA77F6 INO HOSP, SELLS, AZ 203 176 27 6.52 64 49 15 3.27 139 127 12 10.58
>, 1.J '..J
GRANO TOTALS: 9,852 8,450 1,402 3,901 3,055 846 5,951 5,395 556
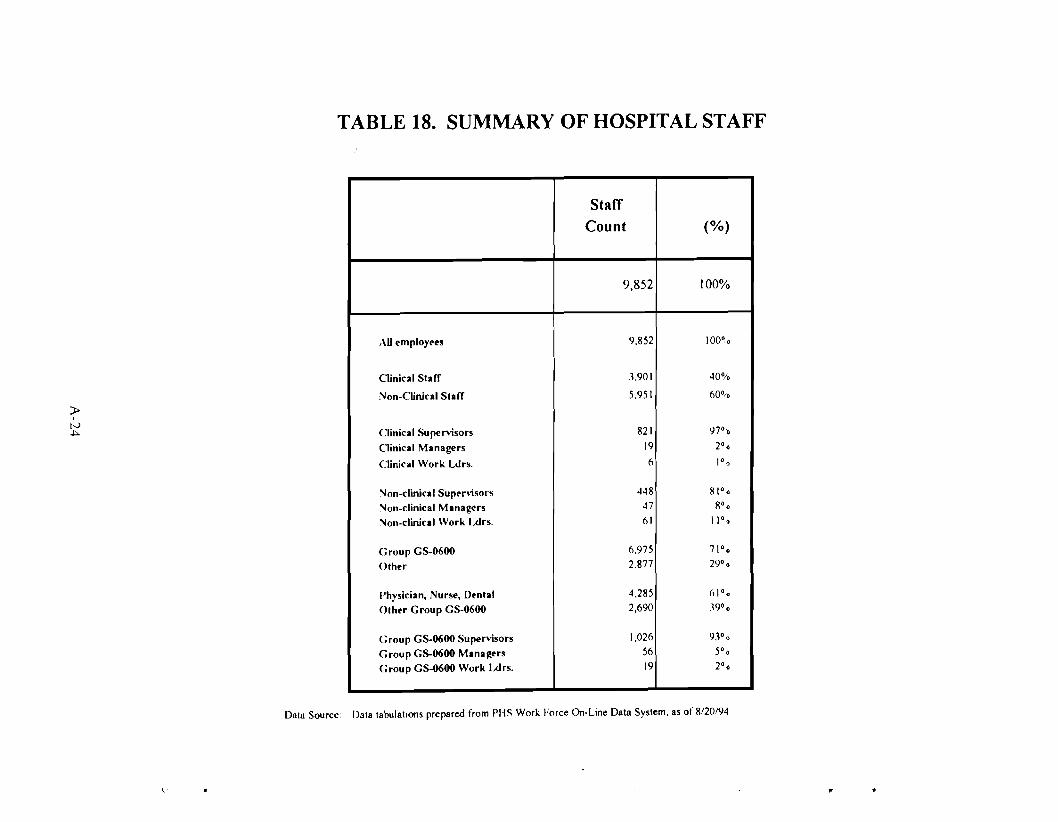
TABLE 18. SUMMARY OF HOSPITAL STAFF
» I
tv ~
Staff
Count (%)
9,852 100%
AU l'mployl'es 9.852 1000 0
Oinical Staff 3.901 40%
Non-Clinical Staff 5.951 60%
Clinical Supervisors 821 97 0 0
Clinical Managers 19 20 0
Clinical Work Ldrs. 6 10 0
"Ion-clinical Supl'r\lsors 448 81 0 0
"Ion-clinical Manag('rs 47 80 0
"Ion-clinical Work l..drs. 61 11 0 0
Group GS-0600 6.975 71 0 0
Other 2.877 290 0
Physician, Nurse, Dl'ntal 4.285 () 10 0
Other Group GS-0600 2,690 Woo
Group GS-0600 Supenlsors 1,026 930 0
Group GS-0600 Managers 56 50 0
Group GS-0600 Work l..drs. 19 20 0
Data tabulations prepared from PHS Work Force On-Line Data System. as of 8/20/94Data Source:
\' •
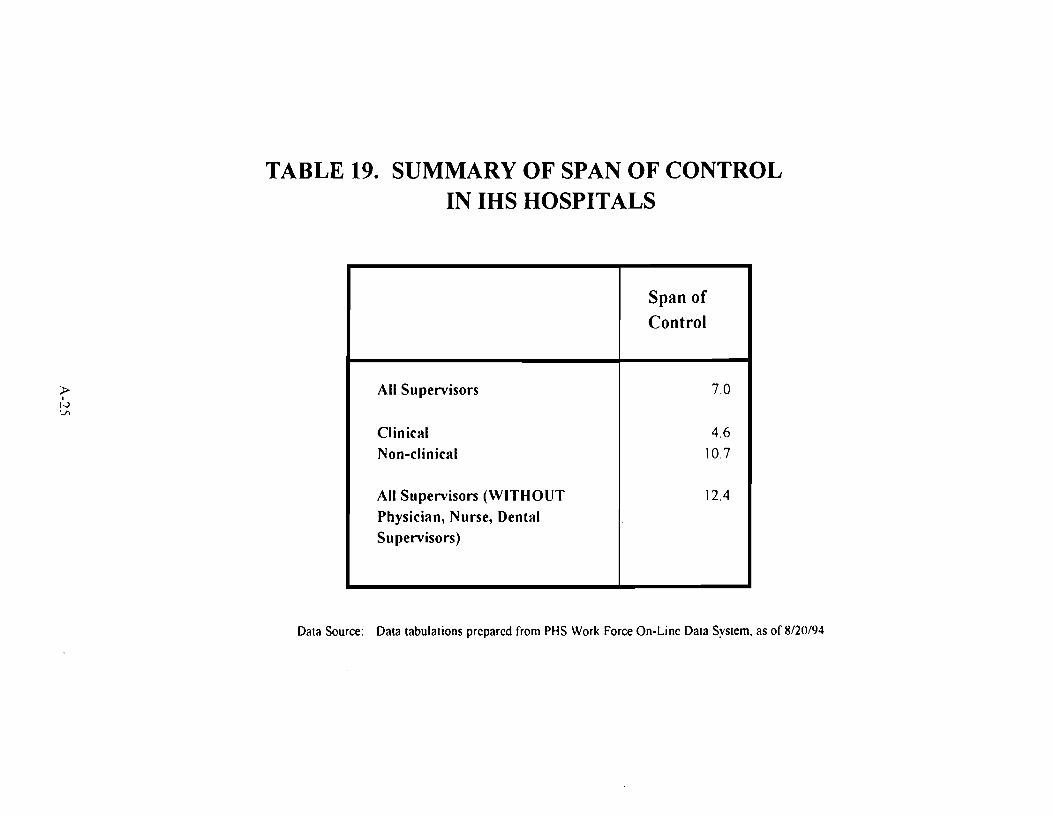
TABLE 19. SUMMARY OF SPAN OF CONTROL IN IHS HOSPITALS
» I
1-'> 'j)
Span of Control
All Supervisors 7.0
Clinical 4.6
Non-clinical 10.7
All Supervisors (WITHOUT 12.4
Physician, Nurse, Dental Supervisors)
Data Source: Data tabulations prepared from PHS Work Force On-Line Data System, as of 8/20/94
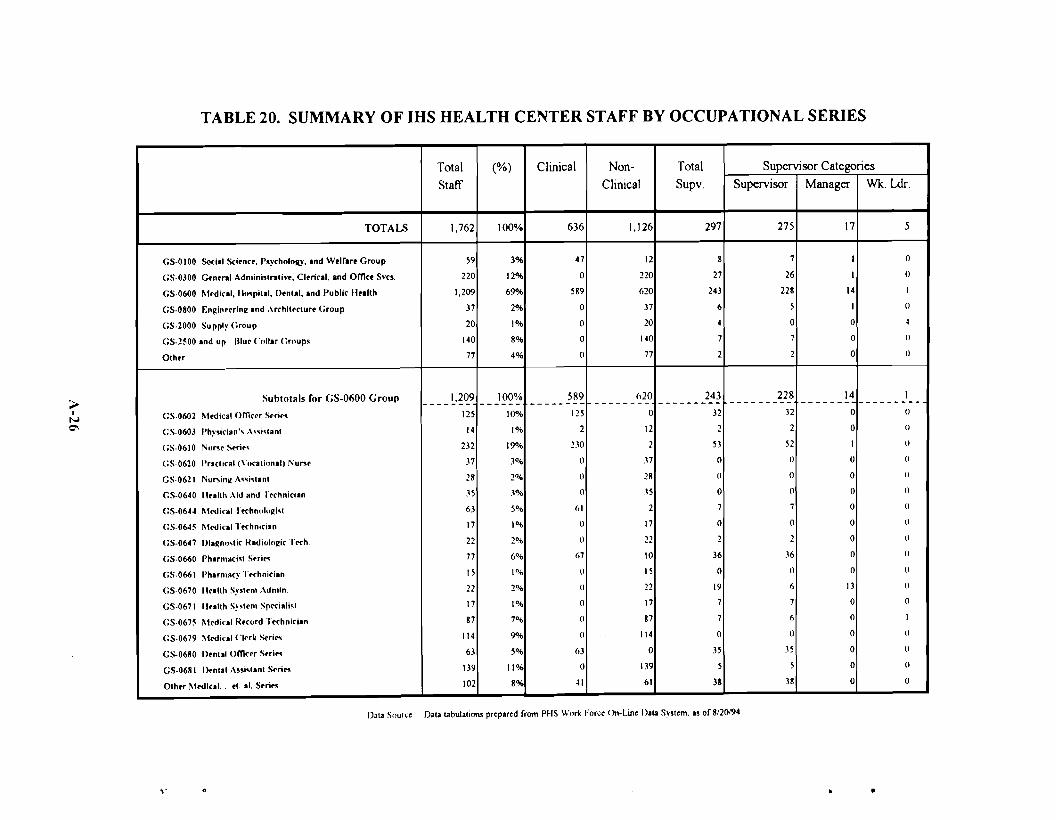
------- -------- -------- ---------
TABLE 20. SUMMARY OF IHS HEALTH CENTER STAFF BY OCCUPATIONAL SERIES
Total Staff
1,762
(%) Clinical Non-Clinical
TOTALS 100% 636 1,126
G5-0100 Social Scl.nrr, rsyrholollY, and W.lrar. Group
(;S-0300 Gtn.ro' Adminlslroliv•. CI.ri<ol, and Offirr Svro.
GS-0600 M.di<ol, "'''pilll, D.nlal, and Publir If.. llh
GS-0800 F.nginr.rlng and ,\rrhll.rlur. Group
GS-2000 Supply (;roup
GS-2500 and up Illu. Coli.. Grnups
Olh.r
59
220
1,209
37
20
140
77
3%
12%
69"'<'
2%
1%
8%
4%
47
0
589
0
0
0
0
12
220
620
37
20
140
77
Subtotals for GS-0600 Group 1.209 100% 5R9 (,20
GS·0602 M.dical omerr S.ri.s 125 10% 125 0
GS-0603 Physirian" '\"i,lanl 14 1% 2 12
GS-0610 Nu .... Stri., 232 19"~ 2.'0 2
GS·0620 Prortiral (\'o<olionai. i"un. 37 .10~ () n
GS·0621 Nu",in~ A"i,lanl 28 2°.il () 28
GS-0640 1I..lth Aid and T.rhnician _15 .1% () .'5
GS-06H M.dical Trrhnologi'l 63 5% 61 2
GS-0645 Mrdical hrhnirian 17 1% () 17
GS-0647 Diagno,lic Hadiolngir Trrh 22 2°A> () 22
G5·0660 Phumarisl Srri... 77 6% 67 10
GS-0661 Pharmory Trrhnirian 15 1% () 15
G5·0670 lI.allh Sy".n. '\dn.in, 22 2°-'0 () 22
GS-0671 1I..lIh s~ ...n. Sprrialisl 17 1% 0 17
GS-0675 M.dical Hrrord Trrhnlrian 87 7°" () 87
GS-0679 \lrdical C1.rk Str;... 114 9"" () 114
GS-0680 D.nul Offirrr S.rl", 63 5% 63 0
G5-0681 D.nlal A..islanl Stri", 139 11% 0 1.'9
Olh.r Mrdlral. .1. al. S.,;", 102 8% ~1 61
Total Supv.
297
8
27
243
6
4
7
2
243 >I 32
N 0\ 2
53
0
()
0
7
0
2
36
0
19
7
7
0
35
5
38
Supervisor Categories Supervisor
275
Manager Wk. Ldr.
17 5
7
26
228
5
0
7
2
228 --------32
2
52
()
()
0
7
0
2
.16
()
6
7
6
0
.15
5
38
I
I
14
1
0
0
0
0
()
I
0
~
()
()
14------ 0
0
I
0
0
0
0
0
0
0
0
13
0
0
0
0
0
0
I --------()
()
()
()
()
()
()
()
()
()
()
()
()
1
()
()
()
0
Oala tabulaliom prepared rrom PHS Wnr\( Force On-Line I)ata System. as or 8/20194Data Sourl.:e
,. •

TABLE 21. IHS HEALTH CENTER STAFF ANALYSIS
Data Source: IHS ~orkforce Database, as of 8/20/94 Database:HCTFLTIM Report:HCPRFSTF
AREA ORG COO Health Center Name Total Staff
Supervisors
NonSupvsr
Adni n Staff
Medi cl
Staff Nursng Staff
Dental Staff
Pharm Records Staff Staff
Engineerng
Blue Collar
Other Staff
ABD HGFBE2 INDIAN HC, FORT TOTTEN N.D. 43 9 34 6 3 5 5 3 8 o 4 9
ABD HGFBK3 IND HALTH CTR, MCLAU~HLIN, S.D 25 3 22 2 o 7 5 4 2 3
ABD HGFBP2 IND HC, NE~ T~N, N.D. (MINNE 47 8 39 5 2 7 5 8 2 2 15
ABD HGFBQ3 IND HEALTH CTR, WANBLEE, S.D. 10 9 2 2 2 o o 2 o
ABO HGFBR L~ER BRULE HLTH CNTR 25 4 21 3 3 4 o 3 6 o 2 4
ABO HGFBS CR~ CREEK HLTH CENTER 49 8 41 9 2 8 5 2 7 5 10
>I
Iv --.I
ABO
ABO
HGFOA3
HGFDC6
IND
IND
HC,
HC,
ALBUQUERQUE,
DULCE, N.M.
N.M. 2
24
o
7
2
17
o
o
o
3
o
6
o
3
o
2 4
o
o 3
o
3
ABO HGFDC8 IND HC, TAOS, N.M. 34 4 30 3 2 5 4 2 9 4 4
ABO HGFDG2 IND HC, IGNACIO, CO 25 6 19 2 2 3 4 2 4 o 7
ABO HGFDG3 IND HC, TO~AOC, CO 17 4 13 2 2 3 4 o 3
BEMI HGFEC2 IND HC, WHITE EARTH 49 8 41 8 4 6 5 3 8 o 5 10
BILL HGFFK2 IND HLTH CTR, LAME DEER, MT o o o o o o o o o
BILL HGFNE2 IND HC, POPLAR, MT 80 11 69 14 10 11 6 5 6 2 5 21
BILL HGFNE3 IND HC, WOLF POINT, MT 27 26 4 3 4 3 2 2 3 5
BILL HGFNH2 IND HC, FORT ~ASHAK IE, ~Y 69 13 56 10 3 8 7 4 8 3 5 21
BILL HGFNH3 IND HC, ARAPAHOE, WY 26 3 23 3 6 4 4 o 2 5
BILL HGFNJ2 IND HC, BOX ELDER, MT 45 6 39 5 5 4 5 2 7 5 11
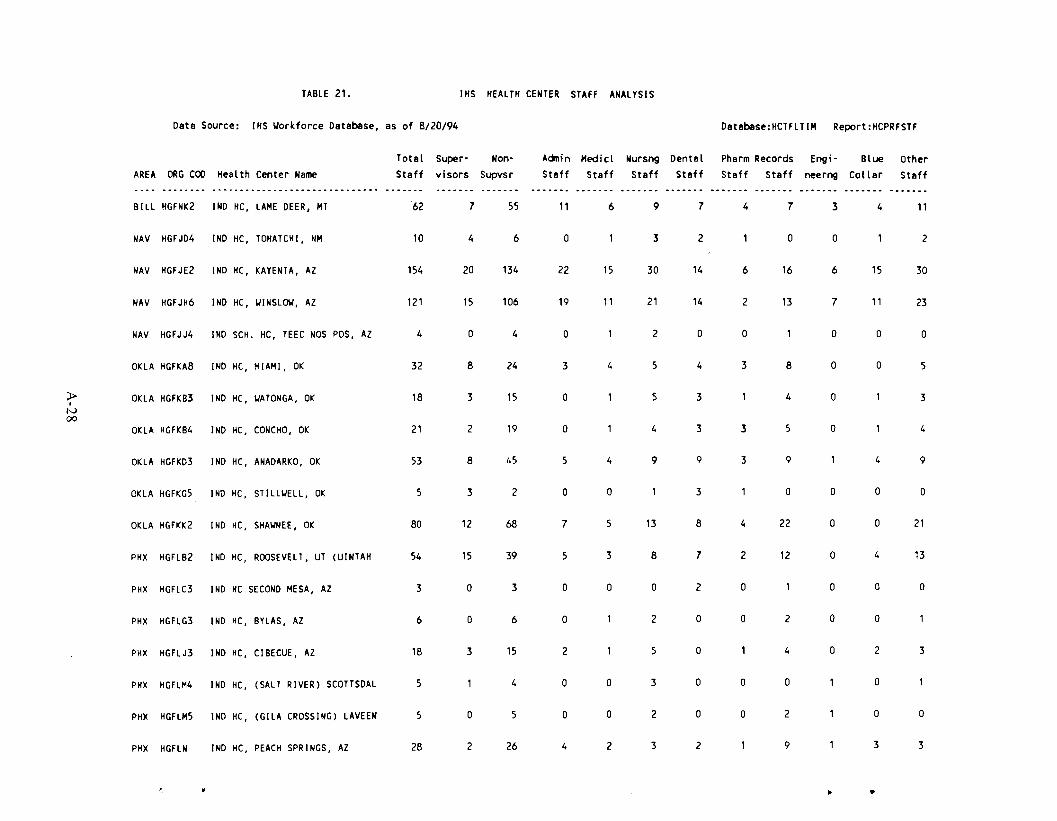
TABLE 21. IHS HEALTH CENTER STAFF ANALYSIS
Data Source: IHS Workforce Database, as of 8/20/94 Database:HCTFLTIH Report:HCPRFSTF
AREA ORG COO Health Center Name Total
Staff Supervisors
NonSupvsr
Acinin Staff
Medicl Staff
Nursng Staff
Dental Staff
Pharm Records Staff Staff
Engineerng
Blue Collar
Other Staff
BILL HGFNK2 IND HC, LAME DEER, MT 62 7 55 11 6 9 7 4 7 3 4 11
NAV HGFJD4 IND HC, TOHATCHI, NM 10 4 6 o 3 2 o o 2
NAV HGFJE2 IND HC, KAYENTA, AZ 154 20 134 22 15 30 14 6 16 6 15 30
NAV HGFJH6 IND HC, WINSLOW, AZ 121 15 106 19 11 21 14 2 13 7 11 23
NAV HGFJJ4 IND SCH. HC, TEEC NOS POS, AZ 4 o 4 o 2 o o o o o
OKLA HGFKA8 IND HC, MIAMI, OK 32 8 24 3 4 5 4 3 8 o o 5
>I
N 00
OKLA
OKLA
HGFKB3
HGFKB4
IND
IND
HC,
HC,
WATONGA, OK
CONCHO, OK
18
21
3
2
15
19
o
o
5
4
3
3 3
4
5
o
o
3
4
OKLA HGFKD3 IND HC, ANADARKO, OK 53 8 45 5 4 9 9 3 9 4 9
OKLA HGFKG5 IND HC, STILLWELL, OK 5 3 2 o o 3 o o o o
OKLA HGFKK2 IND HC, SHAWNEE, OK 80 12 68 7 5 13 8 4 22 o o 21
PHX HGFLB2 IND HC, ROOSEVELT, UT (UINTAH 54 15 39 5 3 8 7 2 12 o 4 13
PHX HGFLC3 IND HC SECOND MESA, AZ 3 o 3 o o o 2 o o o o
PHX HGFLG3 IND HC, BYLAS, AZ 6 o 6 o 2 o o 2 o o
PHX HGFLJ3 IND HC, CIBECUE, AZ 18 3 15 2 5 o 4 o 2 3
PHX HGFLM4 IND HC, (SALT RIVER) SCOTTSDAL 5 4 o o 3 o o o o
PHX HGFLM5 IND HC, (GILA CROSSING) LAVEEN 5 o 5 o o 2 o o 2 o o
PHX HGFLN IND HC, PEACH SPRINGS, AZ 28 2 26 4 2 3 2 9 3 3
~ ..
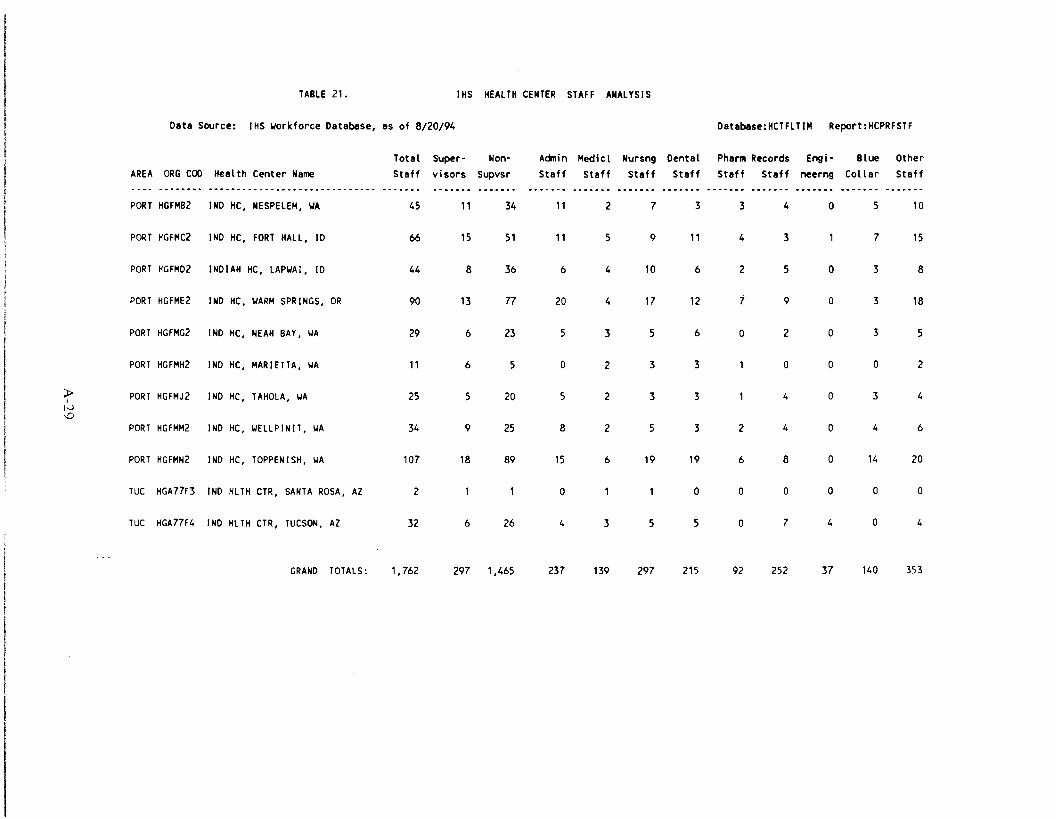
TABLE 21. IHS HEALTH CENTER STAFF ANALYSIS
Data Source: IHS ~orkforce Database, as of 8/20/94 Database:HCTFLTIM Report: HCPRFSTF
AREA
PORT
ORG COO Health Center Name ................. __ • a ............ _ ..... _ .. ____ ....
HGFMB2 IND HC, NESPELEM, ~A
Total Staff
45
Super- Non-visors Supvsr
11 34
Aanin Staff
11
Medicl Staff
2
Nursng Staff
7
Dental Staff
3
Pharm Records Staff Staff
3 4
Engi· neerng
0
Blue Collar
5
Other Staff
10
PORT HGFMC2 IND HC, FORT HALL, 10 66 15 51 11 5 9 11 4 3 1 7 15
PORT HGFMD2 INDIAH HC, LAP~AI, 10 44 8 36 6 4 10 6 2 5 0 3 8
PORT HGFME2 IND HC, ~ARM SPRINGS, OR 90 13 77 20 4 17 12 7 9 0 3 18
PORT HGFMG2 IND HC, NEAH BAY, WA 29 6 23 5 3 5 6 0 2 0 3 5
PORT HGFMH2 IND HC, MARIETTA, WA 11 6 5 0 2 3 3 1 0 0 0 2
» r Iv \D
PORT
PORT
HGFMJ2
HGFMM2
IND
IND
HC,
HC,
TAHOLA, WA
WELLPINIT, WA
25
34
5
9
20
25
5
8
2
2
3
5
3
3
1
2
4
4
0
0
3
4
4
6
PORT HGFMN2 IND HC, TOPPENISH, WA 107 18 89 15 6 19 19 6 8 0 14 20
TUC HGA77F3 IND HLTH CTR, SANTA ROSA, AZ 2 1 1 0 1 1 0 0 0 0 0 0
TUC HGA77F4 IND HLTH CTR, TUCSON, AZ 32 6 26 4 3 5 5 0 7 4 0 4
GRAND TOTALS: 1,762 297 1,465 237 139 297 215 92 252 37 140 353

TABLE 22. HEALTH CENTER SPAN OF CONTROL BY OCCUPATIONAL SERIES
~ I
(,;,/ o
Total Supervisor Span of % by Supervisor Categories
Staff Staff Control Supervisor Manager Wk. Ldr.
TOTALB 1.762 297 5.9 93% 6% 2%
GS·OIOO Social Scltnct. Psychology. and Wtlfart Group 59 8 7.4 88% 13% 0%
GS·0300 Gtntral Admlnislralivt. Cltrlcal. and OmCt S,·co. 220 21 8.1 96% 4% 0°.;,
GS·0600 Mtdlral. Hospllli. Dtnlli. and Public Hullh 1.209 243 5.0 94% 6% 00.;,
GS·0800 Enllinttrlnll and ArchlltClurt Group 37 6 6.2 83°A> 11% O°'Q
GS·2000 Supply Group 20 4 5.0 OOA> OOA> I()()o~
GS·2500 and up Blut Collar Groups 140 1 20.0 I()()OA> 00.;, 0°0
Olhtr 77 2 38.5 I()()O';' 0% 0°-0
Suhlolals for GS·0600 Group 1.209 243 5.0 94% 6% 0°0 -------- --------- ------- -------- -------- ---------
G5·0602 ~Itdiral omctr Stric\ 125 32 3.9 1000.;, 0% 0°1)
GS·0603 Physician's A..i,lanl I ~ 2 7.0 I()()O.;, 00... 00 0
GS·0610 Nu .... St'rl('5 1.l2 53 4.4 98°·. 2°"0 (lOu
GS·0620 Practical (Vocational) ;\'u"'t .11 0 0.0 OO1l 0°.. (lOti
GS·062I Nursing A..i.tanl 28 0 0.0 0°.. 0°/0 0 01 0
(;S·O~O Iluith Aid and Ttchnician .\5 0 00 0"" 0°'0 tlOIl
GS-06~~ ~Itdlcal TKhnoloRi,t 6.\ 1 90 100°.. 00" (IOn
(;S·06~5 Mtdiral TKhnlcian 17 0 0.0 00" 00.. ()Ou
GS-0~7 Dlagno.tlc RadioloRic Ttch. 22 2 11.0 I(l(l".. 00... 11°0
(;S·0660 Phannaci,t Strit. 77 36 21 100°.. 00.;, 11°0
GS·0661 Phannacy Ttchnician IS 0 0.0 (l".. (l"~ (1"/1
(;S-0670 llealth Systtn, ,\dn.in. 22 19 12 .\2% 68°'0 'I'ln
GS-0671 lIulth Systtm Sp....i.li,t 17 7 24 I(l()O'O ()O~ tIll ..
GS.0675 ~Itdlcal RtCord Ttchniclan 87 7 124 86°.. 0°'0 1.J"n
GS·0679 Mtdlcal Cltrk Strit\ II ~ 0 0.0 (l".. (l"1l (lU u
GS·0680 Dtolll OmCtr Strit\ 63 35 18 100% ll".. ltHl i
(;S·0681 Inolll A..I.llnt St,ic, 1.'9 5 27.8 100% 0°.. (1".0
Othtr Mtdlral•... tl. at Strlt\ 102 38 21 100% OOA> 0°'0
D,IO Source' D,la IOhulJllon, prepared from PIIS Worl< Force On-I.ine D,.. Syslem. .. or 8/20/94
.,~.. .l •