Embed Size (px)
Citation preview

8/10/2019 Spark - Bearings Sector Report
http://slidepdf.com/reader/full/spark-bearings-sector-report 1/31
Initiating Coverage on
Bearings Sector
October 2011
Find Spark research on Bloomberg (SPAK <go>), Thomson First Call, Reuters Knowledge and Factset

8/10/2019 Spark - Bearings Sector Report
http://slidepdf.com/reader/full/spark-bearings-sector-report 2/31

8/10/2019 Spark - Bearings Sector Report
http://slidepdf.com/reader/full/spark-bearings-sector-report 3/31
Snapshot of Views on Stocks
Company
Businessanalysisoutcome View Rating
SKF India Rank: 4 Growth to be driven by auto OEM demand and capital formation led industrial demand for the next two years Variablized cost structure and diversified customer base to help withstand cyclical downturns Unorganized players and counterfeits to continue impacting after-market growth, but competitive position on supplies to OEMs is expected to
remain strong Estimate topline CAGR of 19% from CY10-CY12E and PAT CAGR of 20% for the same period
ADD
OUTPERFORM
TP: Rs 727
Bearings Sector
Sector Outlook Positive
Initiating Coverage
NRBBearings
Rank: 8 Dominant market position to sustain in needle roller bearings Domestic revenues to be inline with OEM growth Export revenues to drive overall growth Capital requirements to be high given the company’s backward integration Estimate topline CAGR of 16% from FY11-FY13E and PAT CAGR of 13% over the same period leading to a FY13E PAT of Rs. 669mn
NOT RATED
FAGBearings
Rank: 1 Growth to be driven by industrial capacity addition and automotive sector growth High cost structure variablization similar to SKF Substantial presence in roller bearings presents a lower threat from counterfeits relative to SKF, and stronger after-market growth
Strong free cash flow generation to enable the company to remain debt free Estimate topline CAGR of 18.6% for CY10-12E and PAT CAGR of 20% over the same period leading to a CY12E PAT of Rs. 1.96bn
NOT RATED
2

8/10/2019 Spark - Bearings Sector Report
http://slidepdf.com/reader/full/spark-bearings-sector-report 4/31
Valuation Matrix
Bearings Sector
Sector Outlook Positive
Initiating Coverage
Company
Sales (Rs. mn) EBITDA (Rs. mn) PAT (Rs. mn) EPS (Rs.) EBITDA Margin
CY10/FY11
CY11E/FY12E
CY12E/FY13E
CY10/FY11
CY11E/FY12E
CY12E/FY13E
CY10/FY11
CY11E/FY12E
CY12E/FY13E
CY10/FY11
CY11E/FY12E
CY12E/FY13E
CY10/FY11
CY11E/FY12E
CY12E/FY13E
SKF India 20,932 25,781 29,644 2,794 3,451 4,015 1,770 2,190 2,556 33.6 41.5 48.5 13.3% 13.4% 13.5%
FAG Bearings 10,486 12,283 14,738 1,887 2,425 2,924 1,215 1,638 1,961 73.1 98.5 118.0 18.0% 19.7% 19.8%
Note: CY financial year end for FAG and SKF and March FY ended for NRB
, , , , , , . . . . . .
Company
P/E EV/EBITDA EV/Sales
CMP (Rs)
Mkt Cap Target Rating
CY10/FY11
CY11E/FY12E
CY12E/FY13E
CY10/FY11
CY11E/FY12E
CY12E/FY13E
CY10/FY11
CY11E/FY12E
CY12E/FY13E
(Rs. mn) P/E Price Absolute Relative
SKF India 20.0x 16.2x 13.8x 11.9x 9.3x 7.5x 1.6x 1.2x 1.0x 671 35,384 15x 727Add OPF
FAG Bearings 16.0x 11.8x 9.9x 8.8x 6.3x 4.4x 1.6x 1.2x 0.9x 1,167 19,396 NA NANR NR
NRB Bearings 8.7x 8.1x 6.8x 5.3x 5.0x 4.3x 1.2x 1.1x 0.9x 47 4,555 NA NANR NR
3
8/10/2019 Spark - Bearings Sector Report
http://slidepdf.com/reader/full/spark-bearings-sector-report 5/31
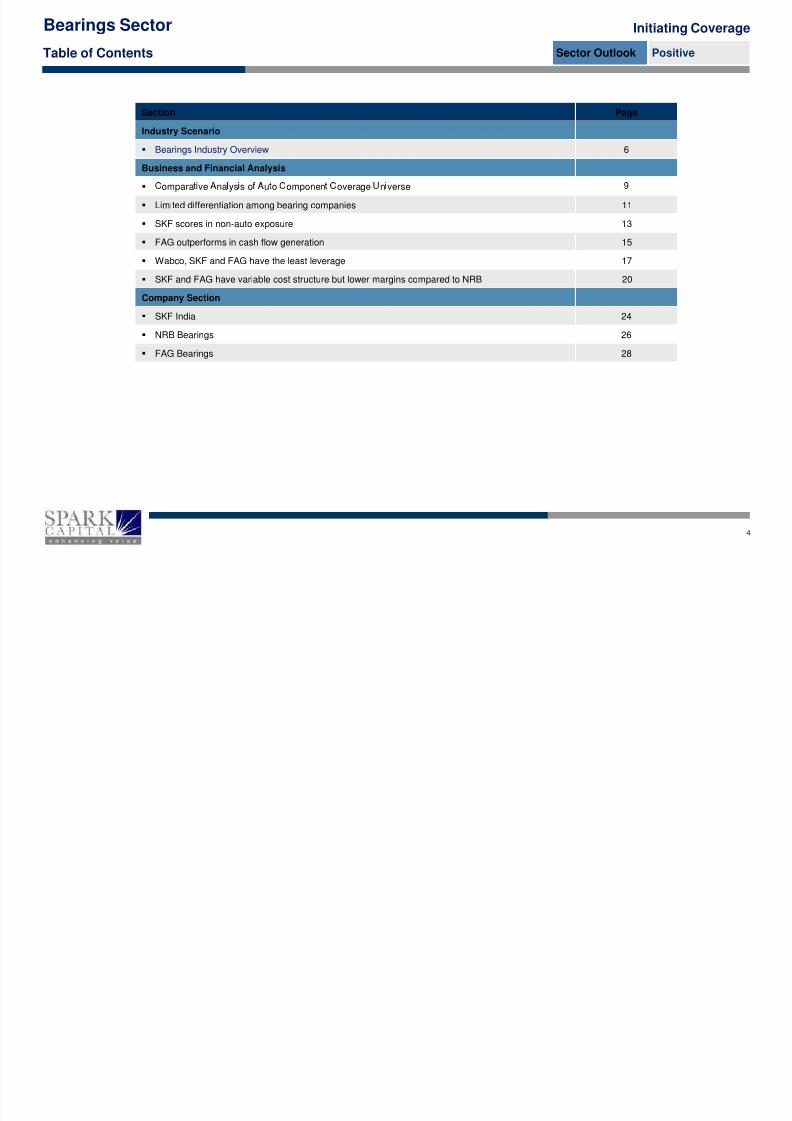
Table of Contents Sector Outlook Positive
Initiating Coverage
Section Page
Industry Scenario
Bearings Industry Overview 6
Business and Financial Analysis
Bearings Sector
ompara ve na ys s o u o omponen overage n verse
Limited differentiation among bearing companies 11
SKF scores in non-auto exposure 13
FAG outperforms in cash flow generation 15
Wabco, SKF and FAG have the least leverage 17
SKF and FAG have variable cost structure but lower margins compared to NRB 20
Company Section
SKF India 24
NRB Bearings 26
FAG Bearings 28
4

8/10/2019 Spark - Bearings Sector Report
http://slidepdf.com/reader/full/spark-bearings-sector-report 6/31
Industry Scenario
5
8/10/2019 Spark - Bearings Sector Report
http://slidepdf.com/reader/full/spark-bearings-sector-report 7/31
Bearing Industry Overview …
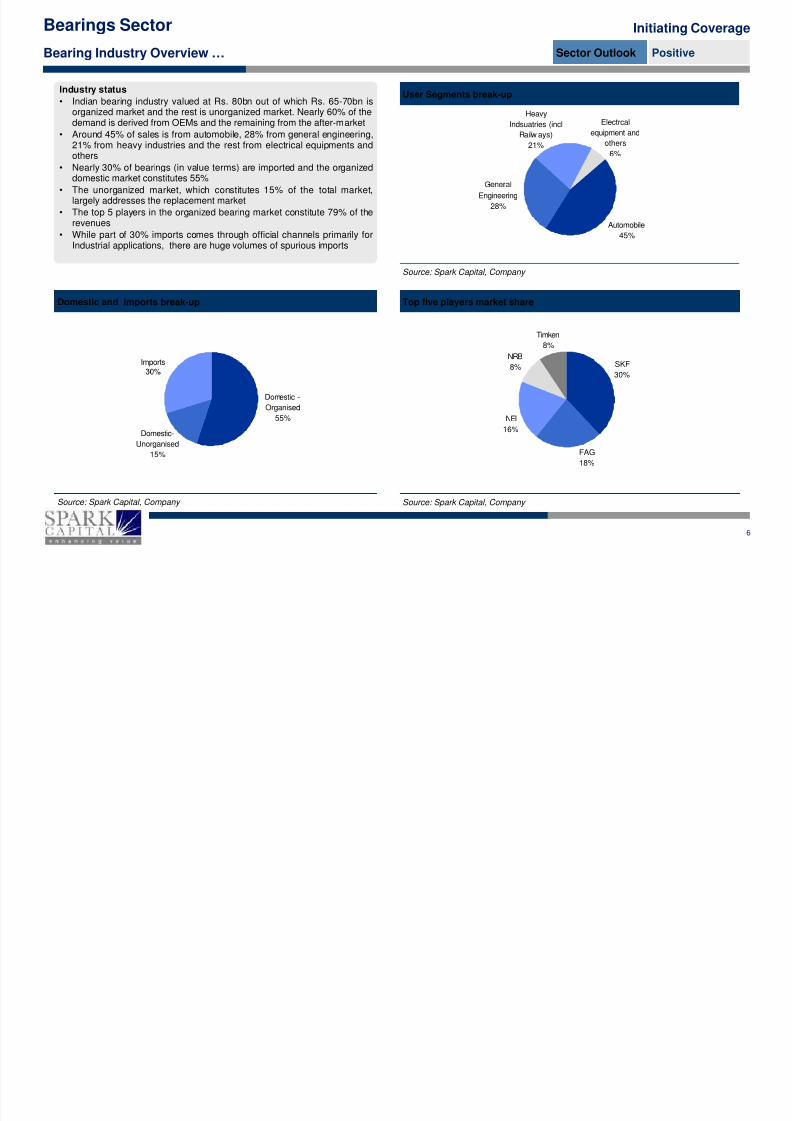
Industry status
• Indian bearing industry valued at Rs. 80bn out of which Rs. 65-70bn isorganized market and the rest is unorganized market. Nearly 60% of thedemand is derived from OEMs and the remaining from the after-market
• Around 45% of sales is from automobile, 28% from general engineering,21% from heavy industries and the rest from electrical equipments andothers
• Nearly 30% of bearings (in value terms) are imported and the organizeddomestic market constitutes 55%
Bearings Sector Initiating Coverage
Sector Outlook Positive
User Segments break-up
Electrcal
equipment and
others
6%
Heavy
Indsuatries (incl
Railw ays)
21%
• The unorganized market, which constitutes 15% of the total market,largely addresses the replacement market
• The top 5 players in the organized bearing market constitute 79% of therevenues
• While part of 30% imports comes through official channels primarily forIndustrial applications, there are huge volumes of spurious imports
Top five players market shareDomestic and imports break-up
Source: Spark Capital, Company
Automobile
45%
Engineering28%
Imports SKFNRB
8%
Timken
8%
6
Source: Spark Capital, Company Source: Spark Capital, Company
Domestic -
Organised
55%
Domestic-
Unorganised
15%
30%
FAG
18%
NEI
16%

8/10/2019 Spark - Bearings Sector Report
http://slidepdf.com/reader/full/spark-bearings-sector-report 8/31
Types of bearings and its applications
Bearing Industry Overview …
Types of bearings Applications
Deep groove ball bearing Wide applications in two-wheelers, four-wheelers,
three-wheelers (Used in wheel, axles)
Spherical roller bearing Car suspension, drive shaft, heavy machinery
Types of bearings and market share
ManufacturerTypes of bearingsproduced Market share
SKF India Deep groove ball bearing 65-70%
FAG India Spherical and cylindrical
roller bearing 45%
Sector Outlook Positive
Initiating CoverageBearings Sector
Source: Spark Capital, Company
Cylindrical roller bearing Machine tools, transmissions, wheel-set bearings for
railway applications
Tapered roller bearing Wide application in commercial vehicles
Needle roller bearing Niche application in engine, gearbox. With less load
and thrust
Source: Spark Capital, Company
INA - (FAG's subsidiary) Needle Roller bearing 30%
Timken Taper Roller bearing 40-50%
NRB Bearings Needle Roller bearing 70%
Organised market size – Product-wise
Bearing Market – Rs. 65-70bn
• The organized market is estimated to be between Rs 65-70bn with over55% of the market dominated by ball bearing (primarily deep groove ballbearing)
• The competitive intensity among organized players is low given thateach la er is dominant in one of the roduct se ments
7
Source: Spark Capital, Company
Ball bearingRs 35-40bn
Spherical andcylindrical roller
bearing: Rs 10-15bn
Needle roller bearing – Rs.5bn
Tapered roller bearing – Rs. 10bn
• Large spurious and illegal import of bearing (esp. deep groove ballbearing) is an evergreen threat to the industry
• Competitive intensity to increase in the needle roller bearing market andtaper rolling bearing in the next 2-3 years with INA and Timken settingup capacities respectively
• Unorganized players will continue to impact the deep groove ballbearing market

8/10/2019 Spark - Bearings Sector Report
http://slidepdf.com/reader/full/spark-bearings-sector-report 9/31
Business & Financial Analysis
8

8/10/2019 Spark - Bearings Sector Report
http://slidepdf.com/reader/full/spark-bearings-sector-report 10/31
Identifying Critical Success Factors (CSFs)
Our CSF matrix compares the nine auto-component companies with eight critical success factors and eight financial parameters.
Parameters Definition
OEM’s dependence Dependence of the OEM, for the components. The relative criticality of a component in the vehicle (for the OEM).
Technology/R&D/Patents Technology, R&D barrier created by the company
Sector Outlook Positive
Initiating CoverageBearings Sector
Criticalsuccessfactors
Replacement Market/distribution network Proportion of revenues from replacement market (aftermarket)
Risk of JV divorce Dependency on JV partner
Customer concentration Large share of revenue coming from few key customers
Non-Auto exposure Proportion of revenue from non-automotive business (related diversification)
Competitive Landscape Market share, competitive positioning in the industry segment
Impact of govt. policies/external factors Favourable/un-favourable implication of changes in govt. policies/external factors
Revenue growth (CAGR FY11 - 13E)
PAT growth (CAGR FY12 - 13E)
EBITDA margin (%)
9
Financialparameters
(FY12E)
Total assets turnover (x)
Working Capital turnover (x)
RoCE (%)
Debt/Equity (x)
OCF/Revenue (%)

8/10/2019 Spark - Bearings Sector Report
http://slidepdf.com/reader/full/spark-bearings-sector-report 11/31
CSF & Financial Parameter Ranking
Scoring of coverage universe: Scale: 1 – 9 with 9 being the best
CRITICAL SUCCESS FACTORAmara Raja
Batt. Apollo Tyres Bharat Forge Exide Inds.Motherson
Sumi WABCO-TVS SKF India FAG BearingsNRB Bearings
OEM's dependence 7 5 9 7 8 9 6 6 6
Technology / R&D / Patents 6 4 8 6 7 9 5 5 5
Replacement/After - market 7 9 2 6 2 4 3 6 5
Risk of divorce of JV 7 9 8 7 7 9 9 9 9
Bearings Sector Initiating Coverage
Sector Outlook Positive
Customer concentration 4 9 4 7 5 3 8 8 8
Non-Auto Business 9 3 7 8 4 3 9 8 4
Competitive Landscape 6 3 9 7 7 8 4 4 5
Impact of govt. policy / external factors 7 3 6 7 6 7 4 4 5
Financials (FY13E/CY12E)Revenue growth (CAGR CY10/FY11 -CY12E/FY13E)
9 8 2 1 7 3 6 5 4
PAT growth (CAGR FY11 - 13E/ CY10-12E) 5 4 6 2 9 3 7 8 1
EBITDA margin (%) 3 1 5 5 2 9 4 7 8
Total assets turnover (x) 9 3 2 5 4 8 6 7 1
Working Capital turnover (x) 1 7 4 6 9 2 5 8 3
RoCE % 6 1 2 5 4 9 7 8 3
10
WABCO-TVS scores highon EBITDA margin, RoCE.And scores secondhighest on asset turnover.
FAG, WABCO and Exide are the top 3companies ranked in that order. FAGscores high on customer concentration,non-auto exposure, revenue and earnings
growth, and working capital management
D/E (x) 5 1 2 6 3 6 6 6 4
OCF/Revenue (%) 1 2 5 7 3 6 4 9 8
FINAL RANK 5 9 7 3 6 2 4 1 8

8/10/2019 Spark - Bearings Sector Report
http://slidepdf.com/reader/full/spark-bearings-sector-report 12/31
#1 OEM’s Dependence #2 Technology, R&D, Patents
HighComponentcriticality
Hightechnology,R&D,patents
Highbarriersto entry
Highswitchingcosts forOEMs
Highbargainingpower forACMs
Bearings Sector
Sector Outlook Positive
Initiating Coverage
Brakingsystems
WABCO-TVS
Forged parts
BHARAT FORGE
Impeccable Function-ality is a hygiene factor.High impact on OEMsreputation
‘Building Blocks’of the vehicle
Parent acquired 166new patents in 2009
Owns process patents
OEM’sdependence Score
WABCO-TVS 9
Bharat Forge 9
Motherson Sumi 8
Amara Raja 7
Apollo Tyres 5
Technology,R&D, Patents Score
WABCO-TVS 9
Bharat Forge 8
Motherson Sumi 7
Amara Raja 6
Apollo Tyres 4
11
Wiring harness,
mirrors
MOTHERSON SUMI
Tyres, Battery, Bearings
NRB, SKF, FAG, APOLLOTYRES / AMARA RAJA /
EXIDE INDUSTRIES
Limiteddifferentiationamongvendors
Predominantly
addressingfunctionality ofperipherals
Know-how in manufac-
turing key components(Fuse, connectors etc.).SMR owns 600 patents.
Technologyinvestment primarilyto survive anddifferentiate
Exide Industries 7
SKF India 6
FAG Bearings 6
NRB Bearings 6
Exide Industries 6
SKF india 5
FAG Bearings 5
NRB Bearings 5

8/10/2019 Spark - Bearings Sector Report
http://slidepdf.com/reader/full/spark-bearings-sector-report 13/31
#3 Replacement Market #4 Customer Concentration
Apollo TyresHigh Low customer concentration
APOLLO TYRES
EXIDE INDUSTRIES
r e
Replacement market revenues as a % of total revenues
50 - 60%
> 70%
Aftermarket Score FAG, SKF, NRB
Sector Outlook Positive
Initiating CoverageBearings Sector
Exide Industries
Amara Raja, FAG
WABCO-TVS, NRB,SKF
BHARAT FORGE
HighLow Market share
High customer concentration
WABCO-TVS
AMARA RAJA,
MOTHERSON SUMI
A f t e r m a r k e t e x p o
s u
10 - 20%
20 - 30%
30 - 40%
40 - 50%Apollo Tyres 9
Exide Industries 6
Amara Raja 7
WABCO-TVS 4
Bharat Forge 2
Motherson Sumi 2
SKF India 3
FAG Bearings 6
12
Motherson Sumi,Bharat Forge,
High after marketexposure
High marketshare+ = Low customer
concentration
Aftermarketexposure
Pricingpower
Volumecyclicality
< 10%
NRB Bearings 5
Customerconcentration
ApolloTyres Exide Inds.
AmaraRaja
Motherson Sumi
WABCO-TVS
BharatForge
SKFIndia
FAGBearing
s
NRBBearing
s
Score 9 7 4 5 3 4 8 8 8

8/10/2019 Spark - Bearings Sector Report
http://slidepdf.com/reader/full/spark-bearings-sector-report 14/31
#5 Non-auto Exposure #6 Risk of JV Divorce
Non-auto revenues as a % of total revenues (relateddiversification
40 - 50%
> 50%
Amara Raja, SKF
Details of key JVs/technology partners
COMPANY JV / TECHNOLOGY PARTNER DETAILSAmara RajaBatteries Johnson Controls
Equal equity stake of 26%, Technology provider for autobatteries
Exide IndustriesFurukawa Batteries, Shin-KobeElectric Machinery Automotive and VRLA Lead Acid Storage Batteries
Motherson Sumi(MSSL) Sumitomo Wiring
Sumitomo wiring has 25% equity stake (technology providerfor wiring harness business), MSSL has six other key JVs
Bharat Forge NTPC, Alstom For foray into power equipment business
Non-autoexposure Score
Initiating Coverage
Sector Outlook Positive
Bearings Sector
5 - 10%
10 - 20%
20 - 30%
30 - 40%
Motherson Sumi,NRB
Bharat Forge
Exide Industries,FAG
Apollo Tyres - -
WABCO-TVS - -
SKF India - Global SKF provides technology know-how
FAG Bearings - Schafeller group provides technological know-how
NRB Bearings -
Inherited the technology from Nadella during its initialtie-up and now are internally capable to manufactureneedle roller bearing
Company Presence of JVImpact ofdivorce
Dependencefor technology
Historical issues withpartner
Amara Raja Batteries High High
Exide Industries High High
Motherson Sumi High High
Bharat Forge Low Low
Apollo Tyres - - -
WABCO-TVS - - -
Amara Raja 9
Exide Industries 8
Bharat Forge 7
Motherson-Sumi 4
WABCO-TVS 3
Apollo Tyres 3
SKF india 9
13
< 5% WABCO-TVS,Apollo Tyres
Dependenceon JV partner
Risk in theevent ofdivorce
Volumecyclicality
Non-autoexposure
SKF India - - -
FAG Bearings - - -
NRB Bearings - - -
Risk of JVdivorce Apollo Tyres
WABCO-TVS
BharatForge
AmaraRaja
ExideInds.
Motherson Sumi
SKFIndia
FAGBearings
NRBBearings
Score 9 9 8 7 7 7 9 9 9
NRB Bearings 4

8/10/2019 Spark - Bearings Sector Report
http://slidepdf.com/reader/full/spark-bearings-sector-report 15/31
#7 Competitive Landscape
Company Market Share Competitive Scenario
Bharat Forge 90% Sole supplier to most CV OEMs
WABCO-TVS 80% Duopoly (Knorr-Bremse second largest)
Exide Industries ~70% Duopoly (Amara Raja second largest)
Motherson Sumi 65% Duopoly (Tata Yazaki second largest)
Apollo Tyres ~30% Highly competitive market (top 5 players account for ~90%)
Amara Raja ~30% Duopoly (Exide Industries is the largest)
Competitive landscape Score
Bharat Forge 9
WABCO-TVS 8
Exide Inds. 7
Motherson Sumi 7
Amara Raja Batt. 6
Sector Outlook Positive
Initiating CoverageBearings Sector
#8 Impact of government policies/external factors
SKF India 65-70% / 30%
- % mar et s are n eep groove a ear ng an % nv overa
organized bearing market
FAG Bearings 18-20%Second leading player in the overall organized market with strongpresence in the cylindrical and spherical ball bearings
NRB Bearings 70% / 12%Leader in the needle roller bearing market with 70% share and 12% sharein the overall organized market
Apollo Tyres 3
SKF india 4
FAG Bearings 4
NRB Bearings 5
Company Impact of govt. policies / external factors Details
Apollo Tyres NEGATIVE Policy on import of tyres and rubber, movement to radials
Amara Raja POSITIVE Policy on disposal of used batteries, movement to VRLA
batteries
Impact of govt. policy Score
WABCO 7
Apollo Tyres 3
14
Exide Industries POSITIVE Policy on disposal of used batteries, movement to VRLA
batteries
WABCO-TVS POSITIVE Policy on mandatory ABS in certain CVs
Motherson Sumi NEUTRAL -
Bharat Forge NEUTRAL -
SKF India NEGATIVE Policy on spurious bearings and import duty
FAG Bearings NEGATIVE Policy on import duty
NRB Bearings NEGATIVE Policy on import duty
.
Bharat Forge 6
Exide Inds. 7
Motherson Sumi 6
SKF india 4
FAG Bearings 4
NRB Bearings 5
B i S t

8/10/2019 Spark - Bearings Sector Report
http://slidepdf.com/reader/full/spark-bearings-sector-report 16/31
10%
15%
20%
20%
30%
40%
50%
OCF/sales – FAG scores highest while Amara scores the lowestRoE - WABCO scores highest while Apollo scores the lowest
#9 Capital Efficiency #10 Cash Flow
6 1 2 4 8 9 1 2 5 7 3 63 5 7 4 9 8
Initiating Coverage
Sector Outlook Positive
Bearings Sector
10%
15%
0%
5%
ARBL APTY BHFC EIL MSSL W TVS SKF FAG NRB
FY11 FY12E FY13E
30%
40%
0%
10%
ARBL APTY BHFC EIL MSSL WTVS SKF FAG NRB
FY11 FY12E FY13E
Source: Spark Capital, Company. Note: CY for FAG and SKF and FY for NRB Source: Spark Capital, Company. Note: CY for FAG and SKF and FY for NRB
6 1 2 5 4 9 1 3 4 7 2 87 8 3 6 9 5
RoACE – WABCO scores the highest while Apollo scores the lowest FCF/sales – FAG scores the highest and Amara scores the lowest
-10%
-5%
0%
5%
ARBL APTY BHFC EIL MSSL WTVS SKF FAG NRB
FY11 FY12E FY13E
0%
10%
20%
ARBL APTY BHFC EIL MSSL W TVS SKF FAG NRB
FY11 FY12E FY13E
15
Source: Spark Capital, Company. . Note: CY for FAG and SKF and FY for NRB Source: Spark Capital, Company. Note: CY for FAG and SKF and FY for NRB Note: ARBL – Amara Raja Batteries, APTY. Apollo Tyres, BHFC – Bharat Forge, EIL – Exide Industries, MSSL-Motherson Sumi, WTVS-WABCO TVS
B i S t
8/10/2019 Spark - Bearings Sector Report
http://slidepdf.com/reader/full/spark-bearings-sector-report 17/31
15%
20%
25%
30%
15%
20%
25%
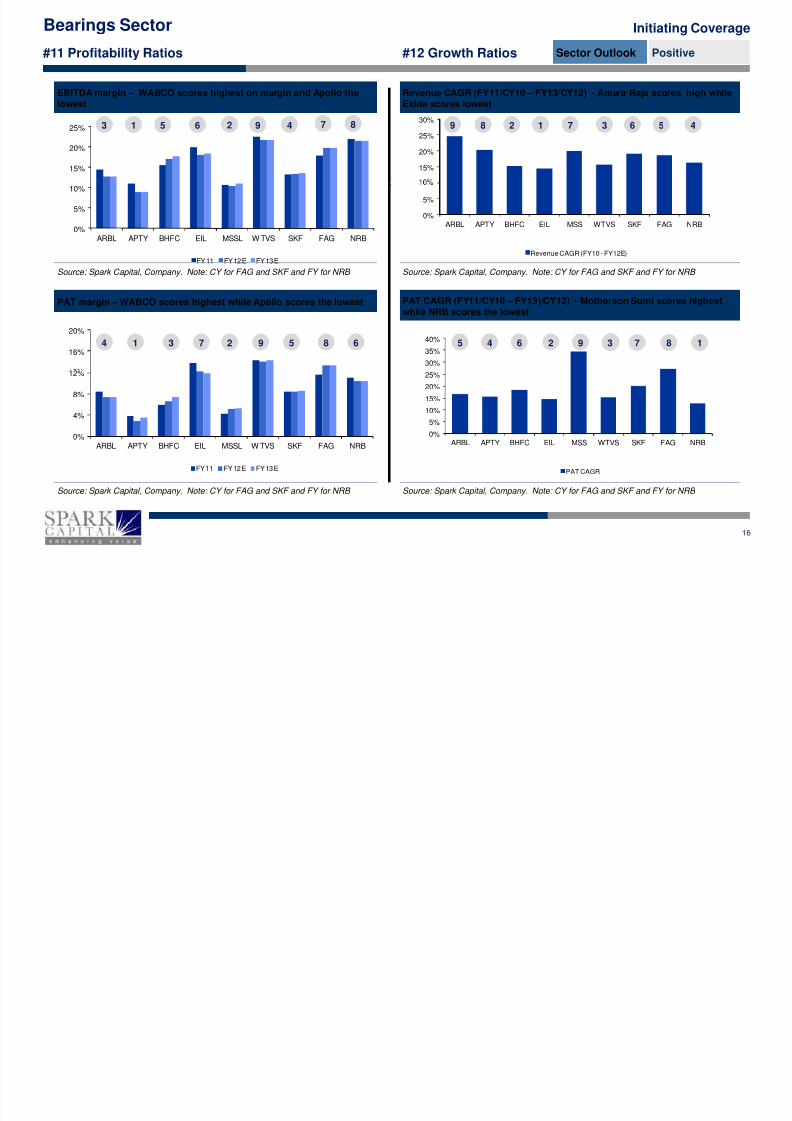
EBITDA margin – WABCO scores highest on margin and Apollo the
lowest
Revenue CAGR (FY11/CY10 – FY13/CY12) - Amara Raja scores high while
Exide scores lowest
#11 Profitability Ratios #12 Growth Ratios
3 1 5 6 2 9 9 8 2 1 7 34 7 8 6 5 4
Initiating Coverage
Sector Outlook Positive
Bearings Sector
30%
35%
40%
16%
20%
0%
5%
ARBL APTY BHFC EIL MSS WTVS SKF FAG NRB
Revenue CAGR (FY10 - FY12E)
0%
5%
10%
ARBL APTY BHFC EIL MSSL W TVS SKF FAG NRB
FY11 FY12E FY13E
PAT CAGR (FY11/CY10 – FY13)/CY12) - Motherson Sumi scores highestwhile NRB scores the lowest
Source: Spark Capital, Company. Note: CY for FAG and SKF and FY for NRB
PAT margin – WABCO scores highest while Apollo scores the lowest
Source: Spark Capital, Company. Note: CY for FAG and SKF and FY for NRB
4 1 3 7 2 9 5 4 6 2 9 55 8 6 5553 7 8 1
0%
5%
10%
15%
20%
25%
ARBL APTY BHFC EIL MSS WTVS SKF FAG NRB
PAT CAGR
0%
4%
8%
12%
ARBL APTY BHFC EIL MSSL W TVS SKF FAG NRB
FY11 FY12E FY13E
Source: Spark Capital, Company. Note: CY for FAG and SKF and FY for NRB Source: Spark Capital, Company. Note: CY for FAG and SKF and FY for NRB
16
Bearings Sector

8/10/2019 Spark - Bearings Sector Report
http://slidepdf.com/reader/full/spark-bearings-sector-report 18/31
1.5
2.0
2.5
1.0x
1.5x
Debt / Equity – WTVS, SKF and FAG scores the highest, while Apollo the
lowestTotal asset turnover (x) – NRB scores the highest while FAG scores thelowest
#13 Turnover Ratios #14 Leverage Ratios
9 3 8 6 7 5 4 1 2 6 3 64 1 2 6 6 4
Initiating Coverage
Sector Outlook Positive
Bearings Sector
0.0
0.5
1.0
ARBL APTY BHFC EIL MSSL W TVS SKF FAG NRB
FY11 FY12E FY13E
30.0%
35.0%
40.0%
50%
60%
0.0x
0.5x
ARBL APTY BHFC EIL MSSL WTVS SKF FAG NRB
FY11 FY12E FY13E
Source: Spark Capital, Company. Note: CY for FAG and SKF and FY for NRB Source: Spark Capital, Company. Note: CY for FAG and SKF and FY for NRB
Debt / Total assets – WTVS,SKF, FAG scores the highest, while Apollo thelowest
Working capital/sales - APTY scores the highest, while ARBL thelowest
2 7 4 6 9 3 5 1 2 6 3 65 8 1 6 6 4
0.0%
5.0%
10.0%
15.0%
20.0%
.
ARBL APTY BHFC EIL MSSL WTVS SKF FAG NRB
FY11 FY12E FY13E
0%
10%
20%
30%
ARBL APTY BHFC EIL MSSL WTVS SKF FAG NRB
FY11 FY12E FY13E
Source: Spark Capital, Company. Note: CY for FAG and SKF and FY for NRB Source: Spark Capital, Company. Note: CY for FAG and SKF and FY for NRB
17
8/10/2019 Spark - Bearings Sector Report
http://slidepdf.com/reader/full/spark-bearings-sector-report 19/31
Comparative analysis of bearing companies
18
I iti ti CBearings Sector

8/10/2019 Spark - Bearings Sector Report
http://slidepdf.com/reader/full/spark-bearings-sector-report 20/31
SKF India FAG Bearings
Revenue Profile
Revenue (CY10- Rs. 20.6bn) Revenue (CY10 - Rs. 10.4 bn)
Initiating Coverage
Sector Outlook Positive
Bearings Sector
Source: Company, Spark Capital Source: Company, Spark Capital
NRB Bearings
–
OEM – 70% After-market –
30%
– – –
OEM – 40% After-market –
60%
– –
Revenue (FY11- Rs. 4.66bn)
Revenue contribution from top two kinds of bearings (CY10/FY11)
SKF India NRB Bearings FAG Bearings
19
Source: Company, Spark Capital
Exports – 10%
OEM – 78% After-market –
22%
Industrial – 8%Auto – 82%
Source: Company, Spark Capital
Deep grooveball bearing
35%
Taper rollerbearing
18%
Needle rollerbearing
58%
Cylindricalbearing
16%
Cylindricalbearing
35%
Sphericalbearing
25%
Initiating CoverageBearings Sector
8/10/2019 Spark - Bearings Sector Report
http://slidepdf.com/reader/full/spark-bearings-sector-report 21/31
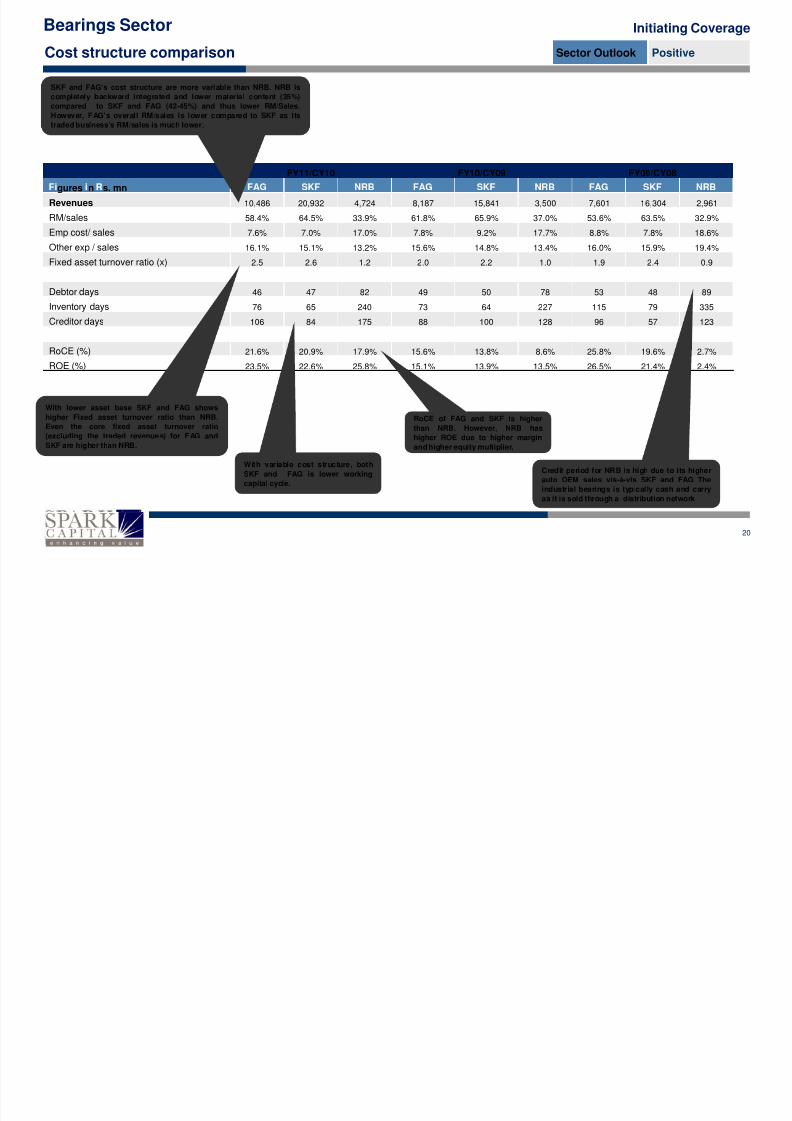
Cost structure comparison
FY11/CY10 FY10/CY09 FY09/CY08
SKF and FAG‘s cost structure are more variable than NRB. NRB is
completely backward integrated and lower material content (35%)
compared to SKF and FAG (42-45%) and thus lower RM/Sales.
However, FAG’s overall RM/sales is lower compared to SKF as its
traded business’s RM/sales is much lower.
Initiating Coverage
Sector Outlook Positive
Bearings Sector
gures n s. mn
Revenues 10,486 20,932 4,724 8,187 15,841 3,500 7,601 16,304 2,961
RM/sales 58.4% 64.5% 33.9% 61.8% 65.9% 37.0% 53.6% 63.5% 32.9%
Emp cost/ sales 7.6% 7.0% 17.0% 7.8% 9.2% 17.7% 8.8% 7.8% 18.6%
Other exp / sales 16.1% 15.1% 13.2% 15.6% 14.8% 13.4% 16.0% 15.9% 19.4%
Fixed asset turnover ratio (x) 2.5 2.6 1.2 2.0 2.2 1.0 1.9 2.4 0.9
Debtor days 46 47 82 49 50 78 53 48 89
Inventory days 76 65 240 73 64 227 115 79 335
Creditor days 106 84 175 88 100 128 96 57 123
RoCE (%) 21.6% 20.9% 17.9% 15.6% 13.8% 8.6% 25.8% 19.6% 2.7%
ROE (%) 23.5% 22.6% 25.8% 15.1% 13.9% 13.5% 26.5% 21.4% 2.4%
20
With lower asset base SKF and FAG shows
higher Fixed asset turnover ratio than NRB.
Even the core fixed asset turnover ratio
(excluding the traded revenues) for FAG and
SKF are higher than NRB.
With variable cost structure, both
SKF and FAG is lower working
capital cycle.
RoCE of FAG and SKF is higher
than NRB. However, NRB has
higher ROE due to higher margin
and higher equity multiplier.
Credit period for NRB is high due to its higher
auto OEM sales vis-à-vis SKF and FAG The
industrial bearings is typically cash and carryas it is sold through a distribution network
Initiating CoverageBearings Sector

8/10/2019 Spark - Bearings Sector Report
http://slidepdf.com/reader/full/spark-bearings-sector-report 22/31
FAG scores high on free cash flow generation
FAG historically has demonstrated higher
growth, better working capital management
which is expected to lead to higher FCF
generation.
FAG (Rs. mn) FY10/CY09 FY11/CY10 FY12E/CY11E FY13E/CY12E
Operating Cash Flow 1,634 1,320 1,684 1,980
Capex (78) (197) (225) (275)
Free Cash Flow 1,556 1,123 1,459 1,705
OCF yield (%) 8.45% 6.83% 8.71% 10.24%
Initiating Coverage
Sector Outlook Positive
Bearings Sector
Better working capital management to be the
key driver for NRB’s improvement in
operating cash flow and therefore leading to
hi her ield. The com an will continue to
FCF yield (%) 8.04% 5.81% 7.54% 8.81%
D/E (x) 0 0 0 0
SKF (Rs. mn) FY10/CY09 FY11/CY10 FY12E/CY11E FY13E/CY12E
Operating Cash Flow 2,275 1,147 2,121 2,634
Capex (629) (1160) (1000) (500)
Free Cash Flow 1,646 -13 1,121 2,134
OCF yield (%) 6.80% 3.40% 6.08% 7.54%
FCF yield (%) 4.90% 0.00% 3.21% 6.11%
D/E (x) 0 0 0 0
NRB (Rs. mn) FY10/CY09 FY11/CY10 FY12E/CY11E FY13E/CY12E
Strong growth in operating cash flow and
reduction in capex to lead to improvement
in free cash flow yield by CY12E.
21
have debt, however we believe the existing
financial leverage will be maintained.
Operating Cash Flow 755 351 675 791
Capex (122) (391) (650) (350)
Free Cash Flow 620 23 25 441
OCF yield (%) 17.10% 8.00% 14.80% 17.36%
FCF yield (%) 14.00% 0.50% 0.54% 9.68%
D/E (x) 0.44 0.44 0.5 0.47
Initiating CoverageBearings Sector

8/10/2019 Spark - Bearings Sector Report
http://slidepdf.com/reader/full/spark-bearings-sector-report 23/31
SKF India
Trading History
FAG Bearings
7x
10x
13x
16x
19x
300400500600700800900
1,000
C M P ( R s . )
7x
10x
13x16x
19x
1,000
1,500
2,000
2,500
C M P ( R s . )
Initiating Coverage
Sector Outlook Positive
Bearings Sector
NRB Bearings
Source: Bloomberg, Spark Capital Source: Bloomberg, Spark Capital
Forward P/E buckets and Frequency
4x
0100
N o v - 0 6
J a n - 0 7
M a r - 0 7
M a y - 0 7
J u l - 0 7
S e p - 0 7
N o v - 0 7
J a n - 0 8
M a r - 0 8
M a y - 0 8
J u l - 0 8
S e p - 0 8
N o v - 0 8
J a n - 0 9
M a r - 0 9
M a y - 0 9
J u l - 0 9
S e p - 0 9
N o v - 0 9
J a n - 1 0
M a r - 1 0
M a y - 1 0
J u l - 1 0
S e p - 1 0
N o v - 1 0
J a n - 1 1
M a r - 1 1
M a y - 1 1
J u l - 1 1
S e p - 1 1
12M fwd P/E
13x
16x
19x
80
100
120
( R s . )
4x
0
500
O c t - 0 6
J a n - 0 7
A p r - 0 7
J u l - 0 7
O c t - 0 7
J a n - 0 8
A p r - 0 8
J u l - 0 8
O c t - 0 8
J a n - 0 9
A p r - 0 9
J u l - 0 9
O c t - 0 9
J a n - 1 0
A p r - 1 0
J u l - 1 0
O c t - 1 0
J a n - 1 1
A p r - 1 1
J u l - 1 1
12M fwd P/E
P/E Multiple Range SKF FAG NRB
Under 8 24% 28% 16%
-
Source: Bloomberg, Spark Capital
22
Source: Company, Spark Capital; TTM PE for NRB
4x
7x
10x
0
20
40
60
S e p - 0 6
N o v - 0 6
J a n - 0 7
M a r - 0 7
M a y - 0 7
J u l - 0 7
S e p - 0 7
N o v - 0 7
J a n - 0 8
M a r - 0 8
M a y - 0 8
J u l - 0 8
S e p - 0 8
N o v - 0 8
J a n - 0 9
M a r - 0 9
M a y - 0 9
J u l - 0 9
S e p - 0 9
N o v - 0 9
J a n - 1 0
M a r - 1 0
M a y - 1 0
J u l - 1 0
S e p - 1 0
N o v - 1 0
J a n - 1 1
M a r - 1 1
M a y - 1 1
J u l - 1 1
TTM P/E
C M P ( -
10 - 12x 12% 34% 23%
12 - 14x 16% 11% 6%
14 - 16x 31% 1% 8%
16 - 18x 7% 0% 7%

8/10/2019 Spark - Bearings Sector Report
http://slidepdf.com/reader/full/spark-bearings-sector-report 24/31
Company Section
23

8/10/2019 Spark - Bearings Sector Report
http://slidepdf.com/reader/full/spark-bearings-sector-report 25/31
SKF Bearings Absolute AddCMP Rs. 671

8/10/2019 Spark - Bearings Sector Report
http://slidepdf.com/reader/full/spark-bearings-sector-report 26/31
SKF BearingsRelative OutperformTarget Rs. 727Financial Summary
Abridged Financial Statements Key metricsRs. mn CY09 CY10 CY11E CY12E CY09 CY10 CY11E CY12E
Profit & Loss Growth ratios
Revenues 15,841 20,932 25,781 29,644 Revenues -2.8% 32.1% 23.2% 15.0%
Manufacturing & Other Expenses 14,244 18,137 22,330 25,629 EBITDA -23.2% 75.0% 23.5% 16.4%
EBITDA 1,597 2,794 3,451 4,015 PAT -26.2% 87.8% 23.7% 16.7%
Depreciation 290 333 405 456 Margins
EBIT 1,307 2,461 3,045 3,559 EBITDA 10.1% 13.35% 13.38% 13.54%
Net Interest Exp / (inc) (124) (200) (246) (283) EBIT 8.3% 11.8% 11.8% 12.0%
Profit Before Tax 1,431 2,661 3,291 3,842 PAT 5.9% 8.5% 8.5% 8.6%
Tax 489 891 1,102 1,286 Leverage & WC ratios
Adj. Net Profit 942 1,770 2,190 2,556 Debt to equity (x) 0.0 0.0 0.0 0.0
Balance Shee t (Rs. mn) Current ratio (x) 2.7 2.9 2.9 3.1
Shareholders Equity 7,147 8,487 10,144 12,079 Debtor days (Sales) 50 47 47 47
Loan funds 1 0 0 0 Inventory days (COGS) 64 65 65 65
Sources of funds 7,148 8,517 10,174 12,109 Creditor Days (COGS) 100 84 84 84
Net block 2,017 2,834 3,429 3,473 Performance & turnover ratios
Investments RoACE 13.8% 20.9% 21.7% 21.3%
Capital WIP 551 359 359 359 RoAE 13.9% 22.6% 23.5% 23.0%
Current assets, loans & advances 8,236 9,586 11,457 13,995 Total asset turnover (x) 1.0 1.2 1.3 1.3
Current liabilities & provisions 3,026 3,302 4,008 4,567 Fixed asset turnover (x) 2.3 2.7 3.0 3.2
Net Current Assets 5,210 6,284 7,449 9,428 Valuation metrics
25
Application of funds 7,148 8,517 10,174 12,109 Current price (Rs.)
Cash Flows (Rs. mn) Shares outstanding (mn) 53 53 53 53
Cash flows from operations 2,275 1,147 2,121 2,634 Market capitalisation (Rs. mn) 35384 35384 35384 35384
Capex 629 1,160 1,000 500 Enterprise value (Rs. mn) 32492 33295 32604 31003
Free Cash Flow 1,646 -13 1,121 2,134 EV/EBIDTA (x) 20.3 11.9 9.4 7.7
Cash flows from investments (1,037) (1,652) (1,000) (500) Adj. Per-share earnings (Rs.) 17.9 33.6 41.5 48.5
Cash flows from financing (272) (255) (430) (533) Price-earnings multiple (x) 37.5 20.0 16.2 13.8
Cash generated during the year 2,879 2,119 2,810 4,411 Dividend yield (%) 0.60% 1.04% 1.29% 1.51%
671

8/10/2019 Spark - Bearings Sector Report
http://slidepdf.com/reader/full/spark-bearings-sector-report 27/31
NRB Bearings Absolute Not RatedCMP Rs. 47

8/10/2019 Spark - Bearings Sector Report
http://slidepdf.com/reader/full/spark-bearings-sector-report 28/31
NRB BearingsRelative Not RatedTarget N.A.Standalone Financial Summary
Abridged Financial Statements Key metrics
Rs. mn FY10 FY11 FY12E FY13E FY10 FY11 FY12E FY13E
Profit & Loss Growth ratios
Revenues 3,500 4,724 5,379 6,384 Revenues 7.9% 35.0% 13.9% 18.7%
Manufacturing & Other Expenses 466 616 703 833 EBITDA 58.1% 76.9% 11.1% 18.7%
EBITDA 590 1,044 1,159 1,377 PAT 472.5% 115.0% 7.5% 18.5%
Depreciation 195 229 266 309 Margins
, . . . .
Net Interest Exp / (inc) 77 50 88 108 EBIT 11.3% 17.3% 16.6% 16.7%Profit Before Tax 371 782 827 980 PAT 7.0% 11.1% 10.5% 10.5%
Tax 127 257 263 312 Leverage & WC ratios
Adj. Net Profit 244 525 564 669 Debt to equity (x) 0.4 0.4 0.5 0.5
Balance Shee t (Rs. mn) Current ratio (x) 0.3 0.3 0.2 0.2
Shareholders Equity 1,876 2,190 2,496 2,875 Debtor days (Sales) 78 82 82 82
Loan funds 827 971 1,252 1,352 Inventory days (COGS) 227 240 240 240
Sources of funds 2,831 3,277 3,864 4,343 Creditor Days (COGS) 128 175 175 175
Net block 1,525 1,687 2,071 2,112 Performance & turnover ratios
Investments 179 166 166 166 RoACE 8.6% 17.9% 17.1% 17.7%
Capital WIP 13 140 140 140 RoAE 13.5% 25.8% 24.1% 24.9%
Current assets, loans & advances 244 317 317 317 Total asset turnover (x) 0.9 1.1 1.1 1.3
Current liabilities & provisions 727 1,209 1,448 1,678 Fixed asset turnover (x) 1.0 1.3 1.3 1.3
Net Current Assets 1,114 1,285 1,487 1,925 Valuation metrics
27
Application of funds 2,831 3,277 3,864 4,343 Current price (Rs.)
Cash Flows (Rs. mn) Shares outstanding (mn) 97 97 97 97
Cash flows from operations 755 351 675 791 Market capitalisation (Rs. mn) 4,560 4,560 4,560 4,560
Capex 122 391 650 350 Enterprise value (Rs. mn) 5,328 5,531 5,812 5,912
Free Cash Flow 620 23 25 441 EV/EBIDTA (x) 9.0 5.3 5.0 4.3
Cash flows from investments (108) (310) (650) (350) Adj. Per-share earnings (Rs.) 2.52 5.41 5.82 6.90
Cash flows from financing (642) (29) (32) (252) Price-earnings multiple (x) 18.68 8.69 8.08 6.82
Cash generated during the year 5 12 (7) 189 Dividend yield (%) 2.1% 4.3% 4.6% 5.4%
47

8/10/2019 Spark - Bearings Sector Report
http://slidepdf.com/reader/full/spark-bearings-sector-report 29/31
FAG Bearings Absolute Not RatedCMP Rs. 1,167

8/10/2019 Spark - Bearings Sector Report
http://slidepdf.com/reader/full/spark-bearings-sector-report 30/31
gRelative Not RatedTarget N.A.Financial Summary
Abridged Financial Statements Key metrics
Rs. mn CY09 CY10 CY11E CY12E CY09 CY10 CY11E CY12E
Profit & Loss Growth ratios
Revenues 8,187 10,486 12,283 14,738 Revenues 7.7% 28.1% 17.1% 20.0%
Manufacturing & Other Expenses 7,146 8,800 10,063 12,027 EBITDA -25.6% 52.0% 28.5% 20.6%
EBITDA 1,242 1,887 2,425 2,924 PAT -31.5% 85.4% 34.8% 19.7%
Depreciation 201 201 206 213 Margins
EBIT 1,041 1,686 2,220 2,711 EBITDA 15.16% 17.99% 19.75% 19.8%
Net Interest Exp / (inc) 7 9 12 13 EBIT 12.71% 16.08% 18.07% 18.39%
Profit Before Tax 996 1,819 2,434 2,936 PAT 8.0% 11.6% 13.3% 13.3%
Tax 340 604 796 975 Leverage & WC ratios
Adj. Net Profit 655 1,215 1,638 1,961 Debt to equity (x) 0 0 0 0
Balance Shee t (Rs. mn) Current ratio (x) 3.2 3.1 3.5 3.8
Shareholders Equity 4,617 5,735 7,238 9,044 Debtor days (Sales) 49 46 46 46
Loan funds 0 0 0 0 Inventory days (COGS) 73 76 76 76
Sources of funds 4,663 5,764 7,268 9,073 Creditor Days (COGS) 88 106 106 106
Net block 1,416 1,410 1,429 1,496 Performance & turnover ratios
Investments 3 3 3 3 RoACE 15.6% 21.6% 22.8% 22.2%
Capital WIP 68 86 86 86 RoAE 15.1% 23.5% 25.2% 24.1%
Current assets, loans & advances 4,609 6,276 8,030 10,196 Total asset turnover (x) 1.0 1.1 1.1 1.1
Current liabilities & provisions 1,435 2,012 2,281 2,708 Fixed asset turnover (x) 2.0 2.5 2.9 3.2
29
Net Current Assets 3,175 4,265 5,749 7,488 Valuation metrics
Application of funds 4,663 5,764 7,268 9,073 Current price (Rs.)
Cash Flows (Rs. mn) Shares outstanding (mn) 17 17 17 17
Cash flows from operations 1,634 1,320 1,684 1,980 Market capitalisation (Rs. mn) 19,396 19,396 19,396 19,396
Capex (78) (197) (225) (275) Enterprise value (Rs. mn) 18,760 17,665 16,515 15,153
Free Cash Flow 1,556 1,123 1,459 1,705 EV/EBIDTA (x) 15.1 9.4 6.8 5.2
Cash flows from investments (444) (74) (225) (275) Adj. Per-share earnings (Rs.) 39.4 73.1 98.5 118.0
Cash flows from financing (94) (96) (97) (134) Price-earnings multiple (x) 29.6 16.0 11.8 9.9
Cash generated during the year 1,096 1,150 1,362 1,571 Dividend yield (%) 0.4% 0.4% 0.6% 0.7%
1,167

8/10/2019 Spark - Bearings Sector Report
http://slidepdf.com/reader/full/spark-bearings-sector-report 31/31