Embed Size (px)
Citation preview
1
Sparse Learning and Stability Selection for Predicting MCI to AD Conversion
Using Baseline ADNI Data
Jieping Ye PhD, Michael Farnum PhD, Eric Yang PhD, Rudi Verbeeck PhD, Victor Lobanov PhD, Nandini Raghavan PhD, Gerald Novak MD, Allitia DiBernardo MD, Vaibhav A. Narayan PhD, and the Alzheimer’s Disease Neuroimaging Initiative*
Abstract
Patients with Mild Cognitive Impairment (MCI) are at high risk of developing Alzheimer's disease (AD).
Identifying MCI individuals with high likelihood of conversion to AD and the associated biosignatures
has recently received increasing attention in AD research. Different biosignatures for AD (neuroimaging,
demographic, genetic and cognitive measures) may contain complementary information for diagnosis and
prognosis of AD. We have conducted a comprehensive study using a large number of samples from the
Alzheimer’s Disease Neuroimaging Initiative (ADNI) to test the power of integrating various baseline
data for predicting the conversion from MCI to probable AD and identifying a small subset of
biosignatures for the prediction and assess the relative importance of different modalities in predicting
MCI to AD conversion. We have employed sparse logistic regression with stability selection for the
integration and selection of potential predictors. Our study differs from many of the other ones in three
important respects: (1) we use a large cohort of MCI samples that are unbiased with respect to age or
education status between case and controls (2) we integrate and test various types of baseline data
available in ADNI including MRI, demographic, genetic and cognitive measures and (3) we apply sparse
logistic regression with stability selection to ADNI data for robust feature selection.
We have used 319 MCI subjects from ADNI that had MRI measurements at the baseline and passed
quality control, including 177 MCI Non-converters and 142 MCI Converters. Conversion was considered
over the course of a 4-year follow-up period. A combination of 15 features (predictors) including those
from MRI scans, APOE genotyping, and cognitive measures achieves the best prediction with an AUC
2
score of 0.8587. These results also demonstrate the effectiveness of stability selection for feature selection
in the context of sparse logistic regression. Addition of CSF biomarkers to the 15 previously identified
features does not provide any performance gain in predicting conversion of MCI to AD.
Author Summary
Alzheimer's disease (AD), the most common type of dementia, is characterized by the progressive
impairment of neurons and their connections resulting in loss of cognitive function and ultimately death.
To identify a biosignature that enables an earlier and more accurate diagnosis of AD, recent AD research
has focused on patients with Mild Cognitive Impairment (MCI), a transitional stage between normal
aging and the development of AD. This study addresses the problem of identifying MCI individuals with
high likelihood of conversion to AD and the associated biosignatures. We employed sparse logistic
regression with stability selection for the prediction of MCI-to-AD conversion and the selection of
biosignatures. We applied the proposed method to MCI subjects from the Alzheimer’s Disease
Neuroimaging Initiative, and our results demonstrate the promise of the proposed method.
Introduction
Alzheimer's disease (AD) is the most common type of dementia, accounting for 60-80% of age-related
dementia cases [1]. AD currently affects about 5.3 million people in the US, with a significant increase
predicted in the near future if no disease-altering therapeutics are developed [1]. In AD patients, neurons
and their connections are progressively destroyed, leading to loss of cognitive function and ultimately
death. As therapeutic intervention is most likely to be beneficial in the early stage of the disease,
identification of a biosignature that enables an earlier and more accurate diagnosis of AD is an important
goal. Mild Cognitive Impairment (MCI), a transitional stage between normal aging and the development
of AD, has been introduced to account for the intermediate cognitive state where patients are impaired on
one or more standardized cognitive tests but do not meet the criteria for clinical diagnosis of dementia [2].
The American Academy of Neurology has recognized MCI as an important clinical group to be identified
3
and monitored [3]. Patients with MCI are at high risk of converting to AD; it is estimated that 10-15% of
these patients progress to AD annually. MCI has thus attracted increasing attention, because it offers an
opportunity to target the disease process early. More recently, MCI has been further classified according
to the presence or absence of a primary memory deficit (amnestic and nonamnestic MCI, respectively),
either in relative isolation (single domain) or accompanied by other types of cognitive deficits (multiple
domain). As the amnestic form of MCI, single or multiple domain, has the greatest risk of progression to
AD, it has been a primary focus of interest in aging studies. There is thus an urgent need to address two
major research questions: (1) how can we identify MCI individuals with high likelihood of developing
AD (2) what is the biosignature most predictive of the conversion from MCI to AD. Brain atrophy
measured by MRI scans, positron emission tomography (PET) including imaging of amyloid burden, and
CSF measurements including Aβ42 and total tau (t-tau) have been the prime candidate biosignatures for
diagnosis and tracking disease progression.
Neuroimaging has been shown to be a powerful tool for the exploration of disease progression and
therapeutic efficacy in AD and MCI. Neuroimaging research offers great potential to identify features that
can identify individuals early in the course of dementing illness; several candidate neuroimaging
biosignatures have been examined in recent cross-sectional and longitudinal neuroimaging studies [4, 5].
Realizing the importance of neuroimaging, NIH in 2003 funded the Alzheimer's Disease Neuroimaging
Initiative (ADNI). All subjects in ADNI undergo 1.5T or 3T structural Magnetic Resonance Imaging
(MRI) scans. Half of the subjects undergo Positron Emission Tomography (PET) scans. While FDG-PET
scans may show a high sensitivity or specificity for the early detection of AD, the validation of structural
MRI markers is the core project in ADNI due to its greater availability, faster data acquisition, and lower
cost. Structural MRI, in particular, has great potential in enabling earlier clinical diagnosis and predicting
disease progression. Previous studies have demonstrated that the hippocampus and the entorhinal cortex
of MCI patients are typically smaller than those measured in normal controls, and are predictive of future
conversion to AD [4]. As the specificity of the prediction is still low [5], current work continues to
examine additional regions and pattern changes for more accurate prediction.
4
Besides brain atrophy measured by MRI scans, CSF measurements including total tau (t-tau),
phosphorylated tau (p-tau), and Aβ42 were identified as being among the most promising and informative
AD biosignatures. Increased CSF concentrations of t-tau and p-tau and decreased concentrations of Aβ42
are found in MCI and AD, and their combination is considered to be characteristic of AD. However, there
is considerable variability of published opinion on the utility of CSF measurements for predicting
conversion from MCI to AD [6-8]. This may be attributable to the small number of subjects used in many
of the previous studies and the variability in their measurement methodology.
In addition to MRI and CSF measurements, there are various clinical/cognitive assessment scores from
the ADNI data set that are potentially useful for the prediction of MCI-to-AD conversion, including Mini
Mental State Examination (MMSE), Clinical Dementia Rating Sum of Boxes (CDR-SB), Alzheimer’s
Disease Assessment Scale-cognitive subscale (ADAS-cog), Logical Memory immediate (LIMM) and
delayed (DELL) paragraph recall, Activities of Daily Living Score (from the Functional Activities
Questionnaire, FAQ), and Trail Making Tests: Part A (TRAA) and Part B (TRAB). Clinical/cognitive
assessments offer potential advantages over imaging or CSF biomarkers since the use of imaging and
CSF biomarkers could severely limit the number of participants screened for a study. Although MRI,
CSF, and clinical/cognitive assessments have been extensively studied in the past, few reports have
compared and combined various measurements from MCI subjects. In this study, we use a large number
of samples from ADNI to test:
(1) the ability of various baseline data (MRI, demographic, genetic and cognitive measures) for
predicting the conversion from MCI to probable AD;
(2) the power of integrating various baseline data in order to identify a biosignature (small subset of
predictive biomarkers) for prediction of the conversion from MCI to probable AD and
(3) the use of CSF biomarkers for predicting the conversion from MCI to probable AD and the
potential of increasing predictive accuracy by combining CSF biomarkers with other
measurements.
5
The main technical challenge is how to integrate effectively various baseline data for classification (MCI
Converts versus MCI Non-converts). A simple approach for data integration is to form a long vector for
each sample (subject) by concatenating the features from all baseline data, which is then fed into a
classifier such as support vector machines (SVM) [9]. To deal with the high dimension/small sample size
problem, feature selection, which selects a small subset of features for improved generalization
performance, is commonly applied. Most existing feature selection algorithms such as the t-test perform
univariate feature ranking [10], and they fail to take the feature correlation into consideration. In this
paper, we apply sparse logistic regression for feature selection, which selects a small subset of features
using the L1-norm regularization [11]. The L1-norm regularization is appealing in many applications due
to its sparsity-inducing property, convenient convexity, and strong theoretical guarantees [12]. An
important issue in the practical application of sparse logistic regression is the selection of an appropriate
amount of regularization, known as model selection. Cross validation is commonly used for model
selection, however it tends to select more features than needed. In this paper, we employed stability
selection, a method recently proposed to address the problem of proper regularization using
subsampling/bootstrapping [13].
Our study differs from others in three important respects: (1) we use a large cohort of MCI samples that
are unbiased with respect to age or education status between case and controls (2) we integrate and test
various types of baseline data available in ADNI including MRI, demographic, genetic and cognitive
measures and (3) we apply sparse logistic regression with stability selection to ADNI data for robust
feature selection.
We have evaluated sparse logistic regression with stability selection on a set of 319 MCI subjects from
ADNI, including 177 MCI Non-converters and 142 MCI Converters (the conversion was considered over
the course of a 4-year follow-up period). Our experiments show that a combination of 15 features from
MRI scans, APOE genotyping, and cognitive measures selected by sparse logistic regression with
stability selection achieves an AUC score of 0.8587.
6
Results
Baseline Characteristics
The baseline information of the 319 MCI subjects by diagnostic group (e.g., MCI Converters and MCI
Non-converters) is summarized in Table 1. There are no significant between-group differences in age
(p=0.6150) or years of education (p=0.7093) between the two groups. Both ADAS-cog total 11, which is
the 70 point total excluding Q4 (Delayed Word Recall) and Q14 (Number Cancellation), and ADAS-cog
total 13, the 85 point total including Q4 and Q14, are significantly higher for MCI Converters than for
MCI Non-Converters (p<0.001); 4 ADAS-cog subscores, including Word Recall (Q1), Delayed Word
Recall (Q4), Orientation (Q7), and Word Recognition (Q8), are much higher for MCI Converters
(p<0.001). In addition, between-group differences that represented significantly greater baseline
impairment for MCI Converters were noted for MMSE, CDR-SB, LDEL, LIMM, TRAA, TRAB, and
FAQ. Finally, MCI Converters were more likely to carry 1 or 2 APOE4 alleles than MCI Non-
converters.
Pattern Classification Using Baseline Measurements
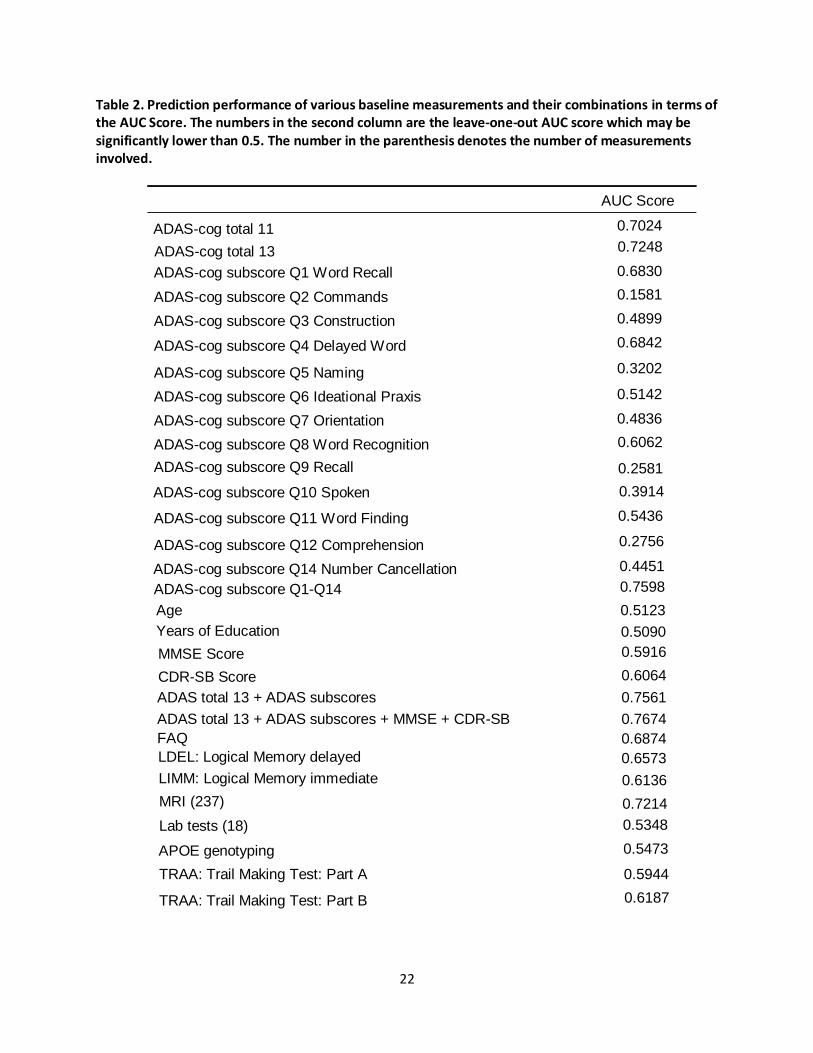
The leave-one-out AUC scores of various baseline measurements and their combinations (without feature
selection) are reported in Table 2. Note that the leave-one-out AUC score may be significantly lower than
0.5. Age (AUC=0.5123), years of education (AUC=0.5090), the combination of 18 lab tests
(AUC=0.5348), and APOE genotyping (AUC=0.5473) perform poorly for the discrimination of MCI
Non-converters and MCI Converters. MMSE achieves an AUC score of 0.5916 and CDR-SB achieves an
AUC score of 0.6064. The combination of 13 ADAS-cog subscores Q1-Q14 (AUC=0.7598) achieves a
higher AUC score than each of the 13 ADAS-cog subscores and both ADAS-cog total 11 (AUC=0.7024)
and ADAS-cog total 13 (AUC=0.7248). Among the 13 ADAS-cog subscores, ADAS-cog subscore Q1
(AUC=0.6830) and ADAS-cog subscore Q4 (AUC=0.6842) achieve the best performance. The
combination of ADAS total 13, ADAS subscores, MMSE, and CDR-SB perform better than individual
scores. A combination of 237 MRI features (see the list of MRI features in the supplemental document)
7
achieves an AUC score of 0.7214, FAQ achieves an AUC score of 0.6874, and TRAB (AUC=0.6187)
performs slightly better than TRAA (AUC=0.5944).
Data Integration and Biosignature Selection
Next, we study the integration of various baseline measurements for predicting the conversion from MCI
to probable AD and identify an optimal biosignature for the prediction. We examine two feature selection
algorithms, including univariate feature ranking based on the t-test and sparse logistic regression with
stability selection. Univariate feature ranking achieves an AUC score of 0.7935 by using the top 15
features, while sparse logistic regression with stability selection achieves an AUC score of 0.8587 by
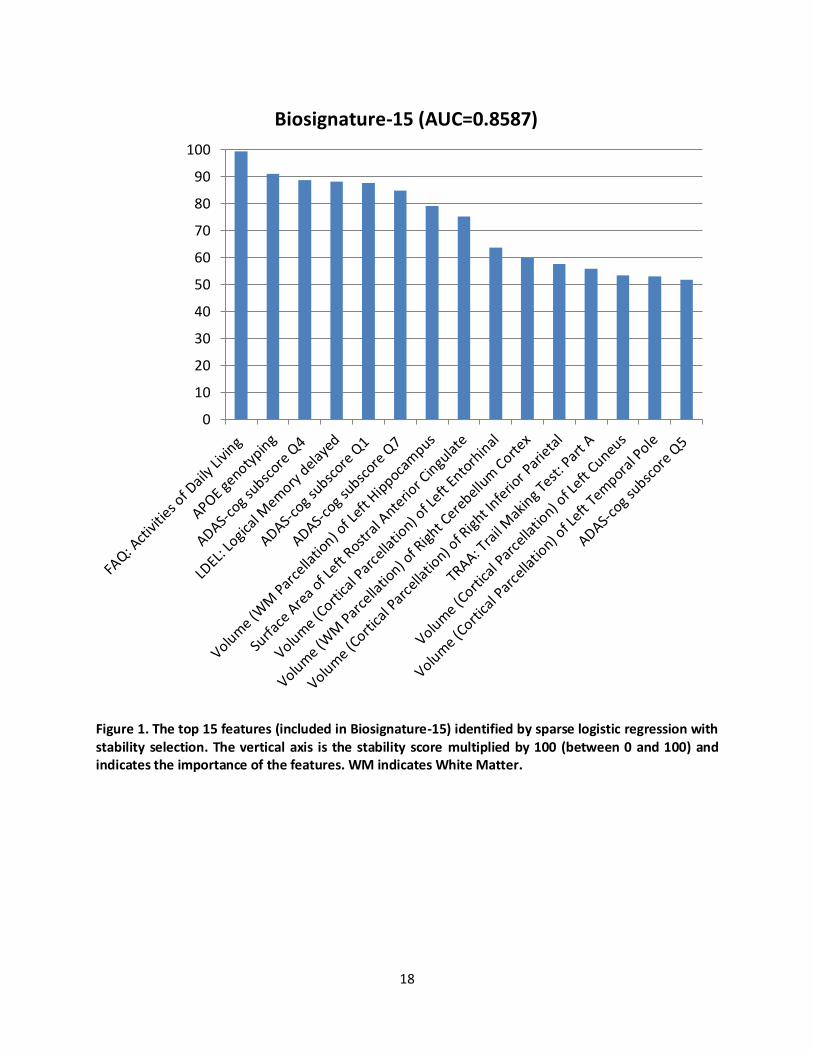
using a total of 15 features. The top 15 features identified by the stability selection (listed in Figure 1)
include FAQ: Activities of Daily Living Score, APOE genotyping, ADAS-cog subscore Q4 (Delayed
Word Recall), Logical Memory delayed, ADAS-cog subscore Q1 (Word Recall), ADAS-cog subscore Q7
(Orientation), Volume (White Matter Parcellation) of Left Hippocampus, Surface Area of Left Rostral
Anterior Cingulate, Volume (Cortical Parcellation) of Left Entorhinal, Volume (White Matter
Parcellation) of Right Cerebellum Cortex, Volume (Cortical Parcellation) of Right Inferior Parietal,
TRAA: Trail Making Test: Part A, Volume (Cortical Parcellation) of Left Cuneus, Volume (Cortical
Parcellation) of Left Temporal Pole, ADAS-cog subscore Q5 (Naming). For convenience we call this set
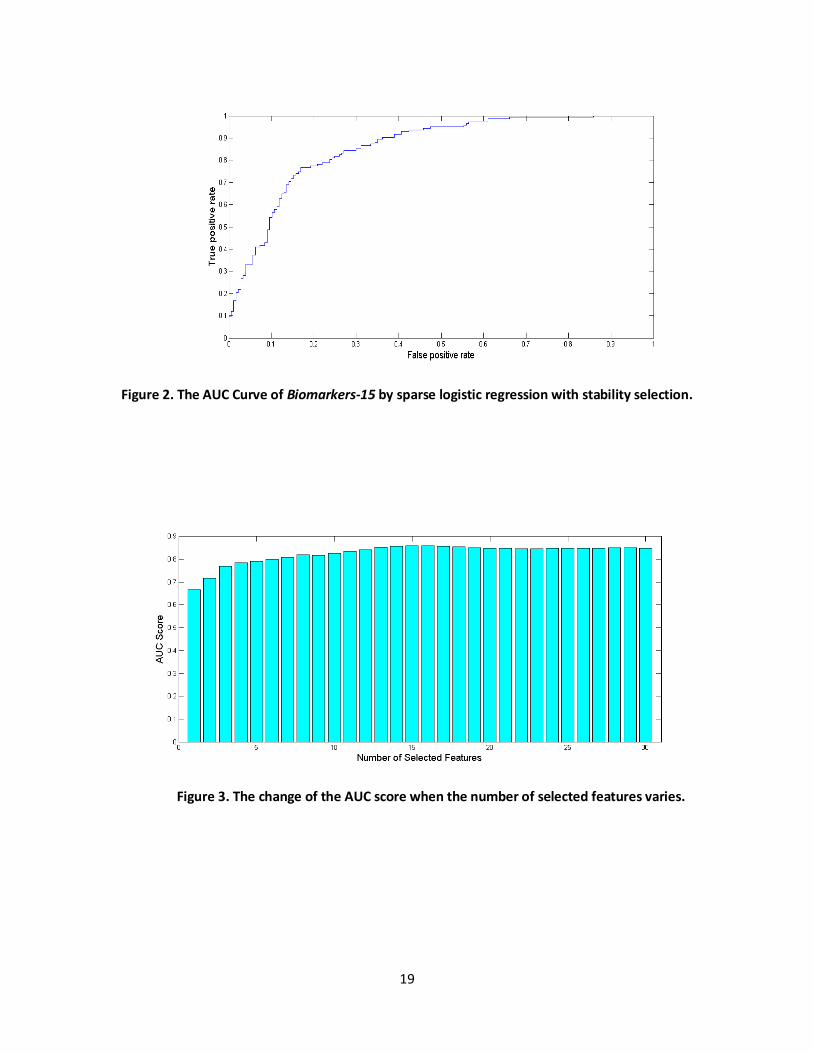
of 15 features ``Biosignature-15” in the following discussions. The corresponding AUC curve is shown in
Figure 2.
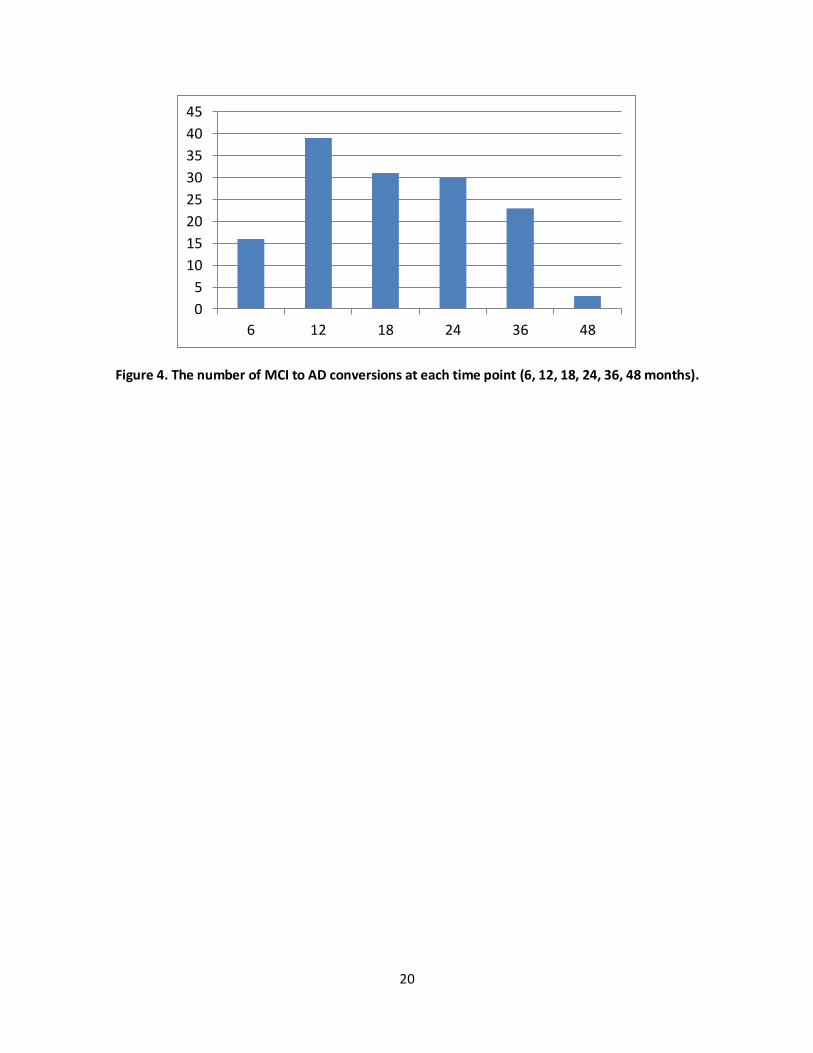
To demonstrate the stability of sparse logistic regression with stability selection, we conduct the
classification using the top T features for T=1, 2, …,30, and the results are shown in Figure 3. The
performance in terms of the AUC score is not sensitive to the number of features selected. The AUC
score stabilizes after the top 13-15 features are included; including any additional features will not further
improve the performance. Our results demonstrate the effectiveness of stability selection.
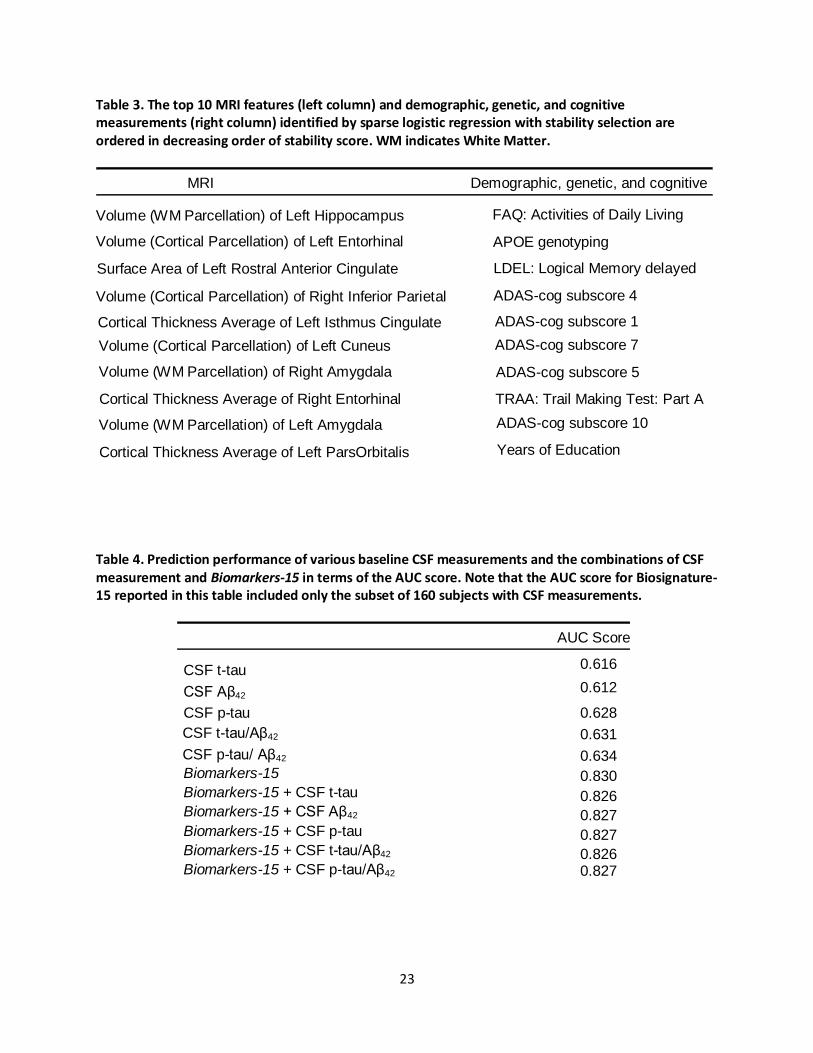
To examine the added benefit of integrating MRI features with various demographic, genetic, and
cognitive measurements, we apply sparse logistic regression with stability selection on MRI features
alone. The top 10 MRI features identified by stability selection are listed in Table 3 (left column), and the
8
AUC score is 0.7877. Table 2 shows that the combination of 237 MRI features achieves an AUC score of
0.7214. Sparse logistic regression with stability selection on the MRI features significantly improves the
performance (the AUC score improves from 0.7214 to 0.7877). In addition, we apply sparse logistic
regression with stability selection on the combination of different demographic, genetic, and cognitive
measurements excluding MRI features. The top 10 demographic, genetic, and cognitive measurements
identified by stability selection are listed in Table 3 (right column), and the AUC score is 0.8111. Most
(top) items in Figure 1 and Table 3 match; the differences are possibly due to the correlation among
different measurements, especially the correlation between the MRI features and various demographic,
genetic, and cognitive measurements.
Integration of CSF and Other Measurements
We extracted a subset of 160 MCI subjects (74 MCI Converts, 86 MCI Non-converters) with a complete
set of CSF measurements and MRI scans. We first test the ability of individual CSF biomarkers
including t-tau, Aβ42, p-tau, and two ratios (t-tau/Aβ42 and p-tau/Aβ42) for predicting the conversion
from MCI to probable AD, and the results are summarized in Table 4. Similar to a previous study [7], we
evaluated the performance of combing individual CSF biomarkers with the biosignatures included from
the larger data set excluding CSF measurements called Biosignature-15 (see Figure 1). The results in
Table 4 showed that (1) the CSF biomarkers do not perform as well as Biosignature-15; and (2) the
inclusion of the CSF biomarkers does not improve the performance of Biosignature-15. Note that the
AUC for Biosignature-15 reported in Table 4 included only the subset of 160 subjects with CSF
measurements.
Discussion
These results demonstrate the effectiveness of sparse logistic regression with stability selection for (1)
integrating various baseline data from ADNI (MRI, demographic, genetic and cognitive measures) for
predicting the conversion from MCI to probable AD; and (2) identifying a small set of strong predictors.
9
Many of the selected features in Biosignature-15 have been identified to be important in characterizing
AD. Biosignature-15 includes 3 ADAS-cog subscores (Q4, Q1, Q7) in the top 6. These three subscores
contribute the largest weights to the ensemble tree-based predictive model (Random Forest) in [16] and
are primarily tests of memory, a key cognitive domain affected early by the disease. Specifically, Q1 and
Q4 are memory tests, which have face validity; Q7 is orientation but involves memory to recall the date,
time of day, and place.
Most of the MRI features in Biosignature-15 are volumes known to be reduced in AD. The hippocampus
and entorhinal cortex have long been known as the first areas to be affected in Alzheimer's Disease, both
on histology and via gross morphological changes visible on imaging [17-22]. The entorhinal cortex is
located in the medial temporal lobe and functions as a hub in a widespread network for memory and
navigation. The hippocampus is also located in the medial temporal lobe and plays important roles in
memory, both for registration and recall and spatial navigation. Changes in the temporal region have been
shown to be a good predictor of the progression of AD [23, 24]. Other studies have also detected a
surprising correlation between cerebellar atrophy and AD, as have we. It was demonstrated in [25, 26]
that the atrophy of the cerebellum, a brain region not associated with the cortical pathology of AD or
typically thought to have a role in cognition and generally believed to be involved only late in AD, was
found to be significantly correlated with clinical severity of the disease. One study [27] suggested that
metabolism in areas such as cerebellum was correlated with deficits in neuropsychological function.
Finally, it has been shown previously that the rostral anterior cingulate is affected in AD [5, 28]. The
anterior cingulate cortex is cytoarchitectonically and functionally divided into parts; the rostral division
has connections to limbic and paralimbic structures including the amygdala and hippocampus. The
atrophy of the caudal portion of the anterior cingulate was shown to be predictive of conversion to AD in
memory impaired subjects, suggesting that this structure might be affected relatively early in the course of
the disease [29, 30]. All four cingulate regions were shown to be significantly smaller in AD cases
compared with controls; the atrophy in the posterior cingulate region was significantly greater than that in
other cingulate regions [28].
10
Several previous studies [4, 24, 31] also achieve good prediction performance; however, in all these
studies, the classes (MCI Converts and MCI Non-Converts) were stratified by age, and thus age was also
predictive. In several other studies, as in ours, age does not stratify the two classes, and thus is not a
relevant predictor. Querbes et al. (2009) developed a normalized thickness index which was computed
using the subset of regions (right medial temporal, left lateral temporal, right posterior cingulate) and
achieved an AUC score of 0.76 [15]. There were 122 MCI subjects used in this study including 50 MCI
Non-converters and 72 MCI Converters (the conversion was considered over the course of a 2-year time
period). In their study, age, years of education, MMSE, and Trail Making test B achieved an AUC score
of 0.52, 0.53, 0.64, and 0.72, respectively. Misra et al. (2009) used MRI scans to predict the short-term
conversion from MCI to AD and achieved an AUC score of 0.77 [14]. There were 103 MCI subjects used
in that study including 76 MCI Non-converters and 27 MCI Converters. In comparison, we achieve a
higher AUC score (0.8587) with a larger sample size (319 MCI subjects) and a larger number of baseline
measurements.
The combination of demographic, genetic, and cognitive measurements outperforms MRI alone for
predicting the MCI to AD conversion. These demographic, genetic, and cognitive measurements can
potentially be used to pre-screen a large number of participants for large-scale AD studies. In addition,
stability selection provides a small subset of candidate demographic, genetic, and cognitive measurements
(see Table 3) for effective and efficient screens. In a recent study [16], an ensemble tree-based predictive
model (Random Forest) was built to predict MCI Converters within 1 year. Their results show that the
addition of MRI features to the cognitive markers did not achieve performance gain. However, our results
show that the integration of demographic, genetic, and cognitive measurements and MRI features using
sparse logistic regression with stability selection achieves a much higher AUC score (AUC=0.8587) than
MRI markers alone. The result demonstrates the benefit of integrating MRI features with various
demographic, genetic, and cognitive measurements for the prediction.
The results in Table 4 showed that the CSF biomarkers are not very effective for the MCI-to-AD
prediction. Shaw et al. (2009) showed that CSF measurements are the most informative markers for
11
distinguishing AD patients from normal controls and the differences between MCI Converters and MCI
Non-Converters are significant [6]. However, their analysis is based on a total of 37 MCI subjects. It is
mentioned in the paper: ``Because of the small numbers of subjects, it is important to be cautious about
drawing any definitive conclusions from these subjects.” A recent study [7] conducted by the same group
showed that MRI and CSF achieved the best AUC score of 0.734, the CSF biomarkers performed slightly
worse than MRI features, and the combination of MRI and CSF achieved a lower AUC score than MRI.
In [32], mixture modeling approaches were used to apply the CSF measurements in the diagnosis of AD.
The proposed approach showed 100% sensitivity in 57 patients with MCI who were clinically progressing
towards AD over the course of a 5-year time period. However, no specificity result was reported. We find
that while in the current ADNI cohort, all MCI Converters show an aberrant CSF signature (defined as
high p-tau i.e. >23 pg/mL and low Aβ42 i.e. <192 pg/mL), such a CSF signature is also present in many
MCI Non-converters. It has been surmised that the subset with the CSF signature will likely convert to
AD in the future. However, ADNI is an on-going study, and based on the data currently available, CSF
markers do not show enough specificity to discriminate between MCI to AD Converters and Non-
converters.
Our findings are consistent with several recent reports in the literature. In [33], no association between
MMSE change and change in levels of CSF biomarkers was reported, whereas brain atrophy was
predictive of MMSE change. Vemuri et al. (2009) investigated the relationship between baseline MRI and
CSF biomarkers and subsequent change in cognitive and functional abilities, which were modeled as
average CDR–SB and MMSE scores over a 2-year period [34]. Their results showed that MRI biomarkers
were better predictors of subsequent cognitive/functional change than CSF biomarkers. In a recent study
[8], it was shown that baseline MRI morphometry was more related to clinical change as indexed by
CDR-SB than were CSF biomarkers. These studies suggest a stronger association between brain atrophy
measured by MRI and progression of clinical symptoms measured by CDR–SB and/or MMSE than
between CSF levels and progression of clinical symptoms. It is possible that CSF biomarkers are more
12
sensitive to transition from NC to MCI than to progression of clinical symptoms within MCI patients. The
results presented in this paper are consistent with these observations.
Materials and Methods
ADNI Participants
The data used in this study were obtained from the ADNI database (www.loni.ucla.edu/ADNI). Data used
for our analyses were accessed on August 8, 2010. ADNI was launched in 2003 by the National Institute
on Aging, the National Institute of Biomedical Imaging and Bioengineering, the Food and Drug
Administration, private pharmaceutical companies, and nonprofit organizations. The main objective of
ADNI is to develop a multi-site, longitudinal, and prospective study of normal cognitive aging, MCI, and
AD. The initiative will facilitate the scientific evaluation of neuroimaging including MRI, PET, other
biomarkers, and clinical and neuropsychological assessments for the onset and progression of MCI and
AD. At the approximately 50 clinical sites involved in the ADNI in the US and Canada, investigators will
collect serial clinical, neuropsychological, biological, and imaging data on about 400 people with MCI,
200 with early AD, and 200 elderly normal controls. The identification of sensitive and specific markers
of very early AD progression will facilitate the diagnosis of early AD and the development, assessment,
and monitoring of new treatments.
Subject Characteristics and Schedule of Assessments in ADNI
There were 319 MCI subjects included in this study including 177 MCI Non-converters and 142 MCI
Converters. We only used a subset of the MCI subjects from ADNI which had MRI measurements at
baseline and passed quality control. The conversion was considered over the course of a 4-year time
period. General inclusion/exclusion criteria for MCI subjects are as follows: MMSE scores between 24
and 30 (inclusive; exceptions made on a case-by-case basis), memory complaint, objective memory loss
measured by education adjusted scores on Wechsler Memory Scale Logical Memory II, CDR of 0.5,
absence of significant levels of impairment in other cognitive domains, essentially preserved activities of
13
daily living, and an absence of dementia. Thus, this corresponds to criteria for amnestic MCI. ADNI
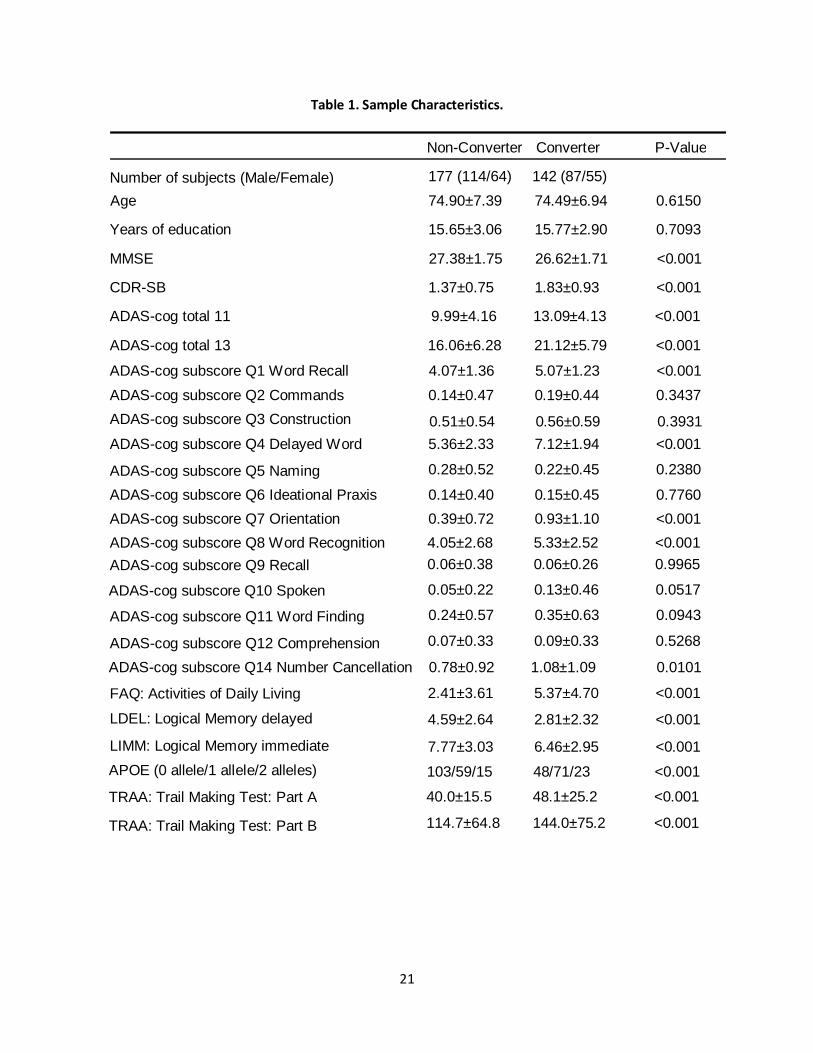
eligibility criteria are described at http://www.adni-info.org. MCI individuals at ADNI were assessed by
neuroimaging at baseline, 6, 12, 18, 24, 36, 48 months. The number of MCI to AD conversions at each
time point (6, 12, 18, 24, 36, 48 months) is summarized in Figure 4.
All participants received 1.5 Tesla (T) structural MRI. The analyses in this study were based on the
imaging data from the ADNI database processed by the team at the University of California at San
Francisco, which performed cortical reconstruction and volumetric segmentation with the Freesurfer
image analysis suite (http://surfer.nmr.mgh.harvard.edu/). The detailed procedure is available at
http://adni.loni.ucla.edu/research/imaging-analysis/. A list of 237 MRI features used in this study is
provided at the supplemental document. More details on ADNI neuroimaging instrumentation and
procedures [35] can be found at www.loni.ucla.edu. About 50% of MCI subjects (74 MCI Converts, 86
MCI Non-converters) have a complete set of CSF measurements and MRI scans at the baseline. CSF was
analyzed at the ADNI Biomarker Core laboratory at the University of Pennsylvania Medical Center.
A number of clinical/cognitive assessment scores were used in this study, including Mini Mental State
Examination (MMSE), Clinical Dementia Rating Sum of Boxes (CDR-SB), Alzheimer’s Disease
Assessment Scale-cognitive subscale (ADAS-cog), Logical Memory immediate (LIMM) and delayed
(DELL) paragraph recall, Activities of Daily Living Score (from the Functional Activities Questionnaire,
FAQ), and Trail Making Tests: Part A (TRAA) and Part B (TRAB).
The following 18 lab tests were included in our study: Test RCT1-Total Bilirubin, Test RCT11-Serum
Glucose, Test RCT12-Total Protein, Test RCT13-Albumin, Test RCT14-Creatine Kinase, Test RCT1407-
Alkaline Phosphatase, Test RCT1408-Lactate Dehydrogenase (LDH), Test RCT183-Calcium (EDTA),
Test RCT19-Triglycerides (GPO), Test RCT20-Cholesterol (High Performance), Test RCT29-Direct
Bilirubin, Test RCT3-GGT, Test RCT392-Creatinine (Rate Blanked), Test RCT4-Alanine
aminotransferase (ALT), Test RCT5-aspartate aminotransferase, Test RCT6-Urea Nitrogen, Test RCT8-
Serum Uric Acid, and Test RCT9-Phosphorus.
14
We report the P-value of various baseline measurements computed by 2-sample t-test. To test the ability
of various baseline data for predicting the conversion from MCI to probable AD, we apply support vector
machines (SVM) on each type of baseline measurement to build the classifier [9]. SVM finds a maximum
margin separating hyperplane between two classes. It leads to a straightforward learning algorithm that
can be reduced to a convex optimization problem. We evaluate the prediction performance in terms of the
area under the curve (AUC) score [36], commonly used in the literature. Specifically, we report the leave-
one-out AUC score, in which we build an SVM model on all but one MCI subject and apply the
classification model to predict the left-out MCI subject, and we repeat this procedure for all MCI subjects.
Biosignature Selection via Sparse logistic regression with Stability Selection
We employed sparse logistic regression based on the L1 norm regularization for biosignature (feature)
selection. Let x∈Rp denote a sample of p features, and let y∈{-1,+1} be the associated (binary) class label
(y=1 for MCI Converts and y=-1 for MCI Non-converts). The logistic regression model is given by:
Prob(y|x)=1/(1+exp(-y(wT x+c)))
where Prob(y|x) is the conditional probability of y, given x, w∈Rp is a weight vector, and c∈R is the
intercept. The expression wT x+c=0 defines a hyperplane in the feature space, on which Prob(y|x) = 0.5.
The conditional probability Prob(y|x) is larger than 0.5 if wT x+c has the same sign as y, and less than 0.5
otherwise.
Suppose that we are give a set of n training data {xi,yi}, i=1,2,…,n, where xi∈Rp denotes the i-th sample
and yi∈{-1,+1} denotes the corresponding class label. The likelihood function associated with these n
samples is defined as ∏i Prob(yi│xi). The negative log-likelihood function is called the (empirical)
logistic loss, and the average logistic loss is defined as:
g(w,c) = -1/n log Prob(yi│xi)= 1/n log(1+exp(-yi (wT xi+c) ) )
which is a smooth and convex function. We can determine w and c by minimizing the average logistic
loss as follows: min(w,c) g(w,c), which is a smooth convex optimization problem. For high-dimensional
data directly solving the logistic regression problem may lead to overfitting. A standard technique to
15
prevent overfitting is regularization. The use of the L1 norm regularization leads to the L1 regularized
logistic regression: min(w,c) g(w,c) + λ ||w||1, where λ>0 is a regularization parameter. It is well known that
the use of the L1 regularization leads to a sparse model, i.e., many of the entries of w are zero, thus
achieving feature selection [11]. The resulting optimization problem is convex and non-smooth. In this
study, the SLEP (Sparse Learning with Efficient Projections) package that we recently developed is used
for solving sparse logistic regression [37].
One major challenge in the use of sparse logistic regression especially for small sample size problems is
the estimation of the right amount of regularization (the value of λ), which determines the number of
features selected. When λ =0 all features are likely to be included in the model. As λ>0 increases, the
number of features selected decreases. In this paper, we employed stability selection, a method recently
proposed to address the problem of proper regularization using subsampling/bootstrapping [13]. We used
bootstrapping in our experiments. The key to stability selection is to perturb the data (e.g. by subsampling
or bootstrapping) many times and choose features that occur in a large fraction (determined by a
parameter τ described below) of the resulting selection sets. Thus, choosing the right value of the
regularization parameter λ becomes much less critical using the stability selection approach, and we have
a better chance of selecting truly relevant features. The key steps of stability selection include:
Draw a bootstrap sample Bt of size n.
For a given value of the regularization parameter λ (>0), run the sparse logistic regression
algorithm on Bt to get the optimal solution wλ. Denote Sλ(Bt) ={j: wjλ ≠ 0} as the set of features
selected by sparse logistic regression.
Repeat the above two steps N times (t=1, 2, …, N) and compute the relative selection
frequencies: Πjλ = ∑t I(j ∈Sλ (Bt))/N, j = 1, 2, …, p, where I(⋅) is the indicator function defined as
follows: I(g) = 1 if g is true and I(g) = 0 otherwise. That is, Πjλ is defined as the fraction of
bootstrap experiments for which the j-th feature is selected.
Repeat the above procedure for a sequence of M regularization parameters Λ = {λ1, λ1, …., λM}.
16
Stability selection outputs the following feature set: Sstable = {j: maxλ∈Λ Πjλ ≥ τ}, where τ>0 is a
given threshold value, i.e., a feature is finally selected if, for at least one value of λ, the fraction of
bootstrap experiments for which the feature is selected exceeds the threshold τ. In the following,
we call maxλ∈Λ Πjλ the stability score of the j-th feature.
In our experiments, we set N = 1000, Λ = {i*0.005, i = 1,2,…,60} (M=60), and τ = 0.5. Our experimental
results showed that the classification was not sensitive to τ. Stability selection outlined above is
appealing in that it has strong theoretical guarantees. Specifically, it has been shown that
subsampling/bootstrapping in conjunction with L1-regularized estimation requires much weaker
assumptions on the data for asymptotically consistent feature selection than what is needed for the
traditional L1-regularized scheme [13]. Subsampling/bootstrapping is commonly used for asymptotic
statistical inference in terms of standard errors, confidence intervals and statistical testing; one of the
distinguishing features of stability selection lies in the marriage of subsampling/bootstrapping and high-
dimensional feature selection algorithms which yields finite sample familywise error control and
dramatically improves feature selection [13].
We compare sparse logistic regression with stability selection to t-test, which ranks features by
calculating a ratio between the difference of two class means and the variability of the two classes [10].
With the selected features (either by t-test or sparse logistic regression with stability selection), we apply
support vector machines (SVM) to build the classifier [9]. We evaluate the prediction performance of
different algorithms in terms of the leave-one-out AUC score.
Conclusions
In this paper we have demonstrated the application of sparse logistic regression and stability selection for
integrating various baseline ADNI data (MRI, CSF, demographic, genetic, and cognitive measures) for
predicting the conversion from MCI to probable AD and identifying a small subset of biosignatures for
the prediction. Sparse logistic regression with stability selection combines the strengths of two

17
approaches well-known in the literature to yield a robust set of biosignatures, called Biosignature-15. We
further show that sparse logistic regression with stability selection achieves very good predictive
performance, with an AUC of 0.8587, which is significantly higher than previous known results using
data that, similar to ours, are not age-stratified. Additional studies are required to test the generalization
ability of Biosignature-15. In addition, further analysis is needed to determine whether the combination of
various baseline measurements can predict the time-to-conversion.
18
Figure 1. The top 15 features (included in Biosignature-15) identified by sparse logistic regression with stability selection. The vertical axis is the stability score multiplied by 100 (between 0 and 100) and indicates the importance of the features. WM indicates White Matter.
0
10
20
30
40
50
60
70
80
90
100
Biosignature-15 (AUC=0.8587)
19
Figure 2. The AUC Curve of Biomarkers-15 by sparse logistic regression with stability selection.
Figure 3. The change of the AUC score when the number of selected features varies.
20
Figure 4. The number of MCI to AD conversions at each time point (6, 12, 18, 24, 36, 48 months).
0
5
10
15
20
25
30
35
40
45
6 12 18 24 36 48
21
Table 1. Sample Characteristics.
Age
Years of education
MMSE
CDR-SB
ADAS-cog total 11
ADAS-cog total 13
ADAS-cog subscore Q1 Word Recall
ADAS-cog subscore Q2 Commands
ADAS-cog subscore Q3 Construction
ADAS-cog subscore Q4 Delayed Word
Recall ADAS-cog subscore Q5 Naming
ADAS-cog subscore Q6 Ideational Praxis
ADAS-cog subscore Q7 Orientation
ADAS-cog subscore Q8 Word Recognition
ADAS-cog subscore Q9 Recall
Instructions ADAS-cog subscore Q10 Spoken
Language ADAS-cog subscore Q11 Word Finding
ADAS-cog subscore Q12 Comprehension
ADAS-cog subscore Q14 Number Cancellation
FAQ: Activities of Daily Living
Score LDEL: Logical Memory delayed
LIMM: Logical Memory immediate
Number of subjects (Male/Female)
APOE (0 allele/1 allele/2 alleles)
TRAA: Trail Making Test: Part A
TRAA: Trail Making Test: Part B
Non-Converter Converter P-Value
27.38±1.75 26.62±1.71 <0.001
16.06±6.28 21.12±5.79 <0.001
4.07±1.36 5.07±1.23 <0.001
177 (114/64) 142 (87/55)
7.77±3.03 6.46±2.95 <0.001
103/59/15 48/71/23 <0.001
40.0±15.5 48.1±25.2 <0.001
114.7±64.8 144.0±75.2 <0.001
4.59±2.64 2.81±2.32 <0.001
1.37±0.75 1.83±0.93 <0.001
15.65±3.06 15.77±2.90 0.7093
74.90±7.39 74.49±6.94 0.6150
9.99±4.16 13.09±4.13 <0.001
2.41±3.61 5.37±4.70 <0.001
0.78±0.92 1.08±1.09 0.0101
0.07±0.33 0.09±0.33 0.5268
0.24±0.57 0.35±0.63 0.0943
0.05±0.22 0.13±0.46 0.0517
0.06±0.38 0.06±0.26 0.9965
4.05±2.68 5.33±2.52 <0.001
0.39±0.72 0.93±1.10 <0.001
0.14±0.40 0.15±0.45 0.7760
0.28±0.52 0.22±0.45 0.2380
5.36±2.33 7.12±1.94 <0.001
0.51±0.54 0.56±0.59 0.3931
0.14±0.47 0.19±0.44 0.3437
22
Table 2. Prediction performance of various baseline measurements and their combinations in terms of the AUC Score. The numbers in the second column are the leave-one-out AUC score which may be significantly lower than 0.5. The number in the parenthesis denotes the number of measurements involved.
AUC Score
0.7024 ADAS-cog total 11
0.6830
0.1581
0.4899
0.6842
0.3202
0.5142
0.2581
0.3914
0.5436
0.2756
0.4836
0.6062
0.7248 ADAS-cog total 13
0.4451
ADAS-cog subscore Q1 Word Recall
ADAS-cog subscore Q2 Commands
ADAS-cog subscore Q3 Construction
ADAS-cog subscore Q4 Delayed Word
Recall ADAS-cog subscore Q5 Naming
ADAS-cog subscore Q6 Ideational Praxis
ADAS-cog subscore Q7 Orientation
ADAS-cog subscore Q8 Word Recognition
ADAS-cog subscore Q9 Recall
Instructions ADAS-cog subscore Q10 Spoken
Language ADAS-cog subscore Q11 Word Finding
ADAS-cog subscore Q12 Comprehension
ADAS-cog subscore Q14 Number Cancellation
0.7598 ADAS-cog subscore Q1-Q14
MMSE Score
CDR-SB Score
ADAS total 13 + ADAS subscores
ADAS total 13 + ADAS subscores + MMSE + CDR-SB
FAQ
MRI (237)
Lab tests (18)
Years of Education
APOE genotyping
0.5916
0.6064
0.7561
0.7674
0.6874
0.7214
0.5090
0.5473
LDEL: Logical Memory delayed
0.6573
LIMM: Logical Memory immediate
0.6136
Age 0.5123
TRAA: Trail Making Test: Part A
TRAA: Trail Making Test: Part B
0.5944
0.6187
0.5348
23
Table 3. The top 10 MRI features (left column) and demographic, genetic, and cognitive measurements (right column) identified by sparse logistic regression with stability selection are ordered in decreasing order of stability score. WM indicates White Matter.
Table 4. Prediction performance of various baseline CSF measurements and the combinations of CSF measurement and Biomarkers-15 in terms of the AUC score. Note that the AUC score for Biosignature-15 reported in this table included only the subset of 160 subjects with CSF measurements.
AUC Score
CSF t-tau
CSF Aβ42
CSF p-tau
CSF t-tau/Aβ42
CSF p-tau/ Aβ42
Biomarkers-15
Biomarkers-15 + CSF t-tau
0.616
1 0.612
2 0.628
8 0.631
0 0.634
2 0.830
6 0.826
7 Biomarkers-15 + CSF Aβ42 0.827
8 Biomarkers-15 + CSF p-tau 0.827
9 Biomarkers-15 + CSF t-tau/Aβ42 0.826
8 Biomarkers-15 + CSF p-tau/Aβ42 0.827
3
Demographic, genetic, and cognitive
measuremeasurements Volume (WM Parcellation) of Left Hippocampus
Volume (Cortical Parcellation) of Left Entorhinal
Surface Area of Left Rostral Anterior Cingulate
Volume (Cortical Parcellation) of Right Inferior Parietal
FAQ: Activities of Daily Living
APOE genotyping
LDEL: Logical Memory delayed
ADAS-cog subscore 4
Volume (Cortical Parcellation) of Left Cuneus
ADAS-cog subscore 1
Volume (WM Parcellation) of Right Amygdala
Cortical Thickness Average of Right Entorhinal
Cortical Thickness Average of Left Isthmus Cingulate
ADAS-cog subscore 7
ADAS-cog subscore 5
TRAA: Trail Making Test: Part A
Volume (WM Parcellation) of Left Amygdala
Cortical Thickness Average of Left ParsOrbitalis
ADAS-cog subscore 10
Years of Education
MRI
24
References
1. Alzheimer's Association. Alzheimer's Disease Facts and Figures. Available at http://www.alz.org/. 2010.
2. Petersen, R.C., Mild Cognitive Impairment Clinical Trials. Nature Review, 2003. 2: p. 646-653. 3. Petersen, R.C., et al., Practice parameter: early detection of dementia: mild cognitive impairment
(an evidence-based review): report of the Quality Standards Subcommittee of the American Academy of Neurology. Neurology 2001. 56: p. 1133-1142.
4. Devanand, D.P., et al., Hippocampal and entorhinal atrophy in mild cognitive impairment: prediction of Alzheimer disease. Neurology 2007. 68: p. 828-36.
5. Fennema-Notestine, C., et al., Structural MRI Biomarkers for Preclinical and Mild Alzheimer's Disease. Hum Brain Mapp 2009. 30(10): p. 3238-3253.
6. Shaw, L.M., et al., Cerebrospinal fluid biomarker signature in Alzheimer’s disease neuroimaging initiative subjects. Ann. Neurol. , 2009. 65: p. 403-413.
7. Davatzikos, C., et al., Prediction of MCI to AD conversion, via MRI, CSF biomarkers, and pattern classification. Neurobiology of Aging, 2010.
8. Fjell, A., et al., CSF Biomarkers in Prediction of Cerebral and Clinical Change in Mild Cognitive Impairment and Alzheimer’s Disease. Journal of Neuroscience 2010. 30(6): p. 2088-2101.
9. Vapnik, V., The Nature of Statistical Learning Theory. 1995: Springer. 10. Guyon, I. and A. Elisseeff, An introduction to variable and feature selection. Journal of Machine
Learning Research, 2003. 3: p. 1157-1182. 11. Tibshirani, R., Regression shrinkage and selection via the lasso. J. Royal. Statist. Soc B, 1996.
58(1): p. 267-288. 12. Candès, E.J. and M. Wakin, An introduction to compressive sampling. IEEE Signal Processing
Magazine, 2008. 25(2): p. 21-30. 13. Meinshausen, N. and P. Bühlmann, Stability selection (with discussion). J. R. Statist. Soc. B, 2010.
72(4): p. 417-473. 14. Misra, C., Y. Fan, and C. Davatzikos, Baseline and longitudinal patterns of brain atrophy in MCI
patients, and their use in prediction of short-term conversion to AD: Results from ADNI. NeuroImage, 2009. 44(4): p. 1415-1422.
15. Querbes, O., et al., Early diagnosis of Alzheimer's disease using cortical thickness: impact of cognitive reserve. Brain 2009. 132: p. 2036-2047.
16. Llano, D.A., G. Laforet, and V. Devanarayan, Derivation of a New ADAS-cog Composite Using Tree-based Multivariate Analysis: Prediction of Conversion From Mild Cognitive Impairment to Alzheimer Disease. Alzheimer Dis Assoc Disord, 2010.
17. Braak, H. and E. Braak, Neuropathological stageing of Alzheimer-related changes. Acta Neuropathologica 1991. 82(4): p. 239-259.
18. Thal, D.R., et al., Phases of Aβ-deposition in the human brain and its relevance for the development of AD. Neurology 2002. 58: p. 1791-1800.
19. Fox, N.C., P.A. Freeborough, and M.N. Rossor, Visualisation and quantification of rates of atrophy in Alzheimer's disease. Lancet, 1996. 348(9020): p. 94-97.
20. Schott, J.M., et al., Assessing the onset of structural change in familial Alzheimer's disease. Annals of Neurology 2003. 53(2): p. 181-188.
21. Pennanen, C., et al., Hippocampus and entorhinal cortex in mild cognitive impairment and early AD. Neurobiology of aging 2004. 25(3): p. 303-310.
22. Jack, C.R., et al., MR-based hippocampal volumetry in the diagnosis of Alzheimer’s disease. Neurology 1992. 42(1): p. 183-188.
25
23. Eckerström, C., et al., Small baseline volume of left hippocampus is associated with subsequent conversion of MCI into dementia: The Göteborg MCI study Journal of the Neurological Sciences 2008. 272: p. 48-59.
24. Visser, P.J., et al., Medial temporal lobe atrophy predicts Alzheimer’s disease in patients with minor cognitive impairment. J Neurol Neurosurg Psychiatry 2002. 72: p. 491-7PMID: 11909909.
25. Thomanna, P.A., et al., The cerebellum in mild cognitive impairment and Alzheimer’s disease – A structural MRI study. Journal of Psychiatric Research 2008. 42(14): p. 1198-1202.
26. Wegiel, J., et al., Cerebellar atrophy in Alzheimer’s disease-clinicopathological correlations. Brain Research 1999. 818(41-50).
27. Newberg, A., et al., Brain metabolism in the cerebellum and visual cortex correlates with neuropsychological testing in patients with Alzheimer's disease. Nucl Med Commun 2003. 24(7): p. 785-90.
28. Jones, B.F., et al., Differential Regional Atrophy of the Cingulate Gyrus in Alzheimer Disease: A Volumetric MRI Study. Cerebral Cortex 2006. 16(12): p. 1701-1708.
29. Frisoni, G.B., et al., Detection of grey matter loss in mild Alzheimer's disease with voxel based morphometry. J Neurol Neurosurg Psychiatry, 2002. 73: p. 657-664.
30. Killiany, R.J., et al., Use of structural magnetic resonance imaging to predict who will get Alzheimer’s disease. Ann Neurol 2000. 47: p. 430-9.
31. Sarazin, M., et al., Amnestic syndrome of the medial temporal type identifies prodromal AD: a longitudinal study. Neurology 2007. 69: p. 1859-67.
32. De Meyer, G., et al., Diagnosis-Independent Alzheimer Disease Biomarker Signature in Cognitively Normal Elderly People. Arch Neurol. , 2010. 67: p. 949-956.
33. Sluimer, J.D., et al., Whole-brain atrophy rate and cognitive decline: longitudinal MR study of memory clinic patients. Radiology 2008. 248: p. 590-598.
34. Vemuri, P., et al., MRI and CSF biomarkers in normal, MCI, and AD subjects. Neurology 2009. 73: p. 287-293.
35. Jack, C.R., et al., The Alzheimer's disease neuroimaging initiative (ADNI): MRI methods. Journal of Magnetic Resonance Imaging 2008. 27(4): p. 685-691.
36. Tan, P., M. Steinbach, and V. Kumar, Introduction to Data Mining. 2006: Addison Wesley. 37. Liu, J., S. Ji, and J. Ye, SLEP: Sparse Learning with Efficient Projections. 2009, Arizona State
University. http://www.public.asu.edu/~jye02/Software/SLEP.