Embed Size (px)
Citation preview
SPATIAL ANALYSIS OF THE EFFECTS OF FLOODING ON
FOOD SECURITY IN AGRARIAN COMMUNITIES OF SOUTH
EASTERN NIGERIA
BY
AKUKWE, THECLA IHEOMA
B.Sc (Hons) and M.Sc (Nigeria)
A Thesis Submitted in the Fulfilment of the Requirements of the Award of the
Degree of Doctor of Philosophy (Environmental Planning and Management) in
Geography and Environmental Studies, Faculty of Arts, University of Nairobi
January, 2019
ii
DECLARATION
This Thesis is my original work and has not been presented for a degree in any other
university.
Signature........................................ Date................................................
Akukwe Thecla Iheoma
C80/99308/2015
This Thesis has been submitted for examination with our approval as University Supervisors.
Signature........................................ Date................................................
Prof. George Krhoda
Department of Geography and Environmental Studies
Signature........................................ Date................................................
Dr. Alice Oluoko-Odingo
Department of Geography and Environmental Studies
iii
DEDICATION
This thesis is dedicated to my dad and late mum who always wanted me to get a doctoral
degree.

iv
ACKNOWLEDGEMENT
I would like to express my profound gratitude to God Almighty to whom the glory is due for
making this dream come true; seeing me through this phase of life and providing me with
supportive people.
The writing of this thesis would not have been possible without the priceless support of my
supervisors; Prof. Krhoda, George and Dr. Oluoko-Odingo, Alice. My special thanks to them
for their expeditiousness in reading and reviewing my thesis, in addition to their constructive
criticisms. To all the staff of Department of Geography and Environmental Studies who
contributed in one form or the other, you will always be remembered,
To my parents, Chief and Late Lolo Cyprian Akukwe, and siblings, I will forever appreciate
your prayers and support.
I will always be indebted to you, the love of my life; Prince Ugochukwu for your patience,
encouragement and moral support. I am also thankful to my friend, Chinedu Ogbodo, for his
cartographic assistance.
This programme was made possible by the Transdisciplinary Training for Resource
Efficiency and Climate Change Adaptation in Africa (TRECCAfrica) Programme, and I am
indeed grateful for the opportunity given me to complete my doctoral programme via this
initiative. My sincere appreciation also goes to the Japanese Trust Fund and African
Development Bank for their support; funding my fieldwork.
Finally, I want to thank Bongani and Trudy who made my stay in Nairobi, invigorating.
v
TABLE OF CONTENTS PAGE
TITLE ......................................................................................................................................... i
DECLARATION ....................................................................................................................... ii
DEDICATION .......................................................................................................................... iii
ACKNOWLEDGEMENT ........................................................................................................ iv
TABLE OF CONTENTS ........................................................................................................... v
LIST OF TABLES ..................................................................................................................... x
LIST OF FIGURES ................................................................................................................. xii
LIST OF PLATES .................................................................................................................. xiv
LIST OF ACRONYMS ........................................................................................................... xv
ABSTRACT ........................................................................................................................... xvii
CHAPTER ONE ...................................................................................................................... 1
INTRODUCTION ................................................................................................................... 1
1.1 Background .......................................................................................................................... 1
1.2 Statement of Problem ........................................................................................................... 4
1.3 Objectives of the study ........................................................................................................ 6
1.4 Justification of the study ...................................................................................................... 6
1.5 Scope and limitations of the study ....................................................................................... 7
1.6 Definition of Concepts ......................................................................................................... 8
1.7 Theoretical Framework ........................................................................................................ 9
1.7.1 Food Insecurity and Vulnerability Information Management Systems Framework ...... 9
1.7.2 Sustainable Livelihoods Framework ............................................................................ 11
1.7.3 Conceptual Framework ................................................................................................. 13
1.8 Research Hypotheses ......................................................................................................... 17
1.9 The Study Area .................................................................................................................. 17
1.9.1 Location ........................................................................................................................ 17
1.9.2 Climate .......................................................................................................................... 17
1.9.3 Relief and Drainage ...................................................................................................... 19
1.9.4 Soil and Vegetation ....................................................................................................... 20
1.9.5 Geology and Geomorphology ....................................................................................... 21
1.9.6 Population ..................................................................................................................... 22
1.9.7 Socio-economic Activities ............................................................................................ 22
1.9.8 Socio-political structure ................................................................................................ 24
vi
1.9.9 Transport and Road Infrastructure ................................................................................ 24
1.10. Organisation of Chapters ................................................................................................ 25
CHAPTER TWO ................................................................................................................... 27
LITERATURE REVIEW ..................................................................................................... 27
2.1 Causes and effects of flooding ........................................................................................... 27
2.2 Vulnerability and adaptation to flooding. .......................................................................... 29
2.3 Food Security Concept and Measurement ......................................................................... 35
2.4 Determinants of food Security. .......................................................................................... 41
2.5 Climate change, Flooding and Food security. ................................................................... 46
CHAPTER THREE ............................................................................................................... 50
RESEARCH METHODOLOGY ......................................................................................... 50
3.1 Introduction ........................................................................................................................ 50
3.2 Reconnaissance Survey ...................................................................................................... 50
3.3 Field Sampling Techniques ............................................................................................... 50
3.4 Data sources ....................................................................................................................... 51
3.5 Data collection ................................................................................................................... 51
3.6 Data analysis ...................................................................................................................... 53
3.6.1 Flood Trend and Extent Analyses ................................................................................. 53
3.6.1.1 The Flood Extent Mapping Procedure ..................................................................54
3.6.2 Simple percentage ......................................................................................................... 55
3.6.3 Flood Vulnerability Index calculation and Principal Component Analysis (PCA). ..... 55
3.6.4 Cluster and Spatial Analyses. ....................................................................................... 58
3.6.5 Regression Analysis and Analysis of Variance (Anova) for flood vulnerability ......... 61
3.6.6 Food Security Assessment ............................................................................................ 62
3.6.6.1 FCS Calculation Steps ............................................................................................. 62
3.6.6.2 Coding Survey Responses for the Food Security Scale ........................................... 64
3.6.6.3 Rasch Analysis ......................................................................................................... 65
3.6.7 Multiple Regression Analysis between food security and its determinants ................. 66
3.6.7.1 Hypothesis testing ................................................................................................ 6167
3.6.8 Ordinal Logistic Regression Analysis ...................................................................... 6269
3.6.9 Mean score and Principal Component Analysis ....................................................... 6170
3.6.10 Wealth Classes ............................................................................................................ 70

vii
3.6.11 Poverty line determination .......................................................................................... 71
3.6.12 Households’ Assets and Amenities measurements ..................................................... 71
3.7 Ethical Issues ..................................................................................................................... 71
CHAPTER FOUR .................................................................................................................. 72
RESULTS AND DISCUSSION ............................................................................................ 72
4.1 Introduction ....................................................................................................................... 72
4.2. Demographic and Socio-economic characteristics of respondents ................................... 72
4.2.1 Sex, Age and Marital status .......................................................................................... 72
4.2.2 Literacy of household heads and spouses ..................................................................... 74
4.2.3 Income .......................................................................................................................... 75
4.2.4 Results of Wealth classes .............................................................................................. 77
4.2.5 Analysis of Households’ Assets and Amenities ........................................................... 77
4.2.5.1 Household dwelling units ........................................................................................ 81
4.2.6 Household characteristics. ............................................................................................ 82
4.2.6.1 Household Size and Dependency ............................................................................ 82
4.2.6.2 Livelihood sources ................................................................................................... 84
4.2.7 Household farm-related characteristics. ....................................................................... 85
4.2.8 Other farm-related characteristics ................................................................................. 87
4.2.8.1 Farm size/land holding............................................................................................. 87
4.2.8.2 Land acquisition methods ........................................................................................ 88
4.2.8.3 Crops produced by households ................................................................................ 89
4.2.8.4 Farm Location. ........................................................................................................ 90
4.2.8.5 Transportation means. .............................................................................................. 90
4.2.8.6 Seeds sources. .......................................................................................................... 91
4.3 The Nature of flood. ........................................................................................................... 92
4.3.1 Flood Extent Mapping .................................................................................................. 94
4.3.1.1 Elevation .................................................................................................................. 94
4.3.1.2 Flood extent ............................................................................................................. 94
4.3.2 Seasonal variations in flood occurrence in Southeast, Nigeria .................................... 97
4.3.2.1 Flood Experience ..................................................................................................... 97
4.3.2.2 Seasonal variations in flood occurrence .................................................................. 98
4.3.3 Rainfall Trends over South eastern, Nigeria ................................................................. 99
4.3.4. Respondents’ Perception of Causes of flooding ........................................................ 102
viii
4.3.5 Effects of flooding ...................................................................................................... 103
4.4 Assessment of Vulnerability to Flooding and its effects ................................................ 104
4.4.1 Results of the Principal Component Analysis (PCA) ................................................. 104
4.4.2 Household Flood Vulnerability Analysis ................................................................... 106
4.4.3 Community and Local Government Area (LGA) Flood Vulnerability Analysis ...... 107
4.4.4 Classification of Vulnerability levels ......................................................................... 109
4.4.5 Determination of Factors that influence Household Flood Vulnerability in Southeast,
Nigeria ................................................................................................................................... 112
4.4.5.1 Results of the relationship between flood vulnerability and its determinants ....... 112
4.4.5.2 Significant socio-economic and environmental factors and their effects on Flood 112
4.4.6 Hypothesis testing: Variations in household vulnerability to flooding ...................... 119
4.5 Food Security Situations and Determinants. .................................................................... 120
4.5.1 Food Security Assessment: Food Accessibility Dimension. ...................................... 120
4.5.2 Food Security Assessment: Food Availability Dimension. ........................................ 123
4.5.2.1 Food Sources and Sufficiency in Own Food production. ...................................... 123
4.5.3 Food Security Assessment: Food Utilization Dimension. .......................................... 123
4.5.4 Food Security Assessment: Stability Dimension ........................................................ 126
4.5.5 Comprehensive Household food security status/level: A USDA Approach .............. 127
4.5.6 Differential household food security status/level ....................................................... 128
4.5.6.1 Food secure households. ........................................................................................ 128
4.5.6.2 Food insecure without hunger households ............................................................ 128
4.5.6.3 Moderately food insecure households with hunger ............................................... 129
4.5.6.4 Severely food insecure households with hunger .................................................... 129
4.6 Determinants of Household Food Security in South eastern Nigeria. ............................. 130
4.6.1 Sex .............................................................................................................................. 130
4.6.2 Marital Status of head of household ........................................................................... 132
4.6.3 Level of education of head of household .................................................................... 132
4.6.4 Off-farm Income ......................................................................................................... 134
4.6.5 Monthly Income of head of household ....................................................................... 134
4.6.6 Dependency Ratio of household ................................................................................. 135
4.6.7 Sufficiency in own food production ........................................................................... 136
4.6.8 Livestock ownership ................................................................................................... 136
4.6.9 Poultry ownership ....................................................................................................... 136
4.6.10 Irrigation practice ...................................................................................................... 137
4.6.11 Flooding .................................................................................................................... 137
ix
4.7 Hypothesis testing: Variations in determinants of household food security ................... 137
4.8 Effects of Flooding on Food Security. ............................................................................. 138
4.8.1 Analysis of Food Expenditure Differential across Households in South East, Nigeria
............................................................................................................................................... 139
4.8.2. Examination of the effects of flooding on food security using Meal Frequency ..... 140
4.8.3 Effects of flooding on food security: A USDA Approach .......................................... 141
4.8.4 Assessment of the Extent of the Relationship between flooding and food security ... 143
4.8.5 Comparative Analysis of the positive and negative effects of flooding on Food security
............................................................................................................................................... 144
4.8.5.1 The positive effects of flooding on Food Security ................................................ 145
4.8.5.2 The negative effects of flooding on Food Security ................................................ 146
4.8.6 Principal Component Analysis of the negative effects of flooding on food security . 148
4.8.6.1 Interpretation of the components ........................................................................... 149
4.9 Households’ adaptation and coping strategies to flooding and food insecurity .............. 150
4.9.1 Households’ adaptation strategies to flooding ............................................................ 151
4.9.1.1 Differential adaptation strategies to flooding adoption in relation to household type
............................................................................................................................................... 155
4.9.2 Households’ adaptation strategies against food insecurity ......................................... 155
4.10 Resilience Analysis ........................................................................................................ 160
CHAPTER FIVE ................................................................................................................. 162
SUMMARY, CONCLUSION AND RECOMMENDATIONS ............................................ 162
5.1 Summary .......................................................................................................................... 162
5.2 Conclusion ....................................................................................................................... 174
5.3 Major findings and contributions to knowledge .............................................................. 175
5.4 Recommendations ............................................................................................................ 176
5.5 Recommendations for Further Research .......................................................................... 179
REFERENCES ..................................................................................................................... 180
APPENDIX 1: Household Questionnaire .............................................................................. 200
APPENDIX 2: Focus Group Discussion/ Key Informant Interview Questionnaire .............. 209
APPENDIX 3: Correlation between number of children and number of dependants .......... 210
APPENDIX 4: Correlation result between level of education and income ........................... 210
APPENDIX 5: Correlation result between level of education and number of dependants ... 211
APPENDIX 6: Rainfall Data ................................................................................................. 212
x
LIST OF TABLES PAGE
Table 1.1: Operationalization of variables ............................................................................... 15
Table 1.2: Projected 2016 population for the study area ......................................................... 22
Table 3.1: Sample size of the study ......................................................................................... 52
Table 3.2: Vulnerability, Units of Measurement and their relationship to vulnerability ......... 51
Table 3.3: Food Consumption Score Thresholds..................................................................... 54
Table 3.4: Standard values for assessing household food (in)security status/level ................ 55
Table 3.5: Hypothesize relationship between food security and factors influencing it ........... 57
Table 3.6: Wealth classes computed from monthly income .................................................... 59
Table 4.1: Socio-economic characteristics of respondents ...................................................... 61
Table 4.2: Educational Qualifications of Household heads and their spouses ........................ 62
Table 4.3: Monthly Income distribution of Households .......................................................... 64
Table 4.4: Percentage Distribution of Wealth Classes ........................................................... 65
Table 4.5: Distribution of household items. ............................................................................ 66
Table 4.6: Percentage Distribution of Household Assets within wealth classes ..................... 67
Table 4.7: Distribution of household amenities ....................................................................... 68
Table 4.8: Percentage Distribution of Housing Type. ............................................................. 69
Table 4.9: Household size/dependants relationship ................................................................. 70
Table 4.10: Distribution of Number of Dependants ................................................................ 71
Table 4.11: Primary occupation of respondents ...................................................................... 72
Table 4.12: Household farm-related characteristic .................................................................. 73
Table 4.13: Nature of flood in South eastern, Nigeria ............................................................. 80
Table 4.14: Percentage Inundated Area ................................................................................... 84
Table 4.15: Flood experience ................................................................................................... 86
Table 4.16: Seasonal variation in flood occurrence ................................................................. 87
Table 4.17: Households’ perceived Causes of flooding .......................................................... 90
Table 4.18: Effects of flooding ................................................................................................ 92
Table 4.19: Component Score of the First Principal Component ............................................ 94
Table 4.20: Household Flood Vulnerability indices and Levels in South eastern Nigeria ...... 96
Table 4.21: Flood Vulnerability Indices of the Communities and LGAs ................................ 97
Table 4.22: Community Flood Vulnerability Levels in SE, Nigeria ....................................... 98
Table 4.23: Determinants of vulnerability Coefficientsa ....................................................... 102
Table 4.24: Significant socio-economic and environmental factors and their effects on flood
vulnerability ........................................................................................................................... 103
xi
Table 4.25: Distribution of socio-economic factors influencing household vulnerability .... 105
Table 4.26: Distribution of environmental factors influencing household vulnerability ...... 108
Table 4.27: ANOVAa for variations in household vulnerability to flooding ........................ 108
Table 4.28: ANOVA Table between household vulnerability and Sex of household heads . 109
Table 4.29: Households’ monthly food expenditure ............................................................. 110
Table 4.30: Household food security status using per capita monthly food expenditure ...... 110
Table 4.31: Distribution of food sources and Sufficiency in own food production .............. 112
Table 4.32: The Frequency Weighted diet diversity score (Food Consumption Score) ........ 113
Table 4.33: Agricultural practices ......................................................................................... 115
Table 4.34: Differential household food security status/levels .............................................. 118
Table 4.35: Logit model output of determinants of food security status ............................... 122
Table 4.36: Distribution of factors influencing household food security in SE, Nigeria ...... 124
Table 4.37: ANOVAa result of determinants of food security .............................................. 129
Table 4.38: ANOVA Table between household food security and Sex of household heads 129
Table 4.39: Effect of flood on food prices ............................................................................. 131
Table 4.40: Daily Meal Frequency in Southeastern, Nigeria ................................................ 131
Table 4.41: Differential household food security status/levels after flooding event ............. 132
Table 4.42: Relationship between flooding and food security Parameter Estimates ............. 134
Table 4.43: Positive Effects of flooding on food security ..................................................... 136
Table 4.44: Negative Effects of flooding on food security .................................................... 138
Table 4.45: Total Variance Explained of the PCA ................................................................ 140
Table 4.46: Rotated Component Matrixa of the PCA ............................................................ 140
Table 4.47: Household Adaptation/Coping strategies to flooding ........................................ 143
Table 4.48: Coping strategies to food insecurity ................................................................... 148
Table 4.49: Flood recovery period by Community ................................................................ 151

xii
LIST OF FIGURES PAGE
Figure 1.1: Food Insecurity and Vulnerability Information Management Systems Framework
.................................................................................................................................................. 10
Figure 1.2: Sustainable Livelihoods Framework ..................................................................... 12
Figure 1.3: Flood, Vulnerability and Food security Framework. ............................................ 16
Figure 1.4: Map of the Study Area. ......................................................................................... 19
Figure 1.5: Drainage Map of the Study Area. .......................................................................... 19
Figure 1.6: Soil Map of the Study Area. .................................................................................. 21
Figure 3.1: Map of the study area showing the sampled LGAs/Communities ........................ 48
Figure 3.2: Structured survey questions on household food security ..................................... 56
Figure 3.3: Household food security status - categorical measure ......................................56
Figure 4.1: Distribution of marital status by sex of household heads. ..................................... 61
Figure 4.2: Distribution of educational qualification by sex of heads of households ............. 63
Figure 4.3: Distribution of monthly income by sex of household heads ................................. 64
Figure 4.4: Household dependency by Wealth Classes ........................................................... 71
Figure 4.5: Distribution of secondary sources of livelihood of the respondents ..................... 72
Figure 4.6: Household farm sizes in acre ................................................................................ 75
Figure 4.7: Land acquisition methods ...................................................................................... 76
Figure 4.8: Variety of crops produced by households in the study area .................................. 77
Figure 4.9: Distribution of farm locations. .............................................................................. 77
Figure 4.10: Transportaion means distribution ........................................................................ 78
Figure 4.11: Distribution of seed sources ................................................................................ 79
Figure 4.12: Map showing elevation of the study area ............................................................ 82
Figure 4.13: Flood Extent and Depth map ............................................................................... 84
Figure 4.14: Map showing inundated Area at LGA level ........................................................ 85
Figure 4.15: Mean Monthly Rainfall over the communities .................................................. 87
Figure 4.16: Annual Rainfall Total over Anambra East and Ogbaru LGAs (in mm) ........... 88
Figure 4.17: Mean Annual Rainfall over Anambra East and Ogbaru LGAs (in mm) .......... 88
Figure 4.18: Annual Rainfall Total over Oguta and Ohaji/Egbema LGAs (in mm) ............. 89
Figure 4.19: Mean Rainfall Total over Oguta and Ohaji/Egbema LGAs (in mm) ................ 89
Figure 4.20: Vulnerability Indices of the Eight Communities ................................................. 97
Figure 4.21: Dendrogram showing hierarchical clustering of the FVI of the 8 communities . 98
Figure 4.22: Spatial Variations in Community Vulnerability Levels ...................................... 99
Figure 4.23: Spatial pattern in vulnerability levels across the four (4) LGAs ....................... 100
xiii
Figure 4.24: Community food security category based on per capita monthly food
expenditure ......................................................................................................... 111
Figure 4.25: Food Consumption Score categories ................................................................. 113
Figure 4.26: Distribution of household Food Consumption Scores (FCS)............................ 115
Figure 4.27: Percentage distribution of the adopted coping strategies to flooding ............... 146
Figure 4.28: Percentage distribution of coping strategies to food insecurity ........................ 150
xiv
LIST OF PLATES PAGE
Plate 4.1: Manual pump water source in Anambra and Imo States ......................................... 69
Plate 4.2: Submerged yam farms in Atani, Ogbaru LGA ........................................................ 86
Plate 4.3: A partly submerged house in Oguta ........................................................................ 86
Plate 4.4: Makeshift houses in Umuorodogwum Village, Oguta .......................................... 144
Plate 4.5: Bamboo constructed flood water pathway in Igbariam ......................................... 144
Plate 4.6: An elevated building in Otuocha ............................................................................. 86
xv
LIST OF ACRONYMS
ANOVA Analysis of Variance
CLOs Community Laison Officers
CSI Coping Strategies Index
DEM Digital Elevation Model
FAO Food Agricultural Organisation
FCS Food Consumption Score
FEWNETS Famine Early Warning Systems Network
FFH Female-headed Household
FGDs Focus Group Discussions
FGT Foster-Greer-Thorbecke
FRN Federal Republic of Nigeria
FSI Food Security Index
FVI Food Vulnerability Index
FSLC First School Leaving Certificate
GIS Geographic Information System
GPS Global Positioning System
HFIAS Household Food Insecurity Access Scale
HFSSM Household Food Security Survey Module
HND Higher National Diploma
IDP Internally Displaced Person
IFAD International Fund for Agricultural Development
IPCC Intercontinental Panel for Climate Change
K cal Kilocalorie
KIIs Key Informant Interviews
LGA Local Government Area
xvi
MDGs Millennium Development Goals
MHH Male-headed Household
MODIS Moderate-resolution imaging Spectroradiometer
NBS National Bureau of Statistics
NCE National Certificate Examination
NIMET Nigerian Meteorological agency
NPC National Population Commission
UN-OCHA United Nations Office for the Coordination of Humanitarian Affairs
OND Ordinary National Diploma
PCA Principal Component Analysis
RAs Research Assistants
SDGs Sustainable Development Goals
SE South East or Southeastern
SPSS Statistical Package for the Social Sciences
SRTM Shuttle Radar Topography Mission
SSCE Senior School Certificate Examination
UNDP United Nations Development Programme
USDA United States Department of Agriculture
WFP World Food Programme
WHO World Health Organisation
xvii
ABSTRACT
Several studies have predicted climate change to cause some shifts in food security in the
future with sparse research on the relationship between flooding (which is one of the
manifestations of climate change) and food security especially in Nigeria. Flooding induced
food insecurity by causing a negative shift in any of the dimensions of food security through
reducing crop harvest and farm income derived from crop sales; damaging assets; destroying
road and farm storage facilities among others. The southeastern Nigeria is generally agrarian
and vulnerable to flooding (due mainly to its nearness to River Niger), and has comparative
advantage in the production of crops like yams, maize, potatoes and cassava (staples), hence
the need to do an in-depth study on the effects of flooding on food security in the region.
In this pursuit, the study assessed the extent to which flooding affected the food security in
eight (8) flood vulnerable and agrarian communities in Anambra and Imo States of
southeastern Nigeria by examining the interactions between flooding and each of the four
dimensions of food security (accessibility, availability, utilization and stability) to capture the
multidimensional nature of food security.
Analyses were drawn from imageries (MODIS and SRTM), questionnaire, focus group
discussions and key informant interviews. A total of 400 households were sampled using
multi-stage, stratified and random sampling methods and the data were analysed using
descriptive and inferential statistics. The integrated vulnerability assessment approach using
indicators (biophysical and socio-economic) were adopted to compute households’ flood
vulnerability indices.
The flood vulnerability index analysis shows that majority of households (49%) were less
vulnerable to flooding whereas 3.5% and 47.5% were moderately and highly vulnerable to
flooding respectively. Igbariam and Ossomala communities were found to be the flood
vulnerability hotspots, and flood vulnerability indices of the 8 communities were mapped
using ArcGIS 10.2 software. The flood vulnerability map showing the spatial variations in
the study area’s different vulnerability levels would aid flood emergency response team to
improve their flood preparedness plans, and to allocate relief materials to flood victims.
The coefficients of the multiple regression model (with p- value ≤ 0.05 at 5% level of
significance) revealed that the main determinants of households’ vulnerability to floods are
age, level of education, off-farm incomes, pre-flood awareness, group membership, private
land ownership, sufficient food production, available storage facility, use of fertilizer, receipt

xviii
of food/aid in time of emergency, phone ownership, canoe ownership, financial support,
diversified income, flood experience and severity of flood.
Households were further classified into four food security levels (food secure (A), food
insecure without hunger (B), moderately food insecure with hunger (C) and severely food
insecure with hunger (D) using the HFSSM (developed by the USDA) prior to and after flood
episodes. The results revealed that 33.3%, 40.2%, 13% and 13.5% households fell into the A,
B, C and D food security levels respectively prior to flood events and 7.2%, 39.3%, 15.7%
and 37.8% correspondingly fell into the A, B, C and D food security levels after flood events.
The implication is that flooding affected food security negatively by increasing the number of
food insecure households to 92.8%, indicating a 26.1% reduction in the number of food
secure households and a 26.5% increase of food insecure households from normal. Igbariam
community was the most affected community as it recorded the highest (72.1%) food
insecurity hotspots (households that experienced extreme food insecurity with hunger) after
flooding, followed by Ossomala community.
The result of the binary logistic regression model showed that, the statistically (5%)
significant variables (with p-value ≤ 0.05) that influence household food security status in
south eastern, Nigeria are; sex, marital status, level of education, off-farm income, monthly
income, dependency ratio, sufficiency in food production, livestock ownership, village
poultry/poultry ownership, irrigation practice and flooding. Flooding was the only factor with
a negative coefficient (-1.11) with an odds ratio of 0.33, implying that flooding induces food
insecurity. The Ordinal Regression Analysis result indicated flooding as a limiting factor that
affects food security negatively in the study area.
The ANOVA results revealed significant inter-household differences in vulnerability to
flooding and determinants of food security as well as a significant variation between female-
headed and male-headed households with female-headed households being the most
vulnerable to food insecurity, and households headed by younger people being the most
vulnerable to flooding.
Furthermore, the outcomes of the analysis indicate that most of the adaptation strategies
employed were self-devised strategies that provided temporary means of survival in times of
food shortages and flooding at the household level. Therefore, sustainable policies and
strategies having more institutional undertone (e.g. social security, food safety nets for flood
victims) are among the suggested efforts to minimize the effects of flooding and food
insecurity.
1
CHAPTER ONE
INTRODUCTION
1.1 Background
Flooding is generally a condition of complete or partial inundation of normally dry areas due
to overflow of tidal or inland waters or from abnormal and rapid accumulation of runoff (Jeb
and Aggarwal, 2008). “Floods are the most recurring, widespread, disastrous and frequent
natural hazards of the world” (Odufuwa, Adedeji, Oladesu and Bongwa, 2012:70). According
to the UN-Water (2011), floods have caused about half of all observed disasters worldwide,
and 84% disaster deaths in the world are attributed to flooding, with an average of 20,000
deaths per year, which makes only a few countries immune to floods.
The growing flood scenarios in different parts of the world have resulted in loss of human
lives, displacement of people, loss in properties and general damage to the environment
(Nzeadibe et al., 2011). Several scholars (Madzwamuse, 2010; Speranza, 2010; Nzeadibe et
al., 2011) have noted developing countries to be the most vulnerable to these impacts due to
their low adaptive capacity. For instance, since 1900, floods have claimed more than 10,000
lives in the United States alone (Adeoye et al., 2009) and in India over 14 million Indians
were victims to the flood of August 2007 in Sathya Sai Baba (Aderogba, 2012). Most
disastrous floods in China had been caused by the unstable Huang Ho (Yellow River) and
hundreds of thousands of people in Bangladesh were killed as a result of the pervasive
flooding of the low-lying delta of the Ganges and Brahmaputra rivers caused by the
combination of high tides and tropical cyclone storms in 1970, 1985 and 1991 (Pearce and
Leib, 2006 in Adeoye et al., 2009). Documentation shows that many lives have been lost
due to flooding while several have been rendered homeless and billions of Naira properties
have been destroyed as a result of devastating floods across Nigeria (Opalana, 2005; Jeb and
Aggarwal, 2008; Etuonovbe, 2011; Olorunfemi, 2011).
Incidences of destructive floods in Nigeria occurred in Akure (1996, 2000, 2002, 2004,
2006), Osogbo (1992, 1996, 2002), Yobe (2000), Ibadan (1985, 1987, 1990, 2011), Makurdi
in 2008 and Sokoto in 2010, Ogbaru, Egbema and Oguta in 2012. Also, coastal cities such as
Lagos, Yenegoa, Calabar, Uyo, Port Harcourt, and Warri experience floods frequently
(Folorunsho and Awosika 2001; Ologunorisa, 2004; Mordi 2011; Amaize 2011; Olajuyigbe
et al., 2012).
2
The most devastating of all these flood events is that of August-October 2012 in Nigeria
which pushed rivers over their banks and submerged hundreds of kilometres of urban and
rural lands (Ojigi, Abdulkadir and Aderoju, 2013). The United Nations Office for the
Coordination of Humanitarian Affairs (UN-OCHA, 2012) noted this 2012 flood to be the
worst floods ever experienced in Nigeria in the past 40 years. It estimated that over 7,705,378
Nigerians were affected by the floods with 2,157,419 internally displaced persons (IDPs).
Over 90% of the 36 States of the country were affected between July and October, 2012 with
363 deaths and more than 618,000 damaged houses (UN-OCHA, 2012). Massive destruction
of farmlands was reported within this period (2012) which resulted to food insecurity in parts
of the country as significant proportion of areas (including the south eastern region) that
produce the three main tuber food crops in Nigeria (namely yam, cassava and sweet potato),
were affected by the floods (FEWS NET, 2012; FEWS NET, 2013).
The United Nations Development Programme (UNDP, 2008) had predicted climate change to
slow down the progress in human development achieved over the last decade with emerging
threats on water availability, food security and agricultural production with another 600
million people rendered malnourished due to sea level rises, droughts, heat waves, rainfall
variations and floods. Climate change has been noted to represent abnormal climatic
situations that can affect agricultural production through their impact on temperature changes
and water availability (Syaukat, 2011), and would intensify the existing hunger and food
insecurity problems in developing countries which already contend with chronic food
problems. Empirical studies show that the increased intensity and frequency of storms,
flooding and drought undoubtedly have implications on food security and agricultural
production (FAO, 2007; Ngoh, Teke and Atanga, 2011; Yaro, 2013 and Pacetti, Caporali and
Rulli, 2017).
Despite increasing global agricultural production (Ibok, Idiong, et al., 2014), large numbers
of people remain hungry and malnourished (Ambali et al., 2015). An estimated 925 million
people were undernourished in 2010, out of which about 900 million people live in
developing countries (FAO, 2010) with an estimated 217.8 million living in sub-saharan
African in 2014-2016 (FAO, 2015). In addition, more than 70% of the undernourished people
live in rural areas where agriculture is dependent upon directly or indirectly (Bashir, Schilizzi
and Pandit, 2012).
Similarly, IFAD (2009) noted that, about 1.2 billion people cannot meet their most basic
3
needs for sufficient food every day especially poor women, men and children who belong to
indigenous populations living in rural environments mostly in developing countries, such as
Nigeria and who are subsistence farmers. Consequently, Nigeria has been listed among the 55
Low Income Food Deficit (LIFD) countries due to the high prevalence of undernourishment
especially among agricultural households (Ambali et al., 2015). Thus, a juxtaposition of
Nigeria’s poverty level and vulnerability to climate-induced flooding threatens food security
in the country.
Food security, according to FAO (1996:4; 2008a:9) “exists when all people, at all times, have
physical and economic access to sufficient, safe and nutritious food that meets their dietary
needs and food preferences for an active and healthy life”. Food security in the above context
consists of four dimensions viz; food accessibility, availability, utilization and stability, and
these dimensions must be fulfilled for food security objectives to be realized.
A state of food security entails that: adequate food is available; all people have physical and
economic access to the food they require; availability and access are ensured over time
(stability), and the food is efficiently utilised. Attaining food security requires not just
attaining an adequate level of good nutrition and food consumption, but maintaining this level
at low risk over time (FAO, 2008a).
Food insecurity on the other hand, exists even if one of these conditions is not met or there is
any negative shift (e.g. caused by flooding) in any of these dimensions of food security. In
the last decade, consideration has been centred on means of eradicating food insecurity and
hunger in the world. A number of global agreements, for instance those agreed upon at the
World Food Summit in 1996 and the Millennium Summit in the year 2000, had goals and
particular targets set for joint action in minimizing the incidence of food insecurity and
hunger. The 1996 World Food Summit aimed to halve by 2015, the number of hungry
people; in the same way, the hunger target of the Millennium Development Goals (MDGs)
set out to halve the prevalence of hunger by the same target date, 2015 (FAO, 2005; FAO
2008a).
The recently adopted Sustainable Development Goals (SDGs) lays emphasis on ending
hunger, achieving food security and improving nutrition and promoting sustainable
agriculture by 2030 in Goal 2. FAO (2008a) has noted that all hungry people are food
insecure, though, not all food insecure people are hungry, and the term ‘hunger’ has been
used to distinguish a subset of food insecure people while people suffering from hunger as a
4
result of inadequate access to food may be considered ‘currently food insecure’. Poverty is
undoubtedly a cause of hunger, hence a relationship exist between hunger, poverty and food
insecurity. Understanding this relationship can clarify how poverty and hunger reduction
programmes can contribute to strengthening food security and vice versa.
It is therefore against this background that this research is geared towards assessing the
spatial effects of flooding on food security of agricultural households in the study area. The
findings of this research are undeniably going to assist vulnerable groups strengthen their
adaptation capacity and ultimately enhance their well-being.
1.2 Statement of Problem
Agriculture is the mainstay of Nigeria’s economy (IFAD, 2012). The agricultural sector has
been noted to contribute about 40% to Nigeria’s economy; employs about two-thirds of the
total labour force and provides a livelihood for about 90 per cent of the rural population
(Federal Republic of Nigeria, 2008; FAO 2011; National Bureau of Statistics, 2012). Yet,
subsistence farming dominates agriculture in the country with up to 90 per cent of Nigeria’s
food being produced by small-scale farmers, who cultivate small plots of land and depend
mainly on rainfall and on very little or no irrigation systems. However, widespread poverty
and poor agricultural output in the country have resulted in widespread food insecurity, with
some studies suggesting that about 70 percent of Nigerians are food insecure (Orewa and
Iyanbe 2009; Obayelu, 2010; Kuku-Shittu et al., 2013).
Nigeria moved from being self-sufficient in food production in the 1960s to being heavily
reliant on food imports in the 1980s (Fasoranti, 2006) and this has led to a continuous
increase in the level of food insecurity in the country since the 1980s. Food insecurity rose
from about 18% in 1986 to about 40% in 1998 (Sanusi, Badejo and Yusuf, 2006) while its
food security index score stands at 37.1 out of 100 in 2015 (EIU, 2015). This is not surprising
given that about 83.3% and 82.2% of the population lived below the poverty line in 2004 and
2010 respectively (World Bank, 2015a).
South eastern Nigeria is in the Niger Delta region which is known for its vulnerability to
flooding due to its location; nearness to the River Niger. The region is generally agrarian and
has comparative advantage in the production of crops like yams, maize, potatoes and cassava
that form the staple food in Nigeria.
Flooding has been a serious environmental problem faced in parts of this region and this is
5
evident in the work of Adewuyi and Olofin (2014) who noted that, while most parts of
Nigeria were affected by the 2012 devastating floods, the southern axis (South South and
South East regions) of the country suffered most with 13 of the extreme flooding incidences
lasting for more than 14 days in 2012. Consequently, it affected food production, crop
harvest, income sources, roads and other facilities.
The effects of flooding on health and the environment in Nigeria had been extensively
discussed and these range from obstruction of traffic, submerging roads, disruption of
economic activities, coastal erosion, loss of property to loss of lives, displacement of people,
water pollution and diseases (Folorunsho and Awosika 2001; Ologunorisa, 2004; Jeb and
Aggarwal, 2008; Ogba and Utang, 2008; Adeloye and Rustum, 2011; Etuonovbe, 2011;
Olorunfemi, 2011; Odufuwa et al., 2012; Duru and Chibo, 2014; Adewuyi and Olofin, 2014)
while studies on flood effects on food security is lacking. Several studies on food security
carried out in Nigeria (Sanusi et al., 2006; Omonona and Agoi, 2007; Muhammad-Lawal and
Omotesho, 2008; Ibrahim et al., 2009; Asogwa and Umeh, 2012; Adepoju and Adejare, 2013;
Ahmed and Dotti, 2014; Ibok, Idiong, et al., 2014; Ibok, Bassey, et al., 2014; Atoloye,
Ogunba and Samuel, 2015) had concentrated mostly on food security pattern and coping
strategies; food security status and determinants of food security among households.
The determinants of household food security noted by scholars include; household size, farm
size, income, level of education, sex and age of head of household, livestock ownership,
credit access, marital status among others (Arene and Anyaeji, 2010; Bashir et al. 2012 and
Ahmed and Dotti, 2014; Djangmah (2016); Goshu, 2016; Ajaero, 2017; Dawit and Zeray,
2017), and flooding has been claimed by Ramakrishna, Gaddam and Daisy (2014) and Zakari
et al. (2014) to have negative impacts on food security in Khammam (India) and Niger
Republic respectively.
Unfortunately, the knowledge of the effects of flooding on food security in the study area
(Anambra and Imo States’ agrarian communities) which are vulnerable to flooding and have
comparative advantage in the production of staples (cassava, potatoes, maize) in Southeastern
Nigeria, is still lacking. Therefore, this study explored that gap to examine the spatial analysis
of the effects of flooding on food security in these agrarian communities, by showing the
spatial variations of households’ flood vulnerability levels and quantifying the number of
food secure/insecure households in relation to the factors influencing households’ flood
vulnerability and food insecurity. The study findings would be relevant in policy formulation
6
geared towards strengthening peoples’ adaptation capacity to flooding and achieving
Sustainable Development Goals especially Goal 2 related to food security.
1.3 Objectives of the study
General objective
The main objective of this research was assessing the effects of flooding on food security in
agrarian communities of the Southeastern region of Nigeria to determine if flooding affects
food security positively or negatively and to which extent it does.
Specific objectives
The specific objectives are as follows;
i. To determine the nature (extent, frequency, severity) of floods in the study area;
ii. To determine variations in households’ vulnerabilities to floods in the study area;
iii. To assess the food security status and its determinants in the study area;
iv. To assess the effects of flood on households’ food security in the study area;
v. To examine households’ adaptive capacities to flooding and food insecurity in the study area;
1.4 Justification of the study
It has been noted that the global mean temperature has increased by 0.74 °C in the last 100
years, and is expected to rise to between 1.1 and 6.4 °C by the end of the twenty-first century,
depending on projected scenarios (Intergovernmental Panel on Climate Change (IPCC),
2007), which could lead to extreme climate variability and weather-related events like
flooding (Syaukat, 2011). Evidence shows that more intense and recurrent weather events
(heat and cold waves, floods, droughts, heavy storms), rising irregularities in seasonal rainfall
patterns and rising sea levels (including flooding) are already having direct impacts not only
on food production, but also on incidence of food distribution infrastructure, food
emergencies, livelihood assets and human health in both urban and rural areas (FAO, 2008b;
Emaziye, Okoh and Ike, 2013).
In the same light, it has been estimated that on average, about 500 weather-associated
disasters now take place per year, compared with about 120 weather-related disasters in the
1980s. Of these disasters, the occurrence of floods has increased six fold over recent period,
affecting more and more people, especially in coastal areas, where most of the world’s
population now lives (Oxfam, 2007; WHO 2008). Similarly, the United Nations
Development Programme (UNDP) (2008) predicted that climate change might slow down or
7
even reverse the progress in human development achieved over the last decade with its
emerging threats on nutrition, water availability, agricultural production, food security and
access, and public health. It also predicted that the impacts of climate change such as sea
level rises, heat waves, droughts, rainfall variations and floods could render another 600
million people malnourished and about 1.8 billion people worldwide could face water
scarcity by 2080 (UNDP, 2008).
Furthermore, the 2012 floods in Nigeria which was noted to be the worst in over 40 years
(UN-OCHA, 2012) have been reported to subsequently cause food insecurity in parts of
Nigeria (FEWS NET, 2013) yet, there is no existing in-depth study on the effect of flooding
on food security in the south eastern region of Nigeria.
This gap makes this study on the spatial analysis of effects of flooding in the agrarian
communities in south eastern region of Nigeria imperative, because knowing the extent to
which flood can affect food security as well as mapping the flood vulnerability and food
insecurity hotspots (i.e. summarizing the number and location of flood vulnerable and food
insecure people) that have been carried out in this study, would help in suggesting the optimal
adaptation strategies against such events. It would also assist policy makers in designing
sustainable food security policies and flood emergency programmes for the region.
Moreover, the differential households’ abilities to cope and determinants of food security
investigated in this research will help in policies formulation which will increase peoples’
resilience. In addition, the findings of the research would serve as baseline for comparative
studies related to flood and food security.
1.5 Scope and limitations of the study
The study focused on the spatial effects of flooding on households in the agrarian
communities of the Southeast region of Nigeria. The research was carried out in Anambra
and Imo States because of their vulnerabilities to flooding and they were the only two and
worst affected States in the region by the Nigerian 2012 devastating floods in addition to
being agrarian. The research was mostly questionnaire-based majorly because there are no
existing data on the food security status at household level in the study area. Since data were
collected at household level, the unit of analysis is households. Indicators were used to assess
the food security status of households and the FAO (1996) definition of food security has
been adopted for the study. Due to financial and temporal constraints only four Local
8
Government Areas (LGAs) were studied, that is, two in Anambra State and two in Imo State
(see Section 3.3). In addition, the inability of most farmers to keep farm inventory on input
and output or quantify their harvest, led to the adoption of response (yes or no) to self
sufficiency in own food production question as a measure to assess food availability
dimension of food security. River discharge data for the period of study was also
inaccessible, so, flood analysis was mainly questionnaire-based.
1.6 Definition of Concepts
Adaptive capacity: is the ability of people to adjust or adapt to changes e.g. their capacity to
maintain their livelihoods in times of food insecurity and flooding
Agrarian community: is an agricultural community where farming forms the major source
of livelihoods of people.
Flooding: “A flood is the build up of too much water which rises to overflow land which is
not normally submerged. It comprises overflow of a river as a result of long-lasting seasonal
rainfall, accumulation of rainwater in low-lying areas and excessive runoff caused by
absence/inadequate storm drainage” (Ward, 1978:15). Flooding in this study is treated as an
event.
Dietary diversity is defined as the number of different foods or food groups eaten over a
reference time period, irrespective of the consumption frequency.
Food frequency: is defined as the frequency (in terms of days of consumption over a
reference period) that a definite food item or food group is taken at each home (household)
(WFP, 2008).
Food group: is defined as a combination of food items with related caloric and nutrient
content.
Food security: food security as operationalised in this study exists when households do have
adequate physical food for consumption, and have the social or economic access to
satisfactory food for a healthy life at all times.
Food accessibility: is a measure of the ability to obtain/secure food. This is determined by
affordability of food and money spent on food.
Food availability: is associated with the produced food’s physical quantities; food processed,
stored, exchanged and distributed. It has to do with “Sufficient food”.
Food system stability: deals with the phrase “at all times” in the food security definition by
FAO (1996; 2008a). It deals with the importance of reducing the risk of negative effects on

9
the other three dimensions: food accessibility, food availability or food utilization. It is the
temporal determinant as used in this study which defines the ability to access and utilize
adequate levels of nutritious food over time.
Food utilization: entails to the consumption of food and how essential nutrients are acquired
from consumed food by a person. It covers the diet’s nutritional value, in addition to access to
potable water; its composition, preparation methods and safety of food.
Hunger: is regarded as a severe stage of food insecurity, rather than as a distinct or
disconnected condition from the more common experience of food insecurity.
Resilience: is defined as the ability of the household to quickly recover from shocks and
stresses induced by flooding and food insecurity.
Vulnerability: refers to those “biophysical and socio-economic factors that influence
people’s ability to cope with flooding and food insecurity” (Adger et al., 2004).
1.7 Theoretical Framework
1.7.1 Food Insecurity and Vulnerability Information Management Systems Framework
This study adopted the Food and Agricultural Organisation-Food Insecurity and Vulnerability
Information Management Systems (FAO-FIVIMS) theoretical framework developed by the
FAO between 1999 and 2003 (Figure 1.1). This theoretical framework was adopted because
it is a useful tool for conducting food security analysis. It answers the basic questions of who
is food insecure, where they are located, and why they are in this condition, both in transitory
and chronic situations as agreed by Verduijn (2005). The framework explains the linkages
among various food security dimensions and factors influencing them at National, sub-
national, community level, household level and individuals’ level. “It helps identify
appropriate entry points for support to strengthened livelihoods, household food security and
nutrition” (FAO, 2008a:7). “It presents food insecurity as a complex phenomenon,
attributable to a range of factors that vary in importance across regions, countries, households
and social groups, as well as over time. These factors have be grouped in four clusters
representing potential vulnerability in the areas of the socio-economic and political
environment; the performance of the food economy; care practices; and health and sanitation.
Most importantly, it shows a common understanding of possible causes of low food
consumption and poor nutritional status” (Verduijn, 2005:12). “The concept of underlying
“socio-economic, political, institutional, cultural and natural factors” in FAO-FIVIMS
framework highlights the need to consider how these factors impact on different dimensions
10
of food security (food availability, food access, stability, food utilization), while also
affecting care practices, in addition to conditions related to health and sanitation” (FAO,
2008a:8).
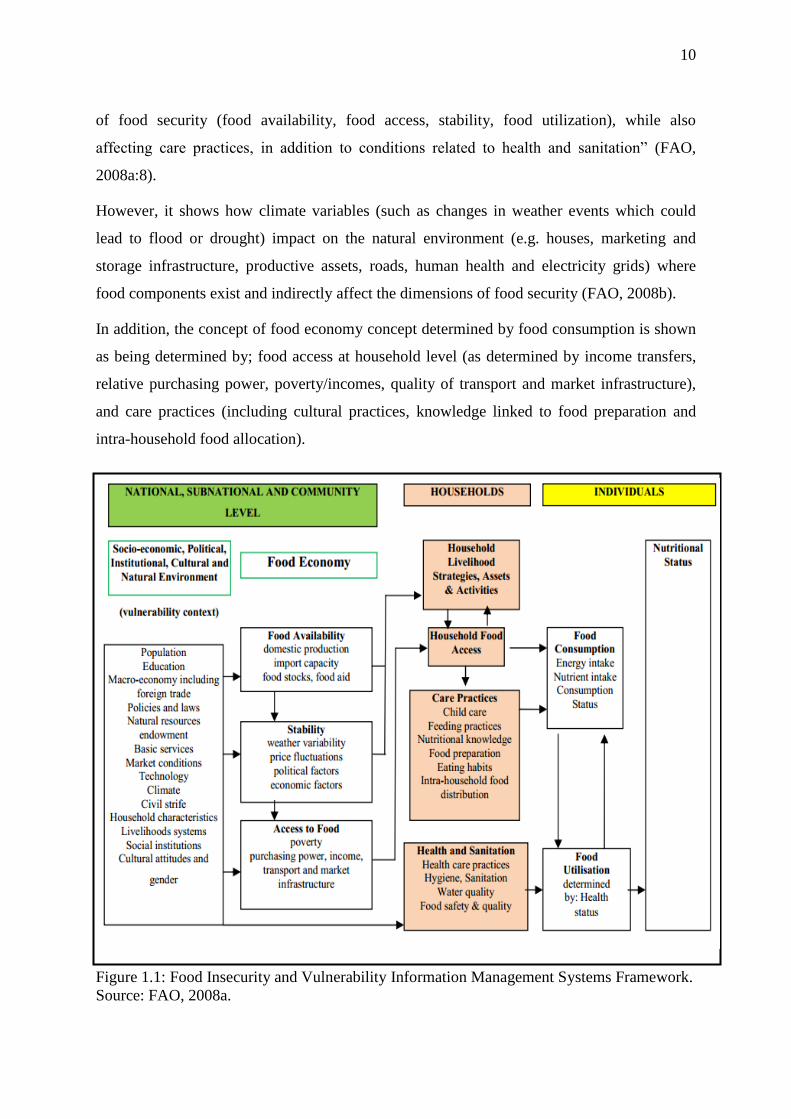
However, it shows how climate variables (such as changes in weather events which could
lead to flood or drought) impact on the natural environment (e.g. houses, marketing and
storage infrastructure, productive assets, roads, human health and electricity grids) where
food components exist and indirectly affect the dimensions of food security (FAO, 2008b).
In addition, the concept of food economy concept determined by food consumption is shown
as being determined by; food access at household level (as determined by income transfers,
relative purchasing power, poverty/incomes, quality of transport and market infrastructure),
and care practices (including cultural practices, knowledge linked to food preparation and
intra-household food allocation).
Figure 1.1: Food Insecurity and Vulnerability Information Management Systems Framework.
Source: FAO, 2008a.
11
The diagram further illustrates that effective and efficient food utilization by the body is
primarily dependent on a person’s health status, which however is reliant on general
sanitation and health conditions. The nutritional status component (concept) of the framework
shows the interactions and relationships of the main issues that affect an individual’s
nutritional status (FAO, 2008a; 2008b). The nutritional outcome depends on two major sub
factors: food consumption (food intake as regards nutrients and energy) and the biological
utilization of food (determined by a person’s health status).
The FAO-FIVIMS theoretical framework offers a comprehensive insight on the factors
influencing vulnerability as well as drivers of current and future food security (dependent
variable) in the study area. These factors as seen from Figure 1.1 include weather variability
(including flooding), income, food stock, food aid, social institutions, gender and poverty
level (which affects people ability to afford), and even availability of markets and transport
facilities which serve as the independent variables. The easily accessible and measureable
components of the theoretical framework have been operationalised in the conceptual
framework.
1.7.2 Sustainable Livelihoods Approach (SLA) Framework
The sustainable livelihoods framework developed by the Department for International
Development (DFID) in 1999 is a tool that aids the understanding of livelihoods, especially
that of the poor. It presents the majors factors that affect the livelihoods of people, and their
interactions. The SLA empowers the poor by treating them as decision-makers with their own
personal sets of priorities, and not as victims.
“A livelihood comprises the capabilities, assets, and activities required for a means of living.
It is deemed sustainable when it can cope with and recover from stresses and shocks and
maintain or enhance its capabilities, assets, and activities both now and in the future, while
not undermining the natural resource base” (Serrat, 2017:21).
The SLA tries to show the way the vulnerable and poor live their lives and how institutions
and policies can help alleviate poverty. Poverty and vulnerability are shown to be related in
the framework.
Vulnerability is regarded as insecurity in households’ well-being when changes occur in
people’s external environment (e.g. flooding). Vulnerability has two sides namely; external
side of shocks (e.g. floods, conflict, storms, illnesses, droughts, diseases), seasonality (e.g.
12
food prices, and critical trends (e.g. governance, environmental, demographic, economic, and
technological; and internal side of defenselessness induced by inability to cope (Serrat, 2017).
Shocks (e.g. flood, conflict) are shown to directly destroy assets as “they can force people to
abandon their home areas and dispose of assets (such as land) prematurely as part of coping
strategies” (DFID, 1999:3). “Seasonal shifts in prices, employment opportunities and food
availability are one of the greatest and most enduring sources of hardship for poor people in
developing countries” (DFID, 1999:3). Some trends mentioned above can reduce
vulnerability e.g. economic indicators can move in positive directions and new technologies
may be very helpful to poor people.
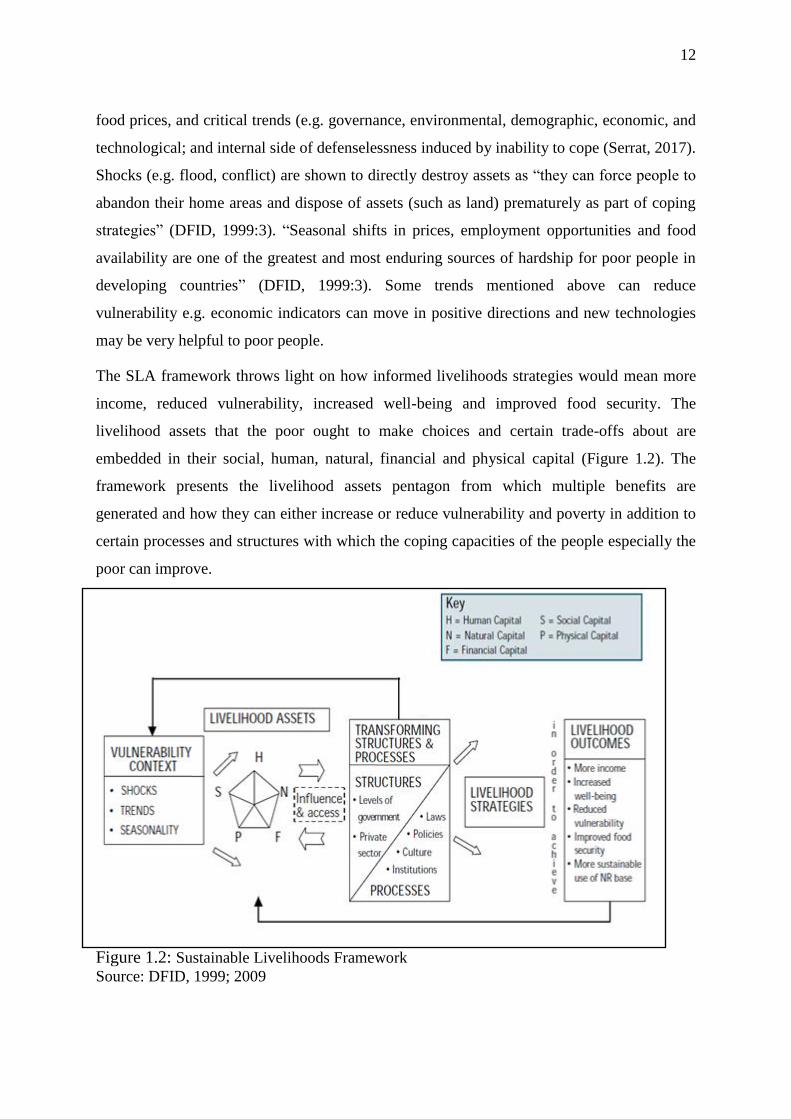
The SLA framework throws light on how informed livelihoods strategies would mean more
income, reduced vulnerability, increased well-being and improved food security. The
livelihood assets that the poor ought to make choices and certain trade-offs about are
embedded in their social, human, natural, financial and physical capital (Figure 1.2). The
framework presents the livelihood assets pentagon from which multiple benefits are
generated and how they can either increase or reduce vulnerability and poverty in addition to
certain processes and structures with which the coping capacities of the people especially the
poor can improve.
Figure 1.2: Sustainable Livelihoods Framework
Source: DFID, 1999; 2009
13
The SLA framework has been reviewed because it brings out the relationship amongst
poverty, vulnerability, sustainable food security and livelihoods considered in this study.
1.7.3 Conceptual Framework
The conceptual framework shown in Figure 1.3 illustrates the relationship between flooding
and food security drawn mostly from the Food and Agricultural Organization - Food
Insecurity and Vulnerability Information Management Systems (FAO-FIVIMS) framework
and the sustainable livelihoods framework as well as reviewed literature. The FAO-FIVIMS
including the Sustainable Livelihoods framework helped in understanding the linkages
among various food security dimensions and factors influencing them at various levels
(Verduijn, 2005; FAO, 2008a; FAO, 2008b; FAO/NRCB, 2008). As shown in Figure 1.3,
food security has four dimensions viz; food availability, accessibility, utilization and stability.
A state of food security entails that households have sufficient food; have physical and
economic access to the food they need and that food is efficiently utilized. But food
accessibility, availability and utilization have to be ensured over time (stability). Stability
stresses the significance of having to minimize the risk of the negative effects on the other
three dimensions (FAO, 2008a). Conversely, food insecurity exists whenever there is a
negative shift (e.g. caused by flooding) in any of these dimensions of food security which
ushers in the concept of vulnerability.
“Vulnerability refers to the array of factors that place households at risk of becoming food
insecure or being affected by flooding. The degree of vulnerability of households or groups
of people is determined by their exposure to the risk factors and their ability to cope with”
(IPCC, 2007:11) flooding and food insecurity as well as the degree to which they are affected
(sensitivity). Vulnerability comprises adaptive capacity factors (e.g. income, education,
access to information) which reduce vulnerability; exposure and sensitivity factors (flood
frequency and severity, flood awareness, location) which increase vulnerability. Data on
these factors were measured by means of indicators collected through questionnaire.
On the one hand, flooding as a phenomenon has a negative effect on food security through
reducing crop harvest and farm income derived from crop sales; damaging assets (e.g.
houses); destroying road and food and farm storage facilities; reducing labour demand;
polluting streams which serve as the major source of water. On the other hand, adaptive
capacity and coping strategies (e.g. income diversification) adopted by households help to
enhance household food security in addition to cushioning the effects of flood-induced food
14
insecurity while food security determinants either enhance or reduce food security. In
addition, sustainable food security is achieved when the four dimensions of food security and
adaptation strategies are established or improved over time.
Food security is the dependent variable and its predictors are drawn from food availability,
accessibility, utilization and stability variables and environmental factor (e.g. flooding)
measured through the use of indicators (via questionnaire) shown in Table 1.1. The Binary
Logistic regression model was used to show the relationship between food security and its
determinants due to the dichotomous nature of the household food security status (food
secure and food insecure households). The variables were mostly categorical and where
ordinal scale of measurement was involved (e.g. level of education ranging from “no formal
education” through having a primary school leaving certificate to having a University
degree), data were transposed into two categories (“no formal education” and “educated”) to
show binary relationship. Flood vulnerability levels is also the dependent variable and the
independent variables are the indicators shown in Table 1.1 and regression analysis was used
to show the direction of influence of these variables on flood vulnerability.
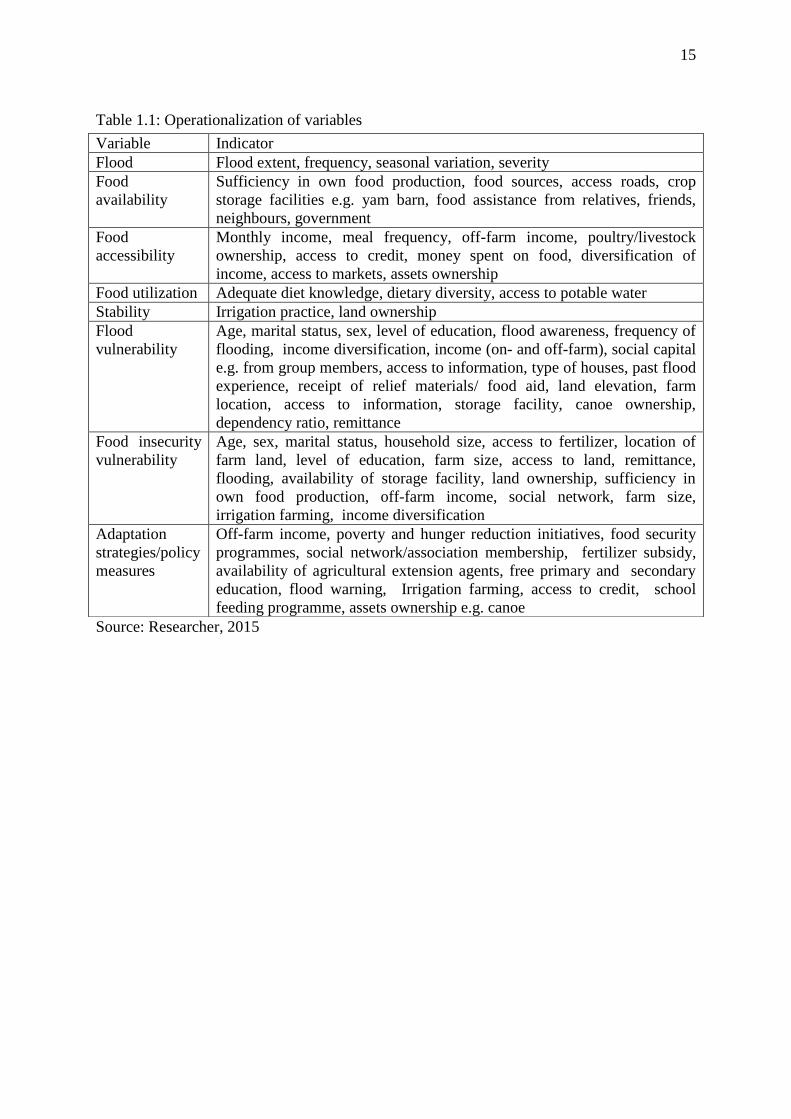
Table 1.1 shows how the variables captured in Figure 1.3 were operationalized through the
use of indicators collected through questionnaire and measurement while flood characteristics
were measured using rainfall data and satellite imageries.
15
Table 1.1: Operationalization of variables
Source: Researcher, 2015
Variable Indicator
Flood Flood extent, frequency, seasonal variation, severity
Food
availability
Sufficiency in own food production, food sources, access roads, crop
storage facilities e.g. yam barn, food assistance from relatives, friends,
neighbours, government
Food
accessibility
Monthly income, meal frequency, off-farm income, poultry/livestock
ownership, access to credit, money spent on food, diversification of
income, access to markets, assets ownership
Food utilization Adequate diet knowledge, dietary diversity, access to potable water
Stability Irrigation practice, land ownership
Flood
vulnerability
Age, marital status, sex, level of education, flood awareness, frequency of
flooding, income diversification, income (on- and off-farm), social capital
e.g. from group members, access to information, type of houses, past flood
experience, receipt of relief materials/ food aid, land elevation, farm
location, access to information, storage facility, canoe ownership,
dependency ratio, remittance
Food insecurity
vulnerability
Age, sex, marital status, household size, access to fertilizer, location of
farm land, level of education, farm size, access to land, remittance,
flooding, availability of storage facility, land ownership, sufficiency in
own food production, off-farm income, social network, farm size,
irrigation farming, income diversification
Adaptation
strategies/policy
measures
Off-farm income, poverty and hunger reduction initiatives, food security
programmes, social network/association membership, fertilizer subsidy,
availability of agricultural extension agents, free primary and secondary
education, flood warning, Irrigation farming, access to credit, school
feeding programme, assets ownership e.g. canoe
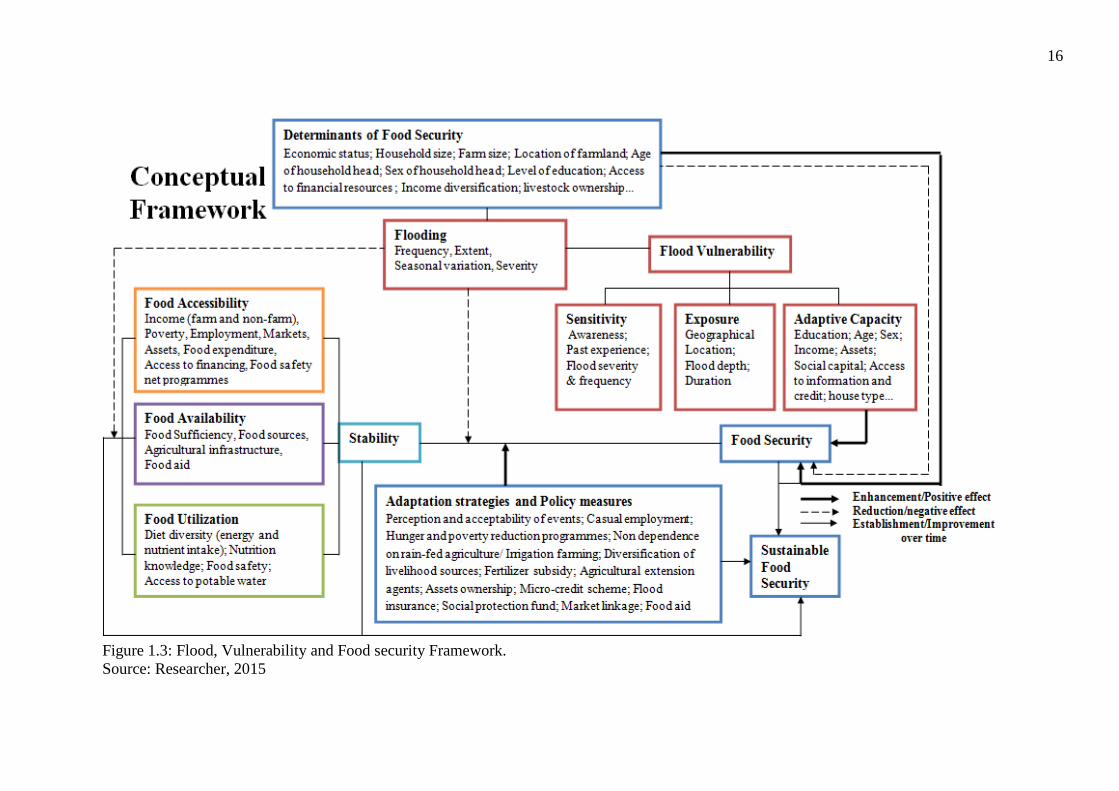
16
Figure 1.3: Flood, Vulnerability and Food security Framework.
Source: Researcher, 2015
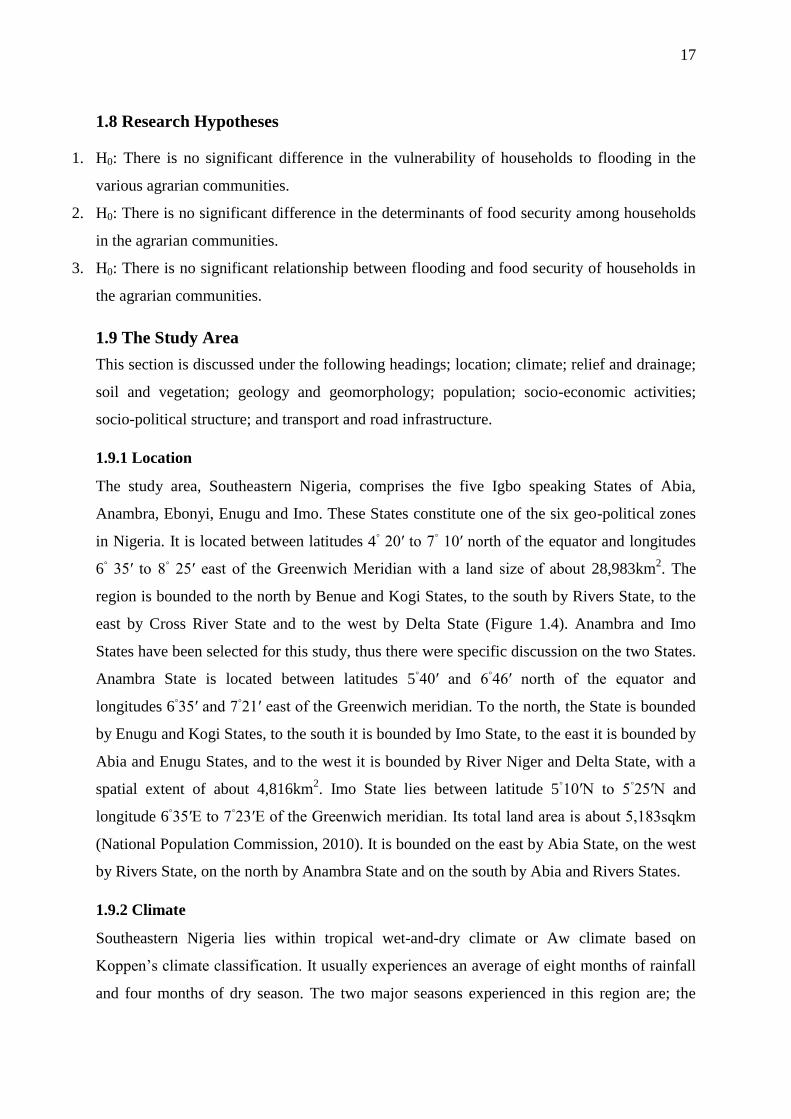
17
1.8 Research Hypotheses
1. H0: There is no significant difference in the vulnerability of households to flooding in the
various agrarian communities.
2. H0: There is no significant difference in the determinants of food security among households
in the agrarian communities.
3. H0: There is no significant relationship between flooding and food security of households in
the agrarian communities.
1.9 The Study Area
This section is discussed under the following headings; location; climate; relief and drainage;
soil and vegetation; geology and geomorphology; population; socio-economic activities;
socio-political structure; and transport and road infrastructure.
1.9.1 Location
The study area, Southeastern Nigeria, comprises the five Igbo speaking States of Abia,
Anambra, Ebonyi, Enugu and Imo. These States constitute one of the six geo-political zones
in Nigeria. It is located between latitudes 4◦ 20′ to 7
◦ 10′ north of the equator and longitudes
6◦ 35′ to 8
◦ 25′ east of the Greenwich Meridian with a land size of about 28,983km
2. The
region is bounded to the north by Benue and Kogi States, to the south by Rivers State, to the
east by Cross River State and to the west by Delta State (Figure 1.4). Anambra and Imo
States have been selected for this study, thus there were specific discussion on the two States.
Anambra State is located between latitudes 5◦40′ and 6
◦46′ north of the equator and
longitudes 6◦35′ and 7
◦21′ east of the Greenwich meridian. To the north, the State is bounded
by Enugu and Kogi States, to the south it is bounded by Imo State, to the east it is bounded by
Abia and Enugu States, and to the west it is bounded by River Niger and Delta State, with a
spatial extent of about 4,816km2. Imo State lies between latitude 5
◦10′N to 5
◦25′N and
longitude 6◦35′E to 7
◦23′E of the Greenwich meridian. Its total land area is about 5,183sqkm
(National Population Commission, 2010). It is bounded on the east by Abia State, on the west
by Rivers State, on the north by Anambra State and on the south by Abia and Rivers States.
1.9.2 Climate
Southeastern Nigeria lies within tropical wet-and-dry climate or Aw climate based on
Koppen’s climate classification. It usually experiences an average of eight months of rainfall
and four months of dry season. The two major seasons experienced in this region are; the
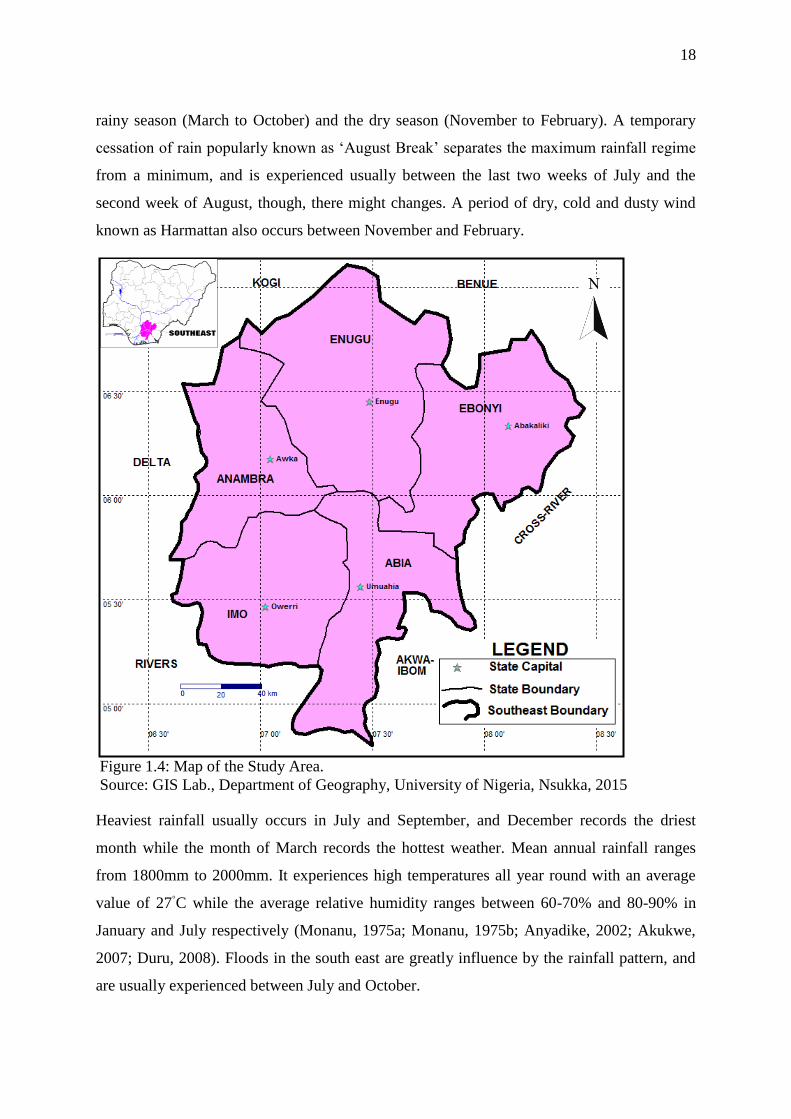
18
rainy season (March to October) and the dry season (November to February). A temporary
cessation of rain popularly known as ‘August Break’ separates the maximum rainfall regime
from a minimum, and is experienced usually between the last two weeks of July and the
second week of August, though, there might changes. A period of dry, cold and dusty wind
known as Harmattan also occurs between November and February.
Figure 1.4: Map of the Study Area.
Source: GIS Lab., Department of Geography, University of Nigeria, Nsukka, 2015
Heaviest rainfall usually occurs in July and September, and December records the driest
month while the month of March records the hottest weather. Mean annual rainfall ranges
from 1800mm to 2000mm. It experiences high temperatures all year round with an average
value of 27◦C while the average relative humidity ranges between 60-70% and 80-90% in
January and July respectively (Monanu, 1975a; Monanu, 1975b; Anyadike, 2002; Akukwe,
2007; Duru, 2008). Floods in the south east are greatly influence by the rainfall pattern, and
are usually experienced between July and October.
19
1.9.3 Relief and Drainage
The Southeastern region of Nigeria may be classified into two broad relief regions namely;
lowlands and cuesta landscapes. The lowlands have heights of less than 400 meters and are
made up of the Niger-Anambra lowlands in Anambra State and the undulating lowlands and
coastal plains located along the Bende-Ameke-Umuahia axis of Imo and Abia States. The
cuesta landscapes of above 350 meters high comprise the Nsukka-Okigwe cuesta and Awka-
Orlu uplands (Ofomata, 2002a). The Nsukka-Okigwe cuesta is made up of the Enugu
escarpments formed by the resistant sandstone in the lower coal measures and in the lower
parts of the false bedded sandstone. The Awka-Orlu uplands are found around the Agulu,
Nanka, Oko, Ekwulobia and Onitsha areas in Anambra State and Orlu area in Imo State. In
terms of drainage, Anambra State is surrounded by rivers such as the River Niger, Omabala
River, the Nkisi River, the Idemili River, Duo River, Mamu River, Ezu River and the
Nwangele/Utumonye creek.
Figure 1.5: Drainage Map of the Study Area.
Source: GIS Lab., Department of Geography, University of Nigeria, Nsukka, 2015
20
Imo State has few rivers with enormous interfluves that carry run-off in periods of heavy
rains. The unique evenness of the terrain could be attributed to the uniformity of the rock
structure and to the dearth of tectonic disturbances (Udo, 1981). The main streams draining
the State are Imo, Otamiri, Njaba and Ulasi rivers, all of which have very few tributaries.
With the exception of Imo River (which runs through the area underlain by the Imo Shales),
other rivers in Imo State rise within the coastal plain sands.
All these rivers in the Southeastern region of Nigeria are tributaries of River Niger (Figure
1.5), and they sometimes overflow their banks to inundate adjacent communities especially
due to excessive water supply from River Niger.
1.9.4 Soil and Vegetation
The soils of the area is composed mainly of iron rich tropical soils, which may be in the
forms of loamy, clay, sandstones and sandy clays, and is further classified based on
geological formation (Figure 1.6), landscape features and degree of profile development into
lithosols, juvenile soils, ferralitic soils and hydromorphic soils (Onokala and Phil-Eze 2001;
Umeji 2002, Ofomata, 2002b).
Her vegetation is mainly rainforest-savanna eco-tone. This vegetation zone comprises more
than 60% grass with Hyparrhenia, Andropogon and Pennisetum purpureum as the
predominant species (Phil-Eze 2001; Anyadike, 2002). The dominant plant species found in
this area include; Elaeis guineensis (Oil palm tree), milicia excelsa (iroko tree), Raphia
vinifera (Raphia palm), Dacroydes edulis (African pear), Psidium guajava (Guava),
Mangifera indica (Mango), Lophira alata, Gmelina arborea (Gmelina tree), Avicennia
Africana, coconuts, kola nuts, bitter kola nuts, bread fruit tree etc (Phil-Eze, 2001).
The region is predominantly agrarian and therefore much dependence on land resources, as a
result of its dense population averaged to about 566 people/Km2
(National Population
Commission, 2010). This high population density is partly influenced by uncontrolled
urbanization, which has brought about change in land-use and built-up environments as well
as decrease in infiltration and percolation in parts of the region. The resultant effect is
increased surface run-off which is generated faster than they are evacuated, thereby
exacerbating flooding rates. In addition, the dependence on land has led to the overuse (due
to annual farming of agricultural lands) of the land resources in the region (Anejionu, Nwilo
and Ebinne, 2013).
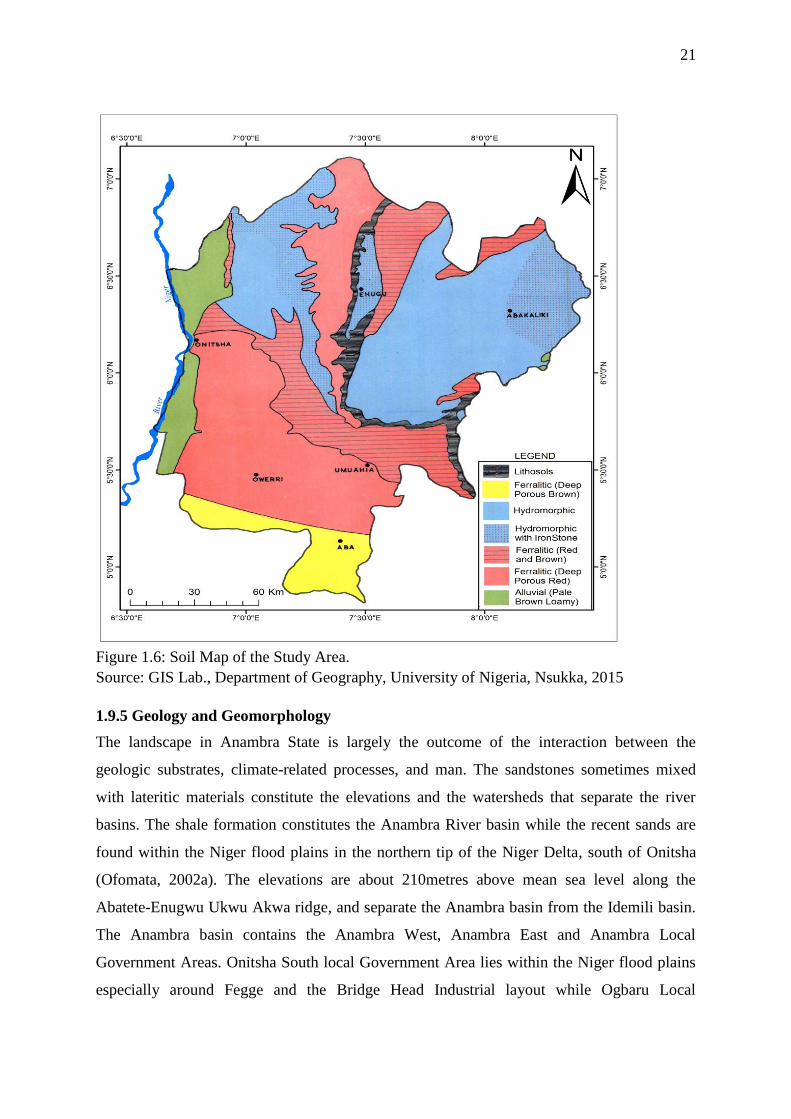
21
Figure 1.6: Soil Map of the Study Area.
Source: GIS Lab., Department of Geography, University of Nigeria, Nsukka, 2015
1.9.5 Geology and Geomorphology
The landscape in Anambra State is largely the outcome of the interaction between the
geologic substrates, climate-related processes, and man. The sandstones sometimes mixed
with lateritic materials constitute the elevations and the watersheds that separate the river
basins. The shale formation constitutes the Anambra River basin while the recent sands are
found within the Niger flood plains in the northern tip of the Niger Delta, south of Onitsha
(Ofomata, 2002a). The elevations are about 210metres above mean sea level along the
Abatete-Enugwu Ukwu Akwa ridge, and separate the Anambra basin from the Idemili basin.
The Anambra basin contains the Anambra West, Anambra East and Anambra Local
Government Areas. Onitsha South local Government Area lies within the Niger flood plains
especially around Fegge and the Bridge Head Industrial layout while Ogbaru Local
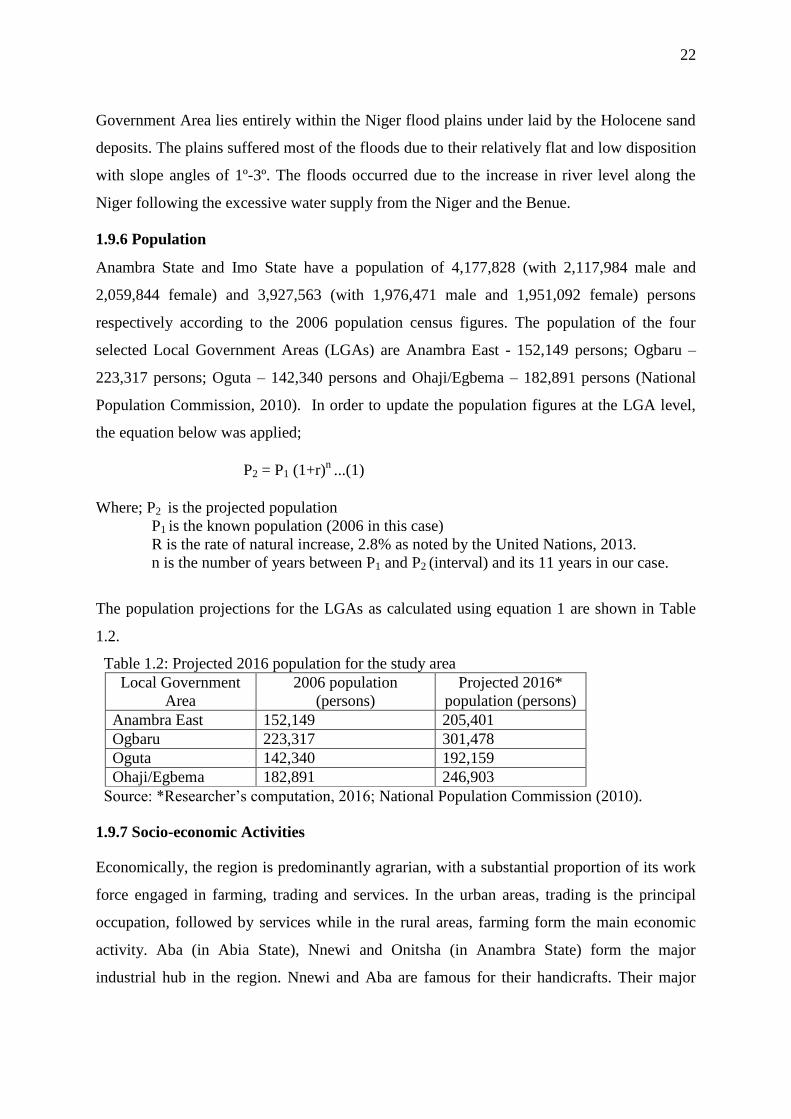
22
Government Area lies entirely within the Niger flood plains under laid by the Holocene sand
deposits. The plains suffered most of the floods due to their relatively flat and low disposition
with slope angles of 1º-3º. The floods occurred due to the increase in river level along the
Niger following the excessive water supply from the Niger and the Benue.
1.9.6 Population
Anambra State and Imo State have a population of 4,177,828 (with 2,117,984 male and
2,059,844 female) and 3,927,563 (with 1,976,471 male and 1,951,092 female) persons
respectively according to the 2006 population census figures. The population of the four
selected Local Government Areas (LGAs) are Anambra East - 152,149 persons; Ogbaru –
223,317 persons; Oguta – 142,340 persons and Ohaji/Egbema – 182,891 persons (National
Population Commission, 2010). In order to update the population figures at the LGA level,
the equation below was applied;
P2 = P1 (1+r)n
...(1)
Where; P2 is the projected population
P1 is the known population (2006 in this case)
R is the rate of natural increase, 2.8% as noted by the United Nations, 2013.
n is the number of years between P1 and P2 (interval) and its 11 years in our case.
The population projections for the LGAs as calculated using equation 1 are shown in Table
1.2.
Table 1.2: Projected 2016 population for the study area
Local Government
Area
2006 population
(persons)
Projected 2016*
population (persons)
Anambra East 152,149 205,401
Ogbaru 223,317 301,478
Oguta 142,340 192,159
Ohaji/Egbema 182,891 246,903
Source: *Researcher’s computation, 2016; National Population Commission (2010).
1.9.7 Socio-economic Activities
Economically, the region is predominantly agrarian, with a substantial proportion of its work
force engaged in farming, trading and services. In the urban areas, trading is the principal
occupation, followed by services while in the rural areas, farming form the main economic
activity. Aba (in Abia State), Nnewi and Onitsha (in Anambra State) form the major
industrial hub in the region. Nnewi and Aba are famous for their handicrafts. Their major
23
economic contributions are palm oil and textiles alongside cosmetics, cement,
pharmaceuticals and plastics.
There are several international markets found in the region e.g. the Onitsha Main Market
which is the largest market in the region followed by the Ariaria International Market in Aba,
Ngbuka motor spare parts market, Nkpo building market, Obosi electrical parts market etc.
There are several daily popular markets like, Eke Onunwa in Owerri (demolished on
26/08/2017), Relief markets in Owerri and Onitsha, Ogbete market in Enugu among others.
Despite the existence of daily markets, some towns in south east have markets that are
periodic; people come to buy and sell on their market day, which usually has a four-day-
cycle. There are four market days in the south east region viz; Eke, Orie, Afor and Nkwo.
These periodical markets are found mostly in rural areas where most of the foods are grown,
and this affect food security as the selling and buying of farm and non-farm produce are on a
four-day-cycle. The region is rich in natural resources including crude oil, natural gas, zinc,
lead, iroko, obeche, mahogany, rubber trees, oil palms and wood. The region has comparative
advantage in the production of subsistence crops like yams, maize, potatoes, cashew, rice,
plantains, and cassava which add a rich agricultural importance to the economy of Nigeria.
The region could potentially offer food security to the nation, and generate export revenues if
given adequate support.
Agriculture is mainly rain-fed in the region with many farmers involved in small-scale
farming. They use crude farming implements like hoes, cutlasses and diggers among others
while mechanised farming is practised by large-scale farmer who are very few. Shifting
cultivation is practised in some parts where there are large expanses of land, though this
practice is decreasing due to land scarcity. Rotational bush fallowing and crop rotation are
also common practices. Rain-fed agriculture affects food security as some crops are
seasonally available and are so expensive during off season.
There are several primary and secondary schools, as well as tertiary institution with some
being run by the State governments, individuals and others by the Federal government. These
tertiary institutions include; Imo State University, Owerri; Federal University of Technology,
Owerri; University of Nigeria, Nsukka; Nnamdi Azikiwe University Awka; Abia State
University, Uturu; Ebonyi State University; Anambra State University, Uli and Igbariam;
Enugu State of Science and Technology; Oko Polythenic; Alvan Ikoku College of Education,
Owerri etc.
24
Health centres and hospitals are found mostly in urban centres with sometimes none found in
an entire town, though each of the Universities in the South east has a Teaching Hospital.
Most Primary Health Care (PHC) centres are found in LGA headquarters which are usually
not easily accessible to rural dwellers.
1.9.8 Socio-political structure
South easterners are generally patrilineal. There is the common practice of communal land
ownership where kinsmen come together to share communal land amongst the male members
each farming season, and whenever an adult kinsman wants to erect a building. This land
tenure system has made land inaccessible to some people and has reduced the portion of land
cultivated. Women do not own land in Igboland; they can only acquire/own land through
marriage, leasehold or by buying. Farm/land leasing is also a common practice in the region.
There is also individual ownership which is usually inherited, gifted or bought.
In most towns and villages, there are traditional rulers who pilot the affairs of their
communities, where there is no traditional ruler, the town union president for instance, might
be handed the mantle of leadership for his community.
In the study area (Igboland), a household is made up of a man, his wife and children,
unmarried brothers and sisters, aged parents, and extended family. This social structure of
household according to Afigbo (1992) is as a result of the agricultural system where these
household members are obliged to help out in different activities. “Land holding is a
reflection of the extended family structure where the adult males basically own the land and
then lease it to their wives. The extended family is readily accepted, including large families
in the traditional Igbo society, because it guarantees an increase agricultural labour force
which is required for agricultural production” (Chukwuezi, 1999:12). Family members
usually constitute the greatest part of agricultural labour, though hired labour is also
employed.
1.9.9 Transport and Road Infrastructure
Air, rail, road and river transport means are available in the South east region of Nigeria. Air
transport is not common as there are only two (2) airports situated in the region; 1 local (Sam
Mbakwe Airport, Owerri and one international (Akanu Ibiam International Airport, Enugu).
Rail transport that links the five (5) States to the rest of the country is minimally used and non
popular because the railway passed through a very few towns, and there are a very few train
25
stations in the region. This has affected inter-regional trade. The most popular train stations in
the south east are the Eha Amufu, Enugu and Aba train stations. River transport is mainly by
canoes and speed boats and are evident only in the agricultural towns that are surrounded by
rivers e.g. Oguta, Otuocha, Anam. The major mode of transport is road with a couple of inter-
State roads linking the five States that make up the south east region as well as inter-regional
roads linking them to other regions e.g. Onitsha-Owerri highway; Enugu-Port Harcourt
express way; Onitsha-Awka-Nsukka road; Enugu-Nsukka-Makurdi-Lokoja highway. Intra-
State roads linking LGAs together are also available. Onitsha, Aba, Enugu, Owerri and
Abakiliki are major hubs for road transport in the region - a large number of transport
companies operate buses and coaches that convey people and goods to different parts of the
country daily.
Road infrastructure in the region is inadequate (in terms of number, accessibility and
connectivity) and majority of the available roads are in poor state which is a major constraint
to the development of agriculture and trade with the exception of Anambra State. Anambra
State is the only State in the region that has improved tremendously in road network in recent
years. The poor transport system within the region, affects movement of farm produce and
increase transport cost e.g. in areas with non motorable roads, motorcycles are used to carry
farm products from farm to market or other urban centres, thereby increasing food prices
because a motorcyclist sometimes has to make 10-20 round-trips of what a vehicle (truck)
could make once.
1.10. Organisation of Chapters
The thesis consists of five chapters. Chapter one is the introduction comprising the study’s
background, problem statement, objectives of the study, justification of the study, scope and
limitations of the study, definition of concepts, theoretical/conceptual framework, research
hypotheses, study area and organization of chapters.
Chapter two is the review of relevant literature on the effects of flooding on food security
organized in five themes namely; causes and effects of flooding, vulnerability and adaptation
to flooding, food security concept and measurements, determinants of food security, and
climate change, flooding and food security.
Chapter three dealt with the research methodology involving the data sources, data collection
methods as well as the tools/techniques employed in the data analysis.

26
Chapter four comprises the results and discussion. It dealt with a description of flood
frequency, seasonal variations and severity as well as mapping the extent of flooding.
Similarly, households’ vulnerabilities to flooding and the different flood vulnerability levels,
households’ food security situations and their determinants, the effects of flooding on food
security across households, the different adaptation and coping measures adopted by
households to reduce the effects of flooding and food insecurity, and resilience of households
were discussed in this chapter. Finally, chapter five consists of the summary of findings,
conclusion and suggestions of measures to alleviate the effects of flooding as well as policy
measures to enhance food security in the study area.
27
CHAPTER TWO
LITERATURE REVIEW
Thematic method has been adopted in discussing relevant literature in this study. The themes
are; causes and effects of flooding; vulnerability and adaptation to flooding; food security
concept and measurement; determinants of food security; climate change, flooding and food
security.
2.1 Causes and effects of flooding
Flooding is one of the most common of all environmental hazards (Adewuyi and Olofin,
2014; Akukwe and Ogbodo, 2015). Flood is a natural phenomenon but human activities and
interventions such as uncontrolled urbanization, impervious surfaces, blocked drainage
facilities, improper use of flood plains, deforestation, coupled with increased population have
increased the damages and losses caused by floods (Ologunorisa, 2004; Jeb and Aggarwal,
2008; Ogba and Utang, 2008; Balabanova and Vassilev, 2010; Ojigi et al., 2013; Akukwe and
Ogbodo 2015). “Statistics have shown that floods in third-world countries usually cause
many casualties and comparatively little damage, whereas floods in Europe and the USA
cause enormous economic damage, but relatively small number of victims” (Klijn, 2009:5).
However, it has not been established whether the increased adverse effects of floods in the
last decades were caused by more intense and recurrent flooding, or by the increased
vulnerability of flood plains, which are the preferred areas for economic development and
settling (Klijn, 2009).
Flooding has been observed globally as one of nature’s damaging phenomena (Adeoye et al.,
2009; Aderogba, 2012; Wright, 2011; Duru and Chibo, 2014). Globally, the incidence of
flooding has increased due to rise in sea level mostly in the coastal cities as well as changes
in annual and seasonal rainfall as a result of climate change (IPCC, 2007; Syaukat, 2011)
which has been manifested in increased pest outbreaks, reduced crop yields, rampant soil
erosion and water logging ( FAO, 2008b; Emaziye, et al., 2013).
Over the past century, the Central United States (CUS) has been beleaguered by a chain of
large floods especially the incidences of 1993, 2008, 2011, 2013 and 2014 (Downton, Miller
and Pielke; 2005; Xiao, Wan and Hewings, 2013). These flood events had taken a devastating
societal consequences and economic toll on the CUS including decreased food production
28
and displacement of communities/people, contributing to economic losses reaching billions
of dollars (Downton et al., 2005; Xiao et al., 2013; Mallakpour and Villarini, 2015).
Yin and Li (2001) noted that floods had become more frequent in the middle reaches of
Yangtze River because of human activities (destruction of vegetation, land reclamation and
siltation, construction of levees) in the river basin which had increased soil erosion of the
upper reaches of the River, reduced the river’s size and caused restricted flood discharge
capacity.
Ninno et al. (2003) studied the floods in Bangladesh and they reported the floods to have
affected food security of millions of households, and flooding, according to Muriadi and
Wljaya (2013) has led to food insecurity in Indonesia. In West Bengal, heavy rainfall,
melting snow, glacial outbursts, and dam break flows have been attributed as the main cause
of inland flooding and the effects of flooding include; displacement of persons with
associated poverty, loss of life and property, agricultural deficiency, disease outbreak,
unemployment and starvation (Ismail and Mustaquim, 2013).
Many cities in Africa had been noted to face tremendous problems of severe flooding
according to Douglas et al. (2008) which is caused by increased storm intensity and
frequency related to climate change, and worsened by factors such as increased runoff from
impermeable surfaces, blocked drainage systems, occupation of floodplains and inadequate
waste management.
Furthermore, flooding in Nigeria has been due to natural (e.g. rainstorm/torrential or heavy
rains, tidal waves and oceans storms usually along the coast), artificial (e.g. dam burst, burst
water pipes, levees failure, silted up drainage, uncontrolled urbanisation) and topographic
factors (Etuonovbe, 2011; Akukwe, 2014).
In various parts of Nigeria, flooding has killed people and forced thousands away from their
homes; caused loss of life, animals and property; destroyed businesses, bridges, roads and
other infrastructure; caused poverty through the degradation of agriculture land and
disruption of services; polluted water resources and increased the risk of diseases (Jeb and
Aggarwal, 2008; Ogba and Utang, 2008; Adeloye and Rustum, 2011; Etuonovbe, 2011;
Olorunfemi, 2011), destroyed farm land and agricultural products resulting to poverty, hunger
and starvation (Ejikeme et al., 2015) and according to Ajaero (2017), the 2012 flood in
Nigeria affected the food security status of both female- and male-headed categories of
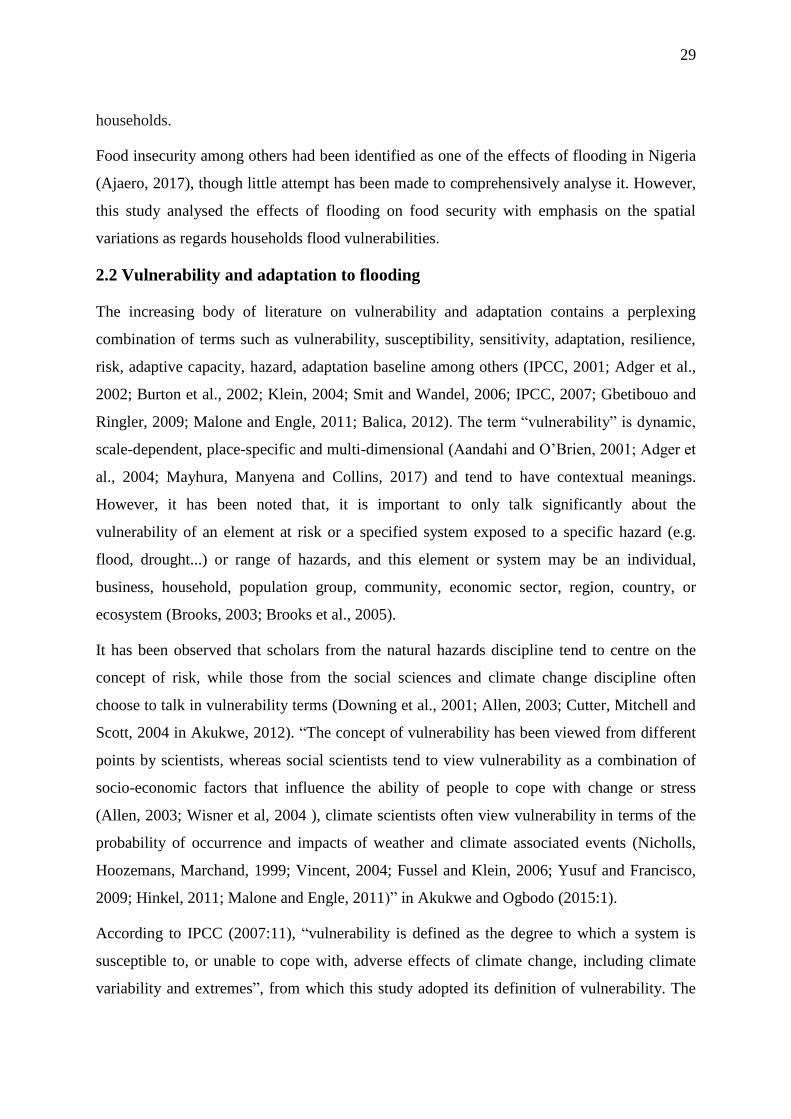
29
households.
Food insecurity among others had been identified as one of the effects of flooding in Nigeria
(Ajaero, 2017), though little attempt has been made to comprehensively analyse it. However,
this study analysed the effects of flooding on food security with emphasis on the spatial
variations as regards households flood vulnerabilities.
2.2 Vulnerability and adaptation to flooding
The increasing body of literature on vulnerability and adaptation contains a perplexing
combination of terms such as vulnerability, susceptibility, sensitivity, adaptation, resilience,
risk, adaptive capacity, hazard, adaptation baseline among others (IPCC, 2001; Adger et al.,
2002; Burton et al., 2002; Klein, 2004; Smit and Wandel, 2006; IPCC, 2007; Gbetibouo and
Ringler, 2009; Malone and Engle, 2011; Balica, 2012). The term “vulnerability” is dynamic,
scale-dependent, place-specific and multi-dimensional (Aandahi and O’Brien, 2001; Adger et
al., 2004; Mayhura, Manyena and Collins, 2017) and tend to have contextual meanings.
However, it has been noted that, it is important to only talk significantly about the
vulnerability of an element at risk or a specified system exposed to a specific hazard (e.g.
flood, drought...) or range of hazards, and this element or system may be an individual,
business, household, population group, community, economic sector, region, country, or
ecosystem (Brooks, 2003; Brooks et al., 2005).
It has been observed that scholars from the natural hazards discipline tend to centre on the
concept of risk, while those from the social sciences and climate change discipline often
choose to talk in vulnerability terms (Downing et al., 2001; Allen, 2003; Cutter, Mitchell and
Scott, 2004 in Akukwe, 2012). “The concept of vulnerability has been viewed from different
points by scientists, whereas social scientists tend to view vulnerability as a combination of
socio-economic factors that influence the ability of people to cope with change or stress
(Allen, 2003; Wisner et al, 2004 ), climate scientists often view vulnerability in terms of the
probability of occurrence and impacts of weather and climate associated events (Nicholls,
Hoozemans, Marchand, 1999; Vincent, 2004; Fussel and Klein, 2006; Yusuf and Francisco,
2009; Hinkel, 2011; Malone and Engle, 2011)” in Akukwe and Ogbodo (2015:1).
According to IPCC (2007:11), “vulnerability is defined as the degree to which a system is
susceptible to, or unable to cope with, adverse effects of climate change, including climate
variability and extremes”, from which this study adopted its definition of vulnerability. The
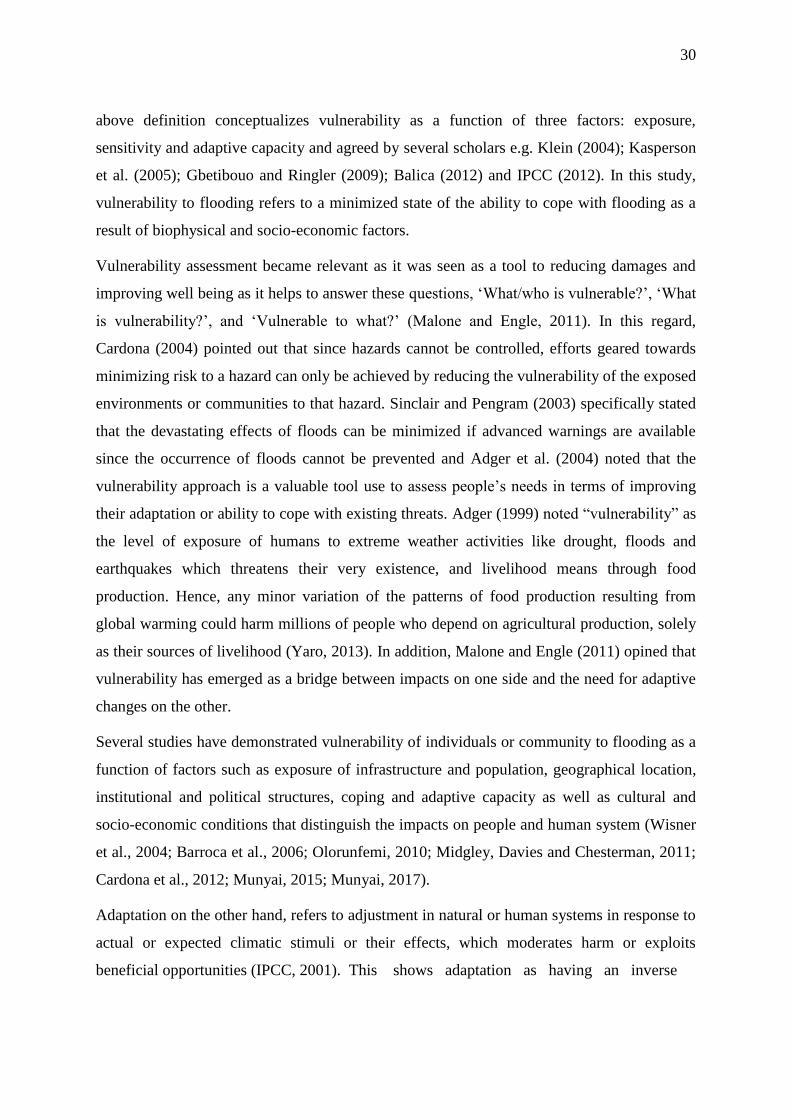
30
above definition conceptualizes vulnerability as a function of three factors: exposure,
sensitivity and adaptive capacity and agreed by several scholars e.g. Klein (2004); Kasperson
et al. (2005); Gbetibouo and Ringler (2009); Balica (2012) and IPCC (2012). In this study,
vulnerability to flooding refers to a minimized state of the ability to cope with flooding as a
result of biophysical and socio-economic factors.
Vulnerability assessment became relevant as it was seen as a tool to reducing damages and
improving well being as it helps to answer these questions, ‘What/who is vulnerable?’, ‘What
is vulnerability?’, and ‘Vulnerable to what?’ (Malone and Engle, 2011). In this regard,
Cardona (2004) pointed out that since hazards cannot be controlled, efforts geared towards
minimizing risk to a hazard can only be achieved by reducing the vulnerability of the exposed
environments or communities to that hazard. Sinclair and Pengram (2003) specifically stated
that the devastating effects of floods can be minimized if advanced warnings are available
since the occurrence of floods cannot be prevented and Adger et al. (2004) noted that the
vulnerability approach is a valuable tool use to assess people’s needs in terms of improving
their adaptation or ability to cope with existing threats. Adger (1999) noted “vulnerability” as
the level of exposure of humans to extreme weather activities like drought, floods and
earthquakes which threatens their very existence, and livelihood means through food
production. Hence, any minor variation of the patterns of food production resulting from
global warming could harm millions of people who depend on agricultural production, solely
as their sources of livelihood (Yaro, 2013). In addition, Malone and Engle (2011) opined that
vulnerability has emerged as a bridge between impacts on one side and the need for adaptive
changes on the other.
Several studies have demonstrated vulnerability of individuals or community to flooding as a
function of factors such as exposure of infrastructure and population, geographical location,
institutional and political structures, coping and adaptive capacity as well as cultural and
socio-economic conditions that distinguish the impacts on people and human system (Wisner
et al., 2004; Barroca et al., 2006; Olorunfemi, 2010; Midgley, Davies and Chesterman, 2011;
Cardona et al., 2012; Munyai, 2015; Munyai, 2017).
Adaptation on the other hand, refers to adjustment in natural or human systems in response to
actual or expected climatic stimuli or their effects, which moderates harm or exploits
beneficial opportunities (IPCC, 2001). This shows adaptation as having an inverse

31
proportionality with vulnerability because adaptation measures or adaptive capacity limit
vulnerability. For instance, adaptive capacity is the reason why people who are exposed to
same degree of flooding, feel different degrees of impact(s). Thus, improving people’s
adaptive capacity is crucial in reducing their vulnerability to flood and this is dependent upon
many factors. As noted by Maskrey (1999:85), “a community’s capacity to absorb the impact
of a hazard event and recover from it is determined by its geographical location, the
resistance of its physical structures and infrastructures, its economic capacity, its levels of
social cohesion and organisation, its cultural vision of disasters and many other factors.”
Similarly, studies on patterns of coping emphasise that people draw on number of informal
sources of income and food, e.g. social networks, and there are existing variations in
households’ resources and the ability to convert these into food entitlements (Pottier 1988;
Davies 1993; Swift 1993; Homewood, 1995 and Morrow, 1999).
In addition, individuals in a household vary in skills, knowledge, and in their socially and
culturally determined rights to resources (e.g. monetary resources, water or forest resources,
labour resources, agricultural production) according to age and gender (Anderson and
Woodrow 1991; Nypan 1991; Dercon and Krishnan 1996; Cannon, 2002; Denton, 2002;
Adger et al., 2004), and households differ in their capability to organize and manage
resources and therefore ability to cope (Adger et al., 2004).
The interconnections between vulnerability and adaptation have been documented. In this
light, Cardona et al. (2012) noted that, having an insight on the many-sided nature of
vulnerability and exposure is a precondition for determining how weather and climate events
influence disasters occurrence, and for designing and implementing efficient adaptation and
disaster risk management strategies.
Studies on vulnerability and adaptation to climate risks and climate change, including floods,
have been undertaken in various regions of the world (Bankoff, 2003; Dutta, Khatun and
Herath, 2005; Metzger and Schroter, 2006; Thorton et al.,2006; Thieken, Kreibich and Merz,
2007; Ali 2007; Aragon-Durand, 2007; Gbetibouo and Ringler, 2009, Yusuf and Francisco,
2009; Heltberg and Bonch-Osmolovskiy, 2011; Midgley et al., 2011; Balica, 2012; Akukwe;
2012; Akukwe and Ogbodo, 2015; Ejikeme et al., 2015; Munyai , 2017). Vulnerability
assessment is considered a core step towards successful disaster risk reduction as it helps to
identify disaster (e.g. floods, earthquakes) hotspots as well as where targeted impact-
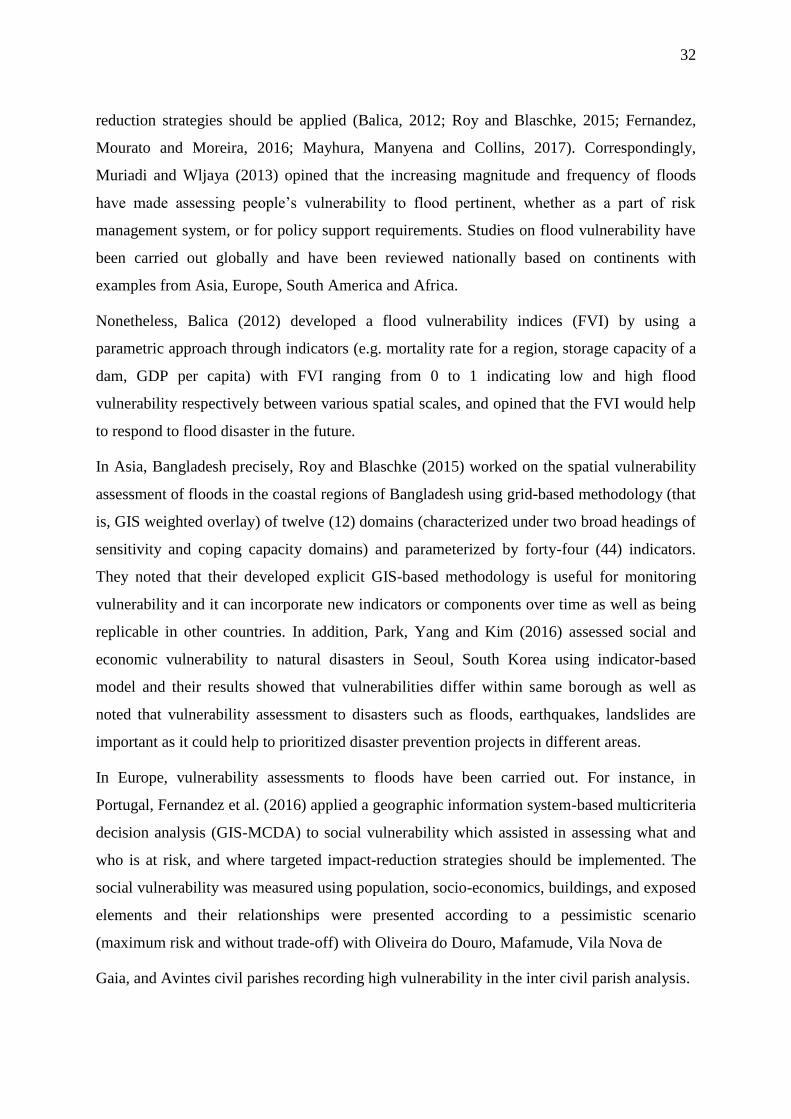
32
reduction strategies should be applied (Balica, 2012; Roy and Blaschke, 2015; Fernandez,
Mourato and Moreira, 2016; Mayhura, Manyena and Collins, 2017). Correspondingly,
Muriadi and Wljaya (2013) opined that the increasing magnitude and frequency of floods
have made assessing people’s vulnerability to flood pertinent, whether as a part of risk
management system, or for policy support requirements. Studies on flood vulnerability have
been carried out globally and have been reviewed nationally based on continents with
examples from Asia, Europe, South America and Africa.
Nonetheless, Balica (2012) developed a flood vulnerability indices (FVI) by using a
parametric approach through indicators (e.g. mortality rate for a region, storage capacity of a
dam, GDP per capita) with FVI ranging from 0 to 1 indicating low and high flood
vulnerability respectively between various spatial scales, and opined that the FVI would help
to respond to flood disaster in the future.
In Asia, Bangladesh precisely, Roy and Blaschke (2015) worked on the spatial vulnerability
assessment of floods in the coastal regions of Bangladesh using grid-based methodology (that
is, GIS weighted overlay) of twelve (12) domains (characterized under two broad headings of
sensitivity and coping capacity domains) and parameterized by forty-four (44) indicators.
They noted that their developed explicit GIS-based methodology is useful for monitoring
vulnerability and it can incorporate new indicators or components over time as well as being
replicable in other countries. In addition, Park, Yang and Kim (2016) assessed social and
economic vulnerability to natural disasters in Seoul, South Korea using indicator-based
model and their results showed that vulnerabilities differ within same borough as well as
noted that vulnerability assessment to disasters such as floods, earthquakes, landslides are
important as it could help to prioritized disaster prevention projects in different areas.
In Europe, vulnerability assessments to floods have been carried out. For instance, in
Portugal, Fernandez et al. (2016) applied a geographic information system-based multicriteria
decision analysis (GIS-MCDA) to social vulnerability which assisted in assessing what and
who is at risk, and where targeted impact-reduction strategies should be implemented. The
social vulnerability was measured using population, socio-economics, buildings, and exposed
elements and their relationships were presented according to a pessimistic scenario
(maximum risk and without trade-off) with Oliveira do Douro, Mafamude, Vila Nova de
Gaia, and Avintes civil parishes recording high vulnerability in the inter civil parish analysis.

33
In South America, Novelo-Casanova and Rodríguez-Vangort (2015) assessed the flood risk
of Motozintla, Mexico by adopting the structural, socioeconomic, organizational and global
vulnerabilities. Their results showed that high level of flood risk to flooding was related to
high structural vulnerability; poverty, lack of basic public services and proper social security
services; no knowledge of existing Civil Protection Plan; and non-existent of disaster
mitigation and response.
In South Africa, Munyai (2017) assessed community flood vulnerability and adaptation using
exposure, susceptibility and resilience indicators and his results showed that flood
vulnerability is determined by dwelling quality, poor or lack of drainage system, education
levels, employment status, rainfall amount and topography in Greater Tzaneen Local
Municipality, South Africa. Moreover, Mayhura et al. (2017) assessed the spatial variation of
social vulnerability to flood hazards in Muzarabani district, Zimbabwe. They developed a
social vulnerability index (SoVI) using the principal component analysis (PCA) technique
and ArcMap10.2 geographic information systems (GIS) tool, and the results presented at the
ward level to show their spatial variability. The SoVI scores were classified into five
categories ranging from 1 (very low vulnerability) to 5 (highly vulnerable). The results
showed that 69.0% of the wards in Muzarabani had a moderate to high level social
vulnerability influenced by a set of institutional and socio-economic factors that varied across
the wards.
In West Africa, Antwi et al. (2015) determined the level of communities' vulnerability to
floods in Ghana, by developing an analytical tool based on complex interaction of human and
natural indicators called Total Community Vulnerability Assessment Framework (TCVAF).
They employed a rural participatory research approach in developing four vulnerability
categories (engineering, socio-economic, political and ecological) using indicators that
helped in the calculation of the total community vulnerability index for each community.
Their results revealed that Baleufili community was the least vulnerable in terms of
engineering, socio-economic and political vulnerability, but the most vulnerable, ecologically
while Chietanga community was the least vulnerable ecologically but the most socio-
economically vulnerable. They also showed that the state of each community's vulnerability
to flood was a combined effect of the four vulnerability index categories which may act
concurrently or independently.
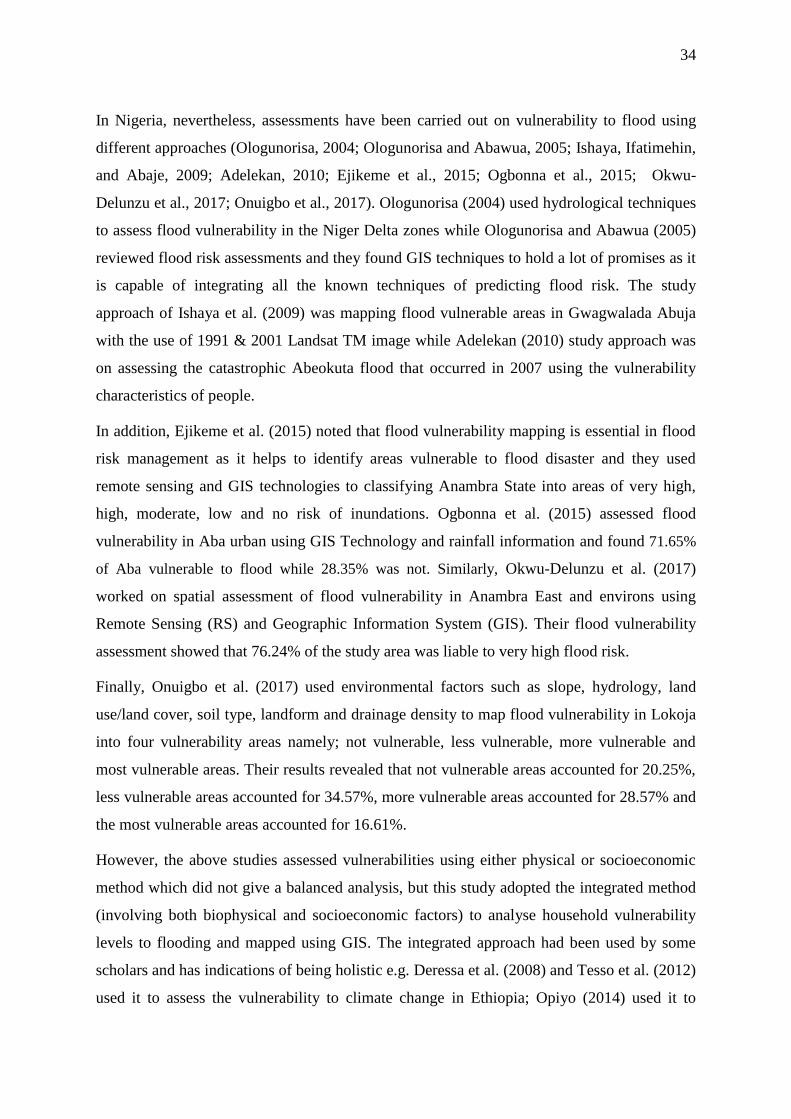
34
In Nigeria, nevertheless, assessments have been carried out on vulnerability to flood using
different approaches (Ologunorisa, 2004; Ologunorisa and Abawua, 2005; Ishaya, Ifatimehin,
and Abaje, 2009; Adelekan, 2010; Ejikeme et al., 2015; Ogbonna et al., 2015; Okwu-
Delunzu et al., 2017; Onuigbo et al., 2017). Ologunorisa (2004) used hydrological techniques
to assess flood vulnerability in the Niger Delta zones while Ologunorisa and Abawua (2005)
reviewed flood risk assessments and they found GIS techniques to hold a lot of promises as it
is capable of integrating all the known techniques of predicting flood risk. The study
approach of Ishaya et al. (2009) was mapping flood vulnerable areas in Gwagwalada Abuja
with the use of 1991 & 2001 Landsat TM image while Adelekan (2010) study approach was
on assessing the catastrophic Abeokuta flood that occurred in 2007 using the vulnerability
characteristics of people.
In addition, Ejikeme et al. (2015) noted that flood vulnerability mapping is essential in flood
risk management as it helps to identify areas vulnerable to flood disaster and they used
remote sensing and GIS technologies to classifying Anambra State into areas of very high,
high, moderate, low and no risk of inundations. Ogbonna et al. (2015) assessed flood
vulnerability in Aba urban using GIS Technology and rainfall information and found 71.65%
of Aba vulnerable to flood while 28.35% was not. Similarly, Okwu-Delunzu et al. (2017)
worked on spatial assessment of flood vulnerability in Anambra East and environs using
Remote Sensing (RS) and Geographic Information System (GIS). Their flood vulnerability
assessment showed that 76.24% of the study area was liable to very high flood risk.
Finally, Onuigbo et al. (2017) used environmental factors such as slope, hydrology, land
use/land cover, soil type, landform and drainage density to map flood vulnerability in Lokoja
into four vulnerability areas namely; not vulnerable, less vulnerable, more vulnerable and
most vulnerable areas. Their results revealed that not vulnerable areas accounted for 20.25%,
less vulnerable areas accounted for 34.57%, more vulnerable areas accounted for 28.57% and
the most vulnerable areas accounted for 16.61%.
However, the above studies assessed vulnerabilities using either physical or socioeconomic
method which did not give a balanced analysis, but this study adopted the integrated method
(involving both biophysical and socioeconomic factors) to analyse household vulnerability
levels to flooding and mapped using GIS. The integrated approach had been used by some
scholars and has indications of being holistic e.g. Deressa et al. (2008) and Tesso et al. (2012)
used it to assess the vulnerability to climate change in Ethiopia; Opiyo (2014) used it to
35
assess vulnerability to climate change among Turkana pastoralists in North-western Kenya
and Madu (2011) used it to assess the vulnerability of Nigerians rural households to climate
change while Akukwe and Ogbodo (2015) adopted it to assess the vulnerability of
households to flooding in Port Harcourt metropolis, Nigeria. The study took into cognizance
the biophysical, socioeconomic and demographic dimensions in assessing the adaptive
capacity of households in the communities as regards the multidimensional nature of
vulnerability and adaptation as partly opined by Cardona (2004) and Brooks et al. (2005).
2.3 Food Security Concept and Measurement
The concept of food security has significantly advanced over time. The term first originated
in the mid-1970s, when the World Food Conference (1974) expressed food security in food
supply terms, thereby, assuring the availability and price stability of essential foodstuffs at
the national and international levels. In the early 80’s, the concept of “access” was included
in the definition of food security (FAO, 2006). However, the generally accepted definition of
food security, according to FAO (1996; 2008a:9) “exists when all people, at all times, have
physical and economic access to sufficient, safe and nutritious food that meets their dietary
needs and food preferences for an active and healthy life”. This definition encompasses four
dimensions (viz; food availability, affordability, utilization and stability) which when not
fulfilled leads to food insecurity. Yaro (2013) had noted food insecurity to be a long-standing
developmental challenge for Africa which has been complicated due to its connectivity with
the socio-economic, technological, political and environmental systems. He further identified
unemployment, poverty, increase in food prices, lack of education, poor access to market
climate and environment conditions as factors that have a direct relationship with food
security
However, these four food security dimensions as opined by Ibok, Idiong et al. (2014) could
be broadly grouped into two determining factors, namely; the demand side and supply side
factors. Whereas the supply side factors determine food availability or food supply as well as
the physical access to food at various levels, the demand side factors determines the
economic access of individuals and households to the available food (Omonona and Agoi,
2007; FAO, 2008a; Ogundari, 2013).
36
On the one hand, food availability has to do with sufficient food being available and it “is
determined by the physical quantities of food that are produced, stored, processed, distributed
and exchanged” (FAO, 1996:4; 2008:9) while food accessibility is determined by factors
such as household financial resources, market prices, socio-cultural as well as geopolitical
factors as against the availability of food in the market (World Bank, 2008; Beyene and
Muche, 2010; Tefera and Tefera, 2014). On the other hand, food utilization has been
described as the food use and how essential nutrients are acquired from consumed food by a
person person (FAO, 2008) and it is influenced by conditions such as nutrients loss during
food processing, improper care and storage, inadequate sanitation and some cultural practices
which prevent the consumption of nutritious food at the household level (Barret and Lentz,
2010; Akudugu and Alhassan, 2012; Tefera and Tefera, 2014 in Djangmah, 2016).
Furthermore, food stability deals with the phrase “at all times” in the food security definition
by FAO (1996; 2008a) and it emphasizes the importance of having to minimize the risk of
negative effects on the other three dimensions namely; food availability, food accessibility or
food utilization over time. Stability has been noted to be affected by shocks (economic and
climatic disasters) or cyclical events such as seasonal shortage which causes disruptions in
food availability, accessibility or utilization (FAO 2006, FAO, 2008a; WFP, 2009).
There is a linkage among the four food security dimensions and any interruption in any of
them leads to food insecurity, for instance, when food supply is completely or overtly
influenced by factors such as climatic events (e.g. drought, flood) and/or natural disasters
(e.g. earthquake, tornado), food availability is affected (FAO, 2006; FAO, 2008a; Barret and
Lentz, 2010; Akudugu and Alhassan, 2012 in Djangmah, 2016). Thus, this study which looks
at flooding effects on food security is imperative.
Globally, scholars have adopted different methods to measure household food security status
using various indicators. These indicators include; food consumption score/dietary diversity
score, per capita expenditure on food, per capita food consumption (such as protein, per
capita nutrient intakes of calorie, and fat), share of dietary intake, anthropometry measures,
food insecurity access scale (self-report/assessment) and coping strategy index among others
(Ogundari, 2017). These indicators are usually in the form of questions and according to
Castell et al. (2015), the food insecurity questionnaires usually employ a series of
retrospective questions that detect the level of concern and the inadequate access to, variety
37
and/or quantity of food, which often reflect three different domains of food insecurity
namely; uncertainty or anxiety; insufficient quality and insufficient quantity. However, an
attempted had been made to categorise research works based on the indicators used.
The Household Food Insecurity Access Scale (HFIAS) is a food insecurity scale consisting of
a set of nine questions, developed by the USAID’s Fanta Project. This scale makes use of
scores attached to responses e.g. 0, 1, 2 and 3 attached to “never, rarely, sometimes and
often” responses respectively, where a cumulative higher score represents greater food
insecurity. Four categories of households namely; food secure, mildly food insecure,
moderately food insecure and severely food insecure households are arrived when this
measurement method is used (Coates, Swindale and Bilinsky, 2007).
In South Africa, Battersby (2011) assessed household food insecurity levels in Cape Town
using HFIAS, and their study revealed that 80% of households were either moderately or
severely food insecure. Similarly, Sekhampu (2017) used the HFIAS in Kwakwatsi, Free
State province of South Africa, and found 51.1% households to be food insecure while 48.8%
were either mildly, moderately or severely food insecure.
Correspondingly, Knueppel, Demment and Kaiser (2009) categorized households in rural
Tanzania using HFIAS method and their results revealed that 20.7 % of the households were
food secure, 8.4 % were mildly food insecure, 22.8 % were moderately food insecure and
48.1 % were severely food insecure and the reason for the large proportion of food insecure
households were attributed to two underlying factors viz; insufficient food intake and
insufficient food quality. Farzana et al. (2017) also adopted the HFIAS to classify households
in Bangladesh into food secure, mildly food insecure, moderately food insecure and severely
food insecure and further categorized the coping strategies adopted with respect to the
households’ food security levels.
The Food Consumption Score (FCS) developed by WFP (2008), is commonly used as a
proxy indicator for determining utilization dimension of food security as well as access to
food. “It is a weighted score based on dietary diversity, food frequency and the nutritional
importance of food groups consumed with a reference period of seven days” (WFP, 2008:1).
The FCS of a household is calculated by multiplying the frequency of foods consumed in the
last seven days with the standardized weighting of each food group, thereby classifying
households into three namely; poor (with FCS of ≤21); borderline (with FCS of 21.5 to 35)
38
and acceptable (with FCS of >35). Ndakaza et al. (2016) used the FCS approach to classify
households in Rwanda into food secure (comprising households with “acceptable” FCS) and
food insecure (consisting of households with “poor” and “borderline” FCS) and their results
showed that 70.9% and 29.1% households were respectively food secure and food insecure.
However, the FCS approach is not without challenges. An observed problem with this
method is its consideration of the frequency of food groups eaten without taking cognizance
of the quantity eaten within the reference period.
On the other hand, Ibrahim et al. (2009) assessed the state of food security among urban
households in the Federal Capital Territory of Nigeria using the food security score scale
developed by Freedom from Hunger (FFH), their results show that 70% of the respondents
were food secure while 30% were not food secure in their study area.
The per capita food expenditure measures food security on the basis of money spent on food
monthly, against the household size. “A food secure household is thus, a household whose
per capita monthly food expenditure fall above or is equal to two-third of the mean per capita
food expenditure while a food insecure household is that whose per capita food expenditure
falls below two-third of the mean monthly per capita food expenditure” (Omonona and Agoi,
2007:402). Omonona and Agoi (2007) analyzed the food security situation among urban
households in Lagos State, Nigeria using food security incidences from per capita food
expenditure, and found out that food insecurity increases with increase in household size and
ages of household heads, and decreases with higher level of education.
Similarly, Adepoju and Olawuyi (2012) applied the per capita food expenditure method to
measure food security indices among farmers in Oyo State, Nigeria and found about 69% to
be food insecure. Ibok, Bassey, et al. (2014) also applied this method to assess the status of
food security of urban households involved in farming in Cross River State of Nigeria, and
their results revealed that 52.5% of the households were food secure whereas 47.5% were
food insecure. One of the disadvantages of this method of measuring food (in)security is its
emphasis on amount of money spent and household size with no account on the food
composition and amount of food consumed.
Nevertheless, Ojogho (2010); Asogwa and Umeh (2012); Olagunju et al. (2012) and Yusuf et
al. (2015) applied the cost-of-calorie method proposed by Greer and Thorbecke (1986) to
determine food security in Edo State and Benue State of Nigeria respectively. The method

39
derived a threshold value that was close to the minimum calorie requirement for human
survival which served as the minimum level, described as the “food insecurity line” and
people who fell below this calorie level were classified as “food insecure” in the study area.
Similarly, Welderufael (2014) used the Foster-Greer-Thorbecke (FGT) method proposed by
Foster et al. (1984) to examine the extent of household’s vulnerability to food insecurity in
urban and rural areas of Amhara regional state of Ethiopia, where about 48% households
were revealed to be food insecure (i.e. they fell below the recommended caloric requirement
of 2200 kcal/Adult Equivalent/day) and these food insecure households were mostly found in
the rural areas. In addition, cost-of-calorie method had been applied by Babatunde et al.
(2007) who found 64% of the households in Kwara State of Nigeria to be food insecure
because they were below the recommended daily requirement of 2260 kcal while Mitiku,
Fufa and Tadese (2012) found 36% households to be food insecure in Shahemene district of
Oromia region, Ethiopia using the FGT method. Furthermore, the FGT method had also been
used by Tefera and Tefera (2014) and Dawit and Zeray (2017) in Ethiopia; Orewa and Iyanbe
(2010) in Nigeria among others. The limitation of this method is that it employs the per capita
calorie supply technique which means larger household size with adults will usually be close
to the minimum level or below it.
The Household Food Security Survey Module (HFSSM), developed by the United States
Department of Agriculture (USDA) classifies households using a constructed linear food
security scale. It measures the degree of food insecurity/hunger experienced by households in
terms of a single numerical value which ranges between 0 and 10 (Bickel et al., 2000). Like
the HFIAS, it employs responses to a set of 14-18 questions regarding households’ food
needs with “never true” coded as 0 while “sometimes true” and “often true” coded as 1.
In the United States of America, Coleman-Jensen, Rabbitt, Gregory and Singh (2015)
assessed the household food security of Americans using the United States Department of
Agriculture (USDA) approach, and their results show that 85.7% and 86% Americans were
food secure in 2013 and 2014 respectively. In addition, Sanusi et al. (2006) measured the
household food security status in Lagos and Ibadan using the USDA approach and found over
70% to be food insecure. Fakayode et al. (2009) also examined the food security situations of
farm households in Ekiti State, Nigeria using the USDA approach. They found out that only
12.2%, 43.6%, 35.9% and 8.3% of the respondents were food secure, food insecure without
40
hunger, moderately food insecure with hunger and severely food insecure with hunger
respectively. Similarly, Ibok, Idiong, et al. (2014) used the USDA approach to examine the
food insecurity status among urban farm households in Cross River State, Nigeria and their
results showed that while 12.44% of urban farmers were food secure, 55.76%, 25.35% and
6.45% were food insecure without hunger, moderately food insecure with hunger and
severely food insecure with hunger correspondingly. An observed disadvantage of this
method is the proxy answers given by parents/guardians on behalf of other members of the
family, though it has more advantages such as concentrating on virtually all the dimensions
of food security compared to other methods.
However, researchers are beginning to adopt more than one measurement method to assess
food security at household level as regards its complexity. For instance, Goshu (2016) in his
PhD work measured the food security status of households in Gubalato district, Ethiopia
using a combination of the HFIAS, FGT, Food Consumption Score (FCS) and Coping
Strategies Index (CSI) methods. His HFIAS findings showed that 48.26%, 30%, 16.09% and
5.65% households were food secure, mildly food insecure, moderately food insecure and
extremely food insecure respectively. The FGT findings indicated 53.9% of the households to
be food secure, 17.8 % mildly food insecure and 28.3% severely food insecure using 2,100
Kcal per adult equivalent per day as a threshold. Moreover, his FCS results revealed that
about 50%, 33% and 17% of the households had acceptable FCS (greater than 35), borderline
FCS (between 21 and 35) and poor FCS (below 21) respectively while his CSI results
categorized about 37% as moderately/severely food insecure, 30% as mildly food insecure
and 33% as food secure households in his study area. The variation in the food security status
of households using various methods is because these methods have got some limitations too.
Furthermore, to take care of some of these limitations, indicators harmonization has been
attempted. Ogundari (2017) incorporated the food utilization and accessibility aspects of
food security definition in assessing food security in an attempt to capture the
multidimensional nature of food security. He harmonized two food security indicators
namely; dietary diversity score (DDS) and food expenditure to categorize households into
four different levels of food security states in Nigeria namely; completely food insecure
households as revealed by both indicators, transitory food insecure households (two types)
each based either on food expenditure or DDS indicators, and completely food secure
households as revealed by both indicators. His results revealed that about 60% and 66% of
41
the households were food secure based on DDS and food expenditure indicators, respectively
whereas only about 42% of the households were eventually food secure when the two
indicators were harmonized.
In the face of the extant literature on food security indicators, it is still devoid of an
agreement on the main indicators that are needed to adequately measure and monitor
household food security situations both at the micro- and macro-levels around the world
(Carletto, Zezza and Banergec, 2013 in Ogundari, 2017), as it is known that these indicators
only centres on one dimension at a time. This is supported by the findings of Bashir and
Schilizzi (2013) on the determinants of rural household food security in Africa and Asia,
which proposed a conceptual model as regards the three widely known components of food
security of food accessibility, availability and utilisation, who found food availability to be
the most studied component, followed by food accessibility, while food utilisation has been
the most ignored component in both continents. To fill the gap of studying a single aspect of
food security, the USDA approach was adopted for a comprehensive household food security
assessment while other indicators have been used to assess other food security dimensions.
The USDA approach has been shown to be a robust approach for assessing food security
status at household level since it includes virtually all of the food security dimensions and
could be used to show the percentages of households that are food secure and food insecure
with/without hunger. For this reason, it was adopted in this research to assess food security
status. However, in order to incorporate the multidimensionality of food security, this study
adopted food composition scores to analyse the utilization dimension; per capita monthly
food expenditure to analyse the accessibility dimension; sufficiency in own food production
to analyse the availability dimension and irrigation agricultural practice to determine the
stability dimension since the sampled households are largely agrarian.
2.4 Determinants of food security
The determinants of food security vary across countries and regions around the globe and
have been examined by different scholars using mostly regression models. Demographic and
socio-economic factors have been extensively demonstrated as the determinants of food
security globally. These factors include; sex and age of household heads, level of education
and marital status of household head, income (including off-farm income), wealth index (e.g.
livestock ownership), household size and dependency ratio, land holding (farm size);
42
sufficiency in own food production among others as revealed below.
In Indonesia, Wiranthi, Suwarsinah and Adhi (2014) applied the ordered regression to
examine the determinants of household food security in the Eastern and Western regions and
they found age and level of education of household’s head, head of household occupation in
non-agricultural sector, increase in expenditure equivalent, female household head, small
household size, and location of household in urban areas as increasing the likelihood of a
household being food secure.
In Mexico, Magaña-Lemus, Ishdorj and Rosson (2013) applied the ordered probit model to
study the determinants of household food security and they found that households with less-
educated and younger household heads, had a higher probability of being food insecure.
Their results also revealed that, the vulnerability to food insecurity was higher in households
with disabled family members; households headed by a single, widow or divorced mother;
rural households; households with kids; households with strong indigenous background; non-
agricultural households and low income families.
In South Africa, Sekhampu (2017) employed the logistic regression analysis to ascertain
household food security and demographics in Kwakwatsi township, and his results
demonstrated household size, the gender and marital status of the household head to be
negatively associated with food security whereas household income and the age of the
household head were positively associated with food security.
Studies that have employed multiple logistic regressions in East Africa include; Mitiku et al.
(2012) whose findings revealed, cultivated land size, family size, total farm income, livestock
ownership and off-farm income of households as the significant determinants of household
food security status in Shashemene District, Ethiopia. In the same vein, Tefera and Tefera
(2014) applied the logit regression model to determine the direction and strength of factors
that influence food security in Mareko District, Guraghe Zone of Southern Ethiopia, and age
of household head, size of credit received, size of cultivated land, household size, level of
education, off-farm income per adult equivalent, use of improved seed, number of contact
with development agents, and size of livestock owned were revealed as the significant
factors.
Moreover, Welderufael (2014) applied the binary logistic model to examine the determinants
of food insecurity in Amhara Regional State of Ethiopia and revealed sex and age of the
43
household heads, consumption expenditure, family size, employment status, farm inputs,
farm size, livestock ownerships and shocks such as illness and drought as the determinants of
household food insecurity. Similarly, Goshu (2016) employed logit regression analysis which
revealed dependency ratio, household size, education level of household head, number of
livestock, agricultural technology, access to protected water, access to credit, distance to the
market, benefit received from Production Safety Net Programmes (PSNP) and crop
diversification index as the significant determinants of food security in Gubalafto District of
Amhara Regional State, Ethiopia.
In Rwanda, Habyarimana (2015) used Probit model to examine determinants of food
insecurity in rural households of Rwanda where household size, livestock ownership,
monthly food expenditure, household asset index and membership to agricultural cooperative
were among significant factors that explained rural household food insecurity levels in
Rwanda. Additionally, Ndakaza et al. (2016) used probit regression to model the factors
influencing food security in Rwanda and their results revealed sex and level of education of
household head as well as farm size, access to near market, livestock ownership and climatic
adaptation among others as significant determinants of household food security.
In Kenya, Oluoko-Odingo (2006) used the stepwise multiple regression to show the
relationship between food security determined by food crop production and some socio-
economic factors. She found a negative relationship between land cultivated the previous
year and household food crop production with a positive relationship existing between farm
size and household labour and household food crop production. Mungai (2014) used the
probit regression to assess food security determinants amongst households in Lugari and
Makueni Sub-counties of Kenya and three factors namely; household income, land size per
capita and education level of household head were found to have significant positive effect on
household food security while household size were negatively and significantly correlated
with food security.
In West Africa, regression models have been employed to examine the significant food
security determinants as well. For instance, Aidoo et al. (2013) assessed food security
determinants among rural households in Sekyere-Afram Plains District, Ghana using the
logistic regression model where marital status and household size had a significant negative
effect on food security, and credit access, farm size and off-farm income were found to
44
significantly influence household food security positively.
In the same vein, Djangmah (2016) studied comparative analysis of food security status
across farming households in Eastern and Northern regions of Ghana using logistic
regression. Her results revealed that monthly household income, off-farm activities, total
quantity of own farm production and dependency ratio positively and significantly influenced
households’ food security while household size and the number of years spent in education
negatively and significantly affected food security in the two regions.
Moreover, Zakari et al. (2014) examined the factors influencing household food security in
Niger, West Africa, using logistic regression to determine the relationship between household
daily rations and factors influencing food security. Their findings revealed that, the sex of the
head of household, access to market, labour supply, diseases and pests, poverty, flooding,
food aid and the distance away from the main road are significant factors influencing the
odds ratio of a household having appropriate daily rations. This is supported by the works of
Adepoju and Olawuyi (2012) and Asogwa and Umeh (2012), who used tobit regression
model and concluded that increase in household size has a positive correlation with food
insecurity among rural households in Oyo State and Benue State of Nigeria respectively.
In Nigeria, Arene and Anyaeji (2010) used logistic regression and they found income and age
of household head as important determinants of food security. Ojogho (2010) used the
multiple binomial logit regression model to examine the determinants of food insecurity
among arable farmers in Edo State of Nigeria and his results show that sex of the household
head, level of education and output level of households are negatively significant while
household size and dependency ratio are positively significant as the factors that influence
food insecurity.
Similarly, the logistic regression was used by Ahmed and Dotti (2014) and Ibok, Bassey, et
al. (2014) to examine the determinants of food security among medium income households in
Maiduguri Metropolis and to investigate food security determinants among urban food crop
farming households in Cross River State, Nigeria respectively. They found years of age of
farmers, formal education, farming as main occupation, farming experience, output of food
crops produce, income from farm and household size to be the major determinants of food
security status of the households.
On the contrary, Adepoju and Olawuyi (2012) found educational status not to be a significant
45
factor in determining the food security status, though their study agrees that an increase in
income increases the food security status of farmers while a unit increase in age of farmers
led to a unit decrease in their probability of being food secure. However, Ogundari (2017)
found household size, income and level of education, sex of household heads and ages of
family members as significant determinants of household food security using multinomial
regression model in Nigeria.
In south eastern Nigeria, Ajaero (2017) used binary logistic regression models to estimate the
socio-economic predictors of food security for male-headed households (MHHs) and female-
headed households (FHHs) before and after floods in Anambra State, and his results revealed
larger household sizes, higher incomes and marital status as the significant determinants of
food security for both FHHs and MHHs after the 2012 flood. Other scholars that had
employed regression model to analyse the socio-economic and demographic determinants of
food security in Nigeria include; Omotesho et al. (2006); Olagunju et al. (2012); Adepoju and
Adejare (2013); Obayelu (2013); Henri-Ukoha et al. (2013); Yusuf et al. (2015).
Most empirical studies have employed regression models especially the logistic regression
model to examine the relationship between food security and its determinants. The logistic
regression is a non parametric statistic tool that has proved to be a powerful tool in showing
the direction, strength and extent (in terms of odd ratios) of the relationship between various
food security levels and their determinants, hence the reason for using this statistical tool. As
a non parametric tool, most of the assumptions (e.g. linearity, homoscedasticity and being
normally distributed) considered under parametric regression (Ordinary Least Squares) are
inconsequential as they are taken care of in the logistic regression model. Therefore, binary
logistic regression model was adopted to assess the relationship between food security and
other determining factors because the strength of the effects could be measured using this
technique as evident in the reviewed works, and because of the binary nature of the nominal
variable being assessed (food security/food insecurity).
Nonetheless, the extensive discussion of the demographic and socio-economic determinants
of food security without in-depth studies on the influence of external disturbances such as
flooding in agrarian and flood vulnerable communities facilitated this study, which
considered flooding as one of the determinants of food security.
46
2.5 Climate change, Flooding and Food security
Several studies have been carried out on climate change and food security. These studies
have predicted climate change to cause some shifts in food security in the future. Due to the
prediction that climate change will increase the intensity of flooding in some regions, there is
need to review some studies related to climate change and food security. It has been noted
that the global mean temperature has increased by 0.74 °C in the last 100 years, and is
expected to rise to between 1.1 and 6.4 °C by the end of the twenty-first century, depending
on projected scenarios (IPCC, 2007), which could lead to extreme climate variability and
weather-related events like flooding (Syaukat, 2011). Evidence shows that more intense and
recurrent weather events (heat and cold waves, floods, droughts, heavy storms), rising
irregularities in seasonal rainfall patterns and rising sea levels (including flooding) are
already having direct impacts not only on food production, but also on incidence of food
distribution infrastructure, food emergencies, livelihood assets and human health in both
urban and rural areas (FAO, 2008b; Emaziye, Okoh and Ike, 2013).
Climate change is not the sole most significant driver of food insecurity but predominantly an
important determinant of food system performance at the farm end of production-linked
income due the overall dependent of food system performance on climate today than it did
200 years ago, especially in locations where the primary source of income and food is still
dependent on rain-fed agriculture (FAO 2008b). Similarly, Hanhra and Qureshi (2010)
opined that climate change may affect food security and agriculture by shifting the temporal
and spatial rainfall distribution and the availability of water, capital, land, terrestrial resources
and the biodiversity by exacerbating uncertainties throughout the food chain; from farm to
fork and yield to trade dynamics and eventually affecting the ability to feed nine billion
people by 2050.
Nevertheless, the increased frequency and intensity of storms, flooding and drought had
altered hydrological cycles and precipitation variation which have implications for food
availability in the future (Syaukat, 2011). Warner, Schattman and Hatch (2017) noted that the
forecast using climate change models of increasingly intense and frequent floods for New
England (Unites States) are already being felt mostly by farming communities that have been
experiencing the associated negative consequences such as inundation, erosion, natural
habitat destruction, and property damage, which invariably affect food security.
47
Ludi et al. (2007) modelled the impacts of climate change on agricultural production and
established that over the next century, there would be negative effects on crop yields,
especially in developing countries where people are already at risk. In addition, FAO (2008b)
acknowledges that these changes in agricultural production patterns would affect food
security in two ways; by affecting food supply at both local and global levels; and by
affecting livelihoods and ability to access food. In the same vein, Schlenker and Roberts
(2009) projected temperature effects on crops in the United States, and Muller et al. (2011)
projected temperature effects on crops in Africa, and both concluded that climate change
would have negative impacts on crop yields. They did these projections by basing the effects
on temperature trends and an expected increase in the possibility of extremes during the
growing season.
Furthermore, in relating the impact of Climate Change to food Production and food security,
Syaukat (2011) used climate data of 36 years (1971 to 2006) and with aid of a simulation, he
emphasized that Indonesia agricultural production is more sensitive to temperature increase
rather than rainfall decrease. His research also showed that the combination of rainfall and
temperature would have significant impact on Indonesia’s food balance by 2050 with an
estimated deficit of 90 million tons of husked rice by 2050. Moreover, Emaziye et al. (2013)
focused on the linkage between climate change and food security of rural households in Cross
River State, Nigeria by applying the food security index equation used by Hoddinott (2001)
and Feleke, Kilmer and Gladwin (2003). They established that Cross River State was
moderately food insecure with food security having statistically significant relationship with
the climate change factors, with 67.07% losses of annual income.
Floods have been described as the natural disasters with most consequences on agriculture;
hampering food security especially in developing countries (Pacetti et al., 2017) where people
are predominantly dependent on agriculture. To prove this, Pacetti, et al. (2017) used remote
sensing data combined with water footprint databases and agricultural statistics to assess the
effects of flood events on food supply (food availability) with reference to the extreme floods
events in Pakistan (2010) and Bangladesh (2007) as case studies. They evaluated flood
damages on agricultural areas by estimating crop losses and converting it into lost calories
and water footprint as complementary indicators, and their results depicted a flood-induced
reduction of food supply between 8% and 5% in Pakistan and Bangladesh respectively.
48
On the other hand, Ramakrishna et al. (2014) examined the impact of flood on food security
and livelihoods of Internally Displaced Person (IDP) households using binary logit model.
They concluded that floods have a negative impact on food security by reducing the wage
income and purchasing power, resulting in food shortages among households in Khammam
region of India. In the same vein, Zakari et al. (2014) also concluded that floods have adverse
and significant effect on household food security in Niger Republic using logit model and
Oluoko-Odingo (2006) found a negative correlation between flooding and household food
crop production in Nyando district of Kenya.
In Nigeria, flooding had been noted to affect crop production and invariably food security. In
this light, Sidi (2012) carried out a research on the impact of the 2012 floods on agriculture
and food security in Nigeria using GIS and his results show that flooding affected a
substantial percentage of areas that produce the three main tuber food crops (sweet potatoes,
cassava and yam) in Nigeria. He noted that 17.2% of sweet potato production areas; 21.6% of
cassava production areas and 27.9% of yam production areas were affected.
Furthermore, Ajaero (2017) demonstrated the impact of flood on food security of male-
headed and female-headed flood-induced migrant households in Anambra State by
determining the before- and after- the 2012 flood food security status of the two categories of
households and his results showed flood to have affected food security, since the 89% of the
FHHs reported to have been food secure before the flood reduced to 22% after the flood
while the 84% of MHHs that were food secure decreased to 34%.
However, based on the available literature, the impact of climate change on food security is
well documented while the effect of floods on food security is still sparse. If climate change
has an adverse effect on food security as Syaukat (2011) and Emaziye et al. (2013) argued,
then flooding which arises from extreme weather events as one of the manifestations of
climate variability is also expected to affect food security. Since Ramakrishna et al. (2014)
and Zakari et al. (2014) found out that floods have positive impact on household food
insecurity in Khammam (India) and Niger respectively, there is need to investigate the effects
of flooding on food security in other flood vulnerable areas. Therefore, the main thrust of this
research was to examine the extent to which flooding could affect food security in the
agrarian communities which are vulnerable to flooding in south eastern region of Nigeria.
Additionally, the multiple logistic regression was adopted to show the relationship between
flooding and household food security alongside other socio-economic and demographic
49
factors since the latter is a nominal variable with two values (food secure and food insecure
households). Moreover, the ordinal logistic regression was used to show the relationship
between flooding and food security. The study is pertinent because there is paucity of
scientific literature showing the interaction between floods and food security in the south
eastern region of Nigeria.
50
CHAPTER THREE
RESEARCH METHODOLOGY
3.1 Introduction
The research methodology was discussed under the following; reconnaissance survey, field
sampling techniques, data sources, data collection and data analysis.
3.2 Reconnaissance Survey
The researcher embarked on reconnaissance visits to the study communities to sensitize the
pertinent community stakeholders on the purpose and the usefulness of the study. The
outcome of the reconnaissance visits were used in modifying the research instruments where
needed, and to identify the target population.
3.3 Field Sampling Techniques
The study was carried out in two (2) Nigerian Southeastern States namely; Imo and Anambra
States which are the most vulnerable States to flooding as they were the only two States
affected in the region by the 2012 floods termed the most devastating floods in Nigeria (UN-
OCHA, 2012). Only two Local Government Areas (LGAs) viz; Ohaji/Egbema and Oguta
LGAs were affected in Imo State by the 2012 floods. Therefore, for equal and unbiased
representation of the two States, two (flood vulnerable and easily accessible) LGAs namely;
Ogbaru and Anambra east LGAs were purposively selected in Anambra State. These four
LGAs viz; Ohaji/Egbema and Oguta LGAs (in Imo State); Ogbaru and Anambra east LGAs
(in Anambra State) were sampled because they consist of agrarian communities that are very
vulnerable to floods; that are situated not too far from the River Niger (the largest River in
Nigeria) and were among the worst affected by the devastating 2012 floods in Nigeria as well
as being accessible. The sample size was determined using Yamane (1967) and Israel (1992)
equation with 400 persons being the sampling size for any population between 100,000 and
more persons, at +/-5% level of precision. It is given as;
n = N/[1+N(e2)]...(2)
where;
n – is the sample size
N- is the population of Anambra East, Ogbaru, Oguta and Ohaji/Egbema LGAs
e – is the level of precision/sampling error i.e. 0.05.
n = 400 households
51
A multi-stage purposive sampling technique was employed to establish the sampling frame.
In each of the LGA, two (2) communities (one being the LGA headquarters) was purposively
selected based on the criteria used in selecting the LGAs, giving a total of four (4)
communities for each State and eight (8) communities for the two (2) States.
Stratified sampling method was used to determine the number of households sampled in each
LGA (Table 3.1 and Figure 3.1) on the basis of the population figures given in section 1.9.6,
with respect to the sample size of 400 households calculated above.
Random sampling method was employed in the administration of the questionnaire.
3.4 Data sources
The data sources are grouped into two viz; primary and secondary sources.
The primary data was obtained from questionnaires (household survey, Focus Group
Discussions (FGDs) and Key Informant Interviews (KIIs). These primary data include
answers to the various questions on household income, coping strategies adopted, causes and
effects of flooding, food security situations and their determinants, severity of flooding, level
of education, nutrition knowledge among others.
The secondary data are rainfall (1974-2013) data collected from the Nigerian Meteorological
agency, Lagos (NIMET); Moderate-resolution imaging Spectroradiometer (MODIS)
(October, 2012) and Shuttle Radar Topography Mission Digital Elevation Model (SRTM
DEM) imageries collected from the United States Geological Survey (USGS) were used to
identify flooded locations and estimate areas affected in the study area with ArcGIS 10.2 and
QGIS 2.0.1.
3.5 Data collection
Mixed data collection methods which are; Questionnaire Surveys, Focus Group Discussions
(FDGs) and key informant interviews (KIIs) were employed in the research.
The Questionnaire Survey consists of two categories; one was used to elicit information from
heads of households (Appendix 1) while the other was used to conduct FDGs and KIIs
(Appendix 2). The questionnaires were validated by experts from Departments of
Agricultural Economics, Agricultural Extension, Geography and Environmental studies.
From the questionnaire, the socioeconomic characteristics of households; flood
characteristics; the vulnerability of households to floods and insecurity; the effects of the
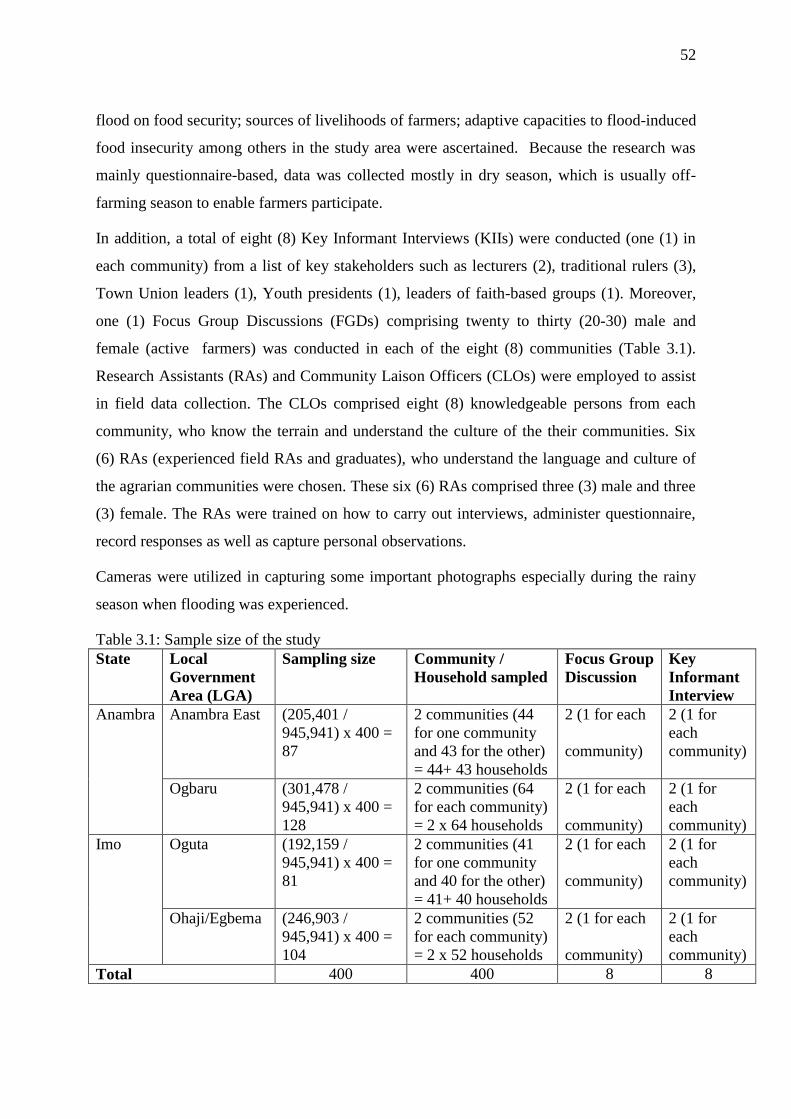
52
flood on food security; sources of livelihoods of farmers; adaptive capacities to flood-induced
food insecurity among others in the study area were ascertained. Because the research was
mainly questionnaire-based, data was collected mostly in dry season, which is usually off-
farming season to enable farmers participate.
In addition, a total of eight (8) Key Informant Interviews (KIIs) were conducted (one (1) in
each community) from a list of key stakeholders such as lecturers (2), traditional rulers (3),
Town Union leaders (1), Youth presidents (1), leaders of faith-based groups (1). Moreover,
one (1) Focus Group Discussions (FGDs) comprising twenty to thirty (20-30) male and
female (active farmers) was conducted in each of the eight (8) communities (Table 3.1).
Research Assistants (RAs) and Community Laison Officers (CLOs) were employed to assist
in field data collection. The CLOs comprised eight (8) knowledgeable persons from each
community, who know the terrain and understand the culture of the their communities. Six
(6) RAs (experienced field RAs and graduates), who understand the language and culture of
the agrarian communities were chosen. These six (6) RAs comprised three (3) male and three
(3) female. The RAs were trained on how to carry out interviews, administer questionnaire,
record responses as well as capture personal observations.
Cameras were utilized in capturing some important photographs especially during the rainy
season when flooding was experienced.
Table 3.1: Sample size of the study
State Local
Government
Area (LGA)
Sampling size Community /
Household sampled
Focus Group
Discussion
Key
Informant
Interview
Anambra Anambra East (205,401 /
945,941) x 400 =
87
2 communities (44
for one community
and 43 for the other)
= 44+ 43 households
2 (1 for each
community)
2 (1 for
each
community)
Ogbaru (301,478 /
945,941) x 400 =
128
2 communities (64
for each community)
= 2 x 64 households
2 (1 for each
community)
2 (1 for
each
community)
Imo Oguta (192,159 /
945,941) x 400 =
81
2 communities (41
for one community
and 40 for the other)
= 41+ 40 households
2 (1 for each
community)
2 (1 for
each
community)
Ohaji/Egbema (246,903 /
945,941) x 400 =
104
2 communities (52
for each community)
= 2 x 52 households
2 (1 for each
community)
2 (1 for
each
community)
Total 400 400 8 8
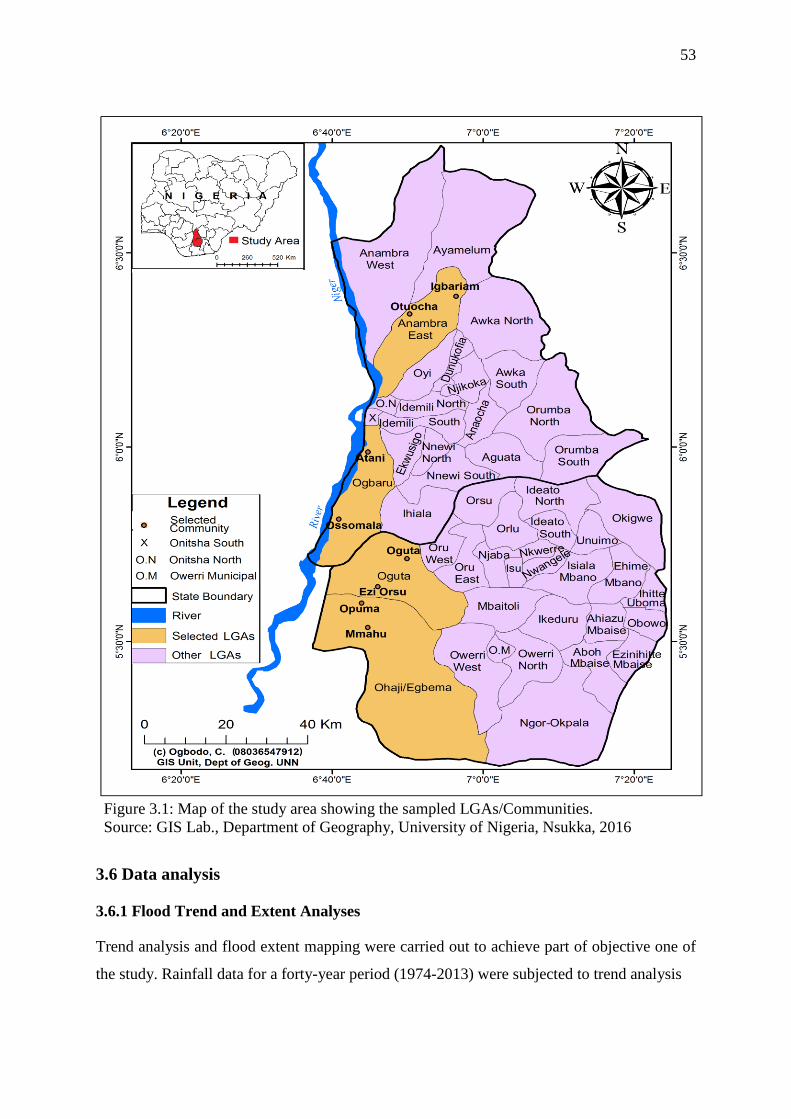
53
Figure 3.1: Map of the study area showing the sampled LGAs/Communities.
Source: GIS Lab., Department of Geography, University of Nigeria, Nsukka, 2016
3.6 Data analysis
3.6.1 Flood Trend and Extent Analyses
Trend analysis and flood extent mapping were carried out to achieve part of objective one of
the study. Rainfall data for a forty-year period (1974-2013) were subjected to trend analysis

54
to show if there is variability in rainfall patterns over the study. The respondents’ perception
of flood occurrences collected through questionnaire was matched with rainfall data to show
if flood events follow rainfall patterns. Flood extent was analysed using Moderate-resolution
imaging Spectroradiometer (MODIS) and Shuttle Radar Topography Mission Digital
Elevation Model (SRTM DEM). ArcGIS mapping software was used to generate maps
showing the extent and depth of flooding and flood vulnerability in the communities that
make up the study area.
3.6.1.1 The Flood Extent Mapping Procedure
Digital image processing of earth remote sensing data and GIS geoprocessing techniques
were employed to determine the 2012 flood extent in the study area, and the processes
executed using ArcGIS ArcMap software. The 2012 flood extent was analysed because 100%
of the participants agreed to have experienced extreme floods in 2012, and 2012 has been
termed the worst flood year in Nigeria for over 40 years where 33 out of the 36 States that
make up the country were affected (UN-OCHA, 2012).
The Moderate-resolution imaging Spectroradiometer (MODIS) Aqua 8-day composite
satellite image (MYD09Q1.A2012281.h18v08.006) captured in October, 2012 spanning the
flood period, was acquired for the study area, via the USGS EarthExplorer portal. Similarly,
the Shuttle Radar Topographical Mission (SRTM) v3 3-arcsec Digital Elevation Model
(DEM) dataset for the area was acquired.
For ease of identification of inundated surface from the MODIS image, the 534 band
combination (a false colour composite) at default 500m spatial resolution was used, because
the true colour composite would not allow for ease of identification or visual contrast
between bare surface and flood water.
The MODIS image, the SRTM DEM, and the ArcMap pixel inspector, were used to identify
the maximum elevation inundated by the 2012 flood water in the study area as 35m.
Whereas, the satellite image provided a visual of the extent of the flood event, and visual
clarity was impaired slightly by cloud cover. The study area largely being a plain, the DEM
intuitively helped to obtain a more complete picture of the event, when subjected alongside
the MODIS image, to a conditional reclass algorithm implemented in ArcMap, effectively
dealing with the cloud cover, and thus producing a visual of the flood extent.
55
The algorithm follows that: If LC is [X]pixel and DEM is LT.EQ [Y]pixel, then Output
[X]pixel as [F]pixel else, [X]pixel is [N]pixel.
Where: LC is the MODIS image derived Land Cover Raster, categorized into Flood, Cloud,
and Others.
[X] pixel is cloud pixel
[Y] pixel is maximum elevation under inundation
[F] pixel is Flood pixel
[N] pixel is Not Flooded
LT.EQ means Less Than or Equal To
From the output of the conditional reclass, the corresponding pixels of the DEM were
extracted, and classified into flood depths below 10metres and those above.
The area of land inundated in each LGA was also computed via the spatial analyst toolbox.
3.6.2 Simple percentage
Descriptive statistics was used to illustrate the socioeconomic characteristics of respondents,
flood characteristics, causes and effects of flooding, food sources and food security
situations, effects of flooding on food security, determinants of food security, adaptation and
coping strategies adopted, recovery length of respondents, household assets and amenities,
effect of floods on economic diversification, income earning opportunities and welfare, food
safety nets, remittance, past flood experience among others in the study area.
3.6.3 Flood Vulnerability Index Calculation and Principal Component Analysis (PCA)
The flood vulnerability index for each household was calculated using thirty-six (36) socio-
economic and environmental variables and the selection of these variables were drawn from
literature and observations. The construction of such indices is faced by many challenges
which include; the choice of the right indicators, weights attached and directions of
relationships with vulnerability. To overcome the challenge of weight, Principal components
analysis (PCA) was employed. PCA is a technique for extracting from a set of variables those
few orthogonal linear combinations of variables that most successfully capture the common
information (Anyadike, 2009). PCA was used because it is frequently used in research that is
based on constructing indices for which there are no well-defined weights (Deressa et al.,
2008). The direction of relationship in vulnerability indicators (their sign) was adopted from
the procedure followed by Deressa et al. (2008); Madu (2011); Tesso et al. (2012) and Opiyo
56
(2014), who attached a positive value to adaptive capacity and a negative value to both
sensitivity and exposure indicators to create vulnerability indices. The justification for
attaching negative signs to sensitivity and exposure indicators is because areas that are highly
exposed to damaging climate are more sensitive to damages, holding adaptive capacity
constant.
In addition, the adaptive capacity variables were assigned a positive sign because “it is
assumed that people with higher adaptive capacity are less sensitive to damages from climate
change, keeping the level of exposure constant” (Deressa et al., 2008:11).
Due to unavailability of certain data, indicators based on some simple assumptions were
mostly used for calculating the vulnerability indices (Table 3.2). “Indicators were adopted to
assess the exposure, sensitivity and coping/adaptive capacity of the households based on the
definition of vulnerability given by IPCC (2007; 2012)” (Akukwe and Ogbodo, 2015:6)
where vulnerability is seen as the net effect of adaptive capacity, sensitivity and exposure.
Vulnerability is thus given as;
Vulnerability = (adaptive capacity) – (sensitivity + exposure) ...(3)
The equation above is expanded as;
VI = (wA1+wA2+ … wAn) - (wB1+wB2…wBn + wC1+wC2+…wCn) ... (4)
“Where ;
VI is vulnerability index
w are weights of the first principal component scores
A1 – An are adaptive capacity variables
B1 – Bn are sensitivity variables
C1 - Cn are exposure variables”
The linear combination of variables with maximum variance using PCA is usually found on
the first principal component (Anyadike, 2009; Yang, 2015). Thus, the first principal
component (w) that captures the largest amount of information common to all the variables
served as weights, w used in the computation of the household vulnerability analysis. The
normalized values for all the adaptive, sensitivity and exposure variables were used. For
example, normalized values for the first adaptive capacity variable across the households
were calculated as follows,
A1 = (A1 – A*1)/s*1...(5)

57
Where; A*1 is the mean of variable A1 across households and s*1 is its standard deviation.
The same goes for all other variables starting from A1 – An through B1 – Bn to C1 - Cn.
It is assumed that, higher net value (computed vulnerability index) indicates lesser
vulnerability and vice versa, because when adaptive capacity of the household exceeds that of
its sensitivity and exposure, the household becomes relatively less vulnerable to flooding and
its effects.
Flood vulnerability assessment is crucial in determining the vulnerable person(s) and why
they are vulnerable. The idea was adopted from IPCC (2007; 2012) where vulnerability is
considered as the net effect of adaptive capacity (socio-economic) and sensitivity/exposure
(biophysical) factors. “The integrated assessment approach and the indicator method that
combines both biophysical and socio-economic factors” (Akukwe and Ogbodo, 2015:4) to
create household vulnerability indices were adopted in this study. A plausible construction of
the relationship between vulnerability and the indicators is attempted in Table 3.2.
The thirty-six (36) indicators used in the flood vulnerability analysis were selected based on
possibly measurable variables drawn from literature, and definition of adaptive capacity,
sensitivity and exposure.
“Adaptive capacity indicators were chosen based on those factors; socio-economic/physical
factors that influence the ability of people to adjust to flooding; to moderate its
potential/actual damages; to take advantage of opportunities arising from it; or to cope with
the consequences (adapted from IPCC, 2007; 2012)” (Akukwe and Ogbodo, 2015:6).
Twenty-nine (29) adaptive capacity indicators were used viz; sex, age, marital status, literacy
rate, level of education, income diversification, off-farm income, monthly income,
dependency ratio, type of housing unit, pre-flood awareness, group membership, land
ownership, food production sufficiency, livestock ownership, village poultry/farm ownership,
farm size, availability of storage facility, fertilizer use, fertilizer subsidy, irrigation practice,
food/aid receipt, early warning information access, phone ownership, radio/TV ownership,
canoe ownership, access to improved water sources, remittance and credit access.
“Sensitivity is the degree to which a system is affected either adversely or beneficially, by
climate variability e.g. frequency of flooding (adapted from IPCC, 2007; 2012)” (in Akukwe
and Ogbodo, 2015:6). Three (3) sensitivity indicators were adopted viz; flood frequency, past
(1 year) flood experience, and severity of flood experienced.
58
Exposure as seen in this study is “the nature and degree to which a system is or people are
exposed to significant flooding (adapted from IPCC, 2007; 2012)” (in Akukwe and Ogbodo,
2015:6). Four (4) exposure indicators were used viz; flood experience (house and farm), farm
location (floodable farm), and depth of flood.
3.6.4 Cluster and Spatial Analyses
Hierarchical cluster analysis was run on the vulnerability indices to group the households and
communities according to similarity in their degree of vulnerability using Average linkage
method into three relative flood vulnerability indices (FVI) namely; less, moderate and high
vulnerability levels.
ArcMap toolbox in ArcGIS 10.2 software was used to map the spatial pattern (spatial
variation) of the different vulnerability levels across the Local Government Areas (that
comprise the communities) and States and reasons for the variations were explained.
The spatial analysis of flood vulnerability would have been mapped at the community level
but due to unavailability of administrative map at the community level, the spatial pattern of
communities’ flood vulnerability was not produced.
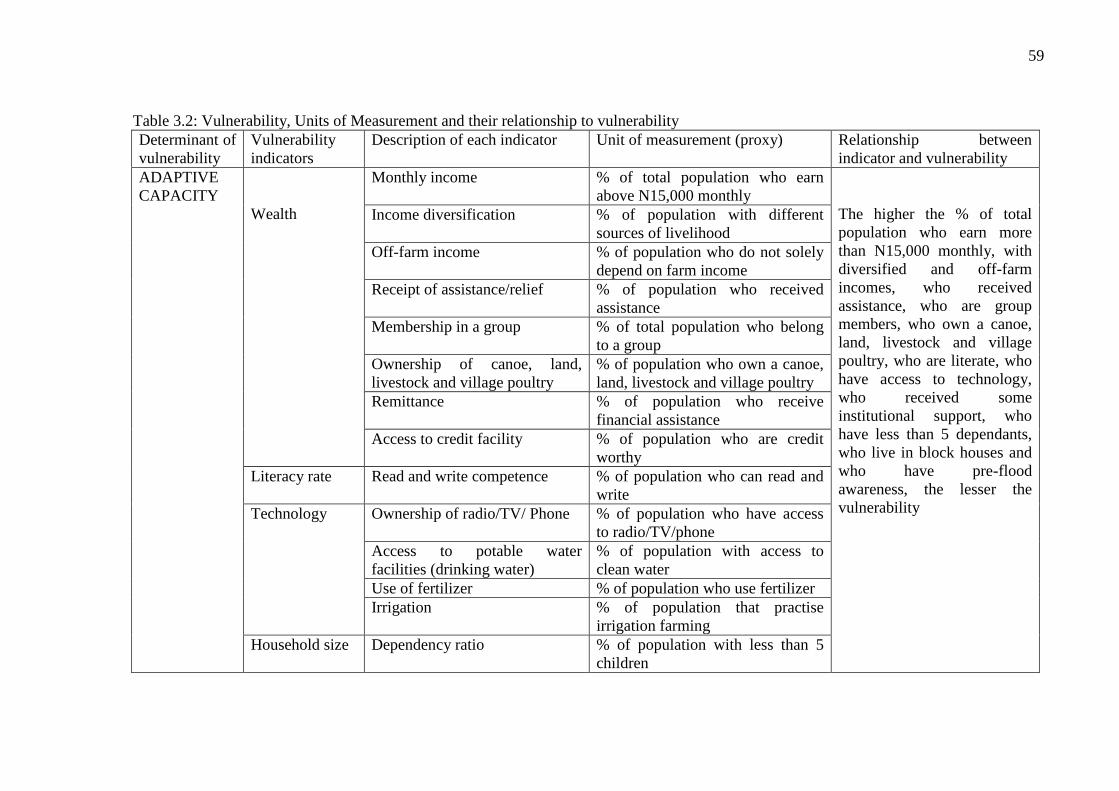
59
Table 3.2: Vulnerability, Units of Measurement and their relationship to vulnerability
Determinant of
vulnerability
Vulnerability
indicators
Description of each indicator Unit of measurement (proxy) Relationship between
indicator and vulnerability
ADAPTIVE
CAPACITY
Wealth
Monthly income % of total population who earn
above N15,000 monthly
The higher the % of total
population who earn more
than N15,000 monthly, with
diversified and off-farm
incomes, who received
assistance, who are group
members, who own a canoe,
land, livestock and village
poultry, who are literate, who
have access to technology,
who received some
institutional support, who
have less than 5 dependants,
who live in block houses and
who have pre-flood
awareness, the lesser the
vulnerability
Income diversification % of population with different
sources of livelihood
Off-farm income % of population who do not solely
depend on farm income
Receipt of assistance/relief % of population who received
assistance
Membership in a group % of total population who belong
to a group
Ownership of canoe, land,
livestock and village poultry
% of population who own a canoe,
land, livestock and village poultry
Remittance % of population who receive
financial assistance
Access to credit facility % of population who are credit
worthy
Literacy rate Read and write competence % of population who can read and
write
Technology Ownership of radio/TV/ Phone % of population who have access
to radio/TV/phone
Access to potable water
facilities (drinking water)
% of population with access to
clean water
Use of fertilizer % of population who use fertilizer
Irrigation % of population that practise
irrigation farming
Household size Dependency ratio % of population with less than 5
children
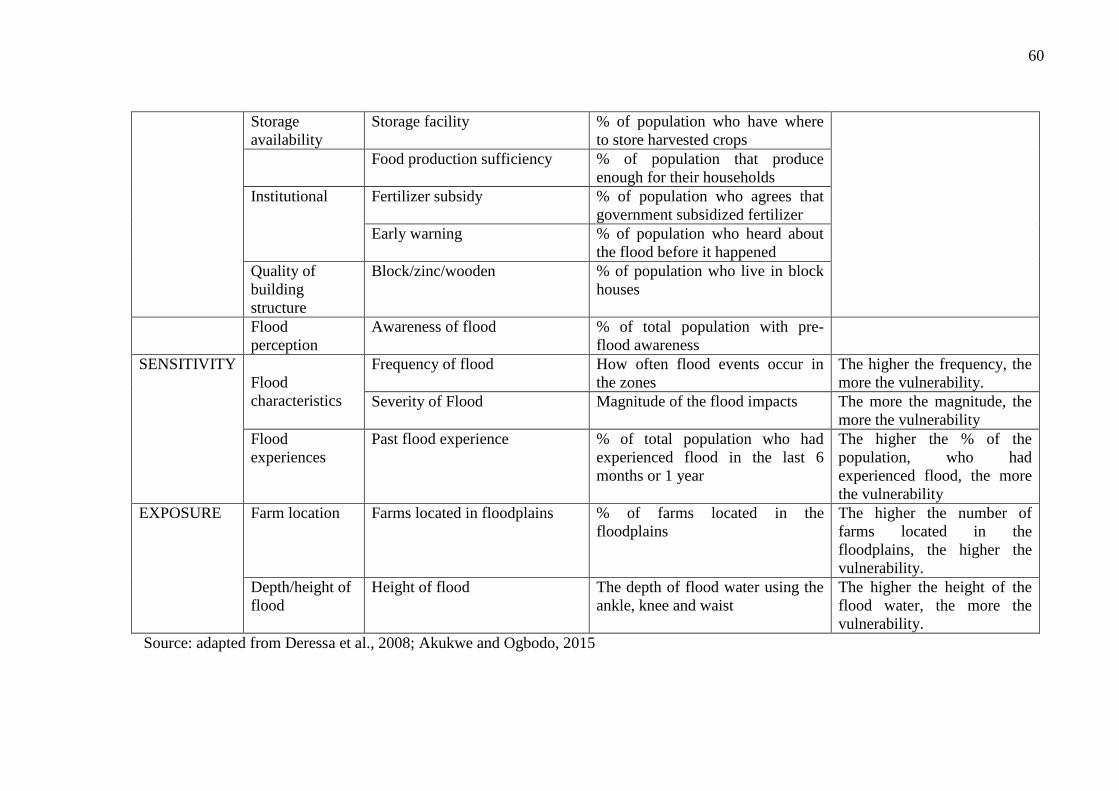
60
Storage
availability
Storage facility % of population who have where
to store harvested crops
Food production sufficiency % of population that produce
enough for their households
Institutional Fertilizer subsidy % of population who agrees that
government subsidized fertilizer
Early warning % of population who heard about
the flood before it happened
Quality of
building
structure
Block/zinc/wooden % of population who live in block
houses
Flood
perception
Awareness of flood % of total population with pre-
flood awareness
SENSITIVITY
Flood
characteristics
Frequency of flood How often flood events occur in
the zones
The higher the frequency, the
more the vulnerability.
Severity of Flood Magnitude of the flood impacts The more the magnitude, the
more the vulnerability
Flood
experiences
Past flood experience % of total population who had
experienced flood in the last 6
months or 1 year
The higher the % of the
population, who had
experienced flood, the more
the vulnerability
EXPOSURE Farm location Farms located in floodplains % of farms located in the
floodplains
The higher the number of
farms located in the
floodplains, the higher the
vulnerability.
Depth/height of
flood
Height of flood The depth of flood water using the
ankle, knee and waist
The higher the height of the
flood water, the more the
vulnerability.
Source: adapted from Deressa et al., 2008; Akukwe and Ogbodo, 2015
61
3.6.5 Regression Analysis and Analysis of Variance (ANOVA) for flood vulnerability
The factors influencing household flood vulnerability and their direction (positive or
negative) of influence were analysed using the linear regression analysis because it was the
most suitable model regarding the proposed relationship between flood vulnerability and
these factors (see Table 3.2), though, the flood vulnerability levels were ordered viz; less
vulnerable, moderately vulnerable and highly vulnerable.
The relationship between household vulnerability (Y) and its determinants (X) were
examined using multiple linear regression model. The vulnerability level (Y) was the
dependent variable while independent variables were the factors influencing vulnerability as
shown below;
Y= b0 + b1x1 +b2x2+…b36x36…(6)
Where; Y is the household vulnerability level
b0 is the constant that scales the equation
b1 to b36 are the coefficients that determine the direction and extent to which the (x)
factors influence household vulnerability (Y)
x1 to x36 are the determinants of household vulnerability, which are in this study;
farm location (floodable farm), Access to credit, Marital status, Canoe ownership, flood
experienced in farmland, Food/Aid receipt, fertilizer subsidy, remittance, poultry farm
ownership, affected by flood in the last one (1) year, early warning, flood frequency, phone
ownership, livestock ownership, Radio/TV ownership, pre-flood awareness, access to potable
water, dependency ratio, flood experienced in area of residence, irrigation practice,
diversified income, flood severity, literacy rate, group membership, storage facility
availability, type of dwelling unit, fertilizer use, sufficient own food production, sex, age,
farm size, flood depth, monthly income, private land ownership, level of education, off-farm
income.
Data on ordinal scale of measurement e.g. flood severity, level of education were transposed
before the regression analysis were run
The one-way analysis of variance (ANOVA) statistic was used to show variations in the
determinants of households’ vulnerability as well as variations between female-headed and
male-headed households while the Snedecor’s variance ratio test or Snedecor’s F test was
used to test for their significance (test the hypothesis).
62
3.6.6 Food Security Assessment
The Food Security Index (FSI) equation given below was used to assess the food accessibility
dimension of food security as defined by FAO (1996). The FSI according to (Omonona and
Agoi, 2007:402) is given as follows:
“FSI = Per capita monthly food expenditure for the ith
household …(7)
2/3 mean per capita monthly food expenditure of all households”
Where FSI =General Food security index
FSI >1 =Food secure ith
household
FSI <1 =Food insecure ith
household
“A food secure household is any household whose per capita monthly food expenditure is
equal to or more than 2/3 of the mean per capita monthly food expenditure of all households.
Conversely, a food insecure household is any household whose per capita monthly food
expenditure is less than 2/3 of the mean per capita monthly food expenditure of all
households” (Omonona and Agoi, 2007:402). Subsequently, the headcount ratio was used to
determine proportion of food secure/insecure households in the study area.
The headcount ratio (HR) according to Ibok, Bassey, Atairet and Obot (2014) is given as
follows;
HR = Q/W ...(8)
Where Q = number of food secure/insecure households
W = number of households used for the study.
“The Food Consumption Score was used to assess the food utilization dimension of food
security. The FCS is a composite score based on dietary diversity, food frequency, and the
relative nutritional importance of different food groups; it also serves as a proxy for current
food security” (WFP, 2008:1). For example, each food item is put into a category, and each
category is weighted based on relative nutritional value where sugar and oil each is given a
weight of 0.5; vegetables and fruit both a weight of 1; cereals and tubers are given a weight
of 2; pulses a weight of 3 while meat, milk and fish are given a weight of 4. The standard
thresholds for each food consumption group are presented in Table 3.3.
3.6.6.1 FCS Calculation Steps
i. “Group food items in the specified food groups
ii. Get consumption frequencies (number of days food items is eaten) within the same group
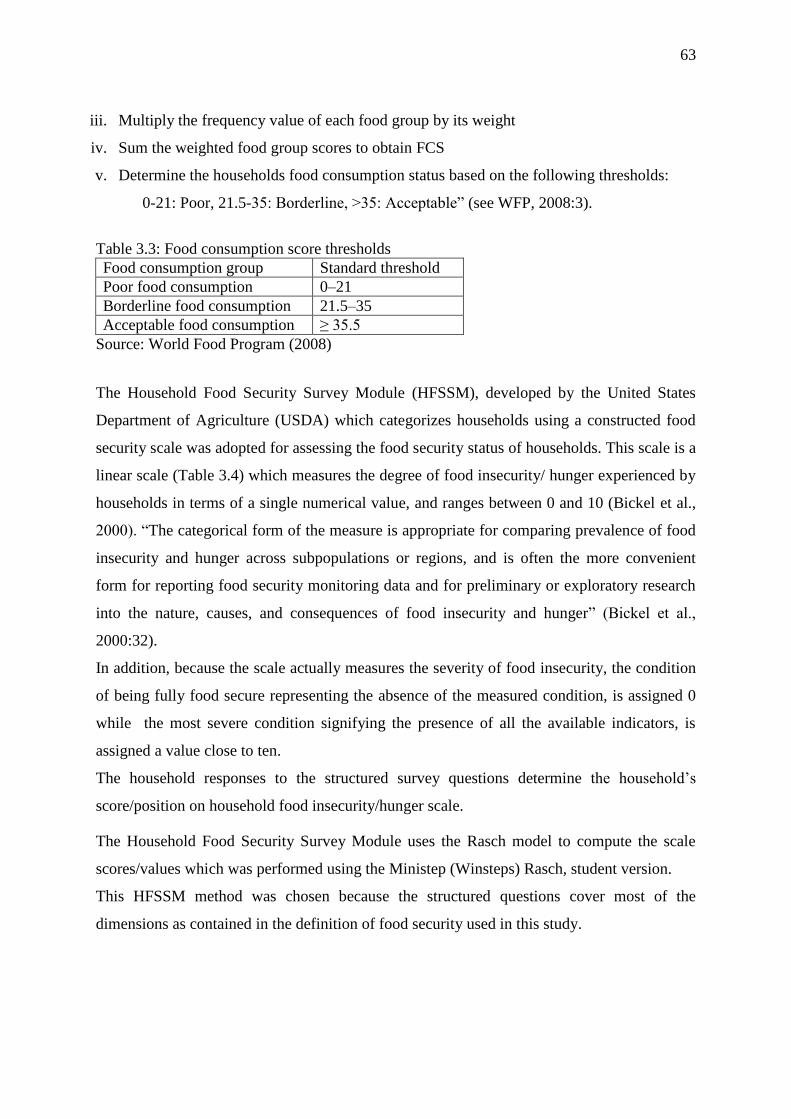
63
iii. Multiply the frequency value of each food group by its weight
iv. Sum the weighted food group scores to obtain FCS
v. Determine the households food consumption status based on the following thresholds:
0-21: Poor, 21.5-35: Borderline, >35: Acceptable” (see WFP, 2008:3).
Table 3.3: Food consumption score thresholds
Food consumption group Standard threshold
Poor food consumption 0–21
Borderline food consumption 21.5–35
Acceptable food consumption ≥ 35.5
Source: World Food Program (2008)
The Household Food Security Survey Module (HFSSM), developed by the United States
Department of Agriculture (USDA) which categorizes households using a constructed food
security scale was adopted for assessing the food security status of households. This scale is a
linear scale (Table 3.4) which measures the degree of food insecurity/ hunger experienced by
households in terms of a single numerical value, and ranges between 0 and 10 (Bickel et al.,
2000). “The categorical form of the measure is appropriate for comparing prevalence of food
insecurity and hunger across subpopulations or regions, and is often the more convenient
form for reporting food security monitoring data and for preliminary or exploratory research
into the nature, causes, and consequences of food insecurity and hunger” (Bickel et al.,
2000:32).
In addition, because the scale actually measures the severity of food insecurity, the condition
of being fully food secure representing the absence of the measured condition, is assigned 0
while the most severe condition signifying the presence of all the available indicators, is
assigned a value close to ten.
The household responses to the structured survey questions determine the household’s
score/position on household food insecurity/hunger scale.
The Household Food Security Survey Module uses the Rasch model to compute the scale
scores/values which was performed using the Ministep (Winsteps) Rasch, student version.
This HFSSM method was chosen because the structured questions cover most of the
dimensions as contained in the definition of food security used in this study.
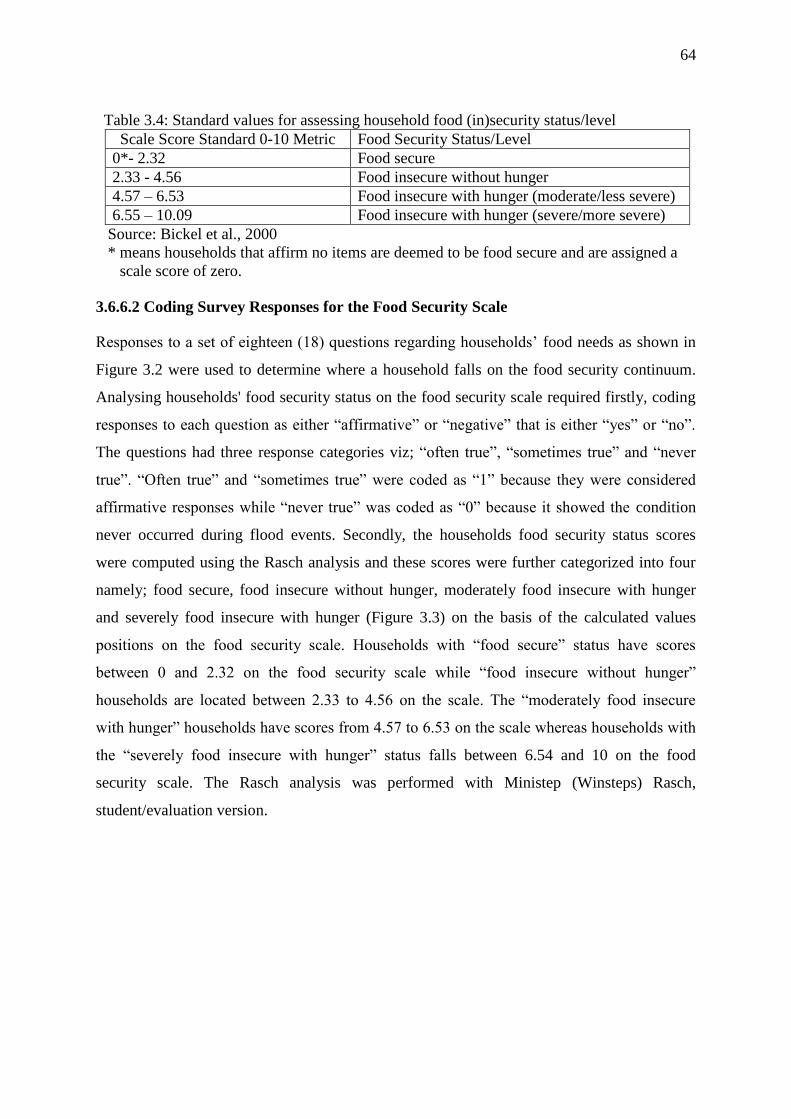
64
Table 3.4: Standard values for assessing household food (in)security status/level
Scale Score Standard 0-10 Metric Food Security Status/Level
0*- 2.32 Food secure
2.33 - 4.56 Food insecure without hunger
4.57 – 6.53 Food insecure with hunger (moderate/less severe)
6.55 – 10.09 Food insecure with hunger (severe/more severe)
Source: Bickel et al., 2000
* means households that affirm no items are deemed to be food secure and are assigned a
scale score of zero.
3.6.6.2 Coding Survey Responses for the Food Security Scale
Responses to a set of eighteen (18) questions regarding households’ food needs as shown in
Figure 3.2 were used to determine where a household falls on the food security continuum.
Analysing households' food security status on the food security scale required firstly, coding
responses to each question as either “affirmative” or “negative” that is either “yes” or “no”.
The questions had three response categories viz; “often true”, “sometimes true” and “never
true”. “Often true” and “sometimes true” were coded as “1” because they were considered
affirmative responses while “never true” was coded as “0” because it showed the condition
never occurred during flood events. Secondly, the households food security status scores
were computed using the Rasch analysis and these scores were further categorized into four
namely; food secure, food insecure without hunger, moderately food insecure with hunger
and severely food insecure with hunger (Figure 3.3) on the basis of the calculated values
positions on the food security scale. Households with “food secure” status have scores
between 0 and 2.32 on the food security scale while “food insecure without hunger”
households are located between 2.33 to 4.56 on the scale. The “moderately food insecure
with hunger” households have scores from 4.57 to 6.53 on the scale whereas households with
the “severely food insecure with hunger” status falls between 6.54 and 10 on the food
security scale. The Rasch analysis was performed with Ministep (Winsteps) Rasch,
student/evaluation version.
65
Figure 3.2: Structured survey questions on household food security
Figure 3.3: Household food security status - categorical measure
Source: Bickel et al., 2000:31
*/ located at midpoint between the two adjacent household scale values.
3.6.6.3 Rasch Analysis
To ensure that the Food Security Indices (FSI) range from 0 to 10 and to remove negative
values that occurred in the output tables using the USCALE=1 and UIMEAN=0 in the
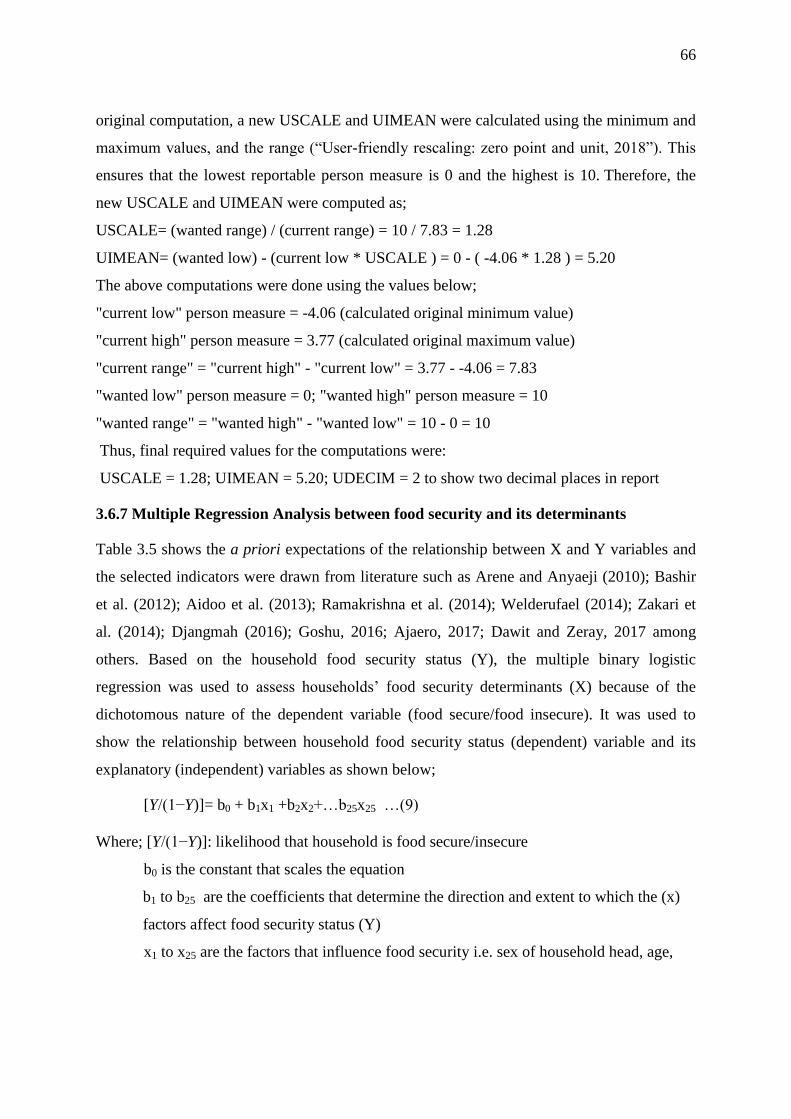
66
original computation, a new USCALE and UIMEAN were calculated using the minimum and
maximum values, and the range (“User-friendly rescaling: zero point and unit, 2018”). This
ensures that the lowest reportable person measure is 0 and the highest is 10. Therefore, the
new USCALE and UIMEAN were computed as;
USCALE= (wanted range) / (current range) = 10 / 7.83 = 1.28
UIMEAN= (wanted low) - (current low * USCALE ) = 0 - ( -4.06 * 1.28 ) = 5.20
The above computations were done using the values below;
"current low" person measure = -4.06 (calculated original minimum value)
"current high" person measure = 3.77 (calculated original maximum value)
"current range" = "current high" - "current low" = 3.77 - -4.06 = 7.83
"wanted low" person measure = 0; "wanted high" person measure = 10
"wanted range" = "wanted high" - "wanted low" = 10 - 0 = 10
Thus, final required values for the computations were:
USCALE = 1.28; UIMEAN = 5.20; UDECIM = 2 to show two decimal places in report
3.6.7 Multiple Regression Analysis between food security and its determinants
Table 3.5 shows the a priori expectations of the relationship between X and Y variables and
the selected indicators were drawn from literature such as Arene and Anyaeji (2010); Bashir
et al. (2012); Aidoo et al. (2013); Ramakrishna et al. (2014); Welderufael (2014); Zakari et
al. (2014); Djangmah (2016); Goshu, 2016; Ajaero, 2017; Dawit and Zeray, 2017 among
others. Based on the household food security status (Y), the multiple binary logistic
regression was used to assess households’ food security determinants (X) because of the
dichotomous nature of the dependent variable (food secure/food insecure). It was used to
show the relationship between household food security status (dependent) variable and its
explanatory (independent) variables as shown below;
[Y/(1−Y)]= b0 + b1x1 +b2x2+…b25x25 …(9)
Where; [Y/(1−Y)]: likelihood that household is food secure/insecure
b0 is the constant that scales the equation
b1 to b25 are the coefficients that determine the direction and extent to which the (x)
factors affect food security status (Y)
x1 to x25 are the factors that influence food security i.e. sex of household head, age,
67
marital status, literacy rate, level of education, diversified income, off-farm income, monthly
income, dependency ratio, group membership, private land ownership, sufficient own food
production, livestock ownership, poultry farm ownership, distance to farm, distance to
market, storage facility availability, fertilizer use, irrigation, food/aid receipt, nutrition
knowledge, farm size, financial support, access to credit, flood experience.
Households in the study area were classified into four food (in)security levels viz; food
secure, food insecure without hunger, moderately food insecure with hunger and severely
food insecure with hunger. However, for the purpose of demonstrating the relationship
between food security and its determinants using binary logistic regression model, the
households were transposed into two categories namely; food secure and food insecure
(comprising food insecure without hunger, moderately food insecure with hunger and
severely food insecure with hunger) households. These households were further
disaggregated into four again for better explanation of the factors influencing food security in
the study area.
The Odds ratio (OR) was used to show the degree of association between X and Y variables.
It is simply the exponential function of the regression coefficient (eb1-b25
) associated with a
one-unit increase in the exposure (Szumilas, 2010).
Unlike the linear regression, the logit model does not make assumptions regarding linearity,
normality and homoscedasticity. This implies that the logit model can handle any type of data
and does not require a linear relationship between the independent variables and the
dependent variable which is binary (food secure/food insecure), hence non-linear. However,
the error term and independent variables do not need to be normally distributed and the
homogeneity of variance around the regression line for all values of the predictor variable is
equally not needed (Goshu, 2016).
3.6.7.1 Hypotheses Testing
The one-way analysis of variance (ANOVA) statistic was used to show if there are variations
in the determinants of food security among households, and variations between female-
headed and male-headed households while the Snedecor’s F test was used to test for their
significance.

68
Table 3.5: Hypothesize relationship between food security and factors influencing it
Determinants of food security (Variable) Code A priori expectation
(Expected relationship
between determinants and
food security)
Sex of household head (X1) (Male=1; Female=0) Positive
Age of household head (X2) (in Years) Negative
Marital status (X3)
Single=1;
Married= 2;
Divorced=3;
Separated=4;
Widowed=5
Neutral
Literacy rate (X4) (Yes=1; No=0) Positive
Level of education (X5)
No formal
education=1;
Primary school=2;
secondary school=3;
OND/NCE=4;
B.Sc/B.A=5;
M.Sc/M.A=6;
PhD=7
Positive
Diversified income (X6) (Yes=1; No=0) Positive
Off-farm income (X7) (Yes=1; No=0) Positive
Monthly income (X8)
<15,000= 1;
15,001-30,000=2;
30,001-45,000=3;
45,001-60,000=4;
60,001-75,000=5;
75,001-90,000=6;
Above 90,000=7
Positive
Dependency ratio (X9) (>5=1; <5=0) Negative
Group membership (X10) (Yes=1; No=0) Positive
Private land ownership (X11) (Yes=1; No=0) Positive
Sufficiency in own food production (X12) (Yes=1; No=0) Positive
Livestock ownership (X13) (Yes=1; No=0) Positive
Village/Agric. poultry ownership (X14) (Yes=1; No=0) Positive
Distance to farm (X15) (>1hr=1; <1hr=0) Negative
Distance to market (X16) (>1hr=1; <1hr=0) Negative
Storage facility availability (X17) (Yes=1; No=0) Positive
Fertilizer use (X18) (Yes=1; No=0) Positive
Irrigation practice (X19) (Yes=1; No=0) Positive
Food/Aid receipt (X20) (Yes=1; No=0) Positive
Nutrition knowledge (X21) (Yes=1; No=0) Positive
Farm size (X22) (in acres) Positive
Financial support (X23) (Yes=1; No=0) Positive
Credit access (X24) (Yes=1; No=0) Positive
Flood Experience (X25) (Yes=1; No=0) Negative
Source: Researcher, 2017
69
3.6.8 Ordinal Logistic Regression Analysis
The simple ordinal logistic regression analysis was used to assess effect of flooding on
households’ food security. The ordinal logistic regression analysis was preferred because of
the ordered nature of the households as analysed by the food security status viz; food secure,
food insecure without hunger, moderately food insecure with hunger and severely food
insecure with hunger. Like the binary logit regression, the ordinal logistic regression does not
make assumptions regarding linearity, normality and homoscedasticity.
The households were assigned codes ranging from 0 to 3 depending on their food security
level which is a function of their scores on the food security scale. Food secure households
were assigned 0, 1 was assigned to households with the status “food insecure without
hunger”, 2 was assigned to households termed “moderately food insecure with hunger” and
severely food insecure with hunger households were assigned 3. These codes, 0 to 3 formed
the codes for the dependent variable, Y, food security. The predicting variable, X, was
flooding coded as 1 for “Yes” and 2 for “No”.
The number of coefficients reported for categorical predictors in ordinal regression models
with intercepts is usually less than one the number of categories of the variable. For instance,
we had four categories for the dependent variable (Food Security = 0,1,2,3), only three
coefficients for food security = 0,1,2 were displayed. For the predictor variable, we had two
categories, but, only the coefficient for the “yes” responses with the value of 1 was displayed.
The last category is usually the reference category, hence the coefficient of 0 for the second
category (reference category) of the predictor variable in which our interest lies.
The ordinal regression model is given as;
[Y/(1−Y)] = aj + bX ...(10)
j goes from 1 to the number of categories (4) minus 1
Where; [Y/(1−Y)]: likelihood that a household is food secure/insecure
a is the constant
b is the coefficient
X is flooding

70
The ‘t’ test was employed to show if flooding is a significant factor influencing food
insecurity while the odds ratio (OR) was used to show the degree of association between
flooding and various levels of food security.
3.6.9 Mean score and Principal Component Analysis (PCA)
Mean scores were used to show if both positive and negative effects (on a likert scale) of
flooding on food security were significant or not. A reliability test was first run with an
expected Cronbach alpha value of ≥0.7 before running the mean score. A mean score of ≥3.0
was assumed significant since it was on a five-point scale.
PCA was run on the negative effects of flooding on food security to summarize the major
aspects of food security that flooding affect negatively. PCA does data reduction by
combining a large number of indicators into fewer similar groups, each group defining the
underlying dimension in the contributing variables forming the group (Anyadike 2009). The
components of the PCA were extracted using the varimax rotation method with significant
loadings of +/-0.60. Eigen values are simply the coefficients attached to eigenvectors ranked
in descending order of their eigen values to arrive at the principal components in order of
significance. This implies that they are the measure of the data’s covariance (“A beginner’s
guide to eigenvectors, PCA, covariance and entropy”, 2018).
3.6.10 Wealth Classes
Wealth classes were constructed using monthly income. First, the mean of each income
group/level was calculated. Then, the minimum income value, the computed 1st, 2
nd and 3
rd
quartiles, and the maximum income value were used to construct the five wealth classes
(Table 3.6).
Table 3.6: Wealth classes computed from monthly income
Wealth Class Monthly Income (in Naira)
Poorest *15,000
Poorer ≥30,000
Middle ≥52,000
Wealthier ≥75,000
Wealthiest ≥90,000
* means ≤ and ≥

71
3.6.11 Poverty line determination
According to the World Bank (2015b), a poverty line sets a limit for minimum income.
Individuals who fall below the line do not have enough money to meet their basic needs of
food, clothing and shelter. The poverty line for the study area was determined using the
World Bank general benchmark of <1.9USD daily for developing countries. As of the time
the pilot survey of the research was carried out, the official exchange rate for US Dollar and
Naira was $1= N263. Thus, $1.9 per day = N500 per day. Therefore, any household with a
monthly income of < N15,000 (derived from 500 daily x 30 days) was considered poor.
All the analyses were run using Statistical Package for Social Sciences (SPSS) version 21 and
Microsoft Excel were used to produce some graphs.
3.6.12 Households’ Assets and Amenities Measurements
Household assets were analysed using ownership of household items like car, refrigerator,
generator, phone, furniture, television, canoe, motorcycle, fan, bicycle, radio, wheel barrow
and others (e.g. sewing machine, clothes iron). Some items (e.g. wheel barrow, bicycle) were
included in the list of assets because they are basic necessities in farming communities; canoe
is an asset in the riverine communities. Household amenities analysed in the study were
access to electricity and good drinking water, sanitary facilities, good housing, adequate
waste disposal, access to roads and hospitals.
3.7 Ethical issues
The researcher notified and obtained the consent of the traditional rulers of each sampled
community prior to the reconnaissance and final surveys. The cultural norms of the
communities were obeyed during the field work. In addition, the consent of the respondents
as well as the administration of questionnaire at their convenience was strictly followed.
Anonymity and confidentiality of respondents were strictly adhered to in administering
questionnaire and data collection.
72
CHAPTER FOUR
RESULTS AND DISCUSSION
4.1 Introduction
This chapter consists of the presentation and discussion of research findings. The results were
mostly questionnaire-based and 400 copies of questionnaire were administered on
respondents with 100% retrieval.
4.2 Demographic and Socio-economic Characteristics of Respondents
There are variations in the demographic and socio-economic characteristics of households
across the communities in the study area. These variations in terms of their sex, age,
occupation, level of education, economic status, access to technology, potable water access
and other farm-related characteristics are shown in Tables 4.1 to 4.12 as well as in Figures
4.1to 4.11.
4.2.1 Sex, Age and Marital status
The sex, age and marital status of heads of households as well as years spent in each
community by household heads are shown in Table 4.1. The study comprised 56.2% males as
heads of households and 43.8% females as heads of households. In terms of age (in years),
slightly more than a quarter (25.8%) of the household heads were between 40 and 49 years
and 25% were between 60 and 69 years of age.
The analysis also revealed that 73% of the heads of household were between 40 years and
above while 27% were between 20 and 39 years of age. In addition, majority (64.5%) of the
heads of households were married while only 7.8% reported to have never been married
(single).
However, 19.8% respondents indicated to have lost their spouses and women constitute a
greater number (74.7%) i.e. (59 out of 79) of these people with the “widowed” status (figure
4.1), hence the reason they are solely farmers since 63.1% (out of the total of those with no
formal education in the study area) were women (figure 4.2).
As regards number of years stayed in the community, a large of proportion (47.6%) reported
to have spent between 30 to 49 years in their communities while 11.2% of household heads
had spent between 60 and 69 years. Only 2% indicated to have stayed <10 years in their
communities (Table 4.1) and this is an indication that majority of the households heads had
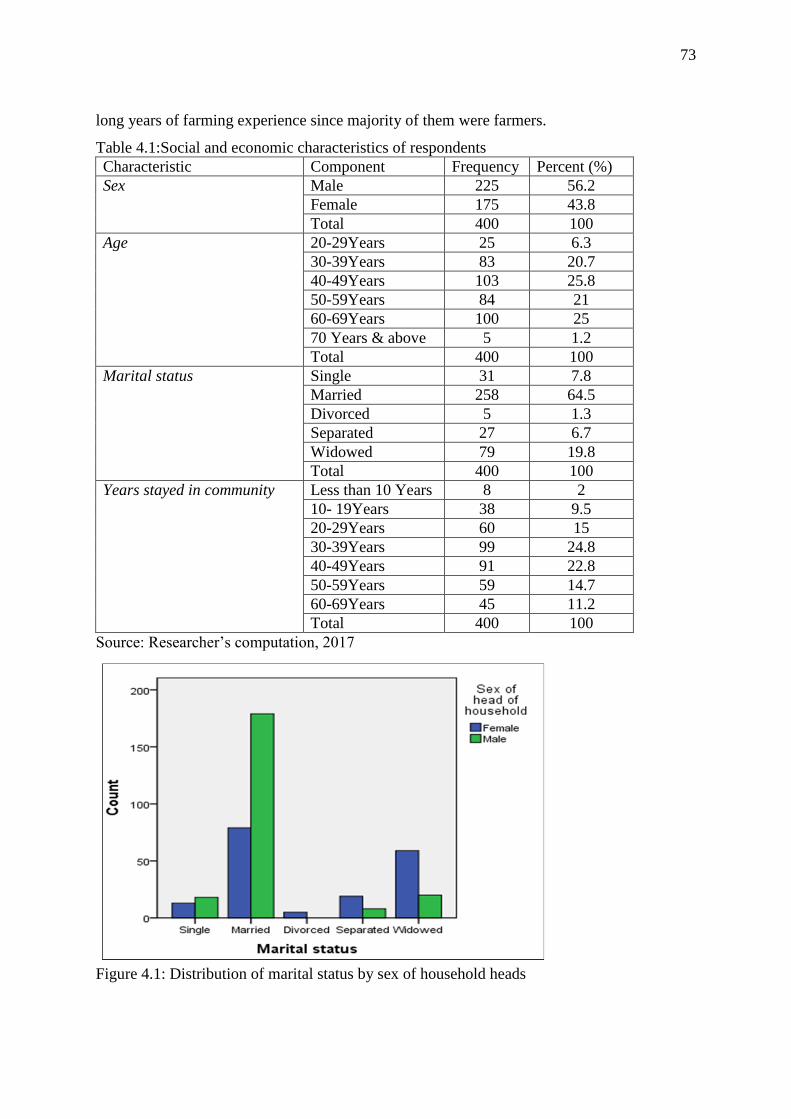
73
long years of farming experience since majority of them were farmers.
Table 4.1:Social and economic characteristics of respondents
Characteristic Component Frequency Percent (%)
Sex Male 225 56.2
Female 175 43.8
Total 400 100
Age 20-29Years 25 6.3
30-39Years 83 20.7
40-49Years 103 25.8
50-59Years 84 21
60-69Years 100 25
70 Years & above 5 1.2
Total 400 100
Marital status Single 31 7.8
Married 258 64.5
Divorced 5 1.3
Separated 27 6.7
Widowed 79 19.8
Total 400 100
Years stayed in community Less than 10 Years 8 2
10- 19Years 38 9.5
20-29Years 60 15
30-39Years 99 24.8
40-49Years 91 22.8
50-59Years 59 14.7
60-69Years 45 11.2
Total 400 100
Source: Researcher’s computation, 2017
Figure 4.1: Distribution of marital status by sex of household heads
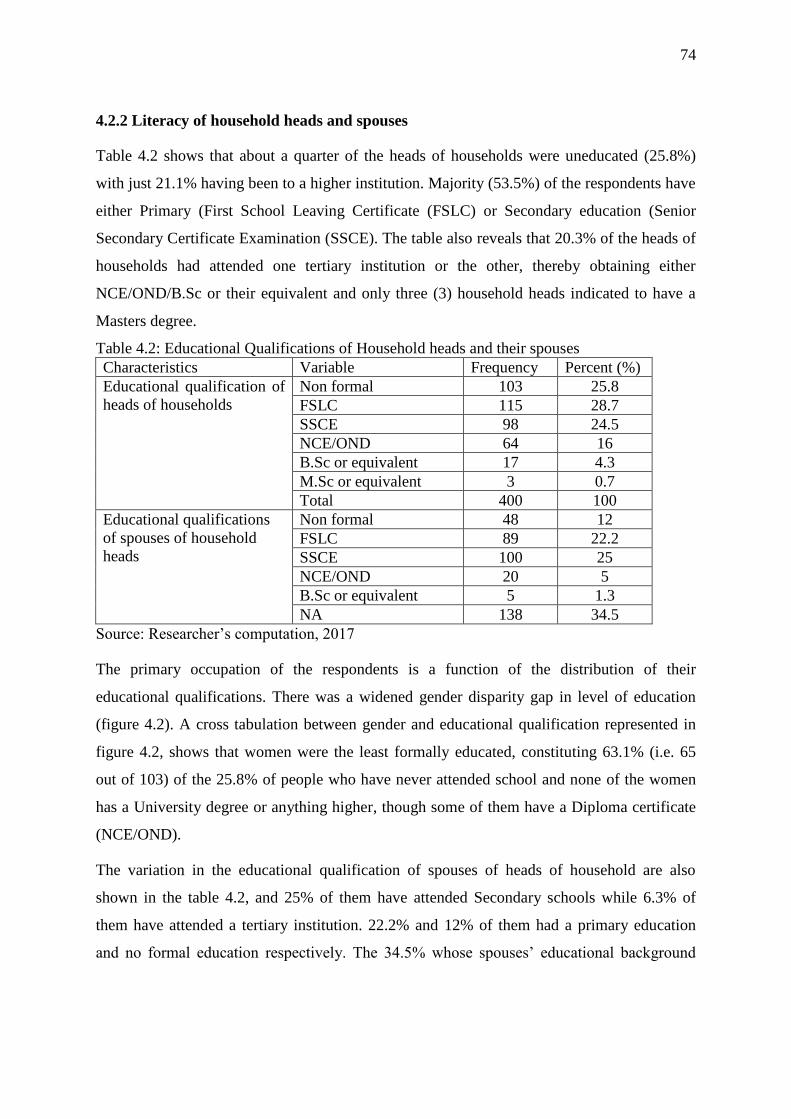
74
4.2.2 Literacy of household heads and spouses
Table 4.2 shows that about a quarter of the heads of households were uneducated (25.8%)
with just 21.1% having been to a higher institution. Majority (53.5%) of the respondents have
either Primary (First School Leaving Certificate (FSLC) or Secondary education (Senior
Secondary Certificate Examination (SSCE). The table also reveals that 20.3% of the heads of
households had attended one tertiary institution or the other, thereby obtaining either
NCE/OND/B.Sc or their equivalent and only three (3) household heads indicated to have a
Masters degree.
Table 4.2: Educational Qualifications of Household heads and their spouses
Characteristics Variable Frequency Percent (%)
Educational qualification of
heads of households
Non formal 103 25.8
FSLC 115 28.7
SSCE 98 24.5
NCE/OND 64 16
B.Sc or equivalent 17 4.3
M.Sc or equivalent 3 0.7
Total 400 100
Educational qualifications
of spouses of household
heads
Non formal 48 12
FSLC 89 22.2
SSCE 100 25
NCE/OND 20 5
B.Sc or equivalent 5 1.3
NA 138 34.5
Source: Researcher’s computation, 2017
The primary occupation of the respondents is a function of the distribution of their
educational qualifications. There was a widened gender disparity gap in level of education
(figure 4.2). A cross tabulation between gender and educational qualification represented in
figure 4.2, shows that women were the least formally educated, constituting 63.1% (i.e. 65
out of 103) of the 25.8% of people who have never attended school and none of the women
has a University degree or anything higher, though some of them have a Diploma certificate
(NCE/OND).
The variation in the educational qualification of spouses of heads of household are also
shown in the table 4.2, and 25% of them have attended Secondary schools while 6.3% of
them have attended a tertiary institution. 22.2% and 12% of them had a primary education
and no formal education respectively. The 34.5% whose spouses’ educational background
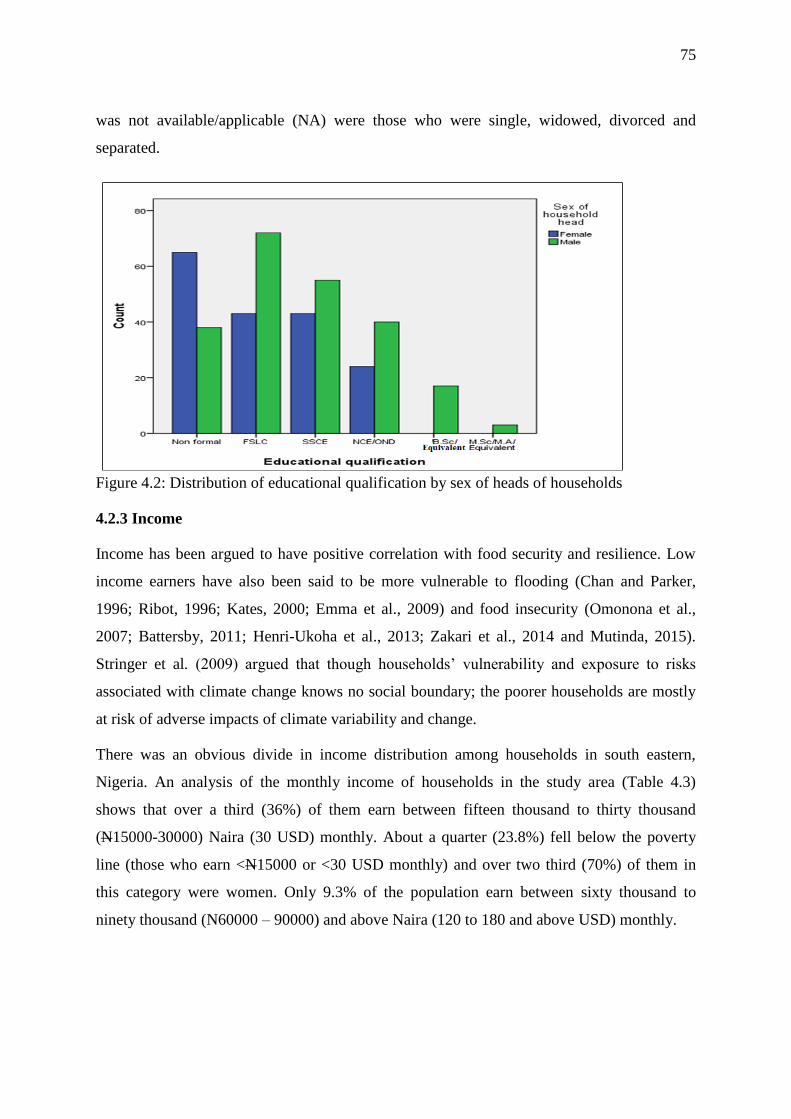
75
was not available/applicable (NA) were those who were single, widowed, divorced and
separated.
Figure 4.2: Distribution of educational qualification by sex of heads of households
4.2.3 Income
Income has been argued to have positive correlation with food security and resilience. Low
income earners have also been said to be more vulnerable to flooding (Chan and Parker,
1996; Ribot, 1996; Kates, 2000; Emma et al., 2009) and food insecurity (Omonona et al.,
2007; Battersby, 2011; Henri-Ukoha et al., 2013; Zakari et al., 2014 and Mutinda, 2015).
Stringer et al. (2009) argued that though households’ vulnerability and exposure to risks
associated with climate change knows no social boundary; the poorer households are mostly
at risk of adverse impacts of climate variability and change.
There was an obvious divide in income distribution among households in south eastern,
Nigeria. An analysis of the monthly income of households in the study area (Table 4.3)
shows that over a third (36%) of them earn between fifteen thousand to thirty thousand
(N15000-30000) Naira (30 USD) monthly. About a quarter (23.8%) fell below the poverty
line (those who earn <N15000 or <30 USD monthly) and over two third (70%) of them in
this category were women. Only 9.3% of the population earn between sixty thousand to
ninety thousand (N60000 – 90000) and above Naira (120 to 180 and above USD) monthly.
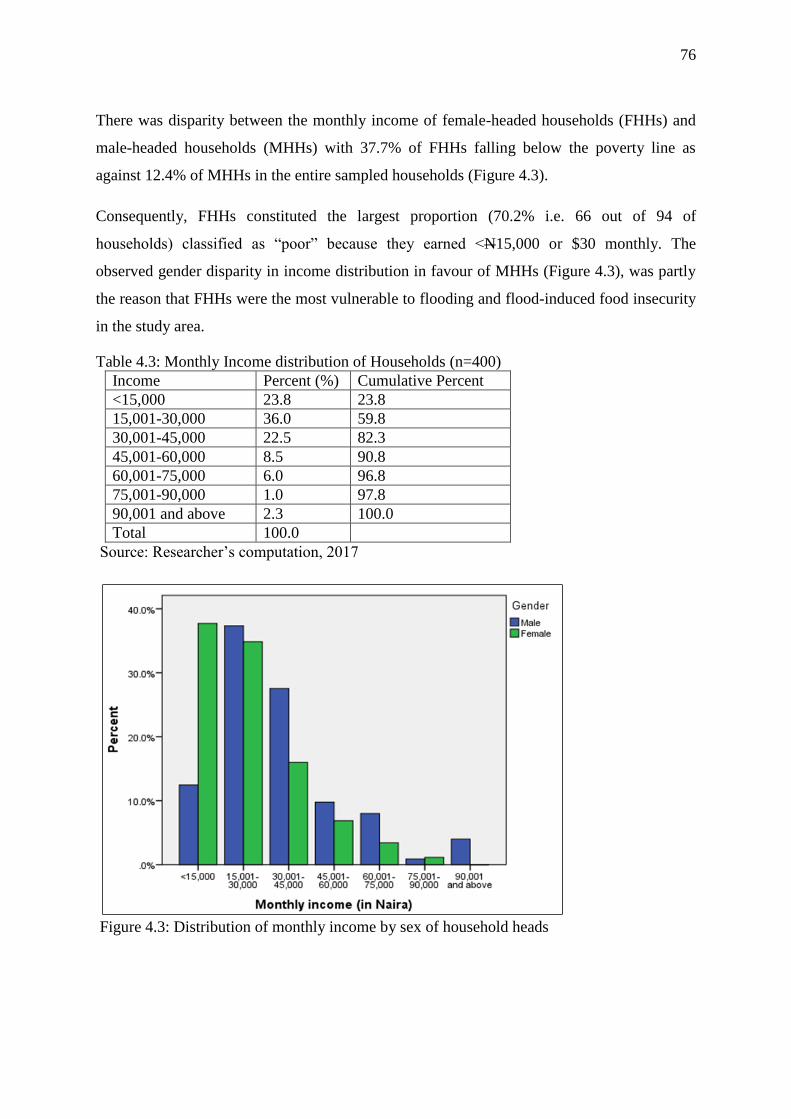
76
There was disparity between the monthly income of female-headed households (FHHs) and
male-headed households (MHHs) with 37.7% of FHHs falling below the poverty line as
against 12.4% of MHHs in the entire sampled households (Figure 4.3).
Consequently, FHHs constituted the largest proportion (70.2% i.e. 66 out of 94 of
households) classified as “poor” because they earned <N15,000 or $30 monthly. The
observed gender disparity in income distribution in favour of MHHs (Figure 4.3), was partly
the reason that FHHs were the most vulnerable to flooding and flood-induced food insecurity
in the study area.
Table 4.3: Monthly Income distribution of Households (n=400)
Income Percent (%) Cumulative Percent
<15,000 23.8 23.8
15,001-30,000 36.0 59.8
30,001-45,000 22.5 82.3
45,001-60,000 8.5 90.8
60,001-75,000 6.0 96.8
75,001-90,000 1.0 97.8
90,001 and above 2.3 100.0
Total 100.0
Source: Researcher’s computation, 2017
Figure 4.3: Distribution of monthly income by sex of household heads
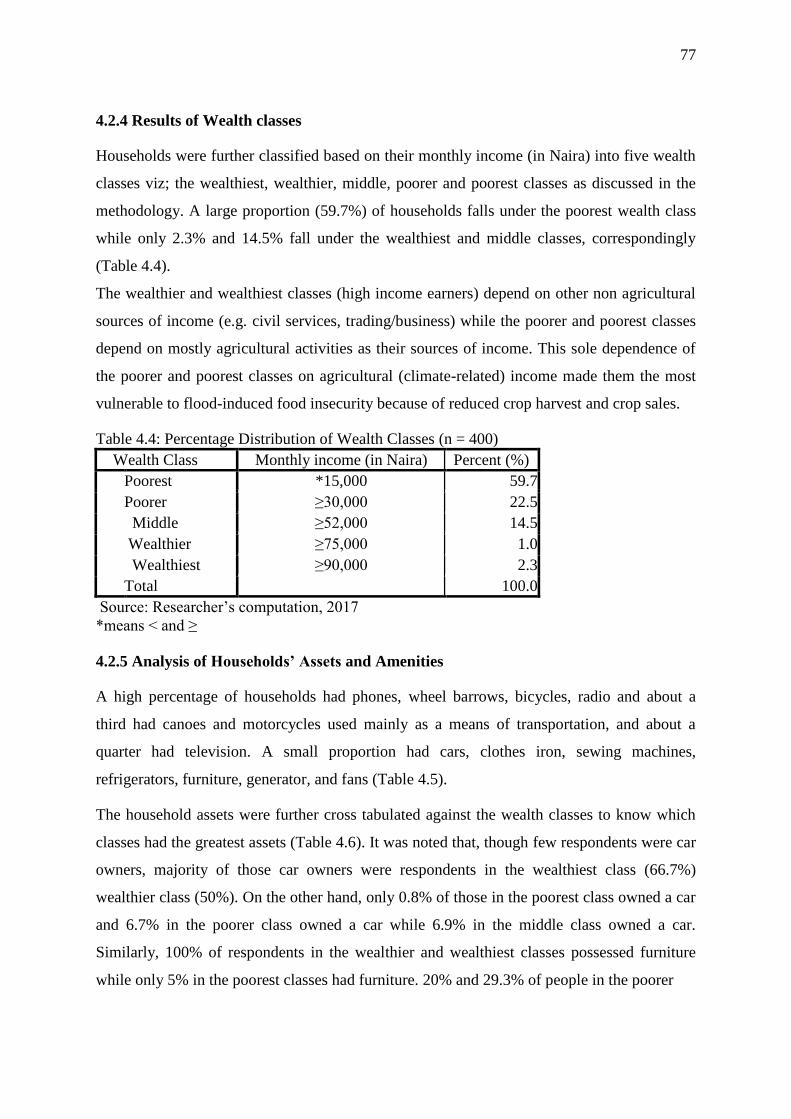
77
4.2.4 Results of Wealth classes
Households were further classified based on their monthly income (in Naira) into five wealth
classes viz; the wealthiest, wealthier, middle, poorer and poorest classes as discussed in the
methodology. A large proportion (59.7%) of households falls under the poorest wealth class
while only 2.3% and 14.5% fall under the wealthiest and middle classes, correspondingly
(Table 4.4).
The wealthier and wealthiest classes (high income earners) depend on other non agricultural
sources of income (e.g. civil services, trading/business) while the poorer and poorest classes
depend on mostly agricultural activities as their sources of income. This sole dependence of
the poorer and poorest classes on agricultural (climate-related) income made them the most
vulnerable to flood-induced food insecurity because of reduced crop harvest and crop sales.
Table 4.4: Percentage Distribution of Wealth Classes (n = 400)
Wealth Class Monthly income (in Naira) Percent (%)
Poorest *15,000 59.7
Poorer ≥30,000 22.5
Middle ≥52,000 14.5
Wealthier ≥75,000 1.0
Wealthiest ≥90,000 2.3
Total 100.0
Source: Researcher’s computation, 2017
*means < and ≥
4.2.5 Analysis of Households’ Assets and Amenities
A high percentage of households had phones, wheel barrows, bicycles, radio and about a
third had canoes and motorcycles used mainly as a means of transportation, and about a
quarter had television. A small proportion had cars, clothes iron, sewing machines,
refrigerators, furniture, generator, and fans (Table 4.5).
The household assets were further cross tabulated against the wealth classes to know which
classes had the greatest assets (Table 4.6). It was noted that, though few respondents were car
owners, majority of those car owners were respondents in the wealthiest class (66.7%)
wealthier class (50%). On the other hand, only 0.8% of those in the poorest class owned a car
and 6.7% in the poorer class owned a car while 6.9% in the middle class owned a car.
Similarly, 100% of respondents in the wealthier and wealthiest classes possessed furniture
while only 5% in the poorest classes had furniture. 20% and 29.3% of people in the poorer
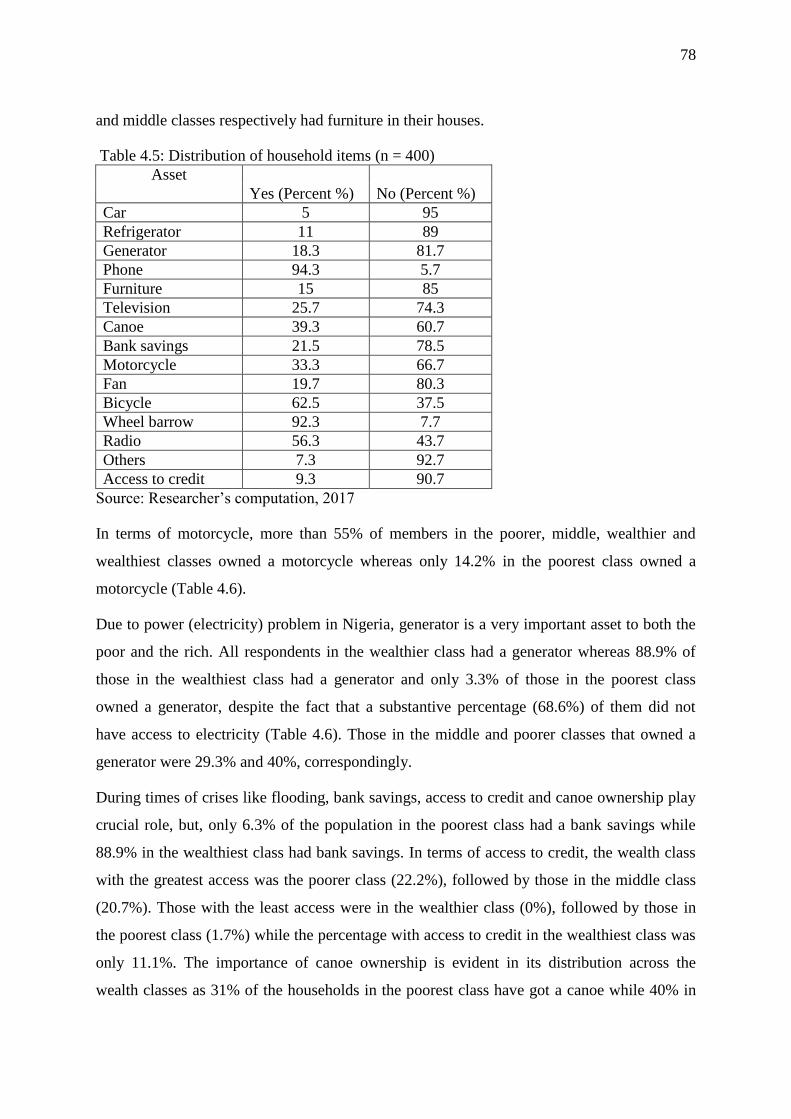
78
and middle classes respectively had furniture in their houses.
Table 4.5: Distribution of household items (n = 400)
Asset
Yes (Percent %) No (Percent %)
Car 5 95
Refrigerator 11 89
Generator 18.3 81.7
Phone 94.3 5.7
Furniture 15 85
Television 25.7 74.3
Canoe 39.3 60.7
Bank savings 21.5 78.5
Motorcycle 33.3 66.7
Fan 19.7 80.3
Bicycle 62.5 37.5
Wheel barrow 92.3 7.7
Radio 56.3 43.7
Others 7.3 92.7
Access to credit 9.3 90.7
Source: Researcher’s computation, 2017
In terms of motorcycle, more than 55% of members in the poorer, middle, wealthier and
wealthiest classes owned a motorcycle whereas only 14.2% in the poorest class owned a
motorcycle (Table 4.6).
Due to power (electricity) problem in Nigeria, generator is a very important asset to both the
poor and the rich. All respondents in the wealthier class had a generator whereas 88.9% of
those in the wealthiest class had a generator and only 3.3% of those in the poorest class
owned a generator, despite the fact that a substantive percentage (68.6%) of them did not
have access to electricity (Table 4.6). Those in the middle and poorer classes that owned a
generator were 29.3% and 40%, correspondingly.
During times of crises like flooding, bank savings, access to credit and canoe ownership play
crucial role, but, only 6.3% of the population in the poorest class had a bank savings while
88.9% in the wealthiest class had bank savings. In terms of access to credit, the wealth class
with the greatest access was the poorer class (22.2%), followed by those in the middle class
(20.7%). Those with the least access were in the wealthier class (0%), followed by those in
the poorest class (1.7%) while the percentage with access to credit in the wealthiest class was
only 11.1%. The importance of canoe ownership is evident in its distribution across the
wealth classes as 31% of the households in the poorest class have got a canoe while 40% in
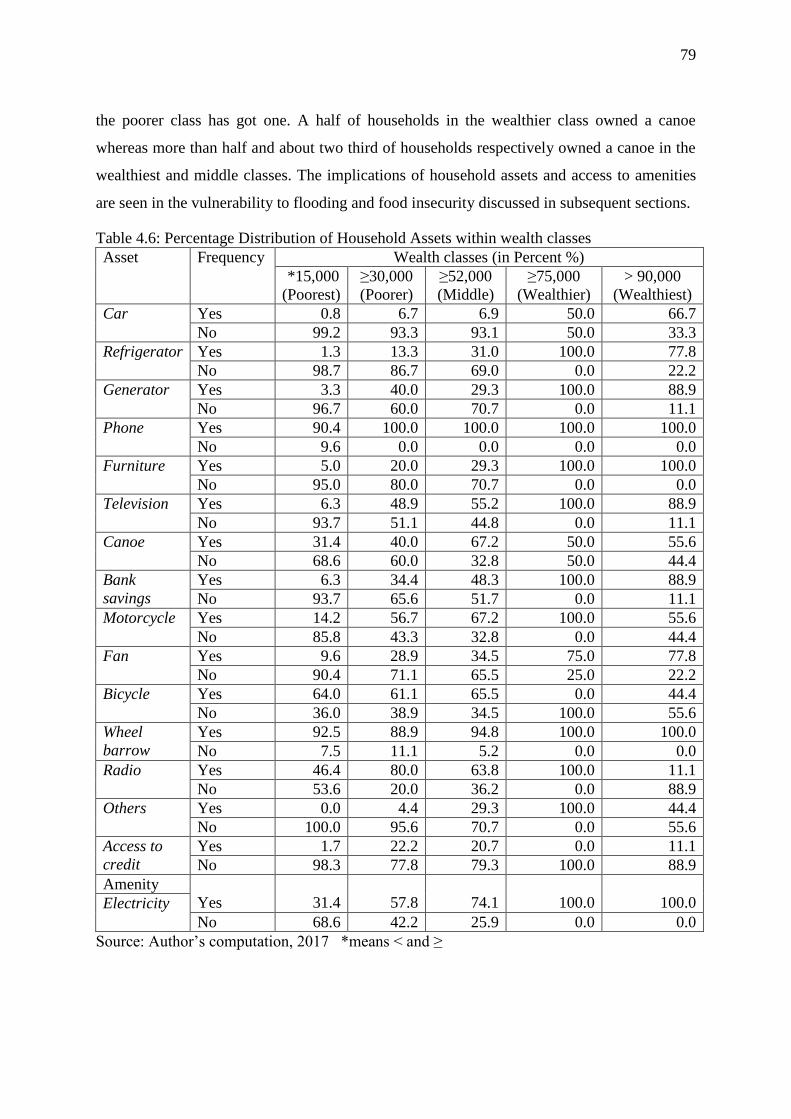
79
the poorer class has got one. A half of households in the wealthier class owned a canoe
whereas more than half and about two third of households respectively owned a canoe in the
wealthiest and middle classes. The implications of household assets and access to amenities
are seen in the vulnerability to flooding and food insecurity discussed in subsequent sections.
Table 4.6: Percentage Distribution of Household Assets within wealth classes
Asset Frequency Wealth classes (in Percent %)
*15,000
(Poorest)
≥30,000
(Poorer)
≥52,000
(Middle)
≥75,000
(Wealthier)
> 90,000
(Wealthiest)
Car Yes 0.8 6.7 6.9 50.0 66.7
No 99.2 93.3 93.1 50.0 33.3
Refrigerator Yes 1.3 13.3 31.0 100.0 77.8
No 98.7 86.7 69.0 0.0 22.2
Generator Yes 3.3 40.0 29.3 100.0 88.9
No 96.7 60.0 70.7 0.0 11.1
Phone Yes 90.4 100.0 100.0 100.0 100.0
No 9.6 0.0 0.0 0.0 0.0
Furniture Yes 5.0 20.0 29.3 100.0 100.0
No 95.0 80.0 70.7 0.0 0.0
Television Yes 6.3 48.9 55.2 100.0 88.9
No 93.7 51.1 44.8 0.0 11.1
Canoe Yes 31.4 40.0 67.2 50.0 55.6
No 68.6 60.0 32.8 50.0 44.4
Bank
savings
Yes 6.3 34.4 48.3 100.0 88.9
No 93.7 65.6 51.7 0.0 11.1
Motorcycle Yes 14.2 56.7 67.2 100.0 55.6
No 85.8 43.3 32.8 0.0 44.4
Fan Yes 9.6 28.9 34.5 75.0 77.8
No 90.4 71.1 65.5 25.0 22.2
Bicycle Yes 64.0 61.1 65.5 0.0 44.4
No 36.0 38.9 34.5 100.0 55.6
Wheel
barrow
Yes 92.5 88.9 94.8 100.0 100.0
No 7.5 11.1 5.2 0.0 0.0
Radio Yes 46.4 80.0 63.8 100.0 11.1
No 53.6 20.0 36.2 0.0 88.9
Others Yes 0.0 4.4 29.3 100.0 44.4
No 100.0 95.6 70.7 0.0 55.6
Access to
credit
Yes 1.7 22.2 20.7 0.0 11.1
No 98.3 77.8 79.3 100.0 88.9
Amenity
Yes
31.4
57.8
74.1
100.0
100.0 Electricity
No 68.6 42.2 25.9 0.0 0.0
Source: Author’s computation, 2017 *means < and ≥
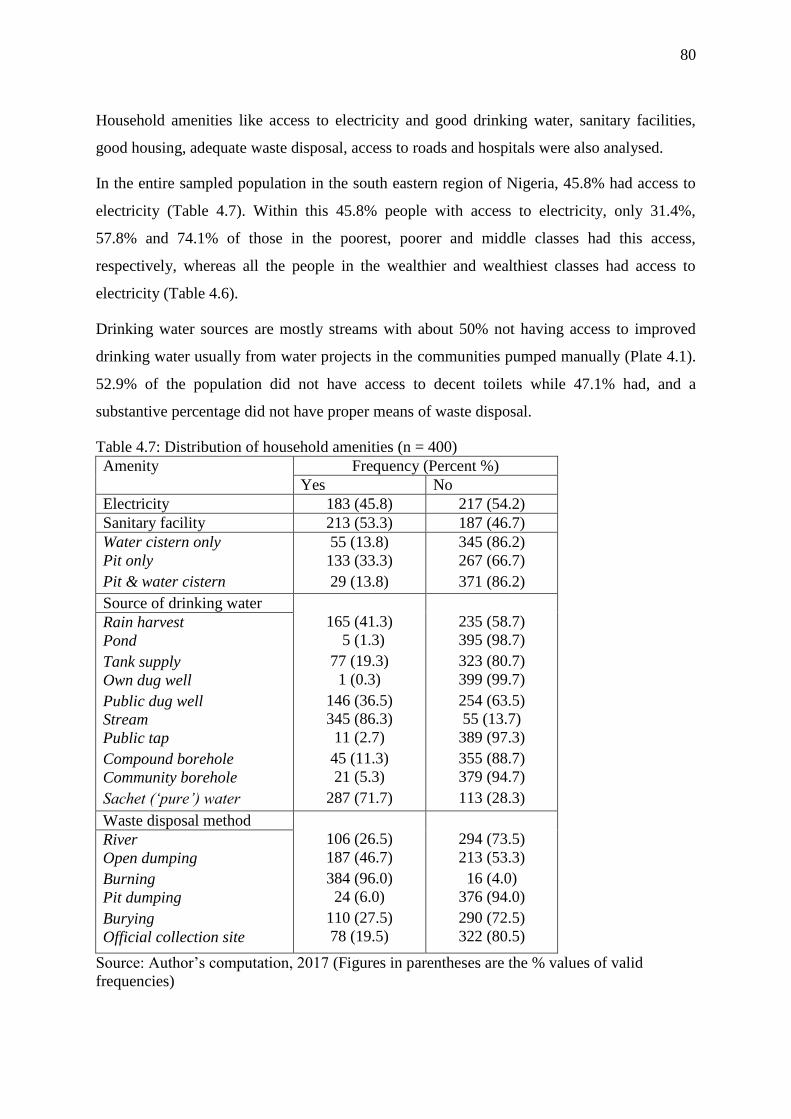
80
Household amenities like access to electricity and good drinking water, sanitary facilities,
good housing, adequate waste disposal, access to roads and hospitals were also analysed.
In the entire sampled population in the south eastern region of Nigeria, 45.8% had access to
electricity (Table 4.7). Within this 45.8% people with access to electricity, only 31.4%,
57.8% and 74.1% of those in the poorest, poorer and middle classes had this access,
respectively, whereas all the people in the wealthier and wealthiest classes had access to
electricity (Table 4.6).
Drinking water sources are mostly streams with about 50% not having access to improved
drinking water usually from water projects in the communities pumped manually (Plate 4.1).
52.9% of the population did not have access to decent toilets while 47.1% had, and a
substantive percentage did not have proper means of waste disposal.
Table 4.7: Distribution of household amenities (n = 400)
Amenity Frequency (Percent %)
Yes No
Electricity 183 (45.8) 217 (54.2)
Sanitary facility 213 (53.3) 187 (46.7)
Water cistern only
Pit only
Pit & water cistern
55 (13.8)
133 (33.3)
29 (13.8)
345 (86.2)
267 (66.7)
371 (86.2)
Source of drinking water
165 (41.3)
5 (1.3)
77 (19.3)
1 (0.3)
146 (36.5)
345 (86.3)
11 (2.7)
45 (11.3)
21 (5.3)
287 (71.7)
235 (58.7)
395 (98.7)
323 (80.7)
399 (99.7)
254 (63.5)
55 (13.7)
389 (97.3)
355 (88.7)
379 (94.7)
113 (28.3)
Rain harvest
Pond
Tank supply
Own dug well
Public dug well
Stream
Public tap
Compound borehole
Community borehole
Sachet (‘pure’) water
Waste disposal method
106 (26.5)
187 (46.7)
384 (96.0)
24 (6.0)
110 (27.5)
78 (19.5)
294 (73.5)
213 (53.3)
16 (4.0)
376 (94.0)
290 (72.5)
322 (80.5)
River
Open dumping
Burning
Pit dumping
Burying
Official collection site
Source: Author’s computation, 2017 (Figures in parentheses are the % values of valid
frequencies)
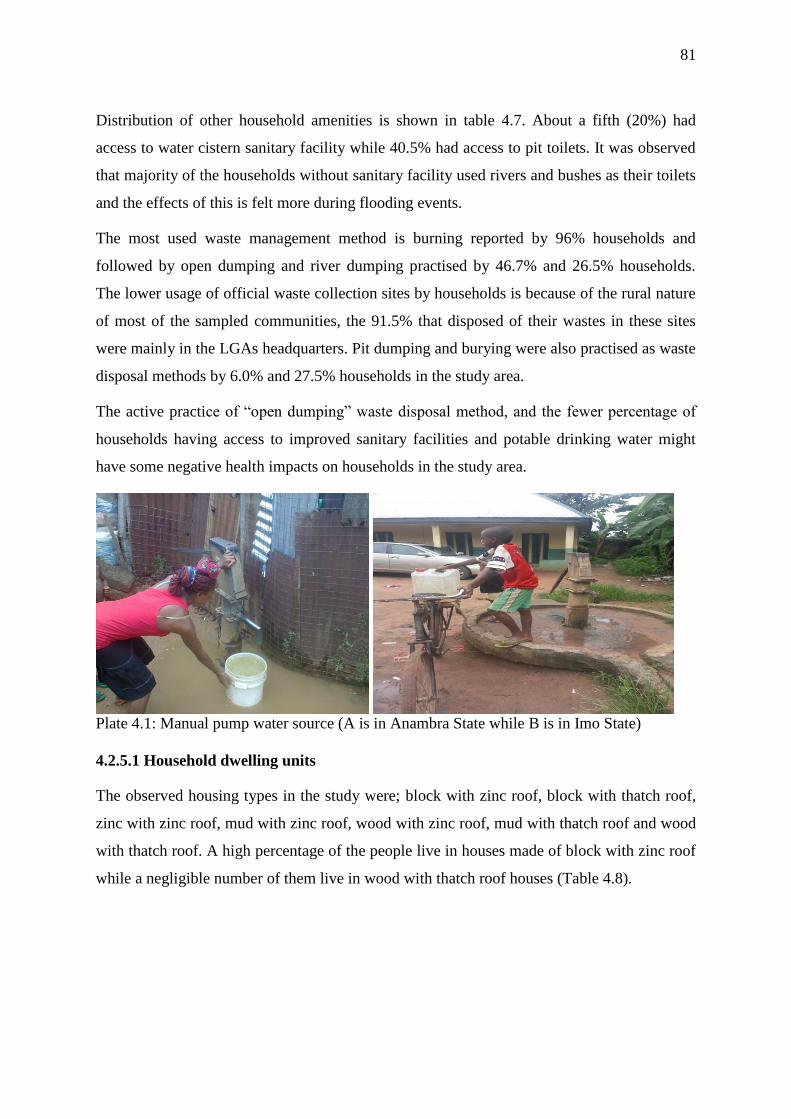
81
Distribution of other household amenities is shown in table 4.7. About a fifth (20%) had
access to water cistern sanitary facility while 40.5% had access to pit toilets. It was observed
that majority of the households without sanitary facility used rivers and bushes as their toilets
and the effects of this is felt more during flooding events.
The most used waste management method is burning reported by 96% households and
followed by open dumping and river dumping practised by 46.7% and 26.5% households.
The lower usage of official waste collection sites by households is because of the rural nature
of most of the sampled communities, the 91.5% that disposed of their wastes in these sites
were mainly in the LGAs headquarters. Pit dumping and burying were also practised as waste
disposal methods by 6.0% and 27.5% households in the study area.
The active practice of “open dumping” waste disposal method, and the fewer percentage of
households having access to improved sanitary facilities and potable drinking water might
have some negative health impacts on households in the study area.
Plate 4.1: Manual pump water source (A is in Anambra State while B is in Imo State)
4.2.5.1 Household dwelling units
The observed housing types in the study were; block with zinc roof, block with thatch roof,
zinc with zinc roof, mud with zinc roof, wood with zinc roof, mud with thatch roof and wood
with thatch roof. A high percentage of the people live in houses made of block with zinc roof
while a negligible number of them live in wood with thatch roof houses (Table 4.8).
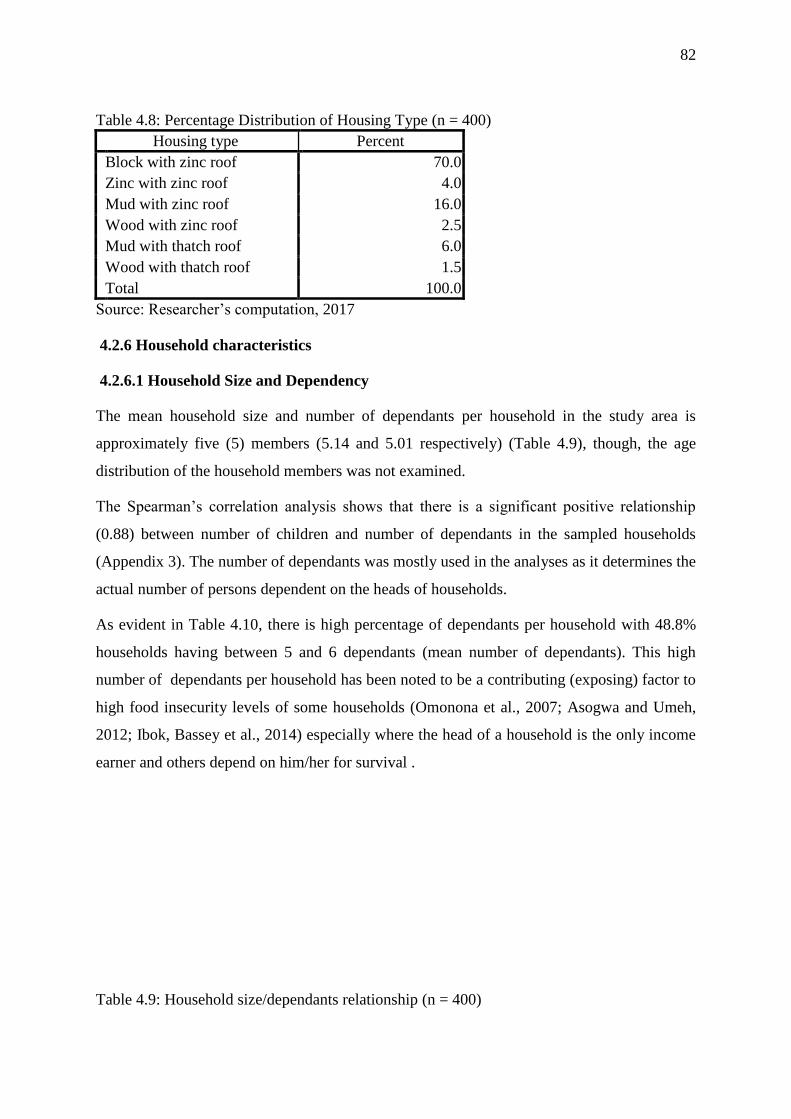
82
Table 4.8: Percentage Distribution of Housing Type (n = 400)
Housing type Percent
Block with zinc roof 70.0
Zinc with zinc roof 4.0
Mud with zinc roof 16.0
Wood with zinc roof 2.5
Mud with thatch roof 6.0
Wood with thatch roof 1.5
Total 100.0
Source: Researcher’s computation, 2017
4.2.6 Household characteristics
4.2.6.1 Household Size and Dependency
The mean household size and number of dependants per household in the study area is
approximately five (5) members (5.14 and 5.01 respectively) (Table 4.9), though, the age
distribution of the household members was not examined.
The Spearman’s correlation analysis shows that there is a significant positive relationship
(0.88) between number of children and number of dependants in the sampled households
(Appendix 3). The number of dependants was mostly used in the analyses as it determines the
actual number of persons dependent on the heads of households.
As evident in Table 4.10, there is high percentage of dependants per household with 48.8%
households having between 5 and 6 dependants (mean number of dependants). This high
number of dependants per household has been noted to be a contributing (exposing) factor to
high food insecurity levels of some households (Omonona et al., 2007; Asogwa and Umeh,
2012; Ibok, Bassey et al., 2014) especially where the head of a household is the only income
earner and others depend on him/her for survival .
Table 4.9: Household size/dependants relationship (n = 400)
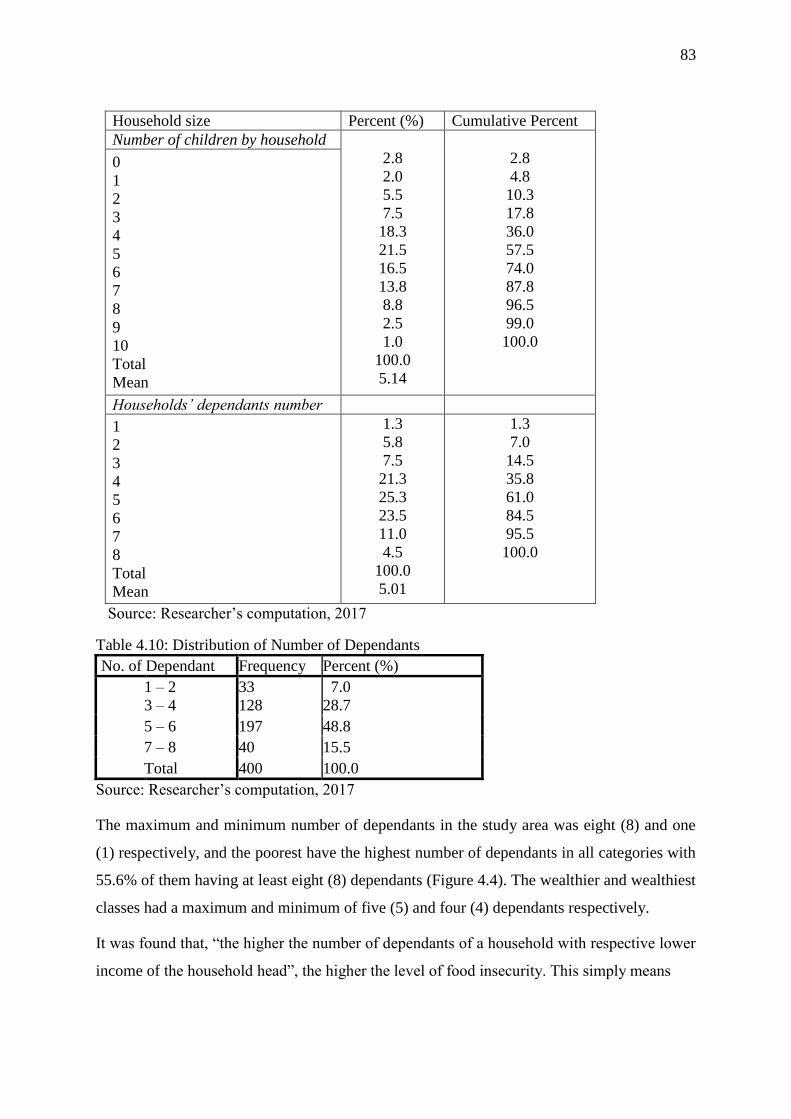
83
Household size Percent (%) Cumulative Percent
Number of children by household
2.8
2.0
5.5
7.5
18.3
21.5
16.5
13.8
8.8
2.5
1.0
100.0
5.14
2.8
4.8
10.3
17.8
36.0
57.5
74.0
87.8
96.5
99.0
100.0
0
1
2
3
4
5
6
7
8
9
10
Total
Mean
Households’ dependants number
1
2
3
4
5
6
7
8
Total
Mean
1.3
5.8
7.5
21.3
25.3
23.5
11.0
4.5
100.0
5.01
1.3
7.0
14.5
35.8
61.0
84.5
95.5
100.0
Source: Researcher’s computation, 2017
Table 4.10: Distribution of Number of Dependants
No. of Dependant Frequency Percent (%)
1 – 2
3 – 4
33
128
7.0
28.7
5 – 6 197 48.8
7 – 8 40 15.5
Total 400 100.0
Source: Researcher’s computation, 2017
The maximum and minimum number of dependants in the study area was eight (8) and one
(1) respectively, and the poorest have the highest number of dependants in all categories with
55.6% of them having at least eight (8) dependants (Figure 4.4). The wealthier and wealthiest
classes had a maximum and minimum of five (5) and four (4) dependants respectively.
It was found that, “the higher the number of dependants of a household with respective lower
income of the household head”, the higher the level of food insecurity. This simply means
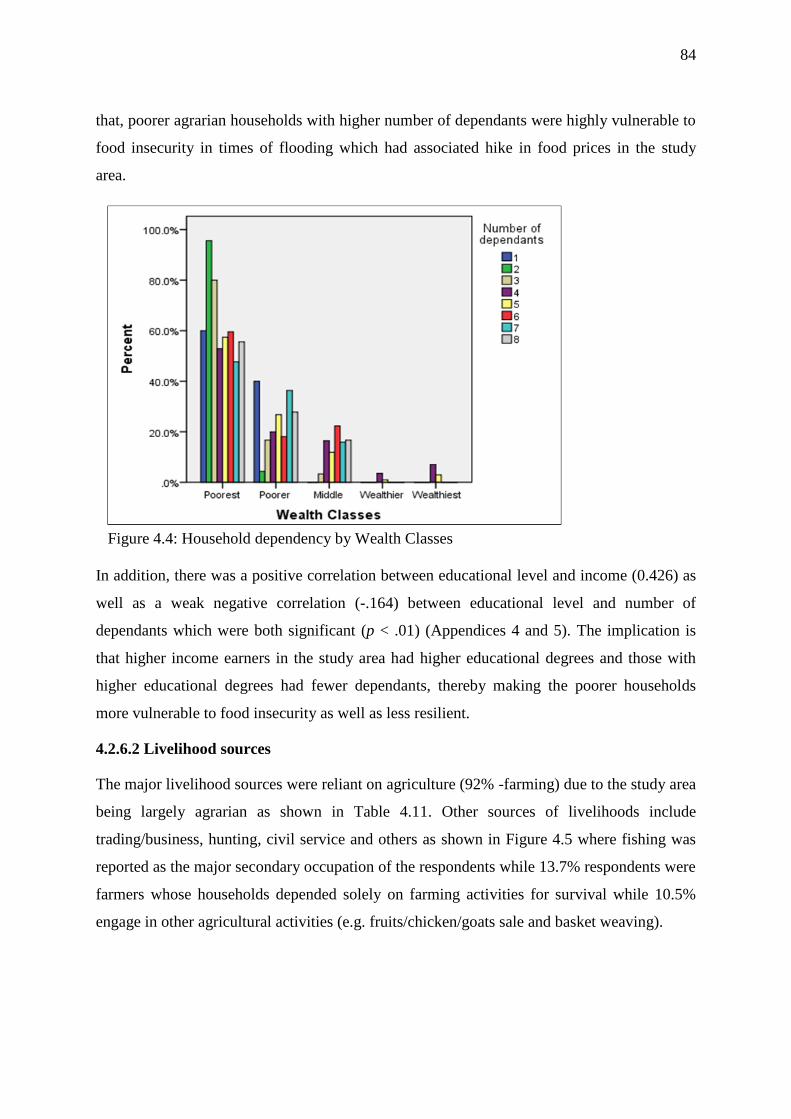
84
that, poorer agrarian households with higher number of dependants were highly vulnerable to
food insecurity in times of flooding which had associated hike in food prices in the study
area.
Figure 4.4: Household dependency by Wealth Classes
In addition, there was a positive correlation between educational level and income (0.426) as
well as a weak negative correlation (-.164) between educational level and number of
dependants which were both significant (p < .01) (Appendices 4 and 5). The implication is
that higher income earners in the study area had higher educational degrees and those with
higher educational degrees had fewer dependants, thereby making the poorer households
more vulnerable to food insecurity as well as less resilient.
4.2.6.2 Livelihood sources
The major livelihood sources were reliant on agriculture (92% -farming) due to the study area
being largely agrarian as shown in Table 4.11. Other sources of livelihoods include
trading/business, hunting, civil service and others as shown in Figure 4.5 where fishing was
reported as the major secondary occupation of the respondents while 13.7% respondents were
farmers whose households depended solely on farming activities for survival while 10.5%
engage in other agricultural activities (e.g. fruits/chicken/goats sale and basket weaving).
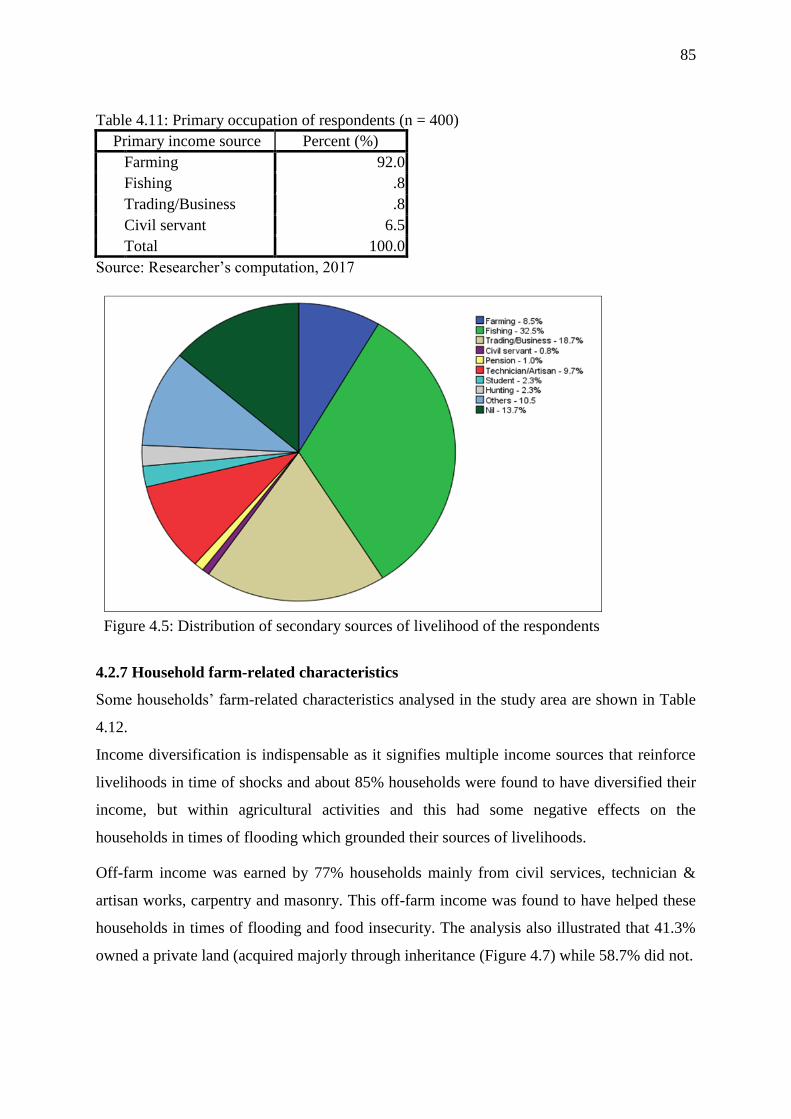
85
Table 4.11: Primary occupation of respondents (n = 400)
Primary income source Percent (%)
Farming 92.0
Fishing .8
Trading/Business .8
Civil servant 6.5
Total 100.0
Source: Researcher’s computation, 2017
Figure 4.5: Distribution of secondary sources of livelihood of the respondents
4.2.7 Household farm-related characteristics
Some households’ farm-related characteristics analysed in the study area are shown in Table
4.12.
Income diversification is indispensable as it signifies multiple income sources that reinforce
livelihoods in time of shocks and about 85% households were found to have diversified their
income, but within agricultural activities and this had some negative effects on the
households in times of flooding which grounded their sources of livelihoods.
Off-farm income was earned by 77% households mainly from civil services, technician &
artisan works, carpentry and masonry. This off-farm income was found to have helped these
households in times of flooding and food insecurity. The analysis also illustrated that 41.3%
owned a private land (acquired majorly through inheritance (Figure 4.7) while 58.7% did not.
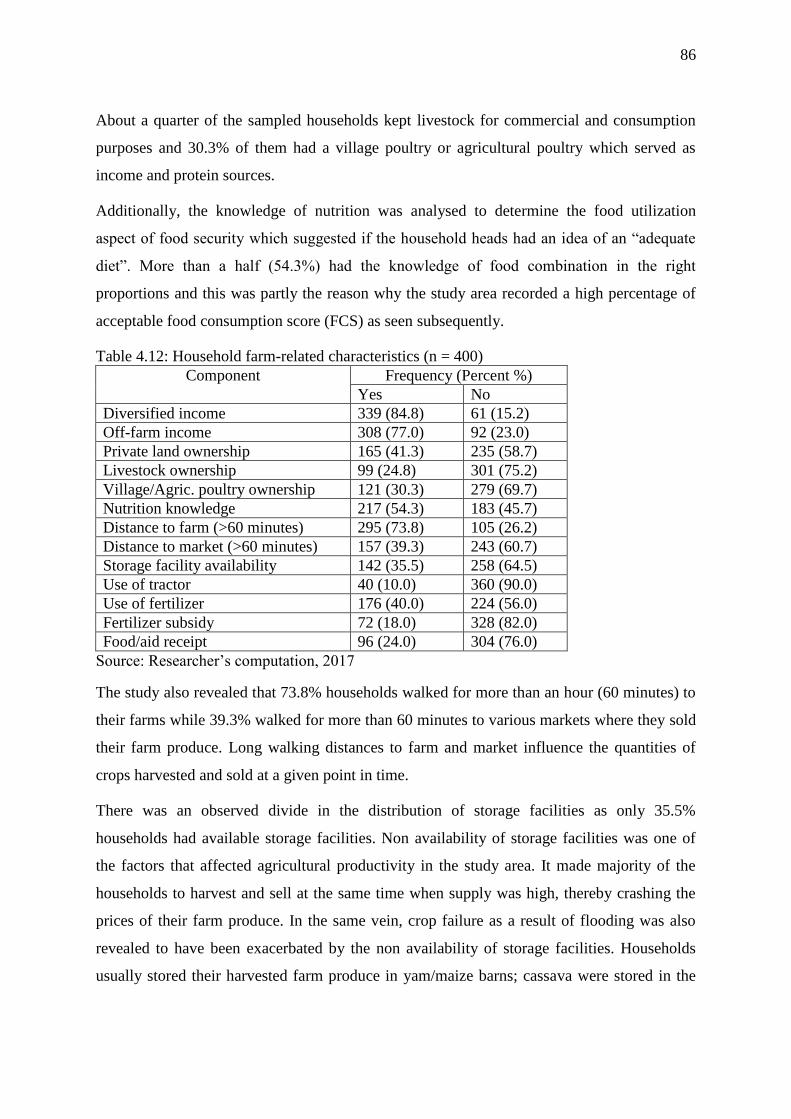
86
About a quarter of the sampled households kept livestock for commercial and consumption
purposes and 30.3% of them had a village poultry or agricultural poultry which served as
income and protein sources.
Additionally, the knowledge of nutrition was analysed to determine the food utilization
aspect of food security which suggested if the household heads had an idea of an “adequate
diet”. More than a half (54.3%) had the knowledge of food combination in the right
proportions and this was partly the reason why the study area recorded a high percentage of
acceptable food consumption score (FCS) as seen subsequently.
Table 4.12: Household farm-related characteristics (n = 400)
Component Frequency (Percent %)
Yes No
Diversified income 339 (84.8) 61 (15.2)
Off-farm income 308 (77.0) 92 (23.0)
Private land ownership 165 (41.3) 235 (58.7)
Livestock ownership 99 (24.8) 301 (75.2)
Village/Agric. poultry ownership 121 (30.3) 279 (69.7)
Nutrition knowledge 217 (54.3) 183 (45.7)
Distance to farm (>60 minutes) 295 (73.8) 105 (26.2)
Distance to market (>60 minutes) 157 (39.3) 243 (60.7)
Storage facility availability 142 (35.5) 258 (64.5)
Use of tractor 40 (10.0) 360 (90.0)
Use of fertilizer 176 (40.0) 224 (56.0)
Fertilizer subsidy 72 (18.0) 328 (82.0)
Food/aid receipt 96 (24.0) 304 (76.0)
Source: Researcher’s computation, 2017
The study also revealed that 73.8% households walked for more than an hour (60 minutes) to
their farms while 39.3% walked for more than 60 minutes to various markets where they sold
their farm produce. Long walking distances to farm and market influence the quantities of
crops harvested and sold at a given point in time.
There was an observed divide in the distribution of storage facilities as only 35.5%
households had available storage facilities. Non availability of storage facilities was one of
the factors that affected agricultural productivity in the study area. It made majority of the
households to harvest and sell at the same time when supply was high, thereby crashing the
prices of their farm produce. In the same vein, crop failure as a result of flooding was also
revealed to have been exacerbated by the non availability of storage facilities. Households
usually stored their harvested farm produce in yam/maize barns; cassava were stored in the
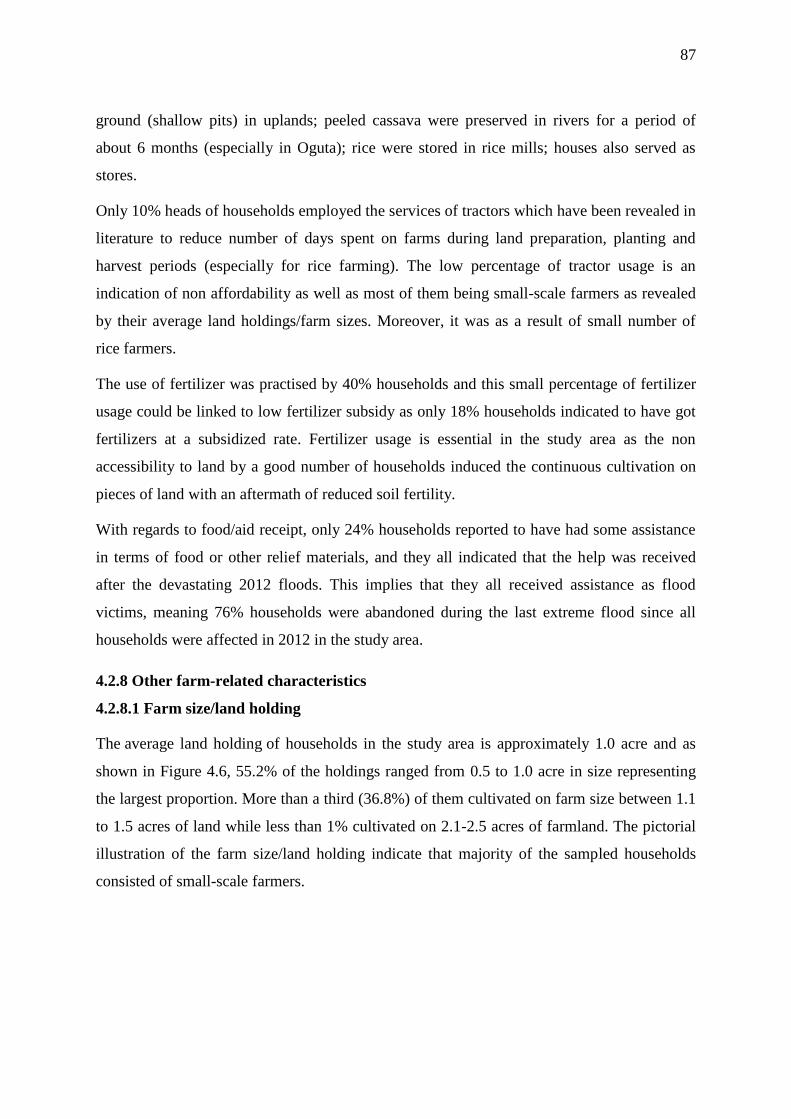
87
ground (shallow pits) in uplands; peeled cassava were preserved in rivers for a period of
about 6 months (especially in Oguta); rice were stored in rice mills; houses also served as
stores.
Only 10% heads of households employed the services of tractors which have been revealed in
literature to reduce number of days spent on farms during land preparation, planting and
harvest periods (especially for rice farming). The low percentage of tractor usage is an
indication of non affordability as well as most of them being small-scale farmers as revealed
by their average land holdings/farm sizes. Moreover, it was as a result of small number of
rice farmers.
The use of fertilizer was practised by 40% households and this small percentage of fertilizer
usage could be linked to low fertilizer subsidy as only 18% households indicated to have got
fertilizers at a subsidized rate. Fertilizer usage is essential in the study area as the non
accessibility to land by a good number of households induced the continuous cultivation on
pieces of land with an aftermath of reduced soil fertility.
With regards to food/aid receipt, only 24% households reported to have had some assistance
in terms of food or other relief materials, and they all indicated that the help was received
after the devastating 2012 floods. This implies that they all received assistance as flood
victims, meaning 76% households were abandoned during the last extreme flood since all
households were affected in 2012 in the study area.
4.2.8 Other farm-related characteristics
4.2.8.1 Farm size/land holding
The average land holding of households in the study area is approximately 1.0 acre and as
shown in Figure 4.6, 55.2% of the holdings ranged from 0.5 to 1.0 acre in size representing
the largest proportion. More than a third (36.8%) of them cultivated on farm size between 1.1
to 1.5 acres of land while less than 1% cultivated on 2.1-2.5 acres of farmland. The pictorial
illustration of the farm size/land holding indicate that majority of the sampled households
consisted of small-scale farmers.
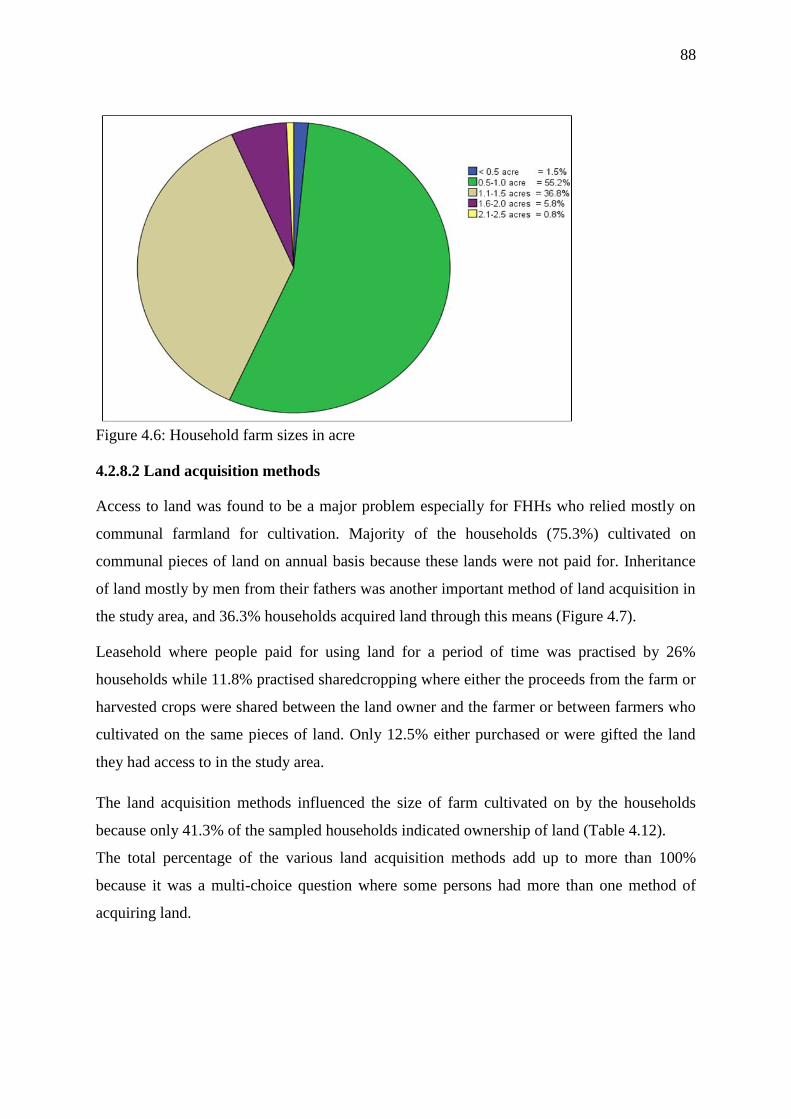
88
Figure 4.6: Household farm sizes in acre
4.2.8.2 Land acquisition methods
Access to land was found to be a major problem especially for FHHs who relied mostly on
communal farmland for cultivation. Majority of the households (75.3%) cultivated on
communal pieces of land on annual basis because these lands were not paid for. Inheritance
of land mostly by men from their fathers was another important method of land acquisition in
the study area, and 36.3% households acquired land through this means (Figure 4.7).
Leasehold where people paid for using land for a period of time was practised by 26%
households while 11.8% practised sharedcropping where either the proceeds from the farm or
harvested crops were shared between the land owner and the farmer or between farmers who
cultivated on the same pieces of land. Only 12.5% either purchased or were gifted the land
they had access to in the study area.
The land acquisition methods influenced the size of farm cultivated on by the households
because only 41.3% of the sampled households indicated ownership of land (Table 4.12).
The total percentage of the various land acquisition methods add up to more than 100%
because it was a multi-choice question where some persons had more than one method of
acquiring land.
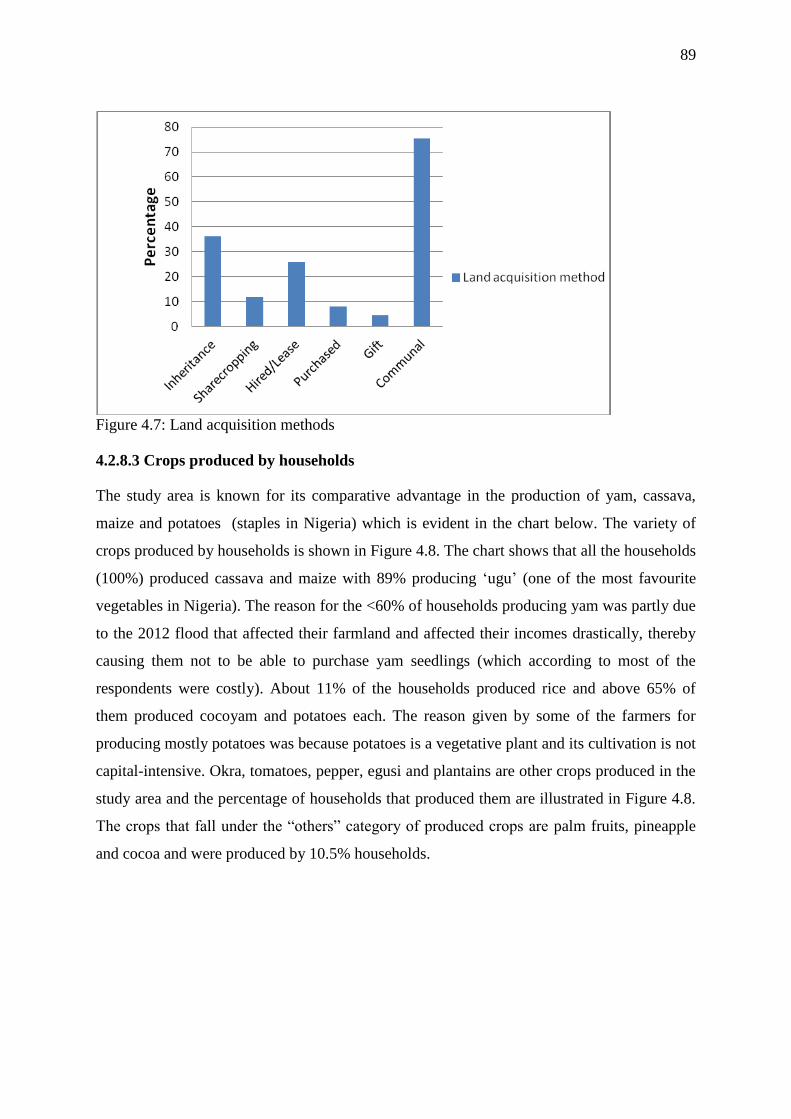
89
Figure 4.7: Land acquisition methods
4.2.8.3 Crops produced by households
The study area is known for its comparative advantage in the production of yam, cassava,
maize and potatoes (staples in Nigeria) which is evident in the chart below. The variety of
crops produced by households is shown in Figure 4.8. The chart shows that all the households
(100%) produced cassava and maize with 89% producing ‘ugu’ (one of the most favourite
vegetables in Nigeria). The reason for the <60% of households producing yam was partly due
to the 2012 flood that affected their farmland and affected their incomes drastically, thereby
causing them not to be able to purchase yam seedlings (which according to most of the
respondents were costly). About 11% of the households produced rice and above 65% of
them produced cocoyam and potatoes each. The reason given by some of the farmers for
producing mostly potatoes was because potatoes is a vegetative plant and its cultivation is not
capital-intensive. Okra, tomatoes, pepper, egusi and plantains are other crops produced in the
study area and the percentage of households that produced them are illustrated in Figure 4.8.
The crops that fall under the “others” category of produced crops are palm fruits, pineapple
and cocoa and were produced by 10.5% households.
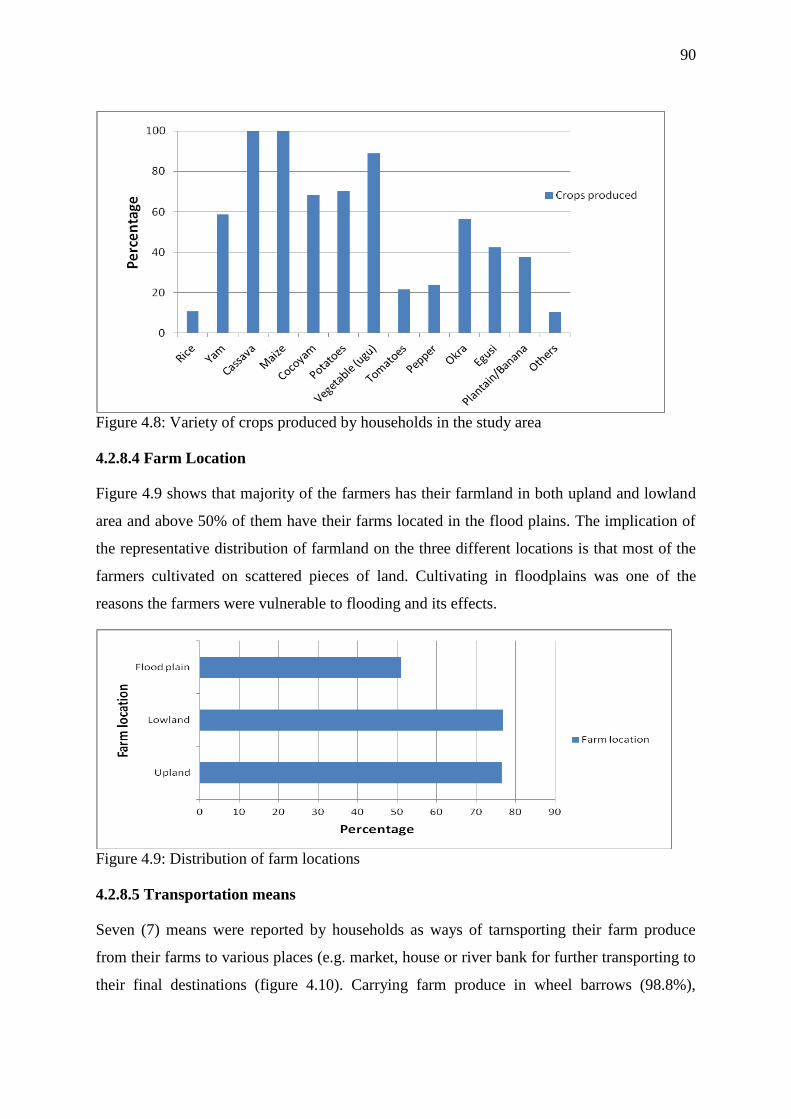
90
Figure 4.8: Variety of crops produced by households in the study area
4.2.8.4 Farm Location
Figure 4.9 shows that majority of the farmers has their farmland in both upland and lowland
area and above 50% of them have their farms located in the flood plains. The implication of
the representative distribution of farmland on the three different locations is that most of the
farmers cultivated on scattered pieces of land. Cultivating in floodplains was one of the
reasons the farmers were vulnerable to flooding and its effects.
Figure 4.9: Distribution of farm locations
4.2.8.5 Transportation means
Seven (7) means were reported by households as ways of tarnsporting their farm produce
from their farms to various places (e.g. market, house or river bank for further transporting to
their final destinations (figure 4.10). Carrying farm produce in wheel barrows (98.8%),
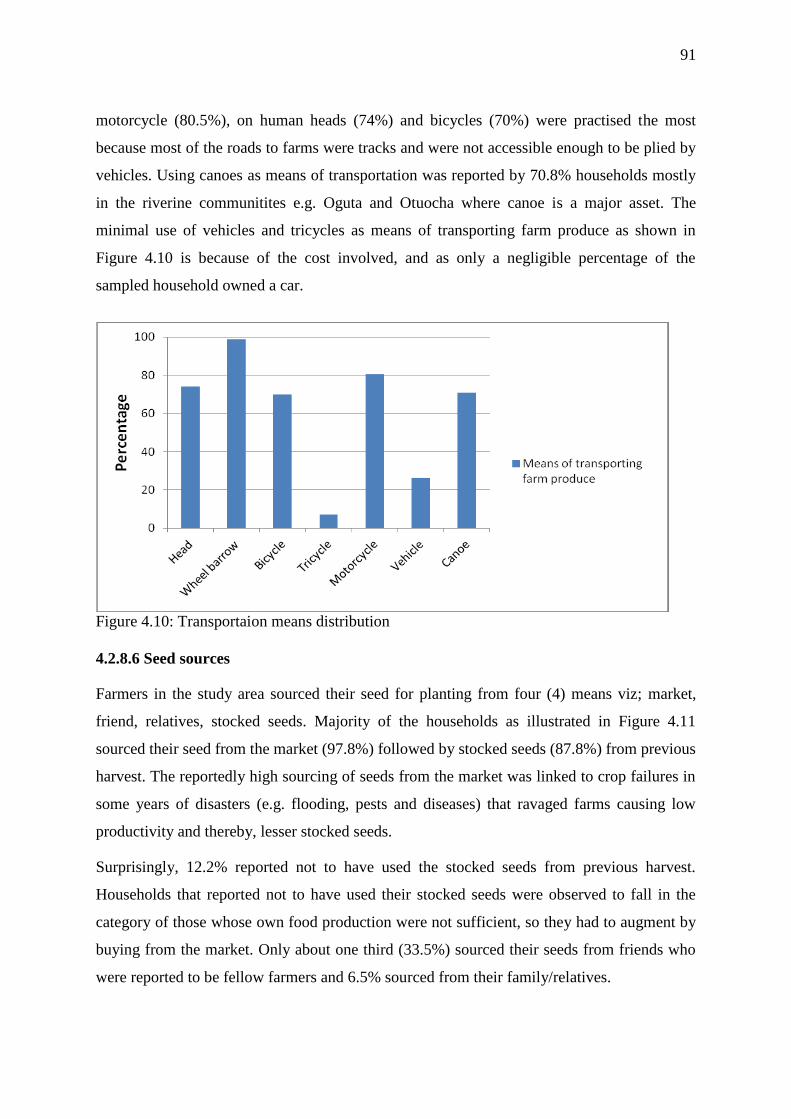
91
motorcycle (80.5%), on human heads (74%) and bicycles (70%) were practised the most
because most of the roads to farms were tracks and were not accessible enough to be plied by
vehicles. Using canoes as means of transportation was reported by 70.8% households mostly
in the riverine communitites e.g. Oguta and Otuocha where canoe is a major asset. The
minimal use of vehicles and tricycles as means of transporting farm produce as shown in
Figure 4.10 is because of the cost involved, and as only a negligible percentage of the
sampled household owned a car.
Figure 4.10: Transportaion means distribution
4.2.8.6 Seed sources
Farmers in the study area sourced their seed for planting from four (4) means viz; market,
friend, relatives, stocked seeds. Majority of the households as illustrated in Figure 4.11
sourced their seed from the market (97.8%) followed by stocked seeds (87.8%) from previous
harvest. The reportedly high sourcing of seeds from the market was linked to crop failures in
some years of disasters (e.g. flooding, pests and diseases) that ravaged farms causing low
productivity and thereby, lesser stocked seeds.
Surprisingly, 12.2% reported not to have used the stocked seeds from previous harvest.
Households that reported not to have used their stocked seeds were observed to fall in the
category of those whose own food production were not sufficient, so they had to augment by
buying from the market. Only about one third (33.5%) sourced their seeds from friends who
were reported to be fellow farmers and 6.5% sourced from their family/relatives.
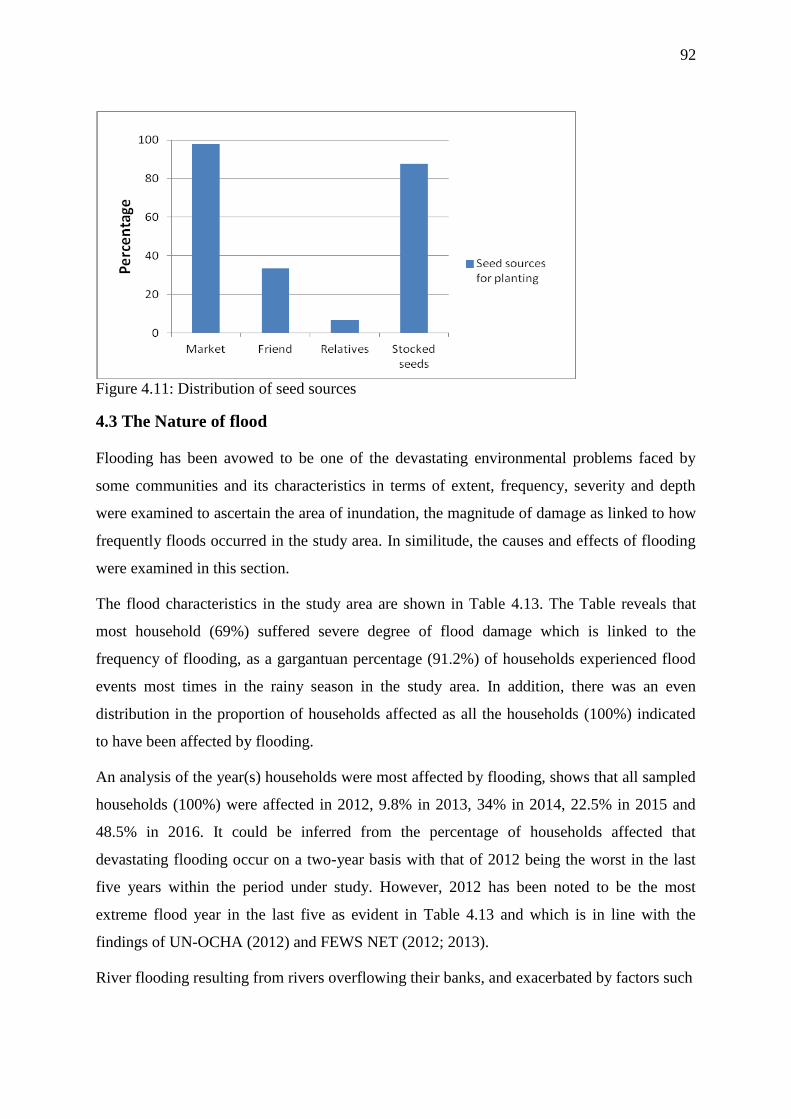
92
Figure 4.11: Distribution of seed sources
4.3 The Nature of flood
Flooding has been avowed to be one of the devastating environmental problems faced by
some communities and its characteristics in terms of extent, frequency, severity and depth
were examined to ascertain the area of inundation, the magnitude of damage as linked to how
frequently floods occurred in the study area. In similitude, the causes and effects of flooding
were examined in this section.
The flood characteristics in the study area are shown in Table 4.13. The Table reveals that
most household (69%) suffered severe degree of flood damage which is linked to the
frequency of flooding, as a gargantuan percentage (91.2%) of households experienced flood
events most times in the rainy season in the study area. In addition, there was an even
distribution in the proportion of households affected as all the households (100%) indicated
to have been affected by flooding.
An analysis of the year(s) households were most affected by flooding, shows that all sampled
households (100%) were affected in 2012, 9.8% in 2013, 34% in 2014, 22.5% in 2015 and
48.5% in 2016. It could be inferred from the percentage of households affected that
devastating flooding occur on a two-year basis with that of 2012 being the worst in the last
five years within the period under study. However, 2012 has been noted to be the most
extreme flood year in the last five as evident in Table 4.13 and which is in line with the
findings of UN-OCHA (2012) and FEWS NET (2012; 2013).
River flooding resulting from rivers overflowing their banks, and exacerbated by factors such
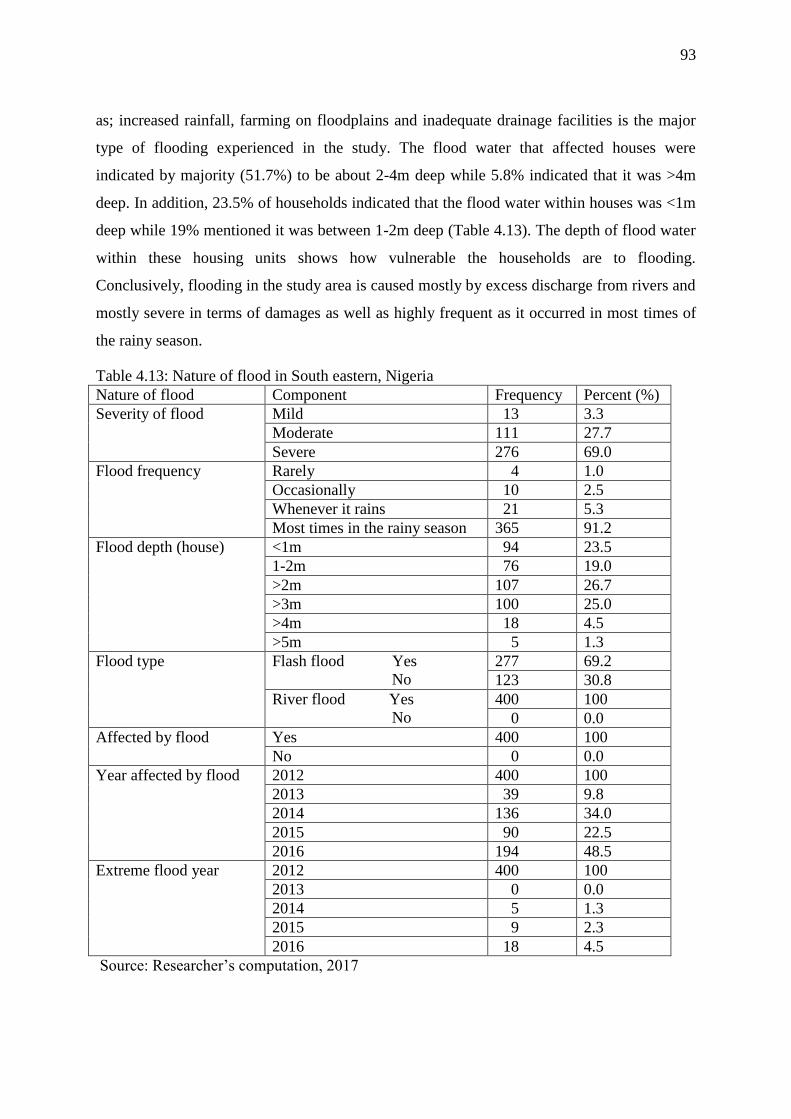
93
as; increased rainfall, farming on floodplains and inadequate drainage facilities is the major
type of flooding experienced in the study. The flood water that affected houses were
indicated by majority (51.7%) to be about 2-4m deep while 5.8% indicated that it was >4m
deep. In addition, 23.5% of households indicated that the flood water within houses was <1m
deep while 19% mentioned it was between 1-2m deep (Table 4.13). The depth of flood water
within these housing units shows how vulnerable the households are to flooding.
Conclusively, flooding in the study area is caused mostly by excess discharge from rivers and
mostly severe in terms of damages as well as highly frequent as it occurred in most times of
the rainy season.
Table 4.13: Nature of flood in South eastern, Nigeria
Nature of flood Component Frequency Percent (%)
Severity of flood Mild 13 3.3
Moderate 111 27.7
Severe 276 69.0
Flood frequency Rarely 4 1.0
Occasionally 10 2.5
Whenever it rains 21 5.3
Most times in the rainy season 365 91.2
Flood depth (house) <1m 94 23.5
1-2m 76 19.0
>2m 107 26.7
>3m 100 25.0
>4m 18 4.5
>5m 5 1.3
Flood type Flash flood Yes
No
277 69.2
123 30.8
River flood Yes
No
400 100
0 0.0
Affected by flood Yes 400 100
No 0 0.0
Year affected by flood 2012 400 100
2013 39 9.8
2014 136 34.0
2015 90 22.5
2016 194 48.5
Extreme flood year 2012 400 100
2013 0 0.0
2014 5 1.3
2015 9 2.3
2016 18 4.5
Source: Researcher’s computation, 2017
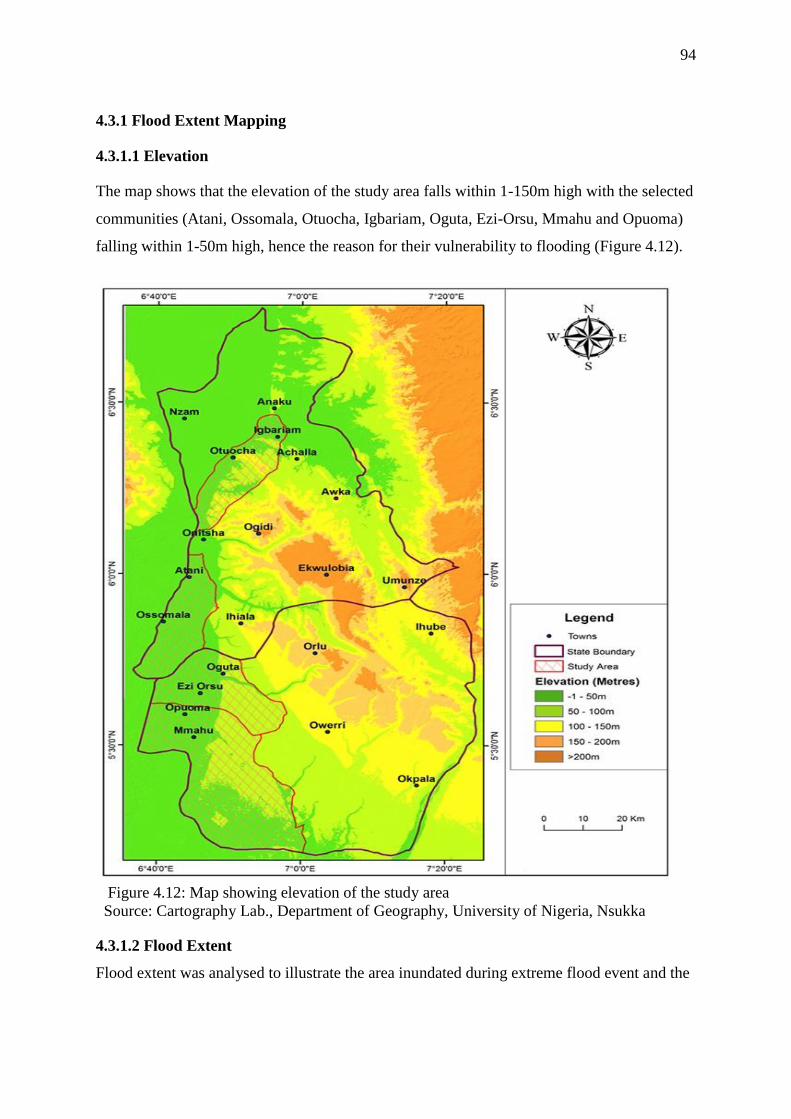
94
4.3.1 Flood Extent Mapping
4.3.1.1 Elevation
The map shows that the elevation of the study area falls within 1-150m high with the selected
communities (Atani, Ossomala, Otuocha, Igbariam, Oguta, Ezi-Orsu, Mmahu and Opuoma)
falling within 1-50m high, hence the reason for their vulnerability to flooding (Figure 4.12).
Figure 4.12: Map showing elevation of the study area
Source: Cartography Lab., Department of Geography, University of Nigeria, Nsukka
4.3.1.2 Flood Extent
Flood extent was analysed to illustrate the area inundated during extreme flood event and the
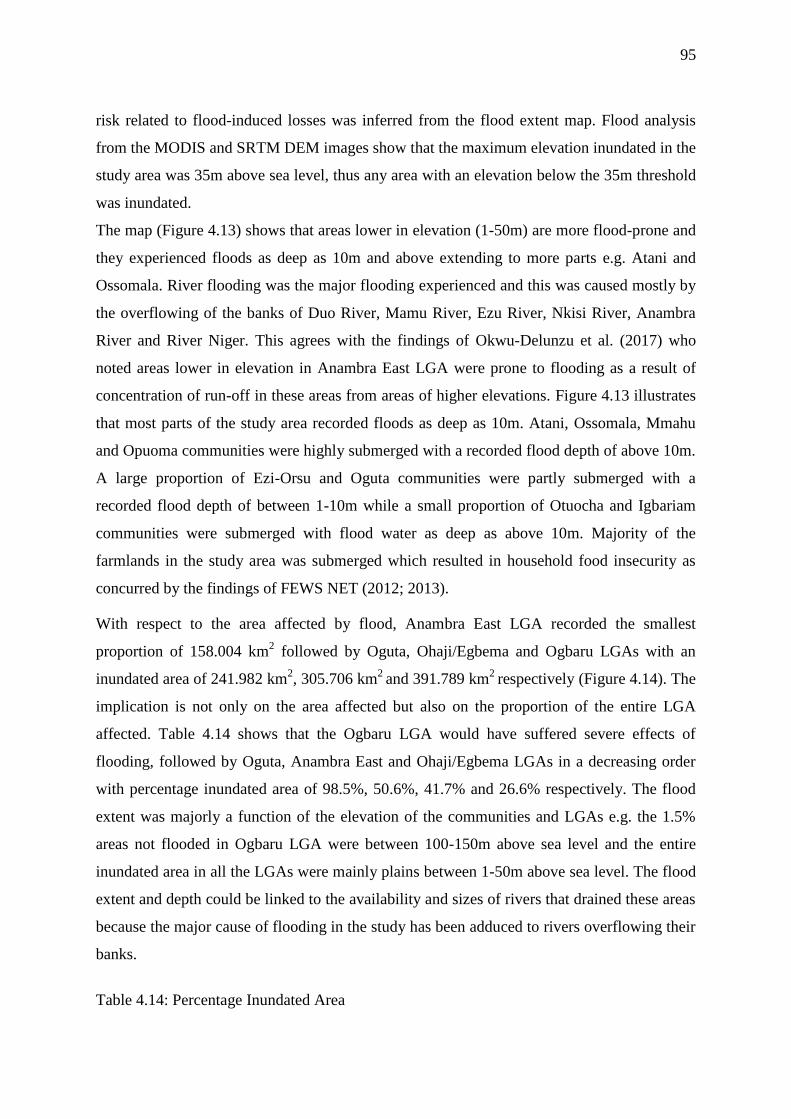
95
risk related to flood-induced losses was inferred from the flood extent map. Flood analysis
from the MODIS and SRTM DEM images show that the maximum elevation inundated in the
study area was 35m above sea level, thus any area with an elevation below the 35m threshold
was inundated.
The map (Figure 4.13) shows that areas lower in elevation (1-50m) are more flood-prone and
they experienced floods as deep as 10m and above extending to more parts e.g. Atani and
Ossomala. River flooding was the major flooding experienced and this was caused mostly by
the overflowing of the banks of Duo River, Mamu River, Ezu River, Nkisi River, Anambra
River and River Niger. This agrees with the findings of Okwu-Delunzu et al. (2017) who
noted areas lower in elevation in Anambra East LGA were prone to flooding as a result of
concentration of run-off in these areas from areas of higher elevations. Figure 4.13 illustrates
that most parts of the study area recorded floods as deep as 10m. Atani, Ossomala, Mmahu
and Opuoma communities were highly submerged with a recorded flood depth of above 10m.
A large proportion of Ezi-Orsu and Oguta communities were partly submerged with a
recorded flood depth of between 1-10m while a small proportion of Otuocha and Igbariam
communities were submerged with flood water as deep as above 10m. Majority of the
farmlands in the study area was submerged which resulted in household food insecurity as
concurred by the findings of FEWS NET (2012; 2013).
With respect to the area affected by flood, Anambra East LGA recorded the smallest
proportion of 158.004 km2 followed by Oguta, Ohaji/Egbema and Ogbaru LGAs with an
inundated area of 241.982 km2, 305.706 km
2 and 391.789 km
2 respectively (Figure 4.14). The
implication is not only on the area affected but also on the proportion of the entire LGA
affected. Table 4.14 shows that the Ogbaru LGA would have suffered severe effects of
flooding, followed by Oguta, Anambra East and Ohaji/Egbema LGAs in a decreasing order
with percentage inundated area of 98.5%, 50.6%, 41.7% and 26.6% respectively. The flood
extent was majorly a function of the elevation of the communities and LGAs e.g. the 1.5%
areas not flooded in Ogbaru LGA were between 100-150m above sea level and the entire
inundated area in all the LGAs were mainly plains between 1-50m above sea level. The flood
extent and depth could be linked to the availability and sizes of rivers that drained these areas
because the major cause of flooding in the study has been adduced to rivers overflowing their
banks.
Table 4.14: Percentage Inundated Area
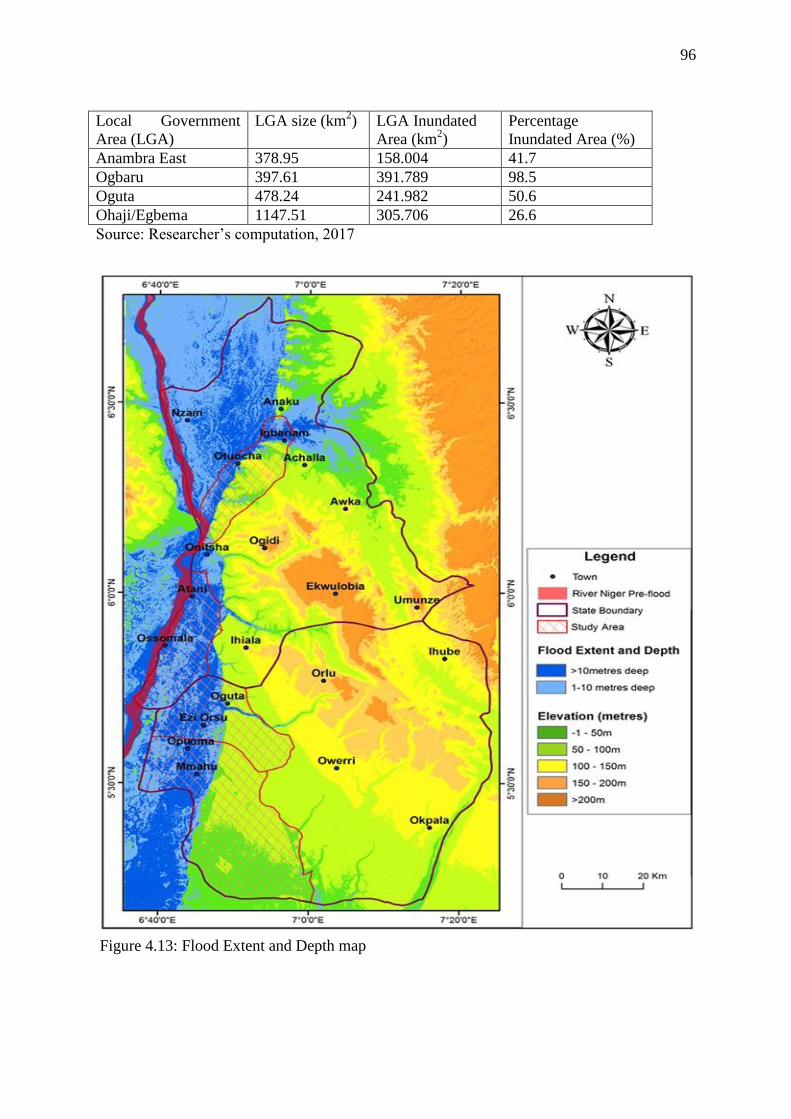
96
Local Government
Area (LGA)
LGA size (km2) LGA Inundated
Area (km2)
Percentage
Inundated Area (%)
Anambra East 378.95 158.004 41.7
Ogbaru 397.61 391.789 98.5
Oguta 478.24 241.982 50.6
Ohaji/Egbema 1147.51 305.706 26.6
Source: Researcher’s computation, 2017
Figure 4.13: Flood Extent and Depth map
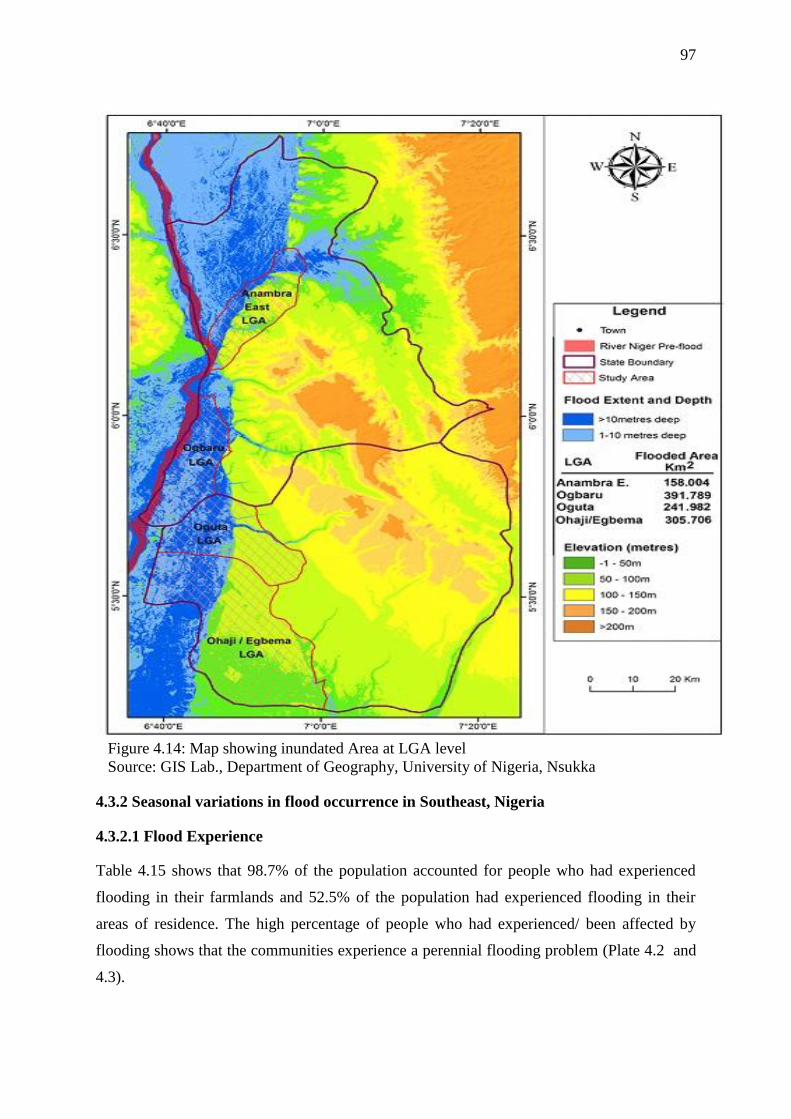
97
Figure 4.14: Map showing inundated Area at LGA level
Source: GIS Lab., Department of Geography, University of Nigeria, Nsukka
4.3.2 Seasonal variations in flood occurrence in Southeast, Nigeria
4.3.2.1 Flood Experience
Table 4.15 shows that 98.7% of the population accounted for people who had experienced
flooding in their farmlands and 52.5% of the population had experienced flooding in their
areas of residence. The high percentage of people who had experienced/ been affected by
flooding shows that the communities experience a perennial flooding problem (Plate 4.2 and
4.3).
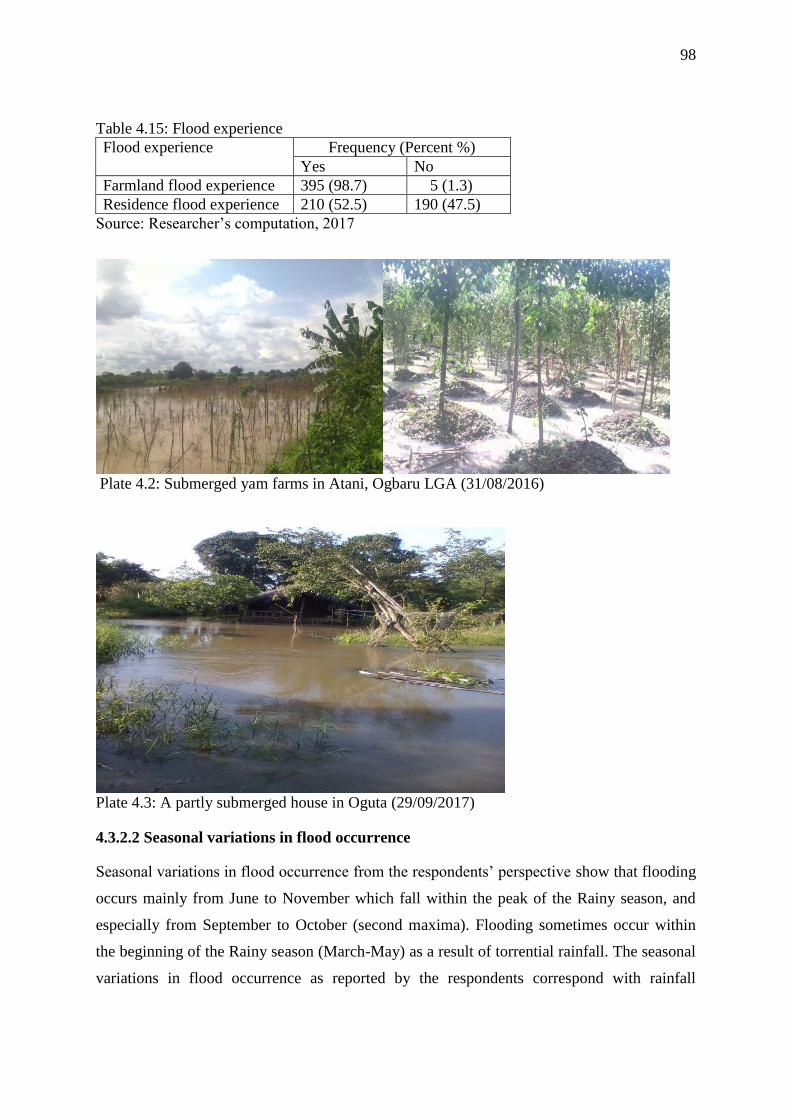
98
Table 4.15: Flood experience
Flood experience Frequency (Percent %)
Yes No
Farmland flood experience 395 (98.7) 5 (1.3)
Residence flood experience 210 (52.5) 190 (47.5)
Source: Researcher’s computation, 2017
Plate 4.2: Submerged yam farms in Atani, Ogbaru LGA (31/08/2016)
Plate 4.3: A partly submerged house in Oguta (29/09/2017)
4.3.2.2 Seasonal variations in flood occurrence
Seasonal variations in flood occurrence from the respondents’ perspective show that flooding
occurs mainly from June to November which fall within the peak of the Rainy season, and
especially from September to October (second maxima). Flooding sometimes occur within
the beginning of the Rainy season (March-May) as a result of torrential rainfall. The seasonal
variations in flood occurrence as reported by the respondents correspond with rainfall

99
variability over the study area as analysed from a 40-year rainfall data (1974-2013) collected
from NIMET, Lagos (Figure 4.15), which shows that maximum rainfall are received between
May and October. Since flooding occurred mostly during the harvest season of most crops,
harvest and productivity are negatively affected.
Table 4.16: Seasonal variation in flood occurrence
Flood occurrence month Frequency (Percent %)
Yes No
March – May 24 (6) 376 (94)
June – August 223 (55.7) 177 (44.3)
September – November 390 (97.5) 10 (2.5)
December – February 0 (0.0) 400 (100)
Source: Researcher’s computation, 2017
Fig.4.15: Mean Monthly Rainfall over Oguta Mean Monthly Rainfall over Anambra
and Ohaji/Egbema LGAs (in mm) East and Ogbaru LGAs (in mm)
4.3.3 Rainfall Trends over Southeastern Nigeria
The annual total rainfall as well as the mean annual rainfall from 1974 to 2013 were analysed
to determine rainfall variability over a 40-year period in the study area with the rainfall data
collected from NIMET, Lagos (Appendix 6). The rainfall curves (Figures 4.16 to 4.19)
indicate variability in rainfall over the four LGAs. Within the period under study, Anambra
East and Ogbaru LGAs received the highest annual rainfall (2924.3mm) with an annual mean
of 243.69mm in 2011 while Oguta and Ohaji/Egbema LGAs recorded their maximum annual
rainfall of 3209.1mm in 2006, with a mean of 267.43mm. On the other hand, Anambra East
and Ogbaru LGAs received their minimum annual rainfall of 861.3mm and a surprising low
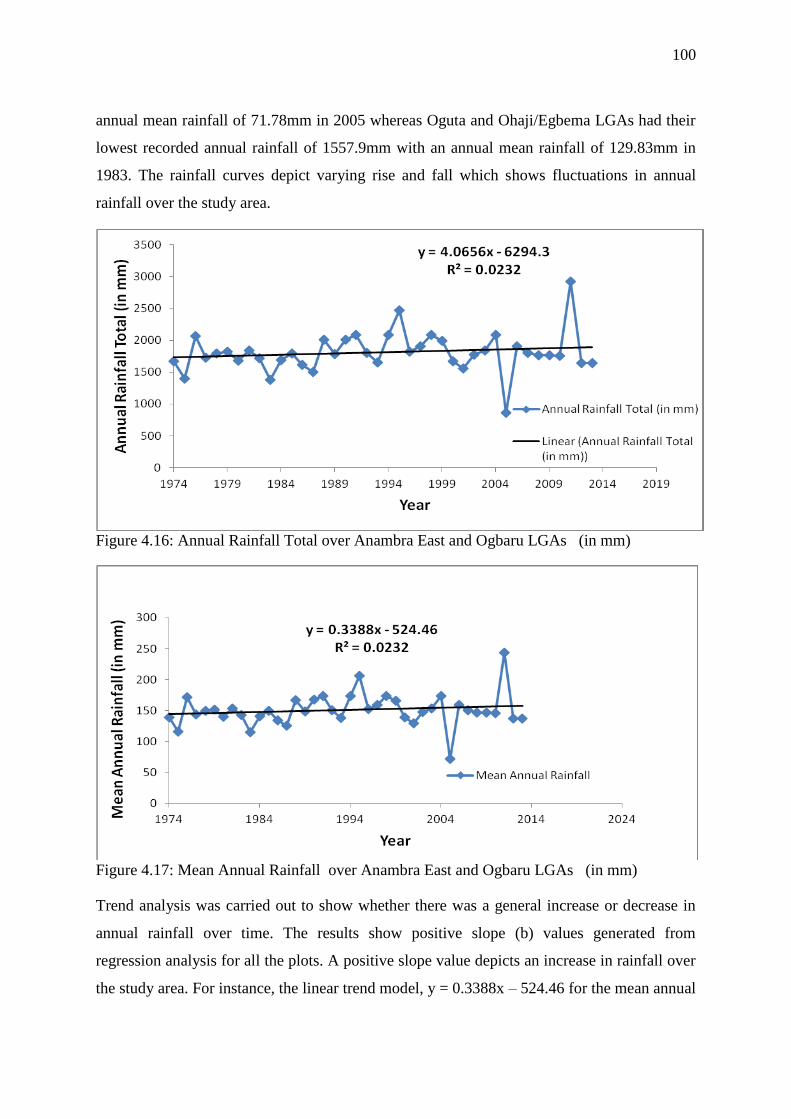
100
annual mean rainfall of 71.78mm in 2005 whereas Oguta and Ohaji/Egbema LGAs had their
lowest recorded annual rainfall of 1557.9mm with an annual mean rainfall of 129.83mm in
1983. The rainfall curves depict varying rise and fall which shows fluctuations in annual
rainfall over the study area.
Figure 4.16: Annual Rainfall Total over Anambra East and Ogbaru LGAs (in mm)
Figure 4.17: Mean Annual Rainfall over Anambra East and Ogbaru LGAs (in mm)
Trend analysis was carried out to show whether there was a general increase or decrease in
annual rainfall over time. The results show positive slope (b) values generated from
regression analysis for all the plots. A positive slope value depicts an increase in rainfall over
the study area. For instance, the linear trend model, y = 0.3388x – 524.46 for the mean annual
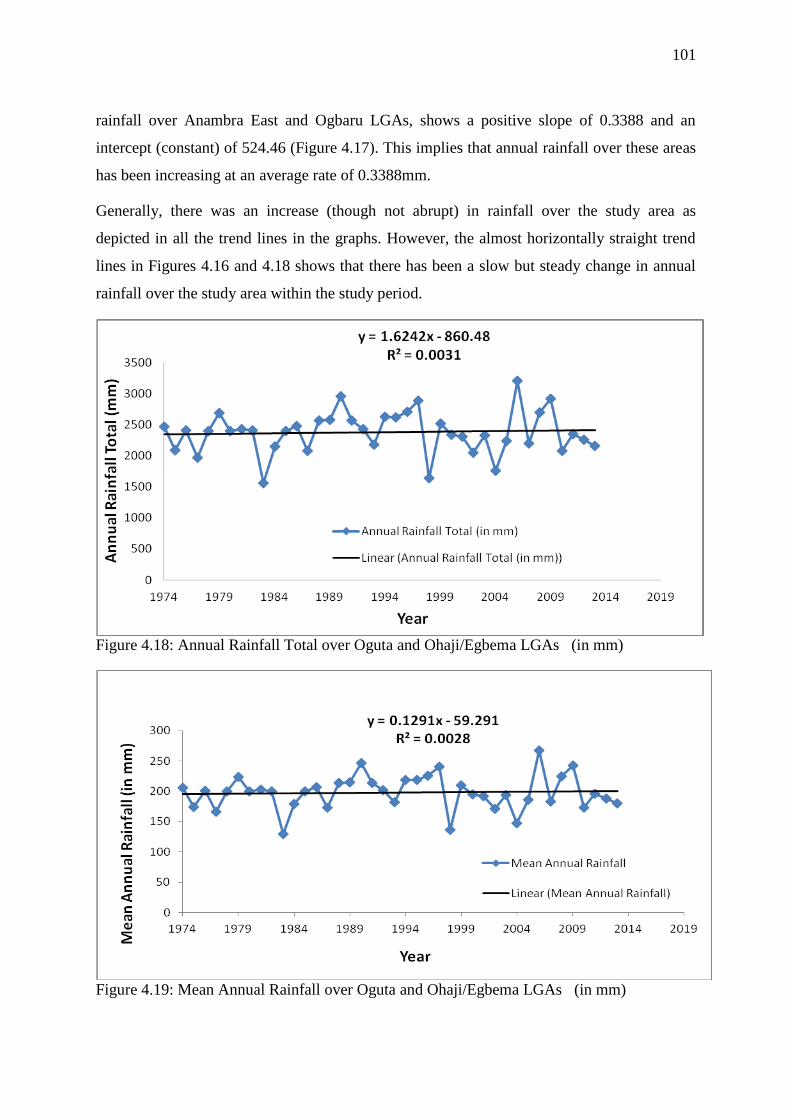
101
rainfall over Anambra East and Ogbaru LGAs, shows a positive slope of 0.3388 and an
intercept (constant) of 524.46 (Figure 4.17). This implies that annual rainfall over these areas
has been increasing at an average rate of 0.3388mm.
Generally, there was an increase (though not abrupt) in rainfall over the study area as
depicted in all the trend lines in the graphs. However, the almost horizontally straight trend
lines in Figures 4.16 and 4.18 shows that there has been a slow but steady change in annual
rainfall over the study area within the study period.
Figure 4.18: Annual Rainfall Total over Oguta and Ohaji/Egbema LGAs (in mm)
Figure 4.19: Mean Annual Rainfall over Oguta and Ohaji/Egbema LGAs (in mm)

102
4.3.4 Respondents’ Perception of Causes of Flooding
The respondents identified eight (8) factors influencing flooding and their analysis shows that
heavy rainfall is perceived to be the major cause of flooding with 99.2% respondents
agreeing to it (Table 4.17). This is true since the study area receives an annual rainfall amount
of about 1800mm, and several studies have adduced increased rainfall to cause flooding as
concurred by Akinsanola and Ogunjobi (2014).
Table 4.17: Households’ perceived causes of flooding (n =400)
Cause of flooding Percent (%)
Yes No
Heavy rainfall 99.2 0.8
Excess river discharge 85.0 15.0
Flat terrain (low topography) 36.8 63.2
Climate change 52.0 48.0
Building/farming on floodplains 59.0 41.0
Wrath of God 10.3 89.7
Impervious surfaces 22.3 77.7
Lack of gutters 44.5 55.5
Source: Researcher’s computation, 2017
Flooding is perceived to be influenced by heavy rainfall and occurs whenever the
precipitation rate exceeds that of infiltration and surface evacuation by available drainage
facilities and rivers.
The next perceived significant cause of flooding is excess river discharge as indicated by
85% respondents. River flooding was the major form of flooding experienced in the study
area and it occurred usually when rivers overflow their banks due to increased volume of
water reaching the rivers at a point in time, thereby exceeding the rivers capacities.
A substantial number (59%) indicated that building/farming on floodplains caused flooding
while 52% noted that flooding was caused by climate change. Building houses/farming in
floodplains alter natural water channels which causes flooding.
Lack of gutters, flat terrain, impervious surfaces and wrath of God were indicated by 44.5%,
36.8%, 22.3% and 10.3% respectively respondents as causes of flooding. Inadequacy of
drainage facilities (e.g. gutters) and impervious surface cause flooding because they lead to
accumulated surface run-off which is generated faster than they are evacuated.
The study area is generally plains and vulnerable to flooding, thus the reason that flat terrain
(low topography) formed one of the major causes of flooding. Flat terrain is exacerbated by
103
heavy rainfall and inadequate drainage facilities because the rate of evacuation of excess run-
off is often slower in areas with flat terrain than when the slopes are pronounced.
Paradoxically, some respondents still believe that flooding is a wrath of God because they
believed that God is punishing them for something they could not explain. According to Jude
Okafor, a 46-year old man in Ugada Oguta in 2016, “I have never seen this kind of flooding
in my lifetime, even my great grandparents, I believed never experienced this kind. I think
God is angry with us for the bad things we have been doing, so He decided to punish us with
that kind of flooding that took virtually everything we had worked for.”
However, heavy rainfall was noted to be the major cause of flooding as it exacerbated the
degree of influence of the other factors that caused flooding in the study area.
4.3.5 Effects of flooding
The effects of flooding in Nigeria had been extensively studied and the findings of effects of
flooding in south eastern Nigeria are in tandem with those of Folorunsho and Awosika
(2001); Ologunorisa (2004); Jeb and Aggarwal (2008); Ogba and Utang (2008); Adeloye and
Rustum (2011); Etuonovbe (2011); Olorunfemi (2011); Odufuwa et al. (2012); Duru and
Chibo (2014) and Adewuyi and Olofin (2014).
The result shows that the effects of flooding in the study area range from physical, economic
to emotional as shown in the Table 4.18. The reported effects of flooding in the study area
shows that majority (93.3%) of households have had their farmlands destroyed as a result of
flooding and 97.7% of them had experienced stream pollution after flood episodes. Flood-
induced stream pollution is one of the intractable effects of flooding in the study area because
a substantial proportion of households get their drinking water from streams. The study also
found out that flooding had affected the income earning sources of 92.7% households which
consequently led to majority of them (88.3%) having suffered from emotional trauma.
However, disease outbreak such as cholera had been experienced in more than one-third of
the sampled households’ sequel to flooding. In the same vein, abandonment of property
especially farmlands due to flooding were indicated by 30.3% respondents.
8.5% households had lost relatives in times of flooding and it was found out that those who
lost their lives either were drowned, were bitten by animals like snakes and crocodiles or
committed suicide after they lost their farmlands to flooding. Loss of household property and
livestock (including fish ponds) were also noted as effects of flooding with 17.7% and 20%
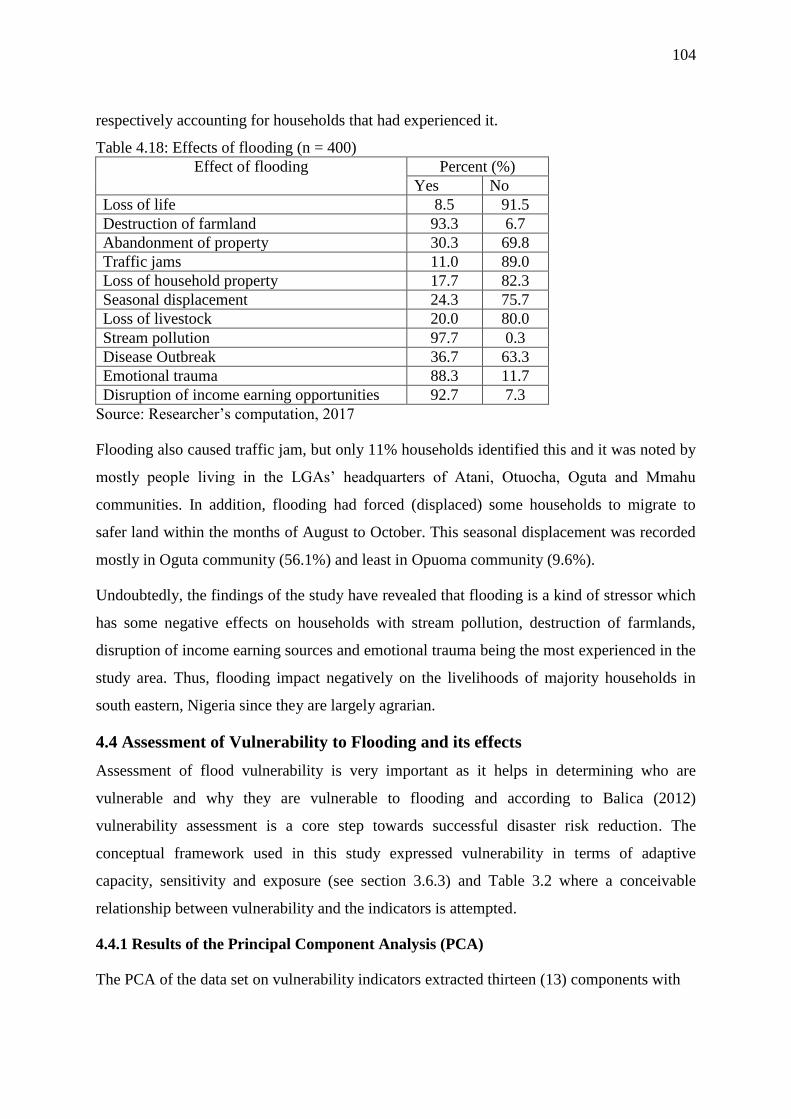
104
respectively accounting for households that had experienced it.
Table 4.18: Effects of flooding (n = 400)
Effect of flooding Percent (%)
Yes No
Loss of life 8.5 91.5
Destruction of farmland 93.3 6.7
Abandonment of property 30.3 69.8
Traffic jams 11.0 89.0
Loss of household property 17.7 82.3
Seasonal displacement 24.3 75.7
Loss of livestock 20.0 80.0
Stream pollution 97.7 0.3
Disease Outbreak 36.7 63.3
Emotional trauma 88.3 11.7
Disruption of income earning opportunities 92.7 7.3
Source: Researcher’s computation, 2017
Flooding also caused traffic jam, but only 11% households identified this and it was noted by
mostly people living in the LGAs’ headquarters of Atani, Otuocha, Oguta and Mmahu
communities. In addition, flooding had forced (displaced) some households to migrate to
safer land within the months of August to October. This seasonal displacement was recorded
mostly in Oguta community (56.1%) and least in Opuoma community (9.6%).
Undoubtedly, the findings of the study have revealed that flooding is a kind of stressor which
has some negative effects on households with stream pollution, destruction of farmlands,
disruption of income earning sources and emotional trauma being the most experienced in the
study area. Thus, flooding impact negatively on the livelihoods of majority households in
south eastern, Nigeria since they are largely agrarian.
4.4 Assessment of Vulnerability to Flooding and its effects
Assessment of flood vulnerability is very important as it helps in determining who are
vulnerable and why they are vulnerable to flooding and according to Balica (2012)
vulnerability assessment is a core step towards successful disaster risk reduction. The
conceptual framework used in this study expressed vulnerability in terms of adaptive
capacity, sensitivity and exposure (see section 3.6.3) and Table 3.2 where a conceivable
relationship between vulnerability and the indicators is attempted.
4.4.1 Results of the Principal Component Analysis (PCA)
The PCA of the data set on vulnerability indicators extracted thirteen (13) components with
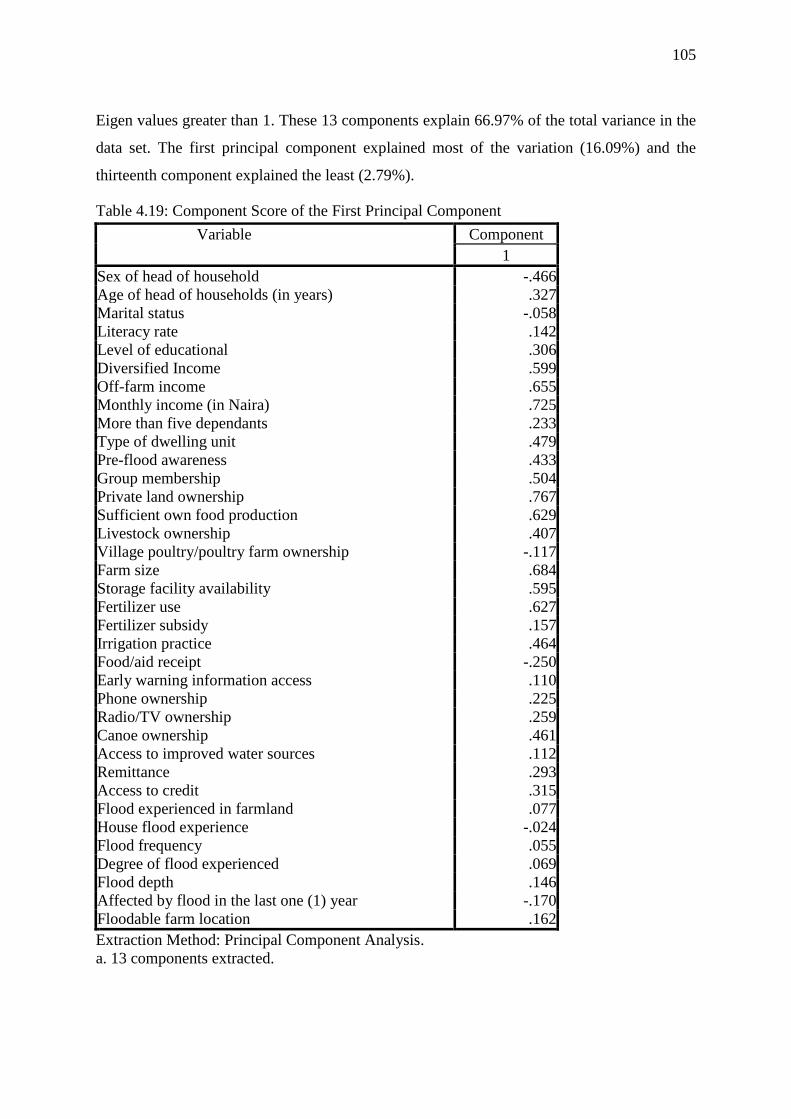
105
Eigen values greater than 1. These 13 components explain 66.97% of the total variance in the
data set. The first principal component explained most of the variation (16.09%) and the
thirteenth component explained the least (2.79%).
Table 4.19: Component Score of the First Principal Component
Variable Component
1
Sex of head of household -.466
Age of head of households (in years) .327
Marital status -.058
Literacy rate .142
Level of educational .306
Diversified Income .599
Off-farm income .655
Monthly income (in Naira) .725
More than five dependants .233
Type of dwelling unit .479
Pre-flood awareness .433
Group membership .504
Private land ownership .767
Sufficient own food production .629
Livestock ownership .407
Village poultry/poultry farm ownership -.117
Farm size .684
Storage facility availability .595
Fertilizer use .627
Fertilizer subsidy .157
Irrigation practice .464
Food/aid receipt -.250
Early warning information access .110
Phone ownership .225
Radio/TV ownership .259
Canoe ownership .461
Access to improved water sources .112
Remittance .293
Access to credit .315
Flood experienced in farmland .077
House flood experience -.024
Flood frequency .055
Degree of flood experienced .069
Flood depth .146
Affected by flood in the last one (1) year -.170
Floodable farm location .162
Extraction Method: Principal Component Analysis.
a. 13 components extracted.
106
The first principal component which explained the majority of the variations were used in the
computation of the vulnerability indices of the households across the eight communities (see
methodology for explanation). The first principal component scores of most of the adaptive
capacity variables were positively associated while few of the indicators under exposure and
sensitivity were negatively associated (Table 4.19).
Only indicators of the adaptive capacity which are positively associated and those of
sensitivity and exposure they are negatively associated were selected in calculating the
vulnerability indices (as explained in methodology section). Consequently, the adaptive
capacity variables selected were age, literacy rate, level of education, income diversification,
off-farm income, monthly income, dependency ratio, type of housing unit, pre-flood
awareness, group membership, land ownership, food production sufficiency, livestock
ownership, farm size, availability of storage facility, fertilizer use, fertilizer subsidy,
irrigation practice, early warning information access, phone ownership, radio/TV ownership,
canoe ownership, access to improved water sources, remittance and credit access.
Furthermore, the sensitivity and exposure variables selected were dwelling units flood
experience and (1 year) flood experience.
4.4.2 Household Flood Vulnerability Analysis
At the household level, the Flood Vulnerability Indices (FVI) for the 400 households were
calculated using the first principal components values against the selected socioeconomic and
environmental variables. The minimum and maximum indices across the households were -
10.73 and 10.44. The negative values are associated with high vulnerability while the positive
are taken to be low vulnerability. Moreover, a higher value of the vulnerability index
connotes lesser vulnerability and vice versa owing to the fact that when adaptive capacity of
the household exceeds that of its sensitivity and exposure, the household becomes relatively
less vulnerable to flooding impact.
Cluster analysis was used in grouping the various flood vulnerability indices (FVI) into three
vulnerability levels; less, moderate and high (details in section 4.4.4). The three vulnerability
levels are relative to one another. The less vulnerable households account for households that
can relatively cope in times of flooding, though they are still vulnerable. The moderately
vulnerable households would need some assistance (especially temporarily) to cope with
flooding while the highly vulnerable households would need assistance for a long time to
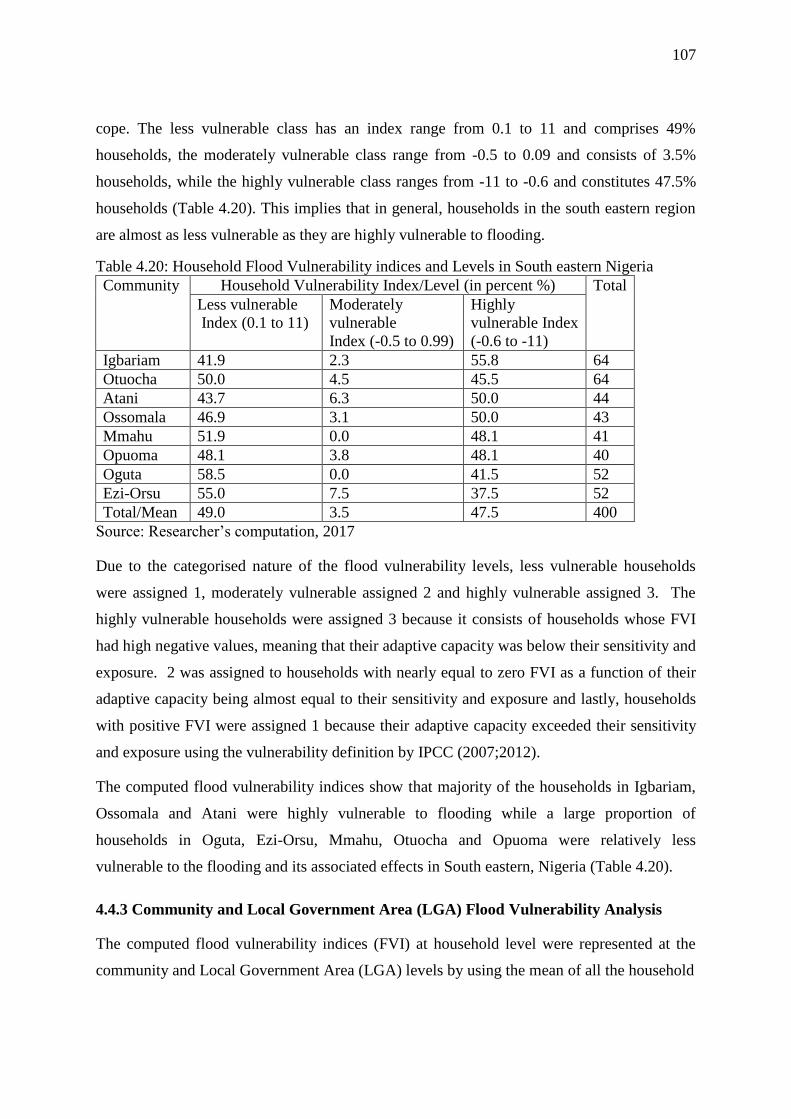
107
cope. The less vulnerable class has an index range from 0.1 to 11 and comprises 49%
households, the moderately vulnerable class range from -0.5 to 0.09 and consists of 3.5%
households, while the highly vulnerable class ranges from -11 to -0.6 and constitutes 47.5%
households (Table 4.20). This implies that in general, households in the south eastern region
are almost as less vulnerable as they are highly vulnerable to flooding.
Table 4.20: Household Flood Vulnerability indices and Levels in South eastern Nigeria
Community Household Vulnerability Index/Level (in percent %) Total
Less vulnerable
Index (0.1 to 11)
Moderately
vulnerable
Index (-0.5 to 0.99)
Highly
vulnerable Index
(-0.6 to -11)
Igbariam 41.9 2.3 55.8 64
Otuocha 50.0 4.5 45.5 64
Atani 43.7 6.3 50.0 44
Ossomala 46.9 3.1 50.0 43
Mmahu 51.9 0.0 48.1 41
Opuoma 48.1 3.8 48.1 40
Oguta 58.5 0.0 41.5 52
Ezi-Orsu 55.0 7.5 37.5 52
Total/Mean 49.0 3.5 47.5 400
Source: Researcher’s computation, 2017
Due to the categorised nature of the flood vulnerability levels, less vulnerable households
were assigned 1, moderately vulnerable assigned 2 and highly vulnerable assigned 3. The
highly vulnerable households were assigned 3 because it consists of households whose FVI
had high negative values, meaning that their adaptive capacity was below their sensitivity and
exposure. 2 was assigned to households with nearly equal to zero FVI as a function of their
adaptive capacity being almost equal to their sensitivity and exposure and lastly, households
with positive FVI were assigned 1 because their adaptive capacity exceeded their sensitivity
and exposure using the vulnerability definition by IPCC (2007;2012).
The computed flood vulnerability indices show that majority of the households in Igbariam,
Ossomala and Atani were highly vulnerable to flooding while a large proportion of
households in Oguta, Ezi-Orsu, Mmahu, Otuocha and Opuoma were relatively less
vulnerable to the flooding and its associated effects in South eastern, Nigeria (Table 4.20).
4.4.3 Community and Local Government Area (LGA) Flood Vulnerability Analysis
The computed flood vulnerability indices (FVI) at household level were represented at the
community and Local Government Area (LGA) levels by using the mean of all the household
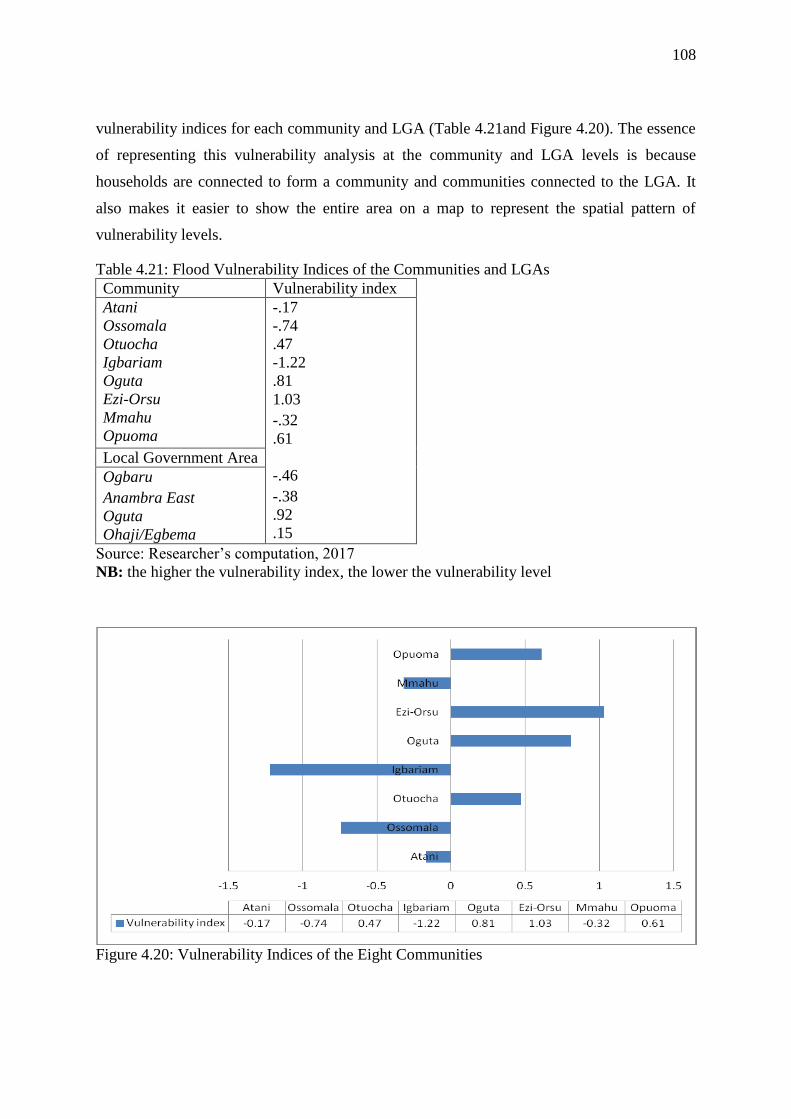
108
vulnerability indices for each community and LGA (Table 4.21and Figure 4.20). The essence
of representing this vulnerability analysis at the community and LGA levels is because
households are connected to form a community and communities connected to the LGA. It
also makes it easier to show the entire area on a map to represent the spatial pattern of
vulnerability levels.
Table 4.21: Flood Vulnerability Indices of the Communities and LGAs
Community Vulnerability index
Atani
Ossomala
Otuocha
Igbariam
Oguta
Ezi-Orsu
Mmahu
Opuoma
-.17
-.74
.47
-1.22
.81
1.03
-.32
.61
-.46
-.38
.92
.15
Local Government Area
Ogbaru
Anambra East
Oguta
Ohaji/Egbema
Source: Researcher’s computation, 2017
NB: the higher the vulnerability index, the lower the vulnerability level
Figure 4.20: Vulnerability Indices of the Eight Communities
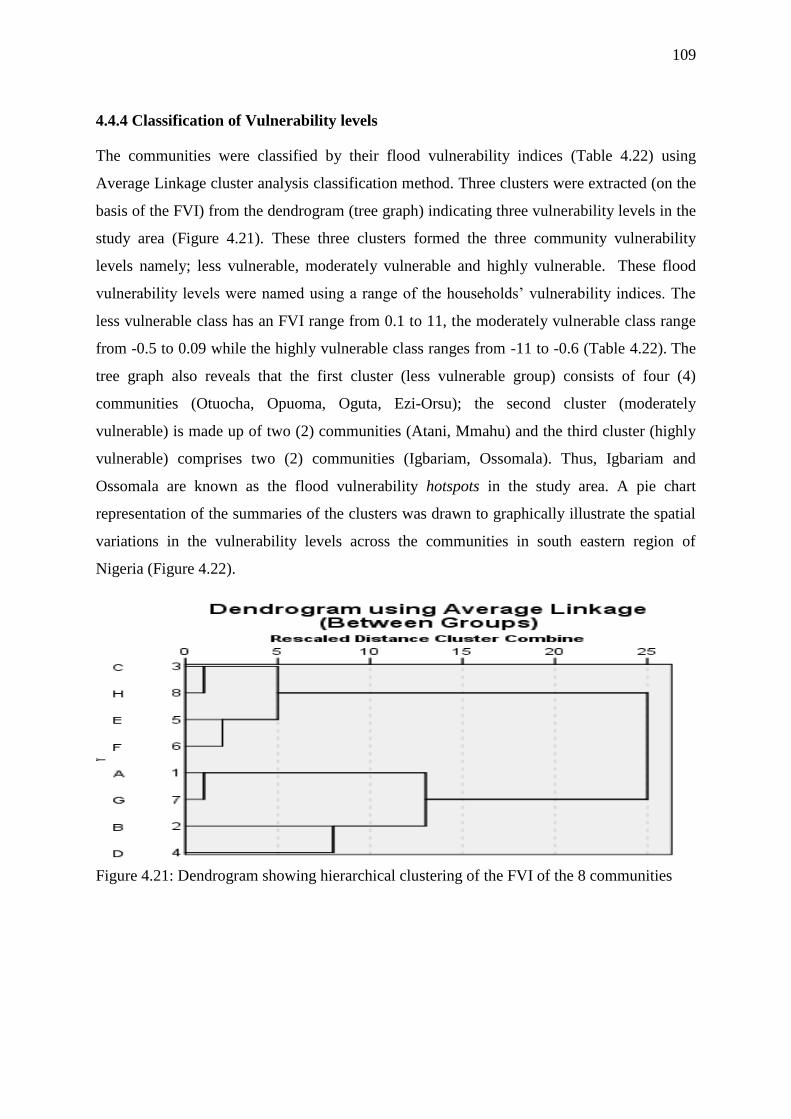
109
4.4.4 Classification of Vulnerability levels
The communities were classified by their flood vulnerability indices (Table 4.22) using
Average Linkage cluster analysis classification method. Three clusters were extracted (on the
basis of the FVI) from the dendrogram (tree graph) indicating three vulnerability levels in the
study area (Figure 4.21). These three clusters formed the three community vulnerability
levels namely; less vulnerable, moderately vulnerable and highly vulnerable. These flood
vulnerability levels were named using a range of the households’ vulnerability indices. The
less vulnerable class has an FVI range from 0.1 to 11, the moderately vulnerable class range
from -0.5 to 0.09 while the highly vulnerable class ranges from -11 to -0.6 (Table 4.22). The
tree graph also reveals that the first cluster (less vulnerable group) consists of four (4)
communities (Otuocha, Opuoma, Oguta, Ezi-Orsu); the second cluster (moderately
vulnerable) is made up of two (2) communities (Atani, Mmahu) and the third cluster (highly
vulnerable) comprises two (2) communities (Igbariam, Ossomala). Thus, Igbariam and
Ossomala are known as the flood vulnerability hotspots in the study area. A pie chart
representation of the summaries of the clusters was drawn to graphically illustrate the spatial
variations in the vulnerability levels across the communities in south eastern region of
Nigeria (Figure 4.22).
Figure 4.21: Dendrogram showing hierarchical clustering of the FVI of the 8 communities
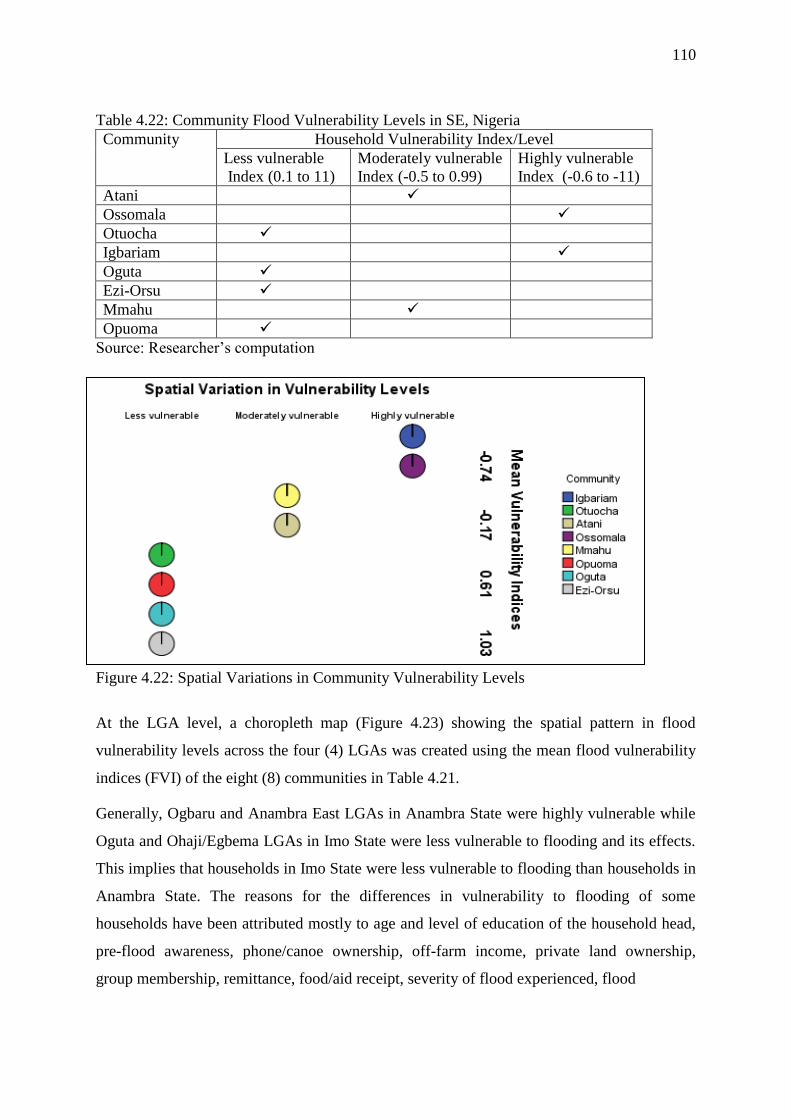
110
Table 4.22: Community Flood Vulnerability Levels in SE, Nigeria
Community Household Vulnerability Index/Level
Less vulnerable
Index (0.1 to 11)
Moderately vulnerable
Index (-0.5 to 0.99)
Highly vulnerable
Index (-0.6 to -11)
Atani
Ossomala
Otuocha
Igbariam
Oguta
Ezi-Orsu
Mmahu
Opuoma
Source: Researcher’s computation
Figure 4.22: Spatial Variations in Community Vulnerability Levels
At the LGA level, a choropleth map (Figure 4.23) showing the spatial pattern in flood
vulnerability levels across the four (4) LGAs was created using the mean flood vulnerability
indices (FVI) of the eight (8) communities in Table 4.21.
Generally, Ogbaru and Anambra East LGAs in Anambra State were highly vulnerable while
Oguta and Ohaji/Egbema LGAs in Imo State were less vulnerable to flooding and its effects.
This implies that households in Imo State were less vulnerable to flooding than households in
Anambra State. The reasons for the differences in vulnerability to flooding of some
households have been attributed mostly to age and level of education of the household head,
pre-flood awareness, phone/canoe ownership, off-farm income, private land ownership,
group membership, remittance, food/aid receipt, severity of flood experienced, flood

111
frequency, flood depth and past flood experienced among others (Tables 4.23 to 4.25).
In addition, the spatial pattern shows that flood vulnerability increases with proximity to a
river, hence the reason Anambra East and Ogbaru LGAs were relatively highly vulnerable to
flooding than Oguta and Ohaji/Egbema LGAs.
Figure 4.23: Spatial pattern in vulnerability levels across the four (4) LGAs
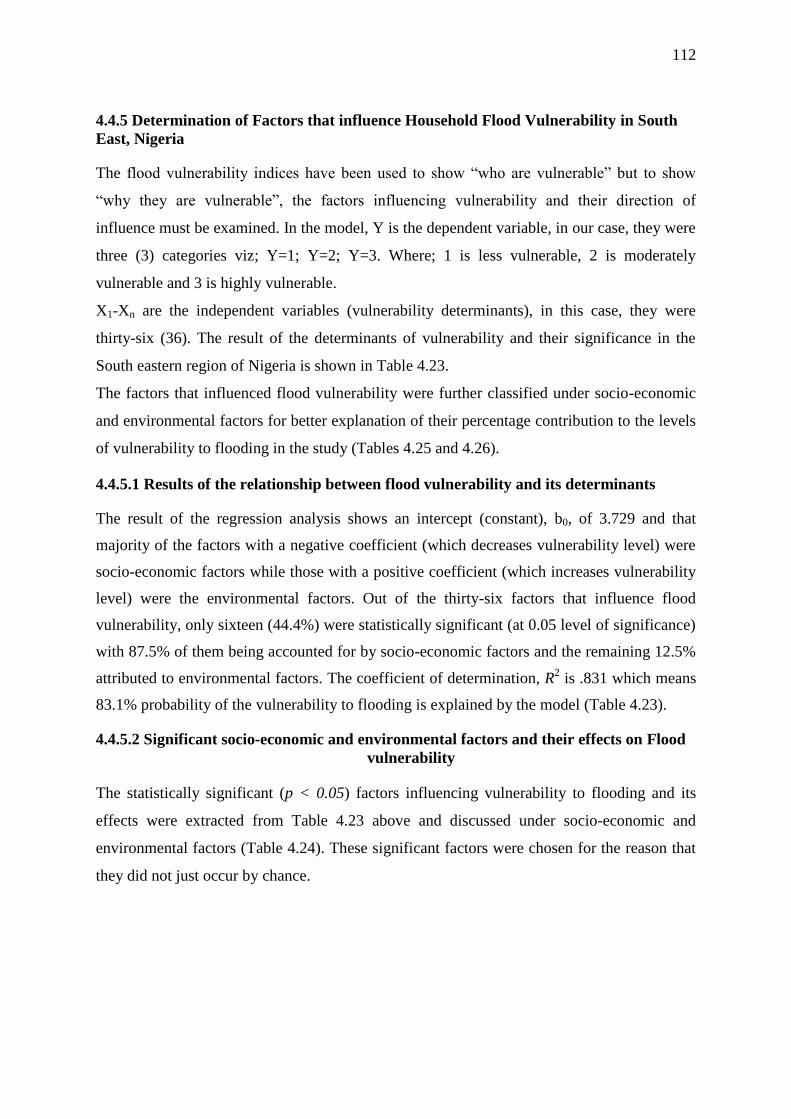
112
4.4.5 Determination of Factors that influence Household Flood Vulnerability in South
East, Nigeria
The flood vulnerability indices have been used to show “who are vulnerable” but to show
“why they are vulnerable”, the factors influencing vulnerability and their direction of
influence must be examined. In the model, Y is the dependent variable, in our case, they were
three (3) categories viz; Y=1; Y=2; Y=3. Where; 1 is less vulnerable, 2 is moderately
vulnerable and 3 is highly vulnerable.
X1-Xn are the independent variables (vulnerability determinants), in this case, they were
thirty-six (36). The result of the determinants of vulnerability and their significance in the
South eastern region of Nigeria is shown in Table 4.23.
The factors that influenced flood vulnerability were further classified under socio-economic
and environmental factors for better explanation of their percentage contribution to the levels
of vulnerability to flooding in the study (Tables 4.25 and 4.26).
4.4.5.1 Results of the relationship between flood vulnerability and its determinants
The result of the regression analysis shows an intercept (constant), b0, of 3.729 and that
majority of the factors with a negative coefficient (which decreases vulnerability level) were
socio-economic factors while those with a positive coefficient (which increases vulnerability
level) were the environmental factors. Out of the thirty-six factors that influence flood
vulnerability, only sixteen (44.4%) were statistically significant (at 0.05 level of significance)
with 87.5% of them being accounted for by socio-economic factors and the remaining 12.5%
attributed to environmental factors. The coefficient of determination, R2 is .831 which means
83.1% probability of the vulnerability to flooding is explained by the model (Table 4.23).
4.4.5.2 Significant socio-economic and environmental factors and their effects on Flood
vulnerability
The statistically significant (p < 0.05) factors influencing vulnerability to flooding and its
effects were extracted from Table 4.23 above and discussed under socio-economic and
environmental factors (Table 4.24). These significant factors were chosen for the reason that
they did not just occur by chance.
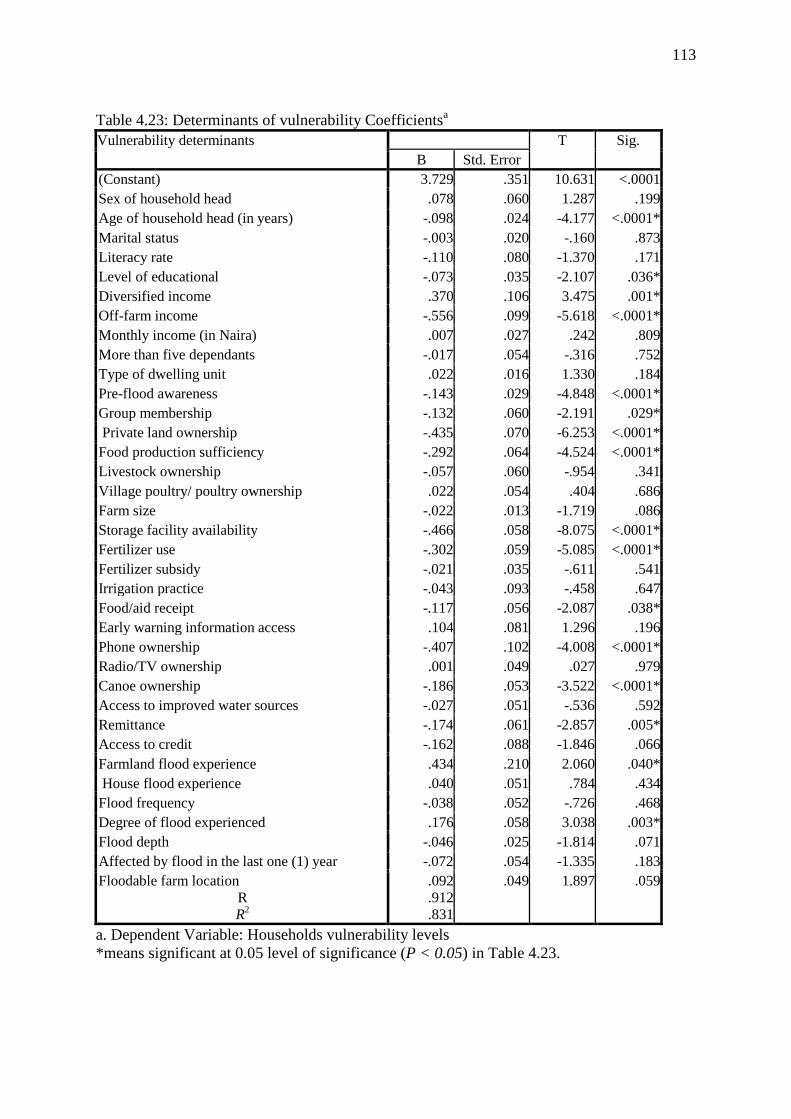
113
Table 4.23: Determinants of vulnerability Coefficientsa
Vulnerability determinants T Sig.
B Std. Error
(Constant) 3.729 .351 10.631 <.0001
Sex of household head .078 .060 1.287 .199
Age of household head (in years) -.098 .024 -4.177 <.0001*
Marital status -.003 .020 -.160 .873
Literacy rate -.110 .080 -1.370 .171
Level of educational -.073 .035 -2.107 .036*
Diversified income .370 .106 3.475 .001*
Off-farm income -.556 .099 -5.618 <.0001*
Monthly income (in Naira) .007 .027 .242 .809
More than five dependants -.017 .054 -.316 .752
Type of dwelling unit .022 .016 1.330 .184
Pre-flood awareness -.143 .029 -4.848 <.0001*
Group membership -.132 .060 -2.191 .029*
Private land ownership -.435 .070 -6.253 <.0001*
Food production sufficiency -.292 .064 -4.524 <.0001*
Livestock ownership -.057 .060 -.954 .341
Village poultry/ poultry ownership .022 .054 .404 .686
Farm size -.022 .013 -1.719 .086
Storage facility availability -.466 .058 -8.075 <.0001*
Fertilizer use -.302 .059 -5.085 <.0001*
Fertilizer subsidy -.021 .035 -.611 .541
Irrigation practice -.043 .093 -.458 .647
Food/aid receipt -.117 .056 -2.087 .038*
Early warning information access .104 .081 1.296 .196
Phone ownership -.407 .102 -4.008 <.0001*
Radio/TV ownership .001 .049 .027 .979
Canoe ownership -.186 .053 -3.522 <.0001*
Access to improved water sources -.027 .051 -.536 .592
Remittance -.174 .061 -2.857 .005*
Access to credit -.162 .088 -1.846 .066
Farmland flood experience .434 .210 2.060 .040*
House flood experience .040 .051 .784 .434
Flood frequency -.038 .052 -.726 .468
Degree of flood experienced .176 .058 3.038 .003*
Flood depth -.046 .025 -1.814 .071
Affected by flood in the last one (1) year -.072 .054 -1.335 .183
Floodable farm location
R
R2
.092
.912
.831
.049 1.897 .059
a. Dependent Variable: Households vulnerability levels
*means significant at 0.05 level of significance (P < 0.05) in Table 4.23.
114
Table 4.24: Significant socio-economic and environmental factors
and their effects on flood vulnerability
Variable Effect on Vulnerability
Socio-economic variables
Negative
Negative
Positive
Negative
Negative
Negative
Negative
Negative
Negative
Negative
Negative
Negative
Negative
Negative
Age
Level of education
Income diversification
Off-farm income
Pre-flood awareness
Group membership
Private land ownership
Food production sufficiency
Storage facility availability
Fertilizer use
Food/aid receipt
Phone ownership
Canoe ownership
Remittance
Environmental variables
Positive
Positive Farmland flood experience
Degree of flood experienced
Positive means the variable increases vulnerability while
negative means it decreases vulnerability
4.4.5.2.1 Socio-economic factors and their effects on flood vulnerability
Majority of the socio-economic factors decreases flood vulnerability and this is true as they
are mainly the adaptive capacity variables on which the vulnerability levels are dependent.
Out of the twenty-nine (29) socio-economic variables perceived to influence household
vulnerability to flooding and its effects, only fourteen (14) were statistically significant at 5%
level of significance in the study area (Tables 4.23 and 4.24).
Cross tabulations were performed to explain the direction of the effects of these socio-
economic factors on vulnerability to flooding and its effects (Table 4.25). The results show
that vulnerability decreases with increasing age, level of education, off-farm incomes, pre-
flood awareness, group membership, private land ownership, sufficient food production,
available storage facility, use of fertilizer, receipt of food/aid in time of emergency, phone
ownership, canoe ownership and financial support and increases with diversified income.
The implication was that younger heads of households were more vulnerable to flooding e.g.
100% of the highly vulnerable households had household heads within the age bracket of 20
and 29 years while 71% of the less vulnerable households had their households heads in the
115
ages of 60 and 69 years. The above was attributed to the fact that younger households’ heads
engaged solely in agricultural sources of livelihoods which were greatly affected in times of
flooding. This could also be as a result of the elderly receiving financial assistance from their
children and other relatives to help cushion the effects of flooding.
The study found that on overall, those with no formal education or with a primary school
education were the most vulnerable with 61.2% and 59.1% households respectively, being
highly vulnerable as a result of their lower or no level of education. This was due to the fact
most heads of households with higher degree had acquired some formal farming techniques
as well as being higher income earners holding other factors like years of farming experience
constant.
The observed negative relationship between off-farm income and flood vulnerability level is
expected because during flood events where and when farmlands had been affected, these
households still had other non farming sources of livelihoods to sustain them as agreed by
Tefera and Tefera (2014). Though, about two third (32.8%) of the highly vulnerable
households got their income from other off-farm sources, it was lesser than the less
vulnerable households with 62.7% getting their incomes from off-farm sources.
In the same vein, “pre-flood awareness influences the place where people reside and their
flood preparedness as well as their exposure to flooding. However, the higher the number of
households with high pre-flood awareness, the lower their vulnerability levels holding other
factors constant” (Akukwe and Ogbodo, 2015:11; Table 3.2). This is obvious in Table 4.25 as
a large proportion of highly vulnerable households had little (73.1%) or no (100%) awareness
of flooding prior to their experience whereas a good number of less vulnerable households
were either fairly aware (55.3%) or highly aware (72.6%) of the flooding.
Being a member of a group/association reduces one’s vulnerability because “membership in a
support network improves social capital of members and thereby, their resilience” (Akukwe
and Ogbodo, 2015:9). This is also consistent with the findings of Blaikie et al. (1994); David
et al. (2007); Adelekan (2009); Olorunfemi (2011) who argued that households that have
access to resources and social networks are less vulnerable to flooding and other
environmental pressures. This is evident in the study area as 62.8% of the less vulnerable
households were members of one group or the other while 77% of the highly vulnerable
households did not belong to any social group.
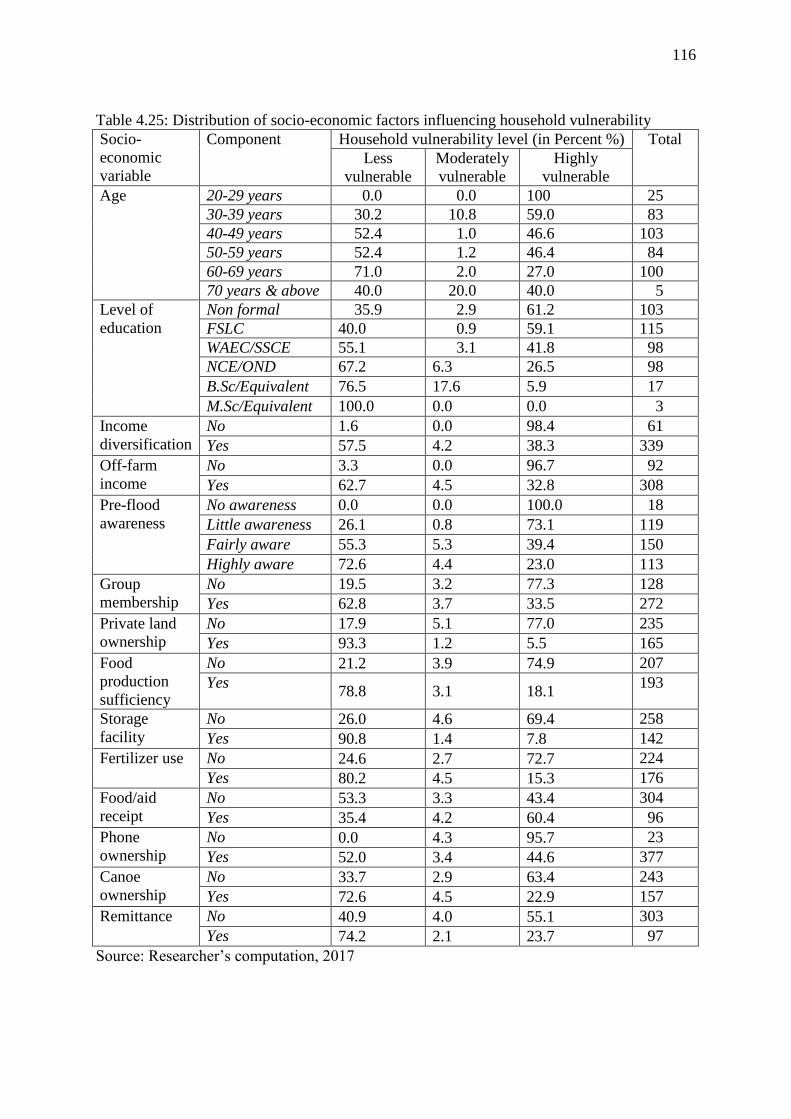
116
Table 4.25: Distribution of socio-economic factors influencing household vulnerability
Socio-
economic
variable
Component Household vulnerability level (in Percent %) Total
Less
vulnerable
Moderately
vulnerable
Highly
vulnerable
Age 20-29 years 0.0 0.0 100 25
30-39 years 30.2 10.8 59.0 83
40-49 years 52.4 1.0 46.6 103
50-59 years 52.4 1.2 46.4 84
60-69 years 71.0 2.0 27.0 100
70 years & above 40.0 20.0 40.0 5
Level of
education
Non formal 35.9 2.9 61.2 103
FSLC 40.0 0.9 59.1 115
WAEC/SSCE 55.1 3.1 41.8 98
NCE/OND 67.2 6.3 26.5 98
B.Sc/Equivalent 76.5 17.6 5.9 17
M.Sc/Equivalent 100.0 0.0 0.0 3
Income
diversification
No 1.6 0.0 98.4 61
Yes 57.5 4.2 38.3 339
Off-farm
income
No 3.3 0.0 96.7 92
Yes 62.7 4.5 32.8 308
Pre-flood
awareness
No awareness 0.0 0.0 100.0 18
Little awareness 26.1 0.8 73.1 119
Fairly aware 55.3 5.3 39.4 150
Highly aware 72.6 4.4 23.0 113
Group
membership
No 19.5 3.2 77.3 128
Yes 62.8 3.7 33.5 272
Private land
ownership
No 17.9 5.1 77.0 235
Yes 93.3 1.2 5.5 165
Food
production
sufficiency
No 21.2 3.9 74.9 207
Yes 78.8 3.1 18.1
193
Storage
facility
No 26.0 4.6 69.4 258
Yes 90.8 1.4 7.8 142
Fertilizer use No 24.6 2.7 72.7 224
Yes 80.2 4.5 15.3 176
Food/aid
receipt
No 53.3 3.3 43.4 304
Yes 35.4 4.2 60.4 96
Phone
ownership
No 0.0 4.3 95.7 23
Yes 52.0 3.4 44.6 377
Canoe
ownership
No 33.7 2.9 63.4 243
Yes 72.6 4.5 22.9 157
Remittance No 40.9 4.0 55.1 303
Yes 74.2 2.1 23.7 97
Source: Researcher’s computation, 2017
117
Private land ownership, sufficient food production, available storage facility and fertilizer use
relate to farming activities which most households depend upon for survival. The inverse
relationship between these factors and vulnerability shows that household that own land;
produces sufficient food for themselves; have access to storage facilities and use fertilizer are
less vulnerable to the effects of flooding. For instance, assuming flooding occurred and
caused a decrease in crop harvest, if the cultivated land belongs to the affected household,
then only the brunt of reduced crop harvest would be bored while it would mean more losses
for households that rented the land.
A good number of farmers cultivate the same piece of land annually thereby reducing crop
yield, therefore fertilizer use is needed to increase crop yield and productivity and invariably
increase the resources (money) to cushion the negative effects of flooding. Sufficiency in
own food production has a related importance to fertilizer use and private land ownership on
reducing the effects of flooding. Storage facility availability reduces the rate at which
households sold their harvested produce (which were usually sold at cheaper rates when there
is no storage facility to avoid losses), thereby reducing the vulnerability of households to the
effects of flooding.
Receipt of food/aid helps in reducing household vulnerability to flooding as well as
improving the resilience of flood affected households as it plays a safety net role. This
assistance came from either the government or other group/association members (e.g.
Kinship network, religious group). A high percentage (60.4%) of the highly vulnerable
households had received one or two forms of assistance, perhaps as a result of them being
highly vulnerable and being the most affected by flood in the past than the less vulnerable
households with a low percentage (35.4%) of food/aid receipt.
The “ownership of phone/TV is a measure of access to technology which is necessary as a
means of being informed on impending flood hazards” as observed by Akukwe and Ogbodo
(2015:10). This was one of the least significant socio-economic factors that influence
household vulnerability because generally, only a small proportion of households (5.8%) did
not own a phone.
Canoe ownership improves movement during flooding and minimizes the effects of flooding
as households could migrate to safer land on reduced cost. Though canoe is a necessary asset
in the flood prone communities of the study area, not all household owned one, thereby
118
making households that could afford one less vulnerable to flooding and its effects. Majority
of the households that owned a canoe fell in the less vulnerable (72.6%) category whereas
majority (63.4%) that did not own one fell in the highly vulnerable category.
Remittance in terms of financial support cushions the effects caused by flooding and reduces
further vulnerability to flooding. This implies getting monetary assistance elsewhere without
a pay back as it is with the case of loan. The findings reveal that the more remittance a
household got, the less vulnerable they were.
Contrarily, income diversification was found to have a positive effect on household flood
vulnerability when it was expected to have a negative effect. This implies that the more
diversified income a household had, the more vulnerable they were. The reason was because
a large proportion of households despite their vulnerability levels had more than one income
sources related to agricultural activities which were also affected during flood events. This is
in consonance with the findings of Devereux (2007) who noted more diversified households
and economies to be less vulnerable to the direct impacts of droughts and floods, as long as
their alternative income sources are neither in any way dependent on agriculture nor rainfall.
4.4.5.2.2 Environmental factors and their effects on vulnerability
These are mostly the biophysical variables that influence household vulnerability to flooding
and its effects. The environmental factors are expected to have a positive relationship with
household vulnerability, meaning they are expected to increase flood vulnerability. Seven (7)
environmental factors were identified to influence vulnerability but only two (2) were
statistically significant viz; farmland flood experience and severity of flood.
There exists a direct relationship between flood experience and vulnerability level because
people tend to be vulnerable if they had experienced flood more than those who have never.
Correspondingly, the higher the flood severity perceived in terms of degree of damage, the
higher the vulnerability to flooding and its effects. Table 4.26 shows that majority of the
households had experienced flooding in their farmlands and had experienced highly severe
flood which corroborates the findings of Ajaero and Mozie, 2014.
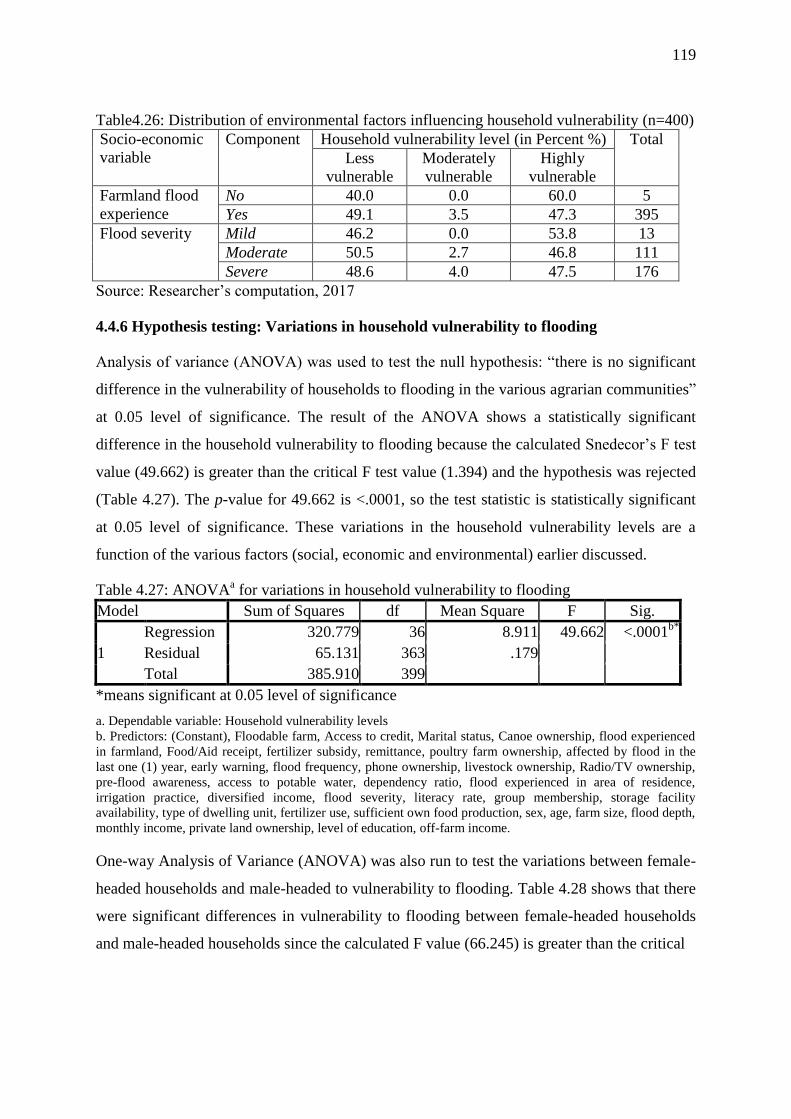
119
Table4.26: Distribution of environmental factors influencing household vulnerability (n=400)
Socio-economic
variable
Component Household vulnerability level (in Percent %) Total
Less
vulnerable
Moderately
vulnerable
Highly
vulnerable
Farmland flood
experience
No 40.0 0.0 60.0 5
Yes 49.1 3.5 47.3 395
Flood severity Mild 46.2 0.0 53.8 13
Moderate 50.5 2.7 46.8 111
Severe 48.6 4.0 47.5 176
Source: Researcher’s computation, 2017
4.4.6 Hypothesis testing: Variations in household vulnerability to flooding
Analysis of variance (ANOVA) was used to test the null hypothesis: “there is no significant
difference in the vulnerability of households to flooding in the various agrarian communities”
at 0.05 level of significance. The result of the ANOVA shows a statistically significant
difference in the household vulnerability to flooding because the calculated Snedecor’s F test
value (49.662) is greater than the critical F test value (1.394) and the hypothesis was rejected
(Table 4.27). The p-value for 49.662 is <.0001, so the test statistic is statistically significant
at 0.05 level of significance. These variations in the household vulnerability levels are a
function of the various factors (social, economic and environmental) earlier discussed.
Table 4.27: ANOVAa for variations in household vulnerability to flooding
Model Sum of Squares df Mean Square F Sig.
1
Regression 320.779 36 8.911 49.662 <.0001b*
Residual 65.131 363 .179
Total 385.910 399
*means significant at 0.05 level of significance
a. Dependable variable: Household vulnerability levels
b. Predictors: (Constant), Floodable farm, Access to credit, Marital status, Canoe ownership, flood experienced
in farmland, Food/Aid receipt, fertilizer subsidy, remittance, poultry farm ownership, affected by flood in the
last one (1) year, early warning, flood frequency, phone ownership, livestock ownership, Radio/TV ownership,
pre-flood awareness, access to potable water, dependency ratio, flood experienced in area of residence,
irrigation practice, diversified income, flood severity, literacy rate, group membership, storage facility
availability, type of dwelling unit, fertilizer use, sufficient own food production, sex, age, farm size, flood depth,
monthly income, private land ownership, level of education, off-farm income.
One-way Analysis of Variance (ANOVA) was also run to test the variations between female-
headed households and male-headed to vulnerability to flooding. Table 4.28 shows that there
were significant differences in vulnerability to flooding between female-headed households
and male-headed households since the calculated F value (66.245) is greater than the critical
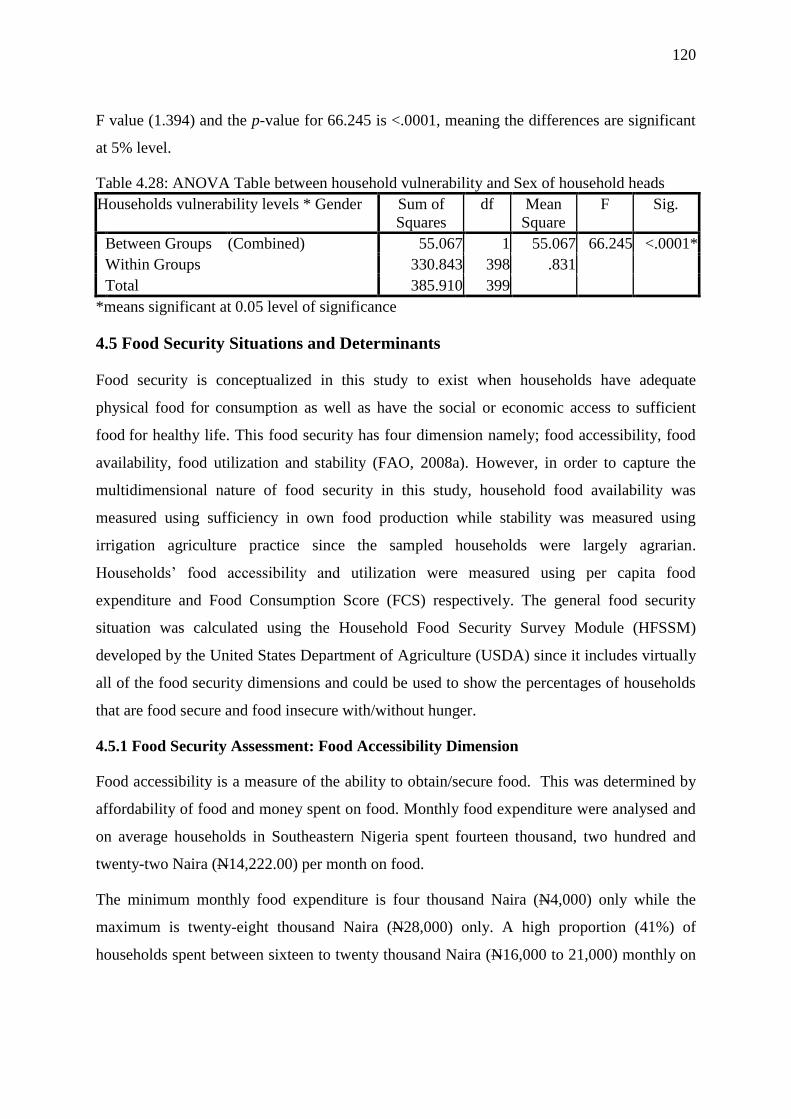
120
F value (1.394) and the p-value for 66.245 is <.0001, meaning the differences are significant
at 5% level.
Table 4.28: ANOVA Table between household vulnerability and Sex of household heads
Households vulnerability levels * Gender Sum of
Squares
df Mean
Square
F Sig.
Between Groups (Combined) 55.067 1 55.067 66.245 <.0001*
Within Groups 330.843 398 .831
Total 385.910 399
*means significant at 0.05 level of significance
4.5 Food Security Situations and Determinants
Food security is conceptualized in this study to exist when households have adequate
physical food for consumption as well as have the social or economic access to sufficient
food for healthy life. This food security has four dimension namely; food accessibility, food
availability, food utilization and stability (FAO, 2008a). However, in order to capture the
multidimensional nature of food security in this study, household food availability was
measured using sufficiency in own food production while stability was measured using
irrigation agriculture practice since the sampled households were largely agrarian.
Households’ food accessibility and utilization were measured using per capita food
expenditure and Food Consumption Score (FCS) respectively. The general food security
situation was calculated using the Household Food Security Survey Module (HFSSM)
developed by the United States Department of Agriculture (USDA) since it includes virtually
all of the food security dimensions and could be used to show the percentages of households
that are food secure and food insecure with/without hunger.
4.5.1 Food Security Assessment: Food Accessibility Dimension
Food accessibility is a measure of the ability to obtain/secure food. This was determined by
affordability of food and money spent on food. Monthly food expenditure were analysed and
on average households in Southeastern Nigeria spent fourteen thousand, two hundred and
twenty-two Naira (N14,222.00) per month on food.
The minimum monthly food expenditure is four thousand Naira (N4,000) only while the
maximum is twenty-eight thousand Naira (N28,000) only. A high proportion (41%) of
households spent between sixteen to twenty thousand Naira (N16,000 to 21,000) monthly on
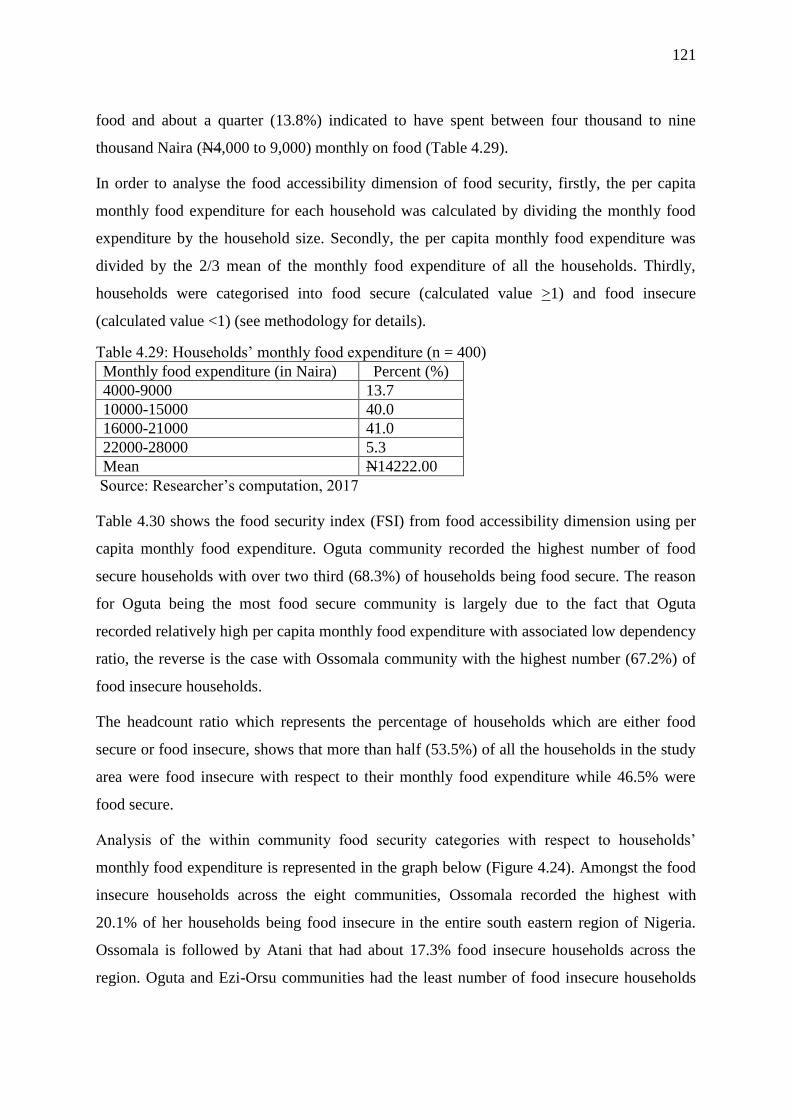
121
food and about a quarter (13.8%) indicated to have spent between four thousand to nine
thousand Naira (N4,000 to 9,000) monthly on food (Table 4.29).
In order to analyse the food accessibility dimension of food security, firstly, the per capita
monthly food expenditure for each household was calculated by dividing the monthly food
expenditure by the household size. Secondly, the per capita monthly food expenditure was
divided by the 2/3 mean of the monthly food expenditure of all the households. Thirdly,
households were categorised into food secure (calculated value >1) and food insecure
(calculated value <1) (see methodology for details).
Table 4.29: Households’ monthly food expenditure (n = 400)
Monthly food expenditure (in Naira) Percent (%)
4000-9000 13.7
10000-15000 40.0
16000-21000 41.0
22000-28000 5.3
Mean N14222.00
Source: Researcher’s computation, 2017
Table 4.30 shows the food security index (FSI) from food accessibility dimension using per
capita monthly food expenditure. Oguta community recorded the highest number of food
secure households with over two third (68.3%) of households being food secure. The reason
for Oguta being the most food secure community is largely due to the fact that Oguta
recorded relatively high per capita monthly food expenditure with associated low dependency
ratio, the reverse is the case with Ossomala community with the highest number (67.2%) of
food insecure households.
The headcount ratio which represents the percentage of households which are either food
secure or food insecure, shows that more than half (53.5%) of all the households in the study
area were food insecure with respect to their monthly food expenditure while 46.5% were
food secure.
Analysis of the within community food security categories with respect to households’
monthly food expenditure is represented in the graph below (Figure 4.24). Amongst the food
insecure households across the eight communities, Ossomala recorded the highest with
20.1% of her households being food insecure in the entire south eastern region of Nigeria.
Ossomala is followed by Atani that had about 17.3% food insecure households across the
region. Oguta and Ezi-Orsu communities had the least number of food insecure households
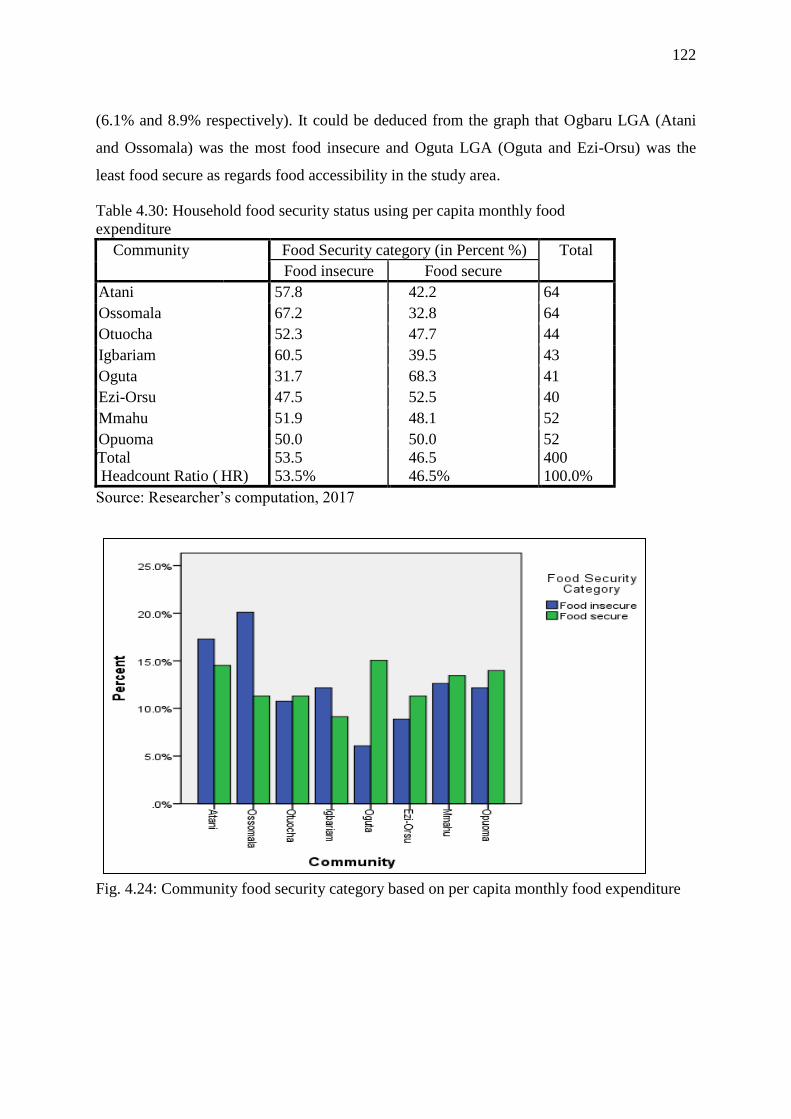
122
(6.1% and 8.9% respectively). It could be deduced from the graph that Ogbaru LGA (Atani
and Ossomala) was the most food insecure and Oguta LGA (Oguta and Ezi-Orsu) was the
least food secure as regards food accessibility in the study area.
Table 4.30: Household food security status using per capita monthly food
expenditure
Community Food Security category (in Percent %) Total
Food insecure Food secure
Atani 57.8 42.2 64
Ossomala 67.2 32.8 64
Otuocha 52.3 47.7 44
Igbariam 60.5 39.5 43
Oguta 31.7 68.3 41
Ezi-Orsu 47.5 52.5 40
Mmahu 51.9 48.1 52
Opuoma 50.0 50.0 52
Total
Headcount Ratio (
HR)
53.5
53.5%
46.5
46.5%
400
100.0%
Source: Researcher’s computation, 2017
Fig. 4.24: Community food security category based on per capita monthly food expenditure
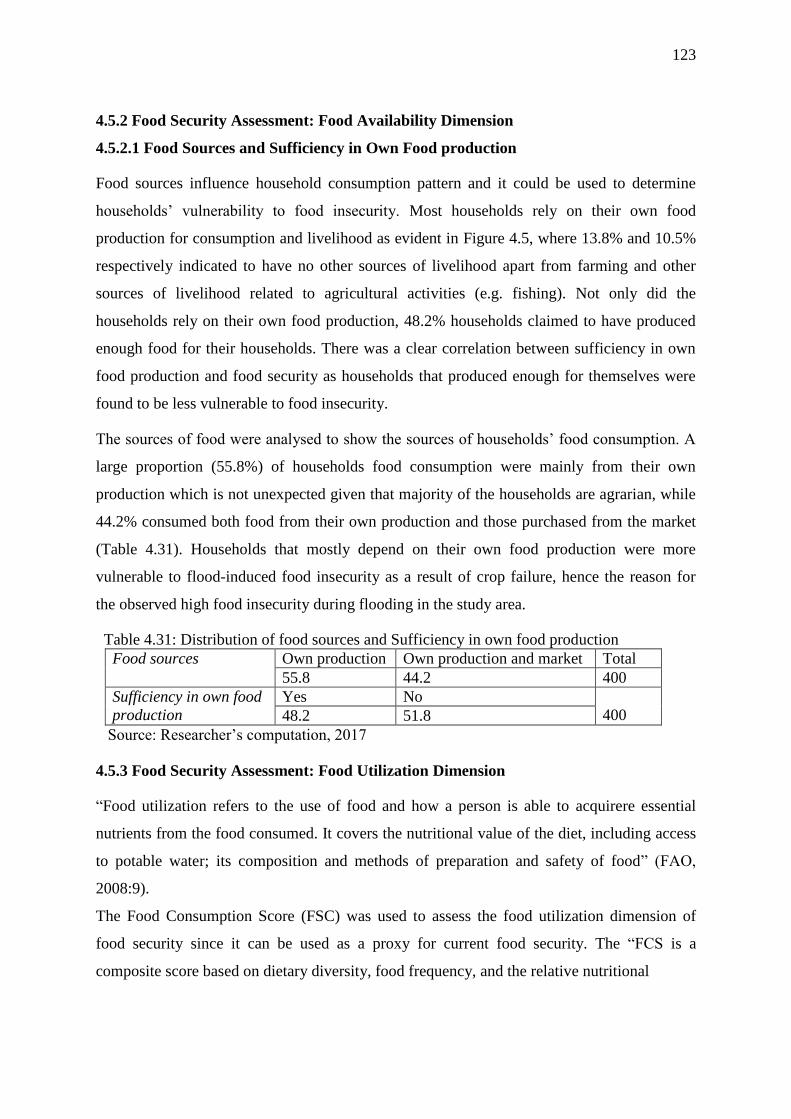
123
4.5.2 Food Security Assessment: Food Availability Dimension
4.5.2.1 Food Sources and Sufficiency in Own Food production
Food sources influence household consumption pattern and it could be used to determine
households’ vulnerability to food insecurity. Most households rely on their own food
production for consumption and livelihood as evident in Figure 4.5, where 13.8% and 10.5%
respectively indicated to have no other sources of livelihood apart from farming and other
sources of livelihood related to agricultural activities (e.g. fishing). Not only did the
households rely on their own food production, 48.2% households claimed to have produced
enough food for their households. There was a clear correlation between sufficiency in own
food production and food security as households that produced enough for themselves were
found to be less vulnerable to food insecurity.
The sources of food were analysed to show the sources of households’ food consumption. A
large proportion (55.8%) of households food consumption were mainly from their own
production which is not unexpected given that majority of the households are agrarian, while
44.2% consumed both food from their own production and those purchased from the market
(Table 4.31). Households that mostly depend on their own food production were more
vulnerable to flood-induced food insecurity as a result of crop failure, hence the reason for
the observed high food insecurity during flooding in the study area.
Table 4.31: Distribution of food sources and Sufficiency in own food production
Food sources Own production Own production and market Total
55.8 44.2 400
Sufficiency in own food
production
Yes No
400 48.2 51.8
Source: Researcher’s computation, 2017
4.5.3 Food Security Assessment: Food Utilization Dimension
“Food utilization refers to the use of food and how a person is able to acquirere essential
nutrients from the food consumed. It covers the nutritional value of the diet, including access
to potable water; its composition and methods of preparation and safety of food” (FAO,
2008:9).
The Food Consumption Score (FSC) was used to assess the food utilization dimension of
food security since it can be used as a proxy for current food security. The “FCS is a
composite score based on dietary diversity, food frequency, and the relative nutritional
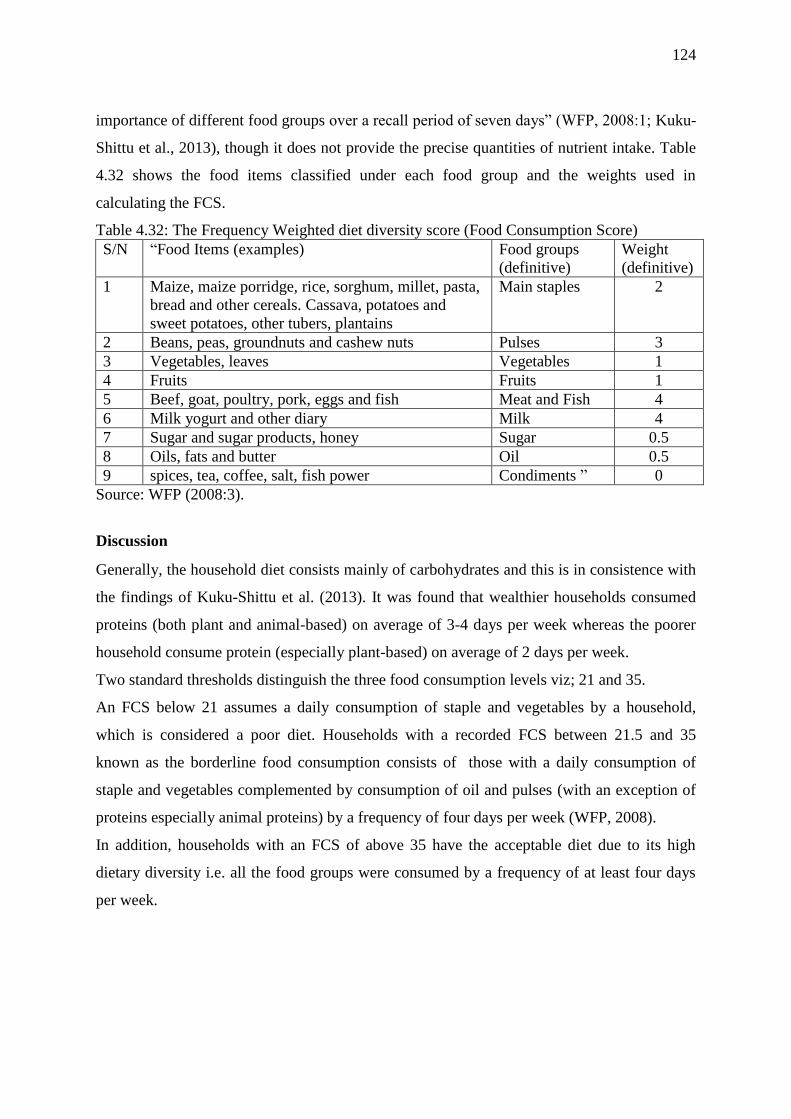
124
importance of different food groups over a recall period of seven days” (WFP, 2008:1; Kuku-
Shittu et al., 2013), though it does not provide the precise quantities of nutrient intake. Table
4.32 shows the food items classified under each food group and the weights used in
calculating the FCS.
Table 4.32: The Frequency Weighted diet diversity score (Food Consumption Score)
S/N “Food Items (examples) Food groups
(definitive)
Weight
(definitive)
1 Maize, maize porridge, rice, sorghum, millet, pasta,
bread and other cereals. Cassava, potatoes and
sweet potatoes, other tubers, plantains
Main staples 2
2 Beans, peas, groundnuts and cashew nuts Pulses 3
3 Vegetables, leaves Vegetables 1
4 Fruits Fruits 1
5 Beef, goat, poultry, pork, eggs and fish Meat and Fish 4
6 Milk yogurt and other diary Milk 4
7 Sugar and sugar products, honey Sugar 0.5
8 Oils, fats and butter Oil 0.5
9 spices, tea, coffee, salt, fish power Condiments ” 0
Source: WFP (2008:3).
Discussion
Generally, the household diet consists mainly of carbohydrates and this is in consistence with
the findings of Kuku-Shittu et al. (2013). It was found that wealthier households consumed
proteins (both plant and animal-based) on average of 3-4 days per week whereas the poorer
household consume protein (especially plant-based) on average of 2 days per week.
Two standard thresholds distinguish the three food consumption levels viz; 21 and 35.
An FCS below 21 assumes a daily consumption of staple and vegetables by a household,
which is considered a poor diet. Households with a recorded FCS between 21.5 and 35
known as the borderline food consumption consists of those with a daily consumption of
staple and vegetables complemented by consumption of oil and pulses (with an exception of
proteins especially animal proteins) by a frequency of four days per week (WFP, 2008).
In addition, households with an FCS of above 35 have the acceptable diet due to its high
dietary diversity i.e. all the food groups were consumed by a frequency of at least four days
per week.
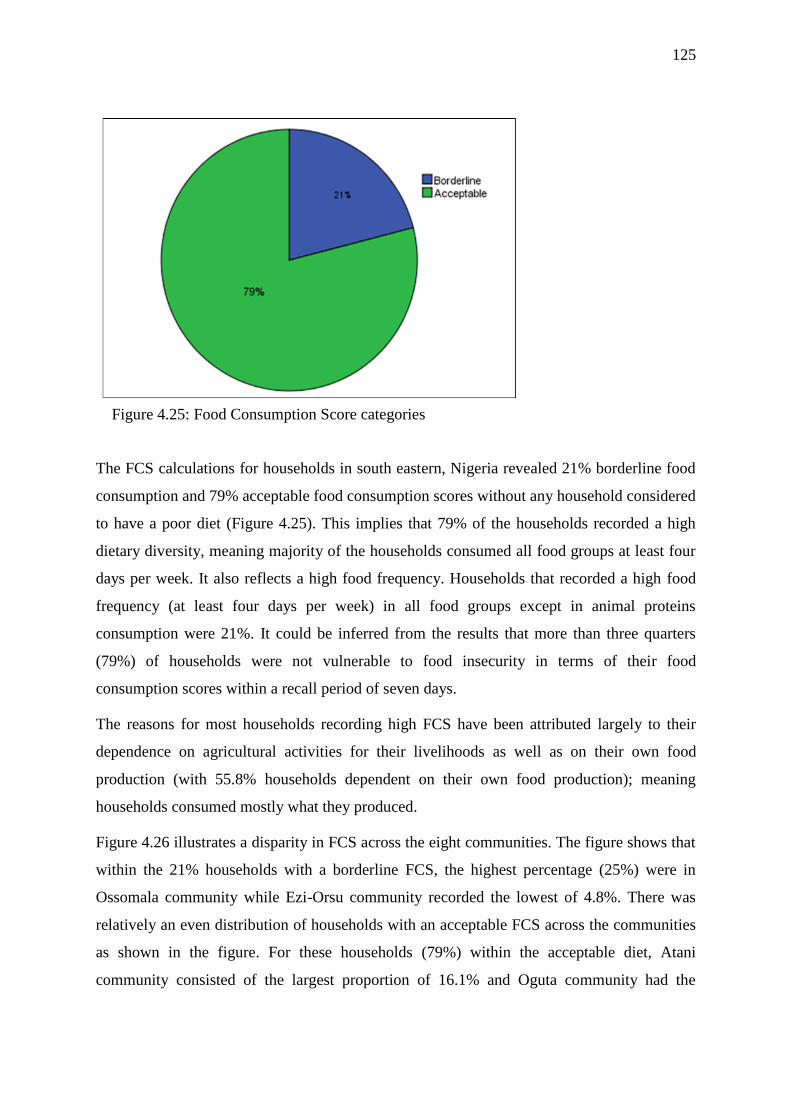
125
Figure 4.25: Food Consumption Score categories
The FCS calculations for households in south eastern, Nigeria revealed 21% borderline food
consumption and 79% acceptable food consumption scores without any household considered
to have a poor diet (Figure 4.25). This implies that 79% of the households recorded a high
dietary diversity, meaning majority of the households consumed all food groups at least four
days per week. It also reflects a high food frequency. Households that recorded a high food
frequency (at least four days per week) in all food groups except in animal proteins
consumption were 21%. It could be inferred from the results that more than three quarters
(79%) of households were not vulnerable to food insecurity in terms of their food
consumption scores within a recall period of seven days.
The reasons for most households recording high FCS have been attributed largely to their
dependence on agricultural activities for their livelihoods as well as on their own food
production (with 55.8% households dependent on their own food production); meaning
households consumed mostly what they produced.
Figure 4.26 illustrates a disparity in FCS across the eight communities. The figure shows that
within the 21% households with a borderline FCS, the highest percentage (25%) were in
Ossomala community while Ezi-Orsu community recorded the lowest of 4.8%. There was
relatively an even distribution of households with an acceptable FCS across the communities
as shown in the figure. For these households (79%) within the acceptable diet, Atani
community consisted of the largest proportion of 16.1% and Oguta community had the

126
smallest proportion of households (9.5%). The reason for this disparity is related to their
sufficiency in own food production.
Figure 4.26: Distribution of household Food Consumption Scores (FCS)
4.5.4 Food Security Assessment: Stability Dimension
Dependencies on rain-fed agriculture or irrigation were used as a proxy to determine the
stability dimension of food security in the study area. The analysis of data disclosed that
majority of the households (88.5%) depended solely on rain-fed agriculture leading to
seasonal harvest of most crops produced in the area which are usually affected because their
harvest season (July to October) run concurrently with the seasonal occurrence of floods.
Only few (12%) households have been able to harvest flood waters for post flood farming
while only 11.5% households practised irrigation agriculture in addition to rain-fed
agriculture (Table 4.33).
Table 4.33: Agricultural practices (n = 400)
Agriculture type Percent (%)
Yes No
Rain-fed 88.5 11.5
Mixed (Irrigation and rain-fed) 11.5 88.5
Post flooding 12.0 88.0
Irrigation and post flooding 6.0 94.0
Source: Researcher’s computation, 2017
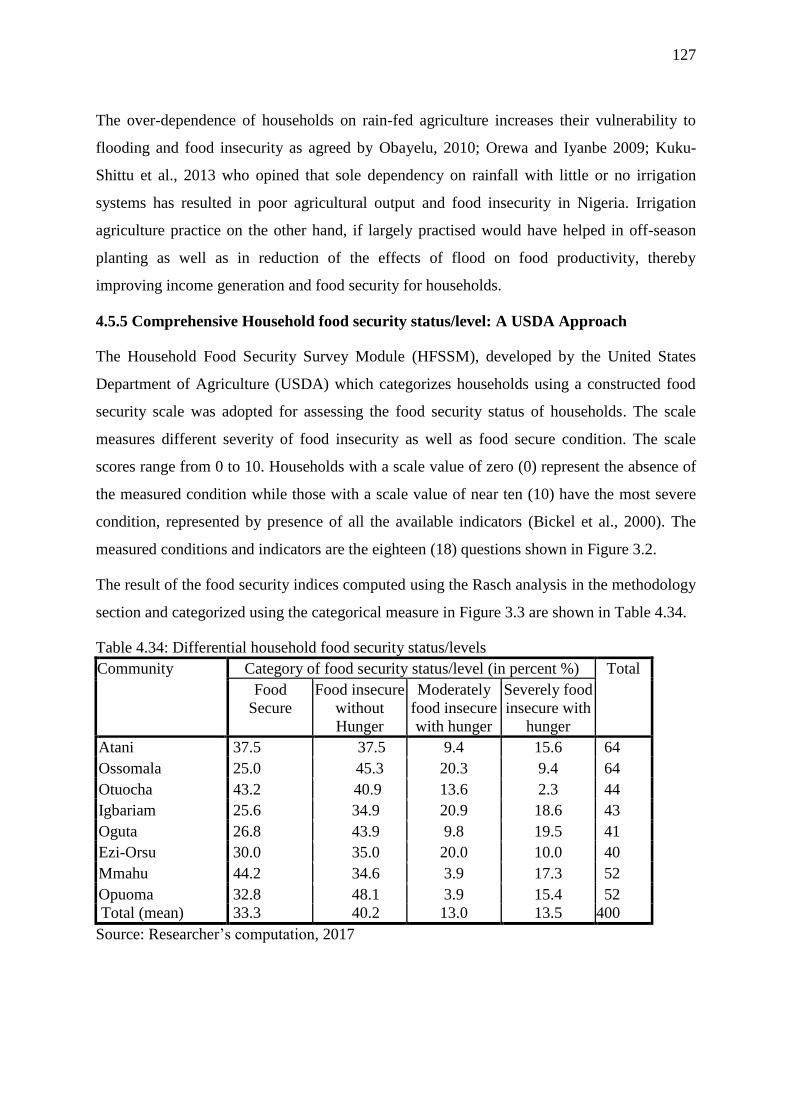
127
The over-dependence of households on rain-fed agriculture increases their vulnerability to
flooding and food insecurity as agreed by Obayelu, 2010; Orewa and Iyanbe 2009; Kuku-
Shittu et al., 2013 who opined that sole dependency on rainfall with little or no irrigation
systems has resulted in poor agricultural output and food insecurity in Nigeria. Irrigation
agriculture practice on the other hand, if largely practised would have helped in off-season
planting as well as in reduction of the effects of flood on food productivity, thereby
improving income generation and food security for households.
4.5.5 Comprehensive Household food security status/level: A USDA Approach
The Household Food Security Survey Module (HFSSM), developed by the United States
Department of Agriculture (USDA) which categorizes households using a constructed food
security scale was adopted for assessing the food security status of households. The scale
measures different severity of food insecurity as well as food secure condition. The scale
scores range from 0 to 10. Households with a scale value of zero (0) represent the absence of
the measured condition while those with a scale value of near ten (10) have the most severe
condition, represented by presence of all the available indicators (Bickel et al., 2000). The
measured conditions and indicators are the eighteen (18) questions shown in Figure 3.2.
The result of the food security indices computed using the Rasch analysis in the methodology
section and categorized using the categorical measure in Figure 3.3 are shown in Table 4.34.
Table 4.34: Differential household food security status/levels
Community Category of food security status/level (in percent %) Total
Food
Secure
Food insecure
without
Hunger
Moderately
food insecure
with hunger
Severely food
insecure with
hunger
Atani 37.5 37.5 9.4 15.6 64
Ossomala 25.0 45.3 20.3 9.4 64
Otuocha 43.2 40.9 13.6 2.3 44
Igbariam 25.6 34.9 20.9 18.6 43
Oguta 26.8 43.9 9.8 19.5 41
Ezi-Orsu 30.0 35.0 20.0 10.0 40
Mmahu 44.2 34.6 3.9 17.3 52
Opuoma 32.8 48.1 3.9 15.4 52
Total (mean) 33.3 40.2 13.0 13.5 400
Source: Researcher’s computation, 2017

128
4.5.6 Differential household food security status/levels
The score position of households on the food security scale is based on the overall pattern of
response to the complete set of indicators by the households (Bickel et al., 2000). A large
proportion of households’ position on the scale was between 2.33 and 10 implying a high
level of food insecurity. In general, one third of households in south eastern Nigeria were
food secure with 40.2% households being food insecure without hunger. As regards
households that were food insecure with hunger, 13% were moderately food insecure with
hunger whereas 13.5% were severely food insecure with hunger. This implies that about two
third of households in the study were food insecure while the remaining (one third) were food
secure.
Discussion
4.5.6.1 Food secure households
Food secure households are those that reported very limited or no food insecurity or hunger
experiences and had very low scores ranging from 0-2.32 on the food security scale. This is
as a result of fewer affirmative responses to the structured food security questions.
Mmahu community recorded the highest percentage (44.2%) with food secure households
and Ossomala community recorded the lowest (25%). Food secure households in Otuocha
community accounted for 43.2% making it the second most food secure community after
Mmahu. Atani, Opuoma and Ezi-Orsu communities in a decreasing order constituted
households with the “food secure” status of ≥30%. More than a quarter of households in
Oguta and Igbariam were food secure. This implies that a larger proportion of households in
Mmahu, Otuocha, Atani and Opuoma communities had minimal evidence of food insecurity
than were households in Ezi-Orsu, Oguta, Igbariam and Ossomala (Table 4.34).
The high food security level of these communities could be attributed to a majority of their
households being headed by married people who were males and had other sources of
livelihoods which generated off-farm income. In addition, a substantive number of them were
high income earners who owned livestock/poultry with larger farm sizes as well as practised
irrigation. They also had received financial support and had nutrition knowledge.
4.5.6.2 Food insecure without hunger households
Households in this category reported little or no reduced food intake of their members. These
households had concerns as regards adequate food supply and household food management
129
as well as felt anxious about their food being sufficient to meet basic needs (Bickel et al.,
2000; Ibok, Idiong et al., 2014) but, there was no presence of hunger among their members.
This category’s score ranges from 2.33 - 4.56 on the food security scale.
The majority of households across the eight communities fall into this category, with a
percentage representation of more than one third of households in each community. Opuoma,
Ossomala, Oguta and Otuocha had more than 40% households termed “food insecure without
hunger” while Atani, Ezi-Orsu, Igbariam and Mmahu accounted for over 30% each of
households in this category. This for instance shows that about half (48.1%) of households in
Opuoma had inadequate food supplies and food budget as well as felt the anxiety of not
having sufficient food and these were experienced least in Mmahu community.
4.5.6.3 Moderately food insecure households with hunger
Households in this category have affirmative responses to at least three adult hunger
indicators/questions. Adults in this category had repeatedly experienced the physical
sensation of hunger due to reduction in their food intake while their children in most cases
had no such experience. The scale scores of this category fall between 4.57 and 6.53 on the
food security scale. Adults in households in Igbariam, Ossomala, Ezi-Orsu and Otuocha
communities who had experienced hunger were 20.9%, 20.3%, 20% and 13.6% respectively.
Similarly, 9.8% and 9.4% households in Oguta and Atani comprised adults who had
experienced reduced food intake whereas each of Mmahu and Opuoma communities have
had 3.9% households of adults with reduced food intake as a result of insufficient food supply
and funds to acquire more.
4.5.6.4 Severely food insecure households with hunger
Households in this category had repeatedly reduced food intake for all their members (adults
and children). This implies that both adults and children experienced hunger, and the scale
scores for this category range from 6.54–10.0 on the food security scale. This is the most
extreme of all the categories consisting of households that have given an affirmative response
to a large number of the severe conditions.
Otuocha community had the smallest number (2.3%) of severely food insecure households
with both adults and children who had experienced hunger while Oguta community had the
largest number (19.5%) of households followed by Igbariam with 18.6% in this category. A
smaller number (9.4%) of households in Ossomala fall into this category with 17.3%, 15.6%,
130
15.4% and 10% of households in Mmahu, Atani, Opuoma and Ezi-Orsu having had both their
adults and children repeatedly reduced their food intake as a result of insufficient food,
inadequate food supply and no resources to acquire more food. Households in this category
are the food insecurity hotspots that would need some assistance for them to cope in times of
food shortage.
4.6 Determinant of Household Food Security in South eastern Nigeria
A binary logistic regression was run to examine the significance of the determinants of food
security in the study area. Food security status was the dependent variable, Y, (p/1-p), while
its determinants were the independent variables, X. Expressed in terms of the variables used
in our study, the binary logistic regression equation is given as;
Log (p/1-p) = a + b1x1+...b25x25 (see methodology).
The Cox and Snell, coefficient of determination, R2 is .426 which means 42.6% probability of
the food security status is explained by the logistic model, and with an 82.5% correct
classification, the model is good. The Log likelihood Ratio (LR) showed by the Chi-Squared
test statistic (286.408) was significant at 5% level, meaning that the independent variables in
the model explained the probability of the household food security status reasonably.
The result of the Logistic Regression Analysis showing the relationship between household
food security status and its determinants is shown in Table 4.35. Twenty-five (25) variables
were hypothesized as determinants of food security status in the study area. Out of these 25
variables, only eleven (11) were statistically significant at 5% level of significance (Table
4.35). The statistically significant variables that influence household food security status in
Southeastern, Nigeria are; sex, marital status, level of education, off-farm income, monthly
income, dependency ratio, sufficiency in food production, livestock ownership, village
poultry/poultry ownership, irrigation practice and flood experience.
4.6.1 Sex
Sex had a positive and statistically significant relationship with food security at 5% level,
indicating that male headed households were more food secure than their female headed
counterparts. This may be as a result of men having more access to land which increases their
own crop production as well as their food security since most of the respondents produced
their own food. This could also be ascertained as most male headed households accounted for
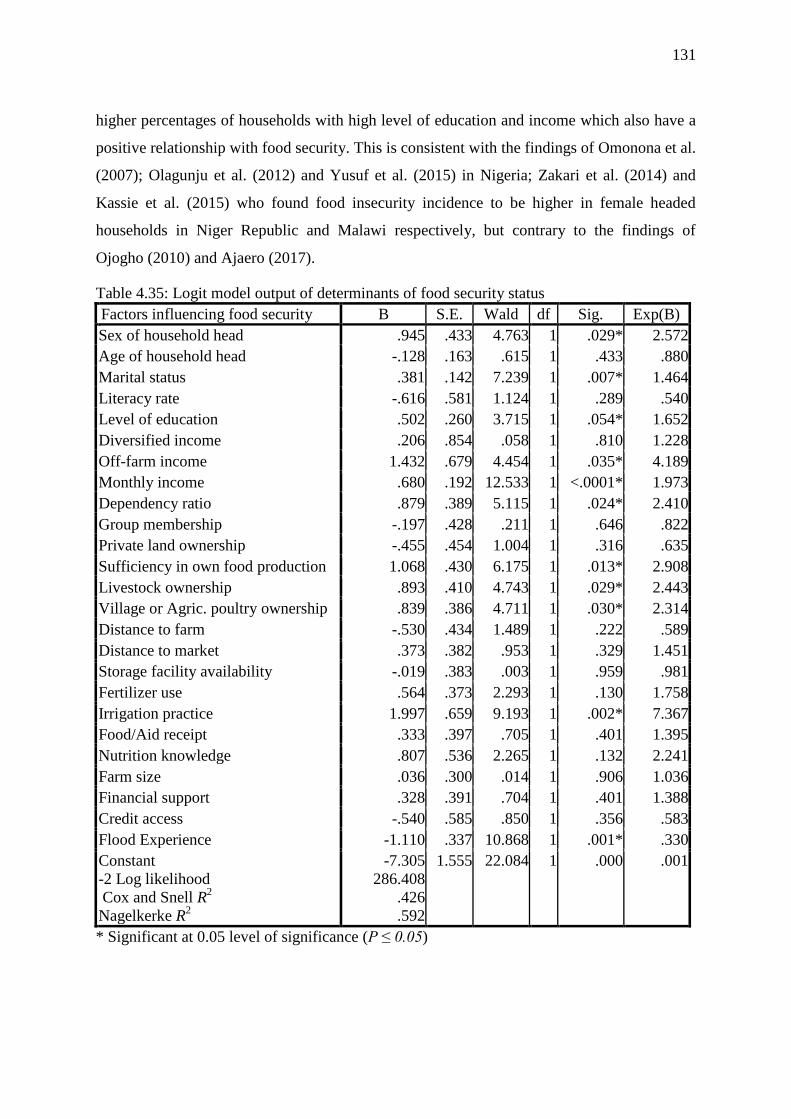
131
higher percentages of households with high level of education and income which also have a
positive relationship with food security. This is consistent with the findings of Omonona et al.
(2007); Olagunju et al. (2012) and Yusuf et al. (2015) in Nigeria; Zakari et al. (2014) and
Kassie et al. (2015) who found food insecurity incidence to be higher in female headed
households in Niger Republic and Malawi respectively, but contrary to the findings of
Ojogho (2010) and Ajaero (2017).
Table 4.35: Logit model output of determinants of food security status
Factors influencing food security B S.E. Wald df Sig. Exp(B)
Sex of household head .945 .433 4.763 1 .029* 2.572
Age of household head -.128 .163 .615 1 .433 .880
Marital status .381 .142 7.239 1 .007* 1.464
Literacy rate -.616 .581 1.124 1 .289 .540
Level of education .502 .260 3.715 1 .054* 1.652
Diversified income .206 .854 .058 1 .810 1.228
Off-farm income 1.432 .679 4.454 1 .035* 4.189
Monthly income .680 .192 12.533 1 <.0001* 1.973
Dependency ratio .879 .389 5.115 1 .024* 2.410
Group membership -.197 .428 .211 1 .646 .822
Private land ownership -.455 .454 1.004 1 .316 .635
Sufficiency in own food production 1.068 .430 6.175 1 .013* 2.908
Livestock ownership .893 .410 4.743 1 .029* 2.443
Village or Agric. poultry ownership .839 .386 4.711 1 .030* 2.314
Distance to farm -.530 .434 1.489 1 .222 .589
Distance to market .373 .382 .953 1 .329 1.451
Storage facility availability -.019 .383 .003 1 .959 .981
Fertilizer use .564 .373 2.293 1 .130 1.758
Irrigation practice 1.997 .659 9.193 1 .002* 7.367
Food/Aid receipt .333 .397 .705 1 .401 1.395
Nutrition knowledge .807 .536 2.265 1 .132 2.241
Farm size .036 .300 .014 1 .906 1.036
Financial support .328 .391 .704 1 .401 1.388
Credit access -.540 .585 .850 1 .356 .583
Flood Experience -1.110 .337 10.868 1 .001* .330
Constant
-2 Log likelihood
Cox and Snell R2
Nagelkerke R2
-7.305
286.408
.426
.592
1.555 22.084 1 .000 .001
* Significant at 0.05 level of significance (P ≤ 0.05)
132
The odds ratio of sex of household heads was 2.572 implying that male-headed households
(MHHs) are 2.572 times more likely to be food secure than female-headed households
(FHHs) (Table 4.35). This is evident in Table 4.36 where 34.2% of MHHs were food secure
as opposed to 32% of FHHs while only 6.2% of the MHHs were severely food insecure and
22.9% of FHHs were severely food insecure.
4.6.2 Marital Status of head of household
Marital status was statistically significant at 5% and the coefficient revealed that households
headed by married people had the likelihood of being more food secure than those headed by
single people, and this in line with the findings of Sekhampu (2013) who reported married
respondents in Kwakwatsi, South Africa being more food secure than unmarried respondents
as well as in consistence with the findings of Magaña-Lemus et al. (2013) in Mexico;
Djangmah (2016) in Ghana; Habyarimana (2015) in Rwanda and Yusuf et al. (2015) in
Nigeria. The reason for married people being more food secure could be traced to relative
contributions (e.g. financial, labour wise) of married couples which increases different
dimensions of food security. Contrarily, the findings of Aidoo et al. (2013) showed that
household food security for unmarried respondents was relatively more than their married
counterparts. The odds ratio revealed that married people-headed households are 1.464 times
probable to be food secure than unmarried people-headed households (Table 4.35). Table
4.36 shows that 33.3% households headed by married people were more food secure while
only 6.5% of those headed by unmarried people were food secure.
4.6.3 Level of Education of head of household
There was a positive and statistically significant (5%) relationship between level of education
of head of household and food security of households, indicating that food security increases
with higher level of education and vice versa. The odds ratio implies that with each unit
increase in level of education, the probability of households to be food secure increases by
1.652 times (Table 4.35). Education has been viewed as a social capital which influence
production and nutritional decisions (Ibok, Bassey, et al., 2014), so it is not surprising that
more educated households in the study area were more food secure. The result agrees with
those of Babatunde et al. (2007); Nyangwesoi et al. (2007); Omonona et al. (2007); Asogwa
and Umeh (2012); Bashir et al. (2012); Olagunju et al. (2012); Henri-Ukoha et al. (2013);
Ibok, Bassey, et al. (2014); Tefera and Tefera (2014); Wiranthi et al. (2014); Mungai (2014);
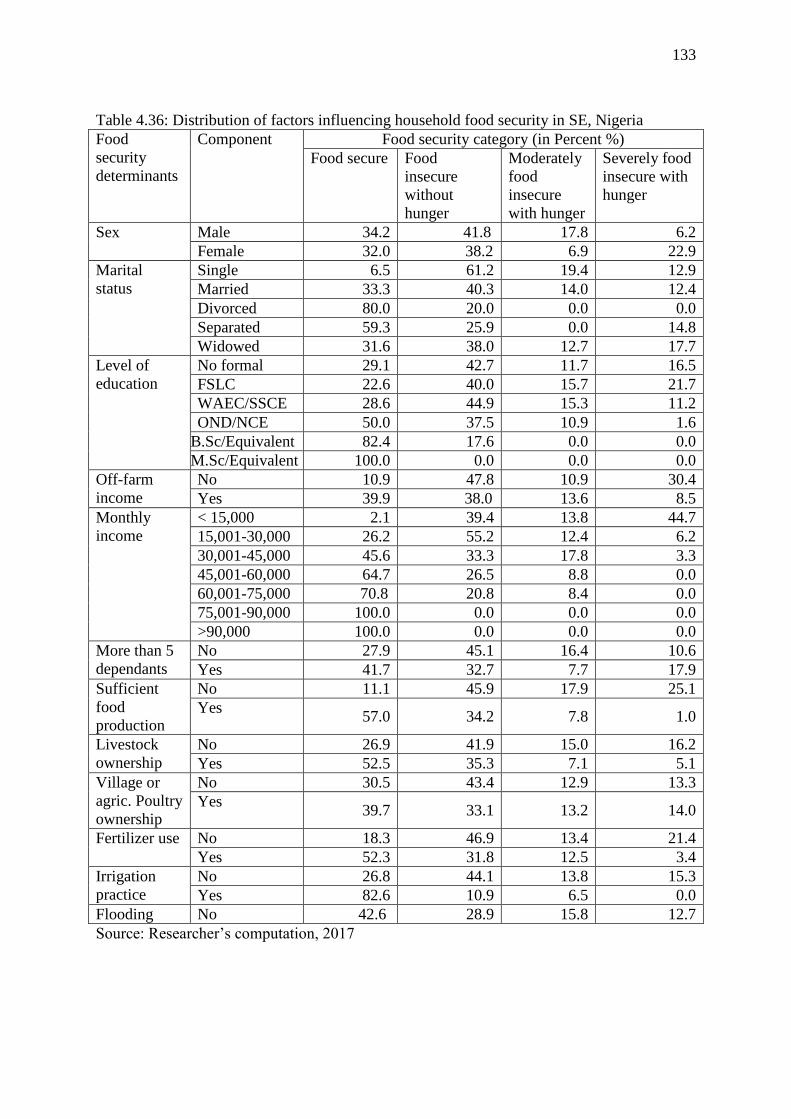
133
Table 4.36: Distribution of factors influencing household food security in SE, Nigeria
Food
security
determinants
Component Food security category (in Percent %)
Food secure Food
insecure
without
hunger
Moderately
food
insecure
with hunger
Severely food
insecure with
hunger
Sex Male 34.2 41.8 17.8 6.2
Female 32.0 38.2 6.9 22.9
Marital
status
Single 6.5 61.2 19.4 12.9
Married 33.3 40.3 14.0 12.4
Divorced 80.0 20.0 0.0 0.0
Separated 59.3 25.9 0.0 14.8
Widowed 31.6 38.0 12.7 17.7
Level of
education
No formal 29.1 42.7 11.7 16.5
FSLC 22.6 40.0 15.7 21.7
WAEC/SSCE 28.6 44.9 15.3 11.2
OND/NCE 50.0 37.5 10.9 1.6
B.Sc/Equivalent 82.4 17.6 0.0 0.0
M.Sc/Equivalent 100.0 0.0 0.0 0.0
Off-farm
income
No 10.9 47.8 10.9 30.4
Yes 39.9 38.0 13.6 8.5
Monthly
income
< 15,000 2.1 39.4 13.8 44.7
15,001-30,000 26.2 55.2 12.4 6.2
30,001-45,000 45.6 33.3 17.8 3.3
45,001-60,000 64.7 26.5 8.8 0.0
60,001-75,000 70.8 20.8 8.4 0.0
75,001-90,000 100.0 0.0 0.0 0.0
>90,000 100.0 0.0 0.0 0.0
More than 5
dependants
No 27.9 45.1 16.4 10.6
Yes 41.7 32.7 7.7 17.9
Sufficient
food
production
No 11.1 45.9 17.9 25.1
Yes 57.0 34.2 7.8 1.0
Livestock
ownership
No 26.9 41.9 15.0 16.2
Yes 52.5 35.3 7.1 5.1
Village or
agric. Poultry
ownership
No 30.5 43.4 12.9 13.3
Yes 39.7 33.1 13.2 14.0
Fertilizer use No 18.3 46.9 13.4 21.4
Yes 52.3 31.8 12.5 3.4
Irrigation
practice
No 26.8 44.1 13.8 15.3
Yes 82.6 10.9 6.5 0.0
Flooding No 42.6 28.9 15.8 12.7
Source: Researcher’s computation, 2017
134
Mutinda (2015); Ajaero (2017) and Dawit and Zeray (2017) who revealed that more educated
households are more food secure, though contrary to the findings of Yusuf et al. (2015) and
Djangmah (2016), who noted a significant negative relationship between food security and
number of years spent in education in Nigeria and Northern region of Ghana respectively.
The evidence is obvious in Table 3.36 where respondents with Master’s and Bachelor’s
degrees or their equivalent were 100% and 82.1% food secure respectively while households
headed by people with no formal education were only 29.1% food secure.
4.6.4 Off-farm Income
The coefficient of off-farm income was positive and significant at 5% implying that the
higher the household off-farm income, the higher the likelihood of that household to be food
secure. Household’s off-farm income will increase the food security status of that household
by the factor 4.189 (Table 4.35). This could be attributed to the fact that off-farm income
shows that agrarian households have diversified their sources of livelihoods (e.g. teaching,
construction labourers, trading, basket weaving) away from farming activities which has a
positive effect on food security because the income helps in times of flood-induced food
insecurity with associated food shortage. In addition, off-farm income could be invested in
agriculture to increase crop production as well as household food availability concurring with
the findings of Asogwa and Umeh (2012) and Olagunju et al. (2012) in Nigeria; Aidoo et al.
(2013) and Djangmah (2016) in Ghana; Mitiku et al. (2012); Tefera and Tefera (2014) and
Dawit and Zeray (2017) in Ethiopia, and Wiranthi et al. (2014) in Indonesia.
The relationship between off-farm income and food security was further illustrated in Table
4.36 where 39.9% of households with off-farm income were food secure and only 10.9%
without off-farm income were food secure.
4.6.5 Monthly Income of head of household
The coefficient of monthly income was positive and statistically significant at 5% level. This
implies that the higher the household monthly income, the more the level of food security,
and the lower the household monthly income, the more food insecure they are. The odds ratio
in favour of households to be food secure increased by 1.973 times by every increase in
monthly income (Table 4.35). This could be ascertained as income remains a very crucial
factor that influences accessibility and availability of food as also supported by Battersby
(2011) who noted income to make a significant difference in reducing (though not eliminate
135
totally) food insecurity. Similar findings of a positive relationship between income and food
security were reported by Omotesho et al. (2006) ; Omonona et al. (2007); Arene and Anyaeji
(2010); Battersby (2011); Bashir (2012); Aidoo et al. (2013); Henri-Ukoha et al. (2013);
Sekhampu (2013); Mungai (2014); Mutinda (2015) and Djangmah (2016). Only 2.1% of
households with <15,000 Naira monthly were food secure while 100% of all the households
that earned 75,000 Naira and above monthly, were food secure, meaning none were food
insecure (Table 4.36).
However, the presence of food secure and different levels of food insecure categories across
households irrespective of their monthly income suggests that income is not the only
determinant of food security in study area.
4.6.6 Dependency Ratio of household
The coefficient of dependency ratio was positive and statistically significant at 5%. Contrary
to the findings of several researchers (Omonona et al., 2007; Ojogho, 2010; Asogwa and
Umeh, 2012; Aidoo et al., 2013; Sekhampu, 2013; Ibok, Bassey, et al., 2014; Mutinda, 2015;
Djangmah, 2016 and Dawit and Zeray, 2017) that households with larger number of
dependants were more food insecurity, our results revealed that households with more than
five (5) dependants were more likely to be food secure than those with lesser number of
dependants. Our findings are in line with the findings of Oluoko-Odingo (2006) and Ajaero
(2017). The odds ratio in support of food security enhances by the factor 2.41 as the number
of dependant is increased by one (Table 4.35). Households with more than five dependants
(41.7%) were more food secure than households with fewer number (27.9%) in Southeastern
Nigeria (Table 4.36).
However, the observed likelihood of households with high dependency ratio being more food
secure could be attributed to the fact that other factors (e.g. income) influence food security
too, as evident in the study area where some high income earners had a dependency ratio of
≥5 dependants. According to Ibok, Bassey, et al. (2014), high dependency ratio means
increase in the number of consumers which put pressure on household resources especially
food, yet high dependency ratio could be an advantage in areas of cheap labour (more free
hands to work in farms) and crop production in agrarian households which is depicted in our
findings.

136
4.6.7 Sufficiency in own food production
Most households in our study are agrarian and agrarian households usually depend on their
own food production. The regression result showed a positive and statistically significant
(5%) relationship between sufficient food production and household food security implying
that, the more sufficient a household is in own food production, the more likely food secure,
that household will be. An odds ratio of 2.908 indicates that a household that produces
sufficient food for its members was 2.908 times likely to be food secure than a household that
had not (Table 4.35). This is in agreement with the findings of Ojogho (2010); Asogwa and
Umeh (2012) and Ibok, Bassey, et al. (2014) in Nigeria and Djangmah (2016) in Ghana.
Table 4.36 shows that 57% of households that produced sufficient food were food secure
while only 11.1% of those that did not produce sufficient food were food secure.
4.6.8 Livestock ownership
Livestock ownership was statistically significant at 5% and the coefficient revealed that
households who reared livestock were more food secure than those that did not. The positive
contribution of livestock ownership to food security is the fact that it could serve as a source
of income and food in times of food shortage and livestock (including poultry) are seen as
asset, and our findings is in tandem with the findings of Mitiku et al. (2012); Welderufael
(2014); Goshu (2016); Dawit and Zeray (2017) all in Ethiopia. Assets ownership as noted by
Asogwa and Umeh (2012) are seen as one of the strategies for enhancing households’
resilience in the face of economic crisis arising from crop failure among others. The odds
ratio in favour of livestock ownership indicates that the probability of households to be food
secure increases by 2.443 times (Table 4.35) and this is illustrated in Table 4.36 where 52.5%
of households who owned livestock were food secure and 26.9% who did not own livestock
were food secure.
4.8.9 Village poultry or Agricultural poultry ownership
The ownership of village or agricultural poultry was statistically significant at 5% and the
positive coefficient showed that an increase in ownership of poultry leads to an increase in
food security and a decrease in food insecurity. Ownership of poultry is a form of income
diversification which impact significantly on food security and our finding is supported by
the findings of Welderufael (2014). The odds ratio in favour of households that are food
secure increases by 2.314 times by every increase in poultry ownership (Table 4.35).
137
Households that owned poultry were more food secure (39.7%) than those that did not (30%)
own poultry (Table 4.36).
4.6.10 Irrigation practice
There was a positive and statistically significant (5%) relationship between irrigation practice
and food security status, meaning that households that practised irrigation farming were more
food secure. This contribution is most significant during off-season of some crops and in
times of unpredicted weather fluctuations e.g. the rains starting late and little or no rains in
the rainy season. The odds ratio revealed that households that practised irrigation were 7.367
times likely to be food secure than those that had not (Table 4.35). Table 4.36 shows that
82.6% of households that practised irrigation were food secure while only 26.8% of those that
did not practise irrigation were food secure.
4.6.11 Flooding
The coefficient of the relationship between flood experience and food security was negative
and statistically significant at 5%. The implication of the result is that, the more a household
experiences flooding with their houses affected, the more food insecure that household
becomes. The result implies that a unit increase in flood experience reduces the odd of
household food security by 0.33times (Table 4.35). Concurringly, Ramakrishna et al. (2014)
and Zakari et al. (2014) found out that floods have positive impact on household food
insecurity in Khammam (India) and Niger respectively. The negative effects of floods
include; destruction of farmland and storage facilities leading to crop failure and food
shortage, thereby increasing food insecurity. 50.5% of households that had experienced
flooding effect at home were food insecure while only 28.9% of those who had not were food
insecure. Conversely, 24.8% of households that had experienced flooding effect were food
secure while 42.6% of households that had not experience flooding were food secure (Table
4.36).
4.7 Hypothesis testing: Variations in determinants of household food security
Analysis of variance (ANOVA) was used to test the null hypothesis: “there is no significant
difference in the determinants of food (in)security among households in the agrarian
communities” at 0.05 level of significance. Since the calculated Snedecor’s F test value
(6.896) is greater than the critical F test value (1.5173), the hypothesis was rejected (Table
4.37), implying a statistically significant difference in the determinants of household food
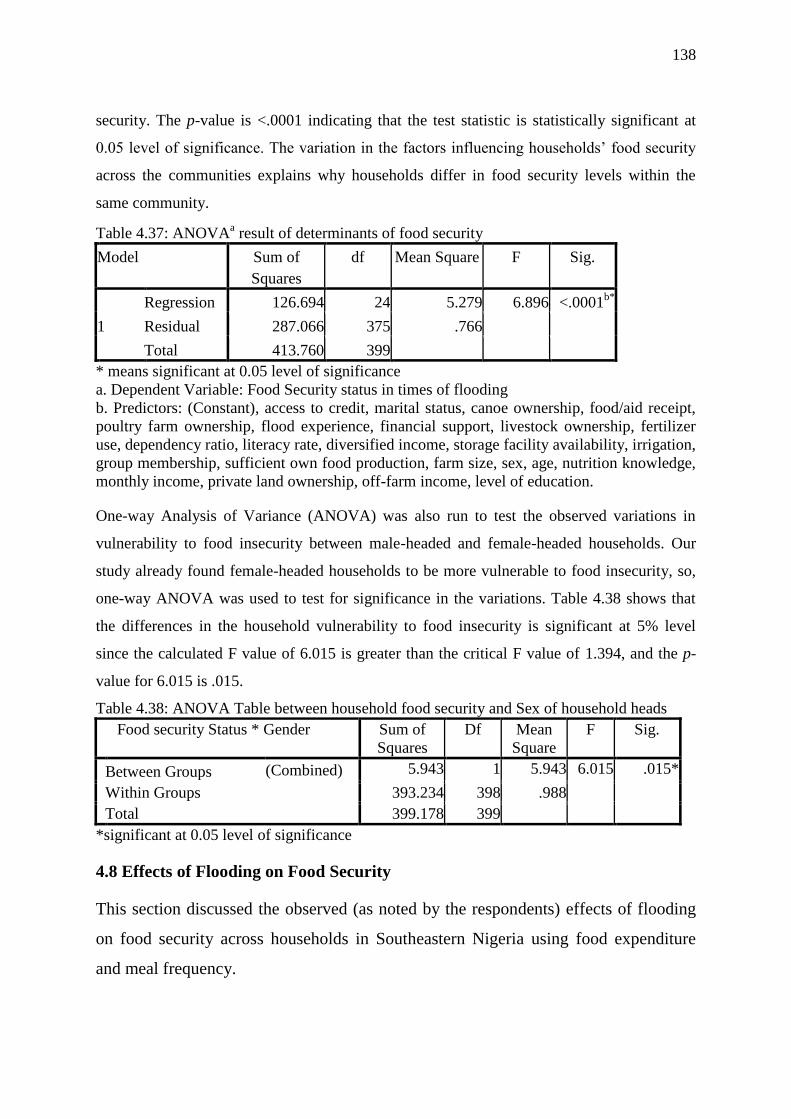
138
security. The p-value is <.0001 indicating that the test statistic is statistically significant at
0.05 level of significance. The variation in the factors influencing households’ food security
across the communities explains why households differ in food security levels within the
same community.
Table 4.37: ANOVAa result of determinants of food security
Model Sum of
Squares
df Mean Square F Sig.
1
Regression 126.694 24 5.279 6.896 <.0001b*
Residual 287.066 375 .766
Total 413.760 399
* means significant at 0.05 level of significance
a. Dependent Variable: Food Security status in times of flooding
b. Predictors: (Constant), access to credit, marital status, canoe ownership, food/aid receipt,
poultry farm ownership, flood experience, financial support, livestock ownership, fertilizer
use, dependency ratio, literacy rate, diversified income, storage facility availability, irrigation,
group membership, sufficient own food production, farm size, sex, age, nutrition knowledge,
monthly income, private land ownership, off-farm income, level of education.
One-way Analysis of Variance (ANOVA) was also run to test the observed variations in
vulnerability to food insecurity between male-headed and female-headed households. Our
study already found female-headed households to be more vulnerable to food insecurity, so,
one-way ANOVA was used to test for significance in the variations. Table 4.38 shows that
the differences in the household vulnerability to food insecurity is significant at 5% level
since the calculated F value of 6.015 is greater than the critical F value of 1.394, and the p-
value for 6.015 is .015.
Table 4.38: ANOVA Table between household food security and Sex of household heads
Food security Status * Gender Sum of
Squares
Df Mean
Square
F Sig.
Between Groups (Combined) 5.943 1 5.943 6.015 .015*
Within Groups 393.234 398 .988
Total 399.178 399
*significant at 0.05 level of significance
4.8 Effects of Flooding on Food Security
This section discussed the observed (as noted by the respondents) effects of flooding
on food security across households in Southeastern Nigeria using food expenditure
and meal frequency.
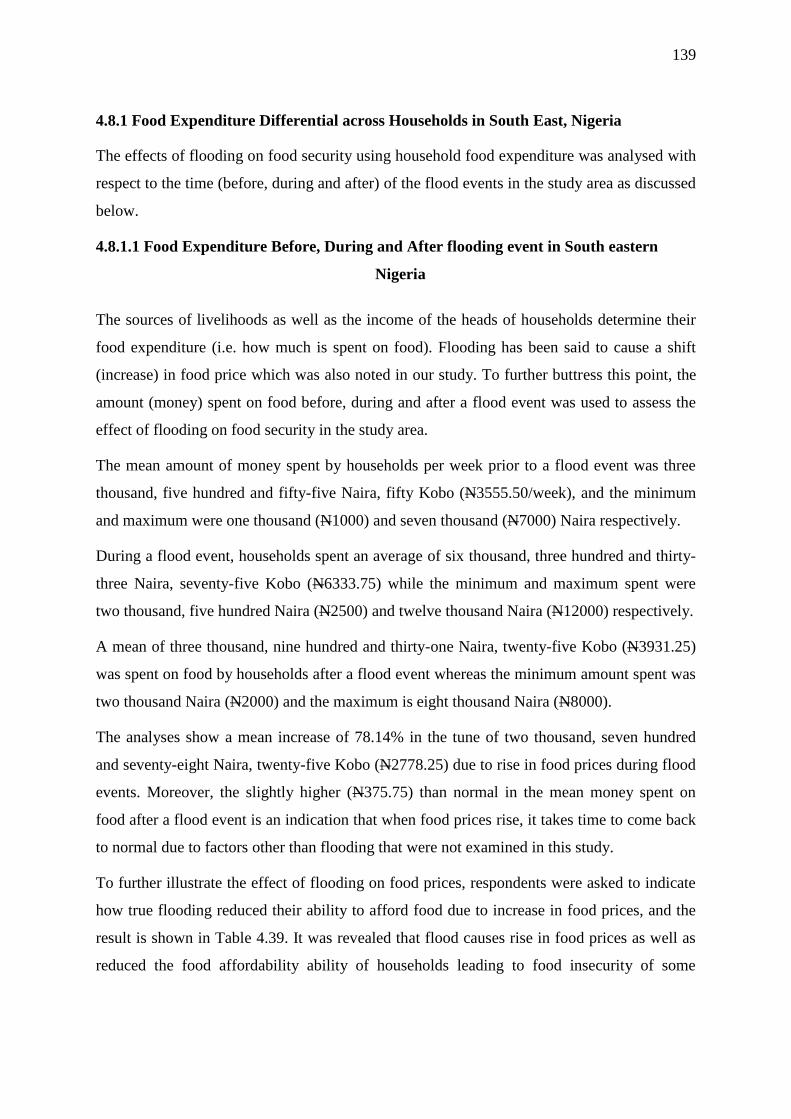
139
4.8.1 Food Expenditure Differential across Households in South East, Nigeria
The effects of flooding on food security using household food expenditure was analysed with
respect to the time (before, during and after) of the flood events in the study area as discussed
below.
4.8.1.1 Food Expenditure Before, During and After flooding event in South eastern
Nigeria
The sources of livelihoods as well as the income of the heads of households determine their
food expenditure (i.e. how much is spent on food). Flooding has been said to cause a shift
(increase) in food price which was also noted in our study. To further buttress this point, the
amount (money) spent on food before, during and after a flood event was used to assess the
effect of flooding on food security in the study area.
The mean amount of money spent by households per week prior to a flood event was three
thousand, five hundred and fifty-five Naira, fifty Kobo (N3555.50/week), and the minimum
and maximum were one thousand (N1000) and seven thousand (N7000) Naira respectively.
During a flood event, households spent an average of six thousand, three hundred and thirty-
three Naira, seventy-five Kobo (N6333.75) while the minimum and maximum spent were
two thousand, five hundred Naira (N2500) and twelve thousand Naira (N12000) respectively.
A mean of three thousand, nine hundred and thirty-one Naira, twenty-five Kobo (N3931.25)
was spent on food by households after a flood event whereas the minimum amount spent was
two thousand Naira (N2000) and the maximum is eight thousand Naira (N8000).
The analyses show a mean increase of 78.14% in the tune of two thousand, seven hundred
and seventy-eight Naira, twenty-five Kobo (N2778.25) due to rise in food prices during flood
events. Moreover, the slightly higher (N375.75) than normal in the mean money spent on
food after a flood event is an indication that when food prices rise, it takes time to come back
to normal due to factors other than flooding that were not examined in this study.
To further illustrate the effect of flooding on food prices, respondents were asked to indicate
how true flooding reduced their ability to afford food due to increase in food prices, and the
result is shown in Table 4.39. It was revealed that flood causes rise in food prices as well as
reduced the food affordability ability of households leading to food insecurity of some
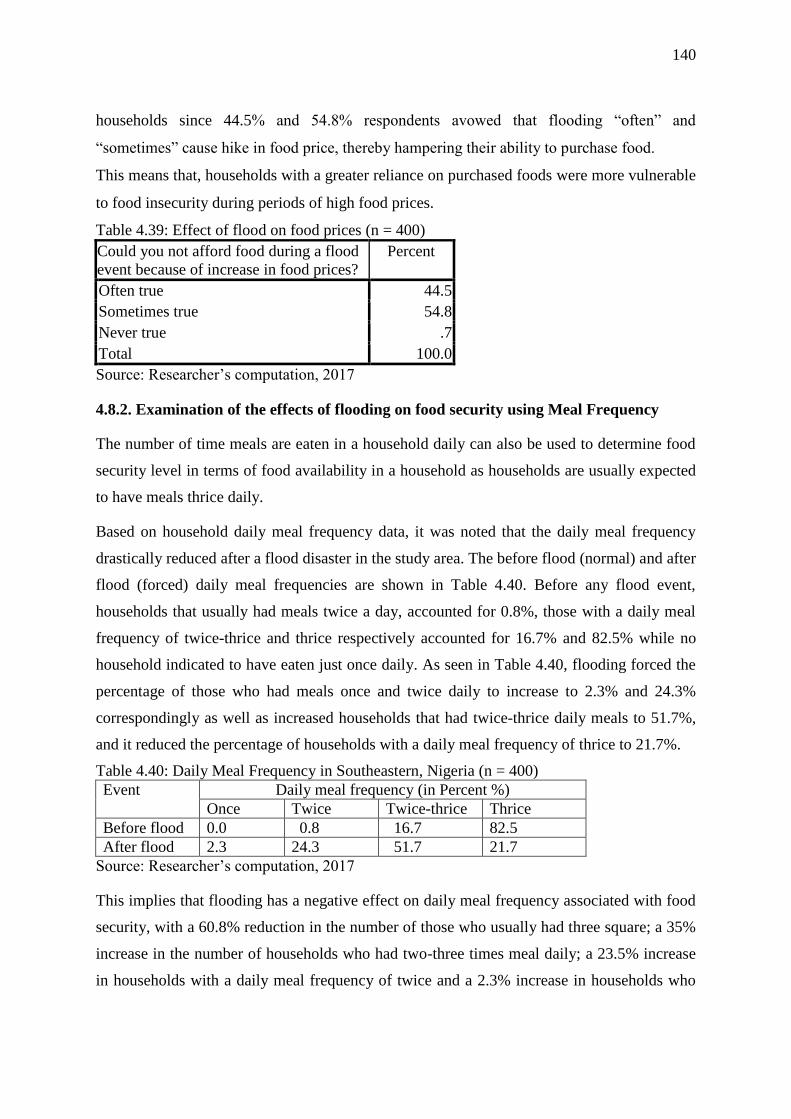
140
households since 44.5% and 54.8% respondents avowed that flooding “often” and
“sometimes” cause hike in food price, thereby hampering their ability to purchase food.
This means that, households with a greater reliance on purchased foods were more vulnerable
to food insecurity during periods of high food prices.
Table 4.39: Effect of flood on food prices (n = 400)
Could you not afford food during a flood
event because of increase in food prices?
Percent
Often true 44.5
Sometimes true 54.8
Never true .7
Total 100.0
Source: Researcher’s computation, 2017
4.8.2. Examination of the effects of flooding on food security using Meal Frequency
The number of time meals are eaten in a household daily can also be used to determine food
security level in terms of food availability in a household as households are usually expected
to have meals thrice daily.
Based on household daily meal frequency data, it was noted that the daily meal frequency
drastically reduced after a flood disaster in the study area. The before flood (normal) and after
flood (forced) daily meal frequencies are shown in Table 4.40. Before any flood event,
households that usually had meals twice a day, accounted for 0.8%, those with a daily meal
frequency of twice-thrice and thrice respectively accounted for 16.7% and 82.5% while no
household indicated to have eaten just once daily. As seen in Table 4.40, flooding forced the
percentage of those who had meals once and twice daily to increase to 2.3% and 24.3%
correspondingly as well as increased households that had twice-thrice daily meals to 51.7%,
and it reduced the percentage of households with a daily meal frequency of thrice to 21.7%.
Table 4.40: Daily Meal Frequency in Southeastern, Nigeria (n = 400)
Event Daily meal frequency (in Percent %)
Once Twice Twice-thrice Thrice
Before flood 0.0 0.8 16.7 82.5
After flood 2.3 24.3 51.7 21.7
Source: Researcher’s computation, 2017
This implies that flooding has a negative effect on daily meal frequency associated with food
security, with a 60.8% reduction in the number of those who usually had three square; a 35%
increase in the number of households who had two-three times meal daily; a 23.5% increase
in households with a daily meal frequency of twice and a 2.3% increase in households who
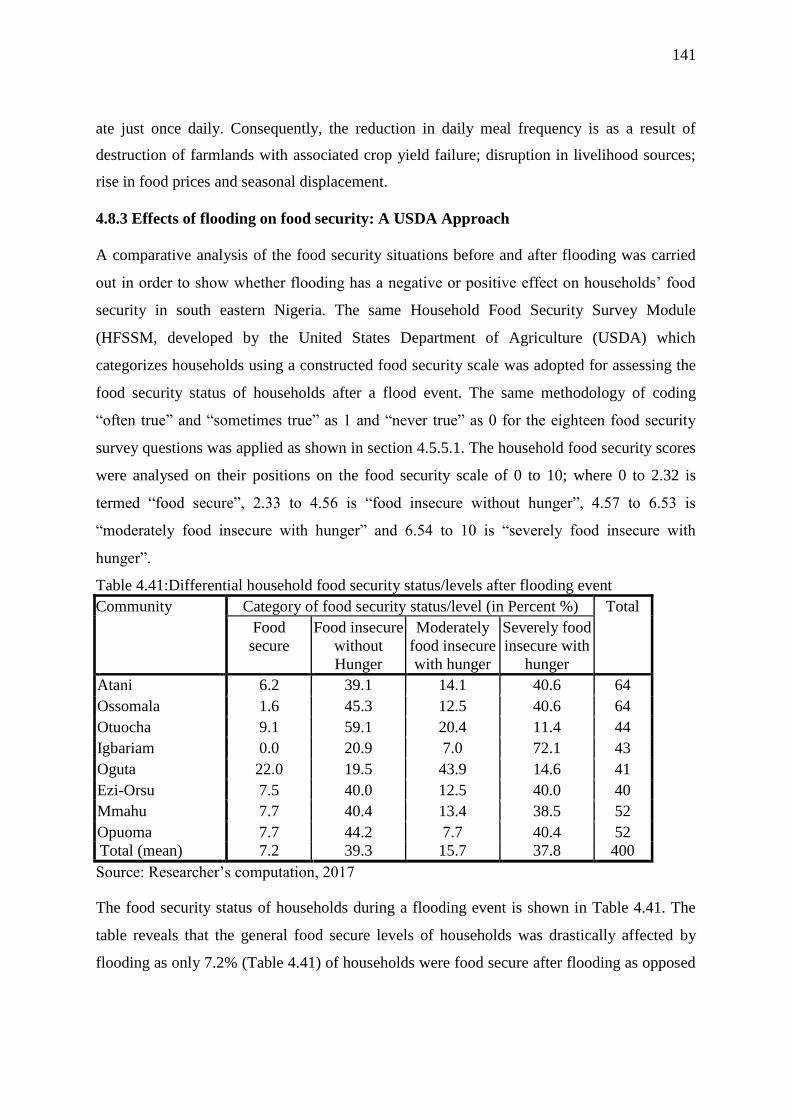
141
ate just once daily. Consequently, the reduction in daily meal frequency is as a result of
destruction of farmlands with associated crop yield failure; disruption in livelihood sources;
rise in food prices and seasonal displacement.
4.8.3 Effects of flooding on food security: A USDA Approach
A comparative analysis of the food security situations before and after flooding was carried
out in order to show whether flooding has a negative or positive effect on households’ food
security in south eastern Nigeria. The same Household Food Security Survey Module
(HFSSM, developed by the United States Department of Agriculture (USDA) which
categorizes households using a constructed food security scale was adopted for assessing the
food security status of households after a flood event. The same methodology of coding
“often true” and “sometimes true” as 1 and “never true” as 0 for the eighteen food security
survey questions was applied as shown in section 4.5.5.1. The household food security scores
were analysed on their positions on the food security scale of 0 to 10; where 0 to 2.32 is
termed “food secure”, 2.33 to 4.56 is “food insecure without hunger”, 4.57 to 6.53 is
“moderately food insecure with hunger” and 6.54 to 10 is “severely food insecure with
hunger”.
Table 4.41:Differential household food security status/levels after flooding event
Community Category of food security status/level (in Percent %) Total
Food
secure
Food insecure
without
Hunger
Moderately
food insecure
with hunger
Severely food
insecure with
hunger
Atani 6.2 39.1 14.1 40.6 64
Ossomala 1.6 45.3 12.5 40.6 64
Otuocha 9.1 59.1 20.4 11.4 44
Igbariam 0.0 20.9 7.0 72.1 43
Oguta 22.0 19.5 43.9 14.6 41
Ezi-Orsu 7.5 40.0 12.5 40.0 40
Mmahu 7.7 40.4 13.4 38.5 52
Opuoma 7.7 44.2 7.7 40.4 52
Total (mean) 7.2 39.3 15.7 37.8 400
Source: Researcher’s computation, 2017
The food security status of households during a flooding event is shown in Table 4.41. The
table reveals that the general food secure levels of households was drastically affected by
flooding as only 7.2% (Table 4.41) of households were food secure after flooding as opposed
142
to the 33.3% (Table 4.34) of households that were food secure before flooding. This implies
that flooding has a 26.1% reduction in the number of food secure households.
Consequently, 39.3% households were food insecure without hunger which is a bit lower
than 40.2% households that were food insecure without hunger before flooding. Flooding
forced a larger proportion of households to go into extreme food insecurity as there were
2.7% and 24.3% respective increase in the number of households that were moderately food
insecure with hunger and severely food insecure with hunger. With respect to households that
experienced extreme food insecurity, 15.7% were moderately food insecure with hunger
whereas 37.8% were severely food insecure with hunger.
Generally, in south eastern Nigeria, flooding reduced food security by increasing the number
of food insecure households to 92.8%, indicating a 26.5% increase of food insecure
households from normal.
The most affected in terms of flood-induced food insecurity was Igbariam community, where
all the households became food insecure after flooding with 72.1% experiencing extreme
food insecurity with hunger. The second most affected was Ossomala community which
recorded only 1.6% food secure households after flooding. The negative effects of flooding
on household food security is seen in Atani, Ezi-Orsu, Mmahu, Opuoma where <8% were
food secure with more than 90% becoming food insecure after flooding. Oguta community
seemed to be the least affected by flooding because 22% of her households were food secure
after flooding which is just 4.8% lower than the number recorded before flooding.
Conversely, the number of households that experienced severe food insecurity in Oguta after
flooding also reduced to 14.6% from the normal 19.5% before flooding. However, flooding
forced majority of households to move from food insecure without hunger status to either
moderately food insecure with hunger status or severely food insecure with hunger status
(with the exception of households in Oguta community), thereby increasing the number of
food insecurity hotspots. The implication is that, more households would be needing food
assistance to aid them cope with the flood-induced food insecurity.
The reasons for the high percentage of the extreme food insecurity recorded by households
were due to decrease in household food supply with associated reduction in children and
adults food intake as a result of inadequate resources to acquire food. It was also revealed that
flooding induced hunger, for example, more than 80% of households indicated to have been
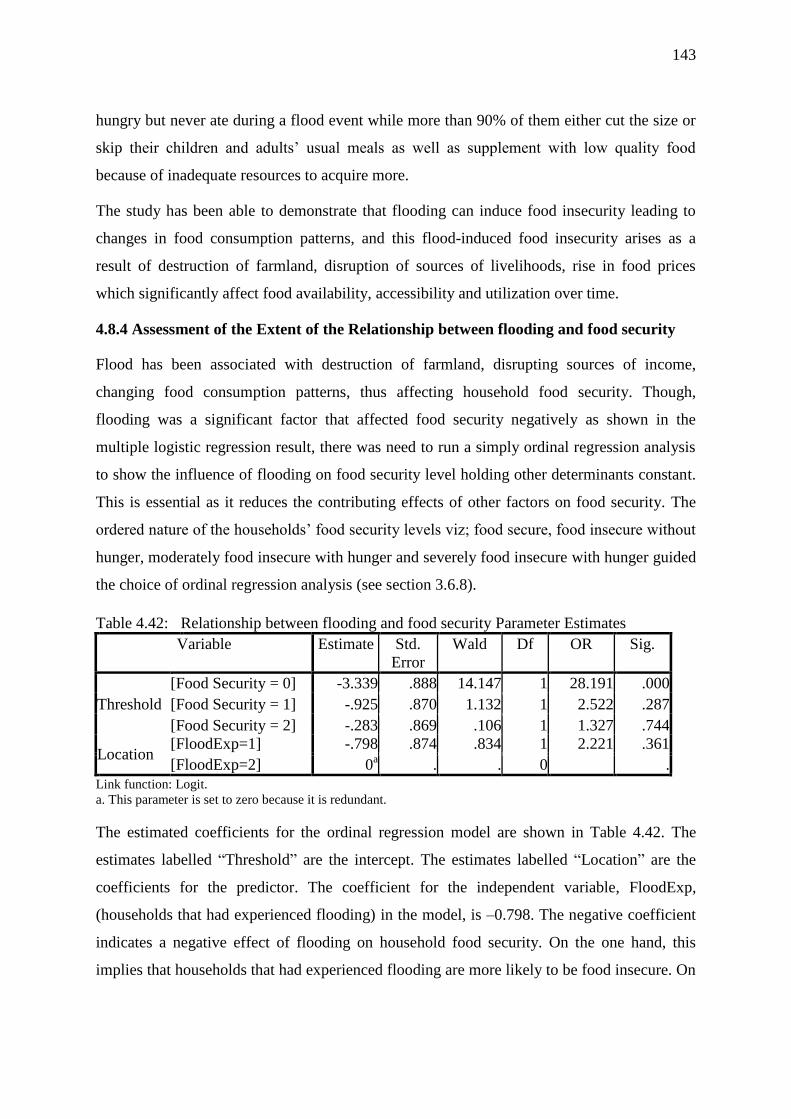
143
hungry but never ate during a flood event while more than 90% of them either cut the size or
skip their children and adults’ usual meals as well as supplement with low quality food
because of inadequate resources to acquire more.
The study has been able to demonstrate that flooding can induce food insecurity leading to
changes in food consumption patterns, and this flood-induced food insecurity arises as a
result of destruction of farmland, disruption of sources of livelihoods, rise in food prices
which significantly affect food availability, accessibility and utilization over time.
4.8.4 Assessment of the Extent of the Relationship between flooding and food security
Flood has been associated with destruction of farmland, disrupting sources of income,
changing food consumption patterns, thus affecting household food security. Though,
flooding was a significant factor that affected food security negatively as shown in the
multiple logistic regression result, there was need to run a simply ordinal regression analysis
to show the influence of flooding on food security level holding other determinants constant.
This is essential as it reduces the contributing effects of other factors on food security. The
ordered nature of the households’ food security levels viz; food secure, food insecure without
hunger, moderately food insecure with hunger and severely food insecure with hunger guided
the choice of ordinal regression analysis (see section 3.6.8).
Table 4.42: Relationship between flooding and food security Parameter Estimates
Variable Estimate Std.
Error
Wald Df OR Sig.
Threshold
[Food Security = 0] -3.339 .888 14.147 1 28.191 .000
[Food Security = 1] -.925 .870 1.132 1 2.522 .287
[Food Security = 2] -.283 .869 .106 1 1.327 .744
Location [FloodExp=1] -.798 .874 .834 1 2.221 .361
[FloodExp=2] 0a . . 0 .
Link function: Logit.
a. This parameter is set to zero because it is redundant.
The estimated coefficients for the ordinal regression model are shown in Table 4.42. The
estimates labelled “Threshold” are the intercept. The estimates labelled “Location” are the
coefficients for the predictor. The coefficient for the independent variable, FloodExp,
(households that had experienced flooding) in the model, is –0.798. The negative coefficient
indicates a negative effect of flooding on household food security. On the one hand, this
implies that households that had experienced flooding are more likely to be food insecure. On
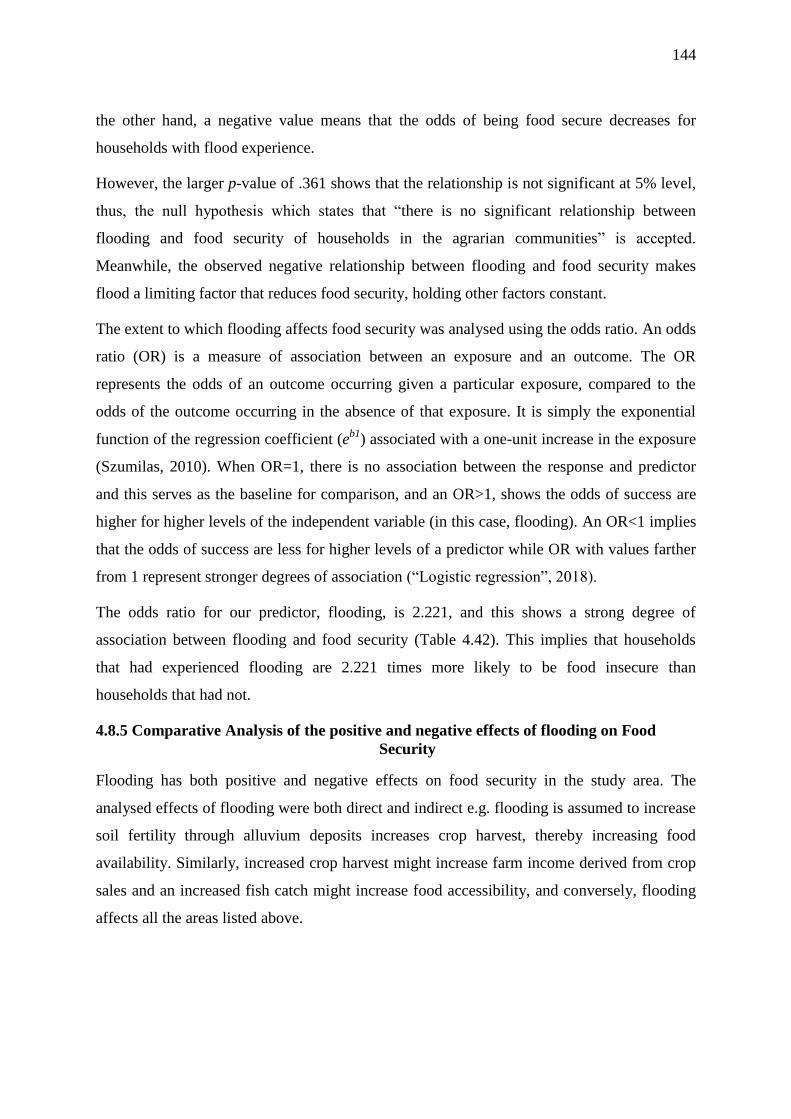
144
the other hand, a negative value means that the odds of being food secure decreases for
households with flood experience.
However, the larger p-value of .361 shows that the relationship is not significant at 5% level,
thus, the null hypothesis which states that “there is no significant relationship between
flooding and food security of households in the agrarian communities” is accepted.
Meanwhile, the observed negative relationship between flooding and food security makes
flood a limiting factor that reduces food security, holding other factors constant.
The extent to which flooding affects food security was analysed using the odds ratio. An odds
ratio (OR) is a measure of association between an exposure and an outcome. The OR
represents the odds of an outcome occurring given a particular exposure, compared to the
odds of the outcome occurring in the absence of that exposure. It is simply the exponential
function of the regression coefficient (eb1
) associated with a one-unit increase in the exposure
(Szumilas, 2010). When OR=1, there is no association between the response and predictor
and this serves as the baseline for comparison, and an OR>1, shows the odds of success are
higher for higher levels of the independent variable (in this case, flooding). An OR<1 implies
that the odds of success are less for higher levels of a predictor while OR with values farther
from 1 represent stronger degrees of association (“Logistic regression”, 2018).
The odds ratio for our predictor, flooding, is 2.221, and this shows a strong degree of
association between flooding and food security (Table 4.42). This implies that households
that had experienced flooding are 2.221 times more likely to be food insecure than
households that had not.
4.8.5 Comparative Analysis of the positive and negative effects of flooding on Food
Security
Flooding has both positive and negative effects on food security in the study area. The
analysed effects of flooding were both direct and indirect e.g. flooding is assumed to increase
soil fertility through alluvium deposits increases crop harvest, thereby increasing food
availability. Similarly, increased crop harvest might increase farm income derived from crop
sales and an increased fish catch might increase food accessibility, and conversely, flooding
affects all the areas listed above.
145
4.8.5.1 The positive effects of flooding on Food Security
The positive effects as identified from observations and responses of household heads were
six (6) namely; flooding increases crop harvest; increases farm income derived from crop
sales; increases labour demand; decreases food item prices; increases soil fertility through
alluvium deposits; and increases fish catch. Household heads were required to indicate the
extent to which flooding affect their household’s food security positively using a five-point
likert scale of 1= to no extent; 2=to little extent; 3= to a moderate extent; 4= to a great extent
and 5= to a very great extent.
The results of the extent of the positive effects of flooding on food security as perceived by
households are shown in Table 4.43.
Table 4.43: Positive Effects of flooding on food security (n = 400)
Positive effect of flooding on food
security
Extent of effect (in Percent %)
1 2 3 4 5
Increases crop harvest 99.0 1.0 0.0 0.0 0.0
Increases farm income derived
from crop sales
88.7 11.3 0.0 0.0 0.0
Increases labour demand 80.8 17.7 1.5 0.0 0.0
Decreases food item prices 99.0 1.0 0.0 0.0 0.0
Increases soil fertility through
alluvium deposits
17.5 3.0 43.7 25.8 10.0
Increases fish catch 17.5 0.8 33.0 36.3 12.4
A 5-point scale with 1= To no extent; 2=To little extent; 3= To a moderate extent; 4= To a
great extent; 5= To a very great extent.
Among the six (6) perceived positive effects of flooding on food security, only two (2) viz;
increases soil fertility through alluvium deposits and increases fish catch had all the 5-point
extent accounted for. About a quarter (25.8%) of households reported flooding to increase
soil fertility to a great extent and 43.7% indicated that flooding brings about a moderate
increase in soil fertility. 10% of households indicated that flooding could increase soil
fertility to a very great extent while 3% and 17.5% households perceived flooding to
respectively increase soil fertility to little or no extent. Households that perceived flooding to
increase fish catch either to a moderate extent, great extent or very great extent were 33%,
36.3% and 12.4% correspondingly. The reason for the 17.5% that indicated flooding to have
“no positive effect on fish catch” was because flooding caused loss of fish ponds affecting the
income of fish pond farmers.
146
Finally, the table reveals that the other perceived positive effects of flooding were negligible
as majority of the households indicated them to be either in little or no extent on food security
which contradicts the assumption that an increase in soil fertility might increase crop harvest
and sales. This indicates that flooding has two major positive effects on food security
(increases soil fertility and fish catch) in the south eastern region of Nigeria as shown in
Table 4.43.
4.8.5.2 The negative effects of flooding on Food Security
The ten (10) negative effects of flooding on food security were identified analysed were;
flooding reduces crop harvest; decreases farm income derived from crop sales; destroys road;
destroys food/ farm storage facilities; reduces labour demand; pollutes streams; reduces the
number of times food is consumed; affects the quality of food eaten; increases food items
prices and it affects the quantity of food eaten (Table 4.44). Some of the identified negative
effects of flooding on food security are indirect, for instance, roads are important in the
transportation of agricultural products from farms to market and when these roads are
destroyed by flooding, food security is affected indirectly. In the same vein, when crop
failure occurs as a result of flooding, food availability is affected with an associated reduction
in meal frequency and quantities.
Flooding was found to reduce crop/fish pond harvest and farm income, thereby affecting
household food security in the study area especially as majority of the households are
agrarian (depending on agriculture for their food and income). Food prices usually are low
during harvest periods, but flooding alters this seasonal pattern by causing a rise in food
prices as a result of crop failure and flood events occur mostly between August and October,
the harvest season for staples like yam in south eastern Nigeria.
Floods also upset the balance between labour supply and demand because after flood events,
there is often an abrupt rise in labour supply (especially as households take up casual labour
to help themselves after flood-induced poor harvest) with an associated decrease in labour
demand due to the reduced number of households that required the labour. Table 4.44 reveals
that the ten (10) identified negative effects of flooding on food security were to a great extent
with the largest proportions of households indicating that it increases food prices (63.5%),
destroys roads (56%), reduces crop harvest (55.7%) and reduces farm income derived from
crop sales (55.5%).
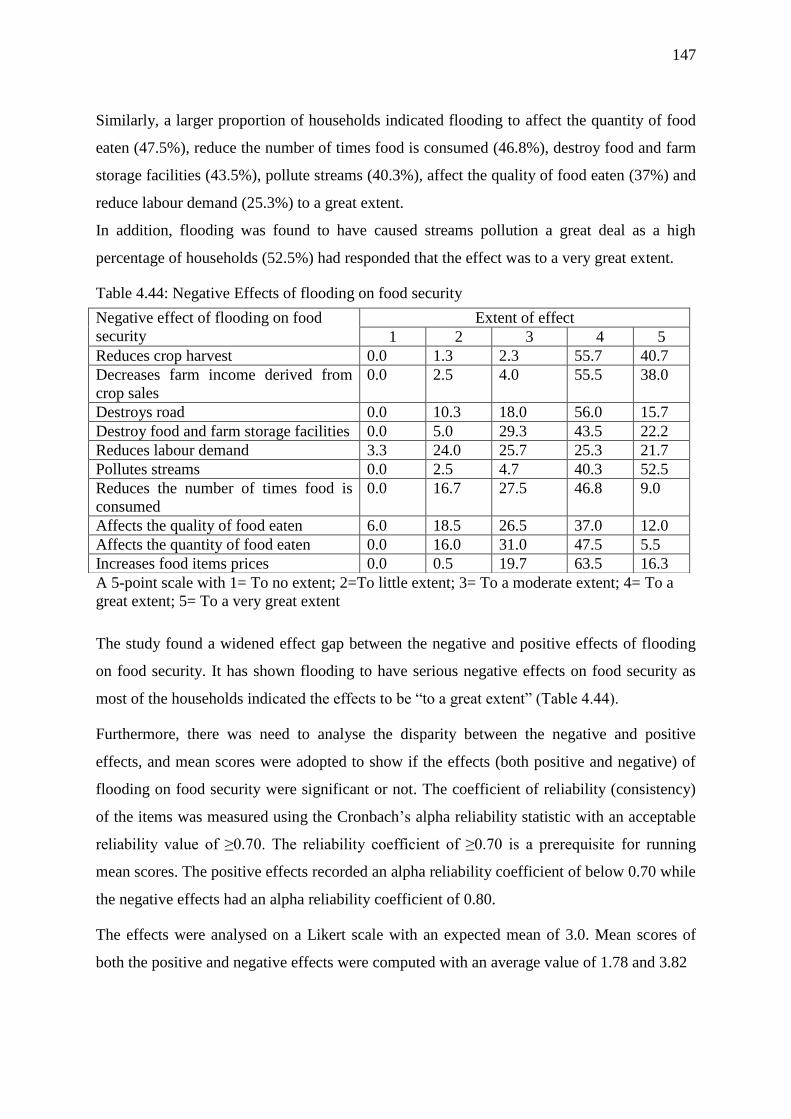
147
Similarly, a larger proportion of households indicated flooding to affect the quantity of food
eaten (47.5%), reduce the number of times food is consumed (46.8%), destroy food and farm
storage facilities (43.5%), pollute streams (40.3%), affect the quality of food eaten (37%) and
reduce labour demand (25.3%) to a great extent.
In addition, flooding was found to have caused streams pollution a great deal as a high
percentage of households (52.5%) had responded that the effect was to a very great extent.
Table 4.44: Negative Effects of flooding on food security
A 5-point scale with 1= To no extent; 2=To little extent; 3= To a moderate extent; 4= To a
great extent; 5= To a very great extent
The study found a widened effect gap between the negative and positive effects of flooding
on food security. It has shown flooding to have serious negative effects on food security as
most of the households indicated the effects to be “to a great extent” (Table 4.44).
Furthermore, there was need to analyse the disparity between the negative and positive
effects, and mean scores were adopted to show if the effects (both positive and negative) of
flooding on food security were significant or not. The coefficient of reliability (consistency)
of the items was measured using the Cronbach’s alpha reliability statistic with an acceptable
reliability value of ≥0.70. The reliability coefficient of ≥0.70 is a prerequisite for running
mean scores. The positive effects recorded an alpha reliability coefficient of below 0.70 while
the negative effects had an alpha reliability coefficient of 0.80.
The effects were analysed on a Likert scale with an expected mean of 3.0. Mean scores of
both the positive and negative effects were computed with an average value of 1.78 and 3.82
Negative effect of flooding on food
security
Extent of effect
1 2 3 4 5
Reduces crop harvest 0.0 1.3 2.3 55.7 40.7
Decreases farm income derived from
crop sales
0.0 2.5 4.0 55.5 38.0
Destroys road 0.0 10.3 18.0 56.0 15.7
Destroy food and farm storage facilities 0.0 5.0 29.3 43.5 22.2
Reduces labour demand 3.3 24.0 25.7 25.3 21.7
Pollutes streams 0.0 2.5 4.7 40.3 52.5
Reduces the number of times food is
consumed
0.0 16.7 27.5 46.8 9.0
Affects the quality of food eaten 6.0 18.5 26.5 37.0 12.0
Affects the quantity of food eaten 0.0 16.0 31.0 47.5 5.5
Increases food items prices 0.0 0.5 19.7 63.5 16.3

148
respectively. Since the mean score for the negative effects of flooding is greater than 3.0, it
could be concluded that flooding had more and significant negative effects than positive
effects in the Southeastern region of Nigeria.
4.8.6 Principal Component Analysis of the negative effects of flooding on food security
The Principal Component Analysis (PCA) was employed to reduce and group the ten (10)
analyzed negative effects of flooding on food security. That means PCA was run on the
negative effects of flooding on food security to determine the underlying dimensions
(summary). The PCA extracted three (3) components with Eigen values greater than 1,
explaining 68.02% of the dataset’s total variance. The first, second and third components
explained 33.65%, 18.23% and 10.22% respectively of all variations (Table 4.45). This
implies the PCA explained 68.02% of the negative effects of flooding on food security
summarized as three (3) underlying dimensions coined from the negative effects loaded
significantly on the 3 extracted components (Table 4.46).
Table 4.45: Total Variance Explained of the PCA
Component Initial Eigen values Extraction Sums of
Squared Loadings
Rotation Sums of Squared
Loadings
Total % of
Varianc
e
Cumula-
tive %
Total % of
Variance
Cumula-
tive %
Total % of
Variance
Cumula-
tive %
1 3.913 39.126 39.126 3.913 39.126 39.126 3.365 33.652 33.652
2 1.823 18.232 57.358 1.823 18.232 57.358 1.819 18.186 51.838
3 1.066 10.663 68.021 1.066 10.663 68.021 1.618 16.183 68.021
4 .811 8.110 76.131
5 .726 7.258 83.389
6 .514 5.141 88.530
7 .459 4.588 93.118
8 .309 3.091 96.209
9 .221 2.207 98.416
10 .158 1.584 100.000
Extraction Method: Principal Component Analysis.
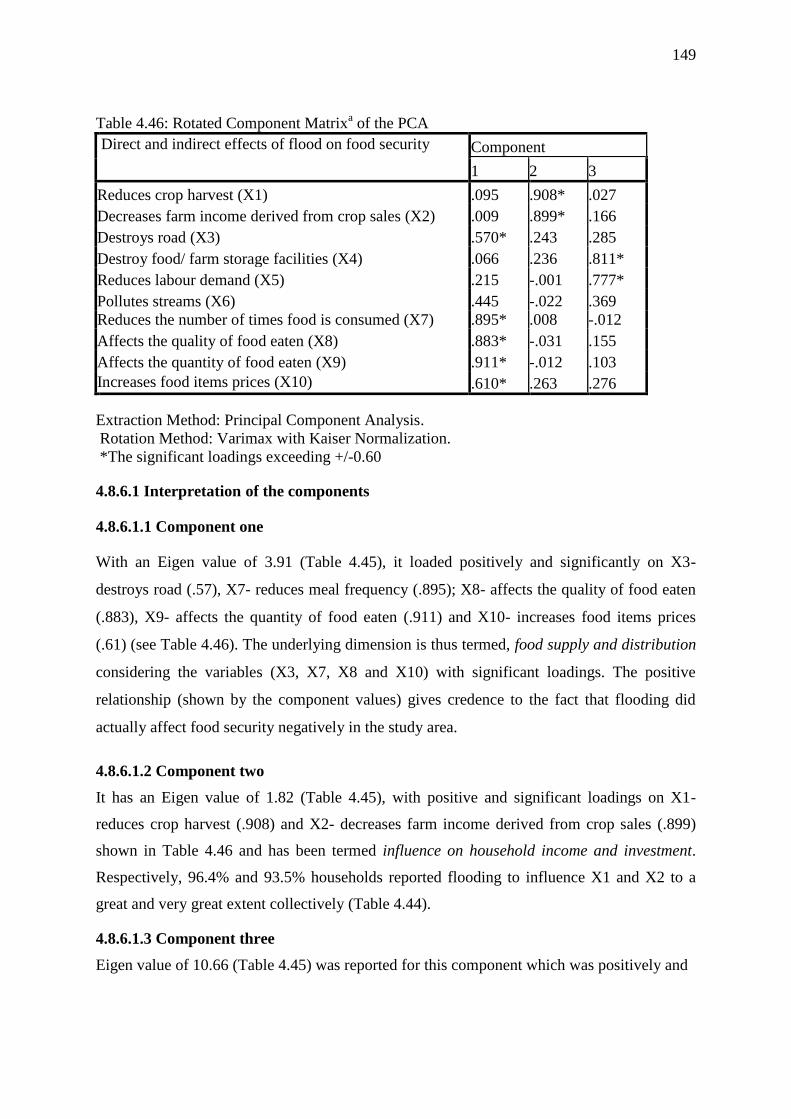
149
Table 4.46: Rotated Component Matrixa of the PCA
Direct and indirect effects of flood on food security Component
1 2 3
Reduces crop harvest (X1) .095 .908* .027
Decreases farm income derived from crop sales (X2) .009 .899* .166
Destroys road (X3) .570* .243 .285
Destroy food/ farm storage facilities (X4) .066 .236 .811*
Reduces labour demand (X5) .215 -.001 .777*
Pollutes streams (X6) .445 -.022 .369
Reduces the number of times food is consumed (X7) .895* .008 -.012
Affects the quality of food eaten (X8) .883* -.031 .155
Affects the quantity of food eaten (X9) .911* -.012 .103
Increases food items prices (X10) .610* .263 .276
Extraction Method: Principal Component Analysis.
Rotation Method: Varimax with Kaiser Normalization.
*The significant loadings exceeding +/-0.60
4.8.6.1 Interpretation of the components
4.8.6.1.1 Component one
With an Eigen value of 3.91 (Table 4.45), it loaded positively and significantly on X3-
destroys road (.57), X7- reduces meal frequency (.895); X8- affects the quality of food eaten
(.883), X9- affects the quantity of food eaten (.911) and X10- increases food items prices
(.61) (see Table 4.46). The underlying dimension is thus termed, food supply and distribution
considering the variables (X3, X7, X8 and X10) with significant loadings. The positive
relationship (shown by the component values) gives credence to the fact that flooding did
actually affect food security negatively in the study area.
4.8.6.1.2 Component two
It has an Eigen value of 1.82 (Table 4.45), with positive and significant loadings on X1-
reduces crop harvest (.908) and X2- decreases farm income derived from crop sales (.899)
shown in Table 4.46 and has been termed influence on household income and investment.
Respectively, 96.4% and 93.5% households reported flooding to influence X1 and X2 to a
great and very great extent collectively (Table 4.44).
4.8.6.1.3 Component three
Eigen value of 10.66 (Table 4.45) was reported for this component which was positively and

150
significantly loaded on X4- destroy food/farm storage facilities (.811) and X5- reduces labour
demand (.777) as shown in Table 4.46. Households that reported flooding to influence X4
and X5 to a great and very great extent were 65.7% and 47% correspondingly (Table 4.44).
The underlying dimension for this component could be termed farm labour and facilities.
However, the positive loadings on all the significant variables, further buttress the point that
flooding affects food security negatively in the study area. For instance, as flooding increases,
there is also an increase in crop harvest reduction as depicted by the significant positive value
(.908) on X2- reduces crop harvest under component 2.
In conclusion, the ten (10) identified negative effects of flooding on food security in the study
area have been reduced to three (3) underlying dimensions namely;
1. Food supply and distribution;
2. Household income and investment;
3. Farm labour and facilities.
4.9 Households’ adaptation strategies to flooding and food insecurity
Adaptive capacities are those things which enable people to cope with stresses such as
flooding, climate change, food shortage etc. Coping strategies are what households are reliant
on to develop means to maintain their livelihoods during and after a disaster and its analysis
focuses on what people do when they are already affected by a hazard (e.g. flood).
Thus, coping strategies are adopted when dealing with the hazard (“Complete coping
strategies analysis”, 2018). In this study, we looked at stress such as flooding and food
insecurity and since these stresses are sometimes inevitable, households had to concentrate on
measures to improve their adaptive capacity. The extent of the effects of flooding and food
insecurity varies across households and because households experienced them differently,
different coping strategies were employed by households to protect themselves from further
hazard or to maintain their livelihoods in the face of stressful events such as flooding. The
driving forces for their adaptation were noted to include; willingness to sustain their
livelihoods and stay alive, the industrious nature (where laziness is strongly abhorred) of the
Igbos and their attachment towards their land. Since the livelihoods in the study area are
dominated by agriculture and they are likely to be affected by frequent flood events with their
associated effects (e.g. food insecurity), the households therefore had to adopt some coping
strategies to survive.
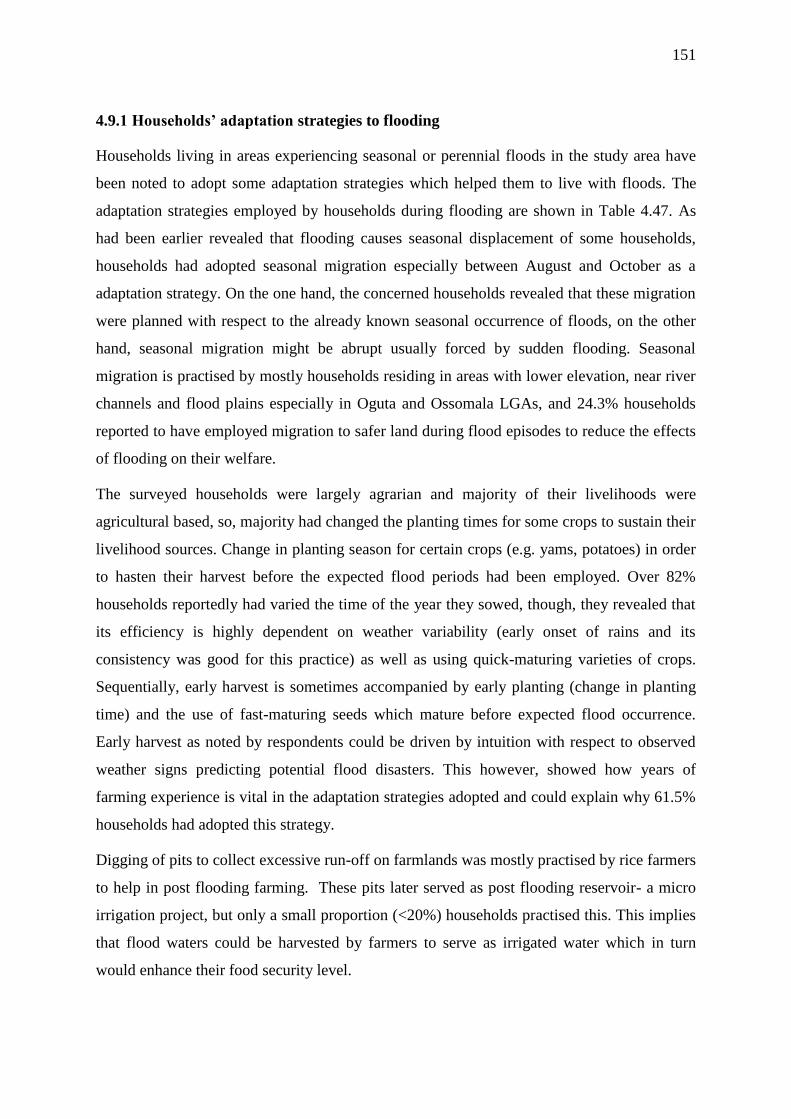
151
4.9.1 Households’ adaptation strategies to flooding
Households living in areas experiencing seasonal or perennial floods in the study area have
been noted to adopt some adaptation strategies which helped them to live with floods. The
adaptation strategies employed by households during flooding are shown in Table 4.47. As
had been earlier revealed that flooding causes seasonal displacement of some households,
households had adopted seasonal migration especially between August and October as a
adaptation strategy. On the one hand, the concerned households revealed that these migration
were planned with respect to the already known seasonal occurrence of floods, on the other
hand, seasonal migration might be abrupt usually forced by sudden flooding. Seasonal
migration is practised by mostly households residing in areas with lower elevation, near river
channels and flood plains especially in Oguta and Ossomala LGAs, and 24.3% households
reported to have employed migration to safer land during flood episodes to reduce the effects
of flooding on their welfare.
The surveyed households were largely agrarian and majority of their livelihoods were
agricultural based, so, majority had changed the planting times for some crops to sustain their
livelihood sources. Change in planting season for certain crops (e.g. yams, potatoes) in order
to hasten their harvest before the expected flood periods had been employed. Over 82%
households reportedly had varied the time of the year they sowed, though, they revealed that
its efficiency is highly dependent on weather variability (early onset of rains and its
consistency was good for this practice) as well as using quick-maturing varieties of crops.
Sequentially, early harvest is sometimes accompanied by early planting (change in planting
time) and the use of fast-maturing seeds which mature before expected flood occurrence.
Early harvest as noted by respondents could be driven by intuition with respect to observed
weather signs predicting potential flood disasters. This however, showed how years of
farming experience is vital in the adaptation strategies adopted and could explain why 61.5%
households had adopted this strategy.
Digging of pits to collect excessive run-off on farmlands was mostly practised by rice farmers
to help in post flooding farming. These pits later served as post flooding reservoir- a micro
irrigation project, but only a small proportion (<20%) households practised this. This implies
that flood waters could be harvested by farmers to serve as irrigated water which in turn
would enhance their food security level.
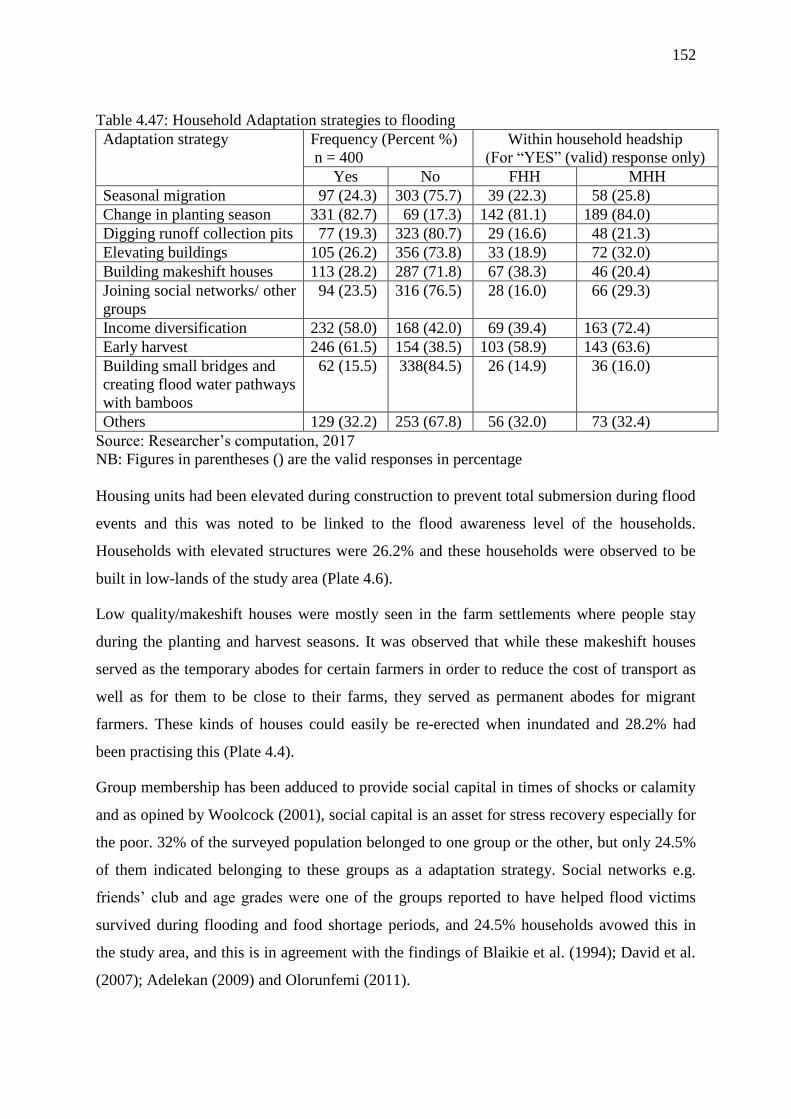
152
Table 4.47: Household Adaptation strategies to flooding
Adaptation strategy Frequency (Percent %)
n = 400
Within household headship
(For “YES” (valid) response only)
Yes No FHH MHH
Seasonal migration 97 (24.3) 303 (75.7) 39 (22.3) 58 (25.8)
Change in planting season 331 (82.7) 69 (17.3) 142 (81.1) 189 (84.0)
Digging runoff collection pits 77 (19.3) 323 (80.7) 29 (16.6) 48 (21.3)
Elevating buildings 105 (26.2) 356 (73.8) 33 (18.9) 72 (32.0)
Building makeshift houses 113 (28.2) 287 (71.8) 67 (38.3) 46 (20.4)
Joining social networks/ other
groups
94 (23.5) 316 (76.5) 28 (16.0) 66 (29.3)
Income diversification 232 (58.0) 168 (42.0) 69 (39.4) 163 (72.4)
Early harvest 246 (61.5) 154 (38.5) 103 (58.9) 143 (63.6)
Building small bridges and
creating flood water pathways
with bamboos
62 (15.5) 338(84.5) 26 (14.9) 36 (16.0)
Others 129 (32.2) 253 (67.8) 56 (32.0) 73 (32.4)
Source: Researcher’s computation, 2017
NB: Figures in parentheses () are the valid responses in percentage
Housing units had been elevated during construction to prevent total submersion during flood
events and this was noted to be linked to the flood awareness level of the households.
Households with elevated structures were 26.2% and these households were observed to be
built in low-lands of the study area (Plate 4.6).
Low quality/makeshift houses were mostly seen in the farm settlements where people stay
during the planting and harvest seasons. It was observed that while these makeshift houses
served as the temporary abodes for certain farmers in order to reduce the cost of transport as
well as for them to be close to their farms, they served as permanent abodes for migrant
farmers. These kinds of houses could easily be re-erected when inundated and 28.2% had
been practising this (Plate 4.4).
Group membership has been adduced to provide social capital in times of shocks or calamity
and as opined by Woolcock (2001), social capital is an asset for stress recovery especially for
the poor. 32% of the surveyed population belonged to one group or the other, but only 24.5%
of them indicated belonging to these groups as a adaptation strategy. Social networks e.g.
friends’ club and age grades were one of the groups reported to have helped flood victims
survived during flooding and food shortage periods, and 24.5% households avowed this in
the study area, and this is in agreement with the findings of Blaikie et al. (1994); David et al.
(2007); Adelekan (2009) and Olorunfemi (2011).
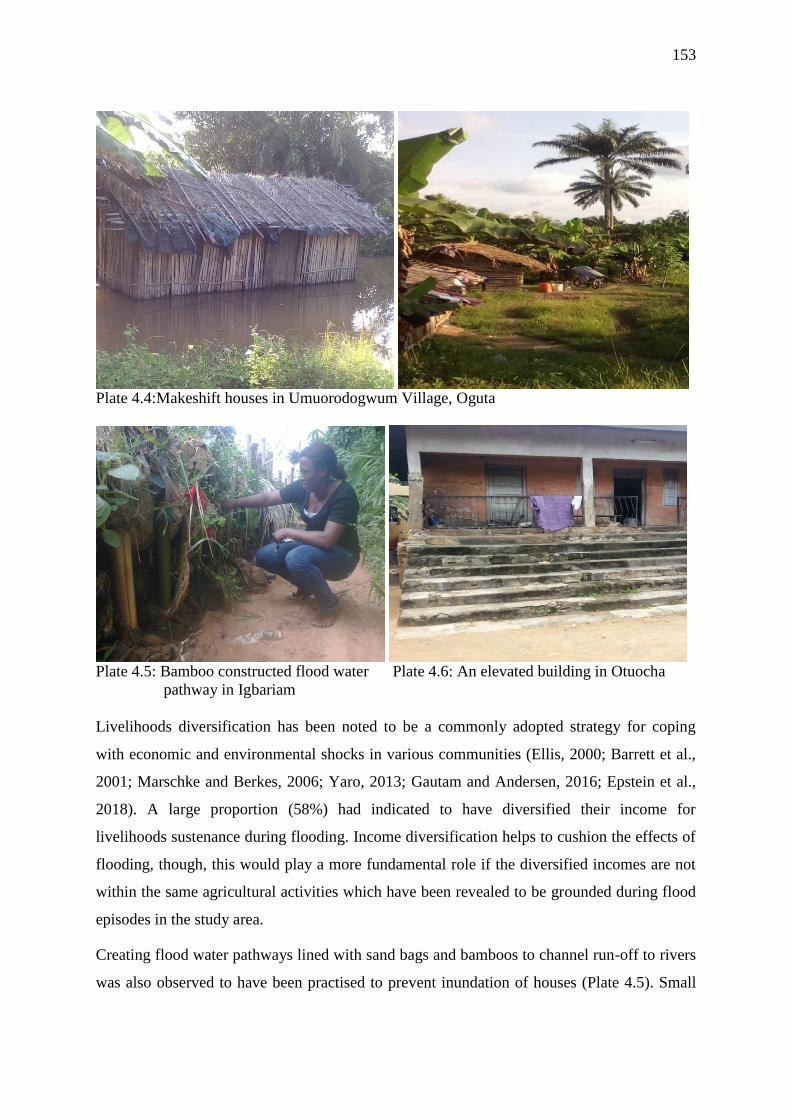
153
Plate 4.4:Makeshift houses in Umuorodogwum Village, Oguta
Plate 4.5: Bamboo constructed flood water Plate 4.6: An elevated building in Otuocha
pathway in Igbariam
Livelihoods diversification has been noted to be a commonly adopted strategy for coping
with economic and environmental shocks in various communities (Ellis, 2000; Barrett et al.,
2001; Marschke and Berkes, 2006; Yaro, 2013; Gautam and Andersen, 2016; Epstein et al.,
2018). A large proportion (58%) had indicated to have diversified their income for
livelihoods sustenance during flooding. Income diversification helps to cushion the effects of
flooding, though, this would play a more fundamental role if the diversified incomes are not
within the same agricultural activities which have been revealed to be grounded during flood
episodes in the study area.
Creating flood water pathways lined with sand bags and bamboos to channel run-off to rivers
was also observed to have been practised to prevent inundation of houses (Plate 4.5). Small
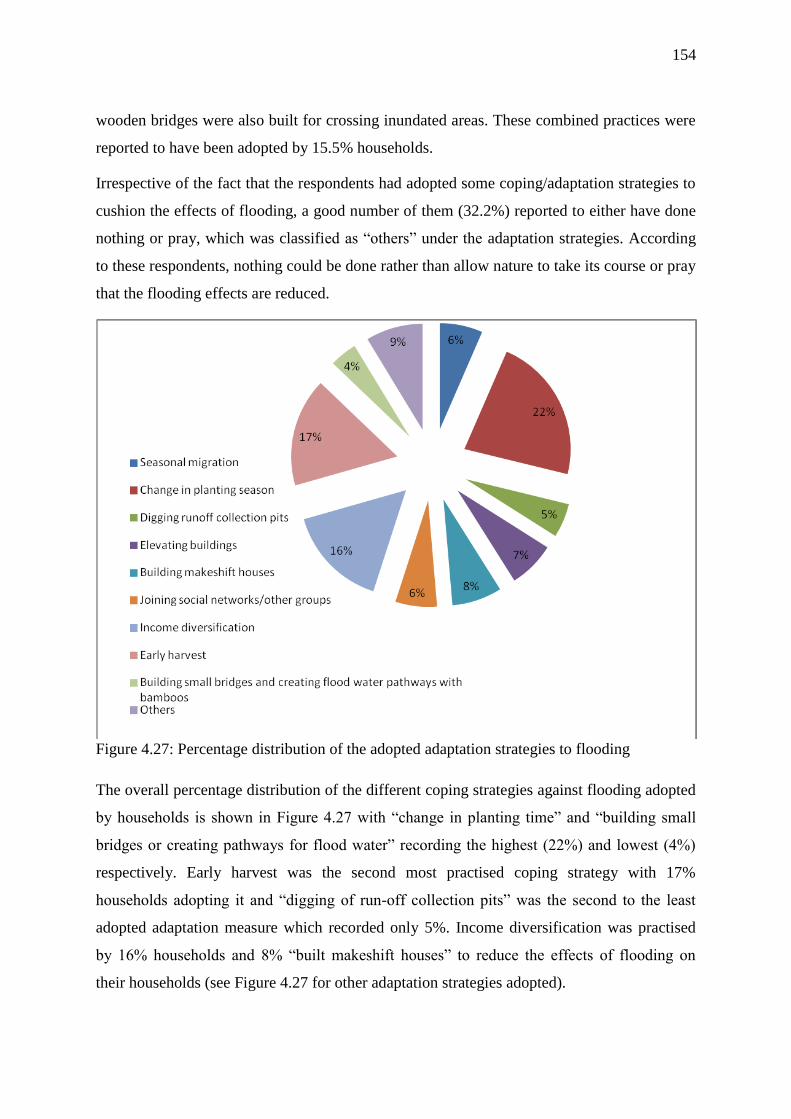
154
wooden bridges were also built for crossing inundated areas. These combined practices were
reported to have been adopted by 15.5% households.
Irrespective of the fact that the respondents had adopted some coping/adaptation strategies to
cushion the effects of flooding, a good number of them (32.2%) reported to either have done
nothing or pray, which was classified as “others” under the adaptation strategies. According
to these respondents, nothing could be done rather than allow nature to take its course or pray
that the flooding effects are reduced.
Figure 4.27: Percentage distribution of the adopted adaptation strategies to flooding
The overall percentage distribution of the different coping strategies against flooding adopted
by households is shown in Figure 4.27 with “change in planting time” and “building small
bridges or creating pathways for flood water” recording the highest (22%) and lowest (4%)
respectively. Early harvest was the second most practised coping strategy with 17%
households adopting it and “digging of run-off collection pits” was the second to the least
adopted adaptation measure which recorded only 5%. Income diversification was practised
by 16% households and 8% “built makeshift houses” to reduce the effects of flooding on
their households (see Figure 4.27 for other adaptation strategies adopted).
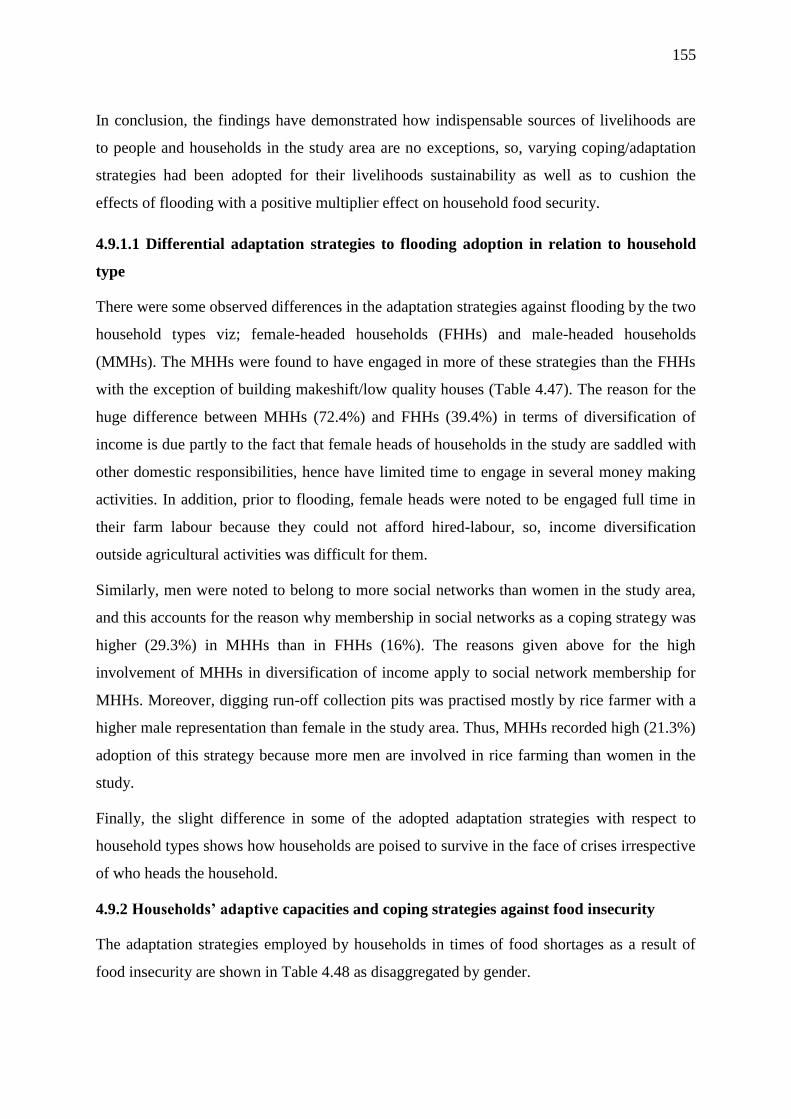
155
In conclusion, the findings have demonstrated how indispensable sources of livelihoods are
to people and households in the study area are no exceptions, so, varying coping/adaptation
strategies had been adopted for their livelihoods sustainability as well as to cushion the
effects of flooding with a positive multiplier effect on household food security.
4.9.1.1 Differential adaptation strategies to flooding adoption in relation to household
type
There were some observed differences in the adaptation strategies against flooding by the two
household types viz; female-headed households (FHHs) and male-headed households
(MMHs). The MHHs were found to have engaged in more of these strategies than the FHHs
with the exception of building makeshift/low quality houses (Table 4.47). The reason for the
huge difference between MHHs (72.4%) and FHHs (39.4%) in terms of diversification of
income is due partly to the fact that female heads of households in the study are saddled with
other domestic responsibilities, hence have limited time to engage in several money making
activities. In addition, prior to flooding, female heads were noted to be engaged full time in
their farm labour because they could not afford hired-labour, so, income diversification
outside agricultural activities was difficult for them.
Similarly, men were noted to belong to more social networks than women in the study area,
and this accounts for the reason why membership in social networks as a coping strategy was
higher (29.3%) in MHHs than in FHHs (16%). The reasons given above for the high
involvement of MHHs in diversification of income apply to social network membership for
MHHs. Moreover, digging run-off collection pits was practised mostly by rice farmer with a
higher male representation than female in the study area. Thus, MHHs recorded high (21.3%)
adoption of this strategy because more men are involved in rice farming than women in the
study.
Finally, the slight difference in some of the adopted adaptation strategies with respect to
household types shows how households are poised to survive in the face of crises irrespective
of who heads the household.
4.9.2 Households’ adaptive capacities and coping strategies against food insecurity
The adaptation strategies employed by households in times of food shortages as a result of
food insecurity are shown in Table 4.48 as disaggregated by gender.
156
Households that actively devised strategies to live with food insecurity had comparative
advantage over others in terms of adaptation. The outcome of the analysis of coping
strategies adopted shows a variation across female- and male-headed households.
Skipping of meals serves as an indicator for determining food security levels as well as a
coping strategy. Normally, household members would not skip meals except in times of
crises which affect food availability and affordability or due to poverty. The most practised
coping strategy in times of flood-induced food shortages was “skipping meals” as 90%
households reported in the study area. Skipping of meals could be voluntary (where
household members decided to purposely skip or keep meals served for later) or forced
(where households members were hungry but did not have anything to eat). 91.4% of all the
female-headed households (FHHs) had skipped their meals at some point in time during food
shortages while 55.6% of the male-headed households (MHHs) had employed “skipping of
meals” as a food insecurity adaptation strategy.
In agricultural communities, it is not unusual to informally borrow either food or money, this
is also evident in Southeastern Nigeria as 31.5% households reported to have done this in
order to sustain their households as a result of food shortage caused by destruction of their
farmlands or seasonal displacement caused by flooding. The analysis also shows that MHHs
(36%) had engaged in the practice of informal borrowing more than FHHS (25.7%).
Accompanied by meals skipping are “reducing portion size of meals” and “reducing meal
frequency”. A significant percentage, 80.7% and 82.3% of households had reduced portion
size of their meals and reduced the number of times food was eaten to cope with food
shortage induced by flooding and this corroborates the findings of Tefera and Tefera (2014)
in Ethiopia, Gupta et al. (2015) in India and Farzana et al. (2017) in Bangladesh. Within the
FHHs, 87.4% and 80% had reduce their households meal portions and reduced their meal
frequency respectively while 75.6% and 84% MHHs had respectively employed reduction of
meal portions and meal frequency as coping strategies. These coping strategies had made
households survived throughout the crises’ period and they emanated from the conditions of
households not having enough food nor resources to afford more.
In order to survive the low food availability as well as high food prices, majority of the
households reported to have eaten their seed stock and/or stocked seeds (e.g. dried maize,
yam tubers) usually kept for next planting season. Though, the practice of eating seed stock is
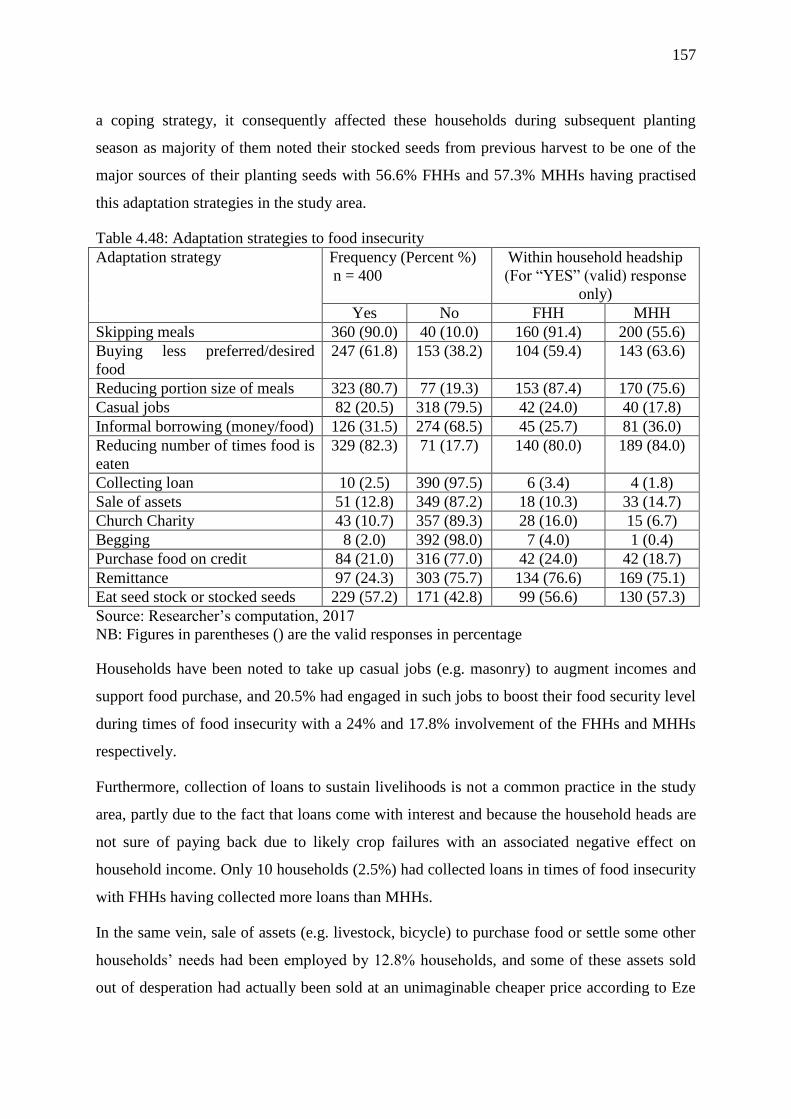
157
a coping strategy, it consequently affected these households during subsequent planting
season as majority of them noted their stocked seeds from previous harvest to be one of the
major sources of their planting seeds with 56.6% FHHs and 57.3% MHHs having practised
this adaptation strategies in the study area.
Table 4.48: Adaptation strategies to food insecurity
Adaptation strategy Frequency (Percent %)
n = 400
Within household headship
(For “YES” (valid) response
only)
Yes No FHH MHH
Skipping meals 360 (90.0) 40 (10.0) 160 (91.4) 200 (55.6)
Buying less preferred/desired
food
247 (61.8) 153 (38.2) 104 (59.4) 143 (63.6)
Reducing portion size of meals 323 (80.7) 77 (19.3) 153 (87.4) 170 (75.6)
Casual jobs 82 (20.5) 318 (79.5) 42 (24.0) 40 (17.8)
Informal borrowing (money/food) 126 (31.5) 274 (68.5) 45 (25.7) 81 (36.0)
Reducing number of times food is
eaten
329 (82.3) 71 (17.7) 140 (80.0) 189 (84.0)
Collecting loan 10 (2.5) 390 (97.5) 6 (3.4) 4 (1.8)
Sale of assets 51 (12.8) 349 (87.2) 18 (10.3) 33 (14.7)
Church Charity 43 (10.7) 357 (89.3) 28 (16.0) 15 (6.7)
Begging 8 (2.0) 392 (98.0) 7 (4.0) 1 (0.4)
Purchase food on credit 84 (21.0) 316 (77.0) 42 (24.0) 42 (18.7)
Remittance 97 (24.3) 303 (75.7) 134 (76.6) 169 (75.1)
Eat seed stock or stocked seeds 229 (57.2) 171 (42.8) 99 (56.6) 130 (57.3)
Source: Researcher’s computation, 2017
NB: Figures in parentheses () are the valid responses in percentage
Households have been noted to take up casual jobs (e.g. masonry) to augment incomes and
support food purchase, and 20.5% had engaged in such jobs to boost their food security level
during times of food insecurity with a 24% and 17.8% involvement of the FHHs and MHHs
respectively.
Furthermore, collection of loans to sustain livelihoods is not a common practice in the study
area, partly due to the fact that loans come with interest and because the household heads are
not sure of paying back due to likely crop failures with an associated negative effect on
household income. Only 10 households (2.5%) had collected loans in times of food insecurity
with FHHs having collected more loans than MHHs.
In the same vein, sale of assets (e.g. livestock, bicycle) to purchase food or settle some other
households’ needs had been employed by 12.8% households, and some of these assets sold
out of desperation had actually been sold at an unimaginable cheaper price according to Eze
158
(2017). Assets in this study, connote valuable things (tangible) but could be regarded
differently with respect to place, Rakodi and Llyod-Jones (2002) noted people’s possession
of and access to assets as well as their livelihoods to be influenced by the context within
which they live. Table 4.48 revealed more MHHs to have sold more assets than FHHs
because of the income and asset poverty found to be higher in the FHHs in the study area.
A very few households (10.7%) had benefitted from church charity in times of food shortages
and begging is not a usual practice as only 8 (2%) households indicated to have applied
begging and these households were among the poor female-headed households with a
monthly income of <15,000 Naira.
Moreover, FHHs had more proportions that resorted to church charity and begging than
MHHs because FHHs had been shown to be the most food insecure with 22.9% classified
under “severely food insecure with hunger” during times of flood events. Food had been
purchased on credit to sustain households as 21% households reported to have done this with
24% FHHs and 18.7% MHHs reported to have employed it.
This study has been able to show an inverse and significant relationship between remittance
and flood vulnerability, meaning the more remittance a household is entitled to, the less
vulnerable that household becomes to flooding. Remittances are money sent back home from
relatives or family members who live elsewhere. Invariably, remittance is a valid coping
strategy to help households cope with food insecurity as well as to withstand other shocks.
This is in line with the findings of Babatunde and Martinetti (2010) who noted increases in
remittances to be associated with increased food security of rural households in Nigeria and
Ponsot and Obegi (2010) who opinionated that a household’s saved remittances served as
insurance against unforeseen events.
The percentage distribution showing the average household adaptation and coping strategies
adopted in times of food insecurity is shown in Figure 4.28 where households have been
illustrated to adopt mostly skipping of meals, reducing meal frequency as well as reducing
meal portion. The chart also indicates begging and collecting loan to be the least adopted
coping strategies.
However, the slightly observed variations in the coping strategies adopted by the FHHs and
MHHs have been linked to facts such as income and asset poverty gaps including differential
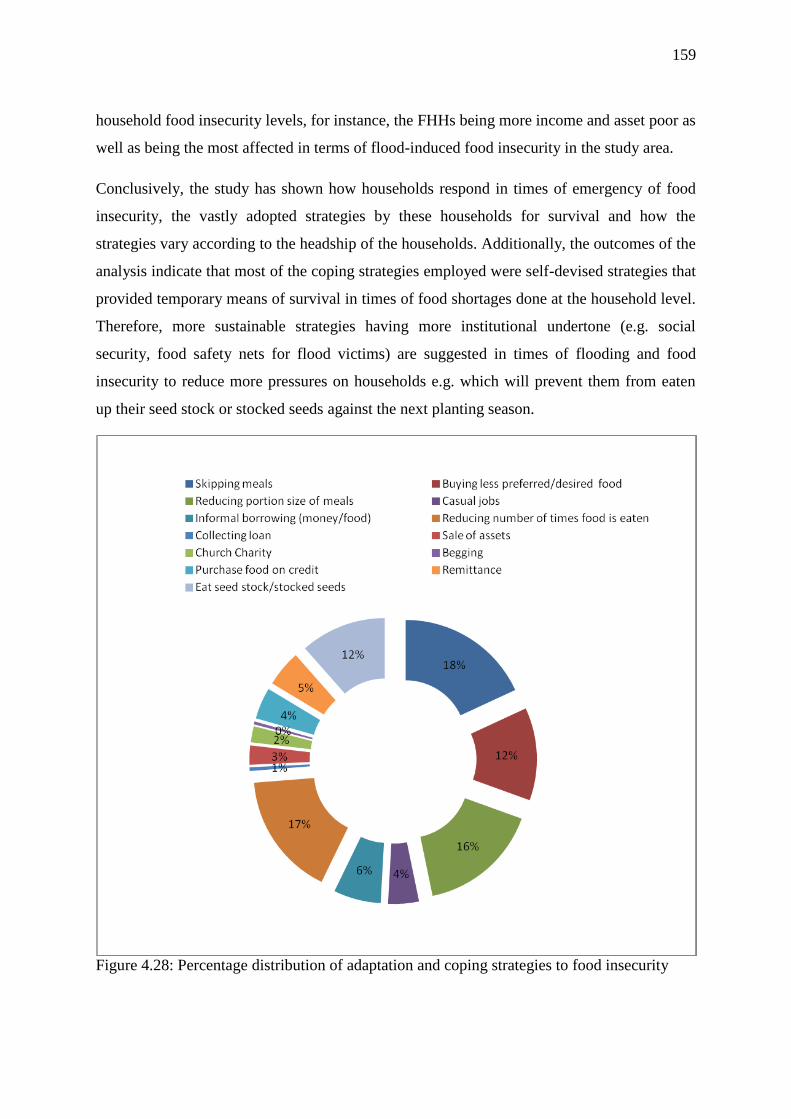
159
household food insecurity levels, for instance, the FHHs being more income and asset poor as
well as being the most affected in terms of flood-induced food insecurity in the study area.
Conclusively, the study has shown how households respond in times of emergency of food
insecurity, the vastly adopted strategies by these households for survival and how the
strategies vary according to the headship of the households. Additionally, the outcomes of the
analysis indicate that most of the coping strategies employed were self-devised strategies that
provided temporary means of survival in times of food shortages done at the household level.
Therefore, more sustainable strategies having more institutional undertone (e.g. social
security, food safety nets for flood victims) are suggested in times of flooding and food
insecurity to reduce more pressures on households e.g. which will prevent them from eaten
up their seed stock or stocked seeds against the next planting season.
Figure 4.28: Percentage distribution of adaptation and coping strategies to food insecurity

160
4.10 Resilience Analysis
The recovery length/period i.e. how long it took people to recover from the shock of flood
episodes in south eastern Nigeria is presented in Table 4.49. Resilience according to Epstein
et al. (2017) is often used to describe how a community, household or person is able to
“bounce back” from a disaster event. There is a plausible relationship between recovery and
resilience. The shorter the time it takes an affected household to bounce back to normal life
after being affected by a flood episode, the more resilient that household is which signifies
their ability to cope or live with flood. Analysis of peoples’ resilience is very important as it
has been noted to have a negative proportionality with their vulnerabilities. Vulnerability
according to Pelling (1999) has 3 components; exposure, resilience and resistance. Exposure
has a direct relationship with vulnerability while resilience has an inverse relationship
(Akukwe and Ogbodo, 2015). The data on recovery period were obtained from questionnaire
where participants were asked to answer the question “how long it took them to recover from
the shock of floods?” The baseline for answering “how long it took each household to
recover from flood disaster” was the 2012 devastating flood as had been noted to be the most
recent extreme floods experienced by all the households.
The table displays a disproportionate recovery period from flood disaster across communities
in the study area. On average, the recovery period was 1-2 years as 51% of the households
took between 1-2 years to bounce back after the devastating flood in 2012 with Ossomala
(35.9%) and Ezi-Orsu (60.5%) communities recording the least and highest number of
households that recovered within this period. Above one quarter of all the households
(28.3%) reported to have recovered between 10 and 12 months after the flood disaster with
Oguta community having fewer households in the category in relation to other communities.
Consequently, Opuoma and Otuocha communities had the largest proportions (13.6% each)
of households with a long recovery period of 3-4 years while Igbariam had the lowest (2.3%).
Meanwhile, 14.1% households in Ossomala community bounced back after 4-6 months with
only one (1) household each in Igbariam and Oguta communities indicated to have recovered
within 4-6 months. No household in Otuocha recovered within 1-6 months while Mmahu and
Ossomala each had two (2) households that bounced back between 1 and 3 months.
With respect to the time taken to bounce back by households in the eight communities, the
study inferred that Ossomala seemed the most resilient of all the communities
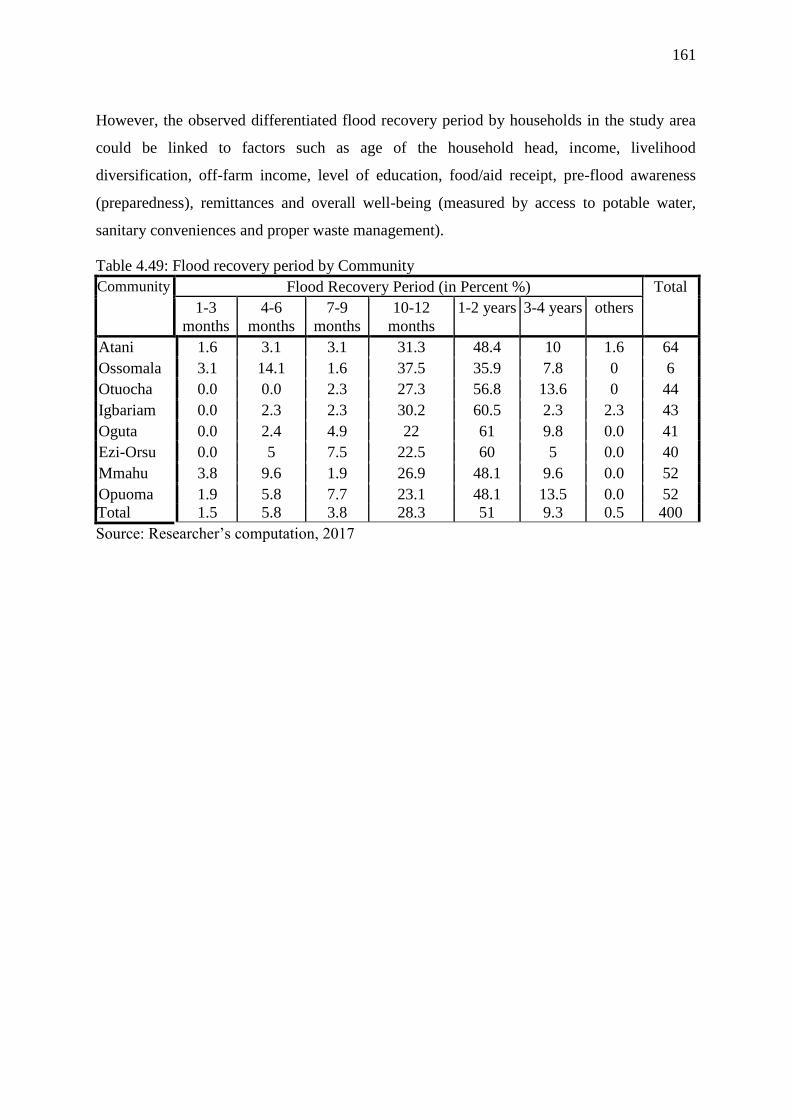
161
However, the observed differentiated flood recovery period by households in the study area
could be linked to factors such as age of the household head, income, livelihood
diversification, off-farm income, level of education, food/aid receipt, pre-flood awareness
(preparedness), remittances and overall well-being (measured by access to potable water,
sanitary conveniences and proper waste management).
Table 4.49: Flood recovery period by Community
Community Flood Recovery Period (in Percent %) Total
1-3
months
4-6
months
7-9
months
10-12
months
1-2 years 3-4 years others
Atani 1.6 3.1 3.1 31.3 48.4 10 1.6 64
Ossomala 3.1 14.1 1.6 37.5 35.9 7.8 0 6
Otuocha 0.0 0.0 2.3 27.3 56.8 13.6 0 44
Igbariam 0.0 2.3 2.3 30.2 60.5 2.3 2.3 43
Oguta 0.0 2.4 4.9 22 61 9.8 0.0 41
Ezi-Orsu 0.0 5 7.5 22.5 60 5 0.0 40
Mmahu 3.8 9.6 1.9 26.9 48.1 9.6 0.0 52
Opuoma 1.9 5.8 7.7 23.1 48.1 13.5 0.0 52
Total 1.5 5.8 3.8 28.3 51 9.3 0.5 400
Source: Researcher’s computation, 2017
162
CHAPTER FIVE
SUMMARY, CONCLUSION AND RECOMMENDATIONS
5.1 Summary
The major findings of this study are summarized in this chapter with respect to the objectives
namely; examination of the nature (extent, frequency, severity) of floods; assessment of
households’ vulnerabilities to floods; assessment of the food security situation and its
determinants; assessment of the effects of flood on households’ food security; and the
examination of households’ adaptive capacities to flooding and food insecurity in the study
area. Nevertheless, the socio-economic, demographic and some farm-related characteristics
of the households were summarized.
5.1.1 Households’ socio-economic, demographic and farm-related characteristics
The socio-economic, demographic and farm-related characteristics were analysed because
they were factors used to investigate the five objectives of this study. A demographic
assessment revealed that the study comprised 56.2% male-headed households (MHHs) and
43.8% male-headed households (FHHs) with about a quarter of them being either in the age
brackets between 40 and 49 years and between 60 and 69 years. The analysis also revealed
that 73% of the heads of household were between the ages of 40 years and above while 27%
were between 20 and 39 years of age. In addition, majority (64.5%) of the heads of
households were married while only 7.8% reported to have never been married (single) with
women constituting a greater number (74.7%) of people with the “widowed” status.
Only 25.8 % heads of households had no formal education. A gender-based disparity in
educational level was found to be related to income and livelihood sources as 63% (out of the
25.8% of those who had no formal education) were women who were solely farmers and
earned lesser monthly. In terms of monthly income, 23.5% households fell below the poverty
line and the FHHs constituted the largest proportion (70.2% i.e. 66 out of 94 of households)
classified as “poor” because they earned <N15,000 or $30 monthly.
The mean household size and number of dependants per household in the study area was
approximately five (5) members (5.14 and 5.01 respectively). The correlation analysis
between level of education and income as well as with dependency ratio revealed that higher
163
income earners had higher educational degrees and those with higher educational degrees had
fewer dependants, thereby making the poorer households more vulnerable to food insecurity
as well as being less resilient.
Apart from farming which was predominant, other sources of livelihoods includes; fishing,
trading, hunting, civil services, artisanship, pension-dependent among others. Majority of the
households heads had long years of farming experience since a large proportion (47.6%)
reported to have spent between 30 to 49 years while only 2% of households’ heads had spent
<10 years in their communities.
About half of the sampled households had access to potable water with streams forming the
major source of drinking water, and 70% of the houses were made of block and zinc roof
while 1.5% were constructed from wood with thatch roof. There was an observed asset
disparity gap as asset poverty was linked to income because the poor did not own many assets
with the exception of mobile phones and wheel barrows.
The average land holding of households is approximately 1.0 acre with 85% households
cultivating communal land (major land acquisition method). Majority of the farm lands are
located in flood plains and lowlands increasing the households’ vulnerability to flooding and
food insecurity.
5.1.2 The nature, extent, causes and occurrence of flood
Flooding was reported to be perennial with all (100%) households having been affected by
flooding within the study period. The study revealed that most household (69%) suffered
severe degree of flood damage which had a very close link with the frequent flood occurrence
with a gargantuan percentage (91.2%) of households experiencing flood events most times in
the rainy season.
The most devastating floods within a 5-year period (study period; 2012 to 2016) occurred in
2012 when all (100%) were affected and this corroborates the findings of UN-OCHA (2012)
that reported the 2012 floods as the worst flood in Nigeria in the last 40 years. It could be
inferred from the percentage of households affected that devastating flooding occur on a two-
year basis in Anambra and Imo States since all sampled households (100%) were affected in
2012, 9.8% in 2013, 34% in 2014, 22.5% in 2015 and 48.5% in 2016. Generally, the flood
depth within dwelling units ranges from <1m to >5m with majority houses being submerged
by floods between 2-4m deep. River flooding was the prominent type of flooding experienced
164
resulting from the overflowing of the banks of Duo River, Mamu River, Ezu River, Nkisi
River, Anambra River and River Niger.
Eight (8) factors were found to influence flooding in south eastern, Nigeria namely; heavy
rainfall, excess river discharge, building/farming on floodplains, climate change, lack of
drainage facilities, low topography, impervious surfaces and wrath of God in decreasing
order.
Flood analysis from the MODIS and SRTM DEM images showed that the maximum
elevation inundated in the study area was 35m above sea level, thus any area with an
elevation below the 35m threshold was inundated. Owing to the fact that majority of the
sampled communities are situated within an elevation of between 1-50m above sea level, they
were highly inundated by the 2012 flood water. Generally, Atani, Ossomala, Mmahu and
Opuoma communities were highly submerged with a recorded flood depth of above 10m. A
large proportion of Ezi-Orsu and Oguta communities were partly submerged with an average
flood depth of between 1-10m while a small proportion of Otuocha and Igbariam
communities were submerged with flood water as deep as above 10m.
With respect to the area affected by flood, Anambra East Local Government Area (LGA)
recorded the smallest proportion of 158.004 km2 followed by Oguta, Ohaji/Egbema and
Ogbaru LGAs with an inundated area of 241.982 km2, 305.706 km
2 and 391.789 km
2
respectively. The implication is not only on the area affected but also on the proportion of the
entire LGA affected. Ogbaru LGA suffered severe effects of flooding, followed by Oguta,
Anambra East and Ohaji/Egbema LGAs in a decreasing order with percentage inundated area
of 98.5%, 50.6%, 41.7% and 26.6% respectively. Elevation was the predominant factor that
influenced the area of inundation (flood extent) in the communities and LGAs e.g. the 1.5%
areas not flooded in Ogbaru LGA are on an elevation between 100-150m above sea level and
the entire inundated area in all the LGAs were mainly plains between 1-50m above sea level.
Increased rainfall intensity was the major cause of flooding in the study area. The trend lines
(slopes) from the trend analysis (of a 40-year rainfall data; 1974-2013) depicted rainfall
increase over the study area, with a mean increase of 0.34mm over sampled communities in
Anambra State and 0.13mm over Imo States’ communities. Flood occurrence was seasonal
and from the respondents’ perspective, it occurs mainly from June to November which fall
within the peak of the Rainy season, and especially from September to October (second
165
rainfall maxima). There was a direct correlation between the indigenous knowledge of the
occurrence floods (including seasonal variations) and scientific proof as rainfall variability
over the study area (as analysed from a 40-year rainfall data (1974-2013) collected from
NIMET, Lagos) shows that maximum rainfall is received between May and October.
Conclusively, flooding in the study area was caused chiefly by heavy rainfall and excess
discharge from rivers, and largely severe in terms of damages as well as highly frequent as it
occurred in most times of the rainy season. In addition, the flood extent was a function of
elevation of the area and majority of the farmlands in the study area was submerged resulting
in household food insecurity as concurred by the findings of FEWS NET (2012; 2013).
Therefore, it is concluded that since flooding occurred mostly during the harvest season of
most crops (June to November), harvest and productivity are negatively affected.
5.1.3 Household Flood Vulnerability Analysis
The study considered vulnerability as the net effect of adaptive capacity (socio-economic),
and sensitivity and exposure (biophysical) as defined by IPCC (2007; 2012). The Flood
Vulnerability Index (FVI) for each household was computed using the first principal
component (that captures the largest amount of information common to all the variables)
against the standardized values for all the considered adaptive capacity, sensitivity and
exposure variables. Indicators (36) were adopted to assess the exposure, sensitivity and
coping/adaptive capacity of the households. The computed minimum and maximum indices
across the households were -10.73 and 10.44. The negative values were associated with high
vulnerability while the positive were linked to low vulnerability. Higher FVI connoted lesser
vulnerability and vice versa, because when adaptive capacity of a household exceeds that of
its sensitivity and exposure, the household becomes relatively less vulnerable to flooding and
its effects.
Three relative flood vulnerability levels (less, moderate and high) were arrived at by running
cluster analysis of the FVIs. At the household level, the less vulnerable class had FVI from
0.1 to 11 and comprised 49% households, the moderately vulnerable class recorded FVI from
-0.5 to 0.09 and consisted of 3.5% households, while the highly vulnerable class had FVI
from -11 to -0.6 and constituted 47.5% households. The less vulnerable households
accounted for households that could relatively cope in times of flooding, though they were
vulnerable. The moderately vulnerable households needed some assistance (especially
166
temporarily) to cope with flooding while the highly vulnerable households would need a long
time assistance to cope with flooding.
“Hierarchical cluster analysis was performed on the FVIs to group the households and
communities according to similarity in their degree of vulnerability using Average linkage
method, and the spatial pattern of the different vulnerability levels were mapped using
ArcGIS 10.2”. At the community level, the tree graph revealed that Otuocha, Opuoma, Oguta
and Ezi-Orsu communities were less vulnerable; Atani and Mmahu communities were
moderately vulnerable while Igbariam and Ossomala communities were highly vulnerable to
flooding. Consequently, Igbariam and Ossomala are known as the flood vulnerability
hotspots in the study area.
At the LGA and State level, Ogbaru and Anambra East LGAs in Anambra State were highly
vulnerable while Oguta and Ohaji/Egbema LGAs in Imo State were less vulnerable to
flooding and its effects. Thus generally implying that, households in Imo State were less
vulnerable to flooding and would need lesser assistance than households in Anambra State to
cope with flooding.
The most vulnerable group were the households headed by younger people (especially
between 20-29 years of age) whose major livelihood sources were agricultural.
Multiple Regression was used to determine the significant factors that influence household
flood vulnerability in Southeastern Nigeria. The regression analysis was based on a plausible
construction of the relationship between flood vulnerability (dependent variable, Y) and
sixty-six (36) socioeconomic and environmental factors (independent variables, X). Out of
the thirty-six (36) factors that influenced flood vulnerability, only sixteen (44.4%) were
statistically significant (P < 0.05) at 5% level of significance, with 87.5% and 12.5%
accounting for socio-economic and environmental factors respectively. The result of the
regression analysis shows an intercept (constant), b0, of 3.729 and that majority (92.9%) of
the factors with negative coefficients (decreasing flood vulnerability) were connected to
socio-economic factors while a third (66.7%) of those with positive coefficients (increasing
flood vulnerability) were related to environmental factors. The coefficient of determination,
R2 was .831 implying that, 83.1% probability of the vulnerability to flooding was explained
by the model.
Consequently, flood vulnerability predominantly and significantly decreases with increasing
167
age, level of education, off-farm incomes, pre-flood awareness, group membership, private
land ownership, sufficient food production, available storage facility, use of fertilizer, receipt
of food/aid in time of emergency, phone ownership, canoe ownership and financial support,
and increases with diversified income, farmland flood experience as well as the severity of
flood experienced.
Analysis of variance (ANOVA) was used to test the null hypothesis: “there is no significant
difference in the vulnerability of households to flooding in the various agrarian communities”
at 0.05 level of significance. The null hypothesis was rejected because the calcultaed
Snedecor’s F test value (49.662) was greater than the critical F test value (1.394) and the p-
value for 49.662 was <.0001. Thus, there was a statistically significant difference in the
households’ vulnerability to flooding in Southeastern Nigeria and these variations in the
households’ flood vulnerability levels were as a result of the social, economic and
environmental factors mentioned earlier. Furthermore, ANOVA was employed to show
whether significant intra-household variations in vulnerability to flooding existed in the study
area, and the results revealed significant differences in vulnerability to flooding between
female-headed households (FHHs) and male-headed households (MHHs) since the calculated
F value (66.245) was greater than the critical F value (1.394) and the p-value was <.0001.
5.1.4 Assessment of food security and its determinants
Food security has four pillars namely; food availability, food accessibility, food utilization
and stability (FAO, 2008a). However, in order to capture the multidimensional nature of food
security in this study, household food availability was measured using food sources and
sufficiency in own food production while stability was measured using irrigation agriculture
practice. Households’ food accessibility and utilization were measured using per capita food
expenditure and Food Consumption Score (FCS) correspondingly. The Household Food
Security Survey Module (HFSSM) developed by the United States Department of Agriculture
(USDA) was adopted to compute the comprehensive household food security status for each
household.
Using the per capita food expenditure, households were classified into food secure (FSI >1)
and food insecure (FSI <1) and 53.5% households accounted for food insecure households
while 44.5% were food secure. Oguta community was the most food secure since it had
68.3% households with FSI >1 while Ossomala community was the most food insecure with
168
67.2% households having an FSI <1. Thus, food security assessment from the food
accessibility dimension revealed majority of the households in the study area to be food
insecure.
Non availability of data on food production influenced the use of food sources and
sufficiency in own food production to assess the food availability dimension since the duo
influence household consumption pattern and it could be used to determine households’
vulnerability to food insecurity. The results showed that about a half (48.2%) of the sampled
households produced enough food for their households. There was a lucid correlation
between sufficiency in own food production and food security as households that produced
enough for themselves were less vulnerable to food insecurity. However, 55.8% households
depended on their own food production whereas 44.2% households relied on their own food
production and markets as food sources, and it was concluded that households that depended
on their own food production were more vulnerable to flood-induced food insecurity as a
result of crop failure, hence the reason for the highly observed food insecurity in times of
flooding in the study area.
An assessment of the food utilization dimension of food security using the FCS (developed
by WFP, 2008) shows that 79% households were food secure since they had an FCS of >35
(acceptable diet) while 21% were food insecure as a result of them recording an FCS of 21.5
and 35 (borderline diet) and 0% household had an FCS of <21 (poor diet). This implies that
79% of the households recorded a high dietary diversity, indicating that majority of the
households consumed all food groups at least four days per week (reflecting a high food
frequency) and 21% households recorded a high food frequency (at least four days per week)
in all food groups except in animal proteins consumption. However, the reasons for most
households being food secure as a result of their recording high FCS, have been attributed
basically to their reliant on own food production for consumption since they are largely
agrarian.
There was an observed FCS disparity across the eight (8) sampled community es as Ossomala
community accounted for the largest proportion (25%) of food insecure households while
Ezi-Orsu community recorded the least (4.8%) within the 21% households with a borderline
FCS. Similarly, for households (79%) within the acceptable diet, Atani community comprised
the largest proportion (16.1%) of food secure households while Oguta community had the
169
smallest proportion (9.5%) of food secure households. The disparity has been related to the
communities’ sufficiency in own food production.
In terms of assessment of the stability dimension of food security, reliance on rain-fed
agriculture or irrigation were used as proxies. These proxies were opted for because it was
noted that over-reliance of households on rain-fed agriculture increases their vulnerability to
flooding and food insecurity as supported by the findings of Obayelu, 2010; Orewa and
Iyanbe 2009; Kuku-Shittu et al., 2013 who related poor agricultural output and food
insecurity to households’ sole dependency on rainfall with little or no irrigation systems in
Nigeria. The results showed that 88.5% households depended exclusively on rain-fed
agriculture while only 11.5% households practised irrigation agriculture in addition to rain-
fed agriculture. It could be inferred from the result that 88.5% households were vulnerable to
food insecurity as a result of seasonal harvest (July to October) running concurrently with the
seasonal occurrence of floods, and had not benefitted from the all-season planting with an
associated income generation and improved food security that come from irrigation
agricultural practice.
In order to take into cognizance the multi-dimensional nature of food security, the HFSSM
(developed by USDA) was adopted to assess food security comprehensively, since the (18)
questions captured virtually all the food security dimensions. The differential categorization
of households’ food security statuses using different food security measurements/methods
facilitated the adoption of the USDA approach as a standard food security assessment method
in the study area. The USDA approach of measuring food security applied the Rasch model
to extract scores for the food security scale used to classify food security statuses/levels into
four viz; food secure (had scores between 0 and 2.32), food insecure without hunger (scores
from 2.33 to 4.56), moderately food insecure with hunger (scores from 4.57 to 6.53) and
severely food insecure with hunger (scores between 6.54 and 10). The score position of
households on the food security scale is based on the overall pattern of response to the
complete set of indicators (HFSSM, 18 questions) by the households (Bickel et al., 2000).
Generally as shown by the Rasch analysis results, 33.3% households were food secure,
40.2% households were food insecure without hunger, 13% households accounted for the
moderately food insecure with hunger, and 13.5% made up the severely food insecure with
hunger households. The implication is that two third (66.7%) of households in the study were
food insecure while only (33.3%) were food secure. It was revealed that Mmahu community
170
was the most food secure with 44.2% households being in this category while Igbariam
community was the most food insecure with the largest proportion (39.5%) of households
falling into either the moderately food insecure with hunger or the severely food insecure
with hunger categories.
On the one hand, food secure households were those that reported very limited or no food
insecurity or hunger whereas food insecure without hunger households had little or no
reduced food intake, but had concerns regarding adequate food supply. On the other hand,
moderately food insecure households had their adults (with exception of their children)
repeatedly experiencing hunger due to reduction in their food intake while the severely food
insecure with hunger households termed food insecurity hotspots, had all members (adults
and children) repeatedly reducing their food intake, and would need some assistance (usually
not for a short time) for them to cope with food insecurity.
However, binary logistic regression model was used to show the direction, strength and
extent to which twenty-five (25) demographic, social, economic and environmental factors
(independent variable, X) influence food security (dependent variable, Y) in Southeastern
Nigeria at 5% significant level. The statistically significant factors with P < 0.05 were; sex,
marital status, level of education, off-farm income, monthly income, dependency ratio,
sufficiency in food production, livestock ownership, village poultry/poultry ownership,
irrigation practice and flood experience. Ten (10) out of the eleven (11) significant factors
had a positive coefficient with the exception of “flood experience” which had a negative
coefficient. This is an indication that flooding decreases the probability of being food secure
by causing a negative shift in different aspects of food security, ceteris paribus. Moreover,
households headed by men who were married with higher income and level of education, as
well as produced sufficient food for their households and practised irrigation agriculture, in
addition to owning poultry and livestock were more food secure. Surprisingly, the study
found a positive correlation between dependency ratio and food security, meaning households
with larger number of dependents were more likely to be food secure and this has been linked
to cheap farm labour as extra hands are available to cultivate more available communal land
thereby increasing crop production for the agrarian households.
ANOVA was used to test the null hypothesis: “there is no significant difference in the
determinants of food security among households in the agrarian communities” at 0.05 level of
171
significance and since the p-value was <.0001, lesser than 0.05, the null hypothesis was
rejected, showing a statistically significant variations of the factors influencing food security
across households. Similarly, ANOVA was run to show variations in vulnerability to food
insecurity between FHHs and MHHs and a p-value of .015 was extracted, and since it is
<0.05, it means the differences in the inter-household vulnerability to food insecurity were
significant at 5% level.
5.1.5 Assessment of the effects of flood on households’ food security
The effects of flooding on food security in Southeastern Nigeria were assessed using food
expenditure before, during and after flood events; meal frequency before and after flood
events; food security statuses before and after flooding using the USDA approach,
comparative analysis between positive and negative effects of flooding and ordinal regression
analysis to show the direction and extent of flooding on food security.
Flooding caused a mean increase of 78.14% in the tune of two thousand, seven hundred and
seventy-eight Naira, twenty-five Kobo (N2778.25) weekly in terms of amount of money
spent on food (food expenditure), resulting from rise in food prices during flood events.
44.5% and 54.8% households confirmed that flooding “often” and “sometimes” respectively
cause hike in food price, thereby hindering their ability to purchase food.
According to the daily meal frequency data, flooding drastically caused a 60.8% reduction in
daily meal frequency (three square meal); from 82.5% households that had three square meal
before flood events to 21.7% after flood events. This implies that majority of the household
became food insecure after flooding.
The differential household food security status/levels before and after flooding events using
the USDA approach showed that flooding generally reduced food security by increasing the
number of food insecure households to 92.8% (from 66.7% households before flooding),
indicating a 26.5% increase of food insecure households from the normal in Southeastern
Nigeria. Similarly, flooding caused a 26.1% reduction in the number of food secure
households from 33.3% that were food secure before flooding to 7.2% after a flood event.
The proportions of households with the statuses of food insecure without hunger, moderately
food insecure with hunger, severely food insecure with hunger were 39.3%, 15.7% and
37.8% respectively after flooding. Igbariam community was the most affected in terms of
flood-induced food insecurity because all her households became food insecure after flooding
172
with 72.1% experiencing extreme food insecurity with hunger. The second most affected was
Ossomala community which recorded only 1.6% food secure households after flooding while
Oguta community was the least affected by flooding because 22% of her households were
food secure after flooding which is just 4.8% lower than the number recorded before
flooding. However, flooding forced majority of households to move from food insecure
without hunger status to either moderately food insecure with hunger status or severely food
insecure with hunger status (with the exception of households in Oguta community), thereby
increasing the number of food insecurity hotspots. The implication is that, more households
would be needing food assistance to aid them cope with the flood-induced food insecurity.
The comparative analysis of the positive and negative effects of flooding on food security
showed that the negative effects outweighed the positive effects in the study. Six (6) positive
and ten (10) negative effects were identified and analysed on a 5-point scale likert scale with
the negative effects having a mean score of 3.88 greater than the expected 3.0 while the
positive effects had a mean score of 1.78 lesser than the expected 3.0.
Principal Component Analysis (PCA) was used to determine the major areas that flooding
affected food security and three components were extracted with eigen values >1 explaining
68.02% of the total variance, thus summarizing these negative effects of flooding on food
security in three (3) aspects namely; food supply and distribution; household income and
investment; and farm labour and facilities.
The Ordinal Regression Analysis was run to show the direction and extent to which flooding
(independent variable, X) affected food security (dependent variable, Y). Ordinal regression
analysis was chosen because of the ordered nature of the households’ food security levels viz;
food secure, food insecure without hunger, moderately food insecure with hunger and
severely food insecure with hunger. The coefficient for the independent variable (flood
experience) in the model was –0.798. The negative coefficient indicates a negative effect of
flooding on household food security. The extent to which flooding affected food security was
analysed using the odds ratio. The odds ratio for the predictor, flooding, was 2.221 indicating
a strong degree of association between flooding and food security as it is greater the 1, the
baseline for comparison. This implies that households that had experienced flooding were
2.221 times more likely to be food insecure than households that had not.
173
However, the null hypothesis which states that “there is no significant relationship between
flooding and food security of households in the agrarian communities” at 5% significant level
was accepted because the p-value of .361 is greater than 0.05, though, flooding significantly
and negatively affected food security as shown in the multiple logistic regression result.
Meanwhile, the observed negative relationship between flooding and food security makes
flood a limiting factor that reduces food security, holding other factors constant.
5.1.6 Analysis of households’ adaptation strategies to flooding and food insecurity
The study revealed a varied extent of the effects of flooding and food insecurity across
households and because households experienced them differently, they adopted different
coping strategies to protect themselves from further hazard or to maintain their livelihoods in
the face of the stressful events (e.g. flooding).
Change in planting season, early harvest, income diversification, seasonal migration, digging
run-off collection pits, elevating buildings, building makeshift houses, joining social
networks, building small bridges, creating flood water pathways with bamboos and others
were examined as the adaptation/coping strategies adopted by households in times of
flooding. The percentage distribution of these adopted coping strategies against flooding
revealed that “change in planting season” (82.7%) and “building small bridges/creating
pathways for flood water” (15.5%) respectively were the most and least adopted adaptation
strategies by households.
The analysed adaptation and coping strategies practised by households in times of flood-
induced food insecurity and food shortages were thirteen (13) viz; skipping meals, reducing
meal frequency, reducing portion size of meals, buying less preferred/desired food, eat seed
stock/stocked seeds, informal borrowing (money/food), remittance, purchase food on credit,
casual jobs, sale of assets, church charity, loan and begging in decreasing order of practice.
Majority of the households (>80%) adopted the “skipping meals”, “reducing meal frequency”
and “reducing portion size of meals” and about 60% adopted buying less preferred food
coping measures, thereby compromising the quantity and quality of food consumed.
However, there were some observed variations in the coping strategies adopted in times of
emergencies of food insecurity and flooding by the FHHs and MMHs. The reasons for the
varied adaptation strategies according to the headship of the households have been linked to

174
facts such as income and asset poverty gaps including differential household food insecurity
levels.
Additionally, the outcomes of the analysis indicate that most of the coping strategies
employed were drastic and self-devised strategies that provided momentary means of survival
in times of food shortages and flooding at the household level. Therefore, more sustainable
strategies having more institutional connotation (e.g. social security, food safety nets for
flood victims) are suggested in times of flooding and food insecurity to reduce more
pressures on households e.g. it will prevent them from eating up their seed stock/stocked
seeds against the next planting season.
5.2 Conclusion
The study set out to investigate the spatial analysis of the effects of flooding on food security
in the agrarian communities of Southeastern Nigeria. Flooding was found to cause negative
shifts in all dimensions of food security by reducing crop harvest, decreasing income,
destroying roads, destroying food/ farm storage facilities, reducing labour demand, polluting
streams, reducing meal frequency, affecting the quality and quantity of food eaten as well as
increasing food prices in Anambra and Imo States. Consequently, flooding was found to have
a statistically significant negative effect on food security when correlated with other factors
but was a limiting factor (though not significant) that affects food security negatively when
regressed against the latter alone.
However, floods caused some positive effects on food security, though the negative effects
were quite significant, making flooding an intractable environmental problem. Though some
adaptation strategies had been adopted to cushion the effects of flooding and flood-induced
food insecurity, they are ephemeral, thus, expediential long-term policies in relation to the
study’s flood and food insecurity analyses and maps are needed for livelihoods sustainability.
The study produced a flood vulnerability map showing the spatial variations in vulnerability
levels across the study area and this would aid flood emergency response team plan
evacuation in times of flood disasters. There was a statistical significant difference in
households’ vulnerability to flood and in the determinants of households’ food security.
Moreover, communities mapped as highly vulnerable to flooding recorded the largest
proportions of households affected by flood-induced food insecurity, suggesting a direct
proportionality between flood vulnerability and flood-induced food insecurity. Seemingly,
175
the state of a households’ vulnerability to flooding and food insecurity are significantly
determined by a combination of socio-economic, demographic and environmental factors.
Consequently, households headed by younger persons were revealed to be more vulnerable to
flooding whereas female-headed households were more vulnerable to food insecurity in the
study area.
The study categorically revealed that larger household size is a resource in agrarian
communities as it generally connotes cheaper labour and more man power for households to
cultivate more land, invariably boosting their food security, ceteris paribus.
Therefore, our study concludes that, “The higher the dependency ratio of a household with
respective higher income of the household head, the higher the level of food security”.
Conversely, this implies that, poorer agrarian households with higher number of dependants
were highly vulnerable to food insecurity in times of flooding which had associated hike in
food prices in the South eastern region of Nigeria.
5.3 Major findings and contributions to knowledge
There are little or no safety nets for agrarian communities in Southeastern Nigeria.
Most farmers have no idea about and have not benefitted from Agricultural programmes such
as FADAMA Projects.
Agricultural extension services are lacking in the study area.
Socio-economic and demographic factors are the major determinants of vulnerability to
flooding and food insecurity.
There were significant inter- and intra-household differences in the vulnerability to flooding.
There were significant inter-household variations in the determinants of food insecurity.
Gender-based disparity in vulnerability to flooding and food insecurity was significant with
FHHs having the greatest propensity to be adversely affected.
All four dimensions of food security were measured using different indicators and it was
noted that food security measurement based on one dimension of food security leads to over
categorization of households into various food secure/insecure categories.
Vulnerability to flooding is directly proportional to flood-induce food insecurity.
Larger household size is a resource in agrarian communities as it increases the possibility of
being food secure through cheaper farm labour and more man power to cultivate more land.

176
Female-headed households were more vulnerable to food insecurity.
Households headed by younger heads were more vulnerable to flooding.
Income from off-farm activities has a decreasing effect on vulnerability to flooding and food
insecurity.
Compromising food quantity and quality are first steps taken by agrarian households in times
of food insecurity.
Flooding is a significant environmental factor that affects food security negatively.
5.4 Recommendations
In the light of the findings from the study and to assist vulnerable groups strengthen their
adaptation and eventually boost the well-being of households as well as to achieve the
Sustainable Development Goals especially Goal 2 which seeks to “end hunger, achieve food
security and improve nutrition, and promote sustainable agriculture” with special emphasis
on Target 2.4 which includes strengthening capacity for adaptation to flooding by 2030 and
the Nigeria’s Vision 20:2020, recommendations have been made. These recommendations
are categorized into area-specific and specific policies implementations.
The area-specific recommendations are;
5.4.1. Storage facilities
Absence of storage facilities was among the major reason for decreased crop production in
the last five years in the agrarian communities as many were forced to harvest early to avoid
impending flood damages. Storage facilities such as yam and maize barns were found to be
owned by only 22.7% households while 12.8% households had other forms of storage
facilities. Thus, a construction of standard-mega-capacity storage facilities (e.g. silos for
grains) at the Local Government Level would help the agrarian households store their farm
produce with a multiplier effect on reducing crop wastage and economic losses during
flooding, and improving food security. This could be sustained by farmers paying a
maintenance fee either monthly, quarterly, biannually or annually.
5.4.2. Irrigation schemes (including flood water harvesting)
Micro irrigation was practised by only 11.5% households especially rice farmers, which
negates the expected as regards the availability of rivers in the study area. Instituting
irrigation schemes (micro and macro) to encourage all (off- and on-) season growing of crops
is essential since majority of the households are agrarian. This will increase crop yields (by
177
reducing dependency on rainfall) and help agrarian households produce more during off-
flood season. What is needed is for the appropriate government authorities (e.g. Anambra-
Imo River Basin Development Authority) to dam the rivers that already surround these
agrarian communities. Controlled flooding as a result of river damming could be an
advantage to the communities since they are mostly affected by river flooding. In addition,
flood water harvesting through constructed reservoirs are also encouraged to improve post
flooding planting especially for rice farmers.
5.4.3. Access to Micro-credit schemes/ Economic empowerment of agrarian households
The survey showed that most agrarian households had access to little or no loan/credit
facilities. Economic empowerment of these agrarian households will increase productivity as
it was found out that land availability was not a problem but inadequate funds to cultivate the
available land. This could be realised by incorporating into policies micro-credit schemes for
agricultural households or implementing already existing policies. It will encourage larger
land holdings as some farmers claimed they did not have the resources to cultivate the
available (free) large expanse of communal land.
5.4.4. Social protection fund/Internally Displaced Persons (IDPs) camps
Early flood warning had been regular after the 2012 devastating flood episodes, but that is not
enough as proper social protection fund and IDPs camps are encouraged to help affected
households cope with flood impacts. This should be incorporated into the State’s Flood
Mitigation measures to enable victims settle in after flood disaster.
5.4.5. Farmers’ associations, formal marketing group/market linkage
There were observed economic losses resulting from crop wastage in the agrarian
communities because of lack of buyers and due to supply exceeding demand during harvest
seasons. Similarly, a substantial number of household heads were not members of any
Farmers’ association or groups, thereby missing out on the benefits of such associations.
Thus, households are encouraged to join social networks (e.g. table contribution group,
organized cooperatives) to encourage savings and reduce their vulnerabilities to flooding and
food insecurity. However, to curb crop wastages and supply failures, a formal marketing
group is suggested to create a market linkage between registered farmers and buyers within
and outside the communities. These groups could be facilitated by the government (State’s
Ministry of Agriculture) and non governmental agencies with farmers as executive officers.
178
5.4.6. Households’ sensitisation and Flood insurance
There was no recorded flood insurance among the sampled households, therefore it is
recommended that households are sensitised on the flood insurance and importance of having
their properties insured. This will be feasible and sustainable if the flood insurance is
subsidized for the farmers by the government, that is, the government contributes part of the
flood insurance while farmers pay the rest.
5.4.7. Access to technology, mechanization, improved seeds, agricultural extension
services
The study area was devoid of mechanized agricultural with only 10% households reported to
have used tractor. Acquiring tractors is quite expensive, but the State can provide tractors
and encourage farmers (especially medium- and large-scale farmers) to use them under
subsidy plans. In addition, encouragement of locally constructed tractors with lesser expertise
to operate is an option suggested. The animal-driven technology practised mostly in Northern
Nigeria should be encouraged in these agrarian especially for small-scale farmers.
Access to agricultural extension services and improved seeds were observed to be lacking in
the sampled communities, thus the services of agricultural extension personnel should be
deployed in agrarian communities to aid them with improved seeds and on agricultural
practices which will increase their crop productivity, improve income generated from crop
sales, and thereby, their food security.
Strengthening and implementations of initiatives and policies such as;
5.4.8. Agriculture Promotion Policy (APP)
The judicious implementation of the Agriculture Promotion Policy (APP) would enhance
food security in the agrarian communities. The Agriculture Promotion Policy (APP) (2016-
2020) is a continuation of the Agricultural Transformation Agenda (ATA) policy (2011-
2015) built on the principle that agriculture is a business. The APP aims at enhancing access
to land, inputs, finance, information and knowledge, climate smart agriculture as well as
increasing production.
5.4.9. Nigeria Incentive-Based Risk Sharing System for Agricultural Lending (NIRSAL)
The strengthening of Nigeria Incentive-Based Risk Sharing system for Agricultural Lending
(NIRSAL) initiative was launched in 2011 and integrated by the Central Bank of Nigeria
(CBN) in 2013. It was proposed to enable the flow of affordable financing to all stakeholders
179
within the whole agricultural value chains. The Southeastern region has comparative
advantage in the production of two (maize and cassava) among the six pilot crops (tomatoes,
rice, soya beans, cotton, maize and cassava) of NIRSAL. This will reduce poverty, increase
access to credit, improve productivity and food security in the agrarian communities.
5.5 Recommendations for Further Research
The study has been able to demonstrate that flooding induces food insecurity leading to
changes in food consumption patterns, and this flood-induced food insecurity arises as a
result of destruction of farmland, disruption of sources of livelihoods, rise in food prices
which significantly affect food availability, accessibility and utilization over time. Thus, the
following are suggested for further studies;
Relationship between vulnerability to flooding and food insecurity in other regions with
emphasis on how flood extent influence crop yield since crop yield could not be integrated in
the survey used for our analysis due to lack of data.
The role of food prices as a determinant of household food security to test the robustness of
this study’s findings.
180
REFERENCES
A beginner’s guide to eigenvectors, PCA, covariance and entropy (2018). Retrieved March 10,
2018, from https://deeplearning4j.org/eigenvector
Aandahi, G. and O’Brien, K. (2001, September). Vulnerability to Climate Changes and
Economic Changes in India Agriculture. Paper presented at the biannual Conference of
the Nordic Association for South Asian Studies on Waters of Hope: The Role of Water in
South Asian Development, Voss, Norway.
Abu, O. (2012). Food Security in Nigeria and South Africa: Policies and Challenges. Kamla-
Raj J Hum Ecol, 38(1), 31-35.
Adedeji, O. H., Odufuwa B. O., and Adebayo O. H. (2012). Building Capabilities for Flood
Disaster and Hazard Preparedness and Risk Reduction in Nigeria: Need for Spatial
Planning and Land Management. Journal of Sustainable Development in Africa, 14(1), 1-
14.
Adelekan, I. O. (2009). Vulnerability of Poor Urban Coastal Communities to Climate Change in
Lagos, Nigeria. Fifth Urban Research Symposium (pp.1-18).
Adeloye, A. and Rustum R. ( 2011). Lagos (Nigeria) flooding and influence of urban planning.
Journal of Urban Design and Planning (ICE), 164 (3), 175 –187.
Adeoye, N. O., Ayanlade, A. and Babatimehin, O. (2009). Climate Change and Menace of
Floods in Nigerian Cities: Socio-economic Implications. Advances in Natural and Applied
Sciences, 3(3), 369-377.
Adepoju, A. O. and Adejare, K.A. (2013). Food Insecurity Status of Rural Households during
the Post-planting Season in Nigeria. Journal of Agriculture and Sustainability, 4 (1), 16-
35.
Adepoju, A. A and Olawuyi, S.O. (2012). Effect of livelihood activities on food security
among farmers in Oyo East Local Government Area of Oyo State, Nigeria. Advances in
Agriculture and Botanics Bioflux, 4 (3), 112-121.
Aderogba, K. A. (2012). Global warming and challenges of floods in Lagos metropolis, Nigeria.
Academic Research International, 2 (3), 448-468.
Adewuyi, T. O. and Olofin, E. A. (2014). Spatio-Temporal Analysis of Flood Incidence in
Nigeria and Its Implication for Land Degradation and Food Security. Journal of
Agricultural Science, 6(2),150-159.
Adger, W. N. (1999). Social Vulnerability to Climate Change and Extremes in Coastal Vietnam.
World Development 27(2), 249-269.
Adger, W. N., Huq, S., Brown, K., Conway, D. and Hulme, M. (2002). Adaptation to Climate
Change: Setting the Agenda for Development Policy and Research (Working Paper 16).
Norwich: Tyndall Centre for Climate Change Research, University of East Anglia.
Adger, W. N., Brooks, N., Bentham, G., Agnew, M. and Eriksen, S. (2004). New Indicators of
Vulnerability and Adaptive Capacity (Technical Report 7). Norwich: Tyndall Centre for
Climate Change Research, University of East Anglia.
181
Ahmed, F. F. and Dotti, R. Y. (2014). Food Security and Coping Strategies amongst Medium
Income Earners in Maiduguri Metropolis of Borno State, Nigeria. Journal of Humanities
and Social Science, IOSR, 19 (1, Ver. IX), 1-8.
Aidoo, R., Mensah, J. O., Tuffour, T. (2013). Determinants of Household Food Security in the
Sekyere-Afram Plains District of Ghana. 1st Annual International Interdisciplinary
Conference, AIIC, proceedings, Azores, Portugal, 514-521.
Ajaero, C.K. (2017). A gender perspective on the impact of flood on the food security of
households in rural communities of Anambra state, Nigeria. Food Security 9 (4), 685–695
Ajaero, C.K. and Mozie, A.T. (2014). Socio-demographic differentials in vulnerability to flood
disasters in rural Southeastern Nigeria. A paper presented at the International Seminar on
Demographic Differential Vulnerability to Natural Disasters in the Context of Climate
Change Adaptation, Kao Lak, Thailand.
Akinsanola A. A. and Ogunjobi K. O. (2014). Analysis of rainfall and temperature variability
over Nigeria. Global Journal of Human-Social Science (B), 14 (3).
Akudugu, M.A., Dittoh, S. and Mahama, E.S. (2012). The Implications of Climate Change on
Food Security and Rural Livelihoods: Experiences from Northern Ghana. Journal of
Environment and Earth Science, 2(3), 21-29.
Akukwe, T. I. (2007). Environmental Quality and the Impact of Bureau for Environment and
Sanitation in Owerri Urban Area, Imo State, Nigeria (Unpublished B.Sc project).
Department of Geography, University of Nigeria, Nsukka.
Akukwe, T.I. (2012). Vulnerability and adaptation to flooding in Port Harcourt metropolis,
Nigeria (Unpublished M.Sc project). Department of Geography, University of Nigeria,
Nsukka.
Akukwe, T.I. (2014). Determinants of flooding in Port Harcourt metropolis, Nigeria. Journal of
Humanities and Social Science, IOSR, 19(11, Ver.VIII), 64-72. DOI: 10.9790/0837-
191186472.
Akukwe, T. I. and Ogbodo, C. (2015). Spatial analysis of vulnerability to flooding in Port
Harcourt metropolis, Nigeria. SAGE Open 5(1), 1-19. DOI: 10.1177/2158244015575558.
Allen, K. (2003). Vulnerability reduction and the community-based approach: A Philippines
study. In M. Pelling (Ed.), Natural Disasters and Development in a Globalizing World
(pp.170–184). New York: Routledge.
Ali, A. M. S. (2007). September 2004 flood event in southwestern Bangladesh: A study of its
nature, causes, and human perception and adjustments to a new hazard. Nat Hazards, 40,
89–111.
Amaize, E. (2011, July 4). Flood displaces 50 Villagers in Delta State. Vanguard, p. 9.
182
Ambali, O.I., Adewuyi, S.A., Babayanju, S. O. and Ibrahim, S. B. (2015). Expansion of Rice for
Job Initiative Programme: Implications for Household Food Security in Lagos State
Nigeria. Advances in Economics and Business, 3(3), 99-106. DOI:
10.13189/aeb.2015.030303. http://www.hrpub.org.
Anderson, M.B. and Woodrow, P.J. (1991). Reducing vulnerability to drought and famine:
developmental approaches to relief. Disasters, 15, 43-54.
Anejionu, O.C.D., Nwilo, P.C. and Ebinne, E.S. (2013, May). Long Term Assessment and
Mapping of Erosion Hotspots in South East Nigeria. Environment for Sustainability, FIG
Working Week, Abuja, Nigeria.
Antwi, E.K., Boakye-Danquah, J., Owusu, A.B., Loh, S.K., Mensah, R., Boafo, Y.A. and
Apronti, P.T. (2015). Community vulnerability assessment index for flood prone savannah
agro-ecological zone: A case study of Wa West District, Ghana. Weather and Climate
Extremes, 10 (B), 56-69. https://doi.org/10.1016/j.wace.2015.10.008
Anyadike, R.N.C. (2002). Climate and Vegetation. In G. E. K. Ofomata (Ed.), A Survey of the
Igbo Nation (pp. 73-82). Onitsha: Africana FEP Publishers.
Anyadike, R.N.C. (2009). Statistical Methods for the Social Sciences. Ibadan: Spectrum Books
Limited.
Aragon-Durand, F. (2007). Urbanization and flood vulnerability in the peri-urban interface of
Mexico City. Disasters, 31(4), 477–494.
Arene, C.J. and Anyaeji, R.C. (2010). Determinants of Food Security among Households in
Nsukka Metropolis of Enugu State, Nigeria. Pakistan Journal of Social Sciences, 30 (1),
9-16
Asogwa, B. C and Umeh, J. C. (2012, December). Food Insecurity Determinants among Rural
Farm Households in Nigeria. International Conference on Ecology, Agriculture and
Chemical Engineering (ICEACS), Phuket (Thailand)
Atoloye, A.T., Ogunba, B.O. and Samuel, F.O. (2015). Spatial Pattern of Household Food
Insecurity and Childhood Malnutrition in Akinyele Local Government Area, Nigeria.
International Journal of Health Sciences 3(1), 235-250.
Babatunde, R. O. and Martinetti, E. C. (2010). Impact of remittances on food security and
nutrition in rural Nigeria. Unpublished manuscript, Center for International Cooperation
and Development, University of Pavia.
Babatunde, R.O., Omotesho, O.A. and Sholotan, O.S. (2007). Factors influencing food security
status of rural farming households in North Central Nigeria. Agricultural Journal, 2(3),
351-357.
Balabanova, S. and Vassilev, V. (2010, May). Creation of flood hazard maps. BALWOIS
2010-Ohrid, Republic of Macedonia. Retrieved from
http://balwois.com/balwois/administration/full_paper/ffp-1560.pdf.
183
Balica, S. F. (2012). Applying the flood vulnerability index as a knowledge base for flood risk
assessment (PhD thesis). UNESCO-IHE, Institute for Water Education, Delft, The
Netherlands.
Bankoff, G. (2003). Constructing vulnerability: the historical, natural and social generation of
flooding in metropolitan Manilla. Disasters 27, 224–238.
Barrett, C. B., Reardon, T. and Webb, P. (2001). Nonfarm income diversification and household
livelihood strategies in rural Africa: concepts, dynamics, and policy implications. Food
Policy 26, 315-331. http://dx.doi.org/10.1016/S0306-9192(01)00014-8
Barrett, C.B. and Lentz, E.C. (2010). Food Insecurity. In R.A. Denemark et al. (Eds), The
International Studies Compendium Project (pp. 1-44). Oxford: Wiley-Blackwell
Publishing.
Barroca, B., Bernardara, P., Mouchel, J.M. and Hubert, G. (2006). Indicators for identification
of urban flood vulnerability. Nat Hazards Earth Syst Sci, 6, 553–558.
Bashir, M. K., Schilizzi, S. and Pandit, R. (2012). The Determinants of Rural Household Food
Security for Landless Households of the Punjab, Pakistan. Working Paper 1208, School of
Agricultural and Resource Economics, University of Western Australia, Crawley,
Australia.
Bashir, M.K. and Schilizzi, S. (2013). Determinants of rural household food security: a
comparative analysis of African and Asian studies. Journal of the Science of Food and
Agriculture 93 (6), 1251-1258. https://doi.org/10.1002/jsfa.6038
Battersby, J. (2011). The State of Urban Food Insecurity in Cape Town. (Urban Food Security
Series No. 11). Kingston and Cape Town: Queen’s University and AFSUN.
Beyene, F., and Muche, M. (2010). Determinants of Food Security among Rural Households of
Central Ethiopia: An Empirical Analysis. Quarterly Journal of International Agriculture,
49(4), 299-318.
Bickel, G., Nord, M., Price, C., Hamilton, W. and Cook, J. (2000). Guide to Measuring
Household Food Security, Revised 2000. Alexandria, USDA.
Blaikie, P., Cannon, T., Davis, I. and Wisner, B. (1994). At Risk: Natural Hazards, People’s
Vulnerability, and Disasters. Routledge, London.
Brooks, N. (2003): Vulnerability, Risk and Adaptation: A Conceptual Framework (Working
Paper 38). Norwich: Tyndall Centre, University of East Anglia.
Brooks, N., Adger, W. N. and Kelly, P. M. (2005). The Determinants of Vulnerability and
Adaptive Capacity at the National Level and the Implications for Adaptation. Global
Environmental Change, 15, 151–163. Doi:10.1016/j.gloenvcha.2004.12.006.

184
Burton, I., Huq, S., Lim, B., Pilifosova, O. and Schipper, E. L. (2002). From Impacts
Assessment to Adaptation Priorities: The Shaping of Adaptation Policies. Climate Policy,
2, 145-159.
Cannon, T. (2002). Gender and Climate Hazards in Bangladesh. Gender and Development, 10
(2), 45-50.
Cardona, O. D. (2004). The Need for Rethinking the Concepts of Vulnerability and Risk from a
Holistic Perspective: A Necessary Review and Criticism for Effective Risk Management.
In G. Bankoff, G. Frerks and D. Hilhorst (Eds.), Mapping Vulnerability: Disasters,
Development and People. London: Earthscan Publications Ltd.
Cardona, O. D., Van Aalst, M. K., Birkmann, J., Fordham, M., Mc Gregor, G., Rosa, P., ...
Thomalla, F. (2012). Determinants of risk: Exposure and vulnerability. In Managing the
Risks of Extreme Events and Disasters to Advance Climate Change Adaptation: Special
Report of the Intergovernmental Panel on Climate Change (pp. 65-108). Cambridge
University Press. DOI: 10.1017/CBO9781139177245.005
Carletto, C., Zezza, A. and Banergec, R. (2013). Towards better measurement of household
food security: harmonizing indicator and the role of household surveys. Glob Food Sec 26,
30–40.
Castell, G.S., Rodrigo, C.P., Ngo de la Cruz, J. and Bartrina, J.A. (2015). Household Food
Insecurity Access Scale (HFIAS). Nutr Hosp.,31(3), 272-278.
Chan, N. W. and Parker, D. J. (1996). Response to Dynamic Flood Hazard Factors in Peninsular
Malaysia. The Geographical Journal 162(3), 313–25.
Coates J., Swindale, A. and Bilinsky, P. (2007). Household Food Insecurity Access Scale
(HFIAS) for Measurement of Food Access: Indicator Guide (v. 3). Washington, DC: Food
and Nutrition Technical Assistance Project, Academy for Educational Development.
Coleman-Jensen, A., Rabbitt, M. P., Gregory, C. and Singh, A. (2015). Household Food
Security in the United States in 2014 (Economic Research Report Number 194). United
States Department of Agriculture, Economic Research Service.
Complete coping Strategies Analysis (2018). Retrieved on March 1, 2018, from
http://www.livelihoodscentre.org/-/complete-coping-strategies-
analysis?p_r_p_564233524_resetCur=true&p_r_p_564233524_categoryId=26507
Corder, G. W. And Foreman, D. I. (2009). Nonparametric Statistics for Non-Statisticians.
Hoboken: John Wiley & Sons.
Cutter, S. L., Mitchell, J. T. and Scott, M. S. (2004). Revealing the vulnerability of people and
places: A case study of Georgetown county, South Carolina. Annals of the Association of
American Geographers, 90(4), 713–737.
David. S., Huq, S., Pelling, M., Reid, H. and Lankao, P.R. (2007). Adapting to Climate Change
in Urban Areas The possibilities and constraints in low- and middle-income nations.
Human Settlements Discussion Paper Series.
185
Davies, S. (1993). Are Coping Strategies a Cop Out? IDS Bulletin, 24, 60-72.
Dawit, D. and Zeray, N. (2017). Determinants of Rural Household Food Security in Wolaita
Zone: The case of Humbo Woreda. Journal of Poverty, Investment and Development 32,
65-82.
Denton, F. (2002.). Climate Change Vulnerability, Impacts, and Adaptation: Why does Gender
matter? Gender and Development, 10 (2), 10-20.
Dercon, S. ( 2001): Income Risk, Coping Strategies and Safety Nets (Working Paper
WPS2000.26). Centre for the Study of African Economies (CSAE), Oxford.
Deressa, T., Hassan R.M. and Ringler, C. (2008). Measuring Ethiopian Farmers’ Vulnerability
to Climate Change Across Regional States (Discussion Paper 00806). Washington DC:
International Food Policy Research Institute (IFPRI).
Devereux, S. (2007). The impact of droughts and floods on food security and policy options to
alleviate negative effects. Agricultural Economics, 37(s1), 47-58. Retrieved from
https://www.unicef.org/socialpolicy/files/The_Impact_of_Droughts_and_Floods_on_Food
_Security.pdf
DFID (1999). Sustainable Livelihoods Guidance Sheets. Department for International
Development United Kingdom.
Djangmah, G.M. (2016). Comparative Analysis of Food Security Status of Farming Households
in Eastern and Northern Regions of Ghana (Unpublished M.Sc project). Department of
Agricultural Economics, McGill University, Montreal; Quebec, Canada.
Douglas,I., Alam, K., Maghenda, M., Mcdonnell, Y., Mclean, L. and Campbell, J. (2008).
Unjust waters: climate change, flooding and the urban poor in Africa. Environment and
Urbanization, 20 (1), 187-206. DOI: 10.1177/0956247808089156.
Downing, T.E., Butterfield, R., Cohen, S., Huq, S., Moss, R., Rahman, A. et al. (2001):
Vulnerability indices: Climate change impacts and adaptation. UNEP Policy Series,
UNEP, Nairobi.
Downton, M.W., Miller, J.Z.B. and Pielke, R.A.J. (2005). Reanalysis of US National Weather
Service flood loss database. Nat. Hazards Rev.6,13–22.
Duru, A. J. (2008). The implications of variability in rainfall over Imo state on little dry season
(1975-2007) (Unpublished B.Sc project). Department of Geography and Environmental
Management, Imo State University, Owerri.
Duru, P. N. and Chibo, C.N. (2014). Flooding in Imo State Nigeria: The Socio-Economic
Implication for Sustainable Development. Humanities and Social Sciences Letters, 2(3),
129-140.

186
Dutta, D., Khatun, F., Herath, S. (2005). Analysis of flood vulnerability of urban buildings and
populations in Hanoi, Vietnam. Seisankenkyu, 57(4), 338–342.
The Economic Intelligent Unit (EIU, 2015). Global food security index 2015: An annual
measure of the state of global food security. London: The Economist Intelligence Unit
Limited.
Ejikeme, J.O., Igbokwe, J.I., Ezeomedo, I.C., Aweh, D.S. and Akinroye, R. (2015). Analysis of
Risks and Impacts of Flooding with Satellite Remote Sensing. Journal of Environment and
Earth Science, 5 (4). http://www.iiste.org/Journals/index.php/JEES/article/view/20118
Emaziye, P. O., Okoh , R. N. and Ike, P. C. (2013). An Evaluation of Effect of Climate Change
on Food Security of Rural Households in Cross River State, Nigeria. Asian Journal of
Agricultural Sciences, 5(4), 56-61.
Ellis, F. (2000). The determinants of rural livelihood diversification in developing countries.
Journal of Agricultural Economics 51 (2), 289-302. http://dx.doi.org/10.1111/j.1477-
9552.2000.tb01229.x
Emma, L., Tompkins, E. L., Lemos, M.C. and Boyd, E. (2009). Disaster Risk Management as a
Barrier to Sustainable Adaptation: Responding to Climate-driven Hazards in the Cayman
Islands and NE Brazil. Paper presented at the opening meeting of the 7th International
Science Conference on Human Dimensions on the Global Environmental Change.
Epstein, K., DiCarlo, J., Marsh, R., Ray, I. and Måren, I. (2017). Coping Strategies of
Smallholder Farming Communities after the 2015 Nepal Earthquake: Insights into Post-
Disaster Resilience and Social–Ecological Change. Case Studies in the Environment. DOI:
https://doi.org/10.1525/cse.2017.000612
Epstein, K., DiCarlo, J., Marsh, R., Adhikari, B., Paudel, D., Ray, I. and Måren, I. E. (2018).
Recovery and adaptation after the 2015 Nepal earthquakes: a smallholder household
perspective. Ecology and Society 23(1):29. https://doi.org/10.5751/ES-09909-230129
Etuonovbe, A. K. (2011, May). Devastating Effect of Flooding in Nigeria. FIG Working Week
2011: Bridging the Gap between Cultures, Marrakech, Morocco.
Eze, P. (2017). Personal communication.
Fakayode, S. B., Rahji, M. A. Y., Oni, O. A. and Adeyemi, M. O. (2009). An Assessment of
Food Security Situations of Farm Households in Nigeria: A USDA Approach. The Social
Sciences 4(1), 24-29.
FAO (1996). Rome Declaration on World Food Security and World Food Summit Plan of
Action. Rome: FAO Document Repository.
FAO (2003). Trade Reforms and Food Security: Conceptualizing the Linkages. Rome: The Food
and Agriculture Organization of the United Nations.
FAO (2005). Food and Agricultural Organization of the United Nations. FAOSTAT, Statistical
Database, Rome: FAO.
FAO (2006). Food Security. Policy Brief (June), 2. http://www.fao.org/forestry/13128-
0e6f36f27e0091055bec28ebe830f46b3.pdf
187
FAO (2007). Climate Change and Food Security: A Framework Document – Summary. Rome:
The Food and Agriculture Organization of the United Nations.
FAO (2008a). Food Security Concepts and Frameworks: Food Security Information for Action,
e-learning manual. Retrieved from http://www.fao.org/elearning/Course/FC/ en/ Course
Viewer.asp?language=en. at 01:20am Thursday 25/06/2015).
FAO (2008b). Climate Change and Food Security: A Framework Document. Rome: The Food
and Agriculture Organization of the United Nations.
FAO/NRCB (2008, April). Poster presented at the International Conference on Food Security
and Environmental Change, Oxford, UK.
FAO (2010). The State of Food Insecurity in the World: Addressing Food Insecurity in
Protracted Crises. Rome: Food and Agricultural Organisation of the United Nations.
FAO (2011). The State of Food and Agriculture, 2010–2011: Women in Agriculture—Closing
the Gender Gap for Development. Rome: FAO.
FAO (2015). Regional overview of food insecurity: African food security prospects brighter
than ever. Accra: FAO.
Farzana, F.D., Rahman, A.S., Sultana, S., Raihan, M.J., Haque, M.A., Waid, J.L., et al. (2017).
Coping Strategies related to food insecurity at the household level in Bangladesh.
PLoSONE 12(4):e0171411. https://doi.org/10.1371/journal.pone.0171411
Fasoranti, M. (2006). A Stochastic Frontier Analysis of Effectiveness of Cassava-Based
Cropping Systems in Ondo State, Nigeria (PhD Dissertation). Federal University of
Technology, Akure.
Federal Republic of Nigeria (FRN, 2008). National Food Security Programme, Federal Ministry
of Agriculture and Water Resources.
Feleke, S. T., Kilmer, R. L. and Gladwin, C. H. (2003). Determinants of Food Security in
Southern Ethiopia. A Selected Paper Presented at the American Agricultural Economics
Association Meetings, Montreal, Canada.
Fernandez, P., Mourato, S. and Moreira, M. (2016). Social vulnerability assessment of flood risk
using GIS-based multicriteria decision analysis. A case study of Vila Nova de Gaia
(Portugal). Geomatics, Natural Hazards and Risk, 7 (4), 1367-1389.
Famine Early Warning Systems Network (FEWSNET, 2012). Third quarter 2012. Retrieved
from www.fews.net/ml/en/info/Pages/fmwkfactors.aspx?l=en&gb=ng&fmwk=factor
Famine Early Warning Systems Network (FEWSNET, 2013). Nigeria Food Security Update,
“Food insecurity increases in Regions affected by flooding and conflict”. Retrieved from
http://reliefweb.int/sites/reliefweb.int/files/resources/Nigeria%20Food%20Security%20Up
dated%20March%202013.pdf.
188
Few, R. (2003). Flooding, Vulnerability and Coping Strategies: Local Responses to a Global
Threat. Progress in Development Studies, 3 (1), 43-58. DOI: 10.1191/1464993403ps049ra.
Folorunsho, R. and Awosika, L. (2001, November). Flood Mitigation in Lagos, Nigeria
Through Wise Management of Solid Waste: A case of Ikoyi and Victoria Islands;
Nigerian. Paper presented at the UNESCO-CSI workshop, Maputo.
Foster, J., Greer, J., Thorbecke, E. (1984). A class of decomposable poverty measures.
Econometrica 52, 761–776.
Fussel, H.M. and Klein, R.J.T. (2006). Climate change vulnerability assessment: An evolution
of conceptual thinking. Climate Change 75, 301-329.
Gautam, Y. and Andersen, P. (2016). Rural livelihood diversification and household well-being:
Insights from Humla, Nepal. Journal of Rural Studies 44, 239-249.
https://doi.org/10.1016/j.jrurstud.2016.02.001
Gbetibouo, G. A. and Ringler, C. (2009). Mapping South African farming sector vulnerability to
Climate Change and variability: A sub-national assessment (IFPRI Discussion Paper
00885). Washington DC: International Food Policy Research Institute, Environment and
Production Technology Division.
Goshu, M.T. (2016). Determinants of Rural Food Security and Child Nutrition: The Case Study
of Gubalafto District of Amhara Regional State, Ethiopia (Unpublished PhD thesis).
Department of Economics, Aligarh Muslim University Aligarh, India.
Greer, J. and Thorbecke, E. (1986). A methodology for measuring food poverty applied to
Kenya. Journal Development Economics, 24(1), 59-74.
Gupta, P., Singh, K., Seth, V., Agarwal, S., and Mathur, P. (2015). Coping Strategies Adopted
by Households to Prevent Food Insecurity in Urban Slums of Delhi, India. Journal of
Food Security, 3(1), 6-10.
Habyarimana, J.B. (2015). Determinants of Household Food Insecurity in Developing
Countries: Evidences from a Probit Model for the Case of Rural Households in Rwanda.
Sustainable Agriculture Research, 4 (2). DOI: http://dx.doi.org/10.5539/sar.v4n2p78
Hanjra, M. A. and Qureshi, M.E. (2010). Global water crisis and future food security in an era of
climate change. Food Policy, 35 (5), 365–377.
Heltberg, R. and Bonch-Osmolovskiy, M. (2011). Mapping vulnerability to Climate Change (
Policy Research Working Paper 5554). Washington DC: The World Bank, Sustainable
Development network, Social Development Unit.
Henri-Ukoha, A, Ibekwe, U.C., Chidiebere-Mark, N.M., Ejike, R and Oparadim (2013).
Determinants of food security in female-headed households involved in individual tenure
system in Abia State, Southeast Nigeria. Global Journal of Agricultural Research 1(2),
48-57.
Hinkel, J. (2011). Indicators of vulnerability and adaptive Capacity: towards a clarification of
the science-policy interface. Global Environmental Change, 21, 198-208.
189
Hoddinott, J. (2001). Choosing Outcome Indicators of Household food Security. In J. Hoddinott
(Ed.), Food Security in Practice: Methods for Rural Development Projects (pp. 31-45).
Washington, DC: IFPRI.
Homewood, K. (1995). Pastoralist Production Systems and Climate Change. In T. E. Downing
(Ed.), Climate change and World Food security (pp. 505-524). Berlin: Springer.
Ibok, O. W., Bassey , N. E., Atairet, E. A. and Obot, O. J. (2014). Food Security Determinants
among Urban Food Crop Farming Households in Cross River State, Nigeria. Asian
Journal of Agricultural Extension, Economics & Sociology, 3(1), 76-90.
Ibok, O. W., Idiong, I. C., Brown, I. N., Okon, I. E. and Okon, U. E. (2014). Analysis of food
insecurity status of urban food crop farming households in Cross River State, Nigeria: A
USDA approach. Journal of Agricultural Science, 6 (2), 132-141.
Ibrahim, H., Uba-Eze, N. R., Oyewole, S. O. and Onuk, E. G. (2009). Food Security among
Urban Households: A Case Study of Gwagwalada Area Council of the Federal Capital
Territory Abuja, Nigeria. Pakistan Journal of Nutrition, 8 (6), 810-813.
International Fund for Agricultural Development (IFAD, 2009). ‘Dimensions of Rural Poverty’.
Rural Poverty Portal. Retrieved from http://www.ruralpovertyportal.org/topic.
International Fund for Agricultural Development (IFAD, 2012). Enabling Poor Rural people to
overcome Poverty in Nigeria. IFAD: Rome. Retrieved from
www.ruralpovertyportal.org/country/statistics/tags/Nigeria.
Intergovernmental Panel on Climate Change (IPCC, 2001). Climate Change 2001: Impacts,
Adaptation, and Vulnerability, Summary for Policymakers. A Report of Working Group II
of the IPCC. Geneva: IPCC.
Intergovernmental Panel on Climate Change (IPCC, 2007). Appendix 1: Glossary. In M. L.
Parry, O. F. Canziani, J. P. Palutikof, P. J. Van der Linden and C. E. Hanson (Eds.),
Climate Change 2007: Impacts, adaptation and vulnerability. Contribution of Working
Group II to the Fourth Assessment Report of the International Panel on climate Change.
Cambridge University Press: Cambridge.
Intergovernmental Panel on Climate Change (IPCC) (2012). Managing the risks of extreme
events and disasters to advance climate change adaptation. A special report of Working
Groups I and II of the Intergovernmental Panel on Climate Change. Cambridge
University Press: Cambridge.
Ismail, M. D. and Mustaquim, M. D. (2013). Socio-economic status of population in flood prone
areas of Chanchal sub-division in Malda district, West Bengal. International Journal of
Research in Applied, Natural and Social Sciences 1(3), 141-152.

190
Israel, G. D. (1992). Sampling the Evidence of Extension Program Impact. Program
Evaluation and Organisational Development. Institute of Food and Agricultural Sciences
(IFAS): University of Florida (PEOD-5).
Jeb, D. N and Aggarwal, S. P. (2008). Flood inundation hazard modelling of the River Kaduna
using remote sensing and Geographic Information Systems. Journal of Applied Sciences
Research, 4 (12), 1822 – 1833.
Kasperson, R. E., Dow, K., Archer, E., Caceres, D., Downing, T., Elmqvist, T. et al. (2005).
Vulnerable peoples and places. In R. Hassan et al (Eds.), Ecosystems and human
wellbeing: Current state and trends. Washington D.C: Island Press.
Kassie, M., Stage, J., Teklewold, H. and Erenstein, O. (2015). Gendered food security in rural
Malawi: Why is women’s food security status lower? Food Security, 7(6), 1299–1320.
Kates, R. (2000). Cautionary Tales: Adaptation and the Global Poor. Climatic Change 45, 5 –
17.
Klein, R. J. T. (2004, December). Approaches, methods and tools for Climate Change impact,
vulnerability and adaptation assessment. Keynote lecture to the In-Session Workshop on
Impacts of, and Vulnerability and Adaptation to, Climate Change, Twenty-First Session of
the UNFCCC Subsidiary Body for Scientific and Technical Advice, Buenos Aires,
Argentina. Accessed on May 01, 2018 and Available at:
https://unfccc.int/files/meetings/cop_10/in_session_workshops/adaptation/application/pdf/
081204_klein_adaptation_abstract.pdf
Klijn, F. (2009). Flood risk assessment and flood risk management. An introduction and
guidance based on experiences and findings of FLOODsite (an EU-funded Integrated
Project). Delft: Deltares/ Delft Hydraulics, The Netherlands.
Knueppel, D., Demment, M. and Kaiser, L. (2009). Validation of the Household Food Insecurity
Access Scale in rural Tanzania. Public Health Nutrition 13(3), 360–367.
Kuku-Shittu, O., Mathiassen, A., Wadhwa, A., Myles, L. and Ajibola, A. (2013).
Comprehensive Food Security and Vulnerability Analysis Nigeria (Discussion Paper
01275). Washington, DC: The International Food Policy Research Institute/World Food
Programme.
Logistic Regression (2018). In STAT 501, Regression Methods. Retrieved February 8, 2018,
Retrieved from https://onlinecourses.science.psu.edu/stat501/node/374
Ludi, E., Stevens, C., Peskett, L. and Cabral, L. (2007). Climate Change and Agriculture:
Agricultural Trade, Markets and Investment. UK: Overseas Development Institute.
Madu, I. A. (2006). Spatial Inequality in Nigeria: The Imperative of Geographic Perspectives in
the Development Process. Journal of Social and Economic Development, 8 (2), 105-120.
191
Madu, I.A. (2011, July). Spatial Analysis of Rural Households Vulnerability to Climate Change
in Nigeria: Implications for Internal security. Paper presented at the 3rd
International
Conference on Climate Change, Rio De Janeiro, Brazil.
Madzwamuse, M. (2010). Climate Change Vulnerability and Adaptation Preparedness in South
Africa. Cape Town: Heinrich Böll Foundation.
Magaña-Lemus, D., Ishdorj, A. and Rosson, C. P. (2013, August). Determinants of household
food insecurity in Mexico. Selected poster prepared for presentation at the Agricultural
and Applied Economics Association’s AAEA & CAES Joint Annual Meeting,
Washington, DC.
http://ageconsearch.umn.edu/bitstream/150518/2/Poster%20Determinants%20of%20Househo
ld%20Food%20Security%20in%20Mexico.pdf
Mallakpour, I. and Villarini, G. (2015). The changing nature of flooding across the central
United States. Nature Climate Change 5, 250–254.
Malone, E. L. and Engle, N. L. (2011). Evaluating regional vulnerability to climate change:
purposes and methods. WIREs Clim Change, 2(3), 462–474. DOI: 10.1002/wcc.116.
Marschke, M. J., and Berkes, F. (2006). Exploring strategies that build livelihood resilience: a
case from Cambodia. Ecology and Society 11(1), 42. http://dx.doi.org/10.5751/ES-01730-
110142
Maskrey, A. (1999). Reducing global disasters. In J. Ingleton (Ed.), Natural Disaster
Management (pp.84–86). Leicester: Tudor Rose.
Mayhura, E., Manyena, B. and Collins, A. E. (2017). An approach for measuring social
vulnerability in context: The case of flood hazards in Muzarabani district, Zimbabwe.
Geoforum, 86, 103-117.
Metzger, M. J. and Schroler, D. (2006). Towards a spatially explicit and quantitative
Vulnerability assessment of environmental change in Europe. Regional Environmental
Change, 6, 201-216.
Midgley, S. J. E., Davies, R. A. G. and Chesterman, S. (2011). Climate risk and Vulnerability
Mapping: status quo (2008) and future (2050). For the Regional Climate Change
Programme Southern Africa (RCCP), UK Department for International Development
(DFID), Cape Town: OneWorld sustainable Investments.
Mitiku, A., Fufa, B. and Tadese, B. (2012). Empirical analysis of the determinants of rural
household’s food security in Southern Ethiopia: The case of Shashemene District. Basic
Research Journal of Agricultural Science and Review, 1(6), 132-138.
Monanu, P. C. (1975a). Temperature and Sunshine. In G. E. K. Ofomata (Ed.), Nigeria in Maps:
Eastern States (pp. 16-18). Benin City: Ethiope Publishing House.
192
Monanu, P. C. (1975b). Humidity. In G. E. K. Ofomata (Ed.), Nigeria in Maps:
Eastern States (pp. 19-21). Benin City: Ethiope Publishing House.
Mordi, R. (2011, July 25). The Tsunami in the making. The Tell, pp. 54 -63.
Morrow, B. H. (1999). Identifying and Mapping Community Vulnerability. Disasters, 24 (1), 1-
18.
Mukhopadhyay, S. (2010). A Geo-Environmental Assessment of Flood Dynamics in
Lower Ajoy River Inducing Sand Splay Problem in Eastern India. Ethiopian Journal of
Environmental Studies and Management 3 (2), 96-110.
Muhammad-Lawal, A., & Omotesho, O. A. (2008). Cereals and farming households food
security in kwara state, Nigeria. Agricultural Journal, 3(3), 235-240.
Muller, C., Cramer, W., Hare, W. L. and Lotze-Campen, H. (2011). Climate change risks for
African agriculture. Proceedings of the National Academy of Sciences, 108, 4313-4315.
Mungai, O. K. (2014). Determinants of household food security in Lugari and Makueni Sub-
counties, Kenya (Unpublished M.Sc project). Department of Economics, School of
Economics, University of Nairobi.
Munyai, R. B. (2015). An assessment of flood vulnerability and adaptation: a case study of
Hamutsha-Muungamuwe village, Makhado municipality (Unpublished M.Sc project).
Department of Geography and Geo-information Sciences (School of environmental
Sciences), University of Venda.
Munyai, R.B. (2017). An assessment of community flood vulnerability and adaptation: A case
study of Greater Tzaneen Local Municipality, South Africa (Unpublished M.Sc project).
Department of Geography and Geo-Information Sciences, University of Venda.
Muriadi, M. and Wljaya, A.F. (2013). A Method for Assessing Household Vulnerability to
Flood at Regencial (Kabupaten) Level in Indonesia. J-PAL, 4 (2), 39-44.
Mutinda, G.B. (2015). Determinants of household food expenditure and food security in rural
Kenya (Unpublished M.Sc project). Department of Economics, University of Nairobi.
National Bureau of Statistics (NBS, 2012). Nigeria Poverty Profile 2010. Abuja, Nigeria.
National Population Commission (NPC, 2010). 2006 Population and Housing Census:
Population Distribution by Sex, State, LGA and Senatorial District (Priority Table Volume
III). Abuja: National Population Commission.
Ndakaza, J.N., Mung’atu, J.K., Ndengo, M., Hagenimana, F., Gasheja, C. and Harerimana, J.
(2016). Modeling key determinants of the household food security in Rwanda: Probit
Regression Approach. International Journal of Mathematics and Physical Sciences
Research, 4 (2), 85-94.

193
Ngoh, M. B., Teke, M. G. and Atanga, N. S. (2011). Agricultural Innovations and Adaptations
to Climate Change Effects and Food Security in Central Africa: Case of Cameroon,
Equatorial Guinea and Central African Republic (Paper No. 13). Nairobi: African
Technology Policy Studies Network, Research.
Nicholls, R. J., Hoozemans, F. M. J. and Marchand, M. (1999). Increasing flood risk and
wetland losses due to global sea-level rise: regional and global analyses. Global
Environmental Change, 9, S69-S87.
Ninno, D.C., Dorosh, A.P. and Smith, C.L. (2003). Public Policy, Food Markets and Household
Coping Strategies in Bangladesh: Avoiding a Food Security Crisis Following the 1998
floods. World Development, 31 (7), 1221-1238.
Novelo-Casanova, D.A. and Rodríguez-Vangort, F. (2015). Flood risk assessment. Case of
study: Motozintla de Mendoza, Chiapas, Mexico. Geomatics, Natural Hazards and Risk,
7(5), 1538-1556. DOI: 10.1080/19475705.2015.1089327
Nyangwesoi, P.M., Odhaiambo, M.O., Odungari, P., Koriri, M.K., Kipsat, M.J. and Serem, A.K.
(2007). Household food security in Vihiga District, Kenya: determinants of dietary
diversity. Proceedings of the 8th African Crop Science Society Conference, El-Minia
University, Egypt, 1383–1390.
Nypan, A. (1991). Women's Work and Strategies for Control of Resources: Changes in the
Position of Rural Women in Tanzania. FORUM for Utviklingsstudier, 1, 79-97.
Nzeadibe, T. C., Egbule, C. L., Chukwuone, N., & Agu, V. (2011). Farmers' Perception of
Climate Change Governance and Adaptation Constraints in Niger Delta Region of
Nigeria. Nairobi: African Technology Policy Studies Network.
Obayelu, A. E. (2010). Classifications of Households into Food Security Status in the North
Central Nigeria: An Application of Rasch Measurement Model. Journal of Agricultural
and Biological Sciences, 5 (3), 26-41.
Obayelu, A.E. (2013). Households' food security status and its determinants in the North-Central
Nigeria. Food Economics, 9 (4), 241-256. DOI: 10.1080/2164828X.2013.845559
Odufuwa, B. O., Adedeji, O. H., Oladesu, J. O. and Bongwa, A. (2012). Floods of Fury in
Nigerian Cities. Journal of Sustainable Development, 5 (7), 69-79.
Ofomata, G. E. K (2002a). Relief, Drainage and Landforms. In G.E.K. Ofomata (Ed.), A Survey
of the Igbo Nation (pp. 83-98). Onitsha: Africana FEP Publishers.
Ofomata, G. E. K (2000b). Soils and Soil Erosion. In G. E. K. Ofomata (Ed.), A Survey of the
Igbo Nation (pp. 99-116). Onitsha: Africana FEP Publishers.
Ogba, C. O. and Utang, B. P. (2008): Integrated Approach to Urban Flood Adaptation in the
Niger Delta Coast of Nigeria. Integrating Generations, FIG Working Week, Stockholm,
Sweden.
Ogbonna, C.E., Ike, F. and Okwu-Delunzu, V.U. (2015). Spatial assessment of flood
vulnerability in Aba urban using Geographic Information System Technology and rainfall
information. International Journal of Geosciences, 6, 191-200.
194
Ogundari, K. (2013, September). Determinants of food-poverty states and the demand for
dietary diversity in Nigeria. Contributed paper prepared for presentation at the 4th
International Conference of the African Association of Agricultural economist (AAAE),
Cape Town, Hammamet, Tunisia.
Ogundari, K. (2017). Categorizing households into different food security states in Nigeria: the
socio-economic and demographic determinants. Agricultural and Food Economics 5 (8).
DOI 10.1186/s40100-017-0076-y
Ogunlela, V. B. and Ogungbile, A. O. (2006). Alleviating Rural Poverty in Nigeria: A Challenge
for the National Agricultural Research System. Tropentag Conference.
http://www.tropentag.de/2006/abstracts/full/614.pdf
Ojigi, M. L., Abdulkadir, F. I. and Aderoju, M. O. (2013, April). Geospatial Mapping and
Analysis of the 2012 Flood Disaster in Central Parts of Nigeria. Paper presented at the 8th
National GIS Symposium, Dammam, Saudi Arabia.
Ojogho, O. (2010). Determinants of Food Insecurity among Arable Framers in Edo State,
Nigeria. Agricultural Journal, 5(3), 151-156.
Okwu-Delunzu V.U., Ogbonna, C.E. and Lamidi, S. (2017). Spatial assessment of flood
vulnerability in Anambra East Local Government Area, Nigeria using GIS and remote
sensing. British Journal of Applied Science & Technology, 19(5), 1-11.
Olajuyigbe, A. E., Rotowa, O. O. and Durojaye, E. (2012). An Assessment of Flood Hazard in
Nigeria: The Case of Mile 12, Lagos. Mediterranean Journal of Social Sciences, 3 (2),
366-377.
Olagunju, F.I., Oke, J.T.O., Babatunde, R.O., Ajiboye, A. (2012). Determinants of food
insecurity in Ogbomoso Metropolis of Oyo State, Nigeria. Production Agriculture and
Technology, 8(1),111–124.
Ologunorisa, T. E. (2004). An Assessment of Flood Vulnerability Zones in the Niger Delta,
Nigeria. International Journal of Environmental Studies, 61(1).
Ologunorisa, T. E. and Abawua, M. J. (2005). Flood Risk Assessment: A Review. Journal of
Applied Sciences and Environmental Management, 9 (1), 57-63.
Oluoko-Odingo, A.A. (2006). Food security and poverty among small-scale farmers in Nyando
District, Kenya (Unpublished Ph.D thesis). Department of Geography and Environmental
Studies, University of Nairobi.
Olorunfemi, F.B. (2011, May): Managing flood disasters under a changing climate: Lessons
from Nigeria and South Africa. Paper presented at NISER Research Seminar Series,
Ibadan.
Omonona, B. T. and Agoi, G. A. (2007). An analysis of food security situation among Nigerian
urban households: Evidence from Lagos State, Nigeria. Journal of Central European
Agriculture 8(3), 397-406.
Omotesho, O. A., Adewumi, M. O., Muhammad-Lawal, A., Ayinde, O. E. (2006). Determinants
of Food Security among the Rural Farming Households in Kwara State, Nigeria. African
Journal of General Agriculture, 2 (1), 7-15.

195
Onokala, P. C. and Phil-Eze, P. O. (2001). Environmental Problems of Rural Transport
Development in Nigeria. In G. E. K. Ofomata and P. O. Phil-Eze (Eds.), Geographical
Perspectives on Environmental Problems and Management in Nigeria. Enugu: Jamoe
Enterprises (Nigeria).
Onuigbo, I.C., Ibrahim P.O., Agada, D.U., Nwose, I.A. and Abimbola, I.I. (2017). Flood
Vulnerability Mapping of Lokoja Metropolis Using Geographical Information System
Techniques. Journal of Geosciences and Geomatics, 5(5), 229-242.
Opalana, T. (2005, June 25). Experts Proffer Solutions to Lagos Flooding. Nigerian Tribune,
p.24.
Opiyo, F.E.O. (2014). Climate variability and change on vulnerability and adaptation among
Turkana pastoralists in North-western Kenya (Unpublished PhD thesis). Department of
Land Resource Management and Agricultural Technology, Faculty of Agriculture,
University of Nairobi.
Orewa, S. I., and Iyanbe, C. O. (2009). Household Food Insecurity in Nigeria: An Assessment of
the Present Status of Protein–Energy Malnutrition among Rural and Low-Income Urban
Households. Journal of Applied Sciences Research, 5 (10), 1615–1621.
Orewa, S. I. and Iyanbe, C.O. (2010). Determinants of Daily Food Calorie Intake among Rural
and Low- Income Urban Households in Nigeria. Academic Journal Plant Science 3 (4),
147-155.
Oxfam (2007, November). Report cited in Reuters Disasters quadruple over last 20 years:
Oxfam. Retrieved from http://www.reuters.com/article/2007/11/25/us-britain-climate-
oxfam-idUSL2518480220071125.
Pacetti, T., Caporali, E. and Rulli, M.C. (2017). Floods and food security: A method to estimate
the effect of inundation on crops availability. Advances in Water Resources, 110, 494-504.
https://doi.org/10.1016/j.advwatres.2017.06.019
Park, Y., Yang, J. and Kim, S. (2016). Social and Economic Disaster Vulnerability Assessment
Considering Urban Characteristics of Seoul. J. Korean Soc. Hazard Mitig., 16 (1), 337-
345.
Pelling, M. (1999). The Political Ecology of Flood Hazard in Urban Guyana. Geoforum, Vol.
30, 249–61.
Phil-Eze, P.O. (2001). Biodiversity and Environmental Problems in Nigeria. In G. E. K.
Ofomata and P. O. Phil-Eze (Eds.), Geographical Perspectives on Environmental
Problems and Management in Nigeria (pp. 33-52). Enugu: Jamoe Enterprises (Nigeria).
Ponsot, F. and Obegi, B. (2010). Etude de capitalisation des initiatives et mécanismes en matière
de transferts de fonds au Mali. Study conducted for Centre d’Information et de Gestion des
Migrations (CIGEM) [Study on the capitalization of initiatives and mechanisms for
remittances in Mali. Study conducted for Center for Information and Migration
Management (CIGEM), Mali], Mali.
Pottier, J. (1988). Migrants No More: Settlement and Survival in Mambwe Villages, Zambia.
Manchester: Manchester University Press.
196
Rakodi, C. and Lloyd-Jones, T. (2002). Urban Livelihoods: A People Centred Approach to
Reducing Poverty, Earthscan Publications Limited, London.
Ramakrishna, G., Gaddam, S. R. and Daisy, I. (2014). Impact of Floods on Food Security and
Livelihoods of IDP tribal households: The case of Khammam region of India.
International Journal of Development and Economics Sustainability, 2 (1), 11-24.
Ribot, J. C. (1996). Climate Variability, Climate Change and Vulnerability: Moving Forward by
Looking Back. In Ribot, J.C., Magalhães, A.R. and Panagides, S.S.(Eds.), Climate
Variability, Climate Change and Social Vulnerability in the Semi-arid Tropics. Cambridge
University Press, Cambridge.
Roy, D.C. and Blaschke, T. (2015). Spatial vulnerability assessment of floods in the coastal
regions of Bangladesh. Geomatics, Natural Hazards and Risk, 6(1), 21-44.
Sanusi, R.A., Badejo, C.A. and Yusuf, B.O. (2006). Measuring Household Food Insecurity in
selected Local Government Areas of Lagos and Ibadan, Nigeria. Pakistan Journal of
Nutrition, 5(1), 62-67.
Schlenker, W. and Roberts, M.J. (2009). Nonlinear temperature effects indicate severe damages
to U.S. crop yields under climate change. Proceedings of the National Academy of
Sciences, 106, 15594-15598.
Sekhampu, T.J. (2013). Determinants of the Food Security Status of Households Receiving
Government Grants in Kwakwatsi, South Africa. Mediterranean Journal of Social
Sciences, 4 (1), 147- 153. Doi:10.5901/mjss.2013.v4n1p147
Sekhampu, T.J. (2017). Association of food security and household demographics in a South
African township. International Journal of social sciences and humanity studies, 9(2),
157-170.
Serrat, O. (2017). The Sustainable Livelihoods Approach. In Serrat, O. (Ed), Knowledge
Solutions (pp.21-26). Asian Development Bank. DOI 10.1007/978-981-10-0983-9_5
Siagian, T.H., Purhadi, P., Suhartono, S., and Ritonga, H. (2014) Social vulnerability to natural
hazards in Indonesia: driving factors and policy implications. Nat. Hazards, 70, 1603-
1617.
Sidi, M. S. (2012, November). The impact of the 2012 floods on agriculture and food security in
Nigeria using GIS. United Nations International Conference on Space-based Technologies
for Disaster Management - Risk Assessment in the Context of Global Climate Change,
Beijing, China.
Sinclair, S. and Pegram, G (2003). A Flood Now casting System for the eThekwini Metro,
Volume 1: Urgent Nowcasting using Radar-An Integrated Pilot Study. Water Research
Commission (WCR). South Africa: Silowa Printers.
Smit, B. And Wandel, J. (2006). Adaptation, adaptive capacity and vulnerability. Global
Environmental Change, 16, 282-293.
Speranza, C. I. (2010). Resilient Adaptation to Climate Change in African Agriculture. Bonn:
Deutsches Institut fur Entwicklungspolitik (D.I.E).
Stringer, L.C., Dyer, J.C., Reed, M.S., Dougill, A.J., Twyman, C. and Mkwambisi, D. (2009).
Adaptations to climate change, drought and desertification: local insights to enhance.
197
Syaukat, Y. (2011). The Impact of Climate Change on Food Production and Security and its
Adaptation Programs in Indonesia. Journal of International Society for Southeast Asian
Agricultural Sciences, 17(1), 40-51.
Swift, J. (1993). Understanding and Preventing Famine and Famine Mortality. IDS Bulletin, 24
(4), 1-16.
Szumilas, M. (2010). Explaining Odds Ratios. J Can Acad Child Adolesc Psychiatry, 19(3),
227–229.
Tefera, T. and Tefera, F. (2014). Determinants of Households Food Security and Coping
Strategies for Food Shortfall in Mareko District, Guraghe Zone Southern Ethiopia. Journal
of Food Security, 2(3), 92-99.
Tesfamariam, T. W. (2007). Livelihoods and Coping Strategies: A Study of Female-Headed
Households in Mekelle, Ethiopia (unpublished M.Sc project). Department of Urban
Management and Development, University of Rotterdam, The Netherlands.
Tesso, G., Emana, B. and Ketema, M. (2012). Analysis of vulnerability and resilience to climate
change induced shocks in North Shewa, Ethiopia . Agricultural Sciences 3(6), 871-888.
Thieken, A. H., Kreibich, H. M. M. and Merz, B. (2007). Coping with floods; preparedness,
response and recovery of flood affected residents in Germany in 2002. J Hydrol Sci,
52(5), 1016–1037.
Thorton, P. K., Jones, P. G., Owiyo, T., Kruska, R. L., Herrero, M., Kristjanson, P., Notenbaert,
A., Bekele, N. and Omolo, A. (2006). Mapping Climate vulnerability and poverty in
Africa. Report to the Department for International Development, ILRI, Nairobi, p.171.
Udo, R. K. (1981). Geographical Regions of Nigeria. London: Heinemann Educational Books.
Umeji, A. C. (2002). Geology. In G. E. K. Ofomata (Ed.), A Survey of the Igbo Nation (pp. 56-
72). Onitsha: Africana FEP Publishers.
United Nations (2013). World Population Prospects: The 2012 Revision (Highlights and
Advance Tables), New York: UN. ESA/P/WP.228.
United Nations Development Programme (UNDP, 2008). Fighting Climate Change - Human
Solidarity in a Divided World. New York: UNDP.
United Nations Office for the Coordination of Humanitarian Affairs (UN-OCHA, 2012).
Nigeria: Floods Situation Report No. 1 (as of 06 November 2012). Retrieved from
http://reliefweb.int/report/nigeria/floods-situation-report-no-1-06-november-2012
UN-Water (2011). Cities coping with water uncertainties. Media Brief, UN-Water Decade
Programme on Advocacy and Communication.
User-friendly rescaling: zero point and unit (2018). Retrieved January 18, 2018, from
https://www.winsteps.com/winman/rescaling.htm
Verduijn, R. (2005). Strengthening Food Insecurity and Vulnerability Information Management
in Lesotho: FIVIMS Assessment Report. Maseru: FAO’s Emergency Operations Service
(TCEO).
Vincent, K. (2004). Creating an index of Social Vulnerability to Climate Change for Africa.
Working Paper 56. Tyndall Center for Climate Change Research.
198
Warner, B.P., Schattman, R.E. and Hatch, C.E. (2017). Farming the Floodplain: Ecological and
Agricultural Tradeoffs and Opportunities in River and Stream Governance in New
England's Changing Climate. Case Studies in the Environment. DOI:
8https://doi.org/10.1525/cse.2017.sc.512407
Ward, R.C. (1978). Floods: A Geographical Perspective. Macmillan Press, London.
Welderufael, M. (2014). Determinants of Households Vulnerability to Food Insecurity in
Ethiopia: Econometric analysis of Rural and Urban Households. Journal of Economics
and Sustainable Development, 5(24).
http://www.iiste.org/Journals/index.php/JEDS/article/view/17506
Wiranthi, P.E., Suwarsinah, H.K., Adhi. A.K (2014). Determinants of Household Food Security:
A Comparative Analysis of Eastern and Western Indonesia. Indones. J. Agric. Sci., 15(1),
17-28.
Wisner, B., Blaikie, P., Cannon, T. and Davis, I. (2004). At risk: Natural hazards, peoples
vulnerability and disasters (2nd ed.). London: Routledge.
Woolcoock, M. (2001). Social Capital and Economic Development: Toward a theoretical
synthesis and policy framework. Theory and Society,151-208.
World Bank, (2008). World Development Report 2008: Agriculture for Development.
Washington DC: World Bank.
https://siteresources.worldbank.org/INTWDR2008/Resources/WDR_00_book.pdf
World Bank (2015a). World Development Indicators. “Poverty headcount ratio at $2 a day
(PPP) (% of population). Retrieved on January 12, 2016 from
http://data.worldbank.org/indicator/SI.POV.2DAY.
World Bank (2015b). World Bank Forecasts Global Poverty to Fall Below 10% for First Time;
Major Hurdles Remain in Goal to End Poverty by 2030. Retrieved on June 11, 2016 from
http://www.worldbank.org/en/news/press-release/2015/10/04/world-bank-forecasts-
global-poverty-to-fall-below-10-for-first-time-major-hurdles-remain-in-goal-to-end-
poverty-by-2030
World Food Conference (1974). Universal Declaration on the eradication of hunger and
malnutrition. United Nations.
World Food Programme (WFP, 2008). Food consumption analysis: Calculation and use of the
food consumption score in food security analysis. Technical Guidance Sheet. Rome.
WHO (2008). Protecting Health from Climate Change – World Health Day 2008. Geneva:
World Health Organization.
Xiao, Y., Wan, J. and Hewings, G. J. D. (2013). Flooding and the Midwest economy: Assessing
the Midwest floods of 1993 and 2008. GeoJournal 78, 245–258.
Yamane, T. (1967). Statistics: An Introductory Analysis (2nd
edition). New York: Harper and
Row.
Yang, L. (2015). An Application of Principal Component Analysis to Stock Portfolio
Management (Unpublished M.Sc project). Department of Economics and Finance,
University of Canterbury.
199
Yaro, J. A. (2013). Building Resilience and reducing Vulnerability to Climate Change:
Implications for Food Security in Ghana. Ghana Office: Friedrich-Ebert-Stiftung.
Yin, H. and Li, C. (2001). Human Impact on Floods and Flood Disasters on the Yangtze River.
Geomorphology, 41, 105–109.
Yusuf, A.A. and Francisco, H.A. (2009). Climate Change vulnerability mapping for South-East
Asia. Report for the IDRC, Economy and environment Program for South-east Asia
(EEPSEA), Swedish International Development Cooperation Agency (SIDA), Canadian
International Development Agency (CIDA). EEPSEA, Singapore.
Yusuf, S.A., Balogun, O.L and Falegbe, O.E. (2015). Effect of urban household farming on food
security status in Ibadan metropolis, Oyo State, Nigeria. Journal of Agricultural Sciences,
60 (1), 61-75.
Zakari, S., Ying, L. and Song, B. (2014). Factors Influencing Household Food Security in West
Africa: The Case of Southern Niger. Sustainability, 6, 1191-1202.
DOI:10.3390/su6031191.
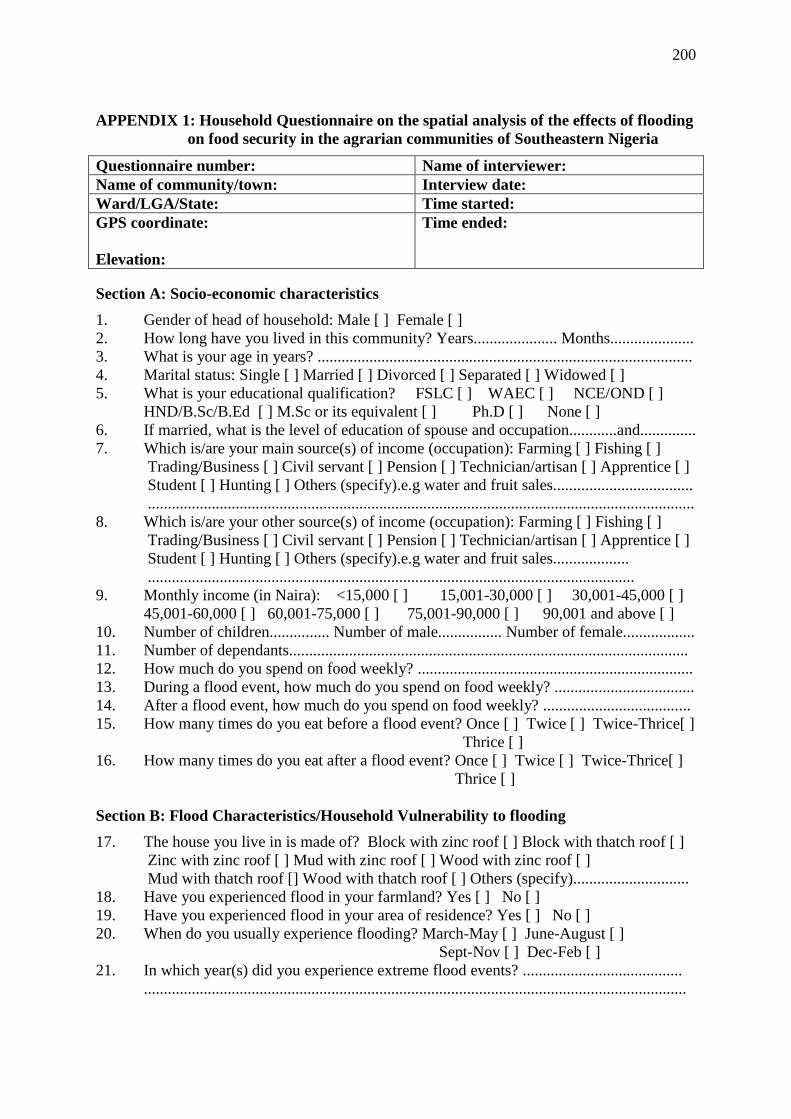
200
APPENDIX 1: Household Questionnaire on the spatial analysis of the effects of flooding
on food security in the agrarian communities of Southeastern Nigeria
Questionnaire number: Name of interviewer:
Name of community/town: Interview date:
Ward/LGA/State: Time started:
GPS coordinate:
Elevation:
Time ended:
Section A: Socio-economic characteristics
1. Gender of head of household: Male [ ] Female [ ]
2. How long have you lived in this community? Years..................... Months.....................
3. What is your age in years? ..............................................................................................
4. Marital status: Single [ ] Married [ ] Divorced [ ] Separated [ ] Widowed [ ]
5. What is your educational qualification? FSLC [ ] WAEC [ ] NCE/OND [ ]
HND/B.Sc/B.Ed [ ] M.Sc or its equivalent [ ] Ph.D [ ] None [ ]
6. If married, what is the level of education of spouse and occupation............and..............
7. Which is/are your main source(s) of income (occupation): Farming [ ] Fishing [ ]
Trading/Business [ ] Civil servant [ ] Pension [ ] Technician/artisan [ ] Apprentice [ ]
Student [ ] Hunting [ ] Others (specify).e.g water and fruit sales...................................
.........................................................................................................................................
8. Which is/are your other source(s) of income (occupation): Farming [ ] Fishing [ ]
Trading/Business [ ] Civil servant [ ] Pension [ ] Technician/artisan [ ] Apprentice [ ]
Student [ ] Hunting [ ] Others (specify).e.g water and fruit sales...................
..........................................................................................................................
9. Monthly income (in Naira): <15,000 [ ] 15,001-30,000 [ ] 30,001-45,000 [ ]
45,001-60,000 [ ] 60,001-75,000 [ ] 75,001-90,000 [ ] 90,001 and above [ ]
10. Number of children............... Number of male................ Number of female..................
11. Number of dependants....................................................................................................
12. How much do you spend on food weekly? .....................................................................
13. During a flood event, how much do you spend on food weekly? ...................................
14. After a flood event, how much do you spend on food weekly? .....................................
15. How many times do you eat before a flood event? Once [ ] Twice [ ] Twice-Thrice[ ]
Thrice [ ]
16. How many times do you eat after a flood event? Once [ ] Twice [ ] Twice-Thrice[ ]
Thrice [ ]
Section B: Flood Characteristics/Household Vulnerability to flooding
17. The house you live in is made of? Block with zinc roof [ ] Block with thatch roof [ ]
Zinc with zinc roof [ ] Mud with zinc roof [ ] Wood with zinc roof [ ]
Mud with thatch roof [] Wood with thatch roof [ ] Others (specify).............................
18. Have you experienced flood in your farmland? Yes [ ] No [ ]
19. Have you experienced flood in your area of residence? Yes [ ] No [ ]
20. When do you usually experience flooding? March-May [ ] June-August [ ]
Sept-Nov [ ] Dec-Feb [ ]
21. In which year(s) did you experience extreme flood events? ........................................
........................................................................................................................................
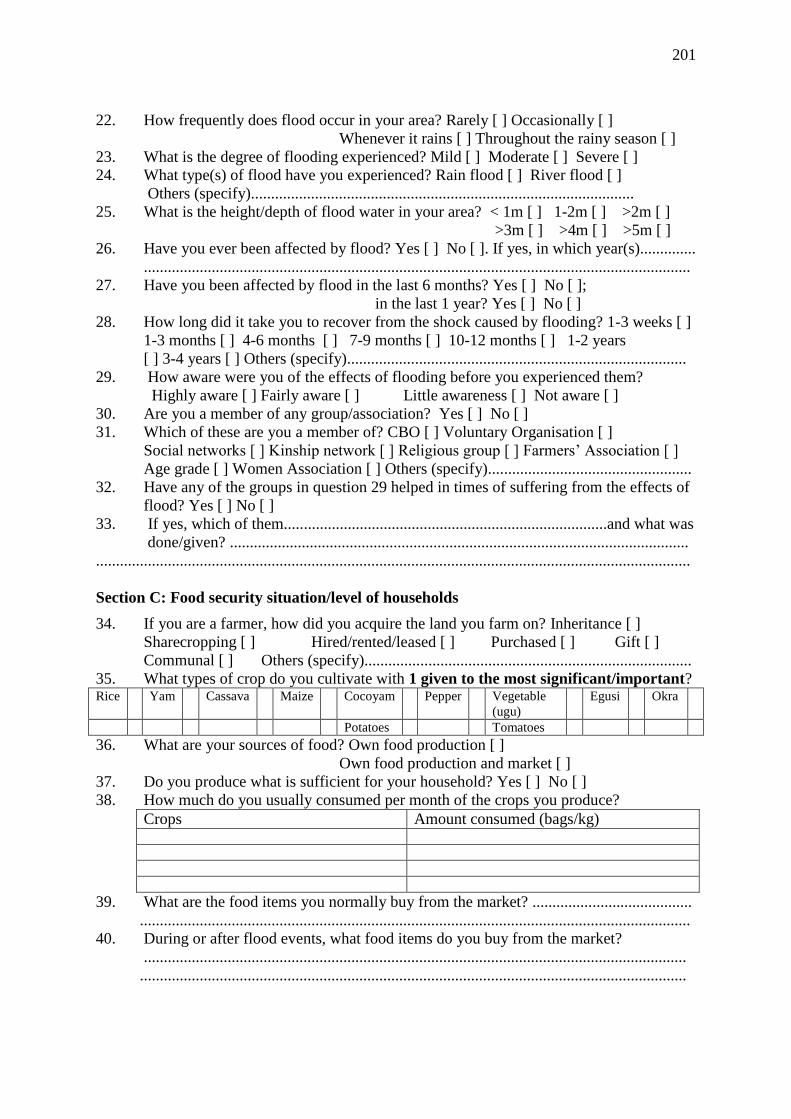
201
22. How frequently does flood occur in your area? Rarely [ ] Occasionally [ ]
Whenever it rains [ ] Throughout the rainy season [ ]
23. What is the degree of flooding experienced? Mild [ ] Moderate [ ] Severe [ ]
24. What type(s) of flood have you experienced? Rain flood [ ] River flood [ ]
Others (specify)................................................................................................
25. What is the height/depth of flood water in your area? < 1m [ ] 1-2m [ ] >2m [ ]
>3m [ ] >4m [ ] >5m [ ]
26. Have you ever been affected by flood? Yes [ ] No [ ]. If yes, in which year(s)..............
.........................................................................................................................................
27. Have you been affected by flood in the last 6 months? Yes [ ] No [ ];
in the last 1 year? Yes [ ] No [ ]
28. How long did it take you to recover from the shock caused by flooding? 1-3 weeks [ ]
1-3 months [ ] 4-6 months [ ] 7-9 months [ ] 10-12 months [ ] 1-2 years
[ ] 3-4 years [ ] Others (specify).....................................................................................
29. How aware were you of the effects of flooding before you experienced them?
Highly aware [ ] Fairly aware [ ] Little awareness [ ] Not aware [ ]
30. Are you a member of any group/association? Yes [ ] No [ ]
31. Which of these are you a member of? CBO [ ] Voluntary Organisation [ ]
Social networks [ ] Kinship network [ ] Religious group [ ] Farmers’ Association [ ]
Age grade [ ] Women Association [ ] Others (specify)...................................................
32. Have any of the groups in question 29 helped in times of suffering from the effects of
flood? Yes [ ] No [ ]
33. If yes, which of them.................................................................................and what was
done/given? ...................................................................................................................
.....................................................................................................................................................
Section C: Food security situation/level of households
34. If you are a farmer, how did you acquire the land you farm on? Inheritance [ ]
Sharecropping [ ] Hired/rented/leased [ ] Purchased [ ] Gift [ ]
Communal [ ] Others (specify)..................................................................................
35. What types of crop do you cultivate with 1 given to the most significant/important? Rice Yam Cassava Maize Cocoyam Pepper Vegetable
(ugu)
Egusi Okra
Potatoes Tomatoes
36. What are your sources of food? Own food production [ ]
Own food production and market [ ]
37. Do you produce what is sufficient for your household? Yes [ ] No [ ]
38. How much do you usually consumed per month of the crops you produce?
Crops Amount consumed (bags/kg)
39. What are the food items you normally buy from the market? ........................................
..........................................................................................................................................
40. During or after flood events, what food items do you buy from the market?
........................................................................................................................................
.........................................................................................................................................
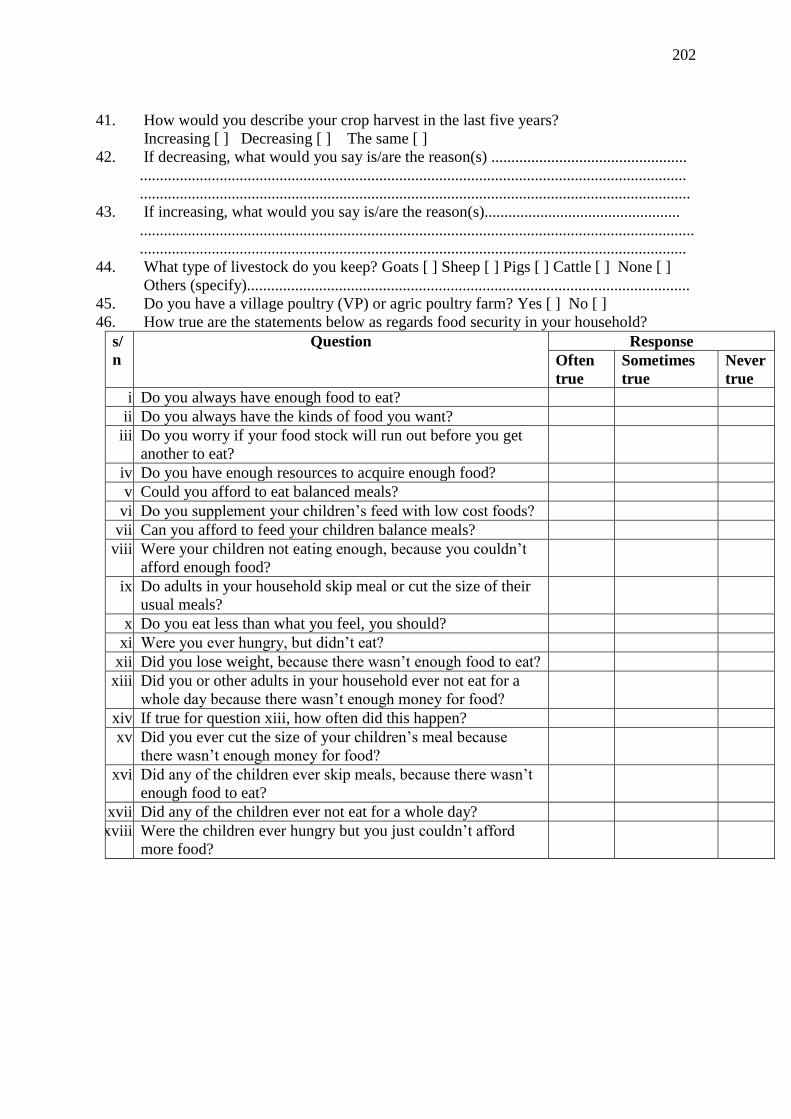
202
41. How would you describe your crop harvest in the last five years?
Increasing [ ] Decreasing [ ] The same [ ]
42. If decreasing, what would you say is/are the reason(s) .................................................
.........................................................................................................................................
..........................................................................................................................................
43. If increasing, what would you say is/are the reason(s).................................................
...........................................................................................................................................
.........................................................................................................................................
44. What type of livestock do you keep? Goats [ ] Sheep [ ] Pigs [ ] Cattle [ ] None [ ]
Others (specify)...............................................................................................................
45. Do you have a village poultry (VP) or agric poultry farm? Yes [ ] No [ ]
46. How true are the statements below as regards food security in your household?
s/
n
Question Response
Often
true
Sometimes
true
Never
true
i. Do you always have enough food to eat?
ii. Do you always have the kinds of food you want?
iii. Do you worry if your food stock will run out before you get
another to eat?
iv. Do you have enough resources to acquire enough food?
v. Could you afford to eat balanced meals?
vi. Do you supplement your children’s feed with low cost foods?
vii. Can you afford to feed your children balance meals?
viii. Were your children not eating enough, because you couldn’t
afford enough food?
ix. Do adults in your household skip meal or cut the size of their
usual meals?
x. Do you eat less than what you feel, you should?
xi. Were you ever hungry, but didn’t eat?
xii. Did you lose weight, because there wasn’t enough food to eat?
xiii. Did you or other adults in your household ever not eat for a
whole day because there wasn’t enough money for food?
xiv. If true for question xiii, how often did this happen?
xv. Did you ever cut the size of your children’s meal because
there wasn’t enough money for food?
xvi. Did any of the children ever skip meals, because there wasn’t
enough food to eat?
xvii. Did any of the children ever not eat for a whole day?
xviii. Were the children ever hungry but you just couldn’t afford
more food?
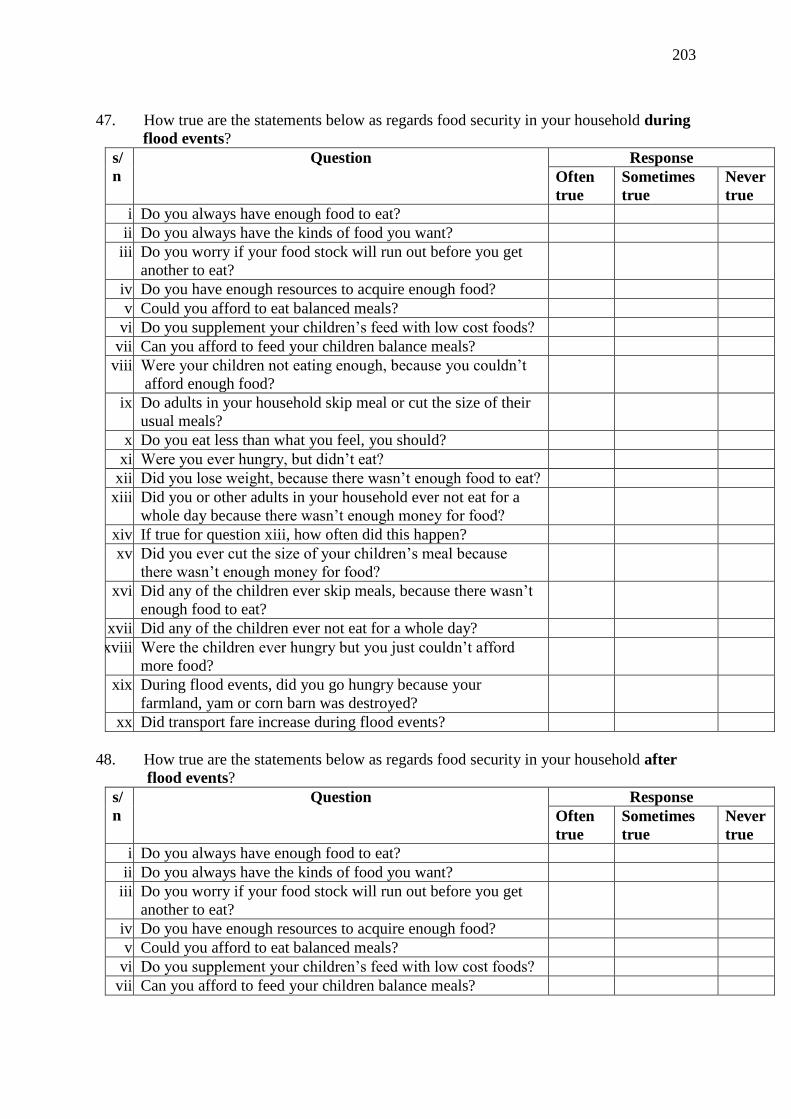
203
47. How true are the statements below as regards food security in your household during
flood events?
s/
n
Question Response
Often
true
Sometimes
true
Never
true
i. Do you always have enough food to eat?
ii. Do you always have the kinds of food you want?
iii. Do you worry if your food stock will run out before you get
another to eat?
iv. Do you have enough resources to acquire enough food?
v. Could you afford to eat balanced meals?
vi. Do you supplement your children’s feed with low cost foods?
vii. Can you afford to feed your children balance meals?
viii. Were your children not eating enough, because you couldn’t
afford enough food?
ix. Do adults in your household skip meal or cut the size of their
usual meals?
x. Do you eat less than what you feel, you should?
xi. Were you ever hungry, but didn’t eat?
xii. Did you lose weight, because there wasn’t enough food to eat?
xiii. Did you or other adults in your household ever not eat for a
whole day because there wasn’t enough money for food?
xiv. If true for question xiii, how often did this happen?
xv. Did you ever cut the size of your children’s meal because
there wasn’t enough money for food?
xvi. Did any of the children ever skip meals, because there wasn’t
enough food to eat?
xvii. Did any of the children ever not eat for a whole day?
xviii. Were the children ever hungry but you just couldn’t afford
more food?
xix. During flood events, did you go hungry because your
farmland, yam or corn barn was destroyed?
xx. Did transport fare increase during flood events?
48. How true are the statements below as regards food security in your household after
flood events?
s/
n
Question Response
Often
true
Sometimes
true
Never
true
i. i Do you always have enough food to eat?
ii. Do you always have the kinds of food you want?
iii. Do you worry if your food stock will run out before you get
another to eat?
iv. Do you have enough resources to acquire enough food?
v. Could you afford to eat balanced meals?
vi. Do you supplement your children’s feed with low cost foods?
vii. Can you afford to feed your children balance meals?
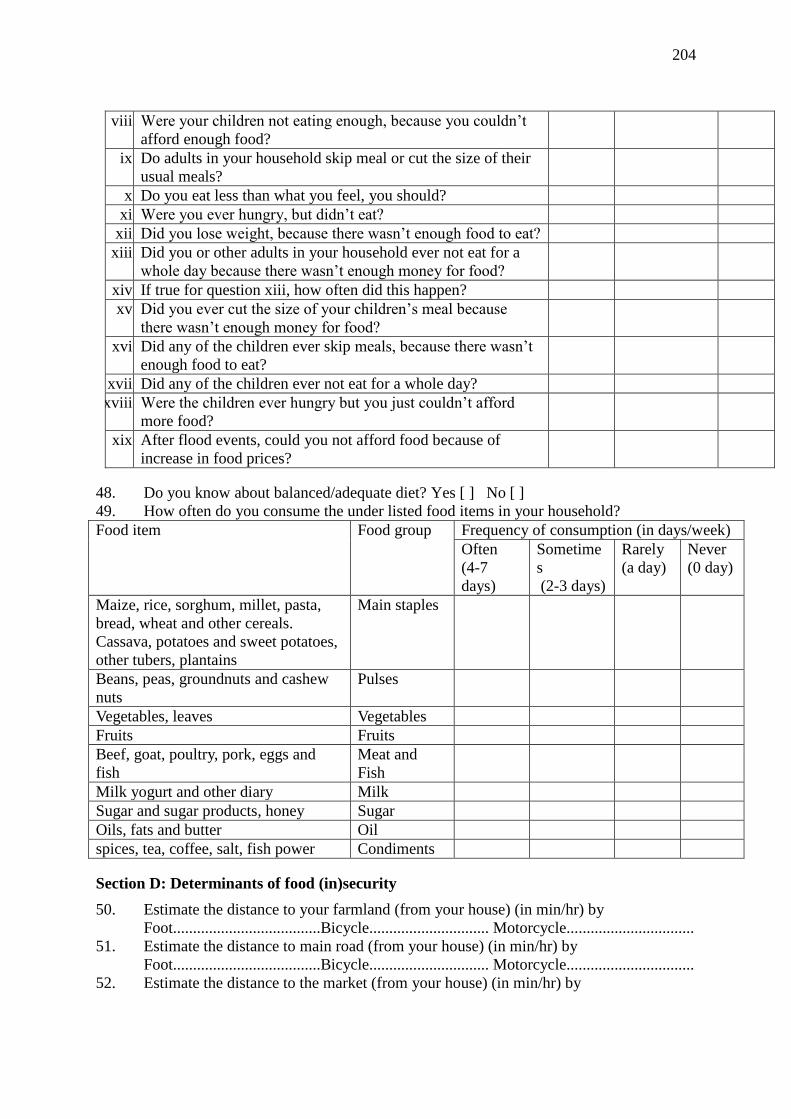
204
viii. Were your children not eating enough, because you couldn’t
afford enough food?
ix. Do adults in your household skip meal or cut the size of their
usual meals?
x. Do you eat less than what you feel, you should?
xi. Were you ever hungry, but didn’t eat?
xii. Did you lose weight, because there wasn’t enough food to eat?
xiii. Did you or other adults in your household ever not eat for a
whole day because there wasn’t enough money for food?
xiv. If true for question xiii, how often did this happen?
xv. Did you ever cut the size of your children’s meal because
there wasn’t enough money for food?
xvi. Did any of the children ever skip meals, because there wasn’t
enough food to eat?
xvii. Did any of the children ever not eat for a whole day?
xviii. Were the children ever hungry but you just couldn’t afford
more food?
xix. After flood events, could you not afford food because of
increase in food prices?
48. Do you know about balanced/adequate diet? Yes [ ] No [ ]
49. How often do you consume the under listed food items in your household?
Food item Food group Frequency of consumption (in days/week)
Often
(4-7
days)
Sometime
s
(2-3 days)
Rarely
(a day)
Never
(0 day)
Maize, rice, sorghum, millet, pasta,
bread, wheat and other cereals.
Cassava, potatoes and sweet potatoes,
other tubers, plantains
Main staples
Beans, peas, groundnuts and cashew
nuts
Pulses
Vegetables, leaves Vegetables
Fruits Fruits
Beef, goat, poultry, pork, eggs and
fish
Meat and
Fish
Milk yogurt and other diary Milk
Sugar and sugar products, honey Sugar
Oils, fats and butter Oil
spices, tea, coffee, salt, fish power Condiments
Section D: Determinants of food (in)security
50. Estimate the distance to your farmland (from your house) (in min/hr) by
Foot.....................................Bicycle.............................. Motorcycle................................
51. Estimate the distance to main road (from your house) (in min/hr) by
Foot.....................................Bicycle.............................. Motorcycle................................
52. Estimate the distance to the market (from your house) (in min/hr) by
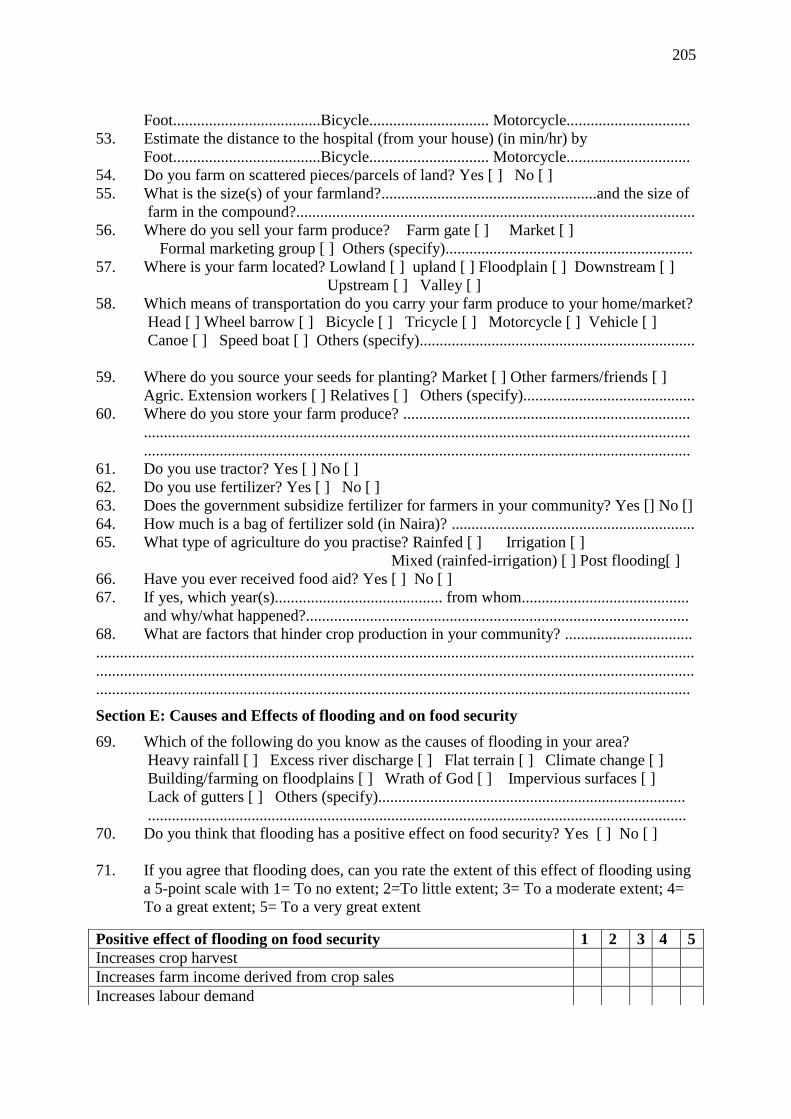
205
Foot.....................................Bicycle.............................. Motorcycle...............................
53. Estimate the distance to the hospital (from your house) (in min/hr) by
Foot.....................................Bicycle.............................. Motorcycle...............................
54. Do you farm on scattered pieces/parcels of land? Yes [ ] No [ ]
55. What is the size(s) of your farmland?......................................................and the size of
farm in the compound?....................................................................................................
56. Where do you sell your farm produce? Farm gate [ ] Market [ ]
Formal marketing group [ ] Others (specify)..............................................................
57. Where is your farm located? Lowland [ ] upland [ ] Floodplain [ ] Downstream [ ]
Upstream [ ] Valley [ ]
58. Which means of transportation do you carry your farm produce to your home/market?
Head [ ] Wheel barrow [ ] Bicycle [ ] Tricycle [ ] Motorcycle [ ] Vehicle [ ]
Canoe [ ] Speed boat [ ] Others (specify).....................................................................
59. Where do you source your seeds for planting? Market [ ] Other farmers/friends [ ]
Agric. Extension workers [ ] Relatives [ ] Others (specify)...........................................
60. Where do you store your farm produce? ........................................................................
.........................................................................................................................................
.........................................................................................................................................
61. Do you use tractor? Yes [ ] No [ ]
62. Do you use fertilizer? Yes [ ] No [ ]
63. Does the government subsidize fertilizer for farmers in your community? Yes [] No []
64. How much is a bag of fertilizer sold (in Naira)? .............................................................
65. What type of agriculture do you practise? Rainfed [ ] Irrigation [ ]
Mixed (rainfed-irrigation) [ ] Post flooding[ ]
66. Have you ever received food aid? Yes [ ] No [ ]
67. If yes, which year(s).......................................... from whom..........................................
and why/what happened?................................................................................................
68. What are factors that hinder crop production in your community? ................................
......................................................................................................................................................
......................................................................................................................................................
.....................................................................................................................................................
Section E: Causes and Effects of flooding and on food security
69. Which of the following do you know as the causes of flooding in your area?
Heavy rainfall [ ] Excess river discharge [ ] Flat terrain [ ] Climate change [ ]
Building/farming on floodplains [ ] Wrath of God [ ] Impervious surfaces [ ]
Lack of gutters [ ] Others (specify).............................................................................
.......................................................................................................................................
70. Do you think that flooding has a positive effect on food security? Yes [ ] No [ ]
71. If you agree that flooding does, can you rate the extent of this effect of flooding using
a 5-point scale with 1= To no extent; 2=To little extent; 3= To a moderate extent; 4=
To a great extent; 5= To a very great extent
Positive effect of flooding on food security 1 2 3 4 5
Increases crop harvest
Increases farm income derived from crop sales
Increases labour demand
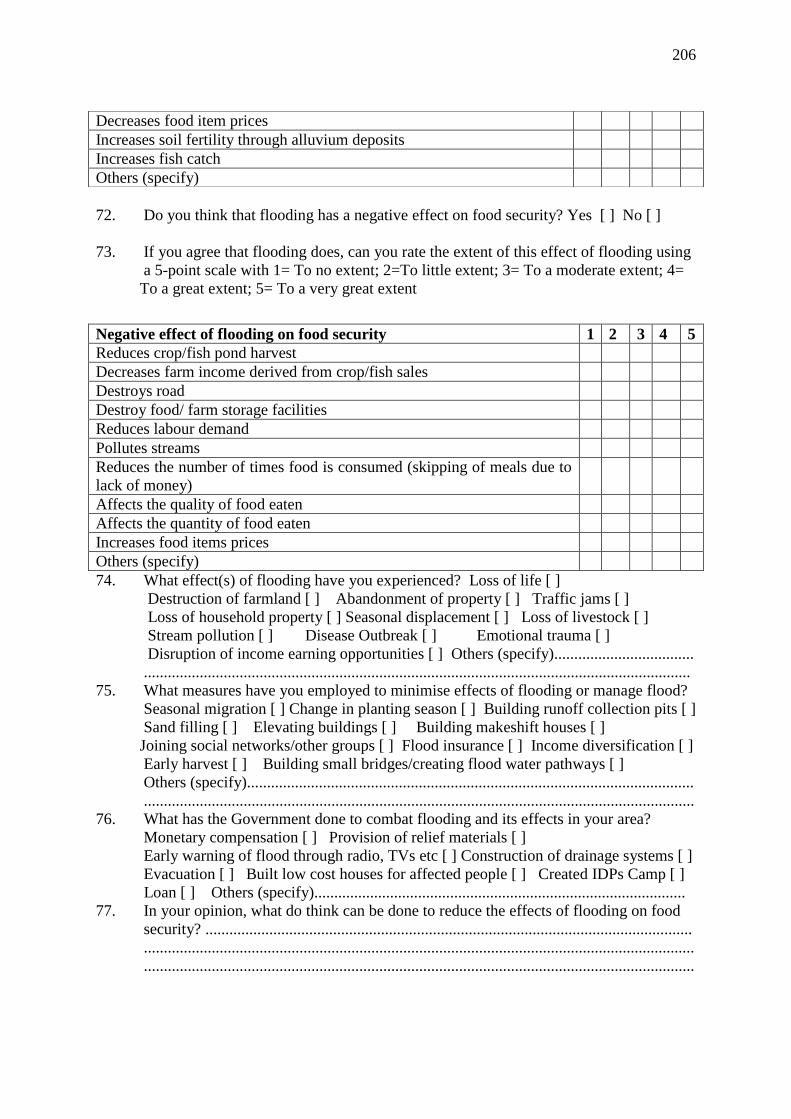
206
72. Do you think that flooding has a negative effect on food security? Yes [ ] No [ ]
73. If you agree that flooding does, can you rate the extent of this effect of flooding using
a 5-point scale with 1= To no extent; 2=To little extent; 3= To a moderate extent; 4=
To a great extent; 5= To a very great extent
74. What effect(s) of flooding have you experienced? Loss of life [ ]
Destruction of farmland [ ] Abandonment of property [ ] Traffic jams [ ]
Loss of household property [ ] Seasonal displacement [ ] Loss of livestock [ ]
Stream pollution [ ] Disease Outbreak [ ] Emotional trauma [ ]
Disruption of income earning opportunities [ ] Others (specify)...................................
.........................................................................................................................................
75. What measures have you employed to minimise effects of flooding or manage flood?
Seasonal migration [ ] Change in planting season [ ] Building runoff collection pits [ ]
Sand filling [ ] Elevating buildings [ ] Building makeshift houses [ ]
Joining social networks/other groups [ ] Flood insurance [ ] Income diversification [ ]
Early harvest [ ] Building small bridges/creating flood water pathways [ ]
Others (specify)................................................................................................................
..........................................................................................................................................
76. What has the Government done to combat flooding and its effects in your area?
Monetary compensation [ ] Provision of relief materials [ ]
Early warning of flood through radio, TVs etc [ ] Construction of drainage systems [ ]
Evacuation [ ] Built low cost houses for affected people [ ] Created IDPs Camp [ ]
Loan [ ] Others (specify).............................................................................................
77. In your opinion, what do think can be done to reduce the effects of flooding on food
security? ..........................................................................................................................
..........................................................................................................................................
..........................................................................................................................................
Decreases food item prices
Increases soil fertility through alluvium deposits
Increases fish catch
Others (specify)
Negative effect of flooding on food security 1 2 3 4 5
Reduces crop/fish pond harvest
Decreases farm income derived from crop/fish sales
Destroys road
Destroy food/ farm storage facilities
Reduces labour demand
Pollutes streams
Reduces the number of times food is consumed (skipping of meals due to
lack of money)
Affects the quality of food eaten
Affects the quantity of food eaten
Increases food items prices
Others (specify)
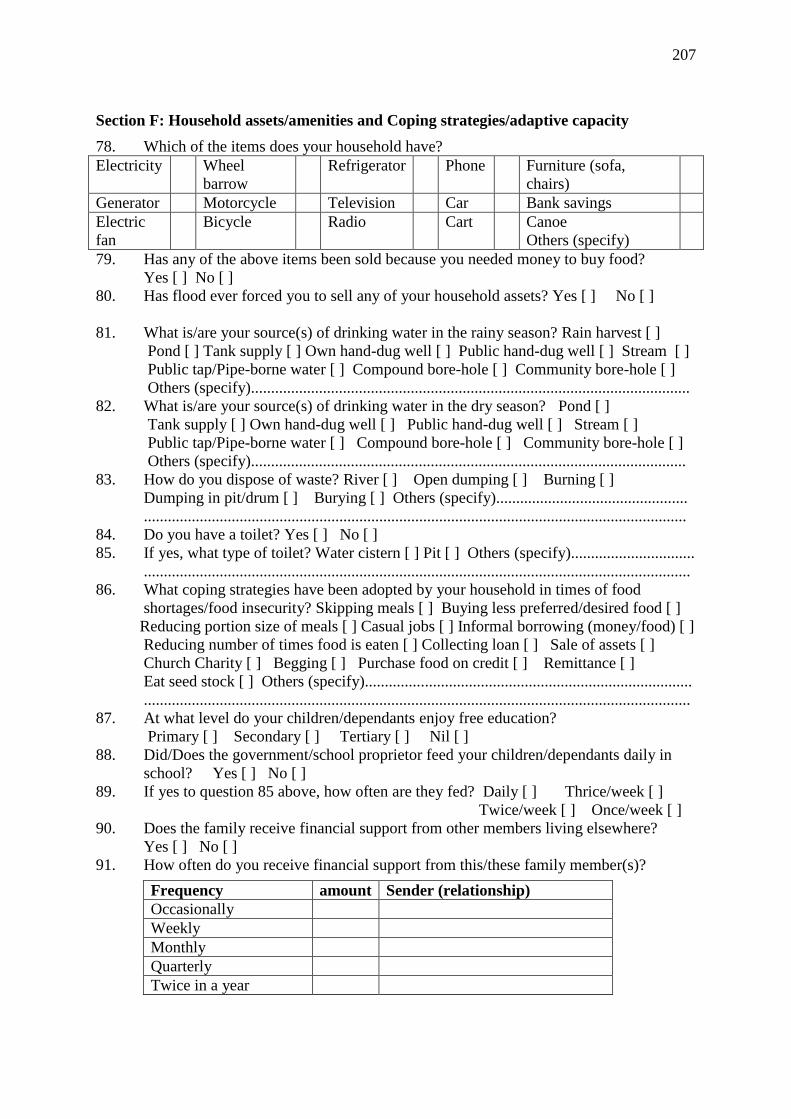
207
Section F: Household assets/amenities and Coping strategies/adaptive capacity
78. Which of the items does your household have?
Electricity Wheel
barrow
Refrigerator Phone Furniture (sofa,
chairs)
Generator Motorcycle Television Car Bank savings
Electric
fan
Bicycle Radio Cart Canoe
Others (specify)
79. Has any of the above items been sold because you needed money to buy food?
Yes [ ] No [ ]
80. Has flood ever forced you to sell any of your household assets? Yes [ ] No [ ]
81. What is/are your source(s) of drinking water in the rainy season? Rain harvest [ ]
Pond [ ] Tank supply [ ] Own hand-dug well [ ] Public hand-dug well [ ] Stream [ ]
Public tap/Pipe-borne water [ ] Compound bore-hole [ ] Community bore-hole [ ]
Others (specify)..............................................................................................................
82. What is/are your source(s) of drinking water in the dry season? Pond [ ]
Tank supply [ ] Own hand-dug well [ ] Public hand-dug well [ ] Stream [ ]
Public tap/Pipe-borne water [ ] Compound bore-hole [ ] Community bore-hole [ ]
Others (specify).............................................................................................................
83. How do you dispose of waste? River [ ] Open dumping [ ] Burning [ ]
Dumping in pit/drum [ ] Burying [ ] Others (specify)................................................
........................................................................................................................................
84. Do you have a toilet? Yes [ ] No [ ]
85. If yes, what type of toilet? Water cistern [ ] Pit [ ] Others (specify)...............................
.........................................................................................................................................
86. What coping strategies have been adopted by your household in times of food
shortages/food insecurity? Skipping meals [ ] Buying less preferred/desired food [ ]
Reducing portion size of meals [ ] Casual jobs [ ] Informal borrowing (money/food) [ ]
Reducing number of times food is eaten [ ] Collecting loan [ ] Sale of assets [ ]
Church Charity [ ] Begging [ ] Purchase food on credit [ ] Remittance [ ]
Eat seed stock [ ] Others (specify)..................................................................................
.........................................................................................................................................
87. At what level do your children/dependants enjoy free education?
Primary [ ] Secondary [ ] Tertiary [ ] Nil [ ]
88. Did/Does the government/school proprietor feed your children/dependants daily in
school? Yes [ ] No [ ]
89. If yes to question 85 above, how often are they fed? Daily [ ] Thrice/week [ ]
Twice/week [ ] Once/week [ ]
90. Does the family receive financial support from other members living elsewhere?
Yes [ ] No [ ]
91. How often do you receive financial support from this/these family member(s)?
Frequency amount Sender (relationship)
Occasionally
Weekly
Monthly
Quarterly
Twice in a year

208
92. Do you have access to credit/loan/microfinance from any source? Yes [ ] No [ ]
93. If yes, name it/them.........................................................................................................
.........................................................................................................................................
94. Are you aware of any Farmers’ Associations? Yes [ ] No [ ]
95. If yes to the question 94 above, list them.........................................................................
.........................................................................................................................................
..........................................................................................................................................
96. Are you a member of any of them? Yes [ ] No [ ]
97. What is/are your reason(s) for your answer to question 96 above? ................................
..........................................................................................................................................
..........................................................................................................................................
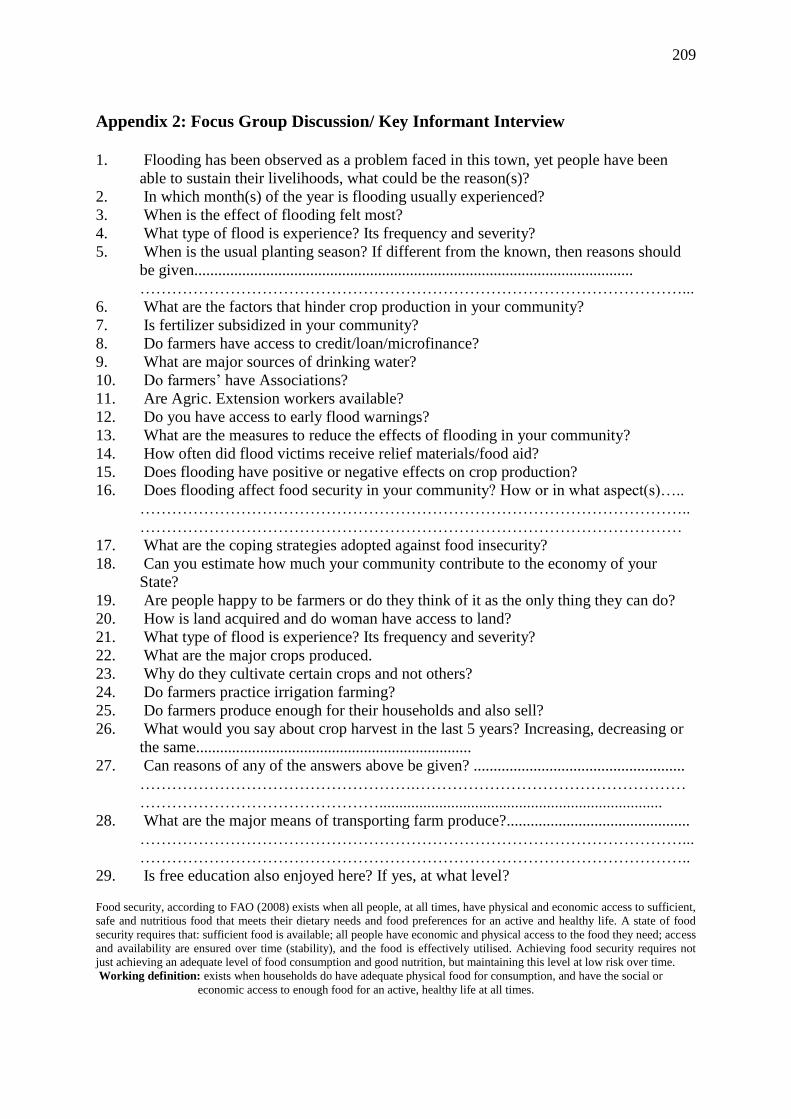
209
Appendix 2: Focus Group Discussion/ Key Informant Interview
1. Flooding has been observed as a problem faced in this town, yet people have been
able to sustain their livelihoods, what could be the reason(s)?
2. In which month(s) of the year is flooding usually experienced?
3. When is the effect of flooding felt most?
4. What type of flood is experience? Its frequency and severity?
5. When is the usual planting season? If different from the known, then reasons should
be given..............................................................................................................
…………………………………………………………………………………………...
6. What are the factors that hinder crop production in your community?
7. Is fertilizer subsidized in your community?
8. Do farmers have access to credit/loan/microfinance?
9. What are major sources of drinking water?
10. Do farmers’ have Associations?
11. Are Agric. Extension workers available?
12. Do you have access to early flood warnings?
13. What are the measures to reduce the effects of flooding in your community?
14. How often did flood victims receive relief materials/food aid?
15. Does flooding have positive or negative effects on crop production?
16. Does flooding affect food security in your community? How or in what aspect(s)…..
…………………………………………………………………………………………..
…………………………………………………………………………………………
17. What are the coping strategies adopted against food insecurity?
18. Can you estimate how much your community contribute to the economy of your
State?
19. Are people happy to be farmers or do they think of it as the only thing they can do?
20. How is land acquired and do woman have access to land?
21. What type of flood is experience? Its frequency and severity?
22. What are the major crops produced.
23. Why do they cultivate certain crops and not others?
24. Do farmers practice irrigation farming?
25. Do farmers produce enough for their households and also sell?
26. What would you say about crop harvest in the last 5 years? Increasing, decreasing or
the same.....................................................................
27. Can reasons of any of the answers above be given? .....................................................
…………………………………………….……………………………………………
……………………………………….......................................................................
28. What are the major means of transporting farm produce?..............................................
…………………………………………………………………………………………...
…………………………………………………………………………………………..
29. Is free education also enjoyed here? If yes, at what level? Food security, according to FAO (2008) exists when all people, at all times, have physical and economic access to sufficient,
safe and nutritious food that meets their dietary needs and food preferences for an active and healthy life. A state of food
security requires that: sufficient food is available; all people have economic and physical access to the food they need; access
and availability are ensured over time (stability), and the food is effectively utilised. Achieving food security requires not
just achieving an adequate level of food consumption and good nutrition, but maintaining this level at low risk over time.
Working definition: exists when households do have adequate physical food for consumption, and have the social or
economic access to enough food for an active, healthy life at all times.
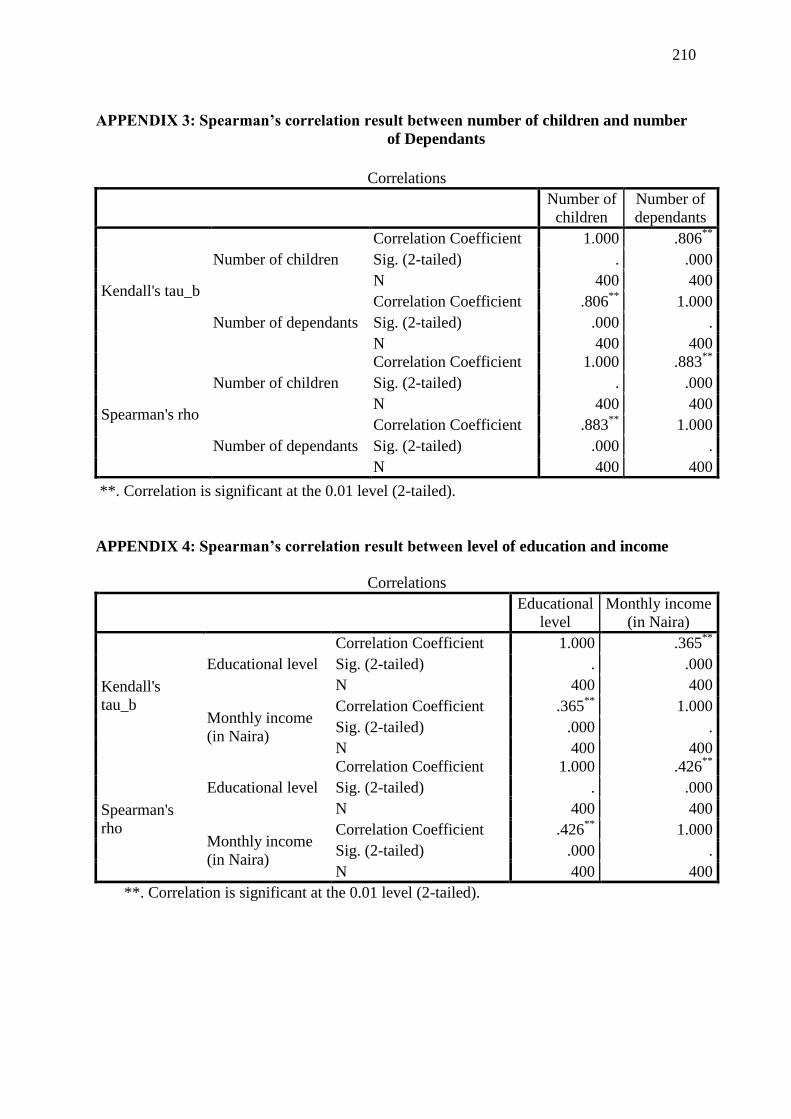
210
APPENDIX 3: Spearman’s correlation result between number of children and number
of Dependants
Correlations
Number of
children
Number of
dependants
Kendall's tau_b
Number of children
Correlation Coefficient 1.000 .806**
Sig. (2-tailed) . .000
N 400 400
Number of dependants
Correlation Coefficient .806**
1.000
Sig. (2-tailed) .000 .
N 400 400
Spearman's rho
Number of children
Correlation Coefficient 1.000 .883**
Sig. (2-tailed) . .000
N 400 400
Number of dependants
Correlation Coefficient .883**
1.000
Sig. (2-tailed) .000 .
N 400 400
**. Correlation is significant at the 0.01 level (2-tailed).
APPENDIX 4: Spearman’s correlation result between level of education and income
Correlations
Educational
level
Monthly income
(in Naira)
Kendall's
tau_b
Educational level
Correlation Coefficient 1.000 .365**
Sig. (2-tailed) . .000
N 400 400
Monthly income
(in Naira)
Correlation Coefficient .365**
1.000
Sig. (2-tailed) .000 .
N 400 400
Spearman's
rho
Educational level
Correlation Coefficient 1.000 .426**
Sig. (2-tailed) . .000
N 400 400
Monthly income
(in Naira)
Correlation Coefficient .426**
1.000
Sig. (2-tailed) .000 .
N 400 400
**. Correlation is significant at the 0.01 level (2-tailed).
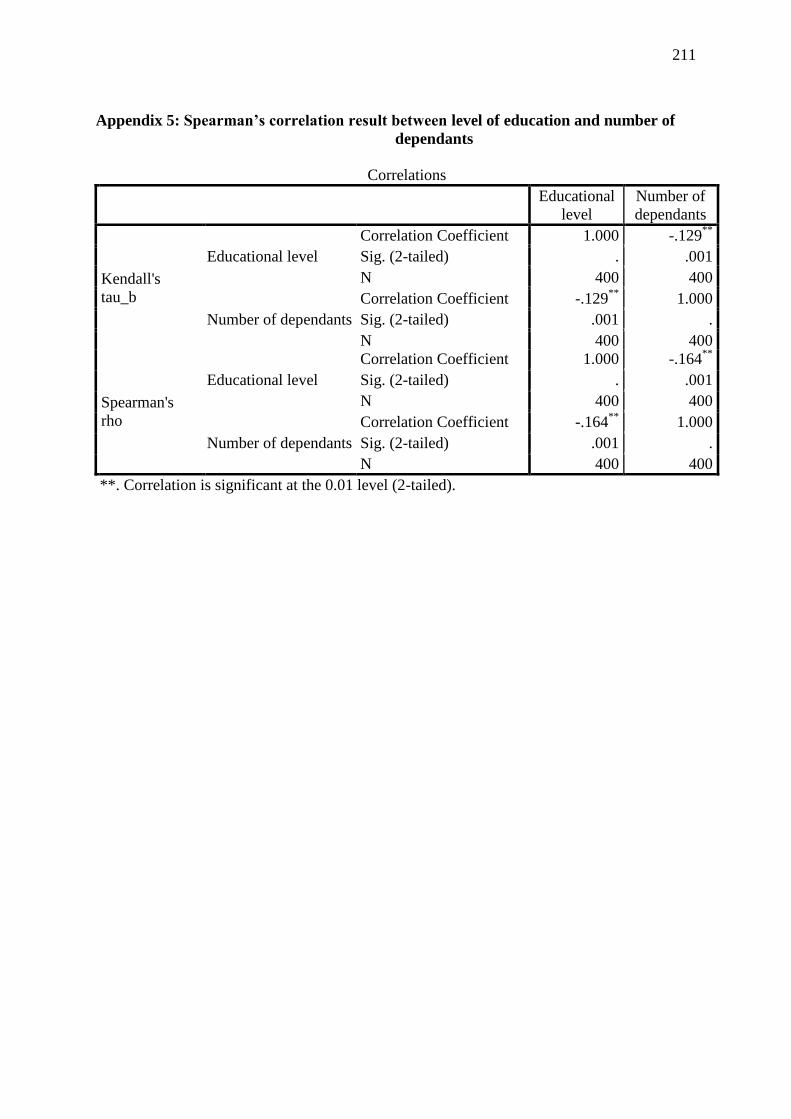
211
Appendix 5: Spearman’s correlation result between level of education and number of
dependants
Correlations
Educational
level
Number of
dependants
Kendall's
tau_b
Educational level
Correlation Coefficient 1.000 -.129**
Sig. (2-tailed) . .001
N 400 400
Number of dependants
Correlation Coefficient -.129**
1.000
Sig. (2-tailed) .001 .
N 400 400
Spearman's
rho
Educational level
Correlation Coefficient 1.000 -.164**
Sig. (2-tailed) . .001
N 400 400
Number of dependants
Correlation Coefficient -.164**
1.000
Sig. (2-tailed) .001 .
N 400 400
**. Correlation is significant at the 0.01 level (2-tailed).
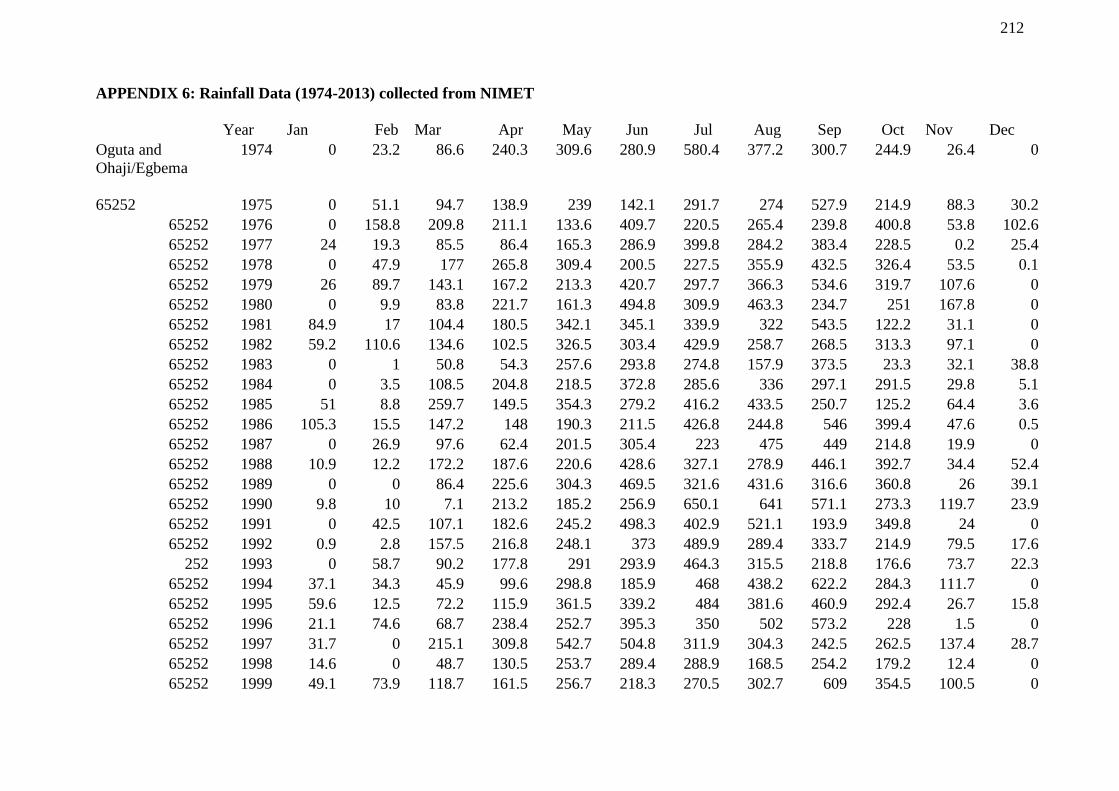
212
APPENDIX 6: Rainfall Data (1974-2013) collected from NIMET
Year
Jan Feb
Mar Apr May Jun Jul Aug Sep Oct
Nov
Dec
Oguta and 1974 0 23.2 86.6 240.3 309.6 280.9 580.4 377.2 300.7 244.9 26.4 0
Ohaji/Egbema
65252 1975 0 51.1 94.7 138.9 239 142.1 291.7 274 527.9 214.9 88.3 30.2
65252 1976 0 158.8 209.8 211.1 133.6 409.7 220.5 265.4 239.8 400.8 53.8 102.6
65252 1977 24 19.3 85.5 86.4 165.3 286.9 399.8 284.2 383.4 228.5 0.2 25.4
65252 1978 0 47.9 177 265.8 309.4 200.5 227.5 355.9 432.5 326.4 53.5 0.1
65252 1979 26 89.7 143.1 167.2 213.3 420.7 297.7 366.3 534.6 319.7 107.6 0
65252 1980 0 9.9 83.8 221.7 161.3 494.8 309.9 463.3 234.7 251 167.8 0
65252 1981 84.9 17 104.4 180.5 342.1 345.1 339.9 322 543.5 122.2 31.1 0
65252 1982 59.2 110.6 134.6 102.5 326.5 303.4 429.9 258.7 268.5 313.3 97.1 0
65252 1983 0 1 50.8 54.3 257.6 293.8 274.8 157.9 373.5 23.3 32.1 38.8
65252 1984 0 3.5 108.5 204.8 218.5 372.8 285.6 336 297.1 291.5 29.8 5.1
65252 1985 51 8.8 259.7 149.5 354.3 279.2 416.2 433.5 250.7 125.2 64.4 3.6
65252 1986 105.3 15.5 147.2 148 190.3 211.5 426.8 244.8 546 399.4 47.6 0.5
65252 1987 0 26.9 97.6 62.4 201.5 305.4 223 475 449 214.8 19.9 0
65252 1988 10.9 12.2 172.2 187.6 220.6 428.6 327.1 278.9 446.1 392.7 34.4 52.4
65252 1989 0 0 86.4 225.6 304.3 469.5 321.6 431.6 316.6 360.8 26 39.1
65252 1990 9.8 10 7.1 213.2 185.2 256.9 650.1 641 571.1 273.3 119.7 23.9
65252 1991 0 42.5 107.1 182.6 245.2 498.3 402.9 521.1 193.9 349.8 24 0
65252 1992 0.9 2.8 157.5 216.8 248.1 373 489.9 289.4 333.7 214.9 79.5 17.6
252 1993 0 58.7 90.2 177.8 291 293.9 464.3 315.5 218.8 176.6 73.7 22.3
65252 1994 37.1 34.3 45.9 99.6 298.8 185.9 468 438.2 622.2 284.3 111.7 0
65252 1995 59.6 12.5 72.2 115.9 361.5 339.2 484 381.6 460.9 292.4 26.7 15.8
65252 1996 21.1 74.6 68.7 238.4 252.7 395.3 350 502 573.2 228 1.5 0
65252 1997 31.7 0 215.1 309.8 542.7 504.8 311.9 304.3 242.5 262.5 137.4 28.7
65252 1998 14.6 0 48.7 130.5 253.7 289.4 288.9 168.5 254.2 179.2 12.4 0
65252 1999 49.1 73.9 118.7 161.5 256.7 218.3 270.5 302.7 609 354.5 100.5 0
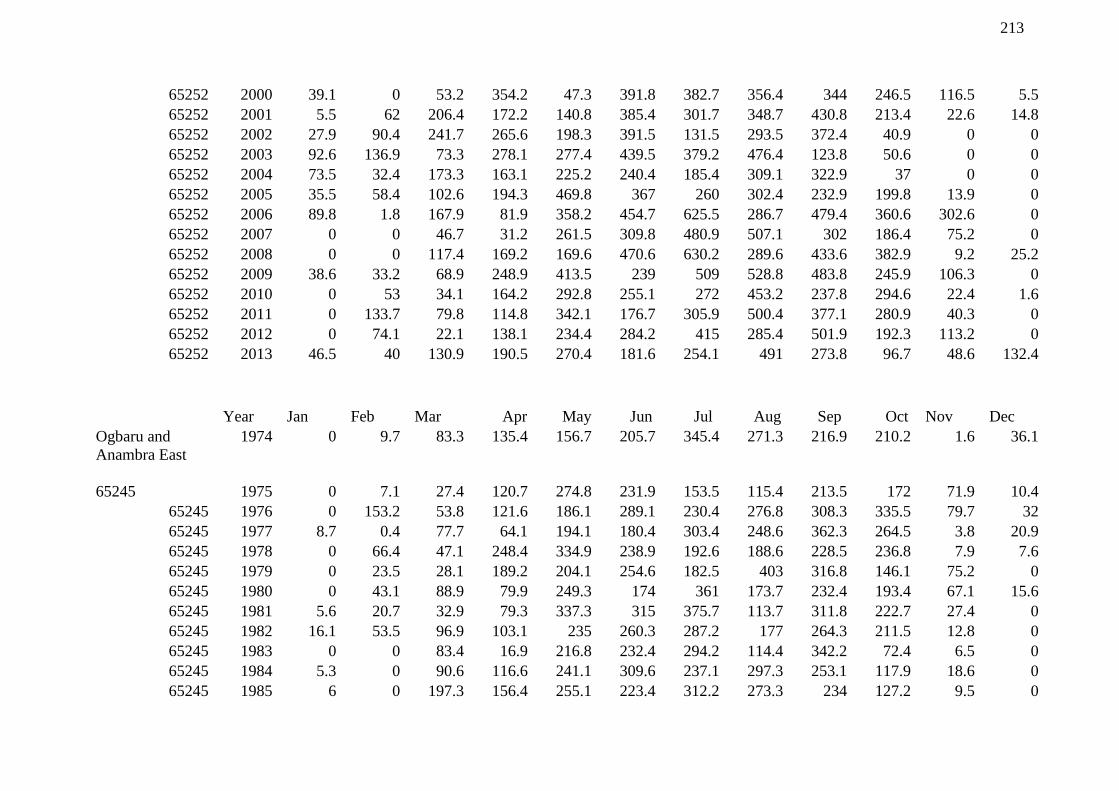
213
65252 2000 39.1 0 53.2 354.2 47.3 391.8 382.7 356.4 344 246.5 116.5 5.5
65252 2001 5.5 62 206.4 172.2 140.8 385.4 301.7 348.7 430.8 213.4 22.6 14.8
65252 2002 27.9 90.4 241.7 265.6 198.3 391.5 131.5 293.5 372.4 40.9 0 0
65252 2003 92.6 136.9 73.3 278.1 277.4 439.5 379.2 476.4 123.8 50.6 0 0
65252 2004 73.5 32.4 173.3 163.1 225.2 240.4 185.4 309.1 322.9 37 0 0
65252 2005 35.5 58.4 102.6 194.3 469.8 367 260 302.4 232.9 199.8 13.9 0
65252 2006 89.8 1.8 167.9 81.9 358.2 454.7 625.5 286.7 479.4 360.6 302.6 0
65252 2007 0 0 46.7 31.2 261.5 309.8 480.9 507.1 302 186.4 75.2 0
65252 2008 0 0 117.4 169.2 169.6 470.6 630.2 289.6 433.6 382.9 9.2 25.2
65252 2009 38.6 33.2 68.9 248.9 413.5 239 509 528.8 483.8 245.9 106.3 0
65252 2010 0 53 34.1 164.2 292.8 255.1 272 453.2 237.8 294.6 22.4 1.6
65252 2011 0 133.7 79.8 114.8 342.1 176.7 305.9 500.4 377.1 280.9 40.3 0
65252 2012 0 74.1 22.1 138.1 234.4 284.2 415 285.4 501.9 192.3 113.2 0
65252 2013 46.5 40 130.9 190.5 270.4 181.6 254.1 491 273.8 96.7 48.6 132.4
Year
Jan
Feb
Mar Apr May Jun Jul Aug Sep Oct
Nov
Dec
Ogbaru and 1974 0 9.7 83.3 135.4 156.7 205.7 345.4 271.3 216.9 210.2 1.6 36.1
Anambra East
65245 1975 0 7.1 27.4 120.7 274.8 231.9 153.5 115.4 213.5 172 71.9 10.4
65245 1976 0 153.2 53.8 121.6 186.1 289.1 230.4 276.8 308.3 335.5 79.7 32
65245 1977 8.7 0.4 77.7 64.1 194.1 180.4 303.4 248.6 362.3 264.5 3.8 20.9
65245 1978 0 66.4 47.1 248.4 334.9 238.9 192.6 188.6 228.5 236.8 7.9 7.6
65245 1979 0 23.5 28.1 189.2 204.1 254.6 182.5 403 316.8 146.1 75.2 0
65245 1980 0 43.1 88.9 79.9 249.3 174 361 173.7 232.4 193.4 67.1 15.6
65245 1981 5.6 20.7 32.9 79.3 337.3 315 375.7 113.7 311.8 222.7 27.4 0
65245 1982 16.1 53.5 96.9 103.1 235 260.3 287.2 177 264.3 211.5 12.8 0
65245 1983 0 0 83.4 16.9 216.8 232.4 294.2 114.4 342.2 72.4 6.5 0
65245 1984 5.3 0 90.6 116.6 241.1 309.6 237.1 297.3 253.1 117.9 18.6 0
65245 1985 6 0 197.3 156.4 255.1 223.4 312.2 273.3 234 127.2 9.5 0
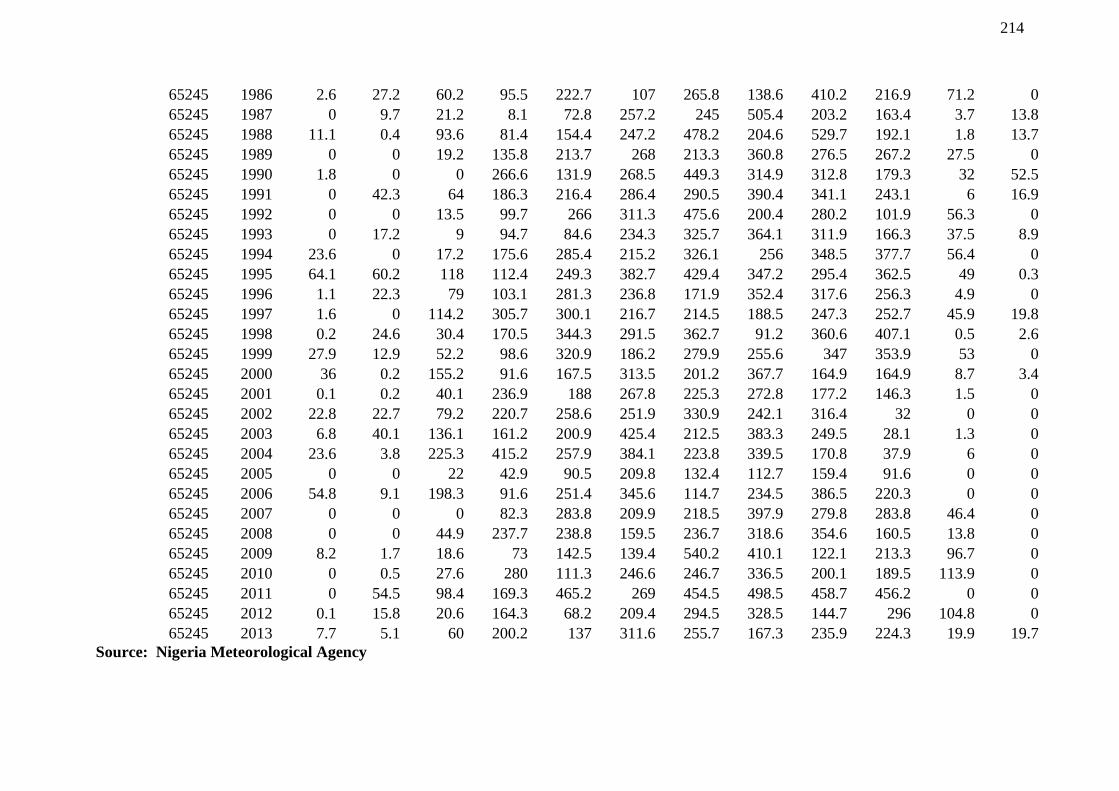
214
65245 1986 2.6 27.2 60.2 95.5 222.7 107 265.8 138.6 410.2 216.9 71.2 0
65245 1987 0 9.7 21.2 8.1 72.8 257.2 245 505.4 203.2 163.4 3.7 13.8
65245 1988 11.1 0.4 93.6 81.4 154.4 247.2 478.2 204.6 529.7 192.1 1.8 13.7
65245 1989 0 0 19.2 135.8 213.7 268 213.3 360.8 276.5 267.2 27.5 0
65245 1990 1.8 0 0 266.6 131.9 268.5 449.3 314.9 312.8 179.3 32 52.5
65245 1991 0 42.3 64 186.3 216.4 286.4 290.5 390.4 341.1 243.1 6 16.9
65245 1992 0 0 13.5 99.7 266 311.3 475.6 200.4 280.2 101.9 56.3 0
65245 1993 0 17.2 9 94.7 84.6 234.3 325.7 364.1 311.9 166.3 37.5 8.9
65245 1994 23.6 0 17.2 175.6 285.4 215.2 326.1 256 348.5 377.7 56.4 0
65245 1995 64.1 60.2 118 112.4 249.3 382.7 429.4 347.2 295.4 362.5 49 0.3
65245 1996 1.1 22.3 79 103.1 281.3 236.8 171.9 352.4 317.6 256.3 4.9 0
65245 1997 1.6 0 114.2 305.7 300.1 216.7 214.5 188.5 247.3 252.7 45.9 19.8
65245 1998 0.2 24.6 30.4 170.5 344.3 291.5 362.7 91.2 360.6 407.1 0.5 2.6
65245 1999 27.9 12.9 52.2 98.6 320.9 186.2 279.9 255.6 347 353.9 53 0
65245 2000 36 0.2 155.2 91.6 167.5 313.5 201.2 367.7 164.9 164.9 8.7 3.4
65245 2001 0.1 0.2 40.1 236.9 188 267.8 225.3 272.8 177.2 146.3 1.5 0
65245 2002 22.8 22.7 79.2 220.7 258.6 251.9 330.9 242.1 316.4 32 0 0
65245 2003 6.8 40.1 136.1 161.2 200.9 425.4 212.5 383.3 249.5 28.1 1.3 0
65245 2004 23.6 3.8 225.3 415.2 257.9 384.1 223.8 339.5 170.8 37.9 6 0
65245 2005 0 0 22 42.9 90.5 209.8 132.4 112.7 159.4 91.6 0 0
65245 2006 54.8 9.1 198.3 91.6 251.4 345.6 114.7 234.5 386.5 220.3 0 0
65245 2007 0 0 0 82.3 283.8 209.9 218.5 397.9 279.8 283.8 46.4 0
65245 2008 0 0 44.9 237.7 238.8 159.5 236.7 318.6 354.6 160.5 13.8 0
65245 2009 8.2 1.7 18.6 73 142.5 139.4 540.2 410.1 122.1 213.3 96.7 0
65245 2010 0 0.5 27.6 280 111.3 246.6 246.7 336.5 200.1 189.5 113.9 0
65245 2011 0 54.5 98.4 169.3 465.2 269 454.5 498.5 458.7 456.2 0 0
65245 2012 0.1 15.8 20.6 164.3 68.2 209.4 294.5 328.5 144.7 296 104.8 0
65245 2013 7.7 5.1 60 200.2 137 311.6 255.7 167.3 235.9 224.3 19.9 19.7
Source: Nigeria Meteorological Agency

ccxv