Embed Size (px)
Citation preview

University of Texas Rio Grande Valley University of Texas Rio Grande Valley
ScholarWorks @ UTRGV ScholarWorks @ UTRGV
Earth, Environmental, and Marine Sciences Faculty Publications and Presentations College of Sciences
10-21-2019
Spatial and seasonal differences in the top predators of Easter Spatial and seasonal differences in the top predators of Easter
Island: Essential data for implementing the new Rapa Nui Island: Essential data for implementing the new Rapa Nui
multiple‐uses marine protected area multiple uses marine protected area
Naiti A. Morales
Erin E. Easton The University of Texas Rio Grande Valley, [email protected]
Alan M. Friedlander
Euan S. Harvey
Rodrigo Garcia
See next page for additional authors
Follow this and additional works at: https://scholarworks.utrgv.edu/eems_fac
Part of the Earth Sciences Commons, Environmental Sciences Commons, and the Marine Biology
Commons
Recommended Citation Recommended Citation Morales, NA, Easton, EE, Friedlander, AM, Harvey, ES, Garcia, R, Gaymer, CF. Spatial and seasonal differences in the top predators of Easter Island: Essential data for implementing the new Rapa Nui multiple‐uses marine protected area. Aquatic Conserv: Mar Freshw Ecosyst. 2019; 29(S2): 118– 129. https://doi.org/10.1002/aqc.3068
This Article is brought to you for free and open access by the College of Sciences at ScholarWorks @ UTRGV. It has been accepted for inclusion in Earth, Environmental, and Marine Sciences Faculty Publications and Presentations by an authorized administrator of ScholarWorks @ UTRGV. For more information, please contact [email protected], [email protected].
Authors Authors Naiti A. Morales, Erin E. Easton, Alan M. Friedlander, Euan S. Harvey, Rodrigo Garcia, and Carlos F. Gaymer
This article is available at ScholarWorks @ UTRGV: https://scholarworks.utrgv.edu/eems_fac/56

1
Spatial and seasonal differences in the top predators of Easter Island: 1
essential data for implementing the new Rapa Nui multiple-uses 2
MPA 3
4
Naiti A. Morales1,2, Erin E. Easton1,2,3, Alan M. Friedlander4,5, Euan S. Harvey6, 5 Rodrigo Garcia7, Carlos F. Gaymer1,2. 6
7 1Millennium Nucleus for Ecology and Sustainable Management of Oceanic Islands (ESMOI), 8 2Departamento de Biología Marina, Universidad Católica del Norte, Larrondo 1281, 9 Coquimbo, Chile. 10 3Present address: University of Texas Rio Grande Valley, School of Earth, Environmental, and 11 Marine Sciences, Brownsville 12 4Fisheries Ecology Research Lab, University of Hawai‘i 13 5Pristine Seas, National Geographic Society, Washington, DC 14 6School of Molecular and Life Sciences, Curtin University, Perth, Western Australia 15 7School the Environment, University of Massachusetts Boston, MA 02125 USA 16
17
Abstract 18
1. Reef fishes are an important component of marine biodiversity and changes in the 19
composition of the assemblage structure may indicate ecological, climatic, or 20
anthropogenic disturbances. To examine spatial differences in the reef fish 21
assemblage structure around Easter Island, eight sites were sampled during autumn 22
and summer 2016-2017 with Baited Remote Underwater Video systems (BRUVs). 23
2. To determine seasonal changes, quarterly (seasonal) sampling was conducted at five 24
of those eight sites. Fifteen pelagic species of fishes were recorded during this study, 25
some of which have not previously been recorded in scuba surveys, including the 26
Galapagos shark (Carcharhinus galapagensis, Snodgrass & Heller, 1905) and tunas 27
(Scrombidae). 28
3. Significant spatial and seasonal differences were found in the fish assemblage. Fish 29
assemblages from the south coast differed significantly from those along the west and 30
east coasts, mainly due to the occurrence of top predators. Winter differed from other 31
seasons, especially along the south coast where the island is more exposed to large 32
oceanic swells and winds from Antarctica. 33
4. Due to the variety and high relative abundance of species recorded during this survey, 34
BRUVs seemed to be an effective method for studying top predators at Easter Island. 35

2
The identification of priority zones for the protection of top predators species 36
represent an important contribution of this study, in order to develop management 37
and conservation strategies to be implemented in the newly created Rapa Nui multiple 38
uses coastal marine protected areas (MUMPA). 39
Keywords 40
BRUVs, Easter Island, top predators, sharks, remote islands, trophic groups, management, 41 conservation. 42
43
Introduction 44
Reef fishes play an important role in ecosystem function (Stevens, Bonfil, Dulvy, & Walker, 45
2000), and are the target of recreational, commercial, and subsistence fisheries in many 46
coastal locations (Henry & Lyle, 2003; Kingsford, Underwood, & Kennelly, 1991). Precise 47
and accurate information on the diversity and abundance of fish populations is important for 48
understanding their ecology, and is critical for developing effective management and 49
conservation strategies (Andrew & Mapstone, 1987; Pita, Fernández-Márquez, & Freire, 50
2014). Changes in the fish assemblage composition usually indicate alteration in the 51
community structure in response to ecological, climatic, or anthropogenic drivers (Jeppesen 52
et al., 2010; Schlosser, 1990; Westera, Lavery, & Hyndes, 2003). 53
Reef fish assemblages vary spatially and temporally in response to biotic variables, such as 54
food availability (Tickler, Letessier, Koldewey, & Meeuwig, 2017), predation or competition 55
(Almany, 2004), and abiotic variables, such as habitat complexity and environmental 56
characteristics like wave exposure and temperature (Anderson & Millar, 2004; Coles & Tarr, 57
1990; Curley, Kingsford, & Gillanders, 2003; Friedlander & Parrish, 1998). For example, 58
spatial variation in reef fish assemblages can occur on scales of metres to kilometres (Connell 59
& Jones, 1991; Curley et al., 2003; Malcolm, Gladstone, Lindfield, Wraith, & Lynch, 2007), 60
and are usually associated with habitat complexity and the environmental conditions that 61
structure that habitat (Asher, Williams, & Harvey, 2017; Coles & Tarr, 1990; Friedlander & 62
Parrish, 1998). Seasonal changes are more evident in reef ecosystems from sub-tropical 63
latitudes because of greater environmental variability (Coles & Tarr, 1990; Friedlander & 64
Parrish, 1998). However, these influences differ by location. For example, Coles and Tarr 65

3
(1990) found that the large variation in temperature between winter and summer (about 20ºC) 66
in the Western Arabian Gulf determines the richness and abundance of inshore species. In 67
Hawaii, Friedlander and Parrish (1998) observed that fish assemblages responded to high 68
wind and wave energy during winter by taking refuge at deeper depths and in more complex 69
habitats. Understanding the natural variations in the fish assemblage provides essential 70
baseline information for designing and evaluating the effectiveness of marine protected areas 71
(MPA) (Charton et al., 2000). Having accurate information of where to protect is especially 72
valuable in highly urbanized areas, where area protection is constrained owing to conflicts 73
among multiple users (Curley et al., 2003). 74
Marine Protected Areas (MPAs) have been shown to be a highly effective means of 75
conserving biodiversity and managing fisheries, while also restoring and preserving overall 76
ecosystem functions (Gaines, White, Carr, & Palumbi, 2010; Lubchenco & Grorud-Colvert, 77
2015). Through the establishment of fishing regulations such as minimum size, effort control 78
and/or regulation of total catches (Botsford, Micheli, & Hastings, 2003; Hilborn, Micheli, & 79
De Leo, 2006), MPAs are usually associated with the increase of abundance, biomass and 80
size of focal species (Micheli, Halpern, Botsford, & Warner, 2004) as well as catch-per-unit-81
effort (CPUE) in adjacent areas (Roberts, Bohnsack, Gell, Hawkins, & Goodridge, 2001). In 82
Chile, 23 MPAs have been created in the last decade, protecting over 41% of its economic 83
exclusive zone (EEZ) (Petit, Campoy, Hevia, Gaymer, & Squeo, 2017). The most recent 84
three MPAs were announced during the 2017 International Marine Protected Areas Congress 85
(IMPAC4 2017): Islas Diego Ramirez-Paso Drake, Juan Fernandez archipelago and Rapa 86
Nui. The Rapa Nui Multiple Uses Coastal Marine Protected Area (MUMPA) covers the 87
entire Easter Island Ecoregion and extends from the Easter Island coastline to the limit of the 88
EEZ, embracing ~579,000 km2. 89
Easter Island, also known by its Polynesian name Rapa Nui, is the most south-eastern coral 90
reef ecosystem in the Pacific Ocean and harbours a unique fish assemblage with a high level 91
of endemism (Randall & Cea, 2010). Easter Island is one of the most isolated inhabited 92
islands in the Pacific Ocean; yet, long-term overfishing has dramatically reduced the 93
abundance of targeted species (Aburto, Gaymer, Haoa, & Gonzales, 2015; Friedlander et al., 94
2013; Randall & Cea, 2010; Zylich et al., 2014). Modern fishing equipment and the demand 95

4
for local fish from increasing tourism has compounded the effects of overfishing (Randall & 96
Cea, 2010; Zylich et al., 2014). There have been a limited number of surveys of fishes around 97
Easter Island (e.g. Easton, Gaymer, Friedlander, & Herlan, 2018; Fernández, Pappalardo, 98
Rodríguez-Ruiz, & Castilla, 2014; Friedlander et al., 2013), with most of these studies 99
focusing on reef fishes, rather than pelagic species. Using underwater visual census (UVC), 100
Friedlander et al. (2013) found contrasting reef fish assemblages between Easter Island and 101
its nearest neighbour, Salas y Gómez, a small island located ~390 km to the east. Salas y 102
Gómez is one of the most isolated islands in the Pacific Ocean and is fully protected from 103
fishing as part of the Motu Motiro Hiva Marine Park. Sharks, primarily the Galapagos shark 104
(Carcharhinus galapagensis), and jacks account for more than 40% of the fish biomass 105
around Salas y Gómez, whereas Easter Island is dominated by smaller planktivorous species, 106
with top predators virtually absent (Friedlander et al. 2013). 107
In the past, ecological studies of fishes at Easter Island have relied on fishery-dependent data 108
from commercial fisheries and UVC, performed by scuba divers (Acuña et al., 2018). The 109
use of fishery-dependent sampling is destructive (Skomal, 2007) and inefficient due to 110
sampling biases from gear selectivity and different fishing effort between species, habitats, 111
seasons, and vessels (Bishop, 2006; Murphy & Jenkins, 2010; Thorson & Simpfendorfer; 112
2009). Additionally, this technique is less effective in locations with insufficient and 113
inaccurate landing information, like Easter Island (Aburto & Gaymer, 2018). UVC is the 114
most-used observational technique for reef ecosystems (Medley, Gaudian, & Wells, 1993; 115
Samoilys & Carlos, 2000). However, it also has several well-documented limitations and 116
problems, including intra- and inter-observer variability (Thompson & Mapstone, 1997) and 117
the effect of divers on the species behaviour (Chapman, Johnston, Dunn, & Creasey, 1974; 118
Cole, 1994; Kulbicki, 1998; Gray et al., 2016; Emslie, Cheal, MacNeil, Miller, & Sweatman, 119
2018; Lindfield, Harvey, McIlwain, & Halford, 2014). In contrast, remote underwater video 120
systems, such as Baited Remote Underwater Video Systems (BRUVs), are effective,non-121
destructive fishery-independent techniques used to sample fish assemblages without these 122
diver-associated problems. 123
BRUVs attract a wide range of marine species from different trophic groups into the field of 124
view of a camera so that they can be identified and counted (Dorman, Harvey, & Newman, 125

5
2012; Hardinge, Harvey, Saunders, & Newman, 2013). BRUVs increase the number of 126
sampled species (Stobart et al., 2007; Willis & Babcock, 2000), and are especially effective in 127
the detection of cryptic and rare predators, such as sharks and fishery-targeted species, that 128
are not well sampled using UVC (Brooks, Sloman, Sims, Danylchuk 2011; Harvey et al. 129
2012; Malcolm et al., 2007; Watson, Harvey, Anderson, & Kendrick, 2005). Pelagic BRUVs 130
are even more novel than traditional BRUVs, allowing the study of species that inhabit the 131
water column, including highly mobile species (Santana-Garcon, Newman & Harvey, 2014; 132
Santana‐Garcon et al., 2014b). Pelagic species are ecologically important to marine 133
ecosystems (Freon , Cury, Shannon, Roy, 2005) and highly valuable for the fishing industry 134
(Pauly 2002; Worm et al. 2006). Despite their importance and that they are constantly 135
threatened by multiple factors, such as pollution, climate change, and overfishing (see Game 136
et al. 2009), the pelagic ecosystems, at a community scale, are still data poor worldwide. 137
Given the lack of quantitative data on the pelagic fish assemblages of Easter Island, the 138
fragility of the marine ecosystem, and the importance of baseline information for the 139
implementation of conservation strategies, the objectives of this study were: (1) to assess 140
spatial and seasonal variability in the pelagic fishes around Easter Island using BRUVs; (2) 141
to determine which environmental factors best explain the observed differences; and (3) to 142
provide key data for advising management and conservation of the coastal areas, with 143
particular emphasis on zoning the recently created MUMPA. 144
145
Material and Methods 146
Study area 147
Easter Island (27°13´S and 109°37´W) has a land area of 166 km2 and ~5600 inhabitants. 148
Located 2250 km east from Pitcairn Island and 3760 km south-west from mainland Chile, it 149
is one of the most isolated places on earth. The nearest island is Salas y Gomez Island 150
(26º28`S and 105º21`W), which is an uninhabited volcanic island with a total area of 0.15 151
km2. Both islands and more than several dozen seamounts are part of the Salas y Gómez 152
Ridge, which extends 2232 km before reaching the Nazca Ridge in the south-eastern Pacific 153
Ocean (Randall & Cea, 2010; Friedlander et al., 2013). 154
6
Sample collection 155
Mid-water BRUVs were constructed according to Santana-Garcon et al., (2014a). Each 156
BRUVs was constructed using a single GoPro Hero 4 camera (mono-camera) held in their 157
own underwater housing. GoPros were set to record a wide-angle of view and 1080p. A mix 158
of fresh local fishes (~300 gr) and one can of Chilean jack mackerel (Trachurus murphyi) 159
were used as bait. Deployments were carried out during daylight hours, avoiding dusk and 160
dawn. Four simultaneous 1-h deployments (replicates), having a minimum separation of 500 161
m to avoid plume dispersion overlap (Santana-Garcon et al., 2014a), were conducted at a 162
depth of ~25 m at each site; a minimum of six deployments were conducted per site. Local 163
knowledge, previous studies and limitations related to weather conditions were used to guide 164
the spatial coverage of sites. Date, hour and location (latitude and longitude) were recorded 165
during every deployment. To study spatial differences around Easter Island, eight sites were 166
sampled during autumn and summer 2017 (Figure 1). To determine seasonal changes in the 167
fish assemblage, quarterly seasonal sampling was undertaken at five of those sites during 168
2016-2017. 169
Every BRUVs was deployed for a minimum of 70 minutes. Following the recommendations 170
of Acuña -Marrero et al. (2018), we discarded the first and the last 5 minutes from every 171
video to avoid any potential influence caused by the presence of the boat. Species 172
assignments were made following Randall and Cea (2010), FishBase (ver. 02/2018, R. Froese 173
& D. Pauly, see www.fishbase.org, accessed 2018), and consultations with world fish 174
specialists. Each species was assigned to a functional group (herbivores, planktivores, 175
secondary consumers, and top predators) following Friedlander et al. (2013) and FishBase 176
(ver. 02/2018, R. Froese & D. Pauly, see www.fishbase.org, accessed 2018). Additionally, 177
all the species were classified as “Target Species” or “Not Target Species” according to 178
Zylich et al. (2014) and discussions by the first author with local fishermen. The maximum 179
number of individuals of the same species appearing in a video frame at the same time 180
(MaxN), plus any other individual that was uniquely and clearly distinguishable from the 181
other individuals, was used as an estimate of relative abundance or a corrected MaxN 182
(cMaxN; see Acuña-Marrero et al., 2018). MaxN is a conservative measurement of relative 183
abundance that avoids any error associated with recounting the same fish (Cappo, Harvey, 184
Malcom, & Speare, 2003; Priede, Bagley, Smith, Creasey, & Merrett, 1994; Willis, Millar, 185

7
& Babcock, 2003); however, it usually underestimates the real abundance in a single 186
deployment (Kilfoil et al., 2017). By including any other individual that was undoubtedly 187
distinguishable within the deployment and that was not already included in the MaxN 188
calculation, cMaxN tends to solve, in part, the underestimation problem of sampled species. 189
cMaxN per hour was used to standardize effort across deployments of different soak times, 190
as suggested by Santana-Garcon et al. (2004b). Measurement of length was not considered 191
during this study, therefore, a biomass calculation could not be included in the analysis. 192
Data analyses 193
All statistical analyses were conducted in PRIMER v. 7.0.13 software package (Clarke & 194
Gorley, 2006) with the PERMANOVA+ add-on (Anderson, Gorley, & Clarke, 2008), unless 195
otherwise specified. A Bray–Curtis similarity matrix was created on the 4th-root transformed 196
cMaxN data. All permutational multivariate analysis of variance (PERMANOVA) tests were 197
run with default settings and 9999 permutations to obtain p-values (Anderson et al., 2008). 198
Statistically significant (p < 0.05) interactions were further explored with appropriate post 199
hoc pairwise tests. To test spatial variance around Easter Island, cMaxN data of each site 200
were analysed using “Sites” as a fixed factor in a PERMANOVA. To test seasonal difference 201
on fish assemblage, data were analysed using seasons (winter, spring, summer and autumn) 202
and five sites as fixed factors. A canonical analysis of principal coordinates (CAP) was used 203
as a general test to evaluate structural differences in overall fish assemblage. CAP maximizes 204
group differences finding the axis that best separates each group (Anderson et al., 2008). 205
CAP analyses were run on the resemble matrix of average values between sites and seasons. 206
Environmental data collection and analysis 207
To determine the role of seasonal and spatial environmental variation on the fish assemblage 208
structure, sea surface temperature (SST), long-term and recent wave energy, distance of each 209
deployment site from the shore, and shelf width were considered. For each site, SST MUR 210
(Multi-scale Sea Surface Temperature) satellite data at a 1 km spatial resolution 211
(https://mur.jpl.nasa.gov) were used after we verified the accuracy of these satellite data with 212
in situ SST data collected at Omohi, Motu Tautara, Ovahe and Kari Kari sites by Evie Wieters 213
(Pers. Comm., unpublished data) from deployed temperature sensors (Onset, tidbit) set to 214
record SST every ten minutes at 12-15 m depth. Long-term and recent wave energy, were 215
8
computed from NOAA’s Wave Watch III (WWIII; http://polar.ncep.noaa.gov/waves), were 216
binned into 16 discrete sectors each spanning 22.5 degrees. The long-term wave energy 217
ranged from Jan 2010 to Jul 2015, meanwhile recent wave energy was calculated using mean 218
values corresponding to the month each deployment was made. Distance from shore and 219
shelf width were calculated for each site using Google Earth Pro (http://earth.google.com) 220
(Table 1S). For seasonal analysis, only wave energy, long-term wave energy, and SST were 221
considered. Environmental and biological data were analysed using distance-based linear 222
modelling (DistLM) and a distance-based redundancy analysis (dbRDA). DistLM is a routine 223
for analysing and modelling the relationship between a multivariate data cloud, as described 224
by a resemblance matrix, and one or more predictor variables. The dbRDA analysis was used 225
to visualize the given model in a multi-dimensional space (Anderson et al., 2008). 226
Environmental values used in the DistLM-dbRDA are shown in Table S2. 227
228
Results 229
Fifteen species were recorded during the study (Table 1). Planktivores and herbivores were 230
the largest components of the pelagic fish assemblage at Easter Island, accounting for 73.8% 231
and 16.9%, respectively (Table 2). The most abundant species around Easter Island were 232
Xanthichthys mento (Jordan & Gilbert, 1882) and Chromis randalli (Greenfield & Hensley, 233
1970). Both occurred at every site-season combination, except at Vaihu during spring. Top 234
predators, while having the highest species richness (9 species), were not well represented in 235
abundance except at Vaihu. Fistularia commersonii (Rüppell, 1838) was the most abundant 236
species among top predators, followed by Seriola lalandi (Valenciennes, 1833) (Table 2). 237
Some species such as Aulostomus chinensis (Linnaeus, 1766) and Caranx lugubris (Poey, 238
1860) showed seasonal occurrence and other species such as C. galapagensis (Snodgrass & 239
Heller, 1905) and Pseudocaranx cheilio (Bloch & Schneider, 1801) displayed more site-240
specific occurrences. Nine target species were recorded, seven of which were top predators. 241
The most abundant and well distributed was Kyphosus sandwicensis (Sauvage, 1880), which 242
was abundant along the east and west coasts of Easter Island year-round; however, low 243
abundances were reported at Vinapu, and it was absent at Vaihu. The black trevally C. 244
lugubris was rare during the entire study. 245
Spatial differences 246

9
PERMANOVA revealed that the fish assemblages differed significantly among sites 247
(Pseudo-F = 4.795, p < 0.001). Sites along the south-east side of Easter Island, Ana hukahu, 248
Vaihu and Vinapu, were significantly different from all the other sites around the island 249
(Table S3). CAP illustrates the difference in the fish assemblage found using PERMANOVA 250
(Figure 2a). The size of the first two axes were δ1 = 0.9823 and δ2 = 0.9339, respectively, 251
over 5 (m) principal coordinate axes. The estimation of misclassification error indicates low 252
allocation success (31%); however most of the misclassifications occurred within two groups 253
(Figure 2a): (1) Vinapu-Vaihu-Ana hukahu, and (2) Ovahe-Omohi-Poike-Kari Kari-Motu 254
Tautara (Table S2). Vaihu was the only site with 100% allocation success. Vector length and 255
direction from CAP revealed that the abundance of a few species such as C. galapagensis, F. 256
commersonii and P. cheilio drove the differences between Vaihu-Vinapu-Ana hukahu, and 257
all the others sites (Figure 2a). The occurrence of Thunnus albacares (Bonnaterre, 1788) and 258
Decapterus muroadsi (Temminck & Schlegel, 1844) distinguished Poike from other sites 259
(Figure 2a), meanwhile the occurrence of Katsuwonus pelamis (Linnaeus, 1758) was a 260
consequence of the differences at Omohi. 261
Seasonal differences 262
Highest richness and abundances were found in autumn and summer. Fish assemblages 263
during winter significantly differed from the other seasons (Pseudo-F = 3.366, p < 0.001, 264
Table S3). Principal axes values from CAP were δ1 = 0.909 and δ2 = 0.546, over m = 3 265
principal coordinate axes (Figure 2b). The overall estimation of misclassification error 266
showed an allocation success of only 60%. Winter had the highest allocation success with 267
80%, while success for autumn (60%), summer (60%), and spring (40%) were lower. In 268
general, the occurrence and abundance of species such as X. mento, A. chinensis and S. 269
lalandi, were associated with winter, while Aluterus scriptus and C. lugubris were associated 270
with the summer season. 271
Environmental analysis 272
DistLM-dbRDA ordination showed that shelf width explained 26.6% of the spatial variation 273
in the fish assemblage around Easter Island (p = 0.002). Recent wave energy and distance 274
from the coast, when considered alone, explained 15.4 %, (p=0.028) and 14.5% (p= 0.039) 275

10
of the variation, respectively. Long-term wave energy was the only variable explaining 276
significant seasonal variability (~ 17.2% of the variation, p = 0.031) (Table S4). 277
Discussion 278
This study is the first on spatial and temporal patterns of the pelagic fish assemblage at Easter 279
Island, highlighting the importance of specific areas of occurrence and abundance. We found 280
the pelagic fish assemblage at Easter Island to be dominated numerically by two small 281
planktivore species, C. randalli and X. mento, followed by the herbivorous K. sandwicensis. 282
The numerical dominance of planktivorous and herbivorous species observed in our study is 283
consistent with Friedlander et al. (2013) findings that these two trophic groups accounted for 284
40% and 31% of the total reef fish biomass, respectively. Top predator species, although less 285
abundant, constituted the richest trophic group in our study (nine species). In contrast, 286
Friedlander et al. (2013) only observed six species of this trophic group, and with lower 287
abundances. These differences in richness and abundance of top predators species might be 288
explained by differences in sampling methods. UVCs is a reliable observational technique 289
(Medley et al., 1993; Samoilys & Carlos, 2000), and it is widely used for sampling reef-290
associated species at shallow, nearshore habitats. However, the effect of divers on animal 291
behaviour has led to the underestimation of some species abundance, such is the case of 292
cryptic and fishery-target species within fishing areas (Chapman et al., 1974; Cole, 1994; 293
Gray et al., 2016; Kulbicki, 1998; Lindfield et al., 2014), especially pelagic species (De 294
Girolamo & Mazzoldi, 2001; Stanley & Wilson, 1995). The higher occurrence of rare species 295
and species undersampled by UVCs, such as C. galapagensis, K. pelamis, T. albacare and 296
C. lugubris, during our study proved the effectiveness of BRUVs in studying the pelagic fish 297
assemblages at Easter Island, especially top predators. 298
Top predators play an important role in the top-down ecosystem regulation (Stevens et al., 299
2000), yet these species are the most vulnerable to overfishing and their removal could lead 300
to environmental changes affecting ecosystem function in fragile ecosystems (Hughes, 301
Graham, Jackson, Mumby, & Steneck, 2010; Shears & Babcock, 2002). The continued 302
decline of top-predator populations at Easter Island has likely caused a phase shift from a 303
healthy community dominated by large top predators, such as at Salas y Gómez, to a 304
disturbed community dominated by smaller planktivorous species (Friedlander et al., 2013). 305

11
Seven of the nine species of top predators recorded in this study are targeted by fisheremen 306
at Easter Island. Together with the herbivorous Pacific rudderfish, K. sandwicensis, top 307
predators like S. lalandi, S. helleri and T. albacares are the most targeted pelagic fishes at 308
Easter Island (Zylich et al., 2014). Subsistence catches are also dominated by K. sandwicensis 309
and other jacks such as C. lugubris and P. cheilio (Zylich et al., 2014). According to local 310
residents, C. lugubris was abundant in the past, but now is uncommon. Similarly, the 311
Galapagos shark, which is currently classified as Near Threatened on the IUCN Red List, has 312
been reported by local residents to have declined considerably around Easter Island, possibly 313
as a result of direct and indirect fishing impacts (Zylich et al., 2014; N. Morales, pers. obs), 314
although the overfishing of prey may also be contributing to this decline (DiSalvo, Randall, 315
& Cea, 1988). Even though fishermen on Easter Island do not directly target the Galapagos 316
shark, they seem to be susceptible to bycatch in coastal and offshore fisheries. Likewise, their 317
population has declined considerably in Central America (Bennett et al., 2003), where the 318
major threat comes from bait-fishing activities around islands and seamounts (Bennett et al., 319
2003; Zylich et al., 2014). 320
The Galapagos shark is the most common coastal shark around Easter Island (Randall & Cea, 321
2010; Zylich et al., 2014), and it was the only species of shark observed during the current 322
study. A similar BRUVs study in the Galapagos Archipelago found that the Galapagos shark 323
was also the most abundant among 12 species of sharks in the area (Acuña-Marrero et al. 324
2018). In that study, the Galapagos shark showed a similar mean cMaxN (0.52) per 325
deployment to our observations (0.58), despite the fact that the highest cMaxN found in the 326
Galapagos (8) was almost three times lower than in the current study (21). Total number of 327
individuals observed was 334 in the Galapagos Archipelago, and 112 in the current study. 328
These contrasting numbers could be a result of a higher local (i.e., site) concentration of this 329
species but a lower regional (i.e., island) abundance at Easter Island than at the Galapagos 330
Archipelago. 331
Spatial and seasonal differences in the composition of pelagic fish species were found during 332
this study. Species composition along the south coast (Ana hukahu, Vaihu and Vinapu) was 333
significantly different from the east and west coasts of the island. Spatial differences in 334
assemblage structure were driven by the occurrence and abundance of the top predators such 335
12
as C. galapagensis, F. commersonii, and P. cheilio, which showed more site specificity, 336
suggesting the presence of specific habitat characteristics unique to certain areas. Habitat 337
structure and complexity have been indicated as important characteristics in the composition 338
of fish assemblages, e.g., more complex habitats provide greater food availability and refuge 339
(Anderson & Millar, 2004; Asher et al., 2017; Coles & Tarr, 1990; Curley et al., 2003; Heupel 340
& Hueter, 2002). Shelf width was the most influential pelagic fish assemblage driver. Along 341
the southern coast of the island, the shelf break (30 m) occurs further from the coastline 342
creating an extended shallow platform (Table S2). The sharks observed during this study 343
were likely juveniles (less than 200 cm TL, Wetherbee, Crow, & Lowe, 1996), based on size 344
estimates of those sharks that closely approached bait canisters (used for scale), suggesting 345
juveniles have an apparent strong association with that shallow shelf habitat. Our 346
observations suggests that the south-east coast of Easter Island could be serving as a nursery 347
area for juvenile Galapagos sharks, which is consistent with nursery areas for Carcharhinus 348
species often occuring in shallow waters (Springer, 1967) with a low-predation environment 349
and ample prey availability (Branstetter, 1990; Heupel & Hueter, 2002; Simpfendorfer & 350
Milward, 1993). 351
Abiotic (environmental) variables also influence the abundance of fish species within an area, 352
leading to spatial variability within the ecosystem (Felley & Felley, 1986). Wave energy has 353
been noted as an important driver of reef habitats and benthic communities at Easter Island 354
where the dominance of different coral species depends on the degree of exposure (Easton, 355
et al., 2018; Friedlander et al., 2013). Wave energy came mainly from the south-west (202°) 356
(Table S1); however, it only explained a small amount of the spatial variability in the pelagic 357
fish assemblage. These results may be explained by the low resolution of the satellite data 358
for each site, which probably did not reflect the real effect of wave energy in the total area. 359
Furthermore, in situ measurement of this environmental variable may provide finer resolution 360
and explanatory power. Although, top predator species are often associated with high-energy 361
environments, the occurrence of top predators and target species at the south-easternmost 362
part of the island (From Vinapu to Poike) could be also explained by the effect of adverse 363
weather conditions (e.g. wind, currents, and wave energy) on the local fishing effort, forcing 364
fishing into more sheltered areas. 365

13
Conversely, the most abundant target species K. sandwicensis was rare on the south coast 366
and virtually absent between Vaihu and Ana hukahu. The nanue (Rapanui name for the K. 367
sandwicensis) is an herbivore species that feeds primarily on red algae. At Easter Island, the 368
occurrence of algae is concentrated at the most protected sites (north-east) of the island (see 369
Easton et al., 2018). On the other hand, this species is one of the most prized species on Easter 370
Island and is considered over-exploited by local people (Gaymer et al., 2013). According to 371
Acuña et al. (2018), nanue are usually caught by traditional shoreline fishing and spear-372
fishing, especially from Vinapu to Hanga Nui, where shoreline access is easier and fishing 373
pressure is higher. The heavy fishing pressure together with the species habitat preference 374
could explain the localized depletion in these areas. 375
Seasonal variability in pelagic fish assemblage structure was evident during this study, with 376
winter been significantly different from the other seasons. Autumn and spring are transition 377
seasons, as has been described from other subtropical areas (Friedlander & Parrish, 1998). 378
Sites located along the coasts most exposed to winter swells and winds (Ana hukahu, Vaihu 379
and Vinapu) showed higher variability among seasons in comparison with more protected 380
sites. Similar results were found by Coles and Tarr (1990) in the western Arabian Gulf, and 381
by Friedlander and Parrish (1998) in the Hawaiian Archipelago. In both cases, the authors 382
noticed that some mobile fishes seem to migrate from exposed to more protected and deeper 383
locations that provide refuge from high wave energy during winter. In contrast, more 384
protected sites seem to have more stable assemblages throughout the year. Asher et al. (2017) 385
also found an increase in abundance of jacks and sharks in shallow and mesophotic reefs in 386
the Hawaiian Archipelago with increasing depth, due probably to the avoidance of 387
environmental (e.g. wave energy) and anthropogenic factors (e.g. fishing) in shallow waters. 388
Easter Island has been understudied in comparison to other islands in the Pacific Ocean, and 389
studies at deeper depths are even more limited (Easton et al., 2017). Seriola lalandi and P. 390
cheilio were recorded at ~280 m and ~170 m, respectively, using ROV (remotely-operated 391
vehicle) and Drop-Cams around Easter Island and the surrounding seamounts (Easton et al., 392
2017). The occurrence of inshore species at deeper depths could also suggest that deeper 393
habitats are being used as a refuge from natural and anthropogenic influences. The presence 394
of particular species during certain seasons and at certain sites could be explored by 395

14
expanding the survey area in order to include mesophotic zones and incorporate surrounding 396
seamounts in future designs. 397
Conservation actions 398
Randall and Cea (2010) proposed the establishment of marine reserves around Rapa Nui to 399
allow resident fishes to grow until they reached full reproductive maturity. Some of the areas 400
suggested for reserves were Motu Nui and Motu Iti (in front of Kari-Kari), Ovahe, Motu 401
Tautara, Hanga Nui, and Motu Marotiri. The last two areas correspond to the southeast side 402
of the island, close to where the greatest abundance of top predators was recorded and a 403
possible nursery area for Galapagos sharks was identified. The Galapagos shark show 404
ontogenetic segregation, where juveniles are more likely to inhabit shallow coastal waters, 405
meanwhile adults occur in deeper waters away from the coast (Acuña-Marrero et al., 2018; 406
Kohler, Casey, & Turner, 1998; Wetherbee et al., 1996). Areas used by early life stages are 407
vital for population stability and recovery (Bonfil, 1997), and therefore, their protection is 408
necessary. 409
Additionally, several initiatives have proposed other strategies to protect marine coastal and 410
offshore ecosystems at Easter Island. Notably, a local initiative promoted by the Rapa Nui 411
chamber of tourism suggested the creation of a marine reserve at Hanga Roa Bay (west side 412
of the island); however, local conflicts hindered its creation (Gaymer et al., 2011). An effort 413
has been made in the last seven years to raise awareness and capacity building in the Rapanui 414
community (Aburto, Gaymer, & Cundill, 2017; Gaymer et al., 2013). These efforts ultimately 415
resulted in a participatory process that lead to the creation of a multiple uses coastal marine 416
protected area, MUMPA, around the entire EEZ of Easter and Salas and Gómez islands, 417
completing the protection initially provided by the Motu Motiro Hiva Marine Park in 2010. 418
In order to implement this large-scale MPA, a participatory management plan has to be built, 419
which includes the zoning of the MUMPA in both the coastal and offshore areas. Zoning will 420
include establishing fully no-take coastal areas that could allow recovery of some over-421
exploited target fishes, but also to protect areas were top predators (such as the Galapagos 422
sharks) are concentrated. Top predators play a crucial role in ecosystem function (Friedlander 423
& De Martini, 2002), thus their protection is necessary for maintaining ecological processes 424
and ecosystem services. The current study is an important contribution for planning the 425

15
management and conservation strategies to be implemented in the newly created Rapa Nui 426
MUMPA. A Marine Council, with a majority of Rapanui-elected members, will place the 427
administration of this area under a co-management strategy, in which is an unprecedented 428
model of MPA administration in Chile (Aburto et al. 2017) 429
Over the last decades, there has been an increasing awareness of the added value that 430
ecosystem services and sustainable management can offer to small human communities that 431
inhabit coastal areas (Arkema, Abramson, & Dewsbury, 2015). Biodiversity has been 432
recently recognized as an economic resource (Admiraal, Wossink, de Groot, & de Snoo, 433
2013), enhancing ecotourism and helping local inhabitants shift from non-sustainable 434
practices (overfishing) to a broader array of sustainable activities with added value such as 435
community-based ecotourism. In this sense, the year-round occurrence of the Galapagos 436
shark in one specific area of the island could be considered a shark-based ecotourism spot, 437
where local operators benefit from long-lived animals ensuring decades of incomes. Thus, 438
not only the protection of the Galapagos shark, but also its potential for ecotourism (e.g. 439
shark-watching by SCUBA divers), should be key elements for taking into account for the 440
zoning of the Rapa Nui MUMPA, that will allow activities such as traditional fishing 441
practices, ecotourism, scientific research and others that should be defined in the 442
management plan. 443
444
Acknowledgements 445
We dedicate this paper to Michel Garcia (in memoriam), who dedicated his life to the 446
protection of the ocean and encouraged the curiosity of an entire generation for Easter 447
Island biodiversity. We also thanks Orca Diving Centre for its valuable contribution in 448
accomplishing this research. We would like to thank Alex Tuki, Tai Pakarati and Matias 449
Luna Atamu, for their help in fieldwork. A special thanks to our colleagues and friends 450
from ESMOI for their constant and enthusiastic support during the whole work especially J. 451
Serratosa for his help with the map production. Finally, the authors would like to thank Dr. 452
E. Wieters for sharing her in situ SST data around Easter Island (Fondecyt #1130167 and 453
Fondecyt #1181719). Authors also want to thank Dr. John Baxter and the anonymous 454
referees for their valuable help in improving the quality of this manuscript The current 455
16
research was financed by the Chilean Millennium Initiative (ESMOI) and Save Our Seas 456
Foundation Small grant #361-2016. Funding was also provided by a CONICYT Ph.D. 457
scholarship to NM (#21151143). 458
459
References 460
Aburto, J. A., Gaymer, C. F., Haoa, S., & González, L. (2015). Management of marine resources 461 through a local governance perspective: Re-implementation of traditions for marine resource 462 recovery on Easter Island. Ocean & Coastal Management, 116: 108-115. 463
Aburto, J. A., & Gaymer, C. F. (2018). Struggling with social-ecological mismatches in marine 464 management and conservation at Easter Island. Marine Policy, 92: 21-29. 465
Aburto, J. A., Gaymer, C. F., & Cundill, G. (2017). Towards local governance of marine resources 466 and ecosystems on Easter Island. Aquatic Conservation: Marine and Freshwater Ecosystems, 27(2): 467 353-371. 468
Acuña, E., Gaymer, C., Hinojosa, I., Aburto, J., Cortes, A., Sfeir, R., Petit, I., Hey, M., Garcia, M., 469 Arana, P., & Canales, C. (2018). Informe Pre-final. Proyecto FIPA 2016-35. Estudio biológico 470 pesquero y evaluación del estado de situación de las pesquerías costeras de importancia para Isla de 471 Pascua. 360 pp. 472
Acuña-Marrero, D., Smith, A. N., Salinas-de-León, P., Harvey, E. S., Pawley, M. D., & Anderson, 473 M. J. (2018). Spatial patterns of distribution and relative abundance of coastal shark species in the 474 Galapagos Marine Reserve. Marine Ecology Progress Series, 593: 73-95. 475
Admiraal, J. F., Wossink, A., de Groot, W. T., & de Snoo, G. R. (2013). More than total economic 476 value: How to combine economic valuation of biodiversity with ecological resilience. Ecological 477 Economics, 89: 115-122. 478
Almany, G. R. (2004). Does increased habitat complexity reduce predation and competition in coral 479 reef fish assemblages? Oikos, 106(2): 275-284. 480
Anderson, M.J., & Millar, R.B. (2004). Spatial variation and effects of habitat on temperate reef 481 fish assemblages in northeastern New Zealand. Journal of Experimental Marine Biology and 482 Ecology, 305:191–221 483
Anderson, M. J., Gorley, R. N., & Clarke, K. R. (2008). PERMANOVA+ for Primer. Plymouth, 484 UK: Primer-E. 485
Andrew, N. L., & Mapstone, B. D. (1987). Sampling and the description of spatial pattern in marine 486 ecology. Oceanography and Marine Biology, 25: 39–90. 487
Arkema, K. K., Abramson, S. C., & Dewsbury, B. M. (2006). Marine ecosystem‐based 488 management: from characterization to implementation. Frontiers in Ecology and the Environment, 489 4(10): 525-532. 490
Asher, J., Williams, I. D., & Harvey, E. S. (2017). An Assessment of Mobile Predator Populations 491 along Shallow and Mesophotic Depth Gradients in the Hawaiian Archipelago. Scientific Reports, 7. 492

17
Bishop, J. (2006). Standardizing fishery-dependent catch and effort data in complex fisheries with 493 technology change. Reviews in Fish Biology and Fisheries, 16: 21-38. 494
Bonfil, R. (1997). Status of shark resources in the southern Gulf of Mexico and Caribbean: 495 implications for management. Fishery Research, 29: 101–117 496
Botsford, L. W., Micheli, F., & Hastings, A. (2003). Principles for the design of marine reserves. 497 Ecological Applications, S25-S31. 498
Brooks, E. J., Sloman, K. A., Sims, D. W., & Danylchuk, A. J. (2011). Validating the use of baited 499 remote underwater video surveys for assessing the diversity, distribution and abundance of sharks in 500 the Bahamas. Endangered Species Research, 13(3): 231-243. 501
Branstetter, S. (1990). Early life-history implications of selected carcharhinoid and lamnoid sharks 502 of the northwest Atlantic. NOAA Tech. Rep. NMFS 90: 17-28. 503
Cappo, M., Harvey, E., Malcom, H., & Speare, P. (2003). Potential of video techniques to monitor 504 diversity, abundance and size of fish in studies of Marine Protected Areas. In: Beumer, J., Grant, A., 505 Smith, D. (Eds.), Aquatic Protected Areas — What Works Best and How do We Know? World 506 Congress on Aquatic Protected Areas. Australian Society for Fish Biology, Cairns, Australia. 455–507 464. 508
Cole, R. G. (1994). Abundance, size structure, and diver-oriented behaviour of three large benthic 509 carnivorous fishes in a marine reserve in northeastern New Zealand. Biology Conservation, 70: 93–510 99. 511
Chapman, C. J., Johnston, A. D. F., Dunn, J. R., & Creasey, D. J. (1974). Reactions of fish to sound 512 generated by diver’s open-circuit underwater breathing apparatus. Marine Biology, 27: 357–366. 513
Charton, J. G., Williams, I. D., Ruzafa, A. P., Milazzo, M., Chemello, R., Marcos, C ... & Riggio, S. 514 (2000). Evaluating the ecological effects of Mediterranean marine protected areas: habitat, scale and 515 the natural variability of ecosystems. Environmental Conservation, 27(2): 159-178. 516
Clarke, K. R., & Gorley, R. N. (2006). PRIMER V6: user manual-tutorial. Plymouth Marine 517 Laboratory. 518
Coles, S. L., & Tarr, B. A. (1990). Reef fish assemblages in the western Arabian Gulf: a 519 geographically isolated population in an extreme environment. Bulletin of Marine Science, 47: 696-520 720. 521
Connell, S.D., & Jones, G.P. (1991). The influence of habitat complexity on postrecruitment 522 processes in a temperate reef fish population. Journal of Experimental Marine Biology and 523 Ecology, 151: 271–294 524
Curley, B. G., Kingsford, M. J., & Gillanders, B. M. (2003). Spatial and habitat-related patterns of 525 temperate reef fish assemblages: implications for the design of Marine Protected Areas. Marine and 526 Freshwater Research, 53: 1197-1210. 527
De Girolamo, M., & Mazzoldi, C. (2001). The application of visual census on Mediterranean rocky 528 habitats. Marine Environmental Research, 51(1): 1-16. 529

18
DiSalvo, L.H., Randall, J.E., & Cea, A., (1988). Ecological reconnaissance of the Easter Island 530 sublittoral marine environment. National Geographic Research, 4: 451-473. 531
Dorman, S. R., Harvey, E. S., & Newman, S. J. (2012). Bait effects in sampling coral reef fish 532 assemblages with stereo-BRUVS. PLoS One, 7(7): e41538. 533
Easton, E. E., Gaymer, C. F., Friedlander, A. M., & Herlan, J. J. (2018). Effects of herbivores, wave 534 exposure and depth on benthic coral communities of the Easter Island ecoregion. Marine and 535 Freshwater Research. doi.org/10.1071/MF17064 536
Easton, E. E., Sellanes, J., Gaymer, C. F., Morales, N., Gorny, M., & Berkenpas, E. (2017). 537 Diversity of deep-sea fishes of the Easter Island Ecoregion. Deep Sea Research Part II: Topical 538 Studies in Oceanography, 137: 78-88 539
Emslie, M. J., Cheal, A. J., MacNeil, M. A., Miller, I. R., & Sweatman, H. P. (2018). Reef fish 540 communities are spooked by SCUBA surveys and may take hours to recover. PeerJ, 6, e4886. 541
Felley, J. D., & Felley, S. M. (1986). Habitat partitioning of fishes in an urban, estuarine bayou. 542 Estuaries, 9: 208–18. 543
Fernández, M., Pappalardo, P., Rodríguez-Ruiz, M.C. & Castilla, J.C., (2014). Síntesis del estado 544 del conocimiento sobre la riqueza de especies de macroalgas, macroinvertebrados y peces en aguas 545 costeras y oceánicas de Isla de Pascua e Isla Salas y Gómez. Latin american journal of aquatic 546 research, 42(4): 760-802. 547
Fréon, P., Cury, P., Shannon, L., & Roy, C. (2005). Sustainable exploitation of small pelagic fish 548 stocks challenged by environmental and ecosystem changes: a review. Bulletin of Marine Science, 549 76(2): 385-462.Friedlander, A. M., & Parrish, J. D. (1998). Temporal dynamics of fish communities 550 on an exposed shoreline in Hawaii. Environmental Biology of Fishes, 53: 1-18. 551
Friedlander, A. M., Ballesteros, E., Beets, J., Berkenpas, E., Gaymer, C. F., Gorny, M., & Sala, E. 552 2013. Effects of isolation and fishing on the marine ecosystems of Easter Island and Salas y Gómez, 553 Chile. Aquatic Conservation: Marine and Freshwater Ecosystems, 23: 515-531 554
Friedlander, A. M., & DeMartini, E. E. (2002). Contrasts in density, size, and biomass of reef fishes 555 between the northwestern and the main Hawaiian islands: the effects of fishing down apex 556 predators. Marine Ecology Progress Series, 230: 253-264. 557
Game, E. T., Grantham, H. S., Hobday, A. J., Pressey, R. L., Lombard, A. T., Beckley, L. E., ... & 558 Richardson, A. J. (2009). Pelagic protected areas: the missing dimension in ocean conservation. 559 Trends in ecology & evolution, 24(7): 360-369. 560
Gray, A. E., Williams, I. D., Stamoulis, K. A., Boland, R. C., Lino, K. C., Hauk, B. B., ... & Kosaki, 561 R. K. (2016). Comparison of reef fish survey data gathered by open and closed circuit SCUBA 562 divers reveals differences in areas with higher fishing pressure. PloS one, 11(12): e0167724. 563
Gaines, S. D., White, C., Carr, M. H., & Palumbi, S. R. (2010). Designing marine reserve networks 564 for both conservation and fisheries management. Proceedings of the National Academy of Sciences, 565 107(43): 18286-18293. 566
19
Gaymer, C., Aburto, J., Acuña, E., Bodini, A., Cárcamo, F., Stotz, W., & Tapia, C. (2013). Base de 567 conocimiento y construcción de capacidades para el uso sustentable de los ecosistemas y recursos 568 marinos de la ecorregión de Isla de Pascua. Licitación 4728-33-le12. Subsecretaría Pesca. 569
Gaymer, C., F. Cárcamo, A.M. Friedlander, A. Palma, A. Bodini, A. Muñoz, M. García, E. 570 Sorensen, I. Petit, L. Zañartu, B. Rapu, C. Gutiérrez, A. Hoffens, E. Sala, E. Ballesteros, & Beets, J. 571 (2011). Implementación de una reserva marina en la bahía de Hanga Roa: estudio de línea base 572 Informe final, Licitación Nº 4728-11-LE1. 573
Hardinge, J., Harvey, E. S., Saunders, B. J., & Newman, S. J. (2013). A little bait goes a long way: 574 the influence of bait quantity on a temperate fish assemblage sampled using stereo-BRUVS. 575 Journal of Experimental Marine Biology and Ecology, 449: 250-260. 576
Harvey, E. S., Newman, S. J., McLean, D. L., Cappo, M., Meeuwig, J. J., & Skepper, C. L. (2012). 577 Comparison of the relative efficiencies of stereo-BRUVs and traps for sampling tropical continental 578 shelf demersal fishes. Fisheries Research, 125: 108-120. 579
Henry, G. W. & Lyle, J. M. (2003). The national recreational and indigenous fishing survey. FDRC 580 Project No 99/158, Tasmanian Aquaculture Fisheries Institute, Hobart. 581
Heupel, M. R., & Hueter, R. E. (2002). The importance of prey density in relation to the movement 582 patterns of juvenile sharks within a coastal nursery area. Marine and Freshwater Research, 53: 583 543–550. 584
Hilborn, R., Micheli, F., & De Leo, G. A. (2006). Integrating marine protected areas with catch 585 regulation. Canadian Journal of Fisheries and Aquatic Sciences, 63: 642-649. 586
Hughes, T. P., Graham, N. A., Jackson, J. B., Mumby, P. J., & Steneck, R. S. (2010). Rising to the 587 challenge of sustaining coral reef resilience. Trends in ecology & evolution, 25(11): 633-642. 588
Jeppesen, E., Meerhoff, M., Holmgren, K., González-Bergonzoni, I., Teixeira-de Mello, F., 589 Declerck, S. A., Meester, L. D., Søndergaard, M., Lauridsen, T. L., Bjerring, R., Conde-Porcuna, J. 590 M., Mazzeo, N., Reizenstein, M., Malmquist, H.J., Liu, Z., Balayla, D., & Lazzaro, X. (2010). 591 Impacts of climate warming on lake fish community structure and potential effects on ecosystem 592 function. Hydrobiologia, 646: 73-90. 593
Kilfoil, J.P., Wirsing, A.J., Campbell, M.D., Kiszka, J.J., Gastrich, K.R., Heithaus, M.R., & Zhang, 594 Y., Bond, M.E., (2017). Baited remote underwater video surveys undercount sharks at high 595 densities: insights from full-spherical camera technologies. Marine Ecology Progress Series, 585: 596 113-121. 597
Kingsford, M. J., Underwood, A. J., & Kennelly, S. J. (1991). Humans as predators on rocky reefs 598 in New South Wales, Australia. Marine Ecology Progress Series, 1-14. 599
Kohler, N. E., Casey, J. G., & Turner, P. A. (1998). NMFS cooperative shark tagging program, 600 1962-93: an atlas of shark tag and recapture data. Marine Fisheries Review, 60(2): 1-1. 601
Kulbicki, M. 1998. How the acquired behavior of commercial reef fishes may influence the results 602 obtained from visual censuses. Journal of Experimental Marine Biology and Ecology, 222: 11-30. 603

20
Lindfield, S. J., Harvey, E. S., McIlwain, J. L., & Halford, A. R. (2014). Silent fish surveys: bubble‐604 free diving highlights inaccuracies associated with SCUBA‐based surveys in heavily fished areas. 605 Methods in Ecology and Evolution, 5(10): 1061-1069. 606
Lubchenco, J., & Grorud-Colvert, K. (2015). Making waves: The science and politics of ocean 607 protection. Science, 350(6259): 382-383. 608
Malcolm, H. A., Gladstone, W., Lindfield, S., Wraith, J., & Lynch, T. P. (2007). Spatial and 609 temporal variation in reef fish assemblages of marine parks in New South Wales, Australia—baited 610 video observations. Marine Ecology Progress Series, 350: 277-290. 611
Medley, P. A., Gaudian, G., & Wells, S. (1993). Coral reef fisheries stock assessment. Reviews in 612 Fish Biology and Fisheries, 3: 242–285. 613
Micheli, F., Halpern, B.S., Botsford, L.W., & Warner, R.R. (2004). Trajectories and correlates of 614 community change in no-take marine reserves. Ecology Applied, 14: 1709–1723. 615
Murphy, H.M., & Jenkins, G.P. (2010). Observational methods used in marine spatial monitoring of 616 fishes and associated habitats: a review. Marine and Freshwater Research, 61: 236-252. 617
Pauly, D., Christensen, V., Guénette, S., Pitcher, T. J., Sumaila, U. R., Walters, C. J., ... & Zeller, D. 618 (2002). Towards sustainability in world fisheries. Nature, 418(6898) : 689. 619
Petit, I. J., Campoy, A. N., Hevia, M. J., Gaymer, C. F., & Squeo, F. A. (2018). Protected areas in 620 Chile: are we managing them?. Revista Chilena de Historia Natural, 91(1): 1. 621
Pita, P., Fernández-Márquez, D., & Freire, J. (2014). Short-term performance of three underwater 622 sampling techniques for assessing differences in the absolute abundances and in the inventories of 623 the coastal fish communities of the Northeast Atlantic Ocean. Marine and Freshwater Research, 624 65: 105-113. 625
Priede, I.G., Bagley, P.M., Smith, A., Creasey, S., & Merrett, N.R. (1994). Scavenging deep 626 demersal fishes of the Porcupine Seabight, Northeast Atlantic — observations by baited camera, 627 trap and trawl. Journal of the Marine Biological Association of the UK, 74: 481–498. 628
Randall, J. E., & Cea, A. 2010. Shore fishes of Easter Island. University of Hawaiʻi Press. 629
Roberts, C.M., Bohnsack, J.A., Gell, F., Hawkins, J.P., & Goodridge, R. (2001). Effects of marine 630 reserves on adjacent fisheries. Science, 294: 1920–1923. 631
Samoilys, M. A., & Carlos, G. (2000). Determining methods of underwater visual census for 632 estimating the abundance of coral reef fishes. Environmental Biology of Fishes, 57: 289–304. 633
Santana-Garcon, J., Newman, S. J., Langlois, T. J., & Harvey, E. S. (2014a). Effects of a spatial 634 closure on highly mobile fish species: an assessment using pelagic stereo-BRUVS. Journal of 635 Experimental Marine Biology and Ecology, 460: 153-161. 636
Santana‐Garcon, J., Braccini, M., Langlois, T. J., Newman, S. J., McAuley, R. B., & Harvey, E. S. 637 (2014b). Calibration of pelagic stereo‐BRUVs and scientific longline surveys for sampling sharks. 638 Methods in Ecology and Evolution, 5: 824-833. 639

21
Schlosser, I. J. (1990). Environmental variation, life history attributes, and community structure in 640 stream fishes: implications for environmental management and assessment. Environmental 641 Management, 14: 621-628. 642
Shears, N.T. & Babcock, R.C. (2002). Marine reserves demonstrate top-down control of community 643 structure on temperate reefs. Oecologia, 132: 131-142. 644
Simpfendorfer, C. A., & Milward, N. E. (1993). Utilization of a tropical bay as a nursery area by 645 sharks of the families Carcharhinidae and Sphyrnidae. Environmental Biology of Fishes, 37: 337–646 45. 647
Skomal, G. (2007). Evaluating the physiological and physical consequences of capture on post 648 release survivorship in large pelagic fishes. Fishing and Managing Ecology, 14: 81–89 649
Springer, S. (1967). Social organisation of shark populations. pp. 149-174. In: Gilbert, RF. 650 Mathewson & D.P Rall (ed.) Sharks, Skates and Rays, John Hopkins University Press, Baltimore. 651
Stanley, D. R., & Wilson, C. A. (1995). Effect of SCUBA divers on fish density and target strength 652 estimates from stationary dual-beam hydroacoustics. Transactions of the American Fisheries 653 Society, 124(6): 946-949. 654
Stevens, J. D., Bonfil, R., Dulvy, N. K., & Walker, P. A. (2000). The effects of fishing on sharks, 655 rays, and chimaeras (chondrichthyans), and the implications for marine ecosystems. ICES Journal 656 of Marine Science: Journal du Conseil, 57: 476-494. 657
Stobart, B., García-Charton, J. A., Espejo, C., Rochel, E., Goñi, R., Reñones, O., ... & Planes, S. 658 (2007). A baited underwater video technique to assess shallow-water Mediterranean fish 659 assemblages: Methodological evaluation. Journal of Experimental Marine Biology and Ecology, 660 345(2), 158-174. 661
Tickler, D.M., Letessier, T.B., Koldewey, H.J., & Meeuwig, J.J. (2017). Drivers of abundance and 662 spatial distribution of reef-associated sharks in an isolated atoll reef system. PLoS ONE, 12: 663 e0177374 664
Thompson, A. A., & Mapstone, B. D. (1997). Observer effects and training in underwater visual 665 surveys of reef fishes. Marine Ecology Progress Series, 53-63. 666
Thorson, J.T., & Simpfendorfer, C.A. (2009). Gear selectivity and sample size effects on growth 667 curve selection in shark age and growth studies. Fisheries Research, 98: 75-84. 668
Watson, D. L., Harvey, E. S., Anderson, M. J., & Kendrick, G. A. (2005). A comparison of 669 temperate reef fish assemblages recorded by three underwater stereo-video techniques. Marine 670 Biology, 148: 415–425. 671
Westera, M., Lavery, P., & Hyndes, G. (2003). Differences in recreationally targeted fishes between 672 protected and fished areas of a coral reef marine park. Journal of Experimental Marine Biology and 673 Ecology, 294(2): 145-168. 674
Wetherbee, B. M., Crow, G. L., & Lowe, C. G. (1996). Biology of the Galapagos shark, 675 Carcharhinus galapagensis, in Hawai'i. Environmental Biology of Fishes, 45(3): 299-310. 676
22
Willis, T. J., & Babcock, R. C. (2000). A baited underwater video system for the determination of 677 relative density of carnivorous reef fish. Marine and Freshwater research, 51(8), 755-763. 678
Willis, T. J., Millar, R. B., & Babcock, R. C. (2003). Protection of exploited fish in temperate 679 regions: high density and biomass of snapper Pagrus auratus (Sparidae) in northern New Zealand 680 marine reserves. Journal of Applied Ecology, 40(2): 214-227. 681
Worm, B., Barbier, E. B., Beaumont, N., Duffy, J. E., Folke, C., Halpern, B. S., ... & Sala, E. 682 (2006). Impacts of biodiversity loss on ocean ecosystem services. Science, 314(5800): 787-790. 683
Zylich, K., Harper, S., Licandeo, R., Vega, R., Zeller, D., & Pauly, D. (2014). Fishing at Easter 684 Island, a recent history (1950-2010). Latin American Journal of Aquatic Research, 42: 685 845-856. 686 687 688
689
23
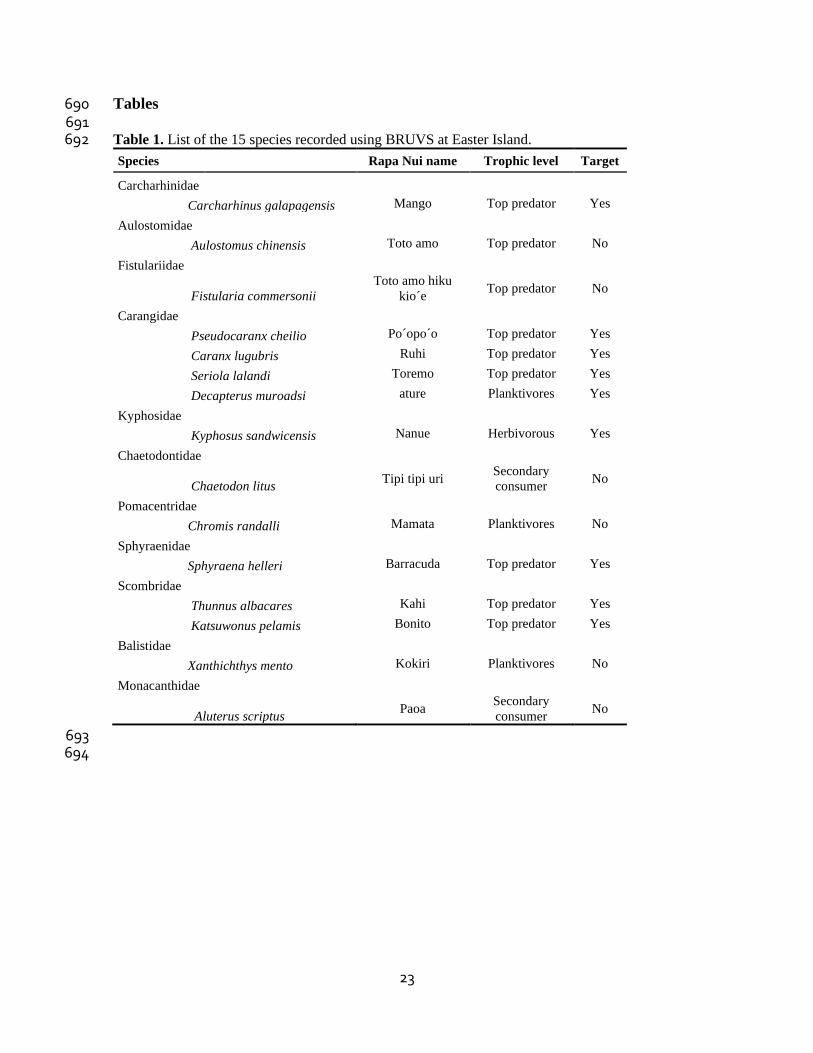
Tables 690 691 Table 1. List of the 15 species recorded using BRUVS at Easter Island. 692
Species Rapa Nui name Trophic level Target
Carcharhinidae
Carcharhinus galapagensis Mango Top predator Yes
Aulostomidae
Aulostomus chinensis Toto amo Top predator No
Fistulariidae
Fistularia commersonii
Toto amo hiku
kio´e Top predator No
Carangidae
Pseudocaranx cheilio Po´opo´o Top predator Yes
Caranx lugubris Ruhi Top predator Yes
Seriola lalandi Toremo Top predator Yes
Decapterus muroadsi ature Planktivores Yes
Kyphosidae
Kyphosus sandwicensis Nanue Herbivorous Yes
Chaetodontidae
Chaetodon litus Tipi tipi uri
Secondary
consumer No
Pomacentridae
Chromis randalli Mamata Planktivores No
Sphyraenidae
Sphyraena helleri Barracuda Top predator Yes
Scombridae
Thunnus albacares Kahi Top predator Yes
Katsuwonus pelamis Bonito Top predator Yes
Balistidae
Xanthichthys mento Kokiri Planktivores No
Monacanthidae
Aluterus scriptus Paoa
Secondary
consumer No
693 694
24
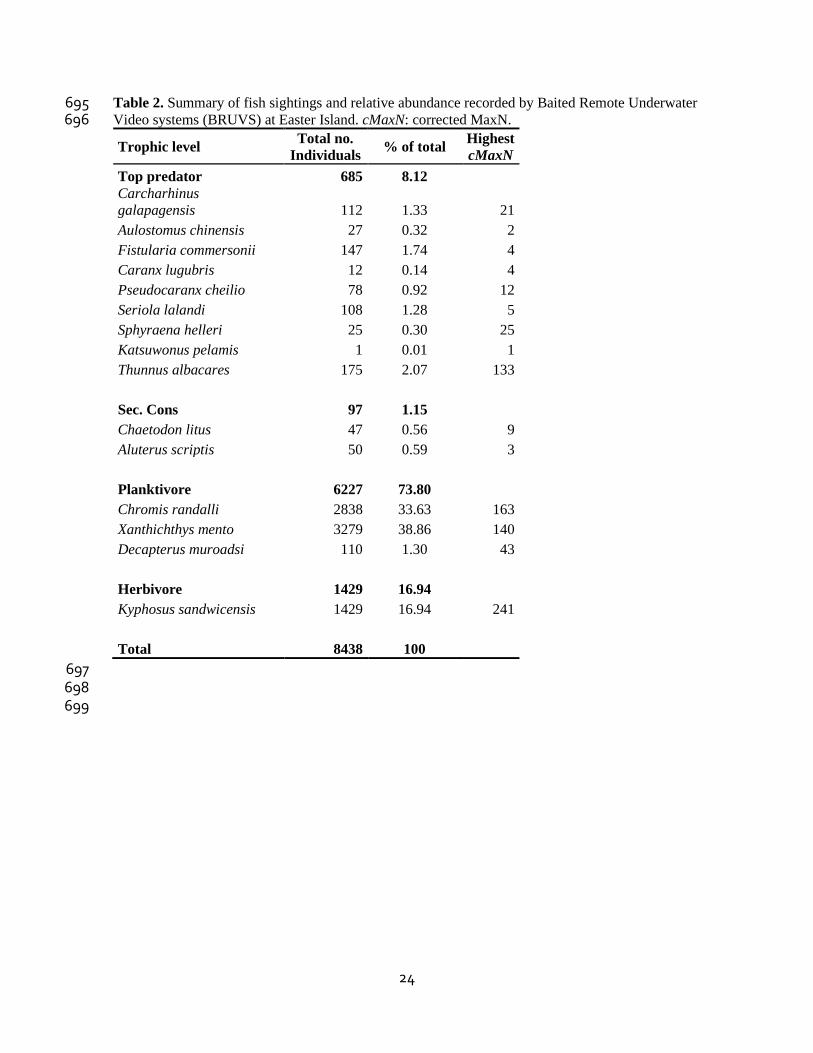
Table 2. Summary of fish sightings and relative abundance recorded by Baited Remote Underwater 695 Video systems (BRUVS) at Easter Island. cMaxN: corrected MaxN. 696
Trophic level Total no.
Individuals % of total
Highest
cMaxN
Top predator 685 8.12 Carcharhinus
galapagensis 112 1.33 21
Aulostomus chinensis 27 0.32 2
Fistularia commersonii 147 1.74 4
Caranx lugubris 12 0.14 4
Pseudocaranx cheilio 78 0.92 12
Seriola lalandi 108 1.28 5
Sphyraena helleri 25 0.30 25
Katsuwonus pelamis 1 0.01 1
Thunnus albacares 175 2.07 133
Sec. Cons 97 1.15 Chaetodon litus 47 0.56 9
Aluterus scriptis 50 0.59 3
Planktivore 6227 73.80 Chromis randalli 2838 33.63 163
Xanthichthys mento 3279 38.86 140
Decapterus muroadsi 110 1.30 43
Herbivore 1429 16.94 Kyphosus sandwicensis 1429 16.94 241
Total 8438 100
697 698 699
25
Figure legend 700
Figure 1. (a) Map of Easter Island and Salas y Gómez Island in relation to South America. Dark lines 701 represent the exclusive economic zone. (b) Sampling locations around Easter Island for seasonal 702 variability (yellow dots). Purple dots represent the 3 extra sites used for assessing spatial variability 703 during summer and autumn. 704 705 Figure 2. Canonical analysis of principal coordinates (CAP) ordination of the variation in fish 706 assemblage among (a) sites and (c) seasons. (b) and (d) CAP loadings shown graphically. 707
708 709
26
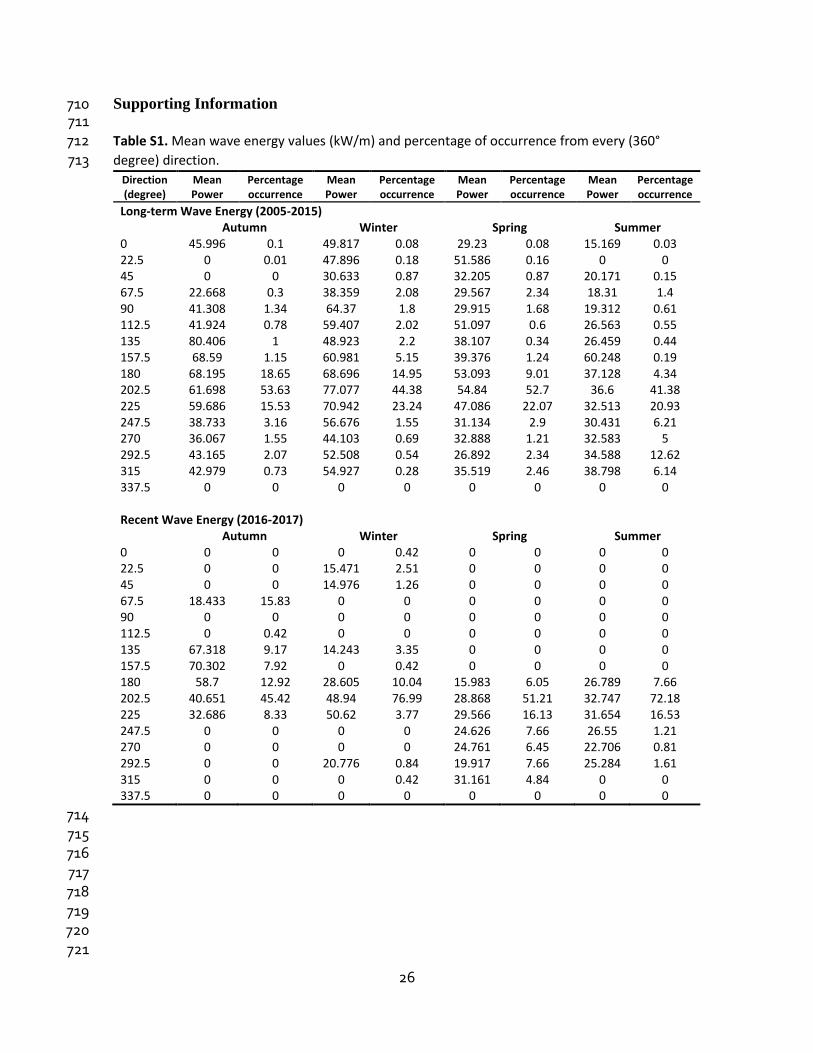
Supporting Information 710 711 Table S1. Mean wave energy values (kW/m) and percentage of occurrence from every (360° 712 degree) direction. 713
Direction (degree)
Mean Power
Percentage occurrence
Mean Power
Percentage occurrence
Mean Power
Percentage occurrence
Mean Power
Percentage occurrence
Long-term Wave Energy (2005-2015) Autumn Winter Spring Summer 0 45.996 0.1 49.817 0.08 29.23 0.08 15.169 0.03 22.5 0 0.01 47.896 0.18 51.586 0.16 0 0 45 0 0 30.633 0.87 32.205 0.87 20.171 0.15 67.5 22.668 0.3 38.359 2.08 29.567 2.34 18.31 1.4 90 41.308 1.34 64.37 1.8 29.915 1.68 19.312 0.61 112.5 41.924 0.78 59.407 2.02 51.097 0.6 26.563 0.55 135 80.406 1 48.923 2.2 38.107 0.34 26.459 0.44 157.5 68.59 1.15 60.981 5.15 39.376 1.24 60.248 0.19 180 68.195 18.65 68.696 14.95 53.093 9.01 37.128 4.34 202.5 61.698 53.63 77.077 44.38 54.84 52.7 36.6 41.38 225 59.686 15.53 70.942 23.24 47.086 22.07 32.513 20.93 247.5 38.733 3.16 56.676 1.55 31.134 2.9 30.431 6.21 270 36.067 1.55 44.103 0.69 32.888 1.21 32.583 5 292.5 43.165 2.07 52.508 0.54 26.892 2.34 34.588 12.62 315 42.979 0.73 54.927 0.28 35.519 2.46 38.798 6.14 337.5 0 0 0 0 0 0 0 0 Recent Wave Energy (2016-2017)
Autumn Winter Spring Summer 0 0 0 0 0.42 0 0 0 0 22.5 0 0 15.471 2.51 0 0 0 0 45 0 0 14.976 1.26 0 0 0 0 67.5 18.433 15.83 0 0 0 0 0 0 90 0 0 0 0 0 0 0 0 112.5 0 0.42 0 0 0 0 0 0 135 67.318 9.17 14.243 3.35 0 0 0 0 157.5 70.302 7.92 0 0.42 0 0 0 0 180 58.7 12.92 28.605 10.04 15.983 6.05 26.789 7.66 202.5 40.651 45.42 48.94 76.99 28.868 51.21 32.747 72.18 225 32.686 8.33 50.62 3.77 29.566 16.13 31.654 16.53 247.5 0 0 0 0 24.626 7.66 26.55 1.21 270 0 0 0 0 24.761 6.45 22.706 0.81 292.5 0 0 20.776 0.84 19.917 7.66 25.284 1.61 315 0 0 0 0.42 31.161 4.84 0 0 337.5 0 0 0 0 0 0 0 0
714 715 716 717 718 719 720 721

27
722 Table S2. Environmental variables used in the DistaLM analysis for every site and season. 723
Season/ Site Temperature (°C)
Historical wave energy (kW/m)
Specific wave energy (kW/m)
Distance from shore (m)
Shelf width (m)
Winter Ana hukahu - - - - - Ovahe 20.669 30.633 14.976 392.875 250 Omohi - - - - - Kari Kari 20.69 56.676 0 324.25 250 Motu tautara 19.285 44.103 20.776 202.5 0 Poike 22.668 18.433 395.5 250 Vaihu 20 60.981 28.605 463.75 1000 Vinapu 20 77.077 48.94 311.75 750 Spring Ana hukahu - - - - - Ovahe 23.746 32.205 0 392.875 250 Omohi - - - - - Kari Kari 23.463 31.134 24.626 324.25 250 Motu tautara 23.149 32.888 19.917 202.5 0 Poike - - - - - Vaihu 22 39.376 15.963 463.75 1000 Vinapu 22 54.84 28.868 311.75 750 Summer Ana hukahu 26 26.563 0 386.5 1000 Ovahe 26.758 20.171 0 392.875 250 Omohi 26.247 38.798 0 255.25 0 Kari Kari 26.59 30.431 26.55 324.25 250 Motu tautara 26.38 32.583 25.284 202.5 0 Poike 26.43 18.31 0 395.5 250 Vaihu 26 60.248 26.789 463.75 1000 Vinapu 26 36.6 32.747 311.75 750 Autumn Ana hukahu 22.683 0 0 392.875 250 Ovahe 22.708 42.979 0 255.25 0 Omohi 22.84 38.733 0 324.25 250 Kari Kari 22.773 36.067 0 202.5 0 Motu tautara 22 22.668 18.433 395.5 250 Poike 22 68.59 58.7 463.75 1000 Vaihu 22 61.698 40.651 311.75 750 Vinapu 22 41.924 67.318 386.5 1000
724 725 726

28
Table S3. PERMANOVA test for all the pelagic fish species. Figures in bold indicate significant 727 results. 728
Level Type Pseudo-F P(perm) Unique perms
MAIN TEST Site 5 Fixed 4.9648 0.0001 9943 Season 4 Fixed 8.274 0.0001 9924 Season x Site 1.3362 0.0881 9887 PAIR-WISE TEST Sites Ovahe. Kari Kari 0.1441 9964 Ovahe. Motu Tautara 0.0978 9977 Ovahe. Vaihu 0.0001 9951 Ovahe. Vinapu 0.0158 9956 Kari Kari. Motu Tautara 0.2019 9947 Kari Kari. Vaihu 0.0001 9948 Kari Kari. Vinapu 0.0047 9956 Motu Tautara. Vaihu 0.0001 9956 Motu Tautara. Vinapu 0.0005 9954 Vaihu. Vinapu 0.001 9943 Season Autumn. Spring 0.4036 9960 Autumn. Summer 0.1654 9954 Autumn. Winter 0.0001 9956 Spring. Summer 0.1402 9952 Spring. Winter 0.0001 9945 Summer. Winter 0.0001 9965
729
730
Table S4. DistaLM test for all the pelagic fish species. Figures in bold indicate significant results. 731
Variable SS(trace) Pseudo-F P Prop.
Site Temperature (ºC) 913.69 1.9302 0.085 0.12117 Historical WE (kW/m) 1008.9 2.1624 0.052 0.13379 Specific WE (kW/m) 1162.3 2.5512 0.032 0.15414 Distance from shore (m) 1093.5 2.3746 0.043 0.14502 Shelf width (m) 2004.5 5.0691 0.001 0.26583 Season Temperature (ºC) 639.58 1.1143 0.3476 0.058295 Historical WE (kW/m) 1887 3.7986 0.0308 0.17199 Specific WE (kW/m) 462.36 0.92675 0.437 0.042142
732