Embed Size (px)
Citation preview

AbstractSpatial and temporal evaluation of current seismic activity throughout the Vlora- Lushnja-Elbasani-Dibra (VLED) transversal fault
zone were carried out at the beginning of year 2016. The seismotectonic b-value, fractal dimension Dc-value and precursory seis-mic quiescence Z-value are considered for a detailed statistical analysis. Completeness magnitude Mc-value varies from 2.5 to 2.7 for different parts of the VLED fault zone. The b-value is calculated as 1.10±0.04 for the south western part and 1.13±0.05 for the middle part, whereas it is estimated as 0.94±0.07 for the north eastern part of the study region. These results reveal that b-values for all regions are well represented by a b-value typically close to 1.0. There are clear decreasing trends in temporal changes of b-values before the occurrences of some strong main shocks. On the contrary, no earthquakes are observed in some periods after decrease of b-value. Dc-values are computed as 2.66±0.04 for the south western part, 2.64±0.03 for the middle part and 2.15±0.02 for the north eastern part of the VLED fault zone. These rather large values show that earthquake activity is more clustered at lar-ger scales or in smaller areas in the study area.
Considering the phenomenon of seismic quiescence as a precursor of the main earthquakes gives successful outcomes in defining the potential anomalies and possible locations of future earthquakes. Quiescence analysis of current seismicity at the beginning of 2016 in the VLED fault zone is performed with the test of standard normal deviate Z-value. Distributions of resulting Z-values show six anomalous regions along the different parts of the VLED fault zone. These quiescence areas are detected at (i) 40.81ºN-19.86ºE (including Kuc-Bubullim, southeast of Lushnja town), (ii) 41.00ºN-20.01ºE (in the Cerriku, south of Elbasani town), (iii) 41.31ºN-20.13ºE (around Bene-Qafe, northeast of Elbasani town), (iv) 41.43ºN-20.21ºE (Krasta-Batra, south of Bulqiza town), (v) 41.28ºN-20.49ºE (including Carrishta-Stebleve, northeast of Librazhdi town), (vi) 41.51ºN-20.51ºE (including Qerrenec-Gjorica, west of Dibra town). As an important result, analyses of spatial and temporal characteristics of the earthquake activity may supply sig-nificant clues for revealing the future seismic hazard along the VLED fault zone, and these anomaly regions may be interpreted as the locations of next possible earthquakes.
_____________________________________________________________________
________________________________________________________________________
1. IntroductionThere exist a lot of regional and temporal studies on the
space-time characteristics of earthquake activity for different parts of the world, and many authors obtained important out-comes and conclusions by using scaling laws (e.g., Utsu, 1971; Mandelbrot, 1982; Habermann, 1983; Hirata, 1989; Frohlich and Davis, 1993; Wiemer and Wyss, 2000; Awad, 2005; Öztürk et al., 2008; Öncel and Wilson, 2007; Roy et al., 2011; Öztürk, 2011; 2015; Ali, 2016). The Albania region is seismically active with tens of destructive large earthquakes over the past twen-ty centuries as revealed from the historical sources (Sulstarova et al., 1980; Ormeni, 2010). Albania is located at the Alpine-Mediterranean seismic belt and accommodates part of the deformation due to the collision of the Adriatic microplate with the Eurasian plate (Mazzoli and Helman, 1994). The main reason of seismicity in Albania is the collision of the Adriatic microplate forming the Albanian orogen. This continental col-lision directly influences the inner part of the country, along longitudinal and transverse faults cutting across the eastern
and the north-eastern part of Albania (Aliaj et al., 2001; Or-meni et al., 2013).
The Vlora-Lushnja-Elbasani-Dibra (VLED) transversal fault zone in Albania is a major tectonic feature with a well-defi-ned fault trace and an established history of seismicity. Major
thearthquake activity of the VLED fault zone during the 20 century began with the destructive Peshkopia earthquake in 1920 in northeast Albania and migrated westwards by a series of destructive earthquakes in 1921, 1930, 1935, 1942, 1959, 1962, 1967, 1982, 2009, 2014 and 2015 (Sulstarova et al., 1980; Aliaj et al., 2001; Ormeni, 2015). Current tectonics of Albania is represented by a significant micro-seismicity, small and medi-um-sized events and a few large earthquakes as given by the occurrence of six main shocks with Ms magnitudes exceeding 6.0 throughout the last century (Kociaj, 1986): June 1, 1905 Shkodra earthquakes (Ms=6.6), February 18, 1911 Ohrid Lake earthquake (Ms=6.7), November 26, 1920 Tepelena earthquake (Ms=6.4), December 17, 1926 Durres earthquake (Ms=6.2),
____________________________________
Austrian Journal of Earth Sciences Vienna xxx - xxx DOI: 10.17738/ajes.2017.0015
Spatial and temporal analysis of recent seismicity in different parts of the Vlora-Lushnja-Elbasani-Dibra Transversal Fault Zone, Albania
1) Institute of Geosciences, Energy, Water and Enivornment Polytechnic University, Tirana, Albania;2) Gümüşhane University, Department of Geophysics, TR-29100, Gümüşhane, Turkey;3) Polytechnic University, Tirana, “Nene Tereza” square, Albania;4) Gümüşhane University, Department of Geomatics Engineering, TR-29100, Gümüşhane, Turkey;*) Corresponding author, [email protected]
Albania; Vlora-Lushnja-Elbasani-Dibra Fault Zone; b-value; fractal dimension; precursory seismic quiescence; earthquake potentialKEYWORDS
2017 Volume 110/2
1) 2)*) 3) 4)Rrapo ORMENI , Serkan ÖZTÜRK , Akli FUNDO & Kemal ÇELIK

Figure 1: Schematic tectonic structure of Albania and seismic source zones in the VLED Transversal Fault Zone. Zones are marked: 1- (Vlora-Lushnje) South western part of VLED, 2- (Elbasani) Middle part of VLED, 3- (Dibra) North eastern part of VLED. Names of tectonic structures: Vlora and Lushnja flexure (VLF), Dumrea diapire dome (DDD), Elbasani Quaternary depression (EQD), Labinoti transversal structure (LTS), marked by important Quater-nary infill (Melo, 1986), Golloborda transversal horst (GTH) continues toward the Tetova Quaternary Graben (TQG).____________________________
Rrapo ORMENI, Serkan ÖZTÜRK, Akli FUNDO & Kemal ÇELIK

Spatial and temporal analysis of recent seismicity in different parts of the Vlora-Lushnja-Elbasani-Dibra Transversal Fault Zone, Albania
November 30, 1967 Dibra earthquake (Ms=6.6) and April 15, 1979 Montenegro earthquake (Ms=6.9). In recent years, how-ever, three strong earthquakes occurred along the VLED fault zone: September 6, 2009 (M =5.4), the Gjorica earthquake L
which occurred in the eastern Albania - the former Yugoslav Republic of Macedonia (FYROM) border, May 19, 2014 (M =5.2), L
the Cerrik earthquake which was near Elbasan, and November 1, 2015 (M =5.0), the Bulqize earthquake which is located 34 km L
east of the capital city Tirana (Ormeni et al., 2013).In the scope of this study, we analyzed the spatial and tem-
poral behaviors of the earthquakes along the VLED fault zone in order to evaluate the seismic hazard potential at the be-ginning of year 2016. From this point of view, the present work is focused on the imaging of size-scaling distributions such as regional, temporal and magnitude distribution of earthquake activity, completeness magnitude, Mc-value, seis-motectonic b-value and its variations with time, fractal dimen-sion Dc-value, precursory seismic quiescence Z-value and GENAS which estimates the cumulative numbers for different magnitude levels. ZMAP analysis software (Wiemer, 2001) was used for all statistical estimations and for all histograms of regional, temporal and magnitude distribution along the VLED fault zone.
2. Geologic and tectonic Structures in and around Albania
The principal geological structures observed in and around Albania are called the Albanides and they form a part of the Dinaric-Albanid-Hellenic arc of the Alpine orogen. The Albani-des are located between Hellenides in the south and the Di-narides in the north, which together form the Dinaric branch
_________
_____________________________________
of the Mediterranean Alpine Belt, limited by the Apulia-Gar-gano foreland in the west. The Albanides comprise sedimen-tary and magmatic rocks of Ordovician to Quaternary age (Aliaj et al., 2001). The Albanian orogen and its vicinity are divided into two active tectonic areas (Ormeni et al., 2013): (i) an external compressional field, constituting the Adriatic col-lision zone (Outer Albanides), and (ii) an internal extensional field (Inner Albanides). In Albania, the Adriatic microplate col-lides with the Eurasian plate throughout a series of thrusts, with the Albanian orogenic front overthrusting the Adriatic microplate, partially over the Apulian platform and partially over the Albanian Basin (southern Adriatic basin).
The VLED fault zone (Fig. 1), striking north-east, dislocates the structure of the Albanides along their entire width (Sul-starova et al, 1980; Sulstarova et al., 2000). It is expressed by the Vlora and Lushnja flexures, the Dumrea diapire dome, the Elbasani Quaternary depression, the Labinoti transversal structure, and marked by significant Quaternary infill (Melo, 1986). The Golloborda transversal horst continues toward the Tetova Quaternary Graben in FYROM (Sulstarova et al., 2000). From the geological and tectonic point of view, the region is a part of the Krasta tectonic sub-zone, which includes an area of Alpine folding. The Krasta sub-tectonic zone has been de-formed by folds, normal faults, and strike-slip faults from movement of the main Alpine orogenic phases (Ormeni et al., 2013). The Okshtuni and Dibra tectonic structures are the north and south parts of the VLED fault zone, respectively. The VLED fault zone shows NE trending nearly 100 km in Al-banian region. It is composed of fragmentary normal faults cutting across the Krasta zone and dividing the Mirdita ophio-lites zone in two main segments (Aliaj et al., 2001; Ormeni et
__________
al., 2013). They represent deep faults that have played an im-portant role in the development and structuring of the Albani-des (Sulstarova et al., 2000; for details on geologic, tectonic or neotectonic processes in and around Albania see Ormeni et al., 2013).
Based on the analysis of the focal mechanisms of moderate and strong earthquakes, the VLED fault zone plays an im-portant role in the seismotec-tonics of Albania, as well as of the FYROM. The analysis of the focal mechanisms indicates the predominance of normal faul-ting with a strike-slip compo-nent, and NNW-SSE extension in eastern Albania, in response to the convergence between the Adriatic microplate and the Albanian orogen. The VLED fault
__________________
thFigure 2: a) Epicenter distributions of earthquakes in and around the VLED fault zone during the 20 century (between 1900 and 2016), b) Seismotectonic subregions and the epicenter distributions of all earthquakes with MD 1.7 and depth<70 km in the VLED fault zone from1967 to 2016. The size of earth-quakes is represented by different symbols.
>___________________________________________________

rated in the shallow upper crust (Ormeni, 2007, 2010).
4. Definition of analysis methodsIn this study, statistical analyses of seismic activity are limi-
ted to shallow earthquakes with depths less than 70 km be-cause it is generally assumed that the seismogenic layer is about this depth for different parts of the world. As mentio-ned above, the solutions of focal mechanism in the study re-gion in fact show that earthquake activity is principally pro-duced in the shallow upper crust (Ormeni, 2007, 2010, 2013). Also, some seismicity analyses including the studies of pre-cursory seismic quiescence give significant results for crustal main events in revealing the possible earthquake hazard in a given region. In order to put forth the behaviours of the earth-quake activity in the VLED fault zone, a number of statistical
______
Figure 3: Graphical display of how to calculate Z-value. is the be-ginning time and te is the ending time of the catalogue. The Z-value is calculated for all times t between t and te to T and is statistically appropriate for estimating seismicity rate change in a time window T in contrast with background seismicity. T is the time window W W
length in year and t is the current time between t and t .0 e
t
0 W
0
__________
Date30/11/19672/12/19672/3/197617/3/19896/9/20099/7/201019/5/20141/11/20151/11/2015
Origin Time7:23:49.00
12:44:41.0019:41:37.000:50:51.00
21:49:41.0022:15:18.000:59:18.006:26:17.006:27 :5.00
Latitude20.4320.2019.6019.9820.4620.0419.9220.2520.23
Longitude41.3541.2440.6841.2541.4941.1740.9341.3641.35
Depth (km)11
2717
24182
18
Subregion321232233
PlaceDiber
ElbasanFier
KerrabeDiber
ElbasanCerrik
BulqizeBulqize
MD
6.74.74.94.65.44.65.25.04.8
M
Table 1: Detailed information of earthquakes which occurred in the Vlora-Lushnja-Elbasani-Dibra Trans-versal Fault Zone with magnitude 4.7 M 6.7 from 1967 to 2015.D< < ________________________________
1. The depths of earthquakes analyzed in this work is limited to shallow earthquakes less than 70 km because these types of seismicity analyses for future seismic hazard, especially in de-tecting the precursory quiescen-ce anomalies, have provided important outcomes related to the crustal main shocks. In ad-dition to this general approach, the analyses of focal depths re-veal that the seismicity in the study region was mainly gene-
zone have produced earthquakes in the past, and they are expected to continue to be active in the future. The studies in the past of moderate and strong earthquakes and their aftershocks have emphasized many geologic and seismotec-tonic characteristics of this area. As a result, these regions con-stitute a threat for nearby urban areas of Vlora, Fieri, Berati, Lushnja, Elbasani, Librazhdi, Bulqiza and Dibra towns in Al-bania, and FYROM.
During the past 95 years, many strong earthquakes occur-red in the VLED fault zone. The Elbasani segment has ruptu-red during earthquake occurred on December 18, 1920, (M 5.6), March 31, 1935 (M 5.7) and May 19, 2014 (M 5.2). The Dibra earthquake of November 30, 1967 (M 6.6) is one of the greatest earthquakes that occurred in Albania. The Dibra segment has occurred with the other earthquakes March 30, 1921 Peshkopia (M 5.8), August 27, 1942 Peshkopia (M 6.0), and September 6, 2009 Gjorica (M 5.4). The Lushnja-Fieri sec-tion have occurred with September 1, 1959 Lushnja (M 6.2), March 18, 1962 Fieri (M 6.0), November 16, 1982 Fieri (M 5.7) earthquakes. The earthquake that occurred in the Vlora seg-ment was on November 21, 1930 Qaf-Llogaras (M 6.0). Strong earthquakes that occurred in recent years in the VLED fault zone can be indicated as May 19, 2014 Cerrik (M=5.2) and November 1, 2015 Bulqize (M=5.0) earthquakes (Ormeni et al., 2013; Sulstarova and Kociaj, 1975; Sulstarova et al., 1980; 2000). Epicenter distributions of all earthquakes inside of the
thstudy region and mentioned above for the 20 century are plotted in Figure 2a.
3. Earthquake DataThe earthquake catalogue used in this study includes a to-
tal of 2814 earthquakes which occurred along the VLED fault zone. Magnitude type used for the statistical analyses is dura-tion magnitude, M . This catalogue is complete for all magni-D
tude levels and for all time periods between 1967 and 2016. Epicenters of all earthquakes with 1.7 M 6.7 and strong D
main shocks with M 5.0 are shown in Figure 2b. Also, a pic-D
ture of the distribution of the events with different magnitu-de sizes in Albania and the surrounding region are represen-ted with different symbols in the same figure. Some details for the earthquakes with magnitude M 4.5 are explained in TableD
___________________________________
__________________________________
< <>
>
Rrapo ORMENI, Serkan ÖZTÜRK, Akli FUNDO & Kemal ÇELIK

Spatial and temporal analysis of recent seismicity in different parts of the Vlora-Lushnja-Elbasani-Dibra Transversal Fault Zone, Albania
parameters are evaluated; histograms of time and magnitude distribution of earthquakes, regional and temporal distribu-tions of seismotectonic b-value of Gutenberg-Richter (G-R) re-lation, fractal dimension Dc-value, precursory seismic quie-scence Z-value, and GENAS model.
4.1 Seismotectonic -value (Gutenberg-Richter rela-tion) and importance of Completeness Magnitude,
-valueA power-law of size distribution of earthquakes is given by
Gutenberg and Richter (1944). This empirical relation between frequency of occurrence and magnitude of earthquakes is well described as follows
(1)
where N(M) is the cumulative number of events with magni-
______________________
b
Mc
______________________________
b
Mc
log N(M)=a-bM10
Figure 4: Cumulative number of earthquakes against time for the original and declustered earthquake catalogue for (a): the south western part (region 1), (b): the middle part (region 2), and (c): the north eastern part (region 3) of the VLED fault zone.____________
b =2.303
(M -M +0.05)mean min
tudes larger than or equal to M in a given time period, where-as a and b-values are constants. The a-value changes accor-ding to the earthquake activity level; fluctuations in a-value depend on the extend of the study region, time interval of observation, and also the number of earthquakes. The b-value is one of the most important arguments in terms of the seis-motectonic properties in a specific area, and it represents the frequency-magnitude distribution of earthquakes. Many stu-dies suggest that the b-value is a scale invariant, and it is re-lated to the distribution of earthquake epicenters and fault segments. A reduction in b-value may result from the decrease in the pressure and an increase of shear stress (Scholz, 1968). Many factors lead to differences of b-values: an increase in thermal gradient, fracture density, material heterogeneity, the number of small and large earthquakes, fault length, stress and strain conditions (Mogi, 1962). The maximum b-value of the frequency-magnitude distribution was estimated by Ols-son (1999) and the resulting maximum b-value was given as 1.5 (or with the error limits, between 1.30 and 1.64). However, it is suggested generally that the b-value fluctuates between 0.3 and 2.0 from region to region in different parts of the world (Utsu, 1971).
The selection of the regression model which is used in the estimation of the b-value is a sensitive and significant point. Although there are a number of methods to calculate the b-value, the best known and commonly used is the maximum likelihood model by Aki (1965). The b-value was generally determined graphically, but a more effective analysis is per-formed using the maximum likelihood method. It was deri-ved from the quality of the first order moment, and later Aki (1965) showed that the maximum likelihood estimate maxi-mizes the likelihood function. As a result, the b-value can be written as follow:
(2)
where M is the mean magnitude of the events, and M is mean min
the minimum magnitude in the catalogue. The coefficient of 0.05 is a correction constant. Local changes in M can be es-min
timated correctly if relatively large numbers (100 or so) of lo-cal measurements are available for analysis. Confidence limits of 95 % on the estimations of b-value are ±1.96 b/ n, where n is the number of earthquakes. This estimate gives the confi-dence limits of ±0.1-0.2 regarding the b-value for a charac-teristic sample of n=100 events. As a result, the number of earthquakes in this study is 487 for region 1, 1503 for region 2, and 824 for region 3. The value of n=100 earthquakes is an ordinary example for estimations and it represents a specific calculation.
In many studies related to the frequency-magnitude distri-bution and precursory seismic quiescence, the usage of the maximum number of earthquakes is very important for reli-able results. For this reason, the estimate of completeness magnitude, Mc-value, is one of the most significant process. Mc-value can be described as the minimum magnitude of
_________________________________________
____________________________________

on the distances between pairs of points. This correlation di-mension was called sphere counting and is among the most widely used. Using the two-point correlation dimension Dc, Grassberger and Procaccia (1983) defined the correlation di-mension Dc and the correlation sum C(r) as follows:
(3)
(4)
where C(r) is the correlation function, r is the distance be-tween two epicenters and N is the number of earthquakes pairs separated by a distance R<r. If the epicenter distribu-tions of events have a fractal structure, the next equation can be defined as follows:
(5)
________
_________________________________
Figure 5: Time histograms of the earthquake distributions for: (a) the south western part (region 1), (b): the middle part (region 2), and (c): the north eastern part (region 3) of the VLED fault zone.__________
complete reporting. In other words, the completeness mag-nitude is that magnitude above which all earthquakes which occur are reported (Habermann, 1983). It means that this mag-nitude level includes 90% of the earthquake data which can be sampled with a power law fit (Wiemer and Wyss, 2000). Mc-values show regional and temporal changes in different networks and catalogues. It is well known that the Mc-value shows a decrease with time since the number of seismographs increases and the techniques for Mc estimation improve. Small events may not be recorded since they fall within the coda of larger earthquakes and so, Mc-value will be larger in the early part of the catalogue. If large Mc-values are excluded from the catalogue, the minimum magnitude level can be lowered and the number of the earthquakes available for analyses can be increased. For the seismicity studies which depend on com-plete sets of small earthquakes, the minimum magnitude level in the calculations should be raised to the highest Mc-value. Temporal variations of Mc-value can be calculated rapidly and safely by evaluating the goodness of fit to a power law.
The assumption of Gutenberg Richter’s power-law distribu-tion against magnitude can be used to calculate the Mc-value. The variations of Mc-value as a function of time is provided by using a moving time window approach with the maximum likelihood method (for details see Wiemer and Wyss, 2000). Since the Mc-value will be larger in the early part of the cata-logue, temporal variations in this parameter may produce wrong seismicity estimations, particularly in b-value. Varia-tions in the Mc-value depend on the earthquake activity of the study region and the sensitivity of the stations. Conse-quently, the investigation of the precursory seismic quie-scence and estimation of the b-value are affected from the choice of Mc-value. For the temporal changes of the magni-tude-frequency distribution of earthquakes and for the re-gional variability of seismic quiescence, the knowledge of temporal changes in Mc-values is necessary. As an important precondition, the estimations of the Mc-value for different parts of the VLED fault zone are made with great care since this type of completeness analysis has a great importance for all statistical calculations in this study.
4.2 Fractal dimension (Correlation Dimension, -value)
Fractal dimension is a real number and measures the geo-metry of a distribution and most likely changes with space and time. Fractal studies are commonly preferred to analyze the clustering properties and size-scaling characteristics of earthquake parameters, assuming that earthquake distribu-tions are fractal. Fractal studies define the self-similarity of a geometrical object. A further generalization leads to the cor-relation dimension Dc which is not based on a covering of the regarded set, but on the distances between pairs of points of the set (Goltz, 1998). Fractal distributions are the only distri-butions which do not include a typical length scale, and so, can be practicable to scale invariant phenomena. Grassber-ger and Procaccia (1983) presented an analysis model based
_
___________________
DcDc
Dc=lim [log C(r)/log r]0r->
C(r)=2N /N(N-1)R<r
C(r)~r Dc
Rrapo ORMENI, Serkan ÖZTÜRK, Akli FUNDO & Kemal ÇELIK

where Dc is a fractal dimension, more generally, the corre-lation dimension. The distance r (in degrees) between two earthquakes can be computed from:
(6)
thwhere (θ ,Φ ) are the latitudes of i events and ( , ) are the longitudes of the jth events (Hirata, 1989). Fractal dimension is described by fitting a straight line to a plot of log C(r) against log r. C(r) is not affected by the lack of points outside the clus-ter if r is small. Therefore, C(r) increases quickly with r, and the Dc-value will be large. Hence, strong clustering would corres-pond to an increase in Dc-value if a scaling range using small values of r is used to estimate Dc-value. The rate at which C(r) rises with r decreases, and Dc-value will be small when r comes
____________________
i i j jθ Φ
Spatial and temporal analysis of recent seismicity in different parts of the Vlora-Lushnja-Elbasani-Dibra Transversal Fault Zone, Albania
Figure 6: Histograms of MD magnitudes of the earthquake distribu-tions for: (a) the south western part (region 1), (b): the middle part (region 2), and (c): the north eastern part (region 3) of the VLED fault zone.
close to the diameter of the cluster. If a scaling range using high values of r is used to estimate the Dc-value, strong clus-tering would correspond to a decrease in r. Depending on the range of r chosen, this means that a dense cluster of points can yield both great and small Dc-values. In practice, fractal systems in nature are self-similar over a finite range, so Dc-value must be estimated from a range which is not sensitive to the finiteness of the set.
The nature of spatial and temporal fractal characteristics of the events is qualified by fractal, especially by the correlation dimension (Kagan, 2007). Distributions of earthquakes comply with the fractal statistics and so, earthquakes can be qualified by fractal dimension. Fractal dimension may be estimated in order to avoid the probable unbroken fields, and these unbro-ken areas are proposed as potential seismic gaps to be broken next (Toksöz et al., 1979). This means that changes in fractal characteristics are mainly related to the complexity or quan-titative measure of the heterogeneity degree of the earth-quake activity on the fault system. Smaller b-value which is related to larger Dc-value is the dominant characteristic in the field of increased complexity for an active fault regime. As an important result, this may arise from the clusters of earthquakes, and the variations in Dc-value may provide some evidences for evaluations of stress relaxation on the fault re-gions (Öncel and Wilson, 2002; Polat et al., 2008).
4.3 Process for declustering of earthquake data and standard normal deviate -test (Precursory Seismic Quiescence, -value)
Foreshocks, aftershocks or earthquake swarms usually mask the temporal distribution of the number of events. Hence, these types of complex data sets affect the results of analy-ses on earthquake statistics. In order to make a quantitative rate change analysis of earthquake activity, all dependent events must be eliminated from the catalogue. In order to separate the dependent events from independent ones, the earthquake catalogue is declustered by using the Reasenberg (1985) algorithm. Arabasz and Hill (1996) stated that cluster procedure “declusters” or decomposes an earthquake cata-logue into main and secondary events. With the usage of a declustering process, all dependent earthquakes can be ex-tracted from each cluster, and they can be represented by a single event. This elimination process is a significant stage for reliable and high quality results of these types of quiescence assessments. In order to decluster the earthquake catalogue used in this study, Reasenberg (1985) algorithm within the ZMAP software (Wiemer, 2001) is used, and precursory quie-scence analysis is made by using the resulting declustered data. After Wiemer (2001), many authors have used ZMAP software for the analysis of seismic quiescence in different parts of the world (e.g., Katsumata and Kasahara, 1999; Chou-liaras and Stavrakakis, 2000; Polat et al., 2008; Öztürk, 2011; 2013; 2015; Öztürk and Bayrak, 2012; Ali, 2016).
We declustered the earthquake catalogue by using the al-gorithm given by Reasenberg (1985). It is well known that
_____________________________
__________
ZZ ___________________________
___________
-1r=cos (cosθ cosθ+sinθ sinθ cos(Φ -Φ ))i j i j i j
ZZ

In region 3 (north eastern part) of the VLED fault zone 824 events with M 1.7 are recorded. The declustering procedureD>
Figure 7: Changes in magnitude completeness, Mc, with time for: (a) the south western part (region 1), (b): the middle part (region 2), and (c): the north eastern part (region 3) of the VLED fault zone. Standard deviation, δMc of the changes (dashed lines) are also shown. Mc-values are estimated for overlapping samples, each including 400 events for all parts of the VLED fault zone.______________________
Table 2: Some details of the original and declustered catalogue for different parts of Vlora-Lushnja-Elbasani-Dibra Transversal Fault zone. The other input parameters used in the statistical analyses are also given.______________________________________________________________________
_Study areaTime period
Time length (decimal year)Completeness magnitude (Mc)Depth interval (km)Number of earthquakes(original catalogue)Number of earthquakes (declustered catalogue)Grid spaceNearest earthquakes (N)Time window (year)Time steps (day)
Region 140.3-41.1ºN, 19.2-20.2ºE
20 July 19679 December 2015
48.392.7
1-70487337
0.01ºx0.01º405.528
Region 240.8-41.4ºN, 19.8-20.6ºE
12 December 196726 December 2015
48.072.5
1-601503953
0.01ºx0.01º405.528
Region 341.2-41.8ºN, 20.1-20.6ºE
30 November 196715 December 2015
48.042.5
1-60824370
0.01ºx0.01º405.528
the declustering process introduces some artificial manipu-lations. Actually, the declustering process contains some op-tional parameters which allow the user to eliminate the de-pendent events in a smaller or larger time or space interval with respect to location of the main event (for details see Ara-basz and Hill, 1996). The study region is divided into three parts (Fig. 2b): the south western part (region 1), middle part (region 2) and the north eastern part (region 3) of the VLED fault zone. The original catalogue consists of 2814 earthquakes between July 20, 1967 and December 26, 2015, a time period of about 48.5 years. After the selection of different regions, earthquake catalogues in these areas are arranged for the analyses. Time variations of completeness magnitude for dif-ferent parts of the VLED fault zone will be explained below (see Fig. 7).
There are 487 earthquakes with M 1.7 in region 1 (south western part) of the VLED fault zone. The declustering process eliminates 47 events and 440 earthquakes are obtained. Thus, this algorithm took away about 9.65 % of earthquakes from all data set. The Mc-value is calculated as 2.7 for this region and the events with magnitudes smaller than 2.7 are removed from the declustered catalogue. The number of events exceeding this completeness magnitude level is 103. These two processes excluded 150 earthquakes and, in total, 30.8 % of the earth-quakes are removed from the whole catalogue of region 1. The earthquake catalogue for quiescence analysis includes 337 earthquakes in the south western part of VLED fault zone.
There are 1503 events with M 1.7 in region 2 (middle part) D
of the VLED fault zone. The declustering procedure removes 178 earthquakes and results in 1325 events. Thus, this algo-rithm took away about 11.84 % of events. The Mc-value is found as 2.5 for region 2 and earthquakes with M <2.5 are D
excluded from the declustered catalogue. The number of earthquakes exceeding this completeness magnitude level is 372. These two procedures removed 550 events and 36.66 % of the events in total are taken away from the whole cata-logue of region 2. Consequently, the earthquake catalogue for quiescence assessment consists of 953 events in the mid-dle part of VLED fault zone.
__________________________________________>
>
____________________________
D
Rrapo ORMENI, Serkan ÖZTÜRK, Akli FUNDO & Kemal ÇELIK

Spatial and temporal analysis of recent seismicity in different parts of the Vlora-Lushnja-Elbasani-Dibra Transversal Fault Zone, Albania
removes 226 earthquakes and 598 earthquakes are obtained. Thus, this algorithm removes about 27.4 % of earthquakes from whole data set. The Mc-value is estimated as 2.5 for re-gion 3 and the events with M <2.5 are subtracted from the D
declustered catalogue. The number of events exceeding this completeness magnitude level is 228, removing 454 events and 55.1 % of the events in total. As a result, the earthquake catalogue for quiescence evaluation includes 370 earthquakes in the north eastern part of VLED fault zone. An extract ofsome parameters for the original and declustered earthquake
catalogue is given in Table 2.Precursory seismic quiescence analysis can be achieved by
the methodology provided in Wiemer and Wyss (1994) and performed in ZMAP software. Although there are a number of techniques which identify the earthquake rate changes, many of these methods have used the precursory quiescence phenomenon. The best known and the most commonly used of these techniques are the standard normal deviate Z-test (for details see Wiemer and Wyss, 1994). ZMAP software has been used by many researchers in order to analyze the seismi-
___________________________
city rate changes for different parts of the world, only a brief description will be given here. ZMAP technique allows to users to analyze and to produce gra-phic displays of seismicity rate changes. In this study, the ZMAP method is used to put forth the areas exhibiting anomalous re-gions of quiescence. In order to rank the importance of quie-scence, standard normal deviate Z-test is used, generating Log Term Average, LTA (t), function for the statistical assessment of the confidence level in units of standard deviations:
(7)
where R is the mean earthquake all
rate in the overall period inclu-ding T (from t to t ), R is the W 0 e wl
average earthquake rate in the considered time window (from t to t+T ), σ and n are the stand-W
ard deviations and the number of samples within and outside the window; t is the current time (t < t < t ). The Z-value is 0 e
calculated by the equation for all times t between t and t to 0 e
T (Fig. 3). The Z-value is estima-W
ted as a function of time, letting the foreground window slide along the time period of cata-logue, called LTA (t).
5. Results of statistical in-vestigations of recent seis-micity and discussions
A statistical evaluation of the recent earthquake activity in the Vlora-Lushnja-Elbasani-Dibra
_________
___Figure 8: Gutenberg-Richter relations of all events between 1967 and 2016 for: (a) the south western part (region 1), (b): the middle part (region 2), and (c): the north eastern part (region 3) of the VLED fault zone. The b-value and its standard deviation, the Mc-value and a-value in the magnitude-frequency distribution are also given.________________________________________________________________
Z(t)=2σ all
2σ wl
nall nwl
R -Rall wi

transversal fault zone in Albania is achieved with the analysis of the seismotectonic b-value, fractal dimension Dc-value, standard normal deviate Z-value, and also by mapping the regional, temporal and magnitude histograms between 1967 and 2016. The b-value of magnitude-frequency relation sup-plies a relative assessment of the likelihood for small and large magnitudes of earthquakes. The relation between fractal di-mension and earthquake activity describes the complex fea-tures and patterns of earthquake occurrences. Estimates of the standard normal deviate Z-value provide valuable infor-mation in detecting the precursory seismic quiescence ano-malies for crustal main shocks, and it also can supply additio-nal perspective to future seismic hazard for a given region. Thus, we focused on estimating these types of parameters and interpretation of the relationships among them in terms of the next earthquake potential.
Figure 4 shows the cumulative number of earthquakes against time in all parts of the VLED fault zone both for the original and declustered earthquake catalogue. As seen in Figures 4a-4c, any significant changes are not reported in seismicity from 1967 to 1976. A slight change is observed in the earthquake activity between 1976 and 1983 for region 1, between 1976 and 1980 for regions 2 and 3. However, the number of earth-quakes gradually increases after 1983 for region 1, after 1980 for regions 2 and 3. Also, significant fluctuations in the earth-quake activity are reported in all regions, especially after the 2000s. As shown in Figure 4, the cumulative number of de-clustered catalogues with larger than or equal to complete-ness magnitude as a function of time has a smoother slope than that of original catalogues. As an important result, we can clearly state that declustering process has eliminated de-pendent earthquakes from the original earthquake catalogue and this process has provided a more reliable, robust and ho-mogeneous earthquake catalogue.
Time histograms for the three regions (Fig. 5a) show the ma-ximum increase in the number of events in 1983 for region 1, and a slight increase after 2012. The histogram for region 2 (Fig. 5b) indicates that there are increases in the number of earthquakes in 1980, 1986, 1990, 1998, 2003, and after 2008 and 2013. The time histogram for region 3 (Fig. 5c) shows a small increase between 1980 and 2010, and a prominent in-crease in the number of events after 2010.
In addition to the time histograms, we mapped the magni-tude histograms for all parts of the VLED zone. The M magni-D
tudes of earthquakes in these three regions change between 1.7 and 6.7, and earthquake numbers show an exponential decay rate from the smaller to larger magnitudes. A lot of the earthquakes are between 2.5 and 3.5 levels for region 1, and between 2.0 and 3.0 levels for regions 2 and 3 (Fig. 6). There is a maximum magnitude at M =2.9 in region 1 (Fig. 6a), at D
M =2.5 in regions 2 (Fig. 6b) and 3 (Fig. 6c).D
As mentioned above, the changes in Mc-value are quite ef-fective on the analysis of precursory seismic quiescence and the Gutenberg-Richter b-value. For this reason, the analyses of completeness magnitude as a function of time is achieved
_______________________
______________________
________________
_______________
by a moving window technique with the maximum curvature method (Woessner and Wiemer, 2005). The Mc-value is calcu-lated for samples of 40 earthquakes per window for region 1 with the catalogue consisting of all 487 earthquakes of M 1.7, D
40 events per window for region 2 with the catalogue inclu-ding all 1503 earthquakes of M 1.7, and 40 events per win-D
dow for region 3 with the catalogue having 824 earthquakes of M 1.7. The Mc-value is relatively large, and changes be-D
tween 2.8 and 3.3 from 1967 to 1983 (Fig. 7a), whereas it fluc-tuates around 2.8 between 1983 and 1995. After 1995, the Mc-value is between 2.9 and 3.2 for region 1. The Mc-value is around 2.8 until 1980 while it changes between 2.4 and 2.8 from 1980 to 2000 (Fig. 7b), and fluctuates between 2.5 and 3.0 from 2000 to 2010, and then these large values decrease from 2.8 to 2.4 between 2010 and 2016. For region 3, Mc-value changes between 2.6 and 3.0 from 1967 to 1985 and, be-
>
>
>
Figure 9: Changes in b-values with time for: (a) the south western part (region 1), (b): the middle part (region 2), and (c): the north eas-tern part (region 3) of the VLED fault zone. The b-values were com-puted for overlapping examples of 75 events for regions 1 and 3, 100 events for regions 2. Standard deviation (δb) of the b-values (dashed lines) is also given. Arrows show the great decrease in b-values be-fore the occurrences of strong earthquakes in the regions._________
Rrapo ORMENI, Serkan ÖZTÜRK, Akli FUNDO & Kemal ÇELIK
Spatial and temporal analysis of recent seismicity in different parts of the Vlora-Lushnja-Elbasani-Dibra Transversal Fault Zone, Albania
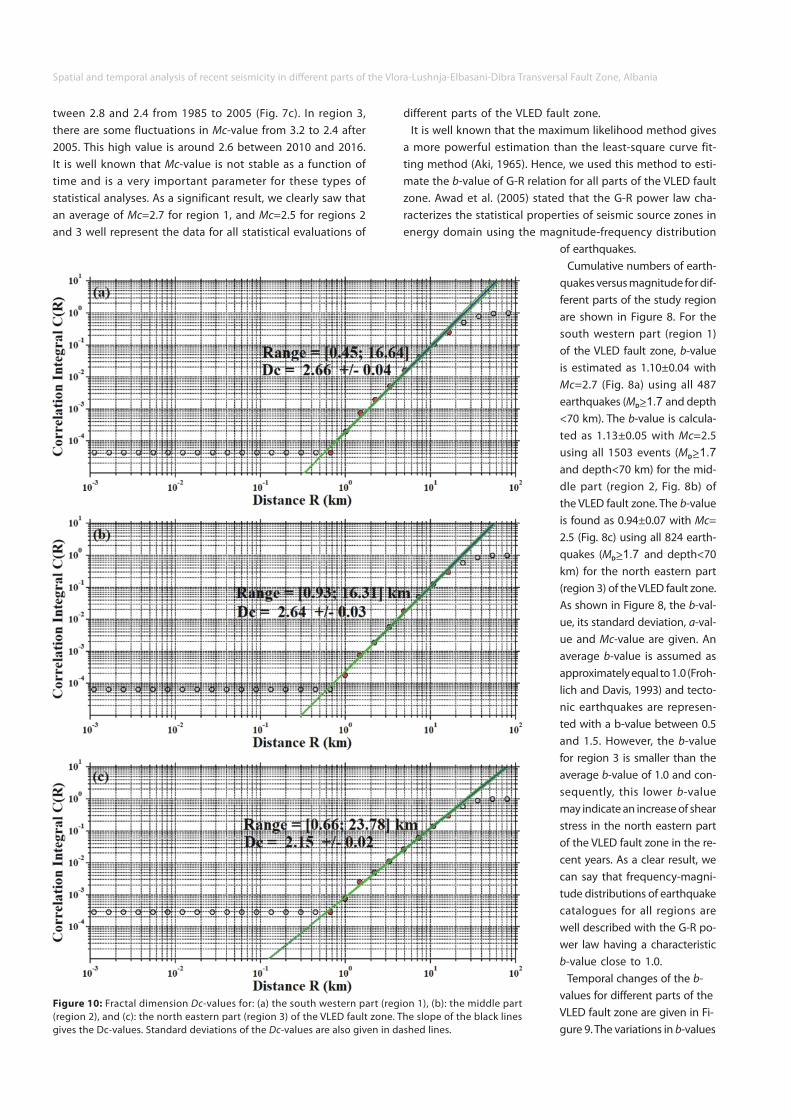
Figure 10: Fractal dimension Dc-values for: (a) the south western part (region 1), (b): the middle part (region 2), and (c): the north eastern part (region 3) of the VLED fault zone. The slope of the black lines gives the Dc-values. Standard deviations of the Dc-values are also given in dashed lines._____________
tween 2.8 and 2.4 from 1985 to 2005 (Fig. 7c). In region 3, there are some fluctuations in Mc-value from 3.2 to 2.4 after 2005. This high value is around 2.6 between 2010 and 2016. It is well known that Mc-value is not stable as a function of time and is a very important parameter for these types of statistical analyses. As a significant result, we clearly saw that an average of Mc=2.7 for region 1, and Mc=2.5 for regions 2 and 3 well represent the data for all statistical evaluations of
different parts of the VLED fault zone.It is well known that the maximum likelihood method gives
a more powerful estimation than the least-square curve fit-ting method (Aki, 1965). Hence, we used this method to esti-mate the b-value of G-R relation for all parts of the VLED fault zone. Awad et al. (2005) stated that the G-R power law cha-racterizes the statistical properties of seismic source zones in energy domain using the magnitude-frequency distribution
___________________
of earthquakes.Cumulative numbers of earth-
quakes versus magnitude for dif-ferent parts of the study region are shown in Figure 8. For the south western part (region 1) of the VLED fault zone, b-value is estimated as 1.10±0.04 with Mc=2.7 (Fig. 8a) using all 487 earthquakes (M 1.7 and depth D
<70 km). The b-value is calcula-ted as 1.13±0.05 with Mc=2.5 using all 1503 events (M 1.7 D
and depth<70 km) for the mid-dle part (region 2, Fig. 8b) of the VLED fault zone. The b-value is found as 0.94±0.07 with Mc= 2.5 (Fig. 8c) using all 824 earth-quakes (M 1.7 and depth<70 D
km) for the north eastern part (region 3) of the VLED fault zone. As shown in Figure 8, the b-val-ue, its standard deviation, a-val-ue and Mc-value are given. An average b-value is assumed as approximately equal to 1.0 (Froh-lich and Davis, 1993) and tecto-nic earthquakes are represen-ted with a b-value between 0.5 and 1.5. However, the b-value for region 3 is smaller than the average b-value of 1.0 and con-sequently, this lower b-value may indicate an increase of shear stress in the north eastern part of the VLED fault zone in the re-cent years. As a clear result, we can say that frequency-magni-tude distributions of earthquake catalogues for all regions are well described with the G-R po-wer law having a characteristic b-value close to 1.0.
Temporal changes of the b-values for different parts of the VLED fault zone are given in Fi-gure 9. The variations in b-values
>
>
>
_________

Figure 11: Changes in Z-values in the beginning of 2016 with T =5.5 years for: (a) the south western part (region 1), (b): the middle part (region 2), and (c): the north eastern part (region 3) of the VLED fault zone. Black dots show the declustered events with M for region 1, for D D
regions 2 and 3.
W
2.7 2.5 >___________________________________________________________________________________________________________
M >
in b-value can be used to forecast a major earthquake. Wang et al. (2016) stated that seismic observations show abnormal b-value changes before the occurrence of some main shocks. We can point out that the decreasing trend in b-value before the occurrences of some strong main shocks may result from a stress increase. The systematic decreasing trend in b-value starts in 2012 and continues in 2015 for region 3. As a very re-markable result, these changes are very important for earth-quake forecasting, and we can interpret that these fluctua-tions can be an indicator of next earthquake in the north eastern part of the VLED fault zone (region 3).
The correlation dimension Dc-value of earthquake epicenter distribution in different parts of the VLED fault zone is calcu-lated by fitting a straight line to the curve of the correlation integral, C(R), versus the distance, R. Dc-values for three parts of the study region are estimated with 95% confidence limits by linear regression fit (Fig. 10). The Dc-value is computed as 2.66±0.04 for the distribution of 487 events in the south wes-tern part of the VLED fault zone (region 1, see Fig. 10a). Using the distribution of 1503 earthquakes in the middle part of the study region (region 2), the Dc-value is calculated as 2.64±0.03 (Fig. 10b). The Dc-value is estimated as 2.15±0.02 (Fig. 10c) for the distribution of 824 events in the north eastern part of the VLED fault zone (region 3). There are a clear linear range and scale invariance in the fractal statistics between 0.45 and 16.64 km for the south western region 1 (Fig. 10a), between 0.93 and 16.31 km for the middle part (Fig. 10b), between 0.66 and 23.78 km for the north eastern part (Fig. 10c) of the study region. Dc-values and their standard deviations are al-so estimated within these distances.
As mentioned above, the fractal dimension may define the earthquake distributions since they match the fractal statis-tics. It is well known that the higher Dc-values are related to active faults and these fault systems have an increasing com-plexity (Öncel and Wilson, 2002). Also, the faults in which earthquakes are caused by failure of isolated, small asperities and occurred in clusters have lower Dc-values (Barton et al., 1999). Öztürk (2015) stated that the higher order correlation dimension, especially larger than 2.3 is increasingly sensitive
_____________
____________________
are examples for the size of 75 events for regions 1 and 3, and 100 events for region 2. There are clear decreases in b-value smaller than 1.0 before some strong main shocks such as Oc-tober 10, 1980 and June 11, 2005 earthquakes (Fig. 9a), while some declines in b-value are not related to the occurrence of a main shock. A remarkable result is that there exists an earth-quake swarm in November 1982 and a significant increase is observed in the b-values with a maximum of b~1.35 until this date. After this, a clear decrease is observed around b~1.2 be-fore the beginning of earthquake swarm. This also means that earthquake swarms have a larger b-value than other earth-quake occurrences. These types of increases and decreases in b-values are also detected before some strong earthquake oc-currences in regions 2 and 3. In the middle part of the VLED fault zone, we observed many systematic decreases before the occurrences of some main shocks such as July 8, 1981, March 15, 1986, October 4, 1998, November 1, 2005, July 2, 2011, and May 19, 2014 earthquakes (Fig. 9b). For region 3, there are regular decreases around b~0.8 before the occur-rences of two main shocks, October 6, 2009 and July 16, 2011 earthquakes while any strong earthquake is not observed af-ter a decrease in b-value in 1987 (Fig. 9c). A significant obser-vation from Figure 9c is that a clear systematic decrease star-ted after 2012 and it continues at the beginning of 2016.
As stated in Utsu (1971), many factors can affect the changes in b-value. The b-value for a region does not reflect only the relative proportion of the number of large and small events, but is also related to the stress situation in the region. Tem-poral changes of b-values are one of the most important pre-cursors for earthquake occurrences. The changes in b-value as a function of time show a tendency to decrease before the occurrence of large earthquakes (Öztürk, 2011; Prasad and Singh, 2015; Wang et al., 2016). Öztürk (2011) observed large decreases before the occurrences of several large earthquakes in Turkey such as August 17, 1999 İzmit, November 12, 1999 Düzce, January 27, 2003 Tunceli, and May 1, 2003 Bingöl earth-quakes. Prasad and Singh (2015) observed a correlation be-tween low b-value for the one-year time interval and the oc-currence of large main shocks. They suggested that changes
___
Rrapo ORMENI, Serkan ÖZTÜRK, Akli FUNDO & Kemal ÇELIK

Spatial and temporal analysis of recent seismicity in different parts of the Vlora-Lushnja-Elbasani-Dibra Transversal Fault Zone, Albania
Figure 12: Results of GENAS estimates for declustered events for: the south western part (region 1), (b): the middle part (region 2), and (c): the north eastern part (region 3) of the VLED fault zone. Times of significant changes (at the 99% confidence level) are marked in blue for seismicity rate increases and in red for seismicity rate decreases as a function of different magnitude groups._____________________
to the heterogeneity in magnitude distribution. This means that earthquake activity is more clustered in smaller areas (or at larger scales) in the south western and the middle parts of the VLED fault zone. As a remarkable conclusion, we can ge-nerally assume that the higher Dc-values are the dominant structural properties in the VLED fault zone and may result from the earthquake clusters. Because the uniform distribu-
tion of events decreases with an increase in the earthquake clustering, this large values can also be an indication of vari-ations in the stress distribution in the study area.
Regional variations of standard normal deviate Z-value in different parts of VLED fault zone are mapped at the begin-ning of 2016 (Fig. 11). Each Z-value has a different interpre-tation: the lowest Z-values mean that the changes in earth-
__________
quake activity are not signifi-cant, and the largest Z-values indicate a decrease in seismici-ty rate. To image the regional changes of precursory seismic quiescence, declustered earth-quake catalogues for all regions are used. For all three parts, we used regional grid of points with a grid of 0.01º. After several tests for all regions, the nearest events N=40 are selected at each node and the changes of earthquake activity are mapped with the maximum radius changes by a moving time window T (or so-W
metimes wl) as stated in Wiemer and Wyss (1994). An important point in this stage is that statis-tical robustness of the LTA (t) function increases with the size of T and so, more and more W
smooth shape is obtained if the length of T exceeds the ano-W
maly period. For this reason, we made a few tests by trying dif-ferent T -values such as 1.5, 2.5, W
3.5, 4.5, and 5.5 years. Thus, we decided that quiescence ano-malies are better visible for the length of time window T =5.5 W
years and we used this T =5.5 W
value for the imaging of regio-nal changes of earthquake ac-tivity rate. Finally, we separated the event population into many groups with the span of 28 days for all regions in order to obtain a dense and continuous cove-rage in time. The selection of N and T -values does not affect W
the results in any way and they are changed in order to improve the quiescence signal. All details for these types of input parame-ters used in ZMAP program and some properties about the stu-dy areas are given in Table 2.__

The regional distribution of the Z-value for the south wes-tern part (region 1) of the VLED fault zone is given in Figure 11a, indicating one seismic quiescence region (A). Two regions seismic quiescence (B and C) are observed in the middle part (region 2) of the VLED fault zone (Fig. 11b). In the north eas-tern part (region 3) three regions (D, E and F) show seismic quiescence anomalies (Fig. 11c).
For Z-value maps, the time window length for all regions is computed by adding T -value to the time chosen as the be-W
ginning of the time cut and so, Z-value changes for all regions are mapped for the same time, the beginning of 2016. In re-gion 1, including the south western part of the VLED fault zone, the quiescence anomaly is centered at 40.81°N-19.86°E (region A, including Kuc-Bubullim, southeast of Lushnja town). In region 2, including the middle part of the VLED fault zone, the first anomaly region is centered at 41.00°N-20.01°E (region B, including Cerriku, south of Elbasani town) and the second one is centered at 41.31°N-20.13°E (regions C, including Bene-Qafe, northeast of Elbasani town). In region 3, including the north eastern part of the VLED fault zone, the first anomaly is centered at 41.43°N-20.21°E (region D, including Krasta-Batra, south of Bulqiza town), the second one is centered at 41.28°N-20.49°E (region E, including Carrishta-Stebleve, northeast of Li-brazhdi town), and the third one is centered at 41.51°N-20.51°E (region F, including Qerrenec-Gjorica, west of Dibra town).
In recent years, many authors such as Katsumata and Kasa-hara (1999), Chouliaras and Stavrakakis (2000), Polat et al., (2008), Öztürk, (2013; 2015), Öztürk and Bayrak (2012) achie-ved some quiescence analysis for different parts of the world and they detected significant seismic quiescence before the main shocks in their study regions. Thus, observed quiescen-ce anomalous regions in different parts of the VLED fault zone may be significant and point out the next earthquake locations.
In addition to these statistical analysis, we used the GENAS technique (Habermann, 1983) in order to put forth all impor-tant rate changes of earthquake activity in different parts of the VLED fault zone. The GENAS algorithm estimates the cu-mulative numbers of different magnitude thresholds. In order to separate the magnitude groups where significant varia-tions occur, the magnitude groups are separately evaluated. GENAS test is based on the iterative comparison of the earth-quake activity rates at different magnitude thresholds (Zúñi-ga et al., 2000). The aim of the evaluating the numbers of magnitude groups separately is to see clearly the individual changes which occur in different magnitude groups. In short, the GENAS application describes the important variations in the number of earthquakes larger and smaller than a given magnitude versus time. GENAS algorithm defines the times which stand out as the start of periods were increases and/or decreases of earthquake activity can be identified as well as the magnitude range affected by these variations (Zúñiga et al., 2000; Chouliaras, 2009). Results of the GENAS model show the important breaks in slope which begin from the end of data for all magnitude groups. Here, “mag and below” states all earthquakes having a magnitude lower than M -valueD
________________________
__
and, “mag and above” refers all event having a magnitude greater than M -value. The GENAS method hypothesized that D
only independent earthquakes can be compared in order to avoid false alarms from seismicity rate changes due to fore-shock and aftershock sequences or clusters (Chouliaras, 2009). For this reason, we used the declustered earthquake cata-logue for GENAS analysis.
The GENAS results (Fig. 12) indicate two significant increases in recorded small earthquakes and two clear decreases in re-corded large events in 1975 and 2012 for the south western part (region 1, Fig. 12a) of the VLED fault zone. On the con-trary, a massive decrease is reported for small earthquakes in 2014 and, some slight increases and decreases from 1990 to 1993. Also, there is a decreasing trend in large earthquakes in 2015. GENAS results for the middle part (region 2) of the VLED fault zone (Fig. 12b) indicate two strong increases in recorded small earthquakes between 1975 and 1977. A few weak vari-ations of recorded large earthquakes are also observed for region 2 in 1975, 1997 and 2014, and also from 2004 to 2008. GENAS results for the north eastern part of the VLED fault zo-ne (region 3) three strong increases in reported small earth-quakes are pronounced in 1974, 1976 and 2008 (Fig. 12c). There are three strong decreases in reported small earth-quakes and three small decreases in reported large events in 1968, 2001 and 2015. Two small increases in region 3 are also observed in recorded large earthquakes in 1974 and 2008. As an important result, we observed a remarkable compatibility between the results of seismic quiescence (Fig. 11) and the GENAS results (Fig. 12) at the beginning of 2016.
For a given region in different parts of the world, regional and spatial behaviors of earthquake activity have been evalu-ated in numerous studies and many different statistical me-thods have been used to make a detailed assessment of earth-quake hazard. In recent years, many authors have used the combination of several statistical parameters such as Guten-berg-Richter b-value, correlation dimension Dc-value and pre-cursory seismic quiescence Z-value in order to reveal the pos-sible locations of future earthquakes in a given region (e.g., Wiemer and Wyss, 1994; Wyss and Martirosyan, 1998; Katsu-mata and Kasahara, 1999; Öncel and Wilson, 2002; Chouliaras and Stavrakakis, (2000); Huang et al., (2002); Wyss et al., 2004; Polat et al., 2008; Roy et al., 2011; Öztürk and Bayrak, 2012; Öztürk, 2011; 2013; 2015; Ali, 2016). The basic idea of these types of studies is that the regions with the lower b-value, the larger Dc-value and the higher Z-value are probable areas for next earthquake hazard. For example, an analysis on the evaluation of seismic hazard for the western part of Turkey is made by Polat et al. (2008) by using b-value and Z-value. They used the maximum likelihood approach to estimate the b-value and LTA (t) function to map the Z-value. They stated that the areas with the smaller b-value or larger Z-value can be interpreted as the most likely region for the next strong earthquake. Öztürk (2011) and Öztürk and Bayrak (2012) eva-luated the seismic hazard potential of different parts of Tur-key using such kind of parameters. Two large earthquakes
______________________________
___________
Rrapo ORMENI, Serkan ÖZTÜRK, Akli FUNDO & Kemal ÇELIK

Spatial and temporal analysis of recent seismicity in different parts of the Vlora-Lushnja-Elbasani-Dibra Transversal Fault Zone, Albania
occurred in the eastern part of Turkey: March 8, 2010 Elazığ and October 23, 2011 Lake Van earthquakes. They observed some significant quiescence anomalies before the occurren-ce of these two earthquakes in 2010 and 2011 and, they ob-served their quiescence anomalies in and around the epicen-tral regions of these earthquakes. In short, these statistical parameters may be used in the forecasting of future earth-quake locations. Because of the lower b-value, the larger Dc-value and the recent quiescence in several regions in and around the VLED fault zone at the beginning of 2016, these anomaly regions are important in the evaluation of seismic potential and hazard.
6. ConclusionsIn the scope of this study, temporal and regional analyses
of the recent earthquake activity in different parts of the Vlo-ra-Lushnja-Elbasani-Dibra Transversal Fault Zone, Albania, are achieved. Several statistical parameters such as the Guten-berg-Richter b-value, the correlation dimension Dc-value and the precursory seismic quiescence Z-value as well as the re-gional, temporal and magnitude histograms of earthquake distributions were used in order to make a comprehensive evaluation for the earthquake hazard potential along the VLED fault zone. We used a homogeneous catalogue for du-ration magnitude, M and it includes 2814 earthquakes with D
1.7 M for shallow earthquakes (<70 km) between July D
20, 1967 and December 26, 2015. For the analysis of standard normal deviate Z-value, the earthquake catalogues for each region were declustered by using Reasenberg’s algorithm.
The properties of earthquake distributions for different parts of the VLED fault zone are approximately the same and seis-micity in all parts has an increasing trend gradually, especi-ally after 1980. Mc-value estimations show a value of 2.7 for the south western part and 2.5 for the middle and north eas-tern part of the study region. Estimated b-values in all parts are around 1.0 and this is a characteristic value for earthquake catalogues. However, the north eastern part of the VLED zone has a b-value of 0.97 and this small value may be related to the increasing shear stress at the beginning of 2016. The b-value variations in time provide significant results and signifi-cant decreases are observed before the occurrences of strong earthquakes. A remarkable fact, this type of pioneering fin-dings may be an evidence for the future strong main shocks. Dc-values for all parts are estimated as greater than 2.0, with 2.66 and 2.64 for the south western and middle parts, res-pectively. These large values mean that earthquake activity in these parts of the VLED fault zone are more clustered in smaller areas or larger scales.
Using the declustered earthquake catalogue, the regional distribution of Z-values is plotted in a grid space of 0.01° in latitude and longitude. We used a moving time window as T =5.5 years and observed several significant seismic quie-W
scence regions at the beginning of 2016. In the south wes-tern part of the VLED fault zone, one quiescence anomaly is centered at 40.81°N-19.86°E. In the middle part of the VLED
_________________________________
< <
__
___________________________
6.7
fault zone, the first anomaly is centered at 41.00°N-20.01°E and the second one is centered at 41.31°N-20.13°E. In the north eastern part of the VLED fault zone, one anomaly is centered at 41.43°N-20.21°E, the second one is centered at 41.28°N-20.49°E, and the third one is centered at 41.51°N-20.51°E.
There are many strong main shocks in the last 95 years in VLED fault zone, especially the recent 2009, 2014 and 2015 earthquakes. When considering the regions which have small b-value and large Dc-value with high Z-value, one can inter-pret that these anomaly regions may be interpreted as the possible locations of the next earthquakes. Hence, the combi-nation of these types of seismotectonic variables and assess-ment of the regional and temporal behaviors together provi-des significant evidences in the identification of the seismic potential in and around the VLED fault zone. For this reason, further statistical analyses in this region will be useful, and the evaluations of b-value, Dc-value and Z-value with toge-ther may supply significant information for the forecasting of the next earthquake location and for the evaluation of seis-mic hazard in the VLED fault zone.
AcknowledgementsI would like to thank to Prof. Dr. Stefan Wiemer for providing
ZMAP software. I also thank to the editor, reviewers Ewald Brückl and Sabine Hruby-Nichtenberger, for their useful and constructive comments, discussions and suggestions in im-proving this paper.
ReferencesAki, K., 1965. Maximum likelihood estimate of b in the formula
log N=a-bM and its confidence limits. Bulletin of the Earth-quake Research Institute, Tokyo University, 43, 237-239.
Ali, S.M., 2016. Statistical analysis of seismicity in Egypt and its surroundings. Arabian Journal of Geosciences, 9 (52), 2-16. http://dx.doi.org/10.1007/s12517-015-2079-x.
Aliaj, S.H., Sulstarova, E., Muço, B. and Kociu, S., 2001. Seismo-tectonic map of Albania, scale 1:500.000. Seismological Ins-titute, Tirane.
Arabasz, W.J. and Hill, S.J., 1996. Applying Reasenberg’s clus-ter analysis algorithm to regional earthquake catalogs out-side California (abstract). Seismological Research Letters, 67(2), p. 30.
Awad, H., Mekkavi, M., Hassib, G. and Elbohoty, M., 2005. Tem-poral and three dimensional spatial analysis of seismicity in the Lake Aswan area, Egypt. Acta Geophysica Polonica 53 (2), 152-166.
Barton, D.J., Foulger, G.R., Henderson, J.R. and Julian, B.R., 1999. Frequency-magnitude statistics and spatial correlation di-mensions of earthquakes at Long Valley Caldera, California. Geophysical Journal International, 138, 563–570. http://dx. doi.org/ 10.1046/j.1365-246X.1999.00898.x.
Chouliaras, G. and Stavrakakis, G.N., 2001. Current seismic quiescence in Greece: Implications for seismic hazard. Jour-
___
______________________
___________________________________
___

nal of Seismology, 5 (4), 595-608. http://dx.doi.org/10.1023/ A:1012025024887.Chouliaras, G., 2009. Investigating the earthquake catalog of
the National Observatory of Athens, Natural Hazards Earth System Sciences, 9, 905-912. http://dx.doi.org/10.5194/nhess-9-905-2009.
Frohlich, C. and Davis, S., 1993. Teleseismic b-values: Or, much ado about 1.0. Journal of Geophysical Research, 98 (B1), 631-644. http://dx.doi.org/10.1029/92JB01891.
Goltz, C., 1998. Fractal and chaotic properties of earthquakes (Lecture Notes in Earth Sciences, 77), Springer-Verlag, 178 pp.
Grassberger, P. and Procaccia, I., 1983. Measuring the strange-ness of strange attractors, Physica, 9(D), 189–208.
Gutenberg, R. and Richter, C.F., 1944. Frequency of earthquakes in California. Bulletin of the Seismological Society of America, 34, 185-188.
Habermann, R.E., 1983. Teleseismic detection in the Aleutian Island arc. Journal of Geophysical Research. 88 (B6), 5056-5064. http://dx.doi.org/10.1029/JB088iB06p05056.
Hirata, T., 1989. Correlation between the b-value and the fractal dimension of earthquakes. Journal of Geophysical Research. 94, 7507-7514. http://dx.doi.org/10.1029/JB094iB06p07507.
Huang, Q., Öncel, A.O. and Sobolev, G.A., 2002. Precursory seismicity changes associated with the MW=7.4 1999 Au-gust 17 Izmit (Turkey) earthquake. Geophysical Journal In-ternational, 151, 235-242.
Kagan, Y.Y., 2007. Earthquake spatial distribution: the correla-tion dimension. Geophysical Journal International, 168, 1175-1194. http://dx.doi.org/10.1111/j.1365-246X.2006.03251.x.
Katsumata, K. and Kasahara, M., 1999. Precursory seismic quie-scence before the 1994 Kurile earthquake (M = 8.3) revea-w
led by three independent seismic catalogs. Pure and Applied Geophysics. 155, 2-4, 443-470. http://dx.doi.org/10.1007/ s000240050274.
Kociaj, S., 1986. The risk of the Albanian’s earth crust and its specification for the ground of construtsion. PhD thesis, Ti-rana.
Mandelbrot, B.B., 1982. The fractal geometry of nature. Free-man Press, San Francisco.
Mazzoli, S. and Helman, M., 1994. Neogene patterns of rela-tive plate motion for Africa-Europe: some implications for recent central Mediterranean tectonics. Geologische Rund-schau, 83, 464-468.
Melo, V., 1986. The structural geology and geotectonic (The geology of the Albanides) (In Albanian). The Publishing House of University of Tirana.
Mogi, K., 1962. Magnitude-frequency relation for elastic shocks accompanying fractures of various materials and some rela-ted problems in earthquakes. Bulletin of the Earthquake Re-search Institute, Tokyo University, 40, 831-853.
Olsson, R., 1999. An estimation of the maximum b-value in the Gutenberg-Richter relation. Geodynamics, 27, 547–552.
Ormeni, Rr., 2007. The general model of construction of the Albanian earth crust and its seismoactive feature accor-ding to the seismological data. PhD thesis, Tirana, Albania.
Ormeni, Rr., 2010. Structure of P, S seismic wave velocities of the Albanian earth lithospheres and its seismoactive featu-res. Kumi publications, Tirana.
Ormeni, Rr. Kociaj, S., Fundo, A., Daja, S.H. and Doda, V., 2013. Moderate earthquakes in Albania during 2009 and their as-sociated seismogenic zones. Italian Journal of Geosciences, 132 (2), 203-212. http://dx.doi.org/10.3301/IJG.2012.45.
Ormeni, Rr., 2015. Mapping b-value in the seismogenic zones of Albania region. Proceeding of the 8th Congress of the Bal-kan Geophysical Society, 4-8 October 2015, Crete, Greece.
Öncel, A.O. and Wilson, T.H., 2002. Space-time correlations of seismotectonic parameters and examples from Japan and Turkey preceding the İzmit earthquake. Bulletin of the Seis-mological Society of America, 92, 339-350. http://dx.doi.org/ 10.1785/0120000844.
Öncel, A.O. and Wilson, T.H., 2007. Anomalous seismicity pre-ceding the 1999 Izmit event, NW Turkey. Geophysical Jour-nal International, 169, 259-270. http://dx.doi.org/10.1111/j. 1365-246X.2006.03298.x.
Öztürk, S., Bayrak, Y., Çinar, H., Koravos, G.Ch. and Tsapanos, T.M. 2008. A quantitative appraisal of earthquake hazard parameters computed from Gumbel I method for different regions in and around Turkey. Natural Hazards 47, 471-495. http://dx.doi.org/10.1007/s11069-008-9234-6.
Öztürk, S., 2011. Characteristics of Seismic Activity in the Wes-tern, Central and Eastern Parts of the North Anatolian Fault Zone, Turkey: Temporal and Spatial Analysis. Acta Geophy-sica, 59 (2), 209-238. http://dx.doi.org/10.2478/s11600-010-0050-5.
Öztürk, S. and Bayrak, Y., 2012. Spatial variations of precursory seismic quiescence observed in recent years in the eastern part of Turkey. Acta Geophysica, 60 (1), 92-118. http://dx.doi. org/10.2478/s11600-011-0035-z.
Öztürk, S., 2013. A statistical assessment of current seismic quiescence along the North Anatolian Fault Zone: Earth-quake precursors. Austrian Journal of Earth Sciences, 106 (2), 4-17.
Öztürk, S., 2015. A study on the correlations between seismo-tectonic b-value and Dc-value, and seismic quiescence Z-value in the Western Anatolian region of Turkey. Austrian Journal of Earth Sciences, 108 (2), 172-184. http://dx.doi.org/ 10.17738/ajes.2015.0019.
Prasad, S. and Singh, C., 2015. Evolution of b-values before large earthquakes of m 6.0 in the Andaman region. Geo-b
logica Acta, 13(3), 205-210. http://dx.doi.org/10.1344/ Geo logicaActa2015.13.3.3.
Polat, O., Gok, E. and Yılmaz, D., 2008. Earthquake hazard of the Aegean Extension region (West Turkey), Turkish Journal of Earth Sciences, 17, 593-614.
Reasenberg, P.A., 1985. Second-order moment of Central Ca-lifornia seismicity, 1969-1982. Journal of Geophysical Re-search, 90 (B7), 5479-5495. http://dx.doi.org/10.1029/JB090 iB07p05479.
Roy, S., Ghosh, U., Hazra, S. and Kayal, J.R., 2011. Fractal dimen-sion and b-value mapping in the Andaman-Sumatra subduc-
>
Rrapo ORMENI, Serkan ÖZTÜRK, Akli FUNDO & Kemal ÇELIK
Received: 22 July 2017Accepted: 13 November 2017
1) 2)*) 3) 4)Rrapo ORMENI , Serkan ÖZTÜRK , Akli FUNDO & Kemal ÇELIK1)
2)
3)
4)
*)
Spatial and temporal analysis of recent seismicity in different parts of the Vlora-Lushnja-Elbasani-Dibra Transversal Fault Zone, Albania
tion zone. Natural Hazards, 57, 27–37. http://dx.doi.org/10. 1007/s11069-010-9667-6.
Scholz, C.H., 1968. The frequency-magnitude relation of mi-crofracturing in rock and its relation to earthquakes. Bulle-tin of the Seismological Society of America, 58, 399-415.
Sulstarova, E., and Kociaj, S., 1975. Catalog of earthquakes of Albania. Published, Science Academy of Albania, Tirane.
Sulstarova, E., Kociaj, S., and Aliaj, S.H., 1980. Seismic Regio-nalizition of Albania. Published, Science Academy of Alba-nia, Tirane.
Sulstarova, E., Peçi, V. and Shuteriqi, P., 2000. Vlora-Elbasani-Dibra (Albania) transversal fault zone and its seismic activi-ty. Journal of Seismology, 4, 117-131.
Toksöz, M.N., Shakal, A.F. and Michael, A.J., 1979. Space-time migration of earthquakes along the North Anatolian Fault Zone and seismic gaps. Pure and Applied Geophysics, 117, 1258–1270.
Utsu, T., 1971. Aftershock and earthquake statistic (III): Analy-ses of the distribution of earthquakes in magnitude, time and space with special consideration to clustering characte-ristics of earthquake occurrence (1). Journal of Faculty of Sci-ence, Hokkaido University, Series VII (Geophysics), 3, 379-441.
Wang, J.H., Chen, K.C., Leu, P.L. and Chang, C.H., 2016. Precur-sor times of abnormal b-values prior to mainshocks. Journal of Seismology, 20, 905-919. http://dx.doi.org/10.1007/s10950-016-9567-7.
Wiemer, S. and Wyss, M., 1994. Seismic quiescence before the Landers (M=7.5) and Big Bear (6.5) 1992 earthquakes. Bulle-tin of the Seismological Society of America, 84 (3), 900-916.
Wiemer, S. and Wyss, M., 2000. Minimum magnitude of com-pleteness in earthquake catalogs: Examples from Alaska, the Western United States, and Japan. Bulletin of the Seismolo-gical Society of America, 90 (3), 859-869. http://dx.doi.org/ 10.1785/0119990114.
Wiemer, S., 2001. A software package to analyze seismicity: ZMAP. Seismological Research Letters, 72(2), 373-382. http:// dx.doi.org/10.1785/gssrl.72.3.373.
Woessner, J. and Wiemer, S., 2005. Assessing the quality of earthquake catalogues: Estimating the magnitude of com-pleteness and its uncertainty. Bulletin of the Seismological Society of America, 95 (2), 684-698. http://dx.doi.org/10. 1785/0120040007.
Wyss, M. and Martirosyan, A.H., 1998. Seismic quiescence be-fore the M7, 1988, Spitak earthquake, Armenia, Geophysical Journal International, 134, 2, 329-340. http://dx.doi.org/10. 1046/j.1365-246x.1998.00543.x.
Wyss, M., Sobolev, G.A. and Clippard, J.D., 2004. Seismic quie-scence precursors to two M7 earthquakes on Sakhalin Is-land, measured by two methods, Earth Planets Space, 56, 725-740.
Zúñiga, R.F., Reyes, M.A. and Valdés, C., 2000. A general over-view of the catalog of recent seismicity compiled by the Mexican Seismological Survey, Geofísica Internacional, 39 (2), 161-170.
Institute of Geosciences, Energy, Water and Enivornment Polytech-
nic University, Tirana, Albania;
Gümüşhane University, Department of Geophysics, TR-29100, Gü-
müşhane, Turkey;
Polytechnic University, Tirana, “Nene Tereza” square, Albania;
Gümüşhane University, Department of Geomatics Engineering, TR-
29100, Gümüşhane, Turkey;
Corresponding author, [email protected]
_______________________________
_________________________________________
_____
_________________________________
_________