Embed Size (px)
Citation preview
1
Spatial and Temporal Modeling for
Sustainable Management of Tropical
Rainforest
The Fuelwood Issue in the Cibodas Biosphere Reserve,
West Java
A.G.Toxopeus
Dept. of Land Resourceand Urban Sciences, ITCP.O.Box 6, 7500 AA EnschedeThe Netherlandsphone: +31.53.4874485fax: +31.53.4874399e-mail: [email protected]
1. Abstract
The aim of this research was to develop a methodology to integrate information on thespatial and temporal diversity of tropical rainforest ecosystems, including both biophysicaland human aspects, and to apply this information in integrated environmentally soundmanagement of the natural resources of the tropical rainforest of the Cibodas ecosystem,West Java. Furthermore, the model should not only consider the "protected" area itself, e.g.,the Gede-Pangrango National Park, but should take the surrounding areas with humanactivities (where the impact is often coming from) in consideration as well.
Therefore, a spatial and temporal modeling system has been developed as a user-friendlytool for decision makers e.g., managers, planners and others involved in the (sustainable)management of the tropical rainforest ecosystem. The developed modeling systemcombines both spatial and temporal data together with other attribute (e.g., statistical) data insuch a way, that it is able to simulate the processes going on in the ecosystem, in space andin time; the result will be a spatial presentation (with qualitative and quantitative data) of theexpected result of a certain management simulation. In that way the user should be able toexamine and evaluate the effects of certain management decisions on the ecosystemfunctioning, before taking them into practice.
Such a modeling system has been developed for and implemented in the Cibodas BiosphereReserve in West Java, Indonesia. The Cibodas Biosphere Reserve is an area of humidtropical rain forest, partly surrounded by production forest, tea plantations and agriculturalland. The tropical rain forest is under high pressure of the rapidly growing human population,around the protected forest. The result of the model, developed for the Cibodas BiosphereReserve, representing the actual situation, indicates clearly where and in what extendfuelwood shortages exists and where impact on the national park can be expected. Severalsimulations of different management possibilities are demonstrating in what extent a specificmanagement option will probably reduce the impact on the national park. But only acombination of several management options seems to be able to reduce the impact on theNational Park substantially.
2
2. Concept of the Management Model for the Cibodas Biosphere Reserve
The problems occurring in the Cibodas Biosphere Reserve, concerning the degradation ofthe natural forest in the Gede-Pangrango National Park because of illegal collection of forestproducts e.g., fuelwood, are described in Toxopeus (1996) and the demonstration package,called "Cibodemo", belonging to this paper.
To be able to conserve the natural forest of the Gede-Pangrango National Park, managersneed information concerning the location and extent of actual forest degradation and thepotential threat of forest degradation in the protected Gede-Pangrango National Park, byillegal fuelwood collection. Moreover, to be able to manage this ecosystem in a sound andsustainable way, they need information concerning the location and extent of the increasingdemand for fuelwood, the availability (production) of fuelwood and the accessibility to(potential) available fuelwood.
Changes are relatively slow in the Cibodas Biosphere Reserve. Therefore, the model shouldbe able to show not only the actual situation of the Cibodas Biosphere Reserve. But it shouldbe able to predict future developments in the Biosphere Reserve over a relative "long term"period (two, five or more years), without any management changes (just leave it as it is andlets hope for the best) or simulating management activities and showing its possible positiveor negative effects on and consequences for the natural forest, socio-economic situation ofthe local people, etc. in the Cibodas Biosphere Reserve.
In this case the main cause of the degradation of the natural forest is the collection of forestproducts, which is in fact caused by the increasing demand for forest products, which is inturn caused by a very high growth of the local human population. Therefore, the demand-aspect is varying in time. Although the availability- and accessibility aspects change in timeas well, these changes are not that fast and the changes are relatively easily to update in themodel. Therefore, the availability- and accessibility aspects are in principle considered to beconstant.
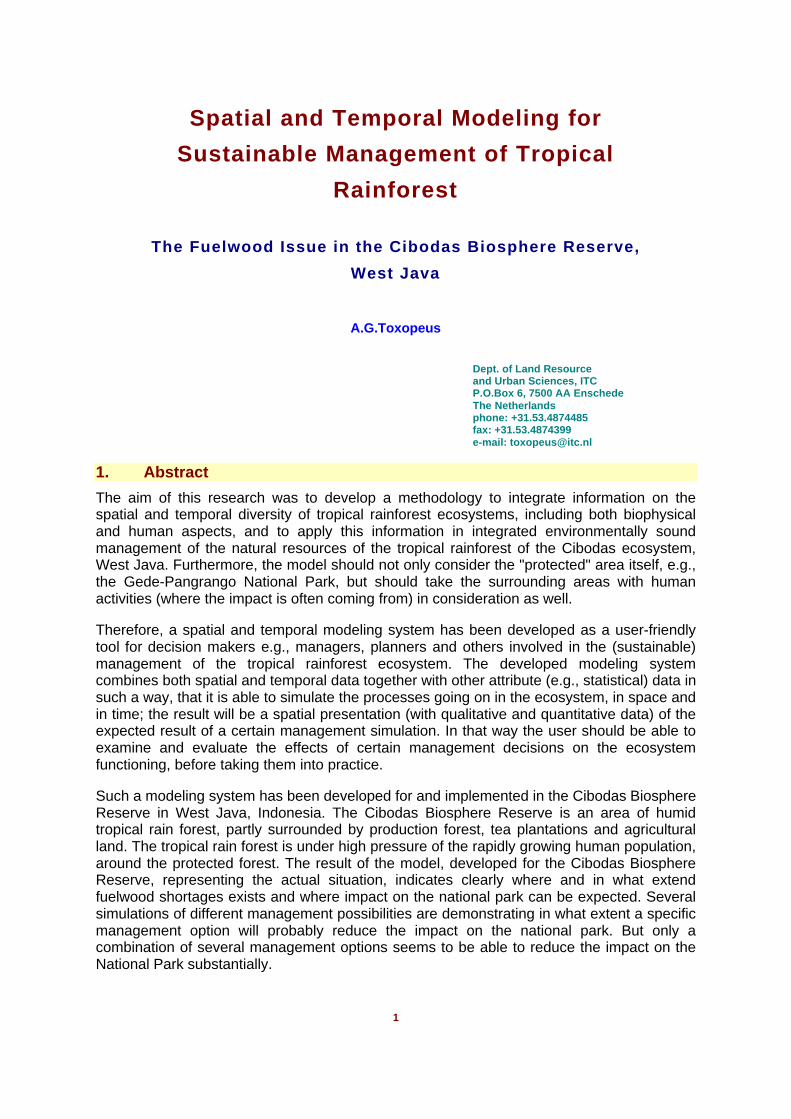
To be able to construct this model, which is calculating and displaying the spatial andtemporal variation of the expected impact of fuelwood collecting in the core zone of theCibodas Biosphere Reserve, data has to be collected and analyzed concerning the fuelwoodproduction of various land cover types, the fuelwood demand or consumption in the area andthe accessibility to the fuelwood sources e.g., the Gede-Pangrango National Park (corezone). A description concerning the analysis and procedures followed to build the model, isgiven in the following sections.
2.1 The Fuelwood Availability (Supply) Aspect
2.1.1 Land Cover Classification
The land cover in the Cibodas Biosphere Reserve has been classified using satellite imagery(TM image 1991), aerial photographs (scale 1:50.000) and other existing maps.Furthermore, field surveys has been carried out to verify and update the classification(Danudoro, 1993, Wiyanto, 1990). This resulted in the identification of seventeen differentland cover types.
2.1.2 Fuelwood Production per Land Cover Ttype
On the basis of additional research (Suhaedi, 1992) and analysis of existing literature(Bekkering and Rusmanhadi, 1987, de Gier, 1989, Hueruman, 1979, RADEP, 1986,RADEP, 1987a, RADEP, 1987b, Smiet, 1990, Smiet et al., 1990, Wiersum, 1976) the
3
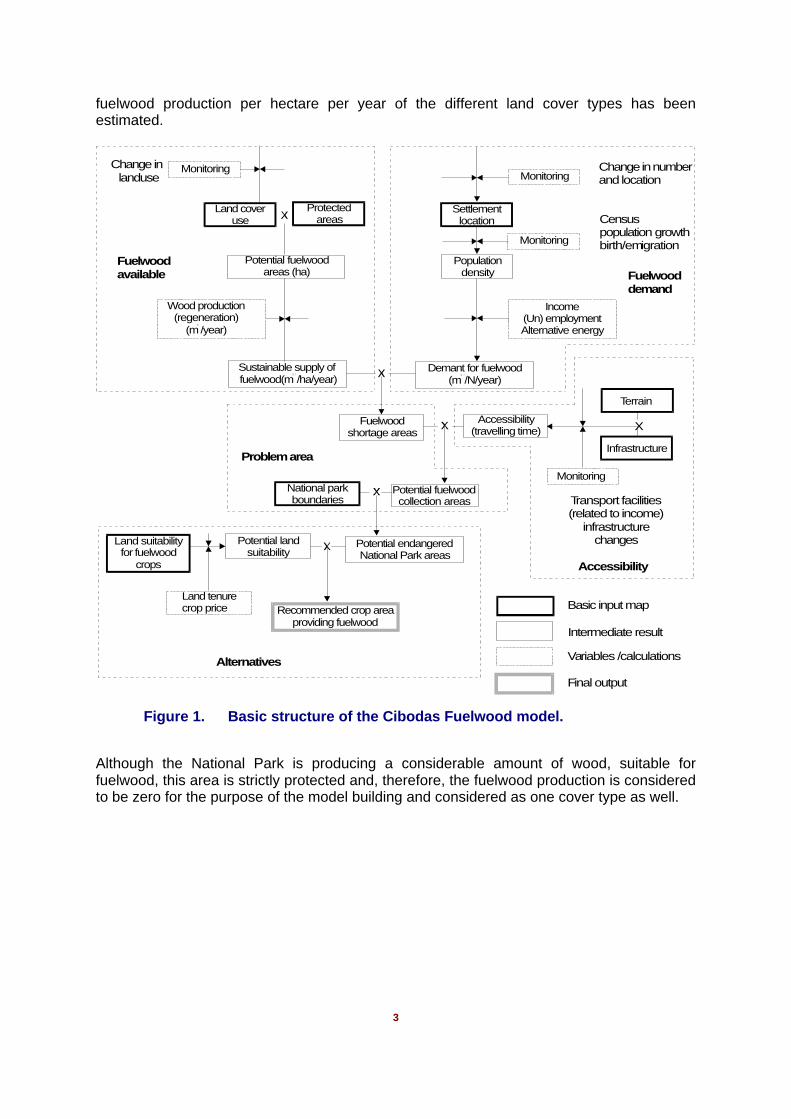
fuelwood production per hectare per year of the different land cover types has beenestimated.
Basic input map
Intermediate result
Variables /calculations
Final output
Alternatives
Problem area
Fuelwooddemand
Fuelwoodavailable
Accessibility
Change in number and location
Censuspopulation growthbirth/emigration
Monitoring
Monitoring
MonitoringChange in landuse
Land coveruse
Protected areas
Settlementlocation
Population density
Income(Un) employmentAlternative energy
Potential fuelwoodareas (ha)
Wood production(regeneration)
(m/year)3
Demant for fuelwood(m /N/year)
3 /
Sustainable supply of fuelwood(m /ha/year)
3 /
Fuelwoodshortage areas
Accessibility(travelling time)
Terrain
Infrastructure
National parkboundaries
Potential fuelwoodcollection areas
Land suitabilityfor fuelwood
crops
Potential landsuitability
Potential endangeredNational Park areas
Land tenurecrop price Recommended crop area
providing fuelwood
Monitoring
Transport facilities(related to income)
infrastructurechanges
X
Figure 1. Basic structure of the Cibodas Fuelwood model.
Although the National Park is producing a considerable amount of wood, suitable forfuelwood, this area is strictly protected and, therefore, the fuelwood production is consideredto be zero for the purpose of the model building and considered as one cover type as well.
4
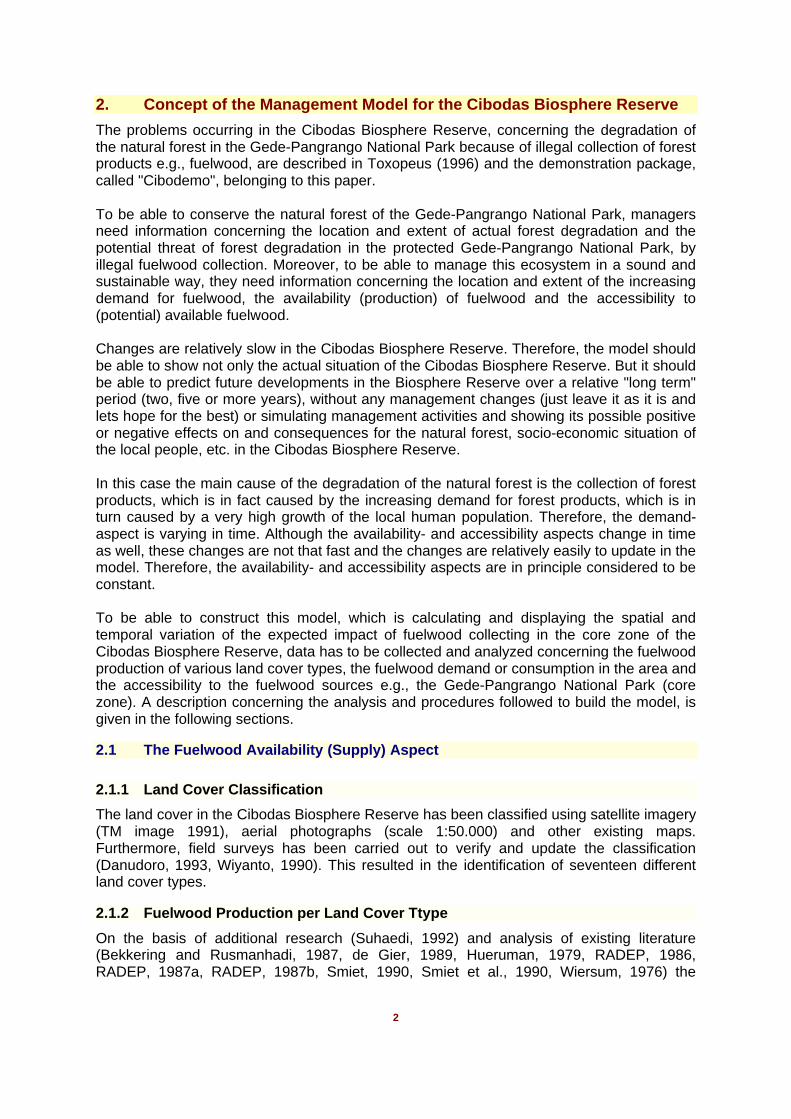
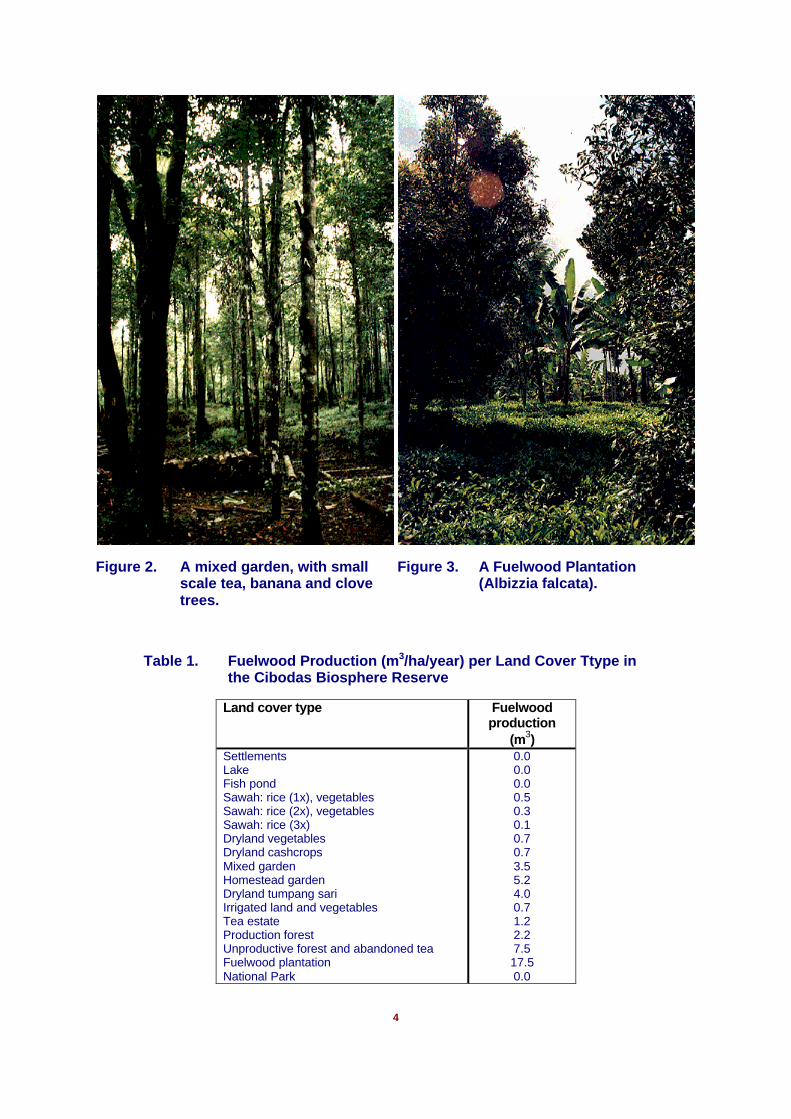
Figure 2. A mixed garden, with small Figure 3. A Fuelwood Plantationscale tea, banana and clove (Albizzia falcata).trees.
Table 1. Fuelwood Production (m3/ha/year) per Land Cover Ttype inthe Cibodas Biosphere Reserve
Land cover type Fuelwoodproduction
(m3)SettlementsLakeFish pondSawah: rice (1x), vegetablesSawah: rice (2x), vegetablesSawah: rice (3x)Dryland vegetablesDryland cashcropsMixed gardenHomestead gardenDryland tumpang sariIrrigated land and vegetablesTea estateProduction forestUnproductive forest and abandoned teaFuelwood plantationNational Park
0.00.00.00.50.30.10.70.73.55.24.00.71.22.27.517.50.0
5
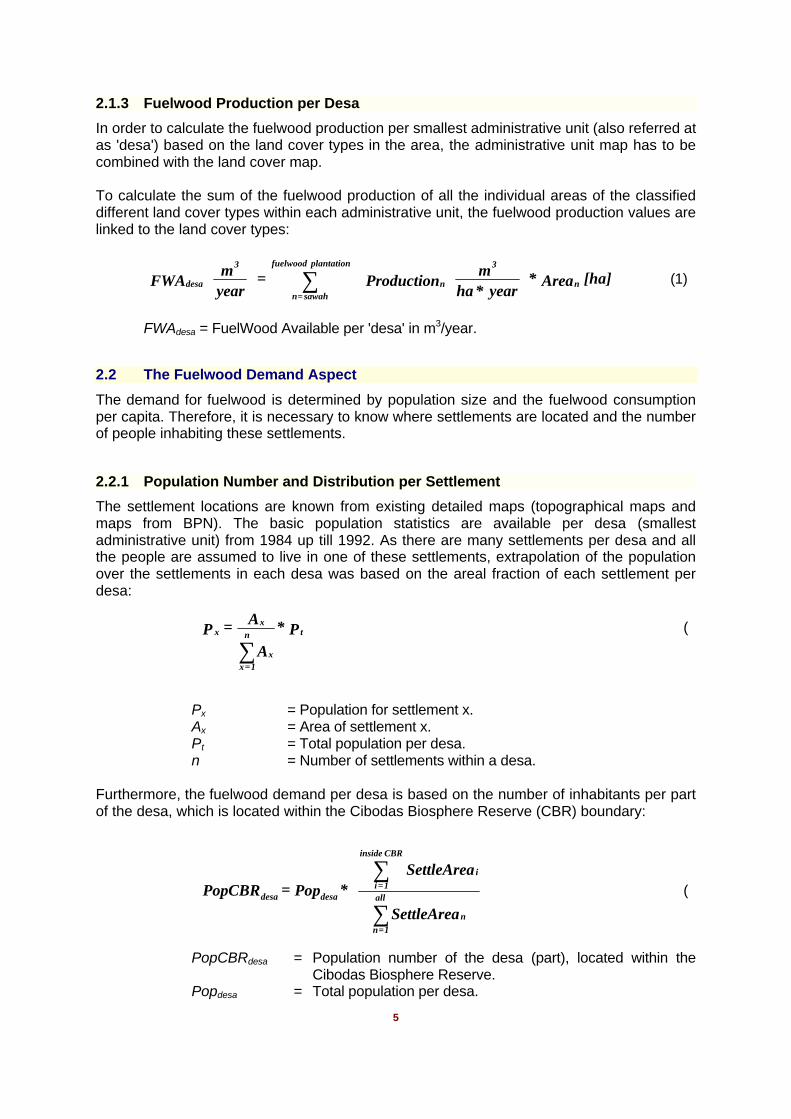
2.1.3 Fuelwood Production per Desa
In order to calculate the fuelwood production per smallest administrative unit (also referred atas 'desa') based on the land cover types in the area, the administrative unit map has to becombined with the land cover map.
To calculate the sum of the fuelwood production of all the individual areas of the classifieddifferent land cover types within each administrative unit, the fuelwood production values arelinked to the land cover types:
∑ [ha] Area *
year *ha m Production =
yearm FWA n
3
n
plantation fuelwood
sawah=n
3
desa (1)
FWAdesa = FuelWood Available per 'desa' in m3/year.
2.2 The Fuelwood Demand Aspect
The demand for fuelwood is determined by population size and the fuelwood consumptionper capita. Therefore, it is necessary to know where settlements are located and the numberof people inhabiting these settlements.
2.2.1 Population Number and Distribution per Settlement
The settlement locations are known from existing detailed maps (topographical maps andmaps from BPN). The basic population statistics are available per desa (smallestadministrative unit) from 1984 up till 1992. As there are many settlements per desa and allthe people are assumed to live in one of these settlements, extrapolation of the populationover the settlements in each desa was based on the areal fraction of each settlement perdesa:
Px = Population for settlement x.Ax = Area of settlement x.Pt = Total population per desa.n = Number of settlements within a desa.
Furthermore, the fuelwood demand per desa is based on the number of inhabitants per partof the desa, which is located within the Cibodas Biosphere Reserve (CBR) boundary:
PopCBRdesa = Population number of the desa (part), located within theCibodas Biosphere Reserve.
Popdesa = Total population per desa.
P*
A
A=P t
x
n
1=x
xx
∑(
∑
∑
SettleArea
SettleArea * Pop= PopCBR
n
all
1=n
i
CBRinside
1=idesadesa (
6
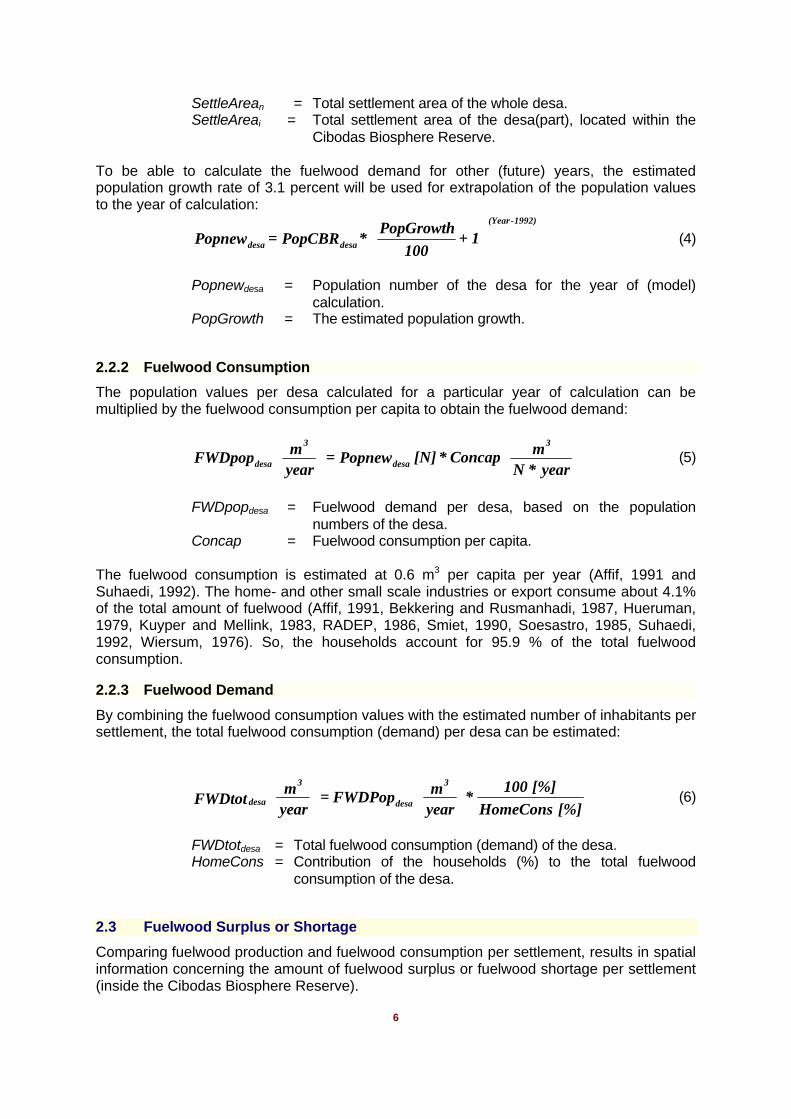
SettleArean = Total settlement area of the whole desa.SettleAreai = Total settlement area of the desa(part), located within the
Cibodas Biosphere Reserve.
To be able to calculate the fuelwood demand for other (future) years, the estimatedpopulation growth rate of 3.1 percent will be used for extrapolation of the population valuesto the year of calculation:
1+
100PopGrowth
* PopCBR= Popnew1992)-(Year
desadesa (4)
Popnewdesa = Population number of the desa for the year of (model)calculation.
PopGrowth = The estimated population growth.
2.2.2 Fuelwood Consumption
The population values per desa calculated for a particular year of calculation can bemultiplied by the fuelwood consumption per capita to obtain the fuelwood demand:
year * N
m Concap * [N] Popnew= yearm FWDpop
3
desa
3
desa (5)
FWDpopdesa = Fuelwood demand per desa, based on the populationnumbers of the desa.
Concap = Fuelwood consumption per capita.
The fuelwood consumption is estimated at 0.6 m3 per capita per year (Affif, 1991 andSuhaedi, 1992). The home- and other small scale industries or export consume about 4.1%of the total amount of fuelwood (Affif, 1991, Bekkering and Rusmanhadi, 1987, Hueruman,1979, Kuyper and Mellink, 1983, RADEP, 1986, Smiet, 1990, Soesastro, 1985, Suhaedi,1992, Wiersum, 1976). So, the households account for 95.9 % of the total fuelwoodconsumption.
2.2.3 Fuelwood Demand
By combining the fuelwood consumption values with the estimated number of inhabitants persettlement, the total fuelwood consumption (demand) per desa can be estimated:
[%] HomeCons[%]100
* yearm FWDPop=
yearm FWDtot
3
desa
3
desa
(6)
FWDtotdesa = Total fuelwood consumption (demand) of the desa.HomeCons = Contribution of the households (%) to the total fuelwood
consumption of the desa.
2.3 Fuelwood Surplus or Shortage
Comparing fuelwood production and fuelwood consumption per settlement, results in spatialinformation concerning the amount of fuelwood surplus or fuelwood shortage per settlement(inside the Cibodas Biosphere Reserve).
7
If there is an estimated fuelwood shortage in a certain area (settlement), it is assumed thatthe shortage of fuelwood is collected from nearby settlements with a surplus or from the corezone (National Park).
2.4 The Accessibility Aspect
Another aspect of the model is the accessibility to the National Park. The easier to access,the sooner people tend to go into the National Park for collecting fuelwood, especially if thereis a shortage. Therefore, the existence of infrastructure, different types of land cover, theprotective function of a buffer zone, the slope steepness and of course the location of thesettlements are taken in consideration. In other words, the "travel time" from a certainsettlement with fuelwood shortage to areas with a surplus of fuelwood (e.g., the NationalPark) is a function of slope steepness, infrastructure, land cover type and distance(Mannathoko et al., 1990).
2.4.1 Infrastructure and Land Cover
The infrastructure was classified on the basis of five different road types, each with a specifictravelling speed (in km/hour). The different land cover types were also classified according tothe expected walking speed (Mannathoko et al, 1990).
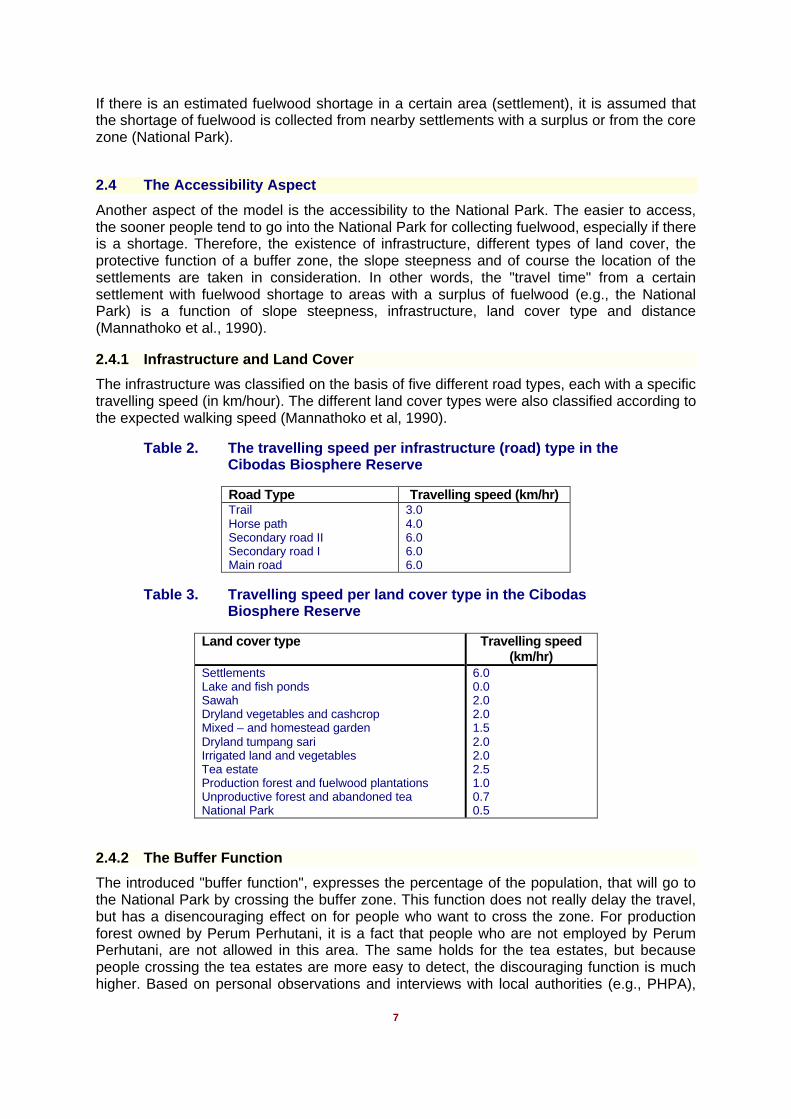
Table 2. The travelling speed per infrastructure (road) type in theCibodas Biosphere Reserve
Road Type Travelling speed (km/hr)TrailHorse pathSecondary road IISecondary road IMain road
3.04.06.06.06.0
Table 3. Travelling speed per land cover type in the CibodasBiosphere Reserve
Land cover type Travelling speed(km/hr)
SettlementsLake and fish pondsSawahDryland vegetables and cashcropMixed – and homestead gardenDryland tumpang sariIrrigated land and vegetablesTea estateProduction forest and fuelwood plantationsUnproductive forest and abandoned teaNational Park
6.00.02.02.01.52.02.02.51.00.70.5
2.4.2 The Buffer Function
The introduced "buffer function", expresses the percentage of the population, that will go tothe National Park by crossing the buffer zone. This function does not really delay the travel,but has a disencouraging effect on for people who want to cross the zone. For productionforest owned by Perum Perhutani, it is a fact that people who are not employed by PerumPerhutani, are not allowed in this area. The same holds for the tea estates, but becausepeople crossing the tea estates are more easy to detect, the discouraging function is muchhigher. Based on personal observations and interviews with local authorities (e.g., PHPA),

8
the "buffer function" for production forest is assumed to be effective for 50 percent and forthe tea estates only 20 percent of the number of people, expected to pass through.
2.4.3 Slope Steepness
The slope steepness of the area will also influence the accessibility to the National Park. Byinterpolating the contour lines (digitized from existing topographical maps) a map of theslope angles (in percent) can be created. The steeper the slope the more it will reduce thetravelling speed. Therefore, slope steepness has been classified according to the expectedinfluence on the travelling speed, called the slope correction factor (Mannathoko et al.,1990). These slope steepness correction factors will be applied to estimate the finaltravelling speed per land cover type. By combining the accessibility factors with thesettlement locations map, the expected travelling time from each settlement into the NationalPark was calculated.
Table 4. The slope steepness classes and the correction factorsapplied to the travelling speed in the Cibodas BiosphereReserve
Slope steepness Slope correction0% - 5%5% - 10%10% - 20%20% - 30%30% - 45%45% - 65%65% and higher
1.000.960.820.650.500.410.29
2.5 The Impact Assessment for Cibodas National Park
To estimate the vulnerability of the National Park, the calculated expected travelling timefrom each settlement to the National Park is combined with the "motivation" of the peopleper settlement to collect fuelwood from the National Park. The "motivation" is based on therelative fuelwood shortage for each settlement.
Settlements with a fuelwood shortage will be used as starting points for an accessibilitycalculation, taking as weight the "travelling speed" values per cover type, reduced by theslope correction factor. The settlements with a shortage have boundary areas around themwith values proportional to the inverted shortage of the settlements, to simulate "motivation".When the shortage is low, the values of the surrounding boundaries should be high. Highvalues reduce "travelling speed" in the distance calculation process (ILWIS, 1993).Therefore, low fuelwood shortage gives high resistance values around settlements (lowmotivation) and high fuelwood shortage gives low resistance values around settlements(high motivation).
The classes, used for the spatial display of the expected impact on the National Park, areconditioned by the amount of fuelwood shortage, calculated for the Cibodas BiosphereReserve. The result of the model, which is based on the year 1992, of the expected impactin the National Park is expressed in the four classes of impact: 1 (severe), 2 (moderate), 3(low) and 4 (no impact). The statistical data (real data) on the quantities of fuelwoodavailable, the demand for fuelwood and the shortage of fuelwood can be displayed for eachdesa separately.
9
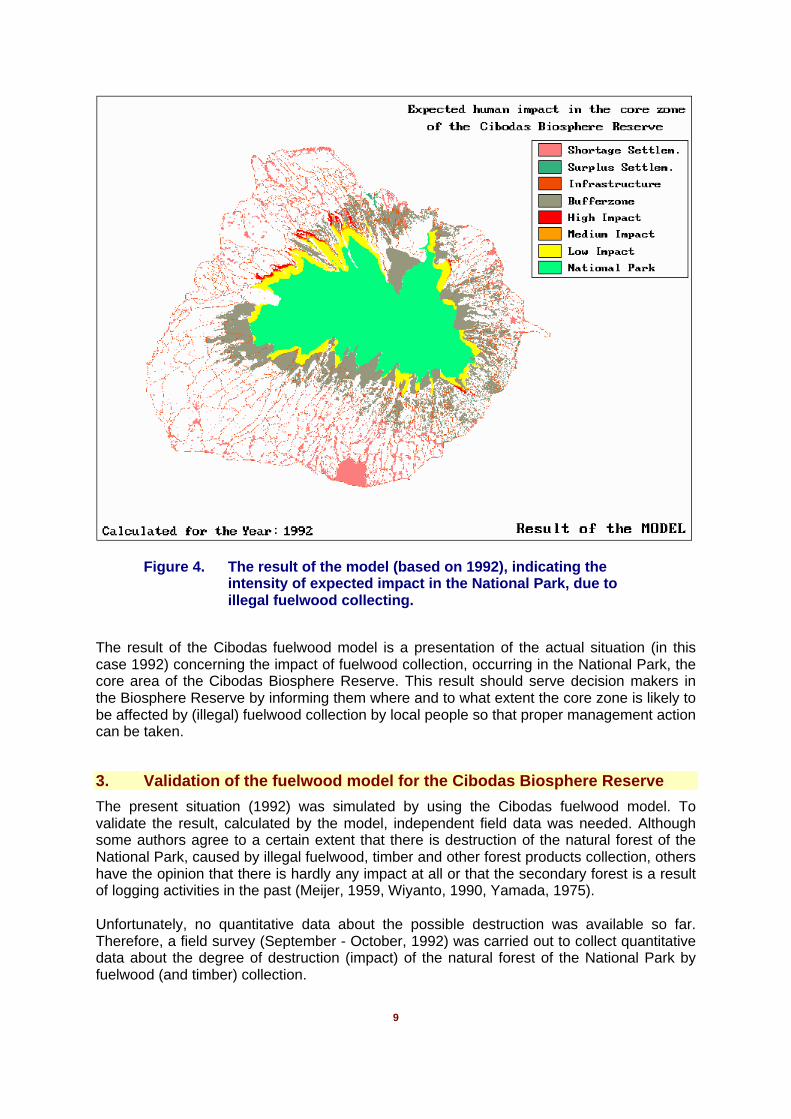
Figure 4. The result of the model (based on 1992), indicating theintensity of expected impact in the National Park, due toillegal fuelwood collecting.
The result of the Cibodas fuelwood model is a presentation of the actual situation (in thiscase 1992) concerning the impact of fuelwood collection, occurring in the National Park, thecore area of the Cibodas Biosphere Reserve. This result should serve decision makers inthe Biosphere Reserve by informing them where and to what extent the core zone is likely tobe affected by (illegal) fuelwood collection by local people so that proper management actioncan be taken.
3. Validation of the fuelwood model for the Cibodas Biosphere Reserve
The present situation (1992) was simulated by using the Cibodas fuelwood model. Tovalidate the result, calculated by the model, independent field data was needed. Althoughsome authors agree to a certain extent that there is destruction of the natural forest of theNational Park, caused by illegal fuelwood, timber and other forest products collection, othershave the opinion that there is hardly any impact at all or that the secondary forest is a resultof logging activities in the past (Meijer, 1959, Wiyanto, 1990, Yamada, 1975).
Unfortunately, no quantitative data about the possible destruction was available so far.Therefore, a field survey (September - October, 1992) was carried out to collect quantitativedata about the degree of destruction (impact) of the natural forest of the National Park byfuelwood (and timber) collection.
10
3.1 Methodology
The samples were subdivided in a number of sub-samples with the first sub-sample wasalways taken in the national park, close to the national park boundary (indicated by a markedPHPA boundary post). From there, more sub-samples were taken till no signs of destructionwere noticed any more. If useful, the second sub-sample was taken 100 m inside the park,the third sub-sample 250 m park inwards, the fourth 500 m inwards, the fifth 1000 minwards, etc. till no destruction was observed any more. The average (sub-) sample size was50 x 20 meters.
The impact was measured in terms of to the observed "illegal" wood cutting and categorizedaccording to the different stem-diameters. Only recent cutting, assumed to be less than oneyear old, was counted. Cuttings already overgrown with mosses, fungi or otherwise clearlywere not counted. Cuttings clearly associated with maintenance of official (PHPA) trails werenot included either.
To classify the impact of wood cutting on the natural forest, as measured during sampling,the number of cuttings and the average stem diameter of the cut wood were considered. Aconversion table, to convert stem diameter (φ cm) to woody biomass (m), as applied inforestry (Byram et al., 1978, Cunia, 1979, FAO, 1984, de Gier, 1989, Stanek and State,1978). The estimated loss of woody biomass per sample (total of 1,25 ha / sample) is thesummation of the calculated woody biomass loss in m; per stem diameter class.
The estimated (classified) impact on the natural vegetation in the National Park is based onthe expected loss of woody biomass (m/ha) per sample per year, compared to (% of) theestimated woody biomass (250 m/ha) of undisturbed forest in the National Park. Theestimated woody biomass of undisturbed forest is the average of the reported woodybiomass in undisturbed tropical evergreen rainforests, given by a number of authors(Bekkering, 1989, de Gier, 1989, Jordan, 1983, Kimmins, 1987, Oldeman, 1988, Paterson,1956, Persson, 1974, Whittaker and Woodwell, 1971).
Table 5. Classification of the impact per sample. The classification isbased on according to the percentage of woody biomassloss per year for each sample, compared with the woodybiomass of undisturbed samples
Impact class impact Loss of woody biomass (%)0134
No impactLittleModerateSevere
051025
It is very difficult to assess the real impact on the natural forest of illegal wood cutting perstem diameter. Wood cutting occurs in different sample units, each with a different floristiccomposition and structure. So, the impact of the wood cutting in these different samples willbe different even if the measured cuttings are comparable. Secondly, the cuttings aremeasured and counted. Cuttings per species were not recorded, but it makes a bigdifference in the impact if the cut species belongs to primary forest or to secondary growth.Thirdly, the small (young) trees are essential for the regrowth of the forest. To what extentthe cuttings of small trees will have an impact on the natural forest in relation to restoration isalso unclear.
Therefore, the classification of the impact of wood cutting on the natural forest is only anindication, based on a generalized calculation.
11
For each sample the buffer zone type (production forest, tea estate or rainfed- or irrigatedagriculture) the length of the buffer zone (from the beginning of the trail through the bufferzone till the national park boundary) has been indicated. The distance from the settlement orvillage nearest to the national park boundary has been considered as well, including all kindsof accessibility aspects, like roads, trails, rivers etc. A sketch map was prepared, to make thesituation as clear as possible. Other relevant information concerning the sample, likelocation, altitude, other disturbances etc. has been added. A relevee sheet was developed tocollect all relevant data in a consistent way, so that the different samples can compared.
3.2 Results of the field survey
During the fieldwork twenty sample areas are surveyed in different locations along theboundary of the National Park (core zone), in the Cibodas Biosphere Reserve. Where thesample starts the number of the PHPA-National Park demarcation was registered and alsothe nearest village to the National Park boundary. The administrative units e.g., desa,kecamatan and kabupaten to which the nearest village belongs is registered and the locationof the sample in the Biosphere Reserve.
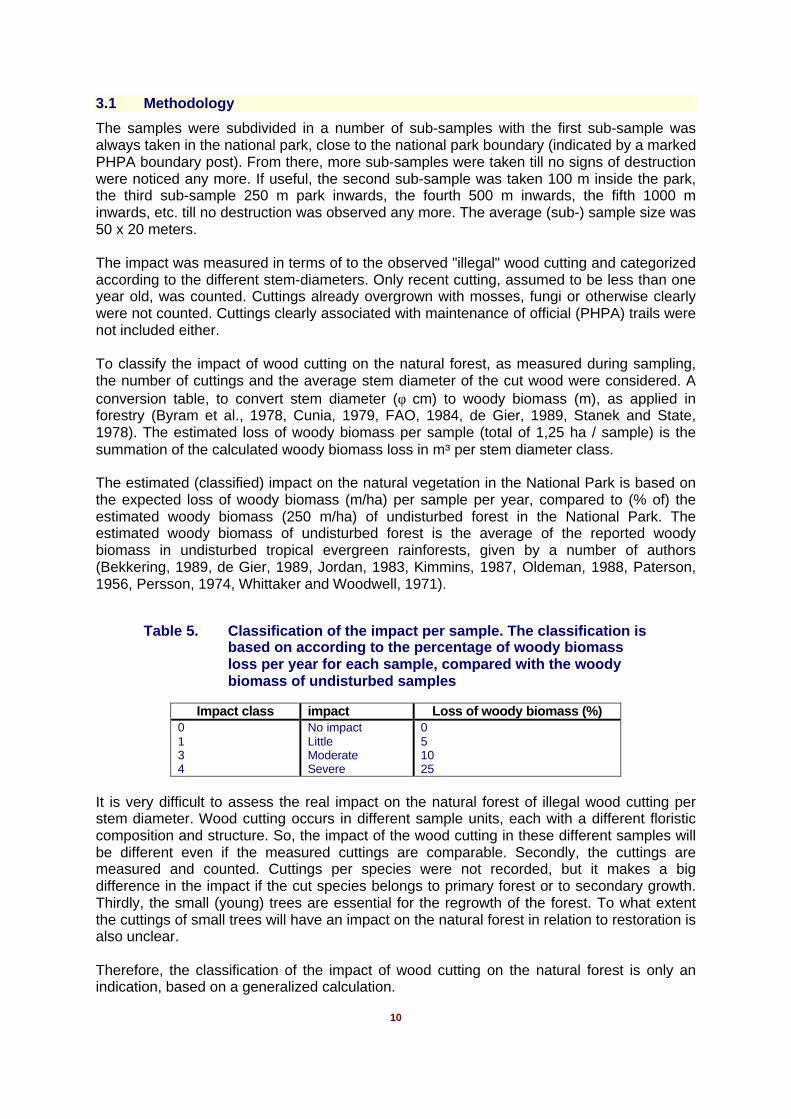
Figure 5. Severe impact due to illegal wood cutting in the Gede Pangrango NationalPark. Agricultural activities were very close to the boundary of theNational Park, because there was no buffer zone.
12
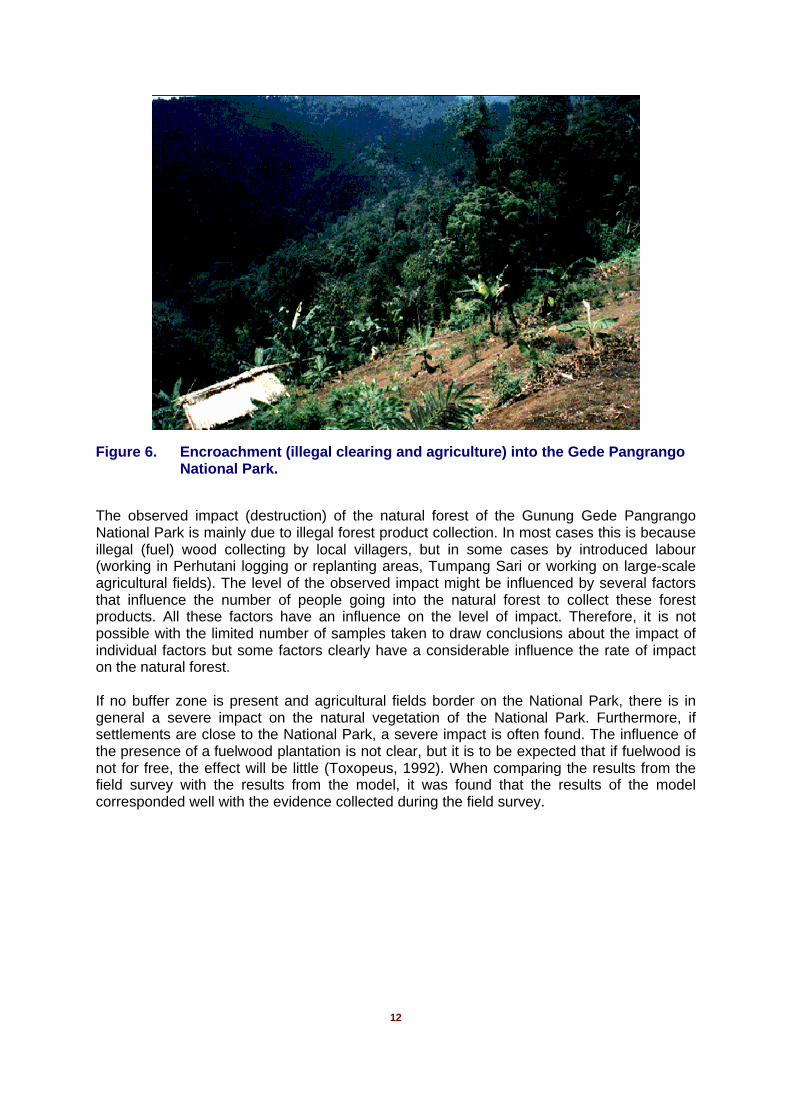
Figure 6. Encroachment (illegal clearing and agriculture) into the Gede PangrangoNational Park.
The observed impact (destruction) of the natural forest of the Gunung Gede PangrangoNational Park is mainly due to illegal forest product collection. In most cases this is becauseillegal (fuel) wood collecting by local villagers, but in some cases by introduced labour(working in Perhutani logging or replanting areas, Tumpang Sari or working on large-scaleagricultural fields). The level of the observed impact might be influenced by several factorsthat influence the number of people going into the natural forest to collect these forestproducts. All these factors have an influence on the level of impact. Therefore, it is notpossible with the limited number of samples taken to draw conclusions about the impact ofindividual factors but some factors clearly have a considerable influence the rate of impacton the natural forest.
If no buffer zone is present and agricultural fields border on the National Park, there is ingeneral a severe impact on the natural vegetation of the National Park. Furthermore, ifsettlements are close to the National Park, a severe impact is often found. The influence ofthe presence of a fuelwood plantation is not clear, but it is to be expected that if fuelwood isnot for free, the effect will be little (Toxopeus, 1992). When comparing the results from thefield survey with the results from the model, it was found that the results of the modelcorresponded well with the evidence collected during the field survey.
13
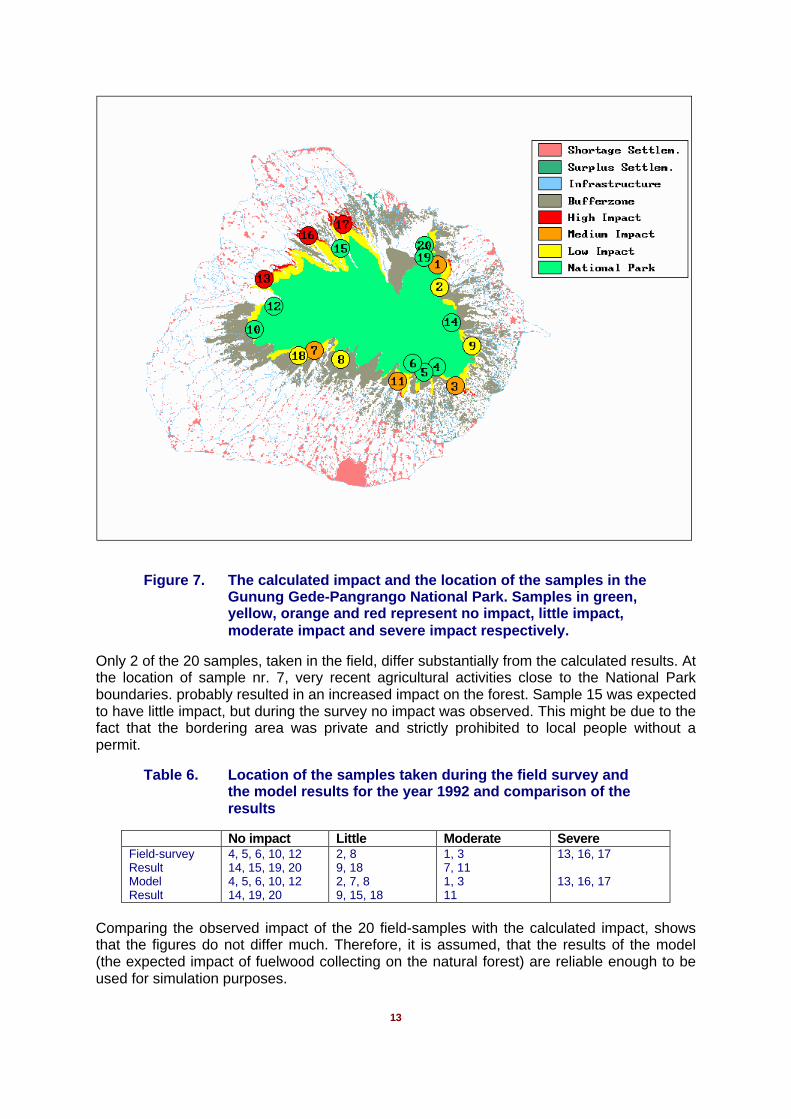
Figure 7. The calculated impact and the location of the samples in theGunung Gede-Pangrango National Park. Samples in green,yellow, orange and red represent no impact, little impact,moderate impact and severe impact respectively.
Only 2 of the 20 samples, taken in the field, differ substantially from the calculated results. Atthe location of sample nr. 7, very recent agricultural activities close to the National Parkboundaries. probably resulted in an increased impact on the forest. Sample 15 was expectedto have little impact, but during the survey no impact was observed. This might be due to thefact that the bordering area was private and strictly prohibited to local people without apermit.
Table 6. Location of the samples taken during the field survey andthe model results for the year 1992 and comparison of theresults
No impact Little Moderate SevereField-surveyResultModelResult
4, 5, 6, 10, 1214, 15, 19, 204, 5, 6, 10, 1214, 19, 20
2, 89, 182, 7, 89, 15, 18
1, 37, 111, 311
13, 16, 17
13, 16, 17
Comparing the observed impact of the 20 field-samples with the calculated impact, showsthat the figures do not differ much. Therefore, it is assumed, that the results of the model(the expected impact of fuelwood collecting on the natural forest) are reliable enough to beused for simulation purposes.
14
4. Sensivity Analysis of the Fuelwood Model
The sensivity analysis helps to identify parameters that strongly affect model output and that,therefore, must be estimated with great care. Most sensivity analyses of complex biophysicalmodels involve changing one parameter at a time. The sensivity analysis indicates a "robust"model when small changes in input parameters result in small changes in model output(Swartzman and Kaluzny, 1987).
4.1 Methodology
A sensitivity analysis was conducted by changing each parameter value by +/- 10% and +/-50%. The sensivity of the model results (the total amount of fuelwood shortage in theCibodas Biosphere Reserve) for the parameter examined, was classified
Table 7. The sensivity classes used
Parameter changes of +/- 10% and +/- 50% in their values+/- 10% change
result change (%)+/- 50% change
result change (%)Sensitivity of the model
0 – 1.0– 2.5
2.5 – 5.05.0 – 10.0
10.0 – 25.025.0 – 50.050.0 – 100.0
0 – 5.05.0 – 12.5
12.5 – 25.025.0 – 50.050.0 – 125.0125.0 – 250.0250.0 – 500.0
Extreme littleVery little
LittleModerate
MuchVery much
Severe
The research priority for the parameters examined is based on the effect of a certainparameter on the model result If the effect of a parameter is low, research priority is low aswell, if the effect of a parameter is high, research priority is high unless detailed researchdata concerning that parameter is already available.
4.2 Sensivity of the parameters used for the Cibodas Biosphere Reserve
The parameters, used in the Cibodas fuelwood model, are based on existing literature andor research in the field. A sensivity analysis has been conducted to estimate the effect of thedifferent parameters on the calculated fuelwood shortage.
Table 8. Results of the sensivity test of the used parameters for theCibodas fuelwood model
Parameters used % change+/- 10%
Impact+/- 50%
Sensitivity of themodel
AVAILABILITYFuelwood production valuesDEMANDFuelwood consumption/capitaFuelwood consumption rateACCESSIBILITYOf the different road typesOf the different land-use typesBufferzone functionalityAccording to slope steepness
10.4
13.84.6
6.72.60.91.0
14.5
59.45.5
7.73.76.78.7
Little to moderate
MuchVery little to little
Very little to moderateVery littleExtreme – to very littleExtreme – to very little
The basis quantity of available data on which the parameter value has been established andthe priority for further research of that specific parameter are indicated in table 9.
15
Table 9. Results of the sensivity test of and research priorities foreach parameter
Parameters used Sensitivity of the model Avail. data Researchpriority
AVAILABILITYFuelwood production valuesDEMANDFuelwood consumption/capitaFuelwood consumption rateACCESSIBILITYOf the different road typesOf the different land-use typesBufferzone functionalityAccording to slope steepness
Little to moderate
MuchVery little to little
Very little to moderateVery littleExtreme – to very littleExtreme – to very little
++
++++
+/-+/---
-
--
++--
According to the results of the tests, the fuelwood production values for each different land-use type and for the fuelwood consumption per capita are the most sensitive parameters.Both are a result of extensive literature studies and field surveys and therefore assumed tobe quite reliable. The fuelwood consumption rate (between household fuelwood use and thefuelwood use for small industries and export) has little influence on the final model output.The accessibility has very little to moderate influence on the model results. The values arebased on a survey done by Mannathoko et al., 1990. The bufferzone functionality and theslope steepness are based on very limited data. Their influence on the model output is little.
The most sensitive parameters in the Cibodas fuelwood model are studied intensively. It is ofgreat importance that these parameter values are regularly surveyed and if necessaryupdated. The output of the model is very much depending on the reliability of theseparameters.
5. Simulations in the Cibodas Biosphere Reserve
All kinds of management options and combination of options are possible and by runningsimulations, the model will present the expected outcome in a spatial representation,together with the statistical data of to each spatial entity. It is up to the user of the model todecide which management option (or combination of management options) will be mostappropriate.
5.1 Simulation possibilities
The procedure to change maps, tables or factors needed for running a desired simulation isbasically the same as for updating the model. The user can run any scenario for any yearand when the new calculations are finished, the expected result of that specific scenario willbe calculated. An overview of the possible options is given below:
Availability• maps: landcover/use• factors: fuelwood production per landuse type
Demand• maps: settlements• tables: population statistics• factors: population growth
• fuelwood consumption / capita• fuelwood consumption rate / area

16
Accessibility• maps: infrastructure
• landcover/use• factors: travelling speed using infrastructure
• travelling speed in the field• slope correction• protective buffer function
5.2 Management Decisions (Simulations) and the Expected Response
During the regional workshop on "Geo-Information systems for Natural ResourceManagement of Biosphere Reserves", d.d. 14 - 17 June, 1993 in Bogor, Indonesia, theparticipants analyzed the problems occurring in the Cibodas Biosphere Reserve anddiscussed possible management options, to solve these problems. By making use of thedeveloped fuelwood model several simulations were done. The results are discussed below.
The result of the model refers to the year 1992. In total the fuelwood available from thebuffer zone and the transition zone is 97852 m3, but the total demand for fuelwood by thepeople living in the transition zone of the Cibodas Biosphere Reserve is estimated to be421196 m3, resulting in a shortage for fuelwood of 323344 m3. Only 7 of the 156 desa'shave a fuelwood surplus (e.g., Cibeureum 1082 m3, Sarampad 91 m3, Kemangman 612 m3,Bunikasih 545 m3, Tegalega 433 m3, Kebonpeut 211 m3 and Gekbrong 587 m3). The areasof the park with severe damage from illegal fuelwood collection are mainly in thenorthwestern, northeastern and southeastern part of the national park,.where the nationalpark is not or little protected by a buffer zone.
Figure 8. The spatial result of the model, based on the situation in theyear 1992. Black represents severe impact, dark grey less
17
impact and medium grey no impact in the National Park. Thelight grey areas surrounding the National Park is the bufferzone area (production forest or tea estate). The light greyareas in the transition zone are settlements or representsinfrastructure.
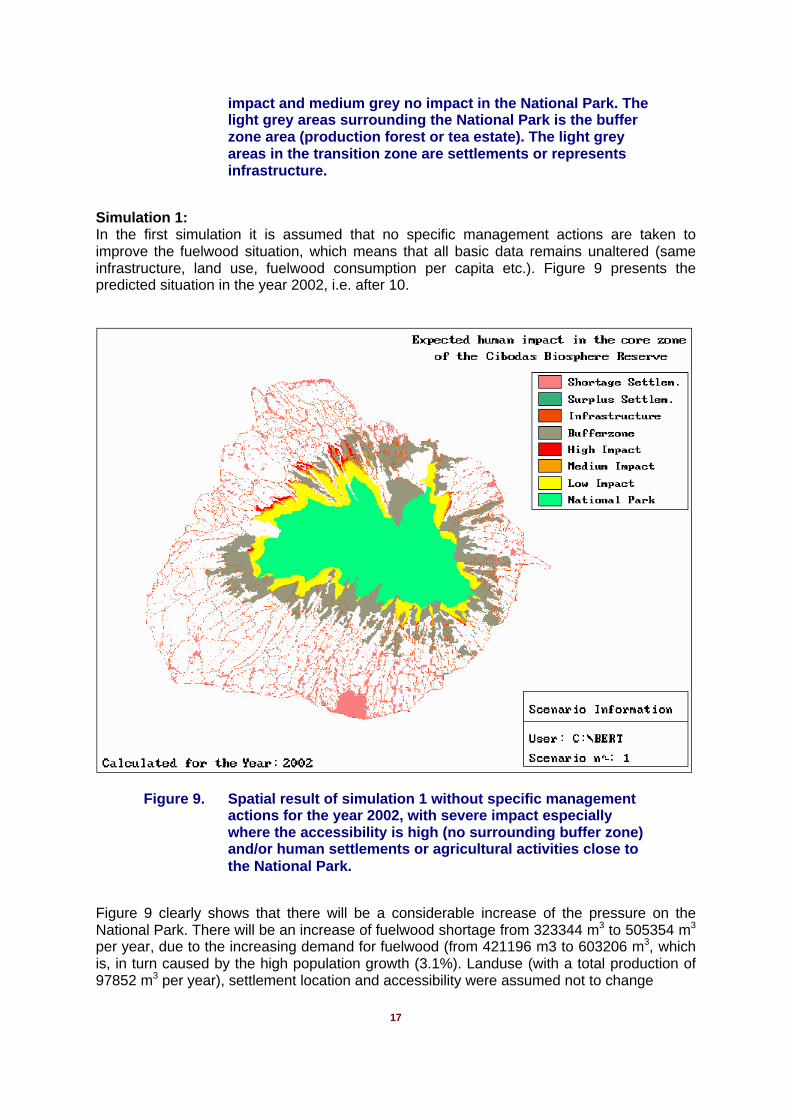
Simulation 1:In the first simulation it is assumed that no specific management actions are taken toimprove the fuelwood situation, which means that all basic data remains unaltered (sameinfrastructure, land use, fuelwood consumption per capita etc.). Figure 9 presents thepredicted situation in the year 2002, i.e. after 10.
Figure 9. Spatial result of simulation 1 without specific managementactions for the year 2002, with severe impact especiallywhere the accessibility is high (no surrounding buffer zone)and/or human settlements or agricultural activities close tothe National Park.
Figure 9 clearly shows that there will be a considerable increase of the pressure on theNational Park. There will be an increase of fuelwood shortage from 323344 m3 to 505354 m3
per year, due to the increasing demand for fuelwood (from 421196 m3 to 603206 m3, whichis, in turn caused by the high population growth (3.1%). Landuse (with a total production of97852 m3 per year), settlement location and accessibility were assumed not to change
18
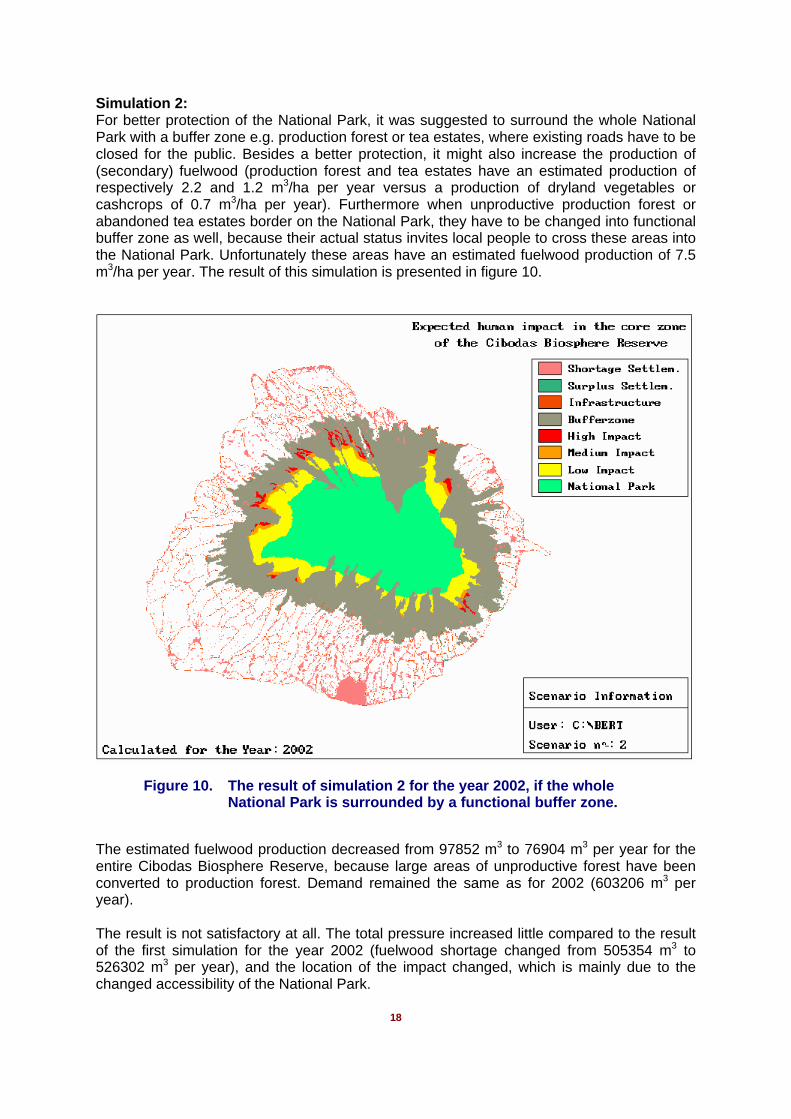
Simulation 2:For better protection of the National Park, it was suggested to surround the whole NationalPark with a buffer zone e.g. production forest or tea estates, where existing roads have to beclosed for the public. Besides a better protection, it might also increase the production of(secondary) fuelwood (production forest and tea estates have an estimated production ofrespectively 2.2 and 1.2 m3/ha per year versus a production of dryland vegetables orcashcrops of 0.7 m3/ha per year). Furthermore when unproductive production forest orabandoned tea estates border on the National Park, they have to be changed into functionalbuffer zone as well, because their actual status invites local people to cross these areas intothe National Park. Unfortunately these areas have an estimated fuelwood production of 7.5m3/ha per year. The result of this simulation is presented in figure 10.
Figure 10. The result of simulation 2 for the year 2002, if the wholeNational Park is surrounded by a functional buffer zone.
The estimated fuelwood production decreased from 97852 m3 to 76904 m3 per year for theentire Cibodas Biosphere Reserve, because large areas of unproductive forest have beenconverted to production forest. Demand remained the same as for 2002 (603206 m3 peryear).
The result is not satisfactory at all. The total pressure increased little compared to the resultof the first simulation for the year 2002 (fuelwood shortage changed from 505354 m3 to526302 m3 per year), and the location of the impact changed, which is mainly due to thechanged accessibility of the National Park.
19
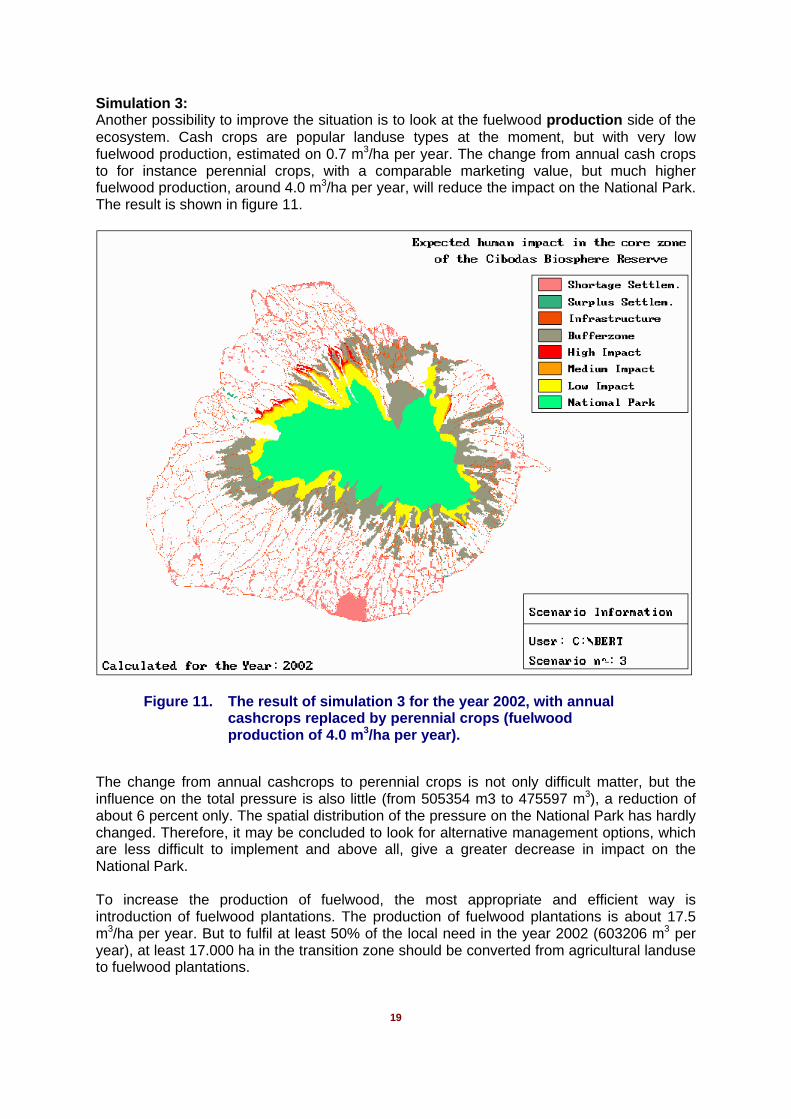
Simulation 3:Another possibility to improve the situation is to look at the fuelwood production side of theecosystem. Cash crops are popular landuse types at the moment, but with very lowfuelwood production, estimated on 0.7 m3/ha per year. The change from annual cash cropsto for instance perennial crops, with a comparable marketing value, but much higherfuelwood production, around 4.0 m3/ha per year, will reduce the impact on the National Park.The result is shown in figure 11.
Figure 11. The result of simulation 3 for the year 2002, with annualcashcrops replaced by perennial crops (fuelwoodproduction of 4.0 m3/ha per year).
The change from annual cashcrops to perennial crops is not only difficult matter, but theinfluence on the total pressure is also little (from 505354 m3 to 475597 m3), a reduction ofabout 6 percent only. The spatial distribution of the pressure on the National Park has hardlychanged. Therefore, it may be concluded to look for alternative management options, whichare less difficult to implement and above all, give a greater decrease in impact on theNational Park.
To increase the production of fuelwood, the most appropriate and efficient way isintroduction of fuelwood plantations. The production of fuelwood plantations is about 17.5m3/ha per year. But to fulfil at least 50% of the local need in the year 2002 (603206 m3 peryear), at least 17.000 ha in the transition zone should be converted from agricultural landuseto fuelwood plantations.
20
The whole transition zone of the Cibodas Biosphere Reserve is about 45.000 ha, whichmeans that about 37% of the whole transition zone should be converted to fuelwoodplantations, to fulfil only 50% of the local need. This seems a very unrealistic managementoption.
When comparing the amount of fuelwood produced in the Cibodas Biosphere Reserve withthe local demand for fuelwood, the difference is great. The demand is about six timesgreater than the production. Therefore, the next simulations attempt to reduce the demandfor fuelwood.
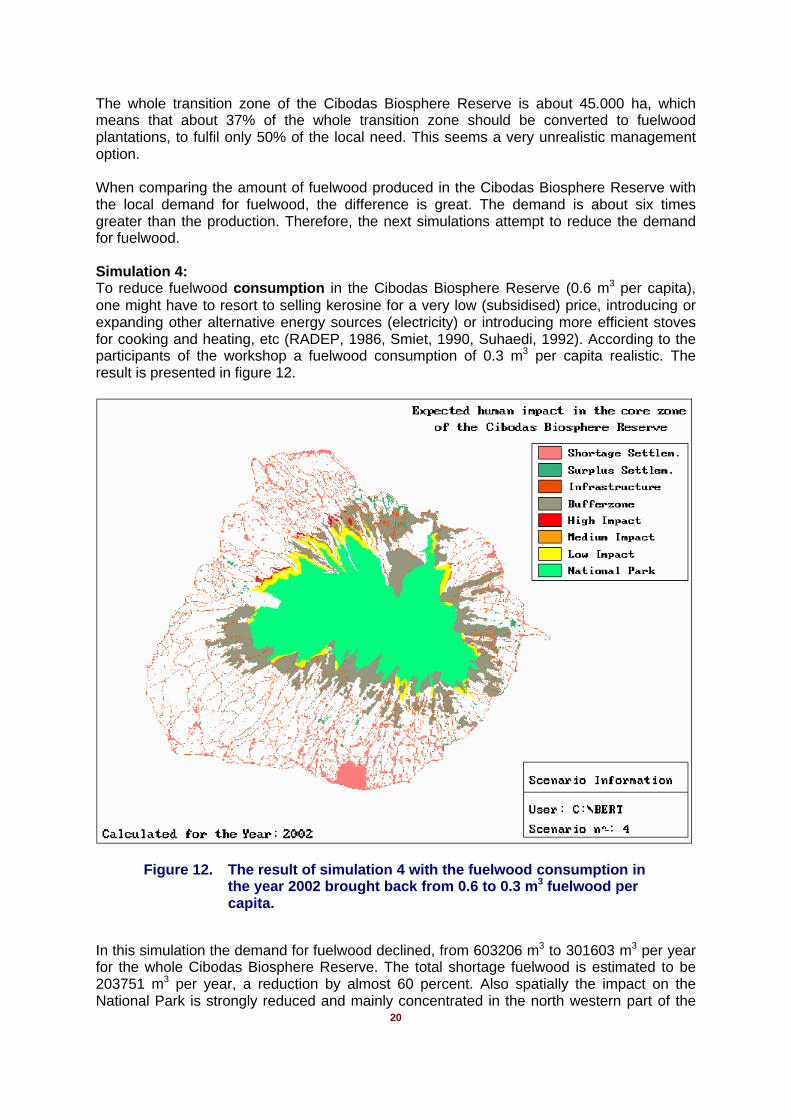
Simulation 4:To reduce fuelwood consumption in the Cibodas Biosphere Reserve (0.6 m3 per capita),one might have to resort to selling kerosine for a very low (subsidised) price, introducing orexpanding other alternative energy sources (electricity) or introducing more efficient stovesfor cooking and heating, etc (RADEP, 1986, Smiet, 1990, Suhaedi, 1992). According to theparticipants of the workshop a fuelwood consumption of 0.3 m3 per capita realistic. Theresult is presented in figure 12.
Figure 12. The result of simulation 4 with the fuelwood consumption inthe year 2002 brought back from 0.6 to 0.3 m3 fuelwood percapita.
In this simulation the demand for fuelwood declined, from 603206 m3 to 301603 m3 per yearfor the whole Cibodas Biosphere Reserve. The total shortage fuelwood is estimated to be203751 m3 per year, a reduction by almost 60 percent. Also spatially the impact on theNational Park is strongly reduced and mainly concentrated in the north western part of the
21
core zone. If fuelwood consumption can be curbed to 0.3 m3 per capita, the development ofan ecosystem that can survive the fuelwood crisis is really going in the right direction. It isclear that this item deserves attention and priority.
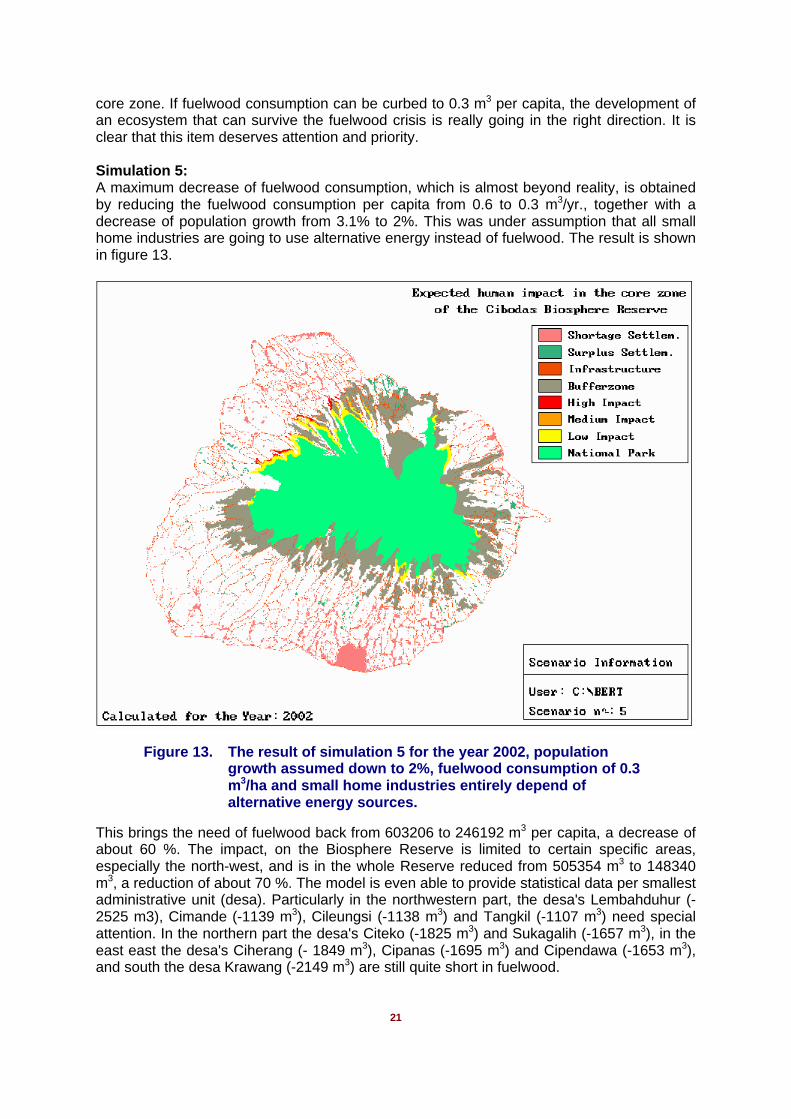
Simulation 5:A maximum decrease of fuelwood consumption, which is almost beyond reality, is obtainedby reducing the fuelwood consumption per capita from 0.6 to 0.3 m3/yr., together with adecrease of population growth from 3.1% to 2%. This was under assumption that all smallhome industries are going to use alternative energy instead of fuelwood. The result is shownin figure 13.
Figure 13. The result of simulation 5 for the year 2002, populationgrowth assumed down to 2%, fuelwood consumption of 0.3m3/ha and small home industries entirely depend ofalternative energy sources.
This brings the need of fuelwood back from 603206 to 246192 m3 per capita, a decrease ofabout 60 %. The impact, on the Biosphere Reserve is limited to certain specific areas,especially the north-west, and is in the whole Reserve reduced from 505354 m3 to 148340m3, a reduction of about 70 %. The model is even able to provide statistical data per smallestadministrative unit (desa). Particularly in the northwestern part, the desa's Lembahduhur (-2525 m3), Cimande (-1139 m3), Cileungsi (-1138 m3) and Tangkil (-1107 m3) need specialattention. In the northern part the desa's Citeko (-1825 m3) and Sukagalih (-1657 m3), in theeast east the desa's Ciherang (- 1849 m3), Cipanas (-1695 m3) and Cipendawa (-1653 m3),and south the desa Krawang (-2149 m3) are still quite short in fuelwood.
22
From this it may be concluded, that the main emphasis in developing satisfactorymanagement options will be on a combination of management measures. If only 5% of thetotal transition zone (about 2250 ha) is converted to fuelwood plantation (stimulated by therecently started and subsidised 'regreening programme'), still 563831 m3 is needed in theyear 2002. If fuelwood consumption can be reduced from 0.6 to 0.3 m3 per capita (local need301603 m3 per year), still 262228 m3 is needed. If population growth can be brought back to2% as well and the small home industries change completely to alternative energy(simulation 6), the need is still 108965 m3. This means for example that at least 6000 ha ofadditional fuelwood plantations are needed to fulfil meet the demand.For total protection of the National Park an additional 108965 m3 fuelwood has to come fromother sources e.g. from other less densely populated areas. Furthermore, the manager isnow aware of the locations, which are the most susceptible to degradation, by illegalfuelwood collection. He can propose other, more selective and small scale managementactivities even to protect these areas against degradation.
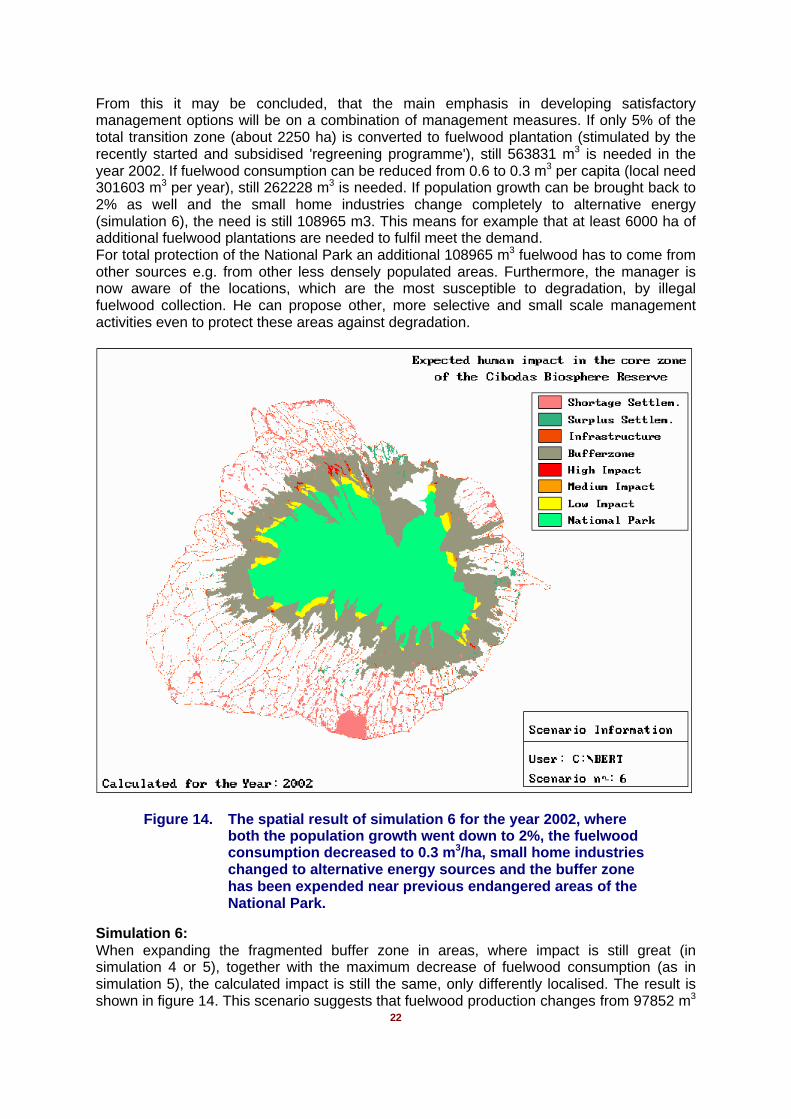
Figure 14. The spatial result of simulation 6 for the year 2002, whereboth the population growth went down to 2%, the fuelwoodconsumption decreased to 0.3 m3/ha, small home industrieschanged to alternative energy sources and the buffer zonehas been expended near previous endangered areas of theNational Park.
Simulation 6:When expanding the fragmented buffer zone in areas, where impact is still great (insimulation 4 or 5), together with the maximum decrease of fuelwood consumption (as insimulation 5), the calculated impact is still the same, only differently localised. The result isshown in figure 14. This scenario suggests that fuelwood production changes from 97852 m3
23
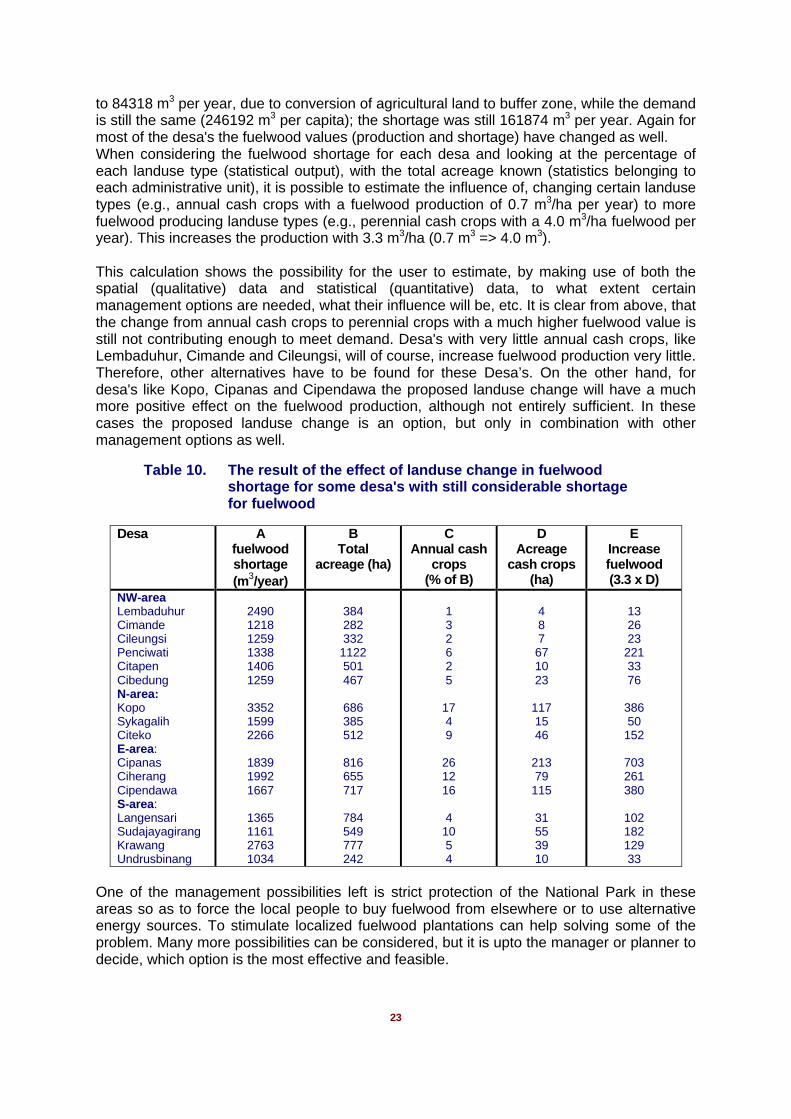
to 84318 m3 per year, due to conversion of agricultural land to buffer zone, while the demandis still the same (246192 m3 per capita); the shortage was still 161874 m3 per year. Again formost of the desa's the fuelwood values (production and shortage) have changed as well.When considering the fuelwood shortage for each desa and looking at the percentage ofeach landuse type (statistical output), with the total acreage known (statistics belonging toeach administrative unit), it is possible to estimate the influence of, changing certain landusetypes (e.g., annual cash crops with a fuelwood production of 0.7 m3/ha per year) to morefuelwood producing landuse types (e.g., perennial cash crops with a 4.0 m3/ha fuelwood peryear). This increases the production with 3.3 m3/ha (0.7 m3 => 4.0 m3).
This calculation shows the possibility for the user to estimate, by making use of both thespatial (qualitative) data and statistical (quantitative) data, to what extent certainmanagement options are needed, what their influence will be, etc. It is clear from above, thatthe change from annual cash crops to perennial crops with a much higher fuelwood value isstill not contributing enough to meet demand. Desa's with very little annual cash crops, likeLembaduhur, Cimande and Cileungsi, will of course, increase fuelwood production very little.Therefore, other alternatives have to be found for these Desa’s. On the other hand, fordesa's like Kopo, Cipanas and Cipendawa the proposed landuse change will have a muchmore positive effect on the fuelwood production, although not entirely sufficient. In thesecases the proposed landuse change is an option, but only in combination with othermanagement options as well.
Table 10. The result of the effect of landuse change in fuelwoodshortage for some desa's with still considerable shortagefor fuelwood
Desa Afuelwoodshortage(m3/year)
BTotal
acreage (ha)
CAnnual cash
crops(% of B)
DAcreage
cash crops(ha)
EIncreasefuelwood(3.3 x D)
NW-areaLembaduhurCimandeCileungsiPenciwatiCitapenCibedungN-area:KopoSykagalihCitekoE-area:CipanasCiherangCipendawaS-area:LangensariSudajayagirangKrawangUndrusbinang
249012181259133814061259
335215992266
183919921667
1365116127631034
384282332
1122501467
686385512
816655717
784549777242
132625
1749
261216
41054
487671023
1171546
21379
115
31553910
132623
2213376
38650
152
703261380
10218212933
One of the management possibilities left is strict protection of the National Park in theseareas so as to force the local people to buy fuelwood from elsewhere or to use alternativeenergy sources. To stimulate localized fuelwood plantations can help solving some of theproblem. Many more possibilities can be considered, but it is upto the manager or planner todecide, which option is the most effective and feasible.
24
5.3 Simulation of the Cibodas Biosphere Reserve in practice
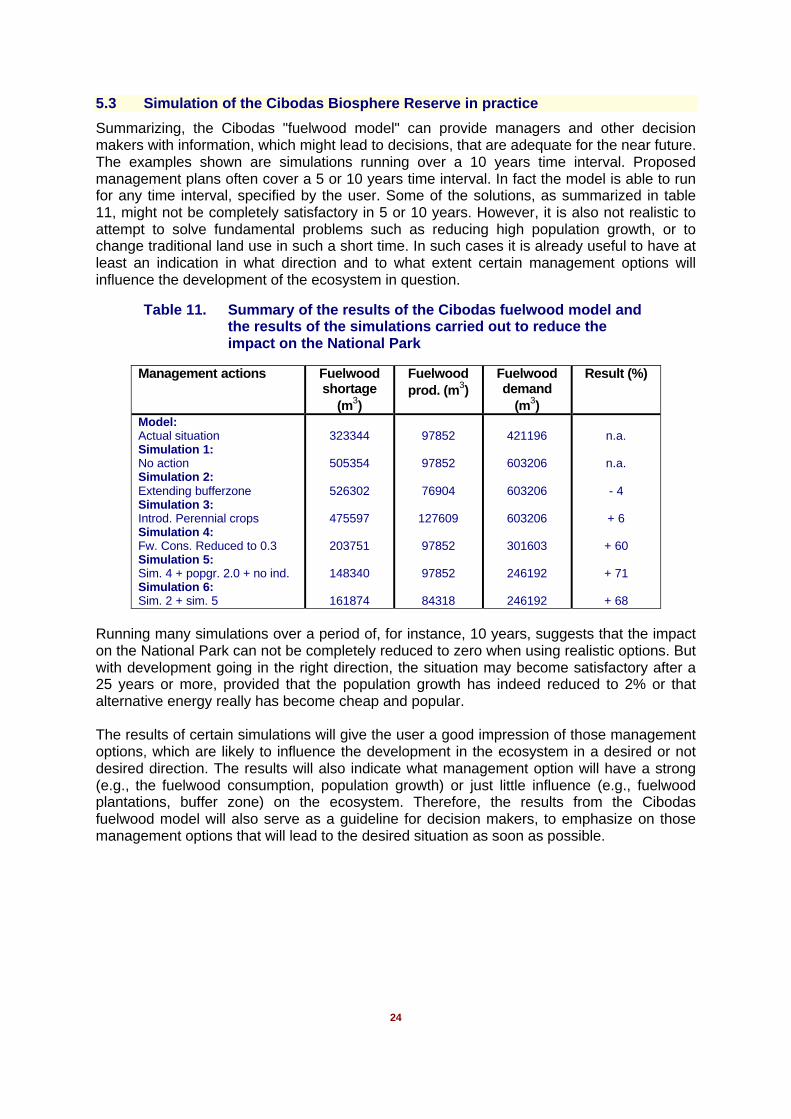
Summarizing, the Cibodas "fuelwood model" can provide managers and other decisionmakers with information, which might lead to decisions, that are adequate for the near future.The examples shown are simulations running over a 10 years time interval. Proposedmanagement plans often cover a 5 or 10 years time interval. In fact the model is able to runfor any time interval, specified by the user. Some of the solutions, as summarized in table11, might not be completely satisfactory in 5 or 10 years. However, it is also not realistic toattempt to solve fundamental problems such as reducing high population growth, or tochange traditional land use in such a short time. In such cases it is already useful to have atleast an indication in what direction and to what extent certain management options willinfluence the development of the ecosystem in question.
Table 11. Summary of the results of the Cibodas fuelwood model andthe results of the simulations carried out to reduce theimpact on the National Park
Management actions Fuelwoodshortage
(m3)
Fuelwoodprod. (m3)
Fuelwooddemand
(m3)
Result (%)
Model:Actual situationSimulation 1:No actionSimulation 2:Extending bufferzoneSimulation 3:Introd. Perennial cropsSimulation 4:Fw. Cons. Reduced to 0.3Simulation 5:Sim. 4 + popgr. 2.0 + no ind.Simulation 6:Sim. 2 + sim. 5
323344
505354
526302
475597
203751
148340
161874
97852
97852
76904
127609
97852
97852
84318
421196
603206
603206
603206
301603
246192
246192
n.a.
n.a.
- 4
+ 6
+ 60
+ 71
+ 68
Running many simulations over a period of, for instance, 10 years, suggests that the impacton the National Park can not be completely reduced to zero when using realistic options. Butwith development going in the right direction, the situation may become satisfactory after a25 years or more, provided that the population growth has indeed reduced to 2% or thatalternative energy really has become cheap and popular.
The results of certain simulations will give the user a good impression of those managementoptions, which are likely to influence the development in the ecosystem in a desired or notdesired direction. The results will also indicate what management option will have a strong(e.g., the fuelwood consumption, population growth) or just little influence (e.g., fuelwoodplantations, buffer zone) on the ecosystem. Therefore, the results from the Cibodasfuelwood model will also serve as a guideline for decision makers, to emphasize on thosemanagement options that will lead to the desired situation as soon as possible.
25
6. References
Affif, M.T., 1991.Environmental risk zoning in the Sukabumi area, West Java,Indonesia. MSc-thesis, ITC,Enschede, 100 pp.
Bekkering, T.D., 1989. Projections for fuelwood supply and demand in the Konto River Watershed. Konto RiverProject, ATA 206, working paper no. 28, 25 pp.
Bekkering, T.D. and Rusmanhadi, 1987. Issues on fuelwood. Kali Konto River Project, Working Paper no. 12,Malang, 26 pp.
Byram, T.D., C.H.M. van Bavel and J.P. van Buijtenen, 1978. Biomass production of east Texas woodlands.Tappi Vol. 61 no. 6, pp: 65-67.
Cunia, T., 1979. On sampling trees for Biomass table construction: some statistical comments. In: Frayer, W.D.(ed.). Forest Resource Inventories. Workshop Proceedings, Vol. II, Colorado State University, FortCollins, Colorado, pp: 643-664.
Danudoro, P., 1993. The use of knowledge-based approach in the integration of Remote Sensing and Geo-Information Systems for Land use mapping. A case study in the buffer zone of Cibodas BiosphereReserve, West Java. Msc-thesis, ITC, Enschede, 59 pp.
FAO, 1984. Land evaluation for forestry. FAO Forestry paper no. 48, Rome, 123 pp.
Gier, A. de, 1989. Woody Biomass for Fuel, Estimating the Supply in Natural Woodlands and Shrublands, ITCpublication no.9, 142 pp.
Hueruman, H., 1979. Consumption and availability of energy in rural areas in relation with the environmentalsituation in West Java. Unpublished Report Forest Faculty, IPB, Bogor, 22 pp.
ILWIS, 1993. ILWIS 1.4 User's manual, 3d edition, Vol. I and Vol II, ITC, Enschede.
Jordan, C.F., 1983. Productivity of tropical rain forest ecosystem and the implications for their use as a futurewood and energy source. In: F.B.Golley (ed.), Tropical Rain Forest Ecosystems, Structure and Function,pp: 117-136.
Kimmins, J.P., 1987. Forest Ecology. McMillan Publ. Co., New York, 531 pp.
Kuyper, J. and W. Mellink, 1983. Supply, demand and consumption of fuelwood for rural households in CentralJava. Internal Report, Dept. Boshuishoudkunde, University of Wageningen, Wageningen.
Mannathoko, L.B., S. Kabore, H.M. Kiyee, A.E.D. Stolle, L. Li Hong, R.H.Emanuels, A. El Tohami andS.Swuttanakoon, 1990. A case study on land use, land resources and aspects of human geography inparts of Lom Kao District of Petchabun Province, Thailand. Research report, ITC, Enschede, 93 pp.
Meijer, W., 1959. Plantsociological analysis of montane rain forest near Tjibodas, West Java. Acta BotanicaNeerlandica, Vol. 8, pp: 277-291.
Oldeman, R.A.A., 1988. Tropical Rain Forest: a hot and humid issue, pp 81-97,, In:Proceedings of the Int. Conf.on Tropical Forest Management, Wageningen, 7th September 1988.
Paterson, S.S., 1956. The forest area of the world and its potential productivity. Royal University of Gothenburg.
Persson, R., 1974. World forest resource: Review of the world's forest resources in the early 1970's. ResearchNote, Royal Collage of Forestry, Stockholm.
RADEP, 1986. Report of a study on fuelwood potential and supply in the province of West Java. Regional EnergyDevelopment Project of West Java. Working Paper no. 2. Forestry Faculty Bogor Agricultural University,Bogor, 54 pp.
RADEP, 1987a. Fuelwood flows between kabupatens in West Java. Regional Energy Development Plan of WestJava, Working Paper no. 12. Forestry Faculty Bogor Agricultural University, Bogor.
RADEP, 1987b. Fuelwood supply projection in West Java for 1986-1995. Regional Energy Project of West Java.Forestry Faculty Bogor Agricultural University, Bogor.
Smiet, A.C., 1990. Agro-forestry and Fuelwood in Java. Environmental Conservation, vol. 17, no. 3, pp: 235-238.
Smiet, A.C., M. Kurmana and B. Sugito, 1990. The Fuelwood Issue in the Cimandiri Watershed, West Java.SECM, special publication No.3, pp: 26-38.
Soesastro, M.H., 1985. Policy analysis of rural household energy needs in West Java. Unpublished report.
Stanek, W. and D. State, 1978. Equations predicting primary productivity (biomass) of trees, shrubs and lesservegetation, based on current literature. Canadian Forest Service, Pacific Forest Research Centre.Victoria BC.

26
Suhaedi, E., 1992. Land Evaluation for Environmental management. A case study in the buffer zone of theCibodas Biosphere Reserve in the Sukabumi region, West Java. MSc-thesis, ITC, Enschede, 86 pp.
Swartzman, G.L. and S.P. Kaluzny, 1987. Ecological Simulation Primer. MacMillan Publ. Co., New York, USA.
Toxopeus, A.G., 1992. Report on a field survey on the Spatial Variation of the impact of Fuelwood Collection inthe core zone of the Cibodas Biosphere Reserve (Indonesia). ITC-UNESCO "Geo-Information forEnvironmentally Sound Management of Natural Resources", Working Document No. 5, ITC, Enschede,80 pp.
Toxopeus, A.G., 1996. ISM, An Interactive Spatial and temporal Modelling system as a tool in ecosystemmanagement. PhD-thesis, ITC. ITC Publication Nr. 44, ITC, Enschede, The Netherlands, 250 pp.
Whittaker, A.D. and Woodwell, 1971. Measurement of net primary production of forests. pp: 159-175. In:P.Duvigneand (ed.), Productivity of Forest Ecosystems. UNESCO, Paris.
Wiersum, K.F., 1976. The Fuelwood situation in the upper Bengawan Solo. Upper Solo Watershed Managementand Upland Development Project. Solo.
Wiyanto, A., 1990. Landscape ecological study of the Cibodas Biosphere Reserve as base line information formanagement plan. MSc-thesis, ITC, Enschede, 88 pp.
Yamada, I., 1975. Forest Ecological studies of the Montane Forest of Mt. Pangrango, West Java. I. Stratificationand floristic composition of the Montane Rain Forest near Cibodas. South East Asian Studies, Vol. 13,pp: 402-426.