Embed Size (px)
Citation preview

AQUATIC MICROBIAL ECOLOGYAquat Microb Ecol
Vol. 59: 89–101, 2010doi: 10.3354/ame01384
Published online March 24
INTRODUCTION
Atoll lagoons are systems that show distinct charac-teristics compared with the surrounding oceanicwaters, with higher abundances of autotrophic pico-and nanoplankton and elevated bacterial biomass andactivity (Le Borgne et al. 1989, Torréton & Dufour 1996,Charpy et al. 1997, Charpy & Blanchot 1998, Gonzálezet al. 1998). Lagoon waters are usually described as
very stable and homogeneous ecosystems (Torréton &Dufour 1996, Delesalle et al. 2001, Ferrier-Pagès &Furla 2001). Their biological functioning is mostly dri-ven by hydrodynamics, particularly water residencetime (Delesalle & Sournia 1992, Charpy et al. 1997,Torréton et al. 2007), which is closely linked to atollgeomorphology and water exchanges with the openocean, via the reef rims (Sournia & Ricard 1976,Charpy & Blanchot 1998, Andréfouët et al. 2001).
© Inter-Research 2010 · www.int-res.com*Email: [email protected]
Spatial and temporal variability of the pico- andnanophytoplankton and bacterioplankton in a deep
Polynesian atoll lagoon
Y. Thomas1, 2,*, P. Garen2, C. Courties3, L. Charpy4
1IFREMER, UMR 100, Presqu’île du Vivier, 29840 Argenton, France2IFREMER, COP, BP 7004, 98719 Taravao, Tahiti, French Polynesia
3UPMC Univ. Paris 06, and CNRS, UMS 2348, MBCE, Observatoire Océanologique, 66651 Banyuls-sur-mer, France4IRD, CNRS, and Univ. Méditerranée, UMR UPB, BP 529, 98713 Papeete, Tahiti, French Polynesia
ABSTRACT: Spatial and temporal scales of variability in phyto- and bacterioplankton abundancewere investigated in a deep atoll lagoon (Ahe, French Polynesia). Ahe Lagoon showed a classicalphytoplankton composition, but its picophytoplankton (Prochlorococcus, Synechococcus andpicoeukaryotes) concentrations are higher than the mean for Polynesian atoll lagoons. Phyto- andbacterioplankton descriptors were highly variable, with mean CVs of >20% in most cases: day–night, day-to-day, vertical, lagoonal and seasonal. Phytoplankton biomass, which was estimated byin vivo fluorescence, was higher in the deep layer than in the upper layer. This pattern was detectedon a day–night scale, showing transitory vertical gradients, and through long-term events that wererecorded during day-to-day measurements, especially during low wind conditions. The main factorspotentially driving this vertical structure of the phytoplankton appeared to be photoinhibition inupper layers and a bottom effect providing more favourable nutrient conditions in deeper layers.Day-to-day fluctuation was the major source of temporal variation and appeared to be highly drivenby vertical patterns and mixing events showing phytoplankton supply from deep layers. At thelagoon scale, the picophytoplankton exhibited a patchy structure that is closely linked to the geomor-phology of the rim, lagoon depth and proximity of the pass. Stations close to the pass were character-ized by consistently lower Synechococcus and picoeukaryote concentrations. Lastly, warm periodsshowed higher Synechococcus, nanophytoplankton and bacterial concentrations. Prochlorococcusand picoeukaryotes showed no seasonal trend, but had an annual variability that could be related tovariations in exchanges between the lagoon and the ocean.
KEY WORDS: Flow cytometry · Picophytoplankton · Nanophytoplankton · Bacterioplankton ·Vertical distribution · Day-to-day dynamics · Large-scale heterogeneity · Deep atoll lagoon · French Polynesia
Resale or republication not permitted without written consent of the publisher

Aquat Microb Ecol 59: 89–101, 2010
Microbes play major roles in pelagic food webs andbiogeochemical cycles (Pomeroy 1974, Cho & Azam1990). They respond quickly to temporal and spatialvariations in their environment; the scale and source ofsuch variability are likely to play a significant role inthe long-term equilibrium of an ecosystem (Haury etal. 1978, González et al. 1998). Therefore, despite theenvironmental homogeneity commonly assumed inatoll lagoon waters, numerous studies highlight transi-tory variations in hydrobiological parameters at smallscales, such as in day-to-day, diel or vertical distribu-tions of temperature, salinity, chl a or microbial com-munity abundance (Sournia & Ricard 1976, Moriarty etal. 1985, Charpy-Roubaud et al. 1988, Charpy & Blan-chot 1998, González et al. 1998, Buestel & Pouvreau2000). However, most of these studies were done inshallow lagoons, which were usually considered aswell mixed and thus homogeneous (Torréton & Dufour1996, González et al. 1998, Charpy & Blanchot 1999).Our present knowledge concerning deep atoll lagoonsis scarce. In this study, we hypothesize that hydro-dynamics, which is partially dependent on deep atollmorphology, drives biological functioning, making thisspecific ecosystem a suitable habitat for microbial com-munities (Atkinson et al. 1981).
The main objectives of this study were thus to deter-mine the spatio-temporal scales of variation inautotrophic phytoplankton and bacteria in a deep atolllagoon (Ahe, French Polynesia), and to develop con-ceivable scenarios to understand this variability. Ourstudy focused on the phytoplanktonic and bacterialcompartments, from integrative descriptors such as invivo phytoplanktonic concentration and size-fraction-ated extracted chl a, to pico-, nano- and bacterioplank-ton identification and quantification by flow cytometry.We developed a sampling strategy that allowed us tocover a wide range of scales so as to measure (1) verti-
cal profiles, (2) day-to-day temporal variability, (3)lagoon-scale patterns, and (4) seasonal variability.
MATERIALS AND METHODS
Sampling site. Ahe Atoll is located in the northwest-ern part of the French Polynesian Tuamotu Archipel-ago at 500 km northeast of Tahiti Island (Fig. 1). AheLagoon measures 145 km2 and has a mean depth closeto 50 m. Ahe is defined as a semi-enclosed atoll. Oneactive pass is located in the western part of the lagoonand several reef-flat spillways (<50 cm depth) are dis-tributed along the reef rim, mainly in the southern andwestern parts of the lagoon. The average water resi-dence time (ratio of lagoon volume to average waterinput rate) is estimated at 34 d (Pagès et al. 2001).
Environmental parameters. Meteorological data(wind direction and velocity, and rainfall) were obtainedfrom the Takaroa Atoll meteorological station, which islocated 120 km east of Ahe (14° 28’ 57’’ S, 145° 3’ 4’’ W).For the 24 h cycles (see below), wind direction andvelocity were recorded in the field with a mobileanemometer. Since no tidal records were made, tidalcycles were simulated by decomposition of tide har-monics obtained from another study performed in theAhe Lagoon (R. Le Gendre pers. comm.), giving tidalamplitude (m) in the lagoon with a 15 min time step.
Vertical profiles of salinity (practical salinity scale),temperature (°C), in vivo chl a (µg l–1) and PAR (photo-synthetically active radiation, µmol m–2 s–1) were car-ried out with a multiparameter probe (SBE S19Plus,Sea-Bird Electronics). To extract the contribution ofpico- and nanophytoplankton to chl a concentration,the biomass of size-fractionated chl a <2 µm and >2 µmwere measured. Total chl a concentration was assessedusing Whatman GF/F (0.7 µm pore size) filters and chl
90
Fig. 1. (a) Location of Ahe Lagoon. (b) Positions of the sampling stations in the lagoon

Thomas et al.: Phytoplankton and bacterioplankton spatio-temporal variability
a >2 µm using Millipore (2 µm pore size) filters. Theconcentration of chl a <2 µm was calculated as the dif-ference between total chl a and chl a >2 µm. Sea watersamples (0.3 l) were filtered, and the filters were rinsedwith deionized water and stored at –20°C. Chlorophyllcollected on the filters was extracted in 96% ethanol asrecommended by Wasmund et al. (2006). Extracts wereprocessed by fluorimetry (Turner 10-AU-005-CE,Turner Designs) according to Yentsch (1963).
Flow cytometry (FCM) analysis. Samples (1.5 ml)were preserved with 2% formol (final concentration)and stored at –80°C after freezing in liquid nitrogen,allowing delayed FCM analysis (Troussellier et al.1995). After thawing at room temperature, sampleswere analysed using a FACSCan flow cytometer (BD-Biosciences) that was equipped with an air-cooledargon laser (488 nm, 15 mW). Phytoplanktonic cellswere discriminated and enumerated according to theirright-angle light scatter properties (roughly related tocell size) and the orange (560–620 nm) and red(>670 nm) fluorescence from their phycoerythrin andchlorophyll pigments, respectively. SYBR Green I(Molecular Probes) was used to stain bacterial popula-tions, which were discriminated and enumerated bytheir nucleic acid contents according to their right-angle light scatter and green fluorescence (Marie et al.2000). Data acquisition was performed using Cell-Quest software (BD-Biosciences). Fluorescent 1.002 µmbeads (Polysciences) were systematically added toeach sample to normalize cell fluorescence and lightscatter emissions, thus allowing comparison of results.To estimate cell concentrations, the exact volume ofwater analysed was determined by measuring thesample volume before and after analysis.
Sampling design. For chl a extraction and flowcytometry analysis, water was sampled by pumping ata flow rate of 5 m3 h–1. A pipe of 32 mm diameter wasconnected to the pump and immersed at the requireddepth.
Vertical profiles: These were were studied duringday–night cycles. Two deep stations (V01 and V02,50 m deep) (Fig. 1) were sampled at intervals of 4 hover 24 h cycles. A vertical profile was obtained every4 h using a multiparameter probe, and water sampleswere taken at 5, 15, 25, 35 and 45 m depth for chl aextraction and flow cytometry analysis. The 2 stationswere sampled successively at an interval of 24 h, and 3surveys of these nycthemeral cycles were carried outin April 2007, July 2007 and February 2008.
In parallel, day-to-day vertical profiles were ob-tained with the multiparameter probe in 12 stations(L01 to L12) distributed across the lagoon (Fig. 1). Ver-tical profiles were obtained in the morning at each sta-tion from L12 to L01. Four surveys with day-to-day pro-files recording were carried out (April–May 2007,July–August 2007, November 2007, and February–March 2008). For technical reasons, day-to-day sam-plings were of different durations: 29, 15, 20 and 29 dduring the 4 survey periods, respectively, and no 24 hcycles were studied in November (Table 1).
Day-to-day temporal variability: This was studiedthrough daily sampling, results of which were aver-aged over the 12 ‘lagoon’ stations. In addition to theday-to-day profiles obtained with the multiparameterprobe, 1 water sample was obtained at 5 m depth at the12 stations every 2 d for size-fractionated chl a analy-sis, and another every 4 d for flow cytometry analysis.A summary of the sampling strategy is given inTable 1.
Data analysis and statistics. For vertical profileanalysis, multiparameter probe profiles were averagedfor each 10 m layer (i.e. 0–10, 10–20, 20–30, 30–40,40–50 m). Mean light profiles were calculated bydividing the irradiance at each metre of depth by theirradiance measured at 1 m depth. Lagoon-scale pat-terns were extracted from ‘lagoon’ station surveys bycomparing the averaged day-to-day results for eachstation. Finally, seasonal variability was extracted
91
Date Study type Stations Period Sampling frequency Depth (m)MPP FCM Chl a
Apr–May 07 Day–night V01, V02 24 h 4 h 4 h 4 h 5, 15, 25, 35, 45Day-to-day L01 – L12 29 d 1 d 4 d 2 d 5a
Jul–Aug 07 Day–night V01, V02 24 h 4 h 4 h 4 h 5, 15, 25, 35, 45Day-to-day L01 – L12 15 d 1 d 4 d 2 d 5a
Nov 07 Day–night – – – – – –Day-to-day L01 – L12 20 d 1 d 4 d 2 d 5a
Feb–Mar 08 Day–night V01, V02 24 h 4 h 4 h 4 h 5, 15, 25, 35, 45Day-to-day L01 – L12 29 d 1 d 4 d 2 d 5a
aVertical profiles from the surface to the bottom were done each time with the MPP
Table 1. Summary of the sampling strategy. MPP: multiparameter probe, FCM: flow cytometry, chl a: size-fractionated chl aextraction
Aquat Microb Ecol 59: 89–101, 2010
from the comparison of the averages of data fromday-to-day sampling performed during the 4 surveys:April–May, July–August, November and Feb–March.
The coefficient of variation (CV) (=SD/MV, where MVis the mean value) was calculated for each parameter toquantify the degree of variability at different scales. Torepresent and test spatial heterogeneity, mean data werestandardized using the standard score z calculation: z =(V – MV)/SD, where V is the data value. After arcsinetransformation of CVs, ANOVA was used to test (1) dif-ferences in CVs among scales, (2) the lagoonal hetero-geneity of z values, and (3) the seasonal effect on meanvalues. A post hoc Tukey’s pairwise multiple comparisontest was performed when significant differences weredetected. Finally, Pearson correlation coefficients werecalculated to test the relation between environmentalfactors (i.e. wind velocity, tidal amplitude and light inten-sity) and plankton abundance data from 24 h cycles.
RESULTS
Flow cytometry identification
Five phytoplankton populations were identifiedaccording to their normalized light scatter (SSC µm–1)and red fluorescence (FLR µm–1) properties. Two pop-ulations belonged to the picophytoplanktonic prokary-otes (Prochlorococcus [Prochl] and Synechococcus[Syn]), and one to the picoeukaryotic population(Peuk). Large eukaryotes were represented by 2 celltypes (N1 & N2) that were characterized by increasingSSC and FLR properties. The averaged normalizedSSC ratio between N2 and N1 was 3.7. Due to their lowconcentrations, the abundances of these 2 cell typeswere pooled and are considered as a single nano-phytoplankton population (Nan) in this paper.
For heterotrophic bacteria, 2 main populations wereenumerated: those with a high apparent nucleic acidcontent (HNA) and those showing a low apparentnucleic acid content (LNA).
Vertical profiles
Day–night cycles
Wind velocity (WV) was measured during 3day–night cycles: April 2007, July–August 2007 andFebruary 2008, at the V01 and V02 stations (Fig. 2,right axes). During the first 2 surveys (Fig. 2a,b), windvelocity was significantly higher at Stn V02 than at StnV01 (p < 0.0001). In February, low wind velocities wererecorded (Fig. 2c), with no significant difference (p >0.05) between stations.
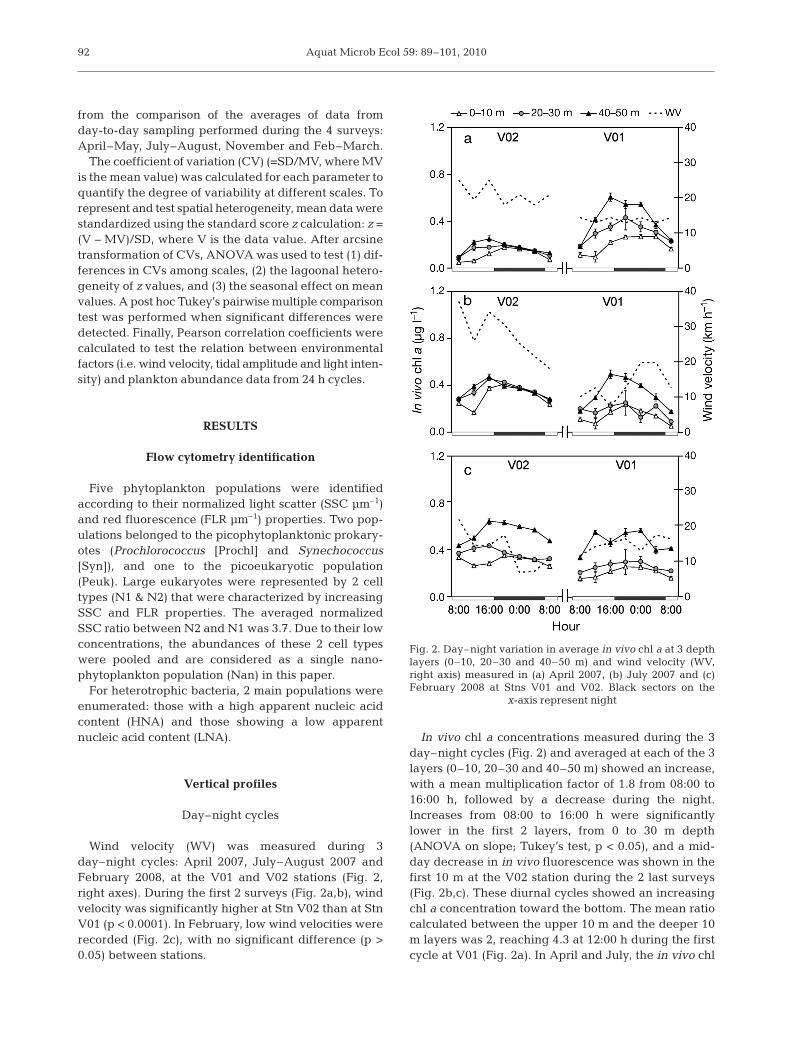
In vivo chl a concentrations measured during the 3day–night cycles (Fig. 2) and averaged at each of the 3layers (0–10, 20–30 and 40–50 m) showed an increase,with a mean multiplication factor of 1.8 from 08:00 to16:00 h, followed by a decrease during the night.Increases from 08:00 to 16:00 h were significantlylower in the first 2 layers, from 0 to 30 m depth(ANOVA on slope; Tukey’s test, p < 0.05), and a mid-day decrease in in vivo fluorescence was shown in thefirst 10 m at the V02 station during the 2 last surveys(Fig. 2b,c). These diurnal cycles showed an increasingchl a concentration toward the bottom. The mean ratiocalculated between the upper 10 m and the deeper 10m layers was 2, reaching 4.3 at 12:00 h during the firstcycle at V01 (Fig. 2a). In April and July, the in vivo chl
92
Fig. 2. Day–night variation in average in vivo chl a at 3 depthlayers (0–10, 20–30 and 40–50 m) and wind velocity (WV,right axis) measured in (a) April 2007, (b) July 2007 and (c)February 2008 at Stns V01 and V02. Black sectors on the
x-axis represent night
Thomas et al.: Phytoplankton and bacterioplankton spatio-temporal variability
a vertical gradient was smoother at V02, and total mix-ing occurred after 16:00 h (Fig. 2a,b). In the Februaryday–night cycles, the chl a vertical gradients at the 2stations were similar and were maintained through thesampling cycle (Fig. 2c).
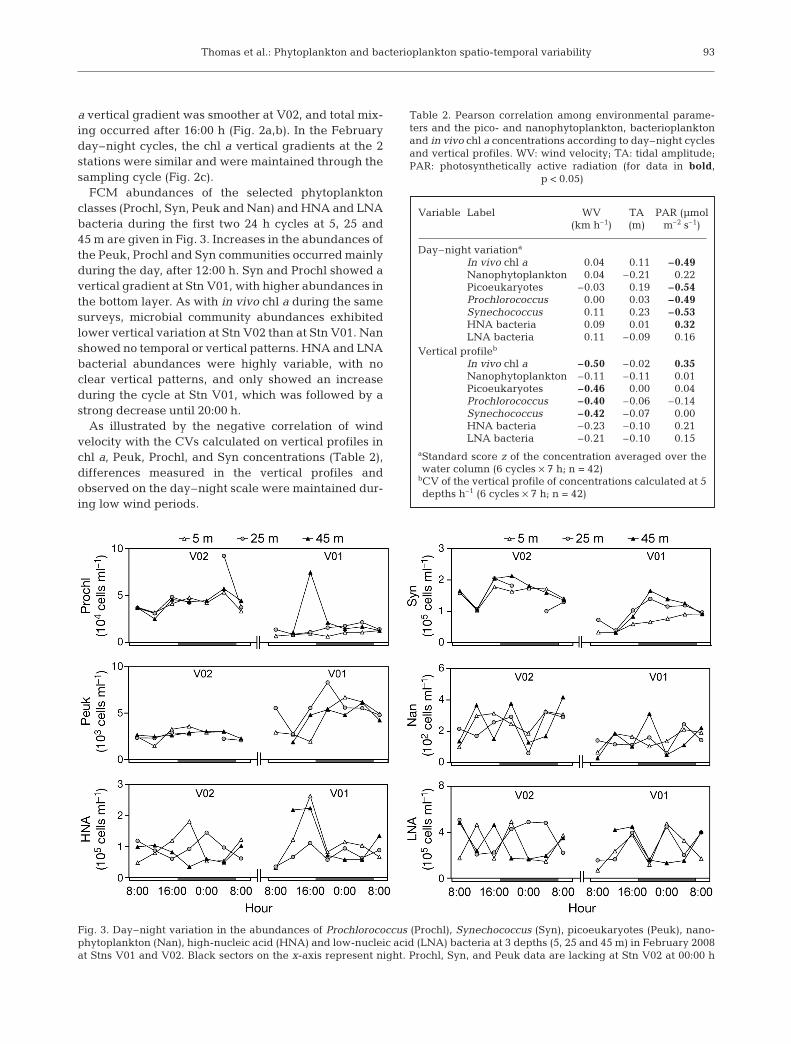
FCM abundances of the selected phytoplanktonclasses (Prochl, Syn, Peuk and Nan) and HNA and LNAbacteria during the first two 24 h cycles at 5, 25 and45 m are given in Fig. 3. Increases in the abundances ofthe Peuk, Prochl and Syn communities occurred mainlyduring the day, after 12:00 h. Syn and Prochl showed avertical gradient at Stn V01, with higher abundances inthe bottom layer. As with in vivo chl a during the samesurveys, microbial community abundances exhibitedlower vertical variation at Stn V02 than at Stn V01. Nanshowed no temporal or vertical patterns. HNA and LNAbacterial abundances were highly variable, with noclear vertical patterns, and only showed an increaseduring the cycle at Stn V01, which was followed by astrong decrease until 20:00 h.
As illustrated by the negative correlation of windvelocity with the CVs calculated on vertical profiles inchl a, Peuk, Prochl, and Syn concentrations (Table 2),differences measured in the vertical profiles andobserved on the day–night scale were maintained dur-ing low wind periods.
93
Variable Label WV TA PAR (µmol(km h–1) (m) m–2 s–1)
Day–night variationa
In vivo chl a 0.04 0.11 –0.49Nanophytoplankton 0.04 –0.21 0.22Picoeukaryotes –0.03 0.19 –0.54Prochlorococcus 0.00 0.03 –0.49Synechococcus 0.11 0.23 –0.53HNA bacteria 0.09 0.01 0.32LNA bacteria 0.11 –0.09 0.16
Vertical profileb
In vivo chl a –0.50 –0.02 0.35Nanophytoplankton –0.11 –0.11 0.01Picoeukaryotes –0.46 0.00 0.04Prochlorococcus –0.40 –0.06 –0.14Synechococcus –0.42 –0.07 0.00HNA bacteria –0.23 –0.10 0.21LNA bacteria –0.21 –0.10 0.15
aStandard score z of the concentration averaged over thewater column (6 cycles × 7 h; n = 42)
bCV of the vertical profile of concentrations calculated at 5depths h–1 (6 cycles × 7 h; n = 42)
Table 2. Pearson correlation among environmental parame-ters and the pico- and nanophytoplankton, bacterioplanktonand in vivo chl a concentrations according to day–night cyclesand vertical profiles. WV: wind velocity; TA: tidal amplitude;PAR: photosynthetically active radiation (for data in bold,
p < 0.05)
Fig. 3. Day–night variation in the abundances of Prochlorococcus (Prochl), Synechococcus (Syn), picoeukaryotes (Peuk), nano-phytoplankton (Nan), high-nucleic acid (HNA) and low-nucleic acid (LNA) bacteria at 3 depths (5, 25 and 45 m) in February 2008at Stns V01 and V02. Black sectors on the x-axis represent night. Prochl, Syn, and Peuk data are lacking at Stn V02 at 00:00 h
Aquat Microb Ecol 59: 89–101, 2010
Day-to-day vertical profiles
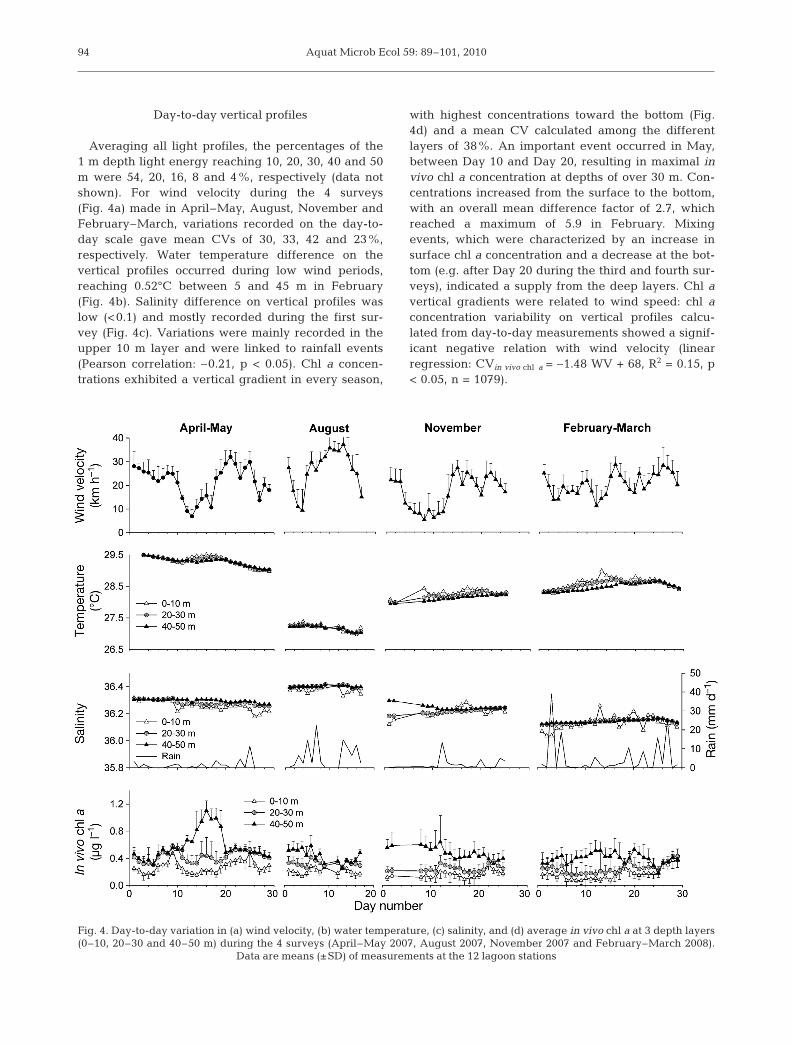
Averaging all light profiles, the percentages of the1 m depth light energy reaching 10, 20, 30, 40 and 50m were 54, 20, 16, 8 and 4%, respectively (data notshown). For wind velocity during the 4 surveys(Fig. 4a) made in April–May, August, November andFebruary–March, variations recorded on the day-to-day scale gave mean CVs of 30, 33, 42 and 23%,respectively. Water temperature difference on thevertical profiles occurred during low wind periods,reaching 0.52°C between 5 and 45 m in February(Fig. 4b). Salinity difference on vertical profiles waslow (<0.1) and mostly recorded during the first sur-vey (Fig. 4c). Variations were mainly recorded in theupper 10 m layer and were linked to rainfall events(Pearson correlation: –0.21, p < 0.05). Chl a concen-trations exhibited a vertical gradient in every season,
with highest concentrations toward the bottom (Fig.4d) and a mean CV calculated among the differentlayers of 38%. An important event occurred in May,between Day 10 and Day 20, resulting in maximal invivo chl a concentration at depths of over 30 m. Con-centrations increased from the surface to the bottom,with an overall mean difference factor of 2.7, whichreached a maximum of 5.9 in February. Mixingevents, which were characterized by an increase insurface chl a concentration and a decrease at the bot-tom (e.g. after Day 20 during the third and fourth sur-veys), indicated a supply from the deep layers. Chl avertical gradients were related to wind speed: chl aconcentration variability on vertical profiles calcu-lated from day-to-day measurements showed a signif-icant negative relation with wind velocity (linearregression: CVin vivo chl a = –1.48 WV + 68, R2 = 0.15, p< 0.05, n = 1079).
94
Fig. 4. Day-to-day variation in (a) wind velocity, (b) water temperature, (c) salinity, and (d) average in vivo chl a at 3 depth layers(0–10, 20–30 and 40–50 m) during the 4 surveys (April–May 2007, August 2007, November 2007 and February–March 2008).
Data are means (±SD) of measurements at the 12 lagoon stations

Thomas et al.: Phytoplankton and bacterioplankton spatio-temporal variability
Day-to-day temporal variability
The abundance of whole microbial communitiesshowed high day-to-day variations in mean intra-sur-vey CV of over 20% (Table 3). Chl a >2 µm, nanophy-toplankton and HNA bacteria showed the highest CVsof 47, 46 and 42%, respectively. Peuk showed the low-est day-to-day variation, with a mean CV of 27%.
Phytoplankton concentrations ranged from 0 to 2 µgl–1 chl a measured in vivo, with marked differencesaccording to depth: the mean intra-survey day-to-dayCVs calculated for the whole water column and by10 m depth layers were 25 and 32%, respectively(Table 3). Larger variations were recorded at depths ofover 30 m, mainly during the April–May survey (seeFig. 4d).
Fractionated chl a measured at 5 m depth (Fig. 5a)ranged from 0.01 to 0.52 µg l–1 for chl a <2 µm (leftaxis) and 0 to 0.24 µg l–1 for chl a >2 µm (right axis).The variations in the 2 fractions were different duringthe April–May survey: the first increase, which wasobserved at 5 m depth before Day 10, was mostly madeup of picophytoplankton; the second increase, whichwas observed after Day 15, was made up of both pico-and nanophytoplankton.
Nan ranged from 0.1 × 10³ to 2.9 × 10³ ml–1 (Fig. 5b,left axis) and contributed mostly to the second abun-dance increase observed in April–May, after Day 15.Peuk varied between 0.8 × 10³ and 13.5 × 10³ ml–1,and seemed to contribute to all the abundanceincreases observed during the 4 surveys (Fig. 5b, leftaxis). The picophytoplanktonic prokaryotes Prochland Syn ranged from 12 × 103 to 251 × 103 ml–1 and
from 22 × 103 to 276 × 103 ml–1, respectively, andvaried mainly during the first survey in April–May,with an increasing contribution of the Prochl commu-nity to the second adundance increase, after Day 15(Fig. 5b, right axis). HNA and LNA bacteria rangedfrom 0.3 × 10⁵ to 20.3 × 10⁵ ml–1 and from 1.2 × 10⁵ to14.3 × 105 ml–1, respectively. The 2 communitiesshowed the same day-to-day trend (Pearson corre-lation: 0.82, p < 0.0001) with a noticeable abundanceincrease after Day 15 during the April–May survey(Fig. 4c).
Lagoon-scale patterns
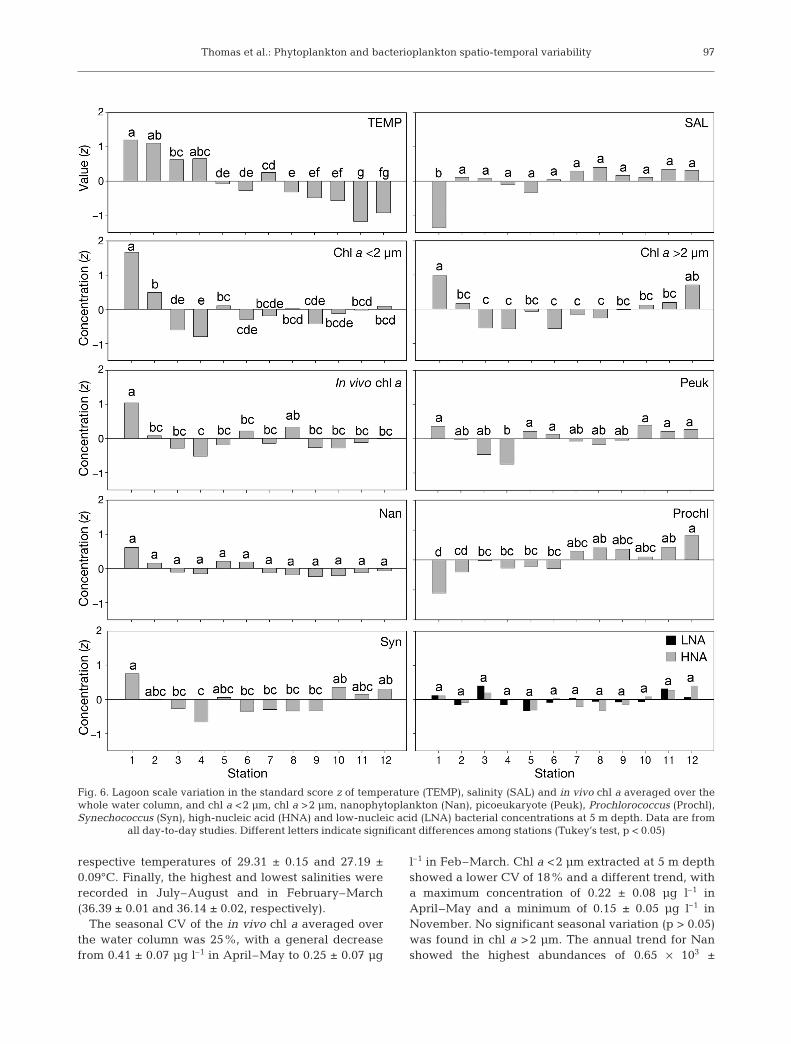
Results evaluated at the lagoon scale are shown inFig. 6. There was an east–west gradient in tempera-ture, with significantly higher temperatures in thewest than in the east (p < 0.05). Salinity appeared tobe homogeneous in the lagoon, with only the L01station showing significantly lower values (p < 0.05).The mean inter-station CVs exceeded 20% for thephyto- and bacterioplankton descriptors (Table 3).General patterns showed a patchy structure, withhigher chl a <2 µm, chl a >2 µm, in vivo chl a, Peukand Syn concentrations in the west (i.e. Stn L01) andalso in the east (i.e. Stns L10, L11, L12) for chl a>2 µm, Peuk and Syn. For the same 5 parameters,Stns L03 and L04 showed the lowest concentrations.Prochl exhibited a west–east gradient, with increas-ing concentrations eastward. Finally, no significantspatial differences were found for Nan, HNA or LNA(p > 0.05).
95
Parameter Vertical Temporal variation nDay–night Day-to-day
Lagoon scaleDay–night Day-to-day Seasonal
Wind direction – – – 9b 29a 9 6, 4, 1Wind velocity – – – 22a 32a 19 6, 4, 1Temperature 0.13b 0.16b 0.35a 0.12b 0.45a 3.11 42, 1080, 88, 6, 48, 1Salinity 0.07ab 0.05b 0.40a 0.04b 0.44a 0.30 42, 1080, 88, 6, 48, 1In vivo chl a
Water column 27b 38a 23ab 24ab 25b 25 42, 1080, 88, 6, 48, 1By 10 m depth layers – – 30a 26a 32a 24 440, 30, 223, 5
Chl a <2 µm 24bc – 27b 18c 32a 18 34, 46, 24, 48, 1Chl a >2 µm 34a – 43a 30a 47a 3 34, 46, 24, 48, 1Nanophytoplankton 35b – 35ab 35ab 46a 32 41, 25, 29, 48, 1Prochlorococcus 23b – 37a 28ab 36a 31 41, 25, 29, 48, 1Picoeukayotes 18b – 30a 24a 27a 21 41, 25, 29, 48, 1Synechococcus 20b – 36a 30a 31a 21 41, 25, 29, 48, 1LNA bacteria 37a – 32a 46a 38a 37 41, 25, 29, 48, 1HNA bacteria 44a – 40a 55a 42a 81 41, 25, 29, 48, 1
Table 3. CV (%) of the meteorological, hydrological and hydrobiological parameters at the spatial and temporal scales studied.Different letters indicate significant CV differences between scales (Tukey’s test, p < 0.05). Since there was only 1 df for the
seasonal scale, season was excluded from the test. HNA: high-nucleic acid, LNA: low-nucleic acid

Aquat Microb Ecol 59: 89–101, 2010
Seasonal variability
Mean data based on the day-to-day studies duringthe 4 surveys are summarized in Table 4. The highestwind velocities were measured in July–August (27.3 ±
7.6 km h–1), with a general east–southeast trend (100 ±24°). The lowest wind velocity was recorded in Novem-ber (16.7 ± 7.0 km h–1), with a general dirction of 113.7± 58.2°. The April–May and July–August surveysappeared to be the warmest and coldest periods with
96
Fig. 5. Day-to-day variation in the (a) concentrations of chl a >2 µm (left scale) and <2 µm (right scale), (b) abundances ofnanophytoplankton (Nan) & picoeukaryotes (Peuk) (left scale) and Prochlorococcus (Prochl) & Synechococcus (Syn) (right scale),and (c) abundances of high-nucleic acid (HNA) & low-nucleic acid (LNA) bacteria at 5 m depth during the 4 surveys (April–May2007, August 2007, November 2007 and February–March 2008). Data are means (±SD) of measurements at the 12 lagoon stations
Parameter April–May 07 July–Aug 07 November 07 Feb–March 08 n
Wind direction (°) 93.9 ± 16.4a 100.0 ± 24.0ab 113.7 ± 58.2b 96.6 ± 20.5ab 29, 15, 20, 29Wind velocity (km h–1) 21.7 ± 6.5a 27.3 ± 7.6b 16.7 ± 7.0c 20.0 ± 1.0ac 29, 15, 20, 29
Water temperature (°C) 29.31 ± 0.15a 27.19 ± 0.09b 28.22 ± 0.09c 28.56 ± 0.13d >103
Salinity 36.23 ± 0.27a 36.39 ± 0.01b 36.22 ± 0.02ac 36.14 ± 0.02c >103
In vivo chl a (µg l–1) 0.41 ± 0.07a 0.30 ± 0.04b 0.26 ± 0.04c 0.25 ± 0.07c >103
Chl a <2 µm (µg l–1) 0.22 ± 0.08a 0.19 ± 0.05b 0.15 ± 0.05c 0.17 ± 0.08d 180, 76, 120, 180Chl a >2 µm (µg l–1) 0.03 ± 0.03a 0.03 ± 0.02a 0.03 ± 0.01a 0.03 ± 0.01a 180, 76, 120, 180
Nanophytoplankton (103 ml–1) 0.65 ± 0.59a 0.37 ± 0.14b 0.33 ± 0.14b 0.59 ± 0.22a 95, 40, 72, 96Prochlorococcus (103 ml–1) 63 ± 40a 95 ± 38b 123 ± 50c 136 ± 44cd 95, 40, 72, 96Picoeukayotes (103 ml–1) 4.58 ± 1.45a 3.84 ± 0.94b 3.26 ± 1.51c 2.81 ± 1.09d 95, 40, 72, 96Synechococcus (103 ml–1) 122 ± 48a 88 ± 20ab 77 ± 39b 84 ± 36b 95, 40, 72, 96
LNA bacteria (103 ml–1) 312 ± 123a 229 ± 144b 168 ± 29c 403 ± 191d 95, 40, 72, 96HNA bacteria (103 ml–1) 115 ± 54a 96 ± 127b 92 ± 20c 373 ± 254b 95, 40, 72, 96
Table 4. Seasonal variations in the meteorological, hydrological and hydrobiological parameters. Data are averages (± SDs) fromthe day-to-day study at the 12 lagoon stations. Different superscript letters indicate significant differences among surveys(Tukey’s test, p < 0.05). Temperature, salinity and in vivo chl a data are water column averages, other data are measurements
made at 5 m depth. HNA: high-nucleic acid, LNA: low-nucleic acid
Thomas et al.: Phytoplankton and bacterioplankton spatio-temporal variability
respective temperatures of 29.31 ± 0.15 and 27.19 ±0.09°C. Finally, the highest and lowest salinities wererecorded in July–August and in February–March(36.39 ± 0.01 and 36.14 ± 0.02, respectively).
The seasonal CV of the in vivo chl a averaged overthe water column was 25%, with a general decreasefrom 0.41 ± 0.07 µg l–1 in April–May to 0.25 ± 0.07 µg
l–1 in Feb–March. Chl a <2 µm extracted at 5 m depthshowed a lower CV of 18% and a different trend, witha maximum concentration of 0.22 ± 0.08 µg l–1 inApril–May and a minimum of 0.15 ± 0.05 µg l–1 inNovember. No significant seasonal variation (p > 0.05)was found in chl a >2 µm. The annual trend for Nanshowed the highest abundances of 0.65 × 10³ ±
97
Fig. 6. Lagoon scale variation in the standard score z of temperature (TEMP), salinity (SAL) and in vivo chl a averaged over thewhole water column, and chl a <2 µm, chl a >2 µm, nanophytoplankton (Nan), picoeukaryote (Peuk), Prochlorococcus (Prochl),Synechococcus (Syn), high-nucleic acid (HNA) and low-nucleic acid (LNA) bacterial concentrations at 5 m depth. Data are from
all day-to-day studies. Different letters indicate significant differences among stations (Tukey’s test, p < 0.05)
Aquat Microb Ecol 59: 89–101, 2010
0.59 × 10³ and 0.59 × 10³ ± 0.22 × 10³ ml–1 in April–Mayand Feb–March (p < 0.05), respectively. Prochl showeda significant increase in mean abundance (p < 0.05)from the first to the last survey (63 × 103 ± 40 × 103 and136 × 103 ± 44 × 103 ml–1 in April–May and Feb–March,respectively). The highest Syn abundances of 122 × 103
± 48 × 103 ml–1 were measured during the first survey.Mean Peuk abundances decreased from the first to thelast survey, with values of 4.58 × 10³ ± 1.45 × 10³ and2.81 × 103 ± 1.09 × 10³ ml–1 in April–May andFeb–March, respectively. The HNA proportion repre-sented 27, 30 and 35% of the total bacterial concentra-tion during the first 3 surveys, and attained a contribu-tion of 48% in Feb–March. LNA bacteria showed aseasonal trend in abundance, with minimum valuesduring surveys at lower temperature and maximumvalues of 403 × 103 ± 191 × 103 ml–1 in Feb–March.HNA bacteria showed a seasonal CV of 81% (Table 3),which was mostly due to a marked increase in abun-dance in Feb–March (373 × 103 ± 264 × 103 ml–1).
DISCUSSION
Hydrobiological state of the Ahe Lagoon
The phytoplankton composition reported in this study,with 83% of chl a extracted from picoplankton commu-nities being dominated in terms of abundance by Syne-chococcus and Prochlorococcus, was in the range of pre-vious surveys in tropical lagoons (Charpy et al. 1992,Ferrier-Pagès & Furla 2001). However, picophytoplank-ton abundances appeared to be higher than mean levelsgenerally found on Polynesian atolls, the mean Prochl,Syn and Peuk abundances observed in Ahe being 1.7-,1.3- and 3.2-fold higher, respectively, than mean valuesfound in the 11 atoll lagoons investigated by Charpy &Blanchot (1998). Thus, Ahe seems to be comparable toclosed atolls like Takapoto or Taiaro, mainly because ofits high abundance of Peuk (Charpy & Blanchot 1998).Despite exchanges with the surrounding oceanthrough the pass and reef-flat spillways, the depth of thelagoon could contribute to the decrease in water ex-changes and thus to the increase in phytoplankton con-centration, especially of lagoonal communities like pi-coeukaryotes (Charpy et al. 1997, Pagès et al. 2001).
Very few data on autotrophic nanoplankton in atolllagoons are available (González et al. 1998). Nonethe-less, our day-to-day abundances, which ranged be-tween 0.12 × 10³ and 2.87 × 10³ ml–1, are equivalent tothe 0.2 × 10³ to 1.1 × 10³ ml–1 measured during day-to-day surveys in the Tikehau Atoll lagoon (González etal. 1998), and are lower than data reported by Ferrier-Pagès & Furla (2001) (2.1 × 10³ to 5.5 × 10³ ml–1, mea-sured in the 2 largest Polynesian atolls).
For the bacterial population, total bacterial abun-dances (HNA + LNA) from our day-to-day studies werebetween 0.16 × 10⁶ and 3.66 × 10⁶ ml–1, which is in thesame range as values previously recorded in the Tike-hau Atoll lagoon: 1.2 × 10⁶ to 2.6 × 10⁶ ml–1 (Torréton &Dufour 1996) and 1.52 × 10⁶ ml–1 (González et al. 1998).
Spatio-temporal scales of variability
During this study, both spatial and temporal fluctua-tions in the studied microbial communities were mea-sured. Based on the mean CV analysis (Table 3),phyto- and bacterioplankton descriptors displaylarge variations >20% in most cases. As reported byGonzález et al. (1998) for the microbial communities ofTikehau Lagoon, day-to-day fluctuations also repre-sented a major source of temporal variability in ourstudy. These variations also appear to be closelyrelated to the vertical structure and dynamics of phyto-plankton communities, with increases recorded in thesurface layer mostly originating from deeper layers.With a mean depth of 50 m, Ahe is a very deep atolllagoon compared with the mean depth of 25 m foundacross 28 Polynesian atoll lagoons by Pagès & André-fouët (2001). During our surveys, the deep layerappeared to be more productive than the upper layerand reached consistently higher phytoplankton con-centrations. This pattern was detected on a day–nightscale, showing transitory vertical gradients, andthrough long-term events that were recorded duringday-to-day measurements. Vertical gradients in phyto-plankton that were recorded in this study also ap-peared to be 2 to 3× higher than transitory gradientsthat were previously described during day-to-daymeasurements in shallow atoll lagoons (Charpy 1996a,Charpy & Blanchot 1998, Buestel & Pouvreau 2000).
At the same time that this variation was shown onsmall spatio-temporal scales, phytoplankton abundanceand composition also showed a patchy spatial configura-tion at the lagoon scale. Large-scale patterns based onseveral day-to-day samplings appeared to be stable be-tween surveys and specific to the different communities,as distribution in lagoonal communities (i.e. Peuk, Syn)was different from that in the oceanic community (i.e.Prochl). Only Nan and bacteria appeared to be homo-geneously distributed over the lagoon.
No clear seasonality of phytoplankton abundance inatoll lagoons has been reported in the literature. Somestudies describe annual variability in total chl a con-centration without clear seasonality (Charpy 1996a),while others report marked seasonality, with the high-est phytoplankton concentration being observed dur-ing the austral summer (Buestel & Pouvreau 2000). InAhe, pico- and nanophytoplankton were characterized
98
Thomas et al.: Phytoplankton and bacterioplankton spatio-temporal variability
by higher Nan, Syn and bacterial abundances duringthe warm periods. Such a pattern was not seen forPeuk and Prochl communities. These results appear todiffer from the seasonal variations in picoplanktoncommunity structure observed in the subtropical NorthPacific Ocean, where the abundance of Prochl typi-cally peaks in summer, Syn in winter and Peuk inspring (Campbell et al. 1997). In addition, the bacterialabundance seasonality observed during our studyappeared to be more similar to the observations ofMoriarty et al. (1985) on the Great Barrier Reef thanobservations from the Tikehau Lagoon, where no sea-sonal trend was detected (Torréton & Dufour 1996). Toour knowledge, data on nanophytoplankton seasonal-ity in atoll lagoons are very scarce. However, Charpy(1996a) reported the same seasonal pattern in the con-centration of chl a >3 µm in the Tikehau Lagoon as thatof Nan in our study, with the highest concentrationsbeing observed in the austral summer. However, oursurveys covered only 1 yr and sampling over severalyears would be necessary to obtain a reliable descrip-tion of seasonal patterns.
Factors driving variability
Wind appeared to be the main factor driving theenvironmental heterogeneity recorded during our sur-veys. Wind provides the forcing factor that drives ver-tical structures. No significant relation was foundbetween wind speed and bacterial abundance (datanot shown); release of bottom communities by theresuspension process, as reported by Torréton &Dufour (1996) in the Tikehau Lagoon, thus appeared tobe limited in our case, probably due to the depth of theAhe Lagoon.
No significant relation was found between day–night microbial abundance variation and tide or wind(Table 2). Light appeared to be the main factor thatwas directly or indirectly driving day–night variations.As reported by Vaulot & Marie (1999) in the equatorialPacific, the vertical structure of Prochlorococcus andSynechococcus should be related to photoinhibition inthe upper layers and to an increase in chlorophyll syn-thesis from the surface to the bottom. This photoinhibi-tion could also explain the time shift in fluorescenceincrease that was observed in the upper 10 m duringday–night cycles (Dandonneau & Neveux 1997). Inaddition, phytoplankton production appeared to behighly limited by nutrient supply in atoll lagoons(Dufour & Berland 1999, Ferrier-Pagès & Furla 2001).Indeed, nutrients that are commonly measured in atolllagoons showed very low concentrations, with relativenitrogen or phosphorus limitation being linked to atollmorphometry (Dufour et al. 2001). Nutrient concentra-
tions are controlled by water exchange with the ocean,uptake by primary producers and recycling processes.Nutrient concentrations are high in atoll lagoon sedi-ment pore water (Charpy-Roubaud et al. 1996), andnutrient fluxes at the sediment–water interface canincrease phytoplankton growth close to the bottom. Abottom effect providing more favourable nutrient con-ditions by organic matter remineralization (Charpy etal. 1997) thus appeared to be a potential factor allow-ing phytoplankton growth in the deep layers.
At the lagoon scale, the kind of patchy structure ob-served has been previously described in the TakapotoLagoon, with rich sectors being related to longer waterresidence time, accumulation by the northeast windand potential anthropogenic enrichment (Sournia &Ricard 1976, Delesalle et al. 2001). In our study, thepatchy phytoplankton structure appeared to be closelylinked to the geomorphology of the rim, lagoon depthand the proximity of the pass. The 2 sectors showing atypical lagoon signature, with high nanoplanktonic,picoeukaryotic and Synechococcus concentrations, weredefined westward by shallow waters and eastward bya sector protected from the prevailing wind trend by areef rim without reef-flat spillways, which can belinked to a retention zone. These 2 sectors were alsodistant from the pass and its diluting effect. As re-ported by Tartinville et al. (1997) for the Mururoa Atolllagoon, it is conceivable that a large fraction of thewater entering the lagoon during the rising tide re-mains in the neighbourhood of the pass. This hypothe-sis explains why only a small extent of the sector isdirectly influenced by the pass, with effects beingmostly confined to Stns L03 and L04 that are character-ized by consistently lower concentrations of lagoonalphytoplankton communities.
Concerning seasonality, Agawin et al. (1998) showedthe high dependence of Syn growth rate on tempera-ture, which in our case was around the optimum valueof 28°C and could explain only a small part of the vari-ability recorded (Moore et al. 1995). Prochl and Peukshowed no seasonal patterns but inverse dynamicsbased on the 4 surveys. Since Prochl is described as anoceanic marker and Peuk as a lagoon marker (Charpy1996b), the increase in Prochl abundance over the 4surveys and the inverse dynamics of Peuk could reflectan increase in oceanic influence in the Ahe Lagoon. Nowater flux data are available for the studied period, butflux calculations made through a modelling study forthe sampling period should provide an interestingapproach to understanding these long-term dynamics.Moreover, we did not measure the heterotrophic com-partment dynamics, which could have a significantpredation effect on bacterial and cyanobacterial popu-lations and, therefore, also a significant effect on theirspatio-temporal dynamics (González et al. 1998).
99

Aquat Microb Ecol 59: 89–101, 2010
CONCLUSIONS
The present study offers new insights into spatio-temporal variation scales in phyto- and bacterioplank-ton abundance in a deep atoll lagoon. CVs revealedhigh variability levels on every scale, with mean valuesexceeding 20% for all microbial communities. None-theless, the vertical scale appeared to be a key deter-minant of spatio-temporal variability in phytoplanktonbiomass, as estimated by in vivo chl a, with a verticalgradient showing an increase from the surface to thebottom. This suggests photoinhibition in the surfacelayers and a bottom effect providing more favourablenutrient conditions. Concurrently, high frequencysampling during these long surveys showed the primacyof day-to-day variability over other temporal scales.Wind was the main factor driving vertical and day-to-day variability, and allowing phytoplankton and bac-terioplankton mixing from the bottom. Lastly, any directoceanic influence appeared to be confined to thevicinity of the pass.
Acknowledgements. This study was supported by the InstitutFrançais de Recherche pour l’Exploitation de la Mer (Ifremer)and the French Polynesian government (research delegation).We thank the Ifremer and Service de la Perliculture staff fortheir efficient help during sample collection; the Pa’umotu:the Maifano family and A. Bennett, for their effective assis-tance on Ahe Atoll; and H. McCombie for helpful commentsand English revision.
LITERATURE CITED
Agawin NSR, Duarte CM, Agustí S (1998) Growth and abun-dance of Synechococcus sp. in a Mediterranean Bay: sea-sonality and relationship with temperature. Mar Ecol ProgSer 170:45–53
Andréfouët S, Pagès J, Tartinville B (2001) Water renewaltime for classification of atoll lagoons in the TuamotuArchipelago (French Polynesia). Coral Reefs 20:399–408
Atkinson M, Smith SV, Stroup ED (1981) Circulation inEnewetak atoll lagoon. Limnol Oceanogr 26:1074–1083
Buestel D, Pouvreau S (2000) Particulate matter in Takapotolagoon waters: potential food for cultivated pearl oysters.Oceanol Acta 23:193–210
Campbell L, Liu HB, Nolla HA, Vaulot D (1997) Annual vari-ability of phytoplankton and bacteria in the subtropicalNorth Pacific Ocean at Station ALOHA during the1991–1994 ENSO event. Deep-Sea Res I 44:167–192
Charpy L (1996a) Phytoplankton biomass and production intwo Tuamotu atoll lagoons (French Polynesia). Mar EcolProg Ser 145:133–142
Charpy L (1996b) Phytoplankton biomass and productivity inthe Great Astrolabe Lagoon. Centre ORSTOM de Tahiti,Papeete (French Polynesia)
Charpy L, Blanchot J (1998) Photosynthetic picoplankton inFrench Polynesian atoll lagoons: estimation of taxa contri-bution to biomass and production by flow cytometry. MarEcol Prog Ser 162:57–70
Charpy L, Blanchot J (1999) Picophytoplankton biomass, com-
munity structure and productivity in the Great AstrolabeLagoon, Fiji. Coral Reefs 18:255–262
Charpy L, Blanchot J, Lo L (1992) Cyanobacteria Synechococ-cus spp. contribution to primary production in a closedatoll lagoon (Takapoto, Tuamotu, French Polynesia). CRAcad Sci III 314:395–401
Charpy L, Dufour P, Garcia N (1997) Particulate organic mat-ter in sixteen Tuamotu atoll lagoons (French Polynesia).Mar Ecol Prog Ser 151:55–65
Charpy-Roubaud C, Charpy L, Lemasson L (1988) Benthicand planktonic primary production of an open atoll lagoon(Tikehau, French Polynesia). Proc 6th Int Coral ReefSymp, Townsville 2:551–556
Charpy-Roubaud C, Charpy L, Sarazin G (1996) Diffusionalnutrient fluxes at the sediment–water interface andorganic matter mineralization in an atoll lagoon (Tikehau,Tuamotu Archipelago, French Polynesia). Mar Ecol ProgSer 132:181–190
Cho BC, Azam F (1990) Biogeochemical significance of bacte-rial biomass in the ocean’s euphotic zone. Mar Ecol ProgSer 63:253–259
Dandonneau Y, Neveux J (1997) Diel variations of in vivo flu-orescence in the eastern equatorial Pacific: an unvaryingpattern. Deep-Sea Res I 44:1869–1880
Delesalle B, Sournia A (1992) Residence time of water andphytoplankton biomass in coral reef lagoons. Cont ShelfRes 12:939–949
Delesalle B, Sakka A, Legendre L, Pagès J, Charpy L, Loret P(2001) The phytoplankton of Takapoto Atoll (TuamotuArchipelago, French Polynesia): time and space variabilityof biomass, primary production and composition over 24years. Aquat Living Resour 14:175–182
Dufour P, Berland B (1999) Nutrient control of phytoplank-tonic biomass in atoll lagoons and Pacific Ocean waters:studies with factorial enrichment bioassays. J Exp MarBiol Ecol 234:147–166
Dufour P, Andréfouët S, Charpy L, Garcia N (2001) Atoll mor-phometry controls lagoon nutrient regime. LimnolOceanogr 46:456–461
Ferrier-Pagès C, Furla P (2001) Pico- and nanoplankton bio-mass and production in the two largest atoll lagoons ofFrench Polynesia. Mar Ecol Prog Ser 211:63–76
González JM, Torréton JP, Dufour P, Charpy L (1998) Tempo-ral and spatial dynamics of the pelagic microbial food webin an atoll lagoon. Aquat Microb Ecol 16:53–64
Haury L, McGowan J, Wiebe P (1978) Patterns and processesin the time–space scales of plankton distribution. In:Steele JH (ed) Spatial pattern in plankton communities.Plenum Press, New York, p 277–327
Le Borgne R, Blanchot J, Charpy L (1989) Zooplankton ofTikehau Atoll (Tuamotu Archipelago) and its relationshipto particulate matter. Mar Biol 102:341–353
Marie D, Partensky F, Simon N, Guillou L, Vaulot D (2000)Flow cytometry analysis of marine picoplankton. In: Dia-mond RA, DeMaggio S (eds) In living colors: protocols inflow cytometry and cell sorting. Springer Verlag, Berlin,p 422–454
Moore LR, Goericke R, Chisholm SW (1995) Comparativephysiology of Synechococcus and Prochlorococcus: influ-ence of light and temperature on growth, pigments, fluo-rescence and absorptive properties. Mar Ecol Prog Ser116:259–275
Moriarty DJW, Pollard PC, Hunt WG (1985) Temporal andspatial variation in bacterial production in the water col-umn over a coral reef. Mar Biol 85:285–292
Pagès J, Andréfouët S (2001) A reconnaissance approach forhydrology of atoll lagoons. Coral Reefs 20:409–414
100

Thomas et al.: Phytoplankton and bacterioplankton spatio-temporal variability
Pagès J, Andréfouët S, Delesalle B, Prasil V (2001) Hydrologyand trophic state in Takapoto Atoll lagoon: comparison withother Tuamotu lagoons. Aquat Living Resour 14:183–193
Pomeroy LR (1974) The ocean’s food web, a changing para-digm. BioScience 24:499–504
Sournia A, Ricard M (1976) Données sur l’hydrologie et laproductivité du lagon d’un atoll fermé (Takapoto, IlesTuamotu). Vie Milieu 26:243–279
Tartinville B, Deleersnijder E, Rancher J (1997) The water res-idence time in the Mururoa atoll lagoon: sensitivity analy-sis of a three-dimensional model. Coral Reefs 16:193–203
Torréton JP, Dufour P (1996) Temporal and spatial stability ofbacterioplankton biomass and productivity in an atolllagoon. Aquat Microb Ecol 11:251–261
Torréton JP, Rochelle-Newall E, Jouon A, Faure V, Jacquet S,Douillet P (2007) Correspondence between the distribu-
tion of hydrodynamic time parameters and the distributionof biological and chemical variables in a semi-enclosedcoral reef lagoon. Estuar Coast Shelf Sci 74:766–776
Troussellier M, Courties C, Zettelmaier S (1995) Flow cyto-metric analysis of coastal lagoon bacterioplankton andpicophytoplankton: fixation and storage effects. EstuarCoast Shelf Sci 40:621–633
Vaulot D, Marie D (1999) Diel variability of photosyntheticpicoplankton in the equatorial Pacific. J Geophys Res104:3297–3310
Wasmund N, Topp I, Schories D (2006) Optimising the storageand extraction of chlorophyll samples. Oceanologia 48:125–144
Yentsch CS (1963) A method for the determination of phyto-plankton chlorophyll and phaeophytin by fluorescence.Deep-Sea Res 10:221–231
101
Editorial responsibility: Urania Christaki,Wimereux, France
Submitted: June 11, 2009; Accepted: October 8, 2009Proofs received from author(s): March 19, 2010