Embed Size (px)
Citation preview

Spatial and temporal variations in criteria air pollutants in threetypical terrain regions in Shaanxi, China, during 2015
Yong Xu1& Qi Ying2,3 & Jianlin Hu3
& Yuan Gao1 & Yang Yang1 & Dexiang Wang1 &
Hongliang Zhang3,4
Received: 17 July 2017 /Accepted: 6 October 2017# Springer Science+Business Media B.V. 2017
Abstract Numerous studies have investigated air pollution inseverely polluted plains, but the characteristics of pollutantsare not well understood in other terrain regions. In this study,air pollution characteristics were analyzed in three typical ter-rain regions (plateau, plain, and mountain regions) in Shaanxi,based on hourly ambient monitoring of particulate matter withdiameter less than 2.5 μm (PM2.5) and less than 10 μm(PM10), CO, SO2, NO2, and O3 in 2015. PM2.5 and PM10 werethe dominant pollutants in three regions, and their annual con-centrations exceeded the Grade II standards by 9.4–68.6 and6.0–73.9%, respectively. PM2.5, PM10, CO, SO2, and NO2
concentrations had similar seasonal trends with highest valuesin winter and lowest values in summer, whereas O3 concen-trations exhibited the opposite trend. Guanzhong Plain had
higher PM2.5, PM10, NO2, and SO2 concentrations but lowerCO, 1-h peak O3, and 8-h peak O3 (8 h-O3) compared to otherregions. PM2.5, PM10, and 8 h-O3 were the three main domi-nant pollutants. The nonattainment rate was highest in winterand lowest in summer or autumn. Pollution also exhibitedsynergy, especially in the plateau region and GuanzhongPlain. PM2.5 was significantly correlated with PM10. NO2
and SO2 were positively correlated with PM2.5 and PM10,while 8 h-O3 generally had significant negative correlationswith other pollutants, especially in the winter. These resultsprovide a comprehensive understanding of pollution status inthe three typical terrain regions in Shaanxi and are helpful forimproving air quality.
Keywords Air pollutant . Terrain region . Guanzhong .
Spatial variation . Temporal variation
Introduction
China has experienced severe air pollution due to economicgrowth in recent years (Guo et al. 2014). Haze has occurredmore frequently on a large scale according to satellite obser-vations (http://www.weather.com.cn/air), especially in thewinter, thereby suggesting that air pollution is no longerlimited to megacities and urban areas. The air pollutionlevels are determined based on the composition andconcentrations of a complex mixture of air pollutants. Themain air pollutants emitted into the atmosphere are SO2,NO2, CO, volatile organic compounds (VOCs), andparticulate matter with diameter less than 2.5 μm (PM2.5)and less than 10 μm (PM10). In addition, the reactionsbetween VOC and nitrogen oxides (NOx) producing O3 inthe planetary boundary layer (PBL) have major effects onhuman health (Lei et al. 2007; Tie et al. 2007; Zhao et al.
Electronic supplementary material The online version of this article(https://doi.org/10.1007/s11869-017-0523-7) contains supplementarymaterial, which is available to authorized users.
* Dexiang [email protected]; [email protected]
* Hongliang [email protected]
1 College of Forestry, Northwest A&F University,Yangling, Shaanxi 712100, China
2 Department of Civil Engineering, Texas A&M University, CollegeStation, TX 77843, USA
3 Jiangsu Key Laboratory of Atmospheric Environment Monitoringand Pollution Control, Jiangsu Engineering Technology ResearchCenter of Environmental Cleaning Materials, CollaborativeInnovation Center of Atmospheric Environment and EquipmentTechnology, School of Environmental Science and Engineering,Nanjing University of Information Science and Technology, 219Ningliu Road, Nanjing 210044, China
4 Department of Civil and Environmental Engineering, Louisiana StateUniversity, Baton Rouge, LA 70803, USA
Air Qual Atmos Healthhttps://doi.org/10.1007/s11869-017-0523-7
2006). SO2, NO2, CO, O3, PM2.5, and PM10 are generallydefined as criteria air pollutants for quantifying air pollutionlevels. These pollutants are investigated to evaluate the airquality, pollution formation/transport mechanisms, healthrisks, and to assess the effectiveness of proposed air pollutioncontrol measures (Gurjar et al. 2008; Hu et al. 2015; Wanget al. 2014b; Wang et al. 2014c; Zhang et al. 2004).
The Ministry of Environmental Protection of China (MEP)started publishing daily air pollution index (API) data for anumber of key cities in 2000 (increasing from 47 cities in2000 to 120 cities in 2011) based on ground monitoring ofthe 24-h average concentrations of SO2, NO2, and PM10
(http://datacenter.mep.gov.cn/index). Thus, studies based onmonitoring data before 2011 were restricted to the valuesobtained for API, SO2, NO2, and PM10 (Gao et al. 2011; Quet al. 2010; Ji et al. 2012). Themonitoring of PM2.5 and O3 wasnot required as per Chinese Ambient Air Quality Standards(CAAQS) guidelines until February 2012 when the third revi-sion of the Chinese Ambient Air Quality Standards GB 3095–2012 (CAAQS) (http://kjs.mep.gov.cn/hjbhbz/bzwb/dqhjbh/dqhjzlbz/201203/W020120410330232398521.pdf) wasreleased. In addition, the MEP also released an officialrevision of the ambient air quality index (AQI), which wascalculated based on the values observed for six criteriapollutants comprising SO2, NO2, PM2.5, PM10, CO, 1-h peakO3 (1 h-O3), and 8-h peak O3 (8 h-O3) in March 2012.Subsequently, more cities (from 76 cities in 2013 to 367 citiesin 2015 after many less-developed cities were added) began torelease the concentrations of these six criteria pollutants andthe calculated AQI values to the public (http://datacenter.mep.gov.cn/index). Using this rich dataset, it is possible to performcomprehensive evaluations of the air quality at a fine spatialscale.
Characteristics of criteria pollutants have been analysis indifferent areas of China. For example, Chai et al. (2014) de-termined the spatial and temporal variations of the six criteriapollutants in 16 Chinese provincial cities using data collectedbetween August 2011 and February 2012. Hourly monitoringdata for the six pollutants in 31 provincial capital cities inChina from March 2013 to February 2014 were analyzed byWang et al. (2014b) and Zhao et al. (2016). Temporal andspatial variations in PM also were investigated with fine pre-cision at the city scale (Hu et al. 2014; Zhang and Cao 2015).Most studies only focused on the spatial and temporal varia-tions of a few pollutants in provincial cities throughout China,so the spatial scale was relatively coarse and the pollutioncharacteristics at city scale for less-developed provinces con-taining different terrains have not been comprehensivelystudied.
Shaanxi is a major province in northwest China, whichhas the three type terrains from north to south (plateau,plain, and mountains regions), and previous studies of thisregion have focused mainly on limited pollutants in the
Guanzhong area, especially Xi’an (Qu et al. 2010; Wanget al. 2014a; Zhang et al. 2016; Zhao et al. 2016). Thus,this study aimed to investigate the temporal and spatialvariations of criteria air pollutants, the air quality attain-ment status, major pollutants, correlations among cities foreach pollutant, and regional relationships among pollutantsbased on 1-year monitoring data at the city scale in thethree typical terrain regions in Shaanxi.
Methods and data
Study domain
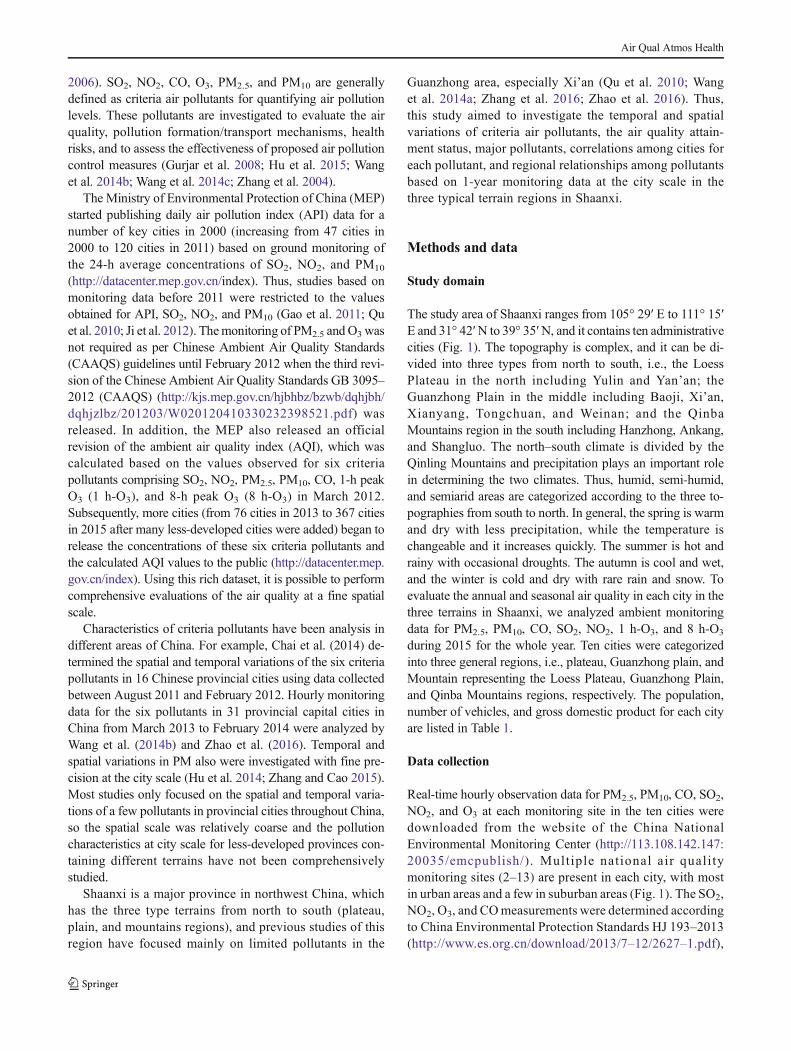
The study area of Shaanxi ranges from 105° 29′ E to 111° 15′E and 31° 42′N to 39° 35′N, and it contains ten administrativecities (Fig. 1). The topography is complex, and it can be di-vided into three types from north to south, i.e., the LoessPlateau in the north including Yulin and Yan’an; theGuanzhong Plain in the middle including Baoji, Xi’an,Xianyang, Tongchuan, and Weinan; and the QinbaMountains region in the south including Hanzhong, Ankang,and Shangluo. The north–south climate is divided by theQinling Mountains and precipitation plays an important rolein determining the two climates. Thus, humid, semi-humid,and semiarid areas are categorized according to the three to-pographies from south to north. In general, the spring is warmand dry with less precipitation, while the temperature ischangeable and it increases quickly. The summer is hot andrainy with occasional droughts. The autumn is cool and wet,and the winter is cold and dry with rare rain and snow. Toevaluate the annual and seasonal air quality in each city in thethree terrains in Shaanxi, we analyzed ambient monitoringdata for PM2.5, PM10, CO, SO2, NO2, 1 h-O3, and 8 h-O3
during 2015 for the whole year. Ten cities were categorizedinto three general regions, i.e., plateau, Guanzhong plain, andMountain representing the Loess Plateau, Guanzhong Plain,and Qinba Mountains regions, respectively. The population,number of vehicles, and gross domestic product for each cityare listed in Table 1.
Data collection
Real-time hourly observation data for PM2.5, PM10, CO, SO2,NO2, and O3 at each monitoring site in the ten cities weredownloaded from the website of the China NationalEnvironmental Monitoring Center (http://113.108.142.147:20035/emcpublish/). Mult iple nat ional air quali tymonitoring sites (2–13) are present in each city, with mostin urban areas and a few in suburban areas (Fig. 1). The SO2,NO2, O3, and COmeasurements were determined accordingto China Environmental Protection Standards HJ 193–2013(http://www.es.org.cn/download/2013/7–12/2627–1.pdf),
Air Qual Atmos Health

and those for PM2.5 and PM10 were obtained according toChina Environmental Protection Standards HJ 655–2013(http://www.es.org.cn/download/2013/7–12/2626–1.pdf).
SO2, NO2, and O3 are measured by the ultraviolet fluores-cence method (TEI, Model 43i from Thermo Fisher ScientificInc., USA, or EC9850 from Ecotech Pty Ltd., Australia), thechemiluminescence method (TEI Model 42i from ThermoFisher Scientific Inc., USA, or EC9841 from Ecotech PtyLtd., Australia), and the UV-spectrophotometry method (TEImodel 49i from Thermo Fisher Scientific Inc., USA, orEC9810 from Ecotech Pty Ltd., Australia), respectively. COis measured using the nondispersive infrared absorption meth-od and the gas filter correlation infrared absorption method
(API Model 300 from Teledyne Advanced PollutionInstrumentation, USA, or TEI, Model 48i from ThermoFisher Scientific Inc., USA, or EC9830 from Ecotech PtyLtd., Australia). The microoscillating balance method(TEOM from Rupprecht & Patashnick Co., Inc., USA) andthe β absorption method (BAM 1020 from Met OneInstrument Inc., USA or Tianhong Co., China or Xianhe Co.,China) are used to measure PM2.5 and PM10. The concentra-tions of the gases and aerosols are relatively high during thestudy period and are always higher than the minimal detectionlimit of the instruments. The details of the methods were ex-plained by Zhao et al. (2016). The values were automaticallyuploaded to the NEM and published after validation according
Table 1 Region category, population, vehicle numbers, gross domestic product (GDP), and number of nonattainment days in the ten cities in Shaanxiduring 2015
City Regioncategory
Population(million)
Vehicle numbers(thousand)
GDP(billion yuan)
Number of nonattainmentdays (for standard II)
Number of nonattainmentdays (for standard I)
Number ofvalid days
Yulin (YL) Plateau 3.38 510 262.1 71 336 362
Yan’an (YA) Plateau 2.21 246 119.9 73 346 362
Baoji (BJ) Plain 3.75 205 178.9 86 339 362
Xi’an (XA) Plain 8.63 1966 581.0 96 342 362
Xianyang (XY) Plain 5.05 271 215.6 93 337 362
Tongchuan (TC) Plain 0.85 69 32.5 92 341 362
Weinan (WN) Plain 5.34 394 146.9 92 342 362
Ankang (AK) Mountain 2.64 94 77.2 66 286 362
Hanzhong (HZ) Mountain 3.43 174 99.1 71 282 362
Shangluo (SL) Mountain 2.35 67 62.2 50 321 356
Source: http://www.shaanxitj.gov.cn/site/1/html/126/132/142/list.htm
0
500
1000
1500
2000
Xi’an
Xianyang
Baoji
HanzhongAnkang
Shangluo
Weinan
Tongchuan
Yan’an
Yulin
Xi’an
Xianyang
Baoji
HanzhongAnkang
Shangluo
Weinan
Tongchuan
Yan’an
Yulin
Xi’an
Xianyang
Baoji
HanzhongAnkang
Shangluo
Weinan
Tongchuan
Yan’an
Yulin
Fig. 1 Geographical location of Shaanxi, terrain elevation, and locations of air quality monitoring sites. The colour shows the elevation height and blacktriangles repesent the locations of air quality monitoring sites in each city
Air Qual Atmos Health

to the Technical Guideline on Environmental MonitoringQuality Management HJ 630–2011(http://kjs.mep.gov.cn/hjbhbz/bzwb/other/qt/201109/W020120130585014685198.pdf). The hourly data were subjected to a sanity check in orderto remove any problematic data points according to CAAQS,as described by Zhao et al. (2016).
In order evaluate the effect of meteorology on pollutants,temperature, relative humidity, and wind speed wasdownloaded from NOAA’s National Climatic Data Center(ftp://ftp.ncdc.noaa.gov/pub/data/noaa/2015) and the dailydata of atmospheric pressure, temperature, relative humidity,wind speed, and sunshine hours were obtained from theNational Daily Surface Climate Dataset (V3.0) (http://data.cma.cn/data/cdcdetail/dataCode/SURF_CLI_CHN_MUL_DAY_CES_V3.0.html), which was prepared by the NationalMeteorological Information Center from the automaticuploaded hourly surface monitoring data.
Analytical methods
The daily concentrations at each site were calculated onlywhen 18 valid hourly values were available for that day. Thecitywide daily average concentrations of PM2.5, PM10, CO,SO2, and NO2 were the average values of the correspondingdaily average concentrations at all monitoring sites in eachcity. The citywide average hourly concentrations were calcu-lated when valid hourly data for the corresponding pollutantwere available for more than two thirds of the monitoringsites. The daily 8 h-O3 concentrations were calculated basedon the average diurnal O3 concentrations when valid data wereavailable for at least 6 h out of every 8 h, and the maximumvalue was selected among all the calculations. The daily 1 h-O3 concentration was the maximum value among the validdiurnal data. The citywide seasonal average values were cal-culated by averaging the citywide daily average values, with arequirement for more than 81 values during each season.Similarly, the citywide annual average values were also cal-culated based on the citywide daily average values, with arequirement for more than 324. The citywide daily, seasonal,and annual average concentrations of PM2.5, PM10, CO, SO2,and NO2, as well as the 1 h-O3 and 8 h-O3 concentrations werecalculated according to these principles. The same dataset andmethod were also used in previous studies (Hu et al. 2014;Wang et al. 2014c). The days when the daily average concen-trations of at least one pollutant exceeded the CAAQS GradeII standard were defined as nonattainment days.
Correlation coefficients were calculated to analyze the pos-sible synergy among pollutants, and the interregional relation-ships among pollutants were determined based on the dailyaverage concentrations. To assess the diurnal variations inPM2.5, PM10, CO, SO2, NO2, and O3, the citywide seasonaldiurnal concentrations were determined when more than 81 ofthe corresponding citywide hourly average values for each
hour were available in each season. Similarly, the citywideannual diurnal values were calculation based on the corre-sponding citywide hourly average values, with a requirementfor more than 324. Additionally, the average diurnal variationsin temperature, relative humility, and wind speed in four sea-sons and annual and seasonal average values of atmosphericpressure, temperature, relative humility, wind speed, and sun-shine hours were also calculated. Besides, 72-h air mass back-ward trajectory analysis (Rolph et al. 2017; Yerramilli et al.2012) was conducted in the most polluted 11 consecutive daysin each cities in the four seasons using NOAA HYSPLITModel (http://ready.arl.noaa.gov/HYSPLIT.php) tounderstand the seasonal variations in inter- and extra-regional pollutions among different terrain regions in Shaanxi.
Results and discussion
Overall air pollutant concentrations
The annual average concentrations of the six pollutants werecalculated for the ten cities (Table 2). The ten cities experi-enced air pollution where the daily average concentrations ofat least one pollutant exceeded the CAAQS Grade I standardon more than 2 out of 3 days, and the CAAQS Grade IIstandard was exceeded on 16–28% of the total days in 2015.All ten cities were affected by severe particulate matterpollution.
The annual average concentration of PM2.5 ranged from38.3 μg/m3 (Yulin) to 59.0 μg/m3 (Xianyang), thereby exceed-ing the corresponding Grade II standard (35 μg/m3) by 9.4–68.6%, and PM10 ranged from 74.2 μg/m3 (Ankang) to121.7 μg/m3 (Xi’an), which exceeded the correspondingGrade II standard (70 μg/m3) by 6.0–73.9% (Table 2). SO2
ranged from 4.9 ppb (Hanzhong) to 8.6 ppb (Yan’an), whereseven cities exceeded the Grade I standard (20 μg/m3, ~ 7 ppb),excluding Yulin, Baoji, and Hanzhong, but no cities exceededthe Grade II standard (60 μg/m3, ~ 21 ppb). NO2 ranged from8.3 ppb (Ankang) to 20.7 ppb (Yan’an), and only Xi’an andYan’an exceeded the Grade I and II standards (40 μg/m3,~ 19.5 ppb). The CO concentration ranged from 0.9 ppm(Weinan) to 1.42 ppm (Yan’an). The annual average 1 h-O3
concentration ranged from 41.0 ppb (Xianyang) to 51.9 ppb(Shangluo), and the 8 h-O3 concentration ranged from33.8 ppb (Xianyang) to 45.3 ppb (Shangluo). Daily averageCO, 1 h-O3, and 8 h-O3 standards are defined in CAAQS, butCO, 1 h-O3, and 8 h-O3 annual standards are not defined inCAAQS for evaluating the annual concentrations of CO andO3 in these cities.
The annual and seasonal distributions of the pollutant con-centrations in the ten cities are shown in Figs. 2 and 3. In termsof their temporal distributions, the concentrations of PM2.5,PM10, CO, SO2, and NO2 all exhibited similar seasonal trends,
Air Qual Atmos Health

with the highest levels in the winter and the lowest in the sum-mer, while there were intermediate concentrations in the springand autumn, with little difference among all three regions. Thehigh concentrations of pollutants in the winter were caused di-rectly by large increases in coal combustion and the burning ofbiomass or biofuel for heating. In addition, temperature inver-sion, and the highest atmospheric pressure (Table S1) causinglow PBL height allowed pollutants to accumulate in a shallowlayer with descending air motions (Ji et al. 2012). By contrast, inthe summer, the temperature was high with low atmosphericpressure (Table S1), the usually unstable state was beneficialfor dispersing pollutants, and heavy precipitation also removedpollutants, thereby leading to low concentrations. However, the8 h-O3 and 1 h-O3 concentrations exhibited the opposite season-al trends compared with the other pollutants.
In terms of their spatial distributions, the concentrations ofPM2.5, PM10, NO2, and SO2 in Guanzhong Plain cities wereusually higher than those in other two regions, whereas thoseof CO, 1 h-O3, and 8 h-O3 were lower. In general, the spatialdistributions of pollutants are influenced greatly by localsources. Guanzhong Plain was the most developed regionwith the highest GDP (Table 1), where coal-fired power plantsand industries with large units, including factories producingcement, chemicals, and metals, were mainly concentrated in2015 (Fig. S1). Furthermore, due to the surrounding highmountains, there is a lack of air movement and the air massencounter obstacles when moving out from the plain(Jazcilevich et al. 2005). However, the 8 h-O3 concentrationsexhibited contrasting spatial variations, where they were al-ways slightly higher in the plateau and mountain regions,possibly because of the relatively higher solar radiation withlong sunshine hours (Table S1) and lower NO2 concentrations(Fig. 3), respectively.
Variations in species
The detailed spatial variations in the concentration of eachpollutant among the three regions during the four seasons
were compared to determine their spatial and temporal differ-ences. The annual concentration of PM2.5 followed the orderof Guanzhong Plain > mountain region > plateau region.There were almost no differences among the ten cities in thethree regions during the spring and summer. In the autumn, theconcentrations in Guanzhong Plain were slightly higher thanthose in the other two regions, which had similar concentra-tions. In the winter, the concentrations were lowest in theplateau region, while the concentrations in the mountain re-gion (except Shangluo) were similar to those in GuanzhongPlain. The air mass trajectory analysis of the cities in the twoterrain regions when PM2.5 concentration was high in winter(Fig. S2) showed that the two regions had interregional trans-port in the winter, and the frequent short trajectory also indi-cated that pollutants were retained easily in the mountain re-gion (except Shangluo). In addition, poor meteorological con-ditions with less rainfall and poor restricted in the south con-tributed to the increased concentration (Gao et al. 2011).However, Shangluo is in a valley toward the northwest alongthe path of the winter monsoon and the wind speed was rela-tively high (two times of that in Ankang and Hanzhong)(Table S1), which favors the dispersion of pollutants. Theconcentration of PM10 was also highest in Guanzhong Plain(Fig. 2). However, the concentration of PM10 was higher inthe plateau region than the mountain region, except during thewinter, which contrasted with the trends in PM2.5. This differ-ence occurred because there is a source of suspended particu-late matter in the plateau region during dry and windy weatheras the Loess Plateau is arid and much of its surface is exposed(Zhang et al. 2002; Zhao et al. 2006), especially during thespring when dusty weather occurs(Wang et al. 2014c; Yanget al. 2011). Back-trajectory analysis for the two cities whenPM10 concentration was high in spring showed dusttransported by the strong winds from the Mongolia can be asignificant contributor (Fig. S2). Furthermore, the number ofindustries was much lower in the mountain region, and thus,they produced less PM10. The ratios of PM2.5 relative to that ofPM10 in the four seasons was in the order of mountain region
Table 2 Annual average concentrations of the criteria air pollutants in the ten cities in Shaanxi
PM2.5 (μg/m3) PM10 (μg/m
3) CO (ppm) SO2 (ppb) NO2 (ppb) 1 h-O3 (ppb) 8 h-O3 (ppb)
Yulin (YL) 38.3 ± 23.5 86.6 ± 46.4 1.37 ± 0.77 6.5 ± 4.7 17.3 ± 7.2 51.5 ± 17.3 45.1 ± 17.1
Yan’an (YA) 45.1 ± 24.0 99.8 ± 42.0 1.42 ± 0.74 8.6 ± 8.3 20.7 ± 5.3 50.5 ± 18.5 42.7 ± 18.0
Baoji (BJ) 56.1 ± 42.3 105.7 ± 61.2 1.10 ± 0.49 5.0 ± 3.6 16.8 ± 5.6 41.9 ± 20.7 34.8 ± 18.7
Xi’an (Querol et al.) 56.7 ± 38.3 121.7 ± 67.7 1.30 ± 0.54 8.5 ± 5.0 19.5 ± 6.9 42.8 ± 23.2 34.8 ± 19.9
Xianyang (XY) 59.0 ± 44.3 112.4 ± 66.1 0.99 ± 0.40 8.0 ± 4.5 18.1 ± 7.5 41.0 ± 20.2 33.8 ± 17.6
Tongchuan (TC) 55.3 ± 38.5 103.6 ± 52.6 0.96 ± 0.44 8.3 ± 6.9 16.5 ± 6.3 47.5 ± 17.3 40.6 ± 16.2
Weinan (WN) 58.7 ± 49.0 111.9 ± 72.9 0.90 ± 0.50 8.0 ± 4.8 19.3 ± 7.5 44.3 ± 21.1 36.8 ± 18.6
Ankang (AK) 50.0 ± 35.7 74.2 ± 46.5 0.92 ± 0.44 8.3 ± 4.7 8.3 ± 4.6 46.6 ± 17.1 39.7 ± 16.0
Hanzhong (HZ) 53.5 ± 39.9 76.9 ± 46.9 1.03 ± 0.46 4.9 ± 2.6 12.8 ± 5.3 45.2 ± 18.8 37.4 ± 17.0
Shangluo (SL) 43.2 ± 27.3 76.5 ± 45.7 1.38 ± 0.53 8.0 ± 5.0 12.5 ± 4.4 51. 9 ± 15.8 45.3 ± 15.2
Air Qual Atmos Health

> Guanzhong Plain > plateau region, corresponding to theseasonal PM10 and PM2.5 orders. The cities with relativelylower PM2.5/PM10 ratios in the plateau region were likelyhaving more primary PM sources, such as PM10 from dust.The ratios in the mountain region were highest did reflectthere were less PM emissions sources, and the frequent short
back-trajectory lines indicated the longtime for the formationof second PM2.5 (Fig. S2). The ratio increased from the springto winter in all regions, as the PM2.5/PM10 ratio increasedduring high PM events (Hu et al. 2014). The ratios in the threeregions were all larger than 0.5 in the winter, partly becausethe poor meteorology were responsible for the weak dilution
Fig. 2 Seasonal concentrations of PM2.5 and PM10 (in μg/m3) as well as the PM2.5/PM10 ratios
Air Qual Atmos Health

of primary pollutants and enhanced secondary PM formation,e.g., the conversion rates of NOx and SO2 from the gas phaseto the particle phases of NO3 and SO4 were higher (Quan et al.2014). The substantial fraction of PM10 mass was in the PM2.5
size range suggests that PM2.5 control strategies will also beeffective in reducing the PM10 pollution, especially in themountain region.
Higher CO concentrations were observed in the plateauregion (Fig. 3), which may have been due to the large numberof coal-fired power plants and industries in Yulin (Fig. S1).Yan’an is a linear narrow city stretching along a BY -̂typevalley, which induces the formation of a local confluence linein the city, thereby accumulating the CO produced mainly bytraffic and residents, with high CO concentrations (Jazcilevichet al. 2005). This could also explain why most of the pollutantconcentrations in Yan’an were higher than those in Yulin de-spite the fact that Yulin contained many more industries.Besides, back-trajectory analysis in the two cities showed thatalthough air mass were mainly from northwest regions,Yan’an was more frequently influenced by Yulin and otherregions, i.e., Guanzhong Plain and eastern China (Fig. S2).However, although Shangluo had the lowest levels of coalconsumption and vehicles, it was unexpectedly affected bysevere CO pollution. It has been studied that the concentra-tions of long-lived pollutants (i.e., CO and SO2) are influencedsignificantly by wind, and regional transport is also a majordeterminant of high CO concentrations (Zhu et al. 2016). Theconcentration of SO2 in the mountain region was slightlyhigher than that in the plateau region during all seasons exceptthe winter (Fig. 3). Unexpectedly, Yan’an had the highestconcentration of SO2 among the ten cities in the winter, whichmay be attributable to the BY -̂type valley where it is located.The concentrations of NO2 in the plateau region were similarto those in Guanzhong Plain, but higher than those in themountain region during all four seasons (Fig. 3). The NO2
concentration was high in the plateau region because of themany industries present in Yulin and the special urban terrainof Yan’an. The NO2 was derived mainly from mobile andstationary sources, and the concentrations were low due tothe small number of vehicles and industries in the mountainregion (Table 1). The concentration ofNO2was considerablyhigher than that of SO2 in all cities, partly because the effi-ciency of flue gas desulfurization was much higher than thatof denitrification in the coal-fired power plants in Shaanxi(Xu et al. 2017).
Nonattainment pollutants
The daily Bdominant pollutant^ is identified as the pollutantthat contributes the most to air quality degradation onnonattainment days. The daily individual air quality index(IAQI) is calculated based on the daily concentration of eachcriteria pollutant according to Technical Regulation on
Ambient Air Quality (HJ 633–2012) (http://kjs.mep.gov.cn/hjbhbz/bzwb/dqhjbh/jcgfffbz/201203/t20120302_224166.htm), where the IAQI is 100 when the corresponding pollutantconcentration is equal to the CAAQS Grade II standard. Thepollutant with the maximum IAQI is defined as the dominantpollutant on nonattainment days (Cheng et al. 2007). Thenonattainment days for standard II in each city are shownin Table 1, and the frequencies of each pollutant as the dom-inant pollutant on the nonattainment days are also illustrated(Fig. 4). PM2.5 was the most frequent dominant pollutant(40–90%), followed by PM10 (4–40%) and O3 (3–23%).The frequency of PM2.5 was much higher than that of PM10
in the mountain region especially in Ankang and Hanzhong(~ 19 times higher), followed by Guanzhong Plain (0.3–2.9times higher), whereas the frequencies of both were similarin the plateau region. CO, NO2, and 1 h-O3 occurred muchless frequently as the dominant pollutants (less than 2%).
In order to illustrate the complexity of air pollution, aBnondominant pollutant^ was defined as a nonattainment pol-lutant (IAQI > 100) but not the dominant pollutant. Based onthe number of days for each nonattainment pollutant (Fig. 5),PM10 was frequently a nondominant pollutant, especially inGuanzhong Plain (40–60%), followed by the mountain region(30–40%) and plateau region (10–20%). In addition, whenPM10 was a nondominant pollutant, PM2.5 was always thedominant pollutant. During 60–90% of the total days whenPM2.5 was the dominant pollutant, PM10 was a nondominantpollutant in Guanzhong Plain, and the rates were 30–50% inthe plateau and mountain regions (Table S2). Furthermore, thedays when PM10 was a nondominant pollutant were concen-trated mostly in the winter, i.e., 80–100% in the plateau andmountain regions, and 60–80% in Guanzhong Plain(Table S2). Therefore, PM10 occurred frequently as a nondom-inant pollutant when PM2.5 was the dominant pollutant inGuanzhong Plain (~ 81%), the mountain region (~ 46%),and the plateau region (~ 48%) during the winter onnonattainment days (Table S2). The results showed that allof the cities were also affected by combined pollution withPM2.5 and PM10 on nonattainment days, especially inGuanzhong Plain during the winter. PM2.5, 1 h-O3, 8 h-O3,and NO2 were rarely nondominant pollutants, with rates lowerthan 6%.
Nonattainment rates
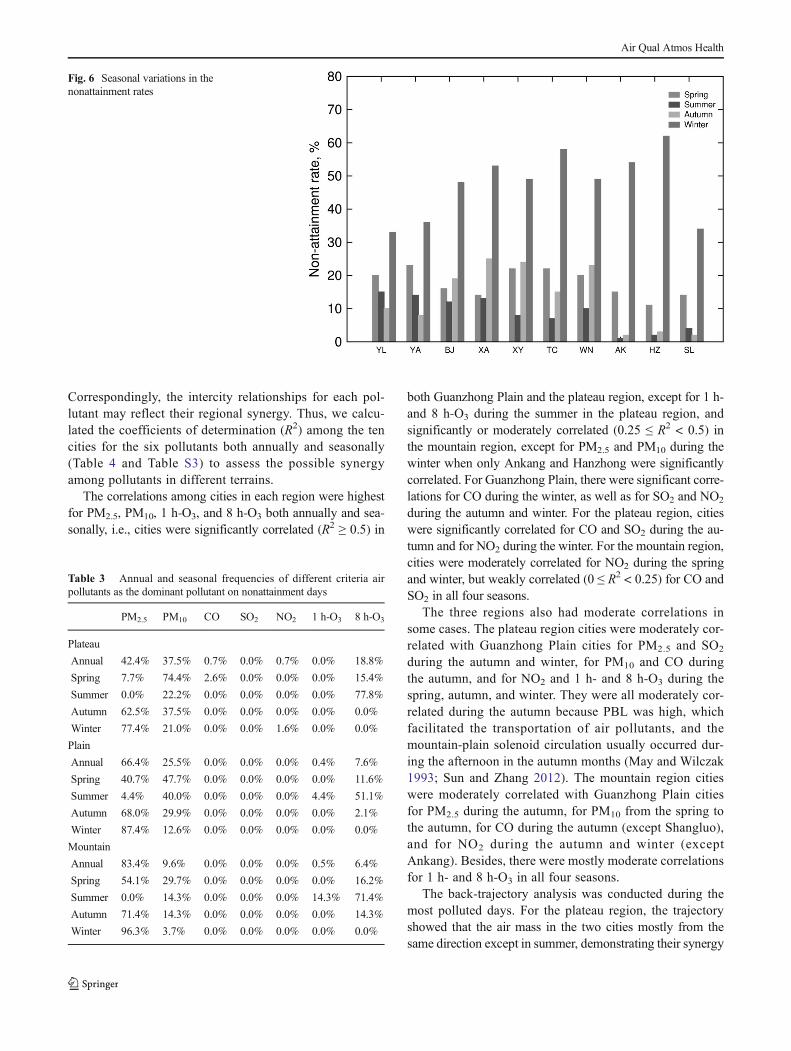
According to the seasonal rates of nonattainment days in eachcity, the seasonal variations were similar in cities in the sameregion whereas there were some differences among regions(Fig. 6). Furthermore, the frequencies of different criteria pol-lutants as the dominant pollutants varied among seasons in thethree regions (Table 3).
In general, the worst air quality occurred in all of the citiesduring the winter, where nonattainment days accounted for
Air Qual Atmos Health
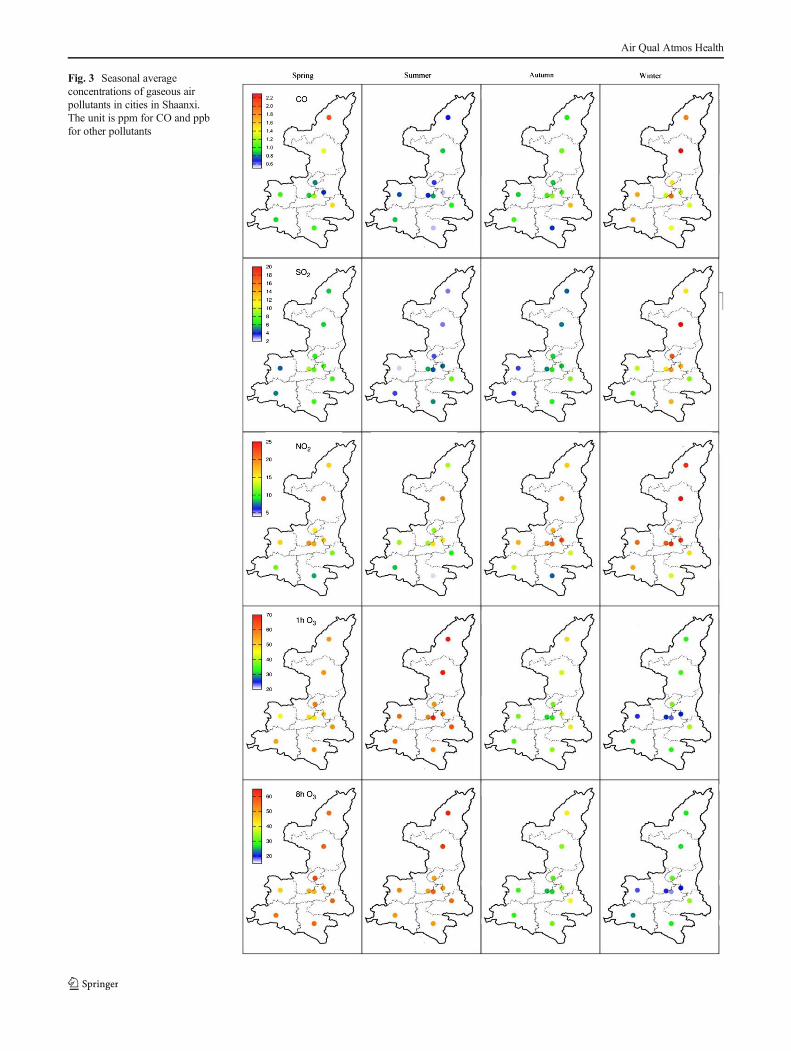
Fig. 3 Seasonal averageconcentrations of gaseous airpollutants in cities in Shaanxi.The unit is ppm for CO and ppbfor other pollutants
Air Qual Atmos Health

30–60%. PM2.5 was the most frequent dominant pollutant(77–96%), possibly because of increased coal combustion(Ji et al. 2012), and poor meteorological conditions are notconducive to the dispersion of air pollutants in the winter(Gao et al. 2011) as discussed above. During the summer,the nonattainment rate was lowest in the mountain region(~ 3%), where 8 h-O3 was the most frequent dominant pollut-ant (> 70%). Similarly, the nonattainment rate was also low inGuanzhong Plain (~ 10%) with comparable frequencies for8 h-O3 (~ 51%) and PM2.5 (~ 40%) as dominant pollutants.However, the nonattainment rate was not the lowest during thesummer in the plateau region where 8 h-O3 made the greatestcontribution (~ 78%) under conditions with high solar radia-tion (Querol et al. 2014; Santurtún et al. 2015) and long sun-shine hours (Table S1). During the autumn, the nonattainmentrate was also lowest in the mountain region (~2%). PM2.5 wasthe most frequent dominant pollutant (63–71%), and PM10
was the second most frequent (14–38%) in the three regions,but the nonattainment rates were quite different, i.e., ~ 2% inthe mountain region, ~ 21% in Guanzhong Plain, and ~ 9% in
the plateau region, thereby indicating severe PM2.5 pollutionin Guanzhong Plain during the autumn. During the spring, thenonattainment rate was ~ 22% in the plateau region wherePM10 made the main contribution (~ 74%) due to the effectsof dusty weather (Wang et al. 2014c; Yang et al. 2011). Thecontributions of PM2.5 (~ 41%) and PM10 (~ 48%) to thenonattainment rate (~ 19%) as dominant pollutants were sim-ilar in Guanzhong Plain. In the mountain region, PM2.5
(~ 54%) and PM10 (~ 30%) were the two main dominantpollutants that contributed to the nonattainment rates(~ 13%), and 8 h-O3 was the third main dominant pollutant,which made similar contributions (12–15%) to thenonattainment rates in the three regions during the spring.
Synergy among pollutants
In general, the concentrations of air pollutants can be in-fluenced greatly by regional transportation within the sameregion, where the similar geography and meteorology haveimportant effects (Gao et al. 2011; Zhu et al. 2016).
Fig. 4 Frequencies of differentpollutants as dominant pollutantson nonattainment days
Fig. 5 Number of days wheneach criteria air pollutant is anondominant pollutant onnonattainment days
Air Qual Atmos Health
Correspondingly, the intercity relationships for each pol-lutant may reflect their regional synergy. Thus, we calcu-lated the coefficients of determination (R2) among the tencities for the six pollutants both annually and seasonally(Table 4 and Table S3) to assess the possible synergyamong pollutants in different terrains.
The correlations among cities in each region were highestfor PM2.5, PM10, 1 h-O3, and 8 h-O3 both annually and sea-sonally, i.e., cities were significantly correlated (R2 ≥ 0.5) in
both Guanzhong Plain and the plateau region, except for 1 h-and 8 h-O3 during the summer in the plateau region, andsignificantly or moderately correlated (0.25 ≤ R2 < 0.5) inthe mountain region, except for PM2.5 and PM10 during thewinter when only Ankang and Hanzhong were significantlycorrelated. For Guanzhong Plain, there were significant corre-lations for CO during the winter, as well as for SO2 and NO2
during the autumn and winter. For the plateau region, citieswere significantly correlated for CO and SO2 during the au-tumn and for NO2 during the winter. For the mountain region,cities were moderately correlated for NO2 during the springand winter, but weakly correlated (0 ≤ R2 < 0.25) for CO andSO2 in all four seasons.
The three regions also had moderate correlations insome cases. The plateau region cities were moderately cor-related with Guanzhong Plain cities for PM2.5 and SO2
during the autumn and winter, for PM10 and CO duringthe autumn, and for NO2 and 1 h- and 8 h-O3 during thespring, autumn, and winter. They were all moderately cor-related during the autumn because PBL was high, whichfacilitated the transportation of air pollutants, and themountain-plain solenoid circulation usually occurred dur-ing the afternoon in the autumn months (May and Wilczak1993; Sun and Zhang 2012). The mountain region citieswere moderately correlated with Guanzhong Plain citiesfor PM2.5 during the autumn, for PM10 from the spring tothe autumn, for CO during the autumn (except Shangluo),and for NO2 during the autumn and winter (exceptAnkang). Besides, there were mostly moderate correlationsfor 1 h- and 8 h-O3 in all four seasons.
The back-trajectory analysis was conducted during themost polluted days. For the plateau region, the trajectoryshowed that the air mass in the two cities mostly from thesame direction except in summer, demonstrating their synergy
Fig. 6 Seasonal variations in thenonattainment rates
Table 3 Annual and seasonal frequencies of different criteria airpollutants as the dominant pollutant on nonattainment days
PM2.5 PM10 CO SO2 NO2 1 h-O3 8 h-O3
Plateau
Annual 42.4% 37.5% 0.7% 0.0% 0.7% 0.0% 18.8%
Spring 7.7% 74.4% 2.6% 0.0% 0.0% 0.0% 15.4%
Summer 0.0% 22.2% 0.0% 0.0% 0.0% 0.0% 77.8%
Autumn 62.5% 37.5% 0.0% 0.0% 0.0% 0.0% 0.0%
Winter 77.4% 21.0% 0.0% 0.0% 1.6% 0.0% 0.0%
Plain
Annual 66.4% 25.5% 0.0% 0.0% 0.0% 0.4% 7.6%
Spring 40.7% 47.7% 0.0% 0.0% 0.0% 0.0% 11.6%
Summer 4.4% 40.0% 0.0% 0.0% 0.0% 4.4% 51.1%
Autumn 68.0% 29.9% 0.0% 0.0% 0.0% 0.0% 2.1%
Winter 87.4% 12.6% 0.0% 0.0% 0.0% 0.0% 0.0%
Mountain
Annual 83.4% 9.6% 0.0% 0.0% 0.0% 0.5% 6.4%
Spring 54.1% 29.7% 0.0% 0.0% 0.0% 0.0% 16.2%
Summer 0.0% 14.3% 0.0% 0.0% 0.0% 14.3% 71.4%
Autumn 71.4% 14.3% 0.0% 0.0% 0.0% 0.0% 14.3%
Winter 96.3% 3.7% 0.0% 0.0% 0.0% 0.0% 0.0%
Air Qual Atmos Health

among PM2.5/PM10. For Guanzhong Plain, the same mostpolluted period and similar back-trajectories of the five citiesin the same season showed that their air quality were influ-enced by the similar air mass, and the several short twiningtrajectories in the plain also indicated their strong synergy forO3 in summer and PM2.5 in other seasons. Furthermore, the airmass from the mountain region indicates their synergy among
PM2.5. For the mountain region, their back-trajectories weredifferent, i.e., they were short and winding in Ankang andHanzhong, indicating the strong air mass retention bysurrounded mountain. However, some trajectories stretchedto northwest, indicating that it was influenced much by otherregions, e.g., 8 h-O3 and PM2.5 were moderated with that inGuanzhong Plain in summer and winter, respectively.
Table 4 Annual coefficients of determination (R2) for criteria air pollutants between cities
YL YA BJ XA XY TC WN AK HZ SL
YL 0.75 0.59 0.45 0.49 0.49 0.58 0.25 0.22 0.31
YA 0.58 0.62 0.47 0.54 0.51 0.71 0.37 0.34 0.47
BJ 0.25 0.32 0.76 0.81 0.73 0.76 0.3 0.31 0.39
XA 0.26 0.3 0.69 0.94 0.85 0.72 0.37 0.36 0.31
XY 0.28 0.34 0.78 0.91 0.87 0.79 0.44 0.43 0.4
TC 0.28 0.3 0.68 0.77 0.81 0.75 0.35 0.33 0.33
WN 0.32 0.52 0.63 0.62 0.72 0.62 0.48 0.43 0.55
AK 0.1 0.25 0.23 0.32 0.35 0.25 0.42 0.77 0.57
HZ 0.11 0.28 0.33 0.39 0.44 0.31 0.45 0.76 0.38
SL 0.15 0.34 0.39 0.29 0.36 0.34 0.53 0.46 0.44
YL 0.34 0.21 0.15 0.27 0.08 0.21 0.4 0.11 0.09
YA 0.65 0.61 0.21 0.42 0.15 0.58 0.46 0.48 0.01
BJ 0.57 0.71 0.33 0.57 0.27 0.71 0.41 0.42 0
XA 0.32 0.43 0.47 0.8 0.77 0.5 0.21 0.38 0.04
XY 0.62 0.77 0.82 0.68 0.72 0.68 0.39 0.58 0.01
TC 0.53 0.66 0.74 0.51 0.84 0.46 0.15 0.37 0.03
WN 0.61 0.77 0.79 0.48 0.83 0.74 0.5 0.54 0.01
AK 0.39 0.6 0.48 0.38 0.59 0.5 0.53 0.4 0.06
HZ 0.34 0.51 0.46 0.42 0.52 0.44 0.46 0.53 0
SL 0.03 0.03 0.06 0.03 0.05 0.05 0.06 0.02 0.02
YL 0.43 0.47 0.39 0.47 0.35 0.53 0.36 0.39 0.45
YA 0.71 0.38 0.29 0.38 0.27 0.42 0.29 0.31 0.41
BJ 0.58 0.61 0.54 0.61 0.47 0.63 0.43 0.54 0.55
XA 0.56 0.69 0.71 0.82 0.64 0.51 0.23 0.43 0.46
XY 0.63 0.71 0.78 0.9 0.76 0.64 0.25 0.52 0.52
TC 0.58 0.62 0.73 0.76 0.81 0.5 0.18 0.38 0.47
WN 0.42 0.6 0.55 0.72 0.65 0.61 0.39 0.53 0.58
AK 0.39 0.46 0.45 0.54 0.54 0.49 0.44 0.59 0.47
HZ 0.41 0.56 0.57 0.65 0.65 0.58 0.53 0.67 0.51
SL 0.48 0.57 0.57 0.65 0.66 0.67 0.58 0.6 0.53
0.67
0.54 0.59
0.46 0.61 0.66
0.57 0.65 0.76 0.86
0.51 0.54 0.70 0.67 0.76
0.35 0.53 0.48 0.69 0.61 0.54
0.36 0.41 0.45 0.49 0.52 0.46 0.41
0.32 0.46 0.50 0.57 0.60 0.51 0.48 0.62
SL 0.46 0.54 0.58 0.61 0.65 0.62 0.52 0.59 0.46
PM2.5PM10
COSO2
NO28-h O3
1-h O3
Colors represent the value range for R2 , i.e., green, R2 ≥ 0.5; light blue, 0.25 ≤ R2 < 0.5; yellow, 0 ≤ R2 < 0.25. For each pollutant, the three red framesfrom the upper left corner to the lower right corner show the R2 values between cities in the plateau region, Guanzhong Plain, and mountain region,respectively
Air Qual Atmos Health

Besides, the trajectories in the plateau region and Guanzhongshowed that the two regions shared air mass in fall and winter.
Correlations between air pollutants
According to the synergy among pollutants within eachregion, as discussed above, correlations were also testedamong pollutants to investigate their relationships in thethree regions (Table 5). We found that there were some
common correlations among the three regions. PM2.5
was always significantly correlated (R ≥ 0.5) withPM10 in all three regions, possibly because the ratiosof PM2.5 to PM10 were high (0.4–0.8) (Fig. 2), andimplied that they may have the same source regions orthat they are influenced by the same local conditions(Deshmukh et al. 2013; Rashki et al. 2013). SO2 andNO2 were always moderately (0.25 ≤ R < 0.5) or sig-nificantly correlated, thereby suggesting that they had
Table 5 Correlation coefficients (R) between criteria air pollutants in the three regions of Shaanxi
Plateau Guanzhong Mountain
Yearly PM10 CO SO2 NO2
1 h-
O3
8 h-
O3 PM10 CO SO2 NO2
1 h-
O3
8 h-
O3 PM10 CO SO2 NO2
1h-
O3
8 h-
O3
PM2.5 0.66 0.46 0.56 0.54 -0.3 -0.35 0.9 0.73 0.56 0.68 -0.35 -0.39 0.87 0.5 0.49 0.64 -0.25 -0.3
PM10 0.36 0.37 0.36 -0.16 -0.19 0.67 0.54 0.68 -0.29 -0.32 0.48 0.47 0.6 -0.18 -0.21
CO 0.74 0.49 -0.46 -0.49 0.62 0.63 -0.5 -0.53 0.39 0.6 -0.23 -0.25
SO2 0.64 -0.49 -0.55 0.56 -0.32 -0.35 0.42 -0.12 -0.13
NO2 -0.27 -0.36 -0.27 -0.34 -0.37 -0.43
1h-O3 0.97 0.98 0.98
Spring
PM2.5 0.65 -0.04 0.28 0.37 0.02 -0.06 0.71 0.5 0.44 0.52 -0.08 -0.14 0.71 0.01 0.24 0.44 0 -0.04
PM10 -0.01 0.18 0.21 -0.06 -0.09 0.34 0.45 0.52 0.07 0.03 0.15 0.26 0.29 0.02 0.04
CO 0.43 -0.06 -0.37 -0.36 0.32 0.33 -0.26 -0.3 0.37 0.1 -0.01 0.01
SO2 0.36 -0.27 -0.33 0.5 -0.04 -0.06 0.22 0.16 0.15
NO2 0.26 0.2 0.2 0.13 -0.06 -0.12
1h-O3 0.97 0.98 0.96
Summer
PM2.5 0.63 0.32 0.09 0.15 0.14 0.13 0.72 0.33 0.11 0.13 0.08 0.09 0.79 0.34 0.21 0.35 0.34 0.32
PM10 -0.06 0.08 0.21 0.03 -0.01 0.15 0.18 0.38 0.06 0.04 0.31 0.24 0.42 0.33 0.3
CO -0.09 0.39 0.06 -0.01 0.02 0.12 0.09 0.05 0.03 0.7 0.09 0.07
SO2 0.26 0.24 0.16 0.37 0.3 0.29 0.24 0.18 0.2
NO2 0.24 0.16 0.28 0.21 0.12 0.09
1h-O3 0.93 0.98 0.95
Autumn
PM2.5 0.69 0.57 0.39 0.45 -0.11 -0.17 0.88 0.63 0.41 0.61 0.02 -0.02 0.87 0.13 0.21 0.32 0.24 0.2
PM10 0.3 0.34 0.55 0.08 -0.02 0.54 0.41 0.61 0.03 -0.01 0.09 0.14 0.29 0.22 0.19
CO 0.7 0.64 -0.56 -0.63 0.58 0.55 -0.42 -0.45 0.19 0.47 0.14 0.15
SO2 0.56 -0.41 -0.48 0.65 -0.15 -0.2 0.13 0.11 0.12
NO2 -0.21 -0.34 0.01 -0.08 -0.14 -0.18
1h-O3 0.97 0.99 0.98
Winter
PM2.5 0.66 0.35 0.38 0.5 -0.12 -0.22 0.94 0.67 0.37 0.75 -0.44 -0.49 0.88 0.66 0.45 0.58 -0.24 -0.34
PM10 0.26 0.25 0.18 0.11 0.07 0.69 0.33 0.73 -0.42 -0.47 0.61 0.49 0.62 -0.13 -0.23
CO 0.73 0.51 -0.04 -0.19 0.38 0.65 -0.35 -0.4 0.36 0.64 -0.33 -0.45
SO2 0.66 -0.02 -0.27 0.46 -0.07 -0.13 0.37 -0.12 -0.17
NO2 -0.21 -0.5 -0.43 -0.54 -0.26 -0.44
1h O3 0.89 0.96 0.95
Colors represent the value ranges for R, i.e., green, R ≥ 0.5; light blue, 0.25 ≤ R < 0.5; yellow, − 0.25 ≤ R < 0.25; red, R < − 0.25
Air Qual Atmos Health

common sources (e.g., fossil fuels) and elimination re-actions (e.g., secondary inorganic aerosol (SIA) forma-tion). NO2 and SO2 always had positive correlationswith PM2.5 and PM10, where the correlation withPM2.5 (significant or moderate) was better than thatwith PM10 (moderate or weak (0 < R < 0.25)). This ismainly because sulfate and nitrate, which are emitteddirectly together with NO2 and SO2, or as SIA generat-ed via gas-phase oxidation or aqueous reactions fromthe two species, have important effects on PM2.5
(Ervens et al. 2011; Fang et al. 2009; Guo et al.2014; Huang et al. 2014). In addition, the differencebetween the two correlations may be explained by thecontribution of nitrate exceeding that of sulfate in SIA.
There were seasonal and spatial variations in the other cor-relations (i.e., 8 h-O3 with other species, and CO with PM2.5,PM10, SO2, and NO2). We found that 8 h-O3 had the mostsignificant negative correlations (R < − 0.25) with other pol-lutants during the winter in all three regions, possibly becausethe meteorological conditions were conducive to the accumu-lation of the other five pollutants, but not for 8 h-O3 becausethe solar radiation level was lower with high aerosol pollution.NO2 had a negative correlation with 8 h-O3. During the sum-mer, 8 h-O3 was significantly correlated with PM2.5 and PM10
only in the mountain region, thereby indicating that the simul-taneous formation of secondary O3 and PM2.5 via photochem-ical reactions (Sakulyanontvittaya et al. 2009; Ying et al.2015) was greater than that in the other two regions. Duringthe spring and autumn, 8 h-O3 had significant negative corre-lations with CO and SO2 in the plateau region, where the maindifference was that 8 h-O3 was weakly correlated with NO2
during the spring but significantly negatively correlated dur-ing the autumn. During the spring and autumn, 8 h-O3 wasalso significantly correlated with CO in Guanzhong Plain,whereas the other correlations (i.e., 8 h-O3 with PM2.5,PM10, SO2, and NO2) were weak. The correlations were weak(− 0.25 ≤ R < 0.25) in the mountain region during the twoseasons.
There were significant or moderate correlations betweenCO with PM2.5, PM10, SO2, and NO2, during the winter inall three regions, thereby suggesting that their common originwas fossil fuel combustion. During the autumn, their corre-lations were similar to those during the winter in the plateauregion and Guanzhong Plain, whereas the correlations wereweak in the mountain region, except for a moderate corre-lation with NO2, which indicates that less coal was burnedin the mountain region, and thus, the CO and NO2 concen-trations were influenced greatly by vehicles. During thespring, there were moderate correlations in GuanzhongPlain but CO was only moderately correlated with SO2 inthe other two regions. CO was also moderately correlatedwith PM2.5 and NO2 in the plateau region during the sum-mer, but only moderately correlated with PM2.5 and weakly
correlated with NO2 in Guanzhong Plain. 1 h-O3 was muchsignificantly correlated with 8 h-O3 and their correlationwith other pollutants was similar.
Comparison among cities
To further assess the terrain effects on air pollution, compari-sons among three cities with similar population (Yulin, Baoji,and Hanzhong) were conducted in the three correspondingterrain regions. The concentrations of most pollutants inBaoji were usually higher than Hanzhong and Yulin (Fig. 2).The concentrations ofmost pollutants such as PM2.5 and PM10
in Baoji are usually higher than those in Hanzhong and Yulinespecially in the winter, as the plain terrain was easy for airpollutants emitted from Xi’an, Xianyang, and Weinan, whichhad much more population than Baoji, to reach Baoji. LoessPlateau is arid and much of its surface is exposed, so PM10 isrelatively high in Yulin in spring. The PM10 level in Yulin wasclose to that in Baoji and was slightly higher than that inHanzhong from spring to autumn. Besides, the relative highaltitude may made the region receive stronger solar radiationand have longer sunshine hours, leading to high 1 h- and 8 h-O3 in all seasons. Themountain region can retain pollutants bysurrounding mountains especially in winter. The concentra-tions of PM2.5 and PM10 in Hanzhong increased to approxi-mate to those of Baoji in winter.
PM2.5, PM10, and 8 h-O3 were the three most frequentdominant pollutants in Yulin. PM2.5 was the most frequentdominant pollutant in Baoji, and PM10 appeared as dominantpollutant in all seasons. PM2.5 also was the most frequentpollutant in Hanzhong, but PM10 was the dominant pollutantonly in spring (Table S4). The correlation coefficients of thefive pollutants (except 8 h-O3) were lowest in Yulin, especial-ly in summer (Table S5), indicating that there was complexrelationship in plateau region. PM2.5 showed significant cor-relation with PM10 in the three cities, and the correlation wasalways highest in Hanzhong, indicating the close relationshipbetween PM2.5 and PM10.
Conclusion
In this study, the characteristics of six criteria pollutants wereanalyzed in the three terrain regions in Shaanxi in 2015.Shaanxi was mainly affected by 8 h-O3 during the summerand by PM2.5 and PM10 in the other seasons. The high con-centrations of the pollutants (except 8 h-O3) and the number ofnonattainment days showed that the air quality was poorestduring the winter, especially in the Guanzhong Plain andmountain regions. Cities in the three regions were mostly sig-nificantly correlated for PM2.5, PM10, and 8 h-O3, especiallyin Guanzhong Plain, which suggests that the location of citiesin plains surrounded by mountains can readily lead to synergy
Air Qual Atmos Health

among pollutants with high concentrations. Themoderate cor-relations among the three regions for some pollutants showedthat synergy among pollutants also occurred on a large scale insome cases. In addition, nonattainment days in the mountainregion were rare during the summer and autumn, but theyincreased greatly during the winter when PM2.5 was the dom-inant pollutant, showing the special polluted characteristics inthe mountain region in winter. These results provide insightsinto the combined influence of air pollution from regionalcities, and they may also help governors of different cities tounderstand the importance of working together to reduce airpollution.
Future studies should focus on the effects and contributionsof extra-regional transport of pollutants to obtain a more com-prehensive understanding of air pollution in Shaanxi. The lo-cal sources, the transport of pollutants, and chemical compo-sitions of PM2.5 in the synergistic pollution-affected regionduring highly polluted seasons should also be investigated toelucidate the mechanisms responsible for the formation of airpollution and to design effective control strategies.
Funding information This study is supported by the National 12thFive-Year Scientific and Technological Support Plan (Grant#2015BAD07B06), and the "948" project from the State ForestryAdministration of China (grant #2013–4–56).
References
Cheng W-L, Chen Y-S, Zhang J, Lyons T, Pai J-L, Chang S-H (2007)Comparison of the revised air quality index with the PSI and AQIindices. Sci Total Environ 382:191–198
Deshmukh DK, Deb MK, Mkoma SL (2013) Size distribution and sea-sonal variation of size-segregated particulate matter in the ambientair of Raipur city, India. Air Qual Atmos Health 6:259–276
Ervens B, Turpin BJ,Weber RJ (2011) Secondary organic aerosol formationin cloud droplets and aqueous particles (aqSOA): a review of labora-tory, field and model studies. Atmos Chem Phys 11:11069–11102
Fang M, Chan CK, Yao X (2009) Managing air quality in a rapidlydeveloping nation: China. Atmos Environ 43:79–86
Gao Y, Liu X, Zhao C, Zhang M (2011) Emission controls versus mete-orological conditions in determining aerosol concentrations inBeijing during the 2008 Olympic Games. Atmos Chem Phys 11:12437–12451
Guo S, Hu M, Zamora ML, Peng J, Shang D, Zheng J, Du Z, Wu Z, ShaoM, Zeng L,MolinaMJ, Zhang R (2014) Elucidating severe urban hazeformation in China. Proc Natl Acad Sci U S A 111:17373–17378
Gurjar BR, Butler TM, Lawrence MG, Lelieveld J (2008) Evaluation ofemissions and air quality in megacities. Atmos Environ 42:1593–1606
Hu J, Wang Y, Ying Q, Zhang H (2014) Spatial and temporal variabilityof PM2.5 and PM10 over the North China Plain and the YangtzeRiver Delta, China. Atmos Environ 95:598–609
Hu J, Ying Q,Wang Y, ZhangH (2015) Characterizing multi-pollutant airpollution in China: comparison of three air quality indices. EnvironInt 84:17–25
Huang RJ, Zhang Y, Bozzetti C, Ho KF, Cao JJ, Han Y, Daellenbach KR,Slowik JG, Platt SM, Canonaco F, Zotter P, Wolf R, Pieber SM,Bruns EA, Crippa M, Ciarelli G, Piazzalunga A, Schwikowski M,
Abbaszade G, Schnelle-Kreis J, Zimmermann R, An Z, Szidat S,Baltensperger U, El Haddad I, Prevot AS (2014) High secondaryaerosol contribution to particulate pollution during haze events inChina. Nature 514:218–222
JazcilevichAD, García AR, Caetano E (2005) Locally induced surface airconfluence by complex terrain and its effects on air pollution in thevalley of Mexico. Atmos Environ 39:5481–5489
Ji D,WangY,Wang L, Chen L, Hu B, TangG, Xin J, Song T,Wen T, SunY, Pan Y, Liu Z (2012) Analysis of heavy pollution episodes inselected cities of northern China. Atmos Environ 50:338–348
Lei W, De Foy B, Zavala M, Volkamer R, Molina LT (2007)Characterizing ozone production in the Mexico City Metropolitanarea, a case study using a chemical transport model. Atmos ChemPhys 7:1347–1366
May PT, Wilczak JM (1993) Diurnal and seasonal-variations ofboundary-layer structure observed with a radar wind profiler andrass. Mon Weather Rev 121:673–682
Qu WJ, Arimoto R, Zhang XY, Zhao CH, Wang YQ, Sheng LF, Fu G(2010) Spatial distribution and interannual variation of surface PM10
concentrations over eighty-six Chinese cities. Atmos Chem Phys 10:5641–5662
Quan J, Tie X, Zhang Q, Liu Q, Li X, Gao Y, Zhao D (2014)Characteristics of heavy aerosol pollution during the 2012–2013winter in Beijing, China. Atmos Environ 88:83–89
Querol X, Alastuey A, Pandolfi M, Reche C, Pérez N, Minguillón MC,Moreno T, Viana M, Escudero M, Orio A (2014) 2001–2012 trendson air quality in Spain. Sci Total Environ 490:957–969
Rashki A, CJd R, Eriksson PG, Kaskaoutis DG, Gupta P (2013)Temporal changes of particulate concentration in the ambient airover the city of Zahedan, Iran. Air Qual Atmos Health 6:123–135
Rolph G, Stein A, Stunder B (2017) Real-time EnvironmentalApplications and Display sYstem: READY. Environ Model Softw95:210–228
Sakulyanontvittaya T, Guenther A, Helmig D, Milford J, WiedinmyerC (2009) Secondary organic aerosol from sesquiterpene andmonoterpene emissions in the United States. Environ SciTechnol 42:8784–8790
Santurtún A, González-Hidalgo JC, Sanchez-Lorenzo A, ZarrabeitiaMT (2015) Surface ozone concentration trends and its relation-ship with weather types in Spain (2001–2010). Atmos Environ101:10–22
Sun J, Zhang F (2012) Impacts of mountain-plains solenoid on diurnalvariations of rainfalls along the Mei-Yu front over the East ChinaPlains. Mon Weather Rev 140:379–397
Tie X, Madronich S, Li G, Ying Z, Zhang R, Garcia AR, Lee-Taylor J,Liu Y (2007) Characterizations of chemical oxidants in MexicoCity: a regional chemical dynamical model (WRF-Chem) study.Atmos Environ 41:1989–2008
Wang D, Hu J, Xu Y, Lv D, Xie X, KleemanM, Xing J, Zhang H, Ying Q(2014a) Source contributions to primary and secondary inorganicparticulate matter during a severe wintertime PM2.5 pollution epi-sode in Xi'an, China. Atmos Environ 97:182–194
Wang Y, Li L, Chen C, Huang C, Huang H, Feng J, Wang S, Wang H,Zhang G, Zhou M, Cheng P, Wu M, Sheng G, Fu J, Hu Y, RussellAG, Wumaer A (2014b) Source apportionment of fine particulatematter during autumn haze episodes in Shanghai, China. J GeophysRes: Atmos 119:1903–1914
Wang Y, Ying Q, Hu J, Zhang H (2014c) Spatial and temporal variationsof six criteria air pollutants in 31 provincial capital cities in Chinaduring 2013-2014. Environ Int 73:413–422
Xu Y, Hu J, Ying Q, Hao H,Wang D, Zhang H (2017) Current and futureemissions of primary pollutants from coal-fired power plants inShaanxi, China. Sci Total Environ 595:505–514
Yang F, Tan J, Zhao Q, Du Z, He K, Ma Y, Duan F, Chen G, Zhao Q(2011) Characteristics of PM2.5 speciation in representative mega-cities and across China. Atmos Chem Phys 11:5207–5219
Air Qual Atmos Health

Yerramilli A, Dodla VBR, Challa VS, Myles L, Pendergrass WR, VogelCA, Dasari HP, Tuluri F, Baham JM, Hughes RL, Patrick C, YoungJH, Swanier SJ, Hardy MG (2012) An integrated WRF/HYSPLITmodeling approach for the assessment of PM2.5 source regions overthe Mississippi Gulf Coast region. Air Qual Atmos Health 5:401–412
Ying Q, Li J, Kota SH (2015) Significant contributions of isoprene tosummertime secondary organic aerosol in eastern United States.Environ Sci Technol 49:7834–7842
Zhang J, Zhang L-y DM, Zhang W, Huang X, Zhang Y-q, Yang Y-y,Zhang J-m, Deng S-h, Shen F, Li Y-w, Xiao H (2016) Indentifyingthe major air pollutants base on factor and cluster analysis, a casestudy in 74 Chinese cities. Atmos Environ 144:37–46
Zhang R, Lei W, Tie X, Hess P (2004) Industrial emissions cause extremediurnal urban ozone variability. Proc Natl Acad Sci U S A 101:6346–6350
Zhang XY, Cao JJ, Li LM, Arimoto R, Cheng Y, Huebert B, Wang D(2002) Characterization of atmospheric aerosol over XiAn in thesouth margin of the loess plateau, China. Atmos Environ 36:4189–4199
Zhang YL, Cao F (2015) Fine particulate matter (PM 2.5) in China at acity level. Sci Rep 5:14884
Zhao P, Feng Y, Zhu T, Wu J (2006) Characterizations of resuspendeddust in six cities of North China. Atmos Environ 40:5807–5814
Zhao S, Yu Y, Yin D, He J, Liu N, Qu J, Xiao J (2016) Annual and diurnalvariations of gaseous and particulate pollutants in 31 provincial cap-ital cities based on in situ air quality monitoring data from ChinaNational Environmental Monitoring Center. Environ Int 86:92–106
ZhuY, Zhang J,Wang J, ChenW,HanY, Ye C, Li Y, Liu J, Zeng L,WuY(2016) Distribution and sources of air pollutants in the North ChinaPlain based on on-road mobile measurements. Atmos Chem Phys16:12551–12565
Air Qual Atmos Health