Embed Size (px)
Citation preview

\ \
Estuaries Vol. 17, No. 4, p. 779-795 December 1994
Spatial and Temporal Variations of Photosynthetic
Parameters in Relation to Environmental Conditions
in Coastal Waters of the Northern Gulf of Mexico
STEVEN E. LOHRENZ 1
University of Southern MississijJjJi Center for Marine Science Stennis Space Center, Mississippi 395 29
GARY L. F AHNENSTIEL
National Oceanic and Atmospheric Administration Great Lakes Environmental Research Laboratory 2205 Commonwealth Bouleuard Ann Arbor, Michigan 48105
DONALD G. REDALJE
University of Southern Mississippi · Center for Marine Science
Stennis Space Center, Mississippi 39529
ABSTRACT: On a series of eight cruises conducted in the northern Gulf of Mexico, efforts were made to characterize temporal and spatial variability in parameters of the photosynthesis-irradiance saturation curve (P:,.,., a 8 , I.) and to relate the observed variations to environmental conditions. Experiments to examine the importance of diel variation in upper mixed layer populations were conducted in July-August 1990 and March 1991. During July-August 1990, p:,_ and 1. showed significant increases and a 8 decreased during the photoperiod in both river plume and shelf-slope populations. During March 1991, no consistent covariance of P-1 parameters with local time was found, although highest values of a 8
in the river plume were observed in early morning. Seasonal variation in pa ~ and a 8 were correlated with temperature. Spatial variations of photosynthetic parameters in the upper mixed layer ranged from twofold to threefold within any given cruise. Variations of photosynthetic parameters in the upper mixed layer were related to principal components derived from environmental variables, including temperature, salinity, nutrients, mixed layer depth, attenuation coefficient, and daily photosynthetically available radiation (PAR). Greater than 70% of the variation in the environmental variables could be accounted for by two principal components; the majority of this variation was associated with the first principal component, which was generally strongly correlated with salinity, nutrients, mixed layer depth, and attenuation coefficient. Correlations of P:..,., a 8 , and I• with the first principal component were found to be significant in some cases, an indication that spatial variability in P-1 parameters was related to river outflow. Variation of P-1 parameters in relation to depth and PAR were evaluated by regressions with principal components derived from depth, temperature, . .and mean daily PAR. For most cruises, p:,_ and I• were negatively correlated with the first principal component, which was strongly positively correlated with depth and negatively correlated with daily PAR. This was consistent with a decreaSe in both p:,_ and I. with depth that could be related to decreasing daily PAR. Positive correlations of a 8 with the first principal component for two cruises, March 1991 and April 1992, indicated an increasing trend with depth. In conclusion, relationships between P-1 parameters and environmental variables in the region of study were significant in some cases, but variation between cruises made it difficult to generalize. We attributed this variation to the physically dynamic characteristics of the region and the possible effects of variables that were not included in the analysis such as species composition. Our findings do support the view that a limited set of observations may be adequate to characterize P-1 parameter distributions in a given region within a restricted period of time.
Introduction Primary production in the northern Gulf of
Mexico is known to be dynamic and spatially heterogeneous (Riley 1937; Thomas and Simmons
1 Corresponding author.
«:> 1994 Estuarine Research Federation 779
1960; Lohrenz et al. 1990; Redalje et al. 1994). This has been attributed to the strong and variable gradients in physical and chemical properties, largely a consequence of the discharge from the Mississippi and Atchafalaya rivers. The variable nature of primary production in this region has complicated
0160-83471941040779-17$01.50/0

780 S. E. Lohrenz et al.
32
30
28
z ~
26 +-' 24 tiS ....:I
22
20
18 100 95 90 85 80
Lon (W)
Fig. I. Map of the Gulf of Mexico with the study region indicated by the box.
efforts to discern temporal and spatial patterns of regional productivity and their relation to possible controlling factors. Improved temporal and spatial resolution of primary production distributions has been achieved by using photosynthesis-irradiance models (e.g., Fee 1973a, b; Harrison eta!. 1985). Such approaches require knowledge of the relationship of rates of pigment-specific photosynthesis to light (i.e., the photosynthesis-irradiance curve) (e.g., Jassby and Platt 1976; Platt et al. 1980). Estimates of primary production can then be made from information about biomass and irradiance distributions, thereby allowing for more detailed sampling.
Environmental variability can act at the level of physiology within phytoplankton species as well as through effects on species composition to cause variations in photosynthesis-irradiance relationships. Such variation contributes to uncertainty in estimates of primary production derived using photosynthesis-irradiance models. Previous studies have demonstrated that photosynthetic parameters may vary over a wide range of temporal and spatial scales, with temperature and light being the most commonly observed environmental covariates (Platt and Jassby 1976; Harrison and Platt 1980; Falkowski 1981; Malone and Neale 1981; Cote and Platt 1983; Harding et al. 1985; Harrison and Platt 1986). Diel periodicity (MacCaull and Platt 1977; Harding et al. 1981, 1982) and species composition and cell size (Malone and Neale 1981; Geider et al. 1986; Gallegos 1992; Gonzalez-Morales et al.
· 1993) have also been implicated as factors contributing to variability.
While variation in photosynthetic parameters in other coastal ecosystems has been examined, little is known about spatial and temporal variation in
40
"' 1989 1990 1991 1992 e
0 30 0 0
0 bO 20 .... "' .<:: 0
"' 0 10 1::1
"' 0
~ 0 0 12 24 36 48
Month
Fig. 2. Monthly mean Mississippi River discharge measured at Tarbert Landing, Mississippi. (Courtesy Army Corps of Engineers.) Symbols indicate cruise periods.
the northern Gulf of Mexico. Such data can be used in the generation of modeled distributions of primary production over seasonal temporal scales and regional spatial scales (Lohrenz et al. 1992a and in preparation), and may facilitate understanding mechanisms of control at the ecosystem level. In addition, information about the distributions of photosynthesis-irradiance relationships and their responses to environmental forcing may be incorporated into larger scale predictive models of primary production (e.g., Platt and Sathyendranath 1988; Prasad et a!. in press). The objectives of our study included the following: 1) characterize temporal variability of photosynthetic parameters, including die I and seasonal time scales, and 2) characterize spatial variability, including changes along vertical gradients and horizontal gradients extending from the river outflow plume, and finally, 3) relate observed variations in photosynthetic parameters to environmental conditions, where possible.
Methods
Eight cruises were conducted in the northern Gulf of Mexico at various times of the year from 1989 to 1992. Cruise dates aboard the R/V Pelican included September 20-27, 1989, April 23-29, 1990, October 23-29, 1990, September 12-18, 1991, April 12-19, 1992, and May 5-18, 1992. Two cruises were conducted aboard the National Oceanic and Atmospheric Administration ship Malcom Baldrige,July 17-August 10, 1990 and March 4-17, 1991. Sampling was generally conducted in the area of the Mississippi River delta (Fig. 1) and encompassed various stages of riverine discharge (Fig. 2). For R/V Pelican cruises, an instrument system was used to provide profiles of conductivity

(Seabird SBE 4-02/0), temperature (SBE 3-01/F), and pressure, depth (SBE 13-01), in situ fluorescence (Sea Tech), and transmissometry (Sea Tech, 5-cm path). Sensors were calibrated before and after the cruise and drift was determined to be negligible. Salinities were determined using an Autosal Model 8400. Upper mixed-layer depths were determined by visual inspection of density profiles. Samples were collected in conjunction with profiling using a rosette sampler (General Oceanics) fitted with twelve 5-l Niskin bottles. To minimize introduction of substances toxic to phytoplankton ( cf. Fitzwater et al. 1982; Knauer and Martin 1983), the bottles were fitted with silicon 0-rings and closure bands. Bottles were cleaned with 0.5 N Baker Instra-Analyzed HCI prior to use. During the NIS Baldrige cruise, samples were collected with a clean 30-1 Go-Flo sampler (General Oceanics) deployed on Kevlar line and tripped with a teflon-coated messenger.
Chlorophyll a (Chi a) and phaeopigment analyses were performed on-board ship using an extraction technique modified from Shoaf and Lium ( 1976). Samples were filtered on Whatman GF IF glass-fiber filters, which were then immersed in 5 ml of DMSOiacetone (40160) and allowed to extract in darkness for I h. After extraction, samples were centrifuged, and fluorescence was measured before and after acidification using a Turner Model 10 fluorometer (Holm-Hansen et al. 1965). Calibrations were made using a Sigma Chi a standard.
Nutrient analyses (N03, N02, NH~, Si03, Po~-) during the NIS Baldrige cruise were performed on-board using a Technicon autoanalyzer as described by Whitledge et al. (1981). For RIV Pelican cruises, nutrient analyses were performed on-board with an Alpkem rapid flow analyzer. The procedures of Whitledge et al. ( 1981) were used after conversion to small volume manifold components. Salinities were determined using an Autosal Model 8400.
Continuous measurements of surface photosynthetic photon flux density (PPFD) were recorded using a Li-Cor system, including Ll-1000 data logger and an LI-190SA quantum sensor. For underwater profiling during the cruises prior to 1991, a LI-192SA underwater quantum sensor was used. During the July-August 1990 cruise, irradiance profiles were obtained using a Biospherical Instruments QSP-200 underwater quantum scalar irradiance sensor. For all subsequent cruises, a Biospherical Instruments PNF300 was used. Profiles of diffuse attenuation, K(z), were computed from the measured irradiance profiles as follows:
K(z) = ln[l(:z;.1)II(z;)]l(z;- z;.1) (1)
where I(z;) is the irradiance at depth Z;. Estimates
.. . • ..
Photosynthesis-lrradiance in Coastal Waters 781
of daily PAR at depth were made by computing the attenuation of surface incident PPFD. No adjustments were made for surface reflectance.
Photosynthesis-irradiance (P-1) measurements were conducted at selected stations during each cruise. Sampling depths were generally selected to be within a range of l-80% of surface incident irradiance. For the September 1989 cruise, P-1 measurements were conducted by incubating nine small polycarbonate bottles (0.045 l) for 1 h in a gradient of sunlight attenuated to various levels with neutral density film (Rasco Sun Filters, N Series). The percentage of solar irradiance at each light level was determined by measurements obtained with a Biospherical Instruments QSL-100 equipped with a 411" sensor. The bottles were incubated in a temperature-controlled deck incubation system (cf. Lohrenz et al. 1990, 1992b). After incubation, samples were filtered onto GF IF filters using gentle vacuum ( < 100 mm Hg), and filters acidified with 0.5 ml I N HCI to eliminate inorganic 14C (Lean and Burnison 1979). Filters were placed in a 20-ml scintillation vial to which 10 ml Scintiverse II (Fisher Scientific) was added.
For all subsequent cruises, photosynthesis-irradiance (P-1) measurements were conducted using a photosynthetron (e.g., Lewis and Smith 1983). Samples were inoculated with NaH14CO; (final concentration, 10 mCi l- 1) and aliquots of 3 ml were dispensed into glass scintillation vials (20-ml capacity) in a temperature-controlled polyvinyl chloride block. During the October 1990 cruise, incubations of less than I h duration were performed using 1-ml aliquots in 7-ml scintillation vials. A range of "white" irradiance was provided with an ELH-type tungsten-halogen projection lamp directed through a heat filter of circulating water, and attenuated with neutral density screens. Quantum scalar irradiance for each vial position was measured with a Biospherical Instruments QSL-100 with a 411" collector modified to fit in the bottom half of a scintillation vial. Each P-1 curve was fitted to data from 18 vial positions, with the exception of the April 1990 cruise when only nine positions were sampled for each curve. For cruises prior to 1991, total added activity was determined by subsampling a 50-JLl aliquot into 4-ml Scintiverse II scintillation fluor plus 50 1.1-l phenethylamine, 50 1.1-l 1 M Tris-HCl, and 100 JLl Milli-Q deionized water. For all subsequent cruises, a 50-jLl aliquot was added to 4 ml Safety-Solve (Research Products International) containing 50 1.1-l of a 1:1 mixture of ethanol: ethanolamine plus 50 1.1-l 1 M Tris-HCl and 100 1.1-l Milli-Q deionized water. Samples from the photosynthetron incubations were acidified directly (final cone. 0.3 N H 2S04) and purged with air for 20 min to volatilize residual 14C02• Prior to liq-

782 S. E. Lohrenz et al.
uid scintillation counting, 10 ml of Scintiverse II was added, with the exception that Cytoscint (ICN) was used for the April 1990 cruise samples.
Activities of productivity samples were determined by liquid scintillation analysis (Packard TriCarb 2000CA). Liquid scintillation counts were corrected for quenching by external standard. Dissolved inorganic carbon samples for specific activity calculations were collected in serum stoppered bottles and preserved with sodium azide (final cone. 0.001 M). Acid-volatilized C02 concentrations were determined by infrared absorption spectroscopy (Horriba).
The resulting photosynthetic rates, normalized to chlorophyll, were used to construct P-1 curves. The P-1 equation of Platt et al. (1980) was used to model the results:
P8 = P~· [1 - exp( -a81/P~)] ·[exp(-(381/P~)] (2)
where P8 (g C g Chi a- 1 h- 1) is the primary production rate normalized to biomass concentration (B, mg Chi a m-3), P~ (g C g Chi a- 1 h- 1) is the saturated rate of Chi trnormalized photosynthesis in the absence of photoinhibition, a 8 (g C [g Chi a h]- 1 [JJ.mol quanta m- 2 s- 1]-1) is the initial slope of the P-1 curve, (38 (g C [g Chi a h) -I [ JJ.mol quanta m-2 s- 1)- 1) is the parameter to characterize photoinhibition, and I (JJ.mol quanta m-2 s- 1) is the available quantum scalar irradiance. Parameters were fit simultaneously using the NONLIN procedure of SYSTAT (Wilkinson 1990), which also produced an estimate of standard errors of the coefficients. An intercept, P~ (g C g Chi a- 1 h- 1) was included as a parameter and checked against zero time values. In cases where differences between P~ and the zero time values were significant, parameters were fit using the zero time value as a constant in the equation instead of P~. The maximum photosynthetic rate P~ax can be computed from the following equation (Platt et al. 1980):
P~,ax= P~·[a8j(a8 + (38)) . [(38/(a8 + (38)]1!/a (3)
For simplicity of notation, the B superscripts were omitted in the exponent. Note that as (31i approaches zero, P~~•ax approaches P!1
•
To assess the variance in parameter estimates, two similarly constructed photosynthetrons were used during the April 1992 cruise to conduct 14 sets of parallel incubations of duplicate subsamples representative of a range of water types. P-1 parameters were estimated from data collected with each incubator and were compared. Average coefficients of variation were 11% (range 1.5-29%) for P~ax• 15% (range 5.1-36%) for a 8, and 40% (range 6-96%) for (38. A comparison was also made be-
tween the tube incubation method as used on the September 1989 cruise and the photosynthetron method as used on subsequent cruises. Results obtained with the tube incubation method were found to be 30-32% lower for P!ax, while values of a 8 ranged from 11% above to 45% below values obtained with the photosynthetron method (data not shown). Values of (38 were not significantly different from zero, so a comparison was not possible. One explanation for the offset in P~ax was that the filtration procedure used with the tube incubation method would not have included recently fixed dissolved organic carbon released from phytoplankton during the incubation or lost as a result of filtration. Because the range of variability between cruises was greater than these methodological differences, we made no effort to adjust the September 1989 data.
Experiments were conducted to evaluate diel periodicity during the July-August 1990 and March 1991 cruises. Sam pies were collected in early morning and held in clean polycarbonate bottles in a temperature-controlled deck incubation system adjusted to simulate in situ irradiance (cf. Lohrenz et al. 1990, 1992b). Subsamples for Chi a and P-1 determinations were removed at various times during the day. An alternative strategy to evaluate diel variations was to sample periodically in the vicinity of a drifting sediment trap array (cf. Redalje et al. 1994). During March 1991, in addition to these methods, we also sampled at various times of day while anchored at a station in the Mississippi River plume.
During the July-August 1990 cruise, determinations were also made of carbon-specific growth rates and carbon biomass (labeled Chi a technique; Redalje and Laws 1981; Redalje 1983; Redalje 1993). Briefly, samples were incubated in 1-l polycarbonate bottles under simulated in situ conditions for 24 h. After incubation, samples were filtered onto GF IF filters using gentle vacuum, and stored in liquid N 2 for postcruise processing. Samples were processed as described in Redalje ( 1993) .
Results Dn:L VARIATION
DuringJuly-August 1990, a consistent pattern of die) variation was observed (Table 1 and Fig. 3). Lowest values of P~""' and highest values of a 8 occun-ed in the early morning in both river plume and shelf, slope populations. Analysis of covariance (SYSTAT, Wilkinson 1990) of P-1 data from the
July-August cruise provided evidence for a significant increase in P~,ax and a decrease in a 8 with local time in both plume and shelf populations (Fig. 3)_ The asynchronous variation in P~"" and a 8 led to the result that the light saturation parameter, Ik ( =

Photosynthesis-lrradiance in Coastal Waters 783
TABLE 1. Die) variation in upper-mixed-layer photosynthetic parameters during July-August 1990. Units are as follows: P~ {g C g Chi a·• h- 1), a 8 {g C [g Chi a h]-• [tJ.mol quanta m·• s·•]- 1), I• {tJ.mol quanta m·• s·•). SE = standard error of the estimate.
Latitude UC~)ude Conditions (N) Date
Incubated samples Plume 28.912 89.490 July 22, 1990
Shelf 28.643 90.463 July 30, 1990
Shelf 28.900 89.942 August 1, 1990
Slope 27.762 90.032 August 5, 1990
Drifter stations
Plume 28.820 89.578 July 25, 1990 Plume 28.780 89.606 July 25, 1990 Plume 28.743 89.636 July 25, 1990 Plume 28.710 89.672 July 25, 1990 Plume 28.722 89.783 July 26, 1990 Plume 28.703 89.835 July 26, 1990 Plume 28.683 89.910 July 26, 1990 Shelf 28.700 90.317 August 2, 1990 Shelf 28.679 90.308 August 2, 1990 Shelf 28.681 90.322 August 2, 1990 Shelf 28.819 90.303 August 3, 1990
P~.axl a 11), increased during the photoperiod (Table 1 and Fig. 3). During March 1991, no significant covariance was found between any of the parameters and local time (Fig. 4), although values of a 11
in plume waters were again highest in early morning (Table 2 and Fig. 4).
SEASONAL VARIATION
Seasonal variation was evident from a comparison of means of midday ( 1000-1400 local time) values of P~: ... x• all, and Ik (Table 3). Some of the variation could be related to changes in temperature. Highest mean values of P~ .. x• all, and Ik were observed during the September 1991 cruise (Table 3), during which some of the highest water temperatures (28-30°C) were observed. Lowest mean values of r~: ... x and all were obse1·ved during March 1991, the period in this study when lowest temperatures were observed (9-20°C). An analysis of the combined P-1 data from all cruises showed that both P~ ... x and all were significantly correlated with temperature, although there was considerable scatter in the data (Fig. 5). Highest values of P~""' fit an exponential relationship with temperature.
HORIZONTAL SPATIAL VARIATION
Horizon tal spatial variations of P~~•ax and a 11 in the upper mixed layer ranged from twofold to threefold within any given cruise as illustrated by plot-
Local Time (h) P:..,. SE a• SE I,
7.3 6.0 0.6 0.026 0.003 236 11.7 22.I 0.7 0.021 0.001 1031 18.8 12.4 0.8 0.030 0.003 416 6.4 6.0 0.3 0.045 0.003 133
11.8 8.6 0.4 0.035 0.001 248 16.8 7.7 0.4 0.031 0.001 249 6.0 5.2 0.2 0.040 0.002 132
12.0 6.0 0.2 0.026 0.002 234 17.0 7.1 0.4 0.027 0.001 258 6.5 3.0 0.4 0.016 0.005 184
12.0 7.3 0.8 0.009 0.001 843 17.1 10.5 2.6 0.008 0.002 1268
5.3 8.3 0.7 0.042 0.003 197 12.6 12.7 0.3 0.043 0.002 298 15.4 11.9 0.9 0.037 0.002 323 18.3 12.1 1.1 ().()42 0.002 286 6.0 6.7 0.4 0.041 0.002 165
12.6 10.9 0.7 0.042 0.002 261 18.0 9.6 0.6 0.037 0.002 259 9.6 8.0 0.6 0.037 0.003 219
12.8 6.1 0.5 0.024 0.002 253 17.9 6.5 0.5 0.029 0.002 228 6.1 5.0 0.3 0.040 0.004 124
ting values in relation to salinity (Figs. 6 and 7). In some cases, this variation could be related to effects of river outflow. For example, analysis of covariance of P-1 data from July-August 1990 indicated that adjusted means of P~mx and Ik in the river plume were significantly higher than in shelf populations (Fig. 3). This coincided with higher observed phytoplankton carbon-specific growth rates in the plume region (Fig. 8). In contrast, no significant regional differences in all could be demonstrated (Fig. 3), nor was there any apparent relationship between a 11 and growth rate (Fig. 8). Analysis of variance of P-I data from March 1991 indicated that the adjusted mean of P~ax in the river plume was significantly lower than in shelf waters (Fig. 4), a finding opposite of that for JulyAugust 1990. Analyses of variance of a 11 and Ik revealed no significant differences between plume and shelf populations at that time (Fig. 4).
In an effort to identify associations between the observed spatial variations and environmental conditions, we examined relationships of photosynthetic parameters to principal components derived from environmental variables. To minimize the influence of diel variation, only data collected during midday (1000-1400 hours) were used. Variables included in the analysis were the following: temperature, salinity, silicate, phosphate, nitrate + nitrite, attenuation coefficient for downwelling PAR,
1
784 S. E. Lohrenz et al.
30r---~~---.-----.----~
--I .s= i 20 -.s= C) tiD
C) tiD - 10 .. • + • •
~lot
0 -L i ,., 0.12 .. I
6 ~ 0.10 .... = ~ ::s 0.08 C' -0 6 0.06 ..:; i 0.04 :a -.s=
0.02 C) tiD
C) 0.00 ~ • tS
1400
- 1200 i ,., .. I 1000 6 ~ .... 800 = ~ ::s
600 C' -0 6 400 ~
... 200 -0
0
+
+ + + +
+
it ~ D
dl ~cf ~~+D CD §
*
+
* *
+
*
+
6 12
+
+
+ + .:F+ * D
ra$ c+ D
D
+
+ +.p7 + co'+ ~+ +
D
*
*
+ +
18
Local Time
24
mixed layer depth, and daily PAR at depth. Prior to analysis, data were transformed to natural logarithms to equalize variances. Principal component analysis was performed using the FACTOR procedure of SYSTAT (Wilkinson 1990). The procedure involved construction of a correlation matrix using pairwise deletion from which principal components were subsequently derived. For some of the cruises, certain variables were omitted because of insufficient data. An examination of component loadings (equivalent to correlation coefficients with original variables) revealed similarities between the components derived for the different cruises (Table 4). Generally, it was found that more than 70% of the variation in the environmental data could be accounted for by the first two principal components (Table 4); the majority of this variation was described by the first principal component, which generally showed strong negative correlations with salinity and mixed layer depth and positive correlations with nutrients and attenuation coefficient. Relationships of temperature and daily PAR with the first principal component were more variable. Temperature showed a strong positive correlation with the first component in April 1990 and with the second component in September 1989, April 1992, and May 1992. A strong negative correlation was observed between temperature and the second principal component in July-August 1990, while daily PAR displayed a positive relationship with the second principal component throughout all cruises.
Relationships between the principal components' variables and midday values of P~ax• a 8
, and Ik were analyzed using stepwise multiple regression (SYSTAT, Wilkinson 1990) and were found to be significant in some cases (Tables 5 and 6). Probability thresholds were set at 0.15 for entrance or removal of principal components as predictors in the stepwise regression models. The value of 0.15 is valid for independent predictors as shown by Monte Carlo studies of stepwise regression (Bendel and Afifi 1977). The relationships between P-1 parameters and the first principal component were found to differ between cruises. P~"'x was positively correlated with the first principal component (i.e.,
Fig. 3. Values of P-I parameters during July-August 1990 as a function of local time. Symbols indicate different locations as follows: +, river plume; 0, shelf; *, slope. Analysis of covariance of the plume and shelf data (n = 55) revealed a significant effect of local time on the values of P~.;~ (p = 0.012), a 8 (p = 0.017), and I• (p < 0.001). The analysis also indicated adjusted means of P~~ and I. were significantly higher in the plume than in shelf waters (p < 0.001 for both), even when the highest data points from each were omitted.

I
Photosynthesis-lrradiance in Coastal Waters 785
TABLE 2. Diet variation in the upper-mixed-layer photosynthetic parameters during March 1991. Units are as follows: P:..X {g C g Chi a-• h- 1), a 8 {g C [g Chi a h]-• [j.Lmol quanta m-2 s-•]- 1), I, {j.Lmol quanta m- 2 s- 1). SE = standard error of the estimate.
Latitude Lol~)ude Conditions (N) Date
Incubated samples Plume 28.913 89.563 March 6, 1991
Shelf 28.754 90.139 March 11, 1991
Slope 28.235 88.796 March 15, 1991
Anchor station Plume 28.910 89.491 March 14, 1991 Plume 28.910 89.494 March 14, 1991 Plume 28.908 89.491 March 14, 1991 Plume 28.909 89.490 March 14, 1991
Drifter stations Plume 28.844 89.616 March 8, 1991 Plume 28.88(; 89.631 March 8, 1991 Shelf 28.613 90.227 March 12, 1991 Shelf 28.706 90.249 March 12, 1991
inversely related to salinity) in July-August 1990 and April 1992, and it was negatively correlated with the first principal component in March 1991 (Table 5). A positive correlation was found for a 8
with the first principal component for April 1990, and a negative association was found for March 1991. lk was found to be negatively correlated with the first principal component in September 1989 and April 1990 (Table 6). Significant correlations between P-1 parameters and the second component were always of the same sign; P~liLX was positively correlated with the second principal component in July-August 1990 and September 1991, while a 11 was negatively correlated with the second principal component in July-August 1990, April 1992, and May 1992 (Table 5). lk was found to be positively correlated with the second principal component in July-August 1990, September 1991, and April and May 1992 (Table 6).
VERTICAL VARIATION
P-1 parameter data from all depths were related to principal components that had been derived from depth, temperature, and mean daily photosynthetically active radiation (PAR) variables. Again, only midday values were used in the analysis. For all cruises, it was found that the first principal component exhibited strong positive associations with depth and negative associations with PAR, while associations with temperature varied (Table 7). For several cruises, P~•ax and lk were found to be negatively correlated with the first component (Tables 6 and 8), a result that was in-
Local Time (h) P:!u,. SE a• SE I,
6.3 5.2 0.5 0.022 0.004 234 10.6 5.1 0.4 0.011 0.002 447 15.6 3.9 0.4 0.014 0.004 276 6.4 3.5 0.8 0.014 0.006 252
10.5 9.2 3.7 0.013 0.002 712 15.3 10.3 1.7 0.019 0.004 529 7.1 4.1 1.3 0.015 0.005 268
11.7 8.0 0.7 0.031 0.007 255 14.8 8.7 1.8 0.024 0.005 366
5.7 4.7 0.3 0.031 0.005 153 8.8 4.3 0.3 0.025 0.004 170
12.4 4.3 0.3 0.014 0.002 307 15.9 5.9 1.5 0.017 0.003 338
6.1 2.7 0.2 0.012 0.002 222 11.1 1.8 0.1 0.007 0.001 247 7.3 5.6 0.5 0.026 0.004 220
12.4 5.4 0.5 0.029 0.007 187
terpreted to reflect a depth-dependent decrease in these parameters. Correlations of a 8 with the first component were positive and significant only in March 1991 and April 1992 (Table 8). The second principal component was consistently positively associated with temperature, while exhibiting weak and variable relationships to depth and daily PAR. Both positive and negative correlations of parameters with the second principal component were observed. One possible interpretation was that the second principal component described variation related to horizontal differences between water masses (e.g .. phytoplankton species composition, nutrient availability, temperature, light history).
Discussion DIEL VARIATION
The observation that P~•ax and lk increased over the photoperiod during July-August 1990 (Table 1 and Fig. 3) was consistent with previously reported observations for both coastal and offshore phytoplankton assemblages (MacCaull and Platt 1977; Kana et a!. 1985). Die! periodicity has been attributed to a combination of endogenous physiological oscillations as well as responses to environmental light cues (e.g., MacCaull and Platt 1977; Falkowski 1984). Our findings differed from some earlier work (Harding et al. 1981, 1982) in that we observed a die! periodicity in a 8 that was out of phase with that of P~.,.x (i.e., a 11 tended to be higher in early morning samples). It is possible that phytoplankton assemblages in this northern Gulf of Mexico region exhibit physiological characteristics
·~ 'I
: I 786 S. E. Lohrenz et al.
~ : 30
-i .:::= i 20 -.:::= (.) tiO
(.)
~ 10 0 .. 0 . * II 0 ~t~ + .. 0+ ll.c
+ a!J~ ) +•+ + + Of/P 0 ..p
+ + +
0 -r_ i
<n 0.12 ... I s as 0.10 .... = as ~ 0.08 C' -0 s 0.06 ::t
i 0.04 :'3 0 + * ** - + llJ ;JO 0
* .:::= 0 6' +* 0 (.) 0.02 0 + 0 it 0 .p:t: tiO .p-rtP q. + +
+ (.)
0.00 00 -• tS
1000
-i 800 <n
... I s 0
as 600 .... = 0 as ~ + C' 400 - *+ 0 +'~-s 0
illlJO ~o'++ ::t
200 -fo*~ *+-- o oO .fo ... + o '1--0
0 6 12
Local Time
18 24
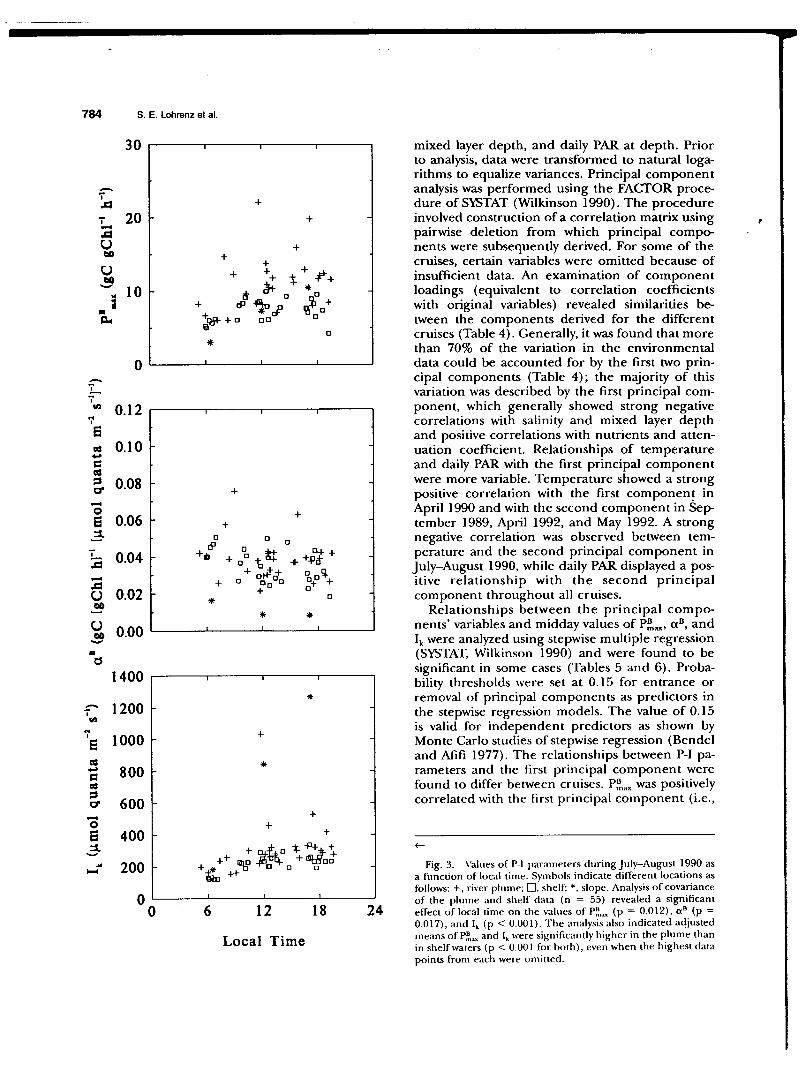
distinct from those previously studied, perhaps due in part to the fact that our study area was characterized by complex and dynamic environmental conditions. Our results may also have been influenced by the temporal coverage of our sampling, which was limited only to the photoperiod, that being the time of day relevant to calculations of primary production.
Changes in photosynthetic parameters arc believed to represent a combination of relatively short-tcnn responses typical of light harvesting and electron transport processes as well as more longterm processes typical of changes in enzymatic activity and turnover or synthesis of cellular constituents (Falkowski 1981, 1984, 1992; Neale and Marra 1985). Photosynthetic mechanisms that could lead to inve1·sc die! changes in P~,ax and <X 11
can be explored on the basis of theoretical arguments. The following expression can be used to approximate light-saturated photosynthesis:
(4)
where 1] (mol 0 2 mol Chi a- 1) corresponds to the ratio of functional photosystem 2 reaction centers (i.e., oxygen-evolving units) to Chi a, and ,. is the turnover time for electrons to flow through the photosynthetic electron-transport chain from water to carbon dioxide (Falkowski 1981, 1992). The initial slope of the P-1 curve ( a 11), and can be expressed as the following:
(5)
where a (m2 quanta- 1) is the functional absorption cross-section of photosystem 2, that entity involved with production of 0 2 (Ley and Mauzerall 1982). Note that this term is distinct from the optical absorption cross section (cf. Dubinsky 1992; Falkowski 1992). From Eqs. 4 and 5, it can be seen that Ik may be expressed as follows:
lk = 1/a,- (6)
The parameter Ik, defined by Tailing ( 1957), has been cited as an indicator of photoadaptive responses to changes in the photic environment . Studies with cultured phytoplankton have shown that a may decrease on time scales of minutes (state transitions) to hours (photoadaptation) in response to increased irradiance (Falkowski 1992).
Fig. 4. Values of P-1 parameters during March 1991 as a function of local time ( +, river plume; 0, shelf; *, slope). Analysis of covariance of the plume and shelf data (n = 34) showed no significant effect-of local time on the values of P~ (p = 0.461), a 8 (p = 0.467), or lk (p = 0.151). The analysis did reveal that adjusted means of P~ were significantly lower in the plume than in shelf waters (p = 0.035).
·:-._ .. -

TABLE 3. Means and standard de,;ations (SO) of midday (1000-1400 hours) values of photosynthetic parameters in the upper mixed layer. Units are as follows: P~,, (g C g Chi a- 1 h- 1),
o:8 (g C [g Chi a h]- 1 [fLmol quanta m- 2 s- 1]- 1), '• (fLmol quanta m- 2 s- 1). n = number of samples.
P~ ... ,. .,. I,
Cruise Mt·an SD Mt·an SD Mt:an SD n
September 1989 9.0 3.6 0.032 0.010 284 59 9 April 1990 10.4 3.4 0.041 0.014 281 127 7 July-August 1990 10.0 3.8 0.033 0.010 349 231 17 October 1990 11.3 5.3 0.04!! 0.024 246 74 10 March l!l!ll 6.1 2.0 0.022 0.00!! 303 142 13 September l !!91 23.0 5.5 0.055 O.ol5 429 83 7 Aplil 1992 8.4 2.3 0.028 0.011 370 213 16 May 1992 5.4 2.8 0.018 0.004 325 221 5
'T has also been shown to decrease with increasing growth irradiance (e.g., Sukenik et al. 1987) and appears to be influenced by Calvin-cycle processes (Falkowski 1992). Such changes would be consistent with die! increases in P::.ax and Ik and decreases in a 8 observed during July-August 1990. Functional changes in lJ have been attributed to photoinhibition or nutrient limitation (Falkowski 1992; Kolber and Falkowski 1993), and such changes may have been a mitigating factor in the die! patterns we observed.
There was no discernable die! pattern in P-1 parameters during March 1991 (Table 2 and Fig. 4). One possible explanation was that die! variation in P-1 parameters was suppressed due to the combination of lower temperatures and a shorter photoperiod. Yet another factor may have been the physical conditions affecting the structure of the water column and the extent of mixing. March 1991 was a period of high river discharge (Fig. 2), lower water temperatures, and greater average mixed-layer depth (mean = 9.5 m, SD = 6.6 m, n = 46 in March 1991 compared to mean = 3.2 m, SD = 1.8 m, n = 85 in July-August 1990; slope stations were excluded). Thus, the extent and rate of vertical mixing in March would have led to a variable photic environment that may have obscured diel patterns.
SEASONAL VARIATIONS
Variation in P-1 parameters occurred over seasonal time scales (Table 3) that could be partially attributed to variations in temperature (Fig. 5). The exponential relationship observed between high values of P~ax and temperature (Fig. 5) was expected from theoretical considerations (Eppley 1972) and was consistent with previous investigations of estuarine populations (Platt and Jassby 1976; Malone and Neale 1981; Pennock and Sharp 1986; Keller 1989). In fact, the exponential relationship shown in Fig. 5 was virtually identical to
50
- 40 ; .s::: 'i -.s::: 30 u Cl)
u ~ 20
... I
e ~ .....
10
0
0.16
; 0.12 ::s 0' -0 e ::1.
-.s::: u Cl)
0.08
0.04
0.00
Photosynthesis-lrradiance in Coastal Waters 787
• • 0 •• 0
~:~Ji ~t
0 0
• • j
0
5 15 25 35
Temperature (°C)
Fig. 5. Combined data for P~.,, and o:11 from all cruises plotted as a function of temperature (T). Closed symbols indicate results from measurements conducted during midday ( 1000-1400 hours). Curved line is a subjective fit to the high values and is described by the equation, P::, •• = exp(O.l25T). P::,.. and o:8 transformed to their natural logarithms were both significantly correlated with temperature (r2 = 0.157, p < 0.001, n = 363 for ln[P::, .. ]; and r2 = 0.153, p < 0.001, n = 363 for ln(o:8 ]).
Error bars indicate ± I SE of the estimate and are shown only for the highest values. See text for further discussion.
that observed by Pennock and Sharp (1986) in the Delaware estuary. Both a 8 and P~ax were found to be significantly correlated with temperature, although some high values of a 8 were encountered at intermediate temperatures (Fig. 5). A significant positive correlation was found between a 8 and P~ax for the combined data from all cruises (r2 = 0.273, p < 0.001, n = 364). This type of correlation has been reported in previous studies (Platt and
-~".
788 S. E. Lohrenz et al.
A B 30 30
SeptomHr 1919 April 1990 Marcb 19PI September 1991
• 0
20 20 . .. .
10 10
. ~· 0 0 "' ; ,:'. i .. ~~ J, ~
~ 0
~ 7" 0 0 :;:; :;:; u 30 u 30 till till
u July/ Auau1t 1990 Oc:tober 1990 u April 1992 May 1992
~ ~
20 = 20 • ~ ~
0 . oooo i o • 0
0
10 .. 10 • • I .
o • to .. • 0 .o • ~ : ··~
. 0 • .. :, .. ·~ ~~ ·:
0 0
00 00 0 r·~
10 20 30 40 0 10 20 30 40 10 20 30 40 0 10 20 30 40
Salinity Salinity
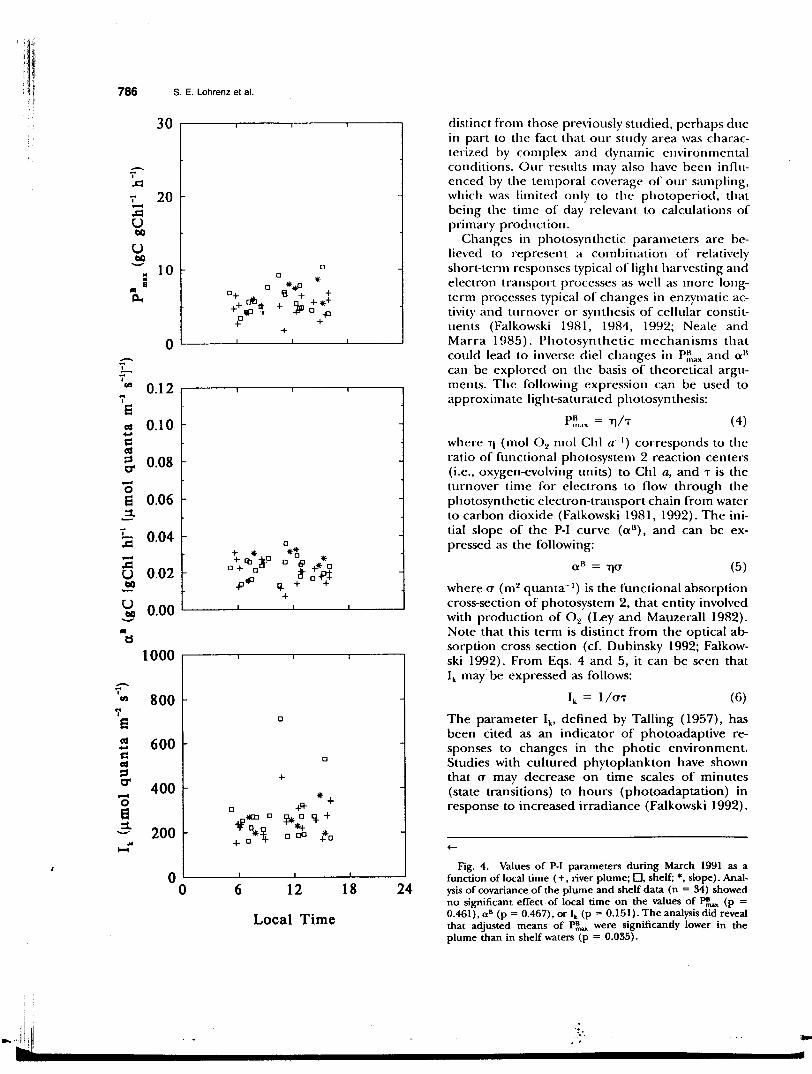
Fig. 6. Variation in P::,.,. as a function of salinity. A) Data from September 1989 and April, July-August, and October 1990 cruises; B) Data from March and September 1991 and April and May 1992 cruises. Closed symbols indicate results from measurements conducted during midday ( 1000-1400 hours).
Jassby 1976; MacCaull and Platt 1977; Harding et al. 1982, 1985). A theoretical basis for covariation of a 8 and P::,ax can be seen by comparing Eqs. 4 and 5. Both a 8 and P~ax will vary as a function of TJ, the ratio of functional reaction centers to Chi a.
A 0.12
September 1989 April 1990 0.10
0.08
"' 0.06 <;'
6 0.04 .
"' ..
;::; 0.02 "' ::I
a' 0.00
0 6 0.12 ~
July/Auaust 1990 October 1990 •
:d 0.10
:;:; 0.08 u ~ 0.06 0
u .· ~ 0.04 ·o
0.02 0 • 0
0.000 10 20 30 40 0 10 20 30 40
Salinity
Combining Eqs. 4 and 5 yields the following expression:
(7)
From this, it can be seen that the relationship be-
0.12 March 1991
0.10 September 1991
0.08
"' 0.06 <;'
6
"' 0.04
;::; 0.02 "' ::I
a'
.. • 0 . ·~
~L. 0 e ! ,, 08 • •• • 0 0
0 0.00
e 0.12 ~
April 1992 May 1992
:d 0.10
:;:; 0.08 u ~ 0.06 u
0~ :: '
.· 0
0.
• .a •• 8 ~ • .. - . 0 0
~ 0.04 ·o
0.02
0.000 10 20 30 40 0 10 20 30 40
Salinity
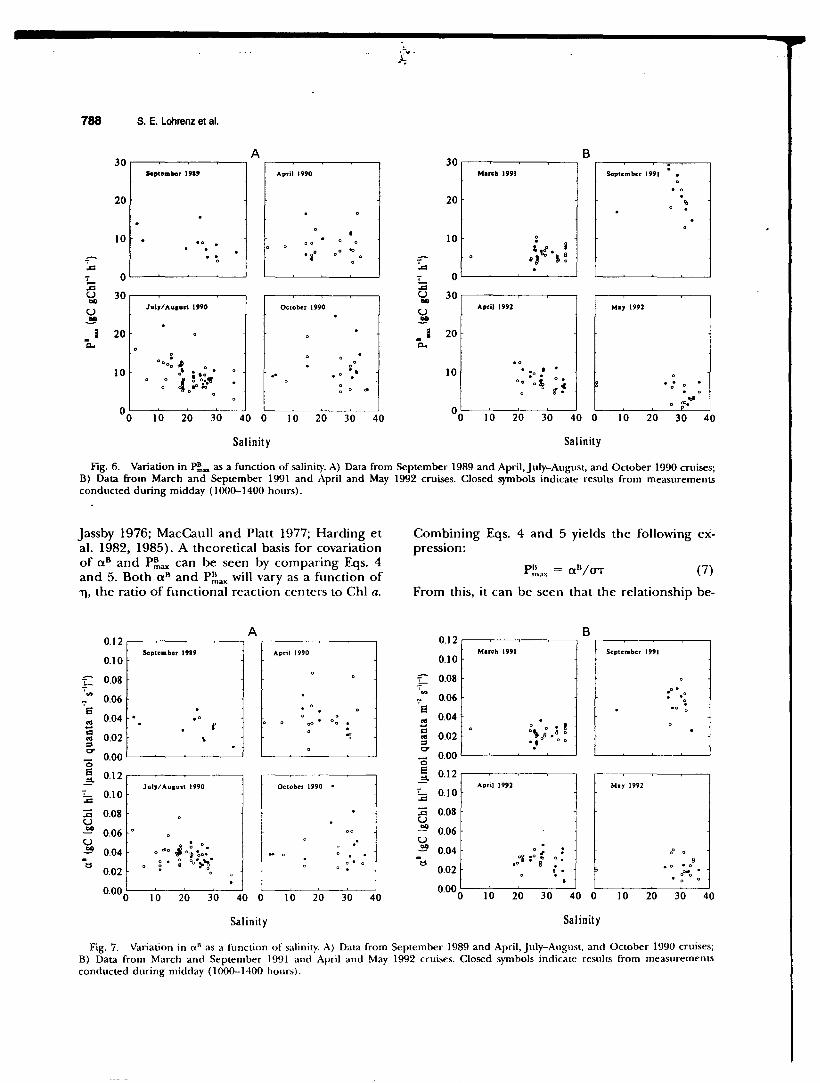
Fig. 7. Variation in o." as a function of salinity. A) Data from September 1989 and April, July-August, and October 1990 cruises; B) Data from March and September 1991 and April and May 1992 cruises. Closed symbols indicate results from measurements conducted during midday (1000-1400 hours).
25
20 -i .J:l i
15 -.J:l u bl) I
u 10 ~ il!
a • ~ iJ? CD
5
- 0 i i 0.12 <ll .. ' e
0.10 ~ .... = ~
0.08 ::s C' -0 e 0.06 ::i
i 0.04 :a (I) -.J:l il! (I)
u 0.02 • bl)
u ~ 0.00 • 0 ~
1 2 3
Growth Rate (d- 1)
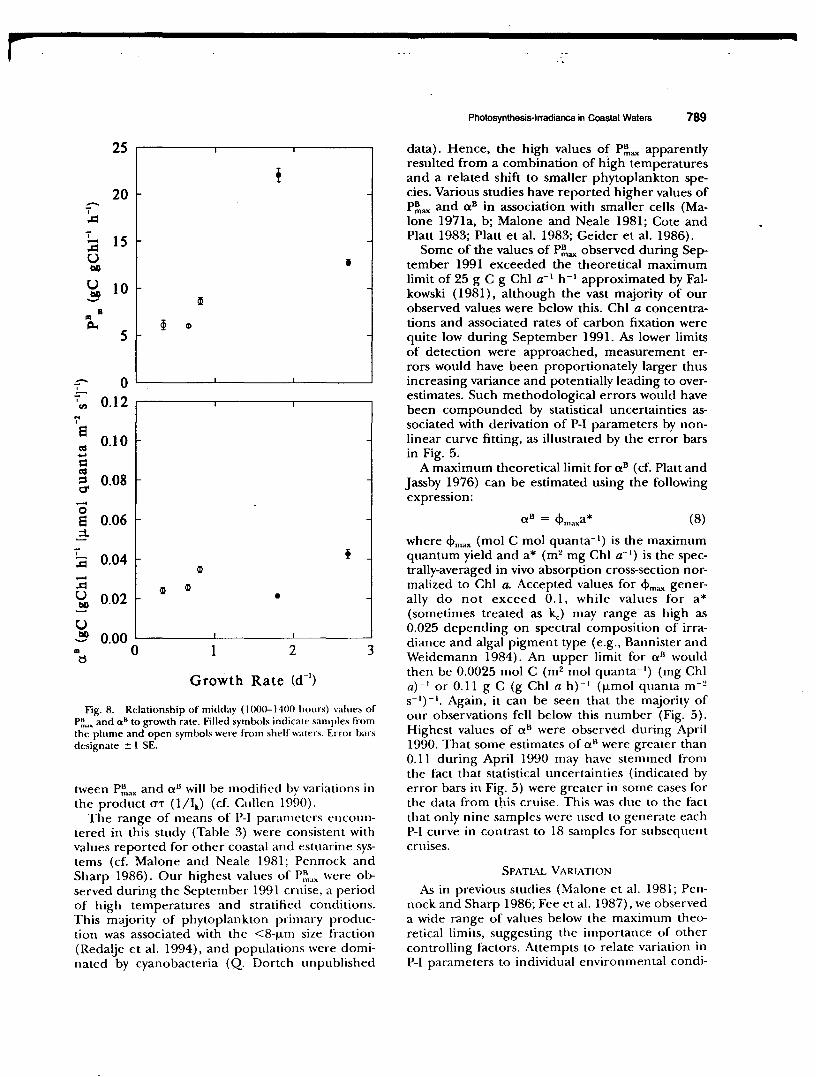
Fig. 8. Relationship of midday ( 1000-1400 hours) values of P~ ... and a 8 to growth rate. Filled symbols indicate samples from the plume and open symbols were from shelf waters. Error bars designate ± I SE.
tween P~oax and cx 8 will be modified by variations in the product O"'T (1/lk) (cf. Cullen 1990).
The range of means of P-1 parameters encountered in this study (Table 3) were consistent with values reported for other coastal and estuarine systems (cf. Malone and Neale 1981; Pennock and Sharp 1986). Our highest values of P~"'x were observed during the September 1991 cruise, a period of high temperatures and stratified conditions. This m~ority of phytoplankton primary production was associated with the <8-j..lm size fraction (Redalje et al. 1994), and populations were dominated by cyanobacteria (Q. Dortch unpublished
Photosynthesis-lrradiance in Coastal Waters 789
data). Hence, the high values of P~ax apparently resulted from a combination of high temperatures and a related shift to smaller phytoplankton species. Various studies have reported higher values of P~ax and cx8 in association with smaller cells (Malone 1971a, b; Malone and Neale 1981; Cote and Platt 1983; Platt et al. 1983; Geider et al. 1986).
Some of the values of P~ax observed during September 1991 exceeded the theoretical maximum limit of 25 g C g Chi a- 1 h- 1 approximated by Falkowski (1981), although the vast majority of our observed values were below this. Chi a concentrations and associated rates of carbon fixation were quite low during September 1991. As lower limits of detection were approached, measurement errors would have been proportionately larger thus increasing variance and potentially leading to overestimates. Such methodological errors would have been compounded by statistical uncertainties associated with derivation of P-1 parameters by nonlinear curve fitting, as illustrated by the error bars in Fig. 5 .
A maximum theoretical limit for cx8 (cf. Platt and Jassby 1976) can be estimated using the following expression:
(8)
where <!>max (mol C mol quanta-•) is the maximum quantum yield and a* (m2 mg Chi a- 1) is the spectrally-averaged in vivo absorption cross-section normalized to Chi a. Accepted values for <!>max generally do not exceed 0.1, while values for a* (sometimes treated as kc) may range as high as 0.025 depending on spectral composition of irradiance and algal pigment type (e.g., Bannister and Weidemann 1984). An upper limit for cx 8 would then be 0.0025 mol C (m2 mol quanta- 1) (mg Chi a)- 1 or 0.11 g C (g Chi a h)- 1 (j.Lmol quanta m- 2
s- 1) -•. Again, it can be seen that the majority of our observations fell below this number (Fig. 5). Highest values of cx11 were observed during April 1990. That some estimates of cx 11 were greater than 0.11 during April 1990 may have stemmed from the fact that statistical uncertainties (indicated by error bars in Fig. 5) were greater in some cases for the data from this cruise. This was due to the fact that only nine samples were used to generate each P-1 curve in contrast to 18 samples for subsequent cruises.
SPATIAL VARIATION
As in previous studies (Malone et al. 1981; Pennock and Sharp 1986; Fee et al. 1987), we observed a wide range of values below the maximum theoretical limits, suggesting the importance of other controlling factors. Attempts to relate variation in P-1 parameters to individual environmental condi-

790 S. E. Lohrenz et al.
TABLE 4. Principal component analyses of environmental variables in the upper mixed layer. Shown are results for the first two principal components, including eigenvalues, percent variance explained by the components, and component loadings for each variable (equivalent to correlations of components with each original variable). n = number of samples, T = temperature (0 C), S = salinity, SiO,- = silicate (!LM), Po;- (!LM), NO, = nitrate + nitrite (!LM), K = attenuation coefficient (m-1), MLD = mixed layer depth (m), and PAR (daily photosynthetically active radiation at depth, mol quanta m-2 d- 1). All variables were converted to natural logarithms prior to analysis.
Percent Eigem'alues Variance Component Loadings
Cruise 2 2 Variable 2 n
September 1989 4.77 2.07 59.6 25.9 T -0.228 0.958 5 s -0.765 ~0.478
SiO,- 0.975 -0.207 Po;- 0.975 -0.101 NO. 0.979 -0.135 K 0.839 0.188 MLD -0.752 -0.094 PAR 0.064 0.900
April 1990 3.94 1.59 65.6 26.5 T 0.916 0.187 7 s -0.995 -0.007 Sio,- 0.921 -0.364 NO. 0.493 -0.821 MLD -0.941 -0.285 PAR 0.358 0.817
july 1990 4.04 1.80 50.5 22.6 T -0.267 -0.913 14 s -0.913 0.080 Sio,- 0.766 0.065 Po;- 0.787 0.414 NO. 0.871 0.158 K 0.923 -0.243 MLD -0.480 0.582 PAR -0.297 0.606
October 1990 2.94 1.41 49.1 23.5 T -0.449 -0.408 7 s -0.890 0.340 NO. 0.807 0.268 K 0.853 -0.380 MI.D -0.736 -0.090 PAR 0.171 0.9:>0
March 1991 3.49 1.61 58.1 26.8 T -0.710 -0.477 12 s -0.901 -0.296 sio,- 0.768 -0.435 NO. 0.931 -0.208 K 0.711 -0.633 PAR 0.459 0.812
September 1991 :~.22 1.16 64.4 2:~.2 s -0.758 0.630 6 SiO,- 0.9:~5 0.139 K 0.900 -0.100 MLD -0.835 0.006 PAR 0.516 0.856
April 1992 :HI 1.49 56.7 24.8 T 0.090 0.873 13 s -0.900 -0.035 sio,- 0.923 -0.322 K 0.8:~ I -0.:~28
MLD -0.8!)6 -0.122 PAR 0.494 0.708
May 1992 3.23 1.:~6 :>3.8 22.7 T -0.08:~ 0.753 6 s -0.966 -0.185 Po.,'- 0.969 0.162 NO, 0.979 0.071 K 0.677 -0.237 PAR -0.217 0.820

Photosynthesis-lrradiance in Coastal Waters 791
TABLE 5. Partial correlation coefficients (with probabilities in parentheses) and squared multiple correlation coefficients from stepwise multiple regression analyses of relationships between principal components and midday values of P~ and a 8 in the upper mixed layer. The principal components served as independent variables and were described in Table 4. r = correlation coefficient, ns = not significant (i.e., predictor probability exceeded 0.15), NA = not applicable.
r::..,.
Partial r for component Multiple
Crui5C 2 r'
September 1989 ns ns NA Aprill990 ns ns NA July 1990 0.826 (0.001) 0.488 (0.091) 0.758 October 1990 ns ns NA March 1991 -0.500 (0.098) ns 0.250 September 1991 ns 0.655 (0.11 0) 0.429 April 1992 0.880 (0.001) ns 0.774 May 1992 ns ns
tions were complicated by the fact that many environmental variables were correlated. Principal component analysis was used to derive independent component variables that described the majority of variation in the environmental data for the mixed layer. The analysis provided information about the pattern of variation of indi\idual variables in relationship to one another, and the manner in which the variation was partitioned among variables. A'i was expected, the largest portion of the variation, as described by the first principal component, was associated with changes along the salinity gradient (Table 4). The first principal component showed a strong negative association with salinity and positive associations with nutrients, reflecting the high inputs of 1·iverine nutrients and decrease in concentrations along the salinity gradient. Similarly, attenuation coefficient was positively associated with the first component due to the high turbidity associated with river outflow, while mixed layer depth was generally negatively associated with the first component as it showed a tendency to increase with increasing salinity. A smaller proportion of the variation was accounted for by the second principal component, which dis-
NA
a•
Partial r for component
2 Multiple
r' n
ns ns NA 10 0.910 (0.004) ns 0.828 7
ns -0.496 (0.071) 0.246 14 ns ns NA 7
-0.667 (0.018) ns 0.445 12 ns ns NA 7 ns -0.508 (0.064) 0.258 14 ns -0.784 (0.065) 0.615 6
played a positive association with daily PAR and was weakly related to salinity. The lack of a strong correlation between daily PAR and salinity may have been a consequence of the fact that sampling depths were adjusted according to light levels. The relationships of variables to the principal components were quite similar for all cruises, evidence that the observed patterns were persistent and real, rather than transitory .or a consequence of chance variation in random data.
The principal component analysis yielded independent variables in the form of principal components that described the majority of environmental variation, and these component variables were then related to P-1 parameters using stepwise multiple regression techniques. Relationships between P-1 and principal component variables were significant in some cases (Tables 5 and 6). Correlations with the first principal component were an indication that spatial variability in P-1 parameters was related to river outflow. For example, positive correlations of P:~ .. " with the first principal component during July-August 1990 and April I 992 were consistent with observations of higher midday values of P:~'"' at lower salinities (Fig. 6). Both
TABLE 6. l'artial correlation rodlicients (with probabilities in parentheses) and squared multiple nHTelation coefticients fi·mn stepwise multiple t·e~ression analyses of n·lationships hetween principal components and midday values of 1, in the upper mixed layer and li>r all depths. Prindpal components snved as inclt-pendent variables and were described in Table 4 (mixed lay<'r) and Table 7 (all depths). r = rorrdation coerticient. ns = not si~nilicant (i.e .. predictor probability exceeded 0.15), NA = not applicable.
~lixt·d L•yt·r ;\lllkpth ..
1:a.~1..-tial r for nunpont·nt Partial r fnr nlmponenl \lultiplt> ., \tuhiplt:
(:ruise ~ r' r~
September I 989 -0.821 (0.088) ns 0.674 5 -0.789 (0.007) 0558 (0.118) 0.740 10
April 1990 -0.679 (0.094) ns 0.461 7 ns -0.582 (0.077) o.:B9 10
July 1990 ns 0.679 (0.008) 0.461 14 -0.418 (0.019) -0.:165 (0.056) 0.285 29 October I 990 ns ns NA 7 -0.617 (0.025) ns 0.:~81 1:1 March 1991 ns ns :-.lA 12 -0.580 (0.006) ns o.:n6 21 September 1991 ns 0.6:~5 (0.1 ~5) 0.404 7 -0.721 (0.()01) 0.:188 (0.091) 0.59~ 21
April 1992 ns 0.590 (0.0~6) 0.:148 14 -0.609 (0.001) 0.288 (0.145) 0.423 28 :\lay 1992 ns 0. 706 (0.117) 0.498 6 -0.443 (0.150) 0.555 (0.040) 0.-!44 13

792 S. E. Lohrenz et al.
TABLE 7. Principal component analyses of depth, temperature, and PAR variables for all depths sampled. Shown are results for the first two principal components, including eigenvalues, percent variance explained by the components, and component loadings for each variable (equivalent to correlations of components with each original variable). n = number of samples, T = temperature (°C), Depth (m), and PAR (daily photosynthetically active radiation at depth, mol quanta m-2 d- 1). All variables were converted to natural logarithms prior to analysis.
Eigenvalues %Variance Component Loadings
Cruise 2
September 1989 2.35 0.424 78.3
April1990 2.33 0.521 77.6
July 1990 1.78 1.01 59.5
October 1990 2.27 0.556 75.5
March 1991 2.08 0.747 69.5
September 1991 2.09 0.803 69.8
April 1992 2.21 0.612 73.7
May 1992 1.71 1.00 57.1
P~,ax and aK were negatively correlated with the first principal component in March 1991. This apparent seasonal shift in relationships between P-1 parameters and river outflow could be explained by low temperatures in the river. A negative association between temperature and the first principal component in March 1991 indicated cooler temperatures at lower salinities.
Horizontal variations in P~,.,x in july-August 1990 reflected trends in growth rate (Fig. 8), possibly
2 Variable 2 n
14.1 Depth 0.877 0.410 10 T -0.853 0.500 PAR -0.923 -0.072
17.4 Depth 0.940 0.181 10 T -0.792 0.609 PAR -0.905 -0.344
33.6 Depth 0.932 -0.176 29 T 0.144 0.988 PAR -0.947 -0.023
18.5 Depth 0.903 -0.322 13 T 0.770 0.637 PAR -0.926 0.216
24.9 Depth 0.935 -0.193 21 T 0.638 0.769 PAR -0.897 0.345
26.8 Depth 0.935 -0.276 21 T 0.567 0.823 PAR -0.948 0.221
20.4 Depth 0.906 0.308 28 T -0.734 0.679 PAR -0.923 -0.237
33.4 Depth 0.926 -0.008 13 T -0.099 0.994 PAR -0.920 -0.115
related to increasing nutrient limitation with distance from the river plume. The changes in growth rate were proportionately larger than changes in P~ax· Variations in carbon to Chi a ratios (g g- 1),
ranging from 12 in the plume to 125 on the shelf (Lohrenz et al. 1992a; Redalje et al. 1994), would tend to moderate growth-rate-dependent changes in P~ax (cf. Falkowski 1981; Cullen 1992). In addition to physiological changes within species populations, changes in species composition may have
TABLE 8. Partial correlation coefficients (with probabilities in parentheses) and squared multiple correlation coefficients from stepwise multiple regression analysis of relationships between prinicipal components and midday values of P~'"' and a 11 for all depths sampled. Principal components served as independent variables and were described in Table 7. r = correlation coefficient, ns = not significant (i.e., predictor pmbability exceeded 0.15), NA = not applicable.
P~ ... ~ u•
Pani~tl r for compont·nl P;utial r fnr compmwnt !\-1ultiple Multiple
Cruise r' r'
September 1989 -0.795 (0.004) -0.552 (0.123) 0.744 ns 0.757 (0.011) 0.573 10 April 1990 ns ns NA ns 0.565 (0.089) 0.319 10 July 1990 -0.387 (0.038) ns 0.150 ns ns NA 29 October 1990 -0.505 (0.079) ns 0.255 ns ns NA 13 March 1991 ns 0.504 (0.020) 0.254 0.574 (0.005) 0.364 (0.115) 0.418 21 September 1991 -0.665 ( 0.00 I) 0.520 (0.019) 0.593 ns ns NA 21 April 1992 -0.499 (0.007) ns 0.249 0.385 (0.043) ns 0.148 28 May 1992 ns ns NA ns -0.443 (0.129) 0.196 13
influenced observed spatial patterns in P-1 parameters. Redalje et al. (1992, 1994) found a larger proportion of primary production associated with the smaller size fractions ( <8 tJ.m) in plume waters as compared to shelf waters during July-August 1990. As mentioned previously, higher values of P!ax and a 8 would be expected for smaller cells. While this was consistent with the trends we observed in P!ax, we found no significant regional differences in a 8 in July-August 1990, nor was the relationship between a 8 and fJ. significant (Fig. 8). Under conditions of increasing nutrient limitation in phytoplankton cultures, a has been observed to increase and 11 decrease (Kolber et al. 1988; Falkowski 1992). From Eq. 5, it is apparent that these changes would have opposing influences on a 8 .
There was statistical evidence of regional differences in 1/aT (= lk) (Fig. 3), although there was considerable overlap in observed ranges of values. An increase in the product, aT, in regions of lower growth rate could be expected as both a and T
have been observed'to increase with increasing nutrient limitation in phytoplankton cultures (Kolber et al. 1988; Falkowski 1992).
VARIATION IN RELATIONSHIP TO
PAR A.'-10 DEPTH
Information about relationships of P-1 parameters to variations in daily PAR was provided in two ways. First, the second principal component in Table 4 showed a consistent positive association with daily PAR. Observed correlations with P-1 parameters were consistent with expectations about relationships between PAR and P-1 parameter variation ( cf. Falkowski 1981; Cullen 1990). Positive correlations were observed between this principal component and P~~ •• , (Table 5) and Ik (Table 6), and negative correlations were observed with a 11 (Table 5). The variation in PAR described by the second principal component was not attributable to variation in attenuation coefficient, as this was most closely related to the first principal component in Table 4. Prior investigations in the Chesapeake Bay (Harding et al. 1985) and the Delaware estuary (Pennock and Sharp 1986) found no significant relationship between attenuation coefficient and P-I parameters in mixed-layer populations. Such a result is understandable since mixed-layer populations would likely experience variable irradiance due to mixing across the vertical light gradient over the course of the photoperiod, particularly in turbid plume environments. It is also evident from the principal component analysis of mixed-layer data in Table 4 that seYeral other environmental variables covaried with attenuation coefficient (i.e., first principal component), and these other variables could also influence P-1 parameters.
Photosynthesis-lrradiance in Coastal Waters 793
A second approach that provided information about relationships between P-1 parameters and daily PAR initially involved principal component analysis of depth, daily PAR at depth, and temperature variables. This revealed that the majority of the variation in daily PAR was related to depth in the first principal component (Table 7). For midday data from several cruises, P!ax (Table 8) and lk (Table 6) were found to be inversely related to the first principal component, from which was inferred an inverse relationship with depth and positive association with daily PAR. Temperature showed both negative and positive associations with the first principal component (Table 7), and thus potentially reinforced or suppressed the vertical gradients in P-1 parameters. Variations in a 8
were found to be positively correlated with the first principal component in March 1991 and April 1992 (i.e., varied inversely with daily PAR along vertical gradients) (Table 8). Responses of P-1 parameters to changes in irradiance depend on the time scales and direction of shift in irradiance (e.g., Falkowski 1984; Neale and Marra 1985; Cullen and Lewis 1988). An important factor in explaining vertical patterns may be the relationship between the rate of mixing and rate of photoadaptation (Cullen and Lewis 1988). Slower mixing rates would potentially result in higher near-surface values of P~,ax and more distinct vertical gradients in both P~,..x and a 8 • This possibility should be examined in future studies.
Conclusions
Our results indicate that relationships between P-1 parameters and environmental conditions in our study region were significant in some cases, but variations between cruises made it difficult to generalize. While it is possible to account for some of the variation in P-1 parameters on the basis of conditions during a specific period, no simple rules exist for predicting a priori the values of P-1 parameters. This was partially due to the fact that many environmental variables were correlated, thus complicating the identification of causative factors. Another element contributing to the apparent complexity in P-1 parameter variation was that changes in physiological variables (i.e., fJ., C:chl, 11. T, and a) were often the result of changes in species composition as well as physiological changes within species populations. Indeed, in the northern Gulf of Mexico, spatially distinct phytoplankton populations occur in river, plume, and shelf waters (Dortch et al. 1992; Fahnenstiel et al. 1992). Given the current state of knowledge, there appears to be no substitute for direct observation of P-1 parameters. However, our findings do support the view that a limited set of observations may be ad-
~·

794 S. E. Lohrenz et al.
equate to characterize a given region within a restricted period of time. The implications of the observed variation in P-1 parameters for the predictability of primary production using regional scale bio-optical algorithms will be examined in a subsequent paper (Lohrenz et al. in preparation).
ACKNOWLEDGMENTS
Financial support for this research was provided by National Oceanic and Atmospheric Administration (NOAA) Mississippi Alabama Sea Grant no. NA90AA-D-SG688, project no. R/LR-25, and United States Department of Energy project no. DE-FG02-92ER61414 through a subcontract from the Louisiana Universities Marine Consortium. We are grateful for the technical assistance of J. Cavaletto, X. Chen, R Krest, M. Marcowitz, and D. Taylor. M. Dagg graciously provided pigment and nutrient data for R/V Pelican cruises. Anonymous reviewers provided valuable comments. We also thank the captains and crews of the R/V Pelican and the NOAA Ship Malcom Baldrige. USM Contribution No. 166.
LiTERATURE CITED
BANNISTER, T. T. AND A. D. WEIDEMANN. 1984. The maximum quantum yield of phytoplankton photosynthesis in situ. Journal of Plankton Research 6:275-294.
BENDEL, R. B. AND A. A. AFIFI. 1977. Comparison of stopping rules in forward "stepwise" regression. Journal of the American Statistical Association 72:4&-53.
CoTE, B. A.'<D T. PL-\TT. 1983. Day-to-day variations in the spring-summer photosynthetic parameters of coastal marine phytoplankton. Limnology and Oceanography 28:320-344.
CULLEN, j. j. AND M. R. LEWIS. 1988. The kinetics of algal photoadaptation in the context of vertical mixing. Journal of Plankton Research 10:1039-1063.
Cuu.t:N,J. J. 1990. On the models of growth and photosynthesis in. phytoplankton. Deep-Sea &search 37:667-686.
CULLEN, j. j., X. YA:\G, AND H. L. MAcl:-lTYRE. 1992. Nutrient limitation of marine photosynthesis, p. 69-88. In P. G. Falkowski and A. Woodhead (eds.), Primary Productivity and Biogeochemical Cycles in the Sea. Plenum Press, New York.
DoRTCH, Q., D. MILSTED, N. N. RABAI~\IS, S. E. LoHRENZ, D. G. REDAIJE, M. J. DAl;G, R. E. Tl'RNt:R, AND T. E. WllllLEDl;t:. 1992. Role of silicate availability in phytoplankton species composition and the fate of carbon, p. 7&--83. In Nutrient Enhanced Coastal Ocean Productivity. Publication Number TAMU-SG-92-109, Sea Grant Program, Texas A&M University, Galveston, Texas.
DUIIINSKY, Z. 1992. The functional and optical absorption crosssections of phytoplankton photosynthesis, p. 31-45. In P. G. Falkowski and A. Woodhead (eels.), Primary Productivity and Hiogeochemical Cycles in the Sea. Plenum Press, New York.
EPPLEY, R. W. 1972. Temperature and phytoplankton growth in the sea. Fishery Bulletin 70:106:~1085.
FMINENSTIEL, G. L., D. G. Rt:nAqt:, S. E. LOHRENZ, M. H. MARcoWITZ, :\1. .J. McCoR\IICK, H. J. CARRICK, AND M. J. DA<;t;, 1992. High growth and microzooplankton-grazing loss rates for phytoplankton populations from the Mississippi River plume region, p. 111-116. In Nutrient Enhanced Coastal Ocean Producthity. Publication Number TA>\10-SG-91-109, Sea Grant Program, Texas A&M UniYersity, Galveston, Texas.
FALKOWSKI, P. G. 1981. Light-shade adaptation and assimilation numbers. jrmmal of Plankton Research 3:203-216.
FALKOWSKI, P. G. 198-t. Physiological responses of phytoplankton to natural light regimes. Journal of Plankton Research 6:295-307.
FALKOWSKI, P. G. 1992. Molecular ecology of phytoplankton photosynthesis, p. -t7-67. In P. G. Falkowski and A. Woodhead
(eds.), Primary Productivity and Biogeochemical Cycles in the Sea. Plenum Press, New York.
FEE, E. J. 1973a. A numerical model for determining integral primary production and its application to Lake Michigan. Journal of the Fisheries Research Boord of Canada 30:1447-1468.
FEE, E. J. 1973b. Modelling primary production in water bodies: A numerical approach that allows vertical inhomogeneities. journal of the Fisheries Research Boord of Canada 30:1469-1473.
FEE, E.J., R. E. HECKY, AND H. A. WELCH. 1987. Phytoplankton photosynthesis parameters in central Canadian lakes. Journal of Plankton Research 9:305-316.
FITZWATER, S. E., G. A. KNAUER, A.'<Dj. H. MA.RTIN. 1982. Metal contamination and its effect on primary production measurements. Limnology and Oceanography 27:544-551.
GALLEGOS, C. L. 1992. Phytoplankton photosynthesis, productivity, and species composition in a eutrophic estuary: Comparison of bloom and non-bloom assemblages. Marim Ecology Progress Series 81:257-267.
GElDER, R.J., T. PLATT, ANDJ. A. R-I.VEN. 1986. Size dependence of growth and photosynthesis in diatoms: A synthesis. Marine Ecology Progress Series 30:93-104.
GONZALEs-MORALES, A. T., G. GAXIOLA-C\sTRO, A.'iD J. R. lARAlARA. 1993. Daily photosynthetic parameters and biomass from size-fractionated phytoplankton off Baja California. Estuarine, Coastal and Shelf Science 36: 14 7-158.
HARDI:\G, L. W., JR., B. W. MEESO:--:, B. B. PREZEU:--:, AND B. M. SWEDIEY. 1981. Die! periodicity of photosynthesis in marine phytoplankton. Marine Biology 61:95-105.
HARDI:\G, L. W., JR., B. B. PREZELIN, B. M. SWEENEY, AND J. L. Cox. 1982. Die! oscillations of the photosynthesis-irradiance (P-1) relationship in natural assemblages of phytoplankton. Marine Biology 67:167-178.
HARDI:\G, L. W., JR., B. W. MEESOS, AND T. R. FISHER, JR. 1985. Photosynthesis patterns in Chesapeake Bay phytoplankton: Short- and long-term responses of P-1 curve parameters to light. Marim Ecoiogy Progress Series 26:99-111.
HARRISOI'l, W. G. AND T. PIATT. 1980. Variation in assimilation numher of coastal marine phytoplankton: Effects of environmental co-variates. journal of Plankton Research 2:249-259.
HARRISON, W. G. AND T. PLATT. 1986. Photosynthesis-irradiance relationships in polar and temperature phytoplankton populations. Polar Biolog;· 5:153-164.
HARRISO:\, W. G., T. PlAIT, AND :1.1. R. LE\\lS. 1985. The utility of light-saturation models for estimating marine primary prodncthity in the field: A comparison \\;th conventional "simulated" in situ methods. Canadian Journal of Fisheries and Aquatic Sciences 42:864-872.
HoLM-HANSEN, 0., C. J. LoRt:Nzt::-;, R. W. HoLMES, AND J. D. H. STRICKJ,\ND. 1965. Fluorometric determination of chlorophyll. journal du Conseil C-onseil International pour /'E."<:plomtion de laMer 30:3-15.
JASSBY, A. D. AND T. PlAIT. 1976. Mathematical formulation of the relationship between photos}nthesis and light for phytoplankton. l-imnology and Oceanography 21:540-547.
KANA, T. M., j. L. WATTS, AND P. :\1. GILBERT. 1985. Die! periodicity in the photos}nthetic capacity of coastal and offshore phytoplankton assemblages. Marine Ecology Progress Snies 25: 131-139.
Kt:t.Lt:R, A. 1989. Modeling effects of temperature, light, and nutrients on primary producti\ity. an empirical and a mechanistic approach compared. l.imnology and Oceanography 34: 82-96.
KNAUER, G. A. AND J. H. MARTI:\. 1983. Trace elements and primary production, p. 825-8-tO. In C. S. Wong, E. Boyle, K. W. Bruland,J. D. Burton, and E. D. Goldberg (eds.), Trace Elements in Seawater. Plenum Press, New York.
KOUIER, Z., j. ZEIIR, A:\D P. FALKOWSKI. 1988. Effects of growth irradiance and nitrogen limitation on photosynthetic energy conYersion in photosystem II. Plant Physiology 88:923-929.

KOLBER, Z. AND P. G. FALKOWSKI. 1993. Use of active fluore&cence to estimate phytoplankton photosynthesis in situ. Limnology and Oceanography 38:164~1665.
LEAN, D. R. S. AND B. K. BURNISON. 1979. An evaluation of errors in the 14C method of primary production measurement. Limnology and Oceanography 24:917-928.
LEWIS, M. R. AND j. C. SMITH. 1983. A small volume, shortincubation-time method for measurement of photosynthesis as a function of incident irradiance. Marine Ecology Progress Series 13:99-102.
LEY, A. C. AND D. C. MAUZERALL. 1982. Absolute absorption croS&-sections for photosystem II and the minimum quantum requirement for photosynthesis in Chfmella vulgaris. Biochimica et Biophysica Acta 680:95--106.
LOHRE:"Z, S. E., M. J. DAGG, AND T. E. WHITLEDGE. 1990. Enhanced primary production at the plume/oceanic interface of the Mississippi River. Continental Shelf Research 10:639-664.
LOHRE:"Z, S. E., G. L. FAHNENSTIEL, D. G. REDALJE, AND G. LANG. 1992a. Regulation and dislribution of primary production in the northern Gulf of Mexico, p. 95--104. In Nulrient Enhanced Coastal Ocean Productivity. Publication Number TAMU-SG-92-109, Sea Grant Program, Texas A&M University, Galveston, Texas.
LOHRE:"Z, S. E., D. A. WIESENRURG, C. R. REIN, R. A. ARNONE, C. D. TAYLOR, G. A. KNAUER, A.'ID A. H. KNAP. 1992b. A comparison of in situ and simulated in situ methods for estimating oceanic primary production. Journal of Plankton Research 14: 201-221.
MACCAl!LL, W. A. AND T. PLATT. 1977. Die) variations in the photosynthetic parameters of coastal marine phytoplankton. Limnology and Oceanography 22:723-731.
MALO:"E, T. C. 1971a. The relative importance of netplankton and nanoplankton as primary producers in neritic and oceanic tropical waters. Limnology and Oceanography 16:633-639.
MALO:->E, T. C. 1971b. The relative importance ofnanoplankton and netplankton as primary producers in the California Current system. Fishery Bulktin 69:799-820.
MAI.O:"E, T. C. AND P. J. NEALE. 1981. Parameters of light-dependent photosynthesis for phytoplankton size fractions in temperate estuarine and coastal environments. Marine Biology 61:289-297.
NEALE, P. j. AND .J. MARRA. 1985. Short-term variation of P,., under natural irradiance conditions: A model and its implications. Marine Ecology Progress Series 26:113-124.
P~:NNOCK, J. R. A:"D J. H. SHARP. 1986. Phytoplankton production in the Delaware estuary: Temporal and spatial variability. Marine Ecology Progress Serie.< 34:143-155.
PLAlT, T., C. L. GALLEGOS, AND W. G. HARRISON. 1980. Photoinhibition of photosynthesis in natural assemblages of marine phytoplankton. Journal of Marine Research 38:687-701.
PLAlT, T. AND A. D. jASSBY. 1976. The relationship between photosynthesis and light for natural assemblages of coastal marine phytoplankton. Journal of Phycology 12:421-430.
PlAIT, T. ,\:->D S. SxniYENDRANATII. 1988. Oceanic primary pro-
Photosynthesis-lrradiance in Coastal Waters 795
duction, estimation by remote sensing at local and regional scales. Science 241:1613-1620.
PLATT, T., D. V. SUBBA RAo, A.'ID B. IRWIN. 1983. Photosynthesis of picoplankton in the oligotrophic ocean. Nature 300:702-704.
PRAsAD, K. S., S. E. LOHRENZ, D. G. REDALJE, AND G. L. FAHNENSTIEL. (in press) Primary production in the Gulf of Mexico coastal waters using "remotely-sensed" trophic category approach. Continental Shelf Research.
REDAIJE, D. G. 1983. Phytoplankton carbon biomass and specific growth rates determined with the labeled chlorophyll a technique. Marine Ecology Progress Series 11:217-225.
REDALJE, D. G. 1993. The labeled chlorophyll a technique for determining photoautotrophic carbon specific growth rates and carbon biomass, p. 563-572. In P. F. Kemp, B. F. Sherr, E. B. Sherr, and J. J. Cole (eds.), Handbook of Methods in Aquatic ~icrobial Ecology. Lewis Publishers, Boca Raton, Florida.
REDALJE, D. G. AI'D E. A. L-\WS. 1981. A new method for estimating phytoplankton growth rates and carbon biomass. Marine Biology 62:73-79.
REDALJE, D. G., S. E. LOHRE:->Z, A.'ID G. L. FAHNENSTIEL. 1992. The relationship between primary production and the export of POM from the photic zone in the Mississippi River plume and inner Gulf of Mexico shelf regions, p. 105--110. In NuIrient Enhanced Coastal Ocean Productivity. Publication Number TAMU-SG-92-109, Sea Grant Program, Texas A&M University, Galveston, Texas.
REDALJE, D. G., S. E. LOHRE:->Z, A.'ID G. L. FAHNENSTEIL. 1994. The relationship between primary production and the vertical export of particulate organic matter in a river impacted coastal ecosystem. Estuaries 17:829-838.
RILEY, G. A. 1937. The significance of the Mississippi River drainage for biological conditions in the northern Gulf of Mexico. Journal of Marine Research 1 :60-7 4.
SHOAF, W. T. AND B. W. LIU:\1. 1976. Improved extraction of chlorophyll a and b from algae using dimethyl sulfoxide. Limnology and Oceanography 21 :92~928.
SUKENIK, A.,j. BE:->:->ETT, AND P. FALKOWSKI. 1987. Light-saturated photosynthesis--Limitation by electron transport or carbon fixation? Biochimica et Biophysica Acta 891:205--215.
TALLING, J. F. 1957. Photosynthetic characteristics of some freshwater plankton diatoms in relation to underwater radiation. New PhJlologist 56:29-50.
THOMAS, W. H. A;•m E. G. SI:O.I:O.IONS. 1960. Phytoplankton production in the Mississippi Delta, p. 103-116. In F. Shepard (ed.), Recent Sediments, Northwest Gulf of Mexico. American Association of Petrologists, Texas, Oklahoma.
WHITLEDGE, T. E., S.C. MALLOY, C.J. PATTON, AND C. D. WIRICK. 1981. Automated nutrient analysis in seawater. Formal Report 51398, Brookhaven National Laboratory, Upton, New York.
WILKINSON, L. 1990. SYSTAT: The System for Statistics. SYSTAT, Inc. Evanston, Illinois.
Received for considemtion, June 9, 1993 Acrepted for publication, April 22, 1994