Embed Size (px)
Citation preview
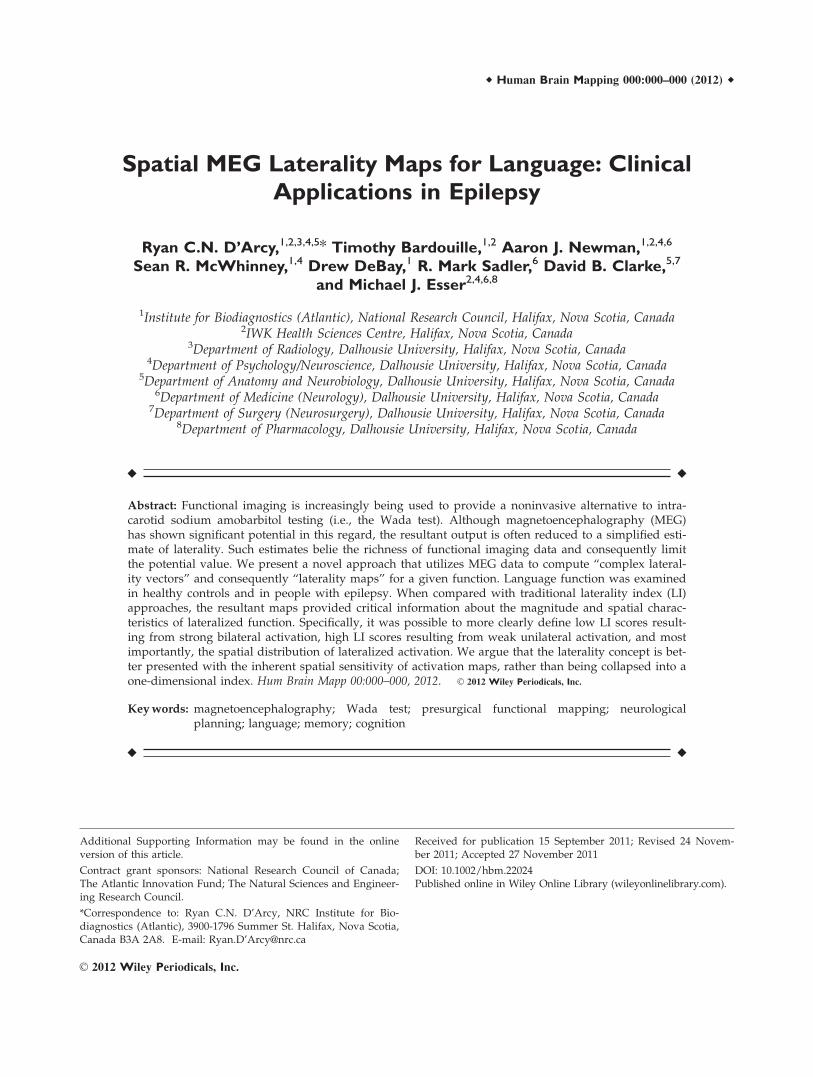
r Human Brain Mapping 000:000–000 (2012) r
Spatial MEG Laterality Maps for Language: ClinicalApplications in Epilepsy
Ryan C.N. D’Arcy,1,2,3,4,5* Timothy Bardouille,1,2 Aaron J. Newman,1,2,4,6
Sean R. McWhinney,1,4 Drew DeBay,1 R. Mark Sadler,6 David B. Clarke,5,7
and Michael J. Esser2,4,6,8
1Institute for Biodiagnostics (Atlantic), National Research Council, Halifax, Nova Scotia, Canada2IWK Health Sciences Centre, Halifax, Nova Scotia, Canada
3Department of Radiology, Dalhousie University, Halifax, Nova Scotia, Canada4Department of Psychology/Neuroscience, Dalhousie University, Halifax, Nova Scotia, Canada
5Department of Anatomy and Neurobiology, Dalhousie University, Halifax, Nova Scotia, Canada6Department of Medicine (Neurology), Dalhousie University, Halifax, Nova Scotia, Canada
7Department of Surgery (Neurosurgery), Dalhousie University, Halifax, Nova Scotia, Canada8Department of Pharmacology, Dalhousie University, Halifax, Nova Scotia, Canada
r r
Abstract: Functional imaging is increasingly being used to provide a noninvasive alternative to intra-carotid sodium amobarbitol testing (i.e., the Wada test). Although magnetoencephalography (MEG)has shown significant potential in this regard, the resultant output is often reduced to a simplified esti-mate of laterality. Such estimates belie the richness of functional imaging data and consequently limitthe potential value. We present a novel approach that utilizes MEG data to compute ‘‘complex lateral-ity vectors’’ and consequently ‘‘laterality maps’’ for a given function. Language function was examinedin healthy controls and in people with epilepsy. When compared with traditional laterality index (LI)approaches, the resultant maps provided critical information about the magnitude and spatial charac-teristics of lateralized function. Specifically, it was possible to more clearly define low LI scores result-ing from strong bilateral activation, high LI scores resulting from weak unilateral activation, and mostimportantly, the spatial distribution of lateralized activation. We argue that the laterality concept is bet-ter presented with the inherent spatial sensitivity of activation maps, rather than being collapsed into aone-dimensional index. Hum Brain Mapp 00:000–000, 2012. VC 2012 Wiley Periodicals, Inc.
Keywords: magnetoencephalography; Wada test; presurgical functional mapping; neurologicalplanning; language; memory; cognition
r r
Additional Supporting Information may be found in the onlineversion of this article.
Contract grant sponsors: National Research Council of Canada;The Atlantic Innovation Fund; The Natural Sciences and Engineer-ing Research Council.
*Correspondence to: Ryan C.N. D’Arcy, NRC Institute for Bio-diagnostics (Atlantic), 3900-1796 Summer St. Halifax, Nova Scotia,Canada B3A 2A8. E-mail: Ryan.D’[email protected]
Received for publication 15 September 2011; Revised 24 Novem-ber 2011; Accepted 27 November 2011
DOI: 10.1002/hbm.22024Published online in Wiley Online Library (wileyonlinelibrary.com).
VC 2012 Wiley Periodicals, Inc.
INTRODUCTION
Magnetoencephalography (MEG) provides a noninva-sive, patient friendly approach to study brain functionwith relatively high spatial resolution (millimeters) andreal-time temporal resolution (milliseconds). Common clin-ical applications of MEG have included seizure localiza-tion in epilepsy and preoperative functional mapping forbrain tumor resection (Funke et al., 2009; Stufflebeamet al., 2009].
One emerging epilepsy application for MEG is preopera-tive evaluation of critical cognitive functions like languageand memory. Historically, hemispheric dominance, orlaterality, has been determined through the invasive Wadatest [Wada, 1949]. In the Wada test, a barbiturate isinjected into one internal carotid artery of an awakepatient to disrupt cognitive function within the injectedhemisphere. Neuropsychological testing is done concur-rently to evaluate the likelihood of language and memoryimpairments. The Wada test is being phased out in manycenters, in large part, due to invasiveness and the avail-ability of amobarbital [Baxendale, 2009; Van der Haegenet al., 2011]. Consequently, the critical need for a noninva-sive alternative from functional imaging has becomeincreasingly clear. Advances in MEG and functional mag-netic resonance imaging (fMRI) represent the leading solu-tions in this realm [Baxendale, 2009; Binder, 2011;Papanicolaou et al., 2004].
Functional Imaging, Language,
and the Wada Test
Significant effort has gone into validating MEG andfMRI laterality testing for language. Often, the functionalimaging results are converted into laterality index (LI)scores, which represent hemispheric dominance in termsof a numeric index that often ranges from 1 (left) to �1(right).
For example, Papanicolaou et al. [2004] used MEG withauditory word presentation to calculate LI scores for lan-guage laterality. The results were concordant with those ofthe Wada test in 74 of 85 patients (87%). In terms of sensi-tivity and specificity, MEG LI scores were greater than 90and 80%, respectively, when compared with the Wadatest. More recently, McDonald et al. [2009] compared MEGactivation between visually presented words and falsefonts. LI scores based on a temporoparietal region of inter-est (ROI) corresponded with Wada testing in 75% of cases,whereas LI scores from a frontal ROI matched in all cases.The pattern of closer frontal, than temporal, correspon-dence with Wada testing has been seen with other studiesinvolving verb generation and picture naming [Bowyeret al., 2005].
In fMRI, LI scores are also strongly consistent withresults of the Wada test. Using a semantic decision task,Binder et al. [1996] showed that LI scores based on thenumber of significantly activated voxels in each hemi-
sphere were in agreement with Wada results in all 22patients, including typical and atypical language distribu-tions [Binder et al., 1996]. Woermann et al. [2003] measuredfMRI activation in a large sample of patients performing acovert naming task (n ¼ 100). The results, based on blindedvisual inspection, matched the Wada results in 91% of com-pleted cases. Interestingly, fMRI activation was bilateral in82% of cases, suggesting that involvement of both hemi-spheres in language processes, rather than unilateral proc-essing, is the norm in patients with epilepsy.
The concordance of MEG/fMRI LI scores with Wadatest results remains high despite the different tasks usedacross studies. However, recent work suggests that clinicaloutcome may be a more appropriate ‘‘gold standard’’ com-parator than the Wada test [Baxendale, 2009; Binder, 2011].Binder et al. [2008] found that including fMRI lateralityscores in presurgical assessment improved the predictiveaccuracy after surgery. In contrast, the Wada test resultsmade no appreciable difference. In a study of patientswith epilepsy involving the left anterior temporal lobe,Sabsevitz et al. [2003] compared the accuracy of fMRI andWada language tests in predicting postsurgical languagedeficits. They too reported better predictive performancefor fMRI based on a temporal lobe ROI as compared tothe Wada test.
Revisiting Laterality Scores
Questions have also been raised about reliance aboutover reliance on the LI [Jones et al., 2011; Sharan et al.,2011]. In particular, MEG and fMRI studies have remainedlargely wedded to traditional LI calculations. LI scoreshave been defined based on the well-known basic formula:
LI ¼ QLH �QRH
QLH þQRH(1)
where Q represents a measure of activation in the appro-priate hemisphere. Thus, LI ranges from 21 to 1 to indi-cate right to left hemispheric dominance. The measure ofactivation, Q, may be (1) the number of active sources in ahemisphere or ROI [Binder et al., 1996; Binder et al., 2008;Kamada et al., 2007; Papanicolau et al., 2004; Sabsevitz,2003]; (2) the magnitude of activation in a ROI [Hirataet al., 2010; Kim and Chung, 2008; McDonald et al., 2009];or (3) the length of time for which activation occurs in aROI [Bowyer et al., 2005].
While useful, the LI approach has two main disadvan-tages. First, the LI scores discard information about activa-tion strength, such that scores near 0 are ambiguous—theymay represent either weak or strong bilateral activation.Second, the LI measure suffers from the coarse spatial sen-sitivity, as it is dependent on the selection of specific ROIsor is summed over the entire hemisphere. Consequently,LI scores, in effect, are under representative of the
r D’Arcy et al. r
r 2 r
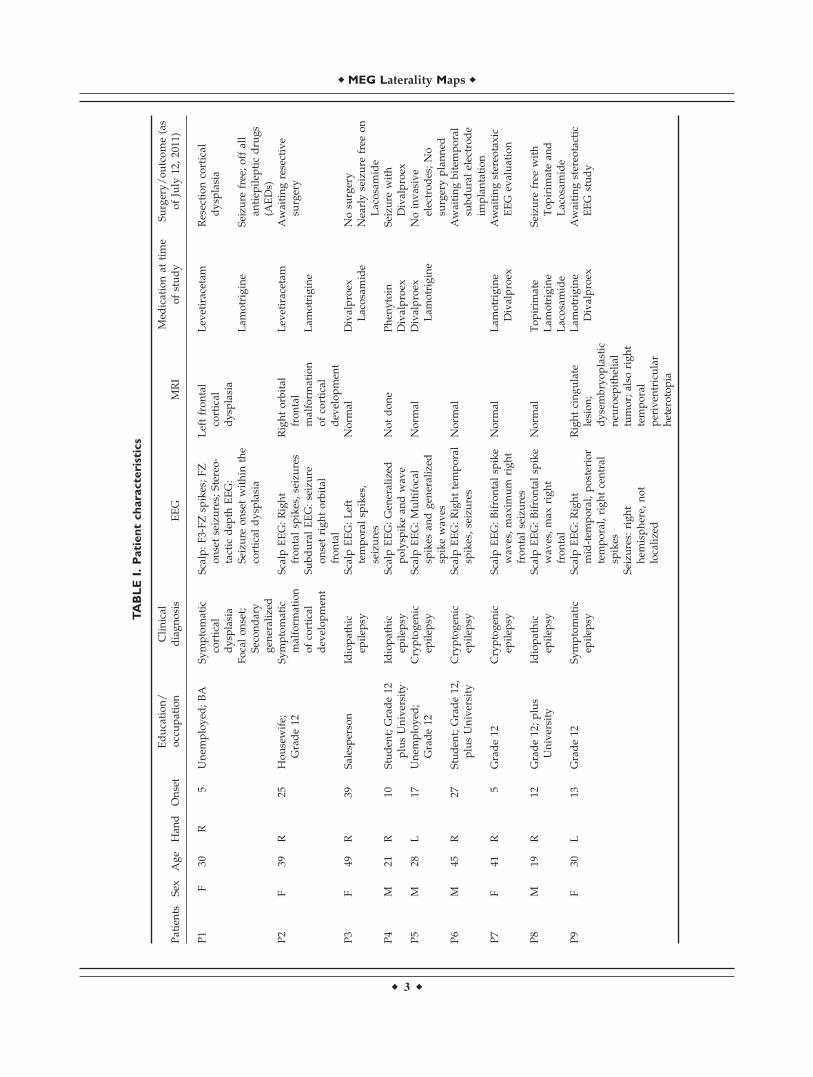
TABLEI.Patientcharacteristics
Patients
Sex
Age
Han
dOnset
Education/
occupation
Clinical
diagnosis
EEG
MRI
Med
icationat
time
ofstudy
Surgery/outcome(as
ofJuly
12,2011)
P1
F30
R5
Unem
ployed
;BA
Symptomatic
cortical
dysp
lasia
Scalp:F3-FZsp
ikes;FZ
onsetseizures;
Stereo-
tactic
dep
thEEG:
Seizu
reonsetwithin
the
cortical
dysp
lasia
Leftfrontal
cortical
dysp
lasia
Lev
etiracetam
Resectioncortical
dysp
lasia
Focalonset;
Secondary
gen
eralized
Lam
otrigine
Seizu
refree;offall
antiep
ilep
ticdrugs
(AEDs)
P2
F39
R25
Housewife;
Grade12
Symptomatic
malform
ation
ofcortical
dev
elopmen
t
Scalp
EEG:Right
frontalsp
ikes,seizures
Rightorbital
frontal
malform
ation
ofcortical
dev
elopmen
t
Lev
etiracetam
Awaitingresective
surgery
SubduralEEG:seizure
onsetrightorbital
frontal
Lam
otrigine
P3
F49
R39
Salesperson
Idiopathic
epilep
syScalp
EEG:Left
temporalsp
ikes,
seizures
Norm
alDivalproex
Lacosamide
Nosu
rgery
Nearlyseizure
free
on
Lacosamide
P4
M21
R10
Studen
t;Grade12
plusUniversity
Idiopathic
epilep
syScalp
EEG:Gen
eralized
polysp
ikean
dwav
eNotdone
Phen
ytoin
Seizu
rewith
Divalproex
Divalproex
P5
M28
L17
Unem
ployed
;Grade12
Cryptogen
icep
ilep
syScalp
EEG:Multifocal
spikes
andgen
eralized
spikewav
es
Norm
alDivalproex
Lam
otrigine
Noinvasive
electrodes;No
surgeryplanned
P6
M45
R27
Studen
t;Grade12,
plusUniversity
Cryptogen
icep
ilep
syScalp
EEG:Righttemporal
spikes,seizures
Norm
alAwaitingbitem
poral
subduralelectrode
implantation
P7
F41
R5
Grade12
Cryptogen
icep
ilep
syScalp
EEG:Bifrontalsp
ike
wav
es,max
imum
right
frontalseizures
Norm
alLam
otrigine
Divalproex
Awaitingstereo
taxic
EEG
evaluation
P8
M19
R12
Grade12;plus
University
Idiopathic
epilep
syScalp
EEG:Bifrontalsp
ike
wav
es,max
right
frontal
Norm
alTopirim
ate
Seizu
refree
with
Topirim
atean
dLacosamide
Lam
otrigine
Lacosamide
P9
F30
L13
Grade12
Symptomatic
epilep
syScalp
EEG:Right
mid-tem
poral,posterior
temporal,rightcentral
spikes
Rightcingulate
lesion;
dysembryoplastic
neu
roep
ithelial
tumor;also
right
temporal
periven
tricular
heterotopia
Lam
otrigine
Divalproex
Awaitingstereo
tactic
EEG
study
Seizu
res:
right
hem
isphere,
not
localized
r MEG Laterality Maps r
r 3 r
valuable patient-specific, high-resolution neuroanatomicaldata provided by functional imaging.
Objectives and Hypotheses
This study was designed to redefine the LI score by tak-ing advantage of the rich data available in functionalimaging. This new approach extracts information aboutthe degree of laterality, magnitude, and location of neuralactivity by scoring laterality as a complex number, andsubsequently remapping this information on a patient-spe-cific cortical surface. Laterality maps were generated basedon MEG scans during a verbal memory task. The resultsfor both healthy controls and people with epilepsy werecompared against standard LI scores derived from tradi-tional ROIs.
There were two main hypotheses: (1) the language-related laterality maps would match closely with theknown functional anatomy that supports language; and (2)the laterality map would provide more specific and clini-cally relevant information about activation magnitude andlocation, when compared with typical LI scores for bothhealthy controls and patients.
METHODS
Participants
Twenty adult participants were included across twogroups. The control group included 10 healthy controls(mean age ¼ 28.2 years, standard deviation (SD) ¼ 9.4years; six females). All subjects were right handed and flu-
ent in English. The patient group included 10 people withepilepsy (mean age ¼ 32.4 years, SD ¼ 10.5 years; sixfemales). The patient sample was recruited from the Epi-lepsy Monitoring Unit at the Halifax Infirmary, Halifax,Nova Scotia. For all patients, the lateralization of languagefunction was in question. Data from one patient could notbe included due to an inability to perform the task (reduc-ing the patient sample size to n ¼ 9). A summary of thepatient group characteristics is provided in Table I. Sevenof nine remaining patients were right handed, and allwere fluent in English. No patient had a Wada test as partof the investigation. The study had research ethics boardapproval, and all participants provided informed consent.
Experimental Paradigm
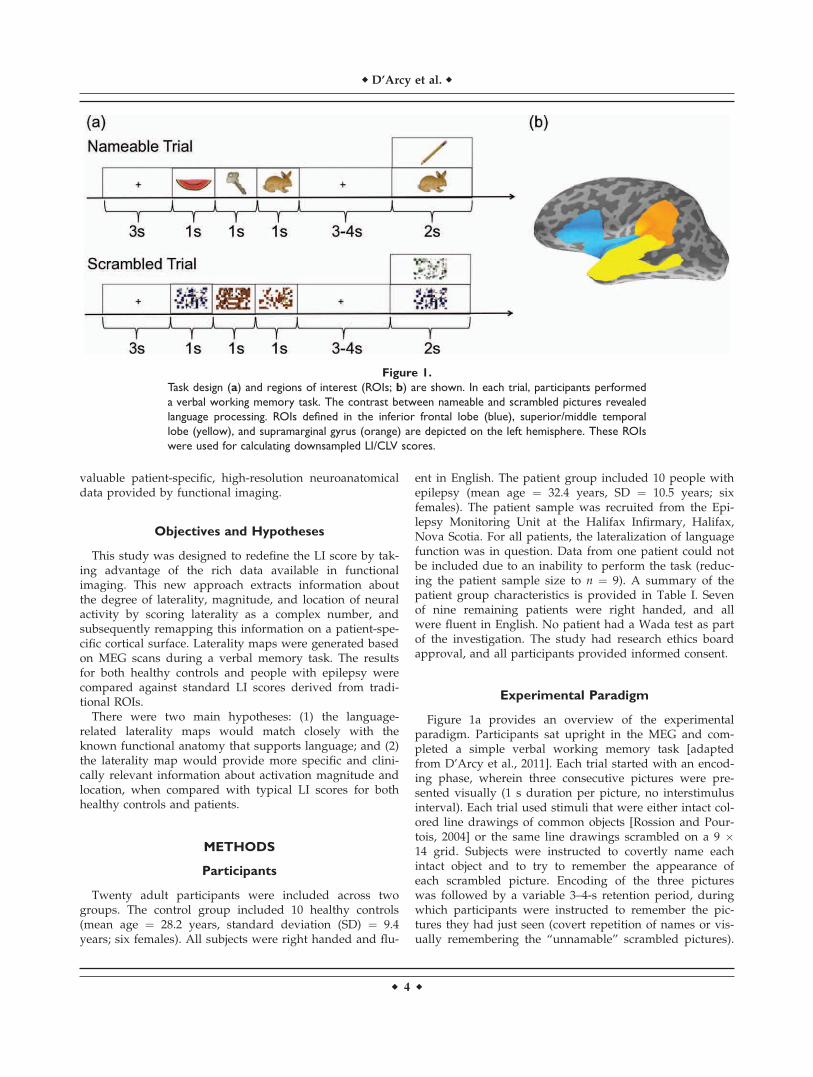
Figure 1a provides an overview of the experimentalparadigm. Participants sat upright in the MEG and com-pleted a simple verbal working memory task [adaptedfrom D’Arcy et al., 2011]. Each trial started with an encod-ing phase, wherein three consecutive pictures were pre-sented visually (1 s duration per picture, no interstimulusinterval). Each trial used stimuli that were either intact col-ored line drawings of common objects [Rossion and Pour-tois, 2004] or the same line drawings scrambled on a 9 �14 grid. Subjects were instructed to covertly name eachintact object and to try to remember the appearance ofeach scrambled picture. Encoding of the three pictureswas followed by a variable 3–4-s retention period, duringwhich participants were instructed to remember the pic-tures they had just seen (covert repetition of names or vis-ually remembering the ‘‘unnamable’’ scrambled pictures).
Figure 1.
Task design (a) and regions of interest (ROIs; b) are shown. In each trial, participants performed
a verbal working memory task. The contrast between nameable and scrambled pictures revealed
language processing. ROIs defined in the inferior frontal lobe (blue), superior/middle temporal
lobe (yellow), and supramarginal gyrus (orange) are depicted on the left hemisphere. These ROIs
were used for calculating downsampled LI/CLV scores.
r D’Arcy et al. r
r 4 r
Following this was a verification phase with the presenta-tion of a probe picture, in which there was either one ofthe three pictures presented in the encoding phase (old) ora new one (2 s duration). Novel pictures were used foreach trial of the task. Participants were instructed to indi-cate, using a button press response, whether the probe pic-ture was old or new (50:50). There was a variable 4–5 sdelay between trials. Every eighth trial was followed by ashort animation (5 s) to break up the task. In total, 128 tri-als were presented over four blocks to each participant.
Stimuli presentation and response monitoring wereachieved using Presentation software (NeurobehavioralSystems, Albany, CA). Stimuli were back-projected on atranslucent screen positioned 1 m away. The visual anglefor stimuli was 5.7�. A practice run with visual feedbackwas used before scanning to ensure task proficiency. Noimage was repeated within the experiment. Responsehand and the order of image presentation were counter-balanced across subjects.
Acquisition
Magnetic fields were recorded using an Elekta Neuro-magV
R
whole head 306-channel MEG system located withina magnetically shielded room, equipped with 102 magneto-meters and 204 gradiometers (Elekta NeuromagV
R
, Helsinki,Finland).1 A separate MEG scan was performed for eachblock of the experimental paradigm. MEG data were band-pass filtered at 0.1–330 Hz and sampled at 1,000 Hz. Electro-magnetic head position indicator (HPI) coils were used totrack head motion during the scan. The three-dimensional(3D) positions of these coils with respect to the nasion andthe left and right preauricular points were obtained using a3D position monitoring system (Polhemus, Colchester, VT).In addition, 100–150 points along the head were digitized tocoregister MEG data with the anatomical magnetic reso-nance imaging (MRI).
Anatomical MRI data were acquired using a 1.5T GEscanner (GE Medical Systems, Waukesha, WI). A 3D T1-weighted anatomical image was acquired using an spoiledgradient recalled (SPGR) sequence (inversion time (TI) ¼400 ms, recovery time (TR) ¼ echo time (TE) ¼ min, Flipangle ¼ 12�, field of view (FOV) 25.6 cm, 256 � 256, 2 mmslices). Functional MRI data were acquired in the samesession, but the results were analyzed separately.
Behavioral Data Analysis
Behavioral analysis included 128 retrieval trials dividedby four conditions (nameable-old, nameable-new,scrambled-old, and scrambled-new). Reaction time (RT)and accuracy data for the verification probe phase wereanalyzed using a repeated measures analysis of variance
(ANOVA), with conservative degrees of freedom [Green-house and Geisser, 1959]. Posthoc t-tests were conductedon significant interactions. An alpha level of P < 0.05 wasused to establish statistical significance.
MEG Data Analysis
Temporal signal-space separation [Taulu et al., 2004]was applied to the raw data for environmental noisereduction using standard Elekta NeuromagV
R
software.MEG scans were excluded if intrascan movement of anyHPI coil exceeded 1 cm. MEG data were segmented withrespect to the onset of each picture in the encoding phase(�100 to 1,000 ms), baseline corrected, low-pass filtered(40 Hz), and down-sampled (250 Hz). Principle compo-nents of MEG epochs that exceeded the threshold of 1.0pT (magnetometers) and 150 fT/cm2 (gradiometers) wereremoved as artifacts [Kobayashi and Kuriki, 1999; Lager-lund et al., 1997]. For patient data, segments containinginterictal activity were rejected based on visual inspection.
For signal averaging to compute evoked data, trialswere categorized into two types: nameable and scrambled.The contrast between these two trial types in the encodingphase was used to isolate language processing. Nameableand scrambled conditions were presented in four separatescans with 48 segments for each of the signal-averagedconditions (192 epochs in total per condition, less errors).
Spatiotemporal activation maps for nameable andscrambled evoked field data were generated usingdynamic statistical parametric mapping (dSPM) of thechange in activation from the prestimulus interval as apseudo-Z statistic [Dale et al., 2000]. The maps were aver-aged across the four separate scans for each condition. Ex-amination of the differences between the nameable andscrambled spatiotemporal dSPM activation maps forhealthy control participants’ using the partial-least squaresmethod applied to event-related MEG source data [Moseset al., 2009] revealed predominant differences between 200and 600 ms poststimulus. For each subject, the differencebetween nameable and scrambled activation maps wasused to generate language-related spatiotemporal maps. AdSPM threshold for significant language-related activationwas set to the 99.5% largest value in the null-hypothesisdistribution using the 100 ms baseline. In the 200–600-mspoststimulus period, only vertices (�5,000 elements perhemisphere) above the dSPM threshold for more than 100ms were included for further analysis. Time-collapsed lan-guage-related maps were plotted on the anatomical MRIby taking the maximum suprathreshold dSPM activationoccurring 200–600-ms poststimulus for each included loca-tion and were used in the laterality calculations below.
Complex Laterality Vector Calculation
For each location on the spatially normalized cortex ofthe left hemisphere, a two-dimensional (2D) constructcalled a complex laterality vector (CLV) was calculatedthat included the magnitude of activation at the left
110–20 electroencephalography (EEG) data were also recorded usinga MEG compatible electrode cap (Elekta NeuromagV
R
, Helsinki, Fin-land). The EEG data were compared to theMEGdata for verification,but did not otherwise add a significant contribution to the results.
r MEG Laterality Maps r
r 5 r
hemisphere location of interest and the mirror location inthe right hemisphere. Mathematically, this 2D informationwas represented as a complex number, as in Formula 2,which contains both a ‘‘real’’ and ‘‘imaginary’’ component.The imaginary component was generated by multiplyingthe magnitude of the second dimension by the mathemati-cal constant i. The ‘‘real’’ component was defined as themagnitude of left hemisphere (LH), dSPM activation at thelocation of interest (QLH). The ‘‘imaginary’’ componentwas defined as the magnitude of dSPM activation at themirror location in the right hemisphere (QRH). The samecalculation was also made for each location on the righthemisphere.
LI ¼ QLH þ i �QRH (2)
For visualization, laterality was overlaid on the left hemi-sphere of the individual’s cortical surface, showing left andbilateral activation only. Laterality was also overlaid on theright hemisphere of the individual’s cortical surface, show-ing right and bilateral activation only. On both hemispheres,the real (left) component of CLV was plotted on a red-to-yellow color scale, and the imaginary (right) componentwas plotted on a blue-to-light blue color scale. Bilateral acti-vation was represented as the sum of both color scales.
ROI Analysis
To compare laterality maps to standard LI scores, ROIswere defined in the inferior frontal lobe/insula, supramar-ginal gyrus, and superior/middle temporal region. ROIswere selected using the FreeSurfer cortical surface recon-struction [Desikan et al., 2006; Fischl et al., 2004]. The ROIsare shown in Figure 1b. Within each ROI, mean activation
and LI scores were calculated based on the language acti-vation maps. For comparison, CLV scores were calculatedusing the same mean activation.
RESULTS
Behavioral Performance Verification
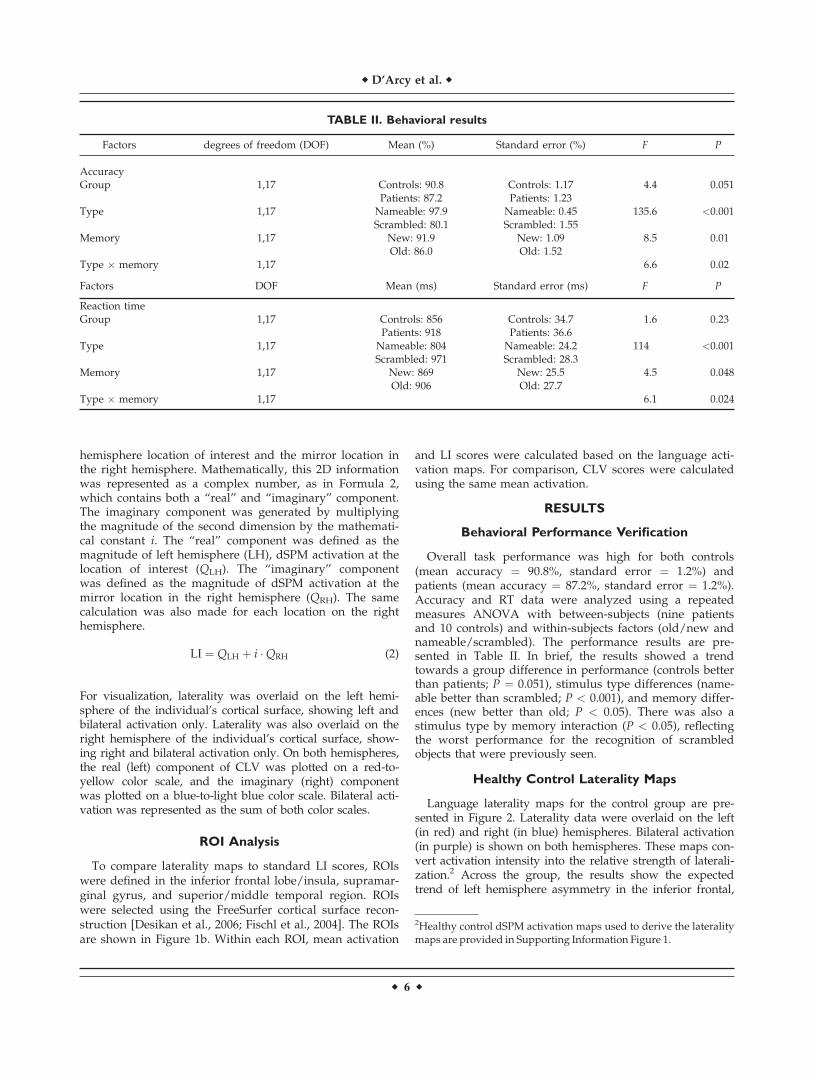
Overall task performance was high for both controls(mean accuracy ¼ 90.8%, standard error ¼ 1.2%) andpatients (mean accuracy ¼ 87.2%, standard error ¼ 1.2%).Accuracy and RT data were analyzed using a repeatedmeasures ANOVA with between-subjects (nine patientsand 10 controls) and within-subjects factors (old/new andnameable/scrambled). The performance results are pre-sented in Table II. In brief, the results showed a trendtowards a group difference in performance (controls betterthan patients; P ¼ 0.051), stimulus type differences (name-able better than scrambled; P < 0.001), and memory differ-ences (new better than old; P < 0.05). There was also astimulus type by memory interaction (P < 0.05), reflectingthe worst performance for the recognition of scrambledobjects that were previously seen.
Healthy Control Laterality Maps
Language laterality maps for the control group are pre-sented in Figure 2. Laterality data were overlaid on the left(in red) and right (in blue) hemispheres. Bilateral activation(in purple) is shown on both hemispheres. These maps con-vert activation intensity into the relative strength of laterali-zation.2 Across the group, the results show the expectedtrend of left hemisphere asymmetry in the inferior frontal,
TABLE II. Behavioral results
Factors degrees of freedom (DOF) Mean (%) Standard error (%) F P
AccuracyGroup 1,17 Controls: 90.8 Controls: 1.17 4.4 0.051
Patients: 87.2 Patients: 1.23Type 1,17 Nameable: 97.9 Nameable: 0.45 135.6 <0.001
Scrambled: 80.1 Scrambled: 1.55Memory 1,17 New: 91.9 New: 1.09 8.5 0.01
Old: 86.0 Old: 1.52Type � memory 1,17 6.6 0.02
Factors DOF Mean (ms) Standard error (ms) F P
Reaction timeGroup 1,17 Controls: 856 Controls: 34.7 1.6 0.23
Patients: 918 Patients: 36.6Type 1,17 Nameable: 804 Nameable: 24.2 114 <0.001
Scrambled: 971 Scrambled: 28.3Memory 1,17 New: 869 New: 25.5 4.5 0.048
Old: 906 Old: 27.7Type � memory 1,17 6.1 0.024
2Healthy control dSPM activation maps used to derive the lateralitymaps are provided in Supporting Information Figure 1.
r D’Arcy et al. r
r 6 r
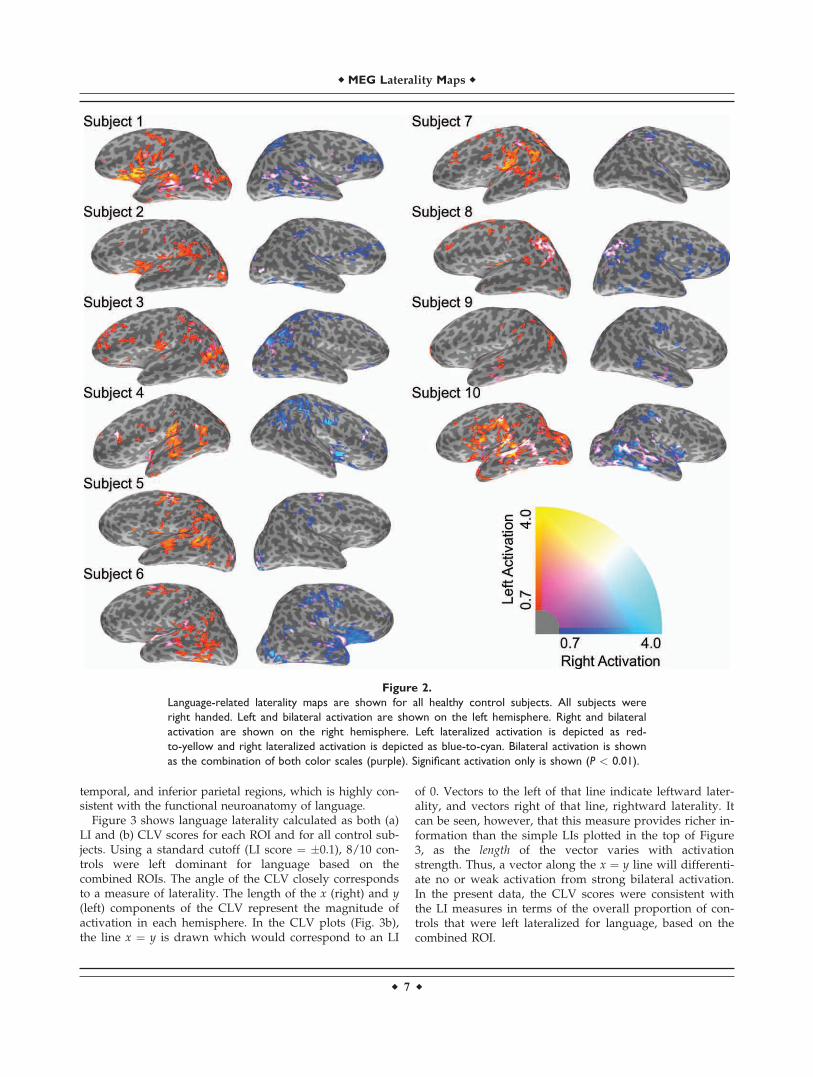
temporal, and inferior parietal regions, which is highly con-sistent with the functional neuroanatomy of language.
Figure 3 shows language laterality calculated as both (a)LI and (b) CLV scores for each ROI and for all control sub-jects. Using a standard cutoff (LI score ¼ �0.1), 8/10 con-trols were left dominant for language based on thecombined ROIs. The angle of the CLV closely correspondsto a measure of laterality. The length of the x (right) and y(left) components of the CLV represent the magnitude ofactivation in each hemisphere. In the CLV plots (Fig. 3b),the line x ¼ y is drawn which would correspond to an LI
of 0. Vectors to the left of that line indicate leftward later-ality, and vectors right of that line, rightward laterality. Itcan be seen, however, that this measure provides richer in-formation than the simple LIs plotted in the top of Figure3, as the length of the vector varies with activationstrength. Thus, a vector along the x ¼ y line will differenti-ate no or weak activation from strong bilateral activation.In the present data, the CLV scores were consistent withthe LI measures in terms of the overall proportion of con-trols that were left lateralized for language, based on thecombined ROI.
Figure 2.
Language-related laterality maps are shown for all healthy control subjects. All subjects were
right handed. Left and bilateral activation are shown on the left hemisphere. Right and bilateral
activation are shown on the right hemisphere. Left lateralized activation is depicted as red-
to-yellow and right lateralized activation is depicted as blue-to-cyan. Bilateral activation is shown
as the combination of both color scales (purple). Significant activation only is shown (P < 0.01).
r MEG Laterality Maps r
r 7 r
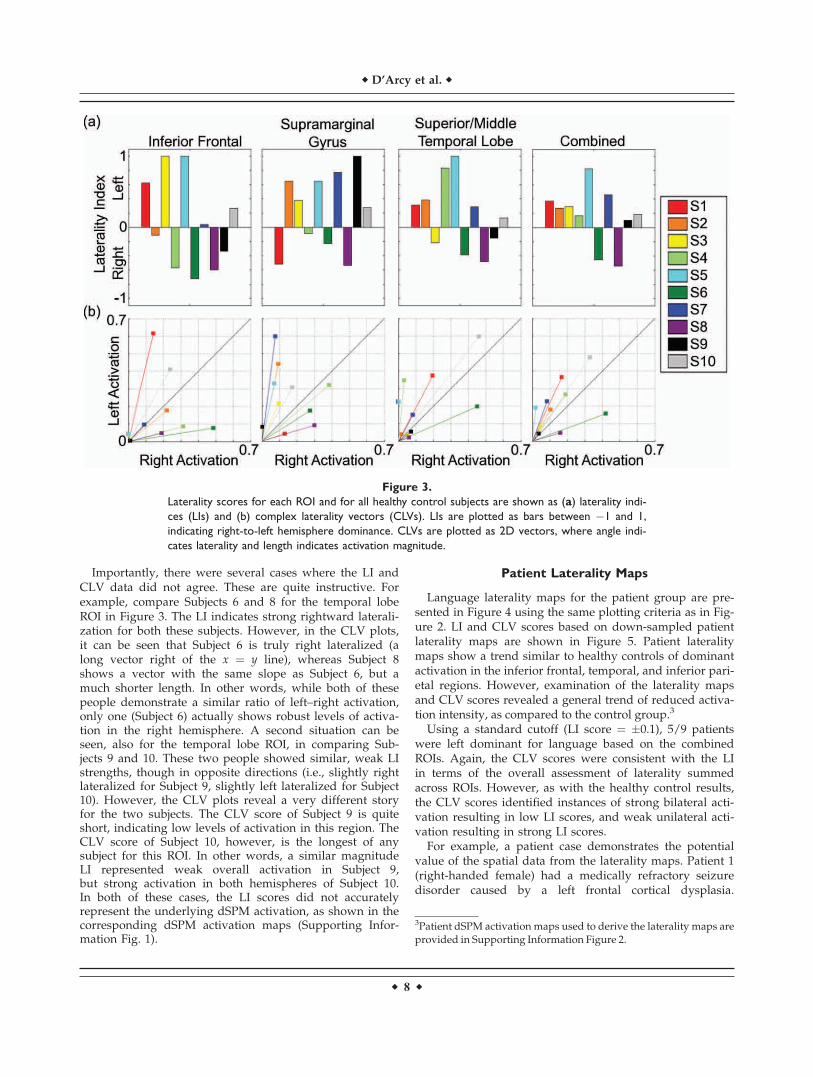
Importantly, there were several cases where the LI andCLV data did not agree. These are quite instructive. Forexample, compare Subjects 6 and 8 for the temporal lobeROI in Figure 3. The LI indicates strong rightward laterali-zation for both these subjects. However, in the CLV plots,it can be seen that Subject 6 is truly right lateralized (along vector right of the x ¼ y line), whereas Subject 8shows a vector with the same slope as Subject 6, but amuch shorter length. In other words, while both of thesepeople demonstrate a similar ratio of left–right activation,only one (Subject 6) actually shows robust levels of activa-tion in the right hemisphere. A second situation can beseen, also for the temporal lobe ROI, in comparing Sub-jects 9 and 10. These two people showed similar, weak LIstrengths, though in opposite directions (i.e., slightly rightlateralized for Subject 9, slightly left lateralized for Subject10). However, the CLV plots reveal a very different storyfor the two subjects. The CLV score of Subject 9 is quiteshort, indicating low levels of activation in this region. TheCLV score of Subject 10, however, is the longest of anysubject for this ROI. In other words, a similar magnitudeLI represented weak overall activation in Subject 9,but strong activation in both hemispheres of Subject 10.In both of these cases, the LI scores did not accuratelyrepresent the underlying dSPM activation, as shown in thecorresponding dSPM activation maps (Supporting Infor-mation Fig. 1).
Patient Laterality Maps
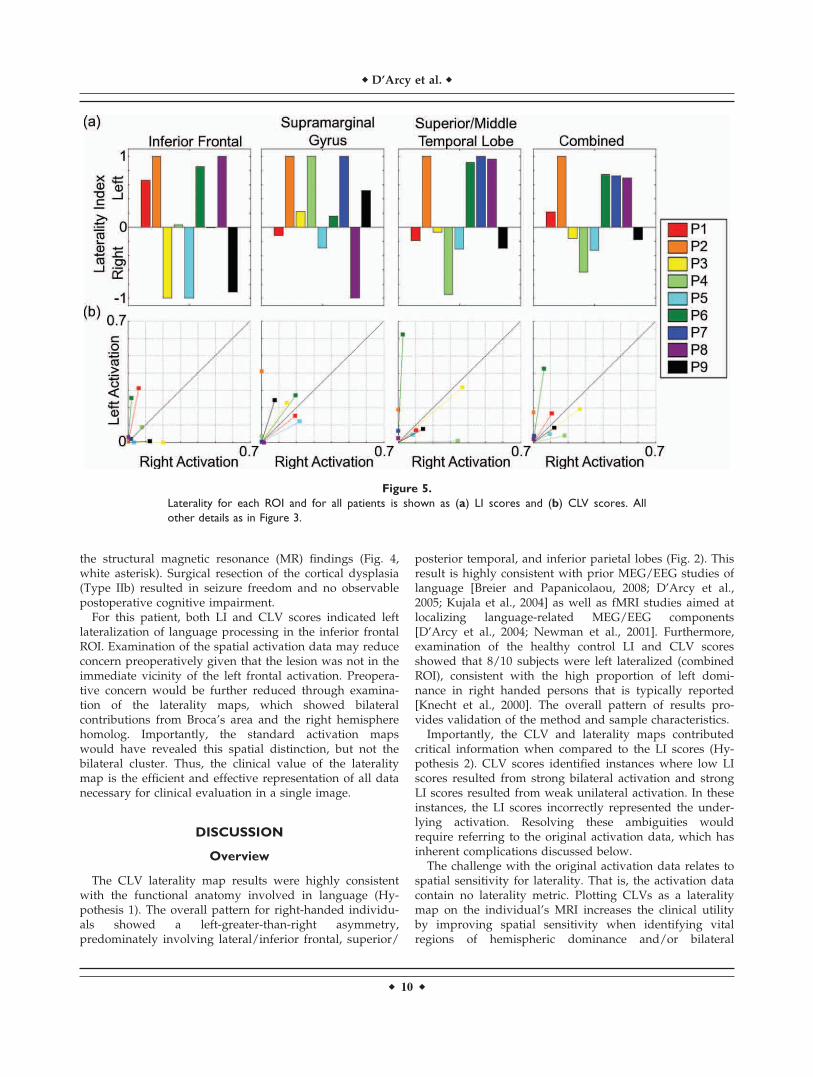
Language laterality maps for the patient group are pre-sented in Figure 4 using the same plotting criteria as in Fig-ure 2. LI and CLV scores based on down-sampled patientlaterality maps are shown in Figure 5. Patient lateralitymaps show a trend similar to healthy controls of dominantactivation in the inferior frontal, temporal, and inferior pari-etal regions. However, examination of the laterality mapsand CLV scores revealed a general trend of reduced activa-tion intensity, as compared to the control group.3
Using a standard cutoff (LI score ¼ �0.1), 5/9 patientswere left dominant for language based on the combinedROIs. Again, the CLV scores were consistent with the LIin terms of the overall assessment of laterality summedacross ROIs. However, as with the healthy control results,the CLV scores identified instances of strong bilateral acti-vation resulting in low LI scores, and weak unilateral acti-vation resulting in strong LI scores.
For example, a patient case demonstrates the potentialvalue of the spatial data from the laterality maps. Patient 1(right-handed female) had a medically refractory seizuredisorder caused by a left frontal cortical dysplasia.
Figure 3.
Laterality scores for each ROI and for all healthy control subjects are shown as (a) laterality indi-
ces (LIs) and (b) complex laterality vectors (CLVs). LIs are plotted as bars between �1 and 1,
indicating right-to-left hemisphere dominance. CLVs are plotted as 2D vectors, where angle indi-
cates laterality and length indicates activation magnitude.
3Patient dSPM activation maps used to derive the laterality maps areprovided in Supporting Information Figure 2.
r D’Arcy et al. r
r 8 r
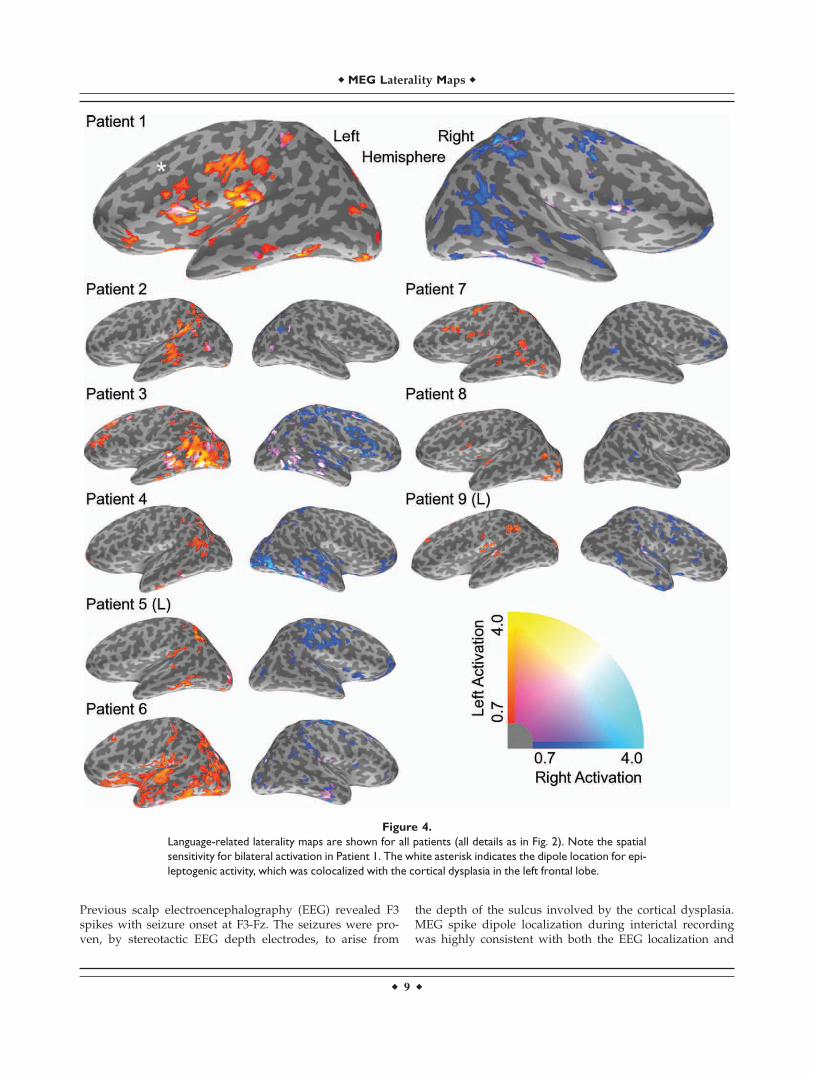
Previous scalp electroencephalography (EEG) revealed F3spikes with seizure onset at F3-Fz. The seizures were pro-ven, by stereotactic EEG depth electrodes, to arise from
the depth of the sulcus involved by the cortical dysplasia.MEG spike dipole localization during interictal recordingwas highly consistent with both the EEG localization and
Figure 4.
Language-related laterality maps are shown for all patients (all details as in Fig. 2). Note the spatial
sensitivity for bilateral activation in Patient 1. The white asterisk indicates the dipole location for epi-
leptogenic activity, which was colocalized with the cortical dysplasia in the left frontal lobe.
r MEG Laterality Maps r
r 9 r
the structural magnetic resonance (MR) findings (Fig. 4,white asterisk). Surgical resection of the cortical dysplasia(Type IIb) resulted in seizure freedom and no observablepostoperative cognitive impairment.
For this patient, both LI and CLV scores indicated leftlateralization of language processing in the inferior frontalROI. Examination of the spatial activation data may reduceconcern preoperatively given that the lesion was not in theimmediate vicinity of the left frontal activation. Preopera-tive concern would be further reduced through examina-tion of the laterality maps, which showed bilateralcontributions from Broca’s area and the right hemispherehomolog. Importantly, the standard activation mapswould have revealed this spatial distinction, but not thebilateral cluster. Thus, the clinical value of the lateralitymap is the efficient and effective representation of all datanecessary for clinical evaluation in a single image.
DISCUSSION
Overview
The CLV laterality map results were highly consistentwith the functional anatomy involved in language (Hy-pothesis 1). The overall pattern for right-handed individu-als showed a left-greater-than-right asymmetry,predominately involving lateral/inferior frontal, superior/
posterior temporal, and inferior parietal lobes (Fig. 2). Thisresult is highly consistent with prior MEG/EEG studies oflanguage [Breier and Papanicolaou, 2008; D’Arcy et al.,2005; Kujala et al., 2004] as well as fMRI studies aimed atlocalizing language-related MEG/EEG components[D’Arcy et al., 2004; Newman et al., 2001]. Furthermore,examination of the healthy control LI and CLV scoresshowed that 8/10 subjects were left lateralized (combinedROI), consistent with the high proportion of left domi-nance in right handed persons that is typically reported[Knecht et al., 2000]. The overall pattern of results pro-vides validation of the method and sample characteristics.
Importantly, the CLV and laterality maps contributedcritical information when compared to the LI scores (Hy-pothesis 2). CLV scores identified instances where low LIscores resulted from strong bilateral activation and strongLI scores resulted from weak unilateral activation. In theseinstances, the LI scores incorrectly represented the under-lying activation. Resolving these ambiguities wouldrequire referring to the original activation data, which hasinherent complications discussed below.
The challenge with the original activation data relates tospatial sensitivity for laterality. That is, the activation datacontain no laterality metric. Plotting CLVs as a lateralitymap on the individual’s MRI increases the clinical utilityby improving spatial sensitivity when identifying vitalregions of hemispheric dominance and/or bilateral
Figure 5.
Laterality for each ROI and for all patients is shown as (a) LI scores and (b) CLV scores. All
other details as in Figure 3.
r D’Arcy et al. r
r 10 r
activation. Evidence for this was seen in our first singlepatient example. The first patient case had undergone sur-gical resection of a left frontal cortical dysplasia (Fig. 4;right-handed female). Surgery resulted in a seizure-freeoutcome and no postoperative cognitive impairment. Inthis instance, both LI/CLV scores and the activation dataindicated left lateralization for the inferior frontal ROI. Ex-amination of the laterality maps showed bilateral activa-tion in Broca’s area (and the right homolog), which wasnot located in the planned resection zone. Only the spatialsensitivity of laterality maps could demonstrate this im-portant bilateral cluster.
LIs calculated from brain imaging data have typicallycollapsed activation across one or more specific ROIs [Kimand Chung, 2008; Papanicolaou et al., 2004; Woermannet al., 2003]. These approaches compress clinically valuableinformation into a single numerical index, which is takenas representative of a highly complex situation. However,the intended application of identifying laterality is to sparespecific brain areas involved in critical cognitive functions.During surgical assessment, it is arguably more beneficialto fully express the laterality distribution. One can positthen that ROIs can be refined for this purpose. Extendedto the spatial limit though, this argument leads to the lat-erality maps presented here. The laterality map effectivelyachieves spatial sensitivity by taking better advantage ofthe high localization accuracy of neuroimaging data. Whencomputed from MEG data, it is further possible to utilizetemporal resolution by examining the maximal time pointsfor language-related activation. This, combined with thespatial information, allows for improved specificity andsensitivity.
Future Directions
This study proposes that the concept of laterality be rep-resented in a more complex framework than that of one-dimensional ‘‘left/right dominant’’ dichotomy. Withrespect to language function, this is consistent with thegeneral understanding that bilateral language processingis common [Woermann et al, 2003]. It is important to notethat CLV scores and the laterality mapping method wehave presented can be applied to other cognitive functions(e.g., memory) and other imaging modalities (e.g., fMRI).Indeed, the laterality map provides a modality independ-ent framework in which MEG and fMRI results can becompared directly. Future work in this area will examinemultimodal differences between fMRI and MEG in map-ping language laterality.
LI scores provided the immediate comparison for CLVscore and laterality maps. Follow-up comparisons againstthe Wada test and outcome are necessary and can be imple-mented with existing datasets related to presurgical nonin-vasive functional mapping for language and, by extension,memory. In this respect, it is noteworthy that previous stud-ies report differences in the predictive power between dif-ferent anatomical regions/ROIs [e.g., Bowyer et al., 2005;
Sabsevitz et al., 2003]. However, the addition of magnitudeand spatial information clearly complicates any evaluationof regional differences in LI scores (Figs. 3 and 5).
According to the recent Clinical Practice Guidelines forPresurgical Functional Brain Mapping using MagneticEvoked Fields [Burgess et al., 2011], reporting MEG later-ality results require the following:
• ‘‘When calculated, the LI should be stated, along witha clear statement of which hemisphere is languagedominant (left dominant, right dominant, bilateral,and inconclusive).’’
• ‘‘Plotting of language-related data on spatially alignedMRI is at the discretion of each site and should bebased on their experience concerning the reliability oflocalization information. Such plots may give theimpression to neurosurgeons that areas without plot-ted activity are safe to resect. This type of error (false-negative) cannot be excluded systematically, so quali-fying statements may be appropriate.’’ (pp. 361)
The first point underscores the importance of the CLVscores disambiguating laterality in terms of relative differ-ences in magnitude. The current results demonstrate thatLI scores alone cannot appropriately demonstrate leftdominant, right dominant, bilateral, and inconclusive sit-uations. The second point underscores the importance ofthe spatial sensitivity in mapping laterality rather thanactivation. This approach provides improved sensitivity,as lateral and bilateral activations become an emergentproperty of the map. In addition, the patient exampledemonstrates improved specificity, as important clustersare better detected. Gains in sensitivity and specificityshould translate into improved capabilities for evaluatingpotential clinical outcome.
CONCLUSIONS
Spatiotemporal laterality mapping with MEG provides anoninvasive alternative to riskier hospital procedures suchas the Wada test. Importantly, the results of the currentstudy demonstrate that CLV and laterality maps take bet-ter advantage of the rich information within MEG for theclinical implementation of presurgical functional mapping.
ACKNOWLEDGMENTS
The authors thank Wendy Smith-D’Arcy and PatrickMcGrath for their assistance with this study. The authorsalso thank Elekta NeuroMagV
R
and Elekta Atlantic forinvaluable contributions to the work.
REFERENCES
Baxendale S. (2009): The Wada test. Curr Opin Neurol 22:185–189.Binder JR, Swanson SJ, Hammeke TA, Morris GL, Mueller WM,
Fischer M, Benbadis S, Frost JA, Rao SM, Haughton VM.
r MEG Laterality Maps r
r 11 r
(1996): Determination of language dominance using functionalMRI: A comparison with the Wada test. Neurology 46:978–984.
Binder JR, Sabsevitz DS, Swanson SJ, Hammeke TA, Raghavan M,Mueller WM. (2008): Use of preoperative functional MRI topredict verbal memory decline after temporal lobe epilepsysurgery. Epilepsia 49:1377–1394.
Binder JR. (2011): Functional MRI is a valid noninvasive alterna-tive to Wada testing. Epilepsy Behav 20:214–222.
Bowyer SM, Moran JE, Weiland BJ, Mason KM, Greenwald ML, SmithBJ, Barkley GL, Tepley N. (2005): Language laterality determinedby MEGmapping with MR-FOCUSS. Epilepsy Behav 6:235–241.
Breier JI, Papanicolaou AC. (2008): Spatiotemporal patterns ofbrain activation during an action naming task using magneto-encephalography. J Clin Neurophysiol 25:7–12.
Burgess RC, Barkley GL, Bagic AI. (2011): Turning a new page inclinical magnetoencephalography: Practicing according to thefirst clinical practice guidelines. J Clin Neurophysiol 28:339–340.
Dale AM, Liu AK, Fischl BR, Buckner RL, Belliveau JW, LewineJD, Halgren E. (2000): Dynamic statistical parametric mapping:Combining fMRI and MEG for high-resolution imaging of cort-ical activity. Neuron 26:55–67.
D’Arcy RC, Ryner L, Richter W, Service E, Connolly JF. (2004):The fan effect in fMRI: Left hemisphere specialization in verbalworking memory. Neuroreport 15:1851–1855.
D’Arcy RC, Service E, Connolly JF, Hawco CS. (2005): The influ-ence of increased working memory load on semantic neuralsystems: A high-resolution event-related brain potential study.Brain Res Cogn Brain Res 22:177–191.
D’Arcy RC, Gawryluk JR, Beyea SD, Hajra SG, Feindel KW,Clarke DB. (2011): Tracking cognitive changes in new-onsetepilepsy: Functional imaging challenges. Epilepsia 52(Suppl4):43–46.
Desikan RS, Segonne F, Fischl B, Quinn BT, Dickerson BC, BlackerD, Buckner RL, Dale AM, Maguire RP, Hyman BT, Albert MS,Killiany RJ. (2006): An automated labeling system for subdi-viding the human cerebral cortex on MRI scans into gyralbased regions of interest. NeuroImage 31:968–980.
Fischl B, van der Kouwe A, Destrieux C, Halgren E, Segonne F,Salat DH, Busa E, Seidman LJ, Goldstein J, Kennedy D, Cav-iness V, Makris N, Rosen B, Dale AM. (2004): Automaticallyparcellating the human cerebral cortex. Cereb Cortex 14:11–22.
Funke M, Constantino T, Van Orman C, Rodin E. (2009): Magne-toencephalography and magnetic source imaging in epilepsy.Clin EEG Neurosci 40:271–280.
Greenhouse SW, Geisser S. (1959): On methods in the analysis ofprofile data. Psychometrika 24:95–111.
Hirata M, Goto T, Barnes G, Umekawa Y, Yanagisawa T, Kato A,Oshino S, Kishima H, Hashimoto N, Saitoh Y, Tani N, YorifujiS, Yoshimine T. (2010): Language dominance and mappingbased on neuromagnetic oscillatory changes: Comparison withinvasive procedures. J Neurosurg 112:528–538.
Jones SE, Mahmoud SY, Phillips MD. (2011): A practical clinicalmethod to quantify language lateralization in fMRI usingwhole-brain analysis. NeuroImage 54:2937–2949.
Kamada K, Sawamura Y, Takeuchi F, Kuriki S, Kawai K, MoritaA, Todo T. (2007): Expressive and receptive language areasdetermined by a non-invasive reliable method using functionalmagnetic resonance imaging and magnetoencephalography.Neurosurgery 60:296–306.
Kim J, Chung C. (2008): Language lateralization using MEG betafrequency desynchronization during auditory oddball stimula-tion with one-syllable words. NeuroImage 42:1499–1507.
Knecht S, Drager B, Deppe M, Bobe L, Lohmann H, Floel A, Ringel-stein EB, Henningsen H. (2000): Handedness and hemisphericlanguage dominance in healthy humans. Brain 123:2512–2518.
Kobayashi T, Kuriki S. (1999): Principal component eliminationmethod for the improvement of in evoked neuromagnetic fieldmeasurements. IEEE Trans Biomed Eng 46:951–958.
Kujala A, Alho K, Service E, Ilmoniemi RJ, Connolly JF. (2004):Activation in the anterior left auditory cortex associated withphonological analysis of speech input: Localization of the pho-nological mismatch negativity response with MEG. Brain ResCogn Brain Res 21:106–13.
Lagerlund TD, Sharbrough FW, Busacker NE. (1997): Spatial filter-ing of multichannel electroencephalographic recordingsthrough principal component analysis by singular valuedecomposition. J Clin Neurophysiol 14:73–82.
McDonald CR, Thesen T, Hagler DJ Jr, Carlson C, Devinksy O,Kuzniecky R, Barr W, Gharapetian L, Trongnetrpunya A, DaleAM, Halgren E. (2009): Distributed source modeling of lan-guage with magnetoencephalography: Application to patientswith intractable epilepsy. Epilepsia 50:2256–2266.
Moses SN, Ryan JD, Bardouille T, Kovacevic N, Hanlon FM, McIntoshAR. (2009): Semantic information alters neural activation duringtransverse patterning performance. NeuroImage 46:863–873.
Newman AJ, Pancheva R, Ozawa K, Neville HJ, Ullman MT.(2001): An event-related fMRI study of syntactic and semanticviolations. J Psycholinguist Res 30:339–364.
Papanicolaou AC, Simos PG, Castillo EM, Breier JI, Sarkari S,Pataraia E, Billingsley RL, Buchanan S, Wheless J, Maggio V,Maggio WW. (2004): Magnetocephalography: A noninvasivealternative to the Wada procedure. J Neurosurg 100:867–876.
Rossion B, Pourtois G. (2004): Revisiting Snodgrass and Vander-wart’s object pictorial set: The role of surface detail in basic-level object recognition. Perception 33:217–236.
Sabsevitz DS, Swanson SJ, Hammeke TA, Spanaki MV, PossingET, Morris GL III, Mueller WM, Binder JR. (2003): Use of pre-operative functional neuroimaging to predict language deficitsfrom epilepsy surgery. Neurology 60:1788–1792.
Sharan A, Ooi YC, Langfitt J, Sperling MR. (2011): Intracarotidamobarbital procedure for epilepsy surgery. Epilepsy Behav20:209–213.
Stufflebeam SM, Tanaka N, Ahlfors SP. (2009): Clinical applicationsof magnetoencephalography. Hum Brain Mapp 30:1813–1823.
Taulu S, Kajola M, Simola J. (2004): Suppression of interferenceand artifacts by the signal space separation method. Brain Top-ogr 16:269–275.
Van der Haegen L, Cai Q, Seurinck R, Brysbaert M. (2011): Fur-ther fMRI validation of the visual half field technique as an in-dicator of language laterality: A large-group analysis.Neuropsychologia 49:2879–2888.
Wada J. (1949): A new method for the determination of the sideof cerebral speech dominance. A preliminary report of theintra-carotid injection of sodium amytal in man. Igaku to Sei-butsugaki 14:221–222.
Woermann FG, Jokeit H, Luerding R, Freitag H, Schulz R, Guer-tler S, Okujava M, Wolf P, Tuxhorn I, Ebner A. (2003): Lan-guage lateralization by Wada test and fMRI in 100 patientswith epilepsy. Neurology 61:699–701.
r D’Arcy et al. r
r 12 r