Embed Size (px)
Citation preview


To my family
”Allt är ännu ett mysterium, men det är spännande som fan” Ulf Lundell, När jag kysser havet, 1982

Supervisors Dr. Ulf Bergström
Institute of Coastal Research Swedish Board of Fisheries Öregrund, Sweden Dr. Alfred Sandström Institute of Freshwater Research
Swedish Board of Fisheries Stockholm, Sweden
Prof. Peter Eklöv
Department of Ecology and Genetics, Limnology
Uppsala University Uppsala, Sweden
Opponent Prof. Christian Möllmann Institute for Hydrobiology and Fisheries Science Hamburg University Hamburg, Germany
List of Papers
This thesis is based on the following papers, which will be referred to by their Roman numerals.
I Florin A-B, Sundblad G, Bergström U. 2009. Characterisation of
juvenile flatfish habitats in the Baltic Sea. Estuarine, Coastal and Shelf Science 82: 294-300.
II Snickars M, Sundblad G, Sandström A, Ljunggren L, Bergström U, Johansson G, Mattila J. 2010. Habitat selectivity of a substrate spawning fish: modelling requirements for the Eurasian perch Perca fluviatilis. Marine Ecology Progress Series 398: 235-243.
III Sundblad G, Härmä M, Lappalainen A, Urho L, Bergström U. 2009. Transferability of predictive fish distribution models in two coastal systems. Estuarine, Coastal and Shelf Science 83: 90-96.
IV Sundblad G, Bergström U, Sandström A. Ecological coherence of marine protected area networks: a spatial assessment using species distribution models. Journal of Applied Ecology (accepted manuscript).
V Sundblad G, Bergström U, Eklöv P. Spatial analysis shows recruitment habitat limitation of large predatory fish. Manuscript.
Papers I-III were reprinted with kind permission of the following publishers; Elsevier (paper I and III) and Inter-Research Science Center (paper II). Contribution I have contributed to the planning of papers I, III and V, participated in the field sampling for papers III-V and have been involved in the analyses and writing of all the papers, with extra responsibility for the analyses of papers II-V and writing of papers III-V.

List of additional papers
Additional papers with contributions from the author, not included in the thesis:
• Bergek S, Sundblad G, Björklund M. 2010. Population
differentiation in Eurasian perch: environmental effects on gene flow? Journal of Fish Biology 76:1159-1172
• Ljunggren L, Sandström A, Bergström U, Mattila J,
Lappalainen A, Johansson G, Sundblad G, Casini M, Kaljuste O, Eriksson B K. 2010. Recruitment failure of coastal predatory fish in the Baltic Sea coincident with an offshore ecosystem regime shift. ICES Journal of Marine Science 67:1587-1595.
• Lappalainen A, Kallasvuo M, Sundblad G, Bergström U.
Comparison of multimesh gillnets and small detonations for sampling young-of-the-year fish in shallow water. Manuscript.

Contents
Introduction.....................................................................................................9 General background ...................................................................................9 Species distribution modelling .................................................................10
Niche and Habitat ................................................................................10 Modelling approaches..........................................................................11 Species – Environment relationships...................................................12
Study system ............................................................................................13
Aims of the thesis..........................................................................................15
Relevance of the thesis..................................................................................16
Methods ........................................................................................................17 Field sampling ..........................................................................................17 Modelling techniques ...............................................................................17 Model evaluation......................................................................................18
Results and Discussion .................................................................................21 Habitat characteristics and species-environment relationships ................21 Distribution modelling .............................................................................23 Applied habitat science and fish ecology .................................................24
Conclusions and perspectives .......................................................................28 Acknowledgements ..................................................................................29
Summary in Swedish (Sammanfattning) ......................................................30 Bakgrund och relevans .............................................................................30 Syfte .........................................................................................................31 Resultat.....................................................................................................31 Sammanfattning och slutsatser.................................................................33
Acknowledgements.......................................................................................35
References.....................................................................................................37


9
Introduction
General background Ecological processes at various temporal and spatial scales have created a vast array of distribution patterns. Describing the relationships between organisms and their environment is central to the understanding of these processes and the functioning of ecosystems. Consequently, studies on biodiversity and the dynamics of species distributions has a long tradition in ecology (e.g. Grinnel 1917). The configuration of habitats and the distribution of species along environmental gradients have for a long time also been affected by human interests and development. For example, in 1877, applied ecology sought the answer to an unexpected low production of an oyster bank in response to fisheries management needs (cited from Olenin and Ducrotoy 2006). Today, as habitat loss poses a major threat to coastal ecosystems (Airoldi and Beck 2007), the need to map species and habitat distributions for nature conservation has increased dramatically (Thrush and Dayton 2010). Ecologists’ interests in understanding population distribution and dynamics, combined with advancements in computer technology, have led to the development of species distribution modelling. This field of spatial modelling relates the occurrence or abundance of species to environmental descriptors and can help resolve, or raise, ecological and evolutionary questions into the underlying processes and mechanisms regulating species and habitat distributions (Guisan and Thuiller 2005, Kozak et al. 2008, Elith and Leathwick 2009). For example, Moore et al. (2009) studied the relationship between seascape features and an assemblage of demersal fish species and were able to predict their distribution in a marine national park, results that are directly applicable in marine spatial planning. These types of studies can increase our understanding of the processes behind distribution patterns and simultaneously provide scientific advice for management.
10
Species distribution modelling Niche and Habitat Joseph Grinnell (1917) was among the first to use the term ‘Niche’, in his paper "The niche relationships of the California Thrasher". Later, the niche concept was popularized by the zoologist G. Evelyn Hutchinson (1957), although the general concept was put forward in a footnote already in 1944 (Hutchinson 1944). The term niche is often separated in two distinct meanings, fundamental and realised. The fundamental niche is described as a hypervolume defined by a multidimensional space of resource functions which limit the potential distribution of an organism. The potential distribution is however seldom the same as the actual distribution, the realised niche, since factors such as historic events, dispersal, behaviour and interactions with other species create constraints. The realised niche could therefore also be referred to as a habitat, as it relies more on an actual spatial distribution. The properties of a habitat are characterised by environmental variables, i.e. abiotic components, yet biotic aspects are inherent in the description of a habitat (Mitchell 2005). For fish, an inherent biotic aspect of a habitat could be exemplified by macrovegetation, which can provide suitable food resources and shelter from predation (Eklöv 1997), although it is still the environmental characteristics that ultimately affect the distribution of the more fine scale properties of the habitat. It should be noted that biotic processes can also be incorporated explicitly when modelling species distributions. Leathwick and Austin (2001) showed that the responses of several species of trees to a dominant environmental gradient (annual temperature) changed when a local biotic factor (competition) was included in the models. There is however a difference between the concepts of niche and habitat and one could argue that the niche lies hierarchically beneath the habitat since several species may share a habitat, but based on the competitive exclusion principle (Hardin 1960), two species cannot share the same realised niche (Udvardy 1959). The inclusion of species and habitat interactions and how organisms interact with the niche reflects the historical development of a more unifying and mechanistic niche concept (Chase and Leibold 2003). This can be summarised so that the concept of niche should “be reserved for mechanistic analysis of how different environmental factors in an organism’s habitat interact with the organism itself to affect its growth, survival and reproduction” (Kearney 2006). Thus, by utilising spatial variation in measurable niche dimensions, species distribution modelling can provide a framework for studying habitat availability, source-sink dynamics and dispersal limitation in relation to the niche concept (Pulliam 2000, Guisan and Thuiller 2005). Although a complete understanding of the niche of a species is extremely data intensive, in the context of species distribution modelling, mechanistic niche models should be suitable for predictions
11
under different conditions, e.g. range shifts in response to climate change (Kearney and Porter 2009). Most species distribution models are however based on correlative representations of species-environment relationships which, hence, describe and map current habitat distributions (Guisan and Zimmerman 2000).
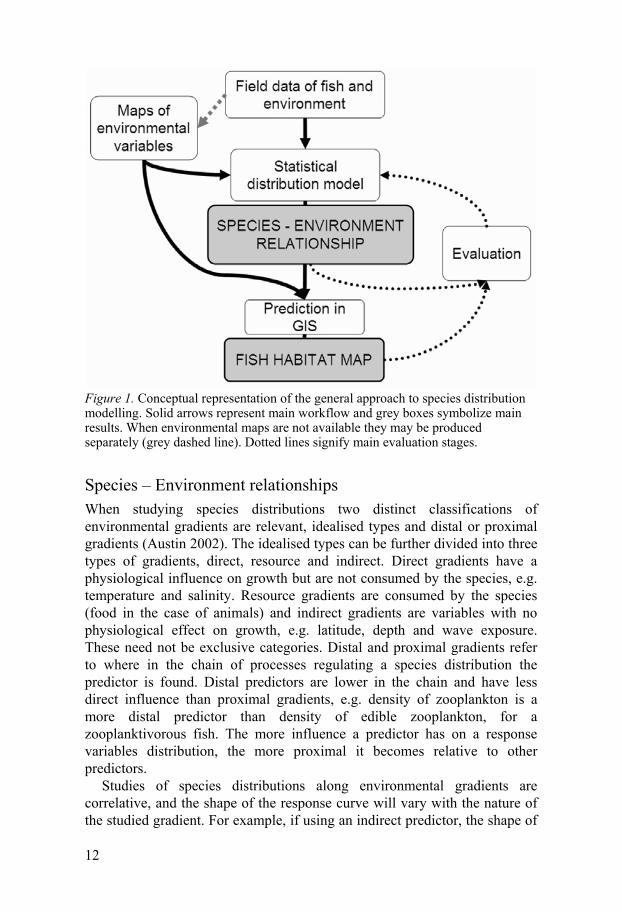
Modelling approaches Modelling the correlation between the spatial distribution of species and environmental conditions has a long history (e.g. Johnston 1924), but it is since the early 1990s, with advancements in ecological theory and computer power, major progress has been made (Guisan and Thuiller 2005). The general approach to species distribution modelling is based on the concept that certain habitat characteristics are needed to host specific species, assemblages or communities. The relationship between the response variable (species/community) and environmental characteristics can inform us of habitat preferences and, based on maps of the same environmental layers, also be used to spatially predict the distribution of the species or community (Figure 1). The primary step requires samples of the response variable along major structuring environmental gradients. The statistical relationship between the environmental explanatory variables and the response can then be applied to maps of the environmental layers to make predictions in a geographic information system (GIS). Map data of relevant variables are not always easy to obtain but can be produced based on separate field campaigns (exemplified by the upper left dashed lines of Figure 1). Evaluation of model performance is an important aspect for model applicability and includes several different aspects (Guisan and Zimmerman 2000). Primarily it refers to an evaluation of the predictive performance, which can be tested using cross-validation techniques and independent datasets. Evaluation can also include aspects of error propagation and spatial autocorrelation, as well as model applicability, which will be dependent on the purpose of the model.
12
Figure 1. Conceptual representation of the general approach to species distribution modelling. Solid arrows represent main workflow and grey boxes symbolize main results. When environmental maps are not available they may be produced separately (grey dashed line). Dotted lines signify main evaluation stages.
Species – Environment relationships When studying species distributions two distinct classifications of environmental gradients are relevant, idealised types and distal or proximal gradients (Austin 2002). The idealised types can be further divided into three types of gradients, direct, resource and indirect. Direct gradients have a physiological influence on growth but are not consumed by the species, e.g. temperature and salinity. Resource gradients are consumed by the species (food in the case of animals) and indirect gradients are variables with no physiological effect on growth, e.g. latitude, depth and wave exposure. These need not be exclusive categories. Distal and proximal gradients refer to where in the chain of processes regulating a species distribution the predictor is found. Distal predictors are lower in the chain and have less direct influence than proximal gradients, e.g. density of zooplankton is a more distal predictor than density of edible zooplankton, for a zooplanktivorous fish. The more influence a predictor has on a response variables distribution, the more proximal it becomes relative to other predictors.
Studies of species distributions along environmental gradients are correlative, and the shape of the response curve will vary with the nature of the studied gradient. For example, if using an indirect predictor, the shape of

13
the response will depend on the correlation between the indirect predictor and the causal gradient(s) (Guisan and Zimmerman 2000). Indirect variables are often correlated to resources and direct gradients, e.g. wave exposure can be thought to encapsulate temperature, water turn-over time and to some extent prey availability, if sensitive to wave exposure. When using multiple indirect variables, the difference in their contribution to the overall model can therefore give insight to the mechanisms governing a species distribution, although care should be taken regarding the shape of the response to the direct gradients and/or resources.
Assessing the type of explanatory variables becomes especially important when models are used in a predictive context. Since sampling is constrained in space and time, the response to environmental conditions used for prediction will be a short-term static description of the expected relationship. Thus, a pseudo-equilibrium with the environment is often implicitly, or more seldom explicitly, assumed (Guisan and Thuiller 2005). Although few studies have addressed this assumption, there is limited evidence suggesting that the validity of this postulation increases with dispersal capability, i.e. highly mobile species have adapted their distribution to current conditions (Araújo and Pearson 2005).
Study system The Baltic Sea is a relatively young sea and has since the latest glaciation undergone several succession stages and is under continuous change. Historically the greatest changes have been related to salinity, depending on its connectivity to the Atlantic. Today the Baltic Sea is brackish with a salinity gradient from around 3 to 30 per mille ranging from the Bothnian Bay in the north to Skagerrak in the southwest. The Baltic Sea is one of the largest brackish water bodies in the world and is a highly productive system with low species diversity (Ojaveer et al. 2010).
Fish and other organisms in the Baltic Sea are influenced by a number of factors. Climate driven hydrographical conditions, primarily temperature and salinity, in combination with top-down effects from fishing drive the Baltic proper offshore system (Casini et al. 2008, Möllmann et al. 2008, Casini et al. 2009). A change from a cod-dominated to a sprat-dominated system resulted in changes in zooplankton community composition in the early 1990s, as an effect of increased predation by sprat (Casini et al. 2008). Parallel changes have occurred in coastal areas adjacent to the central Baltic proper. The increase in sprat biomass coincide in time with an apparent recruitment failure of top predators and subsequent increase of small bodied fish abundance, suggesting that changes in the offshore ecosystem has propagated to parts of the coast (Ljunggren et al. 2010).
14
Natural gradients are governing species distribution in coastal areas at both large and small spatial scales. At large spatial scales abiotic factors such as salinity can limit species distributions (Ojaveer et al. 2010), while at smaller spatial scales local effects such as biotic interactions become more important (Pihl et al. 2000, Bergström et al. 2002, Rosqvist et al. 2010). This becomes particularly apparent in the larger archipelago areas that consist of tens of thousands of islands. A strong meandering shoreline, together with distinct changes in e.g. water depth and substrate, creates a highly diverse environment also over small spatial scales. The archipelago can be divided into inner, middle and outer regions due to their different environmental characteristics. Outer areas are characterized by small islands and high wave exposure, which in turn affects substrate and vegetation. In the middle regions, islands are larger with land vegetation closer to the shoreline and the shores of sheltered inlets are usually covered by reeds. In the innermost parts reed is abundant and land dominates the landscape. When moving from the outer to the inner archipelago, water exchange and wave exposure decreases and turbidity increases, as does the abundance of many freshwater organisms. The combination of strong environmental gradients at multiple scales and an extremely complex topography should provide suitable conditions for successful modelling of species distributions.
Main threats to the coastal zone include increased nutrient loads and habitat loss (Bonsdorff et al. 1997, Airoldi and Beck 2007). Smaller scale (local) disturbances such as dredging and shoreline property development have increased drastically during the last decades (Kindström and Aneer 2007), which together with associated boating have negative effects on fish habitats causing changes in fish community composition (Eriksson et al. 2004, Sandström et al. 2005).
15
Aims of the thesis
This thesis has addressed three main topics: 1. Habitat requirements and species-environment relationships for early life-stages of fish in the coastal areas of the Baltic Sea. The earliest life-stages are often more sensitive to environmental conditions than subsequent stages. Thus, the strong gradients in the coastal areas of the Baltic Sea were hypothesized to influence the distribution of several species and life-stages. Specifically, this thesis has addressed habitat choice for substrate spawning fish (paper II) and the distribution of larvae (paper III) and juveniles (papers I, IV and V) in relation to environmental gradients. 2. Prediction of fish species and habitat distributions. Species distribution modelling is a rapidly advancing field and its applicability for fish reproduction habitats has been relatively unknown. Here the aims have been to determine the relative importance of abiotic and biotic components for species distribution modelling (paper I), assess how general and transferable in space distribution models are (paper III) and to test if a few important environmental variables can explain habitat distributions for an assemblage of the principal coastal fish species (paper IV). 3. Species distribution models for ecological and management applications. Specific applications included i) the development of spatial tools to assess how networks of marine protected areas meet their conservation goals with regards to an assemblage of coastal fish species (paper IV), and ii) assessing limiting factors for the abundance of a top predator coastal fish species (paper V).

16
Relevance of the thesis
Management needs, and should, be based on best available science. Since management of human activities in marine systems inherently require spatial approaches (Rice 2005), science needs to meet this demand. Maps of habitats and ecological communities are needed for an efficient management of the heavily exploited coastal zone. Knowledge on the spatial extent of essential habitats for fish and other organisms is however sparse. As this thesis shows, predictive spatial modelling together with large-scale field studies provide a powerful approach to obtain maps of important coastal fish reproduction areas, results that are directly applicable in marine management. The underlying concept that a variety of well-defined habitat characteristics are needed to host certain species, assemblages or communities is reflected in the use of networks of marine protected areas aimed at conservation of specific habitat types, such as the marine Natura 2000 network in Europe. A spatial approach can in this context serve dual purposes, as demonstrated in this thesis by mapping habitat distributions and by developing tools for evaluation of network performance. Spatially explicit research thus forms an integral role in developing approaches to evaluate and advice conservation management aimed at ecologically important habitats. However, habitat science and nature conservation have traditionally been separate from fisheries science and management (Rice 2005, Armstrong and Falk-Petersen 2008). As management and policies are moving towards integrated and ecosystem-based considerations, an increased understanding of the effects of habitat availability and quality on fish population sizes and dynamics is highly needed. By mapping life-stage specific habitat availability, this thesis shows that adult fish population sizes can be limited by critical recruitment habitats, illustrating the mutual benefits of integrating fisheries management and nature conservation. To summarize, species distribution modelling provides a powerful tool for identification and mapping of ecologically important species and habitat distributions that are highly relevant for an integrated and ecosystem-based management of marine resources.
“Good science includes informing the general public of the relevance and
importance of our work” (Bazzaz et al. 1998).

17
Methods
Field sampling Several sampling techniques have been used for the collection of data in this thesis. Sampling of egg strands in spawning habitats could be performed visually since female Eurasian perch Perca fluviatilis release a single gelatinous egg strand that is relatively easy to identify (Thorpe 1977). Repeated visual surveys were conducted by snorkelling along parallel transect lines and from boats in early spring (papers II and V). Sampling of roach Rutlius rutilus and pike Esox lucius larvae (paper III) was conducted using a white plate and scoop, which is a qualitative method suitable for shallow conditions where plankton or bongo nets are difficult to use (Lappalainen et al. 2008). Sampling of juvenile fish after the first summer was performed with two methods, push net (paper I) and underwater detonations (paper IV and V). Push net was used for flounder Platichthys flesus and turbot Psetta maxima, which lack a gas-filled swimbladder needed for efficient sampling using detonations. The push net is shaped as a semi-circle and was pushed along the surface sediment. Underwater detonations have been used by Scandinavian researchers since the early 1970s (Karås and Neuman 1981) and accurately estimates abundance of juvenile fish in different habitats (Snickars et al. 2007). Compared to an evaluation of the method by Snickars et al. (2007), sampling of data in this thesis had an addition of 10 g explosives. The increased detonation strength increases the sampling area, yielding approximately a 5 m radius. Sampling juvenile fish with underwater detonations generate normally distributed length distributions since sampling efficiency is size independent of young-of-the-year fish (Lappalainen et al. manuscript). In paper V adult population sizes were estimated from standardized monitoring with Nordic multimesh gillnets (Ådjers et al. 2006).
Modelling techniques Two types of statistical modelling techniques were used to model the distribution of species, generalized additive models and maximum entropy, as implemented in the software Maxent (Lehmann et al. 2002, Phillips et al. 2006, Wood 2006). One important aspect to consider in the choice of

18
modelling technique is the type of response data. For sampling strategies that yield information on both presences and absences, generalized models are highly useful (Guisan et al. 2002). However, when absences are uncertain or lacking, for example when detectability is low, presence-only techniques may be preferred (Elith et al. 2006).
Generalized models are extensions of general linear models, such as analysis of variance or linear regression. A main advantage of the generalized approach includes increased flexibility, especially with regards to non-normal error and response distributions, while disadvantages include increased complexity and reduced interpretability (Guisan et al. 2002). Generalized additive models (GAM) are considered a semi- or nonparametric regression technique that does not require linear relationships (Hastie and Tibshirani 1990). GAMs use a smoother spline function to fit a response curve to the data without assuming the shape of the fit a priori. The flexibility of the smoother(s) that is used to fit the data makes it extra important to consider sampling strategy and predictor variables selected, including only ecologically relevant variables.
The software Maxent is a machine learning method based on presence-only information. Since its introduction to ecology (Phillips et al. 2006), several improvements have been made (Phillips and Dudík 2008). The principle behind Maxent is based on an approximation of an unknown probability distribution, drawn from the environmental background layers. The unknown probability distribution is approximated using maximum entropy, given the constraints that the expected value of each environmental variable equals its empirical average from the presence data (Phillips et al. 2006, Phillips and Dudík 2008). Similar to the additive nature of GAMs, the influence on habitat suitability of each environmental variable can be assessed.
Model evaluation Performance of a presence/absence (binomial) model is normally summarized in a confusion or error matrix (Table 1) that cross tabulates observed and predicted presence/absence patterns. Combined with the number of samples, several indices of model performance can be calculated (Fielding and Bell 1997). Recent development has also highlighted the use of bootstrap and other techniques for assessing confidence interval for several performance indices (Liu et al. 2010). However, there is yet no consensus on which indices to use since they are applicable in different ways depending on modelling objectives. If the goal is to identify sites with a higher certainty of finding a species, the threshold would be adjusted to minimize the false positives (i.e. absent, but predicted to be present). This is for example applicable when defining protected areas, where failure to

19
correctly predict presence locations could result in higher costs from a conservation point of view. If the goal instead is to make more general large scale maps of unsampled areas, focus could be on optimizing the overall fit, i.e. the balance between false positives and false negatives (present, but predicted to be absent; Araújo and Williams 2000). More common terms when assessing model performance are sensitivity and specificity (or omission and commission errors). Sensitivity is the proportion of true positives correctly classified and is calculated as A / (A + C). It does not contain information about the models ability to handle absences, which is given by specificity, calculated as D / (B + D), as specified in Table 1.
Table 1. Confusion matrix
Observed presence Observed absence
Predicted presence A(true positive) B(false positive, commission) Predicted absence C(false negative, omission) D(true negative)
In order to use a confusion matrix, the predicted probabilities need to be cut at some threshold where values above are defined as presence and below as absence. One for ecology novel approach for dichotomising continuous predictions, called the true skill statistic, was described by Allouche et al. (2006). It is closely related to Cohen’s kappa statistic (Cohen 1960) and inherits all the advantages while compensating for the dependence of prevalence (i.e. percent occurrence). The true skill statistic is calculated by adding sensitivity (proportion of correctly predicted presences) and specificity (proportion of correctly predicted absences) subtracting 1. Alternatively, if the aim is to balance correct predictions of both presences and absences, as described above, a threshold can be given by graphically visualising sensitivity and specificity on the y-axis for all available cut-off values on the x-axis. The sensitivity-specificity intersection gives the threshold where model predictions of suitable and unsuitable habitats are balanced. If the prevalence is known, another, probably similar approach, was shown by Strauss & Biedermann (2007). For species with a prevalence in the field data of 30%, the 30% of the predicted grid cells with the highest predicted occurrence probabilities were assigned presence. It can be considered a straightforward approach since models with high discriminatory power assign the highest presence probabilities to occupied sites.
Recent and popular approaches for evaluation of species distribution model performance are receiver operating characteristic plots (ROC; Manel et al. 2001, Francis et al. 2005, Maggini et al. 2006). Although originating from signal detection theory, ROC-plots were made popular in medical sciences and have been described as similar to the Mann-Whitney two sample test (Zweig and Campbell 1993). ROC-plots are obtained by plotting

20
all sensitivity values on the y-axis and 1 - specificity on the x-axis for all available thresholds (DeLeo 1993, Fielding and Bell 1997). A strong advantage lies in the fact that it gives an overall measure of accuracy, regardless of the prevalence in the data set (Pearce and Ferrier 2000, McPherson et al. 2004). ROC-plots give an area-under-curve value (AUC) that ranges between 0.5 and 1. An AUC-value of 1 indicates no overlap between the two group distributions, i.e. true positives and false positives. A value of 0.75 shows that 75% of the time a random selection from the positive group will have a score greater than a random selection from the negative group.

21
Results and Discussion
Habitat characteristics and species-environment relationships Strong environmental gradients on multiple spatial scales made the Baltic Sea coastal zone particularly suitable for modelling the early-life stage distribution of several fish species (papers I-V). Many fish species utilise different habitats at different life-stages and this thesis shows how the distribution of eggs (paper II), larvae (paper III) and juveniles (paper I, IV and V) are related to specific habitat characteristics. The earliest life-stages of fish are often the most sensitive to environmental conditions, suggesting that habitat availability and quality influences fish population dynamics (Juanes 2007, paper V). A first step towards understanding functional habitat dependence (e.g. Mumby et al. 2004) in a spatially explicit context requires a characterisation of life-stage specific habitat use and species-environment relationships.
Paper I investigated juvenile flatfish habitat characteristics in the Baltic Sea by relating newly settled flounder and turbot distributions to environmental characteristics. In addition, we assessed the relative importance of biotic and abiotic determinants on a regional scale. Biotic variables included prey biomass and the occurrence of a potential competitor. Abiotic variables included depth, salinity, substrate, turbidity, wave exposure, filamentous algae and habitat structure. Both biotic variables were excluded in the model selection process, which was based on the Akaike information criterion (Akaike 1974), suggesting that abiotic variables are more important at the studied scale of tens of kilometres. Similarly, in northern rock sole in Alaska, Stoner et al. (2007) showed that biological variables were related to smaller spatial scales and that variation in physical variables were more important at scales of tens of kilometres.
The northern Baltic proper constitutes the edge of flounder and turbot distribution, due to the low salinity in the north (Nissling et al. 2002). Compared to marine populations, spawning takes place closer to shore and both flounder and turbot have demersal eggs (Nissling et al. 2002, Nissling et al. 2006). Still, most of the abiotic variables in the final models (Figure 4 in paper I) supported earlier findings from other areas. Both species preferred sand and gravel over soft and stony bottoms and reacted negatively to increased cover of filamentous algae. A positive effect of turbid waters
22
was shown for turbot, which could be a trade-off between feeding strategy and predation risk. Flounder was positively related to salinity, wave exposure and habitat structure. Since complex habitats can reduce flatfish predation risk (Wennhage 2002), the preference for habitat structure may be an adaptation to reduce predation risk.
The aim of paper II was to examine habitat preference of a substrate spawning fish and the potential for modelling spawning habitat distributions. At the larger scale (103 to 105 m), sites with registered spawning had a higher temperature than sites with no egg strands. At the fine scale within sites, (101 to 102 m), littoral areas provided more suitable temperatures than the central parts of the sites. Spawning substrate, on which the gelatinous egg strand can be attached, was the most important predictor variable. Substrates providing rigidity and structural complexity were generally selected and the common reed Phragmites australis was the preferred vegetation species, although other substrates were readily available. In addition, shallow and sheltered areas were positively related to the occurrence of egg strands. These two variables together corresponded to half of the variation explained in the model (Figure 2 in paper II), suggesting a strong potential for predictive distribution modelling of recruitment habitats of substrate-spawning fish. Similarly, habitat specialists and fish species with narrower environmental ranges provide models that are more accurate than generalist species (Grenouillet et al. 2010).
Paper III related the distribution of pike and roach larvae to a few structuring environmental variables and showed that both species are mainly found in low saline and turbid waters. Salinity can have a direct physiological effect on osmosis and roach is more sensitive to increased salinity than pike (Klinkhardt and Winkler 1989, Jacobsen et al. 2007), which may positively influence roach recruitment with the expected climate change (Härmä et al. 2008). Also, the range in Secchi depth differed between species, with roach demonstrating a narrower ‘presence-window’ than pike. The predicted distribution of suitable recruitment habitats in the turbid, low saline waters of the inner and middle archipelago areas also corresponded to the distribution of one summer old juveniles of the two species (Figure 2 in paper III). Since adult life-stages utilise the entire archipelago gradient (Ådjers et al. 2006), these results also highlight a potential source-sink dynamic of life-stage dependent habitat use.
Juvenile habitat characteristics of perch, pike, pikeperch and roach were investigated in papers IV and V. Although there were differences in the responses to a proxy variable for Secchi depth, all species preferred sheltered, shallow areas and their predicted distributions essentially overlapped (Table 1 in paper IV). In general, the importance of local environmental characteristics for juvenile fish community composition will depend on the regional setting, i.e. the archipelago zone (Snickars et al. 2009). Pikeperch is commonly considered to be favoured by eutrophic

23
conditions (Lehtonen et al. 1996) and the juvenile distribution has been shown to overlap with cyprinids along a water clarity gradient (Sandström and Karås 2002). In comparison, for bays and inlets of varying isolation, roach and perch distribution commonly clustered together when compared to a wider range of habitat types (Snickars et al. 2009).
Distribution modelling By statistically relating the distribution of species to environmental descriptors, maps of the same environmental layers can be used to predict the probability of occurrence or abundance of the species (Elith and Leathwick 2009). Yet little is known on the generality and transferability of models between areas. Paper III tested how species distribution models constructed in a training area performed when used to predict distributions in a testing area, as well as the opposite, i.e. constructing models in the testing area and predicting the habitat distribution in the original training area. By sampling pike and roach larvae in two archipelago regions over a period of three years, we showed that distribution models can be successfully transferred to another area. However, transferability of distribution models was dependent on the range of the environmental predictor variables and our results highlight the importance of capturing the full environmental gradients. We emphasized that special attention needs to be given to potentially false absences and the environmental presence range in the different areas. Similarly, Randin et al. (2006) showed species-specific asymmetry in transferability of models between alpine regions, probably due to differences in environmental range. For models based on incomplete environmental gradients, i.e. when sampling does not extend outside the presence range of the species, the predictive capability outside the calibrated range may be negatively affected by the tails of the response curves (Thuiller et al. 2004). A suitable approach was presented by Graf et al. (2006), where pooling of multi-region data resulted in high predictive performance in independent regions.
Uncertain absences along the environmental gradients can have several reasons (Lobo et al. 2010), e.g. if the sampling technique is unspecific or detectability is low due to rarity in the response organism. In some instances, information on presences may be the only available or reliable data, and then presence-only techniques may be used to model the distribution (Elith et al. 2006). One might claim that using presence-only methods should result in decreased performance since the information in the absences is not included in the modelling process. However, similar to the approach of assessing sample size in paper I, an evaluation of presence-only techniques showed that Maxent (Phillips and Dudík 2008) was a superior method and could produce reliable models with samples sizes as low as 10 presence localities

24
(Hernandez et al. 2006). The most comprehensive comparison of modelling techniques so far showed that novel methods, e.g. boosted regression trees (De'ath 2007), multivariate adaptive regression splines (Friedman 1991) and maximum entropy (Maxent), generally outperformed more commonly used techniques (Elith et al. 2006). However, it should be noted that the techniques perhaps most often used, generalised additive models, also ranked high, and that its performance has equalled that of multivariate adaptive regression splines when examining the distribution of freshwater fish in relation to environment (Leathwick et al. 2006). Additionally, the use of random pseudo-absences, as is required for most presence-only techniques, may reduce modelling performance compared to absences obtained from relevant areas, e.g. where intensive field campaigns have not rendered any presence localities (Lobo 2008). A comparison between the environmental characteristics of perch spawning habitats obtained with generalised additive models (paper II) and Maxent (paper V) showed similar responses to depth and wave exposure (Figure 2 in paper II and supporting information paper V), even though there were slight geographic and temporal differences between datasets. Many modelling techniques should produce similar results, especially when the environmental signal is strong (Elith and Graham 2009).
Applied habitat science and fish ecology Science can inform us about the functioning of ecosystems and plays a major part in policy development (Österblom et al. 2010). National and international commitments set goals for the management of our seas and the feedback loop from scientific advice to management requires that the performance of management actions is scientifically evaluated. In this context, science needs to develop, and apply, appropriate methods that can evaluate the state of an ecosystem, allowing well-founded management decisions. On a European level, several legal frameworks guide nature conservation and applied marine science, e.g. the European Union Habitats Directive (92/43/EEC), Water Framework Directive (2000/60/EC) and the more recent Marine Strategy Framework Directive (2008/56/EC). The directives are realised in international regional sea conventions such as the Oslo-Paris convention (OSPAR) covering the North-East Atlantic and the Helsinki commission (HELCOM) covering the Baltic Sea. Under the Habitats Directive, a favourable conservation status of selected habitat types and species should be maintained or restored within a European wide ecologically coherent network of protected areas (the Natura 2000 network). Assessing ecological coherence has, however, proven difficult, mainly due to lack of detailed information on the distribution of habitats (Ardron 2008a). In paper IV we assessed two important components of ecological
25
coherence, representativity and connectivity, of the European Natura 2000 network with respect to a coastal fish species assemblage and associated habitats in the archipelago region of the northern Baltic Sea. Representativity is a measure of the proportion of each conservation feature that is protected, and can be assessed at different scales. Connectivity is dependent on the spatial distribution of protected and unprotected components and how they are interrelated (Ardron 2008b). The spatially explicit analyses showed that both representativity and connectivity of the protected area network was poor. Of the 30 000 km2 study area, 3.5% of the assemblage recruitment habitat was currently protected and 48% of the potentially connected habitats were included in the network, well below the goals of 10-50% and 100% respectively (Ardron 2008b). By providing maps of features with high conservation value, the assessment also revealed geographical areas where the network should be improved to increase the ecological coherence with regard to the studied fish assemblage (Figure 2 and 3 in paper IV). As more distributional information on fish and other organisms becomes available, these types of assessments can be continuously updated under an adaptive management that integrates nature conservation and marine resource management.
Studies that integrate habitat science and fisheries management are however largely lacking (Rice 2005, Armstrong and Falk-Petersen 2008). This probably reflects the traditional separation of fisheries management and nature conservation, as well as a limited knowledge about fish habitat distribution (papers I-III). Many fish species display ontogenetic habitat shifts and as shown in paper III, with juvenile habitats in the inner coastal areas and adults more widely distributed, this may create a spatial mosaic with potential source-sink dynamics. Potential habitat bottlenecks for fish population sizes were investigated in paper V, by using distribution models to map early life stage specific habitat availability. In a 40 000 km2 area, habitat availability for two early life stages of Eurasian perch, as well as fishing pressure, were related to the density of twelve spatially separate populations. We used the availability of recruitment habitats, which encompass both spawning and larval habitats since the larvae remain in close vicinity of the spawning areas (Karås 1996), and the availability of juvenile habitats, i.e. one summer old fish, since they utilise different resources and habitats (Thorpe 1977). The availability of recruitment habitats explained >60% of the variation in adult fish population size (Figure 2 in paper V). Juvenile habitat availability was not related to adult density and there was no effect of commercial and recreational fishing pressure. The strong relationship between the availability of recruitment habitats and adult population sizes may be explained by resource competition and/or predation as density dependent mechanisms regulating survival. In the Baltic Sea coastal zone, vegetated areas contain higher abundances of zooplankton (Kallasvuo et al. 2009) and starvation at the onset of exogenous feeding has
26
been suggested as critical for perch recruitment (Nilsson et al. 2004, Ljunggren et al. 2010). However, the potential role of predation in limiting recruitment habitat productivity can not be excluded (Nilsson 2006). Understanding the mechanisms that regulate recruitment is one of the largest questions in fish and fisheries science and although the exact mechanism remains unclear, these results highlight its spatial component and provide an empirical example how stage-specific habitat availability can be used to detect habitat bottlenecks limiting fish population size.
Critical dependencies on specific habitat types have also been shown in coral reef and mangrove systems (Doherty and Fowler 1994, Mumby et al. 2004), which are distinct and easily mapped habitats. The habitats of most species are, however, defined by continuous environmental gradients, and mapping life-stage specific habitat distributions will require the use of species distribution modelling.
Recognizing habitat importance for fish population sizes emphasizes the use of marine protected areas and habitat remediation for maintaining viable fish stocks under an ecosystem based management (Thrush and Dayton 2010). However, predicting the effects of changes in habitat availability may prove difficult due to ecological processes, such as trophic cascades (Eriksson et al. 2009).
The strong relationship between recruitment habitat availability and population size shows the importance of a spatial habitat component in population dynamics. This calls for the inclusion of habitat effects when assessing population dynamics in habitat shifting species. Interestingly, by using time series data and variation in life-stage specific abundance, population size bottlenecks during settlement have also been hypothesized for flatfish species (Iles 1994, Iles and Beverton 2000). By defining nursery habitats as the coastal zone with specific substrates and depth, and adult grounds as the sea area between 0 and 40 m depth, the size of the nursery ground available per stock has been related to the stock size in sole (Rijnsdorp et al. 1992). A similar approach, i.e. defining nursery habitats as soft sediments less than one meter water depth, was adopted by Wennhage et al. (2007), which allowed calculations of regional contribution to the fishable stock. The increased precision of species distribution modelling for quantitatively estimating habitat distributions could be expected to aid these types of assessments.
With the exception of negative impacts of fishing gear on habitat quality, e.g. trawling impacts on soft bottom habitats (Jennings and Kaiser 1998), few studies integrate habitat and fisheries science. Scientific advice for fisheries management has traditionally been based on stock-recruitment functions that describe average productivity at varying stock levels (Ricker 1954, 1958). Although seldom valid in a longer time frame (Myers 1998), deviations from the expected stock-recruitment functions have been related to environmental conditions, indicating a critical life-stage dependent on
27
specific habitat characteristics (Beaugrand et al. 2003, Köster et al. 2003). As shown in paper V, fish population sizes can be related to spatially explicit estimates of habitat availability. For commercially, more heavily exploited species estimates on habitat size can standardize (Myers 2001) and help reduce uncertainty in parameters of the stock-recruitment function (Mantzouni et al. 2010). For understanding fish population dynamics, an integration of environmental and ecosystem effects is necessary (Möllmann et al. 2008, Casini et al. 2009). In the coastal zone, a spatially explicit approach should be beneficial since all interactions will be a question of where, and the unifying role of habitat has the potential to bring together multiple disciplines in an integrated management (Rice 2005).
Changing climatic conditions has altered patterns of abundance and distribution of several fish populations, and related changes in recruitment success at a critical life-stage has preliminary been suggested as a possible mechanism for these shifts (Rijnsdorp et al. 2009). A future challenge for scientific advice for management will include an understanding of the effects of changing climate on critical habitat productivity and distribution (Lindegren et al. 2010). In a spatial modelling context, it may be tempting to shift current environmental constraints according to expected changes. However, solely relying on climate-envelope approaches can be misleading if species interactions change with climate or if current distributions are caused by source-sink dynamics (Davis et al. 1998). Using lagomorphs (rabbits and hares), Anderson et al. (2009) showed how second-generation bioclimatic models can include metapopulation dynamics and spatially explicit climate change predictions. A way toward understanding species responses to climate change may also be the integration of spatial and dynamic population models that can incorporate a mechanistic understanding of a species niche (Keith et al. 2008, Huntley et al. 2010). These types of models are however data intensive, which may create problems for species whose life history is not well studied or where sufficient detail in the necessary GIS environmental layers are lacking. Although ensemble modelling could be of interest in this context, as it can spatially depict areas of high agreement by using multiple model runs (Grenouillet et al. 2010), future management challenges will include a solid understanding of species distributions. As this thesis has shown, species distribution modelling provides a framework for exploring species-environment relationships that can be used to spatially characterize life-stage specific habitats, as well as their role in evaluating management actions and importance for fish population sizes.

28
Conclusions and perspectives
This thesis has focused on the distribution of species in relation to environment and habitat. Using statistical modelling techniques to capture species-environment relationships, both small and large-scale distribution patterns have been explored. Studying species-environment relationships and the distribution of habitats is important for increasing our understanding of limitations to fish population sizes, as well as for evaluating and informing management decisions, e.g. the construction of networks of marine protected areas.
This thesis has shown that the earliest life stages of both marine and freshwater fish species in the coastal areas of the Baltic Sea utilise different habitats characterised by specific environmental conditions. Further, it was shown that species distribution modelling provides a suitable tool for mapping essential fish habitat distributions and studying their influence on population sizes, as well as evaluating management actions aimed at habitat conservation. The results show that species-environment relationships can be used to map life-stage specific habitat distributions of fish. These relationships, together with high resolution environmental data, can support the identification of essential fish habitats limiting population sizes. The availability of life-stage specific habitats thus provides an important component for understanding fish population dynamics. With continued habitat loss there is a need for identifying habitats that are essential for sustaining fish populations, allowing well informed management prioritizations of protected areas. Effective tools for assessing where protection can be most useful are needed for marine spatial planning that integrates multiple activities. Including anthropogenic pressures in studies of species-environment relationships can also help our ability to integrate different activities in the planning process. As called for by the European Union Marine Strategy Framework Directive, distribution modelling of ecosystem components combined with anthropogenic pressures in a spatially explicit context is necessary for an ecosystem-based management of human activities (2008/56/EC).
Although the future development of ecological systems is unobservable and hence difficult to study, an integration of predictive modelling approaches with ecological scenario analyses provide an interesting future direction for exploring how ecosystems are expected to respond to changes in management and policy goals (Coreau et al. 2009). The spatially explicit

29
nature of species distribution modelling makes it a suitable toolbox for exploring various scenario analyses. Additionally linking ecosystem functions and services provided by the features being modelled also has the ability to increase the applied value of ecological research (Sanchirico and Mumby 2009). This can be illustrated with a specific example. Since recruitment habitat availability is related to adult population size (paper V) it is theoretically possible to predict fish production. Predatory fish generate a suite of goods and services, e.g. food, trophic control and reduced eutrophication (Eriksson et al. 2009), that can then be visualised on maps. Alternative scenarios on the future development of the coastal zone, e.g. habitat loss/remediation or changes in environmental conditions, can also be explored. In a longer time perspective, as environmental background layers and modelling techniques develop, a spatially explicit incorporation of multiple trophic levels generates an interesting vision of an increased understanding and predictability of whole ecosystem dynamics. However, several issues need to be resolved along the way. A fuller understanding of species-environment relationships requires an assessment of spatial and temporal interrelationships between environmental variables, i.e. what are the relationships among different environmental variables and which are governing the distribution of various organism groups? Satellite imagery and oceanographic modelling may be used for this purpose. Additionally, remotely sensed data may also be used to enhance the resolution and precision of the background environmental layers necessary for distribution modelling (e.g. Valavanis et al. 2008).
Acknowledgements I thank Ulf Bergström, Peter Eklöv and Alfred Sandström for helpful comments on this thesis. This thesis was made under the auspices of The Swedish Board of Fisheries, Institute of Coastal Research and their support is acknowledged.
30
Summary in Swedish (Sammanfattning)
Bakgrund och relevans Den rumsliga fördelningen av organismer har skapats av flertalet ekologiska processer. Studier av utbredningsmönster och hur de påverkas av olika miljövariabler har en lång tradition inom ekologin. Vissa arter är väldigt starkt knutna till specifika miljöförhållanden medan andra uppvisar mer generella preferenser. Hos många fiskar är de tidigaste livsstadierna (ägg, larver och årsyngel), också de mest känsliga, vilket gör de mer beroende av lämpliga livsutrymmen. Dessa livsutrymmen kallas habitat och kan karaktäriseras av olika miljöförhållanden, till exempel temperatur, djup och vågexponering. Habitatbegreppet kan också inkludera biologiska karaktäristika, som skydd för predatorer (rovdjur), olika resursnivåer (födotillgång) samt konkurrens mellan och inom arter. Även om forskningen om styrande faktorer bakom utbredningen av arter och habitat har kommit väldigt långt så saknar vi fortfarande mycket kunskap. En konsekvens av detta är att det också saknas kunskap om betydelsen av olika habitat för fiskpopulationers storlek och dynamik.
Liksom många kustområden runt om i världen är Östersjöns skärgårdar utsatta för påverkan. Dels från storskaliga miljöförändringar som övergödning och klimateffekter, men också från lokal påverkan som båttrafik, hamnar, muddringar och strandnära bebyggelse, vilket kan leda till konflikter om utrymme mellan nyttjande- och bevarandeintressen. Ur ett förvaltningsperspektiv talas det om marin rumslig planering, vilket innebär att olika aktiviteter kan tilldelas specifika områden. Det bör påpekas att alla aktiviteter inte behöver vara uteslutande och i många fall kan områden samtidigt nyttjas av flera aktörer. En förutsättning för en effektiv rumslig planering, som tar hänsyn till flera komponenter i ekologiska system, är kännedom om utbredningen av särskilt viktiga habitat.
Östersjöns skärgårdsområden består av tiotusentals öar vilket skapar en rumslig mosaik av olika miljögradienter, där djup, substrat och andra variabler varierar på både liten och stor skala. Att genom fullständiga inventeringar kartera utbredningen av olika arter och livsstadier skulle medföra alltför stora kostnader, både i tid och i pengar. Rumslig modellering, där specifika art-miljörelationer används för att räkna om kartor över olika miljögradienter till kartor över fiskförekomster, har en stor potential att effektivt samla in för förvaltningen relevant information.

31
Samtidigt kan sådan fältbaserad kunskap av utbredningsmönster ge ekologisk insikt om bakomliggande drivande processer.
Syfte För att förbättra vår kunskap om utbredningen av olika fiskarters habitat och dess betydelse för fiskpopulationers dynamik har den här avhandlingen berört tre huvudsakliga ämnen.
Primärt har flertalet arter undersökts med avseende på olika miljövariablers betydelse för utbredningen av livsstadiespecifika habitat. Starka miljögradienter på både liten och stor rumslig skala förväntades påverka habitatval för lek, larver och årsyngel hos arter som abborre, gädda, gös, mört, skrubbskädda (flundra) och piggvar. Sådana beskrivningar kan sedan ligga till grund för rumslig modellering av dessa habitat.
Rumslig modellering av arters utbredning är ett förhållandevis nytt fält och utvecklingen har gått fort framåt. Således har också möjligheter och begränsningar för storskalig rumslig modellering av de habitat dessa arter och livsstadier nyttjar undersökts. Mer specifika frågor som har beaktats har varit i) betydelsen av olika habitatvariabler, som miljö kontra biologiska interaktioner, ii) om modeller byggda i ett område kan flyttas till ett annat område och iii) om generella utbredningsmönster kan beskrivas med ett fåtal drivande miljövariabler.
Slutligen har också rumsliga modeller applicerats på ekologiska och förvaltningsinriktade frågeställningar.
Resultat De starka miljögradienterna i Östersjöns kustområden möjliggjorde storskalig kartering av utbredningsmönster och habitatval för flera fiskarters tidiga livsstadier.
I studie I undersöktes habitaten för årsyngel av Östersjöns två plattfiskarter, skrubbskädda och piggvar. När larver av dessa arter metamorfoserar och alltmer börjar likna de fullvuxna fiskarna uppehåller de sig vid kusten. Dessa kustnära habitat undersöktes med avseende på ett flertal miljövariabler samt resurstillgång och betydelsen av en potentiell konkurrent. Både arterna föredrog sand framför andra typer av substrat och fintrådiga alger hade en negativ effekt på förekomsten. Övriga skillnader i miljövariabler, som vågexponering, salthalt och mängden strukturformande vegetation och sten, var artspecifik och kunde tillskrivas predationsrisk (risken att bli uppäten) och skillnader i födosöksstrategier. Både resurstillgång och förekomsten av en potentiell konkurrent visade sig endast ha en liten inverkan på habitatvalet hos dessa arter, vilket tyder på att det

32
framförallt är miljögradienter som påverkar utbredningen av årsyngel av plattfisk på regional skala i Östersjöns kustområden.
I studie II undersöktes habitatval hos lekande abborre, som är den dominerande arten i Östersjöns kustområden (Ådjers et al. 2006). I likhet med de flesta varmvattenfiskar leker abborren på våren när temperaturen i vattnet stiger och honan fäster vanligtvis en geléaktig romsträng på tillgängligt substrat (Thorpe 1977). Genom att samla in data från Kalmar i söder, till Uppland i norr och Åland i öster kunde detaljerad kunskap om specifika karaktärer som påverkar habitatets kvalitet tas fram. Sett över hela vårsäsongen sker leken i skyddade, grunda och varma områden med styv och strukturbildande vegetation. Val av lekområde skedde på både stor och liten skala. Vikar med romsträngar hade en något högre vattentemperatur än vikar utan romsträngar och inom vikar var temperaturen högre längs med stranden jämfört med de centrala delarna. Vass var den viktigaste vegetationstypen för abborrens lekval. Andra former av leksubstrat som föredrogs var kärlväxter, i huvudsak borstnate, samt i viss utsträckning även brunalgen blåstång. Eftersom denna substratlekande fisk uppvisade väldigt specifika habitatkrav och två av de miljövariabler som användes för att förklara utbredningen är tillgängliga som heltäckande kartor, kunde vi dra slutsatsen att förutsättningarna för storskalig modellering av lekområden för abborre är goda.
Studie III syftade till att beskriva mört- och gäddlarvers habitat samt att testa hur rumsliga modeller byggda i ett område kan prediktera förekomsten av fisk i ett annat, nytt område. Studien utfördes i två delområden i det finska Skärgårdshavet och relaterade tre storskaliga miljögradienter, siktdjup, salthalt och vågexponering, till förekomsten av de båda arternas larver. Larver av både mört och gädda återfanns i de inre skärgårdsområdena som karaktäriseras av lägre salthalt och siktdjup. Denna studie visade att det går att flytta modeller till ett nytt område, men att hänsyn behöver tas till hur generella modellerna är och hur långa miljögradienterna är i de båda områdena. Liknande resultat har visats av Grenouillet et al. (2010), som visade att arter med snävare miljökrav ger mer precisa modeller än generalistarter. Vidare visades att utbredningen av de predikterade larvhabitaten till stor del sammanföll med utbredningen av årsyngel, vilket indikerar att dessa arter är relativt stationära under den första sommaren. När de blir större återfinns dock båda arterna längs hela skärgårdszonen (Ådjers et al. 2006), vilket skulle visa på en rumslig dynamik där den inre delen av skärgården fungerar som källa för ytterområdena.
Forskningen är en viktig del för att förstå hur ekosystem fungerar och för att ge underlag till förvaltningen av våra gemensamma marina resurser så att den kan bygga på välinformerade beslut. Förutom nationell lagstiftning finns det på europeisk nivå flera direktiv som dirigerar naturvården och det behövs verktyg för att både ge råd till förvaltningen och för att utvärdera genomförda åtgärder. En sådan åtgärd är inrättandet av ett marint nätverk av

33
skyddade områden, kallat Natura 2000-nätverket. Syftet med detta nätverk är att långsiktigt bevara särskilda livsmiljöer så att de enskilda skyddade områdena kan samverka och därmed göra större gemensam nytta. Flera av de habitattyper som omfattas av skyddet i Natura 2000-nätverket är också viktiga för fisk eftersom många arters yngel är starkt kopplade till dessa livsmiljöer. I studie IV modellerades lek- och uppväxtområden för abborre, gädda, gös och mört i skärgårdsområdet mellan Stockholm-Uppsala och Finland, inklusive Åland. Genom att ta fram nya analysverktyg visade den studien att endast en liten andel av tillgängliga lek- och uppväxtområden för dessa arter är skyddade i dagsläget och att avstånden mellan skyddade områden ofta är för långt för att arterna ska kunna sprida sig effektivt inom nätverket. Den kartbaserade analysen kunde också peka ut var framtida marina skyddsområden bör placeras om man vill stärka det befintliga nätverket med avseende på dessa viktiga kustfiskarter.
Slutligen har den här avhandlingen visat på betydelsen av tillgången på livsstadiespecifika habitat för mängden stor fisk (studie V). Detta gjordes genom att tillgången på habitat för lek och årsyngel av abborre relaterades till 12 olika bestånd där mängden stor fisk varierade. Resultaten visade att ju mer lekområden det fanns tillgängligt, desto mer stor fisk fanns det. Det må låta banalt, men eftersom det tidigare har varit svårt att kartera fiskars habitat har sådana samband varit svåra att visa. Det var däremot ingen koppling mellan mängden habitat för årsyngel och mängden stor fisk. Någon effekt av fisketryck kunde inte heller hittas. Dessa resultat är ett starkt argument för områdesskydd, eftersom det antyder att bevarandet av lekhabitat kan tillse att det finns gott om stor fisk. Det har dock visats att om man minskar mängden stor abborre kan det ha negativa effekter på lekhabitatets kvalitet, eftersom stora abborrar kontrollerar mängden fiskar som äter betare, vilka i sin tur kontrollerar att mängden fintrådiga alger inte blir för stor (vilket förväntas försämra kvaliteten på habitatet; Eriksson et al. 2009). Sådana typer av interaktioner gör det svårt att förutse effekterna av olika förvaltningsbeslut och det är där som vidare forskning kan bidra med en ökad förståelse av hur Östersjöns kustområden fungerar.
Sammanfattning och slutsatser Den här avhandlingen har behandlat utbredningsmönster hos fiskar i Östersjöns kustområden i förhållande till miljögradienter. Med modern rumslig modelleringsteknik har art-miljörelationer på både stor och liten skala utforskats. Sådan kunskap är av betydelse för en ökad förståelse för fiskpopulationers dynamik och för att utvärdera och ge råd till förvaltningen.
Den här avhandlingen har visat att de tidigaste livsstadierna, ägg, larver och årsyngel, hos både marina och sötvattensfiskar i Östersjöns kustområden använder olika habitat som kan karaktäriseras av specifika

34
miljöförhållanden. Vidare visades det att rumslig modellering är ett användbart verktyg för att förstå utbredningen av kritiska fiskhabitat och deras betydelse för fiskpopulationers dynamik, samt för att utvärdera förvaltningsåtgärder riktade mot naturvård.
Eftersom kusten är fortsatt utsatt för direkt och indirekt påverkan finns det en risk att habitat försämras och förloras. Därför behöver vi en ökad förståelse av vilka habitat som är särskilt viktiga för fisk och effektiva verktyg som kan identifiera var dessa områden finns.

35
Acknowledgements
First of all I want to thank my supervisors. Especially Ulf, you have been an inspiration. You always took the time, even when you really didn’t have any. You have shown an excellent mix of gentle guidance whilst allowing me to explore my own ideas. It has truly been an enjoyable and learning experience. Alfred, you got me started on this path and I appreciate your eye for details and broad knowledge on whatever discussion, showing that there are always much more questions to be asked. Peter, thank you for accepting me at Limno when we knocked on your door and making me feel welcome in the group. It gave me different perspectives and broadened my horizon.
Since I’ve been simultaneously at two great places, Kustlab and Limno, there are of course a lot of people I have enjoyed meeting and getting to know. But let me start with Kustlab, and Öregrunds very own version of “rövarna i Kamomilla stad” – Lars, Affe och Uffe – it wouldn’t have been the same without you. Thank you for believing in the gis-guy from Stockholm and for luring me in with the field sampling of -04. Trälkarl crew; Magnus, Sven, Ulf and Kapten Lars Haddock - maybe it’s hard to believe but rowing a big heavy boat around Gräsö island for two days, only stopping to party and drink whisky, was more fun than I thought – at least it was afterwards. Also, the annual, highly prestigious, pike fishing competition helped keep focus on important issues. Much effort has been put on not winning the biggest trophy of them all – Årets snipjägare! Thank you Lars, Anders, Magnus, Alfred, Ulf, Gustaf, Anssi, Pontus, Landros and those I probably forgot. Even though some of the participants are still in Öregrund, I thought the pikes would be a lot safer now... Or at least until I met Olavi and Didzis, good work and thanks for the whisky! It was nice of the other guys to let us win don’t you say. I want to mention the rest of the Bergström family, whom have been very generous and welcoming, and letting me stay over on several occasions. Not only when there’s been parties, which there have been - Anne has showed us how to properly eat crayfish, Sven-Gunnar how to eat oysters, Sara how to dance, Magnus H how to eat surströmming, Maria B et al how to eat cormorant, Johan how to scream and all of Kustlab how to enjoy ourselves. Too many to name but I appreciate meeting all of you, I really have. Anna, I have appreciated our discussions, and Anders, it’s always fun talking to you. Jens, you’re hard to get rid of, but at least in Öregrund you didn’t have to share a room with me…I’ll see you around. The old music group Just D had a song that was called “Min boss har en boss

36
som också har en boss” – Peter, Teija & Magnus (samt Ingemar och (Bengt/)Axel) tack för att jag fått jobba med min avhandling.
Limnology also knows how to have fun – EDLA, Christmas and in between. Such devotion to masquerades, dancing, golden awards and predictive quizzes I’ve never seen, it’s nice. Thank you Lars, Eva, Anna, Peter, Richard, Janne, Stefan and all other former and current limnologists for a nice atmosphere, although I’m brackish there’s a little limnologist in me too now. My fellow PhD-students also deserve credit for this. You are warm and friendly people and although I haven’t been here fulltime I’ve felt welcome. I have enjoyed getting to know you. Pia und Philipp vielen Dank dass Sie gut gewesen Mitbewohner. Für diejenigen von ver, die verstehen, hat es ein Vergnügen gewesen, Deutsch zu lernen.
I want to extend a few words of appreciation also to other partners in crime; Johan and Gustav – thank you for data and good discussions, now I know the real source of all life. Also, I’m glad you have started using more explosives. This thesis would not have been the same and it wouldn’t have been as much fun without good support from across the water – thank you Martin S, Meri, Johanna, Antti, Lauri, Stefan, Mikael and all others not mentioned. I have also received good support from the really applied side, it’s nice to hear that my work has been appreciated. Stig, you are included here. Martin I, I’m really glad you wrote the software WaveImpact. In that sense you’ve played a big part in this thesis and I look forward to our future collaboration. Somehow it seems appropriate.
Lastly I want to thank my family for encouraging me to pursue my interests, be curious and have fun. I know you are proud of me, but know that this would not have been possible without your support. Anna, my wife, you make me happy and give me energy. Your love and support carry me onward. I know this last stretch has been tough and now I look forward to what’s to come.

37
References
Airoldi, L., and M. W. Beck. 2007. Loss, status and trends for coastal marine habitats of Europe. Oceanography and marine biology: An annual review 45:345-405.
Akaike, H. 1974. A new look at the statistical model identification. IEEE transactions on automatic control 19:716-723.
Allouche, O., A. Tsoar, and R. Kadmon. 2006. Assessing the accuracy of species distribution models: prevalence, kappa and the true skill statistic (TSS). Journal of Applied Ecology 43:1223-1232.
Anderson, B. J., H. R. Akçakaya, M. B. Araújo, D. A. Fordham, E. Martinez-Meyer, W. Thuiller, and B. W. Brook. 2009. Dynamics of range margins for metapopulations under climate change. Proceedings of the Royal Society B: Biological Sciences 276:1415-1420.
Araújo, M. B., and R. G. Pearson. 2005. Equilibrium of species' distributions with climate. Ecography 28:693-695.
Araújo, M. B., and P. H. Williams. 2000. Selecting areas for species persistence using occurrence data. Biological Conservation 96:331-345.
Ardron, J. A. 2008a. The challenge of assessing whether the OSPAR network of marine protected areas is ecologically coherent. Hydrobiologia 606:45-53.
Ardron, J. A. 2008b. Three initial OSPAR tests of ecological coherence: heuristics in a data-limited situation. ICES Journal of Marine Science 65:1527-1533.
Armstrong, C. W., and J. Falk-Petersen. 2008. Habitat - fisheries interactions: a missing link? ICES Journal of Marine Science 65:817-821.
Bazzaz, F., G. Ceballos, M. Davis, R. Dirzo, P. R. Ehrlich, T. Eisner, S. Levin, J. H. Lawton, J. Lubchenco, P. A. Matson, H. A. Mooney, P. H. Raven, J. E. Roughgarden, J. Sarukhan, D. G. Tilman, P. Vitousek, B. Walker, D. H. Wall, E. O. Wilson, and G. M. Woodwell. 1998. Ecological Science and the Human Predicament. Science 282:879.
Beaugrand, G., K. M. Brander, J. A. Lindley, S. Souissi, and P. C. Reid. 2003. Plankton effect on cod recruitment in the North Sea. Nature 426:661-664.
Bergström, U., G. Englund, and E. Bonsdorff. 2002. Small-scale spatial structure of Baltic Sea zoobenthos - inferring processes from patterns. Journal of Experimental Marine Biology and Ecology 281:123-136.
Bonsdorff, E., E. M. Blomqvist, J. Mattila, and A. Norkko. 1997. Coastal eutrophication: causes, consequences and perspectives in the archipelago areas of the northern Baltic Sea. Estuarine, Coastal and Shelf Science 44:63-72.
Casini, M., J. Hjelm, J.-C. Molinero, J. Lövgren, M. Cardinale, V. Bartolino, A. Belgrano, and G. Kornilovs. 2009. Trophic cascades promote threshold-like shifts in pelagic marine ecosystems. Proceedings of the National Academy of Sciences of the United States of America 106:197-202.
Casini, M., J. Lövgren, J. Hjelm, M. Cardinale, J.-C. Molinero, and G. Kornilovs. 2008. Multi-level trophic cascades in a heavily exploited open marine ecosystem. Proceedings of the royal society B 275:1793-1801.
38
Chase, J., M., and M. Leibold, A. 2003. Ecological niches: Linking classical and contemporary approaches. The University of Chicago Press, Chicago and London.
Cohen, J. 1960. A coefficient of agreement for nominal scales. Educational and Psychological Measurement 20:37-46.
Coreau, A., G. Pinay, J. D. Thompson, P. O. Cheptou, and L. Mermet. 2009. The rise of research on futures in ecology: rebalancing scenarios and predictions. Ecology Letters 12:1277-1286.
Davis, A. J., L. S. Jenkinson, J. H. Lawton, B. Shorrocks, and S. Wood. 1998. Making mistakes when predicting shifts in species range in response to global warming. Nature 391:783-786.
De'ath, G. 2007. Boosted trees for ecological modeling and prediction. Ecology 88:243-251.
DeLeo, J. M. 1993. Receiver operating characteristic laboratory (ROCLAB): Software for developing decision strategies that account for uncertainty. Pages 318-325 in Uncertainty Modeling and Analysis, 1993. Proceedings., Second International Symposium on, College Park, MD, USA.
Doherty, P., and A. Fowler. 1994. An empirical test of recruitment limitation in a coral reef fish. Science 263:935-939.
Eklöv, P. 1997. Effects of habitat complexity and prey abundance on the spatial and temporal distributions of perch (Perca fluviatilis) and pike (Esox lucius). Canadian Journal of Fisheries and Aquatic Sciences 54:1520-1531.
Elith, J., and C. H. Graham. 2009. Do they? How do they? WHY do they differ? On finding reasons for differing performances of species distribution models. Ecography 32:66-77.
Elith, J., C. H. Graham, R. P. Anderson, M. Dudik, S. Ferrier, A. Guisan, R. J. Hijmans, F. Huettmann, J. R. Leathwick, A. Lehmann, J. Li, L. G. Lohmann, B. A. Loiselle, G. Manion, C. Moritz, M. Nakamura, Y. Nakazawa, J. McC. M. Overton, A. Townsend Peterson, S. J. Phillips, K. Richardson, R. Scachetti-Pereira, R. E. Schapire, J. Soberon, S. Williams, M. S. Wisz, and N. E. Zimmermann. 2006. Novel methods improve prediction of species' distributions from occurrence data. Ecography 29:129-151.
Elith, J., and J. R. Leathwick. 2009. Species distribution models: Ecological explanation and prediction across space and time. Annual Review of Ecology, Evolution, and Systematics 40:677-697.
Eriksson, B. K., L. Ljunggren, A. Sandström, G. Johansson, J. Mattila, A. Rubach, S. Råberg, and M. Snickars. 2009. Declines in predatory fish promote bloom-forming macroalgae. Ecological Applications 19:1975-1988.
Eriksson, B. K., A. Sandström, M. Isæus, H. Schreiber, and P. Karås. 2004. Effects of boating activities on aquatic vegetation in the Stockholm archipelago, Baltic Sea. Estuarine, Coastal and Shelf Science 61:339-349.
Fielding, A. H., and J. F. Bell. 1997. A review of methods for the assessment of prediction errors in conservation presence/absence models. Environmental Conservation 24:38-49.
Francis, M. P., M. A. Morrison, J. Leathwick, C. Walsh, and C. Middleton. 2005. Predictive models of small fish presence and abundance in northern New Zealand harbours. Estuarine, Coastal and Shelf Science 64:419-435.
Friedman, J. 1991. Multivariate Adaptive Regression Splines. Annals of Statistics 19:1-67.
Graf, R. F., K. Bollmann, S. Sachot, W. Suter, and H. Bugmann. 2006. On the generality of habitat distribution models: a case study of capercaillie in three Swiss regions. Ecography 29:319-328.

39
Grenouillet, G., L. Buisson, N. Casajus, and S. Lek. 2010. Ensemble modelling of species distribution: the effects of geographical and environmental ranges. Ecography, doi: 10.1111/j.1600-0587.2010.06152.x
Grinnel, J. 1917. The niche-relationships of the Californa Thrasher. AUK 34:427-433.
Guisan, A., T. C. Edwards Jr., and T. Hastie. 2002. Generalized linear and generalized additive models in studies of species distributions: setting the scene. Ecological Modelling 157:89-100.
Guisan, A., and W. Thuiller. 2005. Predicting species distribution: offering more than simple habitat models. Ecology Letters 8:993-1009.
Guisan, A., and N. E. Zimmerman. 2000. Predictive habitat distribution models in ecology. Ecological Modelling 135:147-186.
Hardin, G. 1960. The Competitive Exclusion Principle. Science 131:1292-1297. Hastie, T. J., and R. J. Tibshirani. 1990. Generalized Additive Models. Chapman &
Hall, London. Hernandez, P. A., C. H. Graham, L. L. Master, and D. L. Albert. 2006. The effect of
sample size and species characteristics on performance of different species distribution modeling methods. Ecography 29:773-785.
Huntley, B., P. Barnard, R. Altwegg, L. Chambers, B. W. T. Coetzee, L. Gibson, P. A. R. Hockey, D. G. Hole, G. F. Midgley, L. G. Underhill, and S. G. Willis. 2010. Beyond bioclimatic envelopes: dynamic species' range and abundance modelling in the context of climatic change. Ecography 33:621-626.
Hutchinson, G. E. 1944. Limnological studies in Connecticut. VII. A critical examination of the supposed relationship between phytoplankton periodicity and chemical changes in lake waters. Ecology 25:3-26.
Hutchinson, G. E. 1957. Concluding remarks. Pages 415-427 in Quantitative Biology, Cold Spring Harbour Symposia.
Härmä, M., A. Lappalainen, and L. Urho. 2008. Reproduction areas of roach (Rutilus rutilus) in the northern Baltic Sea: potential effects of climate change. Canadian Journal of Fisheries and Aquatic Sciences 65:2678-2688.
Iles, T. C. 1994. A review of stock-recruitment relationships with reference to flatfish populations. Netherlands Journal of Sea Research 32:399-420.
Iles, T. C., and R. J. H. Beverton. 2000. The concentration hypothesis: the statistical evidence. ICES Journal of Marine Science 57:216-227.
Jacobsen, L., C. Skov, A. Koed, and S. Berg. 2007. Short-term salinity tolerance of northern pike, Esox lucius, fry, related to temperature and size. Fisheries Management and Ecology 14:303-308.
Jennings, S., and M. J. Kaiser. 1998. The effects of fishing on marine ecosystems. Advances in marine biology 34:201-352.
Johnston, T. H. 1924. The relation of climate to the spread of prickly pear. Transactions of the Royal Society of South Australia 48:269-295.
Juanes, F. 2007. Role of habitat in mediating mortality during the post-settlement transition phase of temperate marine fishes. Journal of Fish Biology 70:661-677.
Kallasvuo, M., M. Salonen, and A. Lappalainen. 2009. Does the zooplankton prey availability limit the larval habitats of pike in the Baltic Sea? Estuarine, Coastal and Shelf Science 86:148-156.
Karås, P. 1996. Recruitment of perch (Perca fluviatilis L.) from Baltic coastal waters. Archiv für hydrobiologie 138:99-121.
Karås, P., and E. Neuman. 1981. First year growth of perch (Perca fluviatilis L.) and roach (Rutilus rutilus) in a heated Baltic Bay. Institute of Freshwater Research, Report no 59, Drottningholm.

40
Kearney, M. 2006. Habitat, environment and niche: what are we modelling. OIKOS 115:186-191.
Kearney, M., and W. Porter. 2009. Mechanistic niche modelling: combining physiological and spatial data to predict species' ranges. Ecology Letters 12:334-350.
Keith, D. A., H. R. Akçakaya, W. Thuiller, G. F. Midgley, R. G. Pearson, S. J. Phillips, H. M. Regan, M. B. Araújo, and T. G. Rebelo. 2008. Predicting extinction risks under climate change: coupling stochastic population models with dynamic bioclimatic habitat models. Biology Letters 4:560-563.
Kindström, M., and G. Aneer. 2007. What is happening to our shores? BALANCE Report no. 26. Available at: http://balance-eu.org.
Klinkhardt, M. B., and H. M. Winkler. 1989. Einfluss der Salinität auf die Befruchtungs- und Entwicklungsfähigkeit der Eier von vier Süsswasserfischarten Plötz (Rutilus rutilus), Barsch (Perca fluviatilis), Kaulbarsch (Gymnocephalus cernua) und Zander (Stizostedion lucioperca). Wiss. Z. Universität Rostock. N-Reihe 38:23-30 (in German).
Kozak, K. H., C. H. Graham, and J. J. Wiens. 2008. Integrating GIS-based environmental data into evolutionary biology. Trends in Ecology and Evolution 23:141-148.
Köster, F. W., H.-H. Hinrichsen, D. Schnack, M. A. St. John, B. R. MacKenzie, J. Tomkiewicz, C. Möllmann, G. Kraus, M. Plikshs, A. Makarchouk, and E. Aro. 2003. Recruitment of Baltic cod and sprat stocks: identification of critical life stages and incorporation of environmental variability into stock-recruitment relationships. Scientia Marina 67 (Suppl. 1):129-154.
Lappalainen, A., M. Härmä, S. Kuningas, and L. Urho. 2008. Reproduction of pike (Esox lucius) in reed belt shores of the SW coast of Finland, Baltic Sea: a new survey approach. Boreal Environment Research 13:370-380.
Lappalainen , A., M. Kallasvuo, G. Sundblad, and U. Bergström. Comparison of multimesh gillnets and small detonations for sampling young-of-the-year fish in shallow water. manuscript.
Leathwick, J., and M. P. Austin. 2001. Competitive interactions between tree species in New Zealand's old-growth indigenous forests. Ecology 82:2560-2573.
Leathwick, J. R., J. Elith, and T. Hastie. 2006. Comparative performance of generalized additive models and multivariate adaptive regression splines for statistical modelling of species distributions. Ecological Modelling 199:188-196.
Lehmann, A., M. J. Overton, and J. Leathwick. 2002. GRASP: generalized regression analysis and spatial prediction. Ecological Modelling 157:189-207.
Lehtonen, H., S. Hansson, and H. Winkler. 1996. Biology and exploitation of pikeperch, Stizostedion lucioperca (L.), in the Baltic Sea area. Annales Zoologici Fennici 33:525-535.
Lindegren, M., C. Möllmann, A. Nielsen, K. Brander, B. R. MacKenzie, and N. C. Stenseth. 2010. Ecological forecasting under climate change: the case of Baltic cod. Proceedings of the Royal Society B: Biological Sciences 277:2121-2130.
Liu, C., M. White, and G. Newell. 2010. Measuring and comparing the accuracy of species distribution models with presence–absence data. Ecography. doi: 10.1111/.1600-0587.2010.06354.x
Ljunggren, L., A. Sandström, U. Bergström, J. Mattila, A. Lappalainen , G. Johansson, G. Sundblad, M. Casini, O. Kaljuste, and B. K. Eriksson. 2010. Recruitment failure of coastal predatory fish in the Baltic Sea coincident with an offshore ecosystem regime shift. ICES Journal of Marine Science 67:1587-1595.
41
Lobo, J. M. 2008. More complex distribution models or more representative data? Biodiversity Informatics 5:14-19.
Lobo, J. M., A. Jiménez-Valverde, and J. Hortal. 2010. The uncertain nature of absences and their importance in species distribution modelling. Ecography 33:103-114.
Maggini, R., A. Lehmann, N. E. Zimmerman, and A. Guisan. 2006. Improving generalized regression analysis for the spatial prediction of forest communities. Journal of Biogeography 33:1729-1749.
Manel, S., H. C. Williams, and S. J. Ormerod. 2001. Evaluating presence-absence models in ecology: the need to account for prevalence. Journal of Applied Ecology 38:921-931.
Mantzouni, I., H. Sorensen, R. B. O'Hara, and B. R. MacKenzie. 2010. Hierarchical modelling of temperature and habitat size effects on population dynamics of North Atlantic cod. ICES Journal of Marine Science 67:833-855.
McPherson, J. M., W. Jetz, and D. J. Rogers. 2004. The effects of species' range sizes on the accuracy of distribution models: ecological phenomenon or statistical artefact? Journal of Applied Ecology 41:811-823.
Mitchell, S. C. 2005. How useful is the concept of habitat? - a critique. OIKOS 110:634-638.
Moore, C. H., E. S. Harvey, and K. P. Van Niel. 2009. Spatial prediction of demersal fish distributions: enhancing our understanding of species-environment relationships. ICES Journal of Marine Science 66:2068-2075.
Mumby, P. J., A. J. Edwards, J. E. Arias-González, K. C. Lindeman, P. G. Blackwell, A. Gall, M. I. Gorczynska, A. R. Harborne, C. L. Pescod, H. Renken, C. C. C. Wabnitz, and G. Llewellyn. 2004. Mangroves enhance the biomass of coral reef fish communities in the Carribean. Nature 427:533-536.
Myers, R. A. 1998. When Do Environment–recruitment Correlations Work? Reviews in Fish Biology and Fisheries 8:285-305.
Myers, R. A. 2001. Stock and recruitment: generalizations about maximum reproductive rate, density dependence, and variability using meta-analytic approaches. ICES Journal of Marine Science 58:937-951.
Möllmann, C., B. Müller-Karulis, G. Kornilovs, and M. A. St John. 2008. Effects of climate and overfishing on zooplankton dynamics and ecosystem structure: regime shifts, trophic cascade, and feedback loops in a simple ecosystem. ICES Journal of Marine Science 65:302-310.
Nilsson, J. 2006. Predation of northern pike (Esox lucius L.) eggs: a possible cause of regionally poor recruitment in the Baltic Sea. Hydrobiologia 553:161-169.
Nilsson, J., J. Andersson, P. Karås, and O. Sandström. 2004. Recruitment failure and decreasing catches of perch (Perca fluviatilis L.) and pike (Esox lucius L.) in the coastal waters of southeast Sweden. Boreal Environment Research 9:295-306.
Nissling, A., U. Johansson, and M. Jacobsson. 2006. Effects of salinity and temperature conditions on the reproductive success of turbot (Scophtalmus maximus) in the Baltic Sea. Fisheries Research 80:230-238.
Nissling, A., L. Westin, and O. Hjerne. 2002. Reproductive success in relation to salinity for three flatfish species, dab (Limanda limanda), plaice (Pleuronectes platessa) and flounder (Pleuronectes flesus), in the brackish water Baltic Sea. ICES Journal of Marine Science 59:93-108.
Ojaveer, H., A. Jaanus, B. R. MacKenzie, G. Martin, S. Olenin, T. Radziejewska, I. Telesh, M. L. Zettler, and A. Zaiko. 2010. Status of biodiversity in the Baltic Sea. PLoS ONE 5:e12467.
Olenin, S., and J.-P. Ducrotoy. 2006. The concept of biotope in marine ecology and coastal management. Marine Pollution Bulletin 53:20-29.
42
Pearce, J., and S. Ferrier. 2000. Evaluating the predictive performance of habitat models developed using logistic regression. Ecological Modelling 133:225-245.
Phillips, S. J., R. P. Anderson, and R. E. Schapire. 2006. Maximum entropy modeling of species geographic distributions. Ecological Modelling 190:231-259.
Phillips, S. J., and M. Dudík. 2008. Modeling of species distributions with Maxent: new extensions and a comprehensive evaluation. Ecography 31:161-175.
Pihl, L., J. Modin, and H. Wennhage. 2000. Spatial distribution patterns of newly settled plaice (Pleuronectes platessa L.) along the Swedish Skagerrak archipelago. Journal of Sea Research 44:65-80.
Pulliam, H. R. 2000. On the relationship between niche and distribution. Ecology Letters 3:349-361.
Randin, C. F., T. Dirnböck, S. Dullinger, N. E. Zimmerman, M. Zappa, and A. Guisan. 2006. Are niche-based species distribution models transferable in space? Journal of Biogeography 33:1689-1703.
Rice, J. C. 2005. Understanding fish habitat ecology to achieve conservation. Journal of Fish Biology 67 (Supplement B):1-22.
Ricker, W. E. 1954. Stock and recruitment. Journal of the Fisheries Research Board 11:559-623.
Ricker, W. E. 1958. Handbook of computations for biological statistics of fish populations. Bulletin 119 of the Fisheries Resource Board, Canada, Ottawa.
Rijnsdorp, A. D., M. A. Peck, G. H. Engelhard, C. Möllmann, and J. K. Pinnegar. 2009. Resolving the effect of climate change on fish populations. ICES Journal of Marine Science 66:1570-1583.
Rijnsdorp, A. D., F. A. Van Beek, S. Flatman, R. M. Millner, J. D. Riley, M. Giret, and R. De Clerck. 1992. Recruitment of sole stocks, Solea solea (L.), in the Northeast Atlantic. Netherlands Journal of Sea Research 29:173-192.
Rosqvist, K., J. Mattila, A. Sandström, M. Snickars, and M. Westerbom. 2010. Regime shifts in vegetation composition of Baltic Sea coastal lagoons. Aquatic Botany 93:39-46.
Sanchirico, J., and P. Mumby. 2009. Mapping ecosystem functions to the valuation of ecosystem services: implications of species–habitat associations for coastal land-use decisions. Theoretical Ecology 2:67-77.
Sandström, A., B. K. Eriksson, P. Karås, M. Isæus, and H. Schreiber. 2005. Boating and navigation activities influence the recruitment of fish in a Baltic Sea archipelago area. Ambio 34:125-130.
Sandström, A., and P. Karås. 2002. Effects of eutrophication on young-of-the-year freshwater fish communities in coastal areas of the Baltic. Environmental Biology of Fishes 63:89-101.
Snickars, M., A. Sandström, A. Lappalainen, and J. Mattila. 2007. Evaluation of low impact pressure waves as a quantitative sampling method for small fish in shallow water. Journal of Experimental Marine Biology and Ecology 343:138-147.
Snickars, M., A. Sandström, A. Lappalainen, J. Mattila, K. Rosqvist, and L. Urho. 2009. Fish assemblages in coastal lagoons in land-uplift succession: The relative importance of local and regional environmental gradients. Estuarine, Coastal and Shelf Science 81:247-256.
Stoner, A. W., M. L. Spencer, and C. H. Ryer. 2007. Flatfish-habitat associations in Alaska nursery grounds: Use of continuous video records for multi-scale spatial analysis. Journal of Sea Research 57:137-150.
43
Strauss, B., and R. Biedermann. 2007. Evaluating temporal and spatial generality: How valid are species-habitat relationship models? Ecological Modelling 204:104-114.
Thorpe, J. 1977. Synopsis of biological data on the perch Perca fluviatilis Linnaeus, 1758 and Perca flavescens Mitchill, 1814. FAO, Rome.
Thrush, S. F., and P. K. Dayton. 2010. What can ecology contribute to ecosystem-based management? Annual Review of Marine Science 2:419-441.
Thuiller, W., L. Brotons, M. B. Araújo, and S. Lavorel. 2004. Effects of restricting environmental range of data to project current and future species distributions. Ecography 27:165-172.
Udvardy, M. F. D. 1959. Notes on the ecological concepts of habitat, biotope and niche. Ecology 40:725-728.
Valavanis, V. D., G. J. Pierce, A. F. Zuur, A. Palialexis, A. Saveliev, I. Katara, and J. Wang. 2008. Modelling of essential fish habitat based on remote sensing, spatial analys and GIS. Hydrobiologia 612:5-20.
Wennhage, H. 2002. Vulnerability pf newly settled plaice (Pleuronectes platessa L.) to predation: effects of habitat structure and predator functional response. Journal of Experimental Marine Biology and Ecology 269:129-145.
Wennhage, H., L. Pihl, and J. Stål. 2007. Distribution and quality of plaice (Pleuronectes platessa) nursery grounds on the Swedish west coast. Journal of Sea Research 57:218-229.
Wood, S. N. 2006. Generalized additive models: An introduction with R. Chapman and Hall/CRC.
Zweig, M. H., and G. Campbell. 1993. Receiver-Operating Characteristic (ROC) Plots: A fundamental evaluation tool in clinical medicine. Clinical Chemistry 39:561-577.
Ådjers, K., M. Appelberg, R. Eschbaum, A. Lappalainen, A. Minde, R. Repecka, and G. Thoresson. 2006. Trends in coastal fish stocks of the Baltic Sea. Boreal Environment Research 11:13-25.
Österblom, H., A. Gårdmark, L. Bergström, B. Müller-Karulis, C. Folke, M. Lindegren, M. Casini, P. Olsson, R. Diekmann, T. Blenckner, C. Humborg, and C. Möllmann. 2010. Making the ecosystem approach operational - Can regime shifts in ecological- and governance systems facilitate the transition? Marine Policy 34:1290-1299.