Embed Size (px)
Citation preview
Spatial patterns of DOC concentration and DOM opticalproperties in a Brazilian tropical river-wetland systemHigo J. Dalmagro1 , Mark S. Johnson2,3 , Carlo R. de Musis1, Michael J. Lathuillière2 ,Jordan Graesser4, Osvaldo B. Pinto-Júnior1, and Eduardo G. Couto5
1Environmental Sciences Graduate Program, University of Cuiabá, Cuiabá, Brazil, 2Institute for Resources, Environment andSustainability, University of British Columbia, Vancouver, British Columbia, Canada, 3Department of Earth, Ocean andAtmospheric Sciences, University of British Columbia, Vancouver, British Columbia, Canada, 4Department of Geography,McGill University, Montreal, Quebec, Canada, 5Department of Soil Science, Universidade Federal de Mato Grosso, Cuiabá,Brazil
Abstract The Cerrado (savanna) and Pantanal (wetland) biomes of Central Western Brazil haveexperienced significant development activity in recent decades, including extensive land cover conversionfrom natural ecosystems to agriculture and urban expansion. The Cuiabá River transects the Cerrado biomeprior to inundating large areas of the Pantanal, creating one of the largest biodiversity hot spots in the world.We measured dissolved organic carbon (DOC) and the optical absorbance and fluorescence properties ofdissolved organic matter (DOM) from 40 sampling locations spanning Cerrado and Pantanal biomes duringwet and dry seasons. In the upper, more agricultural region of the basin, DOC concentrations were highest inthe rainy season with more aromatic and humified DOM. In contrast, DOC concentrations and DOM opticalproperties were more uniform for the more urbanized middle region of the basin between wet and dryseasons, as well as across sample locations. In the lower region of the basin, wet season connectivity betweenthe river and the Pantanal floodplain led to high DOC concentrations, a fourfold increase in humificationindex (HIX) (an indicator of DOM humification), and a 50% reduction in the spectral slope (SR). Basin-wide, wetseason values for SR, HIX, and FI (fluorescence index) indicated an increasing representation of terrestriallyderived DOM that was more humified. Parallel factor analysis identified two terrestrially derived components(C1 and C2) representing 77% of total fluorescing DOM (fDOM). A third, protein-like fDOM componentincreased markedly during the wet season within the more urban-impacted region.
1. Introduction
Ecohydrological and biogeochemical processes occurring within freshwater systems are fundamental tointeractions between the terrestrial landscape and oceans, which in turn affect the global balance of carbon(C) and nutrients [Aufdenkampe et al., 2011; D’Odorico et al., 2010; Tranvik et al., 2009]. Inland waters andwetlands are estimated to receive inputs of organic and inorganic C from the terrestrial environment thatare on the order of 5.7 Pg yr!1, of which only about 0.9 Pg yr!1 is transported to oceans [Raymond et al.,2013]. Thus, rivers and wetlands act as temporary storage of C in sediments, and cycle C back to the atmo-sphere in the form of CO2 and CH4 [Cole, 2013; Raymond et al., 2013; Borges et al., 2015].
In this context, C cycling within tropical freshwater systems is of great importance, as it is estimated thattropical rivers support CO2 outgassing rates that are double those of temperate rivers, and six times theCO2 evasion rates of boreal/arctic rivers [Aufdenkampe et al., 2011]. In particular, tropical wetlands are esti-mated to support the highest rate of zonal outgassing of any inland water class [Aufdenkampe et al., 2011],although C dynamics in tropical wetland systems are drastically understudied [Sjögersten et al., 2014]. Sincemuch of the C that evades from inland waters originates as dissolved organic carbon (DOC) [Cole, 2013;Ward et al., 2017], the characteristics of DOC transported through a river basin are clearly important to its fate.However, studies of C origin and dynamics over an entire river basin remain relatively uncommon, particu-larly in the tropics [Battin et al., 2009].
Environmental scientists are increasingly emphasizing the ecological roles that organic matter plays in aqua-tic ecosystems [Weishaar et al., 2003]. Dissolved organic matter (DOM) in aqueous systems is a heterogeneousmixture of aromatic and aliphatic organic compounds that have ecologically important roles in a variety ofbiogeochemical and physical processes impacting C and nutrient cycling [Singh et al., 2013; Thurman,
DALMAGRO ET AL. DOM IN A TROPICAL RIVER-WETLAND SYSTEM 1
PUBLICATIONSJournal of Geophysical Research: Biogeosciences
RESEARCH ARTICLE10.1002/2017JG003797
Key Points:• DOC concentrations increasedsubstantially in wet season, except formore urbanized region
• DOM generally more terrestrial innature during wet season throughoutriver-wetland system
• Protein-like fDOM percentageincreased 2.5 times in wet season inmore urbanized region
Supporting Information:• Supporting Information S1
Correspondence to:M. S. Johnson,[email protected]
Citation:Dalmagro, H. J., M. S. Johnson,C. R. de Musis, M. J. Lathuillière,J. Graesser, O. B. Pinto-Júnior, andE. G. Couto (2017), Spatial patterns ofDOC concentration and DOM opticalproperties in a Brazilian tropical river-wetland system, J. Geophys. Res.Biogeosci., 122, doi:10.1002/2017JG003797.
Received 3 FEB 2017Accepted 8 JUL 2017Accepted article online 15 JUL 2017
©2017. American Geophysical Union.All Rights Reserved.
1985]. In addition, DOM is also fundamental in the transport and processing of the major pollutants in theaquatic environment [Aiken et al., 2011; Singh et al., 2015; Yamashita et al., 2008].
Although DOM can be rapidly degraded by biological activity, its chemical and fluorescence characteristicsenable a consideration of the use of DOM as an environmental tracer in some ecosystems [Mariot et al.,2007], in addition to being important tools in the characterization of DOM [Fellman et al., 2010; Johnsonet al., 2011; McKnight et al., 2001]. To this end, optical absorbance and fluorescence spectroscopic techniqueshave come into wide use in recent years [Mariot et al., 2007; Powe et al., 2004; Singh et al., 2013]. These techni-ques enable temporally and spatially extensive sampling programs, which are needed to study DOM dynamicsin aquatic ecosystems [Fellman et al., 2010; Jaffé et al., 2008], in addition to the evaluation of water quality inurban and agricultural river basins [Fellman et al., 2010]. Biogeochemical characterization of DOM based onfluorescence enables the detection of differences between natural and anthropogenic DOM sources in riversimpacted by agricultural wastes [Baker et al., 2003;Wilson and Xenopoulos, 2008], as well as by sewage effluentsthat are characterized by high levels of protein [Baker, 2002]. A combination of optical properties (fluorescenceand absorption), in conjunctionwith conventional measurements of DOC, can be used to discriminate temporaland spatial variations of DOM in a mixed use river basin [Baker and Inverarity, 2004].
A variety of approaches have been employed to elucidate DOC characteristics based on spectrofluorometricanalysis, including numerical evaluation of the excitation-emission matrix (EEMs) for aqueous samples usingparallel factor analysis (PARAFAC) [Stedmon et al., 2003]. EEMs provide a detailed view of environmentalsamples, which permits their use to trace the origins of individual DOM peaks observed in aqueous samplesto ecohydrologic and anthropogenic sources [i.e., Alberts and Takács, 2004; Sierra et al., 2005; Stedmonet al., 2003].
DOC concentration and composition (e.g., DOC quality) can vary considerably along the stream drainage net-work in watersheds [Olefeldt et al., 2013; Singh et al., 2015], depending on a number of factors, such as soiltype and land use [D’Amore et al., 2010; Williams et al., 2010], catchment area and topography [Inamdarand Mitchell, 2006; McGlynn and McDonnell, 2003], and interactions within the fluvial network [Gergel et al.,1999; Laudon et al., 2011]. The DOM within the aquatic system is exposed to various processing such asphotobleaching [Spencer et al., 2009] and microbial respiration [Fasching et al., 2014], which occur simulta-neously and affect the transformation of DOM during transport [Cawley et al., 2012; Lambert et al., 2016a;Ward et al., 2016]. Thus, the DOM processing depends on water residence time (WRT) [Hanson et al., 2011;Köhler et al., 2013], as well as on the terrestrial delivery of DOM. In large rivers, WRT is higher during low-flowcompared to high flow. At high flow, pulses of DOMmobilized by hydrologic events can be rapidly “shunted”downstream before significant modification occurs, a coupled process referred to as the “pulse-shunt”concept [Raymond et al., 2016]. Considering that changes in water level also control the hydrologic connec-tivity with wetlands, it is likely that the downstream gradient in DOM composition differs dramatically in rela-tion to spatiotemporal changes in hydrodynamic conditions [Lambert et al., 2016a].
The objective of this study was to evaluate regional patterns of DOC properties within a tropical river-wetlandsystem. The Cuiabá River basin, which has highly seasonal precipitation but little seasonal variation intemperature, was selected as it transects two of the major biomes in South America: the Cerrado (savannaecosystem) and the Pantanal wetland. Further, there are strong regional differences in anthropogenicimpacts within the basin. We hypothesized that the Cuiabá River, which traverses agricultural areas followedbymore urbanized areas prior to reaching the globally significant Pantanal wetland ecosystem, would exhibitregionally distinct DOC origins that would be most apparent during the dry season when hydrologic connec-tivity to the landscape is lowest but water resident time in the river is highest. As a corollary, we hypothesizedthat DOC origins and concentrations would be similar across regions during the wet season when runoff fromupland agricultural areas and urban effluents flood the relatively pristine Pantanal as overbanking rivers rees-tablish hydrological connectivity between the river and the floodplain.
2. Materials and Methods2.1. Site Description
The Cuiabá River basin is located in Central Western Brazil, covering an area of approximately 28,000 km2
while crossing two major South American biomes: the Cerrado (a native savanna ecosystem) and the
Journal of Geophysical Research: Biogeosciences 10.1002/2017JG003797
DALMAGRO ET AL. DOM IN A TROPICAL RIVER-WETLAND SYSTEM 2
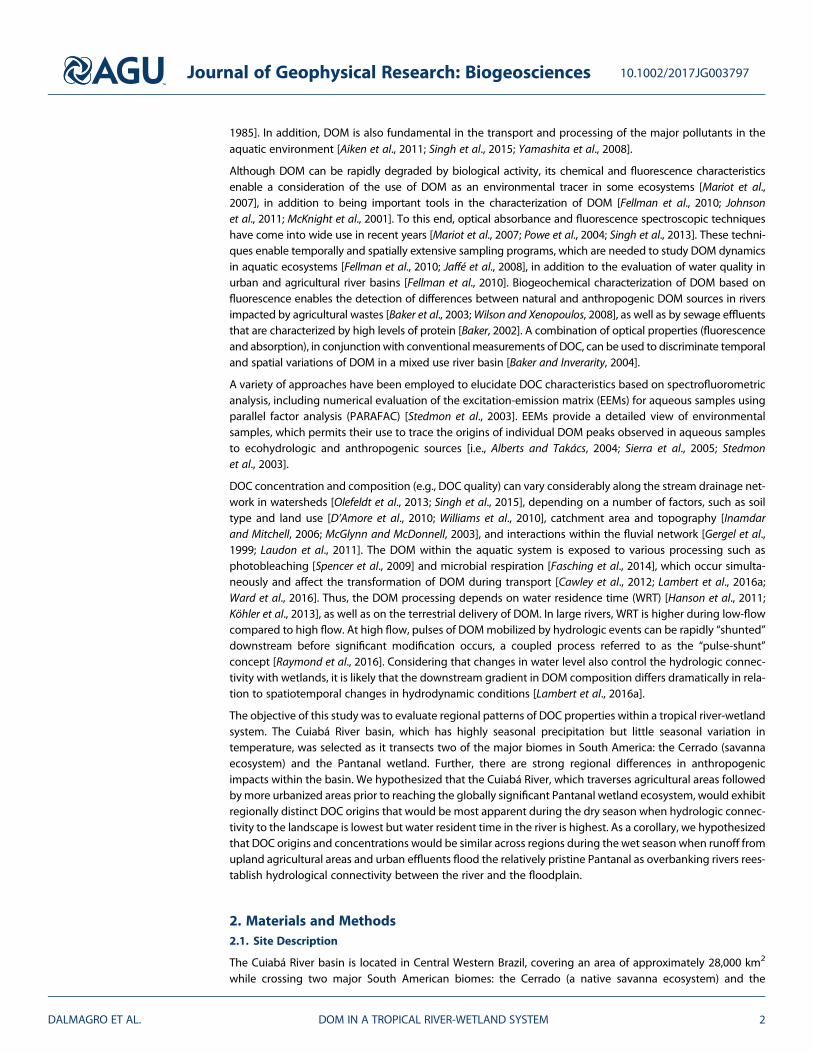
Pantanal wetland complex (Figure 1). We divided the Cuiabá River basin into three regions according tofluvial characteristics and land use patterns (Figure 2). The headwaters of the Cuiabá River (upperregion) are located in the Cerrado biome, with a predominance of Petroferric Acrudox and TypicDystrudepts soils, where the typical savanna vegetation has been widely replaced by agricultureactivities dominated by soybean and maize monocultures and pasture [Wantzen et al., 2012]. In theupper region of the basin, the Cuiabá River behaves initially like a plateau river, with the appearance ofseveral rapids resulting from the basin’s geological structure. About 40% of the natural cover of theCerrado was converted to agriculture over 1985–2005, which is in addition to the 20% that wasconverted prior to 1985 [Grecchi et al., 2014].
The middle region of the Cuiabá River basin is characterized by dystrophic, pebbly, and nutrient poor soilsand is strongly influenced by larger cities and industrial activities. This region includes the cities of Cuiabáand Várzea Grande, an urban agglomeration with a population of approximately 857,000 inhabitants [IBGE[Brazilian Institute of Geography and Statistics], 2016]. Wastewater treatment rates for the urban agglomera-tion are less than 15% [Zeilhofer et al., 2010].
In the lower region of the basin, the river enters the Pantanal wetland where overbanking during the rainyseason contributes to one of the largest flooded expanses in the world, and an important biodiversity hotspot [Junk et al., 2006]. Soils in the Pantanal are composed of sand, silt, clay, and clay-sand sediments, witha lacustrine river deposition environment in which hydromorphic mineral soils with restricted drainage arepredominant [Couto and Oliveira, 2011; Nascimento et al., 2015]. Floodwaters recede in the dry season(May–September), resulting in a complex mosaic of grasslands and forests dotted with numerous lakesand marshes [Mariot et al., 2007].
Figure 1. Map of sampling locations in the Cuiabá River basin within Mato Grosso, Brazil, and corresponding regions(Cerrado, middle, and Pantanal) within the basin.
Journal of Geophysical Research: Biogeosciences 10.1002/2017JG003797
DALMAGRO ET AL. DOM IN A TROPICAL RIVER-WETLAND SYSTEM 3
2.2. Land Cover Analysis
Water samples were collected at 40 sample locations along the main stem of the Cuiabá River and tributariesas described below. We calculated the total drainage area contributing to each sample location based onGPS-referenced sample collection points overlain on a digital elevation model derived from Shuttle RadarTopography Mission (SRTM) data. Upslope contributing areas (e.g., subbasins) were then determined for eachwater sample collection point using the TopologicalBreachBurn, Jenson snap points, andWatershed functionsdistributed with the Whitebox Geospatial Analysis Tools open source software (version 3.3.0) [Lindsay, 2016].
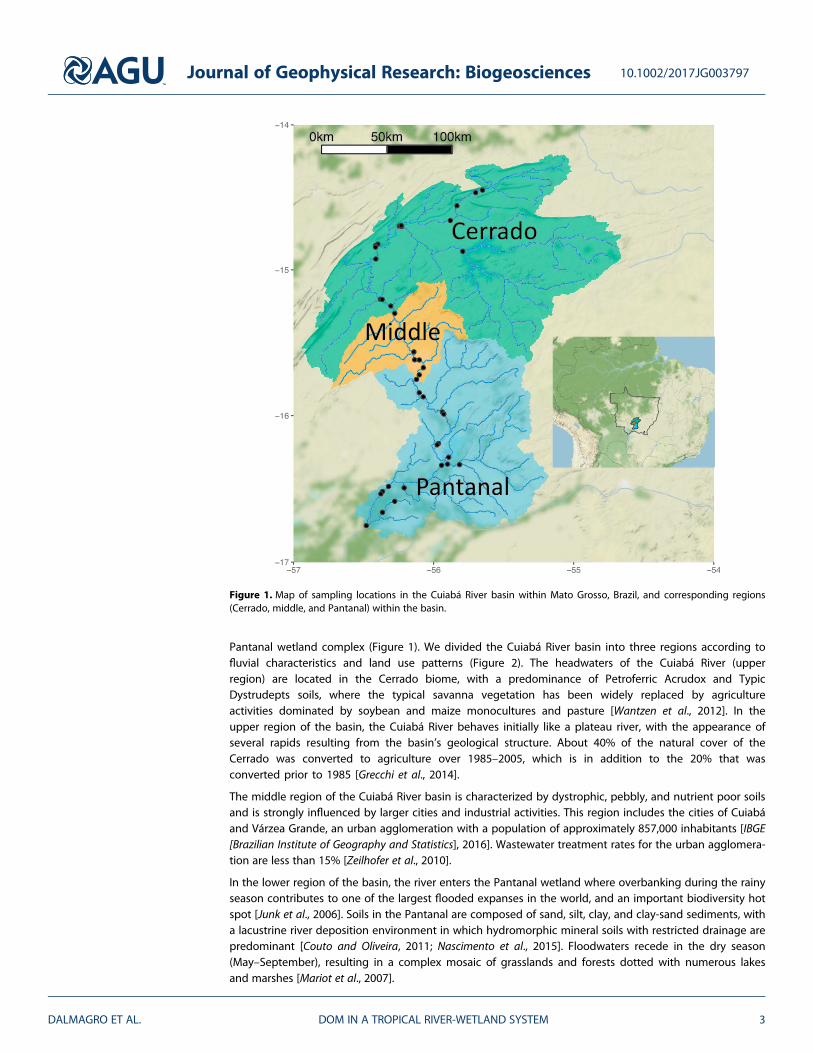
Subbasins were intersected with a land cover map to determine land cover distributions for subbasinscontributing to each sample collection point. Briefly, we classified land cover for each 30 m pixel followingprocedures described in Graesser et al. [2015] using Landsat scenes for 2013–2014. For our study, we consid-ered five land cover categories: crop, forest, pasture, urban, and water (Figure 2). The “water” class refers topermanently water covered areas, whereas seasonally flooded forests and grass covered areas were classifiedas “forests” and “pasture,” respectively, with the latter subject to seasonal grazing. The intersection of theresulting land cover map and the subbasin map allowed us to aggregate land cover at the subbasin andregional scales. Regional-scale land cover is depicted in Figure 2, while subbasin land cover compositionswere used to evaluate land use in association with measured water quality parameters.
2.3. Basin Hydrology
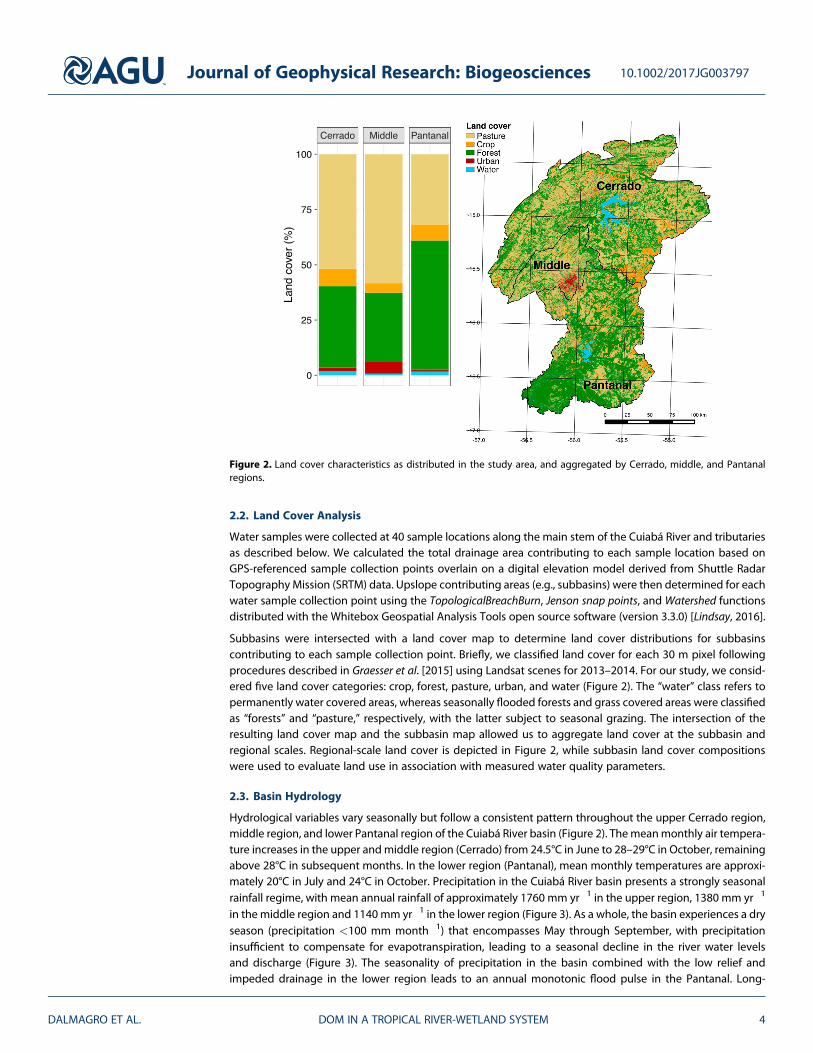
Hydrological variables vary seasonally but follow a consistent pattern throughout the upper Cerrado region,middle region, and lower Pantanal region of the Cuiabá River basin (Figure 2). Themeanmonthly air tempera-ture increases in the upper andmiddle region (Cerrado) from 24.5°C in June to 28–29°C in October, remainingabove 28°C in subsequent months. In the lower region (Pantanal), mean monthly temperatures are approxi-mately 20°C in July and 24°C in October. Precipitation in the Cuiabá River basin presents a strongly seasonalrainfall regime, with mean annual rainfall of approximately 1760 mm yr!1 in the upper region, 1380 mm yr!1
in the middle region and 1140 mm yr!1 in the lower region (Figure 3). As a whole, the basin experiences a dryseason (precipitation <100 mm month!1) that encompasses May through September, with precipitationinsufficient to compensate for evapotranspiration, leading to a seasonal decline in the river water levelsand discharge (Figure 3). The seasonality of precipitation in the basin combined with the low relief andimpeded drainage in the lower region leads to an annual monotonic flood pulse in the Pantanal. Long-
Figure 2. Land cover characteristics as distributed in the study area, and aggregated by Cerrado, middle, and Pantanalregions.
Journal of Geophysical Research: Biogeosciences 10.1002/2017JG003797
DALMAGRO ET AL. DOM IN A TROPICAL RIVER-WETLAND SYSTEM 4
term mean annual flow values are 105 m3 s!1, 332 m3 s!1, and 347 m3 s!1 for the Cerrado, middle, andPantanal regions, respectively. Although it would appear from Figure 3 that flow is higher in the middleregion than in the Pantanal, some river discharge overbanking into the floodplain during the flood periodis evaporated rather than contributing to further downstream flow [Schwerdtfeger et al., 2014], and thisbypass flow is not registered by the river gauge.
2.4. Water Sample Collection and Processing
Surface water samples were collected during the 2013 wet (March) and dry seasons (September) from 40collection points along the Cuiabá River from its headwaters in the Cerrado through the more urbanizedurban middle region and into the Pantanal wetland (Figure 1). Sampling points in the Pantanal region wereselected from both the main stem of the Cuiabá as well as from inundated areas that remain as tributaries tothe Cuiabá during the dry season (Figure 1).
For each of the 40 collection points, three samples were collected from visually well-mixed locations in themain channel at discrete depths (surface, 10 cm and 30 cm). As no significant differences were identifiedbetween depths for the measured parameters, the three samples were treated as replicates with resultspresented as mean values of the three samples. Water samples were filtered in the field using precombustedfilters (Whatman GF/F glass fiber filter, 0.7 μm pore size) and stored in 60 mL amber glass bottles with Tefloncoated caps. Samples were stored on ice in the field and then refrigerated in the laboratory prior to analysis,which occurred within 24 h of collection. Prior to sampling, bottles were washed with acid (HCl, 5% vol/vol),rinsed with distilled water, and dried in a muffle furnace. The Teflon caps were acid washed, rinsed in distilled
Figure 3. Monthly precipitation (mean ± SD) in (a) upper Cerrado region, (b) middle region, and (c) lower Pantanal region of the Cuiabá River basin. Red squares inFigures 3a–3c indicate monthly precipitation during the 2013 study period. River discharge of the Cuiabá River are presented for (d) the upper Cerrado, (e) middle,and (f) lower Pantanal regions of the study basin, with long-termmeanmonthly discharge indicated by the dashed blue line, ±1 one standard deviation (SD) from themean is indicated by the shaded area, and flow during 2013 study period is indicated by the solid red line. Mean monthly data and variability as ±1 SD represent30 year time series (1980–2010) that were obtained from the Brazilian National Meteorological Institute (INMET, 2015, http://www.inmet.gov.br/portal/) and theBrazilian National Water Agency (ANA, 2015, http://www.snirh.gov.br/hidroweb/) for precipitation and river discharge, respectively. Note that Cuiabá River dischargein the Pantanal is lower during the wet season due to overbanking and bypass flow through the floodplain that is not registered by the river gauge.
Journal of Geophysical Research: Biogeosciences 10.1002/2017JG003797
DALMAGRO ET AL. DOM IN A TROPICAL RIVER-WETLAND SYSTEM 5
water, and air dried. Once in the laboratory, the field samples were divided into two aliquots: one for analysisby absorption spectroscopy and another for fluorescence spectrometric analysis for emission and excitationmatrices (EEMs).
2.5. Absorption Spectroscopy
Before laboratory analyses began, samples were wrapped in black plastic to minimize light exposure andallowed to warm up to room temperature. Absorption spectra were measured between 200 and 750 nm in2.5 nm increments using a UV-Vis sensor (spectro::lyser®-S::can MESSTECHNIK GmbH, Vienna, Austria) withresults referenced to a blank spectrum derived from ultrapure 18.2 MΩ Milli-Q water. A multifunctional slidewas used with the submersible sensor for the laboratory-based measurements. The slide facilitates discretesample measurements by fitting over the probe, providing a volume into which individual samples weredecanted following triplicate rinsing with Milli-Q water between samples. DOC concentration was derivedfrom the absorbance spectra via derivative spectroscopy (ANA::Pro software, S::can MESSTECHNIK GmbH,Vienna, Austria), which has been successfully implemented in tropical environments [Waterloo et al., 2006].We corrected the DOC concentration values derived by the spectrometer using a calibration curve developedby preparing solutions of known DOC concentrations from standards obtained from the International HumicSubstances Society.
Spectral slopes (S275–295 and S350–400) were calculated using a nonlinear adjustment of an exponential func-tion, with the absorption spectrum ranging between 275–295 nm and 350–400 nm, respectively [Helms et al.,2008; Spencer et al., 2009]. The spectral slope ratio (SR) was then calculated as the ratio of S275–295 and S350–400[Helms et al., 2008]. The SR parameter has been proposed as a proxy for DOMmolecular weight, with higher SRvalues indicative of lower molecular weight DOM and vice versa [Helms et al., 2008; Spencer et al., 2012], and ithas been used to evaluate the DOM seasonal changes in tropical rivers and wetlands [Yamashita et al., 2010a;Yamashita et al., 2010b]. Values of SR < 1 indicate a predominance of higher molecular weight compoundswithin the DOC pool, as well as a DOC with greater aromaticity and vascular plant inputs [Spencer et al.,2012]. Values for SR > 1 are indicative of DOC containing lower molecular weight compounds [Helmset al., 2008].
2.6. Fluorescence Spectroscopy
The second aliquot was used to generate the excitation-emission matrices (EEMs) using an Aqualog fluores-cence spectrometer (Horiba Scientific, Edison, NJ, USA) with a quartz cuvette of 1 cm path length. Sampleswith DOC concentrations above 15 mg L!1 or values of absorbance at 254 nm greater than 0.3 abs m!1
on the absorbance spectrometer were diluted in ultrapure water (18.2 MΩ Milli-Q) prior to fluorescenceanalysis [Singh et al., 2013; Vodacek et al., 1997]. EEMs were acquired with the following excitation (Ex) andemission (Em) settings: Ex = 240–600 nm at every 3 nm interval, Em = 213–621 nm at every 3.1 nm interval,band pass = 3 nm, and integration time = 1 s. Factory-supplied correction factors were applied to the scans tocorrect for instrument configuration. Absorption data were used to correct for inner filter effects. Then EEMswere blank corrected to eliminate the influence of Raman peaks. Subsequently, EEMs were normalized usingdaily determined water Raman integrated area under maximum fluorescence intensity [Lawaetz andStedmon, 2009], with fluorescence data reported in Raman units. EEMs determined from diluted sampleswere multiplied by the dilution factor to obtain the fluorescence intensity of the original undiluted sample[Moran et al., 2000]. EEMs for all samples from both hydrological periods were utilized (n = 240 EEMs) todevelop the PARAFAC model in MATLAB using the DOMFluor toolbox [Stedmon and Bro, 2008].
To complement our EEMs assessment and help understand the biochemical composition and origin of DOMin the Cuiabá River, we calculated two additional indices: the humification index, HIX [Ohno, 2002; Zsolnayet al., 1999] and the fluorescence index, FI [Cory and McKnight, 2005;McKnight et al., 2001]. HIX was calculatedby dividing the integrated fluorescence intensity between 435 nm and 480 nm emission wavelengths withexcitation at 254 nm by the integrated fluorescence intensity between 300 nm and 345 nm emission wave-lengths with excitation at 254 nm. Larger HIX values are indicative of increasing humification and thepresence of fulvic acids [Ohno, 2002; Zsolnay et al., 1999]. FI, calculated as the ratio of the maximum fluores-cence emission intensity at 470 nm and 520 nm, excited at 370 nm, has been used to distinguish betweenDOM of terrestrial, or allochthonous, versus microbial, or autochthonous, origins [Cory and McKnight, 2005;McKnight et al., 2001]. FI values between 1.2 and 1.5 are indicative of terrestrially derived DOM, while
Journal of Geophysical Research: Biogeosciences 10.1002/2017JG003797
DALMAGRO ET AL. DOM IN A TROPICAL RIVER-WETLAND SYSTEM 6
higher values, between 1.7 and 2.0, are strong indicators of mainly microbial activity origin and autochtho-nous production [McKnight et al., 2001]. Increasing values of FI have been used to indicate a change inDOM from “terrestrial” to “microbial” sources in subtropical [Singh et al., 2010] and tropical regions[Johnson et al., 2011].
2.7. Statistical Analyses
Spectral indices were calculated using the R software environment for statistical computing and graphics (Rversion 3.3.2) [R Core Team, 2016]. Boxplots were constructed using R package ggplot2 [Wickham, 2009].Riverine fluxes of DOC were determined for each region (upper Cerrado region, middle region, and lowerPantanal region) based on DOC concentrations and discharge of the Cuiabá River at the outlet of each regio-nal section. Discharge information was not available from other sample locations. Areal fluxes (e.g., DOCyields) were determined for each region by dividing the riverine fluxes by the total upstream contributingarea. For samples collected along the main stem of the Cuiabá River, distance from source (e.g., riverinedistance) was calculated using the R package riverdist [Tyers, 2017].
Statistical differences were assessed using Tukey’s “Honest Significant Difference” test following two-wayANOVA with regions and seasons as factors. A significance level of p < 0.05 was used as an indicator ofstatistical difference. Linear regression was used to analyze the relationship between land use, DOC concen-tration, and optical characteristics.
Results were further explored using factor analysis on loadings from the principal component analysis usingthe R package FactoMineR [Husson et al., 2011] to identify interdependencies between parameters (e.g., com-mon factors) and to identify temporal and spatial clusters within the reduced parameter space. Factor analy-sis included all DOM optical properties indices and fDOM components identified from PARAFAC and wasconducted in R (function principal from the R package pysch using a varimax rotation) [Revelle, 2015].
3. Results3.1. DOC Concentrations, Fluxes, and Areal Yields
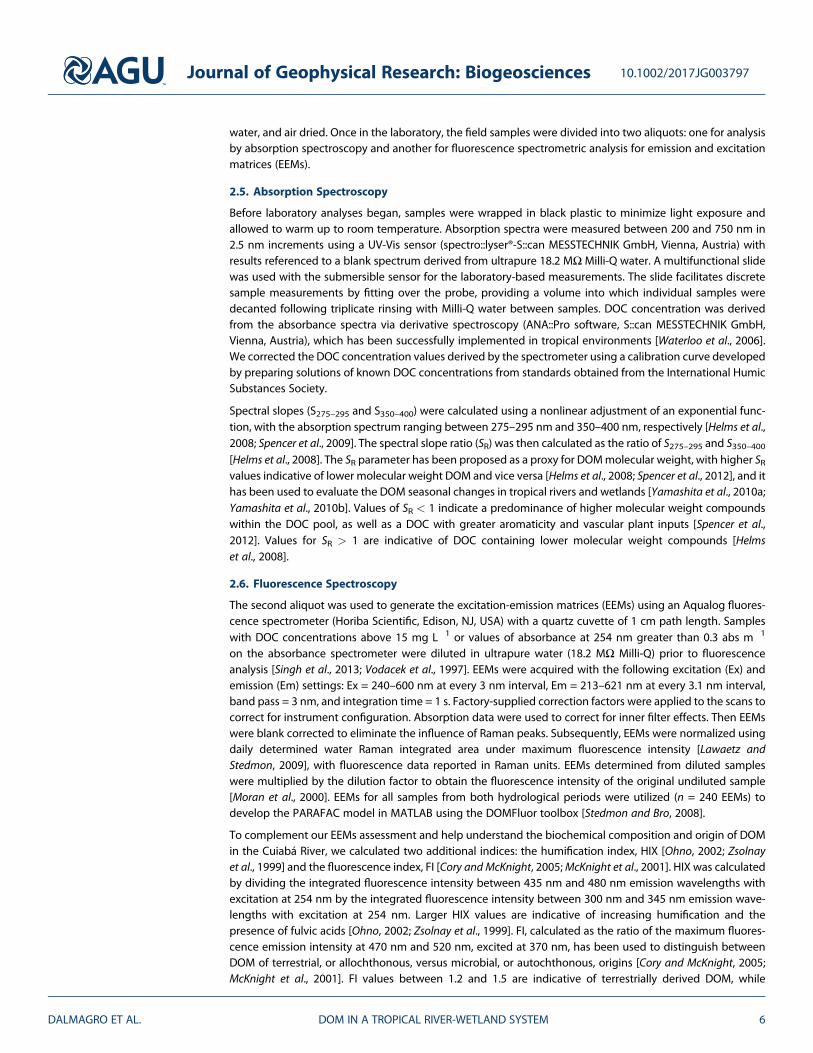
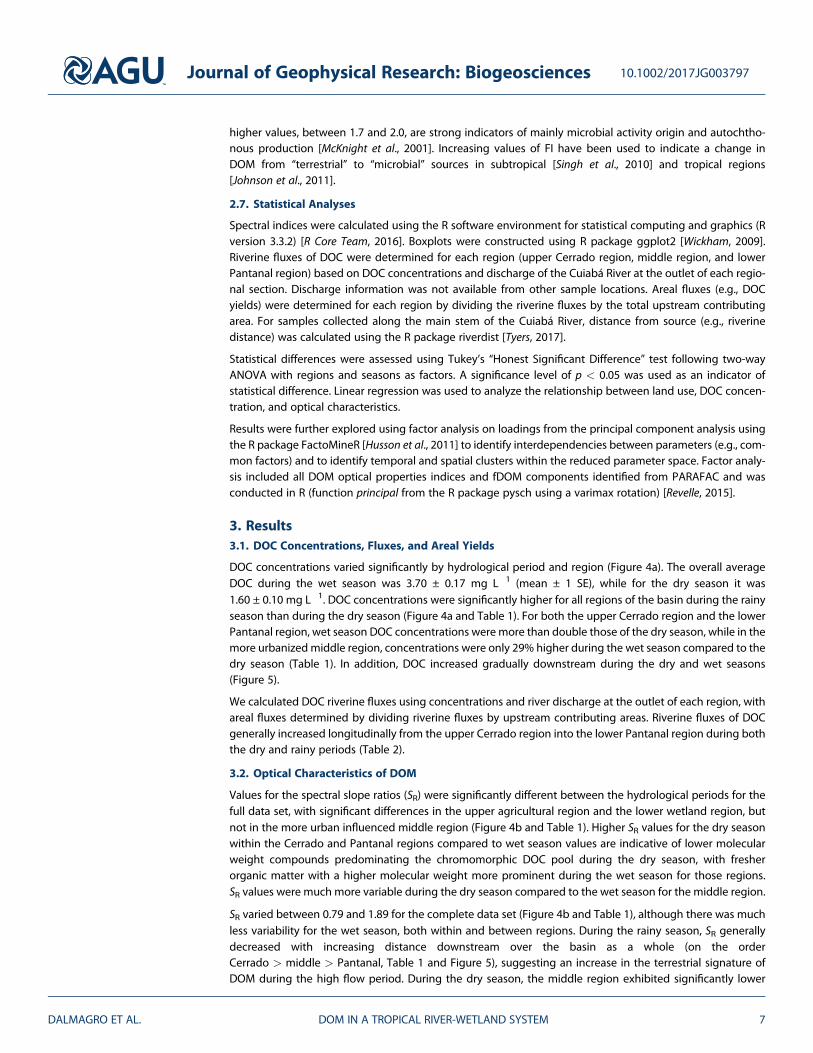
DOC concentrations varied significantly by hydrological period and region (Figure 4a). The overall averageDOC during the wet season was 3.70 ± 0.17 mg L!1 (mean ± 1 SE), while for the dry season it was1.60 ± 0.10 mg L!1. DOC concentrations were significantly higher for all regions of the basin during the rainyseason than during the dry season (Figure 4a and Table 1). For both the upper Cerrado region and the lowerPantanal region, wet season DOC concentrations were more than double those of the dry season, while in themore urbanized middle region, concentrations were only 29% higher during the wet season compared to thedry season (Table 1). In addition, DOC increased gradually downstream during the dry and wet seasons(Figure 5).
We calculated DOC riverine fluxes using concentrations and river discharge at the outlet of each region, withareal fluxes determined by dividing riverine fluxes by upstream contributing areas. Riverine fluxes of DOCgenerally increased longitudinally from the upper Cerrado region into the lower Pantanal region during boththe dry and rainy periods (Table 2).
3.2. Optical Characteristics of DOM
Values for the spectral slope ratios (SR) were significantly different between the hydrological periods for thefull data set, with significant differences in the upper agricultural region and the lower wetland region, butnot in the more urban influenced middle region (Figure 4b and Table 1). Higher SR values for the dry seasonwithin the Cerrado and Pantanal regions compared to wet season values are indicative of lower molecularweight compounds predominating the chromomorphic DOC pool during the dry season, with fresherorganic matter with a higher molecular weight more prominent during the wet season for those regions.SR values were much more variable during the dry season compared to the wet season for the middle region.
SR varied between 0.79 and 1.89 for the complete data set (Figure 4b and Table 1), although there was muchless variability for the wet season, both within and between regions. During the rainy season, SR generallydecreased with increasing distance downstream over the basin as a whole (on the orderCerrado > middle > Pantanal, Table 1 and Figure 5), suggesting an increase in the terrestrial signature ofDOM during the high flow period. During the dry season, the middle region exhibited significantly lower
Journal of Geophysical Research: Biogeosciences 10.1002/2017JG003797
DALMAGRO ET AL. DOM IN A TROPICAL RIVER-WETLAND SYSTEM 7
values for SR compared to Cerrado and Pantanal regions (Figure 4b and Table 1), indicating a contribution offresher DOM with higher molecular weight in this more urbanized region compared to the other regions ofthe basin. During the dry season, no spatial trend was observed for SR, although lowest values were observedin the middle region (Figure 5).
The FI values ranged between 1.39 and 1.71 for all hydrological periods and collection points. The mean FIvalues showed significant differences between hydrological periods, with higher values during the dry periodand lower values indicative of more allochthonous terrestrial origin during the rainy season (Figure 4c andTable 1). We found that FI was more variable during the dry season throughout much of the basin(Figure 4c). Within each region, FI values indicated that DOC was characterized by a greater degree ofmicrobial processing during the dry season compared to DOC that is more directly terrestrially derived duringthe wet season (Figure 4c and Table 1). Overall, the highest FI values were observed for the dry season in themiddle region, indicating amore microbially derived DOC pool for that more urbanized region during the lowwater period.
Basin-wide, HIX values showed a significant difference between the hydrological periods for all regions, withsignificantly higher HIX values during the rainy season (8.12 ± 0. 77) than during the dry season (2.76 ± 0.12,Figure 4d and Table 1). In general, HIX values were lower and less variable in the Cerrado and middle regions,
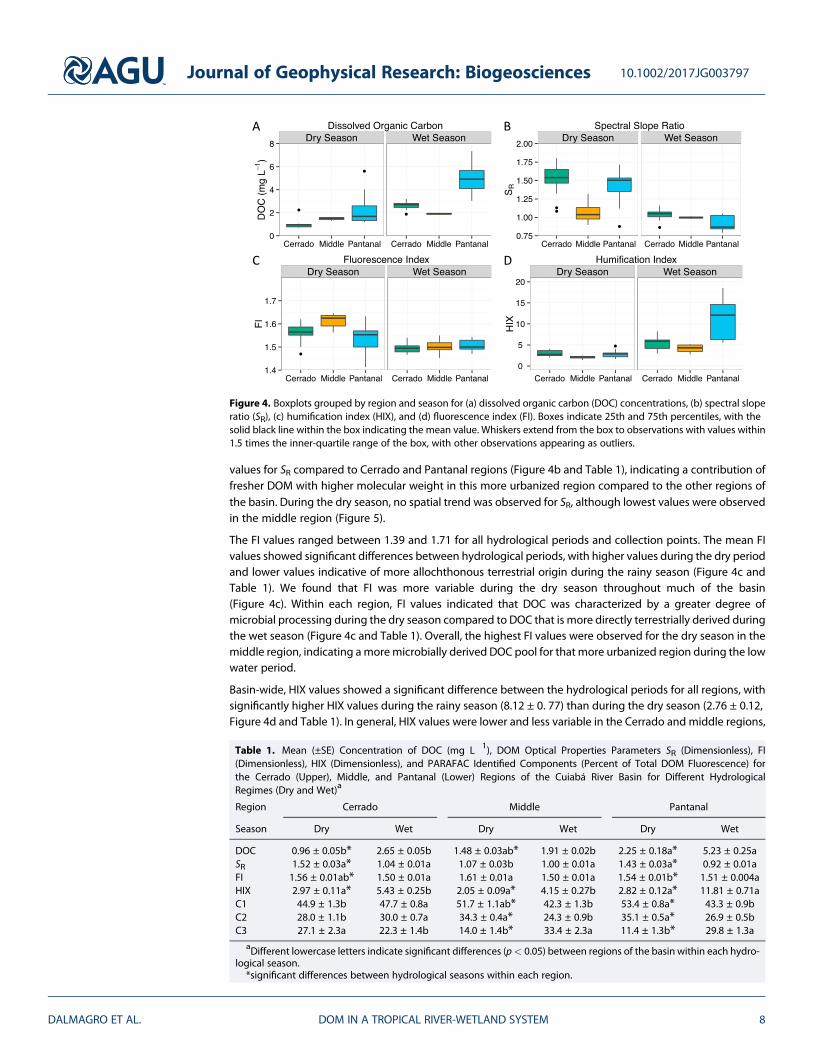
Table 1. Mean (±SE) Concentration of DOC (mg L!1), DOM Optical Properties Parameters SR (Dimensionless), FI(Dimensionless), HIX (Dimensionless), and PARAFAC Identified Components (Percent of Total DOM Fluorescence) forthe Cerrado (Upper), Middle, and Pantanal (Lower) Regions of the Cuiabá River Basin for Different HydrologicalRegimes (Dry and Wet)a
Region Cerrado Middle Pantanal
Season Dry Wet Dry Wet Dry Wet
DOC 0.96 ± 0.05b* 2.65 ± 0.05b 1.48 ± 0.03ab* 1.91 ± 0.02b 2.25 ± 0.18a* 5.23 ± 0.25aSR 1.52 ± 0.03a* 1.04 ± 0.01a 1.07 ± 0.03b 1.00 ± 0.01a 1.43 ± 0.03a* 0.92 ± 0.01aFI 1.56 ± 0.01ab* 1.50 ± 0.01a 1.61 ± 0.01a 1.50 ± 0.01a 1.54 ± 0.01b* 1.51 ± 0.004aHIX 2.97 ± 0.11a* 5.43 ± 0.25b 2.05 ± 0.09a* 4.15 ± 0.27b 2.82 ± 0.12a* 11.81 ± 0.71aC1 44.9 ± 1.3b 47.7 ± 0.8a 51.7 ± 1.1ab* 42.3 ± 1.3b 53.4 ± 0.8a* 43.3 ± 0.9bC2 28.0 ± 1.1b 30.0 ± 0.7a 34.3 ± 0.4a* 24.3 ± 0.9b 35.1 ± 0.5a* 26.9 ± 0.5bC3 27.1 ± 2.3a 22.3 ± 1.4b 14.0 ± 1.4b* 33.4 ± 2.3a 11.4 ± 1.3b* 29.8 ± 1.3a
aDifferent lowercase letters indicate significant differences (p< 0.05) between regions of the basin within each hydro-logical season.*significant differences between hydrological seasons within each region.
Figure 4. Boxplots grouped by region and season for (a) dissolved organic carbon (DOC) concentrations, (b) spectral sloperatio (SR), (c) humification index (HIX), and (d) fluorescence index (FI). Boxes indicate 25th and 75th percentiles, with thesolid black line within the box indicating the mean value. Whiskers extend from the box to observations with values within1.5 times the inner-quartile range of the box, with other observations appearing as outliers.
Journal of Geophysical Research: Biogeosciences 10.1002/2017JG003797
DALMAGRO ET AL. DOM IN A TROPICAL RIVER-WETLAND SYSTEM 8
increasing in the Pantanal region in the wet season (Figure 4d and Table 1) when extensive terrestrial areasare flooded and become hydrologically connected to the Cuiabá River. During the rainy season the values ofHIX showed a systematic and marked increase in their values downstream, from values close to 3 (Cerradoregion) to values greater than 10 (Pantanal region) (Figure 5). Dry season HIX values were similar acrossthe three regions (Figure 4d and Table 1), but with a slight longitudinal decline downstream (Figure 5).
3.3. DOM Components Determined by PARAFAC Analysis
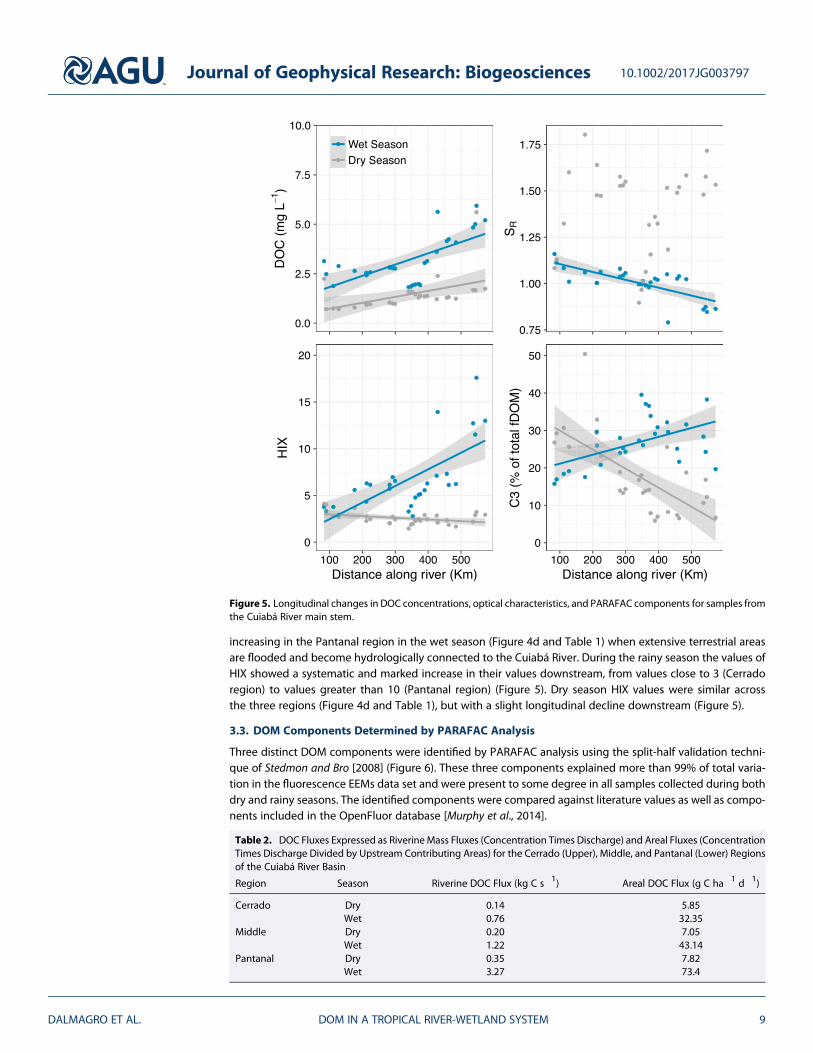
Three distinct DOM components were identified by PARAFAC analysis using the split-half validation techni-que of Stedmon and Bro [2008] (Figure 6). These three components explained more than 99% of total varia-tion in the fluorescence EEMs data set and were present to some degree in all samples collected during bothdry and rainy seasons. The identified components were compared against literature values as well as compo-nents included in the OpenFluor database [Murphy et al., 2014].
Table 2. DOC Fluxes Expressed as RiverineMass Fluxes (Concentration Times Discharge) and Areal Fluxes (ConcentrationTimes Discharge Divided by Upstream Contributing Areas) for the Cerrado (Upper), Middle, and Pantanal (Lower) Regionsof the Cuiabá River Basin
Region Season Riverine DOC Flux (kg C s!1) Areal DOC Flux (g C ha!1 d!1)
Cerrado Dry 0.14 5.85Wet 0.76 32.35
Middle Dry 0.20 7.05Wet 1.22 43.14
Pantanal Dry 0.35 7.82Wet 3.27 73.4
Figure 5. Longitudinal changes in DOC concentrations, optical characteristics, and PARAFAC components for samples fromthe Cuiabá River main stem.
Journal of Geophysical Research: Biogeosciences 10.1002/2017JG003797
DALMAGRO ET AL. DOM IN A TROPICAL RIVER-WETLAND SYSTEM 9
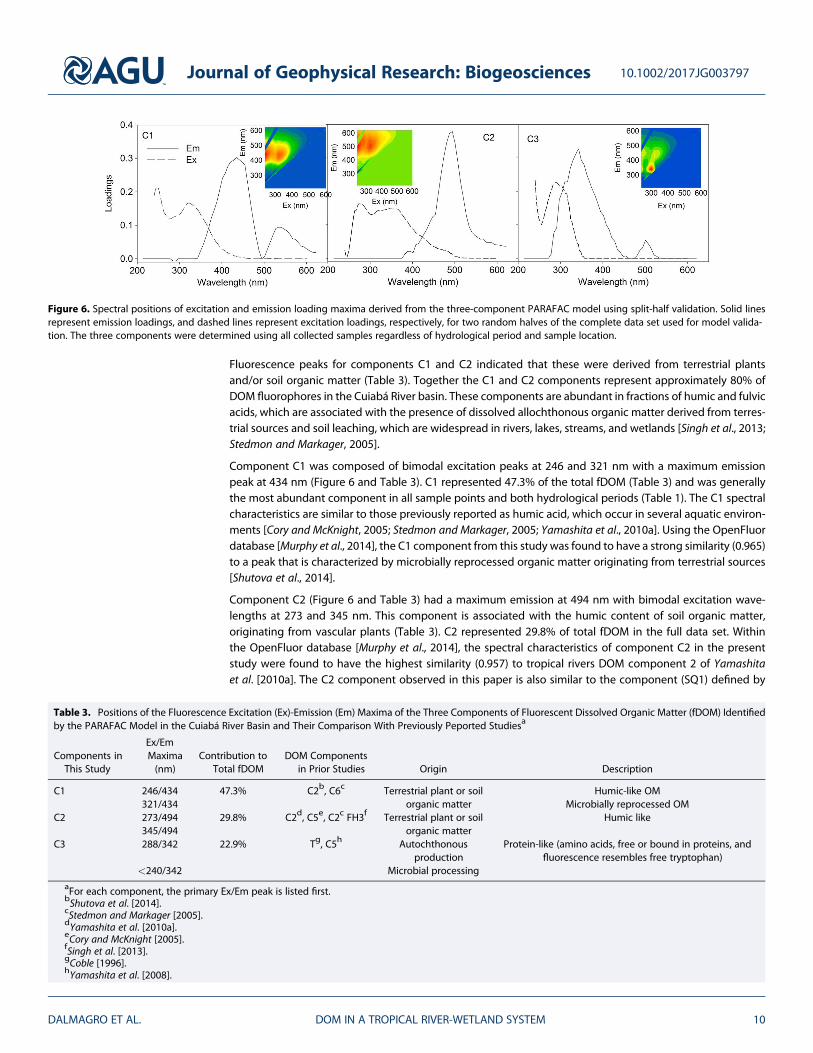
Fluorescence peaks for components C1 and C2 indicated that these were derived from terrestrial plantsand/or soil organic matter (Table 3). Together the C1 and C2 components represent approximately 80% ofDOM fluorophores in the Cuiabá River basin. These components are abundant in fractions of humic and fulvicacids, which are associated with the presence of dissolved allochthonous organic matter derived from terres-trial sources and soil leaching, which are widespread in rivers, lakes, streams, and wetlands [Singh et al., 2013;Stedmon and Markager, 2005].
Component C1 was composed of bimodal excitation peaks at 246 and 321 nm with a maximum emissionpeak at 434 nm (Figure 6 and Table 3). C1 represented 47.3% of the total fDOM (Table 3) and was generallythe most abundant component in all sample points and both hydrological periods (Table 1). The C1 spectralcharacteristics are similar to those previously reported as humic acid, which occur in several aquatic environ-ments [Cory and McKnight, 2005; Stedmon and Markager, 2005; Yamashita et al., 2010a]. Using the OpenFluordatabase [Murphy et al., 2014], the C1 component from this study was found to have a strong similarity (0.965)to a peak that is characterized by microbially reprocessed organic matter originating from terrestrial sources[Shutova et al., 2014].
Component C2 (Figure 6 and Table 3) had a maximum emission at 494 nm with bimodal excitation wave-lengths at 273 and 345 nm. This component is associated with the humic content of soil organic matter,originating from vascular plants (Table 3). C2 represented 29.8% of total fDOM in the full data set. Withinthe OpenFluor database [Murphy et al., 2014], the spectral characteristics of component C2 in the presentstudy were found to have the highest similarity (0.957) to tropical rivers DOM component 2 of Yamashitaet al. [2010a]. The C2 component observed in this paper is also similar to the component (SQ1) defined by
Figure 6. Spectral positions of excitation and emission loading maxima derived from the three-component PARAFAC model using split-half validation. Solid linesrepresent emission loadings, and dashed lines represent excitation loadings, respectively, for two random halves of the complete data set used for model valida-tion. The three components were determined using all collected samples regardless of hydrological period and sample location.
Table 3. Positions of the Fluorescence Excitation (Ex)-Emission (Em) Maxima of the Three Components of Fluorescent Dissolved Organic Matter (fDOM) Identifiedby the PARAFAC Model in the Cuiabá River Basin and Their Comparison With Previously Peported Studiesa
Components inThis Study
Ex/EmMaxima(nm)
Contribution toTotal fDOM
DOM Componentsin Prior Studies Origin Description
C1 246/434 47.3% C2b, C6c Terrestrial plant or soilorganic matter
Humic-like OM321/434 Microbially reprocessed OM
C2 273/494 29.8% C2d, C5e, C2c FH3f Terrestrial plant or soilorganic matter
Humic like345/494
C3 288/342 22.9% Tg, C5h Autochthonousproduction
Protein-like (amino acids, free or bound in proteins, andfluorescence resembles free tryptophan)
<240/342 Microbial processingaFor each component, the primary Ex/Em peak is listed first.bShutova et al. [2014].cStedmon and Markager [2005].dYamashita et al. [2010a].eCory and McKnight [2005].fSingh et al. [2013].gCoble [1996].hYamashita et al. [2008].
Journal of Geophysical Research: Biogeosciences 10.1002/2017JG003797
DALMAGRO ET AL. DOM IN A TROPICAL RIVER-WETLAND SYSTEM 10
Cory and McKnight [2005], and a com-ponent attributed to terrestrial humicmatter in the Florida Everglades[Yamashita et al., 2008].
Component C3 showed two peaks ofmaximum excitation at 240 and288 nm, with maximum emission at342 nm (Figure 6). This componenthas been reported as “free”tryptophan- and tyrosine-like DOMmoieties (Table 3). Component C3was also present throughout thebasin, representing 22.9% of totalfDOM in the full data set. A matchfor C3 was not identified in theOpenFluor database at this time.However, there are numerous exam-ples of protein-like DOM componentsin the literature with similar spectralcharacteristics (for example,Component 7 of Stedmon andMarkager [2005]). Protein-like DOMis common in natural andanthropogenic-impacted systems[Baker, 2001, 2002; Baker andInverarity, 2004; Stedmon andMarkager, 2005], particularly duringlow flow periods.
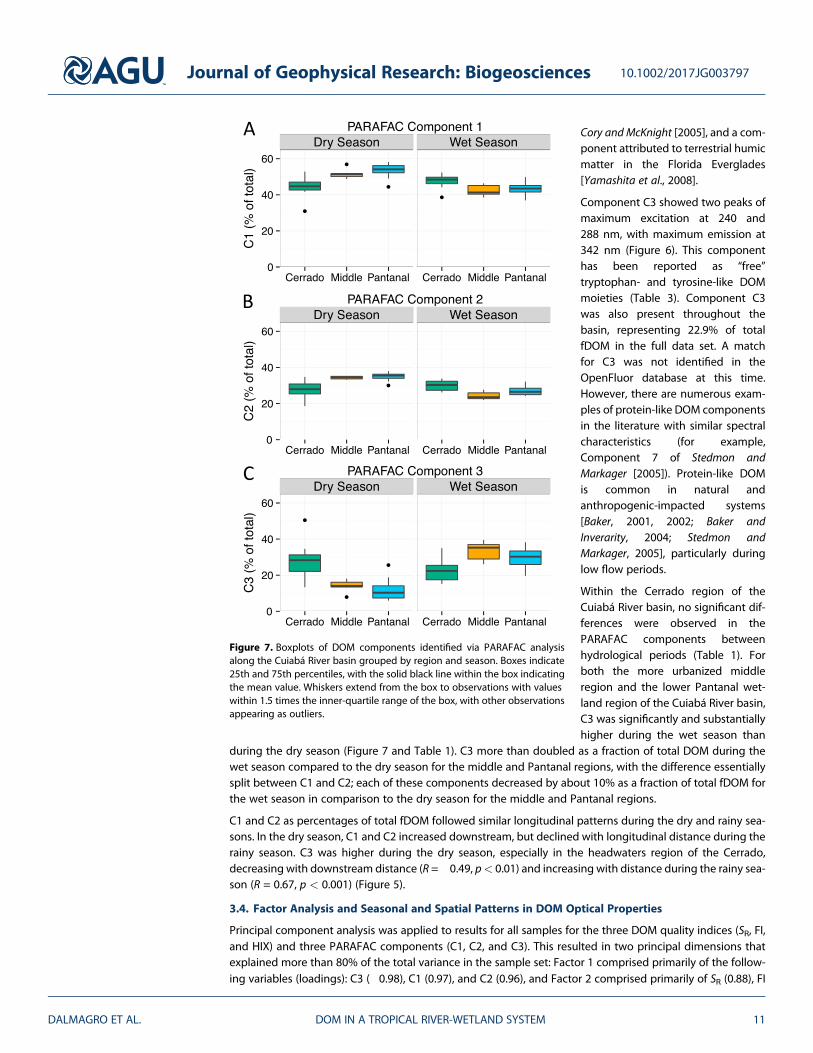
Within the Cerrado region of theCuiabá River basin, no significant dif-ferences were observed in thePARAFAC components betweenhydrological periods (Table 1). Forboth the more urbanized middleregion and the lower Pantanal wet-land region of the Cuiabá River basin,C3 was significantly and substantiallyhigher during the wet season than
during the dry season (Figure 7 and Table 1). C3 more than doubled as a fraction of total DOM during thewet season compared to the dry season for the middle and Pantanal regions, with the difference essentiallysplit between C1 and C2; each of these components decreased by about 10% as a fraction of total fDOM forthe wet season in comparison to the dry season for the middle and Pantanal regions.
C1 and C2 as percentages of total fDOM followed similar longitudinal patterns during the dry and rainy sea-sons. In the dry season, C1 and C2 increased downstream, but declined with longitudinal distance during therainy season. C3 was higher during the dry season, especially in the headwaters region of the Cerrado,decreasing with downstream distance (R =!0.49, p< 0.01) and increasing with distance during the rainy sea-son (R = 0.67, p < 0.001) (Figure 5).
3.4. Factor Analysis and Seasonal and Spatial Patterns in DOM Optical Properties
Principal component analysis was applied to results for all samples for the three DOM quality indices (SR, FI,and HIX) and three PARAFAC components (C1, C2, and C3). This resulted in two principal dimensions thatexplained more than 80% of the total variance in the sample set: Factor 1 comprised primarily of the follow-ing variables (loadings): C3 (!0.98), C1 (0.97), and C2 (0.96), and Factor 2 comprised primarily of SR (0.88), FI
Figure 7. Boxplots of DOM components identified via PARAFAC analysisalong the Cuiabá River basin grouped by region and season. Boxes indicate25th and 75th percentiles, with the solid black line within the box indicatingthe mean value. Whiskers extend from the box to observations with valueswithin 1.5 times the inner-quartile range of the box, with other observationsappearing as outliers.
Journal of Geophysical Research: Biogeosciences 10.1002/2017JG003797
DALMAGRO ET AL. DOM IN A TROPICAL RIVER-WETLAND SYSTEM 11
(0.77), and HIX (!0.65). Loadings for Factors 1 and 2 explained 58.3% and 23.5% of the total variance in theresults dataset, respectively.
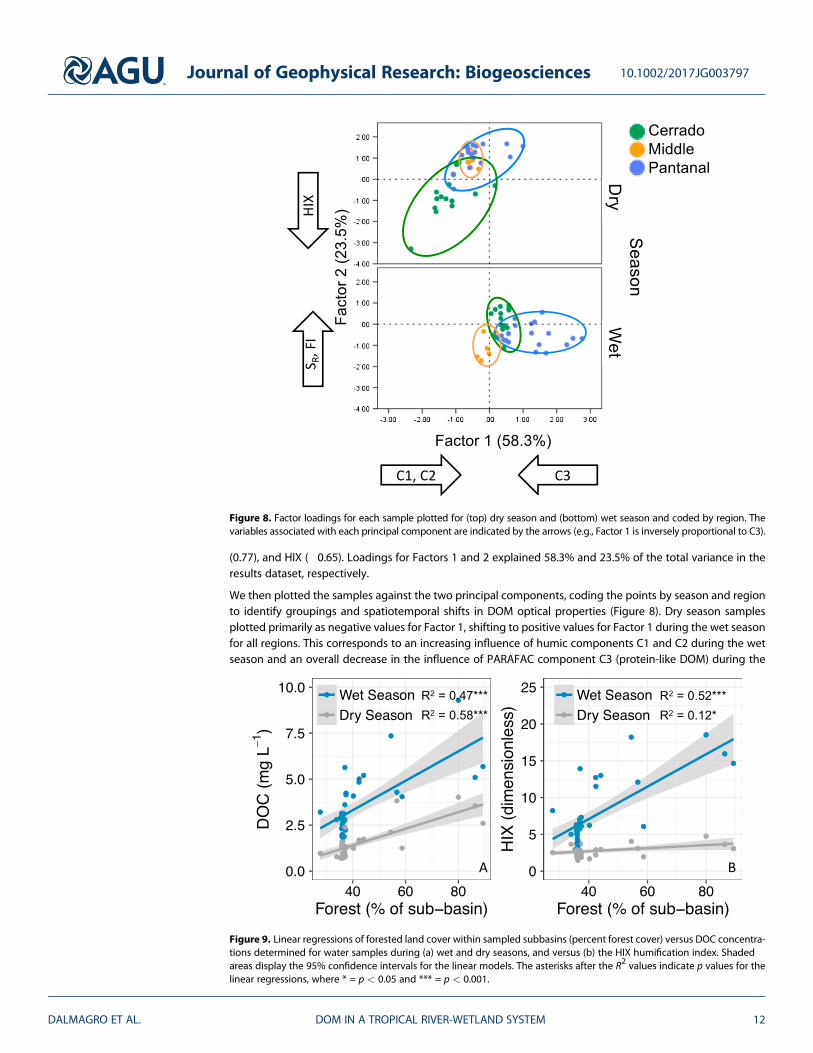
We then plotted the samples against the two principal components, coding the points by season and regionto identify groupings and spatiotemporal shifts in DOM optical properties (Figure 8). Dry season samplesplotted primarily as negative values for Factor 1, shifting to positive values for Factor 1 during the wet seasonfor all regions. This corresponds to an increasing influence of humic components C1 and C2 during the wetseason and an overall decrease in the influence of PARAFAC component C3 (protein-like DOM) during the
Figure 8. Factor loadings for each sample plotted for (top) dry season and (bottom) wet season and coded by region. Thevariables associated with each principal component are indicated by the arrows (e.g., Factor 1 is inversely proportional to C3).
Figure 9. Linear regressions of forested land cover within sampled subbasins (percent forest cover) versus DOC concentra-tions determined for water samples during (a) wet and dry seasons, and versus (b) the HIX humification index. Shadedareas display the 95% confidence intervals for the linear models. The asterisks after the R2 values indicate p values for thelinear regressions, where * = p < 0.05 and *** = p < 0.001.
Journal of Geophysical Research: Biogeosciences 10.1002/2017JG003797
DALMAGRO ET AL. DOM IN A TROPICAL RIVER-WETLAND SYSTEM 12
wet season, a pattern that was observed across each of the three regions (Figure 8, where Factor 1 values areplotted on the x axis). This shift is consistent with the functional description that humic-like DOM is trans-ported from the terrestrial environment to the hydrosphere during periods of heightened hydrologicconnectivity [Lambert et al., 2016a].
The Pantanal and middle regions also plotted lower for Factor 2 during the wet season compared to the dryseason (Factor 2 values refer to y axis dimension of Figure 8), further suggesting the role of wet season hydro-logical connectivity in transporting terrestrially derived DOM (lower FI values) composed of higher molecularweight compounds with greater aromaticity and vascular plant inputs (lower SR values) [Spencer et al., 2012],which is more humified overall (higher HIX values).
The Pantanal sample points shifted from plotting primarily in the upper left quadrant of the principal compo-nent space for the dry season to the lower right quadrant for the wet season, while Cerrado samples shiftedfrom the lower left (dry season) to the upper right (wet season) quadrants (Figure 8). The middle regionshowed the tightest groupings and the smallest shifts between seasons. Cerrado region samples plottedwithin a similar range for Factor 2 for both hydrologic periods but exhibited a significant shift and tightergrouping for Factor 1 (lower protein-like fDOM and more humic like fDOM) during the wet season comparedto the dry season.
3.5. Land Cover Relationships to DOC Concentrations and Optical Properties
DOC concentration and HIX were found to be the parameters most strongly correlated with land cover,which showed the strongest relationships with forest cover for both dry and wet seasons (Figure S1 insupporting information). Further, forest cover exhibited the largest range among subbasins (27–89%forest) for land cover classes. For these reasons, we focused further analysis in relation to forest cover.DOC concentrations and HIX values were found to increase for increasing forest cover during both wet
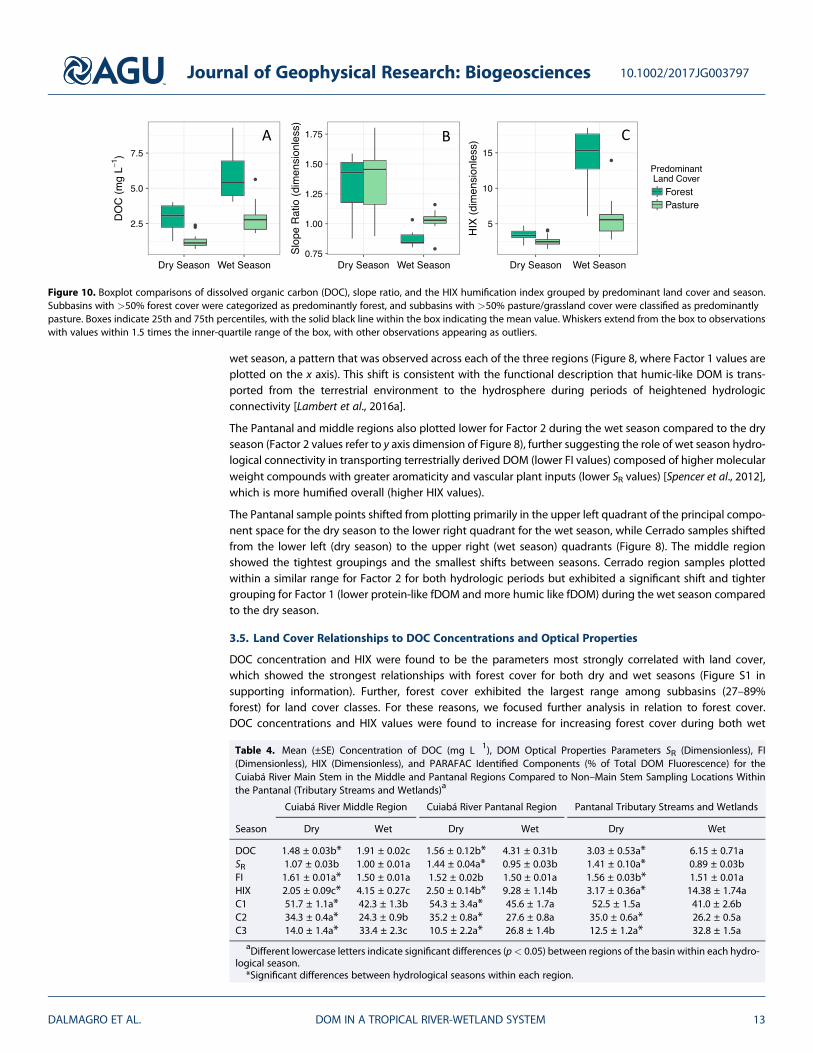
Figure 10. Boxplot comparisons of dissolved organic carbon (DOC), slope ratio, and the HIX humification index grouped by predominant land cover and season.Subbasins with >50% forest cover were categorized as predominantly forest, and subbasins with >50% pasture/grassland cover were classified as predominantlypasture. Boxes indicate 25th and 75th percentiles, with the solid black line within the box indicating the mean value. Whiskers extend from the box to observationswith values within 1.5 times the inner-quartile range of the box, with other observations appearing as outliers.
Table 4. Mean (±SE) Concentration of DOC (mg L!1), DOM Optical Properties Parameters SR (Dimensionless), FI(Dimensionless), HIX (Dimensionless), and PARAFAC Identified Components (% of Total DOM Fluorescence) for theCuiabá River Main Stem in the Middle and Pantanal Regions Compared to Non–Main Stem Sampling Locations Withinthe Pantanal (Tributary Streams and Wetlands)a
Cuiabá River Middle Region Cuiabá River Pantanal Region Pantanal Tributary Streams and Wetlands
Season Dry Wet Dry Wet Dry Wet
DOC 1.48 ± 0.03b* 1.91 ± 0.02c 1.56 ± 0.12b* 4.31 ± 0.31b 3.03 ± 0.53a* 6.15 ± 0.71aSR 1.07 ± 0.03b 1.00 ± 0.01a 1.44 ± 0.04a* 0.95 ± 0.03b 1.41 ± 0.10a* 0.89 ± 0.03bFI 1.61 ± 0.01a* 1.50 ± 0.01a 1.52 ± 0.02b 1.50 ± 0.01a 1.56 ± 0.03b* 1.51 ± 0.01aHIX 2.05 ± 0.09c* 4.15 ± 0.27c 2.50 ± 0.14b* 9.28 ± 1.14b 3.17 ± 0.36a* 14.38 ± 1.74aC1 51.7 ± 1.1a* 42.3 ± 1.3b 54.3 ± 3.4a* 45.6 ± 1.7a 52.5 ± 1.5a 41.0 ± 2.6bC2 34.3 ± 0.4a* 24.3 ± 0.9b 35.2 ± 0.8a* 27.6 ± 0.8a 35.0 ± 0.6a* 26.2 ± 0.5aC3 14.0 ± 1.4a* 33.4 ± 2.3c 10.5 ± 2.2a* 26.8 ± 1.4b 12.5 ± 1.2a* 32.8 ± 1.5a
aDifferent lowercase letters indicate significant differences (p< 0.05) between regions of the basin within each hydro-logical season.*Significant differences between hydrological seasons within each region.
Journal of Geophysical Research: Biogeosciences 10.1002/2017JG003797
DALMAGRO ET AL. DOM IN A TROPICAL RIVER-WETLAND SYSTEM 13
and dry seasons (Figure 9). Regressions were highly significant (p < 0.001) during the wet season, but therelationship between HIX and forest cover did not vary as strongly during the dry season (R2 = 0.12,p < 0.05; Figure 9b).
We explored these relationships furthers by coding subbasins with land cover>50% forest as “predominantlyforest,” and coding subbasins with land cover >50% pasture as “predominantly pasture.” Significant differ-ences were observed between predominantly forested areas and predominantly pasture areas, with DOCconcentrations and HIX values higher for predominantly forested areas for both wet and dry seasons(Figures 9a and 9c). Values for SR were similar for forest (1.33 ± 0.11, mean ± 1 standard error) and pasture-dominated areas (1.37 ± 0.05) during the dry season (p > 0.05), but wet season values for SR were higherfor pasture (1.03 ± 0.01) compared to forest (0.88 ± 0.03; Figure 10b).
4. Discussion4.1. Role of Hydrologic Connectivity on DOM Characteristics
Carbon derived from the terrestrial biosphere is mobilized by precipitation from soils to streams and ground-water and can travel by different flow paths (e.g., via groundwater and unsaturated subsurface flow and viasurface flow in a flooded forest) [Neu et al., 2016;Ward et al., 2017]. Much of the DOC observed in surficial flowis removed from solution as water percolates through the soil layers due to biological decomposition andsorption /desorption to mineral surfaces, resulting in low concentrations in streams and groundwater [Neuet al., 2016]. DOC concentrations tend to be elevated during hydrological events (storms), which can beresponsible for the majority of DOC export on the rising limbs of hydrographs [Raymond and Saiers, 2010].
Although our wet season sampling was conducted after the peak in the annual hydrograph, our data shows alongitudinal increase in DOC concentrations (Table 2 and Figure 5), partly due to the increase in hydrologicalconnectivity that promotes the longitudinal input of DOC from the tributaries [Singh et al., 2015; Lambertet al., 2016b]. The importance of wetlands as a constant source of DOC is documented by Duan et al.[2017], who found that downstream decreases in DOC for the Mississippi River were due to the loss of wet-lands caused by changes in land use.
In the middle region of the study basin, a relative increase in DOC was expected to result from domestic andindustrial effluents from urban areas entering the river. However, the higher flow in this part of the river com-pared to the upper region (Figure 4) may have resulted in a dilution of these effluents during the wet seasoncompared to the upper Cerrado region. DOC concentrations remained rather stable in the middle region,increasing in both concentration and variability within the Pantanal region (Figure 4a).
We hypothesized that DOM characteristics of the Cerrado, middle, and Pantanal regions of the CuiabáRiver basin would be more regionally differentiated during the dry season when hydrologic connectivityis lowest. Regional differences were observed, with DOC concentration during the dry season increasingsignificantly on the order Cerrado < middle < Pantanal (Table 1). There were also large regional differ-ences in most DOC optical metrics between regions during the dry season (Figure 4). Only the humifica-tion index (HIX) differed at the regional scale more for the wet season than the dry season. Overall, dryseason locations in the middle region had lower SR values compared to the other regions (indicatingfresher material with higher molecular weights) and higher FI values (more microbially derived DOM),suggesting the possible influence of domestic and industrial effluents from urban areas entering the river.These patterns could also have resulted from reduced terrestrial inputs and/or an increase in groundwatercontribution to river discharge.
As a corollary hypothesis, we postulated that DOC characteristics and concentrations would be most similarduring the wet season when runoff from upland agricultural areas and urban effluents flood the relativelypristine Pantanal as overbanking rivers reestablish hydrological connectivity between the river and the flood-plain. In order to test these hypotheses in more detail, we further separated Pantanal sampling locations intothose collected from the main stem of the Cuiabá River and those collected from tributaries and lentic areasthat are seasonally connected to the main stem and floodplain.
The increase in the Cuiabá River level during the wet season resulted in hydrologic connectivity across thePantanal wetland complex, flooding both tall-stature forest and grass-dominated areas and connecting theCuiabá River with the floodplain and wetland lakes that are isolated during the dry season. Such
Journal of Geophysical Research: Biogeosciences 10.1002/2017JG003797
DALMAGRO ET AL. DOM IN A TROPICAL RIVER-WETLAND SYSTEM 14
connectivity has been shown to occur at Cuiabá River stages greater than 3 m within the collection area[Girard et al., 2010], which occurred over 119 days in 2013 (maximum river stage of 4.64 m), which encom-passed our wet season sampling campaign.
Higher DOC concentrations in the wetland region of the study basin during the high flow period, and inparticular the higher concentrations in tributary streams and ephemerally connected wetland features,suggest that the increase in rainfall and runoff can drive higher C release, as was also observed by Lambertet al. [2016b]. The relative increase observed in the DOC pool in the Pantanal during the wet season exhibitedcharacteristics of originating primarily from terrestrial sources. This can be seen in the increase in terrestrialfDOM components in the Pantanal during the wet compared to the dry season, accompanied by higher(e.g., more humified) HIX values, lower (e.g., more terrestrial) FI values, and lower (e.g., larger molecularweight DOM) SR values (Figure 8 and Table 1). During the dry season, forests and grasslands are isolated fromthe river system and decomposition and humification processes occur on the terrestrial components ofthe Pantanal.
Despite DOM derived from plant decomposition being generally labile or semilabile when compared toDOM derived from the soil [Mladenov et al., 2007], some components from organic matter decompositionexudates seem to be resistant to fast degradation [Mladenov et al., 2007]. The high concentrations ofhumic DOM in anoxic floodplain soils have been attributed to the low and inefficient decomposition oforganic matter [Mulholland, 2002], although soil organic matter itself is coming to be viewed as a conti-nuum of progressively decomposing organic compounds [Lehmann and Kleber, 2015]. Within this frame-work, terrestrial DOM entering streams and rivers will persist and/or be transported or processed basedon occlusion by or adsorption to minerals as well as their relative solubility and degradability by microbes[Lehmann and Kleber, 2015]. During the wet season when large expanses of terrestrial areas becomeflooded and connected to the river system, terrestrially derived materials are transported by the river asallochthonous DOM. This terrestrial DOM is likely less labile, leading it to persist longer in the ecosystem[Ohno, 2002; Singh et al., 2010; Zsolnay et al., 1999]. During the wet season, hydrological connectivityenables transport of these compounds from wetlands to the river system. Likewise, hydrologic residencetime of the river system declines during the wet season, facilitating export of both relatively labile DOMcompounds as well as more recalcitrant forms of DOM.
In general, tributary streams and wetlands were higher in DOC than the main stem of the Cuiabá River withinthe Pantanal throughout the year, but contributed DOM to the Pantanal wetland complex that was higher inprotein-like substances (component C3) and substantially more humified (HIX) than the Cuiabá River duringthe hydrologically connected wet season (Table 4). Wet season connectivity led to similar levels of C2 (humic-like DOM) for Pantanal samples from the main stem of the Cuiabá compared to its Pantanal tributary streamsand wetlands, but higher levels of C1 (reprocessed OM) in the main stem compared to tributaries and wet-lands (Table 4). This is likely due to instream decomposition occurring more extensively with longer traveltimes within main stem compared to shorter wet season travel times for tributaries and wetlands.
Protein-like DOM during the wet season represented a larger fraction of total fDOM for the Cuiabá River in themiddle section compared to the main stem of the Cuiabá in the Pantanal Region. This difference is likely dueto degradation of this more labile form of DOM as the river traverses the lower, slower moving area of thebasin, or by sorption of protein-like DOM to particles [Aufdenkampe et al., 2011]. Levels of C3 DOM werehigher in the Pantanal tributary streams and wetlands than the Cuiabá main stem during the wet seasonand were at levels that were statistically similar to the Cuiabá River in the middle region (Table 4). Here itmay be that extensive pastures in the Pantanal that are grazed during the dry season contribute protein-likeDOM from manure deposited in fields.
Although we were not able to provide a quantitative estimate the volume of wastewater discharge in themiddle region of the basin, increases in protein-like DOM may be associated with increased microbiologicalactivities [Suhett et al., 2006; Köhler et al., 2013; Kothawala et al., 2014]. Other research on water quality withinthe more urban middle region of Cuiabá River basin found that dissolved oxygen concentrations were muchlower during the wet season (3.20 mg L!1 O2 in the wet season versus 6.92 mg L!1 O2 in the dry season)[Secretaria de Estado do Meio Ambiente (SEMA), 2016]. Nutrient and bacterial concentrations were also foundto be higher in the wet season, with total dissolved nitrogen concentrations of 0.5 mg L!1 N in the dry seasoncompared to 10.3 mg L!1 N in the wet season, total dissolved phosphorus concentrations of 0.1 versus
Journal of Geophysical Research: Biogeosciences 10.1002/2017JG003797
DALMAGRO ET AL. DOM IN A TROPICAL RIVER-WETLAND SYSTEM 15
0.3 mg L!1 P for dry and wet seasons, respectively, and bacterial concentration in 24 times higher in the wetseason than the dry season [SEMA, 2016]. These increases are consistent with the increased C3 proportions oftotal fDOM that we observed for the middle region during the wet season.
Longitudinal analysis for samples collected from the main stem of the Cuiabá River showed that the C3component underwent significant processing during the dry season from the headwaters of the Cerradoto the Pantanal, suggesting that riverine consumption of this fluorophore was greater than the subsequentinputs and/ or production in the downstream regions (Figure 5). Higher inputs of C3 from the Cerrado regionin the dry season could result from the increase in WRT in relation to lower flows and slower velocities, lead-ing to increased autochthonous production within the headwaters region. DOM originating from microbialand autochthonous production is typically considered more labile than DOM derived from soil [Williamset al., 2010] and is thus removed more rapidly instream once introduced [Balcaraczyk et al., 2009]. Duringthe dry season in the present study, C1 and C2 increased longitudinally, while C3 decreased (Figure 5). Thereduction of C3 during the dry season along the Cuiabá River Basin is consistent with a recent study of long-itudinal flows in the Zambezi River Basin, where a considerable decrease in flow during the low flow periodled to a decrease in water velocities and, subsequently, to an increase in WRT, allowing amore efficient degra-dation of DOM during lower flow periods [Lambert et al., 2016b].
While components C1 and C2 presented a longitudinal reduction during the wet season in the present study,C3 showed a considerable longitudinal increase, mainly within the middle region (Figure 5). This increase inC3 within the middle region could be due to saturation of the instream processing capacity of protein-likeDOM corresponding to lower DO levels during low flows [SEMA, 2016], resulting in less thorough decomposi-tion of untreated urban effluents [Zeilhofer et al., 2010].
During the rainy season, DOC fluxes increase steadily from upstream to downstream (Table 2), and higherflows perturb the downstream gradient of the DOM components we observed during the dry season. Theincreased water levels mobilize a higher proportion of terrestrial DOM, and higher water velocities increasethe travel distance of humic soil and aromatic compounds as humic-like DOM is removed more slowly fromthe DOM pool [Wickland et al., 2007; Fellman et al., 2009a, 2009b]. We found that DOCwas correlated with HIX,but not with FI, during the rainy season, suggesting that the majority of the DOC flux during the wet seasonwas derived from humic terrestrial material.
Land cover and differences in hydrological conditions significantly influenced DOC concentrations and opti-cal properties in the Cuiabá River basin. Predominantly forested areas had higher values of DOC and HIX,which were even more pronounced in the wet season (Figure 10). This could in part control the export pat-terns of C during high flow conditions, such that increased rainfall and runoff act as a mechanism to releaselarger proportions of C in these regions. Comparing fluxes between seasons, the Cuiabá River presentedmarked changes in DOM. During the high flow period, DOM exhibited a strongly aromatic character, withlow SR values and augmented HIX values indicating a higher mobilization of fresh, high molecular weight,aromatic compounds due to the increase of water flow through DOM rich of higher soil horizons during highflow periods [Mann et al., 2012; Bouillon et al., 2012]. This pattern is consistent with the role of forested land-scapes in transferring DOM to tropical freshwaters that is more aromatic and with higher molecular weightsthan other vegetation types [Lambert et al., 2015].
Riverine carbon fluxes in the Cuiabá basin, as well as in other tropical watersheds, are undergoing trans-formations through deforestation and expansion of agricultural activity [Davidson et al., 2012; Mann et al.,2014]. Increasingly, it is necessary to trace DOM sources through the vegetative canopy, soils, and in rivernetworks [Neu et al., 2016; Stubbins et al., 2017; Ward et al., 2017]. Large-scale changes in land use canalso have a direct impact on regional precipitation, thereby altering river discharge patterns [Lathuillièreet al., 2016]. DOM reactivity (biological and photochemical) is strongly related to its chemical composition,which will influence the processing of riverine processing of terrestrially derived and autochthonous C[Mann et al., 2014]. Our observations of declining DOC concentrations and lower HIX values for areas withless forest (Figure 9) suggest that conversion of forests to pasture could result in a reduction in DOCfluxes and changes in DOM characteristics, influencing river biogeochemistry and the role of inlandwaters in processing terrestrially derived C. Land use change in the region has also been linked toincreases in stream temperature [Macedo et al., 2013], which could also enhance instream biogeochemicalprocessing of DOM.
Journal of Geophysical Research: Biogeosciences 10.1002/2017JG003797
DALMAGRO ET AL. DOM IN A TROPICAL RIVER-WETLAND SYSTEM 16
4.2. DOC Concentrations and Optical Characteristics in the Cuiabá Compared to Other Tropical Rivers
Components C1 and C2 were the most common fluorophores found in Cuiabá River Basin. These exhibitedhumic-like characteristics associated with high molecular weight and aromatic compounds of terrestrial ori-gin and are relatively common in fresh water systems [Stedmon and Markager, 2005; Yamashita et al., 2008].These DOM components are indicative of molecules representing a mixture of compounds that are resistantto rapid change with reactive compounds that are continually replenished by the lateral entry of terrestrialorganic matter from the landscape mainly during higher flow periods [Seidel et al., 2016].
Our results are consistent with Battin [1998] for the Surumoni River, where he found that most DOC exhibits aterrestrial origin. DOM optical properties for savanna and swamp sites within the Congo Basin showed simi-larities to results obtained for Cerrado (savanna-like) and Pantanal (swamp-like) sites in the present study. Forexample, both FI and SR values in the Congo were found to be higher for the low water hydrologic regimethan the high water regime across all land cover types [Mann et al., 2014], which is consistent with our find-ings for FI and SR during dry season and wet seasons in the Cuiabá River basin. Lambert et al. [2016a] andSeidel et al. [2016] showed clear changes in downstream gradients of DOC concentration and DOM composi-tion, both seasonally and spatially, for the Zambezi River basin and lower Amazon River, respectively. Theseseasonal and longitudinal gradients are consistent with our findings for the Cuiabá River basin.
Mann et al. [2014] also found that SR was highest for the savanna sites in the Congo. We found SR values to behighest in the Cerrado region of the Cuiabá River basin, which has a savanna-dominated ecosystem as itsnatural land cover. DOC concentrations were highest for swamp sites in Congo [Mann et al., 2014] andPantanal sites in the present study. Within the Pantanal, we found seasonal differences to be morepronounced for tributaries and associated floodplains than for the main stem of the Cuiabá. This finding isconsistent with observations from tropical river systems with wetland components in Venezuela[Yamashita et al., 2010a].
5. Conclusion
DOC concentrations, DOM optical properties, and principle fluorescence components of bulk DOM weredetermined during the dry and wet seasons across the Cuiabá River basin from the upper Cerrado region,through the more urbanized middle region, and across the lower region in the Pantanal. DOC concentrationsmore than doubled for the wet season in the Cerrado region and Pantanal region but were fairly similarbetween wet and dry seasons through the middle region. DOC fluxes and fDOM components increased long-itudinally across the regions of the Cuiabá River basin during both wet and dry seasons, with DOC increasingon both mass and areal flux bases. The only exception was for the more protein-like fDOM component, whichdid not increase further within the middle or Pantanal regions over the C3 fDOM fraction delivered from theCerrado region. The decline in C3 during the dry season suggests that instream processing of this componentwas significant during that hydroperiod. During the wet season, however, the C3 fraction of total fDOMincreased within themiddle region as the river’s ability to process higher C3 inputs may have become limited.
In general, wet season DOM was characterized by more terrestrial values for the indicators determined,including lower (more terrestrial) values for the fluorescence index (FI), lower values for the spectral sloperatio (SR) suggesting higher molecular weights, and higher values for the humification index (HIX) indicatingmore humified material. Some important regional differences were also observed. Significantly lower SRvalues in the middle region were observed during the dry season compared to Cerrado and Pantanal regions,which indicates a dry season source of fresher DOM in the more urbanized region compared to other regionsof the basin. Overall, our results found land use and hydrology both affected DOC fluxes and the compositionof DOM within the Cuiabá River basin. These patterns could help to constrain global carbon models and ana-lysis of future scenarios considering biogeochemical cycles that are affected by river hydrology and land use.In support of this, we suggest that future research should endeavor to characterize the degree to which fDOMcomponents are processed in situ in relation to riverine CO2 evasion fluxes.
ReferencesAiken, G. R., C. C. Gilmour, D. P. Krabbenhoft, and W. Orem (2011), Dissolved organic matter in the Florida Everglades: Implications for
ecosystem restoration, Crit. Rev. Environ. Sci. Technol., 41(S1), 217–248, doi:10.1080/10643389.2010.530934.
Journal of Geophysical Research: Biogeosciences 10.1002/2017JG003797
DALMAGRO ET AL. DOM IN A TROPICAL RIVER-WETLAND SYSTEM 17
AcknowledgmentsWe would like to thank the anonymousreviewers for helpful comments on ear-lier versions of the manuscript. Fundingfor the study was generously providedby the Brazilian Council for theImprovement of Higher Education(CAPES) through the science mobiliza-tion program Ciência sem Fronteiras,the Brazilian National Institute forScience and Technology in Wetlands(Instituto Nacional de Ciência eTecnologia em Áreas Úmidas, INCT-INAU) supported by the BrazilianConselho Nacional de DesenvolvimentoCientífico e Tecnológico (CNPq, grant573990/2008-5), and Discovery Grantfunding to M.J. from the CanadianNational Science and EngineeringResearch Council (NSERC). We greatlyappreciate logistical support providedfor this study by INCT-INAU and theSESC-Pantanal. Gerald Boersma kindlyprovided mapping assistance, andAshlee Jollymore provided assistancewith the Aqualog fluorometer. Thisresearch comprises a scientific output ofthe Aquatic-Terrestrial Interactions andCarbon Fluxes Laboratory of INCT-INAU.Data from the publication are availablefrom a publically accessible repositoryat https://github.com/UBCecohydro/data.public.
Alberts, J. J., and M. Takács (2004), Total luminescence spectra of IHSS standard and reference fulvic acids, humic acids and natural organicmatter: Comparison of aquatic and terrestrial source terms, Org. Geochem., 35(3), 243–256, doi:10.1016/j.orggeochem.2003.11.007.
Aufdenkampe, A. K., E. Mayorga, P. A. Raymond, J. M. Melack, S. C. Doney, S. R. Alin, R. E. Aalto, and K. Yoo (2011), Riverine coupling of bio-geochemical cycles between land, oceans, and atmosphere, Front. Ecol. Environ., 9(1), 53–60, doi:10.1890/100014.
Balcaraczyk, K., J. B. Jones, R. Jaffé, and N. Maie (2009), Dissolved organic matter bioavailability and composition in streams drainingcatchments with discontinuous permafrost, Biogeochemistry, 94, 255–270, doi:10.1007/s10533-009-9324-x.
Baker, A. (2001), Fluorescence excitation-emission matrix characterization of some sewage-impacted rivers, Environ. Sci. Technol., 35(5),948–953, doi:10.1021/es000177t.
Baker, A. (2002), Fluorescence properties of some farm wastes: Implications for water quality monitoring, Water Res., 36(1), 189–195,doi:10.1016/S0043-1354(01)00210-X.
Baker, A., and R. Inverarity (2004), Protein-like fluorescence intensity as a possible tool for determining river water quality, Hydrol. Processes,18(15), 2927–2945, doi:10.1002/hyp.5597.
Baker, A., R. Inverarity, M. Charlton, and S. Richmond (2003), Detecting river pollution using fluorescence spectrophotometry: Case studiesfrom the Ouseburn, NE England, Environ. Pollut., 124(1), 57–70, doi:10.1016/S0269-7491(02)00408-6.
Battin, T. J. (1998), Dissolved organic matter and its optical properties in a blackwater tributary of the upper Orinoco river, Venezuela, Org.Geochem., 28(9), 561–569.
Battin, T. J., S. Luyssaert, L. A. Kaplan, A. K. Aufdenkampe, A. Richter, and L. J. Tranvik (2009), The boundless carbon cycle, Nat. Geosci., 2(9),598–600, doi:10.1038/ngeo618.
Borges, A. V., G. Abril, F. Darchambeau, C. R. Teodoru, J. Deborde, L. O. Vidal, T. Lambert, and S. Bouillon (2015), Divergent biophysical controlsof aquatic CO2 and CH4 in the world’s two largest rivers, Sci. Rep., 5, 15614, doi:10.1038/srep15614.
Bouillon, S., A. Yambélé, R. G. M. Spencer, D. P. Gillikin, P. J. Hernes, J. Six, R. Merckx, and A. V. Borges (2012), Organic matter sources,fluxes and greenhouse gas exchange in the Oubangui River (Congo River basin), Biogeosciences, 9(6), 2045–2062, doi:10.5194/bg-9-2045-2012.
Cawley, K. M., P. Wolski, N. Mladenov, and R. Jaffé (2012), Dissolved organic matter biogeochemistry along a transect of the Okavango delta,Bostwana, Wetlands, 32, 475–486, doi:10.1007/s13157-012-0281-0.
Coble, P. G. (1996), Characterization of marine and terrestrial DOM in seawater using excitation-emission matrix spectroscopy, Mar. Chem.,51(4), 325–346, doi:10.1016/0304-4203(95)00062-3.
Cole, J. J. (2013), Freshwater in flux, Nat. Geosci., 6(1), 13–14, doi:10.1038/ngeo1696.Cory, R. M., and D. M. McKnight (2005), Fluorescence spectroscopy reveals ubiquitous presence of oxidized and reduced quinones in dis-
solved organic matter, Environ. Sci. Technol., 39(21), 8142–8149, doi:10.1021/es0506962.Couto, E., and V. Oliveira (2011), The soil diversity of the Pantanal, in The Pantanal of Mato Grosso: Ecology, Biodiversity and Sustainable
Management of a Large Neotropical Seasonall Wetland, edited by W. Junk et al., pp. 71–102, Sofia Pensoft, Sofia, Bulgaria.Davidson, E. A., et al. (2012), The Amazon Basin in transition, Nature, 481(7381), 321–328, doi:10.1038/nature10717.D’Amore, D. V., J. B. Fellman, R. T. Edwards, and E. Hood (2010), Controls on dissolved organic matter concentrations in soils and streams from
a forested wetland and sloping bog in southeast Alaska, Ecohydrology, 3(3), 249–261, doi:10.1002/eco.101.D’Odorico, P., F. Laio, A. Porporato, L. Ridolfi, A. Rinaldo, and I. Rodriguez-Iturbe (2010), Ecohydrology of terrestrial ecosystems, Bioscience,
60(11), 898–907, doi:10.1525/bio.2010.60.11.6.Duan, S., Y. He, S. S. Kaushal, T. S. Bianchi, N. D. Ward, and L. Guo (2017), Impact of wetland decline on decreasing dissolved organic carbon
concentrations along the Mississippi River continuum, Front. Mar. Sci., 3, 280, doi:10.3389/fmars.2016.00280.Fasching, C., B. Behounek, G. A. Singer, and T. J. Battin (2014), Microbial degradation of terrigenous dissolved organic matter and potential
consequences for carbon cycling in brown-water streams, Sci. Rep., 4(4981), 2014, doi:10.1038/srep04981.Fellman, J. B., E. Hood, D. V. D’amore, R. T. Edwards, and D. White (2009a), Seasonal changes in the chemical quality and biodegradability of
dissolved organic matter exported from soils to streams in coastal temperate rainforest watersheds, Biogeochemistry, 95, 277–293,doi:10.1007/s10533-009-9336-6.
Fellman, J. B., E. Hood, R. T. Edwards, and J. B. Jones (2009b), Uptake of allochthonous dissolved organic matter from soil and salmon incoastal temperate rainforest streams, Ecosystems, 12, 747–759, doi:10.1007/s10021-009-9254-4.
Fellman, J. B., E. Hood, and R. G. M. Spencer (2010), Fluorescence spectroscopy opens new windows into dissolved organic matter dynamicsin freshwater ecosystems, Limnol. Oceanogr., 55(6), 2452–2462, doi:10.4319/lo.2010.55.6.2452.
Gergel, S. E., M. G. Turner, and T. K. Kratz (1999), Dissolved organic carbon as an indicator of the scale of watershed influence on lakes andrivers, Ecol. Appl., 9(4), 1377–1390, doi:10.1890/1051-0761(1999)009[1377:DOCAAI]2.0.CO;2.
Girard, P., I. Fantin-Cruz, S. L. de Oliveira, and S. Hamilton (2010), Small-scale spatial variation of inundation dynamics in a floodplain of thePantanal (Brazil), Hydrobiologia, 638(1), 223–233, doi:10.1007/s10750-009-0046-9.
Graesser, J., T. M. Aide, H. R. Grau, and N. Ramankutty (2015), Cropland/pastureland dynamics and the slowdown of deforestation in LatinAmerica, Environ. Res. Lett., 10(3), 034017), doi:10.1088/1748-9326/10/3/034017.
Grecchi, R. C., Q. H. J. Gwyn, G. B. Bénié, A. R. Formaggio, and F. C. Fahl (2014), Land use and land cover changes in the Brazilian Cerrado: Amultidisciplinary approach to assess the impacts of agricultural expansion, Appl. Geogr., 55(0), 300–312, doi:10.1016/j.apgeog.2014.09.014.
Hanson, P. C., D. P. Hamilton, E. H. Stanley, N. Preston, O. C. Langman, and E. L. Kara (2011), Fate of allochthonous dissolved organic carbon inlakes: A quantitative approach, PLoS One, 6, e21884, doi:10.1371/journal.pone.0021884.
Helms, J. R., A. Stubbins, J. D. Ritchie, E. C. Minor, D. J. Kieber, and K. Mopper (2008), Absorption spectral slopes and slope ratios as indicatorsof molecular weight, source, and photobleaching of chromophoric dissolved organic matter, Limnol. Oceanogr., 53(3), 955–969,doi:10.4319/lo.2008.53.3.0955.
Husson, F., S. Le, and J. Pages (2011), Exploratory Multivariate Analysis by Example Using R, 240 pp., CRC Press, Boca Raton, Fla.IBGE (Brazilian Institute of Geography and Statistics) (2016), Municipal population estimates for 2016. [Available at http://www.ibge.gov.br/
home/estatistica/populacao/estimativa2016/estimativa_tcu.shtm, accessed December 2016.]Inamdar, S. P., and M. J. Mitchell (2006), Hydrologic and topographic controls on storm-event exports of dissolved organic carbon (DOC) and
nitrate across catchment scales, Water Resour. Res., 42, W03421, doi:10.1029/2005WR004212.Jaffé, R., D. McKnight, N. Maie, R. Cory, W. H. McDowell, and J. L. Campbell (2008), Spatial and temporal variations in DOM composition in
ecosystems: The importance of long-term monitoring of optical properties, J. Geophys. Res., 113, G04032, doi:10.1029/2008JG000683.Johnson, M. S., E. G. Couto, M. Abdo, and J. Lehmann (2011), Fluorescence index as an indicator of DOC quality in hydrologic flowpaths of
forested tropical watersheds, Biogeochemistry, 105(1), 149–157, doi:10.1007/s10533-011-9595-x.Junk, W., C. N. da Cunha, K. Wantzen, P. Petermann, C. Strüssmann, M. Marques, and J. Adis (2006), Biodiversity and its conservation in the
Pantanal of Mato Grosso, Brazil, Aquat. Sci., 68(3), 278–309, doi:10.1007/s00027-006-0851-4.
Journal of Geophysical Research: Biogeosciences 10.1002/2017JG003797
DALMAGRO ET AL. DOM IN A TROPICAL RIVER-WETLAND SYSTEM 18
Köhler, S. J., D. Kothawala, M. N. Futter, O. Liungman, and L. Tranvik (2013), In-lake processes offset increased terrestrial inputs of dissolvedorganic carbon and color in lakes, PLoS One, 8, e70598, doi:10.1371/journal.pone.0070598.
Kothawala, D. N., C. A. Stedmon, R. A. Müller, G. A. Weyhenmeyer, S. J. Köhler, and L. J. Tranvik (2014), Controls of dissolved organic matterquality: Evidence from a large-scale boreal lake survey, Global Change Biol., 20, 1101–1114, doi:10.1111/gcb.12488.
Lambert, T., F. Darchambeau, S. Bouillon, B. Alhou, J. D. Mbega, C. R. Teodoru, F. C. Nyoni, P. Massicotte, and A. V. Borges (2015), Landscapecontrol on the spatial and temporal variability of chromophoric dissolved organic matter and dissolved organic carbon in large Africanrivers, Ecosystems, 18(7), 1224–1239, doi:10.1007/s10021-015-9894-5.
Lambert, T., S. Bouillon, F. Darchambeau, P. Massicotte, and A. V. Borges (2016a), Shift in the chemical composition of dissolved organicmatter in the Congo River network, Biogeosciences, 13(18), 5405–5420, doi:10.5194/bg-13-5405-2016.
Lambert, T., C. R. Teodoru, F. C. Nyoni, S. Bouillon, F. Darchambeau, P. Massicotte, and A. V. Borges (2016b), Along-stream transport andtransformation of dissolved organic matter in a large tropical river, Biogeosciences, 13(9), 2727–2741, doi:10.5194/bg-13-2727-2016.
Lathuillière, M. J., M. T. Coe, and M. S. Johnson (2016), A review of green- and blue-water resources and their trade-offs for future agriculturalproduction in the Amazon Basin: What could irrigated agriculture mean for Amazonia?, Hydrol. Earth Syst. Sci., 20, 2179–2194, doi:10.5194/hess-20-2179-2016.
Laudon, H., M. Berggren, A. Ågren, I. Buffam, K. Bishop, T. Grabs, M. Jansson, and S. Köhler (2011), Patterns and dynamics of dissolved organiccarbon (DOC) in boreal streams: The role of processes, connectivity, and scaling, Ecosystems, 14(6), 880–893, doi:10.1007/s10021-011-9452-8.
Lawaetz, A. J., and C. A. Stedmon (2009), Fluorescence intensity calibration using the Raman scatter peak of water, Appl. Spectrosc., 63(8),936–940, doi:10.1366/000370209788964548.
Lehmann, J., and M. Kleber (2015), The contentious nature of soil organic matter, Nature, 528(7580), 60–68, doi:10.1038/nature16069.Lindsay, J. B. (2016), The practice of DEM stream burning revisited, Earth Surf. Processes Landforms, 41(5), 658–668, doi:10.1002/esp.3888.Macedo, M. N., M. T. Coe, R. DeFries, M. Uriarte, P. M. Brando, C. Neill, and W. S. Walker (2013), Land-use-driven stream warming in south-
eastern Amazonia, Philos. Trans. R. Soc. London, Ser. B, 368(1619), 20120153, doi:10.1098/rstb.2012.0153.Mann, P., R. Spencer, B. Dinga, J. Poulsen, P. Hernes, G. Fiske, M. Salter, Z. Wang, K. Hoering, and J. Six (2014), The biogeochemistry of carbon
across a gradient of streams and rivers within the Congo Basin, J. Geophys. Res. Biogeosci., 119, 687–702, doi:10.1002/2013JG002442.Mann, P. J., A. Davydova, N. Zimov, R. G. M. Spencer, S. Davydov, E. Bulygina, S. Zimov, and R. M. Holmes (2012), Controls on the composition
and lability of dissolved organic matter in Siberia’s Kolyma River basin, J. Geophys. Res., 117, G01028, doi:10.1029/2011JG001798.Mariot, M., Y. Dudal, S. Furian, A. Sakamoto, V. Vallès, M. Fort, and L. Barbiero (2007), Dissolved organic matter fluorescence as a water-flow
tracer in the tropical wetland of Pantanal of Nhecolândia, Brazil, Sci. Total Environ., 388(1), 184–193, doi:10.1016/j.scitotenv.2007.08.003.McGlynn, B. L., and J. J. McDonnell (2003), Role of discrete landscape units in controlling catchment dissolved organic carbon dynamics,
Water Resour. Res., 39(4), 1090, doi:10.1029/2002WR001525.McKnight, D. M., E. W. Boyer, P. K. Westerhoff, P. T. Doran, T. Kulbe, and D. T. Andersen (2001), Spectrofluorometric characterization of dis-
solved organic matter for indication of precursor organic material and aromaticity, Limnol. Oceanogr., 46(1), 38–48, doi:10.4319/lo.2001.46.1.0038.
Mladenov, N., D. M. McKnight, P. Wolski, and M. Murray-Hudson (2007), Simulation of DOM fluxes in a seasonal floodplain of the OkavangoDelta, Botswana, Ecol. Modell., 205(1), 181–195, doi:10.1016/j.ecolmodel.2007.02.015.
Moran, M. A., W. M. Sheldon, and R. G. Zepp (2000), Carbon loss and optical property changes during long-term photochemical and biolo-gical degradation of estuarine dissolved organic matter, Limnol. Oceanogr., 45(6), 1254–1264, doi:10.4319/lo.2000.45.6.1254.
Mulholland, P. (2002), Large-scale patterns in dissolved organic carbon concentration, flux, and sources, in Aquatic Ecosystems: Interactivity ofDissolved Organic Matter, edited by S. Findlay and R. Sinsabaugh, pp. 139–159, Academic Press, San Diego, Calif.
Murphy, K. R., C. A. Stedmon, P. Wenig, and R. Bro (2014), OpenFluor–an online spectral library of auto-fluorescence by organic compounds inthe environment, Anal. Methods, 6(3), 658–661, doi:10.1039/C3AY41935E.
Nascimento, A. F., S. A. C. Furquim, R. C. Graham, R. M. Beirigo, J. C. Oliveira Junior, E. G. Couto, and P. Vidal-Torrado (2015), Pedogenesis in aPleistocene fluvial system of the Northern Pantanal—Brazil, Geoderma, 255–256, 58–72, doi:10.1016/j.geoderma.2015.04.025.
Neu, V., D. N. Ward, A. V. Krusche, and C. Neill (2016), Dissolved organicand inorganic carbon flow paths in an Amazonian transitional forest,Front. Mar. Sci., 3, 114, doi:10.3389/fmars.2016.00114.
Ohno, T. (2002), Fluorescence inner-filtering correction for determining the humification index of dissolved organic matter, Environ. Sci.Technol., 36(4), 742–746, doi:10.1021/es0155276.
Olefeldt, D., N. Roulet, R. Giesler, and A. Persson (2013), Total waterborne carbon export and DOC composition from ten nested subarcticpeatland catchments—Importance of peatland cover, groundwater influence, and inter-annual variability of precipitation patterns,Hydrol. Processes, 27(16), 2280–2294, doi:10.1002/hyp.9358.
Powe, A. M., K. A. Fletcher, N. N. S. Luce, M. Lowry, S. Neal, M. E. McCarroll, P. B. Oldham, L. B. McGown, and I. M. Warner (2004), Molecularfluorescence, phosphorescence, and chemiluminescence spectrometry, Anal. Chem., 76(16), 4614–4634, doi:10.1021/ac040095d.
R Core Team (2016), R: A Language and Environment for Statistical Computing. Version 3.3.2, R Foundation for Statistical Computing,Vienna, Austria.
Raymond, P. A., J. E. Saiers, and W. V. Sobczak (2016), Hydrological and biogeochemical controls on watershed dissolved organic mattertransport: Pulse-shunt concept, Ecology, 97(1), 5–16, doi:10.1890/14-1684.1.
Raymond, P. A., et al. (2013), Global carbon dioxide emissions from inland waters, Nature, 503(7476), 355–359, doi:10.1038/nature12760.Raymond, P. A., and J. E. Saiers (2010), Event controlled DOC export from forested watersheds, Biogeochemistry, 100, 197–209, doi:10.1007/
s10533-010-9416-7.Revelle, W. (2015), Psych R package version 1.5.4.Schwerdtfeger, J., M. S. Johnson, E. G. Couto, R. S. S. Amorim, L. Sanches, J. H. Campelo Jr., and M. Weiler (2014), Inundation and groundwater
dynamics for quantification of evaporative water loss in tropical wetlands, Hydrol. Earth Syst. Sci., 18(11), 4407–4422, doi:10.5194/hess-18-4407-2014.
Seidel, M., T. Dittmar, N. D. Ward, A. V. Krusche, J. E. Richey, P. L. Yager, and P. M. Medeiros (2016), Seasonal and spatial variability of dissolvedorganic matter composition in the lower Amazon River, Biogeochemistry, 131(3), 281–302, doi:10.1007/s10533-016-0279-4.
Secretaria de Estado do Meio Ambiente (SEMA) (2016), Secretaria de Estado do Meio Ambiente—Superintendência de Recursos Hídricos—SURH. Relatório de Monitoramento Qualidade da Água Bacia das águas da Região Hidrográfica do Paraguai - MT 2012–2014, Cuiabá,147 pp.
Shutova, Y., A. Baker, J. Bridgeman, and R. K. Henderson (2014), Spectroscopic characterisation of dissolved organic matter changes indrinking water treatment: From PARAFAC analysis to online monitoring wavelengths, Water Res., 54(0), 159–169, doi:10.1016/j.watres.2014.01.053.
Journal of Geophysical Research: Biogeosciences 10.1002/2017JG003797
DALMAGRO ET AL. DOM IN A TROPICAL RIVER-WETLAND SYSTEM 19
Sierra, M., M. Giovanela, E. Parlanti, and E. Soriano-Sierra (2005), Fluorescence fingerprint of fulvic and humic acids from varied origins asviewed by single-scan and excitation/emission matrix techniques, Chemosphere, 58(6), 715–733, doi:10.1016/j.chemosphere.2004.09.038.
Singh, S., E. J. D’Sa, and E. M. Swenson (2010), Chromophoric dissolved organic matter (CDOM) variability in Barataria Basin using excitation–emission matrix (EEM) fluorescence and parallel factor analysis (PARAFAC), Sci. Total Environ., 408(16), 3211–3222, doi:10.1016/j.scitotenv.2010.03.044.
Singh, S., S. Inamdar, and M. Mitchell (2015), Changes in dissolved organic matter (DOM) amount and composition along nested headwaterstream locations during baseflow and stormflow, Hydrol. Processes, 29(6), 1505–1520, doi:10.1002/hyp.10286.
Singh, S., S. Inamdar, and D. Scott (2013), Comparison of two PARAFAC models of dissolved organic matter fluorescence for a mid-Atlanticforested watershed in the USA, J. Ecosystems, 2013, 532424, doi:10.1155/2013/532424.
Sjögersten, S., C. R. Black, S. Evers, J. Hoyos-Santillan, E. L. Wright, and B. L. Turner (2014), Tropical wetlands: A missing link in the globalcarbon cycle?, Global Biogeochem. Cycles, 28, 1371–1386, doi:10.1002/2014GB004844.
Spencer, R. G., G. R. Aiken, K. D. Butler, M. M. Dornblaser, R. G. Striegl, and P. J. Hernes (2009), Utilizing chromophoric dissolved organic mattermeasurements to derive export and reactivity of dissolved organic carbon exported to the Arctic Ocean: A case study of the Yukon River,Alaska, Geophys. Res. Lett., 36, L06401, doi:10.1029/2008GL036831.
Spencer, R. G., K. D. Butler, and G. R. Aiken (2012), Dissolved organic carbon and chromophoric dissolved organic matter properties of riversin the USA, J. Geophys. Res., 117, G03001, doi:10.1029/2011JG001928.
Stedmon, C. A., and R. Bro (2008), Characterizing dissolved organic matter fluorescence with parallel factor analysis: A tutorial, Limnol.Oceanogr. Methods, 6, 572–579, doi:10.4319/lom.2008.6.572.
Stedmon, C. A., and S. Markager (2005), Resolving the variability in dissolved organic matter fluorescence in a temperate estuary and itscatchment using PARAFAC analysis, Limnol. Oceanogr., 50(2), 686–697, doi:10.4319/lo.2005.50.2.0686.
Stedmon, C. A., S. Markager, and R. Bro (2003), Tracing dissolved organic matter in aquatic environments using a new approach to fluor-escence spectroscopy, Mar. Chem., 82(3), 239–254, doi:10.1016/S0304-4203(03)00072-0.
Stubbins, A., L. M. Silva, T. Dittmar, and J. T. Van Stan (2017), Molecular and optical properties of tree-derived dissolved organic matter inthroughfall and stemflow from live oaks and eastern red cedar, Front. Earth Sci., 5, 22, doi:10.3389/feart.2017.00022.
Suhett, A. L., A. M. Amado, R. L. Bozelli, F. A. Esteves, and V. F. Farjalla (2006), O papel da foto-degradação do carbono orgânico dissolvido(DOC) nos ecossistemas aquáticos, Oecol. Bras., 10(2), 186–204.
Thurman, E. M. (1985), Organic Geochemistry of Natural Waters, Springer, Dordrecht, Netherlands.Tranvik, L. J., J. A. Downing, J. B. Cotner, S. A. Loiselle, R. G. Striegl, T. J. Ballatore, P. Dillon, K. Finlay, K. Fortino, and L. B. Knoll (2009), Lakes and
reservoirs as regulators of carbon cycling and climate, Limnol. Oceanogr., 54(6), 2298–2314, doi:10.4319/lo.2009.54.6_part_2.2298.Tyers, T. (2017), Riverdist: River Network Distance Computation and Applications. R package version 0.13.1. [Available at https://CRAN.R-project.
org/package=riverdist.]Vodacek, A., N. V. Blough, M. D. DeGrandpre, E. T. Peltzer, and R. K. Nelson (1997), Seasonal variation of CDOM and DOC in the Middle Atlantic
Bight: Terrestrial inputs and photooxidation, Limnol. Oceanogr., 42(4), 674–686.Wantzen, K. M., E. G. Couto, E. E. Mund, R. S. S. Amorim, A. Siqueira, K. Tielbörger, and M. Seifan (2012), Soil carbon stocks in stream-valley-
ecosystems in the Brazilian Cerrado agroscape, Agric. Ecosyst. Environ., 151(0), 70–79, doi:10.1016/j.agee.2012.01.030.Ward, N. D., et al. (2016), The reactivity of plant-derived organic matter and the potential importance of priming effects along the lower
Amazon River, J. Geophys. Res. Biogeosci., 121, 1522–1539, doi:10.1002/2016JG003342.Ward, N. D., T. S. Bianchi, P. M. Medeiros, M. Seidel, J. E. Richey, R. G. Keil, and H. O. Sawakuchi (2017), Where carbon goes when water flows:
Carbon cycling across the aquatic continuum, Front. Mar. Sci., 4, 7, doi:10.3389/fmars.2017.00007.Waterloo, M. J., S. M. Oliveira, D. P. Drucker, A. D. Nobre, L. A. Cuartas, M. G. Hodnett, I. Langedijk, W. W. Jans, J. Tomasella, and A. C. De Araujo
(2006), Export of organic carbon in run-off from an Amazonian rainforest blackwater catchment, Hydrol. Processes, 20(12), 2581–2597,doi:10.1002/hyp.6217.
Weishaar, J. L., G. R. Aiken, B. A. Bergamaschi, M. S. Fram, R. Fujii, and K. Mopper (2003), Evaluation of specific ultraviolet absorbance as anindicator of the chemical composition and reactivity of dissolved organic carbon, Environ. Sci. Technol., 37(20), 4702–4708, doi:10.1021/es030360x.
Wickham, H. (2009), Ggplot2: Elegant Graphics for Data Analysis, Springer, New York.Wickland, K. P., J. C. Neff, and G. R. Aiken (2007), Dissolved organic carbon in Alaskan boreal forest: Sources, chemical characteristics, and
biogeochemistry, Ecosystems, 10, 1323–1340, doi:10.1007/s10021-007-9101-4.Williams, C. J., Y. Yamashita, H. F. Wilson, R. Jaffé, and M. A. Xenopoulos (2010), Unraveling the role of land use and microbial activity in
shaping dissolved organic matter characteristics in stream ecosystems, Limnol. Oceanogr., 55(3), 1159, doi:10.4319/lo.2010.55.3.1159.Wilson, H. F., and M. A. Xenopoulos (2008), Ecosystem and seasonal control of stream dissolved organic carbon along a gradient of land use,
Ecosystems, 11(4), 555–568, doi:10.1007/s10021-008-9142-3.Yamashita, Y., R. Jaffé, N. Male, and E. Tanoue (2008), Assessing the dynamics of dissolved organic matter (DOM) in coastal environments by
excitation emission matrix fluorescence and parallel factor analysis (EEM-PARAFAC), Limnol. Oceanogr., 53(5), 1900, doi:10.4319/lo.2008.53.5.1900.
Yamashita, Y., N. Maie, H. Briceño, and R. Jaffé (2010a), Optical characterization of dissolved organic matter in tropical rivers of the GuayanaShield, Venezuela, J. Geophys. Res., 115, G00F10, doi:10.1029/2009JG000987.
Yamashita, Y., L. J. Scinto, N. Maie, and R. Jaffé (2010b), Dissolved organic matter characteristics across a subtropical wetland’s land-scape: Application of optical properties in the assessment of environmental dynamics, Ecosystems, 13(7), 1006–1019, doi:10.1007/s10021-010-9370-1.
Zeilhofer, P., E. B. N. R. Lima, and G. A. R. Lima (2010), Land use effects on water quality in the urban agglomeration of Cuiabá and VárzeaGrande, Mato Grosso State, central Brazil, Urban Water J., 7(3), 173–186, doi:10.1080/1573062X.2010.484496.
Zsolnay, A., E. Baigar, M. Jimenez, B. Steinweg, and F. Saccomandi (1999), Differentiating with fluorescence spectroscopy the sources ofdissolved organic matter in soils subjected to drying, Chemosphere, 38(1), 45–50, doi:10.1016/S0045-6535(98)00166-0.
Journal of Geophysical Research: Biogeosciences 10.1002/2017JG003797
DALMAGRO ET AL. DOM IN A TROPICAL RIVER-WETLAND SYSTEM 20