Embed Size (px)
Citation preview
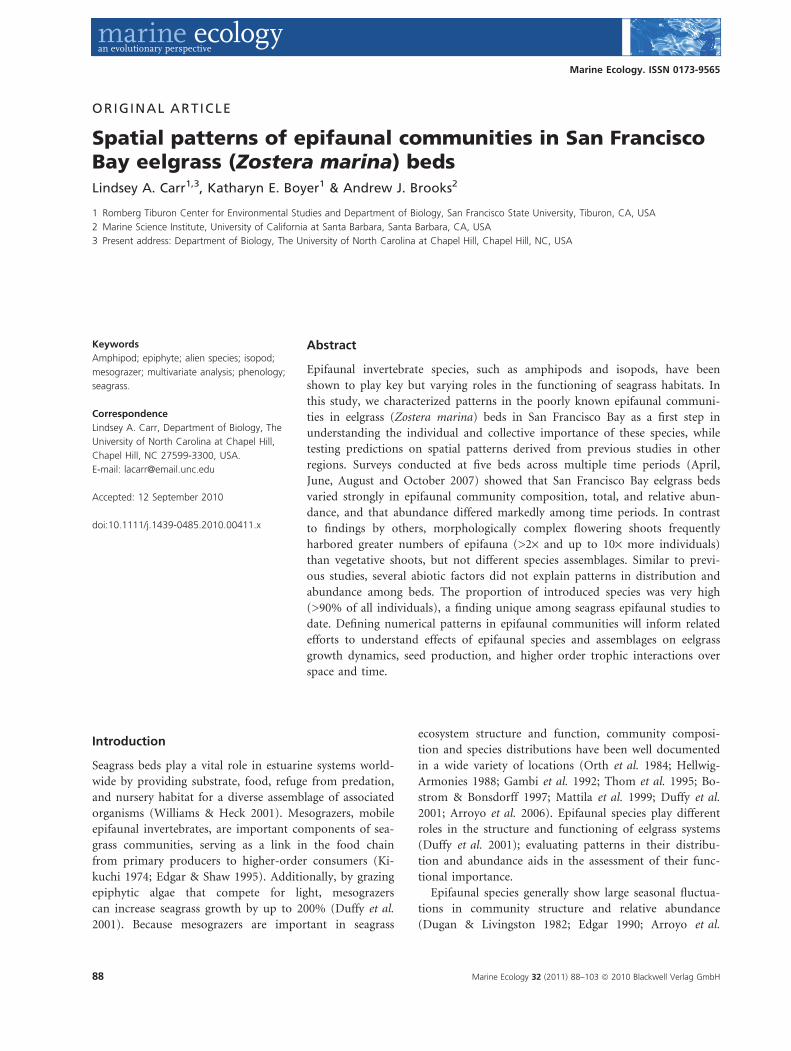
ORIGINAL ARTICLE
Spatial patterns of epifaunal communities in San FranciscoBay eelgrass (Zostera marina) bedsLindsey A. Carr1,3, Katharyn E. Boyer1 & Andrew J. Brooks2
1 Romberg Tiburon Center for Environmental Studies and Department of Biology, San Francisco State University, Tiburon, CA, USA
2 Marine Science Institute, University of California at Santa Barbara, Santa Barbara, CA, USA
3 Present address: Department of Biology, The University of North Carolina at Chapel Hill, Chapel Hill, NC, USA
Introduction
Seagrass beds play a vital role in estuarine systems world-wide by providing substrate, food, refuge from predation,and nursery habitat for a diverse assemblage of associatedorganisms (Williams & Heck 2001). Mesograzers, mobileepifaunal invertebrates, are important components of sea-grass communities, serving as a link in the food chainfrom primary producers to higher-order consumers (Ki-kuchi 1974; Edgar & Shaw 1995). Additionally, by grazingepiphytic algae that compete for light, mesograzerscan increase seagrass growth by up to 200% (Duffy et al.2001). Because mesograzers are important in seagrass
ecosystem structure and function, community composi-tion and species distributions have been well documentedin a wide variety of locations (Orth et al. 1984; Hellwig-Armonies 1988; Gambi et al. 1992; Thom et al. 1995; Bo-strom & Bonsdorff 1997; Mattila et al. 1999; Duffy et al.2001; Arroyo et al. 2006). Epifaunal species play differentroles in the structure and functioning of eelgrass systems(Duffy et al. 2001); evaluating patterns in their distribu-tion and abundance aids in the assessment of their func-tional importance.
Epifaunal species generally show large seasonal fluctua-tions in community structure and relative abundance(Dugan & Livingston 1982; Edgar 1990; Arroyo et al.
Keywords
Amphipod; epiphyte; alien species; isopod;
mesograzer; multivariate analysis; phenology;
seagrass.
Correspondence
Lindsey A. Carr, Department of Biology, The
University of North Carolina at Chapel Hill,
Chapel Hill, NC 27599-3300, USA.
E-mail: [email protected]
Accepted: 12 September 2010
doi:10.1111/j.1439-0485.2010.00411.x
Abstract
Epifaunal invertebrate species, such as amphipods and isopods, have beenshown to play key but varying roles in the functioning of seagrass habitats. Inthis study, we characterized patterns in the poorly known epifaunal communi-ties in eelgrass (Zostera marina) beds in San Francisco Bay as a first step inunderstanding the individual and collective importance of these species, whiletesting predictions on spatial patterns derived from previous studies in otherregions. Surveys conducted at five beds across multiple time periods (April,June, August and October 2007) showed that San Francisco Bay eelgrass bedsvaried strongly in epifaunal community composition, total, and relative abun-dance, and that abundance differed markedly among time periods. In contrastto findings by others, morphologically complex flowering shoots frequentlyharbored greater numbers of epifauna (>2· and up to 10· more individuals)than vegetative shoots, but not different species assemblages. Similar to previ-ous studies, several abiotic factors did not explain patterns in distribution andabundance among beds. The proportion of introduced species was very high(>90% of all individuals), a finding unique among seagrass epifaunal studies todate. Defining numerical patterns in epifaunal communities will inform relatedefforts to understand effects of epifaunal species and assemblages on eelgrassgrowth dynamics, seed production, and higher order trophic interactions overspace and time.
Marine Ecology. ISSN 0173-9565
88 Marine Ecology 32 (2011) 88–103 ª 2010 Blackwell Verlag GmbH
2006; Valentine & Duffy 2006), which has been correlatedwith seasonal changes in shoot height and density(Arroyo et al. 2006). However, most studies have evalu-ated only a single site or morphology of seagrass, usuallyvegetative shoots, over time (but see Nakaoka et al.2001). Conversely, a few studies have quantified mesogr-azer community composition and abundance for vegeta-tive versus flowering shoots, but only during a single timeperiod (Hellwig-Armonies 1988; Nakaoka et al. 2008).Vegetative shoots (those that grow clonally through rhi-zome expansion) have a relatively simple morphology,but flowering shoots exhibit more complex structure asflowers and seeds develop, leading to greater habitat avail-ability for mesograzers (Hellwig-Armonies 1988; Nakaokaet al. 2008). Nakaoka et al. (2008) found a species-specificresponse to flowering shoots, but no significant differencein abundance or species richness. Phenology and abun-dance of flowering shoots over time could thus stronglyinfluence mesograzer abundance and community compo-sition, but no studies to date have addressed this idea.
Eelgrass (Zostera marina) is the only seagrass species inSan Francisco Bay, with populations ranging as far northas San Pablo Bay (North San Francisco Bay) and south tothe San Mateo Bridge (Merkel et al. 2004) (Fig. 1). Mostof the beds grow clonally, supplemented by seedlingrecruitment; however, at least one bed is annual, relyingon seeds produced each summer ⁄ fall to recolonize inspring. Flowering rates and the timing of flowering andseed development vary markedly among populations(K.E. Boyer unpublished data). Epifaunal species utilizingthese eelgrass beds were previously almost unknown (butsee Hansen 1998).
The objective of this study was to characterize patternsin epifaunal communities within and among eelgrass bedsand over time in San Francisco Bay, while testing predic-tions resulting from research in other seagrass systems.According to Nakaoka et al. (2008) working on Z. marinain Japan, we also hypothesized that epifaunal communitycomposition would differ on flowering versus vegetativeshoots. If so, differences in flowering shoot abundancesamong beds could lead to differences in food choices forhigher trophic levels, or perhaps other functional changes.In contrast to the findings of Nakaoka et al. (2008), butconsistent with a study by Hellwig-Armonies (1988) onZ. marina in the North Sea, we predicted higher epifaunalabundances on flowering shoots, as preliminary data indi-cated these offer much greater habitat complexity thanvegetative shoots in San Francisco Bay and perhaps morerefuge and food availability. Consistent with findings fromthe Mediterranean Sea by Connolly & Butler (1996, forCymodeocea nodosa), Arroyo et al. (2006, for Z. marina)and Quiroz-Vazquez et al. (2005, for Z. marina), wefurther hypothesized that epifaunal species richness andabundance would peak when eelgrass shoots are the larg-est and when flowering shoots are the most developed; intheory, refuge space and food availability should be maxi-mized during this time period. Thus, based on prelimin-ary data on shoot lengths, flowering frequencies andepiphyte abundance, we predicted this peak to occur inlate summer for most beds, consistent with Arroyo et al.(2006), and in contrast to Cinar et al. (1998) (both studiesof Z. marina in the Mediterranean Sea). Further, wehypothesized that at the annual bed, epifaunal speciesrichness and abundance would peak in fall since the
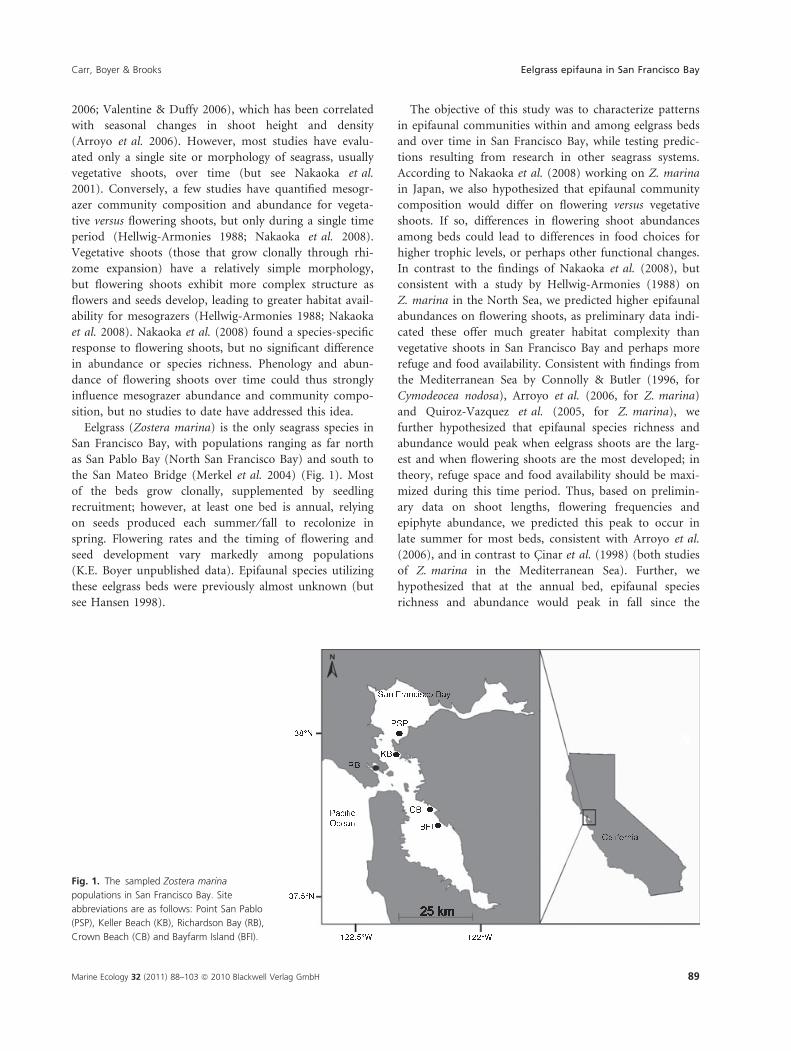
Fig. 1. The sampled Zostera marina
populations in San Francisco Bay. Site
abbreviations are as follows: Point San Pablo
(PSP), Keller Beach (KB), Richardson Bay (RB),
Crown Beach (CB) and Bayfarm Island (BFI).
Carr, Boyer & Brooks Eelgrass epifauna in San Francisco Bay
Marine Ecology 32 (2011) 88–103 ª 2010 Blackwell Verlag GmbH 89
biomass of vegetative and flowering shoots is greater laterin the season due to the bed’s late start from seedlings.Finally, we hypothesized that several important environ-mental parameters in estuaries such as temperature andsalinity would not explain epifaunal distribution patterns,similar to a study by Walsh & Mitchell (1998).The proportion of introduced epifaunal species has not
been described for local eelgrass beds, but is expected tobe high due to the heavy invasion of San Francisco Bayoverall (Cohen & Carlton 1998). While we can make pre-dictions regarding epifaunal distribution and abundancebased on the findings of other studies, the niches andfunctions of non-native species are difficult to predict innovel environments (Suarez et al. 1999). Elucidatingnumerical patterns in eelgrass epifaunal species, bothnative and non-native, presents a first step in evaluatingthe importance of these species or assemblages to thefunctioning of San Francisco Bay eelgrass habitats.
Methods
Study sites
Field surveys were conducted in San Francisco Bay inApril–October of 2007 at five Zostera marina beds(Fig. 1). Eelgrass beds in San Francisco Bay are sporadi-cally distributed in Southern San Pablo Bay, Central SanFrancisco Bay and the northern end of South San Fran-cisco Bay in 23 separate locations, ranging in size from0.1 to 609 hectares, with a total area in the Bay esti-mated at 1,166 hectares (Merkel et al. 2004). We chosefive of the largest beds for our surveys; these sites arealso positioned north to south, and along a salinity gra-dient due to distance from the mouth of the Bay (seeFig. 1 for locations). Point San Pablo (PSP) is the largestbed in the bay, encompassing 609 hectares on a shallowshoal. Crown Beach (CB), an annual bed over most ofits distribution, has a total acreage of 270 hectares. Rich-ardson Bay (RB) covers 177 hectares, and Keller Beach(KB) and Bay Farm Island (BFI) cover 43 and 54 hect-ares, respectively (Merkel et al. 2004). Sampling at allsites and time periods was conducted at a depth between)0.5 and )0.22 MLLW (average of the lower low waterheight of each tidal day observed, National Tidal DatumEpoch).
Field sampling methods
In April, June, August and October 2007, we measureddensities of vegetative and flowering shoots along a 100-m transect, every 5 m, using a 0.25-m2 quadrat. Eelgrassdensities were used to calculate areal epifaunal densities.Ten vegetative and 10 flowering shoots were haphazardly
collected along or near the transect lines at each timeperiod, except in April, when flowering shoots were veryrare. Thus, even if flowering shoots were not present inthe sampling quadrats, others nearby were collected forlaboratory analyses if available. Each individual shoot wasseparated from the rhizome at the sediment surface andinserted into a plastic bottle with ambient bay water(Hellwig-Armonies 1988; Bostrom & Bonsdorff 1997;Mattila et al. 1999). Samples were kept cool and immedi-ately transported to the laboratory for further processing.Temperature and salinity of the surface water wererecorded at each site and time period using a thermome-ter and refractometer (Vee Gee A366ATC), respectively.Ten 2-cm sediment cores were inserted randomly alongthe transect, capped at the top, extracted, placed in asealed bag and brought back to the laboratory for furtheranalysis.
Laboratory analyses
In the laboratory, each bottle was emptied onto a 500-lmsieve and each shoot was subjected to three 1-min fresh-water dips to remove clinging epifauna. This techniquewas found to remove 92–100% of total epifauna fromalgae (Holmlund et al. 1990) and 90% from eelgrass (L.A.Carr unpublished data). Sieve contents were preserved in70% ethanol and identified to the lowest possible taxa,according to Carlton (2007), and enumerated (per shoot).The height of each shoot was also measured and used todetermine epifaunal abundances per cm. Epiphyte bio-mass was quantified using an index, where a subset of theshoots was scraped for epiphytic biomass and the restwere visually assigned a range value. Six vegetative shootswere randomly selected from samples taken at each site ineach time period to be completely scraped of epiphytes.Each blade was assigned a value of 0–5 based on visualinspection of epiphyte loads, with a rating of 0 = no visi-ble epiphytes to 5 = spathe completely covered in epi-phytes. The rest of the vegetative shoots were assignedvalues (0–5) but not scraped. Epiphytes were removedfrom the shoot tissue by scraping with a scalpel in filteredseawater and vacuum-filtered onto Whatman glass fiberfilters. Six flowering shoots were randomly selected fromeach site at each time period when flowering shoots werepresent for epiphyte scraping. Six spathes from each ofthe six flowering shoots were chosen for scraping, withselection based on visual determination of epiphyte loads(same as vegetative shoots). Spathes to be scraped werespecifically chosen to encompass a range of ratings. Aftereach spathe was scraped, the length and width were mea-sured. Epiphyte biomass was determined using chloro-phyll a (chl a) as a proxy, with 90% acetone as theextraction solvent. After extraction, absorbance was read
Eelgrass epifauna in San Francisco Bay Carr, Boyer & Brooks
90 Marine Ecology 32 (2011) 88–103 ª 2010 Blackwell Verlag GmbH
at 630, 647, 664 and 750 nm on a spectrophotometer(Genesys 20; Thermospectronic). Chl a concentration wasdetermined using the formula of Parsons et al. (1984).Concentrations were normalized by dividing the chloro-phyll concentration by the area of the blade surface (Duf-fy et al. 2001).
We determined average chl a for spathes at each indexrating (0–5), then extrapolated to the whole shoot(n = 10 for both vegetative and flowering shoots) usingthe ratings recorded for all spathes or blades on theshoot.
Sediment samples were dried (55 !C), ground andsieved (1-mm sieve). Percent organic matter was deter-mined by combustion at 500 !C for 4 h.
Statistical analysis
Vegetative and flowering eelgrass shoot densities werecompared by site using repeated measures ANOVA, withsite as a random factor (SPSS v.16). Shoot height, epi-phyte biomass, and epifauna per shoot were comparedamong vegetative and flowering shoots using two-factorrepeated measures ANOVA (SPSS v.16), with site andshoot type as factors. Linear regressions were performedon total versus per cm mesograzer abundance for siteswith the most abundant mesograzer densities for Augustand October. Data were tested for homogeneity ofvariances by Cochran’s test, and log-transformed asnecessary.
To examine patterns over time and the effect of siteand shoot morphology on the epifaunal community com-position, we performed two-way cluster analyses (site,shoot type) using presence ⁄ absence data, a Euclidean dis-tance measure and Ward’s method for group linkage, forall taxa on each date (PC ORD v.5).
Non-metric multi-dimensional scaling (nMDS) wasemployed to graphically depict the distributions ofseagrass epifaunal species and their relationships to envi-ronmental variables on each date. For the nMDS ordina-tion we used the Bray–Curtis distance measure andfollowed methods outlined by McCune & Grace (2002).The five sites are displayed as points on the biplots, whilethe arrows indicate the magnitude of the effect of differ-ent environmental variables. Before ordination analysis,species abundance data were square root-transformed tominimize the effect of extremely abundant species. Weperformed separate nMDS graphs for each season. Corre-lations between environmental variables and the axes wereinterpreted according to Pearson and Kendall correlations(r) and the joint bi-plot. The Pearson and Kendall corre-lation value provides insight into which habitat variablesbest describe the patterns of epifaunal community com-position and abundance.
Results
Flowering and vegetative shoot characteristics
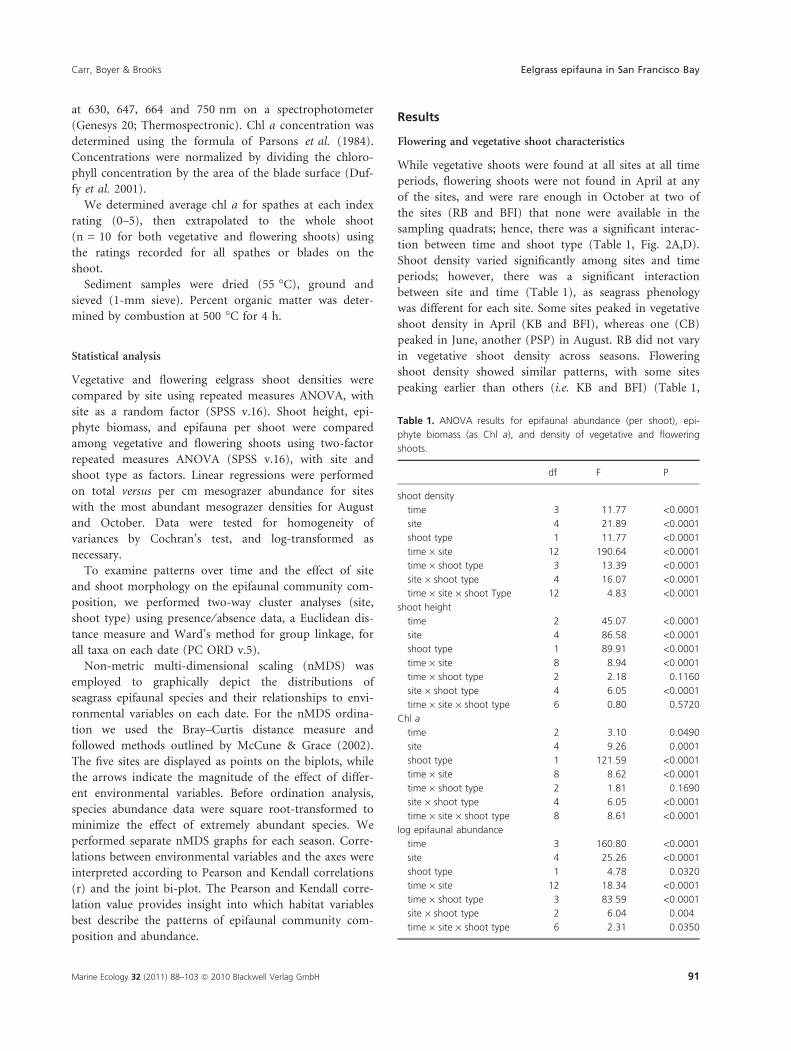
While vegetative shoots were found at all sites at all timeperiods, flowering shoots were not found in April at anyof the sites, and were rare enough in October at two ofthe sites (RB and BFI) that none were available in thesampling quadrats; hence, there was a significant interac-tion between time and shoot type (Table 1, Fig. 2A,D).Shoot density varied significantly among sites and timeperiods; however, there was a significant interactionbetween site and time (Table 1), as seagrass phenologywas different for each site. Some sites peaked in vegetativeshoot density in April (KB and BFI), whereas one (CB)peaked in June, another (PSP) in August. RB did not varyin vegetative shoot density across seasons. Floweringshoot density showed similar patterns, with some sitespeaking earlier than others (i.e. KB and BFI) (Table 1,
Table 1. ANOVA results for epifaunal abundance (per shoot), epi-
phyte biomass (as Chl a), and density of vegetative and flowering
shoots.
df F P
shoot density
time 3 11.77 <0.0001
site 4 21.89 <0.0001
shoot type 1 11.77 <0.0001
time · site 12 190.64 <0.0001
time · shoot type 3 13.39 <0.0001
site · shoot type 4 16.07 <0.0001
time · site · shoot Type 12 4.83 <0.0001
shoot height
time 2 45.07 <0.0001
site 4 86.58 <0.0001
shoot type 1 89.91 <0.0001
time · site 8 8.94 <0.0001
time · shoot type 2 2.18 0.1160
site · shoot type 4 6.05 <0.0001
time · site · shoot type 6 0.80 0.5720
Chl a
time 2 3.10 0.0490
site 4 9.26 0.0001
shoot type 1 121.59 <0.0001
time · site 8 8.62 <0.0001
time · shoot type 2 1.81 0.1690
site · shoot type 4 6.05 <0.0001
time · site · shoot type 8 8.61 <0.0001
log epifaunal abundance
time 3 160.80 <0.0001
site 4 25.26 <0.0001
shoot type 1 4.78 0.0320
time · site 12 18.34 <0.0001
time · shoot type 3 83.59 <0.0001
site · shoot type 2 6.04 0.004
time · site · shoot type 6 2.31 0.0350
Carr, Boyer & Brooks Eelgrass epifauna in San Francisco Bay
Marine Ecology 32 (2011) 88–103 ª 2010 Blackwell Verlag GmbH 91
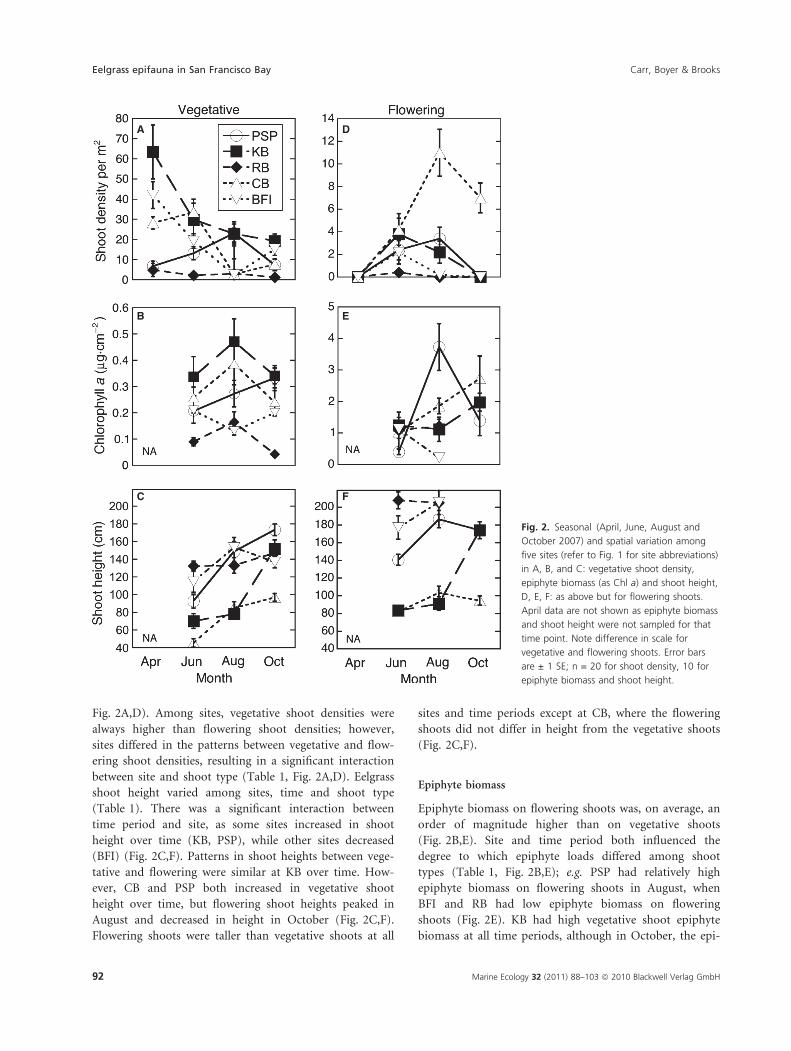
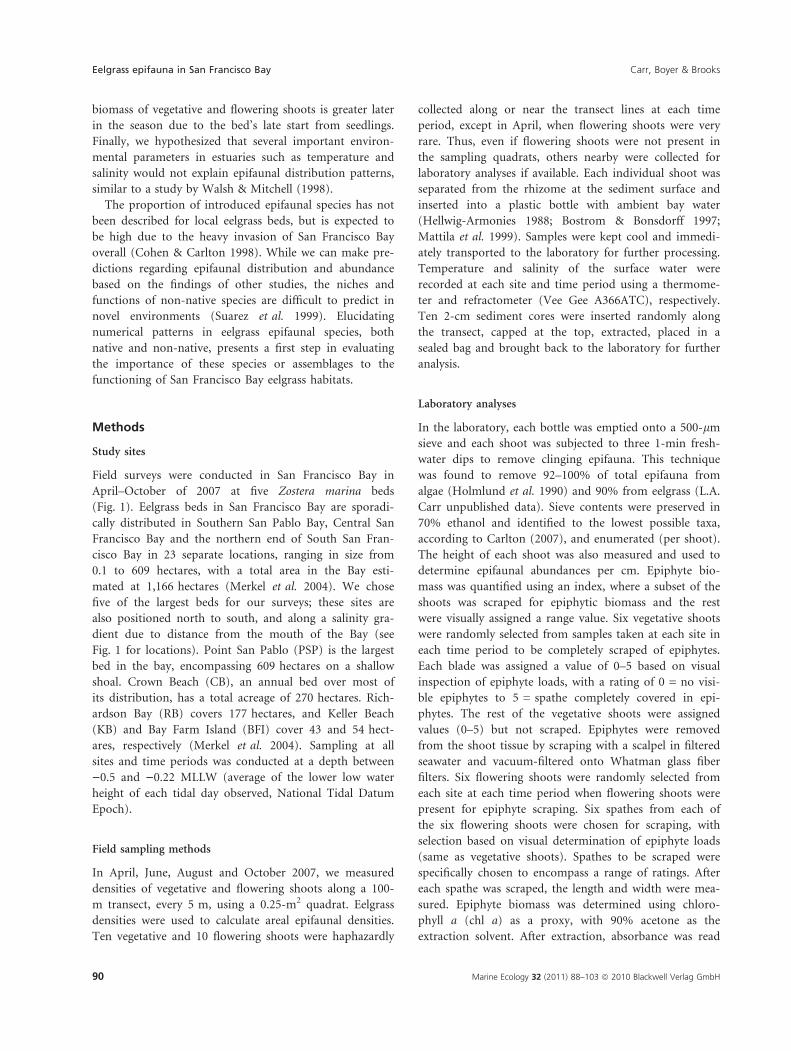
Fig. 2A,D). Among sites, vegetative shoot densities werealways higher than flowering shoot densities; however,sites differed in the patterns between vegetative and flow-ering shoot densities, resulting in a significant interactionbetween site and shoot type (Table 1, Fig. 2A,D). Eelgrassshoot height varied among sites, time and shoot type(Table 1). There was a significant interaction betweentime period and site, as some sites increased in shootheight over time (KB, PSP), while other sites decreased(BFI) (Fig. 2C,F). Patterns in shoot heights between vege-tative and flowering were similar at KB over time. How-ever, CB and PSP both increased in vegetative shootheight over time, but flowering shoot heights peaked inAugust and decreased in height in October (Fig. 2C,F).Flowering shoots were taller than vegetative shoots at all
sites and time periods except at CB, where the floweringshoots did not differ in height from the vegetative shoots(Fig. 2C,F).
Epiphyte biomass
Epiphyte biomass on flowering shoots was, on average, anorder of magnitude higher than on vegetative shoots(Fig. 2B,E). Site and time period both influenced thedegree to which epiphyte loads differed among shoottypes (Table 1, Fig. 2B,E); e.g. PSP had relatively highepiphyte biomass on flowering shoots in August, whenBFI and RB had low epiphyte biomass on floweringshoots (Fig. 2E). KB had high vegetative shoot epiphytebiomass at all time periods, although in October, the epi-
A
B
C
D
E
F
Fig. 2. Seasonal (April, June, August and
October 2007) and spatial variation among
five sites (refer to Fig. 1 for site abbreviations)
in A, B, and C: vegetative shoot density,
epiphyte biomass (as Chl a) and shoot height,
D, E, F: as above but for flowering shoots.
April data are not shown as epiphyte biomass
and shoot height were not sampled for that
time point. Note difference in scale for
vegetative and flowering shoots. Error bars
are ± 1 SE; n = 20 for shoot density, 10 for
epiphyte biomass and shoot height.
Eelgrass epifauna in San Francisco Bay Carr, Boyer & Brooks
92 Marine Ecology 32 (2011) 88–103 ª 2010 Blackwell Verlag GmbH
phyte biomass on PSP vegetative shoots was similar tomeasures at KB (Fig. 2B). Epiphyte biomass on vegetativeshoots at PSP increased over time, but on floweringshoots peaked in August and then decreased. At othersites (KB, CB, and RB) epiphyte biomass on vegetativeshoots peaked in August and then decreased to October,but on flowering shoots epiphyte loads increased fromAugust to October. Epiphyte biomass on flowering shootsat CB increased steadily from June to October, whereasepiphyte biomass on vegetative shoots at CB peakedsharply in August and then decreased by October(Fig. 2B,E). BFI peaked in epiphyte biomass on floweringshoots in June and then steadily decreased to August,whereas epiphyte biomass on vegetative shoots decreased
from June to August and then increased to October(Fig. 2B,E).
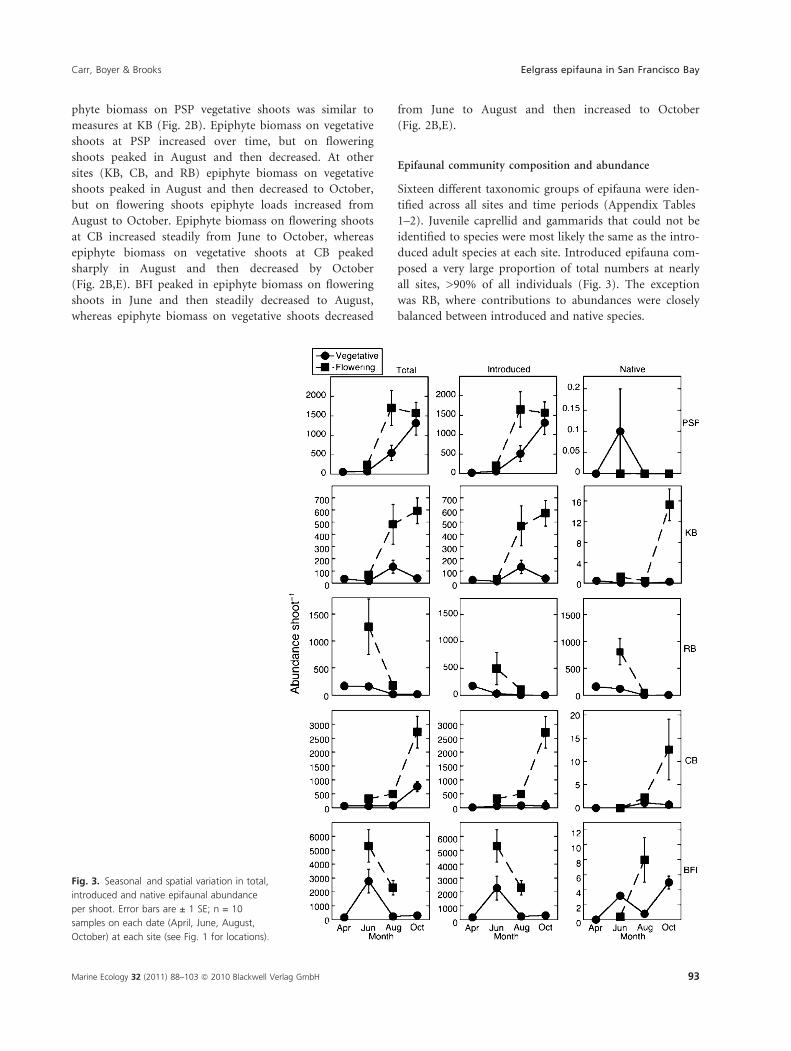
Epifaunal community composition and abundance
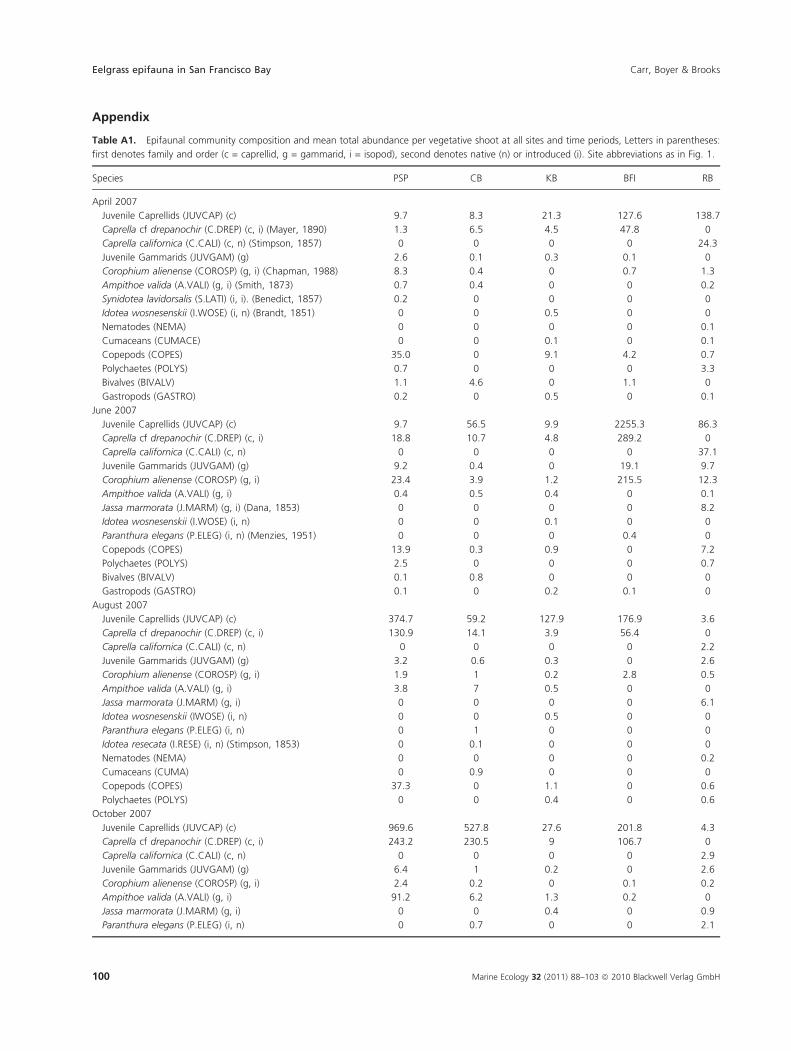
Sixteen different taxonomic groups of epifauna were iden-tified across all sites and time periods (Appendix Tables1–2). Juvenile caprellid and gammarids that could not beidentified to species were most likely the same as the intro-duced adult species at each site. Introduced epifauna com-posed a very large proportion of total numbers at nearlyall sites, >90% of all individuals (Fig. 3). The exceptionwas RB, where contributions to abundances were closelybalanced between introduced and native species.
Fig. 3. Seasonal and spatial variation in total,
introduced and native epifaunal abundance
per shoot. Error bars are ± 1 SE; n = 10
samples on each date (April, June, August,
October) at each site (see Fig. 1 for locations).
Carr, Boyer & Brooks Eelgrass epifauna in San Francisco Bay
Marine Ecology 32 (2011) 88–103 ª 2010 Blackwell Verlag GmbH 93
The greatest abundances of epifauna were found onflowering shoots (Table 1, Appendix Tables A1–2, Fig. 3).Although these shoots were significantly taller than vege-tative shoots (Table 1, Fig. 2c, f), high epifaunal abun-dances on flowering shoots were not simply a function ofshoot length, as epifauna per unit length was significantlycorrelated with abundance per shoot at all sites tested(PSP, CB, BFI all R2 ‡ 0.88, Appendix Fig. A1); hence,the tall flowering shoots harbored greater densities of epi-fauna per unit length than the shorter vegetative shoots(Appendix Fig. A1).Epifaunal abundances at the five sites varied differen-
tially over time (Table 1, Appendix Tables A1–2, Fig. 3).Although all sites had low abundances of epifauna inApril, abundances at BFI and RB peaked in June then fellto very low numbers in October, whereas CB and KBboth reached peak abundances in October on vegetativeshoots (Table 1, Fig. 3).Sites varied in their patterns of epifaunal abundance on
flowering shoots over time: some sites (KB and CB)increased in epifaunal abundance until October, whereasothers (RB and BFI) decreased in epifaunal abundancefrom June until October (Fig. 3). There was a significantinteraction among time, site and eelgrass morphology,with some sites increasing in epifaunal abundance onboth flowering and vegetative shoots (CB and PSP), while
some (KB) decreased in epifaunal abundance on vegeta-tive shoots from August to October and increased inabundance on flowering shoots from June to October(Table 1, Fig. 3).
Areal epifaunal abundances varied from 24 to 24.923individuals per m2. On an areal basis there were greaterabundances of epifauna on vegetative shoots, as vegetativeshoot densities were higher than flowering shoot densities(Appendix Fig. A2).
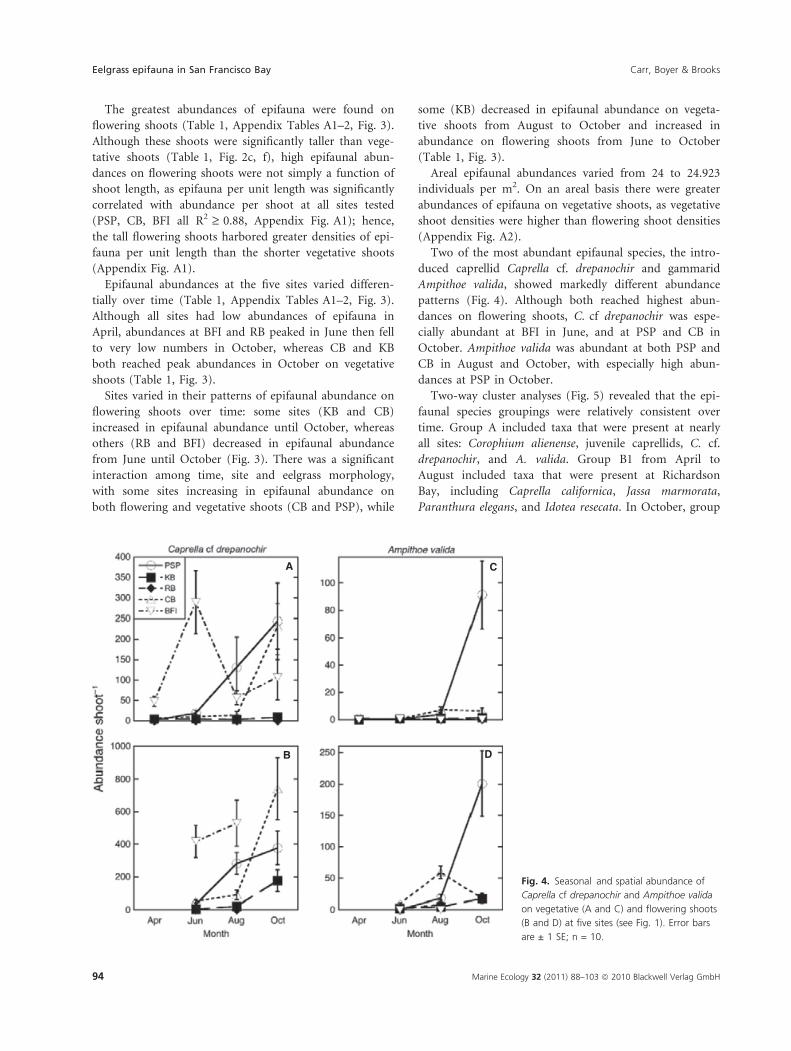
Two of the most abundant epifaunal species, the intro-duced caprellid Caprella cf. drepanochir and gammaridAmpithoe valida, showed markedly different abundancepatterns (Fig. 4). Although both reached highest abun-dances on flowering shoots, C. cf drepanochir was espe-cially abundant at BFI in June, and at PSP and CB inOctober. Ampithoe valida was abundant at both PSP andCB in August and October, with especially high abun-dances at PSP in October.
Two-way cluster analyses (Fig. 5) revealed that the epi-faunal species groupings were relatively consistent overtime. Group A included taxa that were present at nearlyall sites: Corophium alienense, juvenile caprellids, C. cf.drepanochir, and A. valida. Group B1 from April toAugust included taxa that were present at RichardsonBay, including Caprella californica, Jassa marmorata,Paranthura elegans, and Idotea resecata. In October, group
A C
B D
Fig. 4. Seasonal and spatial abundance of
Caprella cf drepanochir and Ampithoe valida
on vegetative (A and C) and flowering shoots
(B and D) at five sites (see Fig. 1). Error bars
are ± 1 SE; n = 10.
Eelgrass epifauna in San Francisco Bay Carr, Boyer & Brooks
94 Marine Ecology 32 (2011) 88–103 ª 2010 Blackwell Verlag GmbH
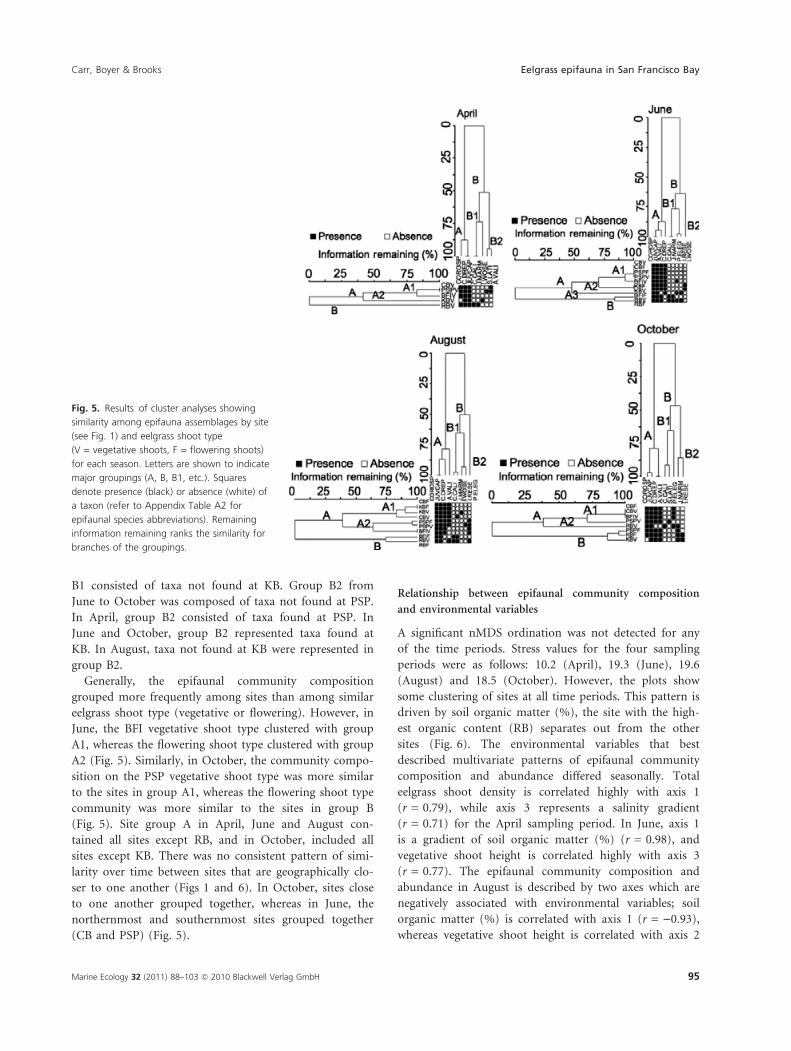
B1 consisted of taxa not found at KB. Group B2 fromJune to October was composed of taxa not found at PSP.In April, group B2 consisted of taxa found at PSP. InJune and October, group B2 represented taxa found atKB. In August, taxa not found at KB were represented ingroup B2.
Generally, the epifaunal community compositiongrouped more frequently among sites than among similareelgrass shoot type (vegetative or flowering). However, inJune, the BFI vegetative shoot type clustered with groupA1, whereas the flowering shoot type clustered with groupA2 (Fig. 5). Similarly, in October, the community compo-sition on the PSP vegetative shoot type was more similarto the sites in group A1, whereas the flowering shoot typecommunity was more similar to the sites in group B(Fig. 5). Site group A in April, June and August con-tained all sites except RB, and in October, included allsites except KB. There was no consistent pattern of simi-larity over time between sites that are geographically clo-ser to one another (Figs 1 and 6). In October, sites closeto one another grouped together, whereas in June, thenorthernmost and southernmost sites grouped together(CB and PSP) (Fig. 5).
Relationship between epifaunal community composition
and environmental variables
A significant nMDS ordination was not detected for anyof the time periods. Stress values for the four samplingperiods were as follows: 10.2 (April), 19.3 (June), 19.6(August) and 18.5 (October). However, the plots showsome clustering of sites at all time periods. This pattern isdriven by soil organic matter (%), the site with the high-est organic content (RB) separates out from the othersites (Fig. 6). The environmental variables that bestdescribed multivariate patterns of epifaunal communitycomposition and abundance differed seasonally. Totaleelgrass shoot density is correlated highly with axis 1(r = 0.79), while axis 3 represents a salinity gradient(r = 0.71) for the April sampling period. In June, axis 1is a gradient of soil organic matter (%) (r = 0.98), andvegetative shoot height is correlated highly with axis 3(r = 0.77). The epifaunal community composition andabundance in August is described by two axes which arenegatively associated with environmental variables; soilorganic matter (%) is correlated with axis 1 (r = )0.93),whereas vegetative shoot height is correlated with axis 2
Fig. 5. Results of cluster analyses showing
similarity among epifauna assemblages by site
(see Fig. 1) and eelgrass shoot type
(V = vegetative shoots, F = flowering shoots)
for each season. Letters are shown to indicate
major groupings (A, B, B1, etc.). Squares
denote presence (black) or absence (white) of
a taxon (refer to Appendix Table A2 for
epifaunal species abbreviations). Remaining
information remaining ranks the similarity for
branches of the groupings.
Carr, Boyer & Brooks Eelgrass epifauna in San Francisco Bay
Marine Ecology 32 (2011) 88–103 ª 2010 Blackwell Verlag GmbH 95
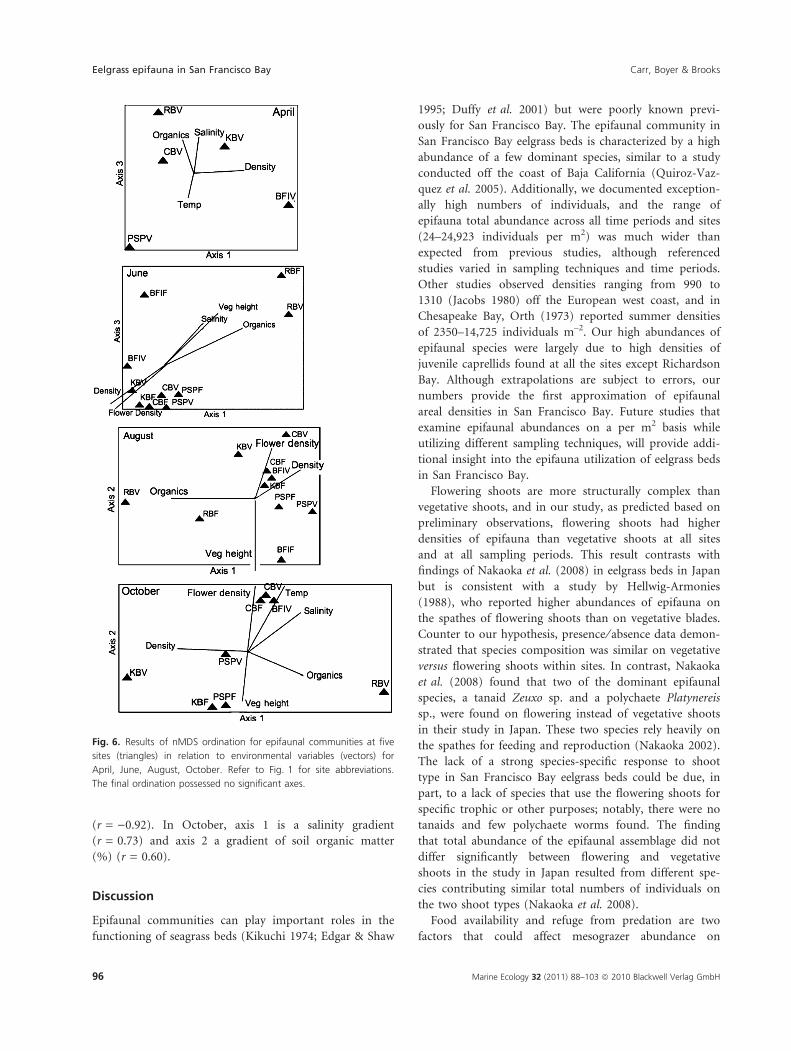
(r = )0.92). In October, axis 1 is a salinity gradient(r = 0.73) and axis 2 a gradient of soil organic matter(%) (r = 0.60).
Discussion
Epifaunal communities can play important roles in thefunctioning of seagrass beds (Kikuchi 1974; Edgar & Shaw
1995; Duffy et al. 2001) but were poorly known previ-ously for San Francisco Bay. The epifaunal community inSan Francisco Bay eelgrass beds is characterized by a highabundance of a few dominant species, similar to a studyconducted off the coast of Baja California (Quiroz-Vaz-quez et al. 2005). Additionally, we documented exception-ally high numbers of individuals, and the range ofepifauna total abundance across all time periods and sites(24–24,923 individuals per m2) was much wider thanexpected from previous studies, although referencedstudies varied in sampling techniques and time periods.Other studies observed densities ranging from 990 to1310 (Jacobs 1980) off the European west coast, and inChesapeake Bay, Orth (1973) reported summer densitiesof 2350–14,725 individuals m–2. Our high abundances ofepifaunal species were largely due to high densities ofjuvenile caprellids found at all the sites except RichardsonBay. Although extrapolations are subject to errors, ournumbers provide the first approximation of epifaunalareal densities in San Francisco Bay. Future studies thatexamine epifaunal abundances on a per m2 basis whileutilizing different sampling techniques, will provide addi-tional insight into the epifauna utilization of eelgrass bedsin San Francisco Bay.
Flowering shoots are more structurally complex thanvegetative shoots, and in our study, as predicted based onpreliminary observations, flowering shoots had higherdensities of epifauna than vegetative shoots at all sitesand at all sampling periods. This result contrasts withfindings of Nakaoka et al. (2008) in eelgrass beds in Japanbut is consistent with a study by Hellwig-Armonies(1988), who reported higher abundances of epifauna onthe spathes of flowering shoots than on vegetative blades.Counter to our hypothesis, presence ⁄ absence data demon-strated that species composition was similar on vegetativeversus flowering shoots within sites. In contrast, Nakaokaet al. (2008) found that two of the dominant epifaunalspecies, a tanaid Zeuxo sp. and a polychaete Platynereissp., were found on flowering instead of vegetative shootsin their study in Japan. These two species rely heavily onthe spathes for feeding and reproduction (Nakaoka 2002).The lack of a strong species-specific response to shoottype in San Francisco Bay eelgrass beds could be due, inpart, to a lack of species that use the flowering shoots forspecific trophic or other purposes; notably, there were notanaids and few polychaete worms found. The findingthat total abundance of the epifaunal assemblage did notdiffer significantly between flowering and vegetativeshoots in the study in Japan resulted from different spe-cies contributing similar total numbers of individuals onthe two shoot types (Nakaoka et al. 2008).
Food availability and refuge from predation are twofactors that could affect mesograzer abundance on
Fig. 6. Results of nMDS ordination for epifaunal communities at five
sites (triangles) in relation to environmental variables (vectors) for
April, June, August, October. Refer to Fig. 1 for site abbreviations.
The final ordination possessed no significant axes.
Eelgrass epifauna in San Francisco Bay Carr, Boyer & Brooks
96 Marine Ecology 32 (2011) 88–103 ª 2010 Blackwell Verlag GmbH
morphologically distinct structures. Flowering shoots hadsignificantly higher epiphytic biomass than vegetativeshoots in this study, and epiphytes are known to be animportant food source for mesograzers (Valentine & Duf-fy 2006); furthermore, fluctuations in epifauna abun-dances have been correlated with patterns of epiphytebiomass (Gambi et al. 1992). Our results suggest thatflowering shoots, when abundant, could increase trophicresources for mesograzers; however, estimates of epiphytebiomass even on flowering shoots were much lower thanreported in other systems (Borum 1985; Duffy et al. 2001;Hauxwell et al. 2001). Further, morphologically complexstructures are generally considered to increase abundanceof epifauna by reducing predation (Nelson 1979; Orthet al. 1984). Recent mesocosm experiments simulatingSan Francisco Bay eelgrass habitats support the value offlowering shoots as refuges for mesograzers when preda-tors are present (Carr 2008, L.A. Carr et al. unpublisheddata, L.A. Carr & K.E. Boyer in preparation).
Overall, the cluster analyses demonstrated greater simi-larity of the mesograzer community assemblage amongsites than on similar morphological structures (floweringor vegetative shoots) between sites. Sites nearest to eachother in proximity exhibited strong similarity in October.At all other sampling periods, the strong dissimilarity ofthe epifaunal community composition at RB compared tothe other sites drove the observed site groupings. Thispattern was due to the presence of Caprella californicaand the absence of Caprella drepanochir at RB. Seasonalvariation among mesograzer community abundances andassemblages is well documented (for reviews see Jernakoffet al. 1996; Valentine & Duffy 2006). Mesograzer abun-dance in our study fluctuated over time, which may relateto seagrass phenology, as demonstrated by Arroyo et al.(2006) and Connolly & Butler (1996). In contrast to ourprediction, epifauna abundance did not peak at theperennial beds during late summer, but did tend to peakafter the highest measured flowering shoot density. As wepredicted, the epifauna abundance at the annual site(Crown Beach) was highest during the October sampling,perhaps due to the delay of height growth and floweringin plants that began from seedlings in spring. However,in contrast to our hypotheses, epifaunal community com-position and species richness were not notably differentover time. These results coupled with the cluster analysessuggest that the mesograzer community assemblage isstrongly tied to position in the bay and much less so toshoot type. This finding suggests that mesograzer speciesassemblages differ by position in the bay, and thus theirnet effects on producer biomass and food web supportare also likely to differ among regions of the bay.
Our results clearly show that epifaunal communityassemblage is strongly influenced by site and time period.
One site parameter, soil organic matter (%), is a strongpredictor of epifaunal community patterns. Increased soilorganic matter in the soil (%) is known to increase theavailability of nutrients to plants, and thus the palatabil-ity, which can influence patterns in abundance and distri-bution of associated organisms (Kelly et al. 1996).
As we hypothesized, measures of physical parameterssuch as salinity and temperature are poor predictors ofcommunity composition. However, temperature was onlymeasured once per site at each sampling period, and weacknowledge that if an average of more detailed temper-ature measurements had been used for the analyses, acorrelation might have been detected. Nevertheless, ourresults are supported by findings that demonstrated epi-faunal larval recruitment and competition were strongerfactors influencing variation in caridean shrimp abun-dance in seagrass beds than were salinity and tempera-ture (Walsh & Mitchell 1998). While the importance inpost-larval migration of epifaunal species from seagrassbeds has been documented (Walsh & Mitchell 1998),there is also evidence that individuals do not leave a sea-grass bed once they have settled (Bell et al. 1988). Ourstudy did not specifically examine settlement and migra-tion, but as the majority of the observed species are livebrooders, we speculate that migration would not have alarge effect on epifaunal community composition in SanFrancisco Bay eelgrass beds. Our results suggest that thelarval epifauna community is determined by the existingcommunity composition, and by introductions of exoticspecies.
San Francisco Bay is well known for its high propor-tion of introduced species (Cohen & Carlton 1998) andwe found that eelgrass beds are no exception. Dominantepifaunal species in the studied eelgrass beds were C. cfdrepanochir, (an introduced caprellid amphipod fromAsia) (C. Brown unpublished data), Corophium alienense(an introduced gammaridean amphipod from Asia) (Ruizet al. 2000), Ampithoe valida (an introduced gammaridnative to the US Atlantic coast) (Cohen & Carlton 1995),and numerous juvenile caprellids and gammarids, proba-bly of the same species. Notably, the introduced caprellidC. cf drepanochir was absent at Richardson Bay, but thenative C. californica was relatively abundant there. How-ever, with the exception of Richardson Bay, introducedepifauna were by far more common than native species(93% of individuals), a finding that is unique to seagrassepifaunal studies that we are aware of to date.
Determining identities, abundances and distributionsrepresents a first step toward identifying functionallyimportant mesograzer species and assemblages in SanFrancisco Bay eelgrass beds. Co-occurring mesograzers inother systems are known to differently influence eco-system processes, including the production of eelgrass,
Carr, Boyer & Brooks Eelgrass epifauna in San Francisco Bay
Marine Ecology 32 (2011) 88–103 ª 2010 Blackwell Verlag GmbH 97
(Duffy et al. 2001). In Chesapeake Bay, Duffy et al.(2001) found that one isopod species caused an increasein eelgrass biomass accumulation, another caused adecrease, and the third species, a gammaridean amphi-pod, had no effect. We speculate that there is a similarrange of functions among mesograzers in San FranciscoBay eelgrass habitats and thus that the variation in com-munity composition among sites and time periods leadsto different net effects. However, we currently understandlittle of the roles of epifauna in these beds; further, thefunctions of introduced eelgrass epifauna in their nativeranges may be poor predictors for new habitats (Suarezet al. 1999). Preliminary studies suggest damage toeelgrass by one invader (A. valida) may be more commonin this system than in the species’ native habitat (Carr2008, L.A. Carr et al. unpublished data). Such findingshave implications for restoration in San Francisco Bayand elsewhere, as the spread of live-brooding invadersmight be limited by careful restoration practices.Declines in fish abundances in the bay and worldwide
highlight the need to conserve habitats with high abun-dances of preferred prey species and refuge potential. Butwhile a conservation focus on areas with high abundancesof native species is common, it may be that eelgrass bedswith high overall abundances of epifauna, regardless ofnative versus introduced status, will provide strongestsupport of higher trophic levels. Experimental evaluationof food web interactions will help to define the functionalroles and relative contributions of both native and intro-duced epifaunal species to higher trophic levels.
Acknowledgements
We thank W. Kimmerer and 2 anonymous referees whoseadvice greatly improved this manuscript. S. Kiriakopolosand D. Singh provided valuable field and laboratory assis-tance. Boat access to survey sites was provided throughfunds from the California Coastal Conservancy andOcean Protection Council.
References
Arroyo M.C., Salas C., Ruedas J.L., Gofas S. (2006) Temporal
changes of mollusk populations from a Zostera marina bed
in southern Spain (Alboran Sea), with biogeographic consid-
erations. Marine Ecology, 27, 417–430.
Bell J.D., Steffe A.S., Westoby M. (1988) Location of seagrass
beds in estuaries: effects on associated fish and decapods.
Journal of Experimental Marine Biology and Ecology, 122,
127–146.
Borum J. (1985) Development of epiphytic communities on
eelgrass (Zostera marina) along nutrient gradient in a
Danish estuary. Marine Biology, 87, 211–218.
Bostrom C., Bonsdorff E. (1997) Community structure and
spatial variation of benthic invertebrates associated withZostera marina (L.) beds in the northern Baltic Sea.
Netherlands Journal of Sea Research, 37, 153–166.Carlton J.T. (2007) Intertidal Invertebrates from Central Califor-
nia to Oregon. University of California Press, Berkeley: 1019pp.
Carr L.A. (2008) Epifaunal Community Structure and Trophic
Interactions in Eelgrass (Zostera marina) Habitats of San
Francisco Bay. MSc Thesis, San Francisco State Univer-
sity,San Francisco: 54 pp.Cinar M.E., Ergen Z., Ozturk B., Kirkim F. (1998) Seasonal
analysis of zoobenthos associated with a Zostera marina L.
bed in Gulbahce Bay Aegean Sea, Turkey. Marine Ecology,
19, 147–162.Cohen A.N., Carlton J.T. (1995) Nonindigenous aquatic spe-
cies in a United State Estuary, A case study of the biological
invasions of the San Francisco Bay and Delta. In: Report forUSFWS, WA DC, and Connecticut Sea Grant. 246 pp.
Cohen A.N., Carlton J.T. (1998) Accelerating invasion rate ina highly invaded estuary. Science, 279, 555–558.
Connolly R.M., Butler A.J. (1996) The effects of altering sea-
grass canopy height on small, motile invertebrates of shallowMediterranean embayments. Marine Ecology, 17, 637–652.
Duffy J.E., MacDonald K.S., Rhode J.M., Parker J.D. (2001)Grazer diversity, functional redundancy, and productivity in
seagrass beds: an experimental test. Ecology, 201, 2417–2434.Dugan P.J., Livingston R.J. (1982) Long-term variation of
macro-invertebrate assemblies in Apalachee Bay, Florida.
Estuarine and Coastal Shelf Science, 14, 391–403.Edgar G.J. (1990) Population regulation, population dynamics
and competition amongst mobile epifauna associated with
seagrass. Journal of Experimental Marine Biology and Ecology,144, 205–234.
Edgar G.J., Shaw C. (1995) The production and trophic ecol-ogy of shallow-water fish assemblages in southern Australia
II. Diets of fishes and trophic relationships between fishes
and benthos at Western Port, Victoria. Journal of Experimen-
tal Marine Biology and Ecology, 194, 83–106.
Gambi M.C., Lorenti M., Russo G.F., Scipione M.B., Zupo
V. (1992) Depth and seasonal distribution of some
groups of the vagile fauna of the Posidonia oceanica leaf
stratum: structural and trophic analyses. Marine Ecology,13, 17–39.
Hansen L.A. (1998) Effects of Sediment on Animals in a San
Francisco Bay Eelgrass Habitat. MSc Thesis, California State
University, Hayward: 70 pp.
Hauxwell J., Cebrian J., Furlong C., Valiela I. (2001) Macro-
algal canopies contribute to eelgrass (Zostera marina) decline
in temperate estuarine ecosystems. Ecology, 82, 1007–1022.
Hellwig-Armonies M. (1988) Mobile epifauna on Zostera
marina, and infauna of its inflorescences. Helgolander
Meersunters, 42, 329–337.
Holmlund M.B., Peterson C.H., Hay M.E. (1990) Does algal
morphology affect amphipod susceptibility to fish predation?
Eelgrass epifauna in San Francisco Bay Carr, Boyer & Brooks
98 Marine Ecology 32 (2011) 88–103 ª 2010 Blackwell Verlag GmbH
Journal of Experimental Marine Biology and Ecology, 139,65–83.
Jacobs R.M. (1980) Effects of the Amoco-Cadiz oil spill on theseagrass community at Roscoff with special reference to the
benthic infauna. Marine Ecology Progress Series, 2, 207–212.
Jernakoff P.A., Brearley A., Nielsen J. (1996) Factors affecting
grazer-epiphyte interactions in temperate seagrass meadows.In: Ansell A.D., Gibson R.N., Barnes M. (Eds), Oceanogra-
phy and Marine Biology. UCL Press, London: pp. 109–162.Kelly R.H., Burke I.C., Lauenroth W.K. (1996) Soil organic
matter and nutrient availability responses to reduced plant
inputs in shortgrass steppe. Ecology, 77, 2516–2527.
Kikuchi T. (1974) Japanese contributions on consumer ecology
in eelgrass (Zostera marina L.) beds, with special referenceto trophic relationships and resources in inshore fisheries.
Aquaculture, 4, 145–160.
Mattila J., Chaplin G., Eilers M.R., Heck K.P., O’Neal J.P., Val-
entine J.F. (1999) Spatial and diurnal distribution of inverte-brate and fish fauna of a Zostera marina bed and nearby
unvegetated sediments in Damariscotta River, Maine (USA).
Netherlands Journal of Sea Research, 41, 321–332.McCune B., Grace J.B. (2002) Analysis of Ecological Communi-
ties, 2nd edn. MjM Software Design, Gleneden Beach, OR:469 pp.
Merkel K.W. & Associates. (2004) Baywide eelgrass (Zostera
marina L.) inventory in San Francisco Bay: pre-survey screen-
ing model and eelgrass survey report. Report Prepared for the
State of California Department of Transportation in Coopera-
tion with NOAA Fisheries. http://www.biomitigation.org.
Nakaoka M. (2002) Predation on seeds of seagrasses Zostera
marina and Zostera caulescens by a tanaid crustacean Zeuxosp. Aquatic Botany, 77, 277–293.
Nakaoka M., Toyohara T., Matsumasa M. (2001) Seasonal andbetween-substrate variation in mobile epifaunal community
in a multispecific seagrass bed of Otsuchi Bay, Japan. Marine
Ecology, 22, 379–395.Nakaoka M., Matsumasa M., Toyohoara T., Williams S.L.
(2008) Animals on marine flowers: does the presence of
flowering shoots affect mobile epifaunal assemblage in a
seagrass meadow? Marine Biology, 153, 589–598.
Nelson W.G. (1979) An analysis of structural pattern in aneelgrass (Zostera marina L.) amphipod community. Journal
of Experimental Marine Biology and Ecology, 39, 231–264.Orth R.J. (1973) Benthic infauna of eelgrass, Zostera marina,
beds. Chesapeake Science, 14, 258–269.
Orth R.J., Heck K.L., van Montfrans J. (1984) Faunal commu-
nities in seagrass beds – a review of the influence of plantstructure and prey characteristics on predator prey relation-
ships. Estuaries, 7, 339–350.Parsons T.R., Maita Y., Lalli C.M. (1984) A Manual of Chemi-
cal and Biological Methods for Seawater Analysis, 2nd edn.Pergamon Press, New York: 184 pp.
Quiroz-Vazquez P., Ibarra-Obando S.E., Meling-Lopez A.E.
(2005) Composition of the epifaunal community associated
with the seagrass Zostera marina in San Quintin Bay, Baja
California. Bulletin of the Southern California Academy of
Sciences, 104, 100–112.
Ruiz G.M., Fofonoff P.W., Carlton J.T., Wonham M.J., Hines
A.N. (2000) Invasion of coastal marine communities in
North America: apparent patterns, processes and biases.Annual Review of Ecology and Systematics, 31, 481–531.
Suarez A.V., Tsutsui N.D., Holway D.A., Case T.J. (1999)Behavioral and genetic differentiation between native and
introduced populations of the Argentine ant. BiologicalInvasions, 1, 43–53.
Thom R., Miller B., Kennedy M. (1995) Temporal patterns of
grazers and vegetation in a temperate seagrass system. Aqua-tic Botany, 50, 201–205.
Valentine J., Duffy J.E. (2006) Grazing in seagrass ecosystems.
In: Larkum A., Orth R.J., Duarte C.M. (Eds), Seagrasses:Biology, Ecology and Conservation. Springer, Netherlands: pp.
463–501.Walsh C.J., Mitchell B.D. (1998) Factors associated with varia-
tions in abundance of epifaunal caridean shrimps betweenand within estuarine seagrass meadows. Marine and Fresh-
water Research, 49, 769–777.
Williams S.L., Heck K.L. (2001) Seagrass community ecology.In: Bertness M.D., Hay M.E., Gaines S.D. (Eds), Marine
Community Ecology. Sinauer Associates, Sunderland, MA:
pp. 120–150.
Carr, Boyer & Brooks Eelgrass epifauna in San Francisco Bay
Marine Ecology 32 (2011) 88–103 ª 2010 Blackwell Verlag GmbH 99
Appendix
Table A1. Epifaunal community composition and mean total abundance per vegetative shoot at all sites and time periods, Letters in parentheses:
first denotes family and order (c = caprellid, g = gammarid, i = isopod), second denotes native (n) or introduced (i). Site abbreviations as in Fig. 1.
Species PSP CB KB BFI RB
April 2007
Juvenile Caprellids (JUVCAP) (c) 9.7 8.3 21.3 127.6 138.7
Caprella cf drepanochir (C.DREP) (c, i) (Mayer, 1890) 1.3 6.5 4.5 47.8 0
Caprella californica (C.CALI) (c, n) (Stimpson, 1857) 0 0 0 0 24.3
Juvenile Gammarids (JUVGAM) (g) 2.6 0.1 0.3 0.1 0
Corophium alienense (COROSP) (g, i) (Chapman, 1988) 8.3 0.4 0 0.7 1.3
Ampithoe valida (A.VALI) (g, i) (Smith, 1873) 0.7 0.4 0 0 0.2
Synidotea lavidorsalis (S.LATI) (i, i). (Benedict, 1857) 0.2 0 0 0 0
Idotea wosnesenskii (I.WOSE) (i, n) (Brandt, 1851) 0 0 0.5 0 0
Nematodes (NEMA) 0 0 0 0 0.1
Cumaceans (CUMACE) 0 0 0.1 0 0.1
Copepods (COPES) 35.0 0 9.1 4.2 0.7
Polychaetes (POLYS) 0.7 0 0 0 3.3
Bivalves (BIVALV) 1.1 4.6 0 1.1 0
Gastropods (GASTRO) 0.2 0 0.5 0 0.1
June 2007
Juvenile Caprellids (JUVCAP) (c) 9.7 56.5 9.9 2255.3 86.3
Caprella cf drepanochir (C.DREP) (c, i) 18.8 10.7 4.8 289.2 0
Caprella californica (C.CALI) (c, n) 0 0 0 0 37.1
Juvenile Gammarids (JUVGAM) (g) 9.2 0.4 0 19.1 9.7
Corophium alienense (COROSP) (g, i) 23.4 3.9 1.2 215.5 12.3
Ampithoe valida (A.VALI) (g, i) 0.4 0.5 0.4 0 0.1
Jassa marmorata (J.MARM) (g, i) (Dana, 1853) 0 0 0 0 8.2
Idotea wosnesenskii (I.WOSE) (i, n) 0 0 0.1 0 0
Paranthura elegans (P.ELEG) (i, n) (Menzies, 1951) 0 0 0 0.4 0
Copepods (COPES) 13.9 0.3 0.9 0 7.2
Polychaetes (POLYS) 2.5 0 0 0 0.7
Bivalves (BIVALV) 0.1 0.8 0 0 0
Gastropods (GASTRO) 0.1 0 0.2 0.1 0
August 2007
Juvenile Caprellids (JUVCAP) (c) 374.7 59.2 127.9 176.9 3.6
Caprella cf drepanochir (C.DREP) (c, i) 130.9 14.1 3.9 56.4 0
Caprella californica (C.CALI) (c, n) 0 0 0 0 2.2
Juvenile Gammarids (JUVGAM) (g) 3.2 0.6 0.3 0 2.6
Corophium alienense (COROSP) (g, i) 1.9 1 0.2 2.8 0.5
Ampithoe valida (A.VALI) (g, i) 3.8 7 0.5 0 0
Jassa marmorata (J.MARM) (g, i) 0 0 0 0 6.1
Idotea wosnesenskii (IWOSE) (i, n) 0 0 0.5 0 0
Paranthura elegans (P.ELEG) (i, n) 0 1 0 0 0
Idotea resecata (I.RESE) (i, n) (Stimpson, 1853) 0 0.1 0 0 0
Nematodes (NEMA) 0 0 0 0 0.2
Cumaceans (CUMA) 0 0.9 0 0 0
Copepods (COPES) 37.3 0 1.1 0 0.6
Polychaetes (POLYS) 0 0 0.4 0 0.6
October 2007
Juvenile Caprellids (JUVCAP) (c) 969.6 527.8 27.6 201.8 4.3
Caprella cf drepanochir (C.DREP) (c, i) 243.2 230.5 9 106.7 0
Caprella californica (C.CALI) (c, n) 0 0 0 0 2.9
Juvenile Gammarids (JUVGAM) (g) 6.4 1 0.2 0 2.6
Corophium alienense (COROSP) (g, i) 2.4 0.2 0 0.1 0.2
Ampithoe valida (A.VALI) (g, i) 91.2 6.2 1.3 0.2 0
Jassa marmorata (J.MARM) (g, i) 0 0 0.4 0 0.9
Paranthura elegans (P.ELEG) (i, n) 0 0.7 0 0 2.1
Eelgrass epifauna in San Francisco Bay Carr, Boyer & Brooks
100 Marine Ecology 32 (2011) 88–103 ª 2010 Blackwell Verlag GmbH
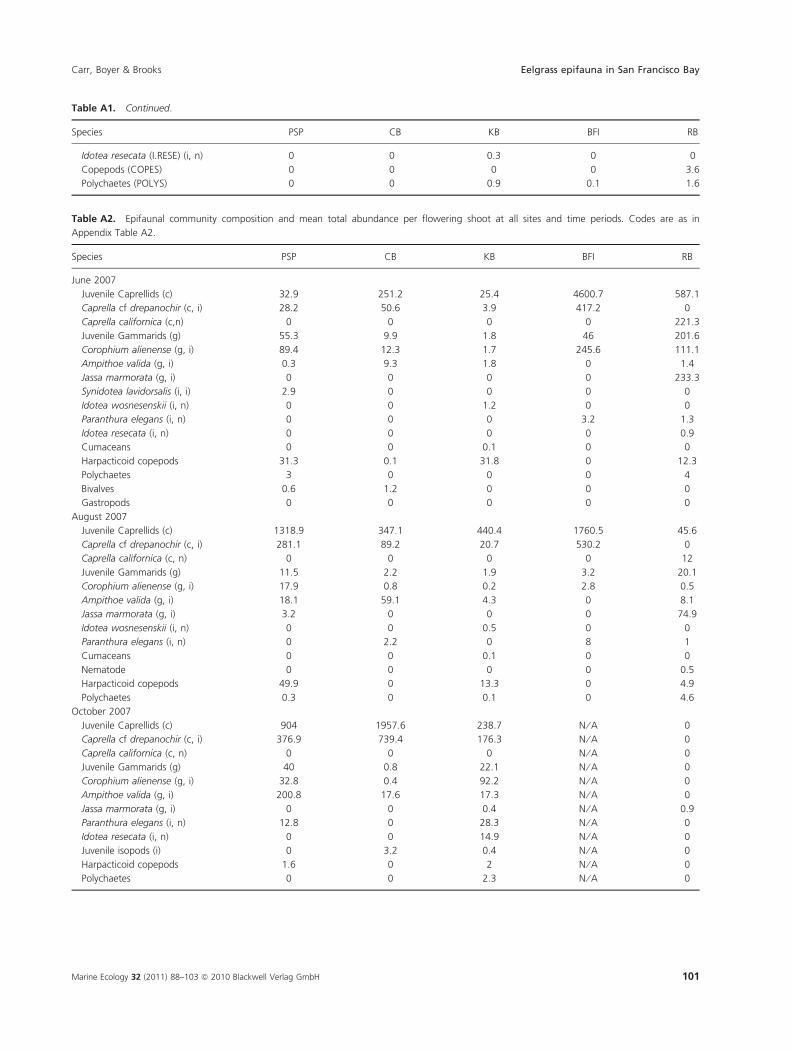
Table A1. Continued.
Species PSP CB KB BFI RB
Idotea resecata (I.RESE) (i, n) 0 0 0.3 0 0
Copepods (COPES) 0 0 0 0 3.6
Polychaetes (POLYS) 0 0 0.9 0.1 1.6
Table A2. Epifaunal community composition and mean total abundance per flowering shoot at all sites and time periods. Codes are as in
Appendix Table A2.
Species PSP CB KB BFI RB
June 2007
Juvenile Caprellids (c) 32.9 251.2 25.4 4600.7 587.1
Caprella cf drepanochir (c, i) 28.2 50.6 3.9 417.2 0
Caprella californica (c,n) 0 0 0 0 221.3
Juvenile Gammarids (g) 55.3 9.9 1.8 46 201.6
Corophium alienense (g, i) 89.4 12.3 1.7 245.6 111.1
Ampithoe valida (g, i) 0.3 9.3 1.8 0 1.4
Jassa marmorata (g, i) 0 0 0 0 233.3
Synidotea lavidorsalis (i, i) 2.9 0 0 0 0
Idotea wosnesenskii (i, n) 0 0 1.2 0 0
Paranthura elegans (i, n) 0 0 0 3.2 1.3
Idotea resecata (i, n) 0 0 0 0 0.9
Cumaceans 0 0 0.1 0 0
Harpacticoid copepods 31.3 0.1 31.8 0 12.3
Polychaetes 3 0 0 0 4
Bivalves 0.6 1.2 0 0 0
Gastropods 0 0 0 0 0
August 2007
Juvenile Caprellids (c) 1318.9 347.1 440.4 1760.5 45.6
Caprella cf drepanochir (c, i) 281.1 89.2 20.7 530.2 0
Caprella californica (c, n) 0 0 0 0 12
Juvenile Gammarids (g) 11.5 2.2 1.9 3.2 20.1
Corophium alienense (g, i) 17.9 0.8 0.2 2.8 0.5
Ampithoe valida (g, i) 18.1 59.1 4.3 0 8.1
Jassa marmorata (g, i) 3.2 0 0 0 74.9
Idotea wosnesenskii (i, n) 0 0 0.5 0 0
Paranthura elegans (i, n) 0 2.2 0 8 1
Cumaceans 0 0 0.1 0 0
Nematode 0 0 0 0 0.5
Harpacticoid copepods 49.9 0 13.3 0 4.9
Polychaetes 0.3 0 0.1 0 4.6
October 2007
Juvenile Caprellids (c) 904 1957.6 238.7 N ⁄A 0
Caprella cf drepanochir (c, i) 376.9 739.4 176.3 N ⁄A 0
Caprella californica (c, n) 0 0 0 N ⁄A 0
Juvenile Gammarids (g) 40 0.8 22.1 N ⁄A 0
Corophium alienense (g, i) 32.8 0.4 92.2 N ⁄A 0
Ampithoe valida (g, i) 200.8 17.6 17.3 N ⁄A 0
Jassa marmorata (g, i) 0 0 0.4 N ⁄A 0.9
Paranthura elegans (i, n) 12.8 0 28.3 N ⁄A 0
Idotea resecata (i, n) 0 0 14.9 N ⁄A 0
Juvenile isopods (i) 0 3.2 0.4 N ⁄A 0
Harpacticoid copepods 1.6 0 2 N ⁄A 0
Polychaetes 0 0 2.3 N ⁄A 0
Carr, Boyer & Brooks Eelgrass epifauna in San Francisco Bay
Marine Ecology 32 (2011) 88–103 ª 2010 Blackwell Verlag GmbH 101
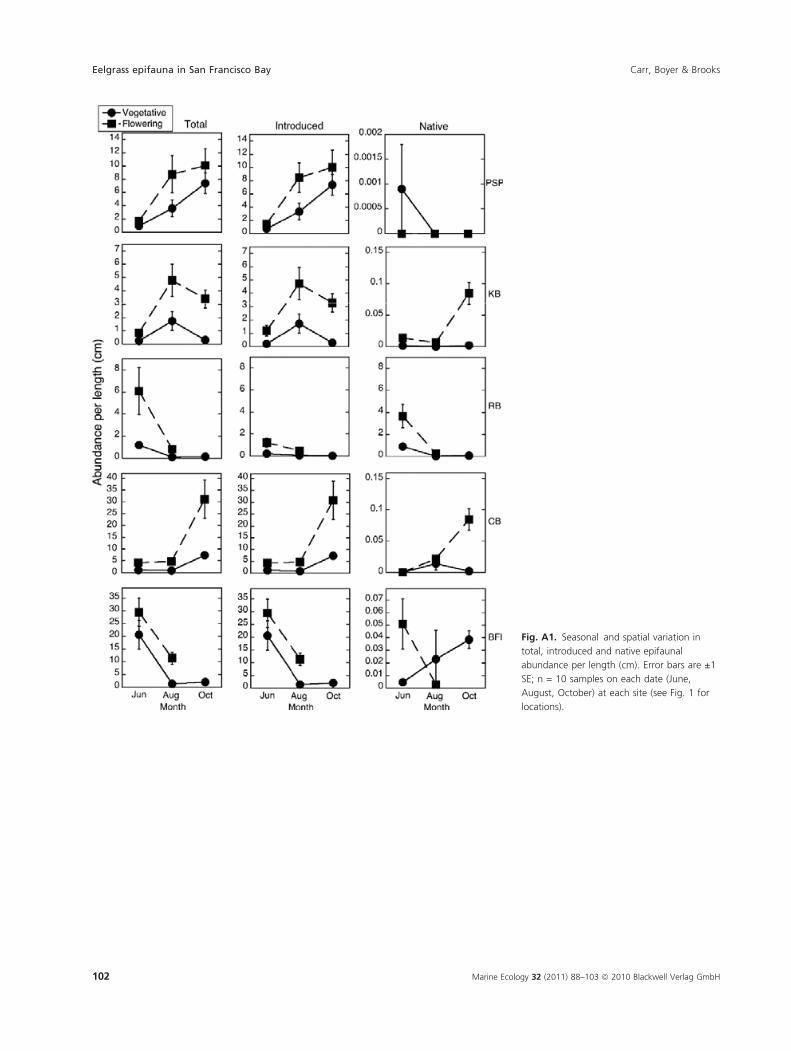
Fig. A1. Seasonal and spatial variation in
total, introduced and native epifaunal
abundance per length (cm). Error bars are ±1
SE; n = 10 samples on each date (June,
August, October) at each site (see Fig. 1 for
locations).
Eelgrass epifauna in San Francisco Bay Carr, Boyer & Brooks
102 Marine Ecology 32 (2011) 88–103 ª 2010 Blackwell Verlag GmbH
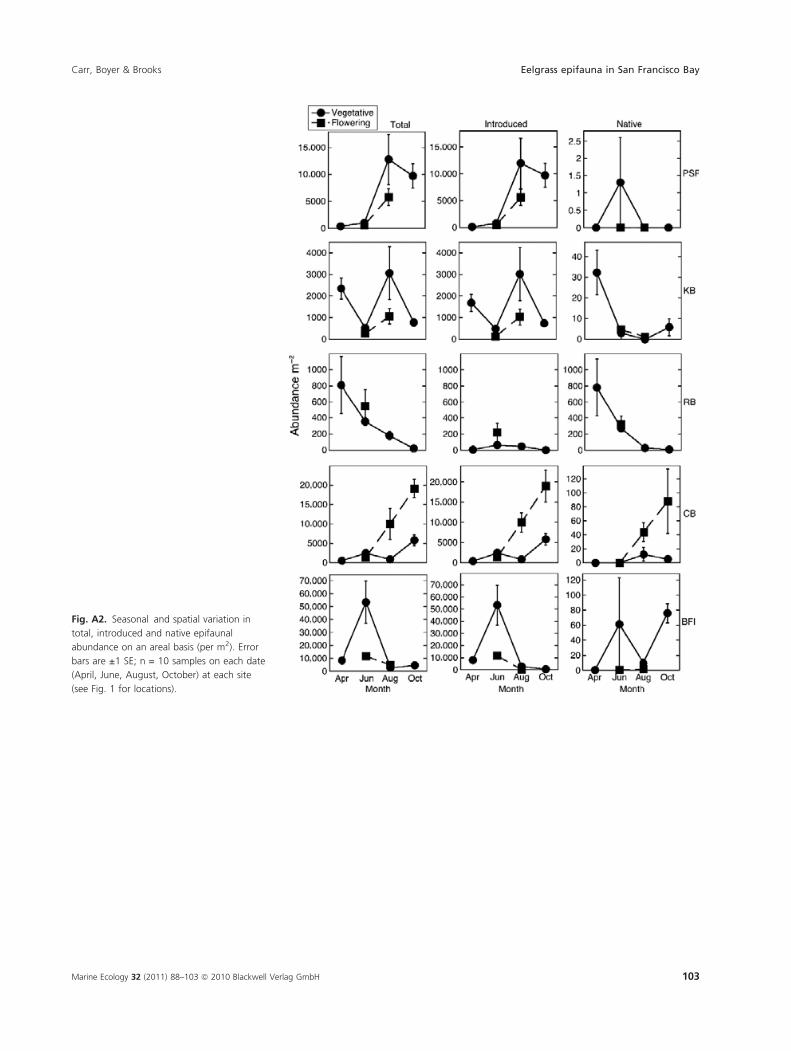
Fig. A2. Seasonal and spatial variation in
total, introduced and native epifaunal
abundance on an areal basis (per m2). Error
bars are ±1 SE; n = 10 samples on each date
(April, June, August, October) at each site
(see Fig. 1 for locations).
Carr, Boyer & Brooks Eelgrass epifauna in San Francisco Bay
Marine Ecology 32 (2011) 88–103 ª 2010 Blackwell Verlag GmbH 103