Embed Size (px)
Citation preview

1632 J. Opt. Soc. Am. A/Vol. 7, No. 9/September 1990
Spatial variability as a limiting factor intexture-discrimination tasks:
implications for performance asymmetries
Barton S. Rubenstein and Dov Sagi
Department of Applied Mathematics and Computer Science, The Weizmann Institute of Science, Rehovot 76100,Israel
Received August 21, 1989; accepted February 2, 1990Texture-discimination tasks reveal a pronounced performance asymmetry depending on which texture representsthe foreground region (small area) and which represents the ground (large area). This asymmetry implies that someglobal processes are involved in the segmentation process. We examined this problem within the context of thetexture-segmentation algorithm, assuming two filtering stages. The first stage uses spatial frequency and orienta-tion-selective (Gabor) filters, whereas the second stage is formed by low-resolution edge-detection filters. Thepresence and location of texture borders are indicated by significant responses in the second stage. Spurioustexture borders may occur owing to textural local variabilities (such as orientation randomization), which areenhanced by the first stage. We suggest that these spurious borders act as background noise and thus limitperformance in texture-discrimination tasks. The noise level depends on which texture occupies the ground in thedisplay. We tested this model on numerous pairs of textures and found remarkably good correlation with humanperformance. A prediction of the model, namely, that discrimination asymmetry will be reduced when texturalelements have identical orientation, was tested psychophysically and confirmed.
1. INTRODUCTION
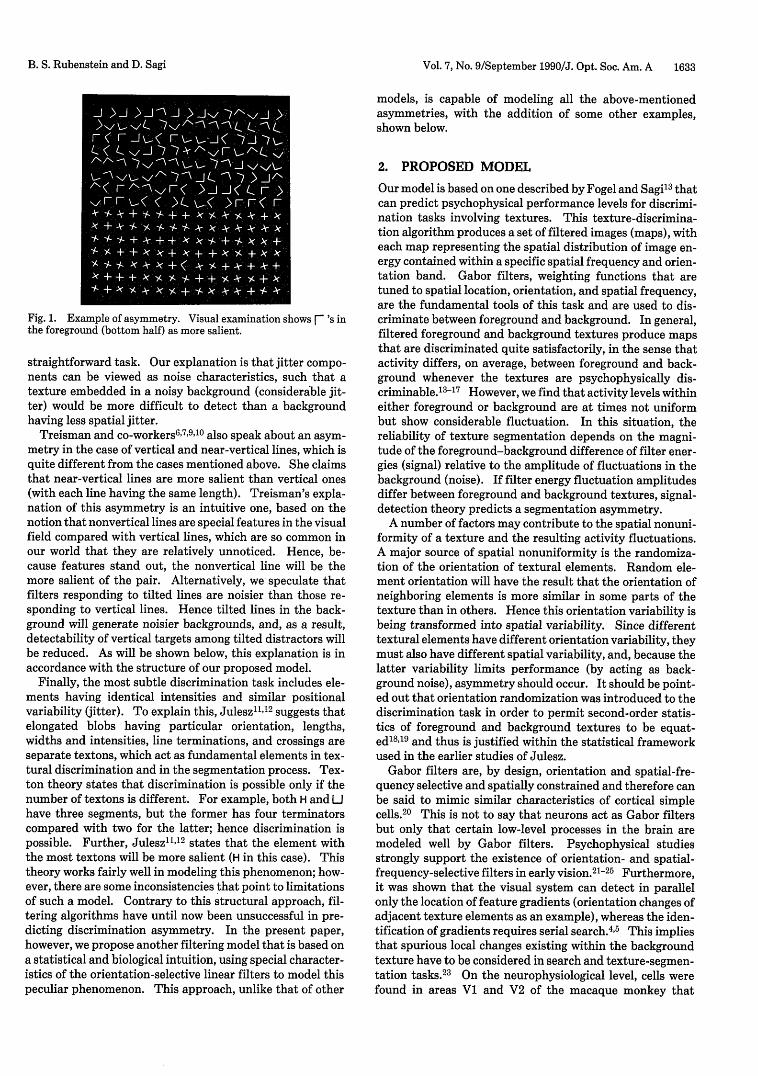
Texture-discrimination tasks reveal a pronounced perfor-mance asymmetry in respect to which texture represents theforeground (disparate) region and which represents theground (large area).' In other words, two different texturalregions that can be discriminated occasionally have a uniquecharacteristic that makes one texture more salient than theother (see Fig. 1). This characteristic implies that morethan local or adjacent textural element analysis occurs intexture-discrimination tasks.2 5 Otherwise, asymmetricdiscrimination would not exist. Rather, some global pro-cesses must be involved in the discrimination and segmenta-tion process.
We propose a solution to the problem that is based onsimple statistical information that is inherent in all texturalstimuli. We claim that these textures can be described ashaving distinct noise characteristics that indicate how easilyone texture region can be detected when embedded in anoth-er texture. Thus, if simple signal-in-noise arguments areapplied, a texture that is surrounded by a noisy background(composed of another texture) will be harder to detect thanone with a less noisy background. If, for example, a shapein Fig. 1 has more noise characteristics than a + shape, thenone would expect it to be more difficult to detect the +'samong the noisier r 's in the background than in the reversecase. This proposal would also imply that textures havingsimilar noise characteristics would have symmetric perfor-mance levels. Finally, the most important claim is thatthese noise characteristics are caused primarily by spatial-variability properties of the stimulus. Hence spatial vari-ability acts as a direct limiting factor in the discriminationprocess, or, in another words, asymmetric performance iscontrolled by these noise characteristics. We shall analyze
these characteristics, but, before doing this, we review thevarious different types of asymmetry so as to gain a betterperspective of the problems of texture discrimination.
Segmentation asymmetry has been observed in manycases"6 -8; however, only a few cases have been classifiedaccording to stimulus characteristics. These characteristicsinclude differences in element intensities, positional vari-ability, and a special case treated by Treisman6 7 that in-volves vertical and near-vertical lines. In a more fundamen-tal discrimination task, two elements regardless of theircompositional and positional characteristics can be com-pared simply by their light intensities. Elements that arebrighter will stand out much more among relatively darkerelements than in the reverse case. This difference in one'sability to see is called asymmetry. Weber's law predictsasymmetry of such a discrimination task, pointing to thebrighter elements as the more salient features. Weber's lawstates that detectability of a target will depend on the adap-tation level produced by the stimulas (background). Whena dark background is presented, a small intensity change willbe easily detected, whereas a bright background will necessi-tate a larger detection threshold. Hence this phenomenonmay be a result of different visibilities of the two textures.Other attempts to model this phenomenon include filteringalgorithms (difference-of-Gaussian and Gabor) that are sen-sitive to contrast and hence make intensity-based discrimi-nation a simple task.
Asymmetry can also be caused by elements with differentpositional characteristics (jitter). Gurnsey and Browse de-scribe similar elements with different jitter components andpoint to the noisier ones (more jitter) as the more salient.8Again with filtering models, difference-of-Gaussian and Ga-bor filters are sensitive to changes in the texture powerspectrum introduced by jitter, rendering discrimination a
0740-3232/90/091632-12$02.00 © 1990 Optical Society of America
B. S. Rubenstein and D. Sagi
Vol. 7, No. 9/September 1990/J. Opt. Soc. Am. A 1633
Fig. 1. Example of asymmetry. Visual examination shows fl 's inthe foreground (bottom half) as more salient.
straightforward task. Our explanation is that jitter compo-nents can be viewed as noise characteristics, such that atexture embedded in a noisy background (considerable jit-ter) would be more difficult to detect than a backgroundhaving less spatial jitter.
Treisman and co-workers 6' 7'9 "10 also speak about an asym-metry in the case of vertical and near-vertical lines, which isquite different from the cases mentioned above. She claimsthat near-vertical lines are more salient than vertical ones(with each line having the same length). Treisman's expla-nation of this asymmetry is an intuitive one, based on thenotion that nonvertical lines are special features in the visualfield compared with vertical lines, which are so common inour world that they are relatively unnoticed. Hence, be-cause features stand out, the nonvertical line will be themore salient of the pair. Alternatively, we speculate thatfilters responding to tilted lines are noisier than those re-sponding to vertical lines. Hence tilted lines in the back-ground will generate noisier backgrounds, and, as a result,detectability of vertical targets among tilted distractors willbe reduced. As will be shown below, this explanation is inaccordance with the structure of our proposed model.
Finally, the most subtle discrimination task includes ele-ments having identical intensities and similar positionalvariability (jitter). To explain this, Julesz"", 2 suggests thatelongated blobs having particular orientation, lengths,widths and intensities, line terminations, and crossings areseparate textons, which act as fundamental elements in tex-tural discrimination and in the segmentation process. Tex-ton theory states that discrimination is possible only if thenumber of textons is different. For example, both H and Uhave three segments, but the former has four terminatorscompared with two for the latter; hence discrimination ispossible. Further, Julesz"", 2 states that the element withthe most textons will be more salient (H in this case). Thistheory works fairly well in modeling this phenomenon; how-ever, there are some inconsistencies that point to limitationsof such a model. Contrary to this structural approach, fil-tering algorithms have until now been unsuccessful in pre-dicting discrimination asymmetry. In the present paper,however, we propose another filtering model that is based ona statistical and biological intuition, using special character-istics of the orientation-selective linear filters to model thispeculiar phenomenon. This approach, unlike that of other
models, is capable of modeling all the above-mentionedasymmetries, with the addition of some other examples,shown below.
2. PROPOSED MODELOur model is based on one described by Fogel and Sagi13 thatcan predict psychophysical performance levels for discrimi-nation tasks involving textures. This texture-discrimina-tion algorithm produces a set of filtered images (maps), witheach map representing the spatial distribution of image en-ergy contained within a specific spatial frequency and orien-tation band. Gabor filters, weighting functions that aretuned to spatial location, orientation, and spatial frequency,are the fundamental tools of this task and are used to dis-criminate between foreground and background. In general,filtered foreground and background textures produce mapsthat are discriminated quite satisfactorily, in the sense thatactivity differs, on average, between foreground and back-ground whenever the textures are psychophysically dis-criminable.3- 7 However, we find that activity levels withineither foreground or background are at times not uniformbut show considerable fluctuation. In this situation, thereliability of texture segmentation depends on the magni-tude of the foreground-background difference of filter ener-gies (signal) relative to the amplitude of fluctuations in thebackground (noise). If filter energy fluctuation amplitudesdiffer between foreground and background textures, signal-detection theory predicts a segmentation asymmetry.
A number of factors may contribute to the spatial nonuni-formity of a texture and the resulting activity fluctuations.A major source of spatial nonuniformity is the randomiza-tion of the orientation of textural elements. Random ele-ment orientation will have the result that the orientation ofneighboring elements is more similar in some parts of thetexture than in others. Hence this orientation variability isbeing transformed into spatial variability. Since differenttextural elements have different orientation variability, theymust also have different spatial variability, and, because thelatter variability limits performance (by acting as back-ground noise), asymmetry should occur. It should be point-ed out that orientation randomization was introduced to thediscrimination task in order to permit second-order statis-tics of foreground and background textures to be equat-ed' 8"19 and thus is justified within the statistical frameworkused in the earlier studies of Julesz.
Gabor filters are, by design, orientation and spatial-fre-quency selective and spatially constrained and therefore canbe said to mimic similar characteristics of cortical simplecells.20 This is not to say that neurons act as Gabor filtersbut only that certain low-level processes in the brain aremodeled well by Gabor filters. Psychophysical studiesstrongly support the existence of orientation- and spatial-frequency-selective filters in early vision. 21-25 Furthermore,it was shown that the visual system can detect in parallelonly the location of feature gradients (orientation changes ofadjacent texture elements as an example), whereas the iden-tification of gradients requires serial search. 4 5 This impliesthat spurious local changes existing within the backgroundtexture have to be considered in search and texture-segmen-tation tasks.23 On the neurophysiological level, cells werefound in areas V1 and V2 of the macaque monkey that
B. S. Rubenstein and D. Sagi

1634 J. Opt. Soc. Am. A/Vol. 7, No. 9/September 1990
respond best to local orientation changes and not to uniformtextures.2 6 These findings imply the existence of a secondstage filtering in early vision, where the initially filtered(Gabor or similar) image is filtered again in order to findlocal energy differences. 27 -30
The segmentation asymmetry predicted by the presentmodel is based on the variability in the response of Gaborfilters to textural elements at different orientations, thusgenerating local energy differences. Certain elements, forexample, + and f , have different energy profiles when fil-tered by Gabor filters at different orientations. This indi-cates not only that these elements have different energyprofiles across the spatial frequency spectrum as alreadysuggested 3 3 -33 but that each element has an unique vari-ability profile across the orientation spectrum. We showhere that the variability profile of a textural element acrossthe orientation spectrum predicts its salience, and this cor-relates well with the psychophysical experiments (concern-ing asymmetry) of Gurnsey and Browse.' This result indi-cates the importance of spatial variability in discriminationtasks.
To justify these claims, we prepared a computer simula-tion of the discrimination task, so as to study visually theimportance of the orientation variability and hence of thespatial variability. Then, based on the success of theseresults, we developed a mathematical model that is able topredict human performance. This model is a refinement ofthe discrimination-segmentation model proposed by Fogeland Sagi.3 It incorporates spatial and orientation variabili-ty as variables in the discrimination process, using the algo-rithm from the computer simulation as its fundamentalbuilding blocks. Finally, to test our hypothesis directly weperformed psychophysical experiments, controlling orienta-tion variability within textures.
3. ANALYSIS OF SPATIAL VARIABILITY
A. Variability across the Orientation SpectrumFirst we show some concrete correlation between variabilityof the orientation profiles of elements and their relativesalience according to psychophysical results of Gurnsey andBrowse.' Using even and odd Gabor filters having fixedorientation and spatial frequency, we computed the filteredenergy of various elements. The equations for these filtersare
Gev(X, yIX, 0, xc, Y,) = expF-[(x - x)2 + y -y)]l
2or2 JX cosl(2r/X)[(x - x,)cos 0 - (y - y,)sin 0]1,
God(X, YI1 , x, XoYc) = exp{ - Xx- XC) 2 +(y -yc2
X s n 2 ( ]2a l
X sinl(2r/)[(x -xc)cos 0 -(y - y)sin 0]1,
(1)
(2)
where r is the Gaussian width ( = 8), 0 is the filter orienta-tion and A is its wavelength, and xc and Yc represent thecenter of the filter with x and y being the coordinates overthe filter's domain. Lot L(x, y) be the input matrix repre.senting one element and its surrounding space (32 X 32pixels) and Eqs. (1) and (2), the Gabor operators. Then, by
performing a simple dot product, G L, we produce two filterresponse values:
GLev(Xcv YcIA, 0) = E Gev(X, YIX, 0, XC Y) * L(x, y),X'y
GLod(XC, YcIX, 0) = E3 God(X, yIX, 0, x,, Yc) L(x, y),X'y
(3)
(4)
where x and y are indices over the basic matrix element (x, y= 0-31). Finally, a simple squaring and summing of theconvolutions of Eqs. (3) and (4) gives the combined filterenergy level:
E(x,, yac, 0) = GLev2(Xc, YJIX, 0) + GLod2(xc, YcIX, 0). (5)
Since Eq. (5) produces only a locally shift-invariant re-sponse, we add a spatial integration stage (over x, Yc) toobtain a texture energy measure:
T.,(X, 0) = E E(x,, yCIc, 0),x, ,y,.eS(x,y)
(6)
where x, and Yc are indices indicating the center of the filterand S(x, y) is some excitatory neighborhood correspondingto a smoothing operation. This neighborhood is defined toensure spatial invariance, and hence energy levels from 25different filters are summed, with filter centers separatedfrom one another equally in a 5 X 5 matrix. This energy, T,represents the shift-invariant response of the system. Fig-ure 2 is a plot of energy T for two different elements, + andF. (Each element is composed of line segments 17 pixelslong.) Each graph shows energies (plotted vertically) fordifferent orientations and filter wavelengths. Notice thatfor filters with large wavelengths (backs of curves) the + haslittle variability, while the F has much more. Correspond-ingly, because the r is noisier than the +, +'s should be lesssalient in the disparate region than in the reverse case, as isshown by Gurnsey and Browse.' Also note that, for shorterwavelengths, there is great sensitivity to individual line seg-ments; but we have found that energy curves of wavelengthslarger than element size ( > 17) correlate more closely withpsychophysical data. In fact, as will be shown explicitly inSection 4, nearly all pairs of elements presented by Gurnseyand Browse' expose asymmetries that correlate closely withvariability characteristics across the orientation spectrum.Elements that were more salient psychophysically also hadthe most orientation variability (in the large-wavelengthwindow) with respect to the complement element of the pair.
B. Computer SimulationBased on these preliminary studies, we created a three-stepalgorithm that simulates textural segmentation. The stim-ulus consists of randomly oriented +'s and r 's [Figs. 3(a)and 4(a)]. The first step of the algorithm involves filteringthe image with a Gabor filter of a specific orientation andspatial frequency ( = 72°, X = 19 pixels, c = 8 pixels).Specifically, we chose a 32 X 32 matrix filter and applied Eq.(5) to corresponding 32 X 32 pixel patches of the stimulus ata 4-pixel sampling rate. With this small sampling rate,there was a significant overlap of the filtering, thus removingany phase properties of filter placement on the image.[Note that each element of Figs. 3(a) and 4(a) has a line
B. S. Rubenstein and D. Sagi

Vol. 7, No. 9/September 1990/J. Opt. Soc. Am. A 1635
ELEMENT F
ENERGY
edge-detection algorithm on the resultant two-value map.Notice that in Fig. 4(d) edge detection is clear and pro-nounced (F's in foreground). In contrast, Fig. 3(d) showsdetection of the stimulus with additional spurious edges inthe background. These spurious edges represent the energyvariability across the orientation spectrum of the F 's. Spe-cifically, F's with similar orientations tend to group togeth-er because adjacent r 's of different orientations have largedifferences in activity. Likewise, because +'s have littlevariability, groups of +'s distinguishing themselves fromother +'s are rare, as can be seen in the background of Fig.4(d). We conclude that these noise characteristics that pro-
ELEMENT +
90 _ _ -(
DEGREES 0
Fig. 2. Gabor filter texture energies, T(X, 0), of + and F for differ-ent wavelengths and orientations. Notice that, for large wave-lengths, element F has greater energy variability across the orien-tation spectrum.
segment size of 17, sitting within a 32 X 32 matrix of space.]Figures 3(b) and 4(b) represent the output of this energyfiltering. Notice the increased variability of energies of theF's relative to those of the +'s. By looking at the Gabor-filtered images, one can see how the figure representing F 'sin the foreground [Fig. 4(b)] is easier to segment.
The second stage of the algorithm involves filtering theGabor energy image with a two-dimensional Gaussian filter.The technique is similar to the first stage, with a 128 X 128matrix filter being applied at a 4-pixel sampling rate. Here,* = 23 pixels. The application of such a large filter producesa smoothed image with little local variability of energy lev-els, except, of course, where large local differences exist.Figures 3(c) and 4(c) represent these filtered outputs. Fi-nally, for the third stage, significant local intensity gradientsare detected from the Gaussian-filtered images, producingFigs. 3(d) and 4(d). This stage detects local differences inenergy levels and hence is a type of edge-detection algo-rithm. Specifically, this was done by thresholding theGaussian maps [Figs. 3(c) and 4(c)] and then running an
Fig. 3. Computer simulation of texture segmentation. The stimu-lus (a) is acted on by even and odd Gabor filters having an orienta-tion of 720 to produce an energy map (Gabor patch also shown) (b).This image is in turn smoothed by a Gaussian filter (c), and finallythe Gaussian image is thresholded and edge detection is performed(d). Notice the spurious clusters caused by the F 's in the back-ground.
(a) (c)
(d)(b)
Fig. 4. Same as Fig. 3 except with F 's in the foreground. Noticethe relatively less noisy background caused by the +'s having limit-ed orientational variability.
ENERGY
(a)
(b)
( C )
(d )
B. S. Rubenstein and D. Sagi

1636 J. Opt. Soc. Am. A/Vol. 7, No. 9/September 1990
duce this clustering are a major contributor to the phenome-non of discrimination asymmetry.
4. MODELING HUMAN TEXTURE-DISCRIMINATION TASKS
We aim here to develop a mathematical, quantitative modelthat incorporates the ideas discussed in the previous sec-tions and is able to give predictions for human performance.The experimental data that we emulate in this model arefrom Gurnsey and Browse,' a choice motivated by the exten-sive quantitative data presented that show striking evidenceof asymmetry. In order to be able to predict actual humanperformance (percent correct), we have to consider the psy-chophysical procedure used in the experiments.
The psychophysical procedure used by Gurnsey andBrowse' is a four-alternative forced-choice method. With abackground texture always present, a foreground textureappears in one of four possible locations on the screen, whichis covered otherwise by the background texture. The obser-vers' task is to indicate the location (one of four) at whichthey believe the foreground appears. Performance is mea-sured as percent-correct localization and thus ranges from25% (chance performance) to 100%. We assume here thatthe observers, when making their decisions, considered localtexture differences at the four possible locations and decidedaccording to the largest difference of the four. That is, theobservers' decisions were based on detecting local differ-ences between adjacent textural elements at the four sepa-rate locations. Thus, in modeling the decision process, wemust consider the distribution of local differences at the fourpossible locations, three of them generated by backgroundvariability and one by foreground-background difference(one foreground texture is present on every trial). Thestatistical distribution of the local differences of both typescan be calculated from the orientation energy distribution ofthe texture elements (Gabor filtered at a specific spatialfrequency). Note that even though interelement structurecan contribute to the discrimination process, our model,being a first-approximation model, does not incorporate thisextra variable. Percent-correct response can be obtainedthen by considering the overlap between the two distribu-tions (foreground-background and background-back-ground) in a way that is similar to standard signal-detectionmethods.34
A. Modeling the Decision ProcessIt is assumed that the observers respond to the location withmaximal local difference. It is further assumed that onlyabsolute values of local-difference strength are considered,meaning that the sign or direction of a texture edge is ig-nored. Thus let pfb(z) be the statistical distribution of theforeground-background (F-B) absolute differences, i.e., allpossible differences between adjacent foreground-back-ground elements. Likewise, Pbb(Z) is the background-back-ground (B-B) distribution of all possible differences be-tween adjacent background element. Hence, using the four-alternative forced-choice method, one must find theprobability of finding a F-B difference that is larger thanany of the B-B differences found at the other three loca-tions. The total correct response is then the result of inte-
grating over all possible F-B differences. The probability ofgiving a correct response is
Pc = J Pfb(Z)[J Pbb(Z')dz] dz, (7)
where z denotes local energy differences. Note that sincethere are no negative difference values [p(z < 0) = 01, westart integration from zero.
B. Computing Filter Local-Difference DistributionsUntil now, the decision scheme has not defined the specificvariable used for measuring local differences. Henceforthwe propose that these local differences are based on local-filter energy samples. Thus, in order to proceed, we mustderive the statistical distributions of filter local-energy dif-ferences, pfb(z) and Pbb(Z)- We begin with roughly the sameprocessing steps described in Section 3.
1. Calculating Filter Energy ValuesFirst, we filter the texture elements with Gabor filters of aspecific spatial frequency but different orientations and ob-tain a local-energy value for each filter, according to Eq. (5).
2. Logarithmic Transformation on the Local-EnergyValuesNext, we apply a logarithmic transformation on the filterenergy values and obtain the orientation distribution of thespace-averaged log-energy values. Thus Eq. (6) is replacedby
T 6M ) = E., log[E(xc, ycIX, 0) + 1],x,.,y,.G S(x,y)
(8)
where S(x, y) is some excitatory neighborhood correspond-ing to the smoothing operation implemented as a Gaussianblur in the computer simulation (Subsection 3.B). This logtransformation represents an operation similar to that of theenergy normalization used by Fogel and Sagi,13 i.e., at largerfilter response values a larger response difference is requiredfor a discrimination threshold to be reached. Caelli' 5 used asimilar log transformation on the filter response values di-rectly [absolute values obtained from Eqs. (3) and (4)].Note that this nonlinearity precedes spatial integration andthus should be viewed as a simplified filter transducer func-tion. Other transducer functions35 could be used, but sinceour calculations are not highly sensitive to the details of thechosen transducer function, our choice is somewhat arbi-trary.
3. Computing Spatial Distributions of Filtered TextureEnergyT.,,(X, 0) describes the smoothed texture energy values atdifferent spatial locations. Here we are interested in com-puting the statistical distributions of T.,(X, 0) values for aspecific spatial-frequency -orientation map. We assumethat S(x, y) [Eq. (8)] is larger than element size; thus spatialvariability due to different filter placements on elements canbe neglected. We are left then with element-orientationvariability as the main contributor to spatial variability.Thus, for each spatial-frequency -orientation map the spa-tial distribution is assumed to equal the orientation distribu-
B. S. Rubenstein and D. Sagi

Vol. 7, No. 9/September 1990/J. Opt. Soc. Am. A 1637
tion of the specific element energy at a specific frequency.Two different distributions should be considered, one forthe foreground and one for the background. For the sake ofsimplicity, we assume that these two distributions are nor-mal, with means Mf and Mb and variances Vf and Vb forforeground and background, respectively, where Mf, Mb, Vfand Vb can be computed from the orientation distribution ata specific frequency. (Although the assumption of normal-ity is not correct, it may be justified by considering a broadspatial averaging process that smoothes the filtered image.Hence, assuming textures with randomly oriented elements,summing log-energy distributions belonging to adjacent ele-ments will produce an approximately normal distribution.)
Orientation variability is not the only noise source in thesystem. We have to consider internal noise (filter responsevariability) and noise introduced by the mask used in theexperiments. Practically, the mask used limits perfor-mance according to its temporal delay from the stimulus;thus the temporal dimension must be considered. However,since we do not consider the temporal dimension here, weassume that all noise sources can be described by one normaldistribution with a mean of Mn and a variance of V,,. Mndepends on the mask and the filter's spatial and temporalproperties; it is probably frequency dependent according tothe different temporal properties of the different filters.3 6
However, Mn should not depend on the particular texturesused, and since we will consider only filter response differ-ences, the mean noise level cancels out. We assume that Vn,which suffers from the same problems as Mn, is the same forall filters (of different spatial frequency and orientation)and independent of the texture elements used. Note that,in order to account for Treisman's result concerning verticalversus tilted line detection,6 7 we should make V, smaller forvertically oriented filters. Since we do not* have anystraightforward way of estimating the noise variance V,, wetake it as the only free parameter for adjusting the modelperformance in relation to human performance.
Both the noise distribution and the orientation distribu-tion produce spatial variability. If we assume that the twodistributions are normal, and uncorrelated, we get normaldistributions of the sums with means Mfn = Mf + M1 andMbn = Mb + Mn and variances Vfn = Vf + Vn and Vbn = Vb +V, for foreground and background, respectively. (Mf andMb represent the mean log energies described above.)
4. Computing Spatial Distributions of Local DifferencesHere we obtain the distributions for F-B and B-B differ-ences from the two distributions of the texture log-energyvalues. We assume that local differences are computed asdifferences between pairs of log-energy values, Tx, separat-ed by a distance larger than the size of the smoothing neigh-borhood, S(x, y). Hence the B-B difference distribution Pbbhas a zero mean and a variance of
Vbb = 2Vbf = 2 (Vb + Vn), (9)
where Vbb is the variance of local differences samples in thebackground due to orientation randomization. The F-Bdifference distribution (at the F-B border) has a mean of
Mfb = Mf -Mb = Mf-Mb, (10)
which reflects the difference between filter responses to the
foreground and background elements, averaged across allorientations. The variance of pfb is
Vfb = Vf. + Vb. = Vf + Vb + 2Vn. (11)
Since these two difference distributions are normal, theycontain negative difference values. Thus, when computingpercent-correct response [Eq. (6)] we have to transfer thenegative values into the positive range (see Subsection 4.A).
Finally, the F-B and B-B absolute-value distributions are
2 1 Z2Pbb(Z) = A oexp _ - _
andVbb 2 Vbb
and
Pf(Z) = 1 exp (Z-M )2
(-z - Mfb) 2 1+ ex 2Vfb
for z 2 0 (12)
for z 0, (13)
where z denotes local-energy differences.
5. Integrating Information from Filters of DifferentSpatial FrequenciesThe log-energy spatial distributions obtained above varyaccording to the filter's spatial frequency. Thus substitut-ing Eqs. (12) and (13) into Eq. (7) yields a correct responsevalue only when a specific spatial-frequency band is used.Integrating information from different filters is a nontrivialproblem. We applied two (alternative) simple combinationrules: (1) use the filter that yields the highest percent-correct value and ignore the others; (2) use only low-spatial-frequency filters. Application of the second rule does notrequire knowledge of the stimulus parameters. Applicationof the first rule requires isolation of the relevant filter, whichmay depend on the specific input.
C. Model PerformanceModel performance was tested numerically. Energy valueswere calculated by using Gabor filters with a = 24 pixels, anamplitude of 1, and a X range from 8 to 64 pixels (at steps of 4pixels). Convolutions were computed by summing 25 dif-ferent Gabor energies with filter centers separated from oneanother by 16 pixels and positioned in a 5 X 5 matrix [defin-ing the S(x, y) neighborhood in Eq. (8)]. It was assumedthat interelement structure does not play an important rolein this computation (for sparsely spaced elements); thusconvolution values were obtained for single elements. Thisassumption may be justified by the result of our psychophys-ical experiments (described in Section 5 below), with a spac-ing-to-element size ratio of 2.5 (Gurnsey and Browse37 useda ratio of 2.3), showing a negligible effect of interelementstructure. (This of course is not true for denser textures.)Performance was examined in each case (with each elementof the pair in the foreground) across all spatial frequencies,and the highest performance percentage was selected as themodel prediction. This maximum-over-X strategy has littleeffect on the data, since in most cases the best performancewas obtained by using low-frequency filters with wave-lengths near 1.5(+0.5) times element size. Element size was33 X 33 pixels for square-shaped elements and 25 X 49 pixels
B. S. Rubenstein and D. Sagi

1638 J. Opt. Soc. Am. A/Vol. 7, No. 9/September 1990
1.00
H0w00
-J
m
00-
0.75
0.50
0.25
0I 2 3 4 5 6 7 8 9 10 11 12 13 14 15 16 17 18
ELEMENT PAIRSFig. 5. Correlation between the psychophysical results of Gurnsey and Browse' (histogram) and the predictions of the model (circles). Thefigure is presented in groups of two elements (numbered at the bottom of each pair), representing a particular stimulus. Each histogramrectangle represents the psychophysical performance level with the element depicted below it in the foreground and the adjacent element in thebackground. Filled circles represent the prediction obtained by selecting the spatial frequency yielding the highest performance for each pair.The open circles represent predictions for Gabor filters having only larger wavelengths. Note that perfect correlation would place one class ofcircles on top of each histogram rectangle. (n = 0.05.)
otherwise. Line segments were 3 pixels wide, similar towhat was used in the psychophysical experiments. 3 7
As was noted above, the only free parameter is the noisevariance Vn; all other variables were calculated by applyingthe texture elements used. The model predictions are de-picted in Fig. 5 (Vn = 0.05) along with the psychophysicaldata (histogram) of Gurnsey and Browse.' The figure ispresented in groups of two elements (numbered at the bot-tom of the figure), representing a particular stimulus. Eachhistogram rectangle represents the psychophysical perfor-mance level with the element depicted below in the fore-ground and the adjacent element in the background. Like-wise for the other histogram rectangle of the pair. Thecircles represent the corresponding predictions of our model.The filled circles represent the highest performance predict-ed for one spatial frequency from a range of frequencies 4 < X< 64. The open circles represent predictions for Gaborfilters having only larger wavelengths X > 40 pixels (1.25times element size). Note that perfect correlation wouldplace one class of circles on top of each histogram rectangle.
The model was also tested with other values of a (16 and32) and produced similar results with one exception: im-provement of performance for pairs that differ in total pixelnumber (pair number 10 and 11) for a = 16. At this a valuethe most discriminating filters are low-pass filters and arethus more intensity sensitive.
A visual inspection of the data shows a surprisingly goodcorrelation between the model performance and human per-formance. The percent-correct values produced by themodel are close to the ones obtained in psychophysical ex-periments, and asymmetries, whenever they are pro-nounced, correlate remarkably well. The total correlationvalue is 0.80 (r = 0.83 for the low-frequency version). Itshould be noted that the psychophysical data points arebased on a limited number of trials (n = 384) distributed
across twelve observers (which are not the same for all tex-ture pairs) and across four stimulus durations; thus a perfectcorrelation when only one adjustable parameter is used isnot expected.
D. Model SummaryWe have presented a model of human texture discriminationthat seems to account well for psychophysical results. Tex-ture differences are detected here by differential activity inorientation and spatial frequency filters. A decision rule isadded in order to allow real texture borders to be separatedfrom spurious ones that are caused by texture spatial vari-ability and noise. This decision rule produces asymmetry indetection because of varying noise levels in the backgroundcaused by different elements.
We believe that this decision stage cannot be avoided, andthus asymmetry is expected from any model that is based ondetection of local differences (without identification). Wechose a simple detection rule, detection of a global maximumof local differences.
This hypothesis seems to work in our case, but more-complicated decision rules are possible, depending on thecomplexity of the available information in the local-differ-ence maps. In addition, the level of familiarity of the ob-servers with the textured patterns must be considered, withthe uncertainties introduced by the experimenter taken intoaccount. In the experiments that we modeled, the differenttexture pairs were intermixed in blocks of trials; thus ageneral decision strategy had to be used. In another set ofexperiments, Gurnsey and Browse' trained two observers toimprove their performance. Within the framework intro-duced here, this improvement can be a result of improvingdecision strategy, which can be accomplished by consideringthe size of the foreground as a detection facilitator, applyingminima detection in addition to or instead of maxima detec-
B. S. Rubenstein and D. Sagi
Vol. 7, No. 9/September 1990/J. Opt. Soc. Am. A 1639
tion, or looking for specific types of edge value. Fogel andSagi13 overcame some of these problems by using an algo-rithm that removed edges that enclosed small areas. Thecomplexity of this level is not known, and our ability topredict performance by using simple rules implies that thevisual system does not use complicated ones (in the case ofuntrained observers and stimulus uncertainty). The resultsof our psychophysical experiments (described in Section 5)show that asymmetry also occurs in detection tasks withoutstimulus uncertainty (but with spatial uncertainty) andwhen one is using trained observers.
We suspect that the decision strategy used will be particu-larly important in discrimination tasks of textures havingsimilar power spectra, such as pair 13 of Fig. 5. Althoughthe two elements of this pair have the same energies at allspatial frequencies, the distribution across orientation isdifferent. At low spatial frequencies, one of them (arrow)has a relatively small orientation variance, whereas the other(triangle) has a pronounced variance, thus producing noisyfiltered maps when the figures are randomly oriented. Thissituation can be enhanced by using the classical triangle-arrow pair with equal sides,38 producing an even smallerorientation (and thus spatial) variance for the arrows. Theresult is a much better discrimination rate (41% for arrowsand 58% for triangles as foreground), in agreement withpsychophysical observations. 2 39 Nothdurft4 0 observed areduction in discrimination of these textures when spatialjitter is increased, thus providing more evidence for the roleof spatial variability in this task.
The overall discrimination performance of our model isdetermined by the noise variance (Vn), which may depend oninternal noise and mask noise. However, in the cases exam-ined here, the main limiting factor is the texture spatialvariance. An absolute limit on model performance was ob-tained by testing the model with Vn = 0, resulting in someimprovement for most pairs (0 to 24%, with an average of6.4% and a standard deviation and 6.7%). This improvedperformance is equal, on the average, to human performanceobtained at long stimulus durations of 167 msec in the ex-periments reported by Gurnsey and Browse.'
Finally, asymmetry is not necessarily a result of havingunequal background and foreground areas. We predict thatasymmetry depends on foreground positional uncertainty(number of possible locations) and not so much on area ratio.However, within the framework of the model, the foregroundarea can be important in two ways: relative to the smooth-ing operator size and relative to the size of clusters formed bybackground variability. These two factors should be exam-ined more carefully, both theoretically and experimentally.
5. PSYCHOPHYSICAL STUDY OFORIENTATION VARIABILITY
In order to test directly the dependence of texture segmenta-tion on orientation variability, we conducted psychophysicalexperiments. These experiments attempt to find a corre-spondence between texture-orientation variability and per-formance asymmetry. It should be noted that these experi-ments were not modeled by the previously described model,because of the different experimental paradigm used. Al-though they too could be modeled, we found the extensive
data provided by Gurnsey and Browse to be sufficient insupporting our model. These experiments rather were per-formed only to confirm the importance of orientation vari-ability.
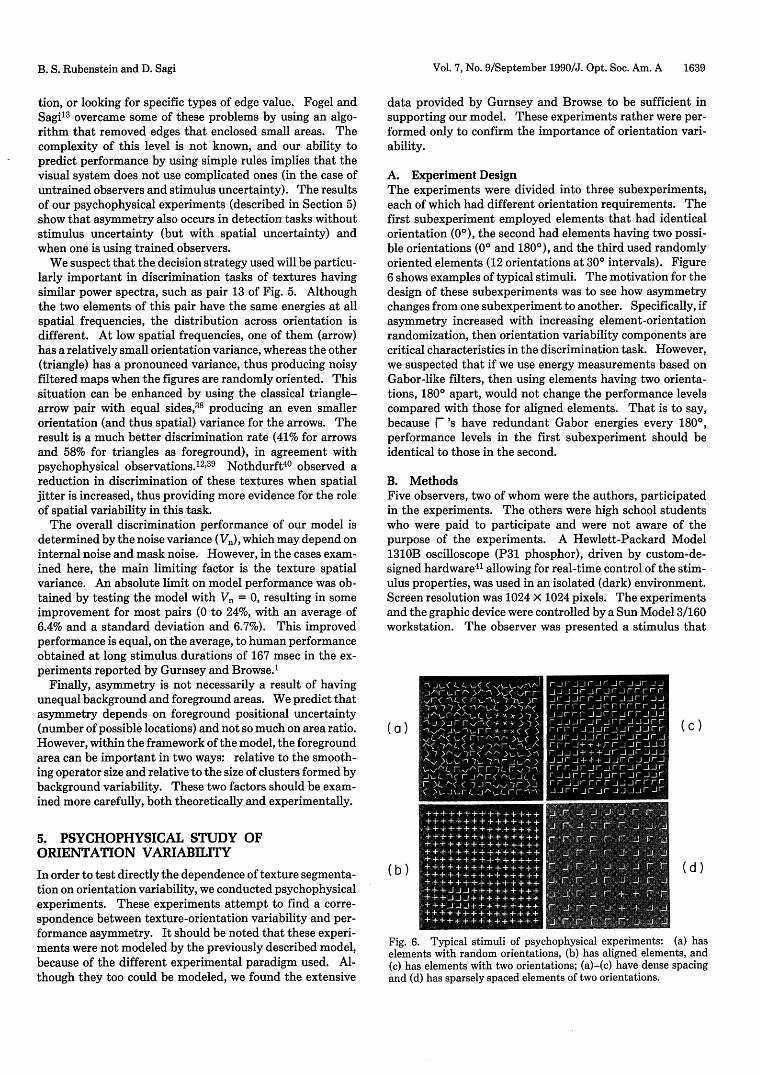
A. Experiment DesignThe experiments were divided into three subexperiments,each of which had different orientation requirements. Thefirst subexperiment employed elements that had identicalorientation (00), the second had elements having two possi-ble orientations (00 and 180°), and the third used randomlyoriented elements (12 orientations at 300 intervals). Figure6 shows examples of typical stimuli. The motivation for thedesign of these subexperiments was to see how asymmetrychanges from one subexperiment to another. Specifically, ifasymmetry increased with increasing element-orientationrandomization, then orientation variability components arecritical characteristics in the discrimination task. However,we suspected that if we use energy measurements based onGabor-like filters, then using elements having two orienta-tions, 180° apart, would not change the performance levelscompared with those for aligned elements. That is to say,because F 's have redundant Gabor energies every 1800,performance levels in the first subexperiment should beidentical to those in the second.
B. MethodsFive observers, two of whom were the authors, participatedin the experiments. The others were high school studentswho were paid to participate and were not aware of thepurpose of the experiments. A Hewlett-Packard Model1310B oscilloscope (P31 phosphor), driven by custom-de-signed hardware4 ' allowing for real-time control of the stim-ulus properties, was used in an isolated (dark) environment.Screen resolution was 1024 X 1024 pixels. The experimentsand the graphic device were controlled by a Sun Model 3/160workstation. The observer was presented a stimulus that
(a) (c)
(d)(b)
Fig. 6. Typical stimuli of psychophysical experiments: (a) haselements with random orientations, (b) has aligned elements, and(c) has elements with two orientations; (a)-(c) have dense spacingand (d) has sparsely spaced elements of two orientations.
B. S. Rubenstein and D. Sagi

1640 J. Opt. Soc. Am. A/Vol. 7, No. 9/September 1990 B .Rbnti n .Sg
Fig. 7. Typical mask having elements comprising a +/ F combina-tion shown with randomly generated orientations.
contains a background and an intermittently shown fore-ground region followed by a mask (see Fig. 7). Consequent-ly the observer had a simple detection task. The stimuluswas composed of a ground, a 15 X 15 matrix of elements, anda disparate region, a 3 X 3 matrix randomly situated over theground. The foreground placement had been defined not tooverlie the center fixation point so the observer could notsimply identify the target by merely studying the centerarea. Also, the foreground did not overlie the bordering two
elements of the ground so as to stay within the foveal area.Each element was placed within a 64 X 64 pixel field (100 X100 in sparse spacing conditions). With sparse spacing, theground was a 9 X 9 matrix of elements, and a 2 X 2 matrixwas used for the disparate region. +'s and F 's were used,with line segments of each element being 40 pixels in length.In turn, each element field was placed adjacent to another inthe stimulus field. Also, each element was positioned ran-domly (jitter) about the center of its space, with as many as 6pixels in any direction. This unalignment was implementedto reduce the potential assistance of global alignment in thedetection task. The observer was positioned 170 cm awayfrom the screen, subtending a 20.2' arc to each elementsegment. The side of the ground matrix subtended an 8.10arc. During the actual experiment, the fixation mark wasshown to center the observer's attention followed by thestimulus (shown for a duration of 10 msec = frame) with orwithout the disparate region (target). Then after an inter-stimulus interval (isi) of 5 to 160 msec, a mask composed ofrandomly oriented elements (+/ F combination with 12 ori-entations at 300 intervals) was shown (100 msec). Notethat the mask's matrix size was identical to that of thestimulus, positionally aligned to overlap except for the 6-pixeljitter. The disparate region was presented only 50%ofthe time, and each observer was asked to detect it by usingthe keyboard to answer yes (1) or no (0). Experiments wereconducted in blocks of 50 trials, with each block havingexactly the same conditions (i.e., isi and elements remained
ONE ORIENTATION DOUBLE ORIENTATION
80 10015 (sec)
RANDOM ORIENTATION
YG L>~-~-
L ~ ~ ~ ~ ~ ~ ~ L +
L ~Ise Z Ise iso
40 60 80 2 0 60'---- 80 100 120 20 40 60 80 100 120 140 160ISI rmsec)
B3R +..
Ise. Ise I se-
20 40 60
KEY
+ =4+ in foregroundL L in foreground
20 40 60 80IS (sec)
DENSE SPAC IN GFig. 8. Psychophysical results of three observers, AP, YG, and BR, for densely spaced stimuli having one orientation, two orientations, andrandom orientations. Asymmetry is marked by the spaces between the curves. Notice that asymmetry increases for textures having moreorientations. The average standard error is depicted at the lower right-hand portion of the graph box.
cn 100
IW -P 80a:-
'.A 60
a0-
1~I00z
LA -g 80-
*60
20 40 60 80 100 120
B. S. Rubenstein and D. Sagi

Vol. 7, No. 9/September 1990/J. Opt. Soc. Am. A 1641
DOUBLE ORIENTATION RANDOM ORIENTATION
SE L
20 ~ 40 60_h 1'e Inse se
20 40 60 8020 40 60 80 80ISI (msec)
BR-LL
se / + I se
_t_ 9 __ __ - # 0* _ An t~~o onU20 40 60 80 20 40
ISt (Msec)60 Zo 40
DS +IL
[se se - sej
20 40 60
KEY
20 40 60ISI (msec)
80 100 20 4U bU dU UU
+ + in foreground
L L in foreground SPARSE SPACING
Fig. 9. Psychophysical results of three observers, SE, BR, and DS, for sparsely spaced stimuli having one orientation, two orientations, andrandom orientations. Notice that there exists great asymmetry for random orientation; however, there is little increase in asymmetry from oneto two orientations.
in their respective background-foreground regions, but theforeground was in different positions). Subjects were testedwith both +'s and F 's in the disparate region. Before eachexperiment, observers were allowed to see the stimulus inorder to understand the task and were aware of the isi.Detection rates were calculated as the average of the perfor-mances to detect both conditions (with or without target) soas to eliminate any subjective preference to one of the condi-tions. Each observer was limited to I h of experimentationto offset the effects of fatigue. Also, observers were allowedto practice for extended periods (up to weeks) so as to accli-mate themselves to the task at hand and, more importantly,learn the task to the point that they can reproduce similarresults.
C. ResultsThe psychophysical data clearly show that, as the elementshave more variability in orientation, asymmetry increases.Figure 8 shows the data with asymmetry marked as thehorizontal spaces between the curves. In the first subexper-iment (one orientation), discrimination for both elements inthe foreground produces similar performance levels, show-ing that the task is symmetric. In the second and third parts(double and random orientation), asymmetry becomesgreater and greater, indicating the importance of orientationvariability. Also, note that, contrary to our prediction con-cerning the second subexperiment of two orientations,asymmetry does increase.
However, in studying the stimulus, we decided that per-haps there were some additional energy variabilities causedby the dense spacing of elements that was affecting thedetection process. Specifically, for the two-orientation sub-experiment, line segments of adjacent F 's tended to liecloser to one another at times in comparison with the firstsubexperiment (one alignment) [see Figs. 6(b) and 6(c)].This would cause greater variability in energies, leading togreater asymmetry than that of aligned F 's. In order toremove this unwanted feature and to isolate orientationvariables, we increased the spacing between the elements,placing the elements in a larger 100 X 100 pixel space [seeFig. 6(d)]. This would remove much of the accidental merg-ing of elements and reduce undesired variability. Hence weconducted an experiment identical to the one mentionedabove with the exception of larger spacing, defining a 9 X 9matrix of elements for the ground and a 2 X 2 matrix target.Figure 6(d) is one example of such a stimulus.
The results are similar to the previous experiments withthe exception that, as expected, asymmetry does not in-crease measurably from the first subexperiment to the sec-ond (see Fig. 9). This supports the idea that orientationcells detect little additional variability, causing performancelevels to remain the same. The small increase in asymmetrycan be accounted for by the effects of positional variabilitymentioned in Section 1, but they are shown here to be negli-gible (in the case of large spacing) compared with the effectsof orientation variability. Also, note that one observer ex-
ONE ORIENTATION
9 100
0
'BC
§ o
W
I
w 6Cit00
it l00U'z0
I-crvo 8
B. S. Rubenstein and D. Sagi
6C) Uu

1642 J. Opt. Soc. Am. A/Vol. 7, No. 9/September 1990
hibited asymmetry for the first subexperiment (one orienta-tion) of sparse spacing (see results for observer BR in Fig. 9).However, this does not affect the validity of the conclusions.
6. CONCLUSION
In conclusion, we have shown experimentally and theoreti-cally that orientation variability can account for perfor-mance asymmetries in texture-discrimination tasks. Ourexperiments show conclusively that, for textures having ran-domly oriented elements, those elements with relativelygreater orientation variability are more distracting in thebackground, resulting in decreased discrimination. Henceasymmetry is the result of background-foreground elementswith different variability profiles. Furthermore, it shouldbe noted that the essence of this model is not to emphasizethe importance of variability across the orientation spec-trum but rather to show how noise characteristics of a stimu-lus are the critical contributors in testing whether discrimi-nation is possible and to what degree. Orientation variabili-ty is hence merely one kind of noise, and, although it hasbeen found to be important in the examples mentionedabove, other noise characteristics such as interelement char-acteristics and those concerning the vertical and tilted linesdescribed by Treisman 6 7 can also be important noise charac-teristics of a stimulus and therefore must be considered.
In spite of the different noise characteristics, we foundthat orientation variability is a major determinant of dis-crimination performance. In fact, using a model based onorientation variability, we found a remarkable correlationwith the psychophysical data of Gurnsey and Browse.' Themodel's success shows that sensory processing underlyingtexture discrimination can be understood strictly in terms oflocal computations, that is, no global calculations need beinvoked. Previously models found local computations to beinsufficient and therefore included global calculations, thusmaking the problem more complex and difficult.9 In ourmodel, an inevitable global component enters only at thedecision-making stage, i.e., when a global maximum of localdifferences must be found. This stage should be task de-pendent, since the decision rule that we used for the spatialfour-alternative forced-choice task is not applicable in de-tection tasks. Detection experiments (Section 5) containno-target trials that produce global maxima in the same wayas target trials. The solution suggested by standard detec-tion theories34 is to use a threshold in order to separate truemaxima from false ones. The success of this thresholdingoperation in distinguishing between trials with and withoutforeground depends on the magnitude of the F-B differencesignal relative to the background noise level.
On a biological level, the implications of such a model arethreefold. First, because of the highly satisfactory perfor-mance of a model based on orientation filters and localcomputations (resembling orientation-selective cells in thevisual cortex), texture segmentation would seem to be pro-cessed at a low level in the visual system. Second, this low-level processing implicates preattentive vision, a stage thatdeals with all parts of the visual field in parallel. Third,because we find orientation variability to be important intexture discrimination, both theoretically and psychophysi-cally, perhaps there exists a cortical stage of processing that
connects nearby orientation cells and consequently can de-tect local activity differences.
ACKNOWLEDGMENTS
We thank Jochen Braun for his comments, Anne Reich forher general assistance, and Yehuda Barbut for figure prepa-ration. This study was supported by the Basic ResearchFoundation administered by the Israel Academy of Sciencesand Humanities.
All correspondence should be addressed to Dov Sagi.
REFERENCES
1. R. Gurnsey and R. Browse, "Micropattern properties and pre-sentation conditions influencing visual texture discrimination,"Percept. Psychophys. 41, 239-252 (1987).
2. J. Beck, "Textural segmentation," in Organization andRepresentation in Perception, J. Beck, ed. (Erlbaum, Hillsdale,N.J., 1982).
3. H. C. Nothdurft, "Sensitivity for structure gradient in texturediscrimination task," Vision Res. 25, 1957-1968 (1985).
4. D. Sagi and B. Julesz, " 'Where' and 'what' in vision," Science228, 1217-1219 (1985).
5. D. Sagi and B. Julesz, "Short-range limitation on detection offeature differences," Spatial Vision 2, 39-49 (1987).
6. A. Treisman, "Preattentive processing in vision," Comput. Vi-sion Graphics Image Process. 31, 156-177 (1985).
7. A. Treisman, "Features and objects in visual processing," Sci.Am. 255, 106-125 (1986).
8. R. Gurnsey and R. Browse, "Aspects of visual texture discrimi-nation," in Computational Processes in Human Vision: AnInterdisciplinary Perspective, Z. Pylyshyn, ed. (Ablex, Nor-wood, N.J., 1988).
9. A. Treisman and S. Gormican, "Feature analysis in early vision:evidence from search asymmetries," Psychol. Rev. 95, 15-48(1988).
10. A. Treisman and J. Souther, "Search asymmetry: a diagnosticfor preattentive processing of separable features," J. Exp. Psy-chol. 114, 285-310 (1985).
11. B. Julesz, "A brief outline of the texton theory of human vision,"Trends Neurosci. 7, 41-45 (1984).
12. B. Julesz, "Texton gradients: the texton theory revisited,"Biol. Cybern. 54, 245-251 (1986).
13. I. Fogel and D. Sagi, "Gabor filters as texture discriminator,"Biol. Cybern. 61, 103-113 (1989).
14. J. Beck, A. Sutter, and R. Ivry, "Spatial frequency channels andperceptual grouping in texture segregation," Comput. VisionGraphics Image Process. 37, 299-325 (1987).
15. T. M. Caelli, "Three processing characteristics of visual texturesegmentation," Spatial Vision 1, 19-30 (1985).
16. J. D. Daugman and D. M. Kammen, "Pure orientation filtering:a scale-invariant image-processing tool for perception researchand data compression," Behav. Res. Meth. Instrum. Comput.18, 559-564 (1986).
17. M. R. Turner, "Texture discrimination by Gabor functions,"Biol. Cybern. 55, 71-82 (1986).
18. B. Julesz, "Visual pattern discrimination," IRE Trans. Inf. The-ory 8, 84-92 (1962).
19. B. Julesz, H. L. Frisch, E. N. Gilbert, and L. A. Shepp, "Inabilityof humans to discriminate between visual textures that agree insecond-order statistics," Biol. Cybern. 31, 137-140 (1973).
20. D. A. Pollen and S. F. Ronner, "Visual cortical neurons aslocalized spatial frequency filters," IEEE Trans. Syst. Man Cy-bern. SMC-13, 907-916 (1983).
21. F. W. Campbell and J. G. Robson, "Application of Fourieranalysis to the visibility of gratings," J. Physiol. (London) 197,551-566 (1968).
22. J. Daugman, "Two dimensional spectral analysis of corticalreceptive field profiles," Vision Res. 25, 671-684 (1980).
B. S. Rubenstein and D. Sagi

Vol. 7, No. 9/September 1990/J. Opt. Soc. Am. A 1643
23. D. Sagi, "The combination of spatial frequency and orientationis effortlessly perceived," Percept. Psychophys. 43, 601-603(1988).
24. A. B. Watson and J. G. Robson, "Discrimination at threshold:labeled detectors in human vision," Vision Res. 21, 1115-1122(1981).
25. H. R. Wilson and J. R. Bergen, "A four mechanism model forthreshold spatial vision," Vision Res. 19, 19-32 (1979).
26. D. C. Van Essen, E. A. DeYoe, J. Olavarria, J. Knierim, J. Fox,D. Sagi, and B. Julesz, "Neural responses to static and movingtexture patterns in visual cortex of the macaque monkey," inNeutral Mechanisms of Visual Perception, D. M. K. Lam andC. Gilbert, eds. (Portfolio, The Woodlands, Tex., 1989), pp. 137-154.
27. C. Chubb, G. Sperling, and J. Solomon, "Texture interactionsdetermine apparent lightness," Proc. Natl. Acad. Sci. USA 86,9631-9635 (1989).
28. M. S. Landy and J. R. Bergen, "Texture segregation for filterednoise patterns," Invest. Ophthalmol. Vis. Sci. Suppl. 30, 160(1989).
29. D. Sagi, "Detection of an orientation singularity in Gabor tex-tures: effect of signal density and spatial-frequency," VisionRes. (to be published).
30. D. Sagi and S. Hochstein, "Lateral inhibition between spatiallyadjacent spatial frequency channels?" Percept. Psychophys. 37,315-322 (1985).
31. J. R. Bergen and E. H. Adelson, "Early vision and textureperception," Nature (London) 333, 363-364 (1988).
32. J. Malik and P. Perona, "Preattentive texture discriminationwith early vision mechanisms," J. Opt. Soc. Am. 7, 923-932(1990).
33. H. Voorees and T. Poggio, "Computing texture boundaries fromimages," Nature (London) 333, 364-367 (1988).
34. D. M. Green and J. A. Swets, Signal Detection Theory andPsychophysics (Wiley, New York, 1966).
35. H. R. Wilson and D. J. Gelb, "Modified line-element theory forspatial-frequency and width discrimination," J. Opt. Soc. Am. A1, 124-131 (1984).
36. A. B. Watson and J. Nachmias, "Patterns of temporal interac-tion in the detection of gratings," Vision Res. 17, 893-902(1977).
37. R. Gurnsey, Department of Psychology, University of WesternToronto, London, Ontario N6A 5C2, Canada (personal commu-nication, 1989).
38. B. Julesz, "Spatial nonlinearities in the visual perception oftextures with identical power spectra," Philos. Trans. R. Soc.London Ser. B 290, 83-94 (1980).
39. J. Enns, "Seeing textons in context," Percept. Psychophys. 39,143-147 (1986).
40. H. C. Nothdurft, "Texton segregation by associated differencesin global and local luminance distribution," Proc. R. Soc. Lon-don Ser. B 239, 295-320 (1990).
41. 0. Smikt, Department of Applied Mathematics, The WeizmannInstitute of Science, Rehovot 76100, Israel (personal communi-cation, 1988).
B. S. Rubenstein and D. Sagi