Embed Size (px)
Citation preview

SPATIO-TEMPORAL CHARACTERISTICS OF RAINFALL AND
TEMPERATURE IN BANGLADESH
K. Roy*, M. Kumruzzaman & A. Hossain
Department of Civil Engineering, Rajshahi University of Engineering and Technology, Rajshahi,
Bangladesh *Corresponding Author: [email protected]
ABSTRACT This study deals with some available rainfall and temperature data for 31 stations of Bangladesh. Data
for rainfall and temperature are collected during 1971 to 2012 time periods. Data of number of
plantation and industries are also collected from the respective organizations. Annual rainfall, highest
maximum and minimum annual temperatures have been analyzed by least square method. From the
analysis it is found that, during study period the maximum rainfall occurred at Teknaf. On the other
hand, minimum rainfall is found at Rajshahi. In most of the cases, the temperature of northern part is
generally higher than the southern part of the country. From present study it has observed that the
number of tree plantation was insufficient to reduce climatic degradation in Rajshahi region. Because
of increasing the number of industries in Rajshahi, Dhaka, Khulna and Chittagong divisions, climatic
parameters changed intensely in the following regions in last 14 years rather than the first and second
14 years which consequences the vulnerable threat to our modern civilization.
Keywords: climatic change; climatic data; least square method; regression equation; contour map
INTRODUCTION
Climate in a narrow sense is usually as the ‘average weather’, or more rigorously, as the statistical
description in terms of the mean and variability of relevant quantities over a period of time.Climatic
variability refers to variations in the mean state and other climate statistics (standard deviations, the
occurrences of extremes, etc.) on all temporal and spatial scales beyond those of individual weather
events (Ahmed, A.U. 2006). Climate change in Bangladesh is an extremely crucial issue and
according to National Geographic, Bangladesh ranks first as the nation most vulnerable to the impacts
of climate change in the coming decades. The main objectives of this study are as follows:
i) To study the spatio-temporal characteristics of annual rainfall in Bangladesh.
ii) To study the spatio-temporal characteristics of highest maximum and lowest minimum annual
temperature.
iii) To find the effect of plantation and industrialization on different climatic parameters.
METHODOLOGY
Rainfall, temperature (1971-2012) data were divided into three periods, used for different analysis to
perform this study at different stations. Less industrialization period is taken as first period (1971-
1984), moderate industrialization period is taken as second period (1985-1998) and modern
industrialization period is taken as third period (1999-2012). The daily rainfall, temperature
(maximum, minimum), data were collected from the Bangladesh Meteorological Department (BMD)
at 31 stations of Bangladesh for 42 years (1971-2012).
Plantation data of different years is collected from Barind Multipurpose Development Authority
(BMDA) for Rajshahi division. Number of industries of different years is collected from Bangladesh
Small & Cottage Industries Corporation (BSCIC) for Rajshahi, Dhaka, Khulna and Chittagong
division.
To analysis the data of climatic parameters the least square method has been used where the
regression equations show the variations of annual rainfall and temperature with time (Garg, S. K.,
1976). This resulting curve is called a regression line of Y on X, since Y is estimated from X.
Proceedings of 3rd International Conference on Advances in Civil Engineering, 21-23 December 2016, CUET, Chittagong, Bangladesh Islam, Imam, Ali, Hoque, Rahman and Haque (eds.)
747
Mathematically, Y = mX + C (Shamsuddin S. 2009)
where, C = constant, m = slope of regression line of Y on the X to the X axis and is called coefficient
of regression of Y on X
ANALYSIS OF DATA
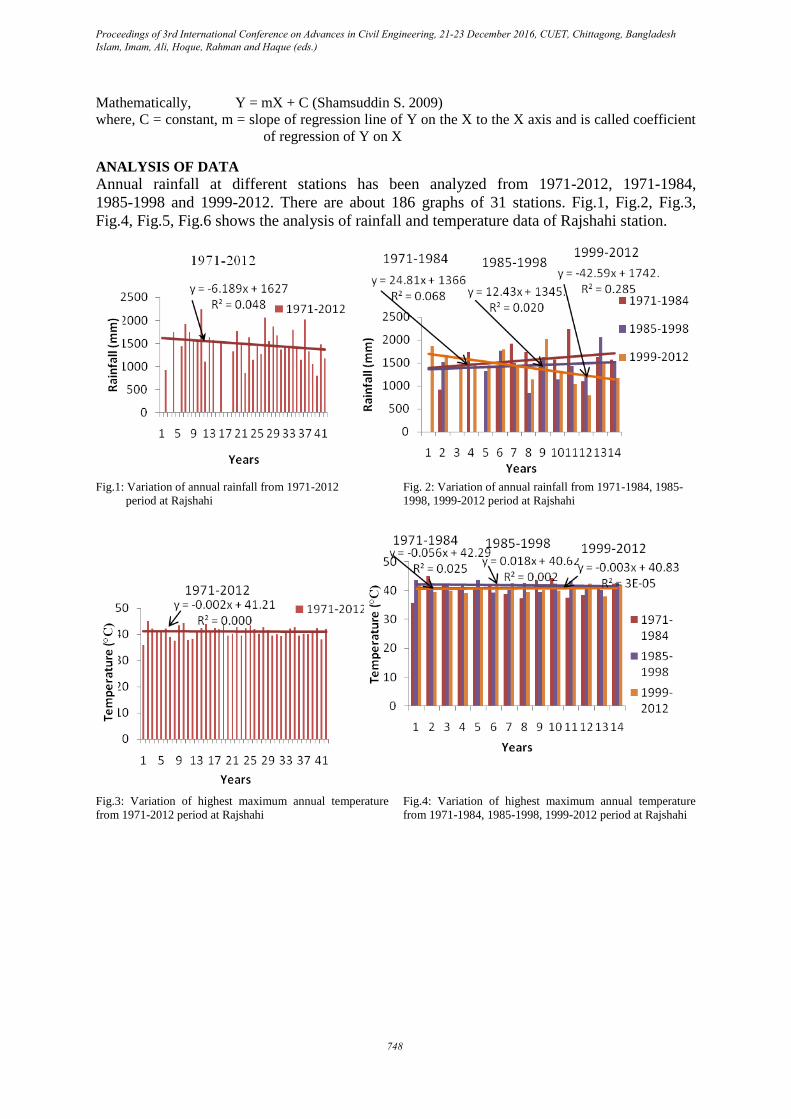
Annual rainfall at different stations has been analyzed from 1971-2012, 1971-1984,
1985-1998 and 1999-2012. There are about 186 graphs of 31 stations. Fig.1, Fig.2, Fig.3,
Fig.4, Fig.5, Fig.6 shows the analysis of rainfall and temperature data of Rajshahi station.
Fig.1: Variation of annual rainfall from 1971-2012
period at Rajshahi
Fig. 2: Variation of annual rainfall from 1971-1984, 1985-
1998, 1999-2012 period at Rajshahi
Fig.3: Variation of highest maximum annual temperature
from 1971-2012 period at Rajshahi Fig.4: Variation of highest maximum annual temperature
from 1971-1984, 1985-1998, 1999-2012 period at Rajshahi
Proceedings of 3rd International Conference on Advances in Civil Engineering, 21-23 December 2016, CUET, Chittagong, Bangladesh Islam, Imam, Ali, Hoque, Rahman and Haque (eds.)
748
RESULTS & DISCUSSIONS
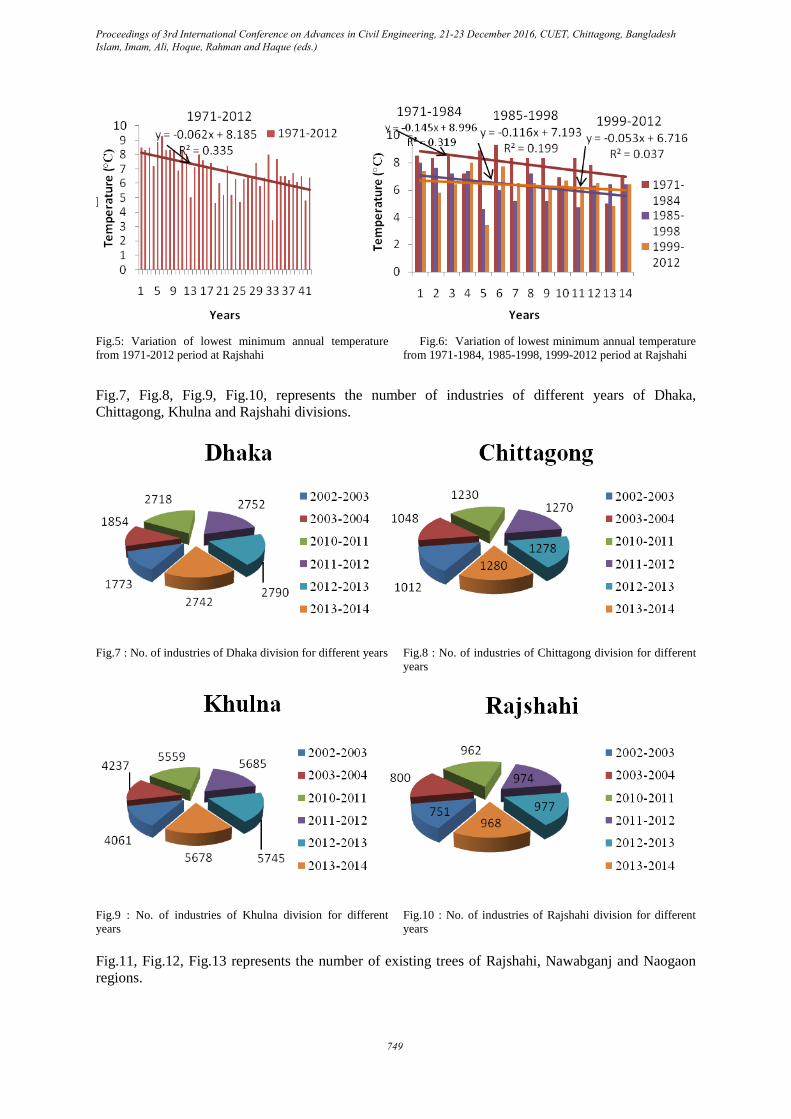
Fig.5: Variation of lowest minimum annual temperature
from 1971-2012 period at Rajshahi Fig.6: Variation of lowest minimum annual temperature
from 1971-1984, 1985-1998, 1999-2012 period at Rajshahi
Fig.7, Fig.8, Fig.9, Fig.10, represents the number of industries of different years of Dhaka,
Chittagong, Khulna and Rajshahi divisions.
Fig.7 : No. of industries of Dhaka division for different years Fig.8 : No. of industries of Chittagong division for different
years
Fig.9 : No. of industries of Khulna division for different
years Fig.10 : No. of industries of Rajshahi division for different
years
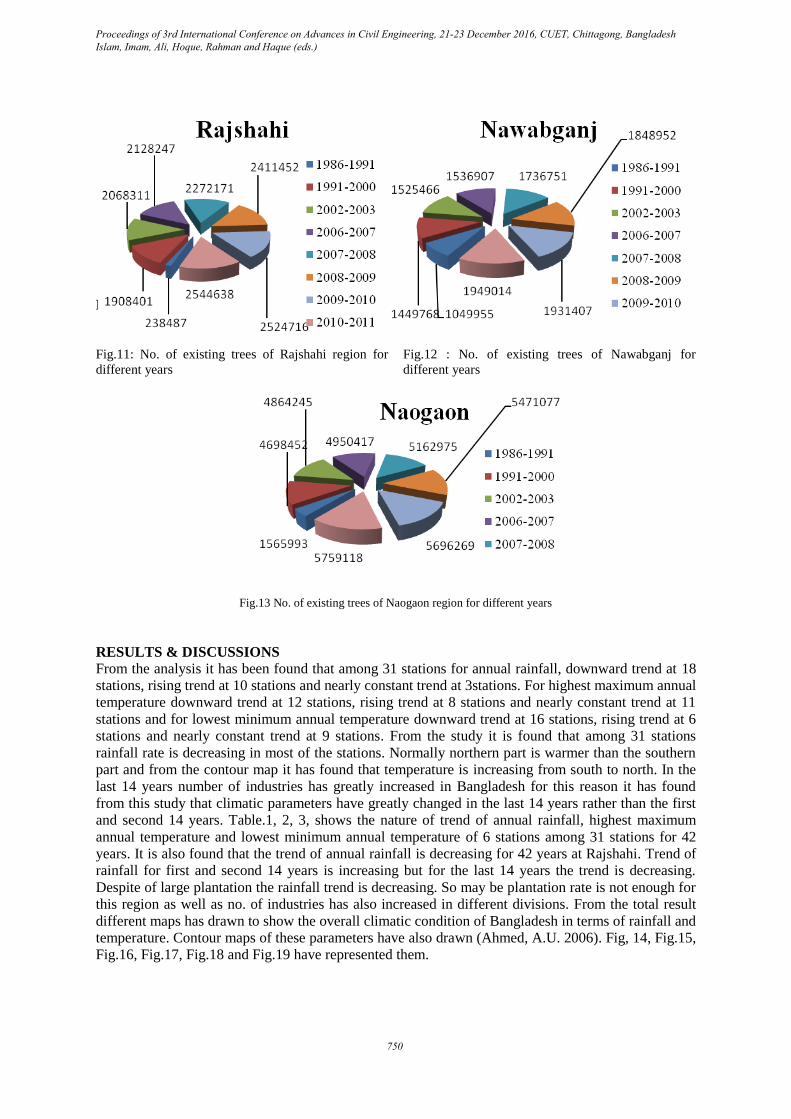
Fig.11, Fig.12, Fig.13 represents the number of existing trees of Rajshahi, Nawabganj and Naogaon
regions.
Proceedings of 3rd International Conference on Advances in Civil Engineering, 21-23 December 2016, CUET, Chittagong, Bangladesh Islam, Imam, Ali, Hoque, Rahman and Haque (eds.)
749
RESULTS &DISCUSSIONS
Fig.11: No. of existing trees of Rajshahi region for
different years Fig.12 : No. of existing trees of Nawabganj for
different years
Fig.13 No. of existing trees of Naogaon region for different years
RESULTS & DISCUSSIONS
From the analysis it has been found that among 31 stations for annual rainfall, downward trend at 18
stations, rising trend at 10 stations and nearly constant trend at 3stations. For highest maximum annual
temperature downward trend at 12 stations, rising trend at 8 stations and nearly constant trend at 11
stations and for lowest minimum annual temperature downward trend at 16 stations, rising trend at 6
stations and nearly constant trend at 9 stations. From the study it is found that among 31 stations
rainfall rate is decreasing in most of the stations. Normally northern part is warmer than the southern
part and from the contour map it has found that temperature is increasing from south to north. In the
last 14 years number of industries has greatly increased in Bangladesh for this reason it has found
from this study that climatic parameters have greatly changed in the last 14 years rather than the first
and second 14 years. Table.1, 2, 3, shows the nature of trend of annual rainfall, highest maximum
annual temperature and lowest minimum annual temperature of 6 stations among 31 stations for 42
years. It is also found that the trend of annual rainfall is decreasing for 42 years at Rajshahi. Trend of
rainfall for first and second 14 years is increasing but for the last 14 years the trend is decreasing.
Despite of large plantation the rainfall trend is decreasing. So may be plantation rate is not enough for
this region as well as no. of industries has also increased in different divisions. From the total result
different maps has drawn to show the overall climatic condition of Bangladesh in terms of rainfall and
temperature. Contour maps of these parameters have also drawn (Ahmed, A.U. 2006). Fig, 14, Fig.15,
Fig.16, Fig.17, Fig.18 and Fig.19 have represented them.
Proceedings of 3rd International Conference on Advances in Civil Engineering, 21-23 December 2016, CUET, Chittagong, Bangladesh Islam, Imam, Ali, Hoque, Rahman and Haque (eds.)
750
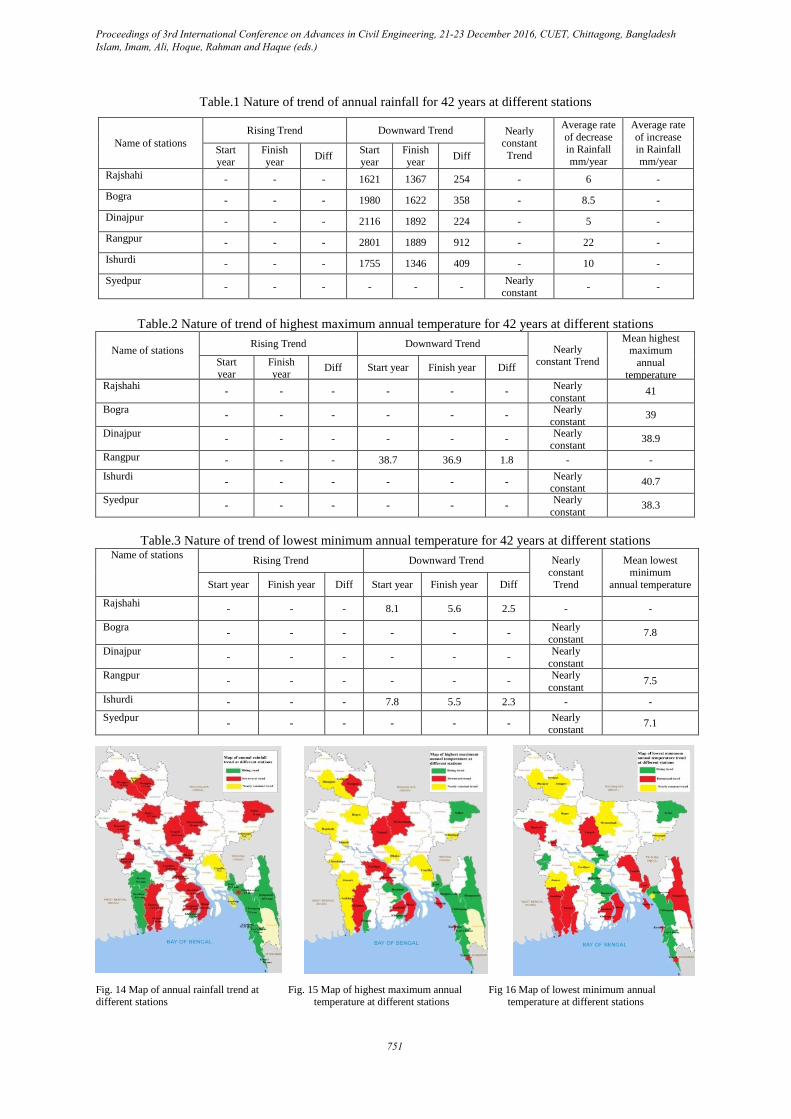
Table.1 Nature of trend of annual rainfall for 42 years at different stations
Name of stations
Rising Trend Downward Trend Nearly constant
Trend
Average rate
of decrease in Rainfall
mm/year
Average rate
of increase in Rainfall
mm/year Start year
Finish year
Diff Start year
Finish year
Diff
Rajshahi
- - - 1621 1367 254 - 6 -
Bogra
- - - 1980 1622 358 - 8.5 -
Dinajpur
- - - 2116 1892 224 - 5 -
Rangpur
- - - 2801 1889 912 - 22 -
Ishurdi
- - - 1755 1346 409 - 10 -
Syedpur
- - - - - - Nearly
constant - -
Table.2 Nature of trend of highest maximum annual temperature for 42 years at different stations
Name of stations
Rising Trend Downward Trend Nearly
constant Trend
Mean highest maximum
annual
temperature
Start year
Finish year
Diff Start year Finish year Diff
Rajshahi
- - - - - -
Nearly
constant 41
Bogra
- - - - - -
Nearly
constant 39
Dinajpur
- - - - - - Nearly
constant 38.9
Rangpur
- - - 38.7 36.9 1.8 - -
Ishurdi
- - - - - - Nearly
constant 40.7
Syedpur
- - - - - -
Nearly
constant 38.3
Table.3 Nature of trend of lowest minimum annual temperature for 42 years at different stations Name of stations
Rising Trend Downward Trend Nearly constant
Trend
Mean lowest minimum
annual temperature Start year Finish year Diff Start year Finish year Diff
Rajshahi
- - - 8.1 5.6 2.5 - -
Bogra
- - - - - -
Nearly
constant 7.8
Dinajpur
- - - - - -
Nearly
constant
Rangpur
- - - - - -
Nearly
constant 7.5
Ishurdi
- - - 7.8 5.5 2.3 - -
Syedpur
- - - - - - Nearly
constant 7.1
Fig. 14 Map of annual rainfall trend at Fig. 15 Map of highest maximum annual Fig 16 Map of lowest minimum annual
different stations temperature at different stations temperature at different stations
Proceedings of 3rd International Conference on Advances in Civil Engineering, 21-23 December 2016, CUET, Chittagong, Bangladesh Islam, Imam, Ali, Hoque, Rahman and Haque (eds.)
751

Fig.17. Contour map of mean annual Fig.18. Contour map of mean highest maximum Fig19. Contour map of mean lowest rainfall annual temperature minimum annual temperature
CONCLUSION
Trend of different climatic parameters mainly changed during last 14 years. Average annual rainfall
(a.a.r.) varies from 1482 mm at Rajshahi to 4127 mm at Teknaf. The a.a.r. is large in the hilly area i.e.
Teknaf, Chittagong, Sylhet, Srimongal and small in the north-western part of the country Highest
mean minimum annual temperature varies from 5.9°C at Srimangal to 12°C at Cox’s Bazar. Though
Rajshahi is not an industrial area, number of industries is increasing day by day. Afforestation of this
region seems not to be sufficient. This is one of the reasons of decreasing tendency of rainfall.
Decreasing tendency of lowest temperature, increasing tendency of highest temperature have been
found in this area. In general, characteristics of different climatic parameters which have impact on
climatic degradation have been found in last 14 years period rather than the first and second 14 years
periods which may be a vulnerable threat to our modern civilization.
ACKNOWLEDGMENTS
The project was completed under the proper guidance of Dr. Md. Kumruzzaman, Professor,
Department of Civil Engineering, RUET, Rajshahi. The author takes this opportunity to thank
research guide, Professor Dr. Md. Kumruzzaman for the unstinting efforts and guidance, which made
working for this thesis enjoyable. The author is extremely grateful and happy to have him as
supervisor.
REFERENCES Ahmed, A.U. 2006. Bangladesh Climate Change Impacts and Vulnerability, A Synthesis. Climate
Change Cell, Bangladesh Department of Environment. Dhaka.
Bangladesh Meteorological Department Dhaka, Different Climatological Data for the period 1971 to
2012 at 31 stations of Bangladesh,
Briffa, K.R. Van der Schrier, G. and Jones P.D. (2009). Wet and dry summers in Europe since 1750,
Evidence of increasing drought. International Journal of Climatology, Vol. 29(13), pp. 1894-1905.
Chow, V .T, 1964. Hand Book of Applied Hydrology, McGraw-Hill Book Co. New York.
Garg, S. K., 1976. Irrigation Engineering & Hydraulic Structure, Khanna Publishers, Delhi.
Raghunath, H. M. 1985. Hydrology, New Age International (PVT) Limited, Delhi.
Shamsuddin S. (2009). Rainfall variability and the trends of wet and dry periods in Bangladesh”:
International Journal of Climatology.
SirajulI., Hasan G M J, Chowdhury, M.A.I., 2005, International Journal of Environmental Science
and Technology, Vol. 2, No. 4, Winter 2006, pp. 301-308
Proceedings of 3rd International Conference on Advances in Civil Engineering, 21-23 December 2016, CUET, Chittagong, Bangladesh Islam, Imam, Ali, Hoque, Rahman and Haque (eds.)
752