Embed Size (px)
Citation preview

SPATIO TEMPORAL MODELLING FOR SOCIAL MEDIA DATA
B U D I N U R A N I R . , A N D T E A M
WORKSHOP IN LINE WITH ICW-HDDA-X
FMIPA UNPAD

RESEARCH TEAM
EDDY HERMAWAN

RESEARCH BACKGROUND

SUPPORTED BY:RISE_SMA PROJECT
INTERNATIONAL CONSORTIUM
EUROPEAN GRANT
UNION 2019-2022
2. ALG 2020
WFH GRANT
UNPAD INTERNAL GRANT

BIG DATA-DATA SCIENCE
Big Data means data with a large capacity.
Volume, Variety, Varicity, and Velocity.
Data science is the interdisciplinary science
of compiling to obtain valuable actionable
wealth from data sets which include three
phases namely data design, data
collection, and data analysis.
http://www.teknologi-bigdata.com/2013/12/memahami-definisi-big-data.html

GEORGE BOX (18 October 1919 – 28 March 2013)

RESEARCH QUESTION

RESEARCH QUESTION
•HOW THE SPATIO TEMPORAL MODELLING CAN BE USED TO DESCRIBE OR PREDICT REAL PHENOMENA?
•HOW THE RELATION BETWEEN COVID-19 AS A SOCIAL MEDIA DATA WITH A CLIMATE PHENOMENA?

RESEARCH METHODOLOGY

KNOWLEDGE DISCOVERY IN DATABASE (KDD)
Data Mining: Concepts and Techniques
Data Mining: A KDD Process
Knowledge Discovery in Database—Han and Kamber , 2006
Data mining: the core of
knowledge discovery process.
Data Cleaning
Data Integration
Databases
Data Warehouse
Task-relevant Data
Selection
Data Mining
Pattern Evaluation


OUTLINE
Registration Twitter Application
Crawling Twitter Data Steps

Registration Twitter Application

REGISTER ON TWITTER APPLICATION#1 Access to the Twitter Developer site
#2 Sign in with a Twitter account
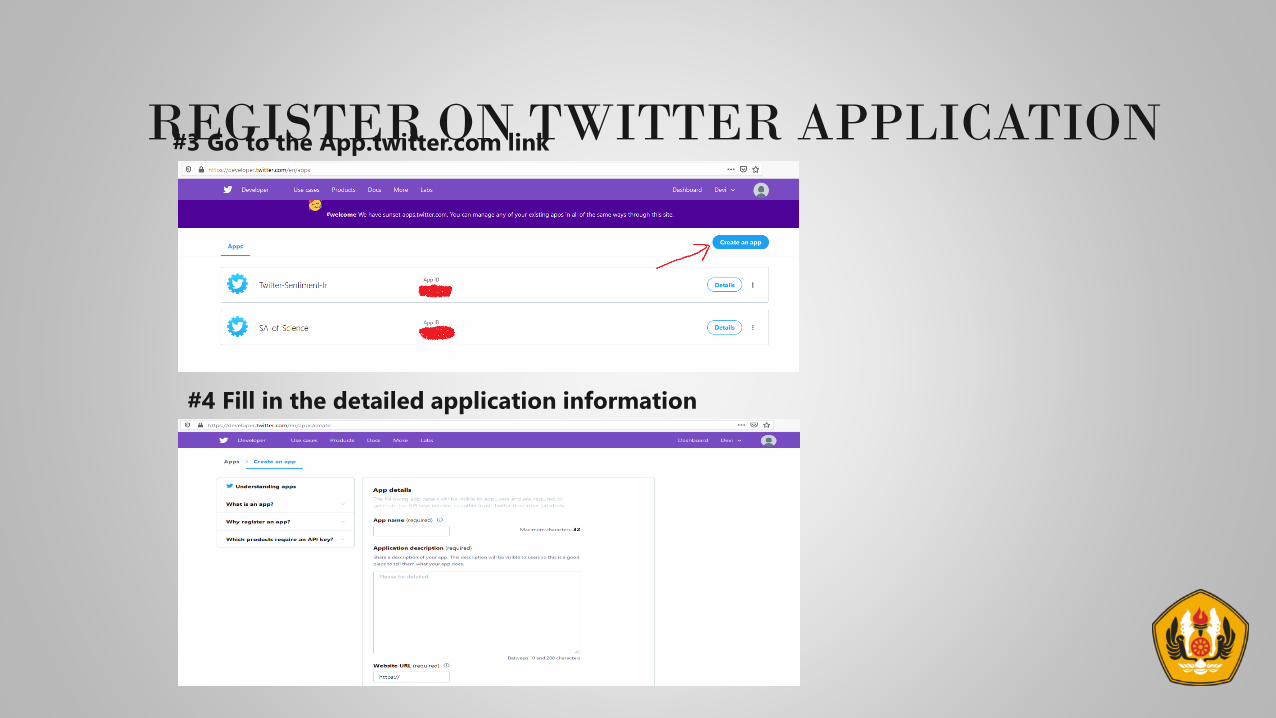
REGISTER ON TWITTER APPLICATION#3 Go to the App.twitter.com link
#4 Fill in the detailed application information

REGISTER ON TWITTER APPLICATION#5 Twitter application provides detailed App information, Keys and tokens, Permissions

Crawling Twitter Data Steps

CRAWLING TWITTER DATA
Crawling Data is used for data extraction and refers
to collecting data from either the world wide web, or
in data crawling cases – any document, file, etc

CRAWLING TWITTER DATA
Base on Trending Topic ex. #CoronaVirus, #Indonesialawancorona,
#PSBBJakarta
Base on keyword ex. #covid-19, coronavirus, PSBB,
#Covid19Indonesia.
Attribute Requiremens (fundamental:id,create_at,text Geo:lat,long
User:id,name,location,followers_count

CRAWLING TWITTER DATA
Utilize API/Library of Twitter for data Crawling
Use several programming languages(JavaScript, PHP, Python, R,
Ruby, etc.
Crawling results are stored in a repository (File / File Collection)

CRAWLING USING PYTHON

CRAWLING TWITTER DATA STEPS

Twitter Data Preperation
Crawling data is executed in real time by caching tweet data as soon as the crawling script is run for the next 20 minutes according to the defined duration time and stored in .json file format
Data was collected in 39 duration time from 10 March - 22 March 2020 with a total of 1,799,362 Tweets with 921,462 tweets with the keywords coronavirus, covid19, covid-19
Raw Tweet data is cleaned from ASCII tokens (non-text)
Take only the required Attributes: create_at, id, and text
All words are converted to Lowcase
Counting keyword text is calculated using the SUMPRODUCT function in Excel / Opencalc
Data is saved in .xlsx and .csv format

Raw tweet data is saved in the .json file format at each interval. The first duration is 11.00-11.20, the second duration is 16.00-16.20, the third duration 21.00-21.20. So in 1 day there are 3 different files with the .json format
Selection of the duration time between the hours is selected, after comparing the volume of tweets in other hours. Because at these hours it tends to approach the rest time and that is synchronized with the GMT time. Because the data format is in GMT
From the data attributes, there are many choices of data sets that contain attributes; create_at(retrieval time), str_id (twitter user id), and text (contents of tweets), this is done to minimize the process because of large data sets
From the three selected attributes, a process is performed to eliminate the characters of each tweet containing ASCII characters in order to facilitate the process of calculating keywords.
Twitter Data Preperation (cont.)

• RT @ndtv: Lockdowns not enough to defeat #coronavirus
• RT @TinasheRus: The only person that could end Coronavirus is her https://t.co/3C20oaxAha
• RT @WVUPublicHealth: Symptoms of COVID-19 may appear anywhere from 2-14 days after exposure
• RT @NorbertElekes: NEW: India reports 3 new coronavirus deaths
• RT @e100ss: Update Jumlah Kasus Covid-19 di Indonesia dan Jawa Timur per hari ini (22/3/2020). https://t.co/VFT1bPFGWp
• RT @Reuters: Thailand plans $3 billion liquidity support fund amid coronavirus outbreak https://t.co/VxJ7ot0Y30 https://t.co\/dcr14GGZQ3
• Many people are affected by the CoronaVirus. Avoid public places wash your hands regularly. Stay healthyhttps://t.co/sv7dsKk9nY
• @ndtv @IndiaToday this must be the headlines. We can defeat #coronavirus
• Receta la OCDE rescate tipo Plan Marshall por pandemia de coronavirus https://t.co/pcWtg0WhDP https://t.co/sHndIxAnhr
• *#PrayIndonesia* Korban Wabah Covid19 Setiap Hari Terus Bertambah https://t.co/b7dV2lbw4z
• RT @KemenkesRI: Update situasi terkini perkembangan #COVID19 di Indonesia (22/3) #tenangdanwaspada #LawanCovid19
Examples of Crawling Twitter data

Data in .csv format

Data in .xlsx format

Result of Calculation

Data Recapitulation
Number of Covid-19 tweets
Number of all tweets
May 5, 202020/41
Rt =
Date Hour
1 14.00-14.20 8.994 16.616 0,541
2 16.00-16.20 31.514 58.074 0,543
3 21.00-21.20 33.237 58.139 0,572
4 14.00-14.20 9.232 15.913 0,580
5 16.00-16.20 18.068 32.476 0,556
6 21.00-21.20 33.693 57.947 0,581
7 14.00-14.20 20.569 35.204 0,584
8 16.00-16.20 32.577 57.639 0,565
9 21.00-21.20 31.481 58.190 0,541
10 14.00-14.20 19.296 33.936 0,569
11 16.00-16.20 8.184 14.904 0,549
12 21.00-21.20 31.785 58.049 0,548
13 14.00-14.20 32.223 58.139 0,554
14 16.00-16.20 31.438 58.143 0,541
15 21.00-21.20 14.428 27.794 0,519
16 14.00-14.20 31.105 58.139 0,535
17 16.00-16.20 29.279 58.143 0,504
18 21.00-21.20 2.129 8.694 0,245
19 14.00-14.20 30.266 57.916 0,523
20 16.00-16.20 13.331 26.467 0,504
21 21.00-21.20 7.038 13.176 0,534
22 14.00-14.20 5.784 11.508 0,503
23 16.00-16.20 30.119 58.143 0,518
24 21.00-21.20 27.970 55.758 0,502
25 14.00-14.20 1.131 2.267 0,499
26 16.00-16.20 30.241 58.139 0,520
27 21.00-21.20 29.730 58.137 0,511
28 14.00-14.20 29.050 58.136 0,500
29 16.00-16.20 28.947 58.150 0,498
30 21.00-21.20 27.750 58.135 0,477
31 14.00-14.20 28.769 57.980 0,496
32 16.00-16.20 26.652 58.133 0,458
33 21.00-21.20 23.821 52.427 0,454
34 14.00-14.20 27.190 58.091 0,468
35 16.00-16.20 27.198 58.131 0,468
36 21.00-21.20 26.413 58.139 0,454
37 14.00-14.20 27.125 58.137 0,467
38 16.00-16.20 27.282 58.114 0,469
39 21.00-21.20 26.423 58.139 0,454
921.462 1.799.362 19,905
23.627 46.137 0,510
27.282 58.074 0,518Median
19/03/2023
20/03/2024
21/03/2025
Total
Mean
Number of
tweets
Total of
crawling
(Nt)
Consentration
of tweets
(Rt )
11/03//2020
12/03//2020
10/03/2020
14/3/2020
15/3/2020
22/03/2026
No
Time (t )
13/3/2020
16/3/2020
17/03/2021
18/03/2022

Implementation on Markov Model
It Provided on Parallel sessions HDDA-X Conference
Paper #7 in Room VII, Entitle :“Posted Prediction in
Social Media Base on Markov Chain Model: Twitter
Dataset With COVID-19 Trends”

EXAMPLE OF SPATIAL MODEL ON COVID-19 IN WEST JAVA

INTRODUCTION
Geostatistics Kriging MethodOrdinary
Kriging Method
Positive Covid-
19R Program

Covid-19 Data Source
Source: https://public.tableau.com/profile/divisi.data.jabar.digital.service#!/vizhome/SISTEMPEMANTAUANCOVID-19JAWABARAT-BLACKVERSION/DashboardPikobar (March 30, 2020)


Positive Covid-19 Data at 27 Districts/Cities
Based on data obtained from the West JavaProvince Covid-19 Information andCoordination Center (PIKOBAR), the dataused in this study is the data on the positivedistribution of Covid-19 in 27 districts/citiesin West Java on March 30, 2020. There are17 districts/cities positively infected withCovid-19 and 10 districts/cities that have notbeen / are not positively infected with Covid-19, so that 10 districts/cities are used asunobserved locations which are predictedusing the Ordinary Kriging Method.
Locations Districts/Cities x (meter) y (meter)Positive
Covid-19
1 Bandung District 783878,91 9212195,99 5
2 Bandung Barat District 766336,78 9239951,83 3
3 Bekasi District 737892,54 9310886,09 18
4 Bogor District 707864,62 9272289,39 7
5 Ciamis District 211762,74 9201105,27 0
6 Cianjur District 735407,62 9246735,86 0
7 Cirebon District 224759,67 9250971,35 2
8 Garut District 805859,2 9182651,56 0
9 Indramayu District 185429,78 9286580,32 0
10 Karawang District 766998,69 9304492,71 6
11 Kuningan District 223314,18 9228029,24 2
12 Majalengka District 193270,88 9241028,52 1
13 Pangandaran District 223954,16 9157488,85 0
14 Purwakarta District 773540,13 9270103,26 2
15 Subang District 799538,82 9274599,25 0
16 Sukabumi District 716263,7 9242194,1 1
17 Sumedang District 830676,64 9245605,74 1
18 Tasikmalaya District 184260,84 9165875,06 0
19 Bandung District 789529,34 9234296,86 18
20 Banjar City 227324,26 9184594,3 0
21 Bekasi City 717951,32 9306539,57 25
22 Bogor City 699012,41 9271215,98 16
23 Cimahi City 780706,59 9238770,98 7
24 Cirebon City 230267,73 9255425,15 0
25 Depok City 698704,07 9293084,28 29
26 Sukabumi City 712957,18 9233271,37 0
27 Tasikmalaya City 193660,93 9187100,08 1


Observed Data and Unobserved Data
Locations District/Cities x (meter) y (meter)Positive
Covid-19
1 Bandung District 783878,91 9212195,99 5
2 Bandung Barat District 766336,78 9239951,83 3
3 Bekasi District 737892,54 9310886,09 18
4 Bogor District 707864,62 9272289,39 7
5 Cirebon District 224759,67 9250971,35 2
6 Karawang District 766998,69 9304492,71 6
7 Kuningan District 223314,18 9228029,24 2
8 Majalengka District 193270,88 9241028,52 1
9 Purwakarta District 773540,13 9270103,26 2
10 Sukabumi District 716263,7 9242194,1 1
11 Sumedang District 830676,64 9245605,74 1
12 Bandung City 789529,34 9234296,86 18
13 Bekasi City 717951,32 9306539,57 25
14 Bogor City 699012,41 9271215,98 16
15 Cimahi City 780706,59 9238770,98 7
16 Depok City 698704,07 9293084,28 29
17 Tasikmalaya City 193660,93 9187100,08 1
Locations Districts/Cities x (meter) y (meter)1 Ciamis District 211762,74 9201105,27
2 Cianjur District 735407,62 9246735,86
3 Garut District 805859,2 9182651,56
4 Indramayu District 185429,78 9286580,32
5 Pangandaran District 223954,16 9157488,85
6 Subang District 799538,82 9274599,25
7 Tasikmalaya District 184260,84 9165875,06
8 Banjar City 227324,26 9184594,3
9 Cirebon City 230267,73 9255425,15
10 Sukabumi City 712957,18 9233271,37
By using the Ordinary Point Kriging Method, 17districts/cities infected with Covid-19 were used as sampledata and 10 districts/cities that were not/had not been infectedwith Covid-19 were used as predictive data or data inunselected locations.
Futhermore, at these 10 locations, predictions were made tofind out how many people were positively infected withCovid-19.

x (meter) y (meter)Positive
Covid-19
Min 193271 9187100 1.000
1st Qu 698704 9238771 2.000
Median 717951 9245606 5.000
Mean 623786 9255809 8.471
3rd Qu 773540 9272289 16.000
Max 830677 9310886 29.000
Descriptive Statistics
summary(dt)
hist(dt$Positif)
qqnorm(dt$Positif)
qqline(dt$Positif)
Histogram of dt$Positif
dt$Positif
Fre
qu
en
cy
0 5 10 15 20 25 30
02
46
8
-2 -1 0 1 2
05
10
15
20
25
30
Normal Q-Q Plot
Theoretical Quantiles
Sa
mp
le Q
ua
ntile
s

Experimental SemivariogramSE<-variogram(Positif~1,data=dt,cutoff=300000,width=5000)plot(SE,pl=F,main="Experimental Semivariogram",pch=16)
Based on the table, it is found that from 17districts/cities as observed locations there are 25criteria for the number of data pairs that are thesame distance. Furthermore, the plot is obtainedfrom the semivariogram value to the distance (h)where all the information is synthesized in onepoint per distance class, which then the plot isused to fit the best theoretical model.
NoThe number of data pairs that
are equally distanceDistance
Experimental
Semivariogram
1 2 9404.704 50.5
2 1 14418.25 8
3 7 22594.07 79.42857
4 2 28281.86 37
5 7 32391.38 20.92857
6 3 36641.61 99.33333
7 3 41931.92 81.83333
8 2 48995.91 120.5
9 6 52171.9 90.08333
10 3 57289.7 4.833333
11 6 63985.75 52.25
12 6 67117.92 91.75
13 7 73315.16 78.85714
14 3 76801.07 175.6667
15 4 81676.34 78.75
16 3 86880.35 130.3333
17 4 92157.51 55.75
18 3 97671.21 82
19 2 102534.6 42.5
20 2 108534.4 72.5
21 2 113955.8 72.25
22 2 116279.9 244
23 2 126908.8 153
24 1 134131.9 112.5
25 1 140253.2 392

Fitting the best theoretical modelsGaussian<-vgm(83.38971,"Gau",25000)
plot(SE, pl=F, model=Gaussian,pch=16,main="Gaussian Model",col=2)
attr(Fit.Gaussian,"SSErr")
SSE Model Teoretis
Gaussian Spherical Exponential
6.343123e-05 6.216507e-05 6.023146e-05
Based on the Figure it can be seen in plain view that of the three theoretical
model approaches that are following the experimental semivariogram plot is
the Exponential Model, for more accurate results the SSE (Sum Square
Error) is calculated and can be seen in the Table, it is obtained that the
Exponential Model has a minimum SSE of 6.023146e-05, so the Exponential
Model is used as input in the calculation process of the Ordinary Kriging
Method.

Prediction of Ordinary Point Kriging Method for Positive Covid-19
The process of calculating the prediction ofthe positive distribution of Covid-19 usingthe functions in the R Program for theOrdinary Kriging Method produces the besttheoretical model, the Exponential Model asinput in prediction calculations in unsampledlocations. Based on the results of predictioncalculations in 10 districts/cities, the averagepositive spread of Covid-19 is 6 people.
Locations Districts/Cities x (meter) y (meter)Prediction of
Positive Covid-19
1 Ciamis District 211762.7 9201105 6.389463
2 Cianjur District 735407.6 9246736 6.296900
3 Garut District 805859.2 9182652 7.620536
4 Indramayu District 185429.8 9286580 7.554535
5 Pangandaran District 223954.2 9157489 7.543700
6 Subang District 799538.8 9274599 7.158450
7 Tasikmalaya District 184260.8 9165875 6.884230
8 Banjar City 227324.3 9184594 7.273130
9 Cirebon City 230267.7 9255425 4.645638
10 Sukabumi City 712957.2 9233271 4.901836
k.o<-krige(Positif~1, locations=dt, newdata=dt1, model=Fit.Exponential)


EXAMPLE OF SPATIO TEMPORAL MODEL ON COVID-
19 IN BANDUNG RAYA

PSBB BANDUNG RAYA
• The West Java Governor Regulation Number 30 of 2020 also regulates the modes of transportation that may or may not operate as long as the PSBB is in effect.
• For private cars, half the passenger capacity. Then bikers are prohibited from riding a ride. All car or motorcycle drivers are required to wear a mask.
• The Governor of West Java, Ridwan Kamil, on April 29, 2020, stated that his party had agreed to submit the provincial-level large-scale social restrictions (PSBB) to reduce the spread of the corona virus to the Ministry of Health (Kemenkes). This cannot be separated from there are still 17 regions in West Java that have not implemented the PSBB

Research purpose
• Predicting positive data for Covid-19 in Bandung Raya in the future with the STARI model approach
• Predicting positive data of Covid-19 in Bandung Raya to warning to the public and government to always carry out physical distancing, always wear masks, avoid touching faces, and wash hands frequently.

or it can be written
STARI MODEL (1,1,1)

• Positive daily data for Covid-19
• Data from March 6, 2020, to May 6, 2020.
• Data obtained from https://pikobar.jabarprov.go.id/.
• : positive data for covid-19 in Bandung City
• : positive data for covid-19 in Cimahi City
• : positive data for covid-19 in Bandung
Regency
• : positive data for covid-19 in West Bandung
Regency
)(1 tZ
)(2 tZ
)(3 tZ
)(4 tZ


STARI (1,1,1) MODEL ERROR HISTOGRAM ERROR

WHITE NOISE TEST

MSE STARI (1,1,1) MODEL ACTUAL DATA AND FORECAST DATA

ACTUAL DATA PLOT AND FORECAST DATA PLOT

The STARI model (1,1,1) is a phenomenon of present timeobservation that can be seen by one time before and is in a group oflocations with non-stationary data. The STARI estimation modelusing the OLS method produces 𝜙10 and 𝜙11. The application of theSTARI model can be implemented in forecasting cases of positiveCovid-19 sufferers in Bandung Raya. Therefore, this model canremind the government or the public to always carry out physicaldistancing, always wear masks, avoid facial monitoring, andfrequently wash their hands to break the Covid-19 chain in BandungRaya.
CONCLUSION