Embed Size (px)
Citation preview
Spatio-temporal plasma heatingmechanisms in a radio frequencyelectrothermal microthruster
Scott J Doyle1 , Andrew R Gibson1 , Jason Flatt1, Teck Seng Ho2 ,Rod W Boswell2, Christine Charles2, Peng Tian3, Mark J Kushner3 andJames Dedrick1
1York Plasma Institute, Department of Physics, University of York, Heslington, York YO10 5DD, UnitedKingdom2 Space Plasma, Power and Propulsion Laboratory, Research School of Physics and Engineering, TheAustralian National University, ACT 0200, Australia3University of Michigan, Dept. of Electrical and Computer Engineering, 1301 Beal Ave., Ann Arbor, MI48109-2122, United States of America
E-mail: [email protected]
Received 23 April 2018, revised 23 July 2018Accepted for publication 2 August 2018Published 30 August 2018
AbstractLow-power micro-propulsion sources are currently being developed for a variety of spacemissions. Electrothermal plasma thrusters are of specific interest since they enable spatial controlof the power deposition to the propellant gas. Understanding the mechanisms whereby electricalpower is coupled to the propellant will allow for optimization of the heating and fuel efficienciesof electrothermal sources. Previous studies of radio frequency (RF) plasmas have shown adependence of the gas and electron heating mechanisms on the local collisionality. This is ofparticular importance to thrusters due to the large pressure gradients that exist between the inletand outlet when expanding into vacuum. In this work, phase-resolved optical emissionspectroscopy and numerical simulations were employed to study plasma heating in anasymmetric RF (13.56MHz) electrothermal microthruster operating in argon between186–226Pa (1.4–1.7 Torr) plenum pressure, and between 130–450V (0.2–5W). Three distinctpeaks in the phase-resolved Ar(2p1) electron impact excitation rate were observed, arising fromsheath collapse heating, sheath expansion heating, and heating via secondary electron collisions.These experimental findings were corroborated with the results of two-dimensional fluid/MonteCarlo simulations performed using the Hybrid Plasma Equipment Model (HPEM). The influenceof each mechanism with respect to the position within the plasma source during an α-γ modetransition, where plasma heating is driven via bulk and sheath heating, respectively, wasinvestigated. Sheath dynamics were found to dictate the electron heating at the inlet and outlet,this is distinct from the center of the thruster where interactions of secondary electrons werefound to be the dominant electron heating mechanism. Optimization of the heating mechanismsthat contribute to the effective exhaust temperature will directly benefit electrothermal thrustersused on miniaturized satellite platforms.
Keywords: electric propulsion, electron heating, gas heating, hollow cathode, PROES, dc bias
1. Introduction
Recently there has been a significant interest in the develop-ment of compact satellite platforms with onboard propulsion[1–4]. Prospective applications of micro-, nano-, and pico-sized
platforms (0.1–100 kg), such as satellite constellations [5],would benefit from robust, neutralizer-free electric propulsion(EP) sources [6, 7]. As such, an increasing percentage ofsatellites are being equipped with electronically driven pro-pulsion, necessitating the development of compact, low-power,
Plasma Sources Science and Technology
Plasma Sources Sci. Technol. 27 (2018) 085011 (17pp) https://doi.org/10.1088/1361-6595/aad79a
0963-0252/18/085011+17$33.00 © 2018 IOP Publishing Ltd1

and charge-neutral EP sources for this new generation ofsatellites [8–11].
Electrothermal plasma microthrusters differ from moretraditional resistojets and cold gas thrusters since theyenhance the spatial control of the power deposition to thepropellant [10, 12]. One such source is the Pocket Rocket[13–17], a low-power (up to 50W) asymmetric radio fre-quency (RF) capacitively coupled electrothermal micro-thruster. The thruster is typically powered by a 13.56MHzRF voltage resulting in a weakly ionized plasma, facilitatingthe coupling of electrical energy into the propellant [9].Thrust is produced by the expulsion of hot (1000 K) neutrals,themselves heated via ion–neutral charge exchange collisions,producing a neutral exhaust plume [18]. The thruster andpower supply have recently been demonstrated to fit within astandard 1U CubeSat frame; see [1] for a schematic of thethruster in situ, and [19] for a schematic of the miniaturizedversion.
Ions are accelerated radially within the thruster by meansof a dc self-bias voltage that forms as a negative surfacecharge on an insulating alumina dielectric layer, which islocated between the plasma and the powered electrode. Time-averaged dc self-biases can arise in capacitively coupledplasmas operating at RF voltages through, for example, adifference in the powered and grounded electrode-collectingareas. The dc self-bias voltage forms to balance the time-averaged current reaching each electrode [20]. A negative dcself-bias increases the time-averaged voltage drop at the di-electric surface, resulting in greater ion acceleration, and, viaion–neutral charge exchange [21], more energetic neutralsexiting the source.
Ions impacting the radial wall can release secondaryelectrons through the Auger process [22]. These electrons arethen accelerated away from the wall back into the plasmathrough the sheath potential and can reach high energies(≈50 eV) [21, 23] relative to the ionization potential of thepropellant ( 14 eV» for argon (Ar)) [15]. Few ions leave thethruster since they are radially accelerated into the radial wallby the dc self-bias voltage, and ambipolar forces constrain theelectrons. The outlet plume is therefore effectively charge-neutral and no external neutralizer is required [13, 18]. Withno need for an external neutralizer, the size, complexity andpower requirements of the Pocket Rocket are reduced relativeto other, non-charge-neutral, EP sources [8].
The Pocket Rocket is typically operated at relatively highpressures, above 133Pa (1.0 Torr), since this represents thePaschen (pressure×distance) minimum for ignition for therelatively small dimensions required by applications in smallsatellites [24]. The study of high-pressure (�1Torr) RFplasma jets has shown that pressure gradients can greatlyaffect the plasma heating mechanisms within the source [25].Electrothermal sources for space propulsion naturally posses aneutral pressure gradient between the gas inlet and thevacuum expansion region; thus, the neutral gas and electronheating mechanisms can vary across this region. This effect iscompounded as the neutral gas temperature and local ioniz-ation fraction are coupled to the local collisionality, leading to
a non-linear relationship between axial neutral transport andthe effectiveness of plasma heating mechanisms [26–29].
Capacitively coupled RF plasma sources exhibit differentelectron heating mechanisms depending on the pressure,applied voltage, and geometry. For example, low-power dis-charges are sustained through ionizations during sheathexpansion and contraction, and hence show plasma heating atphases of peak temporal voltage modulation (dV/dt) [30].Sheath collapse heating, e.g. field reversal [31, 32], andsheath expansion heating, e.g. stochastic heating [33, 34],occur during phases of peak dV/dt, increasing and decreasingvoltage respectively; they are also indicative of α-modeoperation.
At higher applied voltages, positive ion bombardmentonto material surfaces becomes significant, leading to anincreased production of secondary electrons, which are sub-sequently accelerated through the sheath and back into theplasma, reaching maximum energies during full sheathextension [35, 36]. These electrons typically have a non-thermal energy distribution and deposit power into the plasmaprimarily through ionization collisions. Secondary electronheating can be enhanced through the hollow cathode effect,leading to higher specific power deposition [37, 38]. Thisγ-mode of operation of the Pocket Rocket is desired due toincreased neutral gas heating.
Power deposited from ion–neutral charge exchange col-lisions is highest in the plasma sheaths, where the electricfields couple electrical power into kinetic motion [17, 21].The phase-averaged sheath extent, and hence heated volumeof the propellant, are related to the local pressure, plasmadensity, and dc self-bias voltage [30]. Therefore, under-standing how the phase-resolved electron heating mechan-isms link to the phase-averaged sheath dynamics allows foroptimization of the neutral gas heating in electrothermalplasma thrusters.
In this work, results from two-dimensional fluid/MonteCarlo simulations of the Pocket Rocket thruster are comparedto experimentally obtained measurements of the phase-resolved Ar(2p1) excitation rate. The phase-averaged plasmadensity, neutral gas heating, and spatially resolved powerdeposition are investigated. Three temporal electron heatingmechanisms are identified, and the relative changes in exci-tation from these mechanisms during an α–γ mode transitionare presented. Finally, the dominant electron heating mech-anism at three axial locations within the thruster are identifiedand discussed.
The Pocket Rocket source, experimental setup, andoptical diagnostics are described in section 2. The simulationgeometry and computational methods employed are discussedin section 3. Simulated phase-resolved Ar(2p1) excitationrates are compared against experimentally measured excita-tion rates for an Ar discharge in α-mode (135 V) and γ-mode(445 V) in section 4. Phase-averaged simulated plasma den-sity, excitation rate, and neutral gas temperature are discussedwith relation to the dc self-bias voltage and axial powerdeposition in section 5.1. Three temporal electron heatingmechanisms are identified with respect to the phase-resolveddielectric surface voltage in section 5.2, and the relative
2
Plasma Sources Sci. Technol. 27 (2018) 085011 S J Doyle et al

changes in these heating mechanisms with applied voltage arediscussed in section 5.3. Finally, the spatial extent of eachelectron heating mechanism is discussed in section 5.4.
2. Experimental setup
2.1. Description of the source
The Pocket Rocket source, power coupling circuit, and opticalconfiguration are illustrated in figure 1. The thruster consistedof an 18mm long, 4.2mm inside diameter, 1.0mm thick,alumina tube through which propellant is passed. A 5mmlong copper electrode was positioned around the midpoint ofthis tube, supported in a ceramic macor housing, and twogrounded aluminum rings, of lengths 4mm and 2mm, werepositioned around the inlet and the outlet, respectively. Thegrounded electrodes were 3mm and 4mm from the poweredelectrode on the downstream and upstream sides, respec-tively. The source was mounted to, and electrically isolatedfrom, an expansion chamber by a 300mm long Pyrex glasstube. Gas was introduced through a plenum at the upstreamside of the source. The pressure was measured by a gaugefitted to the plenum, and a Pyrex glass window positioned atthe rear of the plenum enabled optical access along the axiallength of the source. The source was operated in Ar with aplenum pressure between 186–226Pa (1.4–1.7 Torr) and anexpansion chamber pressure of 113Pa (0.85 Torr).
The source was operated with a 13.56MHz drivingvoltage between 135–445V supplied via an external circuitcomprising of an arbitrary waveform generator (Keysight33621A, 120MHz), broadband amplifier (IFI SCCX100,0.01–220MHz), and matching network (Coaxial Power
Systems MMN150), connected as shown in figure 1. Voltage,current, and power were measured with a SOLAYL SASVigilant Power Monitor [39], and the power deposited intothe plasma was obtained via the subtractive method [40, 41].
A 1″ biconcave lens was positioned in front of the ple-num window, which produced an image of the plasmafocused at the midpoint of the alumina tube; this is shown infigure 1 as a dotted line. Images were recorded by an (ICCD)camera (Andor iStar DH344T-18U-73, 1024×1024 array,pixel size: 13×13 μm2), fitted with a 750.466nm bandpassfilter (LOT-QuantumDesign, 1 nm FWHM), which waspositioned at the focal point of the lens. Phase-resolvedimages were obtained by triggering the camera on the outputof an arbitrary waveform generator, and a digital delay gen-erator (Stanford Research Systems DG645) in series provideda variable delay in the triggering time.
Phase-resolved optical emission spectroscopy (PROES)[42, 43] images were taken with an optical gate width of1.7ns and a gate step of 2ns at a sampling frequency of500kHz for a total integrated exposure time of 100ms. Sincethe ICCD camera was aligned axially with the source, themeasured optical emission was integrated along the axial line-of-sight within the source. Furthermore, since the plasma wasoptically thin at the wavelengths of interest, emission from thefull length of the source region was able to reach the camera.Therefore, the experimental depth of field (DoF) was taken as24mm, which was equal to the axial length of the sourceregion. To a reasonable approximation, the contribution of theDoF can be considered flat with respect to axial depth [44].To replicate a 24mm DoF in the simulated PROES images,discussed in section 4, the simulated excitation was integratedalong the source Z-axis. Radial profiles were taken from theupstream plenum side of the source, the center of the poweredelectrode, and the expansion region downstream of thesource; these are shown in figure 2 as locations 1, 2, and 3,respectively.
2.2. Electron impact excitation rates
The optical emission from the thruster was measured withrespect to time within the RF voltage cycle by PROES. Thistechnique provides information on the dynamics of phase-dependent species in the discharge [43, 45]. The opticalemission from Ar(2p1–1s2) at 750.4nm was measured inphase with the driving voltage. This state was chosen becauseit is dominantly populated from the ground state by directelectron impact excitation [46, 47]. The phase-resolved opti-cal emission was post-processed to extract the electron impactexcitation rate of the Ar(2p1) state as summarized below.
The change in population of an excited state ni at anygiven time is described by a system of coupled differentialequations. These include the electron impact excitation ratefrom ground to leveli, the sum of the excitation rates frommetastables to leveli, the sum of the cascade contributionsdue to de-excitation from levels above i, and the decay rate
Figure 1. Schematic of the experimental setup (not to scale),showing the power coupling circuit and the orientation of the camerawith respect to the plasma source.
3
Plasma Sources Sci. Technol. 27 (2018) 085011 S J Doyle et al

from leveli, as described in equation (1):
n t
tn E t n E t A n t A n t
d
d.
1
ii i i i i0 ,0
mm m,
cc cå å= + + -
( ) ( ) ( ) ( ) ( )
( )
Here, n0, ni, nm, and nc are the ground state, ith state,metastable state, and cascade state populations, respectively.Ai is the Einstein coefficient for state i, Aic is the cascadeprobability out of state c into state i, while Em,i(t) and Ei,0(t)are the electron impact excitation functions for metastableexcitation and ground excitation, respectively. Note thatEm,i(t) and Ei,0(t) can be obtained from the product of theelectron density and the rate coefficient for the relevantprocess. By assuming that the Ar(2p1) excited state is notheavily populated through cascade processes or step-wise(metastable) excitation, the excitation function Ei,0(t) can beequated directly to the number of photons emitted nPh,i(t,r) via[43]
E tn A
n t r
tn t r
1 d ,
d
1, 2i
ik,0
0
Ph,i
effPh,i
t= +
⎛⎝⎜
⎞⎠⎟( ) ( ) ( ) ( )
where the photon flux nPh,i(t, r) is given as
n t r A n t r, , . 3ik iPh,i =( ) ( ) ( )
Here, ni(t, r) and Aik are the radial population density andtransition probability out of state i, respectively. The effectivelifetime of state i is denoted by τeff, taking into accountspontaneous emission and collisional quenching given by
A g k n1
4k
ik ikq
q qeff
å åt= + ( )
where gik=1 is the optical escape factor [48, 49], and kq andnq are the quenching coefficient and density of quenchingspecies q, respectively. In this work, quenching is assumed tobe performed only by neutral Ar where the quenching coef-ficient (kar=1.6×10⁻¹⁷ m3 s−1) is evaluated for a neutralgas temperature of 1000K [47, 50].
3. Description of the model
3.1. Mesh geometry and operating conditions
Two-dimensional, fluid-kinetic simulations were undertakenusing the Hybrid Plasma Equipment Model (HPEM) [51].The Pocket Rocket mesh geometry is illustrated in figure 2.An external circuit (not shown) comprising of an RF voltagesource and blocking capacitor was connected to the poweredelectrode. Although a blocking capacitor was included withinthe circuit, the alumina dielectric layer prevented a dc currentback to the power source and maintained the time-averageddc self-bias voltage as a negative surface charge.
The numerical mesh consisted of 64×152 (R×Z) cellsin a cylindrically symmetric geometry, corresponding to aradial resolution of 0.125mm per cell and an axial resolutionof 0.5mm per cell. A higher radial resolution was required toresolve the electric field gradient through the powered elec-trode sheaths. The powered electrode was driven by a13.56MHz voltage with an amplitude of 120–450V. Thesource was operated in Ar with an input flow rate of 100sccmat the gas inlet and a fixed pressure of 0.85Torr at the outlet,resulting in a plenum pressure of 226Pa (1.7 Torr) at 445V;this closely matched the experimental setup.
3.2. Simulation theory
To enable specifying an outlet pressure boundary condition,modifications to the model were required. The simulation is amultifluid model in which a momentum equation is solvedfor each neutral species. In the momentum equation, themomentum flux is solved at the half-points between the meshpoints for density and temperature. The procedure to imple-ment the pressure boundary condition is as follows. First, thenumerical mesh points corresponding to the face of the pumpin contact with the plasma are recorded. The pressure gradientappearing in the momentum equation for each species isbetween the pump node and the nearest neighbor plasmanodes. For each species, the densities at the nearest plasmanodes to the pump node are averaged and placed at the pump
Figure 2. Illustration of the simulation domain (not to scale). Thedomain is radially symmetric around R=0.0mm. Gas is introducedinto the plenum and extracted at the end of the expansion tube. An RFvoltage is applied to the electrodes, denoted in red, and couples to theplasma through an alumina tube, denoted in blue. The source region,highlighted by dotted lines, contains three subregions of interest:upstream (Z= 14.2 mm), the powered electrode (Z= 21 mm), anddownstream (Z= 31 mm), that is, regions 1, 2, and 3, respectively.
4
Plasma Sources Sci. Technol. 27 (2018) 085011 S J Doyle et al
face. These collected densities are then used to compute molefractions. The partial pressure of each species at the pumpface is then the mole fraction of that species multiplied by theoutlet pressure boundary condition. The inlet boundary con-dition is the flow rate, which determines the momentum ofeach species at the face of the inlet. With the inlet flow rateand pressure at the outlet port specified, the pressure gradientbetween the two naturally results from the calculation.
The charged particle species included in the simulationare Ar+, Ar2
+, and e−, with the trajectory of electrons releasedfrom material surfaces following ion bombardment (second-ary electrons) being kinetically tracked using a Monte Carlosimulation separately from electrons in the plasma bulk.Neutral species included are Ar, Ar(1s2), Ar(1s3), Ar(1s4),Ar(1s5), Ar(4p), Ar(4d), and Ar2
*. Excitation of the Ar(4p)lumped state is used as a proxy for the excitation of Ar(2p1),and the full reaction mechanism is as discussed in [52]. Anexplicit simulation of radiation transport is not included here.
The energy distribution functions of ions and neutrals areassumed to be Maxwellian with a superimposed advectivevelocity since the plasma is considered to be collisional at186–266Pa (1.4–1.7 Torr) plenum pressure. The energydistribution functions for electrons created in the bulk plasmaare obtained from the solution of the two-term approximationof the Boltzmann equation.
Secondary electron emission from the radial walls of thethruster is introduced using an energy-independent model,where the secondary electron flux is proportional to theincident ion fluxes and the secondary electron emissioncoefficient [53]. Secondary electron emission coefficients areset to γ=0.2 and γ=0.0 at the surface of the alumina walland outside the plasma source, respectively. Once created,secondary electron pseudoparticles are launched from thematerial surface with an initial energy of 3eV, and are furtheraccelerated through the local potential gradient where theirmotion and collisions are tracked using a Monte Carlo algo-rithm [54]. The kinetic treatment of the secondary electronsensures that, aside from the initial launch energy, there are nofurther assumptions made regarding the shape of the sec-ondary electron energy distribution.
The density of species Ni within any given cell isdetermined from the mass continuity between adjacent cells(equation (5)).
N
tS 5i
i ifdd
= - +· ( )
Here, f is the flux of particles between adjacent cells,and Si is the particle source function due to electron impactand heavy particle collisions. For electrons, f is accountedfor using the drift diffusion approximation implemented usingScharfetter–Gummel fluxes [55]. Reaction rates for the col-lisional processes are determined from the solution of thetwo-term Boltzmann equation. In the case of heavy particlereactions, rate coefficients are used in Arrhenius form [51].
For ions and neutrals, the species flux and temperaturesare obtained from more complete versions of the momentumand energy continuity equations (6) and (7). Neutral species
exclude the terms with electric fields, and the viscosity termsare not included for ions due to the low density of ionsrelative to neutral particles.
t mN k T N v
q
mN
vm
m mN N v v
E1
6
i
ii i i i
i
ii
ij
j
i ji j i j ij
B2
å
fdd
n
=- - +
- - -
( ) · ( )
· ( ) ( )
Here, Ti, mi, and vi are the mean temperature, mass, andvelocity of species i, respectively. vi is the viscosity tensor forspecies i, νij is the collision rate between species i and j, E isthe electric field strength, and kB is Boltzmann’s constant. Thesummation term is performed for each heavy particle species jfor which collision rates have been defined. Electron–neutraland electron–ion collisions solved for in the model includeelastic, excitation, and ionization reactions. As described in[52], cascade processes, multi-step ionization, and heavyparticle mixing between excited species are also included, theinteraction cross-sections and rate coefficients for which areobtained from [56–60].
The energy conservation equation (equation (7)) allowsthe computation of the temperature of each species by con-sidering its thermal conductivity κ and the inclusion of achange in the enthalpy term. The final term applies a temp-erature dependency to the collision rates, with rate coefficientkij, and accounts for ion–neutral charge exchange heating.The general form of the energy continuity equation for heavyparticles is written as follows:
N c T
tT P v N v
N q
m vm
m mN N k T T N N k H
N N k k T
E
3
7
i i ii i i i i i
i i
i i
j
j
i ji j ij j i
ji j H
ji j ij j
22
b
B
ij
å å
å
dd
k
n
= - - +
+ - D
D
· · · ( )
( )
( )
where ci is the specific heat capacity, Pi is the partial pressure,and òi is the specific energy of species i. The change inenthalpy for an exothermic or endothermic reaction is ΔH,and the rate coefficient for reactions with a change in enthalpyis given as kΔHij. Equation (7) can be extended into solids toprovide material temperatures. For material nodes, the onlyterms on the rhs that are retained are thermal conduction andsources of heat due to ion collisions and surface neutralizationof ions.
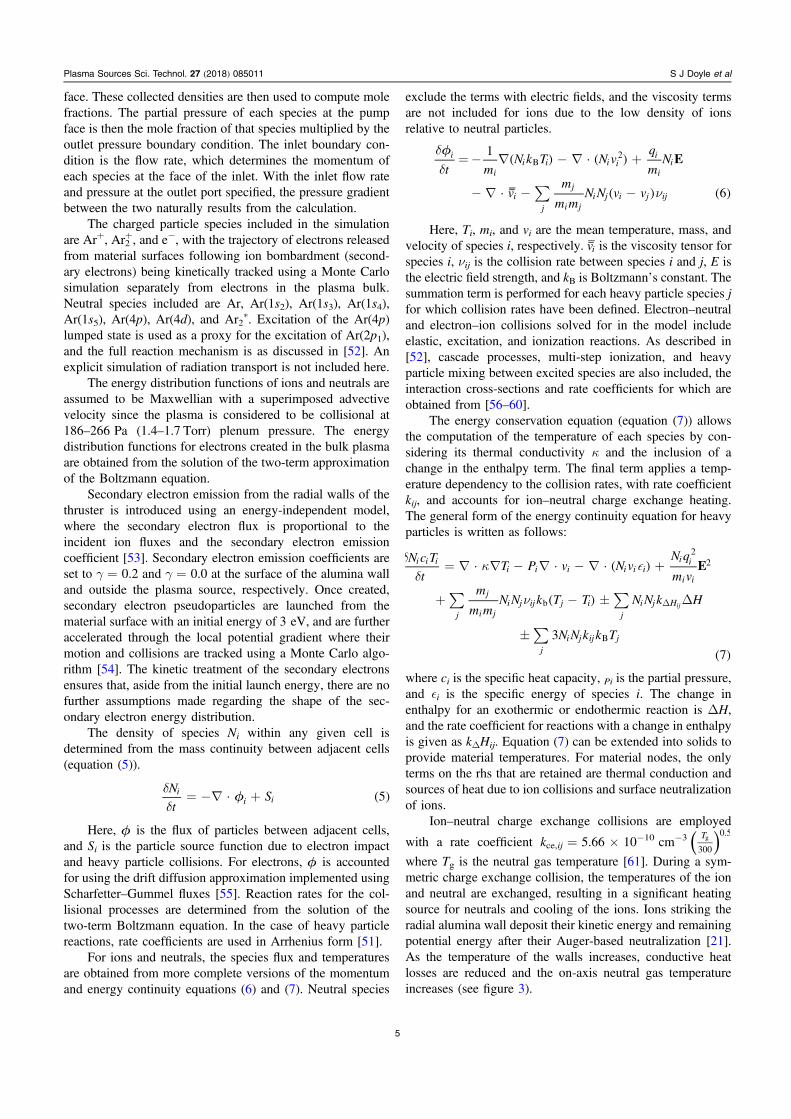
Ion–neutral charge exchange collisions are employed
with a rate coefficient kce,ij=5.66×10⁻¹⁰cm−3T
300
0.5g( )
where Tg is the neutral gas temperature [61]. During a sym-metric charge exchange collision, the temperatures of the ionand neutral are exchanged, resulting in a significant heatingsource for neutrals and cooling of the ions. Ions striking theradial alumina wall deposit their kinetic energy and remainingpotential energy after their Auger-based neutralization [21].As the temperature of the walls increases, conductive heatlosses are reduced and the on-axis neutral gas temperatureincreases (see figure 3).
5
Plasma Sources Sci. Technol. 27 (2018) 085011 S J Doyle et al

Thermal energy transport from the neutral gas toward theradial wall is accounted for using the approach described in[62], based on a temperature ‘jump’ across the computationalcell adjacent to the surface [63]. This temperature jump isdetermined largely by the thermal energy accommodationcoefficient αE, which is dependent on a variety of surfaceconditions, including the neutral gas temperature. In this worka value of αE=0.4 is applied, which is based on extra-polating the temperature dependence of the thermal energyaccommodation coefficient measured by Yamaguchi et al[64] for Ar atoms incident on platinum surfaces to a temp-erature of 1000K. In general, Ar thermal energy accom-modation coefficients have been found to be relativelyindependent of the surface material [65].
3.3. Determining wall temperatures
The ion flux incident on the radial wall results in a heating ofthe wall material. Previous work has shown that wall heatingin the Pocket Rocket occurs over relatively long time scales(≈100 s) [21]. This cannot be easily accounted for on typicalsimulation time scales (100 μs–10 ms) [51]. To approximatethis effect, two sets of simulations were performed: one with afixed initial wall temperature of 325K, and a second with aninitial wall temperature derived from a two-step proceduredescribed below. The maximum on-axis neutral gas tem-peratures with respect to applied voltage for both sets ofsimulations are shown in figure 3.
The two-step method was performed as follows. In thefirst step, the maximum on-axis neutral gas temperature wascomputed using a ‘cold’ wall at 325 K. In the second step, thesimulations were re-run with the wall temperature initializedas the maximum value of neutral gas temperature determinedin the first step. As shown in figure 3 the two-step methodresulted in higher on-axis neutral gas temperatures, with thedifference increasing with applied voltage. The cold wallneutral gas temperatures in figure 3 closely matched those
previously simulated using the computational fluid dynamicscode CFD-ACE+ [17, 21].
3.4. Determining collisionality
The neutral gas is primarily heated through ion–neutralcharge exchange [21], and hence accurate modeling of theneutral density, and hence collisionality, is important. Thecollisional regime is described by the Knudsen number [66],Kn, the ratio between the atomic mean free path λ and acharacteristic dimension of the system L:
KnL N R
k T
PV R
1
2
1
28
Ar Ar
B g
Ar
ls s
= = = ( )
Here, NAr is the Ar ground state density, which is relatedto the pressure P, neutral gas temperature Tg, and dischargevolume V by the ideal gas law; σAr is the collisional cross-section for collisions between two Ar atoms; and R is theradius of the discharge region (2.1 mm, figure 3.1). Since thePocket Rocket operates in the slip–flow transition boundaryregime ( K0.01 0.35n ) [67], a slip condition [68] wasapplied to plasma material boundaries to maintain nonzerofluid velocities at material surfaces [69].
The simulated phase-averaged on-axis Knudsen numberfor three voltages, 150V, 300V, and 450V, is shown infigure 4, where an axial location of zero is at the top of theplenum.
The neutral gas temperature increases with appliedvoltage and power deposition, resulting in a reduction inneutral density within the source region (12�Z�38mm),reducing the collisionality and increasing the Knudsen num-ber. Since neutral gas heating is primarily a collisional pro-cess, this feedback between heating and collisionality sets alimit on the achievable heating efficiency. The on-axisKnudsen number profile for 150V shows close agreementwith previous work performed for cold gas operation usingCFD-ACE+ [16, 17].
Figure 3. Phase-averaged on-axis (R= 0 mm) neutral gas tempera-tures with respect to applied voltage with 325K walls (black circles)and with the wall temperature determined by the two-step method(red triangles). The plenum pressure is 186–226Pa (1.4–1.7 Torr) inAr for a 13.56MHz driving voltage with amplitudes between120V–450V.
Figure 4. Phase-averaged on-axis profiles the Knudsen numbershowing a reduced collisionality in the heated region of the source.The plenum pressure is 226Pa (1.7 Torr), driven at 13.56MHz,with 150V, 300V, and 450V amplitudes, and with 349K, 687K,and 967K alumina wall temperatures, respectively. An axiallocation of zero is at the top of the plenum.
6
Plasma Sources Sci. Technol. 27 (2018) 085011 S J Doyle et al

3.5. Determining thrust
The simulated thrust FT was obtained by integrating the ionand neutral mass flux through an axial plane, one cell thick(0.5 mm), at the exit aperture of the thruster (Z= 37 mm). Themethod employed was adapted from [70]:
F A v m A v m R
A P R
d
d . 9
R
k
n
kn knk
n
ki ki
R
T 0 c0
c0
0 c
å åò
ò
= +
+ D
= =
⎛⎝⎜
⎞⎠⎟
⎛⎝⎜
⎞⎠⎟˙ ˙
( )
When considering only neutral Ar and Ar+, this simplifies to
F A v m A v m R A P Rd d
10
R R
T0
c Ar Ar c Ar Ar0
cò ò= + + D+ +( ˙ ) ( ˙ )
( )
where R is the radius of the source (2.1 mm), Ac is the cross-sectional area of a simulation cell (in cylindrical coordinates),and vAr and vAr+ are the neutral Ar and Ar+ ion velocities,respectively. The mass flux rates through the plane of inte-gration are denoted by mAr˙ and mAr+˙ for Ar and Ar+,respectively. Here, the neutral mass flux rate is defined asm mAr Ar Ar= G˙ with the Ar atom mass mAr and Ar flux ΓAr.The Ar ion mass flux rate is defined in the same way for theAr+ flux. The differential pressure across the plane of inte-gration is accounted for as ΔP, which is defined as
P P PZ 0D = - , where PZ is the pressure at the plane ofintegration, and P0 is the output pressure of 113Pa(0.85 Torr). In reality, when operating in vacuum, a portion ofthis pressure thrust will be converted into the momentum ofthe neutrals; this is not accounted for in this treatment.
Using equation (3.5), the thrust produced by a 100sccm,450V, and 13.56MHz discharge with a 967K initial temper-ature wall is 1.13mN for a total deposited RF power of 3.3W,giving a gross thrust-to-power ratio of 0.34mNW−1. This valuecompares well to the Hall effect (0.05–0.08mN W−1) [71, 72]and gridded ion (0.01–0.02mN W−1) [72] thrusters. Further-more, the ability to operate the thruster with very low (�5W)absolute powers provides an advantage over techniques thatrequire a high minimum power to operate, e.g. Arcjets [4, 72].These properties make the Pocket Rocket desirable option fornano-sized platforms with little onboard power.
Note that these values represent lab operating conditionswhere the outlet pressure is set to 113Pa (0.85 Torr), asmeasured in the expansion chamber, and the deposited poweris taken from the simulation data (figure 7). If employed in avacuum, the output pressure P0 will approach zero, resultingin the formation of a sharp pressure drop through the throat ofthe nozzle [16, 73]. Although this boundary will alter theperformance of the thruster, it will also maintain the pressuregradient through the source, and therefore the heatingmechanisms within the source are not expected to changesignificantly in vacuum.
4. Phase-resolved electron impact excitation rate:experiments and simulations
Measured and simulated phase-resolved Ar(2p1) excitationrates are shown in figures 5(a) and (b), respectively, for an α-mode, 186Pa (1.4 Torr) plenum pressure (13.56MHz, 135Vdischarge). The simulated powered electrode potential anddielectric surface potential (Z= 21 mm, R= 2.1 mm) phasealigned with the simulated excitation are shown in figure 5(c).The experimental data has been shifted in phase such that theexcitation structures align with those produced in thesimulation.
There is close agreement between the experimentalmeasurements and the simulations. Two excitation structuresoccur per phase cycle in both simulated and measured Ar(2p1)excitation rates at 135V; these are labeled A and B infigure 5. Peak A is temporally wider than peak B, and occursas the voltage at the powered electrode and adjacent dielectricare increasing, thereby accelerating electrons toward the di-electric; this is the phase of sheath collapse. Peak B occurs fordecreasing voltage at the powered electrode and dielectric,accelerating electrons away from the dielectric; this is thephase of sheath expansion.
A similar comparison for a 240Pa (1.8 Torr) plenumpressure (13.56MHz, 445V discharge) is shown in figure 6,where the plasma is operating in a ‘bright’ mode [74]. Thisbright mode is hereafter referred to as the γ-mode, and isdefined as the point where the integrated excitation from peakC becomes larger than A and B. The discharge transitions into
Figure 5. Phase-resolved (a) measured and (b) simulated Ar(2p1)excitation rates, and (c) simulated electrode voltage waveform anddielectric surface potential at the powered electrode (Z= 21 mm,R= 2.1 mm) with respect to the RF phase. The plenum pressure is200Pa (1.5 Torr) in the experiment, 186Pa (1.4 Torr) in thesimulation, with a 135V applied voltage at 13.56MHz; thesimulation wall temperature is 332K.
7
Plasma Sources Sci. Technol. 27 (2018) 085011 S J Doyle et al

γ-mode for voltages higher than 325V in the experiment andat voltages higher than 270V in the simulation.
The measured and simulated excitation rates show closeagreement with two excitation structures per RF cycle. Whencompared to figure 5, the excitation during sheath collapse atthe powered electrode, peak A, is still visible; however, thisstructure occurs over a shorter time interval. The excitationduring sheath expansion at the powered electrode, peak B, isno longer visible, and a new excitation structure, peak C,appears just after maximum sheath extension at 0.75t
2»w
p.
Peak C represents excitation from secondary electronsreleased from the alumina surface via ion bombardment andsubsequently accelerated through the sheath potential. Notealso that the background excitation rate is higher in γ-modethan in α-mode, suggesting the existence of a time-indepen-dent excitation mechanism.
The time-averaged dielectric surface potentials, denotedby the red dotted lines in figures 5 and 6(c), are both negative.Since the bias on the blocking capacitor is small, the averageapplied voltage to the electrodes is essentially zero. Thecharging of the alumina dielectric surface therefore functionsas a dc self-bias voltage, which is mostly negative for the445V case: it is negative for 74% of the RF cycle as com-pared to 66% of the cycle at 135V. In traditional RF dis-charges, where bare metal electrodes are used and a blockingcapacitor is installed in the circuit, the dc self-bias voltageforms to balance the collected currents on the grounded andpowered electrodes [30]. In this geometry, the electrodes arenot in direct contact with the plasma, and therefore currents to
those electrodes are displacement currents. Assuming thecurrent density is constant, the dc self-bias voltage is deter-mined by the ratio of the collecting areas of the grounded andpowered electrodes. For such conditions, the dc self-biasvoltage scales linearly with the applied voltage amplitude, andis negative if the powered electrode has a smaller surface area,as in this geometry.
The computed increase in the magnitude of the dc self-bias voltage with increasing applied voltage is a result ofseveral factors. First, an increase in the driving voltagenaturally produces an increase in the dc self-bias voltage,when all other conditions remaining constant. Second, withincreasing applied voltage and power deposition, the plasmadensity increases, which reduces the sheath width near thepowered electrode relative to that adjacent to the groundedelectrodes. This leads to an increase in capacitance, whichenables more current to be collected by the powered elec-trode, thereby making the negative dc self-bias voltage alarger fraction of the applied voltage [30, 75]. Third, anincrease in the ion flux due to the increased density releasesmore secondary electrons at the radial alumina wall adjacentto the powered electrode. These secondary electrons areaccelerated to higher energies through the sheath potentialbecause the dielectric surface potential is more negative. Asthe dc self-bias voltage varies along the axial length of thethruster, so too does the flux and energy of ion-inducedsecondary electrons, which could potentially lead to anadditional secondary electron-induced asymmetry [76].
4.1. Power dissipated in the plasma
The measured and simulated plasma power deposited withrespect to applied voltage is shown in figure 7.
Figure 6. Phase-resolved (a) measured and (b) simulated Ar(2p1)excitation rates, and (c) simulated electrode voltage waveform anddielectric surface potential at the powered electrode (Z= 21 mm,R= 2.1 mm) with respect to the RF phase. The plenum pressure is1.8Torr in the experiment, 1.7Torr in the simulation, with a 445Vapplied voltage at 13.56MHz; the simulation wall temperatureis 963K.
Figure 7. Measured and simulated plasma power with respect toapplied voltage amplitude. The voltage interval within which the α–γ transition occurs is shown by shaded regions. The plenum pressureis 200–240Pa (1.5–1.8 Torr) in the experiment, 186–226Pa(1.4–1.7 Torr) in the simulation, for a 13.56MHz driving voltage;the simulation wall temperature is 332–963K.
8
Plasma Sources Sci. Technol. 27 (2018) 085011 S J Doyle et al

The measured plasma power agrees with the simulatedpower for voltages up to approximately 250V, beyond whichthe measured plasma power increases more rapidly withvoltage. An α–γ mode transition occurs for applied voltagesbetween 325V and 355V in the experiment and between270V and 300V in the simulation. This difference in theα–γ mode transition voltage could be due to ion energy-dependent secondary electron emission coefficients that arenot captured in the model. These differences could also bedue to power deposition in non-plasma components withinthe circuit, which are not accounted for in the model.
The more gradual increase in power deposition withvoltages above 250V in simulation is attributed to the fol-lowing. (1) The secondary electron emission and thermalaccommodation coefficients will affect the power depositionto the plasma. These values are not precisely known in theexperiment, and can change depending on material temper-ature and surface cleanliness [77, 78]. (2) By increasing theinitial wall temperature with the applied voltage using thetwo-step method, the conductive losses from the neutral gasto the walls are reduced for a fixed thermal accommodationcoefficient. Less power is required to attain higher neutral gastemperatures as the power required to maintain the high walltemperature is effectively removed from the simulation. Thisresults in a lower simulated plasma power deposition for thegiven applied voltage.
5. Spatio-temporal heating mechanisms in thePocket Rocket
5.1. Phase-averaged plasma parameters
The Ar+ density, electron temperature, axial pressure profile,and axial neutral velocity profile are shown in figures 8(a),(b), and (c), respectively, for a 450V, 1.7Torr plenumpressure γ-mode discharge.
The Ar+ density (figure 8(a)) reaches a maximum on-axisat the center of the powered electrode (region 2). The decreasein density from upstream to downstream (regions 1 to 3) isprimarily a result of the decreasing pressure. The inhomo-geneous axial plasma density results in an axial variation insheath thickness and capacitance, leading to larger variationsin current collected at the powered and grounded electrodes.
There is an asymmetry in electron temperature about thepowered electrode in figure 8(b), with a region of hotterelectrons reaching closer to the axis further downstream(region 3). The phase-averaged sheath extension can beinferred from the region of hot electrons, since cold electronswill not have enough energy to enter this region. This sug-gests a larger sheath extension downstream (region 3) of thepowered electrode relative to upstream (region 1). This is inagreement with the asymmetric distribution of plasma densityobserved in figure 8(a). The electron temperatures upstreamand downstream of the source (regions 1 and 3, respectively)are significantly lower than at the powered electrode(region 2).
The on-axis neutral gas pressure (Pg) and axial neutralgas velocity (Vg) are shown in figure 8(c). The pressuredecreases linearly with respect to distance until it reaches≈0.85Torr, which is equal to the output pressure in theexpansion region. The neutral gas velocity increases as itenters the thruster (region 1), reaching a maximum at thepowered electrode (region 2) where power is primarilydeposited into the plasma. The gas velocity drops sharply as itexpands and cools upon exiting the thruster at Z=37mm(region 3), where V Tg gµ as expected.
The total simulated phase-averaged Ar(2p1) excitationrate due to collisions with fluid electrons, created in the gas-phase, and secondary Monte Carlo electrons is shown infigure 9(a). The on-axis contributions from each class ofelectrons to the total excitation rate are shown in figure 9(b),and the on-axis plasma potential and dielectric surfacepotential (R= 2.1 mm, Z = 21 mm) are shown in 9(c).
There is a peak in Ar(2p1) excitation rate at the poweredelectrode (region 2), and it is aligned with the region ofnegative dc self-bias voltage on the alumina surface, as shownin figure 9(c). The excitation rate upstream and downstream(regions 2 and 3, respectively) is significantly lower than atthe powered electrode, as is consistent with a γ-modedischarge.
The on-axis Ar(2p1) excitation rate resulting from colli-sions with either fluid or secondary electrons is shown infigure 9(b). Although upstream (region 1) has a higher peakexcitation than downstream (region 3), their axially integrated
Figure 8. Phase-averaged (a) Ar+ density, (b) electron temperature,and (c) on-axis gas pressure and axial neutral gas velocity. Regions1, 2, and 3 are defined as upstream, the powered electrode, anddownstream, respectively. The plenum pressure is 226Pa (1.7 Torr)in Ar, with a 450V applied voltage at 13.56MHz; the walltemperature is 967K. An axial location of zero is at the top of theplenum.
9
Plasma Sources Sci. Technol. 27 (2018) 085011 S J Doyle et al

contributions are approximately the same, noting that thevolume of excitation upstream is larger than downstream. Theexcitation is primarily driven by lower energy fluid electronsin all three regions, since the more energetic secondaryelectrons preferentially cause ionization. The secondaryelectron ionization rate (not shown) is a factor of five largerthan the excitation rate, and is approximately equal to theionization rate of the fluid electrons in γ-mode.
The excitation peaks upstream and downstream (regions1 and 3) have almost no contribution from secondary elec-trons. Excitation in these regions arises primarily from sheathheating mechanisms, where time-varying electric fields ensurecurrent continuity between the central powered electrode andthe grounded electrodes at the inlet and outlet. The physicalmechanisms responsible for the excitation at each location arediscussed in sections 5.2 and 5.4.
The contribution to the total excitation rate by secondaryelectrons is greatest at the powered electrode (region 2). Thisis to be expected because the dc self-bias voltage at the sur-face of the dielectric wall, shown in figure 9(c), is mostnegative at the powered electrode between 17�Z�27mm.The magnitude of the dc self-bias voltage in region 2 andcorresponding axial positive ion flux at regions 1, 2, and 3with respect to applied voltage are shown in figures 10(a) and(b), respectively. The small statistical scatter is due to theinherent noise in the Monte Carlo simulation used to tracksecondary electrons.
Normalizing the dc self-bias voltage to the applied volt-age more clearly shows the increasing ratio with increasing
applied voltage. The dc self-bias voltage approaches a limit of65%–70% of the applied voltage amplitude. This correspondsto a dc self-bias voltage of −304V for 450V applied at thepowered electrode. Due to the large physical asymmetrybetween the powered and grounded electrode areas, the dcself-bias voltage is a large fraction (�40%) of the appliedvoltage amplitude even when the discharge is operating inα-mode.
Increasing the applied voltage results in an increasedphase-averaged ion flux at all axial locations, as shown infigure 10(b). The increase is greatest in magnitude at thepowered electrode (region 2), correlating with the increaseddc self-bias voltage and production of more secondary elec-trons. The secondary electrons produced at the poweredelectrode (region 2) are also accelerated to higher energiesthan those produced at the grounded electrodes. The increasedionization due to ion-induced secondary electron emissionresults in an increase in the plasma density at the poweredelectrode (region 2), as shown in figure 11.
In α-mode, with 150V discharge, the plasma densityreaches a maximum of 1.1×10¹⁷m−3 near the center of thepowered electrode (region 2). A secondary peak in plasmadensity occurs upstream (region 1). The plasma density dropsoff sharply at Z�37mm as the plasma expands at the exit ofthe thruster. As the voltage is increased to 300V, the plasmaenters γ-mode and the maximum on-axis plasma densityincreases to 6×10¹⁷m−3 at the upstream side of the pow-ered electrode (Z= 17 mm, between regions 1 and 2). Thisvalue closely agrees with the value of 5.4×10¹⁷m−3
Figure 9. Phase-averaged (a) Ar(2p1) total excitation rate, (b) on-axiscontribution to the excitation rate from fluid electrons and secondaryelectrons, and (c) on-axis plasma potential and dielectric surfacepotential at the powered electrode (region 2). The plenum pressure is226Pa (1.7 Torr), with a 450V applied voltage at 13.56MHz; thewall temperature is 967K. An axial location of zero is at the top ofthe plenum.
Figure 10. Phase-averaged (a) dc self-bias voltage and (b) Ar+ fluxat the alumina surface with respect to applied voltage amplitudeupstream (region 1), at the powered electrode (region 2), anddownstream (region 3). The plenum pressure is 186–226Pa(1.4–1.7 Torr) Ar, with a 13.56MHz applied voltage; the aluminawall temperature is 334–967K.
10
Plasma Sources Sci. Technol. 27 (2018) 085011 S J Doyle et al

previously obtained for similar operating conditions at300V [16].
At voltages above 300V the peak density shifts back tothe center of the powered electrode (region 2) at Z=21mm,reaching a maximum value of 1.2×10¹⁸m−3 at 450V. Theincrease in density at this location is attributed to the pro-duction of more energetic secondary electrons as the dc self-bias voltage magnitude and ion flux increase. The smallerpeak at approximately Z=17mm results from electronheating during sheath collapse upstream of the poweredelectrode (region 1). The spatial distribution of these heatingmechanisms is described in more detail in section 5.4.
The neutral gas temperature and RF power deposition fora simulated 1.7Torr Ar, with 450V (γ-mode) and13.56MHz discharge, are shown in figure 12.
The largest increase in neutral gas temperature is axiallylocalized near the powered electrode (region 2) (figure 12(a)).This correlates with the region of highest dc self-bias voltage(figure 9(c)), greatest radial Ar+ flux (figure 10(b)) andgreatest plasma density (figure 11). The ions first gain thermalenergy in the presheath and then radial advective velocity inthe sheath, both of which contribute to gas heating via chargeexchange collisions. This is in agreement with previousobservations, which have suggested that the primary neutralgas heating mechanism is through ion–neutral chargeexchange collisions [17, 21]. Localized heating close to thepowered electrode reduces the local gas density, resulting in areduction in collisionality, as shown previously in figure 4.
The RF power coupled to the plasma per unit volume isshown in figure 12(b). The total RF power coupled to theplasma is 3.27W; of this, 2.69W is coupled via ion accel-eration in the sheaths, and 0.58W is coupled via electronheating. Power deposition is highest adjacent to the poweredelectrode between 17�Z�27mm, aligning with the regionof highest dc self-bias voltage. Power is primarily depositedwithin the sheaths, and reduces with radial distance from theradial wall, dropping significantly for R�1.0mm. The netrate of charge exchange is largest in the center of the bulkplasma where the ion density is highest. However, the heatsource is largest off axis, in the sheaths, where the ions gainenergy. It follows that a larger sheath region will result in alarger number of ions being accelerated over a greater dis-tance, and will increase the volume of the plasma into whichpower is coupled. Furthermore, a larger maximum sheathextension necessitates an increase in the sheath velocity, for afixed driving frequency, increasing the power deposition.
Since the maximum sheath extension is proportional tothe radial wall surface potential, an increasingly negative dcself-bias voltage increases the sheath extension and con-sequentially the volume of plasma into which power isdeposited [30, 75]. The sheath extension is also inverselyproportional to the decreasing gas density, resulting in anincreased radial extent to which power is deposited withincreasing axial distance along the thruster. Combining thesetwo effects, the volume of the plasma into which power isdeposited could be optimized for a given radius by varyingthe dc self-bias voltage. This could be accomplished byvarying the size of the grounded electrode relative to thepowered electrode, a technique used in semiconductor pro-cessing [37, 79], or through an application of an electricalasymmetry [20, 80].
The high radial ion acceleration and ion flux close to thepowered electrode results in an undesired etching of the di-electric surface. Figures 13(a) and (b) show the angular dis-tribution in the ion energy distribution function (IEDF) andangle-integrated IEDF incident on the alumina wall adjacentto the powered electrode (R=2.1 mm, Z = 21 mm) for a450V γ-mode discharge.
Figure 13(a) shows the angular dispersion of the ionsimpacting the dielectric surface with respect to the ion energy,the color denoting the fraction of the IEDF at the givenenergy. Over 50% of ions impacting the radial wall hit within2° of normal, accelerated through the powered electrode
Figure 11. Phase-averaged on-axis plasma density with respect toaxial location for 150V, 300V, and 450V discharges. Thedischarge is in α-mode at 150V and γ-mode for 300V and 450V.The plenum pressures are 186Pa, 213Pa, and 226Pa (1.4 Torr,1.6 Torr, and 1.7 Torr) Ar, with a 13.56MHz applied voltage; thewall temperatures are 334K, 687K, and 963K, respectively. Anaxial location of zero is at the top of the plenum.
Figure 12. Phase-averaged (a) neutral gas temperature, and (b) RFpower deposition for a 450V, γ-mode discharge. The plenumpressure is 226Pa (1.7 Torr), with a 13.56MHz applied voltage; thewall temperature is 963K. An axial location of zero is at the top ofthe plenum.
11
Plasma Sources Sci. Technol. 27 (2018) 085011 S J Doyle et al

sheath. This indicates that the radial ion acceleration is sub-stantial enough such that the radial ion flux is not greatlyaffected by the perpendicular neutral flow.
The IEDF in figure 13(b) is Maxwellian in profile due tothe high gas pressure, and has a mode energy of 10eV. Thereexists a high-energy tail extending beyond 250eV due to therelatively large potential (−342 V) present across the poweredelectrode sheath. The high-energy tail contains the majority ofthe ion population, with 61% of the ions above 50eV,denoted by the dashed line. This indicates that sputteringof the alumina surface is likely to occur during γ-modeoperation.
Since sputtering rates scale linearly with the ion currentdensity incident on the surface to be sputtered [75], an esti-mate of the etching rate in the Pocket Rocket can be achievedby comparison to known devices. Alumina etching rates of10nm min−1 have been demonstrated using an industrial ionmilling technique employing a 500eV, 1mAcm−2 currentdensity Ar+ beam [81]. The Ar+ radial flux incident on thewall at 450V in the Pocket Rocket is 9.3×10²⁰ (m−2s−1)(figure 10(b)), which equals a current density of14.9mAcm−2. By comparison to [81] the etching rate in thePocket Rocket is therefore approximately 149nm min−1.This reduces to an effective etching rate of 90.9nm min−1,5.45μm h−1, assuming that only 61% of the ions are capableof sputtering. However, since this does not fully account forthe reduced mean ion energy or the increased surface rede-position due to the higher operating pressure in the PocketRocket, these values represent an upper limit for the etch-ing rate.
Etching rates decrease by approximately a factor of threeper order of magnitude in ion energy; this is due to thedependence of the sputtering yield on the ion velocity [82]. Ifthis is assumed, along with a conservative redeposition frac-tion of 0.5, then the final net etching rate in the Pocket Rocketbecomes 0.91μm h−1. At this rate the Pocket Rocket couldoperate for over 1000 h before the alumina wall was
significantly etched. The lifetime of the thruster is thereforeexpected to be constrained primarily by propellant availabilityand not through component etching.
5.2. Phase-resolved electron heating mechanisms
The predicted phase-resolved total Ar(2p1) excitation rate on-axis and alumina surface bias for three operating voltages(150 V, 300 V, and 450 V) are shown in figures 14(a) and (b),respectively. The excitation profiles are integrated through aDoF equal to the length of the source (DoF=24 mm),including excitation from each region of interest.
Peak A occurs for all three voltages in figure 14(a) andincreases in magnitude with applied voltage. The peakbecomes more temporally narrow and more closely alignedwith the maximum voltage at the powered electrode (region2) dielectric surface as the applied voltage is increased. Thischange is a result of the differing charge dynamics of the ionsand electrons within a phase cycle, leading to the build-up ofexcess charge within the plasma bulk. Increasing the appliedvoltage results in a larger dc self-bias voltage and a greaterphase-averaged radial ion flux, as shown previously infigure 10. To maintain quasi-neutrality within the bulk, thereis an equal phase-averaged electron flux to the walls tocompensate for the positive ion loss from the plasma [83].During sheath collapse, shown in figure 14(b) as the shadedregions, electrons are able to leave the bulk plasma to con-serve current continuity. However, as the dc self-bias voltage
Figure 13. Phase-averaged (a) angularly resolved and (b) angle-integrated Ar+ IEDF adjacent to the powered electrode dielectric atregion 2 (R=2.1 mm, Z = 21 mm) for a 450V γ-mode discharge.The plenum pressure is 226Pa (1.7 Torr) Ar, with 13.56MHz at450V; the wall temperature is 963K.
Figure 14. Simulated (a) on-axis phase-resolved Ar(2p1) excitation,and (b) dielectric surface potential at the powered electrode (region2) (R = 2.1 mm, Z = 21 mm) for applied voltages of 150V, 300V,and 450V. The shaded area represents the phase interval for whichthe sheath is collapsed for operation at 150V (black) and 450V(blue). The plenum pressures are 186Pa, 213Pa, and 226Pa(1.4 Torr, 1.6 Torr, and 1.7 Torr) Ar, with a 13.56MHz discharge;the wall temperatures are 334K, 687K, and 963K, respectively.
12
Plasma Sources Sci. Technol. 27 (2018) 085011 S J Doyle et al

increases, the phase-averaged positive Ar+ flux leaving theplasma increases, indicated in figure 10(b) as an increasedphase-averaged positive ion flux. The electron flux at thephase of sheath collapse must therefore increase withincreasing voltage. Furthermore, the proportion of the RFphase cycle for which the sheath is collapsed decreases withincreasing dc self-bias voltage, which is observed as areduction in the shaded area between 150V and 450Voperation in figure 14(b). Both of these mechanisms lead toincreased electron flux at sheath collapse, and therefore ahigher Ar(2p1) excitation rate.
Peak B occurs for voltages below 150V, and isapproximately the same magnitude as peak A. Peak B isproduced as the alumina surface potential decreases, repellingelectrons from the surface, and can therefore reasonably beattributed to sheath expansion heating. Due to the highpressures (�1Torr), the maximum sheath velocity is rela-tively low, and this results in a relatively small contribution tothe total excitation.
Peak C occurs just after the phase of most negativealumina surface potential ( 0.77t
2=w
p), indicating that it is not
a product of sheath movement. The excitation could be due tothe release of energetic secondary electrons from the aluminasurface, which are then accelerated through the fully extendedsheath. Electrons produced at material surfaces have a non-zero time-of-flight to reach the central axis of the PocketRocket, and hence there will be a delay between maximumion bombardment at the most negative voltage and when theon-axis excitation occurs due to secondary electrons. Notealso that the shape of the surface potential in figure 14 issinusoidal, indicating that the RF voltage waveform is notgreatly deformed as it is coupled between the copper elec-trode through the alumina radial wall. This is due, in part, tothe current to the electrodes through the alumina being purelydisplacement current, and the permittivity of the alumina inthe model being independent of temperature and electric fieldstrength.
5.3. Phase-resolved excitation across the α–γ mode transition
An α–γ mode transition is observed experimentally as anincrease in the optical emission intensity at voltages above325V and in the simulation as an increase in the Ar(2p1)excitation at voltages above 270V. The simulated on-axisAr(2p1) excitation rates for voltages between 120–450V, insteps of 30V, are shown with respect to phase in figure 15,where the contours are obtained by interpolating the excita-tion between each voltage.
Peaks A and C grow with increasing applied voltage, asshown previously in figure 14, while peak B either reduceswith increasing voltage or does not grow fast enough toovercome the increasing time-independent ‘background’excitation between peaks A and C. This background excita-tion is also observed experimentally, as shown in figure 6(a).The increase in the temporally constant background excitationis attributed to the secondary electron emission as aresult of increased temporally constant ion bombardment,which is shown in figure 10(b). This implies that there is
time-independent neutral gas heating since ion–neutral chargeexchange is the primary neutral energy deposition pathway[21]. Although the dc self-bias voltage ensures an approxi-mately time-independent secondary electron rate of produc-tion, the secondary electron energy has a time dependency.The most energetic secondary electrons are produced atmaximum sheath extension aligning with excitation peak C.Therefore, the background emission is an indication of thetemporally constant secondary electron production, whereaspeak C describes the temporally varying secondary electronenergy.
As described previously, peak A primarily results fromincreased axial and radial electron flux during sheath collapseat the powered electrode to maintain current continuity, andpeak B results from electron collisions during sheath expan-sion. Peak C and the background excitation result from sec-ondary electrons generated from ion bombardment. Asdescribed in section 4, an α–γ mode transition occurs whenthe secondary electron interactions represent the dominantionization pathway, i.e. time-integrated excitation from peakC, and the background is greater than the combined excitationfrom peak A and B. This transition occurs in simulationbetween 270V and 300V, denoted by the space between thewhite dotted lines in figure 15; the results closely match theexperimental transition at 325V.
5.4. Spatially resolved plasma heating mechanisms
Simulated, phase-resolved, on-axis Ar(2p1) excitation ratesfrom upstream, at the powered electrode, and downstream ofthe source, regions 1, 2, and 3, respectively, are shown in
Figure 15. Simulated Ar(2p1) excitation rates, including excitationfrom fluid and secondary electrons, with respect to RF voltage phaseand voltage amplitude. Voltages below 270V and above 300V(inclusive) denote α-mode and γ-mode operation, respectively. Theplenum pressure is 186–226Pa (1.4–1.7 Torr), with a 13.56MHzdischarge; the wall temperature is 334–963K.
13
Plasma Sources Sci. Technol. 27 (2018) 085011 S J Doyle et al

figure 16. By setting the DoF to 0.5mm, one cell thick in theaxial direction, the excitation rate at each location can beobserved independently as opposed to the axially integratedanalysis discussed earlier. The phase-resolved excitationfrom each region for a 226Pa (1.7 Torr) plenum pressure,and 13.56MHz, 450V, γ-mode discharge is shown infigure 16(a). The voltage drop across the sheath (Von−axis−Vdielectric) at each region is shown in figure 16(b). Note thatthe phase of maximum sheath drop at the grounded electrodesis 0.5t
2=w
pout-of-phase relative to the maximum sheath
drop at the powered electrode.The phase-resolved Ar(2p1) excitation is normalized to
the global maximum value within the three profiles shown infigure 16(a). A significant change in the temporal excitationprofile between the three regions demonstrates that thedominant excitation mechanism changes with axial distance.The excitation upstream (region 1) peaks just prior to themaximum sheath drop, and hence maximum sheath exten-sion, at the upstream grounded electrode. This indicates thatsheath expansion heating is the dominant electron heatingmechanism at the upstream grounded electrode [34]. A sec-ondary, smaller peak in excitation during sheath collapse(0.3 0.5t
2 w
p) suggests that sheath collapse heating occurs
in this region as well.Excitation at the downstream grounded electrode
(region 3) exhibits a similar profile as the upstream electrode,albeit shifted to a later time in the RF cycle and shows noexcitation during sheath collapse. Although the maximumsheath voltage drop across the downstream grounded electrodesheath is lower than that for the upstream electrode, it occursover the same region in the RF phase (0.1 0.5t
2 w
p)
(figure 16(b)). This suggests that the primary heating mech-anism is likely still sheath expansion heating at the groundedelectrode; however, there may be further effects from otherheating mechanisms, such as axial electron flux toward thecollapsed powered electrode sheath. Upstream and down-stream (regions 1 and 3, respectively) both demonstrateheating mechanisms that correspond to α-mode heating, wheresheath expansion and collapse dictate the ionization andexcitation structures.
The excitation at the powered electrode (region 2), ismarkedly different from that upstream and downstream(regions 1 and 3, respectively). Most notably, the peak exci-tation rate occurs later in the RF cycle, just after the phase ofmaximum sheath voltage drop 0.8t
2=w
p. This corresponds
to the phase of the most negative alumina surface potential,suggesting that the excitation is most likely due to collisionsfrom an increased number of high-energy secondary elec-trons, accelerated through the sheath potential as previouslydescribed (with reference to figure 14). The excitation struc-ture at the powered electrode (region 2) shows little evidenceof either sheath expansion or sheath collapse heating duringthe powered electrode sheath collapse, 0.25t
2»w
p, but does
show a substantial ‘background’ excitation, such that theminimum excitation rate at the powered electrode is onlyslightly less than the maximum rate downstream (region 3).This background excitation increases with voltage due to theion-induced secondary electron emission increasing with thephase-averaged ion flux, providing a time-independent exci-tation mechanism as shown in figure 6.
6. Conclusions
Electron heating mechanisms were investigated in an RFelectrothermal microthruster operating between 186–226Pa(1.4–1.7 Torr) with an applied 13.56MHz voltage between130–450V. Experimental measurements of the phase-resolved Ar(2p1) excitation rate were compared to simulationmeasurements using the HPEM; the measurements showedclose agreement. An α–γ mode transition was observed forvoltages above 270V in simulation and above 325V in theexperiment. Three excitation structures were observed withinthe RF voltage cycle, and by comparison to simulations, theprimary heating mechanism responsible for each was identi-fied: electron heating at the collapsing sheath edge duringsheath collapse, electron heating during sheath expansion, andsecondary electron-induced excitation at maximum sheathextension. Sheath collapse and sheath expansion heatingmechanisms primarily deposit power on-axis at the upstreamand downstream ends of the thruster, while power depositionfrom secondary electron collisions and ion–neutral chargeexchange interactions predominately occurs within the pow-ered electrode sheath. The maximum sheath extension, andcorrespondingly the heated volume of the plasma, was foundto increase with the magnitude of the dc self-bias voltage.Optimizing the volume of the propellant heated, and theplasma discharge mode, via the dc self-bias voltage could
Figure 16. Simulated on-axis (a) Ar(2p1) excitation and (b) sheathvoltage drop upstream, at the powered electrode, and downstream(regions 1, 2, and 3, respectively). The plenum pressure is 226Pa(1.7 Torr), with a 450V applied voltage at 13.56MHz; the walltemperature is 963K.
14
Plasma Sources Sci. Technol. 27 (2018) 085011 S J Doyle et al

potentially enable the development of more power-efficientelectrothermal thrusters for use in increasingly miniaturizedsatellite platforms.
Acknowledgments
The authors wish to thank P Hill, R Armitage, C Murphy, andE Wagenaars for their technical support and useful discus-sions. The work presented herein was funded by the Engi-neering and Physical Sciences Research Council, grantreference number EP/m508196/1. The participation of MKushner was supported by the US National Science Foun-dation and the US Department of Energy’s Office of FusionEnergy Science.
ORCID iDs
Scott J Doyle https://orcid.org/0000-0002-8741-1018Andrew R Gibson https://orcid.org/0000-0002-1082-4359Teck Seng Ho https://orcid.org/0000-0002-3487-6196Mark J Kushner https://orcid.org/0000-0001-7437-8573James Dedrick https://orcid.org/0000-0003-4353-104X
References
[1] Levchenko I et al 2018 Space micropropulsion systems forCubesats and small satellites: From proximate targets tofurthermost frontiers 5 011104
[2] Adamovich I et al 2017 The 2017 plasma roadmap: lowtemperature plasma science and technology J. Phys. D:Appl. Phys. 50 323001
[3] Scharfe D B and Ketsdever A D 2009 A review of high thrust ,high Delta-V options for microsatellite missions 45th AIAA/ASME/SAE/ASEE Joint Propulsion Conference 15, 1–14
[4] Martinez-Sanchez M and Pollard J E 1998 Spacecraft electricpropulsion-an overview J. Propul. Power 14 688–99
[5] Ulybyshev Y 2008 Satellite constellation design for complexcoverage J. Spacecr. Rockets 45 843–9
[6] Keidar M, Zhuang T, Shashurin A, Teel G, Chiu D, Lukas J,Haque S and Brieda L 2015 Electric propulsion for smallsatellites Plasma Phys. Control. Fusion 57 014005
[7] Poghosyan A and Golkar A 2017 CubeSat evolution:Analyzing CubeSat capabilities for conducting sciencemissions Prog. Aerosp. Sci. 88 59–83
[8] Rafalskyi D and Aanesland A 2016 Brief review on plasmapropulsion with neutralizer-free systems Plasma SourcesSci. Technol. 25 043001
[9] Charles C, Boswell R W and Takahashi K 2012 Investigationof radiofrequency plasma sources for space travel PlasmaPhys. Control. Fusion 54 124021
[10] Charles C 2009 Plasmas for spacecraft propulsion J. Phys. D:Appl. Phys. 42 163001
[11] Dunaevsky A, Raitses Y and Fisch N J 2006 Plasmaacceleration from radio-frequency discharge in dielectriccapillary Appl. Phys. Lett. 88 10–3
[12] Goebel D M and Katz I 2008 Fundamentals of ElectricPropulsion (Hokoken, NJ: Wiley)
[13] Charles C and Boswell R W 2012 Measurement and modellingof a radiofrequency micro-thruster Plasma Sources Sci.Technol. 21 022002
[14] Charles C, Dedrick J, Boswell R W, O’Connell D and Gans T2013 Nanosecond optical imaging spectroscopy of anelectrothermal radiofrequency plasma thruster plume Appl.Phys. Lett. 103 124103
[15] Greig A, Charles C and Boswell R W 2015 Simulation of mainplasma parameters of a cylindrical asymmetric capacitivelycoupled plasma micro-thruster using computational fluiddynamics Front. Phys. 2 1–9
[16] Ho T S, Charles C and Boswell R W 2017 A comprehensive coldgas performance study of the pocket rocket radiofrequencyelectrothermal microthruster Front. Phys. 4 1–16
[17] Ho T S, Charles C and Boswell R 2017 Neutral gas heating andion transport in a constricted plasma flow Phys. Plasmas 248–13
[18] Greig A, Charles C, Hawkins R and Boswell R 2013 Directmeasurement of neutral gas heating in a radio-frequencyelectrothermal plasma micro-thruster Appl. Phys. Lett. 1031–7
[19] Charles C, Liang W, Raymond L, Rivas-Davila J andBoswell R W 2017 Vacuum testing of a miniaturized switchmode amplifier powering an electrothermal plasma micro-thruster Front. Phys. 5 1–8
[20] Heil B G, Czarnetzki U, Brinkmann R P and Mussenbrock T2008 On the possibility of making a geometricallysymmetric RF-CCP discharge electrically asymmetricJ. Phys. D: Appl. Phys. 41 165202
[21] Greig A, Charles C, Paulin N and Boswell R W 2014 Volumeand surface propellant heating in an electrothermal radio-frequency plasma micro-thruster Appl. Phys. Lett. 105054102
[22] Hagstrum H D 1954 Theory of auger ejection of electrons frommetals by ions Phys. Rev. 96 336–65
[23] Lafleur T and Booth J-P 2012 Control of the ion flux and ionenergy in CCP discharges using non-sinusoidal voltagewaveforms J. Phys. D: Appl. Phys. 45 395203
[24] Charles C, Hawkins R and Boswell R W 2015 Particle in cellsimulation of a radiofrequency plasma jet expanding invacuum Appl. Phys. Lett. 106 093502
[25] Charles C, Boswell R W, Bish A, Khayms V and Scholz E F2016 Direct measurement of axial momentum imparted byan electrothermal radiofrequency plasma micro-thrusterFront. Phys. 4 1–6
[26] Fruchtman A, Makrinich G, Chabert P and Rax J M 2005Enhanced plasma transport due to neutral depletion Phys.Rev. Lett. 95 1–4
[27] Raimbault J L, Liard L, Rax J M, Chabert P, Fruchtman A andMakrinich G 2007 Steady-state isothermal bounded plasmawith neutral dynamics Phys. Plasmas 14 013503
[28] Liard L, Raimbault J L, Rax J M and Chabert P 2007 Plasmatransport under neutral gas depletion conditions J. Phys. D:Appl. Phys. 40 5192–5
[29] Fruchtman A 2008 Energizing and depletion of neutrals by acollisional plasma Plasma Sources Sci. Technol. 17 024016
[30] Chabert P and Braithwaite N 2014 Physics of Radio-FrequencyPlasmas 3rd edn (Cambridge: Cambridge University Press)
[31] Schulze J, Donkó Z, Luggenhölscher D and Czarnetzki U 2009Different modes of electron heating in dual-frequencycapacitively coupled radio frequency discharges PlasmaSources Sci. Technol. 18 034011
[32] Schulze J, Derzsi A, Dittmann K, Hemke T, Meichsner J andDonkó Z 2011 Ionization by drift and ambipolar electricfields in electronegative capacitive radio frequency plasmasPhys. Rev. Lett. 107 1–5
[33] Lieberman M A 1988 Analytical solution for capacitive RFsheath IEEE Trans. Plasma Sci. 16 638–44
[34] Schulze J, Heil B G, Luggenhölscher D, Brinkmann R P,Czarnetzki U and Luggenh D 2008 Stochastic heating inasymmetric capacitively coupled RF discharges J. Phys. D:Appl. Phys. 41 195212
15
Plasma Sources Sci. Technol. 27 (2018) 085011 S J Doyle et al

[35] Schoenbach K H, El-habachi A, Shi W and Ciocca M 1997High-pressure hollow cathode discharges Plasma SourcesSci. Technol. 6 468–77
[36] Phelps A V and Petrovic Z L 1999 Cold-cathode discharges andbreakdown in argon: surface and gas phase production ofsecondary electrons Plasma Sources Sci. Technol. 8 R21–44
[37] Lafleur T, Boswell R W and Booth J-P 2012 Enhanced sheathheating in capacitively coupled discharges due to non-sinusoidal voltage waveforms Appl. Phys. Lett. 100 194101
[38] Doyle S J, Lafleur T, Gibson A R, Tian P, Kushner M J andDedrick J 2017 Enhanced control of the ionization rate inradio-frequency plasmas with structured electrodes via tailoredvoltage waveforms Plasma Sources Sci. Technol. 26 125005
[39] Lafleur T, Delattre P A, Booth J P, Johnson E V and Dine S2013 Radio frequency current-voltage probe for impedanceand power measurements in multi-frequency unmatchedloads Rev. Sci. Instrum. 84 015001
[40] Godyak V A and Piejak R B 1990 Insitu simultaneous radiofrequency discharge power measurements J. Vac. Sci.Technol., A 8 3833–7
[41] Marinov D and Braithwaite N J St 2014 Power coupling andelectrical characterization of a radio-frequency microatmospheric pressure plasma jet Plasma Sources Sci.Technol. 23 3–9
[42] Gans T, Lin C C, Schulz-von der Gathen V and Döbele H F2003 Phase-resolved emission spectroscopy of a hydrogenRF discharge for the determination of quenching coefficientsPhys. Rev. A 67 12707
[43] Gans T, O’Connell D, Schulz-von der Gathen V andWaskoenig J 2010 The challenge of revealing and tailoringthe dynamics of radio-frequency plasmas Plasma SourcesSci. Technol. 19 034010
[44] Siepa S and Czarnetzki U 2015 Line integration and spatialresolution in optical imaging of plasmas J. Phys. D: Appl.Phys. 48 385201
[45] Schulze J, Schüngel E, Donkó Z, Luggenhölscher D andCzarnetzki U 2010 Phase resolved optical emissionspectroscopy: a non-intrusive diagnostic to study electrondynamics in capacitive radio frequency discharges J. Phys.D: Appl. Phys. 43 124016
[46] Chilton J E, Boffard J B, Schappe R S and Lin C C 1998Measurement of electron-impact excitation into the p3 5 4plevels of argon using Fourier-transform spectroscopy Phys.Rev. A 57 267–77
[47] Niemi K, Reuter S, Graham L M, Waskoenig J, Knake N,Schulz-Von Der Gathen V and Gans T 2010 Diagnosticbased modelling of radio-frequency driven atmosphericpressure plasmas J. Phys. D: Appl. Phys. 43 124006
[48] Huddlestone R H and Leonard S L 1965 Plasma DiagnosticTechniques.pdf (New York: Academic)
[49] Anders A 1990 A Formulary for Plasma Physics (Berlin:Akademie-Verlag)
[50] Sadeghi N, Setser D W, Francis A, Czarnetzki U andDöbele H F 2001 Quenching rate constants for reactions ofAr(4p[1/2]0¢, 4p[1/2]0¢, 4p[3/2]2¢, and 4p[5/2]2) atomswith 22 reagent gases J. Chem. Phys. 115 3144–54
[51] Kushner M J 2009 Hybrid modelling of low temperatureplasmas for fundamental investigations and equipmentdesign J. Phys. D: Appl. Phys. 42 194013
[52] Tian P and Kushner M J 2015 Controlling VUV photon fluxesin low-pressure inductively coupled plasmas PlasmaSources Sci. Technol. 24 34017
[53] Furman M A and Pivi M T F 2002 Probabilistic model for thesimulation of secondary electron emission Phys. Rev. Spec.Top.—Accel. Beams 5 82–99
[54] Song S-H and Kushner M J 2012 Control of electron energydistributions and plasma characteristics of dual frequency,pulsed capacitively coupled plasmas sustained in Ar and Ar/CF4/O2 Plasma Sources Sci. Technol. 21 55028
[55] Scharfetter D L and Gummel H K 1969 Large-signal analysisof a silicon read diode oscillator IEEE Trans. ElectronDevices 16 64–77
[56] Hayashi M 1991 Report No. IPPJ-AM-19, Technical report,Nagoya Institute of Technology
[57] Tachibana K 1986 Excitation of the 1s5, 1s4, 1s3 and 1s2 levelsof argon by low-energy electrons Phys. Rev. A 34 451
[58] Rapp D and Englander-Golden P 1965 Total cross sections forionization and attachment in gases by electron impact. i.positive ionization J. Chem. Phys. 43 1464–79
[59] Dyatko N A, Ionikh Y Z, Kochetov I V, Marinov D L,Meshchanov A V, Napartovich A P, Petrov F B andStarostin S A 2008 Experimental and theoretical study of thetransition between diffuse and contracted J. Phys. D: Appl.Phys. 41 055204
[60] Bogaerts A, Serikov R G V and Serikov V V 1999 Calculationof gas heating in direct current argon glow dischargesJ. Appl. Phys. 87 8334
[61] Ellis H W, Pai R Y, McDaniel E W, Mason E A andViehland L A 1976 Transport properties of gaseous ions over awide energy range At. Data Nucl. Data Tables 17 177–210
[62] Gibson A R, Foucher M, Marinov D, Chabert P, Gans T,Kushner M J and Booth J-P 2017 The role of thermal energyaccommodation and atomic recombination probabilities inlow pressure oxygen plasmas Plasma Phys. Control. Fusion59 024004
[63] Lofthouse A J, Scalabrin L C and Boyd I D 2008 Velocity slipand temperature jump in hypersonic aerothermodynamicsJ. Thermophys. Heat Transfer 22 38–49
[64] Yamaguchi H, Kanazawa K, Matsuda Y, Niimi T,Polikarpov A and Graur I 2012 Investigation on heat transferbetween two coaxial cylinders for measurement of thermalaccommodation coefficient Phys. Fluids 24 062002
[65] Trott W M, Castaeda J N, Torczynski J R, Gallis M A andRader D J 2011 An experimental assembly for precisemeasurement of thermal accommodation coefficients Rev.Sci. Instrum. 82 035120
[66] Steckelmacher W 1986 Knudsen flow 75 years on: The currentstate of the art for flow of rarefied gases in tubes and systemsRep. Prog. Phys. 49 1083–107
[67] Chen X and Pfender E 1983 Effect of the Knudsen number onheat transfer to a particle immersed into a thermal plasmaPlasma Chem. Plasma Process. 3 97–113
[68] Thompson P A 1994 Compressible Fluid Dynamics 2nd edn(New York: McGraw-Hill)
[69] Wu L 2008 A slip model for rarefied gas flows at arbitraryKnudsen number Appl. Phys. Lett. 93 2006–9
[70] Arakoni R A, Ewing J J and Kushner M J 2008Microdischarges for use as microthrusters: modelling andscaling J. Phys. D: Appl. Phys. 41 105208
[71] Garrigues L and Coche P 2011 Electric propulsion:comparisons between different concepts Plasma Phys.Control. Fusion 53 124011
[72] Mazouffre S 2016 Electric propulsion for satellites andspacecraft: established technologies and novel approachesPlasma Sources Sci. Technol. 25 033002
[73] Ho T S, Charles C and Boswell R 2018 Performance modellingof plasma microthruster nozzles in vacuum J. Appl. Phys.123 173301
[74] Dixon S, Charles C, Dedrick J, Gans T, O’Connell D andBoswell R 2014 Observations of a mode transition in ahydrogen hollow cathode discharge using phase resolvedoptical emission spectroscopy Appl. Phys. Lett. 105 014104
[75] Lieberman M A and Lichtenberg A J 2005 Principles ofPlasma Discharges and Materials Processing 2nd edn(Hoboken, NJ: Wiley)
[76] Lafleur T, Chabert P and Booth J-P 2013 Secondary electroninduced asymmetry in capacitively coupled plasmas J. Phys.D: Appl. Phys. 46 135201
16
Plasma Sources Sci. Technol. 27 (2018) 085011 S J Doyle et al

[77] Derzsi A, Korolov I, Schüngel E, Donkó Z and Schulze J 2015Effects of fast atoms and energy-dependent secondary electronemission yields in PIC/MCC simulations of capacitivelycoupled plasmas Plasma Sources Sci. Technol. 24 034002
[78] Daksha M, Derzsi A, Wilczek S, Trieschmann J,Mussenbrock T, Awakowicz P, Donkó Z and Schulze J2017 The effect of realistic heavy particle induced secondaryelectron emission coefficients on the electron powerabsorption dynamics in single- and dual-frequencycapacitively coupled plasmas Plasma Sources Sci. Technol.26 085006
[79] Mahony C M O, Al Wazzan R and Graham W G 1997 Sheathdynamics observed in a 13.56 MHz-driven plasma Appl.Phys. Lett. 71 608
[80] Lafleur T 2016 Tailored-waveform excitation of capacitivelycoupled plasmas and the electrical asymmetry effect PlasmaSources Sci. Technol. 25 013001
[81] Williams K R, Gupta K and Wasilik M 2003 Etch rates formicromachining processing II J. Microelectromech. Syst. 12761–77
[82] Benninghoven A, Rudenauer F G and Werner H W 1987Secondary Ion Mass Spectrometry: Basic Concepts,Instrumental Aspects, Applications and Trends 1st edn(Cambridge: Wiley)
[83] Schulze J, Schüngel E, Donkó Z and Czarnetzki U 2010 Chargedynamics in capacitively coupled radiofrequency discharges J. Phys. D: Appl. Phys. 43225201
17
Plasma Sources Sci. Technol. 27 (2018) 085011 S J Doyle et al