Embed Size (px)
DESCRIPTION
Spatiotemporal Analysis of Surface Water Tetrachloroethene in New Jersey. Presentation of the project of Yasuyuki Akita Temporal GIS Fall 2004. Agenda. About Tetrachloroethene Monitoring Data Details of BME Method BME Analysis Results of BME Analysis New Criterion Model Comparison - PowerPoint PPT Presentation
Citation preview
Spatiotemporal Analysis ofSpatiotemporal Analysis ofSurface Water Surface Water
Tetrachloroethene in New Tetrachloroethene in New JerseyJersey
Presentation of the project of Presentation of the project of Yasuyuki AkitaYasuyuki Akita
Temporal GIS Fall 2004Temporal GIS Fall 2004
AgendaAgenda
• About TetrachloroetheneAbout Tetrachloroethene
• Monitoring DataMonitoring Data
• Details of BME MethodDetails of BME Method
• BME AnalysisBME Analysis
• Results of BME AnalysisResults of BME Analysis
• New CriterionNew Criterion
• Model ComparisonModel Comparison
• ConclusionConclusion

About TetrachloroetheneAbout Tetrachloroethene
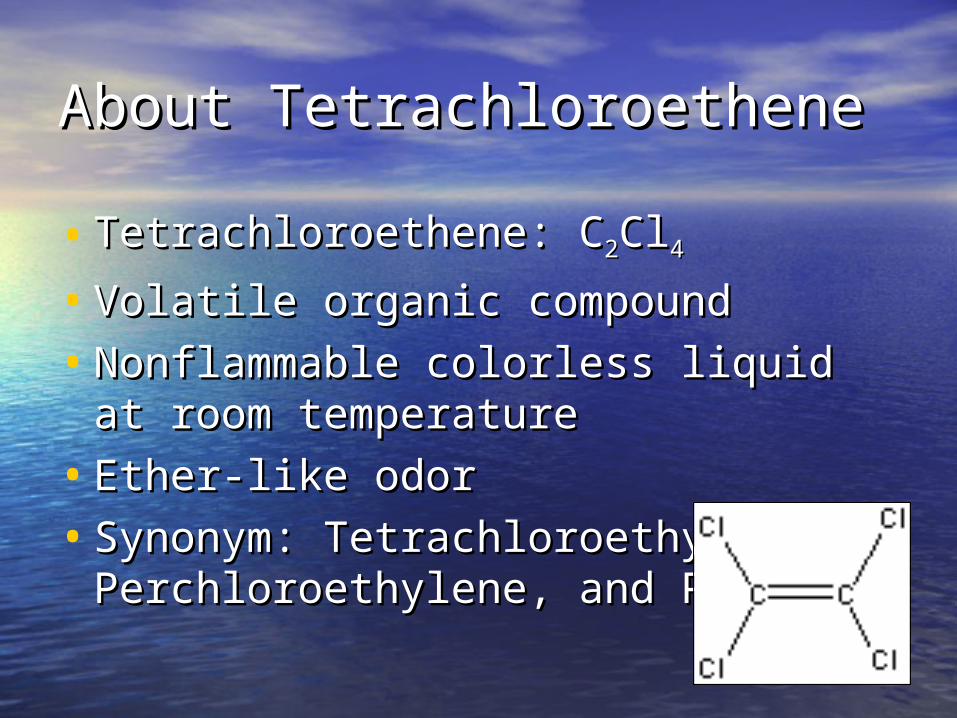
About TetrachloroetheneAbout Tetrachloroethene
• Tetrachloroethene: CTetrachloroethene: C22ClCl44• Volatile organic compoundVolatile organic compound
• Nonflammable colorless liquid at Nonflammable colorless liquid at room temperatureroom temperature
• Ether-like odorEther-like odor
• Synonym: Tetrachloroethylene, Synonym: Tetrachloroethylene, Perchloroethylene, and PCEPerchloroethylene, and PCE
Use and ProductionUse and Production
• Mainly Used for dry cleaning, chemical Mainly Used for dry cleaning, chemical intermediates, and industrial solventintermediates, and industrial solvent
• PCE used in dry cleaning industry has PCE used in dry cleaning industry has been declining during 90sbeen declining during 90s
• Recent Demand: 763 million lb (1980) Recent Demand: 763 million lb (1980)
318 million lb 318 million lb (1999)(1999)
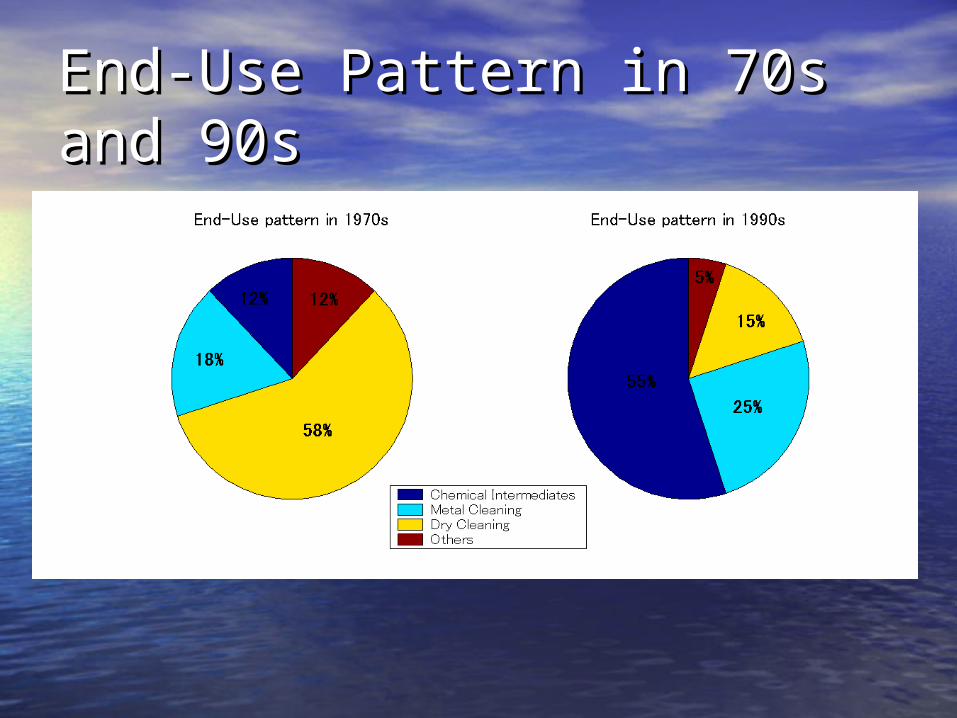
End-Use Pattern in 70s and End-Use Pattern in 70s and 90s90s
Exposure pathwayExposure pathway
• Primary routePrimary route– InhalationInhalation– Ingestion of contaminated food and waterIngestion of contaminated food and water
• Widely distributed in environmentWidely distributed in environment– 38% of surface water sampling sites in the 38% of surface water sampling sites in the
U.S.U.S.– 771 of the 1430 National Priorities List sites771 of the 1430 National Priorities List sites– 154 of 174 surface water samples in N.J. 154 of 174 surface water samples in N.J.
(1977~1979)(1977~1979)
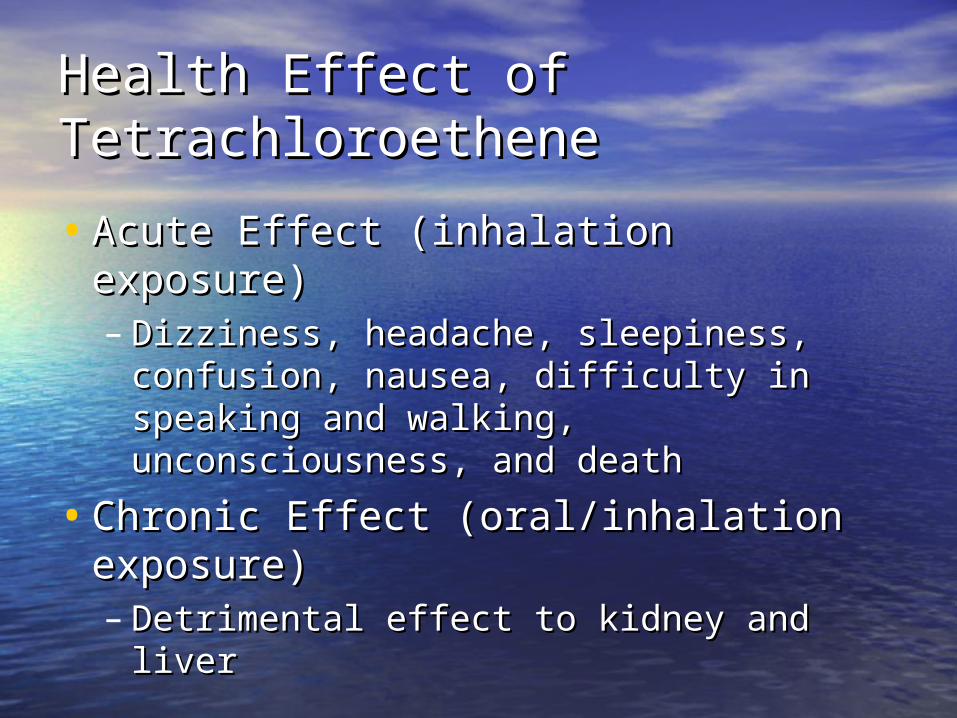
Health Effect of Health Effect of TetrachloroetheneTetrachloroethene
• Acute Effect (inhalation exposure)Acute Effect (inhalation exposure)– Dizziness, headache, sleepiness, Dizziness, headache, sleepiness,
confusion, nausea, difficulty in speaking confusion, nausea, difficulty in speaking and walking, unconsciousness, and and walking, unconsciousness, and deathdeath
• Chronic Effect (oral/inhalation Chronic Effect (oral/inhalation exposure)exposure)– Detrimental effect to kidney and liverDetrimental effect to kidney and liver

CarcinogenicityCarcinogenicity
• Reasonably anticipated to be a human Reasonably anticipated to be a human carcinogen (US DHHS)carcinogen (US DHHS)
• Group 2A (Probably carcinogenic to Group 2A (Probably carcinogenic to humans) (IARC)humans) (IARC)
• Animal studies: tumors in Animal studies: tumors in liverliver and and kidneykidney
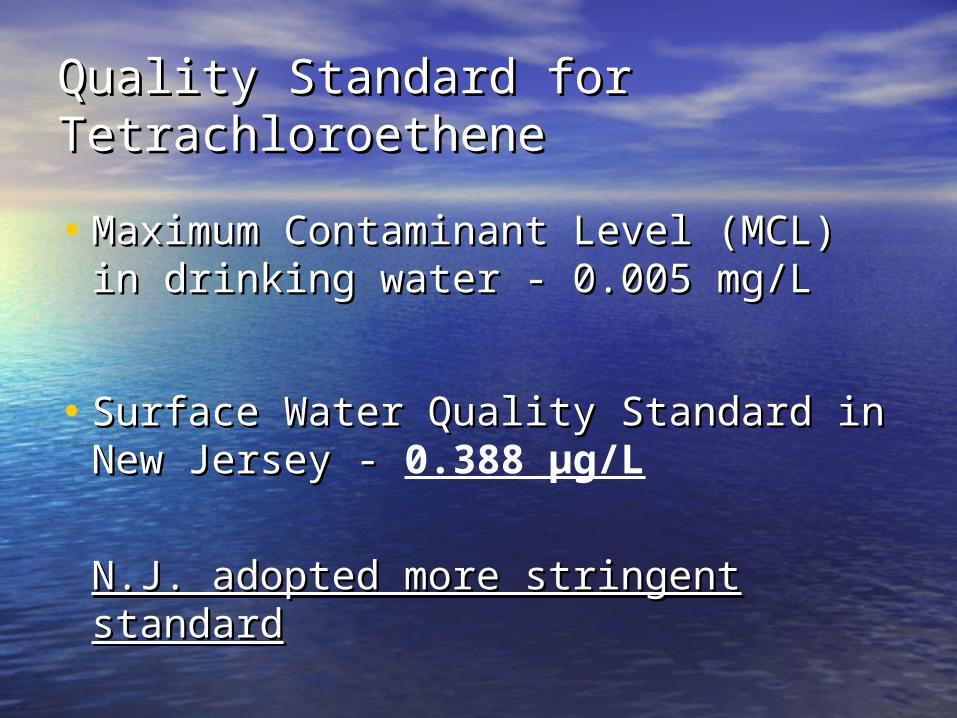
Quality Standard for Quality Standard for TetrachloroetheneTetrachloroethene
• Maximum Contaminant Level (MCL) Maximum Contaminant Level (MCL) in drinking water - 0.005 mg/Lin drinking water - 0.005 mg/L
• Surface Water Quality Standard in Surface Water Quality Standard in New Jersey - New Jersey - 0.388 μg/L
N.J. adopted more stringent standardN.J. adopted more stringent standard

Monitoring DataMonitoring Data
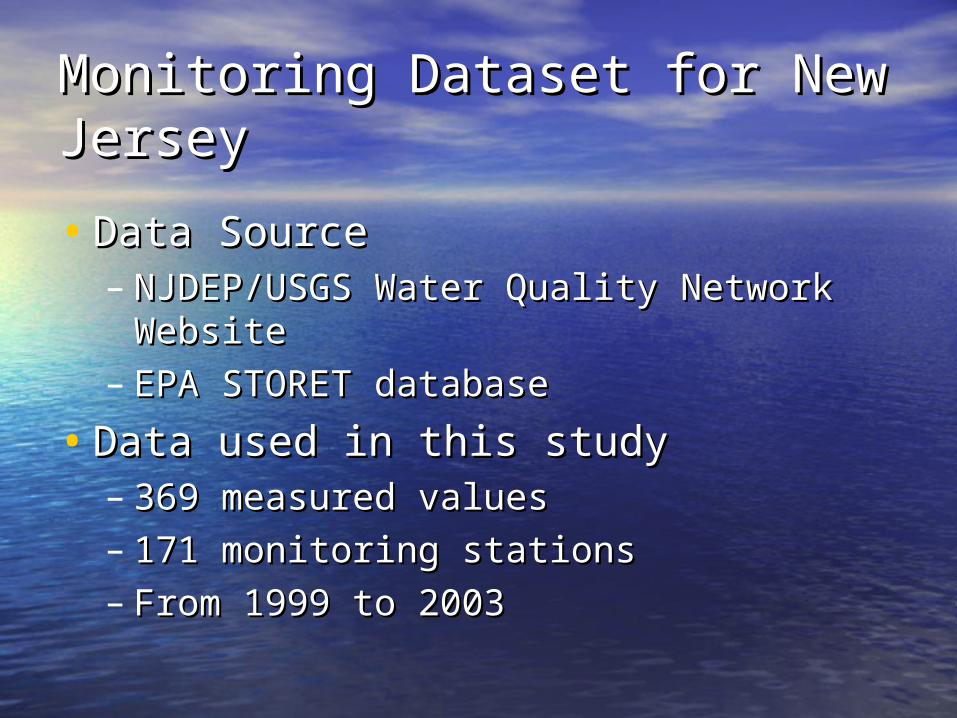
Monitoring Dataset for New Monitoring Dataset for New JerseyJersey
• Data SourceData Source– NJDEP/USGS Water Quality Network NJDEP/USGS Water Quality Network
WebsiteWebsite– EPA STORET databaseEPA STORET database
• Data used in this studyData used in this study– 369 measured values369 measured values– 171 monitoring stations171 monitoring stations– From 1999 to 2003From 1999 to 2003
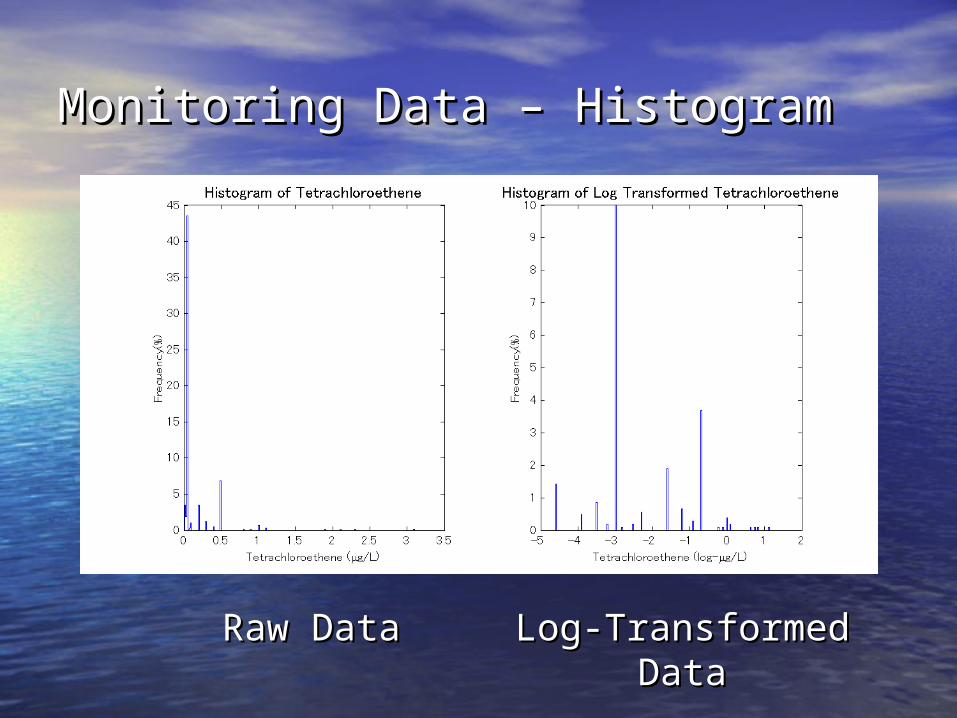
Monitoring Data – HistogramMonitoring Data – Histogram
Raw DataRaw Data Log-Transformed Log-Transformed DataData
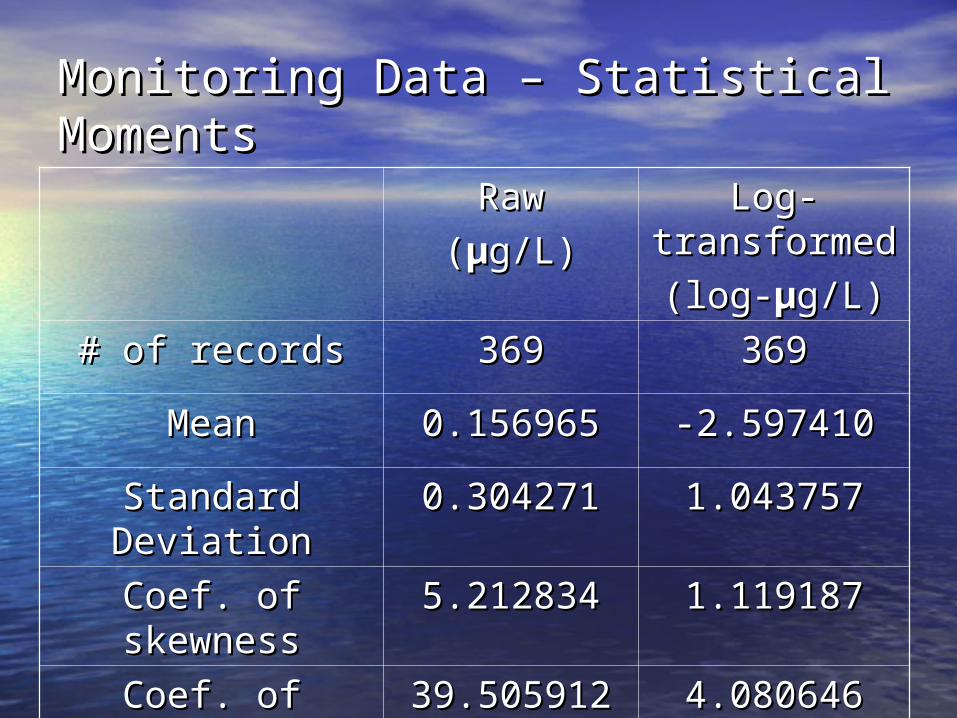
Monitoring Data – Statistical Monitoring Data – Statistical MomentsMoments
RawRaw
((μμg/L)g/L)Log-Log-
transformedtransformed
(log-(log-μμg/L)g/L)
# # of recordsof records 369369 369369MeanMean 0.1569650.156965 -2.597410-2.597410
Standard Standard DeviationDeviation
0.3042710.304271 1.0437571.043757
Coef. of Coef. of skewnessskewness
5.2128345.212834 1.1191871.119187
Coef. of kurtosisCoef. of kurtosis 39.50591239.505912 4.0806464.080646
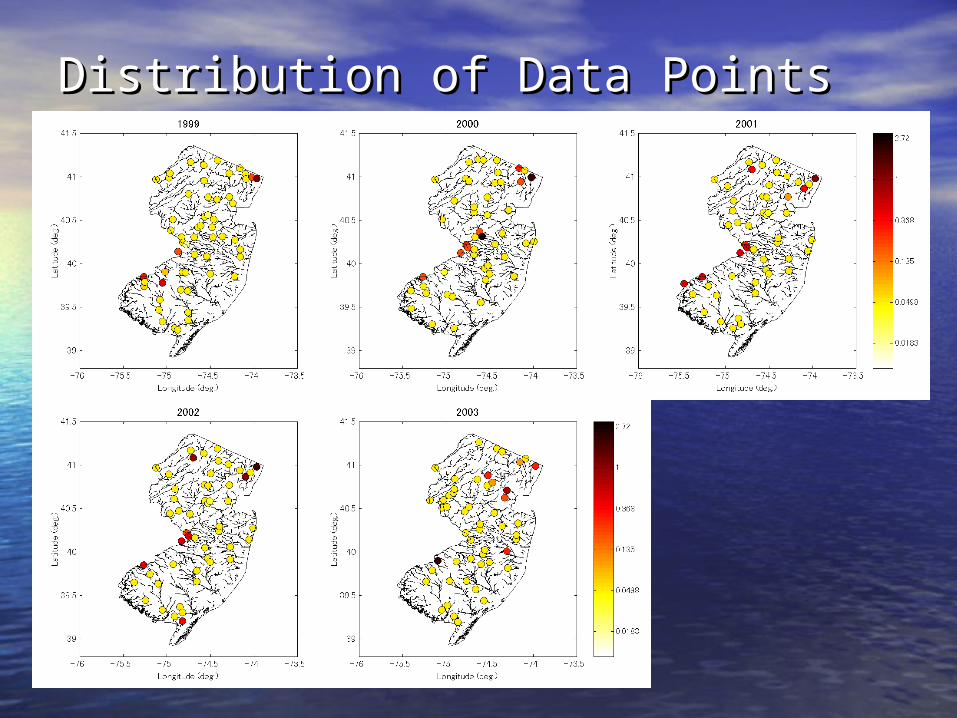
Distribution of Data PointsDistribution of Data Points
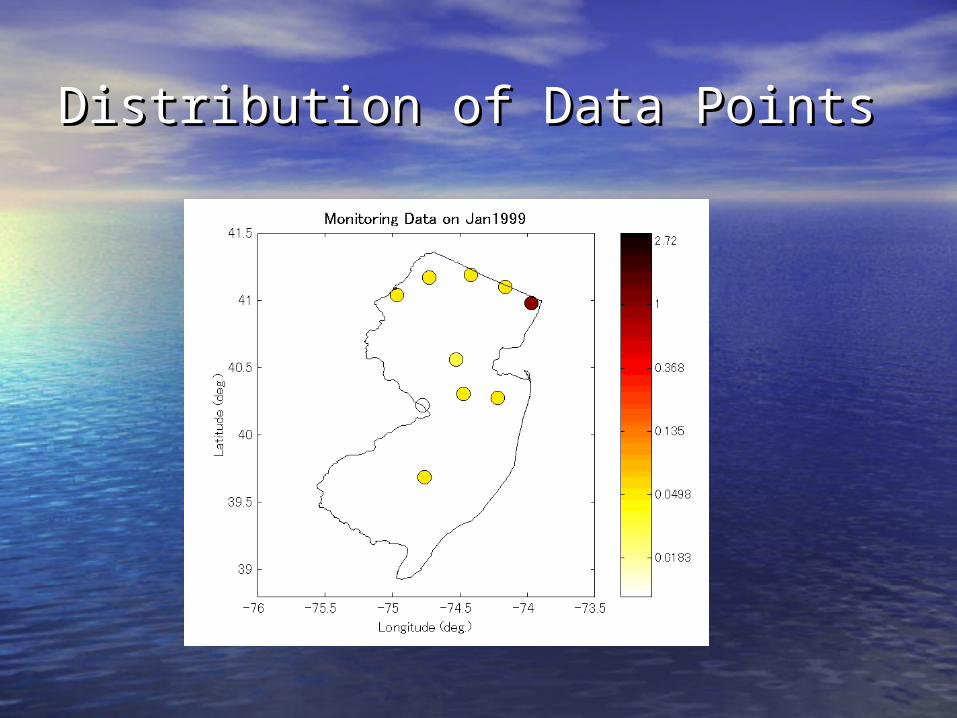
Distribution of Data PointsDistribution of Data Points
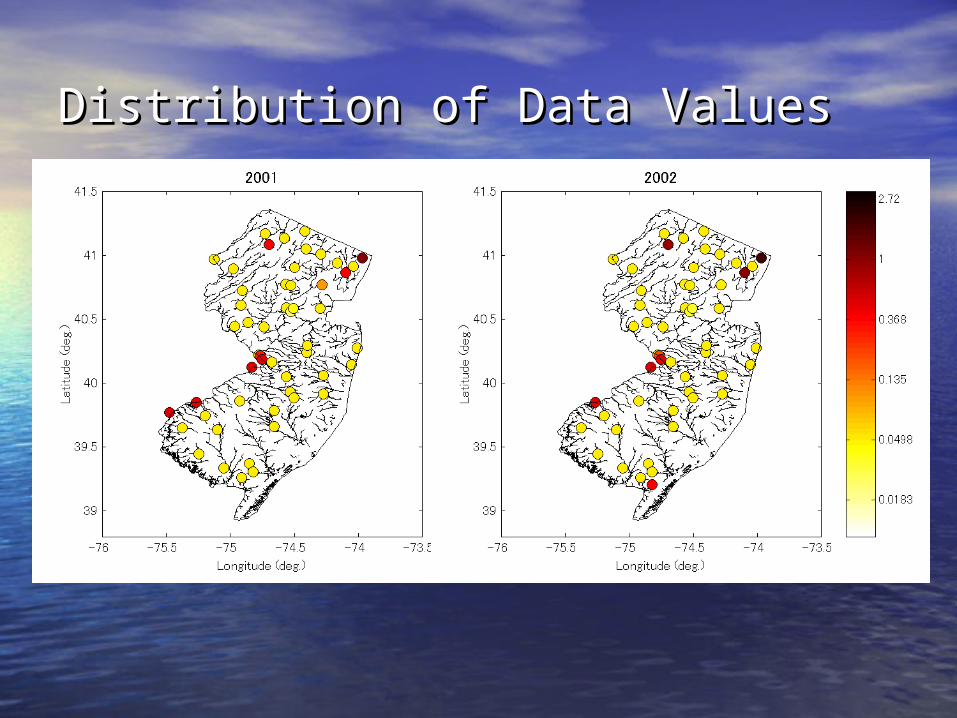
Distribution of Data ValuesDistribution of Data Values
What we want to know is …What we want to know is …
• Challenge of our researchChallenge of our research– Assess all river reachesAssess all river reaches– Taking into account the space/time Taking into account the space/time
variabilityvariability
Framework for the space/time Framework for the space/time estimationestimation
Bayesian Maximum Entropy (BME) analysis of Bayesian Maximum Entropy (BME) analysis of TGISTGIS

Details of BME MethodDetails of BME Method
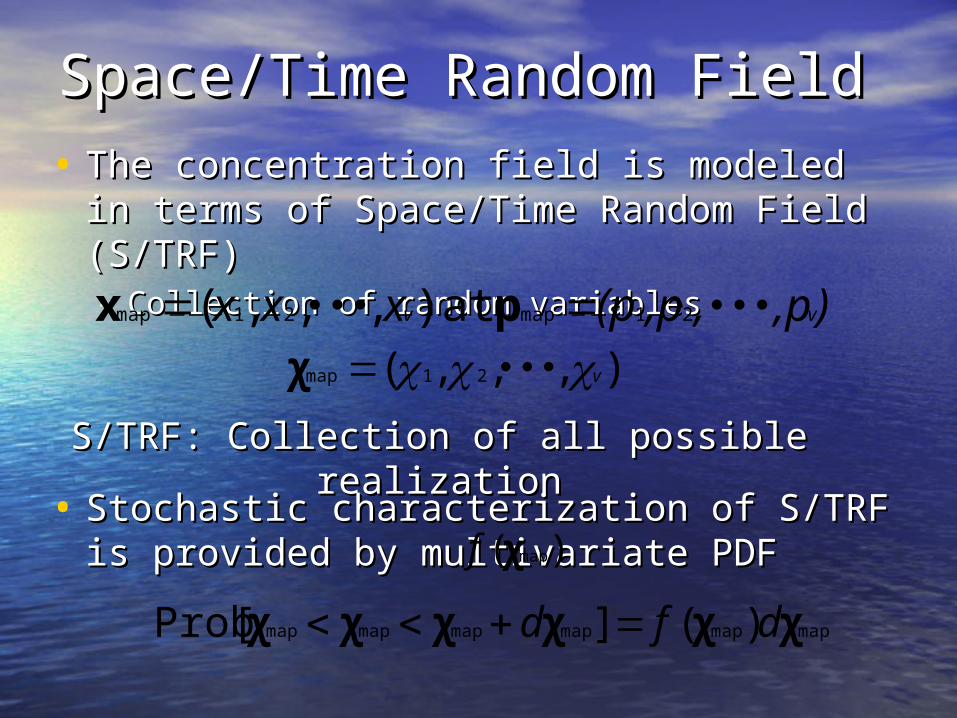
Space/Time Random FieldSpace/Time Random Field• The concentration field is modeled in terms The concentration field is modeled in terms
of Space/Time Random Field (S/TRF)of Space/Time Random Field (S/TRF)– Collection of random variablesCollection of random variables
mapmapmapmapmapmap )(][Prob χχχχχχ dfd
),p,,p(pxxx vv ・・・ ・・・ 21map21map at ),,,( px),,,( 21map v ・・・χ
S/TRF: Collection of all possible realizationS/TRF: Collection of all possible realization
• Stochastic characterization of S/TRF is Stochastic characterization of S/TRF is provided by multivariate PDFprovided by multivariate PDF)( mapχf
Knowledge BaseKnowledge Base
• General Knowledge Base: General Knowledge Base: GG– Describe global characteristics of the Describe global characteristics of the
random field of interestrandom field of interest– Expressed as statistical momentsExpressed as statistical moments
• Site-specific knowledge Base: Site-specific knowledge Base: SS– Available monitoring data over the Available monitoring data over the
space/time domain of interestspace/time domain of interest
• Total Knowledge Base: Total Knowledge Base: KK– KK = = GG ∪ ∪ SS
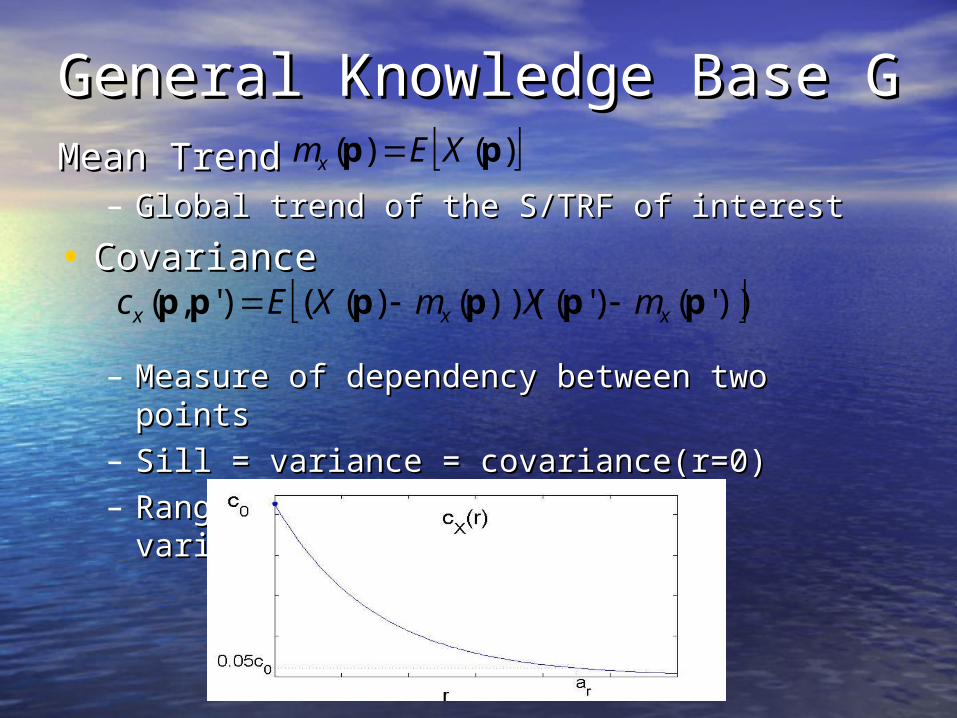
General Knowledge Base General Knowledge Base GGMean TrendMean Trend
– Global trend of the S/TRF of interestGlobal trend of the S/TRF of interest
• CovarianceCovariance
– Measure of dependency between two pointsMeasure of dependency between two points– Sill = variance = covariance(r=0)Sill = variance = covariance(r=0)– Range shows the extent that co-variability Range shows the extent that co-variability
existsexists
)()( pp XEmx
))'()'())(()(()',( pppppp xxx mXmXEc
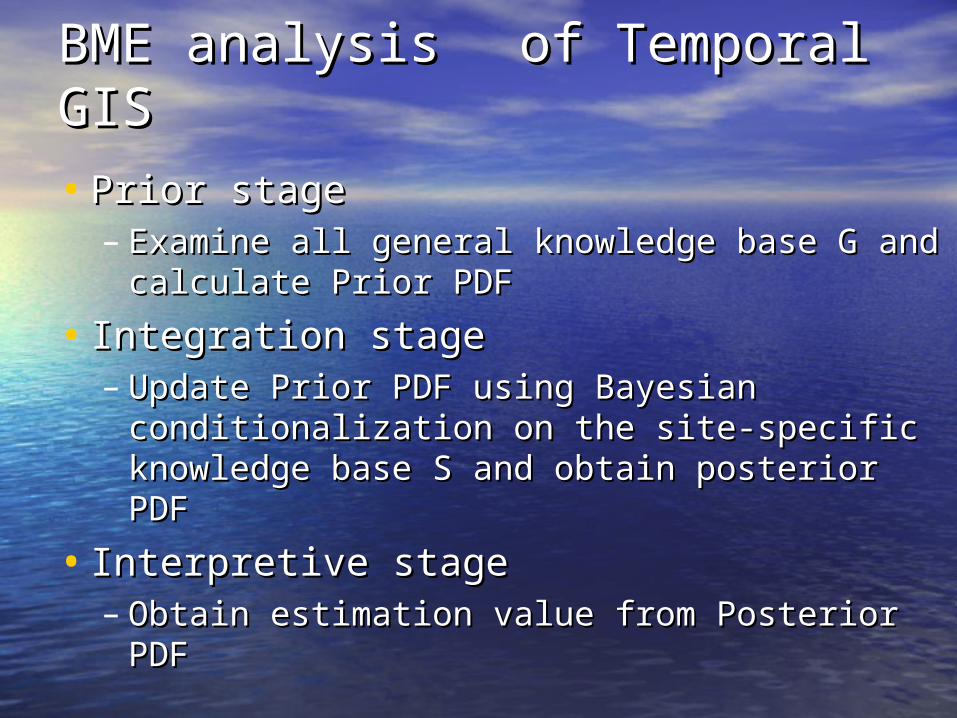
BME analysisBME analysis of Temporal of Temporal GISGIS
• Prior stagePrior stage– Examine all general knowledge base Examine all general knowledge base GG and and
calculate Prior PDFcalculate Prior PDF
• Integration stageIntegration stage– Update Prior PDF using Bayesian Update Prior PDF using Bayesian
conditionalization on the site-specific conditionalization on the site-specific knowledge base knowledge base S S and obtain posterior PDFand obtain posterior PDF
• Interpretive stageInterpretive stage– Obtain estimation value from Posterior PDFObtain estimation value from Posterior PDF
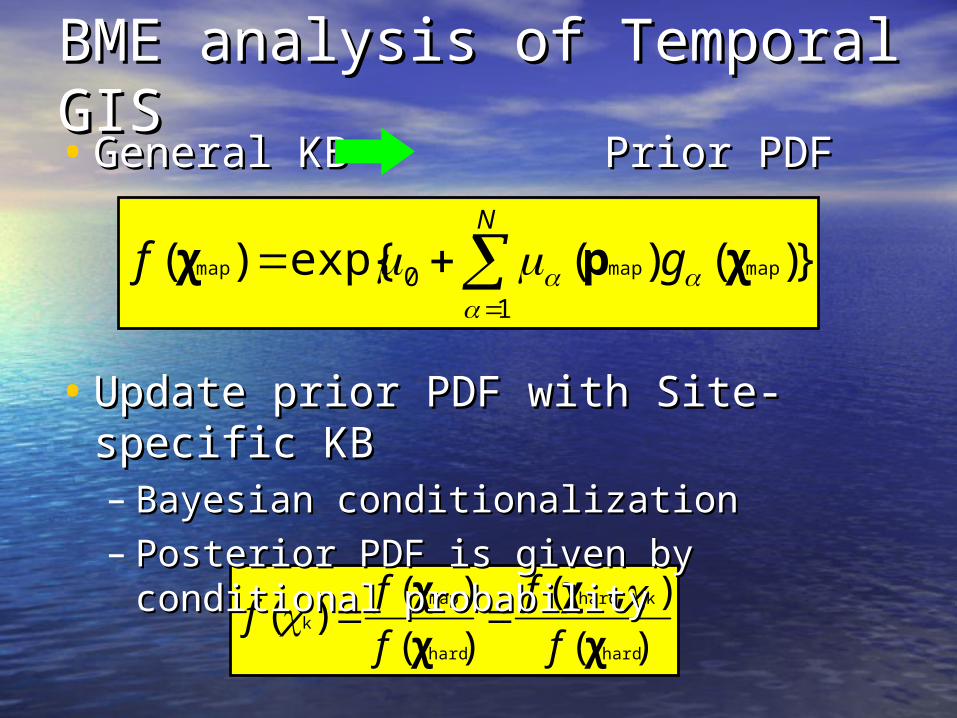
BME analysis of Temporal BME analysis of Temporal GISGIS• General KB Prior PDFGeneral KB Prior PDF
})()(exp{)(1
0 mapmapmap
N
gf
χpχ
)(
),(
)(
)()(
hard
khard
hard
map
k
χ
χ
χ
χ
f
f
f
ff
• Update prior PDF with Site-specific KBUpdate prior PDF with Site-specific KB– Bayesian conditionalizationBayesian conditionalization– Posterior PDF is given by conditional Posterior PDF is given by conditional
probability probability
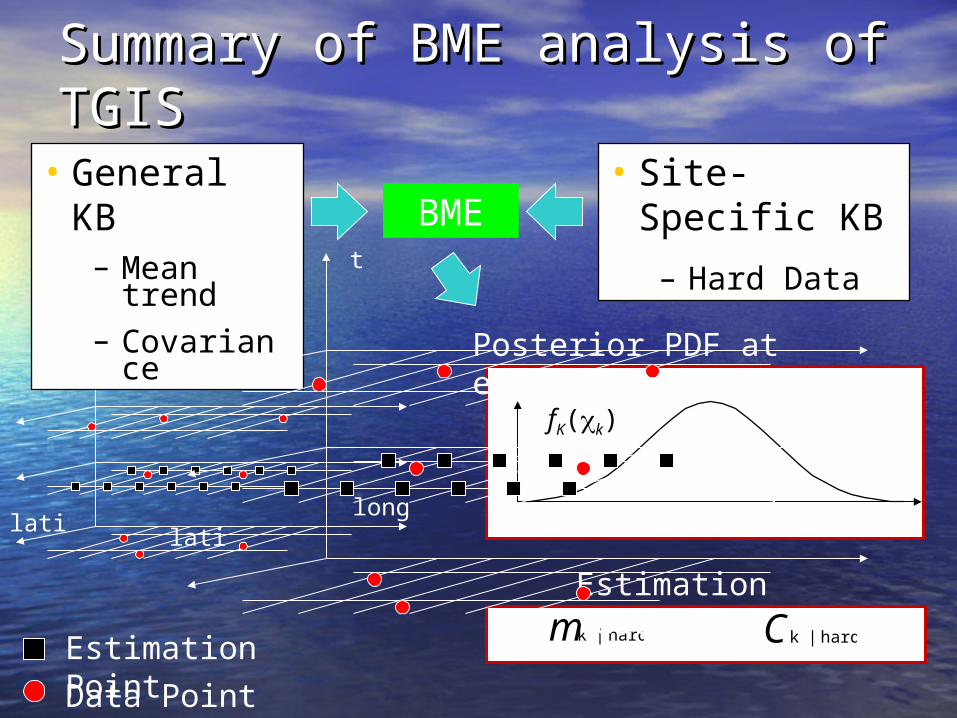
Summary of BME analysis of Summary of BME analysis of TGISTGIS
Estimation Point
Data Point
longlati
t
• General KB– Mean
trend– Covarianc
e
• Site-Specific KB
– Hard Data
BME
fK(k)
Posterior PDF at estimation point
hard|km hard|kCEstimation Value
longlati
t

BME AnalysisBME Analysis
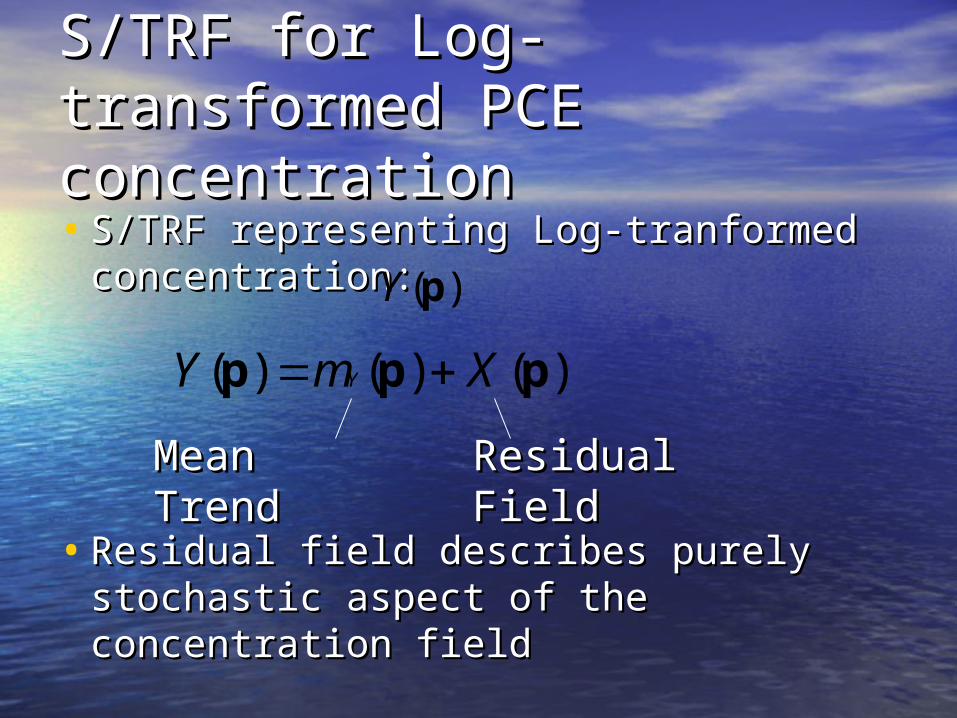
S/TRF for Log-transformed S/TRF for Log-transformed PCE concentrationPCE concentration
• S/TRF representing Log-tranformed S/TRF representing Log-tranformed concentration: concentration:
• Residual field describes purely Residual field describes purely stochastic aspect of the stochastic aspect of the concentration fieldconcentration field
)()()( ppp XmY Y
)(pY
Mean Mean TrendTrend
Residual Residual FieldField
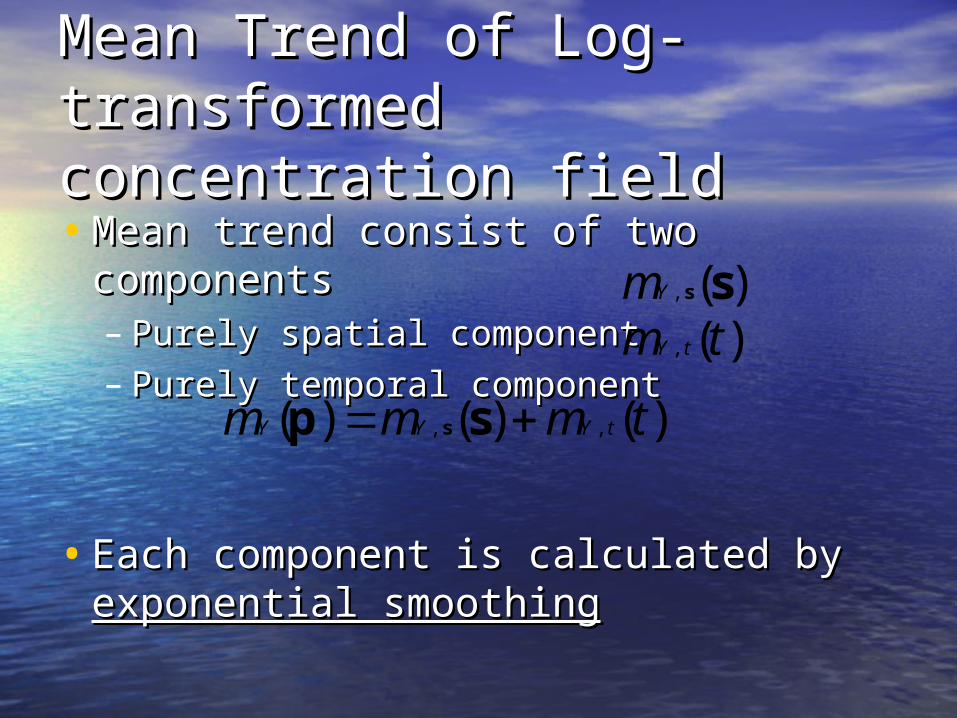
Mean Trend of Log-Mean Trend of Log-transformed concentration transformed concentration fieldfield• Mean trend consist of two Mean trend consist of two
componentscomponents– Purely spatial componentPurely spatial component– Purely temporal componentPurely temporal component
• Each component is calculated by Each component is calculated by exponential smoothingexponential smoothing
)()()( ,, tmmm tYYY sp s
)(, ssYm)(, tm tY
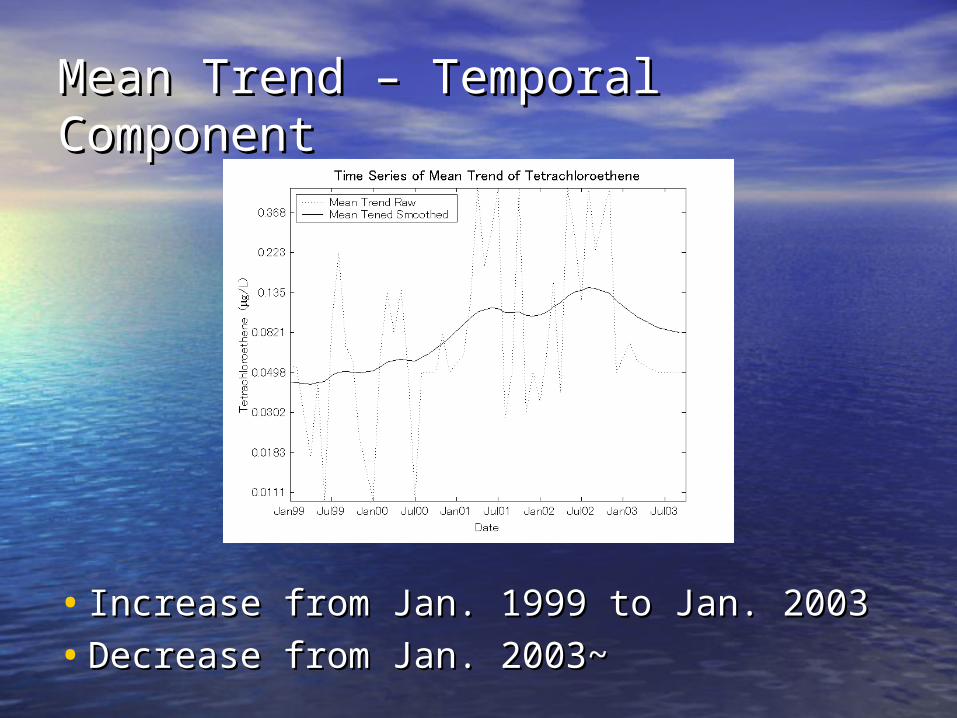
Mean Trend – Temporal Mean Trend – Temporal ComponentComponent
• Increase from Jan. 1999 to Jan. 2003Increase from Jan. 1999 to Jan. 2003
• Decrease from Jan. 2003~Decrease from Jan. 2003~
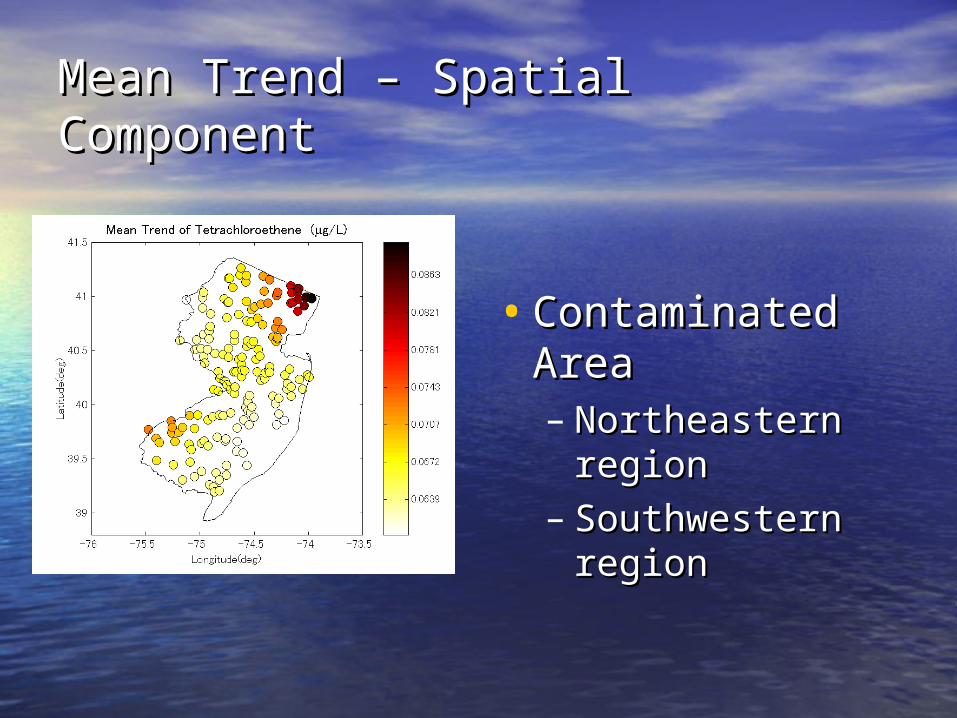
Mean Trend – Spatial ComponentMean Trend – Spatial Component
• Contaminated AreaContaminated Area– Northeastern Northeastern
regionregion– Southwestern Southwestern
regionregion
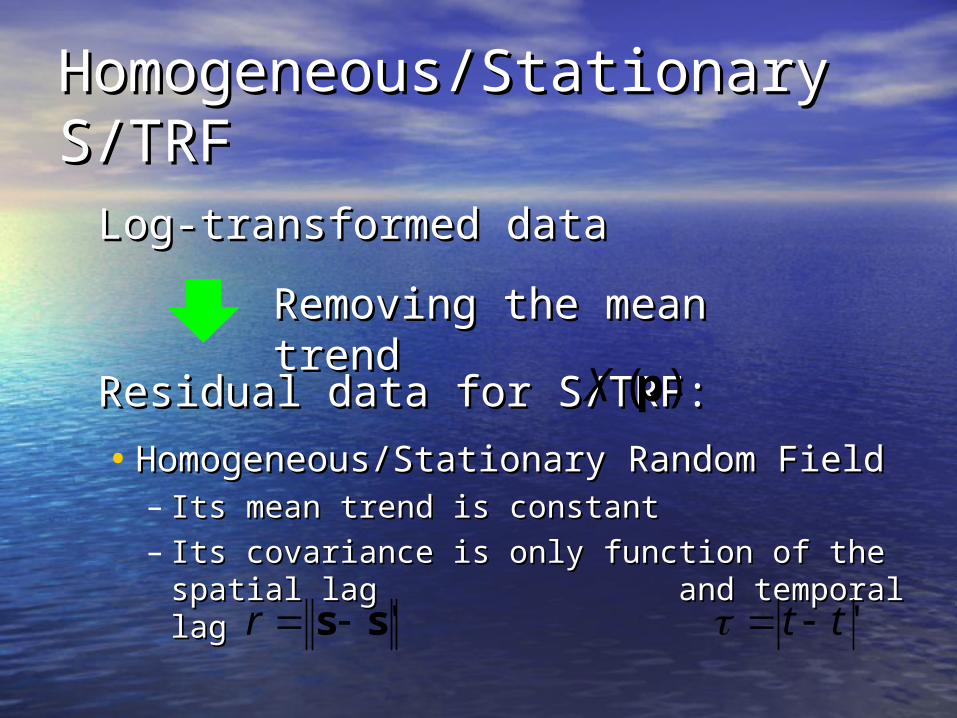
Homogeneous/Stationary Homogeneous/Stationary S/TRFS/TRF
Log-transformed dataLog-transformed data
Residual data for S/TRF: Residual data for S/TRF:
Removing the mean Removing the mean trendtrend
• Homogeneous/Stationary Random Homogeneous/Stationary Random FieldField– Its mean trend is constantIts mean trend is constant– Its covariance is only function of the Its covariance is only function of the
spatial lag and temporal lagspatial lag and temporal lag'ss r 'tt
)(pX
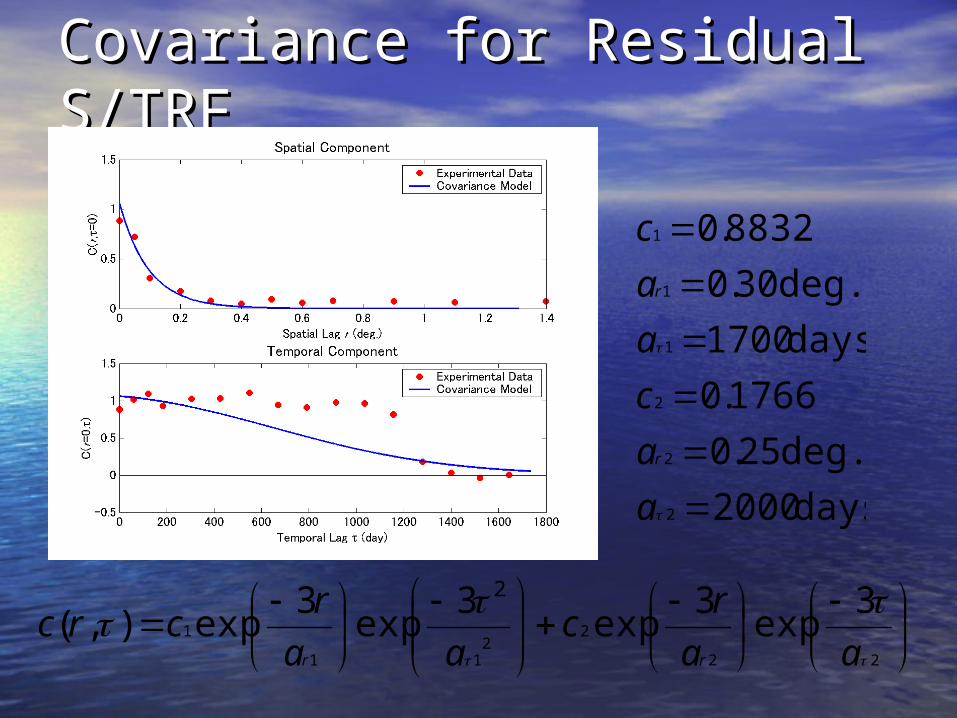
Covariance for Residual Covariance for Residual S/TRFS/TRF
22
22
11
1
3exp
3exp
3exp
3exp),(
2
aa
rc
aa
rcrc
rr
days 2000
deg. 25.0
1766.0
days 1700
deg. 30.0
8832.0
2
2
2
1
1
1
a
a
c
a
a
c
r
r
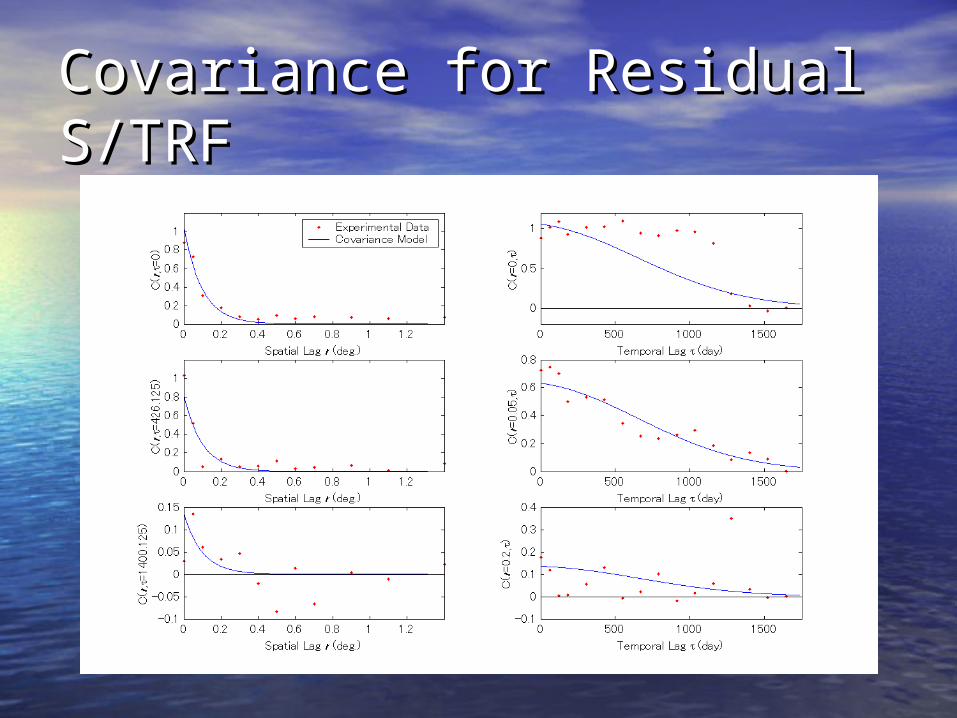
Covariance for Residual Covariance for Residual S/TRFS/TRF
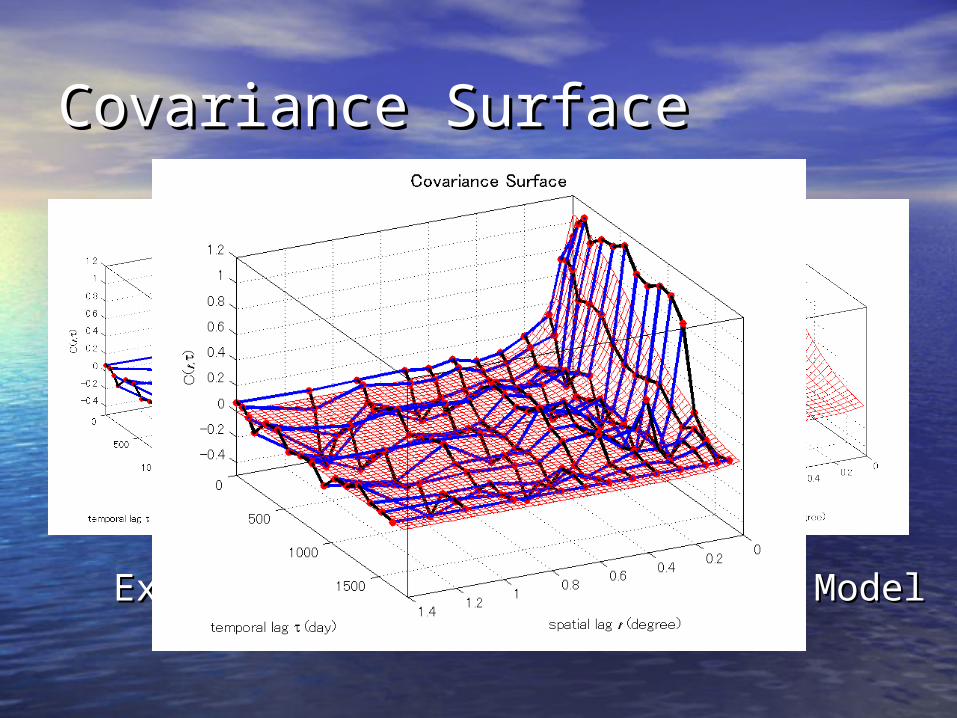
Covariance SurfaceCovariance Surface
Experimental DataExperimental Data Covariance ModelCovariance Model
Results of BME AnalysisResults of BME Analysis
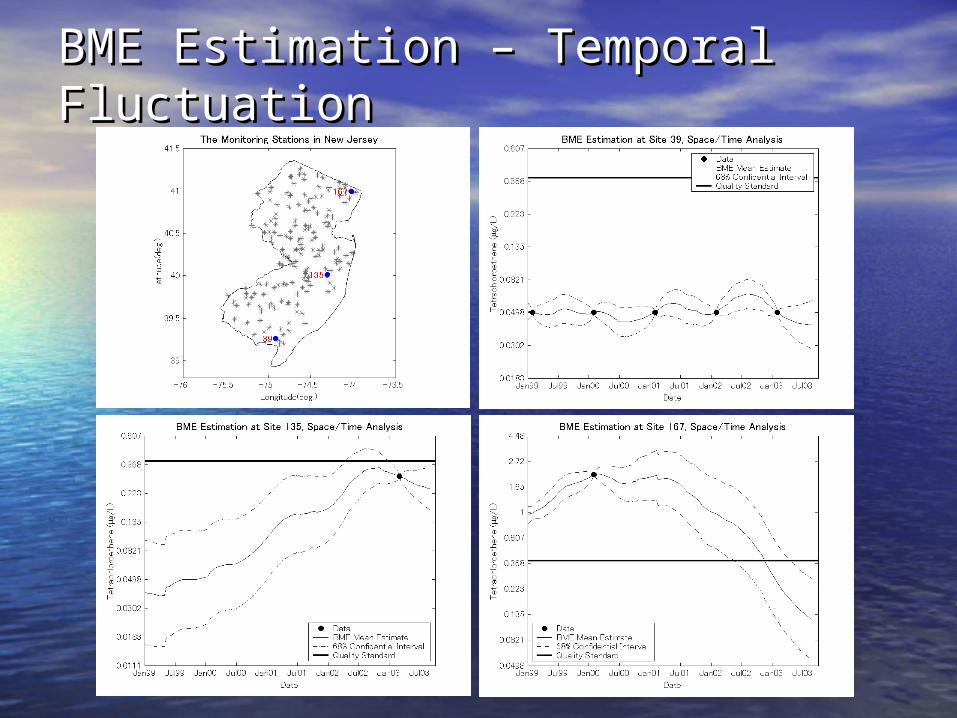
BME Estimation – Temporal BME Estimation – Temporal FluctuationFluctuation
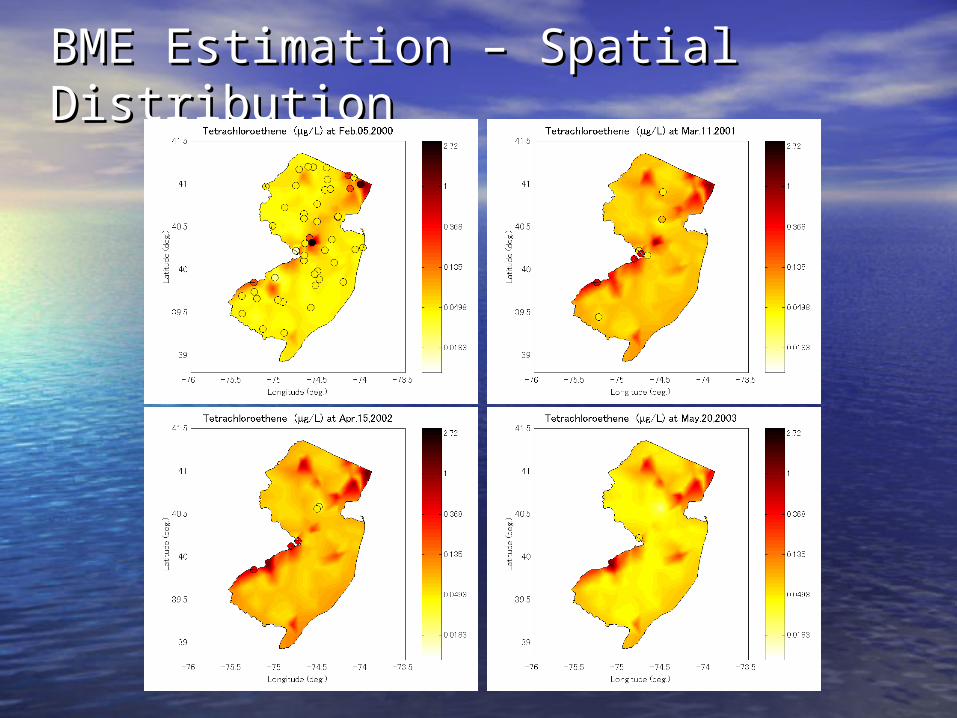
BME Estimation – Spatial BME Estimation – Spatial DistributionDistribution
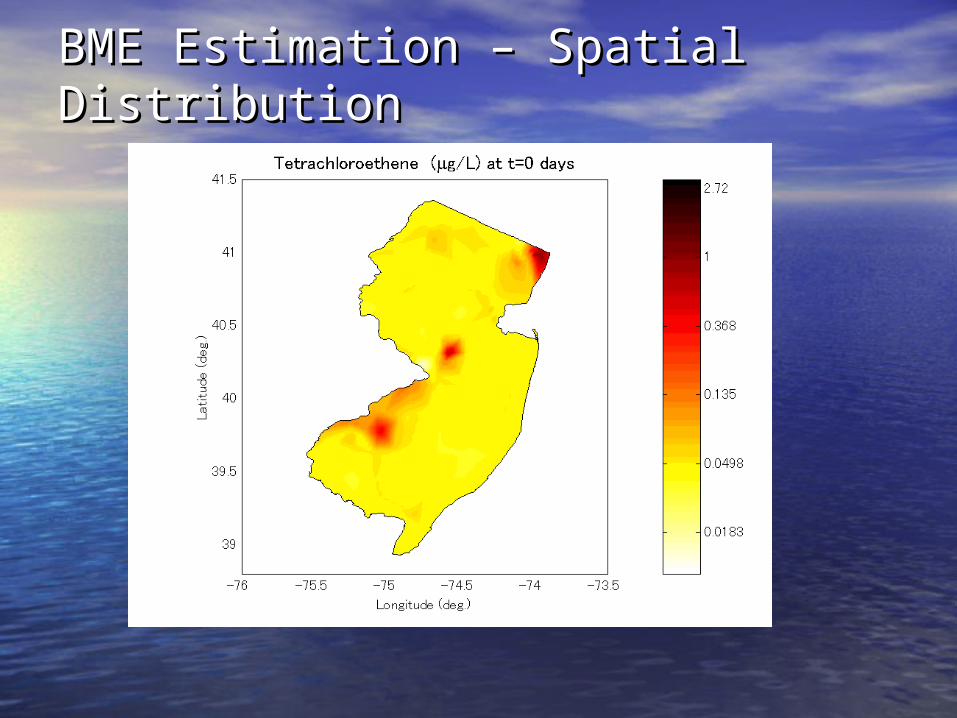
BME Estimation – Spatial BME Estimation – Spatial DistributionDistribution
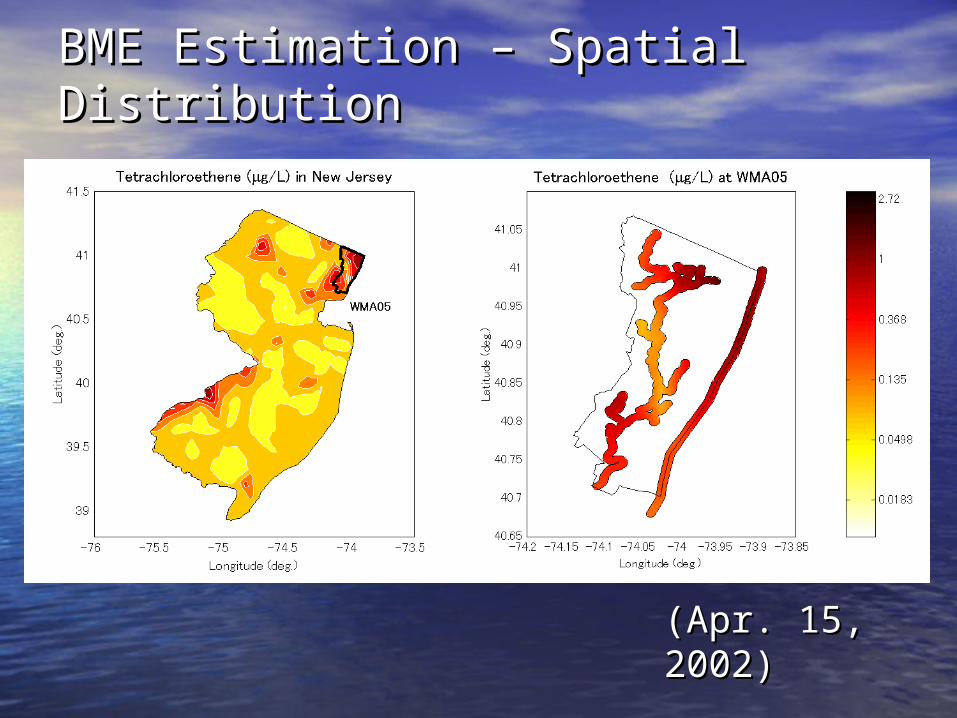
BME Estimation – Spatial BME Estimation – Spatial DistributionDistribution
(Apr. 15, (Apr. 15, 2002)2002)
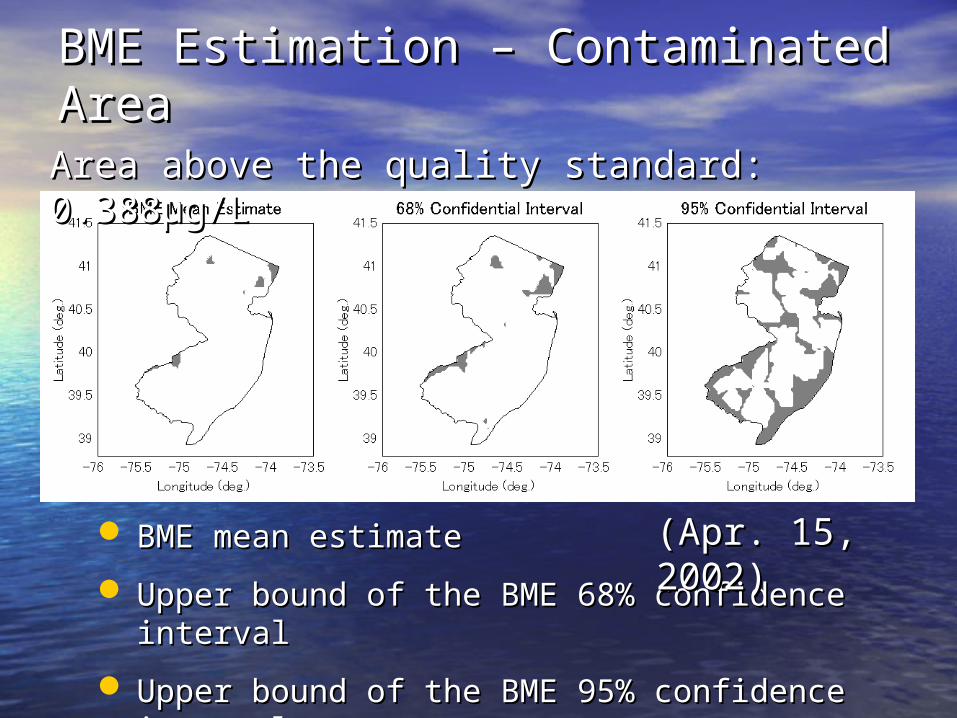
BME Estimation – Contaminated BME Estimation – Contaminated AreaAreaArea above the quality standard: 0.388μg/LArea above the quality standard: 0.388μg/L
BME mean estimateBME mean estimate
Upper bound of the BME 68% confidence Upper bound of the BME 68% confidence interval interval
Upper bound of the BME 95% confidence Upper bound of the BME 95% confidence intervalinterval
(Apr. 15, (Apr. 15, 2002)2002)
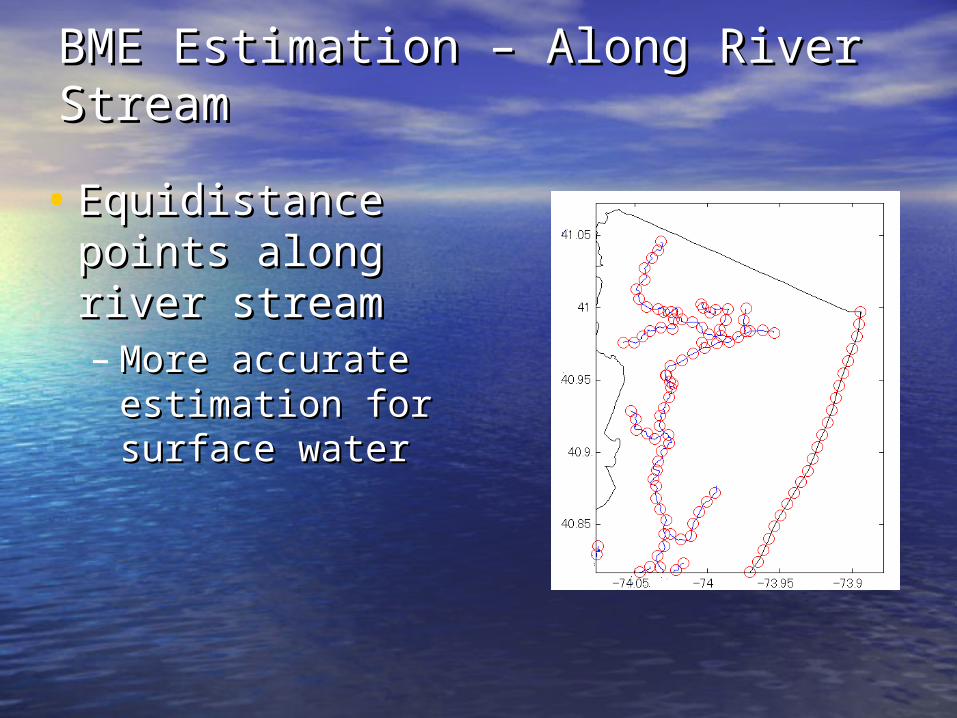
BME Estimation – Along River BME Estimation – Along River StreamStream
• Equidistance points Equidistance points along river streamalong river stream– More accurate More accurate
estimation for estimation for surface water surface water
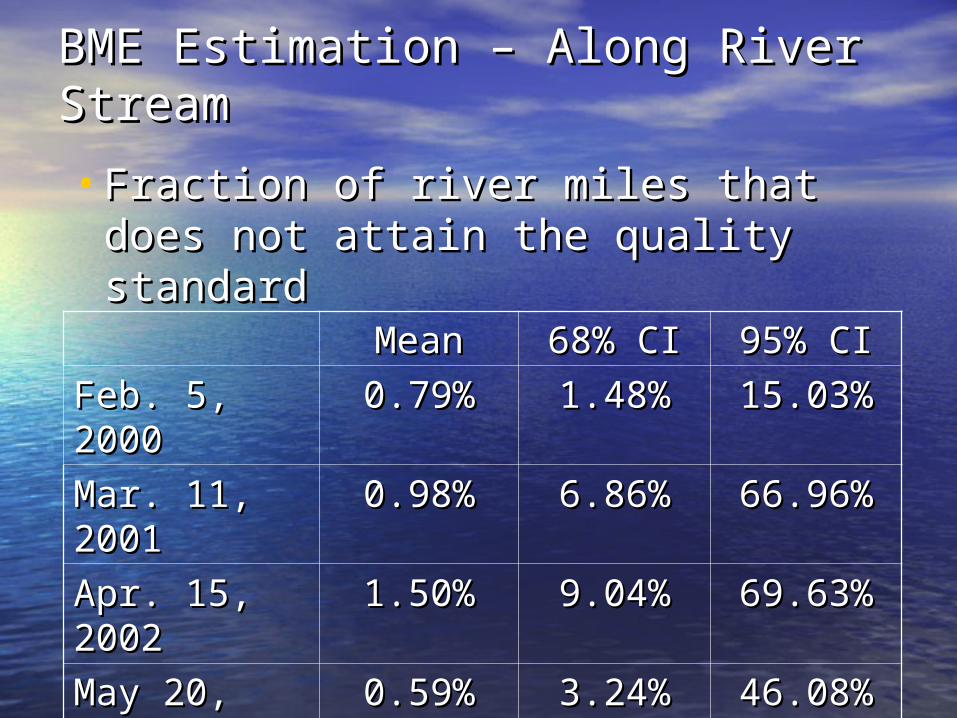
BME Estimation – Along River BME Estimation – Along River StreamStream
MeanMean 68% CI68% CI 95% 95% CICI
Feb. 5, 2000Feb. 5, 2000 0.79%0.79% 1.48%1.48% 15.03%15.03%Mar. 11, Mar. 11, 20012001
0.98%0.98% 6.86%6.86% 66.96%66.96%
Apr. 15, Apr. 15, 20022002
1.50%1.50% 9.04%9.04% 69.63%69.63%
May 20, May 20, 20032003
0.59%0.59% 3.24%3.24% 46.08%46.08%
• Fraction of river miles that does not Fraction of river miles that does not attain the quality standardattain the quality standard
New CriterionNew Criterion
Assessment CriterionAssessment Criterion
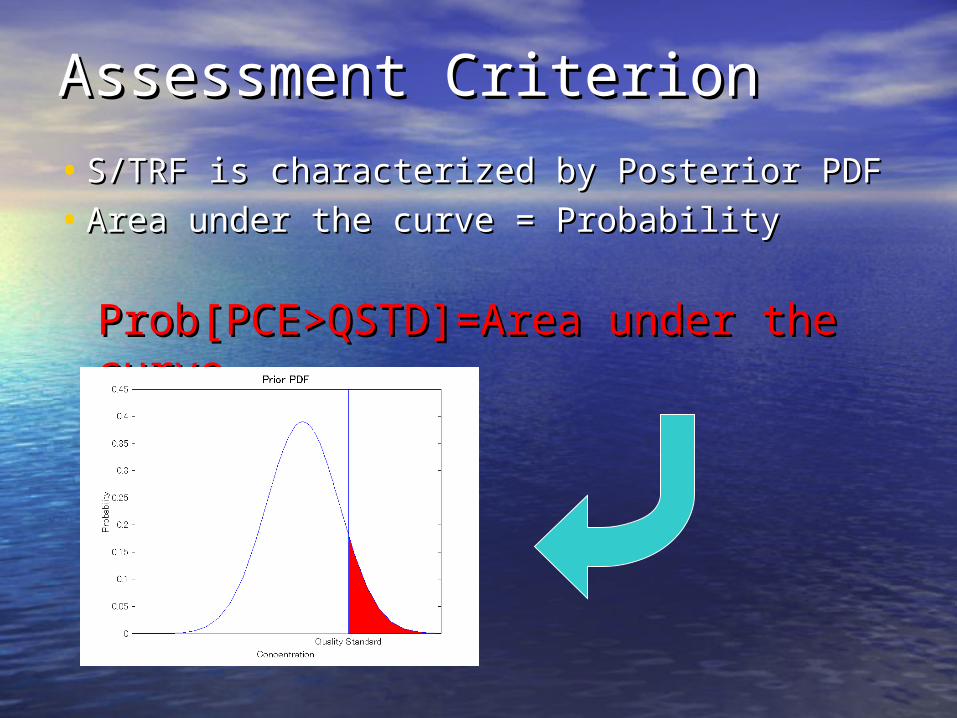
• S/TRF is characterized by Posterior PDFS/TRF is characterized by Posterior PDF
• Area under the curve = ProbabilityArea under the curve = Probability
Prob[PCE>QSTD]=Area under the Prob[PCE>QSTD]=Area under the curvecurve (QSTD<PCE<(QSTD<PCE<∞)∞)
Assessment CriterionAssessment Criterion
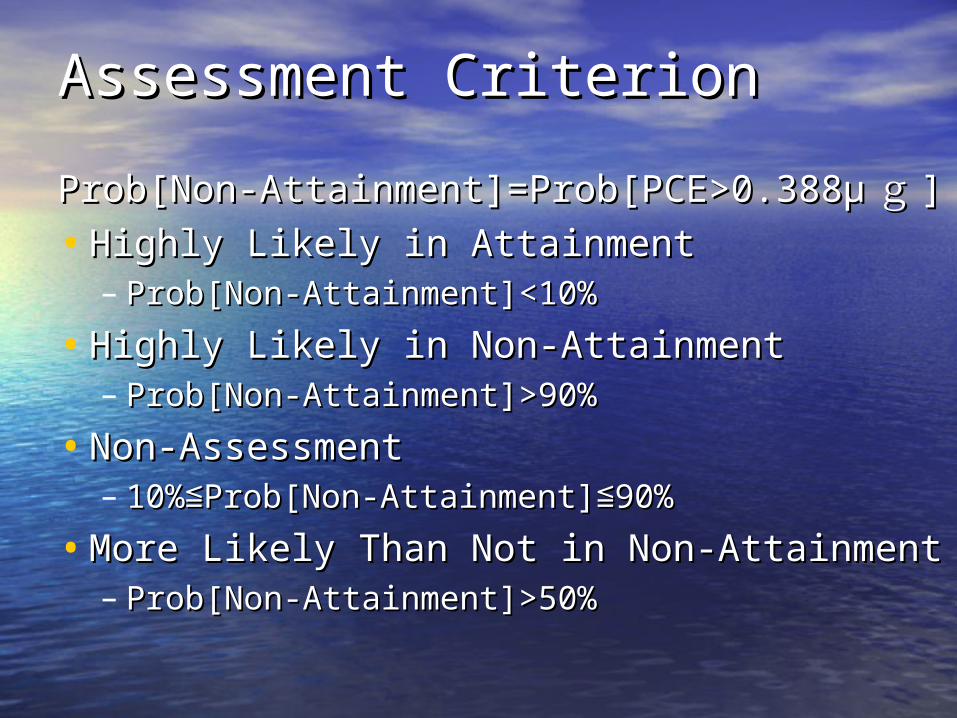
Prob[Non-Attainment]=Prob[PCE>0.388μProb[Non-Attainment]=Prob[PCE>0.388μgg ]]
• Highly Likely in AttainmentHighly Likely in Attainment– Prob[Non-Attainment]<10%Prob[Non-Attainment]<10%
• Highly Likely in Non-AttainmentHighly Likely in Non-Attainment– Prob[Non-Attainment]>90%Prob[Non-Attainment]>90%
• Non-AssessmentNon-Assessment– 10%10%≦≦Prob[Non-Attainment]Prob[Non-Attainment]≦90%≦90%
• More Likely Than Not in Non-AttainmentMore Likely Than Not in Non-Attainment– Prob[Non-Attainment]>50%Prob[Non-Attainment]>50%
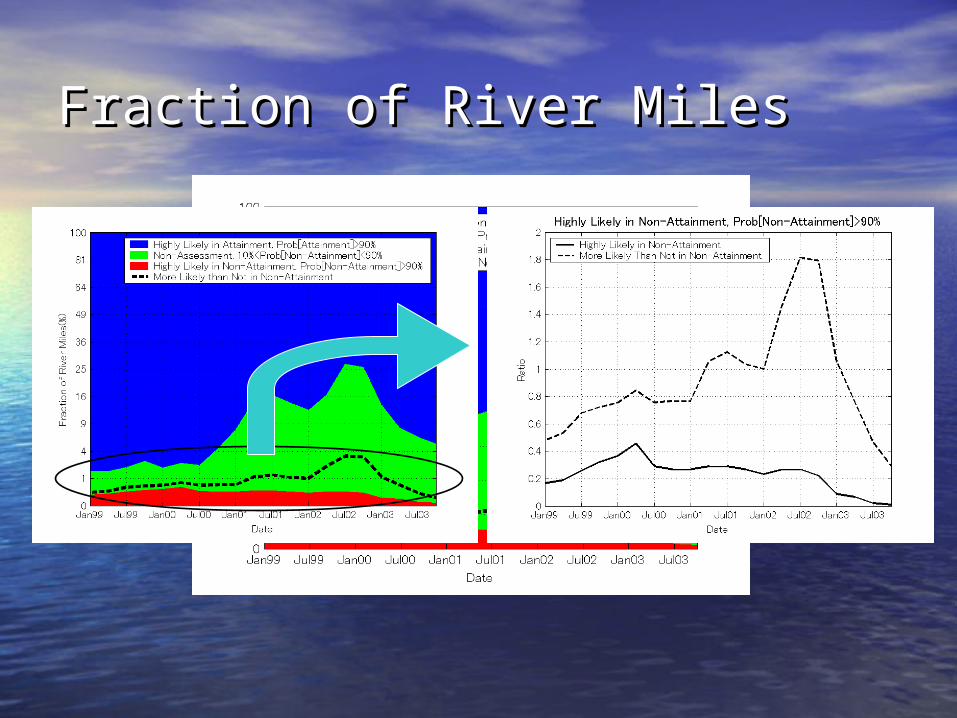
Fraction of River MilesFraction of River Miles
Identifying Contaminated Identifying Contaminated WMAsWMAs• The state of New Jersey is divided into The state of New Jersey is divided into
20 20 Watershed Management Area Watershed Management Area (WMA)(WMA)
• Assess which part of the state is Assess which part of the state is contaminatedcontaminated
• Contribution of each WMA to the Contribution of each WMA to the fraction of river miles assessed as fraction of river miles assessed as – Highly Likely in Non-AttainmentHighly Likely in Non-Attainment– More Likely Than Not in Non-AttainmentMore Likely Than Not in Non-Attainment
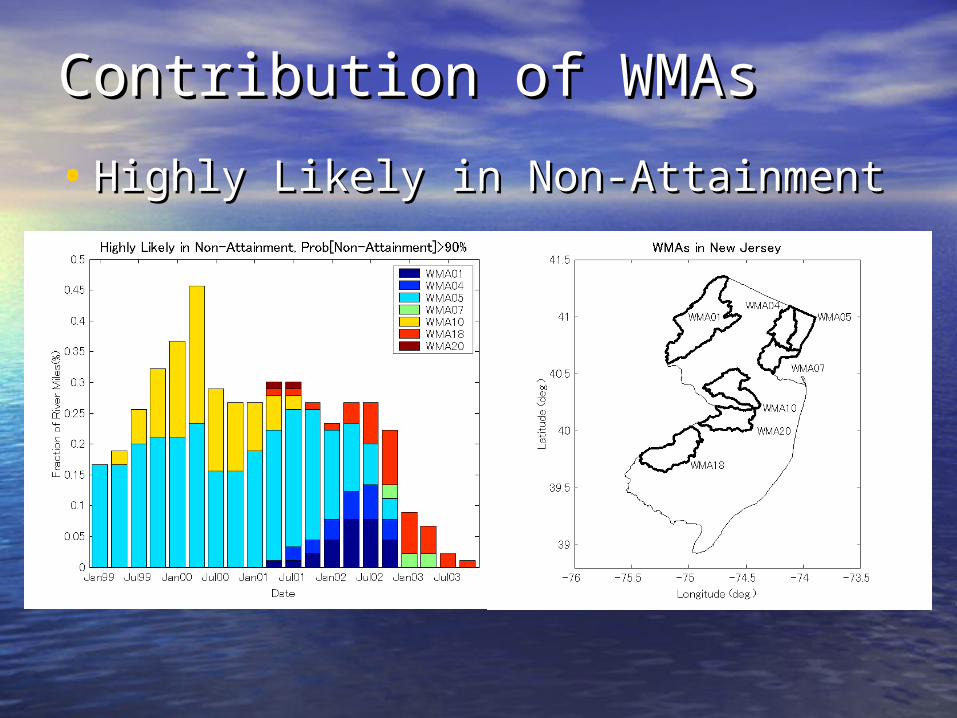
Contribution of WMAsContribution of WMAs
• Highly Likely in Non-AttainmentHighly Likely in Non-Attainment
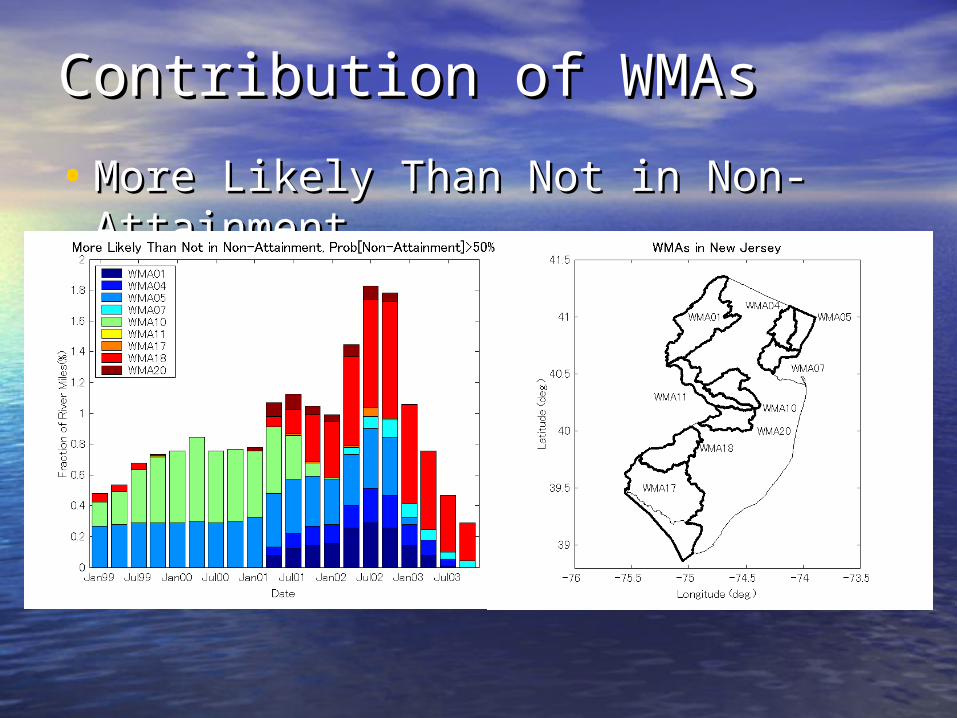
Contribution of WMAsContribution of WMAs
• More Likely Than Not in Non-More Likely Than Not in Non-AttainmentAttainment
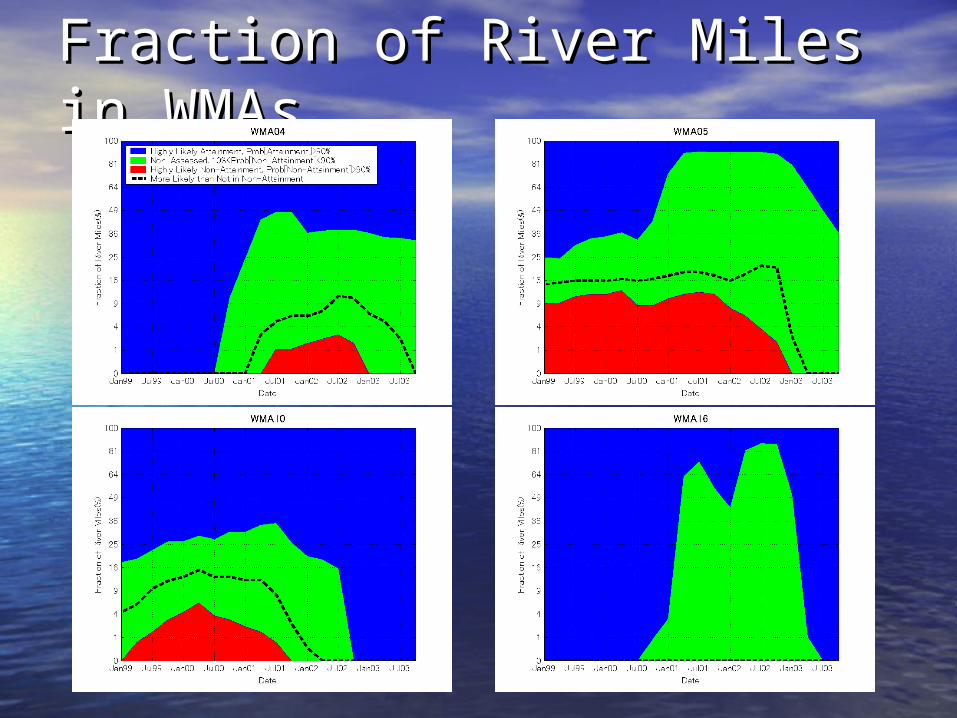
Fraction of River Miles in Fraction of River Miles in WMAsWMAs
Model ComparisonModel Comparison
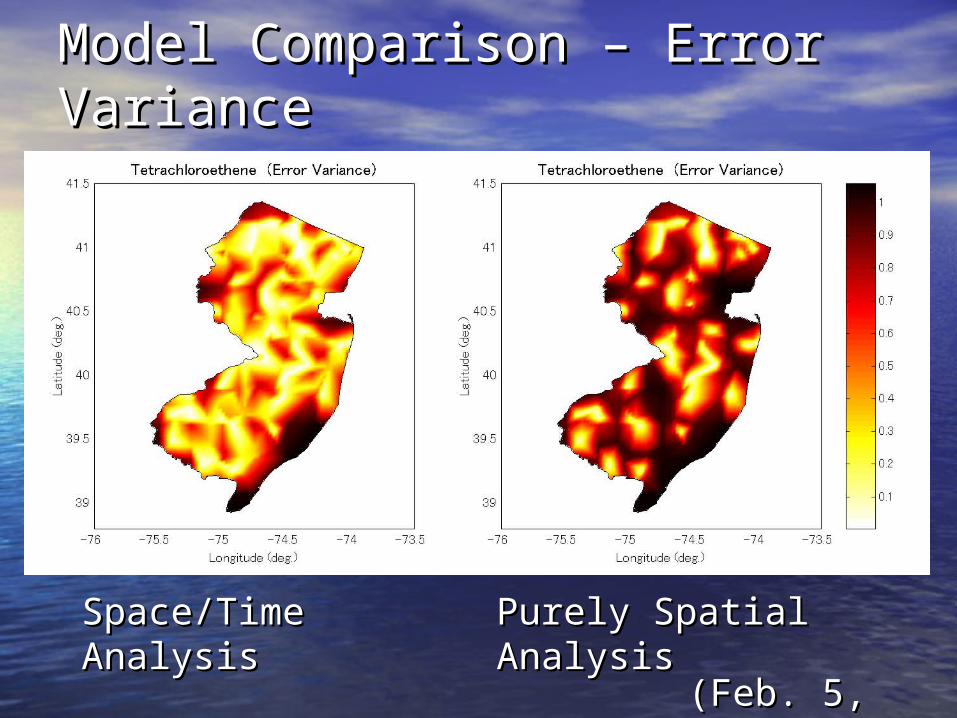
Model Comparison – Error Model Comparison – Error VarianceVariance
Space/Time Space/Time AnalysisAnalysis
Purely Spatial Purely Spatial AnalysisAnalysis
(Feb. 5, (Feb. 5, 2000)2000)
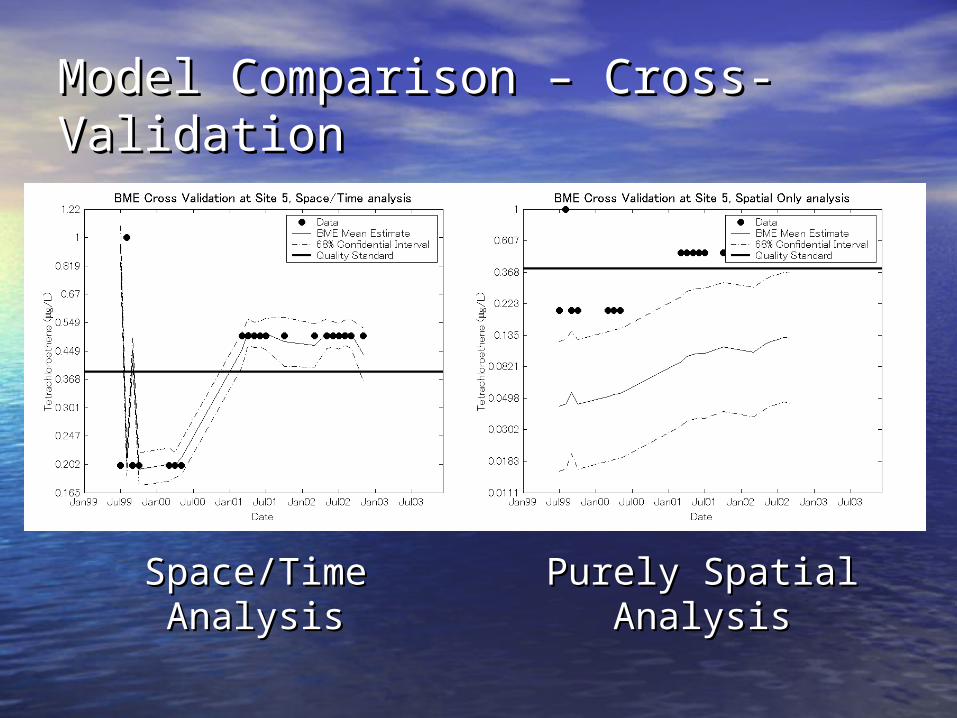
Model Comparison – Cross-Model Comparison – Cross-ValidationValidation
Space/Time Space/Time AnalysisAnalysis
Purely Spatial Purely Spatial AnalysisAnalysis
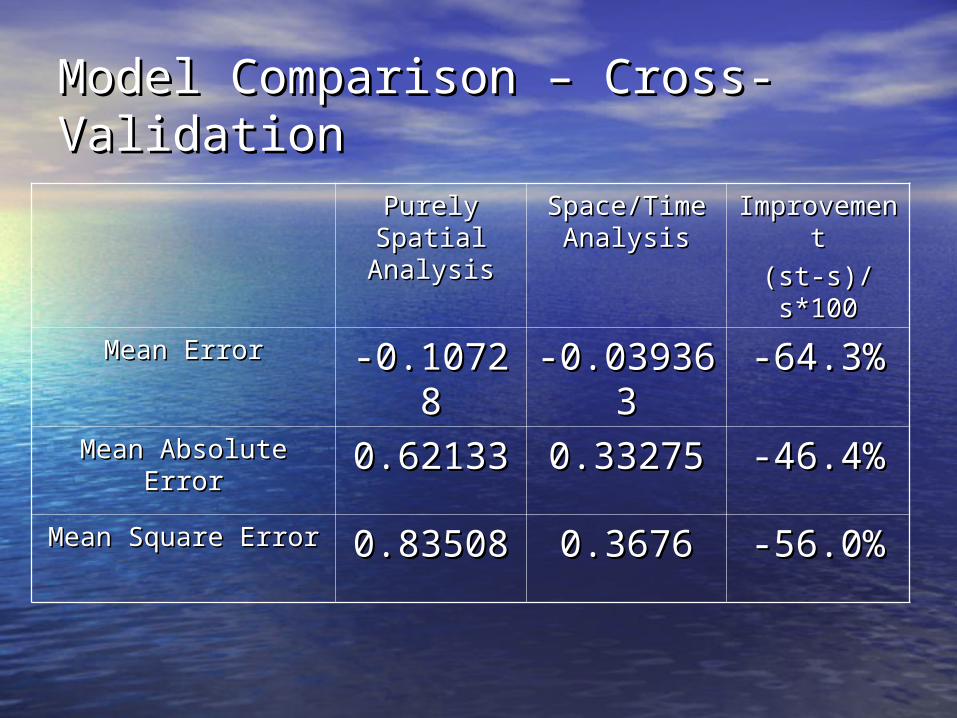
Model Comparison – Cross-Model Comparison – Cross-ValidationValidation
Purely Purely Spatial Spatial
AnalysisAnalysis
Space/Time Space/Time AnalysisAnalysis
ImprovemeImprovementnt
(st-s)/s*100(st-s)/s*100
Mean ErrorMean Error -0.10728-0.10728 -0.039363-0.039363 -64.3%-64.3%
Mean Absolute ErrorMean Absolute Error 0.621330.62133 0.332750.33275 -46.4%-46.4%
Mean Square ErrorMean Square Error 0.835080.83508 0.36760.3676 -56.0%-56.0%
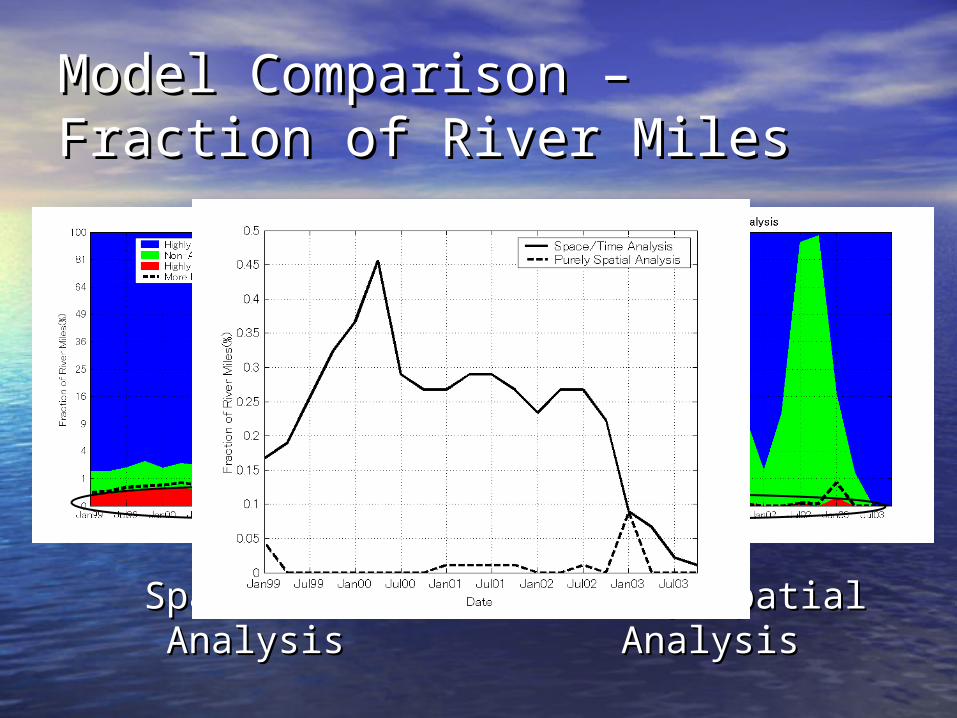
Model Comparison – Fraction of Model Comparison – Fraction of River MilesRiver Miles
Space/Time Space/Time AnalysisAnalysis
Purely Spatial Purely Spatial AnalysisAnalysis
ConclusionConclusion
ConclusionConclusion
• About Monitoring DataAbout Monitoring Data– Some high concentration values are Some high concentration values are
observed in New Jersey between 1999 to observed in New Jersey between 1999 to 2003.2003.
– Monitoring data shows high Space/Time Monitoring data shows high Space/Time variability in terms of location of the variability in terms of location of the monitoring point and monitoring valuemonitoring point and monitoring value
• Application of BME method of TGISApplication of BME method of TGIS– It enables us to take into account high It enables us to take into account high
space/time variability and to estimate space/time variability and to estimate the concentration all river reachesthe concentration all river reaches
ConclusionConclusion
• New CriterionNew Criterion– New criterion takes into account the New criterion takes into account the
uncertainty information of posterior PDFuncertainty information of posterior PDF– It is used to complementary criterion for It is used to complementary criterion for
the conventional onethe conventional one– Fraction of the river miles assessed as Fraction of the river miles assessed as
“Highly Likely in Non-Attainment” “Highly Likely in Non-Attainment” reached about 0.45% in 2000reached about 0.45% in 2000
– Fraction of the river miles assessed by Fraction of the river miles assessed by the conventional criterion (More Likely the conventional criterion (More Likely Than~) reached about 1.8% in 2002Than~) reached about 1.8% in 2002
ConclusionConclusion
• Model ComparisonModel Comparison– Space/Time analysis produces more Space/Time analysis produces more
accurate estimation than the conventional accurate estimation than the conventional purely spatial analysispurely spatial analysis
– Space/Time analysis produced very Space/Time analysis produced very different estimatedifferent estimate
– In purely spatial analysis, non-assessment In purely spatial analysis, non-assessment river miles reach about 99%river miles reach about 99%
• NJ DEP will be able to better assess NJ DEP will be able to better assess PCE concentration in all river reaches PCE concentration in all river reaches by using this method and new by using this method and new criterioncriterion