Embed Size (px)
Citation preview

University of Calgary
PRISM: University of Calgary's Digital Repository
Cumming School of Medicine Cumming School of Medicine Research & Publications
2009-04-01
Spatiotemporal integration of molecular and
anatomical data in virtual reality using semantic
mapping
Soh, Jung; Turinsky, Andrei L.; Trinh, Quang M.; Chang, Jasmine;
Sabhaney, Ajay; Dong, Xiaoli; Gordon, Paul M. K.; Janzen, Ryan P.
W.; Hau, David; Xia, Jianguo...
Dove Medical Press
Jung Soh, Andrei L Turinsky, Quang M Trinh, Jasmine Chang, Ajay Sabhaney, Xiaoli Dong, Paul MK
Gordon, Ryan PW Janzen, David Hau, Jianguo Xia, David S Wishart, and Christoph W Sensen.
"Spatiotemporal integration of molecular and anatomical data in virtual reality using semantic
mapping". Int J Nanomedicine. 2009; 4: 79–89.
http://hdl.handle.net/1880/47757
journal article
Downloaded from PRISM: https://prism.ucalgary.ca

© 2009 Soh et al, publisher and licensee Dove Medical Press Ltd. This is an Open Access article which permits unrestricted noncommercial use, provided the original work is properly cited.
International Journal of Nanomedicine 2009:4 79–89 79
O R I G I N A L R E S E A R C H
Spatiotemporal integration of molecular and anatomical data in virtual reality using semantic mapping
Jung Soh1
Andrei L Turinsky1
Quang M Trinh1
Jasmine Chang1
Ajay Sabhaney1
Xiaoli Dong1
Paul MK Gordon1
Ryan PW Janzen1
David Hau2
Jianguo Xia2
David S Wishart2
Christoph W Sensen1
1Sun Center of Excellence for Visual Genomics, University of Calgary, Calgary, AB, Canada; 2Department of Biological Sciences, University of Alberta, Edmonton, AB, Canada
Correspondence: Christoph W SensenSun Center of Excellence for Visual Genomics, HS 1150, Faculty of Medicine, 3330 Hospital Drive NW, Calgary, AB T2N 4N1, CanadaTel +1 403 220 4301Fax +1 403 210 9399Email [email protected]
Abstract: We have developed a computational framework for spatiotemporal integration of
molecular and anatomical datasets in a virtual reality environment. Using two case studies
involving gene expression data and pharmacokinetic data, respectively, we demonstrate how
existing knowledge bases for molecular data can be semantically mapped onto a standardized
anatomical context of human body. Our data mapping methodology uses ontological representa-
tions of heterogeneous biomedical datasets and an ontology reasoner to create complex semantic
descriptions of biomedical processes. This framework provides a means to systematically
combine an increasing amount of biomedical imaging and numerical data into spatiotempo-
rally coherent graphical representations. Our work enables medical researchers with different
expertise to simulate complex phenomena visually and to develop insights through the use of
shared data, thus paving the way for pathological inference, developmental pattern discovery
and biomedical hypothesis testing.
Keywords: anatomical atlas, gene expression, pharmacokinetics, biomedical data integration,
CAVEman, virtual reality in medicine
IntroductionBiomedical data produced while studying an organism using a number of lab techniques
often exist in a wide variety of data formats, which are often incompatible with each
other. The spatial granularity of such data can vary greatly, from the molecular level
(eg, models of elucidated molecular complexes) to the macroscopic level (eg, volu-
metric scans of tissues and organs).1 Existing integration techniques for multi-database
systems, data warehousing and federated database systems2 are often inadequate for
handling the abundance of biomedical data, because of the diversity, complexity, and
the ever-changing nature of the biomedical data sources. Most biomedical data sources,
such as genome sequences, proteomics data, metabolomic information, and anatomi-
cal data, are created and managed independently, presenting a number of challenges
when data from multiple sources need to be integrated in order to create a solution to
complex biomedical queries.
We have created an integrated ontology-based framework that enables semantic
interoperability between multiple autonomous biomedical data sources with differ-
ent semantics. Using two case studies, one involving gene expression data and the
other using pharmacokinetic data, we describe how the framework combines a set of
molecular data with an anatomical atlas of 3D human body. Our source of anatomi-
cal data is the CAVEman project (http://www.4dbioinformatics.ca), which provides
a standardized anatomical context for the exploration of biomedical datasets in a
virtual reality environment using an object-oriented model of the human body. The
anatomical component of CAVEman3 is based on the 3D digital atlas of the human

International Journal of Nanomedicine 2009:480
Soh et al
adult male anatomy developed by Kasterstener Inc, expanded
from its earlier version,4 which is structured according to the
nomenclature defi ned in Terminologia Anatomica.5,6
Integration frameworkThe goal of our integration framework is to enable the user
to visualize an integrated representation of biomedical data
coming from separate data sources (Figure 1). The platform
for this integration is the human body atlas of the CAVEman
system. The user queries a biomedical data source for a subset
of data to be visualized. The data query interface formats
the user query depending on the type of the data to retrieve
the desired instances of data. The data is then partitioned
into anatomical information (eg, body systems or organs)
and symbolic information (eg, numbers or positive/negative
indicators), which are separately mapped for subsequent
integration. The semantic mapper fi nds the mapping from the
components of anatomical information to standardized terms
or IDs adopted in the human body atlas. This process generates
a set of unique indices for the relevant three-dimensional (3D)
graphic models of the anatomical objects. The visual mapper
produces a graphic representation of the symbolic information
to be viewed, using selected visual features such as color,
shape, and texture. Symbolic information is converted to a
set of visually salient features that also represents the original
information unambiguously. In a virtual reality environment,
renderings of the visual features on the selected models of the
human body atlas are generated and presented to the user.
Semantic mapping is required because there are a wide vari-
ety of different anatomical terminologies used in biomedical
data sources.7 Nonstandard terms referring to organs and tissues
need to be mapped to standardized identifi ers for the anatomical
parts of interest. The actual methods of fi nding the semantic
mapping vary according to the type of data. Visual mapping
is employed to convert symbolic (ie, textual and numerical)
information to visual features that can be represented unam-
biguously in a virtual reality environment. The selection of
the specifi c visual features to be used is guided by the ranges
of values to represent and the methods used for normalizing
them. We achieve the integration in 3D space by combining
semantic mapping and visual mapping. If the data to be visual-
ized is time-dependent, spatiotemporal mapping is obtained by
repeatedly applying this spatial mapping framework over the
existing time points. We show the applicability of this generic
framework to integrating different types of data sources with
the human body anatomical atlas by using two case studies.
Case study 1: Gene expression data mappingThe problemOur fi rst case study is on integration of genomic and anatomi-
cal data, which involves visual mapping of gene expression
Biomedical data source
Data query interface
Human body atlas
Formatted query
Retrieved data
Semantic mapper
Anatomical info
Symbolic info
Standardizedterms/IDs
Virtual reality environment
3D tissue models
Visual features (color, shape, etc)
Query
Integrated visualization
User
Visual mapper
Figure 1 A computational framework for spatial integration of molecular and anatomical data. The anatomical information contained in the molecular data is semantically mapped to indices to a human body atlas. The textual or numerical information is mapped to visual features to be rendered on the retrieved 3D models of the human body in a virtual reality environment.
International Journal of Nanomedicine 2009:4 81
Spatiotemporal integration of molecular and anatomical data
data onto the anatomical context provided by the human
body atlas. The amount of gene expression information
generated from microarray experiments has been grow-
ing at an exponential rate.8 As those experiments employ
high-throughput methods, a tremendous amount of data
is created even from a single experiment. While statistical
analysis of gene expression data can reveal interesting pat-
terns, presenting the analysis results in a visually intuitive
way should also be an essential part of any gene expression
analysis program. The visual aspect of dataset presentation
is a signifi cant factor that provides intuitive insights into
patterns and leads to conclusions, which might be missed
when using only statistical assessments.
Most software for gene expression data analysis performs
unsupervised clustering to generate meaningful groups of
genes without bias of prior knowledge of gene function.
However, the high dimensionality of the datasets often
hinders the discovery of interesting patterns, clusters, and
outliers, making it diffi cult to classify genes into meaningful
groups automatically. Researchers often have to refer to many
kinds of specifi c genomic and anatomical information while
maintaining an overall view of the gene expression dataset,
in order to make sense of the analysis results even if they are
visually presented (eg, heat maps). Visual mapping of gene
expression values onto a highly relevant context, such as the
tissues themselves from which mRNA expression values
were experimentally measured, would provide the user a
coherent view of the vast array of the expression values. To
this end, a system for gene expression profi ling should be able
to integrate as much biologically and statistically relevant
information as possible and provide the user with a coherent
simultaneous view of such pieces of information.
The dataThe gene expression data has been retrieved from Genomics
Institute of the Novartis Research Foundation (GNF)
SymAtlas,9 a publicly available database of gene function
and structure (http://symatlas.gnf.org). In particular, we use
the Human U133A/GNF1H microarray dataset, which has
been pre-normalized using the GC content adjusted Robust
Multi-array Average (gcRMA) algorithm.10 The dataset
contains gene expression values for 44,760 probe sets in
79 human organs and tissues, obtained using Affymetrix probe
set identifi ers.11
MethodsWe applied the integration framework of Figure 1 to integrate
gene expression data with anatomical data. The implementations
of the semantic mapper and visual mapper are dictated by
the characteristics of the gene expression data we wanted to
visualize. Figure 2 illustrates the methods and the data fl ow
for gene expression data mapping, which is based on the
integration framework.
The semantic mapper implementation is based on ontolo-
gies, which formalize vocabularies defi ned by data own-
ers, their properties, and their semantic relationships and
restrictions within a knowledge domain.12,13 We use the Web
Ontology Language (OWL; http://www.w3.org/2004/owl) to
establish semantic relationships among entities from separate
biomedical datasets. For each data source, an OWL ontology
generator creates a local ontology that describes the data
source, and translates the data into instances of the newly cre-
ated ontology. The data owners then defi ne the relationships
between the elements of the newly generated ontology and
the semantic constructs from other related ontologies.
For our case study, we use two local ontologies in the
form of OWL resources. The fi rst one represents the GNF
SymAtlas dataset that lists the available genes, the tissues
in which their expression were measured, and the cor-
responding microarray spot intensity values (SymAtlas
ontology). This ontology contains 44,760 terms describ-
ing the genes, where each gene term contains 79 terms
describing spot intensity values from different organs and
tissues. The second one describes the tissue names used in
GNF SymAtlas and their mapping to the standard Termi-
nologia Anatomica terms (tissues ontology). This ontology
contains 79 terms, as it only describes the mapping from
the anatomical terms for the organs and tissues used in the
dataset to proper TA IDs. The mapping is sometimes not
straightforward, as the SymAtlas anatomical terms are not
always directly mappable to a TA term. Thus, the actual
mapping was done not by the providers of the SymAtlas
data, but by the researchers for this case study. We have
modifi ed the Pellet reasoning engine14 to validate semantic
relationships between ontologies automatically. The map-
ping from a gene ID to tissue names to TA IDs is automatic
due to the use of this ontology reasoner.
The semantic mapper starts with a search for the instances
the Affymetrix ID of a queried gene in the SymAtlas ontology.
Genes are referred to by the corresponding Affymetrix probe
set identifi ers: for example, 1007_s_at is the Affymetrix probe
set ID of a human epithelial discoidin domain-containing
receptor 1 precursor gene. The data available for this gene
is contained within the affymetrix:gene_1007_s_at element
of the SymAtlas ontology fi le. Once matching records are
found in the OWL-formatted data, the associated information,

International Journal of Nanomedicine 2009:482
Soh et al
including terms that describe the cell line or tissue in which
the expression was measured and the spot intensities of such
measurements as recorded in the SymAtlas data source, is
retrieved. The tissue ontology is used for relating tissue
names used in the SymAtlas data to the corresponding TA
identifi ers. For example, “Heart” in SymAtlas data is mapped
to the TA ID of “A12.1.00.001.”
The role of the visual mapper is to convert the retrieved
numerical gene expression values into visual features that can
be readily rendered on the human body atlas. We chose to use
color as the key visual feature because it can represent a vast
range of expression values. The gene expression values are
fi rst normalized with respect to a control or reference organ
that can be selected by the user. In the case study, any one
of the 79 organs can be chosen as the control organ. Thus an
expression value that is greater than that for the control organ
would be regarded as over-expressed. Using a neutral color
for the control organ (eg, white) the expression values for
all the other organs are color-mapped to show the strength
of the gene expression in the corresponding organs, relative
to the control organ. This provision is useful comparing the
relative expression levels of a gene in many different organs
simultaneously.
ResultsThe visualization result for the Affymetrix ID 1007_s_at is
shown in Figure 3. It clearly shows very high expression of
the gene in the amygdala and the colorectal adenocarcinoma
cell lines (mapped onto the 3D rectum model); relatively
high expression in olfactory bulbs, the pituitary gland and
the trachea; relatively low expression in cerebral peduncles,
kidneys, pancreas, pons and tongue tissues; and low expres-
sion in the heart and liver tissues. In contrast to the original
numerical dataset, which contains a rather overwhelming
amount of data (79 spot intensity values in different tissues
for each probe set), our 3D visualization gives the user an
immediate, easy-to-comprehend visual summary of the high-
lights of the body-wide expression patterns. With this type
of visualization, there is no need for the user to mentally link
a multitude of expression values to a collection of tissues in
which each value was measured from. The measuring con-
text and the magnitude of the expression values are clearly
Normalization
Gene expression values
Normalized expresssion values
Colors for organs
Color mappingVisual mapper
Semantic mapper
SymAtlasontology
Tissuesontology
Tissues & values
TA IDs for organs
Affymetrix gene ID
Ontology reasoner
Gene IDTissues TA IDs
Figure 2 Semantic mapping and visual mapping for integrated visualization of gene expression data for a queried gene. The semantic mapper maps anatomical terms to organ IDs in TA using the ontologies. The visual mapper normalizes gene expression values with respect to a control organ and converts them into color values to be used for rendering the organs.

International Journal of Nanomedicine 2009:4 83
Spatiotemporal integration of molecular and anatomical data
represented as the anatomical organs displayed and their
color, respectively. This helps to alert the human explorer
visually to the presence of “interesting” patterns in the data,
which can be explored further using the original dataset.
Case study 2: Pharmacokinetic data integrationThe problemOur second case study involves a knowledge base provided
by the Human Metabolome project,15 in particular its
DrugBank component.16 The goal of the case study is to
visually model the absorption, distribution, metabolism,
and excretion (ADME) of drugs within the anatomical
context. Almost every FDA approved drug must go through
rigorous pharmacokinetic analysis, wherein the drug’s
ADME is determined through a combination of animal
experiments and computer modeling. Therefore, creating
a mechanism for accurate ADME models and simulations
has the potential to contribute to the drug discovery and
design processes.
One of the diffi culties in pharmaceutical metabolomics
is that there is a signifi cant disconnect between the experi-
mental data (which is often visually represented) and the
pharmacokinetic models (which are nonvisual). In particular,
pharmacokinetic modeling is largely done using simplifi ed
Figure 3 3D visualization of body-wide gene expression patterns for the Affymetrix probe ID 1007_s_at, shown for 12 selected organs. Darker shades of red represent higher expression values.

International Journal of Nanomedicine 2009:484
Soh et al
compartmental models (boxes with different partition
coeffi cients), based on classical differential equations with
simplifi ed boundary conditions. This approach may appeal to
mathematicians but not necessarily to biologists or medical
doctors who are involved in drug development and testing.
Likewise, classical methods mostly ignore the importance
of visualization as an aid to understanding pharmacokinetic
or metabolic processes. Spatiotemporal mapping of pharma-
cokinetic events onto their proper anatomical context will
allow drug developers to: (i) share their results with a broader
audience; (ii) assist in teaching pharmacokinetic principles to
students and clinicians; (iii) permit real-time exploration and
testing of drug ADME; and (iv) better integrate experimental
data with theoretical calculations.
The dataThe data was generated using a Java program for ADME
modeling, called ADME-Modeler, developed in the
Human Metabolome project (http://metabolomics.ca). The
software interactively requests the following information
from the user: (i) the chemical compounds involved in the
ADME reactions; (ii) route of administration (enteral/oral
or parenteral/intravenous), volume of distribution, and
bioavailability; (iii) the rate constants of absorption, dis-
tribution, conversion and elimination for each compound;
and (iv) additional information such as time intervals and
dosage regimen. The program then calculates the temporal
distribution, concentration and location of each of the drugs
and drug metabolites using either the fi rst-order elimination
or the Michaelis–Menten kinetics17 as selected by the user.
To calculate compound concentrations in different organs,
the human body is conceptually divided into three com-
partments: (i) the gastric-intestinal compartment including
the stomach and the intestine; (ii) the central compartment
including highly perfused organs such as the cardiovascular
system, liver, kidney, brain, spleen, and lungs; and (iii) the
peripheral compartment including cerebrospinal fl uid, bone,
muscle, and adipose tissue.
ADME and pharmacokinetic information on several drugs
were obtained: acetaminophen (Tylenol), acetylsalicylic acid
(Aspirin), atorvastatin (Lipitor), fl uoxetin (Prozac), and silde-
nafi l (Viagra). The information was compiled from multiple
sources after an extensive literature search. For example,
the search revealed that ingested acetylsalicylic acid (ASA)
is converted to salicylic acid (SA) within the stomach and
the circulation system.18 SA is then either renally excreted
or fi rst converted to one of four known derivatives (salicyl
acyl glucuronide, gentisic acid, salicyl phenolic glucuronide,
or salicyluric acid) before subsequent renal excretion.19,20
The rates of absorption of ASA and SA from the stomach,
the rates of conversion from one compound to another, and
the rates of excretion of the various ASA derivatives are
shown in Figure 4, which were all identifi ed from the relevant
literature.18,21–23
The constants and modeling formulas, such as those indi-
cated for ASA, were used to automatically produce the con-
centration data for the compounds in various compartments
over time, resulting in a time series for each compound and
each compartment affected. Thus the ADME data for a drug
takes the form of a two-dimensional matrix of concentrations
(eg, in milligrams), where each row corresponds to a distinct
time instant and each column represents a compartment in
which the concentrations were measured.
MethodsThe integration of pharmacokinetic data with anatomical
data is accomplished by applying the integration framework
shown in Figure 1. The two core tasks of the framework that
need to be implemented in a data-dependent way are the
semantic mapping and the visual mapping. The workings of
these two components are illustrated in Figure 5.
The anatomical information contained in the ADME
data of a drug is given in terms of compartments in which
the metabolite measurements were taken, and therefore is
different from Terminologia Anatomica (TA), on which the
organization of the human body atlas is based. These terms
can be retrieved from the header of the ADME data fi le and
fed to a compartment-to-organ mapper that maps each com-
partment to corresponding standardized organ names and TA
identifi ers. For example, the ‘Blood’ compartment will be
mapped to the organ ‘A12.0.00.000’ (cardiovascular system)
in TA, which determines that the chemical compounds
located in the blood will be shown on the cardiovascular sys-
tem of the atlas. The use of ontological representation was not
needed for this mapping, as the number of terms involved did
not warrant the added complexity. However, as the number
of compartments and the number of corresponding organs
grow, it will eventually be necessary to adopt ontologies.
The visual mapper needs to produce visual features for
expressing different chemical compounds and their concen-
trations contained in the ADME data. We chose to use colors
and their intensities to represent the compounds and their
concentrations. First, unique base colors (eg, red, green, or
blue) are assigned to each chemical compound (or a small
group of a few compounds if their behaviors are similar)
appearing in the data. Then the color of an organ at a given

International Journal of Nanomedicine 2009:4 85
Spatiotemporal integration of molecular and anatomical data
Acetylsalicylic acid (ASA)
1st order
Salicyl acyl glucuronide
Gentisic acid
Salicyluric acid
Salicyl phenolic glucuronide
1st order
1st order k = 0.0071hr–1
k = 0.0023hr–1
1st order
Michaelis-Menten Vmax = 60.3 mg/h Km = 338 mg/L
1st order
1st order
1st order
Michaelis-Menten Vmax = 32.3 mg/h Km = 629 mg/L
1st order
1st order2.60 < k < 9.24 hr–1
68% of ASA
1st order 2.60 < k < 9.24 hr 1
32% of ASA
Salicylic acid (SA)
1st order
Alimentary Cardiovascular Urinary
k = 3.00 hr–1
k = 0.50 hr–1
k = 1.40 hr–1
k = 0.0075 hr–1
k = 2.08 hr–1 k = 2.08 hr–1
k = 0.69 hr–1
–
Figure 4 The ADME fl ow of acetylsalicylic acid in three anatomical systems, corresponding to the initial ingestion, blood concentration, and urine concentration. Either the fi rst order elimination or the Michaelis-Menten kinetics with the specifi ed parameters is used for modeling changes over time in chemical compounds themselves, in concentration, and in affected anatomical systems.
Color mapping
ADME data
time
(compound, organ) TA IDs for organs
Concentration values
Colors for (compound, organ)
Colors for organs
Term mapping
Color mixing per organ
Semantic mapper
Visual mapper
Figure 5 Semantic mapping and visual mapping for integrated visualization of pharmacokinetic data for a single time point. The ADME data is given as a matrix where each cell represents the numerical concentration value of a chemical compound existing in an organ at a time instant. The semantic mapper maps compartments to organ IDs in TA. The visual mapper converts each concentration value to a color value and combines them into a mixed color for each organ.

International Journal of Nanomedicine 2009:486
Soh et al
time is calculated by scaling the base color of the compound
existing in that organ at that time instant by its relative
concentration, such that darker colors stand for heavier con-
centrations. If multiple compounds exist simultaneously in an
organ at a certain time point, the colors depicting the different
compounds are mixed to indicate the mixture of compounds.
This process effectively converts a numerical concentration
value of a compound into a unique color value representing
the compound and its concentration as well.
ResultsThe semantic mapper and visual mapper illustrated in Figure 5
accomplish the core part of the pharmacokinetic data mapping.
The mapping results are visualized within the virtual reality
environment offered by the CAVEman system. After the
desired anatomical systems are loaded into the visualization
scene, the user loads the text fi le that contains the ADME data of
a particular drug, which triggers the series of mapping processes
required for visual integration of the data. Figure 6 illustrates
the interface for the loading of acetaminophen (Tylenol) ADME
data into the visualization system. This particular data has
11 (compound, organ) pairs after compartment-to-organ map-
ping was performed, over 1001 discrete time instants, resulting
in a total of 11,011 concentrations to visualize. Currently loaded
anatomical models are displayed in the left panel according to
the TA hierarchy, with those affected by the drug shown in
red. By selecting an anatomical organ or system, the user can
see the list of the chemical compounds that exist in the model
at some time points on the right. The bottom panel controls
the visualization parameters such as the base colors to assign
to compounds and the time steps for playing the animation of
the ADME process.
The spatiotemporal visualization shows the dynamically
changing mixture of colors in the selected body compartments
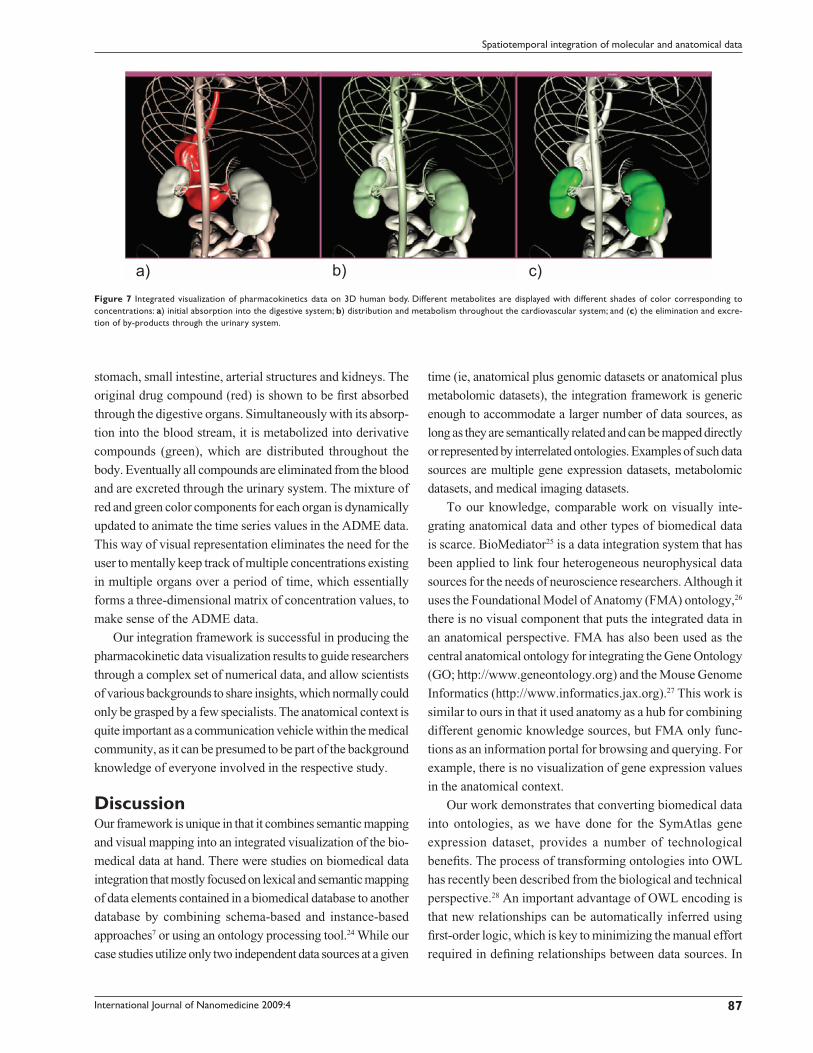
to illustrate the ADME process. Figure 7 shows three typical
snapshots of the ADME visualization using 3D models of the
Figure 6 Graphical user interface for the visualization of the acetaminophen ADME process.
International Journal of Nanomedicine 2009:4 87
Spatiotemporal integration of molecular and anatomical data
stomach, small intestine, arterial structures and kidneys. The
original drug compound (red) is shown to be fi rst absorbed
through the digestive organs. Simultaneously with its absorp-
tion into the blood stream, it is metabolized into derivative
compounds (green), which are distributed throughout the
body. Eventually all compounds are eliminated from the blood
and are excreted through the urinary system. The mixture of
red and green color components for each organ is dynamically
updated to animate the time series values in the ADME data.
This way of visual representation eliminates the need for the
user to mentally keep track of multiple concentrations existing
in multiple organs over a period of time, which essentially
forms a three-dimensional matrix of concentration values, to
make sense of the ADME data.
Our integration framework is successful in producing the
pharmacokinetic data visualization results to guide researchers
through a complex set of numerical data, and allow scientists
of various backgrounds to share insights, which normally could
only be grasped by a few specialists. The anatomical context is
quite important as a communication vehicle within the medical
community, as it can be presumed to be part of the background
knowledge of everyone involved in the respective study.
DiscussionOur framework is unique in that it combines semantic mapping
and visual mapping into an integrated visualization of the bio-
medical data at hand. There were studies on biomedical data
integration that mostly focused on lexical and semantic mapping
of data elements contained in a biomedical database to another
database by combining schema-based and instance-based
approaches7 or using an ontology processing tool.24 While our
case studies utilize only two independent data sources at a given
time (ie, anatomical plus genomic datasets or anatomical plus
metabolomic datasets), the integration framework is generic
enough to accommodate a larger number of data sources, as
long as they are semantically related and can be mapped directly
or represented by interrelated ontologies. Examples of such data
sources are multiple gene expression datasets, metabolomic
datasets, and medical imaging datasets.
To our knowledge, comparable work on visually inte-
grating anatomical data and other types of biomedical data
is scarce. BioMediator25 is a data integration system that has
been applied to link four heterogeneous neurophysical data
sources for the needs of neuroscience researchers. Although it
uses the Foundational Model of Anatomy (FMA) ontology,26
there is no visual component that puts the integrated data in
an anatomical perspective. FMA has also been used as the
central anatomical ontology for integrating the Gene Ontology
(GO; http://www.geneontology.org) and the Mouse Genome
Informatics (http://www.informatics.jax.org).27 This work is
similar to ours in that it used anatomy as a hub for combining
different genomic knowledge sources, but FMA only func-
tions as an information portal for browsing and querying. For
example, there is no visualization of gene expression values
in the anatomical context.
Our work demonstrates that converting biomedical data
into ontologies, as we have done for the SymAtlas gene
expression dataset, provides a number of technological
benefi ts. The process of transforming ontologies into OWL
has recently been described from the biological and technical
perspective.28 An important advantage of OWL encoding is
that new relationships can be automatically inferred using
fi rst-order logic, which is key to minimizing the manual effort
required in defi ning relationships between data sources. In
a) b) c)Figure 7 Integrated visualization of pharmacokinetics data on 3D human body. Different metabolites are displayed with different shades of color corresponding to concentrations: a) initial absorption into the digestive system; b) distribution and metabolism throughout the cardiovascular system; and (c) the elimination and excre-tion of by-products through the urinary system.

International Journal of Nanomedicine 2009:488
Soh et al
contrast, traditional data integration efforts would create
either a global schema to which all data providers map their
data or fi eld mappings between each pair of databases. The
former diminishes data-provider independence and limits the
view of the underlying data, whereas the latter introduces
combinatorial complexity and requires strict lexical identity
among the data sources to enable queries. Our ontology-based
semantic mapping facilitates modular architecture in which
data sources can be completely independent.
The semantic mapping aspect of the integration frame-
work deals mostly with anatomical information, whereas
the visual mapping module converts the remaining symbolic
information into a visually meaningful form. The choice
of visual features is of critical importance, as the features
should have suffi cient dimensionalities to be able to repre-
sent the variability in the data values present in the sym-
bolic information, and yet they should be easily rendered
in the visualization environment. We chose color as the
main visual feature in both case studies because it has at
least two visually (as opposed to colorimetrically) distinct
dimensions: the hue and shade. For example, this choice
has helped us to successfully render all possible mixtures
of multiple chemical compound concentrations by using a
hue to represent a compound itself and different shades to
represent concentrations.
The importance of knowledge integration has been widely
understood in the narrower area of bioinformatics, which
focuses predominantly on molecular studies.29,30 The broader
fi eld of nanomedicine presents an even more challenging area
for data integration: indeed, complex biomedical phenomena
involve diverse and seemingly unrelated data from several
domains of knowledge, each of which has already spawned
a variety of data formats and vastly different scales, from a
nanoscale to a macroscale. The emphasis on visualization
as a data integration platform leads to natural development
of a practical data integration framework where the nature
of semantic mapping as well as visual mapping is defi ned
by the characteristics of the biomedical data sources to be
integrated.
The importance of our framework lies in presenting a
methodological template for the visual spatiotemporal model-
ing of molecular events in their proper anatomical context.
The two case studies demonstrate that this framework, based
on mapping of data semantics and judicious use of visual
features, enables spatiotemporal visualization of complex
biomedical phenomena. 3D graphical representation provides
users with high-level models that are self-explanatory and
lead to further investigation into the raw data. Visualization
of biomedical data in a proper context can help researchers
to obtain a comprehensive view of the massive complexity
of multiple incompatible data types and focus instead on
developing a highly intuitive understanding of the studied
phenomena. Information visualization has already become
one of the main techniques in bioinformatics, and we antici-
pate that its importance will only increase.
ConclusionsWe have described a systematic framework for bioinformatics
data integration based on integration of semantic mapping
and visual mapping results. We use ontologies to seman-
tically (as opposed to lexically) resolve the ambiguities
stemming from different sets of uncontrolled terminologies.
Semantic mapping is accomplished by either using a simple
term mapper or an ontology reasoning engine to process
semantic relationships contained in the ontologies. Visual
mapping transforms the textual or numerical data into visu-
ally distinct and intuitive representations that can readily
be shown in our virtual reality environment. The integrated
framework provides users with an effective way to exploit,
analyze, and interact with their data, as well as to potentially
embed other data analysis tools.
This work is part of the existing CAVEman Human
Body project, which uses immersive virtual reality visualiza-
tion and animation to represent biomedical data of varying
granularity, including spatiotemporal processes. The 3D data
visualization component of the integration framework allows
researchers to load, view, and interact with data objects
ranges from molecular complexes to 3D atlases of different
organisms. As a result of semantic and visual data integration,
users can take advantage of the CAVEman capabilities to
explore the related biological data from different data sources
across different organisms in an integrated visual environ-
ment and perhaps generate new biological insights.
AcknowledgmentsThis work has been supported by Genome Canada through
Genome Alberta; the National Research Council of Canada’s
Industrial Research Assistance Program; the Alberta Science
and Research Authority; Western Economic Diversifi cation;
the Government of Canada and the Government of Alberta
through the Western Economic Partnership Agreement;
the iCORE/Sun Microsystems Industrial Research Chair
program; the Alberta Network for Proteomics Innovation;
and the Canada Foundation for Innovation. J. Xia is supported
by an Ingenuity PhD Student Scholarship from the Alberta
Ingenuity Fund.

International Journal of Nanomedicine 2009:4 89
Spatiotemporal integration of molecular and anatomical data
References 1. Turinsky AL, Sensen CW. On the way to building an integrated
computational environment for the study of developmental patterns and genetic diseases. Int J Nanomedicine. 2006;1:89–96.
2. Batini C, Lenzerini M, Navathe SB. A comparative analysis of methodologies for database schema integration. ACM Comput Surv. 1986;18:323–364.
3. Turinsky AL, Fanea E, Trinh Q, et al. CAVEman: standardized anatomi-cal context for biomedical data mapping. Anat Sci Ed. 2008;1:10–18.
4. Lajeunesse D, Edwards C, Grosenick B. Realism: a study in human structural anatomy. Red Deer: Kasterstener Publications Inc; 2003.
5. Federative Committee on Anatomical Technology. Terminologia Anatomica – international anatomical terminology. Stuttgart, New York: Thieme; 1998.
6. Whitmore I. Terminologia Anatomica: new terminology for the new anatomist. Anat Rec. 1999;257:50–53.
7. Mougin F, Burgun A, Bodenreider O. Mapping data elements to terminological resources for integrating biomedical data sources. BMC Bioinformatics. 2006;7:S6.
8. Barrett T, Troup DB, Wilhite SE, et al. NCBI GEO: Mining tens of millions of expression profi les – database and tools update. Nucleic Acids Res. 2007;35:D760–D765.
9. Su AI, Wiltshire T, Batalov S, et al. A gene atlas of the mouse and human protein-encoding transcriptomes. Proc Natl Acad Sci U S A. 2004;101:6062–6067.
10. Wu Z, Irizarry RA, Gentleman R, et al. A model-based background adjustment for oligonucleotide expression arrays. J Am Stat Assoc. 2004;99:909–917.
11. Lockhart DJ, Dong H, Byrne MC, et al. Expression monitoring by hybridization to high-density oligonucleotide arrays. Nat Biotechnol. 1996;14:1675–1680.
12. Gruber TR. A translation approach to portable ontology specifi cations. Knowl Acquis. 1993;5:199–220.
13. Bodenreider O, Stevens R. Bio-ontologies: Current trends and future directions. Brief Bioinform. 2006;7:256–274.
14. Sirin E, Parsia B, Grau BC, et al. Pellet: A practical OWL-DL reasoner. J Web Semantics. 2007;5:51–53.
15. Wishart DS, Tzur D, Knox C, et al. HMDB: the Human Metabolome Database. Nucleic Acids Res. 2007;35:D521–D526.
16. Wishart DS, Knox C, Guo AC, et al. DrugBank: a knowledgebase for drugs, drug actions and drug targets. Nucleic Acids Res. 2008;36:D901–D906.
17. Gibaldi M, Perrier D, editors. Pharmacokinetics. New York: Informa Healthcare; 1982.
18. Rowland M, Riegelman S, Harris PA, et al. Absorption kinetics of aspirin in man following oral administration of an aqueous solution. J Pharm Sci. 1972;16:379–385.
19. Tsuchiya T, Levy G. Biotransformation of salicylic acid and its acyl and phenolic glucuronides in man. J Pharm Sci. 1972;61:800–801.
20. Liu J, Smith PC. Direct analysis of salicylic acid, salicyl acyl gluc-uronide, salicyluric acid and gentisic acid in human plasma and urine by high-performance liquid chromatography. J Chromatogr. 1996;675:61–70.
21. Levy G, Tsuchiya T, Amsel LP. Limited capacity for salicyl phenolic glucuronide formation and its effect on the kinetics of salicylate elimi-nation in man. Clin Pharmacol Ther. 1972;13:258–268.
22. Bochner F, Graham GG, Cham BE, et al. Salicylate metabolite kinetics after several salicylates. Clin Pharmacol Ther. 1981;30:266–275.
23. Needs CJ, Brooks PM. Clinical pharmacokinetics of the salicylates. Clin Pharmacokinet. 1985;10:164–177.
24. Narayanan PS, O’Connor MJ, Das AK. Ontology-driven mapping of temporal data in biomedical databases. AMIA Annu Symp Proc. 2006;1045.
25. Wang K, Tarczy-Hornoch P, Shaker R, Mork P, Brinkley JF. BioMediator data integration: beyond genomics to neuroscience data. AMIA Annu Symp Proc. 2005;789–783.
26. Rosse C, Mejino JVL. A reference ontology for biomedical informatics: the Foundational Model of Anatomy. J Biomed Inform. 2003;36:478–500.
27. Gennari JH, Silberfein A, Wiley JC. Integrating knowledge sources through and anatomy ontology. In: Pacifi c Symposium on Biocomputing; 2005 Jan 4–8; Hawaii, USA. p. 115–126.
28. Aranguren M, Bechhofer S, Lord P, et al. Understanding and using the meaning of statements in a bio-ontology: recasting the gene ontology in OWL. BMC Bioinformatics. 2007;8:57.
29. Chicurel M. Bioinformatics: bringing it all together. Nature. 2002;419:751,753–755.
30. Stein L. Creating a bioinformatics nation. Nature. 2002;417:119–120.


![Ivyspring Nanotheranosticsdrug release within a lesion [12–14]. Such MR-labelled carriers also offer anatomical guidance, feedback, and spatiotemporal control of the applied FUS](https://img.pdfslide.net/doc/110x75/60a7f0834afb7621ef71c187/ivyspring-nanotheranostics-drug-release-within-a-lesion-12a14-such-mr-labelled.jpg)