Embed Size (px)
Citation preview
SPATIOTEMPORAL PATTERNS OF RESOURCE USE AND DENSITY OF
AMERICAN BLACK BEARS ON YELLOWSTONE’S NORTHERN RANGE
by
Nathaniel Roth Bowersock
A thesis submitted in partial fulfillment of the requirements for the degree
of
Master of Science
in
Fish and Wildlife Management
MONTANA STATE UNIVERSITY Bozeman, Montana
April 2020
©COPYRIGHT
by
Nathaniel Roth Bowersock
2020
All Rights Reserved
ii
ACKNOWLEDGMENTS
I want to start with thanking my advisor, Andrea Litt, for giving me a chance to prove my
abilities in graduate school, and guiding me through this tremendous process to become a
better biologist. I also need to thank Kerry Gunther and Frank van Manen for their
mentorship and allowing me the opportunity to work with bears in the Greater
Yellowstone Ecosystem, which has been a great privilege. I am grateful to Jay Rotella for
serving on my committee and providing me with vital feedback. I appreciate the help I
received from Terrill Paterson and Blake Lowrey with my many coding issues, along
with the help my fellow graduate students and the ecology department staff provided over
the years. I have much gratitude for my army of technicians: Elise Loggers, Megan
Wright, Lauren Bryant, Samantha Schmidt, Katie Piecora, Hitomi Okada, Nikki Tatton,
Neal Hurst, Leia Hayward, and Amelia Hiorns – my project would not have been
possible without them. I am also grateful for the assistance I received from Mike Sawaya,
Jerod Merkle, the Yellowstone Bear Management Office and the Interagency Grizzly
Bear Study Team. Annie Carlson of the Yellowstone Research Permit Office helped us to
secure our research permits. Dan MacNulty of Utah State University (NSF grant DEB-
1245373) and Shannon Barber-Meyer of the USGS Northern Prairie Wildlife Research
Center both shared elk location data. This research was supported with funding from
Yellowstone Forever, and much appreciated scholarships from Jack Creek Preserve
Foundation and the Kenneth D. Lorang Memorial Fund. I greatly appreciate my loving
family; without their support, I do not know if I would be where I am today. Lastly, I am
very grateful to my wife Lisa, for always being by my side and believing in me.
iii
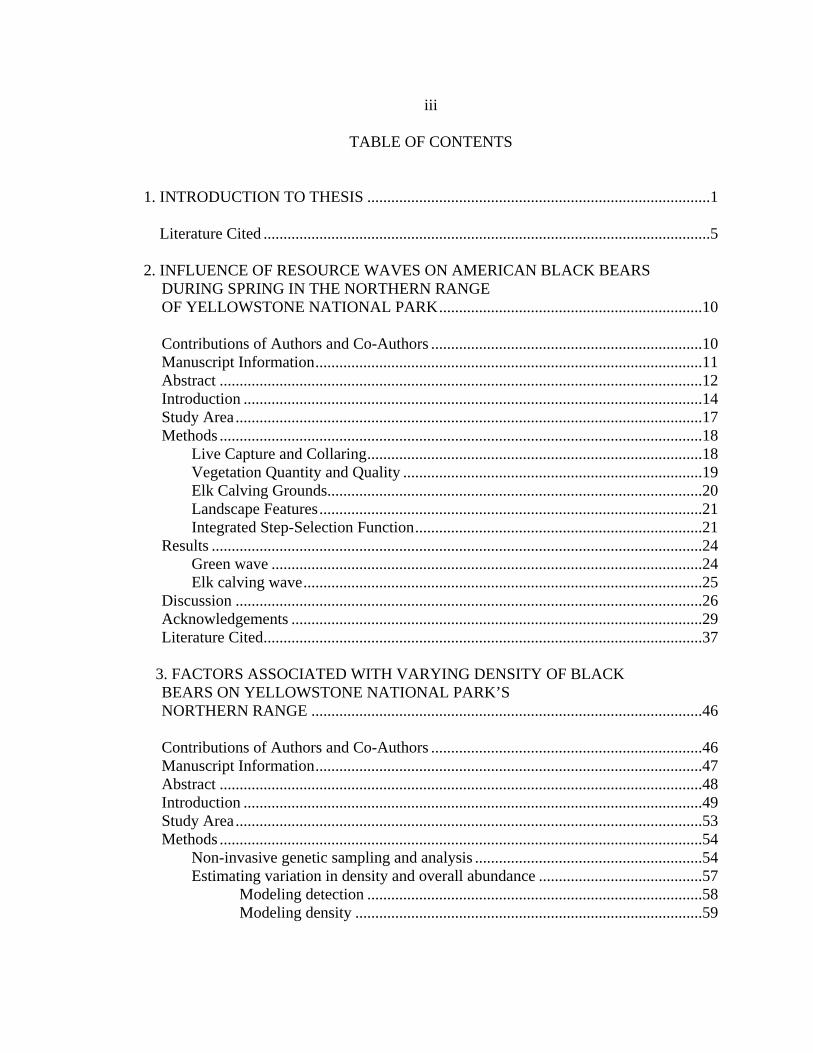
TABLE OF CONTENTS
1. INTRODUCTION TO THESIS ......................................................................................1
Literature Cited ................................................................................................................5
2. INFLUENCE OF RESOURCE WAVES ON AMERICAN BLACK BEARS DURING SPRING IN THE NORTHERN RANGE OF YELLOWSTONE NATIONAL PARK ..................................................................10
Contributions of Authors and Co-Authors ....................................................................10 Manuscript Information .................................................................................................11 Abstract .........................................................................................................................12 Introduction ...................................................................................................................14 Study Area .....................................................................................................................17 Methods .........................................................................................................................18
Live Capture and Collaring ....................................................................................18 Vegetation Quantity and Quality ...........................................................................19 Elk Calving Grounds..............................................................................................20 Landscape Features ................................................................................................21 Integrated Step-Selection Function ........................................................................21
Results ...........................................................................................................................24 Green wave ............................................................................................................24 Elk calving wave ....................................................................................................25
Discussion .....................................................................................................................26 Acknowledgements .......................................................................................................29 Literature Cited ..............................................................................................................37
3. FACTORS ASSOCIATED WITH VARYING DENSITY OF BLACK BEARS ON YELLOWSTONE NATIONAL PARK’S NORTHERN RANGE ..................................................................................................46
Contributions of Authors and Co-Authors ....................................................................46 Manuscript Information .................................................................................................47 Abstract .........................................................................................................................48 Introduction ...................................................................................................................49 Study Area .....................................................................................................................53 Methods .........................................................................................................................54
Non-invasive genetic sampling and analysis .........................................................54 Estimating variation in density and overall abundance .........................................57
Modeling detection ....................................................................................58 Modeling density .......................................................................................59
iv
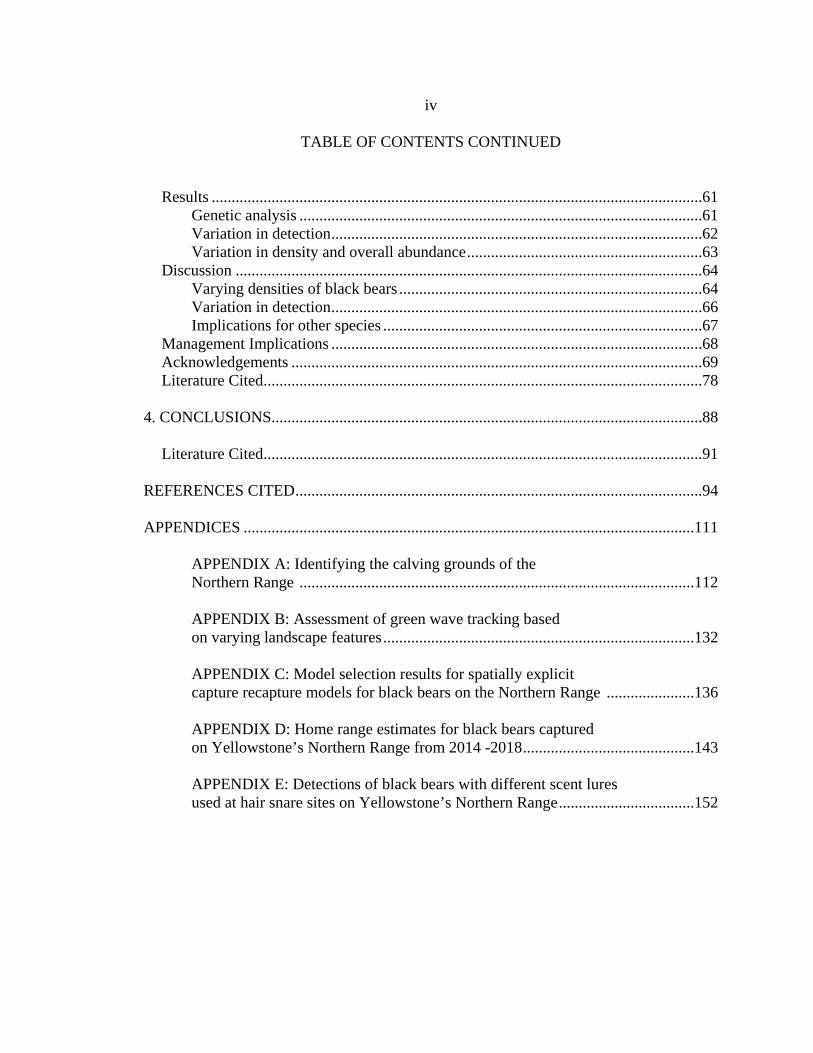
TABLE OF CONTENTS CONTINUED
Results ...........................................................................................................................61
Genetic analysis .....................................................................................................61 Variation in detection .............................................................................................62 Variation in density and overall abundance ...........................................................63
Discussion .....................................................................................................................64 Varying densities of black bears ............................................................................64 Variation in detection .............................................................................................66 Implications for other species ................................................................................67
Management Implications .............................................................................................68 Acknowledgements .......................................................................................................69 Literature Cited ..............................................................................................................78
4. CONCLUSIONS............................................................................................................88
Literature Cited ..............................................................................................................91
REFERENCES CITED ......................................................................................................94 APPENDICES .................................................................................................................111
APPENDIX A: Identifying the calving grounds of the Northern Range ...................................................................................................112 APPENDIX B: Assessment of green wave tracking based on varying landscape features ..............................................................................132
APPENDIX C: Model selection results for spatially explicit capture recapture models for black bears on the Northern Range ......................136
APPENDIX D: Home range estimates for black bears captured on Yellowstone’s Northern Range from 2014 -2018 ...........................................143 APPENDIX E: Detections of black bears with different scent lures used at hair snare sites on Yellowstone’s Northern Range ..................................152
v
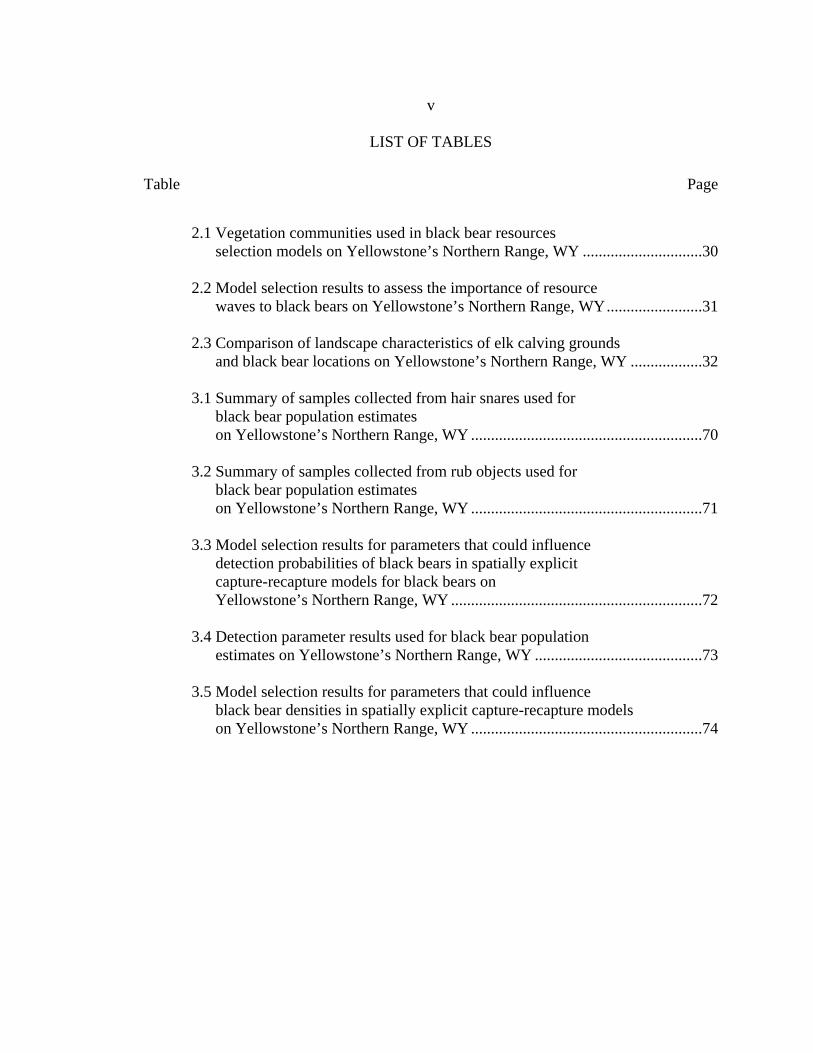
LIST OF TABLES
Table Page
2.1 Vegetation communities used in black bear resources selection models on Yellowstone’s Northern Range, WY ..............................30
2.2 Model selection results to assess the importance of resource
waves to black bears on Yellowstone’s Northern Range, WY ........................31
2.3 Comparison of landscape characteristics of elk calving grounds and black bear locations on Yellowstone’s Northern Range, WY ..................32
3.1 Summary of samples collected from hair snares used for black bear population estimates on Yellowstone’s Northern Range, WY ..........................................................70
3.2 Summary of samples collected from rub objects used for
black bear population estimates on Yellowstone’s Northern Range, WY ..........................................................71
3.3 Model selection results for parameters that could influence
detection probabilities of black bears in spatially explicit capture-recapture models for black bears on Yellowstone’s Northern Range, WY ...............................................................72
3.4 Detection parameter results used for black bear population
estimates on Yellowstone’s Northern Range, WY ..........................................73 3.5 Model selection results for parameters that could influence
black bear densities in spatially explicit capture-recapture models on Yellowstone’s Northern Range, WY ..........................................................74
vi
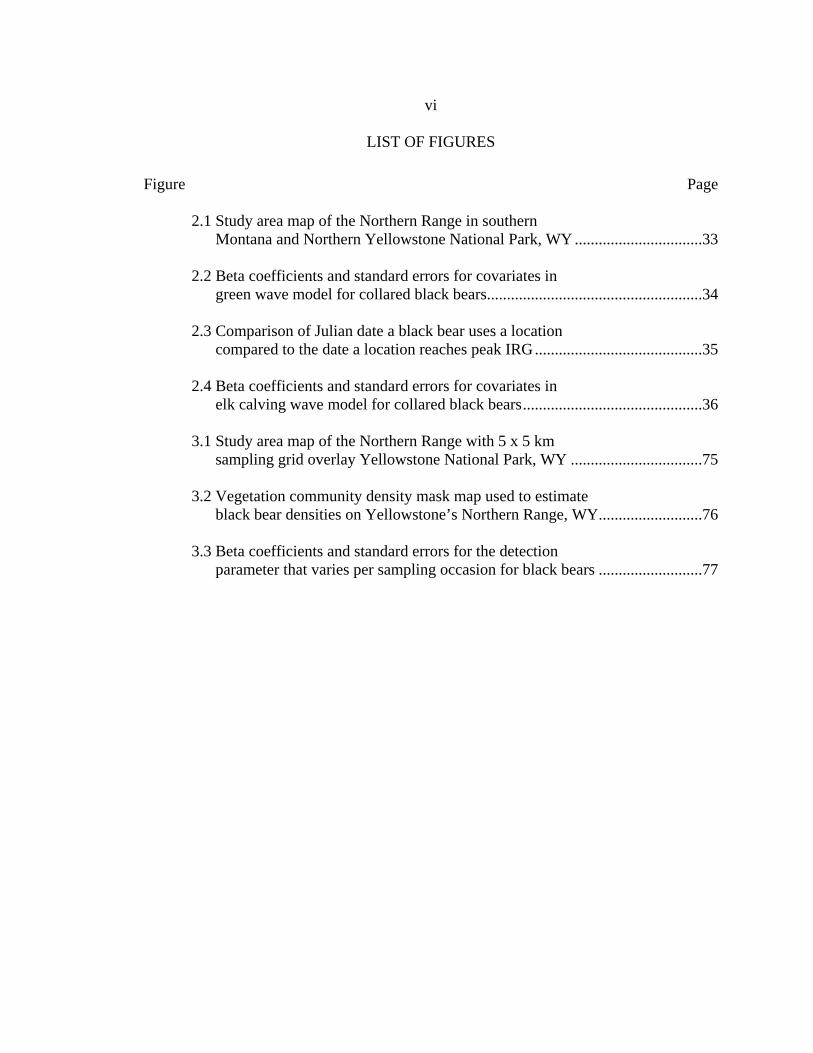
LIST OF FIGURES
Figure Page
2.1 Study area map of the Northern Range in southern Montana and Northern Yellowstone National Park, WY ................................33
2.2 Beta coefficients and standard errors for covariates in
green wave model for collared black bears ......................................................34
2.3 Comparison of Julian date a black bear uses a location compared to the date a location reaches peak IRG ..........................................35
2.4 Beta coefficients and standard errors for covariates in
elk calving wave model for collared black bears .............................................36 3.1 Study area map of the Northern Range with 5 x 5 km
sampling grid overlay Yellowstone National Park, WY .................................75
3.2 Vegetation community density mask map used to estimate black bear densities on Yellowstone’s Northern Range, WY ..........................76
3.3 Beta coefficients and standard errors for the detection
parameter that varies per sampling occasion for black bears ..........................77
vii
ABSTRACT
The availability of resources, such as food and cover, can directly influence the
movement and distribution of wildlife populations. The abundance and seasonal timing of many resources have changed in Yellowstone National Park (YNP), which has influenced populations of American black bears (Ursus americanus), an opportunistic omnivore. Previous studies have focused on how changes in resources have influenced black bears in the central and southern regions of YNP, however little work has focused on black bears in the northern part of the park. In 2017-2018, we used GPS collars and non-invasive genetic sampling to understand resource selection and variation in densities of black bears on the Northern Range. We sought to 1) assess whether black bears were following seasonal pulses of resources (resource waves) in the spring, such as the green wave and elk (Cervus canadensis) calving wave and 2) evaluate how densities of black bears varied based on landscape features, generating a baseline abundance estimate to help track changes in the population over time. We found evidence that black bears followed the green wave, prioritizing forage quality over quantity when selecting patches of green vegetation in early spring. However, black bears were less likely to select areas near historical elk calving grounds, suggesting that consumption of neonates is more opportunistic. Densities of black bears varied among vegetation communities, with the highest densities in forested communities dominated by Douglas fir. Our study provides the first baseline density estimates for black bears on the Northern Range, with an average density of 12.8 bears/100km2 (95% CI = 9.4 – 17.5), which is higher than other regions in YNP. Availability of high-quality resources may allow for higher densities of black bears, with potential ramifications for other wildlife populations on the Northern Range. Information about resource selection and variation in estimated densities could be used to guide management decisions to continue to reduce human-bear conflicts and provide safe wildlife viewing experiences for the growing number of visitors to YNP.
1
CHAPTER ONE
INTRODUCTION TO THESIS
Variation in the availability of resources can impact the distribution and
abundance of wildlife populations (Brown et al. 1995, Pettorelli et al. 2001, Beckmann
and Berger 2003, Armstrong et al. 2016, Rayl et al. 2018, Welfelt et al. 2019). For
example, some animals alter their movement to follow seasonal pulses in food resources,
such as masting vegetation or spawning salmonid species (Oncorhynchus spp.) (McCarty
et al. 2002, Armstrong et al. 2016, Deacy et al. 2016, 2017, Service et al. 2019). Inter-
and intra-specific competition may increase as the availability of food resources declines
(Pettorelli et al. 2001, Belant et al. 2010, Service et al. 2019). In some cases, competition
for resources can lead to niche partitioning, altering how species are distributed (Toft
1985, Voeten and Prins 1999). Human activity also can influence the distribution of
animal populations by altering access to resources (Beckmann and Berger 2003, Pelletier
2006, Goad et al. 2014, Gingery et al. 2018). Therefore, studying the relationships
between wildlife populations and resources can help develop conservation and
management strategies (Pettorelli et al. 2001, McCarty et al. 2002, Manly et al. 2007,
Loosen et al. 2019, Welfelt et al. 2019).
The American black bear (Ursus americanus) is a large-bodied omnivore and the
most widely distributed species of bear in North America (Pelton 2003). Black bears
select contiguous forested areas and consume large quantities of plant matter, but also
will consume animal matter when available (Bastille-Rousseau et al. 2011, Costello et al.
2
2016, Rayl et al. 2018, Svoboda et al. 2019). The quality and availability of resources can
influence the distribution of black bears (Drewry et al. 2013, Humm et al. 2017, Loosen
et al. 2019, Welfelt et al. 2019). For example, when food resources are limited, larger
male bears can outcompete and displace smaller female bears (Beckmann and Berger
2003, Johnson et al. 2015, Duquette et al. 2017). In addition, the abundance of food
resources also can affect the degree of competition with grizzly bears (Ursus arctos) in
areas where they are sympatric (Aune 1994, Mattson et al. 2005, Fortin et al. 2013,
Costello et al. 2016).
In Yellowstone National Park (YNP), USA, black bears are sympatric with
grizzly bears (Barnes and Bray 1967, Cole 1976, Schwartz et al. 2014, Teisberg et al.
2014). Since the 1960s, black bears in YNP have experienced substantial ecological
changes (Barnes and Bray 1967, Cole 1976, Fortin et al. 2013, Teisberg et al. 2014,
Gunther et al. 2015). For example, the population of grizzly bears in YNP has increased
in abundance since being listed as a threatened species in 1975, resulting in higher levels
of interspecific competition and niche partitioning between the two bear species
(Schwartz et al. 2014, Costello et al. 2016). In addition, abundance and availability of
high-calorie food resources, such as whitebark pine (Pinus albicaulis), elk (Cervus
canadensis), and cutthroat trout (Oncorhynchus clarkii), have changed, causing some
bears to seek out alternative food sources (Fortin et al. 2013, Teisberg et al. 2014,
Gunther et al. 2015, Costello et al. 2016). However, black bears might be better adapted
to capitalize on lower-calorie foods such as vegetative food resources, due their smaller
body size and lesser metabolic needs, compared to grizzly bears that require higher-
3
nutritious foods such as neonate elk (Noyce and Garshelis 1998; Robbins et al. 2004,
2007; McLellan 2011).
The Northern Range of YNP occurs at lower elevations and undergoes longer
green-up periods compared to other regions of the park, resulting in increased availability
of vegetative food resources (Singer et al. 1994, Frank et al. 2016, Notaro et al. 2019).
This abundance of vegetation allows diverse and abundant ungulate populations to occur
on the Northern Range (Frank and McNaughton 1992, Barber-Meyer et al. 2008, Metz et
al. 2012, Mosley and Mundinger 2018). The current abundant food resources on the
Northern Range could support higher densities of black bears compared to the rest of
YNP, with concomitant implications for other species (Murphy et al. 1998, Mattson et al.
2005, Barber-Meyer et al. 2008, Rayl et al. 2018).
Therefore, we sought to better understand how availability of resources on the
Northern Range influenced resource use and population density of black bears. In
Chapter 2, we assessed whether black bears alter their movements to follow pulses of
resources (resource waves) in the spring. We were specifically interested if black bears
tracked the green wave, choosing patches of highly-digestible plant resources at
intermediate biomass (Merkle et al. 2016, Aikens et al. 2017, Middleton et al. 2018). In
addition, we assessed whether black bears tracked the elk calving wave, selecting areas
where neonate elk could be found (Bastille-Rousseau et al. 2011, Rayl et al. 2018,
Svoboda et al. 2019). In Chapter 3, we estimated the abundance of black bears on the
Northern Range, making use of non-invasive genetic sampling techniques. Specifically,
we investigated how the density of black bears might vary with landscape features

4
(Loosen et al. 2019, Stetz et al. 2019, Welfelt et al. 2019). In our final chapter, we
describe how these findings contribute to our understanding of the influence of resources
on the spatiotemporal distribution of black bears.
5
LITERATURE CITED
Aikens, E. O., M. J. Kauffman, J. A. Merkle, S. P. H. Dwinnell, G. L. Fralick, and K. L. Monteith. 2017. The greenscape shapes surfing of resource waves in a large migratory herbivore. Ecology Letters 20:741–750.
Armstrong, J. B., G. Takimoto, D. E. Schindler, M. M. Hayes, and M. J. Kauffman. 2016. Resource waves: phenological diversity enhances foraging opportunities for mobile consumers. Ecology 97:1099–1112.
Aune, K. E. 1994. Comparative ecology of black and grizzly bears on the Rocky Mountain Front, Montana. International Conference of Bear Research and Management 9:365–374.
Barber-Meyer, S. M., L. D. Mech, and P. J. White. 2008. Elk calf survival and mortality following wolf restoration to Yellowstone National Park. Wildlife Monographs 169:1–30.
Barnes, V. G., and O. E. Bray. 1967. Population characteristics and activities of black bears in YNP. Final report. Colorado State University, Boulder, CO.
Bastille-Rousseau, G., D. Fortin, C. Dussault, R. Courtois, and J. P. Ouellet. 2011. Foraging strategies by omnivores: Are black bears actively searching for ungulate neonates or are they simply opportunistic predators? Ecography 34:588–596.
Beckmann, J. P., and J. Berger. 2003. Using black bears to test ideal-free distribution models experimentally. Journal of Mammalogy 84:594–606.
Belant, J. L., B. Griffith, Y. Zhang, E. H. Follmann, and L. G. Adams. 2010. Population-level resource selection by sympatric brown and American black bears in Alaska. Polar Biology 33:31–40.
Brown, J. H., D. W. Mehlman, and G. C. Stevens. 1995. Spatial variation in abundance. Ecology 76:2028–2043.
Cole, G. F. 1976. Management involving grizzly and black bears in Yellowstone National Park, 1970-1975. U.S. Department of the Interior, National Park Service, Natural Resources Report 9:1–26.
Costello, C. M., S. L. Cain, S. Pils, L. Frattaroli, M. A. Haroldson, and F. T. van Manen. 2016. Diet and macronutrient optimization in wild ursids: A comparison of grizzly bears with sympatric and allopatric black bears. PLoS ONE 11:e0153702.
Deacy, W., W. Leacock, J. B. Armstrong, and J. A. Stanford. 2016. Kodiak brown bears surf the salmon red wave: Direct evidence from GPS collared individuals. Ecology 97:1091–1098.
6
Deacy, W. W., J. B. Armstrong, W. B. Leacock, C. T. Robbins, D. D. Gustine, E. J. Ward, J. A. Erlenbach, and J. A. Stanford. 2017. Phenological synchronization disrupts trophic interactions between Kodiak brown bears and salmon. Proceedings of the National Academy of Sciences 114:201705248.
Drewry, J. M., F. T. van Manen, and D. M. Ruth. 2013. Density and genetic structure of black bears in coastal South Carolina. Journal of Wildlife Management 77:153–164.
Duquette, J. F., J. L. Belant, C. M. Wilton, N. Fowler, B. W. Waller, D. E. Beyer, N. J. Svoboda, S. L. Simek, and J. Beringer. 2017. Black bear (Ursus americanus) functional resource selection relative to intraspecific competition and human risk. Canadian Journal of Zoology 95:203–212.
Fortin, J. K., C. C. Schwartz, K. A. Gunther, J. E. Teisberg, M. A. Haroldson, M. A. Evans, and C. T. Robbins. 2013. Dietary adjustability of grizzly bears and American black bears in Yellowstone National Park. Journal of Wildlife Management 77:270–281.
Frank, D. A., and S. J. McNaughton. 1992. The ecology of plants, large mammalian herbivores, and drought in Yellowstone National Park. Ecology 73:2043–2058.
Frank, D. A., R. L. Wallen, and P. J. White. 2016. Ungulate control of grassland production: grazing intensity and ungulate species composition in Yellowstone Park. Ecosphere 7:e01603.
Gingery, T. M., D. R. Diefenbach, B. D. Wallingford, and C. S. Rosenberry. 2018. Landscape-level patterns in fawn survival across North America. Journal of Wildlife Management 82:1003–1013.
Goad, E. H., L. Pejchar, S. E. Reed, and R. L. Knight. 2014. Habitat use by mammals varies along an exurban development gradient in northern Colorado. Biological Conservation 176:172–182.
Gunther, K. A., F. T. van Manen, C. Servheen, and S. Haas. 2015. Grizzly bear recovery in the Greater Yellowstone Ecosystem: Food habits, demographic changes and a bear bathtub. Safety in bear country. Yellowstone Science 23:1–100.
Humm, J. M., J. W. McCown, B. K. Scheick, and J. D. Clark. 2017. Spatially explicit population estimates for black bears based on cluster sampling. Journal of Wildlife Management 81:1187–1201.
Johnson, H. E., S. W. Breck, S. Baruch-mordo, D. L. Lewis, C. W. Lackey, K. R. Wilson, J. Broderick, J. S. Mao, and J. P. Beckmann. 2015. Shifting perceptions of risk and reward: Dynamic selection for human development by black bears in the western United States. Biological Conservation 187:164–172.
7
Loosen, A. E., A. T. Morehouse, and M. S. Boyce. 2019. Land tenure shapes black bear density and abundance on a multi-use landscape. Ecology and Evolution 9:73–90.
Manly, B. F. J., L. L. McDonald, D. L. Thomas, T. L. McDonald, and W. P. Erickson. 2007. Resource selection by animals: Statistical design and analysis for field studies. Springer Science & Business Media. Volume 2. Kluwer Academic Publisher, New York, Boston, Dordrecht, London, Moscow.
Mattson, D. J., S. Herrero, and T. Merrill. 2005. Are black bears a factor in the restoration of North American grizzly bear populations? Ursus 16:11–30.
McCarty, J. P., D. J. Levey, C. H. Greenberg, and S. Sargent. 2002. Spatial and temporal variation in fruit use by wildlife in a forested landscape. Forest Ecology and Management 164:277–291.
McLellan, B. N. 2011. Implications of a high-energy and low-protein diet on the body composition, fitness, and competitive abilities of black (Ursus americanus) and grizzly (Ursus arctos) bears. Canadian Journal of Zoology 89:546–558.
Merkle, J. A., K. L. Monteith, E. O. Aikens, M. M. Hayes, K. R. Hersey, A. D. Middleton, B. A. Oates, H. Sawyer, B. M. Scurlock, and M. J. Kauffman. 2016. Large herbivores surf waves of green-up in spring. Proceedings of the Royal Society B: Biological Sciences 283:20160456.
Metz, M. C., D. W. Smith, J. A. Vucetich, D. R. Stahler, and R. O. Peterson. 2012. Seasonal patterns of predation for gray wolves in the multi-prey system of Yellowstone National Park. Journal of Animal Ecology 81:553–563.
Middleton, A. D., J. A. Merkle, D. E. McWhirter, J. G. Cook, R. C. Cook, P. J. White, and M. J. Kauffman. 2018. Green-wave surfing increases fat gain in a migratory ungulate. Oikos 127:1060–1068.
Mosley, B. J. C., and J. G. Mundinger. 2018. History and status of wild ungulate populations on the Northern Yellowstone Range. Rangelands 40:189–201.
Murphy, K. M., G. S. Felzien, M. G. Hornocker, and T. K. Ruth. 1998. Encounter competition between bears and cougars: some ecological implications. Ursus 10:55–60.
Notaro, M., K. Emmett, and D. O’Leary. 2019. Spatio-temporal variability in remotely sensed vegetation greenness across Yellowstone National Park. Remote Sensing 11:798–828.
Noyce, K. V., and D. L. Garshelis. 1998. Spring weight changes in black bears in northcentral Minnesota : The negative foraging period revisited. Ursus 10:521–531.
8
Pelletier, F. 2006. Effects of tourist activities on ungulate behaviour in a mountain protected area. Journal of Mountain Ecology 8:15–19.
Pelton, M. R. 2003. Black Bear. Pages 547–555 in G. A. Feldhamer, B. C. Thompson, and J. A. Chapman, editors. Wild Mammals of North America: Biology, Management, and Conservation. Second Edition. Johns Hopkins University Press, Baltimore, MD.
Pettorelli, N., J. Gaillard, P. Duncan, J. Ouellet, and G. Van Laere. 2001. Population density and small-scale variation in habitat quality affect phenotypic quality in roe deer. Oecologia 128:400–405.
Rayl, N. D., G. Bastille-Rousseau, J. F. Organ, M. A. Mumma, S. P. Mahoney, C. E. Soulliere, K. P. Lewis, R. D. Otto, D. L. Murray, L. P. Waits, and T. K. Fuller. 2018. Spatiotemporal heterogeneity in prey abundance and vulnerability shapes the foraging tactics of an omnivore. Journal of Animal Ecology 87:874–887.
Robbins, C. T., J. K. Fortin, K. D. Rode, S. D. Farley, L. A. Shipley, and L. A. Felicetti. 2007. Optimizing protein intake as a foraging strategy to maximize mass gain in an omnivore. Oikos 116:1675–1682.
Robbins, C. T., C. C. Schwartz, and L. A. Felicetti. 2004. Nutritional ecology of ursids: a review of newer methods and management implications. Ursus 15:161–171.
Schwartz, C. C., J. K. Fortin, J. E. Teisberg, M. A. Haroldson, C. Servheen, C. T. Robbins, and F. T. van Manen. 2014. Body and diet composition of sympatric black and grizzly bears in the Greater Yellowstone Ecosystem. Journal of Wildlife Management 78:68–78.
Service, C. N., A. W. Bateman, M. S. Adams, K. A. Artelle, T. E. Reimchen, P. C. Paquet, and C. T. Darimont. 2019. Salmonid species diversity predicts salmon consumption by terrestrial wildlife. Journal of Animal Ecology 88:392–404.
Singer, F. J., L. C. Mark, and R. C. Cates. 1994. Ungulate herbivory of willows on Yellowstone’s northern winter range. Journal of Range Management 47:435–443.
Stetz, J. B., M. S. Mitchell, and K. C. Kendall. 2019. Using spatially-explicit capture–recapture models to explain variation in seasonal density patterns of sympatric ursids. Ecography 42:237–248.
Svoboda, N. J., J. L. Belant, D. E. Beyer, J. F. Duquette, and P. E. Lederle. 2019. Carnivore space use shifts in response to seasonal resource availability. Ecosphere 10:e02817.
9
Teisberg, J. E., M. A. Haroldson, C. C. Schwartz, K. A. Gunther, J. K. Fortin, and C. T. Robbins. 2014. Contrasting past and current numbers of bears visiting Yellowstone cutthroat trout streams. Journal of Wildlife Management 78:369–378.
Toft, C. A. 1985. Resource partitioning in amphibians and reptiles. Copeia 1985:1–21.
Voeten, M. M., and H. H. T. Prins. 1999. Resource partitioning between sympatric wild and domestic herbivores in the Tarangire region of Tanzania. Oecologia 120:287–294.
Welfelt, L. S., R. A. Beausoleil, and R. B. Wielgus. 2019. Factors associated with black bear density and implications for management. Journal of Wildlife Management 83:1527–1539.

10
CHAPTER TWO
INFLUENCE OF RESOURCE WAVES ON AMERICAN BLACK BEARS DURING
SPRING IN THE NORTHERN RANGE OF YELLOWSTONE NATIONAL PARK
Contribution of Authors and Co-Authors
Manuscript in Chapter 2 Author: Nathaniel R. Bowersock Contributions: Implemented the study, collected and analyzed the data, wrote the manuscript Co-Author: Andrea R. Litt Contributions: Guided study design, helped secure funding, assisted with data analysis, extensive review of manuscript Co-Author: Kerry A. Gunther Contributions: Conceived initial study idea, secured funding, assisted with data collection, reviewed the manuscript Co-Author: Jay J. Rotella Contributions: Reviewed the manuscript Co-Author: Jerod A. Merkle Contributions: Reviewed the manuscript, assisted with data analysis Co-Author: Frank T. van Manen Contributions: Assisted with data analysis, reviewed the manuscript
11
Manuscript Information
Nathaniel R. Bowersock, Andrea R. Litt, Kerry A. Gunther, Jay J. Rotella, Jerod A. Merkle, Frank T. van Manen Ecosphere Status of Manuscript: _X__ Prepared for submission to a peer-reviewed journal ____ Officially submitted to a peer-reviewed journal ____ Accepted by a peer-reviewed journal ____ Published in a peer-reviewed journal
12
Influence of resource waves on American black bears during spring in the Northern
Range of Yellowstone National Park
NATHANIEL R. BOWERSOCK1, Department of Ecology, Montana State University,
P.O. Box 173460, Bozeman, MT 59717-2400, USA
ANDREA R. LITT, Department of Ecology, Montana State University, P.O. Box 173460,
Bozeman, MT 59717-2400, USA
JAY J. ROTELLA, Department of Ecology, Montana State University, P.O. Box 173460,
Bozeman, MT 59717-2400, USA
JEROD A. MERKLE, Wyoming Cooperative Fish and Wildlife Research Unit,
Department of Zoology and Physiology, University of Wyoming, Department 3166, 1000
East University Avenue, Laramie, WY 82071, USA
KERRY A. GUNTHER, Bear Management Office, Yellowstone Center for Resources,
Yellowstone National Park, P.O. Box 168, Yellowstone National Park, WY 82190, USA.
FRANK T. VAN MANEN, U.S. Geological Survey, Northern Rocky Mountain Science
Center, Interagency Grizzly Bear Study Team, 2327 University Way, Suite 2, Bozeman,
MT 59715, USA.
1Email: [email protected]
ABSTRACT Seasonal pulses in resources, also known as resource waves, can drive
movement and behavior of consumers. American black bears (Ursus americanus) are
opportunistic omnivores that consume diverse foods to meet macronutrient needs. During
the fall, black bears capitalize on resource waves such as hard mast, but we know less
about the importance of resource waves during other seasons. We sought to understand
13
whether the green wave, when green vegetation reaches optimal foraging quality, and the
elk (Cervus canadensis) calving wave, when neonate elk are born, influence black bear
resource selection in the spring. We hypothesized that black bears would follow the green
wave, but would be less likely to track the calving wave. We instrumented 8 black bears
with GPS collars in 2017 and 2018 in the Northern Range of Yellowstone National Park,
USA and estimated fine-scale resource selection with integrated step-selection functions
based on used and available locations. During spring, black bears selected areas based on
forage quality over quantity, suggesting they were following the green wave.
Specifically, we found that black bears followed the trailing edge of the green wave,
reflecting consumption of vegetation shortly after it reached optimal foraging quality.
During the calving wave, black bears were more likely to select areas outside of the
calving grounds, suggesting that if they consumed elk calves, they did so
opportunistically. Because of their smaller body size and different metabolic needs, black
bears might be able to capitalize on the phenological state of plant resources, a potential
benefit if grizzly bears (Ursus arctos) are better competitors for energy-rich foods, such
as neonate elk. Few studies have shown evidence of an omnivorous species following the
green wave, suggesting there is need to further understand how temporal and spatial
variation in available resources influence selection by species with diverse diets such as
black bears.
KEY WORDS American black bear, forage quality, green wave, Northern Range,
phenology, resource selection, step-selection functions, Ursus americanus, Yellowstone
National Park
14
The distribution and abundance of food resources are vital for wildlife species, but the
timing of when foods are available may be even more influential on energy gains of
consumers (Armstrong et al. 2016). Seasonal pulses in resources, also known as resource
waves, can drive the movement and behavior of consumers (Welch et al. 1997, Davis et
al. 2006, Bojarska and Selva 2012, Merkle et al. 2016, Denny et al. 2018, Dou et al.
2019). For example, masting plants create an important resource pulse in the summer and
fall, supplying energy-rich foods to many wildlife species for migration, mating, or
hibernation in late summer and fall (Inman and Pelton 2002, McCarty et al. 2002, Ryan et
al. 2004). Resource pulses may come from plant or animal-based foods and in some
cases, consumers will transition from one resource pulse to another (Armstrong et al.
2016, Deacy et al. 2017, 2019). In Alaska, brown bears (Ursus arctos) shift their
movements to take advantage of seasonally abundant spawning salmon (Oncorhynchus
spp.), but later shift their diets to take advantage of seasonally-limited red elderberry
(Sambucus racemosa) berries, allowing bears to build fat reserves for hibernation
(Armstrong et al. 2016, Deacy et al. 2017).
During spring, some wildlife species alter their movements to track the
phenological changes in green vegetation, a pattern referred to as the green wave (van der
Graaf et al. 2006, Hebblewhite et al. 2008, Bischof et al. 2012, Merkle et al. 2016). Plants
at early to mid-phenological states are lower in fibrous material, making them easier to
digest and therefore more nutritious. Animals that follow the green wave select patches of
vegetation at optimal forage quality, which is a balance between nutritional quality and
15
abundance on the landscape (Bischof et al. 2012, Armstrong et al. 2016, Merkle et al.
2016, Aikens et al. 2017). By consuming vegetation at optimal forage quality, animals
can maximize energy intake, which can have important fitness consequences
(Hebblewhite et al. 2008, Merkle et al. 2016). For example, migratory elk (Cervus
canadensis) that tracked the green wave could consume more digestible vegetation,
resulting in higher body fat composition, compared to non-migratory elk (Hebblewhite et
al. 2008, Middleton et al. 2018). In addition, migrating Barnacle Geese (Branta
leucopsis) that followed the green wave had higher fledgling survival, potentially due to
consuming more nutritious vegetation (van der Graaf et al. 2006).
In North America, the American black bear is an opportunistic omnivore that
balances the intake of fat and protein for efficient mass gains while meeting
macronutrient needs (Coogan et al. 2014, Erlenbach et al. 2014, Costello et al. 2016).
Maintaining this balance can be challenging due to seasonality of energy-rich food
resources but the mobility of bears allows them to shift movements in late summer and
fall to track the pulsed availability of masting vegetation (Welch et al. 1997, Klinka and
Reimchen 2009, Belant et al. 2010, Fortin et al. 2013, Coogan et al. 2014, Erlenbach et
al. 2014, Costello et al. 2016). Soft mast, such as Vaccinium species, are easily digestible
foods that bears can convert and store as fat as they prepare for hibernation (Belant et al.
2010, Armstrong et al. 2016, Deacy et al. 2017). Hard mast, such as oak acorns (Quercus
spp.) and pine nuts (Pinus spp.), provide good sources of fat and protein that also allow
bears to quickly build lean mass and fat (Diamond et al. 2000, Inman and Pelton 2002,
Ryan et al. 2004, Moyer et al. 2007, Mazur et al. 2013, Schwartz et al. 2014, Costello et
16
al. 2016). In addition, some black bears shift their foraging activities to feed on spawning
salmon and trout species (Oncorhynchus spp.) that supply a rich source of fat and protein
(Klinka and Reimchen 2009, Belant et al. 2010, Fortin et al. 2013).
Compared with fall, food resources are more limited in spring when bears are
more likely to seek high-protein foods (Coogan et al. 2014, Erlenbach et al. 2014,
Costello et al. 2016). Many species of ungulates give birth during a narrow time window
in the spring, providing predators with a pulse of abundant protein (Testa 2005, Hodge et
al. 2010). Some black bears shift their foraging strategies to actively prey on neonate
ungulates when they are available (Rayl et al. 2018), whereas other black bears capitalize
on these resources opportunistically (Bastille-Rousseau et al. 2011, Svoboda et al. 2019).
Even when black bears prey on neonate ungulates (Ballard et al. 1999, Jacoby et al. 1999,
Griffin et al. 2011, Rayl et al. 2018), they also consume substantial amounts of green
vegetation in the spring (Lariviere 2001, Pelton 2003, Duquette et al. 2017). Although
plants can be high in protein, body mass gains may be lower for black bears due to their
limited ability to digest green vegetation (Erlenbach et al. 2014, Schwartz et al. 2014,
Costello et al. 2016, Herrero 2018).
Many ecological changes have occurred recently in the Greater Yellowstone
Ecosystem (GYE) that may affect food resources for black bears, such as changes in the
abundance and distribution of whitebark pine (Pinus albicaulis), elk, and cutthroat trout
(Oncorhynchus clarkii) (Fortin et al. 2013, Middleton et al. 2013). In addition, the
recovery of grizzly bears and the reintroduction of gray wolves (Canis lupus) may have
increased competition (Smith et al. 2003, Fortin et al. 2013, Costello et al. 2014). Despite
17
these changes, black bears in the GYE seem to meet their macronutrient needs in the late
summer and fall (Fortin et al. 2013, Costello et al. 2016), but maintaining this balance is
more challenging during spring (Schwartz et al. 2014, Costello et al. 2016). Therefore,
we sought to determine the importance of resource waves for black bears during spring.
First, we investigated whether black bears follow the green wave, consuming vegetation
at its optimal forage quality, which might allow black bears to gain body mass (Noyce
and Garshelis 1998). Second, we examined how the birth pulse of neonate elk (calving
wave) influences movements of black bears and whether bears actively or
opportunistically seek this food resource (Bastille-Rousseau et al. 2011, Rayl et al. 2018).
Given that green vegetation comprises the largest proportion of black bears’ diets in the
spring (Costello et al. 2016), we predicted that black bears would follow the green wave,
tracking the optimal forage quality of vegetation as it transitions across the landscape.
However, we predicted that black bears would be less likely to alter their movements to
track calving locations, because black bears tend to consume fewer elk calves compared
to grizzly bears (Barber-Meyer et al. 2008).
STUDY AREA
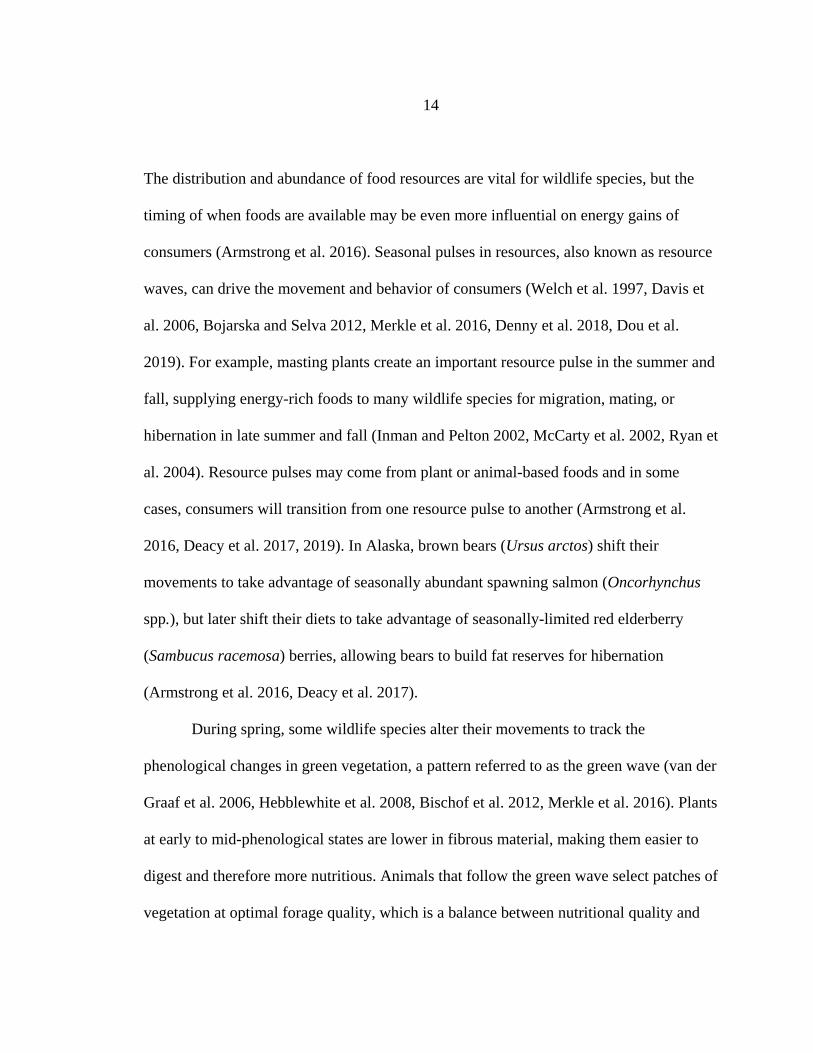
Yellowstone National Park (YNP; 8,991 km2) is in northwestern Wyoming, with
additional portions in Montana and Idaho (Barber-Meyer et al. 2008). We focused our
study on the Northern Range of YNP, a 1,530-km2 area along the northern third of the
national park extending into portions of southern Montana (Figure 2.1; Metz et al. 2012).
We focused on about 1,000 km2 of the Northern Range within YNP. Although the
diversity and abundance of plants, ungulates, and predators on the Northern Range have
18
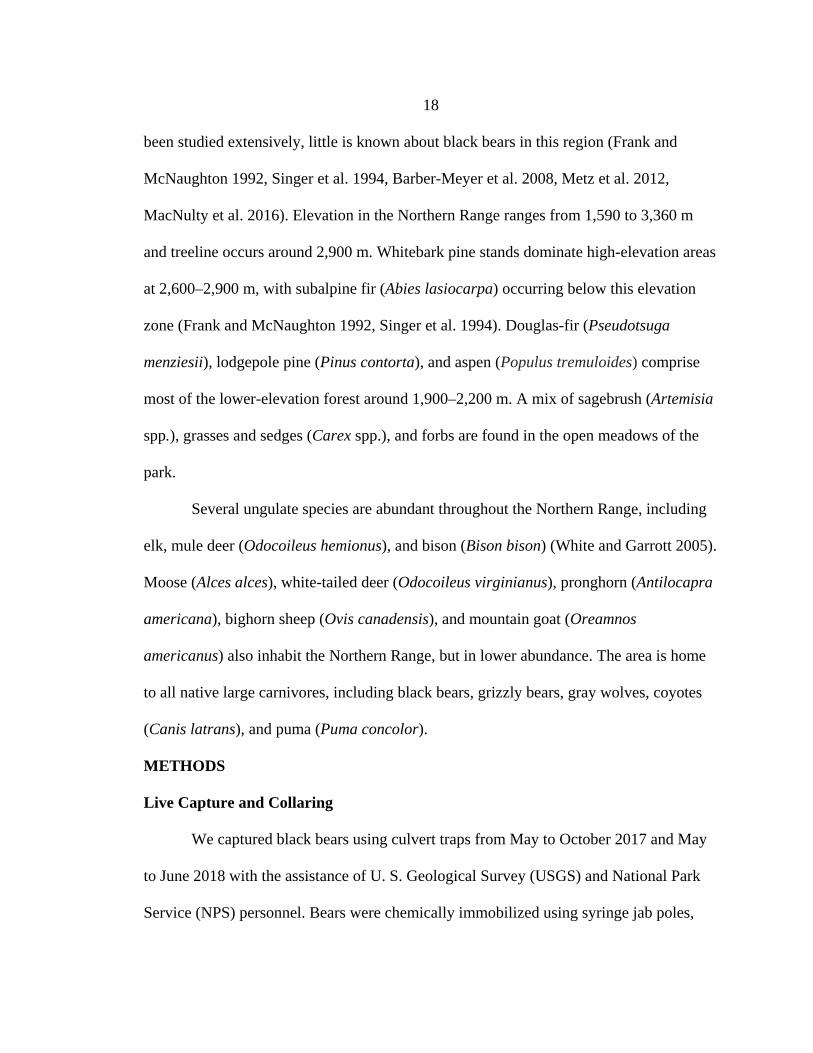
been studied extensively, little is known about black bears in this region (Frank and
McNaughton 1992, Singer et al. 1994, Barber-Meyer et al. 2008, Metz et al. 2012,
MacNulty et al. 2016). Elevation in the Northern Range ranges from 1,590 to 3,360 m
and treeline occurs around 2,900 m. Whitebark pine stands dominate high-elevation areas
at 2,600–2,900 m, with subalpine fir (Abies lasiocarpa) occurring below this elevation
zone (Frank and McNaughton 1992, Singer et al. 1994). Douglas-fir (Pseudotsuga
menziesii), lodgepole pine (Pinus contorta), and aspen (Populus tremuloides) comprise
most of the lower-elevation forest around 1,900–2,200 m. A mix of sagebrush (Artemisia
spp.), grasses and sedges (Carex spp.), and forbs are found in the open meadows of the
park.
Several ungulate species are abundant throughout the Northern Range, including
elk, mule deer (Odocoileus hemionus), and bison (Bison bison) (White and Garrott 2005).
Moose (Alces alces), white-tailed deer (Odocoileus virginianus), pronghorn (Antilocapra
americana), bighorn sheep (Ovis canadensis), and mountain goat (Oreamnos
americanus) also inhabit the Northern Range, but in lower abundance. The area is home
to all native large carnivores, including black bears, grizzly bears, gray wolves, coyotes
(Canis latrans), and puma (Puma concolor).
METHODS
Live Capture and Collaring
We captured black bears using culvert traps from May to October 2017 and May
to June 2018 with the assistance of U. S. Geological Survey (USGS) and National Park
Service (NPS) personnel. Bears were chemically immobilized using syringe jab poles,
19
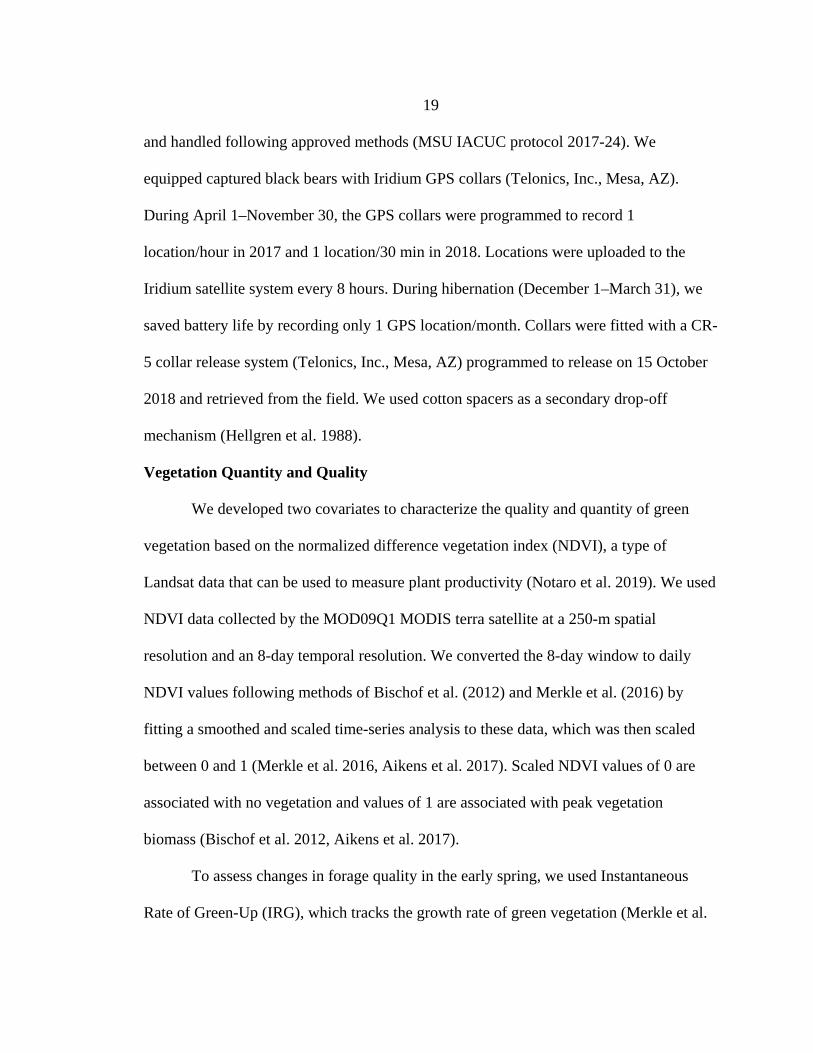
and handled following approved methods (MSU IACUC protocol 2017-24). We
equipped captured black bears with Iridium GPS collars (Telonics, Inc., Mesa, AZ).
During April 1–November 30, the GPS collars were programmed to record 1
location/hour in 2017 and 1 location/30 min in 2018. Locations were uploaded to the
Iridium satellite system every 8 hours. During hibernation (December 1–March 31), we
saved battery life by recording only 1 GPS location/month. Collars were fitted with a CR-
5 collar release system (Telonics, Inc., Mesa, AZ) programmed to release on 15 October
2018 and retrieved from the field. We used cotton spacers as a secondary drop-off
mechanism (Hellgren et al. 1988).
Vegetation Quantity and Quality
We developed two covariates to characterize the quality and quantity of green
vegetation based on the normalized difference vegetation index (NDVI), a type of
Landsat data that can be used to measure plant productivity (Notaro et al. 2019). We used
NDVI data collected by the MOD09Q1 MODIS terra satellite at a 250-m spatial
resolution and an 8-day temporal resolution. We converted the 8-day window to daily
NDVI values following methods of Bischof et al. (2012) and Merkle et al. (2016) by
fitting a smoothed and scaled time-series analysis to these data, which was then scaled
between 0 and 1 (Merkle et al. 2016, Aikens et al. 2017). Scaled NDVI values of 0 are
associated with no vegetation and values of 1 are associated with peak vegetation
biomass (Bischof et al. 2012, Aikens et al. 2017).
To assess changes in forage quality in the early spring, we used Instantaneous
Rate of Green-Up (IRG), which tracks the growth rate of green vegetation (Merkle et al.
20
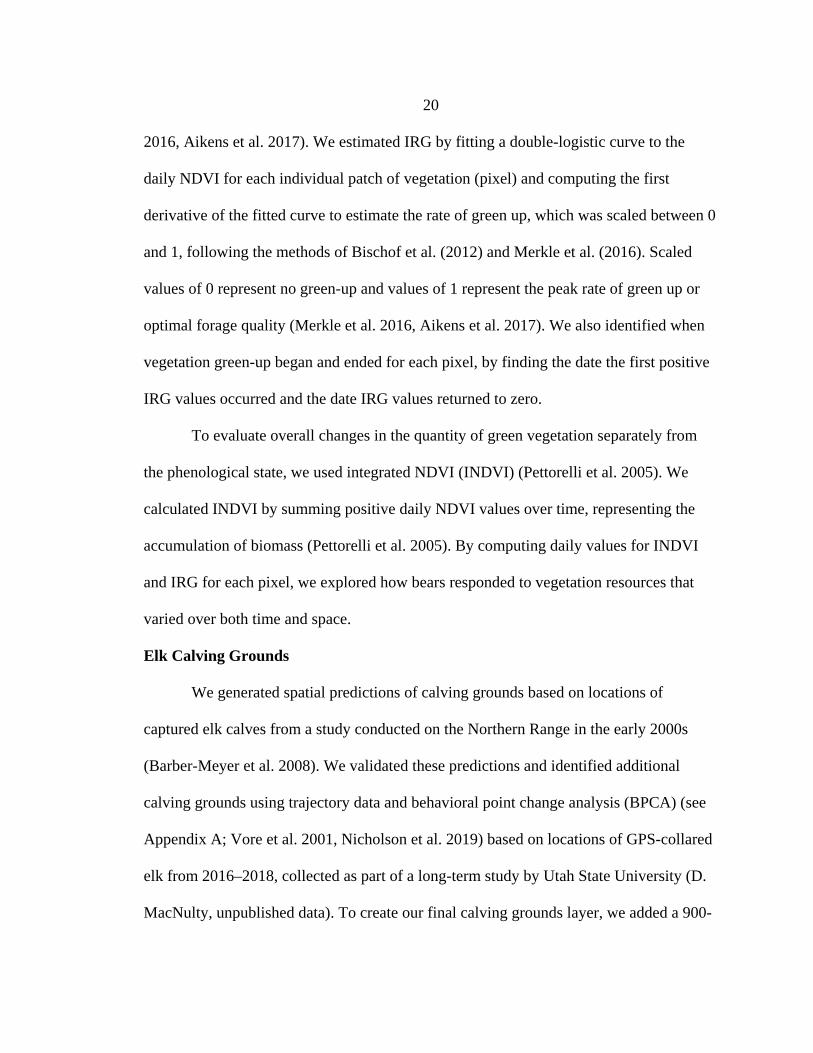
2016, Aikens et al. 2017). We estimated IRG by fitting a double-logistic curve to the
daily NDVI for each individual patch of vegetation (pixel) and computing the first
derivative of the fitted curve to estimate the rate of green up, which was scaled between 0
and 1, following the methods of Bischof et al. (2012) and Merkle et al. (2016). Scaled
values of 0 represent no green-up and values of 1 represent the peak rate of green up or
optimal forage quality (Merkle et al. 2016, Aikens et al. 2017). We also identified when
vegetation green-up began and ended for each pixel, by finding the date the first positive
IRG values occurred and the date IRG values returned to zero.
To evaluate overall changes in the quantity of green vegetation separately from
the phenological state, we used integrated NDVI (INDVI) (Pettorelli et al. 2005). We
calculated INDVI by summing positive daily NDVI values over time, representing the
accumulation of biomass (Pettorelli et al. 2005). By computing daily values for INDVI
and IRG for each pixel, we explored how bears responded to vegetation resources that
varied over both time and space.
Elk Calving Grounds
We generated spatial predictions of calving grounds based on locations of
captured elk calves from a study conducted on the Northern Range in the early 2000s
(Barber-Meyer et al. 2008). We validated these predictions and identified additional
calving grounds using trajectory data and behavioral point change analysis (BPCA) (see
Appendix A; Vore et al. 2001, Nicholson et al. 2019) based on locations of GPS-collared
elk from 2016–2018, collected as part of a long-term study by Utah State University (D.
MacNulty, unpublished data). To create our final calving grounds layer, we added a 900-
21
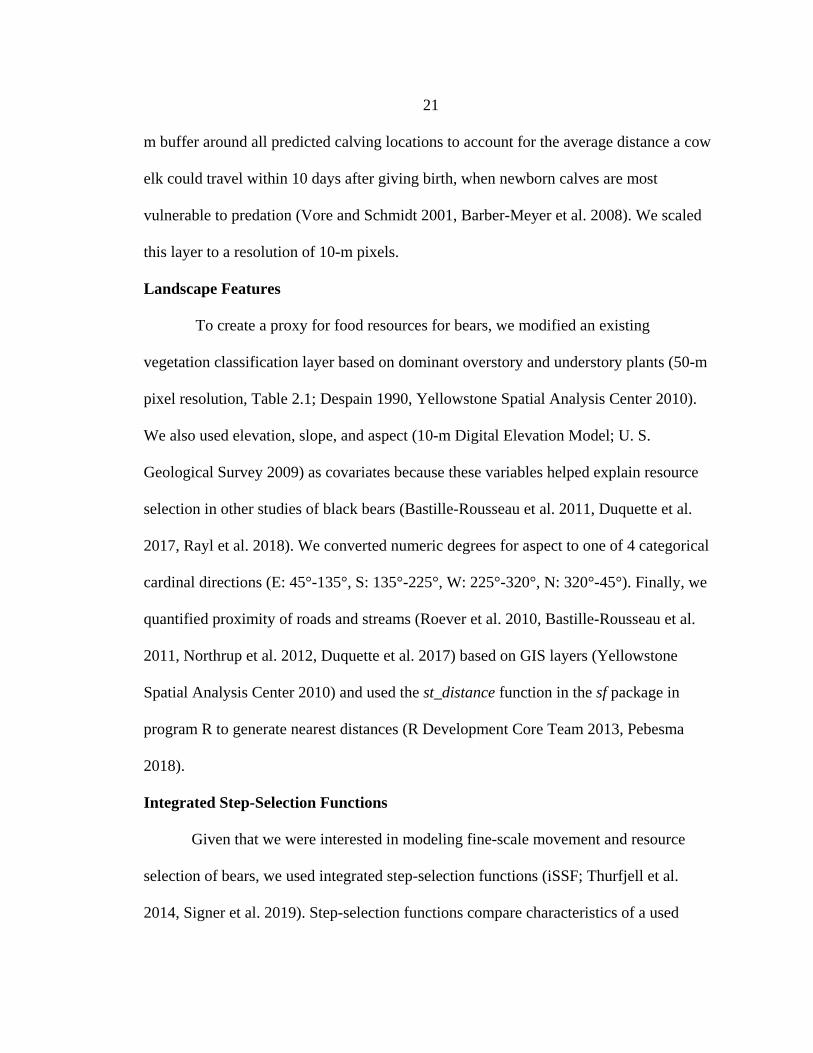
m buffer around all predicted calving locations to account for the average distance a cow
elk could travel within 10 days after giving birth, when newborn calves are most
vulnerable to predation (Vore and Schmidt 2001, Barber-Meyer et al. 2008). We scaled
this layer to a resolution of 10-m pixels.
Landscape Features
To create a proxy for food resources for bears, we modified an existing
vegetation classification layer based on dominant overstory and understory plants (50-m
pixel resolution, Table 2.1; Despain 1990, Yellowstone Spatial Analysis Center 2010).
We also used elevation, slope, and aspect (10-m Digital Elevation Model; U. S.
Geological Survey 2009) as covariates because these variables helped explain resource
selection in other studies of black bears (Bastille-Rousseau et al. 2011, Duquette et al.
2017, Rayl et al. 2018). We converted numeric degrees for aspect to one of 4 categorical
cardinal directions (E: 45°-135°, S: 135°-225°, W: 225°-320°, N: 320°-45°). Finally, we
quantified proximity of roads and streams (Roever et al. 2010, Bastille-Rousseau et al.
2011, Northrup et al. 2012, Duquette et al. 2017) based on GIS layers (Yellowstone
Spatial Analysis Center 2010) and used the st_distance function in the sf package in
program R to generate nearest distances (R Development Core Team 2013, Pebesma
2018).
Integrated Step-Selection Functions
Given that we were interested in modeling fine-scale movement and resource
selection of bears, we used integrated step-selection functions (iSSF; Thurfjell et al.
2014, Signer et al. 2019). Step-selection functions compare characteristics of a used
22
(bear) location to ≥1 paired available locations (Thomas and Taylor 2006, Thurfjell et al.
2014, Signer et al. 2019). We used the amt package in R (R Development Core Team
2013, Signer et al. 2019) to generate random available locations for each used location
based on the distribution of turn angles and distances traveled between successive
locations, known as steps, of our collared bears (Fortin et al. 2005, Thurfjell et al. 2014,
Merkle et al. 2016). Although collars recorded a location every 1/2 or 1 hour, not every
GPS fix was successful. Based on the distribution of successful fixes, we set the step
length to 2 hours, which allowed us to generate consistent steps for each bear. We
incorporated a covariate for the distance between successive used locations and the
distance between used to available locations as a resource-independent movement kernel,
to account for the potential that animal movement is conditional on resource selection
(Forester et al. 2009, Signer et al. 2019). To determine the appropriate ratio of paired
available to used locations, we built models with ratios of 1 used location paired with 5,
10, 20, or 30 available locations and compared coefficient estimates (Northrup et al.
2013, Thurfjell et al. 2014). We found that estimates were consistent for models with a
1:10 ratio of used to available locations (Forester et al. 2009, Thurfjell et al. 2014, Peck et
al. 2017).
We used conditional logistic regression to assess whether bears are selecting
locations with particular resources disproportionately to what is available on the
landscape, conditional on the individual bear’s movements (fit_issf function in the amt
package, Signer et al. 2019). All continuous covariates were centered and scaled before
fitting models. Categorical covariates were compared to a baseline level.
23
To explore the importance of the green wave for resource selection by black
bears, we restricted our analysis to data associated with spring green up. We selected bear
locations between April 27 to June 8, which were the 2nd and 3rd quartile dates for spring
green-up for all collared bears (Merkle et al. 2016). We created a base model (base) that
included: INDVI, distance to nearest road, distance to nearest stream, vegetation
community, elevation, slope, categorical aspect, and distance between successive
locations. We compared this to a second model that incorporated IRG (base + IRG) using
small-sample corrected Akaike’s Information Criterion (AICc) (Burnham and Anderson
2004, Merkle et al. 2016). We also compared the dates when a patch of vegetation
reached peak IRG to the date a bear used that patch of vegetation, as a way to assess how
well bears followed the green wave (Merkle et al. 2016, Aikens et al. 2017).
To understand whether black bears were more likely to select locations near
calving grounds (and track the calving wave), we computed the Euclidean distance
between each used or random location and the nearest calving ground using the
st_distance function in the sf package in program R (R Development Core Team 2013,
Pebesma 2018). We used this approach to assess the selection of the calving grounds
because distances to fixed or linear features can better assess selection than categorical
covariates with iSSF models (Thurfjell et al. 2014, Peck et al. 2017). Locations within the
buffered calving grounds were represented by negative distance values and locations
outside of the calving grounds were represented by positive distances. We restricted data
to May 15–June 30, the elk calving season for the Northern Range (Barber-Meyer et al.
2008) and again fit a base model (base) that included: INDVI, distance to nearest road,
24
distance to nearest stream, vegetation community, elevation, slope, categorical aspect,
and distance between successive locations. We compared this model to a second model
that included the covariate identifying the distance to elk calving grounds (base +
ElkCalf) using AICc (Bastille-Rousseau et al. 2011, Rayl et al. 2018).
RESULTS
We used location data from 7 of 8 GPS-collared black bears (1 adult male, 1 sub-
adult male, 2 sub-adult females, 4 adult females) in our resource selection models. We
excluded 1 adult female bear because recorded locations did not meet our requirements
for the time frame of these analyses. Based on these 7 bears, we analyzed 3,287 used
locations paired with 32,870 available locations for our green wave model and 6,268 used
locations paired with 62,680 available locations for the calving wave model.
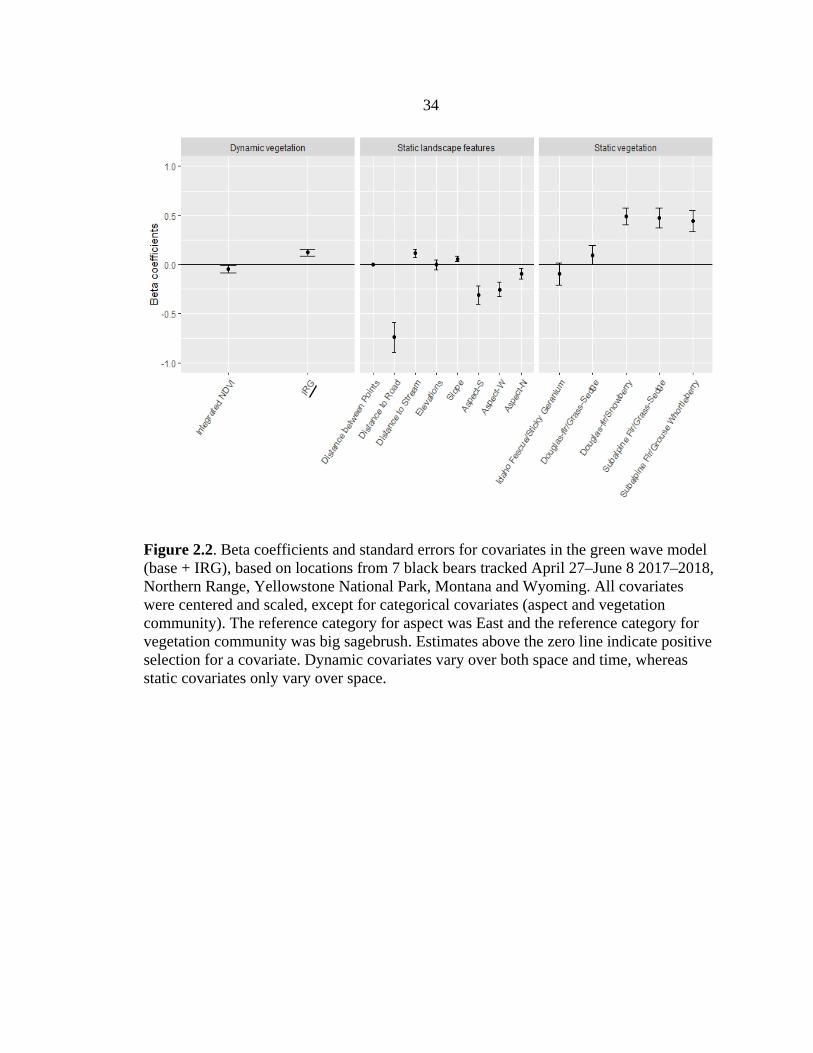
Green wave
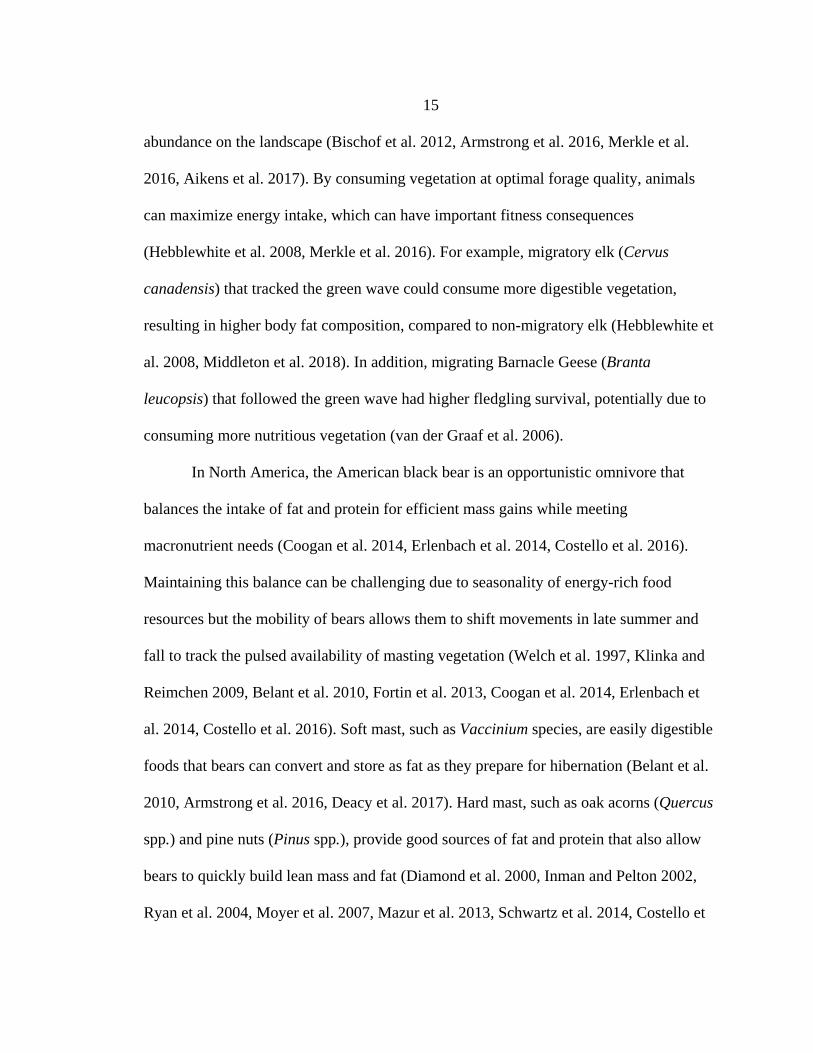
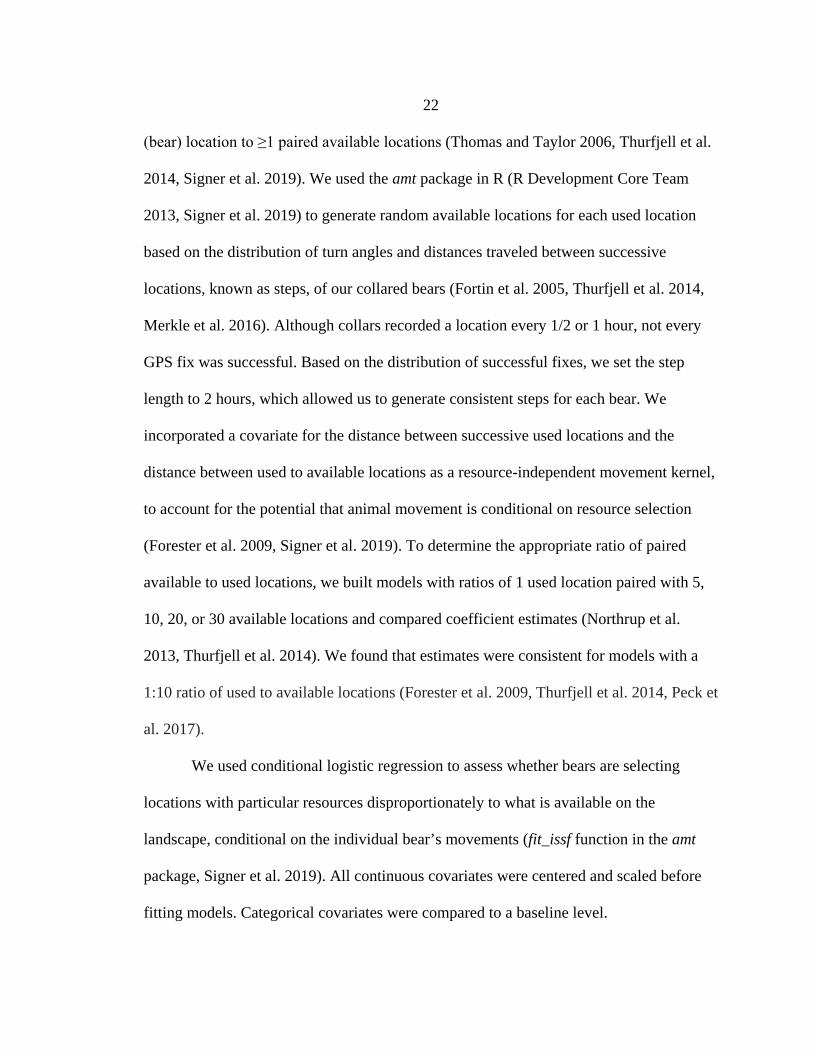
The model that included the IRG covariate (base + IRG) better described the data
than the base model (ΔAICc = 9.59; Table 2.2), suggesting that black bears follow the
green wave on the Northern Range. Bears selected locations with higher values of IRG
(forage quality), but lower INDVI (vegetation quantity) compared with available
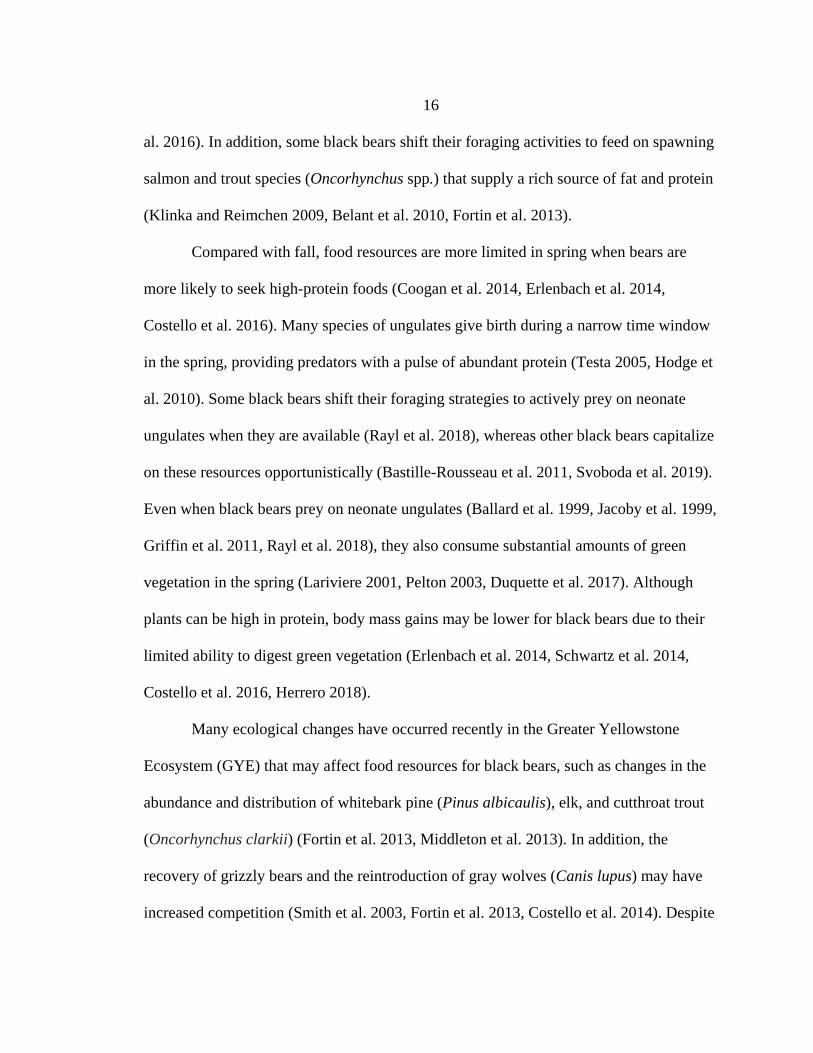
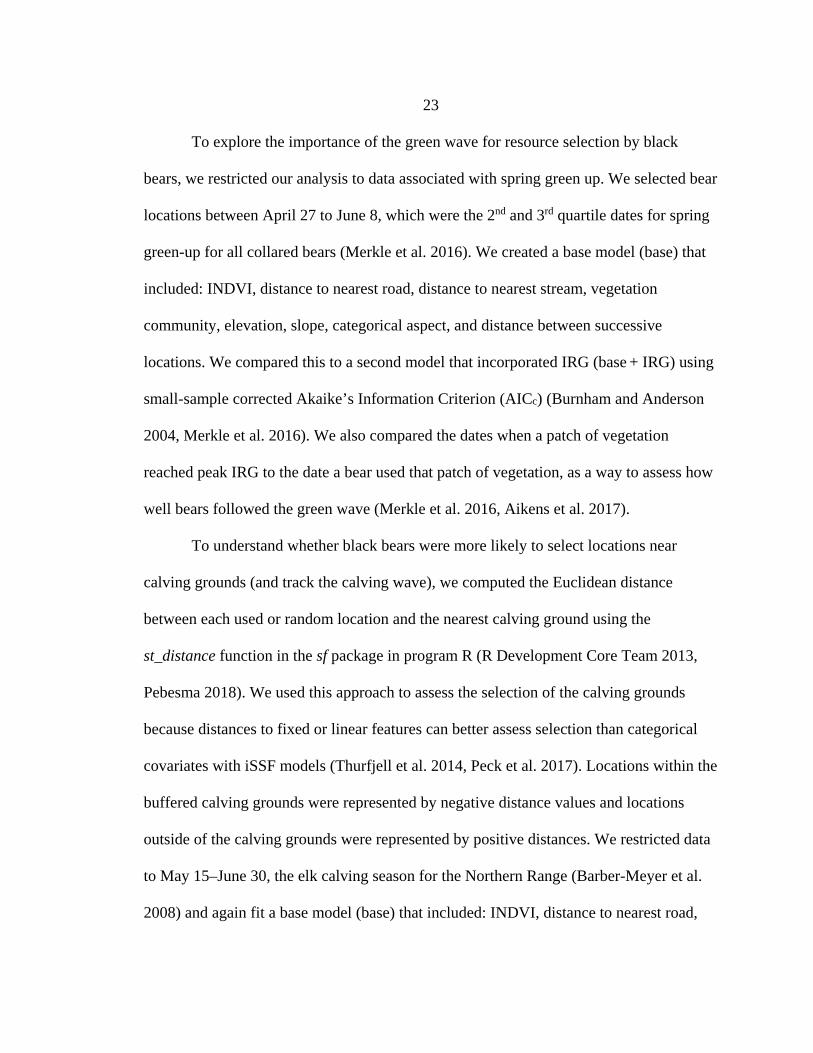
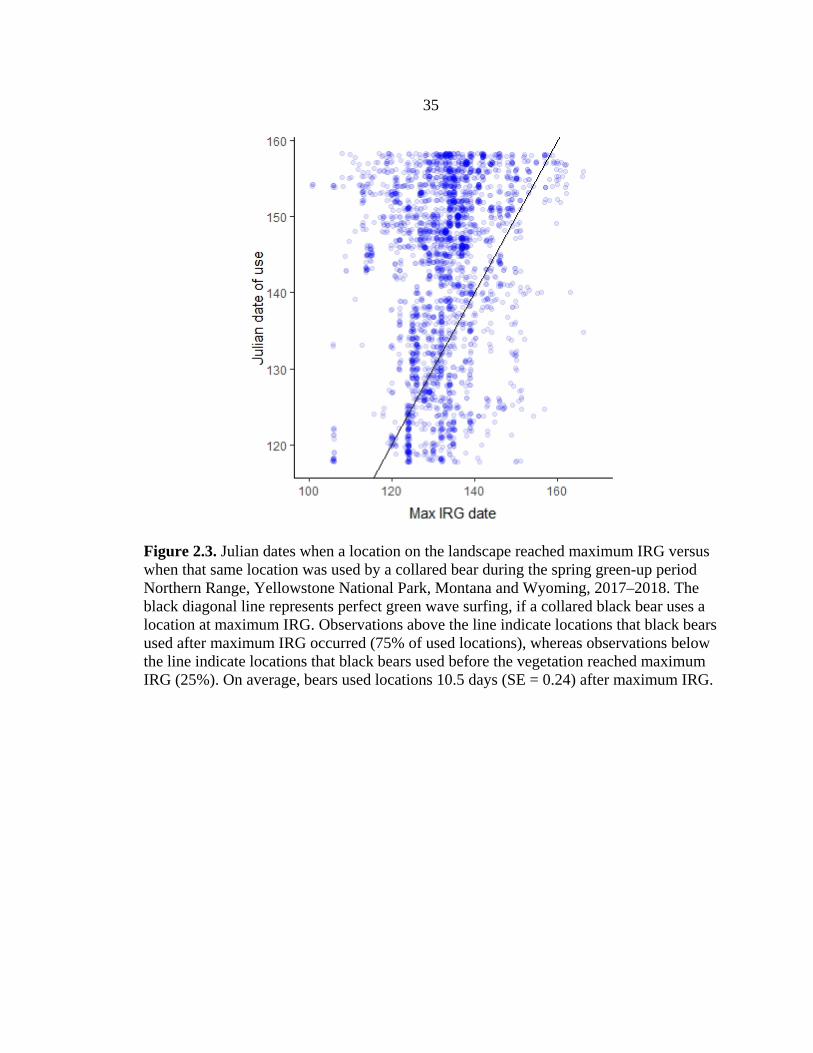
resources (Figure 2.2). Bears tended to use the trailing edge of the green wave, as 75% of
the locations were used after peak IRG (Figure 2.3); these patterns varied but overall
were fairly consistent for different vegetation communities and with varying distances
from landscape features (Appendix B; Figs. B1–B3). On average, bears used locations
10.5 days (SE = 0.24, range = 35 days before to 73 days after) after vegetation reached
peak quality (Figure 2.3).
25
Of the static landscape features, black bears showed the strongest selection for
areas closer to roads (mean = 907.6 m, range = 0 – 9971) and for forested vegetation
communities over non-forested communities, especially communities dominated by
subalpine fir and Douglas fir (Table 2.1, Figure 2.2). Black bears showed some selection
for areas farther from streams (mean = 376.2 m, range = 0 – 1527; Figure 2.2), with
steeper slopes (mean = 13.3°, range = 0 – 71.8), and preferring eastern aspects (Figure
2.2).
Elk calving wave
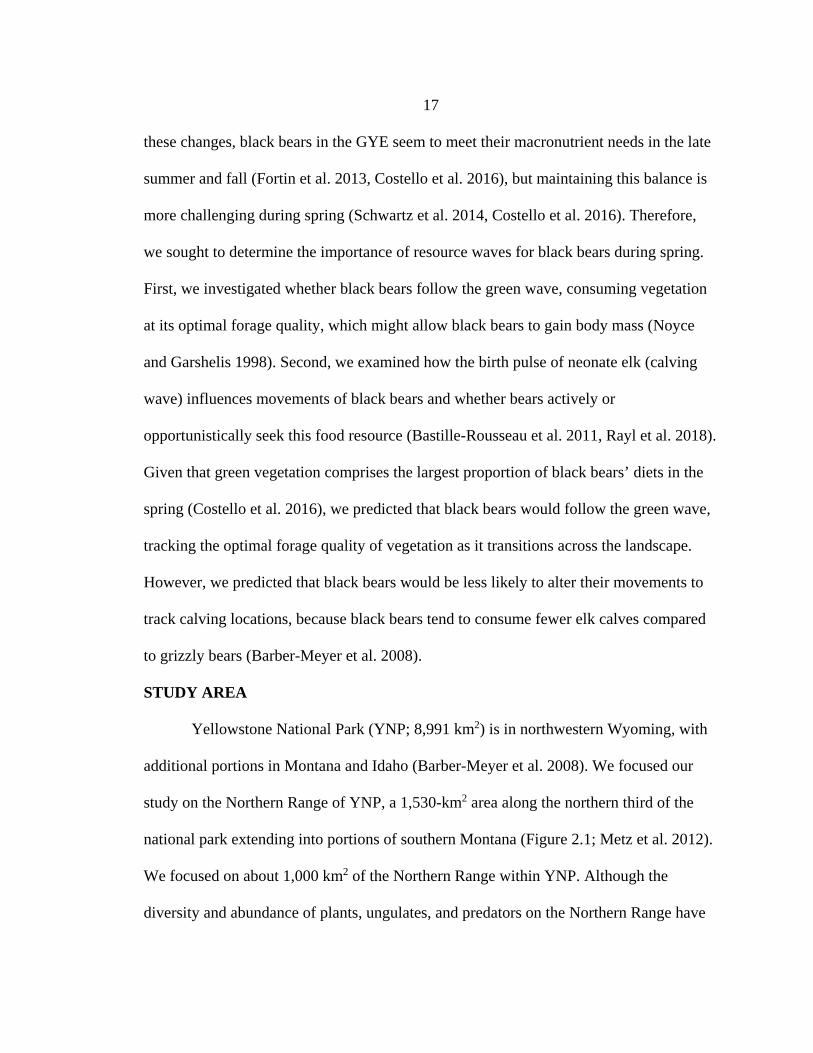
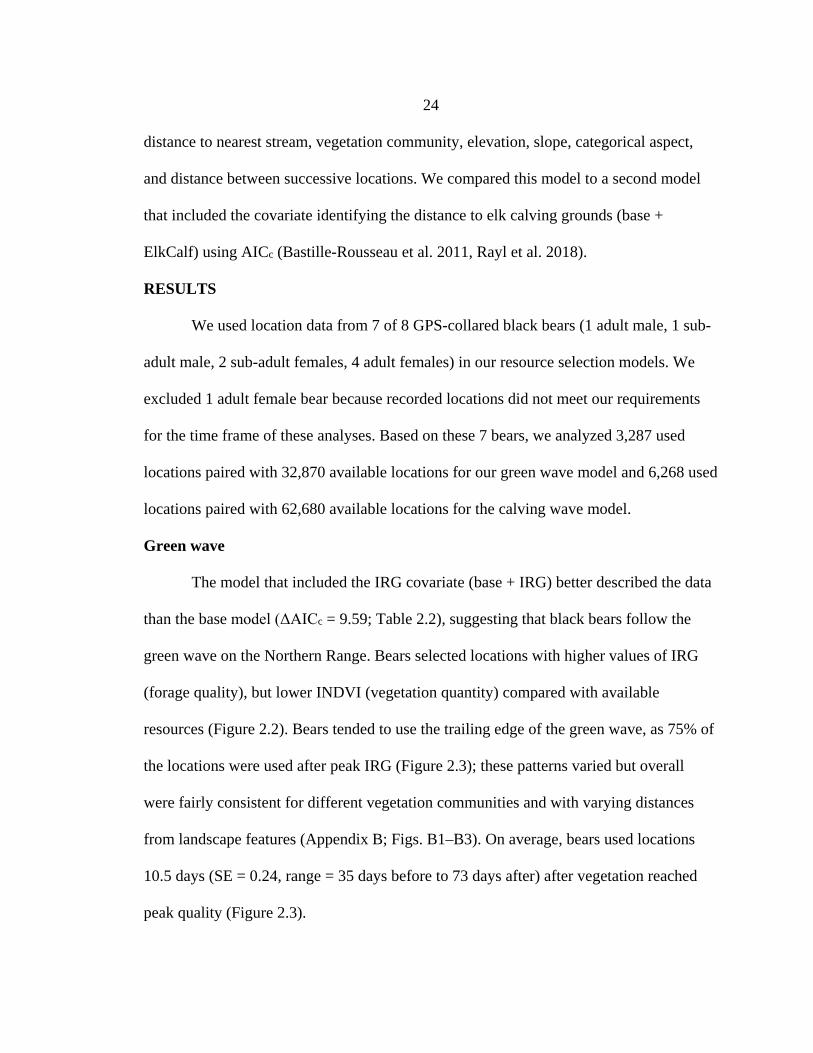
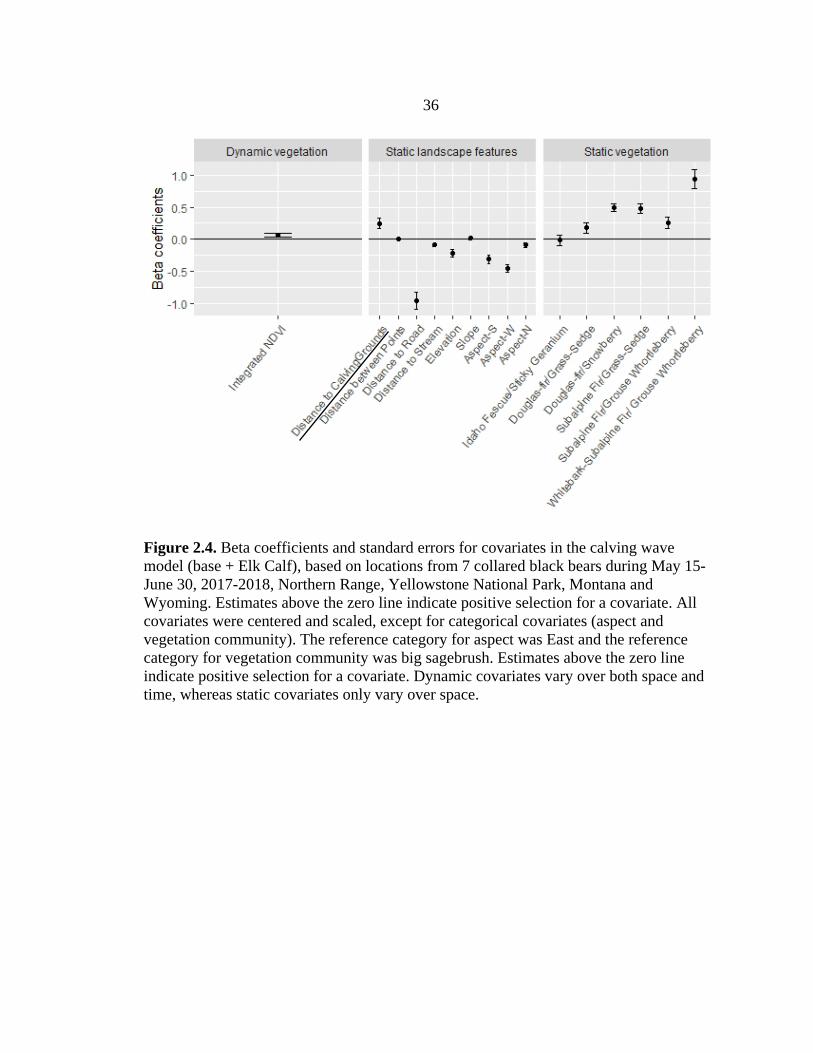
Although the model that included the calving grounds covariate (base + ElkCalf)
better helped to explain resource selection by black bears compared to the base model
(ΔAICc = 10.74, Table 2.2), bears selected areas farther from the elk calving grounds
with higher INDVI (Figure 2.4). Bears showed the strongest selection for forested
communities, especially those dominated by whitebark pine, over non-forested
communities, and also strongly selected for areas closer to roads (mean = 1462.6 m,
range = 0 – 15,557 m; Figure 2.4). Bears also showed some selection for locations with
lower elevations (mean = 2193 m, range = 1699 – 3084 m), easterly aspects, and that
were closer to streams (mean = 166.6 m, range = 0 – 1,075 m) (Figure 2.4).
Based on our spatial predictions, calving grounds generally were in non-forested
communities with lower average INDVI values, whereas the collared black bears
generally used locations in forested communities with higher average INDVI (Table 2.3).
The average slope, aspect, and elevation of calving grounds were similar to locations
used by black bears (Table 2.3).
26
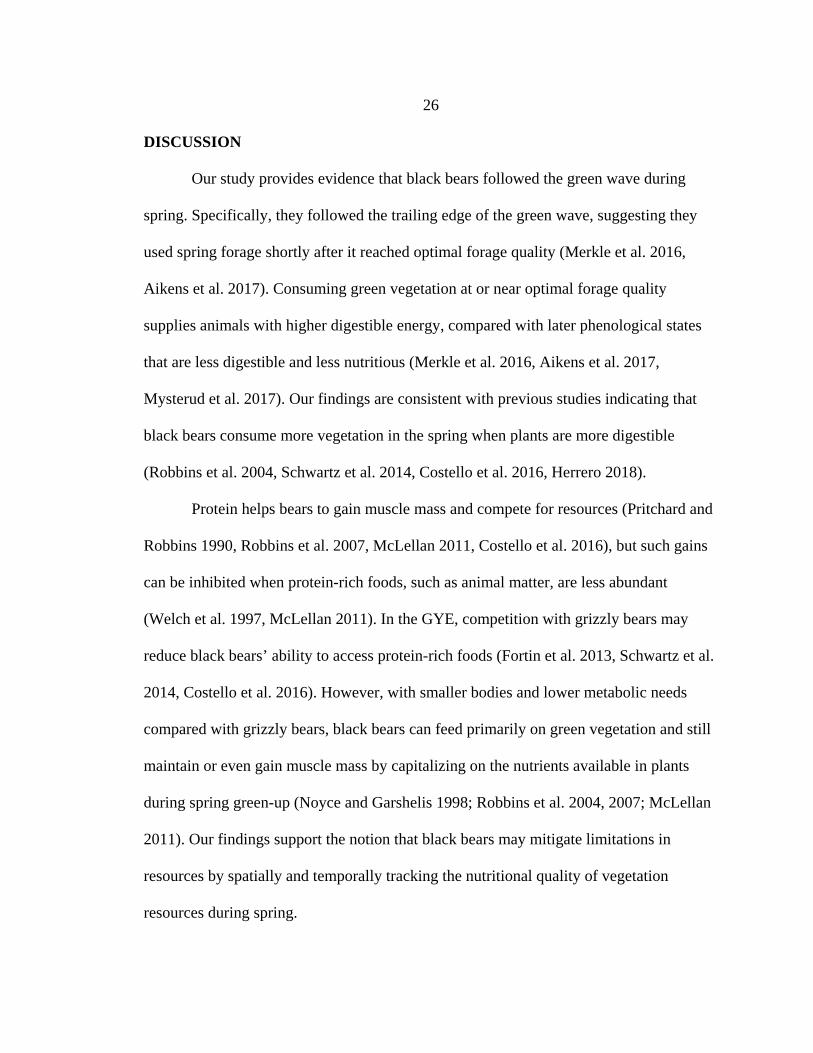
DISCUSSION
Our study provides evidence that black bears followed the green wave during
spring. Specifically, they followed the trailing edge of the green wave, suggesting they
used spring forage shortly after it reached optimal forage quality (Merkle et al. 2016,
Aikens et al. 2017). Consuming green vegetation at or near optimal forage quality
supplies animals with higher digestible energy, compared with later phenological states
that are less digestible and less nutritious (Merkle et al. 2016, Aikens et al. 2017,
Mysterud et al. 2017). Our findings are consistent with previous studies indicating that
black bears consume more vegetation in the spring when plants are more digestible
(Robbins et al. 2004, Schwartz et al. 2014, Costello et al. 2016, Herrero 2018).
Protein helps bears to gain muscle mass and compete for resources (Pritchard and
Robbins 1990, Robbins et al. 2007, McLellan 2011, Costello et al. 2016), but such gains
can be inhibited when protein-rich foods, such as animal matter, are less abundant
(Welch et al. 1997, McLellan 2011). In the GYE, competition with grizzly bears may
reduce black bears’ ability to access protein-rich foods (Fortin et al. 2013, Schwartz et al.
2014, Costello et al. 2016). However, with smaller bodies and lower metabolic needs
compared with grizzly bears, black bears can feed primarily on green vegetation and still
maintain or even gain muscle mass by capitalizing on the nutrients available in plants
during spring green-up (Noyce and Garshelis 1998; Robbins et al. 2004, 2007; McLellan
2011). Our findings support the notion that black bears may mitigate limitations in
resources by spatially and temporally tracking the nutritional quality of vegetation
resources during spring.
27
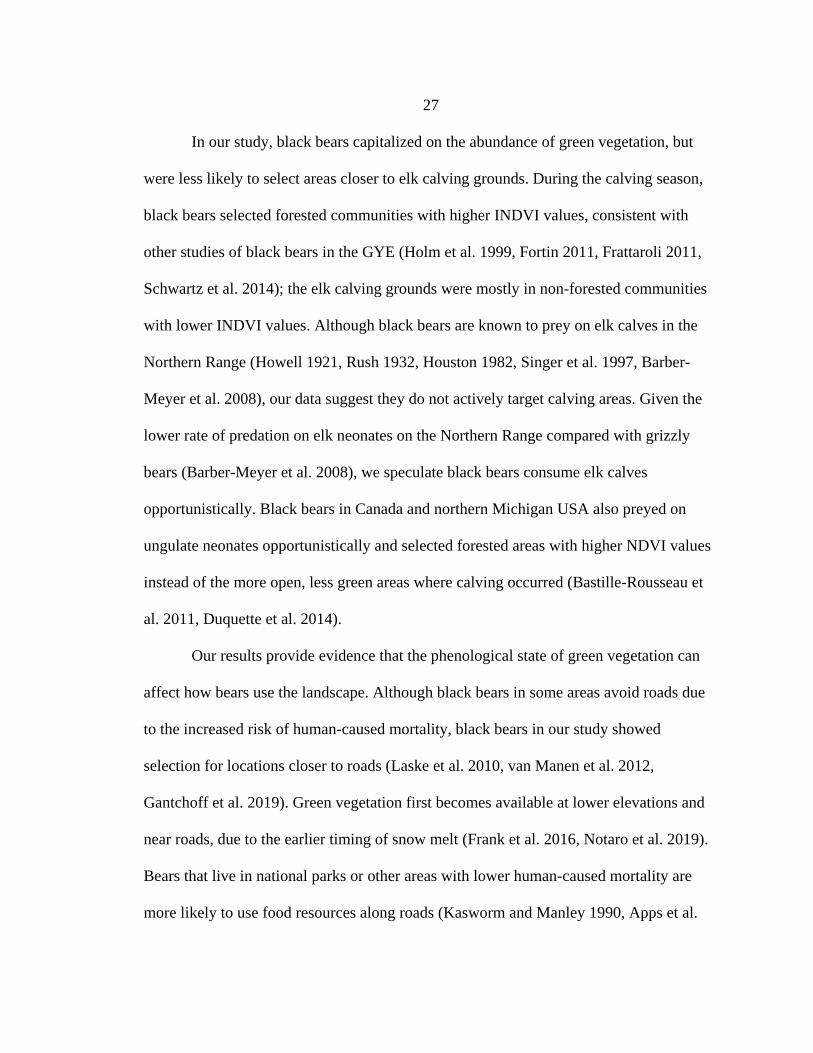
In our study, black bears capitalized on the abundance of green vegetation, but
were less likely to select areas closer to elk calving grounds. During the calving season,
black bears selected forested communities with higher INDVI values, consistent with
other studies of black bears in the GYE (Holm et al. 1999, Fortin 2011, Frattaroli 2011,
Schwartz et al. 2014); the elk calving grounds were mostly in non-forested communities
with lower INDVI values. Although black bears are known to prey on elk calves in the
Northern Range (Howell 1921, Rush 1932, Houston 1982, Singer et al. 1997, Barber-
Meyer et al. 2008), our data suggest they do not actively target calving areas. Given the
lower rate of predation on elk neonates on the Northern Range compared with grizzly
bears (Barber-Meyer et al. 2008), we speculate black bears consume elk calves
opportunistically. Black bears in Canada and northern Michigan USA also preyed on
ungulate neonates opportunistically and selected forested areas with higher NDVI values
instead of the more open, less green areas where calving occurred (Bastille-Rousseau et
al. 2011, Duquette et al. 2014).
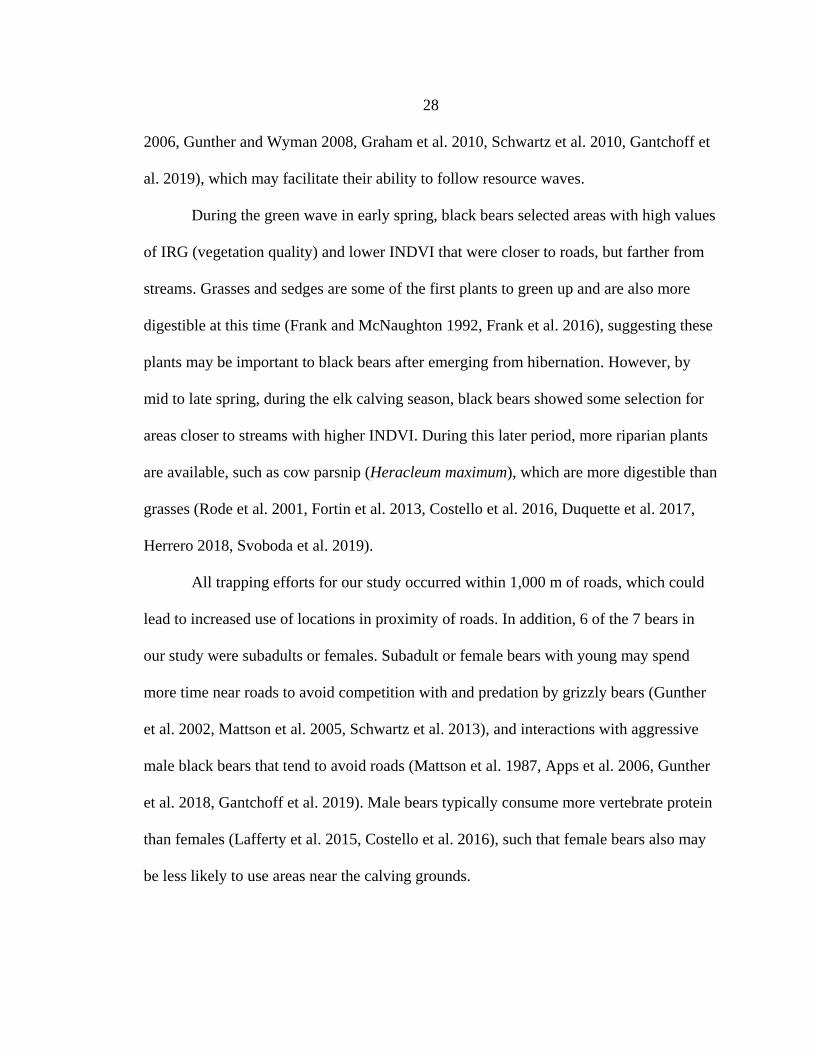
Our results provide evidence that the phenological state of green vegetation can
affect how bears use the landscape. Although black bears in some areas avoid roads due
to the increased risk of human-caused mortality, black bears in our study showed
selection for locations closer to roads (Laske et al. 2010, van Manen et al. 2012,
Gantchoff et al. 2019). Green vegetation first becomes available at lower elevations and
near roads, due to the earlier timing of snow melt (Frank et al. 2016, Notaro et al. 2019).
Bears that live in national parks or other areas with lower human-caused mortality are
more likely to use food resources along roads (Kasworm and Manley 1990, Apps et al.
28
2006, Gunther and Wyman 2008, Graham et al. 2010, Schwartz et al. 2010, Gantchoff et
al. 2019), which may facilitate their ability to follow resource waves.
During the green wave in early spring, black bears selected areas with high values
of IRG (vegetation quality) and lower INDVI that were closer to roads, but farther from
streams. Grasses and sedges are some of the first plants to green up and are also more
digestible at this time (Frank and McNaughton 1992, Frank et al. 2016), suggesting these
plants may be important to black bears after emerging from hibernation. However, by
mid to late spring, during the elk calving season, black bears showed some selection for
areas closer to streams with higher INDVI. During this later period, more riparian plants
are available, such as cow parsnip (Heracleum maximum), which are more digestible than
grasses (Rode et al. 2001, Fortin et al. 2013, Costello et al. 2016, Duquette et al. 2017,
Herrero 2018, Svoboda et al. 2019).
All trapping efforts for our study occurred within 1,000 m of roads, which could
lead to increased use of locations in proximity of roads. In addition, 6 of the 7 bears in
our study were subadults or females. Subadult or female bears with young may spend
more time near roads to avoid competition with and predation by grizzly bears (Gunther
et al. 2002, Mattson et al. 2005, Schwartz et al. 2013), and interactions with aggressive
male black bears that tend to avoid roads (Mattson et al. 1987, Apps et al. 2006, Gunther
et al. 2018, Gantchoff et al. 2019). Male bears typically consume more vertebrate protein
than females (Lafferty et al. 2015, Costello et al. 2016), such that female bears also may
be less likely to use areas near the calving grounds.
29
Although black bears have the ability to consume a wide array of foods, we found
bears on the Northern Range capitalized on nutritional quality of green vegetation, which
may be an effective strategy to compete for resources in time and space. Additionally, we
found that vegetative resources drove black bear movements more than the availability of
protein-rich elk calves. Furthermore, tolerance of human activity (e.g., in a national park)
may facilitate the ability of bears to follow resource waves. This increased understanding
of how the availability of resources influenced bears activity, will allow managers to
better predict how bears may shift their diets and movements in response to future
changes in availability and distribution of food resources.
ACKNOWLEDGMENTS
We are grateful to the Yellowstone Bear Management Office and the Interagency Grizzly
Bear Study Team for all of their support. Elise Loggers, Megan Wright, Lauren Bryant,
Samantha Schmidt, Katie Piecora, Hitomi Okada, Nikki Tatton, Neal Hurst, Leia
Hayward, Amelia Hiorns helped set up and monitor trap sites. Annie Carlson
(Yellowstone Research Permit Office) helped us secure our research permits. Dan
MacNulty (Utah State University) shared elk location data under NSF grant # (DEB-
1245373) and Shannon Barber-Meyer (USGS Northern Prairie Wildlife Research Center)
shared elk calf capture locations; these data were instrumental for portions of this study.
Finally, this research was supported with funding from Yellowstone Forever.
30
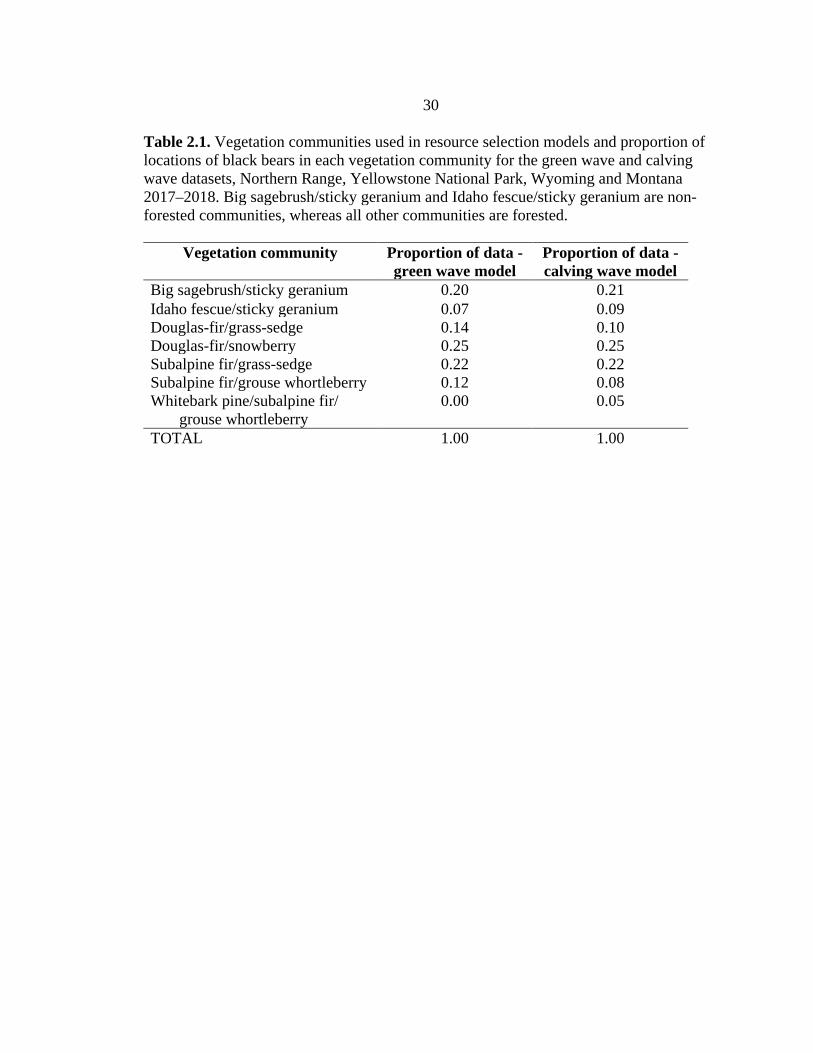
Table 2.1. Vegetation communities used in resource selection models and proportion of locations of black bears in each vegetation community for the green wave and calving wave datasets, Northern Range, Yellowstone National Park, Wyoming and Montana 2017–2018. Big sagebrush/sticky geranium and Idaho fescue/sticky geranium are non-forested communities, whereas all other communities are forested.
Vegetation community
Proportion of data - green wave model
Proportion of data - calving wave model
Big sagebrush/sticky geranium 0.20 0.21 Idaho fescue/sticky geranium 0.07 0.09 Douglas-fir/grass-sedge 0.14 0.10 Douglas-fir/snowberry 0.25 0.25 Subalpine fir/grass-sedge 0.22 0.22 Subalpine fir/grouse whortleberry 0.12 0.08 Whitebark pine/subalpine fir/
grouse whortleberry 0.00 0.05
TOTAL 1.00 1.00
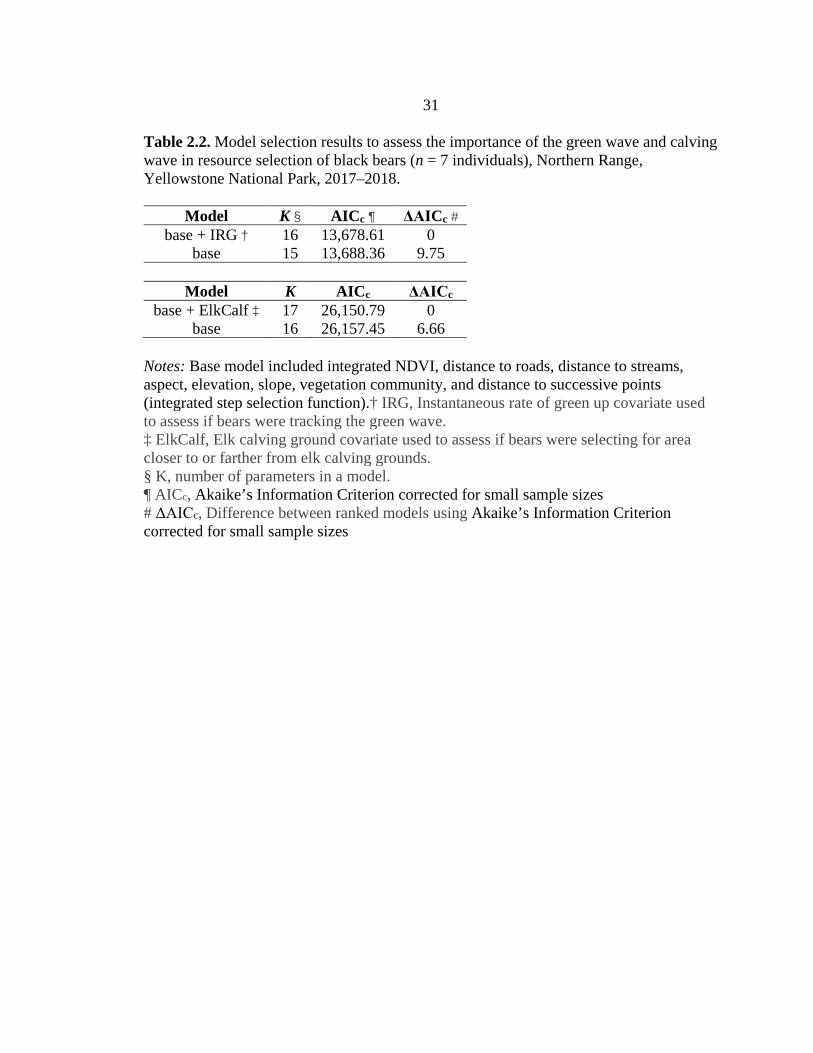
31
Table 2.2. Model selection results to assess the importance of the green wave and calving wave in resource selection of black bears (n = 7 individuals), Northern Range, Yellowstone National Park, 2017–2018.
Model K § AICc ¶ ΔAICc # base + IRG † 16 13,678.61 0
base 15 13,688.36 9.75
Model K AICc ΔAICc base + ElkCalf ‡ 17 26,150.79 0
base 16 26,157.45 6.66 Notes: Base model included integrated NDVI, distance to roads, distance to streams, aspect, elevation, slope, vegetation community, and distance to successive points (integrated step selection function).† IRG, Instantaneous rate of green up covariate used to assess if bears were tracking the green wave. ‡ ElkCalf, Elk calving ground covariate used to assess if bears were selecting for area closer to or farther from elk calving grounds. § K, number of parameters in a model. ¶ AICc, Akaike’s Information Criterion corrected for small sample sizes # ΔAICc, Difference between ranked models using Akaike’s Information Criterion corrected for small sample sizes
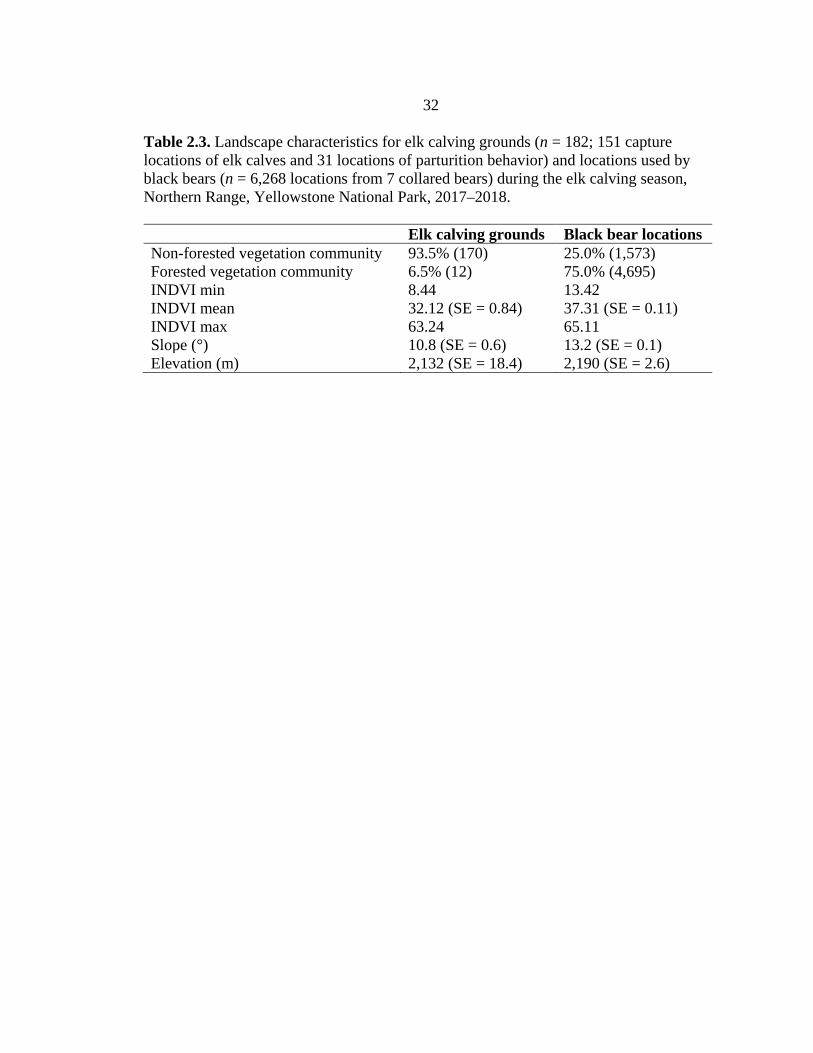
32
Table 2.3. Landscape characteristics for elk calving grounds (n = 182; 151 capture locations of elk calves and 31 locations of parturition behavior) and locations used by black bears (n = 6,268 locations from 7 collared bears) during the elk calving season, Northern Range, Yellowstone National Park, 2017–2018. Elk calving grounds Black bear locations Non-forested vegetation community 93.5% (170) 25.0% (1,573) Forested vegetation community 6.5% (12) 75.0% (4,695) INDVI min 8.44 13.42 INDVI mean 32.12 (SE = 0.84) 37.31 (SE = 0.11) INDVI max 63.24 65.11 Slope (°) 10.8 (SE = 0.6) 13.2 (SE = 0.1) Elevation (m) 2,132 (SE = 18.4) 2,190 (SE = 2.6)
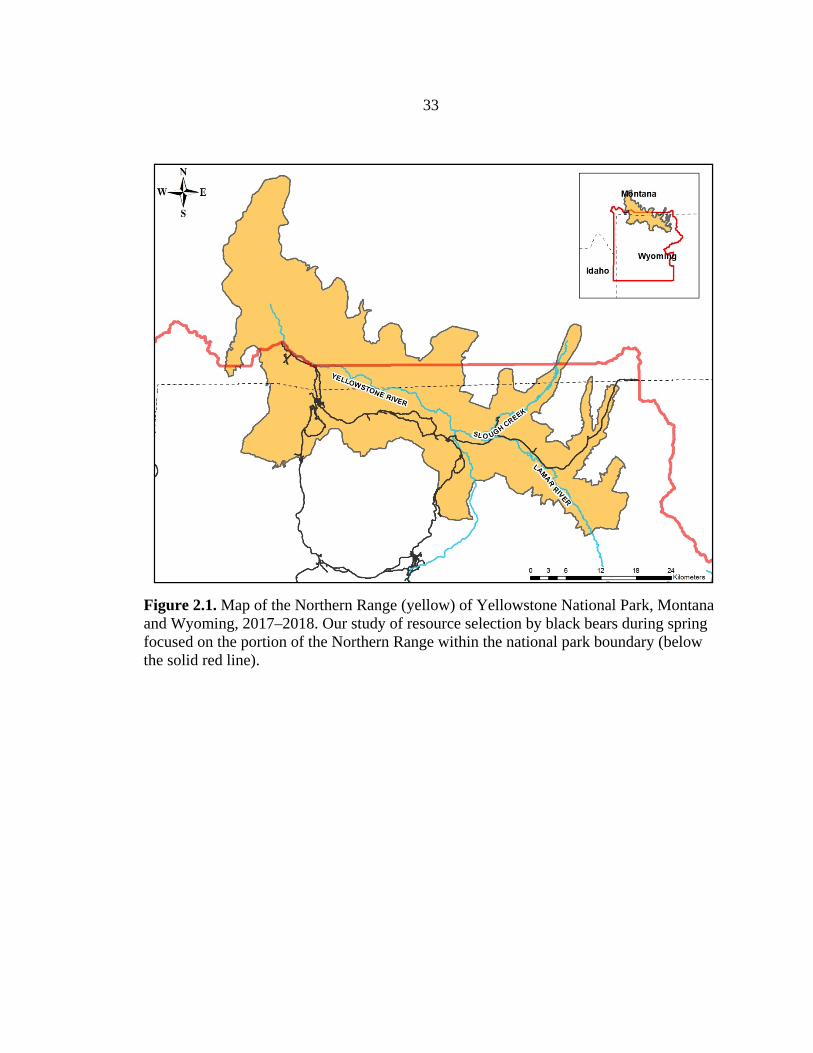
33
Figure 2.1. Map of the Northern Range (yellow) of Yellowstone National Park, Montana and Wyoming, 2017–2018. Our study of resource selection by black bears during spring focused on the portion of the Northern Range within the national park boundary (below the solid red line).
34
Figure 2.2. Beta coefficients and standard errors for covariates in the green wave model (base + IRG), based on locations from 7 black bears tracked April 27–June 8 2017–2018, Northern Range, Yellowstone National Park, Montana and Wyoming. All covariates were centered and scaled, except for categorical covariates (aspect and vegetation community). The reference category for aspect was East and the reference category for vegetation community was big sagebrush. Estimates above the zero line indicate positive selection for a covariate. Dynamic covariates vary over both space and time, whereas static covariates only vary over space.
35
Figure 2.3. Julian dates when a location on the landscape reached maximum IRG versus when that same location was used by a collared bear during the spring green-up period Northern Range, Yellowstone National Park, Montana and Wyoming, 2017–2018. The black diagonal line represents perfect green wave surfing, if a collared black bear uses a location at maximum IRG. Observations above the line indicate locations that black bears used after maximum IRG occurred (75% of used locations), whereas observations below the line indicate locations that black bears used before the vegetation reached maximum IRG (25%). On average, bears used locations 10.5 days (SE = 0.24) after maximum IRG.
36
Figure 2.4. Beta coefficients and standard errors for covariates in the calving wave model (base + Elk Calf), based on locations from 7 collared black bears during May 15-June 30, 2017-2018, Northern Range, Yellowstone National Park, Montana and Wyoming. Estimates above the zero line indicate positive selection for a covariate. All covariates were centered and scaled, except for categorical covariates (aspect and vegetation community). The reference category for aspect was East and the reference category for vegetation community was big sagebrush. Estimates above the zero line indicate positive selection for a covariate. Dynamic covariates vary over both space and time, whereas static covariates only vary over space.
37
LITERATURE CITED
Aikens, E. O., M. J. Kauffman, J. A. Merkle, S. P. H. Dwinnell, G. L. Fralick, and K. L. Monteith. 2017. The greenscape shapes surfing of resource waves in a large migratory herbivore. Ecology Letters 20:741–750.
Apps, C. D., B. N. McLellan, and J. G. Woods. 2006. Landscape partitioning and spatial inferences of competition between black and grizzly bears. Ecography 29:561–572.
Armstrong, J. B., G. Takimoto, D. E. Schindler, M. M. Hayes, and M. J. Kauffman. 2016. Resource waves: phenological diversity enhances foraging opportunities for mobile consumers. Ecology 97:1099–1112.
Ballard, W. B., H. A. Whitlaw, S. J. Young, R. A. Jenkins, and G. J. Forbes. 1999. Predation and survival of white-tailed deer fawns in northcentral New Brunswick. The Journal of Wildlife Management 63:574–579.
Barber-Meyer, S. M., L. D. Mech, and P. J. White. 2008. Elk calf survival and mortality following wolf restoration to Yellowstone National Park. Wildlife Monographs 169:1–30.
Bastille-Rousseau, G., D. Fortin, C. Dussault, R. Courtois, and J. P. Ouellet. 2011. Foraging strategies by omnivores: Are black bears actively searching for ungulate neonates or are they simply opportunistic predators? Ecography 34:588–596.
Belant, J. L., B. Griffith, Y. Zhang, E. H. Follmann, and L. G. Adams. 2010. Population-level resource selection by sympatric brown and American black bears in Alaska. Polar Biology 33:31–40.
Bischof, R., L. E. Loe, E. L. Meisingset, B. Zimmermann, B. Van Moorter, and A. Mysterud. 2012. A migratory northern ungulate in the pursuit of spring: Jumping or surfing the green wave? The American Naturalist 180:407–424.
Bojarska, K., and N. Selva. 2012. Spatial patterns in brown bear Ursus arctos diet: The role of geographical and environmental factors. Mammal Review 42:120–143.
Burnham, K. P., and D. R. Anderson. 2004. Multimodel inference: Understanding AIC and BIC in model selection. Sociological Methods & Research 33:261–304.
Coogan, S. C. P., D. Raubenheimer, G. B. Stenhouse, and S. E. Nielsen. 2014. Macronutrient optimization and seasonal diet mixing in a large omnivore, the grizzly bear: A geometric analysis. PLoS ONE 9:e97968.
Costello, C. M., S. L. Cain, S. Pils, L. Frattaroli, M. A. Haroldson, and F. T. van Manen. 2016. Diet and macronutrient optimization in wild ursids: A comparison of grizzly bears with sympatric and allopatric black bears. PLoS ONE 11:e0153702.
38
Costello, C. M., F. T. van Manen, M. A. Haroldson, M. R. Ebinger, S. L. Cain, K. A. Gunther, and D. D. Bjornlie. 2014. Influence of whitebark pine decline on fall habitat use and movements of grizzly bears in the Greater Yellowstone Ecosystem. Ecology and Evolution 4:2004–2018.
Davis, H., R. D. Weir, A. N. Hamilton, and J. A. Deal. 2006. Influence of phenology on site selection by female American black bears in coastal British Columbia. Ursus 17:41–51.
Deacy, W. W., J. B. Armstrong, W. B. Leacock, C. T. Robbins, D. D. Gustine, E. J. Ward, J. A. Erlenbach, and J. A. Stanford. 2017. Phenological synchronization disrupts trophic interactions between Kodiak brown bears and salmon. Proceedings of the National Academy of Sciences 114:201705248.
Deacy, W. W., W. B. Leacock, J. A. Stanford, and J. B. Armstrong. 2019. Variation in spawning phenology within salmon populations influences landscape-level patterns of brown bear activity. Ecosphere 10:e02575.
Denny, C. K., G. B. Stenhouse, and S. E. Nielsen. 2018. Scales of selection and perception: landscape heterogeneity of an important food resource influences habitat use by a large omnivore. Wildlife Biology 2018:1–10.
Despain, D. G. 1990. Yellowstone vegetation: consequnces of environment and history in a natural setting. Roberts Rinehart Publishers, Boulder, Colorado, USA.
Diamond, S. J., R. H. Giles, and R. L. Kirkpatrick. 2000. Hard mast production before and after chestnut blight. Southern Journal of Applied Forestry 24:196–201.
Dou, H., H. Yang, J. L. D. Smith, L. Feng, T. Wang, and J. Ge. 2019. Prey selection of Amur tigers in relation to the spatiotemporal overlap with prey across the Sino-Russian border. Wildlife Biology 1:1–11.
Duquette, J. F., J. L. Belant, N. J. Svoboda, D. E. Beyer, and P. E. Lederle. 2014. Effects of maternal nutrition, resource use and multi-predator risk on neonatal white-tailed deer survival. PLoS ONE 9:e100841.
Duquette, J. F., J. L. Belant, C. M. Wilton, N. Fowler, B. W. Waller, D. E. Beyer, N. J. Svoboda, S. L. Simek, and J. Beringer. 2017. Black bear (Ursus americanus) functional resource selection relative to intraspecific competition and human risk. Canadian Journal of Zoology 95:203–212.
Erlenbach, J. A., K. D. Rode, D. Raubenheimer, and C. T. Robbins. 2014. Macronutrient optimization and energy maximization determine diets of brown bears. Journal of Mammalogy 95:160–168.
39
Forester, J. D., H. K. Im, and P. J. Rathouz. 2009. Accounting for animal movement in estimation of resource selection functions: Sampling and data analysis. Ecology 90:3554–3565.
Fortin, D., H. L. Beyer, M. S. Boyce, D. W. Smith, T. Duchesne, and J. S. Mao. 2005. Wolves influence elk movements: Behavior shapes a trophic cascade in Yellowstone National Park. Ecology 86:1320–1330.
Fortin, J. K. 2011. Niche separation of grizzly (Ursus arctos) and American black bears (Ursus americanus) in Yellowstone National Park. Disserataion, Washington State University.
Fortin, J. K., C. C. Schwartz, K. A. Gunther, J. E. Teisberg, M. A. Haroldson, M. A. Evans, and C. T. Robbins. 2013. Dietary adjustability of grizzly bears and American black bears in Yellowstone National Park. Journal of Wildlife Management 77:270–281.
Frank, D. A., and S. J. McNaughton. 1992. The ecology of plants, large mammalian herbivores, and drought in Yellowstone National Park. Ecology 73:2043–2058.
Frank, D. A., R. L. Wallen, and P. J. White. 2016. Ungulate control of grassland production: grazing intensity and ungulate species composition in Yellowstone Park. Ecosphere 7:e01603.
Frattaroli, L. M. 2011. Black bear (Ursus americanus) ecology in southern Grand Teton National Park. Thesis, Montana State University.
Gantchoff, M. G., D. Beyer, and J. L. Belant. 2019. Reproductive class influences risk tolerance during denning and spring for American black bears (Ursus americanus). Ecosphere 10:1–12.
Graham, K., J. Boulanger, J. Duval, and G. Stenhouse. 2010. Spatial and temporal use of roads by grizzly bears in west-central Alberta. Ursus 21:43–56.
Griffin, K. A., M. Hebblewhite, H. S. Robinson, P. Zager, S. M. Barber-Meyer, D. Christianson, S. Creel, N. C. Harris, M. A. Hurley, D. H. Jackson, B. K. Johnson, W. L. Myers, J. D. Raithel, M. Schlegel, B. L. Smith, C. White, and P. J. White. 2011. Neonatal mortality of elk driven by climate, predator phenology and predator community composition. Journal of Animal Ecology 80:1246–1257.
Gunther, K. A. M. J. Biel, N. Anderson, and L. Waits. 2002. Probable grizzly bear predation on an American black bear in Yellowstone National Park. Ursus 13 372 – 374.
40
Gunther, K. A., K. R. Wilmot, S. L. Cain, T. Wyman, E. G. Reinertson, and A. M. Bramblett. 2018. Managing human-habituated bears to enhance survival, habitat effectiveness, and public viewing. Human-Wildlife Interactions 12:373–386.
Gunther, K. A., and T. Wyman. 2008. Human habituated bears: The next challenge in bear management in Yellowstone National Park. Yellowstone Science 16:35–41.
Hebblewhite, M., E. Merrill, and G. McDermid. 2008. A Multi-Scale Test of the Forage Maturation Hypothesis in a Partially Migratory Ungulate Population. Ecological Monographs 78:141–166.
Hellgren, E. C., D. W. Carney, N. P. Garner, and M. R. Vaughan. 1988. Use of breakaway cotton spacers on radio collars. Wildlife Society Bulletin 16:216–218.
Herrero, S. 2018. Bear attacks: their causes and avoidance. Third edition. Rowman and Littlefield, Lanaham, MD.
Hodge, S. J., M. B. V Bell, and M. A. Cant. 2010. Reproductive competition and the evolution of extreme birth synchrony in a cooperative mammal. Biology Letters 7:54–56.
Howell, A. B. 1921. The black bear as a destroyer of game. Journal of Mammalogy 2:36.
Holm, G. W., F. G. Lindzey, and D. S. Moody. 1999. Interactions of sympatric black and grizzly bears in northwest Wyoming. Ursus 11:99–108.
Houston, D. B. 1982. The northern Yellowstone elk. Macmillan Publishing Company, New York, New York, USA.
Inman, R. M., and M. R. Pelton. 2002. Energetic production by soft and hard mast foods of American black bears in the Smoky Mountains. Ursus 13:57–68.
Jacoby, M. E., G. V Hilderbrand, C. Servheen, C. C. Schwartz, S. M. Arthur, T. A. Hanley, C. T. Robbins, and R. Michener. 1999. Trophic relations of brown and black bears in several western North American ecosystems. Journal of Wildlife Management 63:921–929.
Kasworm, W. F., and T. L. Manley. 1990. Road and trail influences on grizzly bears and black bears in Northwest Montana. International Conference on Bear Research and Management 8:79–84.
Klinka, D. R., and T. E. Reimchen. 2009. Darkness, twilight, and daylight foraging success of bears (Ursus americanus) on salmon in coastal British Columbia. Journal of Mammalogy 90:144–149.
Lariviere, B. S. 2001. Ursus americanus. Mammalian Species 647:1–11.
41
Laske, T. G., H. J. Harlow, D. L. Garshelis, and P. A. Iaizzo. 2010. Extreme respiratory sinus arrhythmia enables overwintering black bear survival — Physiological insights and applications to human medicine. Journal of Cardiovascular Translational Research 3:559–569.
MacNulty, D. R., D. R. Stahler, C. T. Wyman, J. Ruprecht, and D. W. Smith. 2016. The challenge of understanding northern Yellowstone elk dynamics after wolf reintroduction. Yellowstone Science 24:25–33.
Mattson, D. J., S. Herrero, and T. Merrill. 2005. Are black bears a factor in the restoration of North American grizzly populations? Ursus 16:11-30.
Mattson, D. J., R. R. Knight, and B. M. Blanchard. 1987. The effects of developments and primary roads on grizzly bear habitat use in Yellowstone National Park, Wyoming. International Conference of Bear Research and Management 7:259–273.
Mazur, R., A. P. Klimley, and K. Folger. 2013. Implications of the variable availability of seasonal foods on the home ranges of black bears, Ursus americanus, in the Sierra Nevada of California. Animal Biotelemetry 1:1–16.
McCarty, J. P., D. J. Levey, C. H. Greenberg, and S. Sargent. 2002. Spatial and temporal variation in fruit use by wildlife in a forested landscape. Forest Ecology and Management 164:277–291.
McLellan, B. N. 2011. Implications of a high-energy and low-protein diet on the body composition, fitness, and competitive abilities of black (Ursus americanus) and grizzly (Ursus arctos) bears. Canadian Journal of Zoology 89:546–558.
Merkle, J. A., K. L. Monteith, E. O. Aikens, M. M. Hayes, K. R. Hersey, A. D. Middleton, B. A. Oates, H. Sawyer, B. M. Scurlock, and M. J. Kauffman. 2016. Large herbivores surf waves of green-up in spring. Proceedings of the Royal Society B: Biological Sciences 283:20160456.
Metz, M. C., D. W. Smith, J. A. Vucetich, D. R. Stahler, and R. O. Peterson. 2012. Seasonal patterns of predation for gray wolves in the multi-prey system of Yellowstone National Park. Journal of Animal Ecology 81:553–563.
Middleton, A. D., J. A. Merkle, D. E. McWhirter, J. G. Cook, R. C. Cook, P. J. White, and M. J. Kauffman. 2018. Green-wave surfing increases fat gain in a migratory ungulate. Oikos 127:1060–1068.
42
Middleton, A. D., T. A. Morrison, J. K. Fortin, C. T. Robbins, K. M. Proffitt, P. J. White, D. E. McWhirter, T. M. Koel, D. G. Brimeyer, W. S. Fairbanks, and M. J. Kauffman. 2013. Grizzly bear predation links the loss of native trout to the demography of migratory elk in Yellowstone. Proceedings of the Royal Society B: Biological Sciences 280:20130870.
Moyer, M. A., J. W. McCown, and M. K. Oli. 2007. Factors influencing home-range size of female Florida black bears. Journal of Mammalogy 88:468–476.
Mysterud, A., B. K. Vike, E. L. Meisingset, and I. M. Rivrud. 2017. The role of landscape characteristics for forage maturation and nutritional benefits of migration in red deer. Ecology and Evolution 7:4448–4455.
Nicholson, K. L., M. J. Warren, C. Rostan, J. Månsson, T. F. Paragi, and H. Sand. 2019. Using fine-scale movement patterns to infer ungulate parturition. Ecological Indicators 101:22–30.
Northrup, J. M., M. B. Hooten, C. R. J. Anderson, and G. Wittemyer. 2013. Practical guidance on characterizing availability in resource selection functions under a use–availability design. Ecological Society of America 94:1456–1463.
Northrup, J. M., J. Pitt, T. B. Muhly, G. B. Stenhouse, M. Musiani, and M. S. Boyce. 2012. Vehicle traffic shapes grizzly bear behavior on a multiple-use landscape. Journal of Applied Ecology 49:1159–1167.
Notaro, M., K. Emmett, and D. O’Leary. 2019. Spatio-temporal variability in remotely sensed vegetation greenness across Yellowstone National Park. Remote Sensing 11:798–828.
Noyce, K. V., and D. L. Garshelis. 1998. Spring weight changes in black bears in northcentral Minnesota : The negative foraging period revisited. Ursus 10:521–531.
Pebesma, E. 2018. Package ‘sf’- simple feature. R package version 0.7-3. https://cran.r-project.org/web/packages/sf/index.html
Peck, C. P., F. T. van Manen, C. M. Costello, M. A. Haroldson, L. A. Landenburger, L. L. Roberts, D. D. Bjornlie, and R. D. Mace. 2017. Potential paths for male-mediated gene flow to and from an isolated grizzly bear population. Ecosphere 8:e01969.
Pelton, M. R. 2003. Black Bear. Pages 547–555 in G. A. Feldhamer, B. C. Thompson, and J. A. Chapman, editors. Wild Mammals of North America: Biology, Management, and Conservation. Second Edi. Johns Hopkins University Press, Baltimore, MD.
43
Pettorelli, N., J. O. Vik, A. Mysterud, J. Gaillard, C. J. Tucker, N. C. Stenseth, and C. B. Lyon. 2005. Using the satellite-derived NDVI to assess ecological responses to environmental change. Ecology and Evolution 20:503–510.
Pritchard, G. T., and C. T. Robbins. 1990. Digestive and metabolic efficiencies of grizzly and black bears. Canadian Journal of Zoology 68:1645–1651.
R Development Core Team. 2013. R: A language and environment for statistical computing. R Foundation for Statistical Computing. Vienna, Austria.
Rayl, N. D., G. Bastille-Rousseau, J. F. Organ, M. A. Mumma, S. P. Mahoney, C. E. Soulliere, K. P. Lewis, R. D. Otto, D. L. Murray, L. P. Waits, and T. K. Fuller. 2018. Spatiotemporal heterogeneity in prey abundance and vulnerability shapes the foraging tactics of an omnivore. Journal of Animal Ecology 87:874–887.
Robbins, C. T., J. K. Fortin, K. D. Rode, S. D. Farley, L. A. Shipley, and L. A. Felicetti. 2007. Optimizing protein intake as a foraging strategy to maximize mass gain in an omnivore. Oikos 116:1675–1682.
Robbins, C. T., C. C. Schwartz, and L. A. Felicetti. 2004. Nutritional ecology of ursids: a review of newer methods and management implications. Ursus 15:161–171.
Rode, K. D., C. T. Robbins, and L. A. Shipley. 2001. Constraints on herbivory by grizzly bears. Oecologia 128:62–71.
Roever, C. L., M. S. Boyce, and G. B. Stenhouse. 2010. Grizzly bear movements relative to roads: Application of step selection functions. Ecography 33:1113–1122.
Rush, W. M. 1932. Northern Yellowstone elk study. Montana Fish and Game Commission, Helena, Montana, USA.
Ryan, C. W., J. C. Pack, W. K. Igo, J. C. Rieffenberger, and A. B. Billings. 2004. Relationship of mast production to big-game harvests in West Virginia. Wildlife Society Bulletin 32:786–794.
Schwartz, C. C., S. L. Cain, S. Podruzny, S. Cherry, and L. Frattaroli. 2010. Contrasting activity patterns of sympatric and allopatric black and grizzly bears. Journal of Wildlife Management 74:1628–1638.
Schwartz, C. C., J. K. Fortin, J. E. Teisberg, M. A. Haroldson, C. Servheen, C. T. Robbins, and F. T. van Manen. 2014. Body and diet composition of sympatric black and grizzly bears in the Greater Yellowstone Ecosystem. Journal of Wildlife Management 78:68–78.
44
Schwartz, C. C., M. A. Haroldson, K. A. Gunther, and C. T. Robbins. 2013. Omnivory and the terrestrial food web, Yellowstone grizzly bear diets. Pages 109 – 124 in P.J. White, R.A. Garrott, and G. E. Plumb, editors. Yellowstone’s Wildlife in Transition. Harvard University Press, Cambridge Massachusetts, USA.
Signer, J., J. Fieberg, and T. Avgar. 2019. Animal movement tools (amt): R package for managing tracking data and conducting habitat selection analyses. Ecology and Evolution 9:880–890.
Singer, F. J., A. Harting, K. K. Symonds, and M. B. Coughenour. 1997. Density dependence, compensation, and environmental effects of elk calve mortality in Yellowstone National Park. Journal of Wildlife Management 61:12-25.
Singer, F. J., L. C. Mark, and R. C. Cates. 1994. Ungulate herbivory of willows on Yellowstone’s northern winter range. Journal of Range Management 47:435–443.
Smith, D. W., R. O. Peterson, and D. B. Houston. 2003. Yellowstone after wolves. BioScience 53:330–340.
Svoboda, N. J., J. L. Belant, D. E. Beyer, J. F. Duquette, and P. E. Lederle. 2019. Carnivore space use shifts in response to seasonal resource availability. Ecosphere 10:e02817.
Testa, J. W. 2005. Does predation on neonates inherently select for earlier births? Journal of Mammalogy 83:699–706.
Thomas, D. L., and E. J. Taylor. 2006. Study designs and tests for comparing resource use and availability. Journal of Wildlife Management 54:324–336.
Thurfjell, H., S. Ciuti, and M. S. Boyce. 2014. Applications of step-selection functions in ecology and conservation. Movement Ecology 2:1–12.
U.S. Geological Survey. 2009. National Elevation Dataset. U.S. Geological Survey, EROS Data Center, Sioux Falls, South Dakota, USA.
van der Graaf, S., J. Stahl, R. H. Drent, A. Klimkowska, and J. P. Bakker. 2006. Surfing on a green wave - how plant growth drives spring migration in the Barnacle Goose Branta leucopsis. Ardea 94:567–577.
van Manen, F. T., M. F. McCollister, J. M. Nicholson, L. M. Thompson, J. L. Kindall, and M. D. Jones. 2012. Short-term impacts of a 4-lane highway on American black bears in eastern North Carolina. Wildlife Monographs 181:1–35.
Vore, J. M., and E. M. Schmidt. 2001. Movements of female elk during calving season in northwest Montana. Wildlife Society Bulletin 29:720–725.
45
Welch, C. A., J. Keay, K. C. Kendall, and C. T. Robbins. 1997. Constraints on frugivory by bears. Ecology 78:1105–1119.
White, P. J., and R. A. Garrott. 2005. Yellowstone’s ungulates after wolves - Expectations, realizations, and predictions. Biological Conservation 125:141–152.
Yellowstone Spatial Analysis Center. 2010. Yellowstone Spatial Analysis Center, Yellowstone National Park, Mammoth, Wyoming, USA
46
CHAPTER THREE
FACTORS ASSOCIATED WITH VARYING DENSITY OF BLACK BEARS ON
YELLOWSTONE NATIONAL PARK’S NORTHERN RANGE
Contribution of Authors and Co-Authors
Manuscript in Chapter 3 Author: Nathaniel R. Bowersock Contributions: Implemented the study, collected and analyzed the data, wrote the manuscript Co-Author: Andrea R. Litt Contributions: Guided study design, helped secure funding, assisted with data analysis, extensive review of manuscript Co-Author: Kerry A. Gunther Contributions: Conceived initial study idea, secured funding, assisted with data collection, reviewed the manuscript Co-Author: Michael A. Sawaya Contributions: Guided study design, assisted with data analysis, reviewed the manuscript Co-Author: Jay J. Rotella Contributions: Reviewed the manuscript Co-Author: Frank T. van Manen Contributions: Assisted with data analysis, reviewed the manuscript
47
Manuscript Information Nathaniel R. Bowersock, Andrea R. Litt, Kerry A. Gunther, Michael A. Sawaya, Jay J. Rotella, Frank T. van Manen Journal of Wildlife Management Status of Manuscript: _X__ Prepared for submission to a peer-reviewed journal ____ Officially submitted to a peer-reviewed journal ____ Accepted by a peer-reviewed journal ____ Published in a peer-reviewed journal
48
Factors associated with varying density of black bears on Yellowstone National
Park’s Northern Range
NATHANIEL R. BOWERSOCK1, Department of Ecology, Montana State University,
P.O. Box 173460, Bozeman, MT 59717-2400, USA
ANDREA R. LITT, Department of Ecology, Montana State University, P.O. Box 173460,
Bozeman, MT 59717-2400, USA
JAY J. ROTELLA, Department of Ecology, Montana State University, P.O. Box 173460,
Bozeman, MT 59717-2400, USA
MICHAEL A. SAWAYA, Sinopah Wildlife Research Associates, 127 North Higgins
Avenue Suite 310, Missoula, MT 59802, USA.
KERRY A. GUNTHER, Bear Management Office, Yellowstone Center for Resources,
Yellowstone National Park, P.O. Box 168, Yellowstone National Park, WY 82190, USA.
FRANK T. VAN MANEN, U.S. Geological Survey, Northern Rocky Mountain Science
Center, Interagency Grizzly Bear Study Team, 2327 University Way, Suite 2, Bozeman,
MT 59715, USA.
1Email: [email protected]
ABSTRACT Variation in the availability of resources can influence how wildlife
populations are distributed. In Yellowstone National Park (YNP), American black bears
(Ursus americanus) have experienced many changes to available resources, which has
changed their distribution in the park. The Northern Range of YNP is known for its
abundant vegetative resources that could support a larger number of black bears
compared to the rest of the park, but little is known about black bears in this region. We
49
used non-invasive genetic sampling and spatially explicit capture-recapture models to
quantify variation in black bear density as a function of landscape features. During 2017
and 2018, we obtained 3,673 hair samples from 26 hair corrals and 270 rub objects,
which we genotyped to identify 138 unique individual black bears (66 males, 72
females). Densities were highest in Douglas fir communities (23.2 bears/100 km2, 95%
CI = 15.2–35.6) and lowest in big sagebrush (1.8 bears, 0.19–16.7). We estimated an
average density of 12.8 bears/100km 2 (95% CI = 9.4 – 17.5), which is higher than other
portions of the Greater Yellowstone Ecosystem, suggesting that food resources and other
conditions on the Northern Range can support more black bears. Our study provides the
first baseline density estimates of black bears on the Northern Range, which can guide
management decisions in the face of continued changes in available resources and
increased visitation to the park. This information could help prioritize the placement of
additional food storage boxes in backcountry settings, especially in forested areas, to
reduce access to human foods and subsequent human-wildlife interactions.
KEY WORDS abundance, American black bear, density, non-invasive genetic sampling,
Northern Range, resource, spatially explicit capture-recapture models, Yellowstone
National Park, Ursus americanus
Variation in the abundance and availability of resources, such as food and cover, can
influence the density and distribution of wildlife populations (Brown et al. 1995, Ives and
Klopper 1997, Delibes et al. 2001, Greene and Stamps 2001, Pettorelli et al. 2001, Manly
et al. 2007, Gaillard et al. 2010). Access to resources can change due to inter- and
intraspecific competition (Toft 1985, Gaston et al. 1997, Voeten and Prins 1999), which
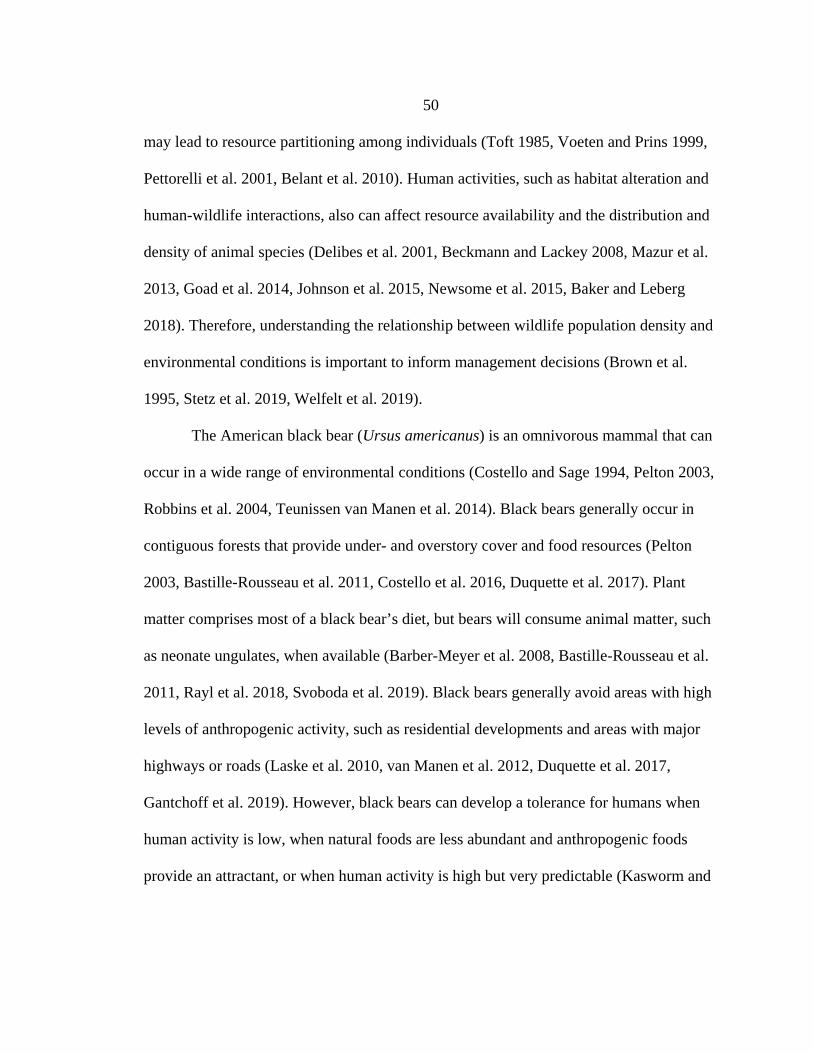
50
may lead to resource partitioning among individuals (Toft 1985, Voeten and Prins 1999,
Pettorelli et al. 2001, Belant et al. 2010). Human activities, such as habitat alteration and
human-wildlife interactions, also can affect resource availability and the distribution and
density of animal species (Delibes et al. 2001, Beckmann and Lackey 2008, Mazur et al.
2013, Goad et al. 2014, Johnson et al. 2015, Newsome et al. 2015, Baker and Leberg
2018). Therefore, understanding the relationship between wildlife population density and
environmental conditions is important to inform management decisions (Brown et al.
1995, Stetz et al. 2019, Welfelt et al. 2019).
The American black bear (Ursus americanus) is an omnivorous mammal that can
occur in a wide range of environmental conditions (Costello and Sage 1994, Pelton 2003,
Robbins et al. 2004, Teunissen van Manen et al. 2014). Black bears generally occur in
contiguous forests that provide under- and overstory cover and food resources (Pelton
2003, Bastille-Rousseau et al. 2011, Costello et al. 2016, Duquette et al. 2017). Plant
matter comprises most of a black bear’s diet, but bears will consume animal matter, such
as neonate ungulates, when available (Barber-Meyer et al. 2008, Bastille-Rousseau et al.
2011, Rayl et al. 2018, Svoboda et al. 2019). Black bears generally avoid areas with high
levels of anthropogenic activity, such as residential developments and areas with major
highways or roads (Laske et al. 2010, van Manen et al. 2012, Duquette et al. 2017,
Gantchoff et al. 2019). However, black bears can develop a tolerance for humans when
human activity is low, when natural foods are less abundant and anthropogenic foods
provide an attractant, or when human activity is high but very predictable (Kasworm and
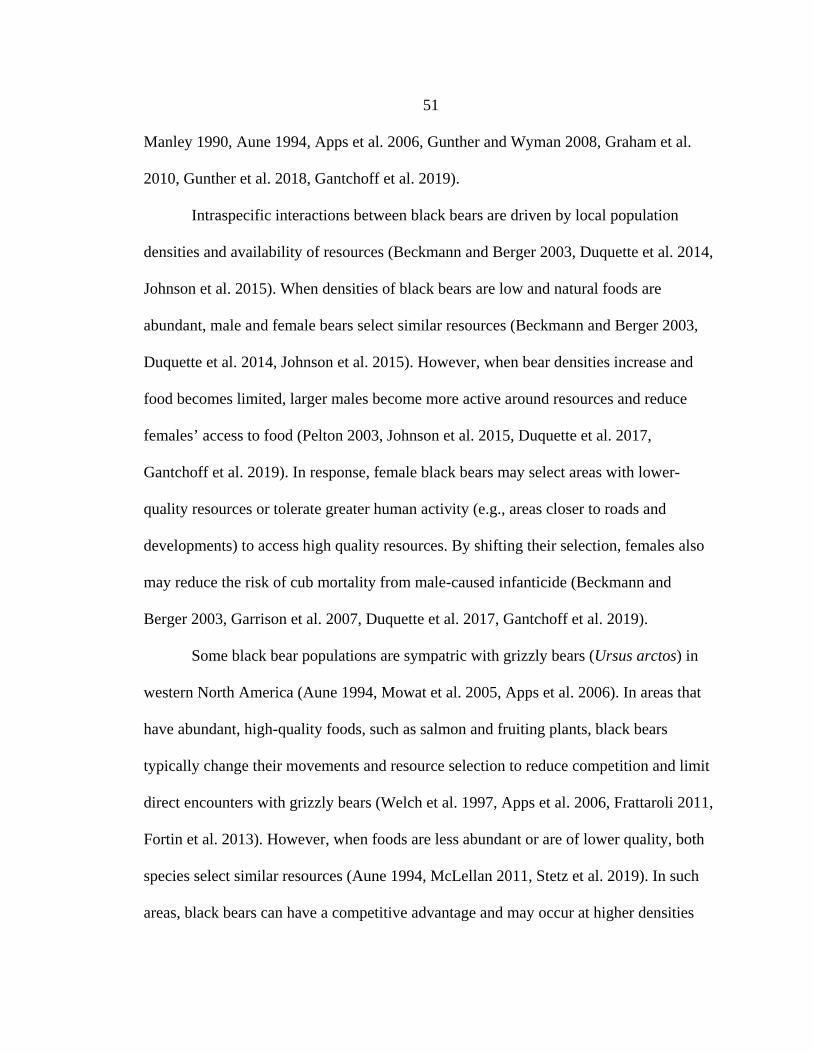
51
Manley 1990, Aune 1994, Apps et al. 2006, Gunther and Wyman 2008, Graham et al.
2010, Gunther et al. 2018, Gantchoff et al. 2019).
Intraspecific interactions between black bears are driven by local population
densities and availability of resources (Beckmann and Berger 2003, Duquette et al. 2014,
Johnson et al. 2015). When densities of black bears are low and natural foods are
abundant, male and female bears select similar resources (Beckmann and Berger 2003,
Duquette et al. 2014, Johnson et al. 2015). However, when bear densities increase and
food becomes limited, larger males become more active around resources and reduce
females’ access to food (Pelton 2003, Johnson et al. 2015, Duquette et al. 2017,
Gantchoff et al. 2019). In response, female black bears may select areas with lower-
quality resources or tolerate greater human activity (e.g., areas closer to roads and
developments) to access high quality resources. By shifting their selection, females also
may reduce the risk of cub mortality from male-caused infanticide (Beckmann and
Berger 2003, Garrison et al. 2007, Duquette et al. 2017, Gantchoff et al. 2019).
Some black bear populations are sympatric with grizzly bears (Ursus arctos) in
western North America (Aune 1994, Mowat et al. 2005, Apps et al. 2006). In areas that
have abundant, high-quality foods, such as salmon and fruiting plants, black bears
typically change their movements and resource selection to reduce competition and limit
direct encounters with grizzly bears (Welch et al. 1997, Apps et al. 2006, Frattaroli 2011,
Fortin et al. 2013). However, when foods are less abundant or are of lower quality, both
species select similar resources (Aune 1994, McLellan 2011, Stetz et al. 2019). In such
areas, black bears can have a competitive advantage and may occur at higher densities
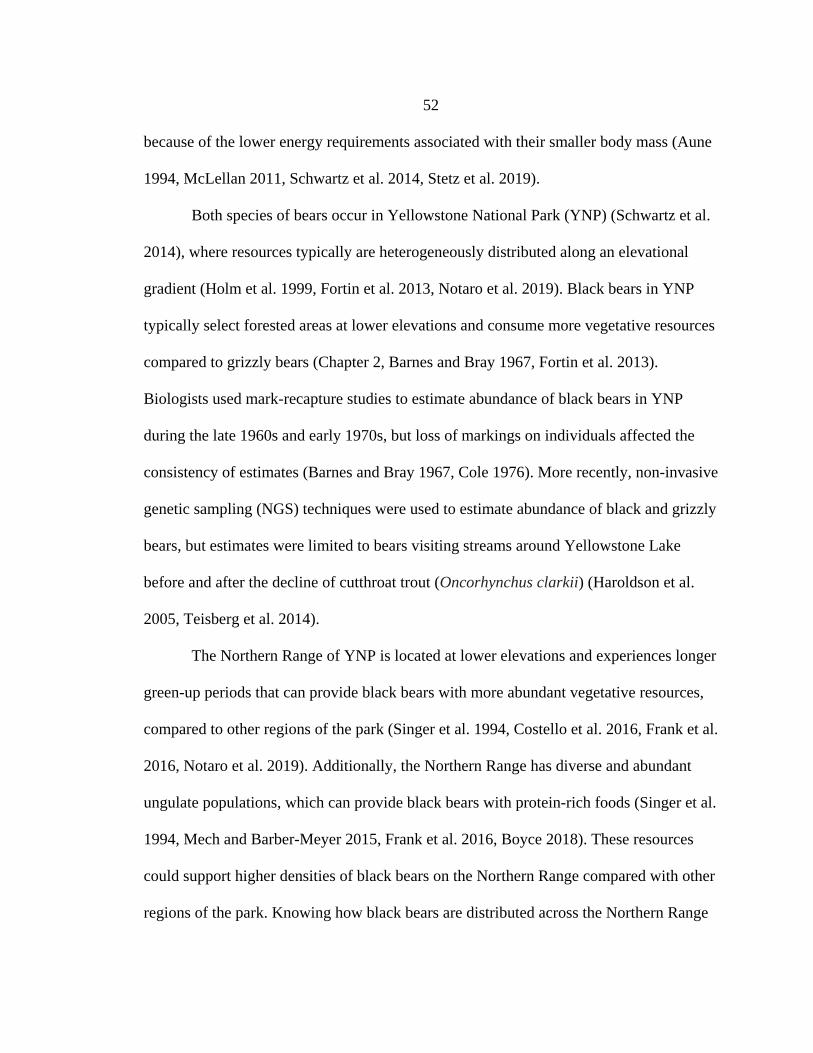
52
because of the lower energy requirements associated with their smaller body mass (Aune
1994, McLellan 2011, Schwartz et al. 2014, Stetz et al. 2019).
Both species of bears occur in Yellowstone National Park (YNP) (Schwartz et al.
2014), where resources typically are heterogeneously distributed along an elevational
gradient (Holm et al. 1999, Fortin et al. 2013, Notaro et al. 2019). Black bears in YNP
typically select forested areas at lower elevations and consume more vegetative resources
compared to grizzly bears (Chapter 2, Barnes and Bray 1967, Fortin et al. 2013).
Biologists used mark-recapture studies to estimate abundance of black bears in YNP
during the late 1960s and early 1970s, but loss of markings on individuals affected the
consistency of estimates (Barnes and Bray 1967, Cole 1976). More recently, non-invasive
genetic sampling (NGS) techniques were used to estimate abundance of black and grizzly
bears, but estimates were limited to bears visiting streams around Yellowstone Lake
before and after the decline of cutthroat trout (Oncorhynchus clarkii) (Haroldson et al.
2005, Teisberg et al. 2014).
The Northern Range of YNP is located at lower elevations and experiences longer
green-up periods that can provide black bears with more abundant vegetative resources,
compared to other regions of the park (Singer et al. 1994, Costello et al. 2016, Frank et al.
2016, Notaro et al. 2019). Additionally, the Northern Range has diverse and abundant
ungulate populations, which can provide black bears with protein-rich foods (Singer et al.
1994, Mech and Barber-Meyer 2015, Frank et al. 2016, Boyce 2018). These resources
could support higher densities of black bears on the Northern Range compared with other
regions of the park. Knowing how black bears are distributed across the Northern Range
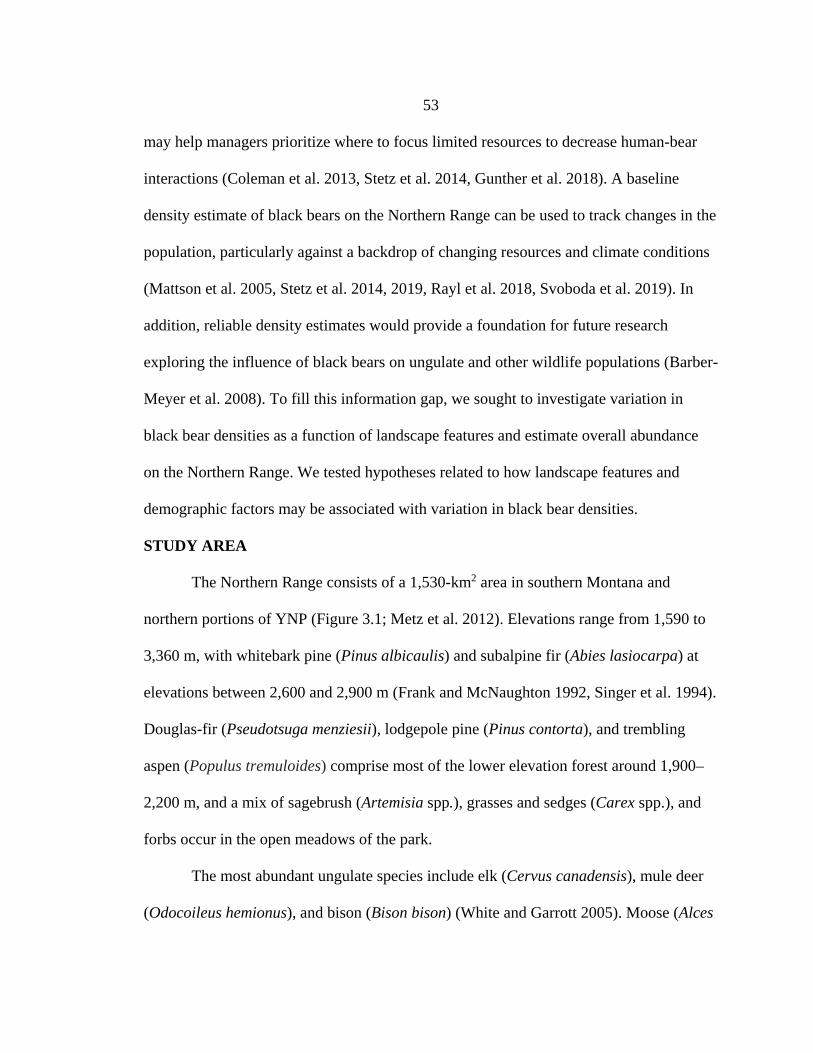
53
may help managers prioritize where to focus limited resources to decrease human-bear
interactions (Coleman et al. 2013, Stetz et al. 2014, Gunther et al. 2018). A baseline
density estimate of black bears on the Northern Range can be used to track changes in the
population, particularly against a backdrop of changing resources and climate conditions
(Mattson et al. 2005, Stetz et al. 2014, 2019, Rayl et al. 2018, Svoboda et al. 2019). In
addition, reliable density estimates would provide a foundation for future research
exploring the influence of black bears on ungulate and other wildlife populations (Barber-
Meyer et al. 2008). To fill this information gap, we sought to investigate variation in
black bear densities as a function of landscape features and estimate overall abundance
on the Northern Range. We tested hypotheses related to how landscape features and
demographic factors may be associated with variation in black bear densities.
STUDY AREA
The Northern Range consists of a 1,530-km2 area in southern Montana and
northern portions of YNP (Figure 3.1; Metz et al. 2012). Elevations range from 1,590 to
3,360 m, with whitebark pine (Pinus albicaulis) and subalpine fir (Abies lasiocarpa) at
elevations between 2,600 and 2,900 m (Frank and McNaughton 1992, Singer et al. 1994).
Douglas-fir (Pseudotsuga menziesii), lodgepole pine (Pinus contorta), and trembling
aspen (Populus tremuloides) comprise most of the lower elevation forest around 1,900–
2,200 m, and a mix of sagebrush (Artemisia spp.), grasses and sedges (Carex spp.), and
forbs occur in the open meadows of the park.
The most abundant ungulate species include elk (Cervus canadensis), mule deer
(Odocoileus hemionus), and bison (Bison bison) (White and Garrott 2005). Moose (Alces
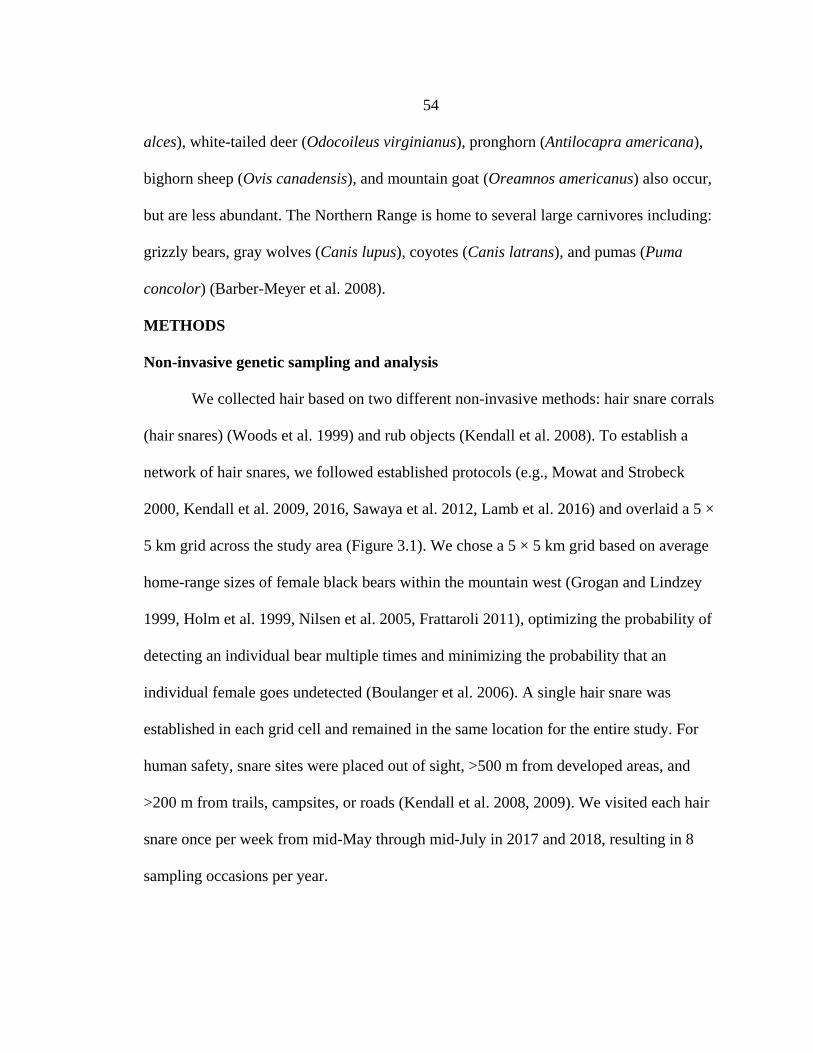
54
alces), white-tailed deer (Odocoileus virginianus), pronghorn (Antilocapra americana),
bighorn sheep (Ovis canadensis), and mountain goat (Oreamnos americanus) also occur,
but are less abundant. The Northern Range is home to several large carnivores including:
grizzly bears, gray wolves (Canis lupus), coyotes (Canis latrans), and pumas (Puma
concolor) (Barber-Meyer et al. 2008).
METHODS
Non-invasive genetic sampling and analysis
We collected hair based on two different non-invasive methods: hair snare corrals
(hair snares) (Woods et al. 1999) and rub objects (Kendall et al. 2008). To establish a
network of hair snares, we followed established protocols (e.g., Mowat and Strobeck
2000, Kendall et al. 2009, 2016, Sawaya et al. 2012, Lamb et al. 2016) and overlaid a 5 ×
5 km grid across the study area (Figure 3.1). We chose a 5 × 5 km grid based on average
home-range sizes of female black bears within the mountain west (Grogan and Lindzey
1999, Holm et al. 1999, Nilsen et al. 2005, Frattaroli 2011), optimizing the probability of
detecting an individual bear multiple times and minimizing the probability that an
individual female goes undetected (Boulanger et al. 2006). A single hair snare was
established in each grid cell and remained in the same location for the entire study. For
human safety, snare sites were placed out of sight, >500 m from developed areas, and
>200 m from trails, campsites, or roads (Kendall et al. 2008, 2009). We visited each hair
snare once per week from mid-May through mid-July in 2017 and 2018, resulting in 8
sampling occasions per year.
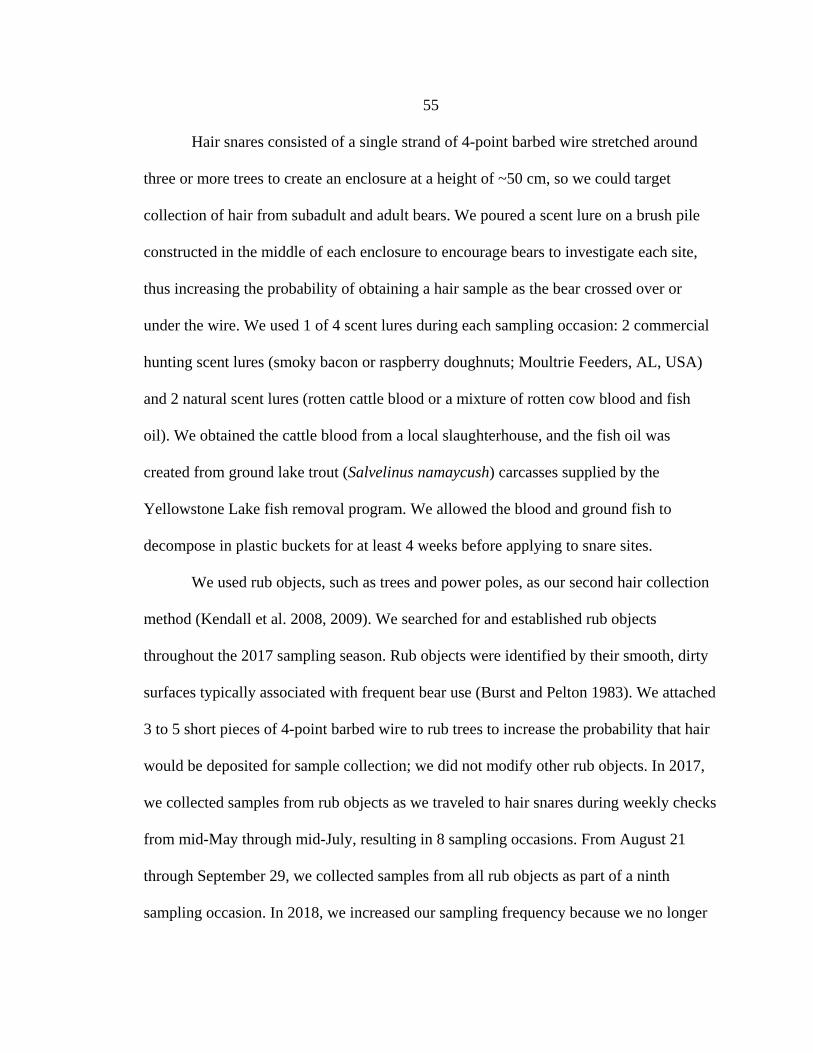
55
Hair snares consisted of a single strand of 4-point barbed wire stretched around
three or more trees to create an enclosure at a height of ~50 cm, so we could target
collection of hair from subadult and adult bears. We poured a scent lure on a brush pile
constructed in the middle of each enclosure to encourage bears to investigate each site,
thus increasing the probability of obtaining a hair sample as the bear crossed over or
under the wire. We used 1 of 4 scent lures during each sampling occasion: 2 commercial
hunting scent lures (smoky bacon or raspberry doughnuts; Moultrie Feeders, AL, USA)
and 2 natural scent lures (rotten cattle blood or a mixture of rotten cow blood and fish
oil). We obtained the cattle blood from a local slaughterhouse, and the fish oil was
created from ground lake trout (Salvelinus namaycush) carcasses supplied by the
Yellowstone Lake fish removal program. We allowed the blood and ground fish to
decompose in plastic buckets for at least 4 weeks before applying to snare sites.
We used rub objects, such as trees and power poles, as our second hair collection
method (Kendall et al. 2008, 2009). We searched for and established rub objects
throughout the 2017 sampling season. Rub objects were identified by their smooth, dirty
surfaces typically associated with frequent bear use (Burst and Pelton 1983). We attached
3 to 5 short pieces of 4-point barbed wire to rub trees to increase the probability that hair
would be deposited for sample collection; we did not modify other rub objects. In 2017,
we collected samples from rub objects as we traveled to hair snares during weekly checks
from mid-May through mid-July, resulting in 8 sampling occasions. From August 21
through September 29, we collected samples from all rub objects as part of a ninth
sampling occasion. In 2018, we increased our sampling frequency because we no longer
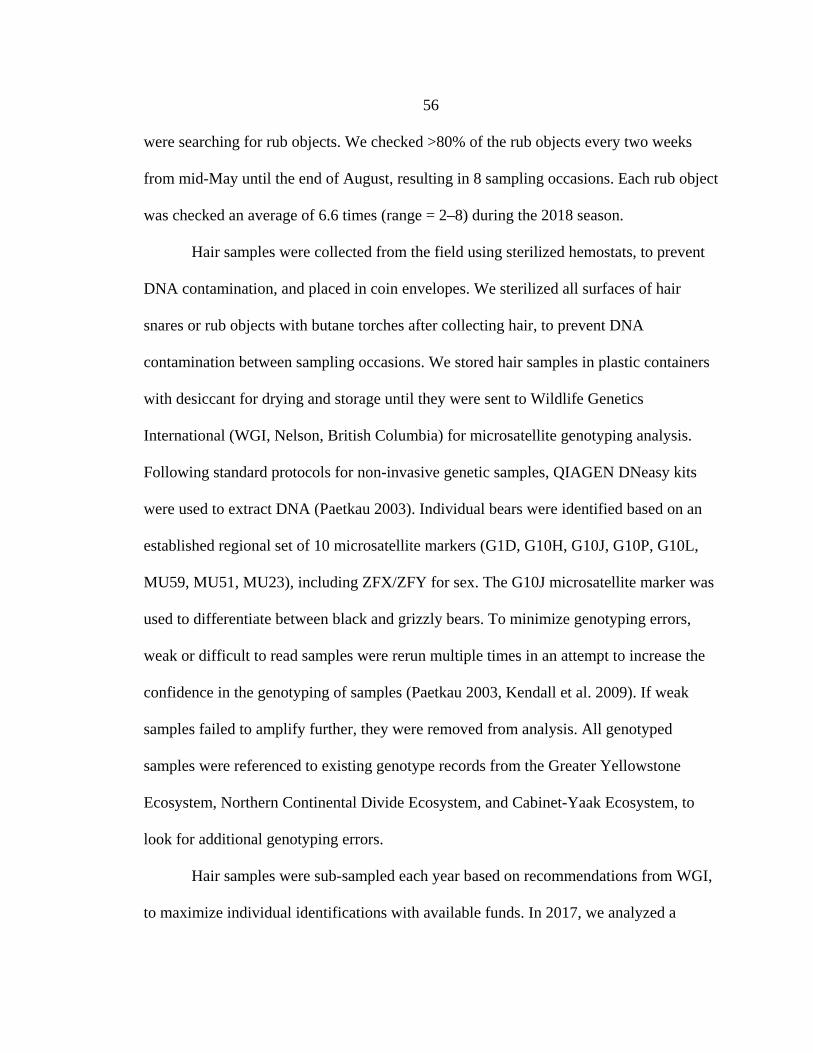
56
were searching for rub objects. We checked >80% of the rub objects every two weeks
from mid-May until the end of August, resulting in 8 sampling occasions. Each rub object
was checked an average of 6.6 times (range = 2–8) during the 2018 season.
Hair samples were collected from the field using sterilized hemostats, to prevent
DNA contamination, and placed in coin envelopes. We sterilized all surfaces of hair
snares or rub objects with butane torches after collecting hair, to prevent DNA
contamination between sampling occasions. We stored hair samples in plastic containers
with desiccant for drying and storage until they were sent to Wildlife Genetics
International (WGI, Nelson, British Columbia) for microsatellite genotyping analysis.
Following standard protocols for non-invasive genetic samples, QIAGEN DNeasy kits
were used to extract DNA (Paetkau 2003). Individual bears were identified based on an
established regional set of 10 microsatellite markers (G1D, G10H, G10J, G10P, G10L,
MU59, MU51, MU23), including ZFX/ZFY for sex. The G10J microsatellite marker was
used to differentiate between black and grizzly bears. To minimize genotyping errors,
weak or difficult to read samples were rerun multiple times in an attempt to increase the
confidence in the genotyping of samples (Paetkau 2003, Kendall et al. 2009). If weak
samples failed to amplify further, they were removed from analysis. All genotyped
samples were referenced to existing genotype records from the Greater Yellowstone
Ecosystem, Northern Continental Divide Ecosystem, and Cabinet-Yaak Ecosystem, to
look for additional genotyping errors.
Hair samples were sub-sampled each year based on recommendations from WGI,
to maximize individual identifications with available funds. In 2017, we analyzed a
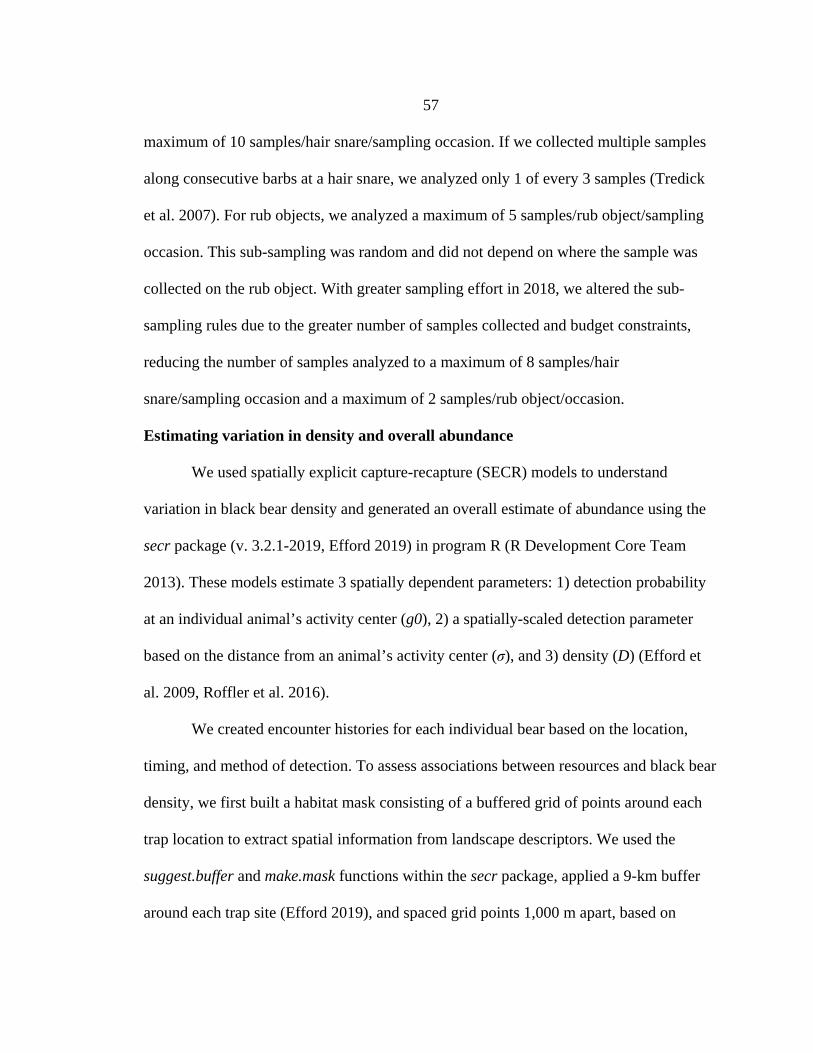
57
maximum of 10 samples/hair snare/sampling occasion. If we collected multiple samples
along consecutive barbs at a hair snare, we analyzed only 1 of every 3 samples (Tredick
et al. 2007). For rub objects, we analyzed a maximum of 5 samples/rub object/sampling
occasion. This sub-sampling was random and did not depend on where the sample was
collected on the rub object. With greater sampling effort in 2018, we altered the sub-
sampling rules due to the greater number of samples collected and budget constraints,
reducing the number of samples analyzed to a maximum of 8 samples/hair
snare/sampling occasion and a maximum of 2 samples/rub object/occasion.
Estimating variation in density and overall abundance
We used spatially explicit capture-recapture (SECR) models to understand
variation in black bear density and generated an overall estimate of abundance using the
secr package (v. 3.2.1-2019, Efford 2019) in program R (R Development Core Team
2013). These models estimate 3 spatially dependent parameters: 1) detection probability
at an individual animal’s activity center (g0), 2) a spatially-scaled detection parameter
based on the distance from an animal’s activity center (σ), and 3) density (D) (Efford et
al. 2009, Roffler et al. 2016).
We created encounter histories for each individual bear based on the location,
timing, and method of detection. To assess associations between resources and black bear
density, we first built a habitat mask consisting of a buffered grid of points around each
trap location to extract spatial information from landscape descriptors. We used the
suggest.buffer and make.mask functions within the secr package, applied a 9-km buffer
around each trap site (Efford 2019), and spaced grid points 1,000 m apart, based on
58
recommendations (σ < 0.5) in Royle et al. (2014), which resulted in a habitat mask
encompassing 1,592 km2. We used a Poisson distribution, half-normal detection function,
and the full likelihood to examine factors that could influence detection and density
parameters (Efford et al. 2009).
Modelling Detection - We used a 2-step approach to evaluate covariates in our
SECR models (Gould et al. 2018, Loosen et al. 2019, Stetz et al. 2019). In our first step,
we compared models focused on factors that might influence the detection parameters (g0
and σ), while keeping density spatially uniform. Home ranges of black bears typically
differ between males and females, and space use can be influenced by the opposite sex,
so we used sex as a covariate on both g0 and σ (Sawaya et al. 2012, Kendall et al. 2015,
Tattoni et al. 2015, Loosen et al. 2019, Stetz et al. 2019, Welfelt et al. 2019). Because we
were using a maximum-likelihood approach and not partitioning the data between males
and females, we set sex as a group covariate in our models (Efford 2019). The ability to
detect individual bears could differ between hair snares and rub objects (Sawaya et al.
2012, Kendall et al. 2015, Tattoni et al. 2015, Loosen et al. 2019, Stetz et al. 2019), so we
considered collection method (hair snare or rub object) as a covariate on g0 and σ.
Additionally, previous experiences at trap sites might influence detection probability for
some individuals, so we considered a behavioral covariate (bk) on g0 (Harris et al. 2011,
Loosen et al. 2019). We further assumed there was spatial heterogeneity in detection of
individuals, and we considered 2-class finite mixtures (h2) for σ (Pledger 2000, Drewry
et al. 2013, Hooker et al. 2015). Finally, we included sampling occasion (t) and year
(session) as additional covariates on g0. We considered combinations of covariates (g0:
59
sex, sampling method, behavior, time of sampling occasion, and year; σ: sex, method,
spatial heterogeneity) to create 132 additive models (Appendix C), and used Akaike’s
Information Criterion corrected for small sample sizes (AICc) to compare model fit
(Burnham and Anderson 2004).
Modelling Density - In our second step, we used the top model for the detection
parameters from step 1 and focused on covariates that might influence bear density.
Black bears typically select forested areas and areas with abundant green vegetation
(Chapter 2, Bastille-Rousseau et al. 2011, Fortin et al. 2013, Costello et al. 2016,
Duquette et al. 2017). Therefore, we expected black bear density to increase with the
productivity of vegetation and vary among vegetation communities, with higher densities
in forested areas because these areas provide food and cover (Loosen et al. 2019, Stetz et
al. 2019, Welfelt et al. 2019).
We classified vegetation communities based on dominant over- and understory
plants (Despain 1990), which we used as a proxy for food resources. We used vegetation
community layers (50-m pixel resolution, Yellowstone Center for Resources,
Yellowstone Spatial Analysis Center 2010) and potential natural vegetation (PNV) data
(U.S. Forest Service, PNV Classification for Western and Central Montana, and Northern
Idaho) to classify vegetation for our habitat mask using the raster package in program R
(Hijmans et al. 2015). We reclassified vegetation communities into 4 categories broadly
representative of the study area (big sagebrush, Douglas fir, Idaho fescue, subalpine fir)
(Figure 3.2).
60
To assess how green vegetation influenced black bear densities, we initially
considered using yearly averaged normalized difference vegetation index (NDVI) data.
However, NDVI varied little across the landscape when averaged over our sampling
season. Net primary productivity (NPP), the amount of energy available on the landscape
from vegetation, better described variation on the landscape compared with NDVI (Xu et
al. 2012). We used NPP (kg C/m2) data at a 250‐m resolution from 2017 and 2018
(Numerical Terradynamic Simulation GroupMOD 17 MODIS;
http://www.ntsg.umt.edu/data; accessed 10 Sep 2019). Values of NPP in 2017 and 2018
were highly correlated (r = 0.999), so we averaged the two years, then centered and
scaled these values (subtracting the mean from NPP values, divided by the standard
deviation), to describe vegetation for both years.
The presence of roads can influence the spatial distribution of black bears,
depending on their tolerance of humans and inter- and intraspecific interactions
(Kasworm and Manley 1990, Laske et al. 2010, Gunther et al. 2018, Gantchoff et al.
2019). Within YNP, black bears are observed along roads most often on the Northern
Range (National Park Service, unpublished data). We considered distance to the nearest
road as a potential covariate and expected black bear densities to be higher near roads.
This prediction also was informed by data from collared bears that selected locations
closer to roads (see Chapter 2). We used a geospatial layer of paved roads (Yellowstone
Spatial Analysis Center 2010) and the st_distance function in the sf package, to compute
proximity of nearest road for locations in the density mask array, which we scaled
following the same procedures as the averaged NPP values (Pebesma 2018).
61
Finally, home-range sizes differ for male and female black bears on the Northern
Range (Appendix D), which can lead to differences in density (Drewry et al. 2013,
Humm et al. 2017, Azad et al. 2019, Welfelt et al. 2019). Therefore, we included sex as a
potential covariate in density models. We predicted that the sex ratio would be female-
biased, given that female black bears have lower resource needs and smaller home ranges
compared with males (Tredick and Vaughan 2009, Frary et al. 2011, Drewry et al. 2013,
Murphy et al. 2016, Gould et al. 2018).
Before creating models to explore factors that influence variation in bear density,
we first examined correlations between covariates. Values of NPP were related to the
vegetation community categories, so we did not include both covariates in the same
models. We considered 11 additive models and used AICc to compare model fit
(Burnham and Anderson 2004). Finally, we estimated overall abundance of black bears
within our study area (the 1,592-km2 habitat mask) with the region.N function in the secr
package (Efford 2019).
RESULTS
Genetic analysis
Between 2017 and 2018, we collected a total of 3,673 hair samples from 26 hair
snares, 217 from rub trees, and 53 other rub objects (see Appendix E for data on the
success rates of lures at hair snares). In 2017, we collected 67% of the 1,358 samples
from hair snares (Table 3.1) and 33% from rub objects (Table 3.2). When we increased
our sampling effort in 2018, 27% of the 2,315 samples came from hair snares (Table 3.1)
and 73% from rub objects (Table 3.2). We submitted 1,998 hair samples for genetic
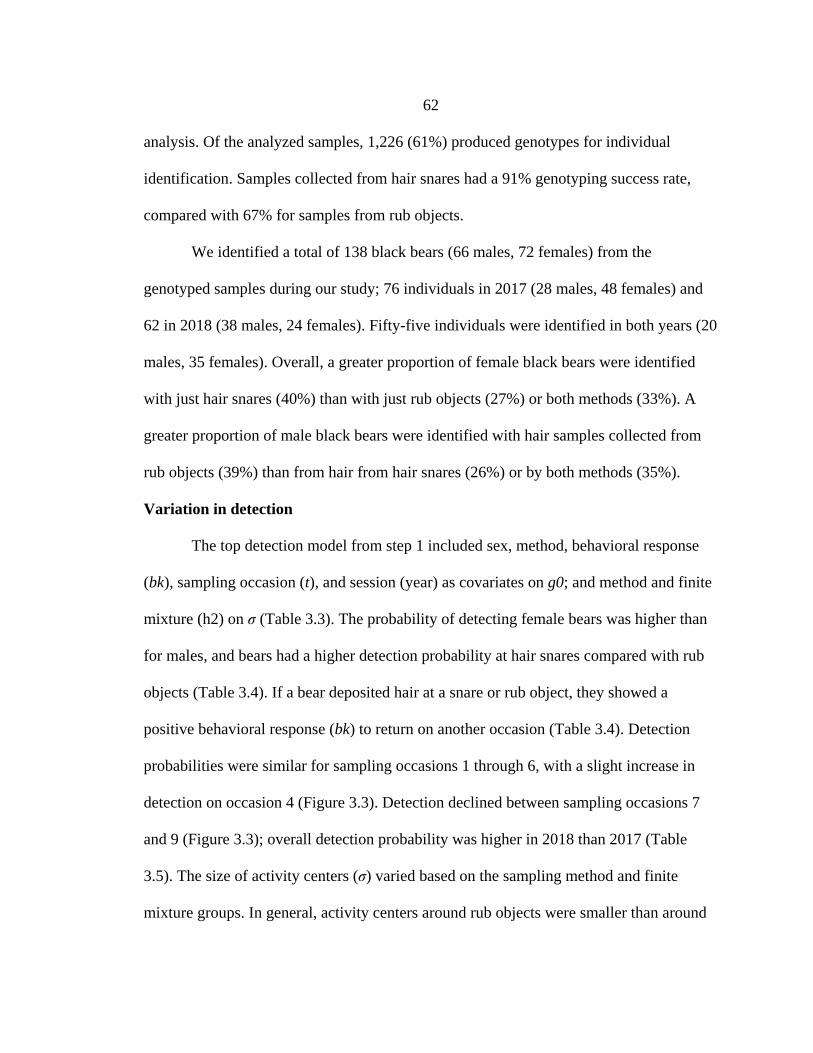
62
analysis. Of the analyzed samples, 1,226 (61%) produced genotypes for individual
identification. Samples collected from hair snares had a 91% genotyping success rate,
compared with 67% for samples from rub objects.
We identified a total of 138 black bears (66 males, 72 females) from the
genotyped samples during our study; 76 individuals in 2017 (28 males, 48 females) and
62 in 2018 (38 males, 24 females). Fifty-five individuals were identified in both years (20
males, 35 females). Overall, a greater proportion of female black bears were identified
with just hair snares (40%) than with just rub objects (27%) or both methods (33%). A
greater proportion of male black bears were identified with hair samples collected from
rub objects (39%) than from hair from hair snares (26%) or by both methods (35%).
Variation in detection
The top detection model from step 1 included sex, method, behavioral response
(bk), sampling occasion (t), and session (year) as covariates on g0; and method and finite
mixture (h2) on σ (Table 3.3). The probability of detecting female bears was higher than
for males, and bears had a higher detection probability at hair snares compared with rub
objects (Table 3.4). If a bear deposited hair at a snare or rub object, they showed a
positive behavioral response (bk) to return on another occasion (Table 3.4). Detection
probabilities were similar for sampling occasions 1 through 6, with a slight increase in
detection on occasion 4 (Figure 3.3). Detection declined between sampling occasions 7
and 9 (Figure 3.3); overall detection probability was higher in 2018 than 2017 (Table
3.5). The size of activity centers (σ) varied based on the sampling method and finite
mixture groups. In general, activity centers around rub objects were smaller than around
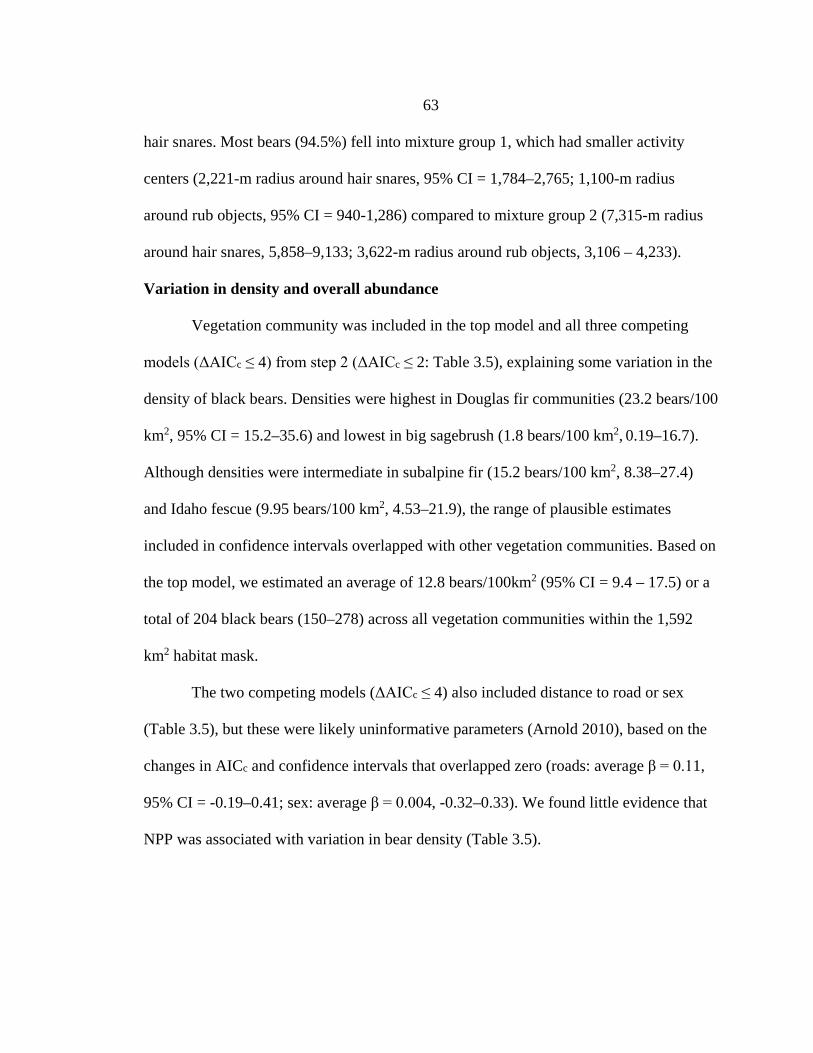
63
hair snares. Most bears (94.5%) fell into mixture group 1, which had smaller activity
centers (2,221-m radius around hair snares, 95% CI = 1,784–2,765; 1,100-m radius
around rub objects, 95% CI = 940-1,286) compared to mixture group 2 (7,315-m radius
around hair snares, 5,858–9,133; 3,622-m radius around rub objects, 3,106 – 4,233).
Variation in density and overall abundance
Vegetation community was included in the top model and all three competing
models (ΔAICc ≤ 4) from step 2 (ΔAICc ≤ 2: Table 3.5), explaining some variation in the
density of black bears. Densities were highest in Douglas fir communities (23.2 bears/100
km2, 95% CI = 15.2–35.6) and lowest in big sagebrush (1.8 bears/100 km2, 0.19–16.7).
Although densities were intermediate in subalpine fir (15.2 bears/100 km2, 8.38–27.4)
and Idaho fescue (9.95 bears/100 km2, 4.53–21.9), the range of plausible estimates
included in confidence intervals overlapped with other vegetation communities. Based on
the top model, we estimated an average of 12.8 bears/100km2 (95% CI = 9.4 – 17.5) or a
total of 204 black bears (150–278) across all vegetation communities within the 1,592
km2 habitat mask.
The two competing models (ΔAICc ≤ 4) also included distance to road or sex
(Table 3.5), but these were likely uninformative parameters (Arnold 2010), based on the
changes in AICc and confidence intervals that overlapped zero (roads: average β = 0.11,
95% CI = -0.19–0.41; sex: average β = 0.004, -0.32–0.33). We found little evidence that
NPP was associated with variation in bear density (Table 3.5).
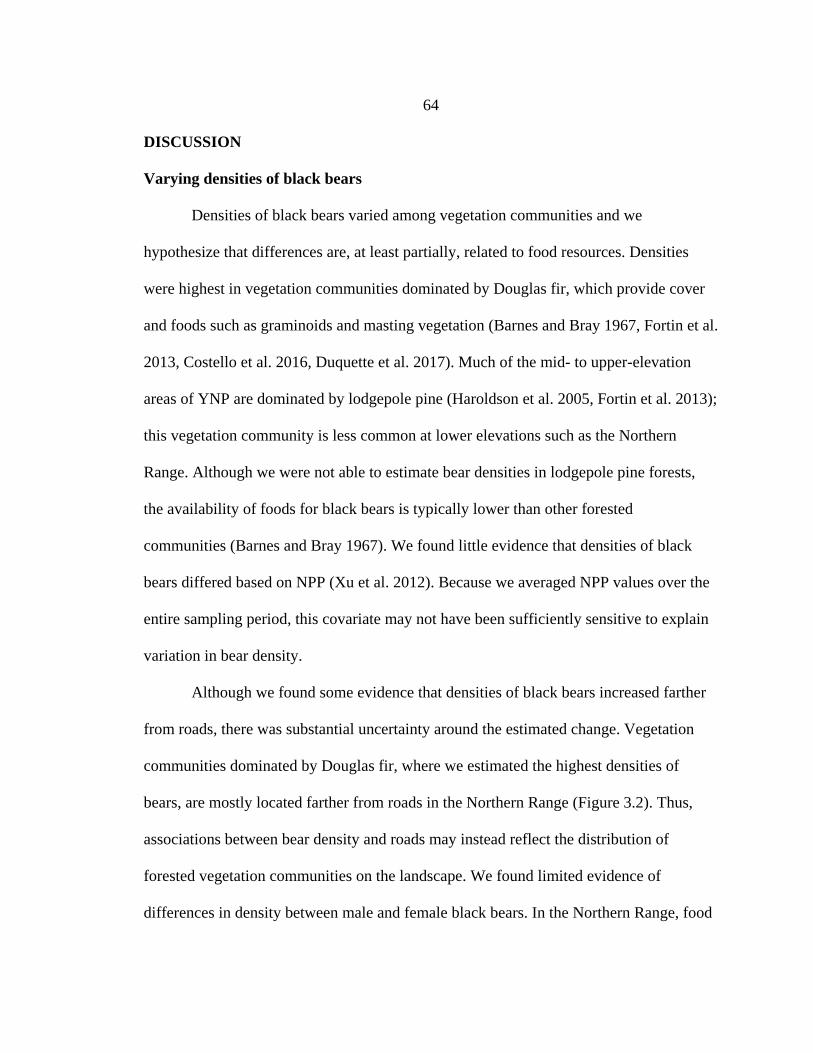
64
DISCUSSION
Varying densities of black bears
Densities of black bears varied among vegetation communities and we
hypothesize that differences are, at least partially, related to food resources. Densities
were highest in vegetation communities dominated by Douglas fir, which provide cover
and foods such as graminoids and masting vegetation (Barnes and Bray 1967, Fortin et al.
2013, Costello et al. 2016, Duquette et al. 2017). Much of the mid- to upper-elevation
areas of YNP are dominated by lodgepole pine (Haroldson et al. 2005, Fortin et al. 2013);
this vegetation community is less common at lower elevations such as the Northern
Range. Although we were not able to estimate bear densities in lodgepole pine forests,
the availability of foods for black bears is typically lower than other forested
communities (Barnes and Bray 1967). We found little evidence that densities of black
bears differed based on NPP (Xu et al. 2012). Because we averaged NPP values over the
entire sampling period, this covariate may not have been sufficiently sensitive to explain
variation in bear density.
Although we found some evidence that densities of black bears increased farther
from roads, there was substantial uncertainty around the estimated change. Vegetation
communities dominated by Douglas fir, where we estimated the highest densities of
bears, are mostly located farther from roads in the Northern Range (Figure 3.2). Thus,
associations between bear density and roads may instead reflect the distribution of
forested vegetation communities on the landscape. We found limited evidence of
differences in density between male and female black bears. In the Northern Range, food
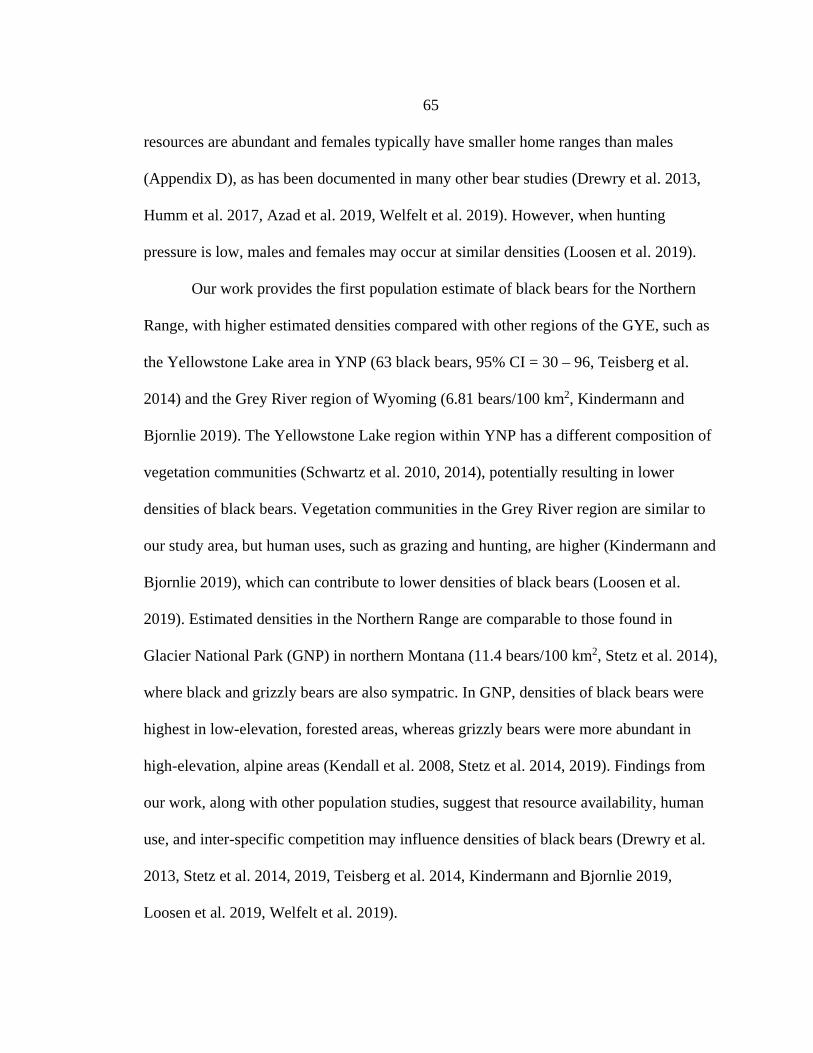
65
resources are abundant and females typically have smaller home ranges than males
(Appendix D), as has been documented in many other bear studies (Drewry et al. 2013,
Humm et al. 2017, Azad et al. 2019, Welfelt et al. 2019). However, when hunting
pressure is low, males and females may occur at similar densities (Loosen et al. 2019).
Our work provides the first population estimate of black bears for the Northern
Range, with higher estimated densities compared with other regions of the GYE, such as
the Yellowstone Lake area in YNP (63 black bears, 95% CI = 30 – 96, Teisberg et al.
2014) and the Grey River region of Wyoming (6.81 bears/100 km2, Kindermann and
Bjornlie 2019). The Yellowstone Lake region within YNP has a different composition of
vegetation communities (Schwartz et al. 2010, 2014), potentially resulting in lower
densities of black bears. Vegetation communities in the Grey River region are similar to
our study area, but human uses, such as grazing and hunting, are higher (Kindermann and
Bjornlie 2019), which can contribute to lower densities of black bears (Loosen et al.
2019). Estimated densities in the Northern Range are comparable to those found in
Glacier National Park (GNP) in northern Montana (11.4 bears/100 km2, Stetz et al. 2014),
where black and grizzly bears are also sympatric. In GNP, densities of black bears were
highest in low-elevation, forested areas, whereas grizzly bears were more abundant in
high-elevation, alpine areas (Kendall et al. 2008, Stetz et al. 2014, 2019). Findings from
our work, along with other population studies, suggest that resource availability, human
use, and inter-specific competition may influence densities of black bears (Drewry et al.
2013, Stetz et al. 2014, 2019, Teisberg et al. 2014, Kindermann and Bjornlie 2019,
Loosen et al. 2019, Welfelt et al. 2019).
66
Variation in detection
Subgroups of bears differentially encounter and use hair snares and rub objects,
based on previous visits by other bears, home-range size, habitat conditions, or
habituation to human activity (Kendall et al. 2008, Sawaya et al. 2012). We found higher
detection probabilities for females compared with males, consistent with previous work
and likely a function of differences in home-range sizes (Appendix D; Gould et al. 2018,
Loosen et al. 2019, Welfelt et al. 2019). Detection probabilities also were higher for hair
snares compared with rub objects. In contrast, female grizzly bears in Banff National
Park, Canada were detected less often at rub objects, likely due to the regular presence of
male grizzly bears (Sawaya et al. 2012). Sawaya et al. (2012) detected male grizzly bears
more often at rub objects; males have larger home ranges and rub objects were more
abundant and widely distributed compared with hair snares. In our study, higher bear
densities likely were associated with smaller home ranges, such that bears would have
been more likely to encounter a hair snare due the scent attractant, compared with rub
objects (Sawaya et al. 2012). However, we detected more unique individuals based on
samples from rub objects, despite lower detection probabilities, particularly with the
increased sampling effort in 2018 (Kendall et al. 2008, Graves et al. 2011, Sawaya et al.
2012, Stetz et al. 2014, Gould et al. 2018). Declines in detection probabilities late in the
sampling period coincided with seasonal changes in food availability, possibly decreasing
the effectiveness of the scent lure at hair snares (Costello et al. 2016).
67
Implications for other species
Grizzly bears outcompete and displace black bears throughout the interior and
southern regions of the GYE, where lodgepole pine is the dominant forest type (Barnes
and Bray 1967, Schwartz et al. 2010, Frattaroli 2011, Fortin et al. 2013). However,
conditions on the Northern Range seem to support higher densities of black bears,
potentially because of differences in vegetative communities and more abundant food
resources, which could in turn influence the distribution and abundance of grizzly bears
(Aune 1994, Stetz et al. 2019).
High densities of black bears also can influence recruitment of ungulate
populations (Bastille-Rousseau et al. 2011, Rayl et al. 2018, Svoboda et al. 2019).
Barber-Meyer et al. (2008) documented that black and grizzly bears accounted for 69%
of all predator-related mortality of elk calves on the Northern Range, with grizzly bears
involved in a larger proportion of predation events. Although Barber-Meyer et al. (2008)
attempted to estimate the annual number of elk calves killed by bears on the Northern
Range, they lacked accurate estimates of bear numbers. Based on our high estimated
density, black bears could be preying on more elk calves and having a greater effect on
elk recruitment than previously thought. In addition, bears (black or grizzly bear) visited
at least 42% of kills made by cougars and displaced cougars from >10% of these kills
(Murphy et al. 1998). Our study provides new information that can contribute to a more
complete understanding of the diverse animals on the Northern Range and the influence
of these black bears on other trophic levels (Ruth et al. 2011, Metz et al. 2012, MacNulty
et al. 2016, Tallian et al. 2017, Kohl et al. 2019).
68
MANAGEMENT IMPLICATIONS
Visitation continues to increase in YNP, creating challenges for national park
managers simultaneously tasked with providing safe wildlife viewing opportunities and
protecting bears from people. Our estimates of black bear density were greatest in
Douglas fir and subalpine fir communities and managers may consider this when
evaluating where human-black bear interactions would be most likely to occur. Fine-scale
information regarding the distribution of bears also can help managers prioritize where to
use limited resources to reduce conflicts between bears and people. For example, road
patrols could be focused along sections of roadway that overlap with Douglas fir and
subalpine fir forests or more food storage boxes could be provided at backcountry
campsites in forested communities.
We also expect the abundance of food resources for bears will change with altered
climate conditions (Frank and McNaughton 1992, Frank et al. 2016, Notaro et al. 2019).
In the central regions of YNP, abundance of some foods already have changed, such as
cutthroat trout and whitebark pine cones, displacing bears from some areas and causing
some bears to seek alternative foods (Middleton et al. 2013, Teisberg et al. 2014).
Because of the unique conditions of the Northern Range, vegetation communities may be
affected by climate change differently and at different time scales, compared with other
regions of YNP. If the availability of vegetative resources decrease, bears might explore
areas outside of YNP in search of alternative foods, possibly increasing vulnerability to
human-caused mortality, such as hunter harvest and management removal. Based on
daily movement data and home-range estimates (Appendix D), some adult male bears do
69
not exclusively use YNP lands and several of these animals (2 of 5 collared males
between 2014 – 2018) have been harvested by hunters. Future changes in the availability
of resources on the Northern Range may affect vital rates of population segments
differently, which can translate into population-level impacts (Bunnell and Tait 1980,
Miller 1990, Hebblewhite et al. 2002, Malcolm and Van Deelen 2010, Mace and Chilton-
Radandt 2011).
ACKNOWLEDGMENTS
We thank our field crews: Elise Loggers, Megan Wright, Lauren Bryant, Samantha
Schmidt, Katie Piecora, Hitomi Okada, Nikki Tatton, Neal Hurst, Leia Hayward, Amelia
Hiorns, and the many volunteers that helped collect data in support of this project. The
Yellowstone Bear Management Office provided additional field support to set up and
monitor hair snare locations. Annie Carlson of the Yellowstone Research Permit Office
helped us secure our research permits. The Yellowstone Fisheries program supplied lake
trout carcasses that we used for scent lure. We are grateful to David Paetkau and his staff
at Wildlife Genetics International for their analytical work and helpful guidance
regarding subsampling. In addition, we thank Jeff Stetz for assisting with both field and
technical support of our study and Terrill Patterson for assistance with model coding
issues. Finally, this research was supported by funding from Yellowstone Forever.
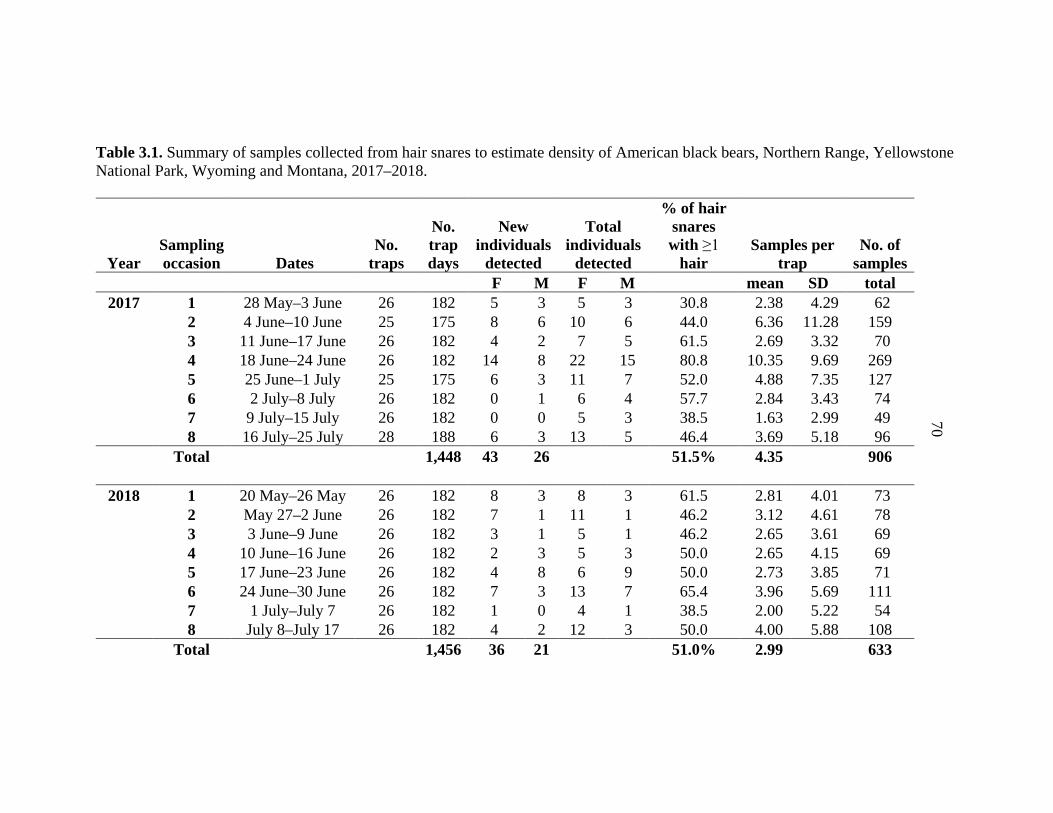
70
Table 3.1. Summary of samples collected from hair snares to estimate density of American black bears, Northern Range, Yellowstone National Park, Wyoming and Montana, 2017–2018.
Year Sampling occasion Dates
No. traps
No. trap days
New individuals
detected
Total individuals
detected
% of hair snares with ≥1
hair Samples per
trap No. of
samples F M F M mean SD total
2017 1 28 May–3 June 26 182 5 3 5 3 30.8 2.38 4.29 62 2 4 June–10 June 25 175 8 6 10 6 44.0 6.36 11.28 159 3 11 June–17 June 26 182 4 2 7 5 61.5 2.69 3.32 70 4 18 June–24 June 26 182 14 8 22 15 80.8 10.35 9.69 269 5 25 June–1 July 25 175 6 3 11 7 52.0 4.88 7.35 127 6 2 July–8 July 26 182 0 1 6 4 57.7 2.84 3.43 74 7 9 July–15 July 26 182 0 0 5 3 38.5 1.63 2.99 49 8 16 July–25 July 28 188 6 3 13 5 46.4 3.69 5.18 96 Total 1,448 43 26 51.5% 4.35 906
2018 1 20 May–26 May 26 182 8 3 8 3 61.5 2.81 4.01 73 2 May 27–2 June 26 182 7 1 11 1 46.2 3.12 4.61 78 3 3 June–9 June 26 182 3 1 5 1 46.2 2.65 3.61 69 4 10 June–16 June 26 182 2 3 5 3 50.0 2.65 4.15 69 5 17 June–23 June 26 182 4 8 6 9 50.0 2.73 3.85 71 6 24 June–30 June 26 182 7 3 13 7 65.4 3.96 5.69 111 7 1 July–July 7 26 182 1 0 4 1 38.5 2.00 5.22 54 8 July 8–July 17 26 182 4 2 12 3 50.0 4.00 5.88 108 Total 1,456 36 21 51.0% 2.99 633
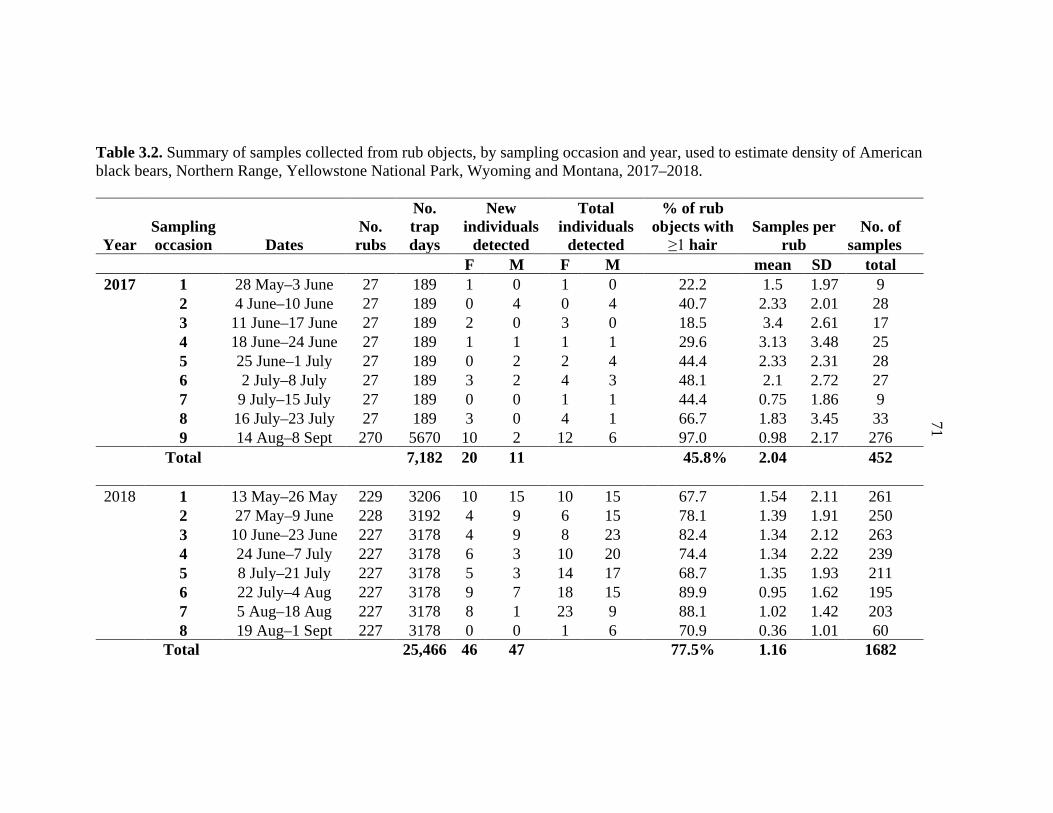
71
Table 3.2. Summary of samples collected from rub objects, by sampling occasion and year, used to estimate density of American black bears, Northern Range, Yellowstone National Park, Wyoming and Montana, 2017–2018.
Year Sampling occasion Dates
No. rubs
No. trap days
New individuals
detected
Total individuals
detected
% of rub objects with
≥1 hair Samples per
rub No. of
samples F M F M mean SD total
2017 1 28 May–3 June 27 189 1 0 1 0 22.2 1.5 1.97 9 2 4 June–10 June 27 189 0 4 0 4 40.7 2.33 2.01 28 3 11 June–17 June 27 189 2 0 3 0 18.5 3.4 2.61 17 4 18 June–24 June 27 189 1 1 1 1 29.6 3.13 3.48 25 5 25 June–1 July 27 189 0 2 2 4 44.4 2.33 2.31 28 6 2 July–8 July 27 189 3 2 4 3 48.1 2.1 2.72 27 7 9 July–15 July 27 189 0 0 1 1 44.4 0.75 1.86 9 8 16 July–23 July 27 189 3 0 4 1 66.7 1.83 3.45 33 9 14 Aug–8 Sept 270 5670 10 2 12 6 97.0 0.98 2.17 276 Total 7,182 20 11 45.8% 2.04 452
2018 1 13 May–26 May 229 3206 10 15 10 15 67.7 1.54 2.11 261 2 27 May–9 June 228 3192 4 9 6 15 78.1 1.39 1.91 250 3 10 June–23 June 227 3178 4 9 8 23 82.4 1.34 2.12 263 4 24 June–7 July 227 3178 6 3 10 20 74.4 1.34 2.22 239 5 8 July–21 July 227 3178 5 3 14 17 68.7 1.35 1.93 211 6 22 July–4 Aug 227 3178 9 7 18 15 89.9 0.95 1.62 195 7 5 Aug–18 Aug 227 3178 8 1 23 9 88.1 1.02 1.42 203 8 19 Aug–1 Sept 227 3178 0 0 1 6 70.9 0.36 1.01 60 Total 25,466 46 47 77.5% 1.16 1682
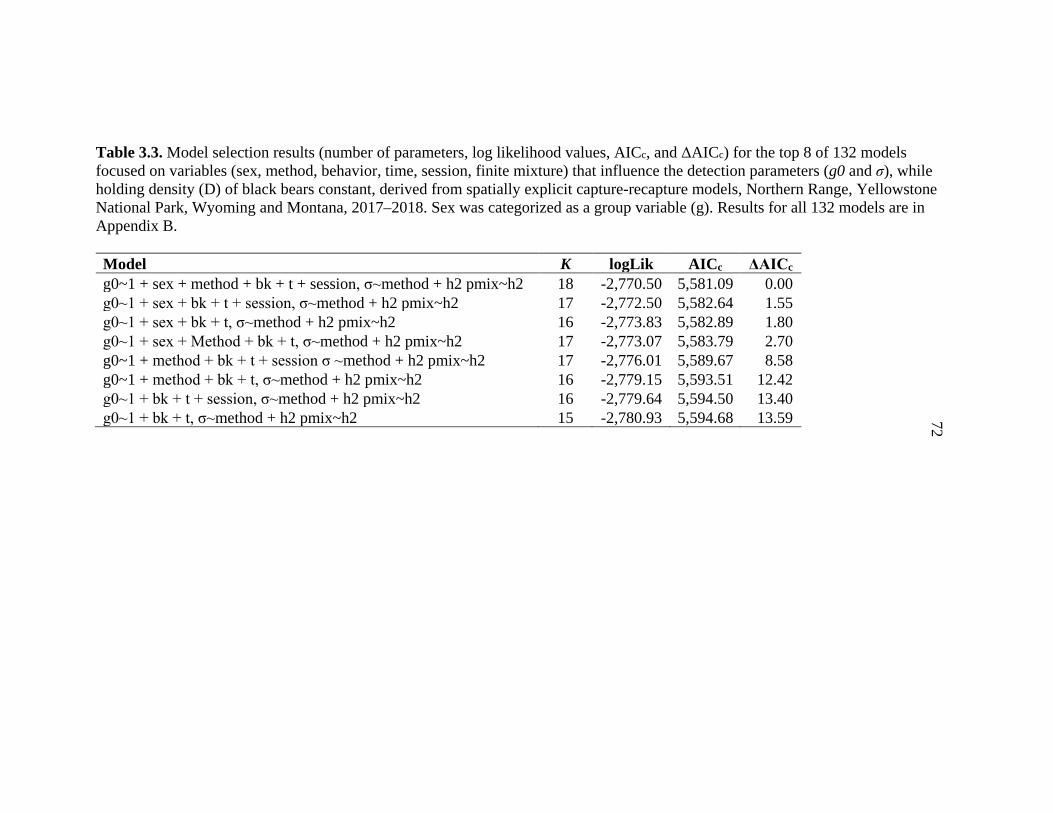
72
Table 3.3. Model selection results (number of parameters, log likelihood values, AICc, and ΔAICc) for the top 8 of 132 models focused on variables (sex, method, behavior, time, session, finite mixture) that influence the detection parameters (g0 and σ), while holding density (D) of black bears constant, derived from spatially explicit capture-recapture models, Northern Range, Yellowstone National Park, Wyoming and Montana, 2017–2018. Sex was categorized as a group variable (g). Results for all 132 models are in Appendix B. Model K logLik AICc ΔAICc g0~1 + sex + method + bk + t + session, σ~method + h2 pmix~h2 18 -2,770.50 5,581.09 0.00 g0~1 + sex + bk + t + session, σ~method + h2 pmix~h2 17 -2,772.50 5,582.64 1.55 g0~1 + sex + bk + t, σ~method + h2 pmix~h2 16 -2,773.83 5,582.89 1.80 g0~1 + sex + Method + bk + t, σ~method + h2 pmix~h2 17 -2,773.07 5,583.79 2.70 g0~1 + method + bk + t + session σ ~method + h2 pmix~h2 17 -2,776.01 5,589.67 8.58 g0~1 + method + bk + t, σ~method + h2 pmix~h2 16 -2,779.15 5,593.51 12.42 g0~1 + bk + t + session, σ~method + h2 pmix~h2 16 -2,779.64 5,594.50 13.40 g0~1 + bk + t, σ~method + h2 pmix~h2 15 -2,780.93 5,594.68 13.59
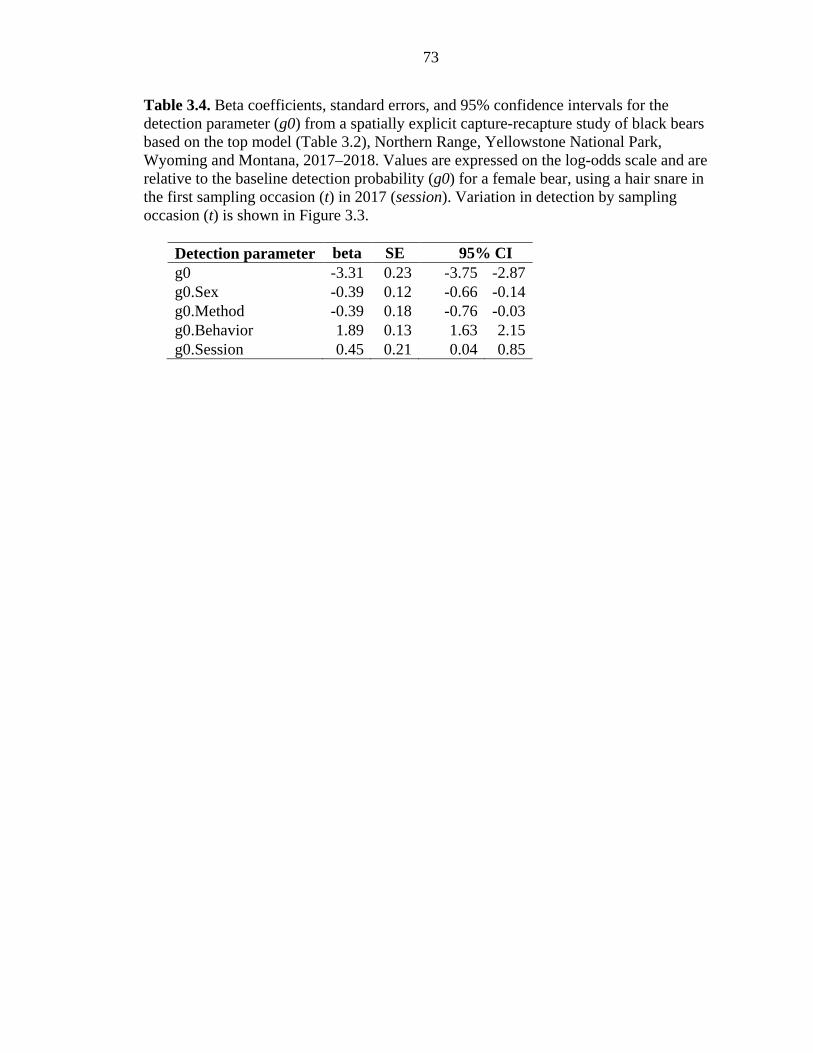
73
Table 3.4. Beta coefficients, standard errors, and 95% confidence intervals for the detection parameter (g0) from a spatially explicit capture-recapture study of black bears based on the top model (Table 3.2), Northern Range, Yellowstone National Park, Wyoming and Montana, 2017–2018. Values are expressed on the log-odds scale and are relative to the baseline detection probability (g0) for a female bear, using a hair snare in the first sampling occasion (t) in 2017 (session). Variation in detection by sampling occasion (t) is shown in Figure 3.3.
Detection parameter beta SE 95% CI g0 -3.31 0.23 -3.75 -2.87 g0.Sex -0.39 0.12 -0.66 -0.14 g0.Method -0.39 0.18 -0.76 -0.03 g0.Behavior 1.89 0.13 1.63 2.15 g0.Session 0.45 0.21 0.04 0.85
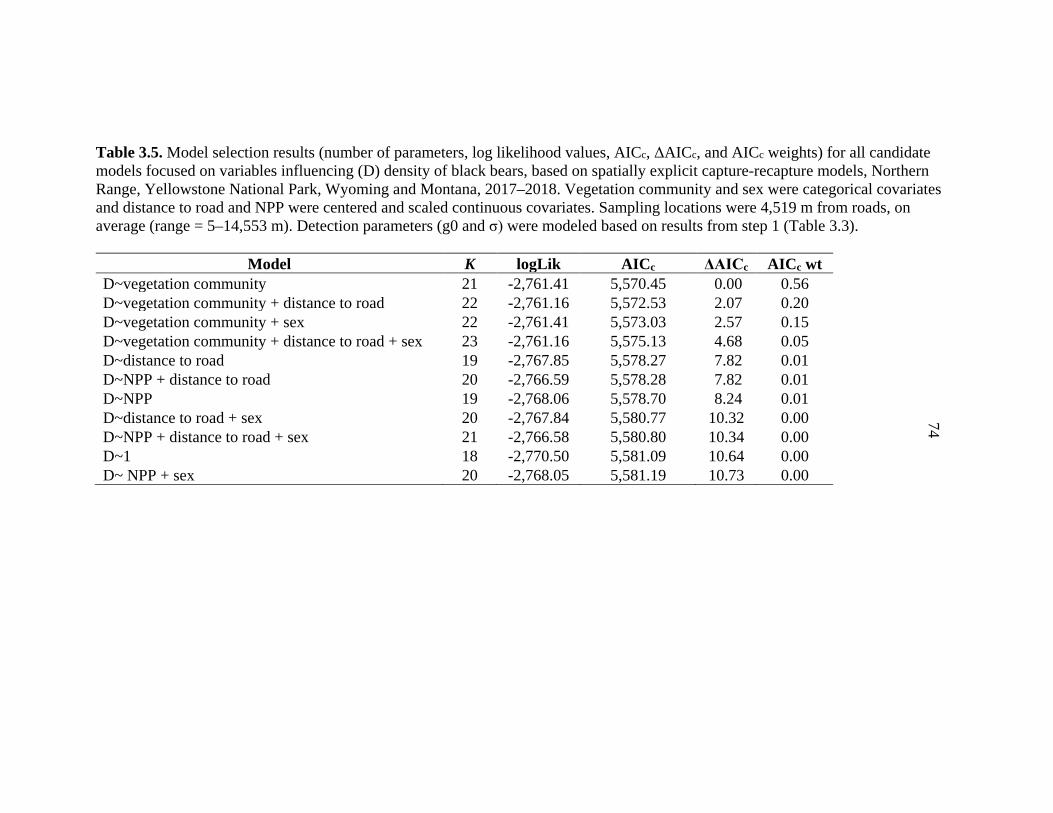
74 Table 3.5. Model selection results (number of parameters, log likelihood values, AICc, ΔAICc, and AICc weights) for all candidate models focused on variables influencing (D) density of black bears, based on spatially explicit capture-recapture models, Northern Range, Yellowstone National Park, Wyoming and Montana, 2017–2018. Vegetation community and sex were categorical covariates and distance to road and NPP were centered and scaled continuous covariates. Sampling locations were 4,519 m from roads, on average (range = 5–14,553 m). Detection parameters (g0 and σ) were modeled based on results from step 1 (Table 3.3).
Model K logLik AICc ΔAICc AICc wt D~vegetation community 21 -2,761.41 5,570.45 0.00 0.56 D~vegetation community + distance to road 22 -2,761.16 5,572.53 2.07 0.20 D~vegetation community + sex 22 -2,761.41 5,573.03 2.57 0.15 D~vegetation community + distance to road + sex 23 -2,761.16 5,575.13 4.68 0.05 D~distance to road 19 -2,767.85 5,578.27 7.82 0.01 D~NPP + distance to road 20 -2,766.59 5,578.28 7.82 0.01 D~NPP 19 -2,768.06 5,578.70 8.24 0.01 D~distance to road + sex 20 -2,767.84 5,580.77 10.32 0.00 D~NPP + distance to road + sex 21 -2,766.58 5,580.80 10.34 0.00 D~1 18 -2,770.50 5,581.09 10.64 0.00 D~ NPP + sex 20 -2,768.05 5,581.19 10.73 0.00
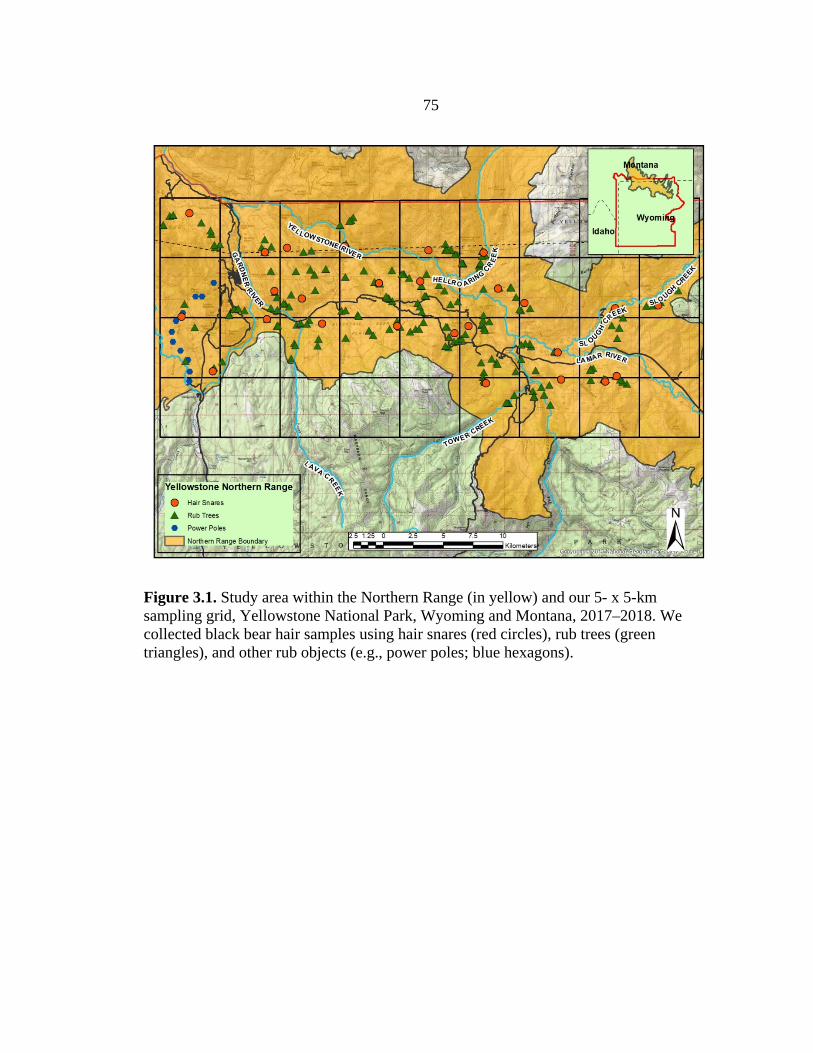
75
Figure 3.1. Study area within the Northern Range (in yellow) and our 5- x 5-km sampling grid, Yellowstone National Park, Wyoming and Montana, 2017–2018. We collected black bear hair samples using hair snares (red circles), rub trees (green triangles), and other rub objects (e.g., power poles; blue hexagons).
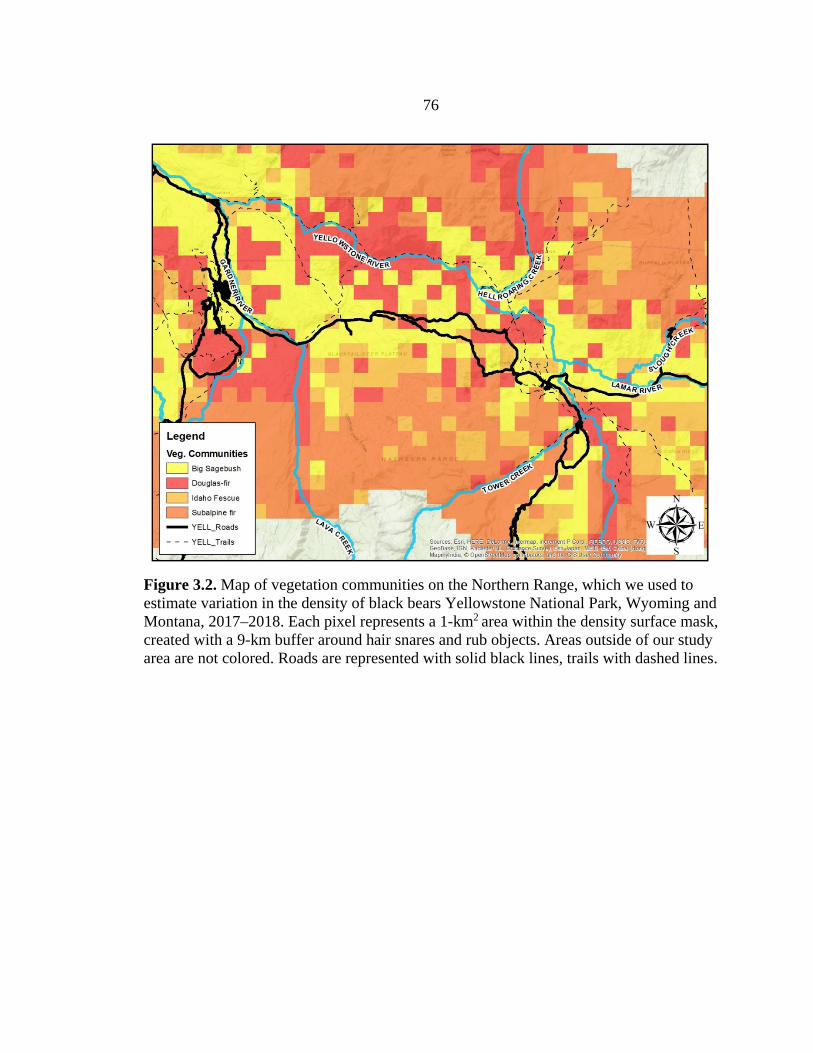
76
Figure 3.2. Map of vegetation communities on the Northern Range, which we used to estimate variation in the density of black bears Yellowstone National Park, Wyoming and Montana, 2017–2018. Each pixel represents a 1-km2 area within the density surface mask, created with a 9-km buffer around hair snares and rub objects. Areas outside of our study area are not colored. Roads are represented with solid black lines, trails with dashed lines.
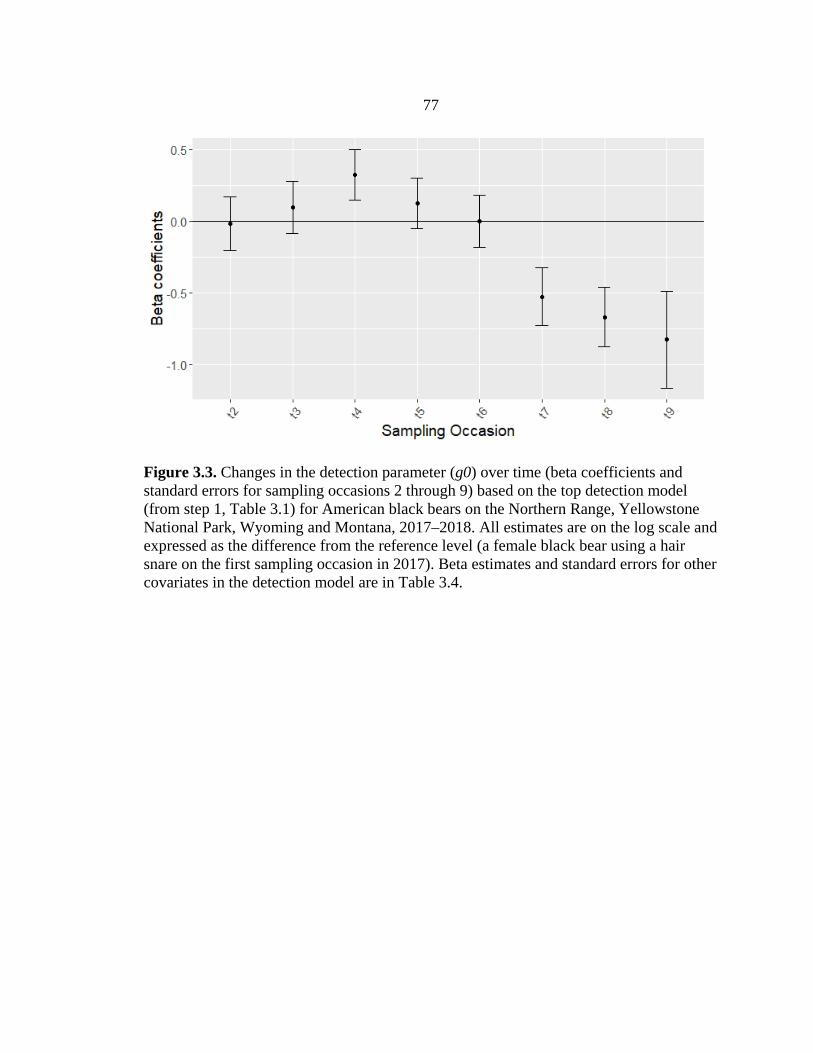
77
Figure 3.3. Changes in the detection parameter (g0) over time (beta coefficients and standard errors for sampling occasions 2 through 9) based on the top detection model (from step 1, Table 3.1) for American black bears on the Northern Range, Yellowstone National Park, Wyoming and Montana, 2017–2018. All estimates are on the log scale and expressed as the difference from the reference level (a female black bear using a hair snare on the first sampling occasion in 2017). Beta estimates and standard errors for other covariates in the detection model are in Table 3.4.
78
LITERATURE CITED
Apps, C. D., B. N. McLellan, and J. G. Woods. 2006. Landscape partitioning and spatial inferences of competition between black and grizzly bears. Ecography 29:561–572.
Arnold, T. W. 2010. Uninformative parameters and model selection using Akaike’ s Information Criterion. Journal of Wildlife Management 74:1175–1178.
Aune, K. E. 1994. Comparative ecology of black and grizzly bears on the Rocky Mountain Front, Montana. International Conference of Bear Research and Management 9:365–374.
Azad, S., K. McFadden, J. D. Clark, T. Wactor, and D. S. Jachowski. 2019. Applying spatially explicit capture – recapture models to estimate black bear density in South Carolina. Wildlife Society Bulletin 43:500–507.
Baker, A. D., and P. L. Leberg. 2018. Impacts of human recreation on carnivores in protected areas. PLoS ONE 13:e0195436.
Barber-Meyer, S. M., L. D. Mech, and P. J. White. 2008. Elk calf survival and mortality following wolf restoration to Yellowstone National Park. Wildlife Monographs 169:1–30.
Barnes, V. G., and O. E. Bray. 1967. Population characteristics and activities of black bears in YNP. Final report. Colorado State University, Boulder, CO.
Bastille-Rousseau, G., D. Fortin, C. Dussault, R. Courtois, and J. P. Ouellet. 2011. Foraging strategies by omnivores: Are black bears actively searching for ungulate neonates or are they simply opportunistic predators? Ecography 34:588–596.
Beckmann, J. P., and J. Berger. 2003. Using black bears to test ideal-free distribution models experimentally. Journal of Mammalogy 84:594–606.
Beckmann, J. P., and C. W. Lackey. 2008. Carnivores, urban landscapes, and longitudinal studies: a case history of black bears. Human–Wildlife Conflicts 2:168–174.
Belant, J. L., B. Griffith, Y. Zhang, E. H. Follmann, and L. G. Adams. 2010. Population-level resource selection by sympatric brown and American black bears in Alaska. Polar Biology 33:31–40.
Boulanger, J., M. Proctor, S. Himmer, G. Stenhouse, D. Paetkau, and J. Cranston. 2006. An empirical test of DNA mark–recapture sampling strategies for grizzly bears. Ursus 17:149–158.
Boyce, M. S. 2018. Wolves for Yellowstone: dynamics in time and space. Journal of Mammalogy 99:1021–1031.
79
Brown, J. H., D. W. Mehlman, and G. C. Stevens. 1995. Spatial variation in abundance. Ecology 76:2028–2043.
Bunnell, F. L., and D. E. N. Tait. 1980. Bears in models and in reality: Implications to management. International Conference of Bear Research and Management 4:15–23.
Burnham, K. P., and D. R. Anderson. 2004. Multimodel inference: Understanding AIC and BIC in model selection. Sociological Methods & Research 33:261–304.
Burst, T. L., and M. R. Pelton. 1983. Black bear mark trees in the Smoky Mountains. International Conference of Bear Research and Management 5:45–53.
Cole, G. F. 1976. Management involving grizzly and black bears in Yellowstone National Park, 1970-1975. U.S. Department of the Interior, National Park Service, Natural Resources Report 9:1–26.
Coleman, T. H., C. C. Schwartz, K. A. Gunther, and S. Creel. 2013. Grizzly bear and human interaction in Yellowstone National Park: An evaluation of bear management areas. The Journal of Wildlife Management 77:1311–1320.
Costello, C. M., S. L. Cain, S. Pils, L. Frattaroli, M. A. Haroldson, and F. T. van Manen. 2016. Diet and macronutrient optimization in wild ursids: A comparison of grizzly bears with sympatric and allopatric black bears. PLoS ONE 11:e0153702.
Costello, C. M., and R. W. Sage. 1994. Predicting black bear habitat selection from food abundance under 3 forest management systems. International Conference of Bear Research and Management 9:375–387.
Delibes, M., P. Gaona, and P. Ferreras. 2001. Effects of an attractive sink leading into maladaptive habitat selection. American Naturalist 158:277–285.
Despain, D. G. 1990. Yellowstone vegetation: consequnces of environment and history in a natural setting. Roberts Rinehart Publishers, Boulder, Colorado, USA.
Drewry, J. M., F. T. van Manen, and D. M. Ruth. 2013. Density and genetic structure of black bears in coastal South Carolina. Journal of Wildlife Management 77:153–164.
Duquette, J. F., J. L. Belant, N. J. Svoboda, D. E. Beyer, and P. E. Lederle. 2014. Effects of maternal nutrition, resource use and multi-predator risk on neonatal white-tailed deer survival. PLoS ONE 9:e100841.
Duquette, J. F., J. L. Belant, C. M. Wilton, N. Fowler, B. W. Waller, D. E. Beyer, N. J. Svoboda, S. L. Simek, and J. Beringer. 2017. Black bear (Ursus americanus) functional resource selection relative to intraspecific competition and human risk. Canadian Journal of Zoology 95:203–212.
80
Efford, M. 2019. Package ‘secr’ - spatially explicit capture - recapture models in R. version 3.2.1. https://cran.r-project.org/web/packages/secr/index.html
Efford, M. G., D. L. Borchers, and A. E. Byrom. 2009. Density estimation by spatially explicit capture-recapture: likelihood-based methods. Pages 255–269 in D. L. Thomson, E. G. Cooch, and M. J. Conroy, editors. Modeling demographic processes in marked populations. Springer, Boston, MA.
Fortin, J. K. 2011. Niche separation of grizzly (Ursus arctos) and American black bears (Ursus americanus) in Yellowstone National Park. Dissertation, Washington State University.
Fortin, J. K., C. C. Schwartz, K. A. Gunther, J. E. Teisberg, M. A. Haroldson, M. A. Evans, and C. T. Robbins. 2013. Dietary adjustability of grizzly bears and American black bears in Yellowstone National Park. Journal of Wildlife Management 77:270–281.
Frank, D. A., and S. J. McNaughton. 1992. The ecology of plants, large mammalian herbivores, and drought in Yellowstone National Park. Ecology 73:2043–2058.
Frank, D. A., R. L. Wallen, and P. J. White. 2016. Ungulate control of grassland production: grazing intensity and ungulate species composition in Yellowstone Park. Ecosphere 7:e01603.
Frary, V. J., J. Duchamp, D. S. Maehr, and J. L. Larkin. 2011. Density and distribution of a colonizing front of the American black bear Ursus americanus. Wildlife Biology 17:404–416.
Frattaroli, L. M. 2011. Black bear (Ursus americanus) ecology in southern Grand Teton National Park. Thesis, Montana State University.
Gaillard, J., M. Hebblewhite, A. Loison, M. Fuller, R. Powell, M. Basille, and B. Van Moorter. 2010. Habitat – performance relationships: finding the right metric at a given spatial scale. Philosophical Transctions of the Royal Society B: Biological Science 365:2255–2265.
Gantchoff, M. G., D. Beyer, and J. L. Belant. 2019. Reproductive class influences risk tolerance during denning and spring for American black bears (Ursus americanus). Ecosphere 10:1–12.
Garrison, E. P., J. W. McCown, and M. K. Oli. 2007. Reproductive ecology and cub survival of Florida black bears. Journal of Wildlife Management 71:720–727.
Gaston, K. J., T. M. Blackburn, and J. H. Lawton. 1997. Interspecific abundance-range size relationships: An appraisal of mechanisms. Journal of Animal Ecology 66:579-601.
81
Goad, E. H., L. Pejchar, S. E. Reed, and R. L. Knight. 2014. Habitat use by mammals varies along an exurban development gradient in northern Colorado. Biological Conservation 176:172–182.
Gould, M. J., J. W. Cain, G. W. Roemer, W. R. Gould, and S. G. Liley. 2018. Density of American black bears in New Mexico. Journal of Wildlife Management 82:775–788.
Graham, K., J. Boulanger, J. Duval, and G. Stenhouse. 2010. Spatial and temporal use of roads by grizzly bears in west-central Alberta. Ursus 21:43–56.
Graves, T. A., K. C. Kendall, J. A. Royle, J. B. Stetz, and A. C. Macleod. 2011. Linking landscape characteristics to local grizzly bear abundance using multiple detection methods in a hierarchical model. Animal Conservation 14:652–664.
Greene, C. M., and J. A. Stamps. 2001. Habitat selection at low population densities. Ecology 82:2091–2100.
Grogan, R. G., and F. G. Lindzey. 1999. Estimating population size of a low-density black bear population using capture-resight. International Conference on Bear Research and Management 11:117–122.
Gunther, K. A. M. J. Biel, N. Anderson, and L. Waits. 2002. Probable grizzly bear predation on an American black bear in Yellowstone National Park. Ursus 13:372 – 374.
Gunther, K. A., K. R. Wilmot, S. L. Cain, T. Wyman, E. G. Reinertson, and A. M. Bramblett. 2018. Managing human-habituated bears to enhance survival, habitat effectiveness, and public viewing. Human-Wildlife Interactions 12:373–386.
Gunther, K. A., and T. Wyman. 2008. Human habituated bears: The next challenge in bear management in Yellowstone National Park. Yellowstone Science 16:35–41.
Haroldson, M. A., K. A. Gunther, D. P. Reinhart, S. R. Podruzny, C. Cegelski, L. Waits, T. Wyman, and J. Smith. 2005. Changing number of spawning cutthroat trout in tributary streams of Yellowstone Lake and estimates of grizzly bears visiting streams from DNA. Ursus 16:167–180.
Harris, R. B., C. C. Schwartz, R. D. Mace, and M. A. Haroldson. 2011. Study design and sampling intensity for demographic analyses of bear populations. Ursus 22:24–36.
Hebblewhite, M., M. Percy, and R. Serrouya. 2002. Black bear (Ursus americanus) survival and demography in the Bow Valley of Banff National Park, Alberta. Biological Conservation:112: 415-425.
82
Hijmans, R. J., J. van Etten, J. Cheng, M. Mattiuzzi, M. Sumner, J. A. Greenberg, O. P. Lamigueiro, A. Bevan, E. B. Racine, and A. Shortridge. 2015. Package ‘raster’. R package version 3.1-5. https://cran.r-project.org/web/packages/raster/index.html
Holm, G. W., F. G. Lindzey, and D. S. Moody. 1999. Interactions of sympatric black and grizzly bears in northwest Wyoming. Ursus 11:99–108.
Hooker, M. J., J. S. Laufenberg, A. K. Ashley, J. T. Sylvest, and M. J. Chamberlain. 2015. Abundance and density estimation of the American black bear population in central Georgia. Ursus 26:107–115.
Humm, J. M., J. W. McCown, B. K. Scheick, and J. D. Clark. 2017. Spatially explicit population estimates for black bears based on cluster sampling. The Journal of Wildlife Management 81:1187–1201.
Ives, A. R., and E. D. Klopper. 1997. Spatial variation in abundance created by stochastic temporal variation. Ecology 78:1907–1913.
Johnson, H. E., S. W. Breck, S. Baruch-mordo, D. L. Lewis, C. W. Lackey, K. R. Wilson, J. Broderick, J. S. Mao, and J. P. Beckmann. 2015. Shifting perceptions of risk and reward: Dynamic selection for human development by black bears in the western United States. Biological Conservation 187:164–172.
Kasworm, W. F., and T. L. Manley. 1990. Road and trail influences on grizzly bears and black bears in Northwest Montana. International Conference on Bear Research and Management 8:79–84.
Kendall, K. C., A. C. Macleod, K. L. Boyd, J. Boulanger, J. A. Royle, W. F. Kasworm, D. Paetkau, M. F. Proctor, K. Annis, and T. A. Graves. 2015. Density, distribution, and genetic structure of grizzly bears in the Cabinet-Yaak ecosystem. Journal of Wildlife Management 80:314–331.
Kendall, K. C., J. B. Stetz, J. Boulanger, A. C. Macleod, D. Paetkau, and G. C. White. 2009. Demography and genetic structure of a recovering grizzly bear population. Journal of Wildlife Management 73:3–17.
Kendall, K. C., J. B. Stetz, D. A. Roon, L. P. Waits, J. B. Boulanger, and D. Paetkau. 2008. Grizzly bear density in Glacier National Park, Montana. Journal of Wildlife Management 72:1693–1705.
Kindermann, R., and D. Bjornlie. 2019. Black bear population monotoring in the Greys River, Wyoming using clustered hair snares corrals and spatially explicit capture-recapture models. Large Carnivore Section, Wyoming Game and Fish Department
83
Kohl, M. T., T. K. Ruth, M. C. Metz, D. R. Stahler, D. W. Smith, P. J. White, and D. R. MacNulty. 2019. Do prey select for vacant hunting domains to minimize a multi-predator threat? Ecology Letters 20:1724–1733.
Lamb, C. T., D. A. Walsh, and G. Mowat. 2016. Factors influencing detection of grizzly bears at genetic sampling sites. Ursus 27:31–44.
Laske, T. G., H. J. Harlow, D. L. Garshelis, and P. A. Iaizzo. 2010. Extreme respiratory sinus arrhythmia enables overwintering black bear survival — Physiological insights and applications to human medicine. Journal of Cardiovascular Translational Research 3:559–569.
Loosen, A. E., A. T. Morehouse, and M. S. Boyce. 2019. Land tenure shapes black bear density and abundance on a multi-use landscape. Ecology and Evolution 9:73–90.
Mace, R. D., and T. Chilton-Radandt. 2011. Black bear harvest, research, and management in Montana. 2011 Final report. Montana Department of Fish, Wildlife and Parks, Wildlife Division, Helena, Montana.
MacNulty, D. R., D. R. Stahler, C. T. Wyman, J. Ruprecht, and D. W. Smith. 2016. The challenge of understanding northern Yellowstone elk dynamics after wolf reintroduction. Yellowstone Science 24:25–33.
Malcolm, K. D., and T. R. Van Deelen. 2010. Effects of habitat and hunting framework on American black bear harvest structure in Wisconsin. Ursus 21:14–22
Manly, B. F. J., L. L. McDonald, D. L. Thomas, T. L. McDonald, and W. P. Erickson. 2007. Resource selection by animals: Statistical design and analysis for field studies. Second Edition. Kluwer Academic Publisher, New York.
Mattson, D. J., S. Herrero, and T. Merrill. 2005. Are black bears a factor in the restoration of North American grizzly bear populations? Ursus 16:11–30.
Mattson, D. J., R. R. Knight, and B. M. Blanchard. 1987. The effects of developments and primary roads on grizzly bear habitat use in Yellowstone National Park, Wyoming. International Conference of Bear Research and Management 7:259–273.
Mazur, R., A. P. Klimley, and K. Folger. 2013. Implications of the variable availability of seasonal foods on the home ranges of black bears, Ursus americanus, in the Sierra Nevada of California. Animal Biotelemetry 1:1–16.
McLellan, B. N. 2011. Implications of a high-energy and low-protein diet on the body composition, fitness, and competitive abilities of black (Ursus americanus) and grizzly (Ursus arctos) bears. Canadian Journal of Zoology 89:546–558.
84
Mech, L. D., and S. Barber-Meyer. 2015. Yellowstone wolf (Canis lupus) density predicted by elk (Cervus elaphus) biomass. Canadian Journal of Zoology 502:499–502.
Metz, M. C., D. W. Smith, J. A. Vucetich, D. R. Stahler, and R. O. Peterson. 2012. Seasonal patterns of predation for gray wolves in the multi-prey system of Yellowstone National Park. Journal of Animal Ecology 81:553–563.
Middleton, A. D., T. A. Morrison, J. K. Fortin, C. T. Robbins, K. M. Proffitt, P. J. White, D. E. McWhirter, T. M. Koel, D. G. Brimeyer, W. S. Fairbanks, and M. J. Kauffman. 2013. Grizzly bear predation links the loss of native trout to the demography of migratory elk in Yellowstone. Proceedings of the Royal Society B: Biological Sciences 280:20130870.
Miller, S. D. 1990. Impact of increased bear hunting on survivorship of young bears. Wildlife Society Bulletin 18:462–467.
Mowat, G., D. C. Heard, D. R. Seip, K. G. Poole, G. Stenhouse, and D. W. Paetkau. 2005. Grizzly (Ursus arctos) and black bear (U. americanus) densities in the interior mountains of North America. Wildlife Biology 11:31–48.
Mowat, G., and C. Strobeck. 2000. Estimating population size of grizzly bears using hair capture, DNA profiling, and mark- recapture analysis. Journal of Wildlife Management 64:183–193.
Murphy, K. M., G. S. Felzien, M. G. Hornocker, and T. K. Ruth. 1998. Encounter competition between bears and cougars: some ecological implications. Ursus 10:55–60.
Murphy, S. M., J. J. Cox, B. C. Augustine, J. T. Hast, J. M. Guthrie, J. Wright, J. Mcdermott, S. C. Maehr, and J. H. Plaxico. 2016. Characterizing recolonization by a reintroduced bear population using genetic spatial capture-recapture. Journal of Wildlife Management 80:1390–1407.
Newsome, T. M., J. A. Dellinger, C. R. Pavey, W. J. Ripple, C. R. Shores, A. J. Wirsing, and C. R. Dickman. 2015. The ecological effects of providing resource subsidies to predators. Global Ecology and Biogeography 24:1–11.
Nilsen, E. B., I. Herfindal, and J. D. C. Linnell. 2005. Can intra-specific variation in carnivore home-range size be explained using remote-sensing estimates of environmental productivity? Écoscience 12:68–75.
Notaro, M., K. Emmett, and D. O’Leary. 2019. Spatio-temporal variability in remotely sensed vegetation greenness across Yellowstone National Park. Remote Sensing 11:798–828.
85
Paetkau, D. 2003. An empirical exploration of data quality in DNA-based population inventories. Molecular Ecology 12:1375–1387.
Pebesma, E. 2018. Package ‘sf’- simple feature. R package version 0.7-3. https://cran.r-project.org/web/packages/sf/index.html
Pelton, M. R. 2003. Black Bear. Pages 547–555 in G. A. Feldhamer, B. C. Thompson, and J. A. Chapman, editors. Wild Mammals of North America: Biology, Management, and Conservation, Second Edition. Johns Hopkins University Press, Baltimore, MD.
Pettorelli, N., J. Gaillard, P. Duncan, J. Ouellet, and G. Van Laere. 2001. Population density and small-scale variation in habitat quality affect phenotypic quality in roe deer. Oecologia 128:400–405.
Pledger, S. 2000. Unified maximum likelihood Estimates for closed capture-recapture models using mixtures. Biometrics 56:434–442.
R Development Core Team. 2013. R: A language and environment for statistical computing. R Foundation for Statistical Computing. Vienna, Austria.
Rayl, N. D., G. Bastille-Rousseau, J. F. Organ, M. A. Mumma, S. P. Mahoney, C. E. Soulliere, K. P. Lewis, R. D. Otto, D. L. Murray, L. P. Waits, and T. K. Fuller. 2018. Spatiotemporal heterogeneity in prey abundance and vulnerability shapes the foraging tactics of an omnivore. Journal of Animal Ecology 87:874–887.
Robbins, C. T., C. C. Schwartz, and L. A. Felicetti. 2004. Nutritional ecology of ursids: a review of newer methods and management implications. Ursus 15:161–171.
Roffler, G. H., J. N. Waite, R. W. Flynn, K. R. Larson, and D. Logan. 2016. Wolf population estimation on Prince of Wales Island, Southeast Alaska : A comparison of methods. Alaska Department of Fish and Game, Division of Wildlife Conservation, Region I. 1–74.
Royle, J. A., R. B. Chandler, R. Sollmann, and B. Gardner. 2014. Spatial Capture-Recapture. Academic Press, Waltham, MD.
Ruth, T. K., M. A. Haroldson, K. M. Murphy, P. C. Buotte, M. G. Hornocker, and H. B. Quigley. 2011. Cougar survival and source-sink structure on Greater Yellowstone’s Northern Range. Journal of Wildlife Management 75:1381–1398.
Sawaya, M. A., J. B. Stetz, A. P. Clevenger, M. L. Gibeau, and S. T. Kalinowski. 2012. Estimating grizzly and black bear population abundance and trend in Banff National Park using noninvasive genetic sampling. PLoS ONE 7:e34777.
86
Schwartz, C. C., S. L. Cain, S. Podruzny, S. Cherry, and L. Frattaroli. 2010. Contrasting activity patterns of sympatric and allopatric black and grizzly bears. Journal of Wildlife Management 74:1628–1638.
Schwartz, C. C., J. K. Fortin, J. E. Teisberg, M. A. Haroldson, C. Servheen, C. T. Robbins, and F. T. van Manen. 2014. Body and diet composition of sympatric black and grizzly bears in the Greater Yellowstone Ecosystem. Journal of Wildlife Management 78:68–78.
Schwartz, C. C., M. A. Haroldson, K. A. Gunther, and C. T. Robbins. 2013. Omnivory and the terrestrial food web, Yellowstone grizzly bear diets. Pages 109 – 124 in P.J. White, R.A. Garrott, and G. E. Plumb, editors. Yellowstone’s Wildlife in Transition. Harvard University Press, Cambridge, Massachusetts.
Singer, F. J., L. C. Mark, and R. C. Cates. 1994. Ungulate herbivory of willows on Yellowstone’s northern winter range. Journal of Range Management 47:435–443.
Stetz, J. B., K. C. Kendall, and A. C. Macleod. 2014. Black bear density in Glacier National Park , Montana. Wildlife Society Bulletin 38:60–70.
Stetz, J. B., M. S. Mitchell, and K. C. Kendall. 2019. Using spatially-explicit capture–recapture models to explain variation in seasonal density patterns of sympatric ursids. Ecography 42:237–248.
Svoboda, N. J., J. L. Belant, D. E. Beyer, J. F. Duquette, and P. E. Lederle. 2019. Carnivore space use shifts in response to seasonal resource availability. Ecosphere 10:e02817.
Tallian, A., D. W. Smith, D. R. Stahler, M. C. Metz, R. L. Wallen, C. Geremia, J. Ruprecht, C. T. Wyman, and D. R. MacNulty. 2017. Predator foraging response to a resurgent dangerous prey. Functional Ecology 31:1418–1429.
Tattoni, C., N. Bragalanti, C. Groff, and F. Rovero. 2015. Patterns in the use of rub trees by the Eurasian brown bear. Hystrix 26:118–124.
Teisberg, J. E., M. A. Haroldson, C. C. Schwartz, K. A. Gunther, J. K. Fortin, and C. T. Robbins. 2014. Contrasting past and current numbers of bears visiting Yellowstone cutthroat trout streams. Journal of Wildlife Management 78:369–378.
Teunissen van Manen, J. L., L. I. Muller, Z.-H. Li, A. M. Saxton, and M. R. Pelton. 2014. Using stable isotopes to assess dietary changes of American black bears from 1980 to 2001. Isotopes in environmental and health studies 50:382–398.
Toft, C. A. 1985. Resource partitioning in amphibians and reptiles. Copeia 1985:1–21.
87
Tredick, C. A., M. R. Vaughan, D. F. Stauffer, S. L. Simek, and T. Eason. 2007. Sub-sampling genetic data to estimate black bear population size: A case study. Ursus 18:179–188.
Tredick, C. A., and M. R. Vaughan. 2009. DNA-based population demographics of black bears in Coastal North Carolina and Virginia. Journal of Wildlife Management 73:1031–1039.
van Manen, F. T., M. A. Haroldson, and B. Karabensh. 2019. Yellowstone grizzly bear investigations: Annual report of the Interagency Grizzly Bear Study Team 2018. U.S. Geological Survey
van Manen, F. T., M. F. McCollister, J. M. Nicholson, L. M. Thompson, J. L. Kindall, and M. D. Jones. 2012. Short-term impacts of a 4-lane highway on American black bears in eastern North Carolina. Wildlife Monographs 181:1–35.
Voeten, M. M., and H. H. T. Prins. 1999. Resource partitioning between sympatric wild and domestic herbivores in the Tarangire region of Tanzania. Oecologia 120:287–294.
Welch, C. A., J. Keay, K. C. Kendall, and C. T. Robbins. 1997. Constraints on frugivory by bears. Ecology 78:1105–1119.
Welfelt, L. S., R. A. Beausoleil, and R. B. Wielgus. 2019. Factors associated with black bear density and implications for management. Journal of Wildlife Management 83:1527–1539.
Woods, J. G., D. Paetkau, C. Strobeck, D. Lewis, B. N. McLellan, and M. Proctor. 1999. Genetic tagging of free-ranging black and brown bears. Wildlife Society Bulletin 27:616–627.
Xu, C., Y. Li, J. Hu, X. Yang, S. Sheng, and M. Liu. 2012. Evaluating the difference between the normalized difference vegetation index and net primary productivity as the indicators of vegetation vigor assessment at landscape scale. Environmental Monitoring and Assessment 184:1275–1286.
88
CHAPTER FOUR
CONCLUSIONS
Animals often alter their movements and foraging strategies to account for
temporal and spatial shifts in the availability of food resources across the landscape
(McCarty et al. 2002, Armstrong et al. 2016, Deacy et al. 2017, Service et al. 2019). In
the early spring, black bears in the Northern Range of YNP prioritized forage quality
over quantity when selecting green vegetation (Chapter 2), which may allow them to
maintain body mass until food resources become more abundant (Pritchard and Robbins
1990). Later in the spring, black bears shifted foraging to patches of abundant vegetation
(Chapter 2), potentially in response to variation in the digestibility of plant species that
grow earlier or later in the season (Pritchard and Robbins 1990, Herrero 2018). Black
bears spent relatively limited time in non-forested areas where seasonally abundant and
protein-rich elk calves are available (Chapter 2). Instead, bears focused on vegetative
resources found in forested areas. Accordingly, estimates of black bear density reflected
differences among vegetation communities, with the highest density estimates in Douglas
fir and subalpine fir communities (Chapter 3).
Black bears are forest-dwelling specialists (Pelton 2003, Herrero 2018), which is
reflected by our finding that forested vegetation communities, specifically those
dominated by Douglas fir and subalpine fir, appeared to influence movement and
densities of black bears on the Northern Range (Chapters 2 and 3). These forest
communities provide good cover for black bears to avoid encounters with grizzly bears or
89
humans (Herrero 2018). Forested vegetation communities also supply bears with
abundant vegetative resources, such as grasses and sedges earlier in the spring and
masting vegetation later in the year, that help bears quickly gain fat in the late summer
and fall (Barnes and Bray 1967, Fortin 2011, Frattaroli 2011). Compared to other
portions of the GYE, Douglas fir and subalpine fir forests are more dominant on the
Northern Range (Despain 1990), which might explain the higher densities of black bears
we detected.
High densities of black bears in forest communities could have concomitant
effects on other wildlife populations. For example, cougars on the Northern Range also
prefer forested areas (Kohl et al. 2019) and black bears may be more likely to encounter
cougar kills than previously thought. Black bears may displace cougars from these food
resources and affect their kill rates. We found evidence that predation on neonate elk
calves by black bears was opportunistic (Chapter 2), but high densities of black bears
(Chapter 3) could still influence recruitment rates of elk (Bastille-Rousseau et al. 2011,
Rayl et al. 2018, Svoboda et al. 2019). Although we generated a single estimate of
density for the entire summer, the availability of food resources changes during this time,
which could contribution to variation in density of bears (Stetz et al. 2019). Therefore,
generating separate density estimates during and after the elk calving seasons would
likely provide important insights.
Our study provides evidence of foraging strategies black bears use in the spring
when food resources are limited. Previous research has focused on foraging strategies of
bears in response to calorie-rich foods during the late summer and fall, such as whitebark
90
pine seeds (Schwartz et al. 2006, 2014; Gunther et al. 2014). As whitebark pine seeds
become less abundant, grizzly bears are less likely to meet their caloric needs with this
food source, such that they may spend less time in whitebark pine stands (Bjornlie et al.
2014, Costello et al. 2014). Therefore, black bears may capitalize on this limited food
resource, as they consume fewer calories and, unlike most grizzly bears, can obtain cones
while still on the tree (Kendall 1983, Robbins et al. 2004, McLellan 2011). By furthering
our overall understanding of foraging strategies black bears use in each season, we can
better predict how they may respond to future changes in the quantity and quality of
seasonal food resources.
As park visitation increases, managers are seeking effective options that
simultaneously allow for the safety of both people and bears. Our work can be used to
guide management decisions to reduce human-bear conflicts within the Northern Range
and other portions of YNP. For example, park personnel may prioritize patrols in areas
selected by black bears during spring, such as forested sections near roads, to ensure
visitors keep sufficient distance while bears are foraging. Adding more food storage
options in backcountry campsites in Douglas fir and subalpine fir forests, where we
predicted high densities of bears, could ensure bears are not exposed to unnatural foods.
91
LITERATURE CITIED
Apps, C. D., B. N. McLellan, and J. G. Woods. 2006. Landscape partitioning and spatial inferences of competition between black and grizzly bears. Ecography 29:561–572.
Armstrong, J. B., G. Takimoto, D. E. Schindler, M. M. Hayes, and M. J. Kauffman. 2016. Resource waves: phenological diversity enhances foraging opportunities for mobile consumers. Ecology 97:1099–1112.
Barber-Meyer, S. M., L. D. Mech, and P. J. White. 2008. Elk calf survival and mortality following wolf restoration to Yellowstone National Park. Wildlife Monographs 169:1–30.
Bastille-Rousseau, G., D. Fortin, C. Dussault, R. Courtois, and J. P. Ouellet. 2011. Foraging strategies by omnivores: Are black bears actively searching for ungulate neonates or are they simply opportunistic predators? Ecography 34:588–596.
Bjornlie, D. D., F. T. van Manen, M. R. Ebinger, M. A. Haroldson, D. J. Thompson, and C. M. Costello. 2014. Whitebark pine, population density, and home-range size of grizzly bears in the Greater Yellowstone Ecosystem. PLoS ONE 9:e88160.
Costello, C. M., S. L. Cain, S. Pils, L. Frattaroli, M. A. Haroldson, and F. T. van Manen. 2016. Diet and macronutrient optimization in wild ursids: A comparison of grizzly bears with sympatric and allopatric black bears. PLoS ONE 11:e0153702.
Costello, C. M., F. T. van Manen, M. A. Haroldson, M. R. Ebinger, S. L. Cain, K. A. Gunther, and D. D. Bjornlie. 2014. Influence of whitebark pine decline on fall habitat use and movements of grizzly bears in the Greater Yellowstone Ecosystem. Ecology and Evolution 4:2004–2018.
Deacy, W. W., J. B. Armstrong, W. B. Leacock, C. T. Robbins, D. D. Gustine, E. J. Ward, J. A. Erlenbach, and J. A. Stanford. 2017. Phenological synchronization disrupts trophic interactions between Kodiak brown bears and salmon. Proceedings of the National Academy of Sciences 114:201705248.
Despain, D. G. 1990. Yellowstone vegetation: consequnces of environment and history in a natural setting. Roberts Rinehart Publishers, Boulder, Colorado, USA.
Duquette, J. F., J. L. Belant, C. M. Wilton, N. Fowler, B. W. Waller, D. E. Beyer, N. J. Svoboda, S. L. Simek, and J. Beringer. 2017. Black bear (Ursus americanus) functional resource selection relative to intraspecific competition and human risk. Canadian Journal of Zoology 95:203–212.
Fortin, J. K. 2011. Niche separation of grizzly (Ursus arctos) and American black bears (Ursus americanus) in Yellowstone National Park. Dissertation, Washington State University.
92
Frattaroli, L. M. 2011. Black bear (Ursus americanus) ecology in southern Grand Teton National Park. Thesis, Montana State University.
Gantchoff, M. G., D. Beyer, and J. L. Belant. 2019. Reproductive class influences risk tolerance during denning and spring for American black bears (Ursus americanus). Ecosphere 10:1–12.
Gunther, K. A., R. R. Shoemaker, K. L. Frey, M. A. Haroldson, S. L. Cain, F. T. van Manen, and J. K. Fortin. 2014. Dietary breadth of grizzly bears in the Greater Yellowstone Ecosystem. Ursus 25:60–72.
Gunther, K. A., K. R. Wilmot, S. L. Cain, T. Wyman, E. G. Reinertson, and A.M. Bramblett. 2018. Managing human-habituated bears to enhance survival, habitat effectiveness, and public viewing. Human-Wildlife Interactions 12:373–386.
Herrero, S. 2018. Bear attacks: their causes and avoidance. Third edition. Rowman and Littlefield, Lanaham, MD.
Kasworm, W. F., and T. L. Manley. 1990. Road and trail influences on grizzly bears and black bears in Northwest Montana. International Conference on Bear Research and Management 8:79–84.
Kendall, K. C. 1983. Use of Pine Nuts by Grizzly and Black Bears in the Yellowstone. International Conference on Bear Research and Management 5:166–173.
Loosen, A. E., A. T. Morehouse, and M. S. Boyce. 2019. Land tenure shapes black bear density and abundance on a multi-use landscape. Ecology and Evolution 9:73–90.
Mattson, D. J., R. R. Knight, and B. M. Blanchard. 1987. The effects of developments and primary roads on grizzly bear habitat use in Yellowstone National Park, Wyoming. International Conference of Bear Research and Management 7:259–273.
McLellan, B. N. 2011. Implications of a high-energy and low-protein diet on the body composition, fitness, and competitive abilities of black (Ursus americanus) and grizzly (Ursus arctos) bears. Canadian Journal of Zoology 89:546–558.
Pelton, M. R. 2003. Black Bear. Pages 547–555 in G. A. Feldhamer, B. C. Thompson, and J. A. Chapman, editors. Wild Mammals of North America: Biology, Management, and Conservation. Second Edi. Johns Hopkins University Press, Baltimore, MD.
Pritchard, G. T., and C. T. Robbins. 1990. Digestive and metabolic efficiencies of grizzly and black bears. Canadian Journal of Zoology 68:1645–1651.
93
Rayl, N. D., G. Bastille-Rousseau, J. F. Organ, M. A. Mumma, S. P. Mahoney, C. E. Soulliere, K. P. Lewis, R. D. Otto, D. L. Murray, L. P. Waits, and T. K. Fuller. 2018. Spatiotemporal heterogeneity in prey abundance and vulnerability shapes the foraging tactics of an omnivore. Journal of Animal Ecology 87:874–887.
Robbins, C. T., C. C. Schwartz, and L. A. Felicetti. 2004. Nutritional ecology of ursids: a review of newer methods and management implications. Ursus 15:161–171.
Sawaya, M. A., J. B. Stetz, A. P. Clevenger, M. L. Gibeau, and S. T. Kalinowski. 2012. Estimating grizzly and black bear population abundance and trend in Banff National Park using noninvasive genetic sampling. PLoS ONE 7:e34777.
Schwartz, C. C., J. K. Fortin, J. E. Teisberg, M. A. Haroldson, C. Servheen, C. T. Robbins, and F. T. van Manen. 2014. Body and diet composition of sympatric black and grizzly bears in the Greater Yellowstone Ecosystem. The Journal of Wildlife Management 78:68–78.
Schwartz, C. C., M. A. Haroldson, G. C. White, R. B. Harris, S. Cherry, K. A. Keating, D. S. . Moody, and C. Servheen. 2006. Temporal, spatial, and environmental influences on the demographics of grizzly bears in the Greater Yellowstone Ecosystem. Wildlife Monographs 161:1–68.
McCarty, J. P., D. J. Levey, C. H. Greenberg, and S. Sargent. 2002. Spatial and temporal variation in fruit use by wildlife in a forested landscape. Forest Ecology and Management 164:277–291.
Stetz, J. B., M. S. Mitchell, and K. C. Kendall. 2019. Using spatially-explicit capture–recapture models to explain variation in seasonal density patterns of sympatric ursids. Ecography 42:237–248.
Svoboda, N. J., J. L. Belant, D. E. Beyer, J. F. Duquette, and P. E. Lederle. 2019. Carnivore space use shifts in response to seasonal resource availability. Ecosphere 10:e02817.
van Manen, F. T., M. F. McCollister, J. M. Nicholson, L. M. Thompson, J. L. Kindall, and M. D. Jones. 2012. Short-term impacts of a 4-lane highway on American black bears in eastern North Carolina. Wildlife Monographs 181:1–35.
Welfelt, L. S., R. A. Beausoleil, and R. B. Wielgus. 2019. Factors associated with black bear density and implications for management. Journal of Wildlife Management 83:1527–1539.

94
REFERENCES CITED
95
Aikens, E. O., M. J. Kauffman, J. A. Merkle, S. P. H. Dwinnell, G. L. Fralick, and K. L. Monteith. 2017. The greenscape shapes surfing of resource waves in a large migratory herbivore. Ecology Letters 20:741–750.
Apps, C. D., B. N. McLellan, and J. G. Woods. 2006. Landscape partitioning and spatial inferences of competition between black and grizzly bears. Ecography 29:561–572.
Armstrong, J. B., G. Takimoto, D. E. Schindler, M. M. Hayes, and M. J. Kauffman. 2016. Resource waves: phenological diversity enhances foraging opportunities for mobile consumers. Ecology 97:1099–1112.
Arnold, T. W. 2010. Uninformative parameters and model selection using Akaike’ s Information Criterion. Journal of Wildlife Management 74:1175–1178.
Aune, K. E. 1994. Comparative ecology of black and grizzly bears on the Rocky Mountain Front, Montana. International Conference of Bear Research and Management 9:365–374.
Azad, S., K. McFadden, J. D. Clark, T. Wactor, and D. S. Jachowski. 2019. Applying spatially explicit capture-recapture models to estimate black bear density in South Carolina. Wildlife Society Bulletin 43:500–507.
Baker, A. D., and P. L. Leberg. 2018. Impacts of human recreation on carnivores in protected areas. PLoS ONE 13:e0195436.
Ballard, W. B., H. A. Whitlaw, S. J. Young, R. A. Jenkins, and G. J. Forbes. 1999. Predation and survival of white-tailed deer fawns in northcentral New Brunswick. Journal of Wildlife Management 63:574–579.
Barber-Meyer, S. M., L. D. Mech, and P. J. White. 2008. Elk calf survival and mortality following wolf restoration to Yellowstone National Park. Wildlife Monographs 169:1–30.
Barnes, V. G., and O. E. Bray. 1967. Population characteristics and activities of black bears in YNP. Final report. Colorado State University, Boulder, CO.
Bastille-Rousseau, G., D. Fortin, C. Dussault, R. Courtois, and J. P. Ouellet. 2011. Foraging strategies by omnivores: Are black bears actively searching for ungulate neonates or are they simply opportunistic predators? Ecography 34:588–596.
Beckmann, J. P., and J. Berger. 2003. Using black bears to test ideal-free distribution models experimentally. Journal of Mammalogy 84:594–606.
Beckmann, J. P., and C. W. Lackey. 2008. Carnivores, urban landscapes, and longitudinal studies: a case history of black bears. Human–Wildlife Conflicts 2:168–174.
96
Belant, J. L., B. Griffith, Y. Zhang, E. H. Follmann, and L. G. Adams. 2010. Population-level resource selection by sympatric brown and American black bears in Alaska. Polar Biology 33:31–40.
Bischof, R., L. E. Loe, E. L. Meisingset, B. Zimmermann, B. Van Moorter, and A. Mysterud. 2012. A migratory northern ungulate in the pursuit of spring: Jumping or surfing the green wave? The American Naturalist 180:407–424.
Bjornlie, D. D., F. T. van Manen, M. R. Ebinger, M. A. Haroldson, D. J. Thompson, and C. M. Costello. 2014. Whitebark pine, population density, and home-range size of grizzly bears in the Greater Yellowstone Ecosystem. PLoS ONE 9:e88160.
Bojarska, K., and N. Selva. 2012. Spatial patterns in brown bear c diet: The role of geographical and environmental factors. Mammal Review 42:120–143.
Boulanger, J., M. Proctor, S. Himmer, G. Stenhouse, D. Paetkau, and J. Cranston. 2006. An empirical test of DNA mark–recapture sampling strategies for grizzly bears. Ursus 17:149–158.
Boyce, M. S. 2018. Wolves for Yellowstone: dynamics in time and space. Journal of Mammalogy 99:1021–1031.
Brown, J. H., D. W. Mehlman, and G. C. Stevens. 1995. Spatial variation in abundance. Ecology 76:2028–2043.
Bunnell, F. L., and D. E. N. Tait. 1980. Bears in models and in reality: Implications to management. International Conference of Bear Research and Management 4:15–23.
Burnham, K. P., and D. R. Anderson. 2004. Multimodel inference: Understanding AIC and BIC in model selection. Sociological Methods & Research 33:261–304.
Burst, T. L., and M. R. Pelton. 1983. Black bear mark trees in the Smoky Mountains. International Conference of Bear Research and Management 5:45–53.
Cole, G. F. 1976. Management involving grizzly and black bears in Yellowstone National Park, 1970-1975. U.S. Department of the Interior, National Park Service, Natural Resources Report 9:1–26.
Coleman, T. H., C. C. Schwartz, K. A. Gunther, and S. Creel. 2013. Grizzly bear and human interaction in Yellowstone National Park: An evaluation of bear management areas. Journal of Wildlife Management 77:1311–1320.
Coogan, S. C. P., D. Raubenheimer, G. B. Stenhouse, and S. E. Nielsen. 2014. Macronutrient optimization and seasonal diet mixing in a large omnivore, the grizzly bear: A geometric analysis. PLoS ONE 9:e97968.
97
Costello, C. M., S. L. Cain, S. Pils, L. Frattaroli, M. A. Haroldson, and F. T. van Manen. 2016. Diet and macronutrient optimization in wild ursids: A comparison of grizzly bears with sympatric and allopatric black bears. PLoS ONE 11:e0153702.
Costello, C. M., F. T. van Manen, M. A. Haroldson, M. R. Ebinger, S. L. Cain, K. A. Gunther, and D. D. Bjornlie. 2014. Influence of whitebark pine decline on fall habitat use and movements of grizzly bears in the Greater Yellowstone Ecosystem. Ecology and Evolution 4:2004–2018.
Costello, C. M., and R. W. Sage. 1994. Predicting black bear habitat selection from food abundance under 3 forest management systems. International Conference of Bear Research and Management 9:375–387.
Davis, H., R. D. Weir, A. N. Hamilton, and J. A. Deal. 2006. Influence of phenology on site selection by female American black bears in coastal British Columbia. Ursus 17:41–51.
Deacy, W., W. Leacock, J. B. Armstrong, and J. A. Stanford. 2016. Kodiak brown bears surf the salmon red wave: Direct evidence from GPS collared individuals. Ecology 97:1091–1098.
Deacy, W. W., J. B. Armstrong, W. B. Leacock, C. T. Robbins, D. D. Gustine, E. J. Ward, J. A. Erlenbach, and J. A. Stanford. 2017. Phenological synchronization disrupts trophic interactions between Kodiak brown bears and salmon. Proceedings of the National Academy of Sciences 114:201705248.
Deacy, W. W., W. B. Leacock, J. A. Stanford, and J. B. Armstrong. 2019. Variation in spawning phenology within salmon populations influences landscape-level patterns of brown bear activity. Ecosphere 10:e02575.
Delibes, M., P. Gaona, and P. Ferreras. 2001. Effects of an attractive sink leading into maladaptive habitat selection. American Naturalist 158:277–285.
Denny, C. K., G. B. Stenhouse, and S. E. Nielsen. 2018. Scales of selection and perception: landscape heterogeneity of an important food resource influences habitat use by a large omnivore. Wildlife Biology 2018:1–10.
Despain, D. G. 1990. Yellowstone vegetation: consequnces of environment and history in a natural setting. Roberts Rinehart Publishers, Boulder, Colorado, USA.
Diamond, S. J., R. H. Giles, and R. L. Kirkpatrick. 2000. Hard mast production before and after chestnut blight. Southern Journal of Applied Forestry 24:196–201.
Dou, H., H. Yang, J. L. D. Smith, L. Feng, T. Wang, and J. Ge. 2019. Prey selection of Amur tigers in relation to the spatiotemporal overlap with prey across the Sino-Russian border. Wildlife Biology 1:1–11.
98
Drewry, J. M., F. T. van Manen, and D. M. Ruth. 2013. Density and genetic structure of black bears in coastal South Carolina. Journal of Wildlife Management 77:153–164.
Duquette, J. F., J. L. Belant, N. J. Svoboda, D. E. Beyer, and P. E. Lederle. 2014. Effects of maternal nutrition, resource use and multi-predator risk on neonatal white-tailed deer survival. PLoS ONE 9:e100841.
Duquette, J. F., J. L. Belant, C. M. Wilton, N. Fowler, B. W. Waller, D. E. Beyer, N. J. Svoboda, S. L. Simek, and J. Beringer. 2017. Black bear (Ursus americanus) functional resource selection relative to intraspecific competition and human risk. Canadian Journal of Zoology 95:203–212.
Efford, M. 2019. Package ‘secr’ - spatially explicit capture - recapture models in R. version 3.2.1. https://cran.r-project.org/web/packages/secr/index.html
Efford, M. G., D. L. Borchers, and A. E. Byrom. 2009. Density estimation by spatially explicit capture-recapture: likelihood-based methods. Pages 255–269 in D. L. Thomson, E. G. Cooch, and M. J. Conroy, editors. Modeling demographic processes in marked populations. Springer, Boston, MA.
Erlenbach, J. A., K. D. Rode, D. Raubenheimer, and C. T. Robbins. 2014. Macronutrient optimization and energy maximization determine diets of brown bears. Journal of Mammalogy 95:160–168.
Forester, J. D., H. K. Im, and P. J. Rathouz. 2009. Accounting for animal movement in estimation of resource selection functions: Sampling and data analysis. Ecology 90:3554–3565.
Fortin, D., H. L. Beyer, M. S. Boyce, D. W. Smith, T. Duchesne, and J. S. Mao. 2005. Wolves influence elk movements: Behavior shapes a trophic cascade in Yellowstone National Park. Ecology 86:1320–1330.
Fortin, J. K. 2011. Niche separation of grizzly (Ursus arctos) and American black bears (Ursus americanus) in Yellowstone National Park. Dissertation, Washington State University.
Fortin, J. K., C. C. Schwartz, K. A. Gunther, J. E. Teisberg, M. A. Haroldson, M. A. Evans, and C. T. Robbins. 2013a. Dietary adjustability of grizzly bears and American black bears in Yellowstone National Park. The Journal of Wildlife Management 77:270–281.
Fortin, J. K., J. V Ware, H. T. Jansen, C. C. Schwartz, and T. Charles. 2013b. Temporal niche switching by grizzly bears but not American black bears in Yellowstone National Park. Journal of Mammalogy 94:833–844.
99
Frank, D. A., and S. J. McNaughton. 1992. The ecology of plants, large mammalian herbivores, and drought in Yellowstone National Park. Ecology 73:2043–2058.
Frank, D. A., R. L. Wallen, and P. J. White. 2016. Ungulate control of grassland production: grazing intensity and ungulate species composition in Yellowstone Park. Ecosphere 7:e01603.
Frary, V. J., J. Duchamp, D. S. Maehr, and J. L. Larkin. 2011. Density and distribution of a colonizing front of the American black bear Ursus americanus. Wildlife Biology 17:404–416.
Frattaroli, L. M. 2011. Black bear (Ursus americanus) ecology in southern Grand Teton National Park. Thesis, Montana State University.
Gaillard, J., M. Hebblewhite, A. Loison, M. Fuller, R. Powell, M. Basille, and B. Van Moorter. 2010. Habitat – performance relationships: finding the right metric at a given spatial scale. Philosophical Transctions of the Royal Society B: Biological Science 365:2255–2265.
Gantchoff, M. G., D. Beyer, and J. L. Belant. 2019. Reproductive class influences risk tolerance during denning and spring for American black bears (Ursus americanus). Ecosphere 10:1–12.
Garrison, E. P., J. W. McCown, and M. K. Oli. 2007. Reproductive ecology and cub survival of Florida black bears. Journal of Wildlife Management 71:720–727.
Gaston, K. J., T. M. Blackburn, and J. H. Lawton. 1997. Interspecific abundance-range size relationships: An appraisal of mechanisms. The Journal of Animal Ecology 66:579-601.
Gelman, A. 2008. Sample size determination for logistic regression revisited. Statistics in medicine 27:2865–2873.
Goad, E. H., L. Pejchar, S. E. Reed, and R. L. Knight. 2014. Habitat use by mammals varies along an exurban development gradient in northern Colorado. Biological Conservation 176:172–182.
Gould, M. J., J. W. Cain, G. W. Roemer, W. R. Gould, and S. G. Liley. 2018. Density of American black bears in New Mexico. Journal of Wildlife Management 82:775–788.
Graham, K., J. Boulanger, J. Duval, and G. Stenhouse. 2010. Spatial and temporal use of roads by grizzly bears in west-central Alberta. Ursus 21:43–56.
Graves, T. A., K. C. Kendall, J. A. Royle, J. B. Stetz, and A. C. Macleod. 2011. Linking landscape characteristics to local grizzly bear abundance using multiple detection methods in a hierarchical model. Animal Conservation 14:652–664.
100
Greene, C. M., and J. A. Stamps. 2001. Habitat selection at low population densities. Ecology 82:2091–2100.
Griffin, K. A., M. Hebblewhite, H. S. Robinson, P. Zager, S. M. Barber-Meyer, D. Christianson, S. Creel, N. C. Harris, M. A. Hurley, D. H. Jackson, B. K. Johnson, W. L. Myers, J. D. Raithel, M. Schlegel, B. L. Smith, C. White, and P. J. White. 2011. Neonatal mortality of elk driven by climate, predator phenology and predator community composition. Journal of Animal Ecology 80:1246–1257.
Grogan, R. G., and F. G. Lindzey. 1999. Estimating population size of a low-density black bear population using capture-resight. International Conference on Bear Research and Management 11:117–122.
Gunther, K. A., F. T. van Manen, C. Servheen, and S. Haas. 2015. Grizzly bear recovery in the Greater Yellowstone Ecosystem: Food habits, demographic changes and a bear bathtub. Safety in bear country. Yellowstone Science 23:1–100.
Gunther, K. A., R. R. Shoemaker, K. L. Frey, M. A. Haroldson, S. L. Cain, F. T. van Manen, and J. K. Fortin. 2014. Dietary breadth of grizzly bears in the Greater Yellowstone Ecosystem. Ursus 25:60–72.
Gunther, K. A. M. J. Biel, N. Anderson, and L. Waits. 2002. Probable grizzly bear predation on an American black bear in Yellowstone National Park. Ursus 13 372 – 374.
Gunther, K. A., K. R. Wilmot, S. L. Cain, T. Wyman, E. G. Reinertson, and A. M. Bramblett. 2018. Managing human-habituated bears to enhance survival, habitat effectiveness, and public viewing. Human-Wildlife Interactions 12:373–386.
Gunther, K. A., and T. Wyman. 2008. Human habituated bears: The next challenge in bear management in Yellowstone National Park. Yellowstone Science 16:35–41.
Haroldson, M. A., K. A. Gunther, D. P. Reinhart, S. R. Podruzny, C. Cegelski, L. Waits, T. Wyman, and J. Smith. 2005. Changing number of spawning cutthroat trout in tributary streams of Yellowstone Lake and estimates of grizzly bears visiting streams from DNA. Ursus 16:167–180.
Harris, R. B., C. C. Schwartz, R. D. Mace, and M. A. Haroldson. 2011. Study design and sampling intensity for demographic analyses of bear populations. Ursus 22:24–36.
Hebblewhite, M., M. Percy, and R. Serrouya. 2002. Black bear (Ursus americanus) survival and demography in the Bow Valley of Banff National Park , Alberta. Biological Conservation 112: 415-425.
101
Hebblewhite, M., E. Merrill, and G. McDermid. 2008. A Multi-Scale Test of the Forage Maturation Hypothesis in a Partially Migratory Ungulate Population. Ecological Monographs 78:141–166.
Hellgren, E. C., D. W. Carney, N. P. Garner, and M. R. Vaughan. 1988. Use of breakaway cotton spacers on radio collars. Wildlife Society Bulletin 16:216–218.
Herrero, S. 2018. Bear attacks: their causes and avoidance. Third edition. Rowman and Littlefield, Lanaham, MD.
Hijmans, R. J., J. van Etten, J. Cheng, M. Mattiuzzi, M. Sumner, J. A. Greenberg, O. P. Lamigueiro, A. Bevan, E. B. Racine, and A. Shortridge. 2015. Package ‘raster’. R package version 3.1-5. https://cran.r-project.org/web/packages/raster/index.html
Hodge, S. J., M. B. V Bell, and M. A. Cant. 2010. Reproductive competition and the evolution of extreme birth synchrony in a cooperative mammal. Biology Letters 7:54–56
Holm, G. W., F. G. Lindzey, and D. S. Moody. 1999. Interactions of sympatric black and grizzly bears in northwest Wyoming. Ursus 11:99–108.
Hooker, M. J., J. S. Laufenberg, A. K. Ashley, J. T. Sylvest, and M. J. Chamberlain. 2015. Abundance and density estimation of the American black bear population in central Georgia. Ursus 26:107–115.
Houston, D. B. 1982. The northern Yellowstone elk. Macmillan Publishing Company, New York, New York, USA.
Howell, A. B. 1921. The black bear as a destroyer of game. Journal of Mammalogy 2:36.
Humm, J. M., J. W. McCown, B. K. Scheick, and J. D. Clark. 2017. Spatially explicit population estimates for black bears based on cluster sampling. The Journal of Wildlife Management 81:1187–1201.
Inman, R. M., and M. R. Pelton. 2002. Energetic production by soft and hard mast foods of American black bears in the Smoky Mountains. Ursus 13:57–68.
Ives, A. R., and E. D. Klopper. 1997. Spatial variation in abundance created by stochastic temporal variation. Ecology 78:1907–1913.
Jacoby, M. E., G. V Hilderbrand, C. Servheen, C. C. Schwartz, S. M. Arthur, T. A. Hanley, C. T. Robbins, and R. Michener. 1999. Trophic relations of brown and black bears in several western North American ecosystems. The Journal of Wildlife Management 63:921–929.
102
Johnson, H. E., S. W. Breck, S. Baruch-mordo, D. L. Lewis, C. W. Lackey, K. R. Wilson, J. Broderick, J. S. Mao, and J. P. Beckmann. 2015. Shifting perceptions of risk and reward: Dynamic selection for human development by black bears in the western United States. Biological Conservation 187:164–172.
Kasworm, W. F., and T. L. Manley. 1990. Road and trail influences on grizzly bears and black bears in Northwest Montana. International Conference on Bear Research and Management 8:79–84.
Kendall, K. C., A. C. Macleod, K. L. Boyd, J. Boulanger, J. A. Royle, W. F. Kasworm, D. Paetkau, M. F. Proctor, K. Annis, and T. A. Graves. 2015. Density, distribution, and genetic structure of grizzly bears in the Cabinet-Yaak ecosystem. The Journal of Wildlife Management 80:314–331.
Kendall, K. C., J. B. Stetz, J. Boulanger, A. C. Macleod, D. Paetkau, and G. C. White. 2009. Demography and genetic structure of a recovering grizzly bear population. Journal of Wildlife Management 73:3–17.
Kendall, K. C., J. B. Stetz, D. A. Roon, L. P. Waits, J. B. Boulanger, and D. Paetkau. 2008. Grizzly bear density in Glacier National Park, Montana. Journal of Wildlife Management 72:1693–1705.
Kendall, K. C. 1983. Use of Pine Nuts by Grizzly and Black Bears in the Yellowstone. International Confrence on Bear Research and Management 5:166–173.
Kindermann, R., and D. Bjornlie. 2019. Black bear population monitoring in the Greys River, Wyoming using clustered hair snares corrals and spatially explicit capture-recapture models. Large Carnivore Section, Wyoming Game and Fish Department
Klinka, D. R., and T. E. Reimchen. 2009. Darkness, twilight, and daylight foraging success of bears (Ursus americanus) on salmon in coastal British Columbia. Journal of Mammalogy 90:144–149.
Kohl, M. T., T. K. Ruth, M. C. Metz, D. R. Stahler, D. W. Smith, P. J. White, and D. R. MacNulty. 2019. Do prey select for vacant hunting domains to minimize a multi-predator threat? Ecology Letters 20:1724–1733.
Lamb, C. T., D. A. Walsh, and G. Mowat. 2016. Factors influencing detection of grizzly bears at genetic sampling sites. Ursus 27:31–44.
Lariviere, B. S. 2001. Ursus americanus. Mammalian Species 647:1–11.
Laske, T. G., H. J. Harlow, D. L. Garshelis, and P. A. Iaizzo. 2010. Extreme respiratory sinus arrhythmia enables overwintering black bear survival — Physiological insights and applications to human medicine. Journal of Cardiovascular Translational Research 3:559–569.
103
Loosen, A. E., A. T. Morehouse, and M. S. Boyce. 2019. Land tenure shapes black bear density and abundance on a multi-use landscape. Ecology and Evolution 9:73–90.
Mace, R. D., and T. Chilton-Radandt. 2011. Black bear harvest, research, and management in Montana. 2011 Final report. Montana Department of Fish, Wildlife and Parks, Wildlife Division, Helena, Montana
MacNulty, D. R., D. R. Stahler, C. T. Wyman, J. Ruprecht, and D. W. Smith. 2016. The challenge of understanding northern Yellowstone elk dynamics after wolf reintroduction. Yellowstone Science 24:25–33.
Malcolm, K. D., and T. R. Van Deelen. 2010. Effects of habitat and hunting framework on American black bear harvest structure in Wisconsin. Ursus 21:14–22.
Manly, B. F. J., L. L. McDonald, D. L. Thomas, T. L. McDonald, and W. P. Erickson. 2007. Resource selection by animals: Statistical design and analysis for field studies. Second edition. Kluwer Academic Publisher, New York.
Mattson, D. J., S. Herrero, and T. Merrill. 2005. Are black bears a factor in the restoration of North American grizzly bear populations? Ursus 16:11–30.
Mattson, D. J., R. R. Knight, and B. M. Blanchard. 1987. The effects of developments and primary roads on grizzly bear habitat use in Yellowstone National Park, Wyoming. International Conference of Bear Research and Management 7:259–273.
Mazur, R., A. P. Klimley, and K. Folger. 2013. Implications of the variable availability of seasonal foods on the home ranges of black bears, Ursus americanus, in the Sierra Nevada of California. Animal Biotelemetry 1:1–16.
McCarty, J. P., D. J. Levey, C. H. Greenberg, and S. Sargent. 2002. Spatial and temporal variation in fruit use by wildlife in a forested landscape. Forest Ecology and Management 164:277–291.
McLellan, B. N. 2011. Implications of a high-energy and low-protein diet on the body composition, fitness, and competitive abilities of black (Ursus americanus) and grizzly (Ursus arctos) bears. Canadian Journal of Zoology 89:546–558.
Mech, L. D., and S. Barber-Meyer. 2015. Yellowstone wolf (Canis lupus) density predicted by elk (Cervus elaphus) biomass. Canadian Journal of Zoology 502:499–502.
Merkle, J. A., K. L. Monteith, E. O. Aikens, M. M. Hayes, K. R. Hersey, A. D. Middleton, B. A. Oates, H. Sawyer, B. M. Scurlock, and M. J. Kauffman. 2016. Large herbivores surf waves of green-up in spring. Proceedings of the Royal Society B: Biological Sciences 283:20160456.
104
Metz, M. C., D. W. Smith, J. A. Vucetich, D. R. Stahler, and R. O. Peterson. 2012. Seasonal patterns of predation for gray wolves in the multi-prey system of Yellowstone National Park. Journal of Animal Ecology 81:553–563.
Middleton, A. D., J. A. Merkle, D. E. McWhirter, J. G. Cook, R. C. Cook, P. J. White, and M. J. Kauffman. 2018. Green-wave surfing increases fat gain in a migratory ungulate. Oikos 127:1060–1068.
Middleton, A. D., T. A. Morrison, J. K. Fortin, C. T. Robbins, K. M. Proffitt, P. J. White, D. E. McWhirter, T. M. Koel, D. G. Brimeyer, W. S. Fairbanks, and M. J. Kauffman. 2013. Grizzly bear predation links the loss of native trout to the demography of migratory elk in Yellowstone. Proceedings of the Royal Society B: Biological Sciences 280:20130870.
Miller, S. D. 1990. Impact of increased bear hunting on survivorship of young bears. Wildlife Society Bulletin 18:462–467.
Mosley, B. J. C., and J. G. Mundinger. 2018. History and status of wild ungulate populations on the Northern Yellowstone Range. Rangelands 40:189–201.
Mowat, G., D. C. Heard, D. R. Seip, K. G. Poole, G. Stenhouse, and D. W. Paetkau. 2005. Grizzly (Ursus arctos) and black bear (U. americanus) densities in the interior mountains of North America. Wildlife Biology 11:31–48.
Mowat, G., and C. Strobeck. 2000. Estimating population size of grizzly bears using hair capture, DNA profiling, and mark- recapture analysis. Journal of Wildlife Management 64:183–193.
Moyer, M. A., J. W. McCown, and M. K. Oli. 2007. Factors influencing home-range size of female Florida black bears. Journal of Mammalogy 88:468–476.
Murphy, K. M., G. S. Felzien, M. G. Hornocker, and T. K. Ruth. 1998. Encounter competition between bears and cougars: some ecological implications. Ursus 10:55–60.
Murphy, S. M., J. J. Cox, B. C. Augustine, J. T. Hast, J. M. Guthrie, J. Wright, J. Mcdermott, S. C. Maehr, and J. H. Plaxico. 2016. Characterizing recolonization by a reintroduced bear population using genetic spatial capture-recapture. Journal of Wildlife Management 80:1390–1407.
Mysterud, A., B. K. Vike, E. L. Meisingset, and I. M. Rivrud. 2017. The role of landscape characteristics for forage maturation and nutritional benefits of migration in red deer. Ecology and Evolution 7:4448–4455.
105
Newsome, T. M., J. A. Dellinger, C. R. Pavey, W. J. Ripple, C. R. Shores, A. J. Wirsing, and C. R. Dickman. 2015. The ecological effects of providing resource subsidies to predators. Global Ecology and Biogeography 24:1–11.
Nicholson, K. L., M. J. Warren, C. Rostan, J. Månsson, T. F. Paragi, and H. Sand. 2019. Using fine-scale movement patterns to infer ungulate parturition. Ecological Indicators 101:22–30.
Nilsen, E. B., I. Herfindal, and J. D. C. Linnell. 2005. Can intra-specific variation in carnivore home-range size be explained using remote-sensing estimates of environmental productivity? Ecoscience 12:68–75.
Northrup, J. M., M. B. Hooten, C. R. J. Anderson, and G. Wittemyer. 2013. Practical guidance on characterizing availability in resource selection functions under a use–availability design. Ecological Society of America 94:1456–1463.
Northrup, J. M., J. Pitt, T. B. Muhly, G. B. Stenhouse, M. Musiani, and M. S. Boyce. 2012. Vehicle traffic shapes grizzly bear behavior on a multiple-use landscape. Journal of Applied Ecology 49:1159–1167.
Notaro, M., K. Emmett, and D. O’Leary. 2019. Spatio-temporal variability in remotely sensed vegetation greenness across Yellowstone National Park. Remote Sensing 11:798–828.
Noyce, K. V., and D. L. Garshelis. 1998. Spring weight changes in black bears in northcentral Minnesota: The negative foraging period revisited. Ursus 10:521–531.
Paetkau, D. 2003. An empirical exploration of data quality in DNA-based population inventories. Molecular Ecology 12:1375–1387.
Pebesma, E. 2018. Package ‘sf’- simple feature. R package version 0.7-3. https://cran.r-project.org/web/packages/sf/index.html
Peck, C. P., F. T. van Manen, C. M. Costello, M. A. Haroldson, L. A. Landenburger, L. L. Roberts, D. D. Bjornlie, and R. D. Mace. 2017. Potential paths for male-mediated gene flow to and from an isolated grizzly bear population. Ecosphere 8:e01969.
Pelton, M. R. 2003. Black Bear. Pages 547–555 in G. A. Feldhamer, B. C. Thompson, and J. A. Chapman, editors. Wild Mammals of North America: Biology, Management, and Conservation. Second Edition. Johns Hopkins University Press, Baltimore, MD.
Pelletier, F. 2006. Effects of tourist activities on ungulate behaviour in a mountain protected area. Journal of Mountain Ecology 8:15–19.
106
Pettorelli, N., J. Gaillard, P. Duncan, J. Ouellet, and G. Van Laere. 2001. Population density and small-scale variation in habitat quality affect phenotypic quality in roe deer. Oecologia 128:400–405.
Pettorelli, N., J. O. Vik, A. Mysterud, J. Gaillard, C. J. Tucker, N. C. Stenseth, and C. B. Lyon. 2005. Using the satellite-derived NDVI to assess ecological responses to environmental change. Ecology and Evolution 20:503–510.
Pledger, S. 2000. Unified maximum likelihood Estimates for closed capture-recapture models using mixtures. Biometrics 56:434–442.
Pritchard, G. T., and C. T. Robbins. 1990. Digestive and metabolic efficiencies of grizzly and black bears. Canadian Journal of Zoology 68:1645–1651.
R Development Core Team. 2013. R: A language and environment for statistical computing. R Foundation for Statistical Computing. Vienna, Austria.
Rayl, N. D., G. Bastille-Rousseau, J. F. Organ, M. A. Mumma, S. P. Mahoney, C. E. Soulliere, K. P. Lewis, R. D. Otto, D. L. Murray, L. P. Waits, and T. K. Fuller. 2018. Spatiotemporal heterogeneity in prey abundance and vulnerability shapes the foraging tactics of an omnivore. Journal of Animal Ecology 87:874–887.
Robbins, C. T., J. K. Fortin, K. D. Rode, S. D. Farley, L. A. Shipley, and L. A. Felicetti. 2007. Optimizing protein intake as a foraging strategy to maximize mass gain in an omnivore. Oikos 116:1675–1682.
Robbins, C. T., C. C. Schwartz, and L. A. Felicetti. 2004. Nutritional ecology of ursids: a review of newer methods and management implications. Ursus 15:161–171.
Rode, K. D., C. T. Robbins, and L. A. Shipley. 2001. Constraints on herbivory by grizzly bears. Oecologia 128:62–71.
Roever, C. L., M. S. Boyce, and G. B. Stenhouse. 2010. Grizzly bear movements relative to roads: Application of step selection functions. Ecography 33:1113–1122.
Roffler, G. H., J. N. Waite, R. W. Flynn, K. R. Larson, and D. Logan. 2016. Wolf population estimation on Prince of Wales Island, Southeast Alaska : A comparison of methods. Alaska Department of Fish and Game, Division of Wildlife Conservation, Region I. 1–74.
Royle, J. A., R. B. Chandler, R. Sollmann, and B. Gardner. 2014. Spatial Capture-Recapture. Academic Press, Waltham, MD.
Ruth, T. K., M. A. Haroldson, K. M. Murphy, P. C. Buotte, M. G. Hornocker, and H. B. Quigley. 2011. Cougar survival and source-sink structure on Greater Yellowstone’s Northern Range. Journal of Wildlife Management 75:1381–1398.
107
Rush, W. M. 1932. Northern Yellowstone elk study. Montana Fish and Game Commission, Helena, Montana, USA.
Ryan, C. W., J. C. Pack, W. K. Igo, J. C. Rieffenberger, and A. B. Billings. 2004. Relationship of mast production to big-game harvests in West Virginia. Wildlife Society Bulletin 32:786–794.
Sawaya, M. A., J. B. Stetz, A. P. Clevenger, M. L. Gibeau, and S. T. Kalinowski. 2012. Estimating grizzly and black bear population abundance and trend in Banff National Park using noninvasive genetic sampling. PLoS ONE 7:e34777.
Schwartz, C. C., S. L. Cain, S. Podruzny, S. Cherry, and L. Frattaroli. 2010. Contrasting activity patterns of sympatric and allopatric black and grizzly bears. Journal of Wildlife Management 74:1628–1638.
Schwartz, C. C., J. K. Fortin, J. E. Teisberg, M. A. Haroldson, C. Servheen, C. T. Robbins, and F. T. van Manen. 2014. Body and diet composition of sympatric black and grizzly bears in the Greater Yellowstone Ecosystem. Journal of Wildlife Management 78:68–78.
Schwartz, C. C., M. A. Haroldson, G. C. White, R. B. Harris, S. Cherry, K. A. Keating, D. S. . Moody, and C. Servheen. 2006. Temporal, spatial, and environmental influences on the demographics of grizzly bears in the Greater Yellowstone Ecosystem. Wildlife Monographs 161:1–68.
Schwartz, C. C., M. A. Haroldson, K. A. Gunther, and C. T. Robbins. 2013. Omnivory and the terrestrial food web, Yellowstone grizzly bear diets. Pages 109 – 124 in P.J. White, R.A. Garrott, and G. E. Plumb, editors. Yellowstone’s Wildlife in Transition. Harvard University Press, Cambridge Massachusetts, USA.
Service, C. N., A. W. Bateman, M. S. Adams, K. A. Artelle, T. E. Reimchen, P. C. Paquet, and C. T. Darimont. 2019. Salmonid species diversity predicts salmon consumption by terrestrial wildlife. Journal of Animal Ecology 88:392–404.
Signer, J., J. Fieberg, and T. Avgar. 2019. Animal movement tools (amt): R package for managing tracking data and conducting habitat selection analyses. Ecology and Evolution 9:880–890.
Singer, F. J., L. C. Mark, and R. C. Cates. 1994. Ungulate herbivory of willows on Yellowstone’s northern winter range. Journal of Range Management 47:435–443.
Singer, F. J., A. Harting, K. K. Symonds, and M. B. Coughenour. 1997. Density dependence, compensation, and environmental effects of elk calf mortality in Yellowstone National Park. Journal of Wildlife Management 6:12-25.
108
Smith, D. W., R. O. Peterson, and D. B. Houston. 2003. Yellowstone after wolves. BioScience 53:330–340.
Stetz, J. B., K. C. Kendall, and A. C. Macleod. 2014. Black bear density in Glacier National Park , Montana. Wildlife Society Bulletin 38:60–70.
Stetz, J. B., M. S. Mitchell, and K. C. Kendall. 2019. Using spatially-explicit capture–recapture models to explain variation in seasonal density patterns of sympatric ursids. Ecography 42:237–248.
Svoboda, N. J., J. L. Belant, D. E. Beyer, J. F. Duquette, and P. E. Lederle. 2019. Carnivore space use shifts in response to seasonal resource availability. Ecosphere 10:e02817.
Tallian, A., A. Ordiz, M. C. Metz, C. Milleret, C. Wikenros, D. W. Smith, D. R. Stahler, J. Kindberg, D. R. Macnulty, P. Wabakken, J. E. Swenson, and H. Sand. 2017. Competition between apex predators? Brown bears decrease wolf kill rate on two continents. Philosophical Transctions of the Royal Society B: Biological Science 284:20162368.
Tallian, A., D. W. Smith, D. R. Stahler, M. C. Metz, R. L. Wallen, C. Geremia, J. Ruprecht, C. T. Wyman, and D. R. MacNulty. 2017. Predator foraging response to a resurgent dangerous prey. Functional Ecology 31:1418–1429.
Tattoni, C., N. Bragalanti, C. Groff, and F. Rovero. 2015. Patterns in the use of rub trees by the Eurasian brown bear. Hystrix 26:118–124.
Teisberg, J. E., M. A. Haroldson, C. C. Schwartz, K. A. Gunther, J. K. Fortin, and C. T. Robbins. 2014. Contrasting past and current numbers of bears visiting Yellowstone cutthroat trout streams. The Journal of Wildlife Management 78:369–378.
Testa, J. W. 2005. Does predation on neonates inherently select for earlier births? Journal of Mammalogy 83:699–706.
Teunissen van Manen, J. L., L. I. Muller, Z.-H. Li, A. M. Saxton, and M. R. Pelton. 2014. Using stable isotopes to assess dietary changes of American black bears from 1980 to 2001. Isotopes in environmental and health studies 50:382–398.
Thomas, D. L., and E. J. Taylor. 2006. Study designs and tests for comparing resource use and availability. Journal of Wildlife Management 54:324–336.
Thurfjell, H., S. Ciuti, and M. S. Boyce. 2014. Applications of step-selection functions in ecology and conservation. Movement Ecology 2:1–12.
Toft, C. A. 1985. Resource partitioning in amphibians and reptiles. Copeia 1985:1–21.
109
Tredick, C. A., M. R. Vaughan, D. F. Stauffer, S. L. Simek, and T. Eason. 2007. Sub-sampling genetic data to estimate black bear population size: A case study. Ursus 18:179–188.
Tredick, C. A., and M. R. Vaughan. 2009. DNA-based population demographics of black bears in Coastal North Carolina and Virginia. Journal of Wildlife Management 73:1031–1039.
U.S. Geological Survey. 2009. National Elevation Dataset. U.S. Geological Survey, EROS Data Center, Sioux Falls, South Dakota, USA.
van der Graaf, S., J. Stahl, R. H. Drent, A. Klimkowska, and J. P. Bakker. 2006. Surfing on a green wave - how plant growth drives spring migration in the Barnacle Goose Branta leucopsis. Ardea 94:567–577.
van Manen, F. T., M. A. Haroldson, and B. Karabensh. 2019. Yellowstone grizzly bear investigations: annual report of the Interagency Grizzly Bear Study Team 2018. U.S. Geological Survey
van Manen, F. T., M. F. McCollister, J. M. Nicholson, L. M. Thompson, J. L. Kindall, and M. D. Jones. 2012. Short-term impacts of a 4-lane highway on American black bears in eastern North Carolina. Wildlife Monographs 181:1–35.
Voeten, M. M., and H. H. T. Prins. 1999. Resource partitioning between sympatric wild and domestic herbivores in the Tarangire region of Tanzania. Oecologia 120:287–294.
Vore, J. M., and E. M. Schmidt. 2001. Movements of female elk during calving season in northwest Montana. Wildlife Society Bulletin 29:720–725.
Welch, C. A., J. Keay, K. C. Kendall, and C. T. Robbins. 1997. Constraints on frugivory by bears. Ecology 78:1105–1119.
Welfelt, L. S., R. A. Beausoleil, and R. B. Wielgus. 2019. Factors associated with black bear density and implications for management. Journal of Wildlife Management 83:1527–1539.
White, P. J., and R. A. Garrott. 2005. Yellowstone’s ungulates after wolves - Expectations, realizations, and predictions. Biological Conservation 125:141–152.
Woods, J. G., D. Paetkau, C. Strobeck, D. Lewis, B. N. McLellan, and M. Proctor. 1999. Genetic tagging of free-ranging black and brown bears. Wildlife Society Bulletin 27:616–627.
110
Xu, C., Y. Li, J. Hu, X. Yang, S. Sheng, and M. Liu. 2012. Evaluating the difference between the normalized difference vegetation index and net primary productivity as the indicators of vegetation vigor assessment at landscape scale. Environmental Monitoring and Assessment 184:1275–1286.
Yellowstone Spatial Analysis Center. 2010. Yellowstone Spatial Analysis Center, Yellowstone National Park, Mammoth, Wyoming, USA

111
APPENDICES
112
APPENDIX A
IDENTIFYING THE ELK CALVING GROUNDS OF THE NORTHERN RANGE
113
Identifying the Elk Calving Grounds on the Northern Range
To understand whether black bears actively or opportunistically prey on neonate
elk calves, we first needed to identify locations of elk calving grounds on the Northern
Range (NR) of Yellowstone National Park (YNP). Barber-Meyer et al. (2008) captured
151 newborn elk calves (≤6 days old) from May 16 to June 20 (2003-2005) to estimate
survival and focused their capture efforts in areas of previous survival studies on the
Northern Range (Mattson 1997, Singer et al. 1997). We used these capture locations as a
starting point for identifying calving grounds, assuming that elk give birth in similar areas
each year (Vore and Schmidt 2001). We then compared alternative methods to generate
spatial predictions of the calving grounds on the Northern Range.
Researchers have used several different methods to examine patterns in GPS
locational data of large ungulates to identify the timing and location of parturition (the
action of giving birth) (Vore and Schmidt 2001, D’Angelo et al. 2004, DeMars et al.
2013, Mcgraw et al. 2014, Nicholson et al. 2019). We explored three of these methods
(changes in daily movement, track analysis, and behavioral change point analysis
[BCPA]) using data from 29 GPS-collared cow elk (hourly locations collected from
2016-2018) that were part of an ongoing, long-term study within YNP by Utah State
University. Unlike other parturition studies, we did not always know whether elk in this
dataset gave birth to a calf. Initially, we focused on 14 individuals that had pregnancy
tests completed upon capture in 2016. Initially, we sought to evaluate multiple methods
based on this smaller dataset (n = 14 individuals) to assess whether using the calf capture
114
locations from the early 2000s (Barber-Meyer et al. 2008) was appropriate to identify the
calving grounds of the Northern Range, so we could later apply the most effective
methods to our larger dataset (n = 29 individuals).
Changes in daily movements
Vore et al. (2001) found that pregnant elk traveled more than twice their average
daily movements (the maximum distance traveled in a day) before giving birth, then
reduced movement to less than half their daily average after successfully giving birth for
10 or more days. This change in daily movement distances surrounding parturition also
has been observed in other ungulate species (Clutton-Brock and Guinness 1975,
D’Angelo et al. 2004, DeMars et al. 2013, Mcgraw et al. 2014). Elk in YNP tend to give
birth between May 15 and June 15 (Singer et al. 1997, Barber-Meyer et al. 2008), so we
focused our search for changes in daily movements to a window between May 1 and June
30. We used the adhabitatLT package in program R to calculate the trajectory (the
distance traveled between successive GPS locations) of each elk and examine their daily
movements (Calenge 2006, R Development Core Team 2013). We plotted daily
movements for each elk over time and looked for changes that might suggest a calving
event; 11 of 12 elk with positive pregnancy tests showed changes in their daily
movements (Figures A1 and A2). Specifically, these elk showed initial spikes in
movement, then declining below their daily mean for ≥7 days, and returning to daily
movements closer to their mean. In comparison, the two elk that had negative pregnancy
tests did not show major deviations in daily movements (Figure A3). Only one elk with a
positive pregnancy test lacked changes in daily movements that would suggest a potential
115
calving event. Therefore, most of the elk in our dataset displayed similar changes in
movement surrounding calving events as previously documented in other ungulates.
Track analysis
To link potential calving events to locations on the landscape, we assessed the
application of the Tracking Analyst® (TA) tool in ArcGIS, previously used by Nicholson
et al. (2019) in their study of moose (Alces alces). The TA tool identifies changes in
movement on the landscape over time based on trajectory data, which includes locational
points with associated changes in speed or distance traveled between successive points.
These points (and distances) are categorized and colored in ArcMap according to the
distribution of changing movements. Given that we already generated trajectory data
using the adhabitatLT package, which included both the distance traveled between GPS
locations and the location of each daily movement, we exported these data into ArcMap
and plotted the daily movements of the elk, creating the same data as the TA tool. We
categorized the daily movement data based on the quartile distribution of the trajectory
data (0-477, 478-985, 986-1215, and 1216-7000 m for our data on 14 elk). The daily
movement points associated with shorter distances were more clustered together, which
suggested a calving event (Figure A4).
We then evaluated how well the clustered points (associated with short distances)
on the Northern Range overlaid with the locations of calves captured in the early 2000s
(Barber-Meyer et al. 2008). We first mapped the locations of captured calves in ArcMap
and added a conservative buffer of 900 m around each point, based on the daily mean
movement traveled after a birthing event for the 14 GPS-collared elk from 2016 (mean =
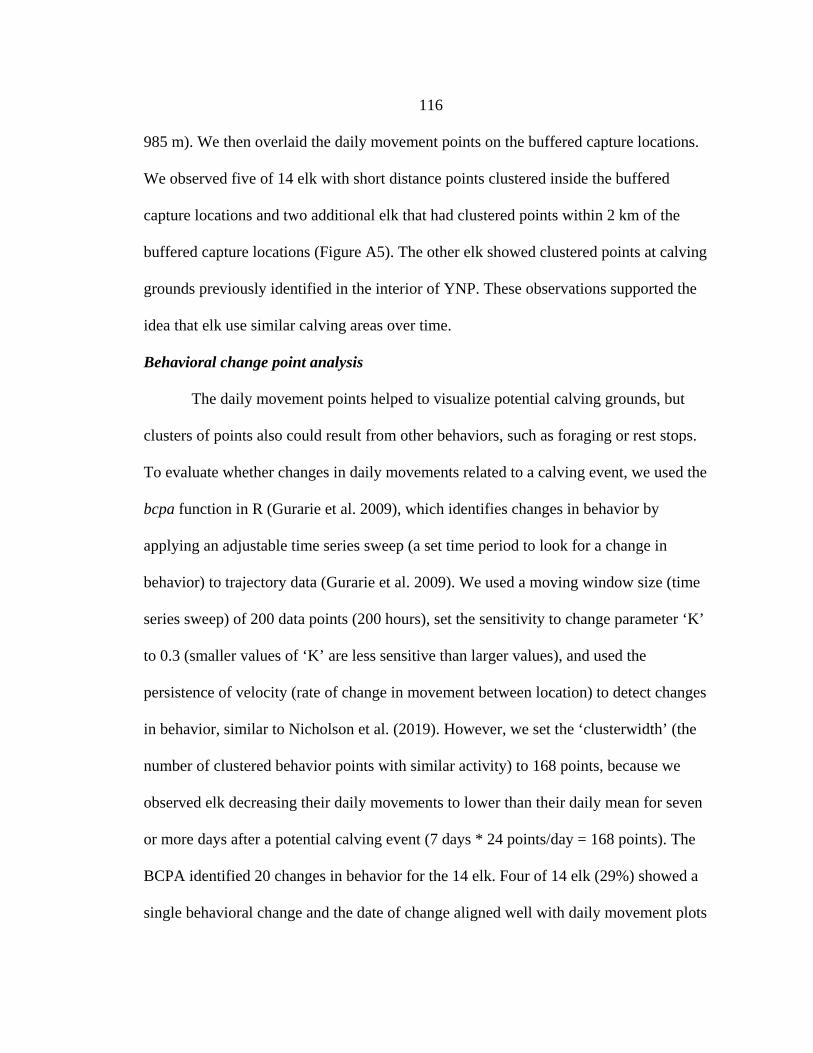
116
985 m). We then overlaid the daily movement points on the buffered capture locations.
We observed five of 14 elk with short distance points clustered inside the buffered
capture locations and two additional elk that had clustered points within 2 km of the
buffered capture locations (Figure A5). The other elk showed clustered points at calving
grounds previously identified in the interior of YNP. These observations supported the
idea that elk use similar calving areas over time.
Behavioral change point analysis
The daily movement points helped to visualize potential calving grounds, but
clusters of points also could result from other behaviors, such as foraging or rest stops.
To evaluate whether changes in daily movements related to a calving event, we used the
bcpa function in R (Gurarie et al. 2009), which identifies changes in behavior by
applying an adjustable time series sweep (a set time period to look for a change in
behavior) to trajectory data (Gurarie et al. 2009). We used a moving window size (time
series sweep) of 200 data points (200 hours), set the sensitivity to change parameter ‘K’
to 0.3 (smaller values of ‘K’ are less sensitive than larger values), and used the
persistence of velocity (rate of change in movement between location) to detect changes
in behavior, similar to Nicholson et al. (2019). However, we set the ‘clusterwidth’ (the
number of clustered behavior points with similar activity) to 168 points, because we
observed elk decreasing their daily movements to lower than their daily mean for seven
or more days after a potential calving event (7 days * 24 points/day = 168 points). The
BCPA identified 20 changes in behavior for the 14 elk. Four of 14 elk (29%) showed a
single behavioral change and the date of change aligned well with daily movement plots
117
(Figures A6 and A7). Ten of 14 elk (71%) showed two or more changes in behavior. To
filter out points that might falsely identify calving events, we compared the BCPA to the
daily movement plots and found that the two behavior changes detected before May 11,
preceding the calving season, likely were misidentified as a calving event, so we
eliminated those detections. For elk that still had multiple behavioral changes, we found
that changes at later dates better represented calving events based on observations of
where BCPA locations clustered. Earlier changes appeared to be shifts in movements, an
increase in daily movements, to reach calving areas, especially for migrant elk that travel
from outside of YNP into the interior of the park, so we also removed those points from
our calving ground map. We also removed points associated with elk that had a negative
pregnancy test (n = 2 individuals). When we did not have pregnancy tests to confirm our
findings, we assumed that elk in the GYE have high pregnancy rates (Middleton et al.
2013, Proffitt et al. 2014) and relied on both the daily movement data and BCPA results
to identify false positive results. After filtering the BCPA data, we had 11 behavior
change locations, which we then compared to the buffered calf capture layer and daily
movement data in ArcMap (Figure A8). Of the 11 behavior change locations, eight
occurred within the clusters of short daily movements and the other three were within 5
km of the clustered points for those elk. Of the 11 behavior changes identified, eight were
in the Northern Range and five were found within the borders of the buffered capture
location layer. This method suggests that the clustering of short daily movements during
the spring months likely were associated with a calving event and further supported the
118
use of the captured calf locations (Barber-Meyer et al. 2008) as a representation of the
calving grounds on the Northern Range.
Analysis of full dataset
We applied each of the three methods above to the full data set of 29 elk from
2016 – 2018. We identified 49 calving locations for 27 of the 29 elk based on BCPA.
After visually inspecting the results, we found only three locations for 2 individuals
incorrectly identified a potential calving event based on the visual inspection of BCPA
locations compared to the clustering of short distance daily movement points. The
misidentified locations were between 10 and 21 km away from potential calving
locations, which were validated by the daily movement data. These two individuals were
long-distance migrants that started their travels from areas outside of the YNP to the
interior of YNP, which could explain the erroneous detections. Fifteen of the 29 elk had
>2 calving events identified over multiple years. Twelve of those elk had calving sites
within 5 km of the previous year’s calving location, supporting the idea that elk use
similar calving areas each year. Of the 49 calving locations, 22 were within the Northern
Range and an additional 10 were within 6 km of the Northern Range. In addition, we
were able to identify 15 calving locations in the interior of YNP (Figure A9); 6 of these
locations coincide with areas where grizzly bears were observed hunting elk calves in the
spring during the 1980s and 1990s (French and French 1990, Mattson 1997). To create
our final calving grounds layer of the Northern Range, we combined the Barber-Meyer et
al. (2008) calf capture locations and the newly-identified BCPA locations and added a
900-m buffer to all locations (Figures A10 and A11).
119
Figure A1. Daily maximum distances traveled by a single elk (#1623) in 2016, demonstrating a change in daily movement distances, which is suggestive of a calving event. The vertical line is the mean daily distance traveled for this individual (852 m/day).
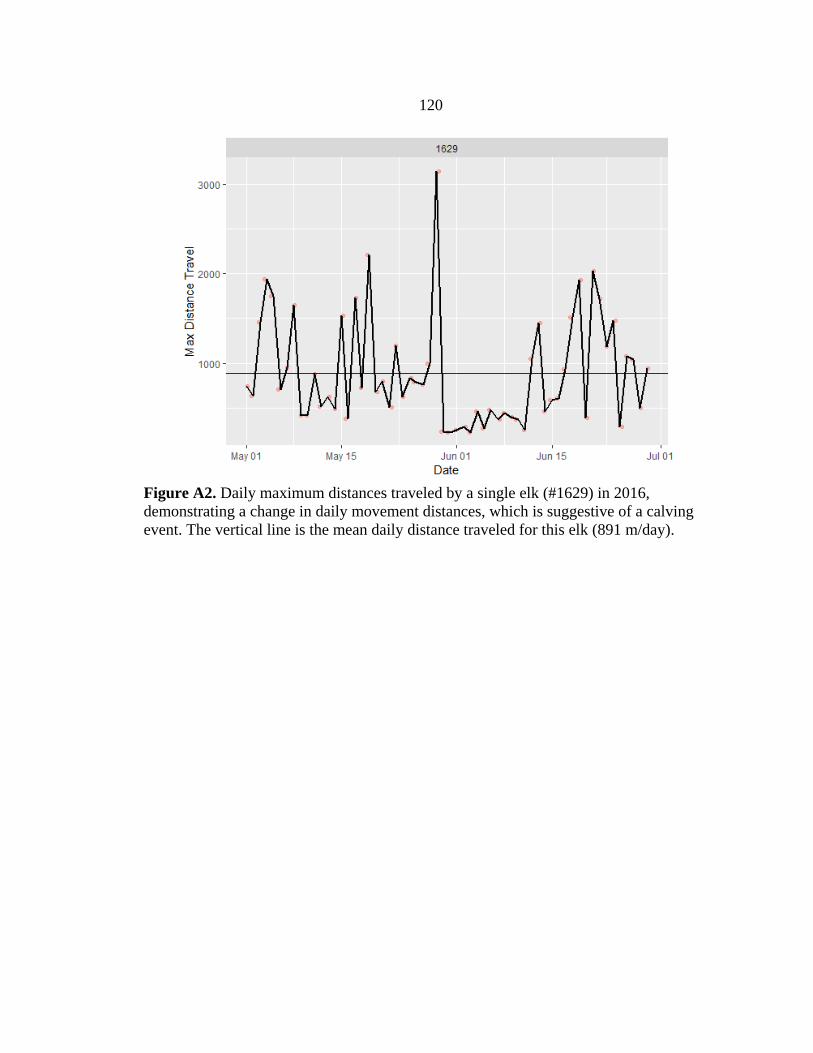
120
Figure A2. Daily maximum distances traveled by a single elk (#1629) in 2016, demonstrating a change in daily movement distances, which is suggestive of a calving event. The vertical line is the mean daily distance traveled for this elk (891 m/day).
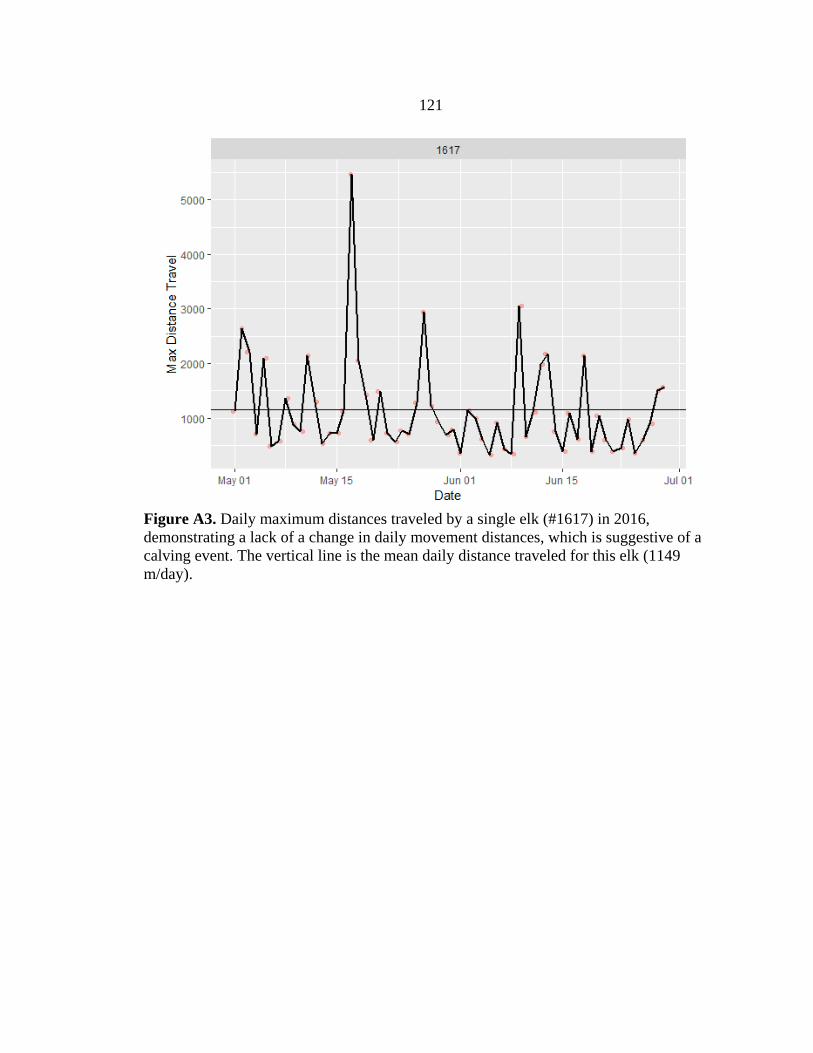
121
Figure A3. Daily maximum distances traveled by a single elk (#1617) in 2016, demonstrating a lack of a change in daily movement distances, which is suggestive of a calving event. The vertical line is the mean daily distance traveled for this elk (1149 m/day).
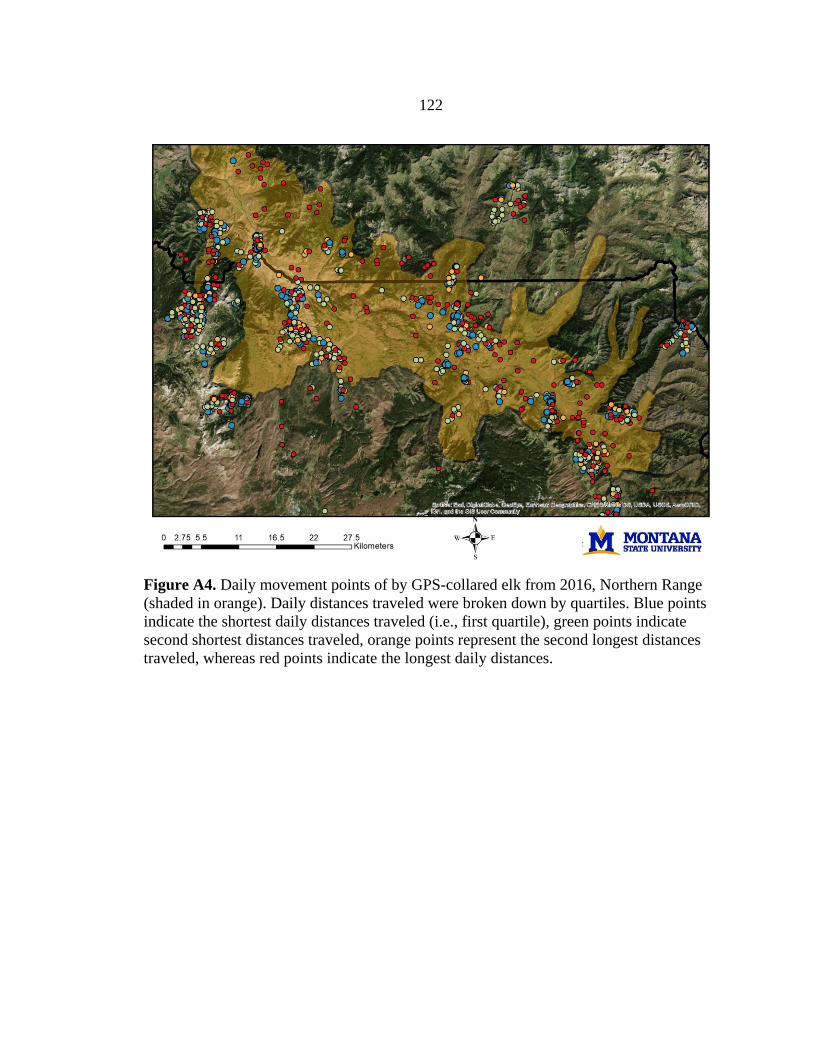
122
Figure A4. Daily movement points of by GPS-collared elk from 2016, Northern Range (shaded in orange). Daily distances traveled were broken down by quartiles. Blue points indicate the shortest daily distances traveled (i.e., first quartile), green points indicate second shortest distances traveled, orange points represent the second longest distances traveled, whereas red points indicate the longest daily distances.
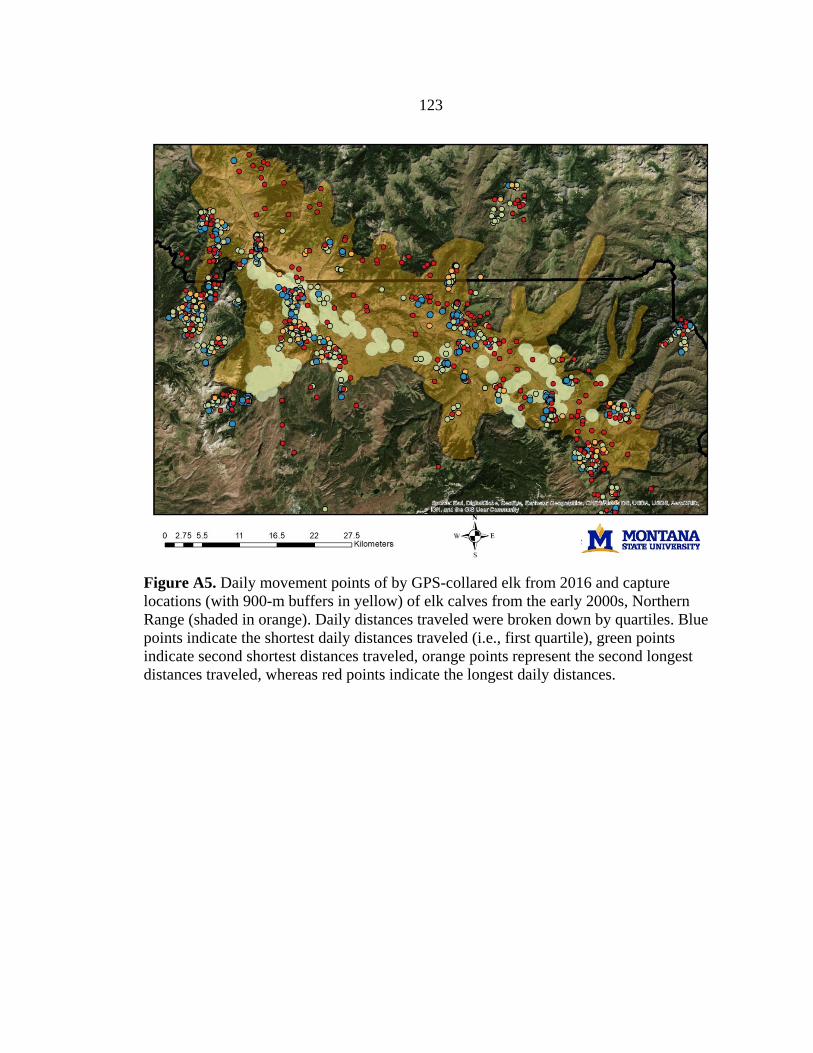
123
Figure A5. Daily movement points of by GPS-collared elk from 2016 and capture locations (with 900-m buffers in yellow) of elk calves from the early 2000s, Northern Range (shaded in orange). Daily distances traveled were broken down by quartiles. Blue points indicate the shortest daily distances traveled (i.e., first quartile), green points indicate second shortest distances traveled, orange points represent the second longest distances traveled, whereas red points indicate the longest daily distances.
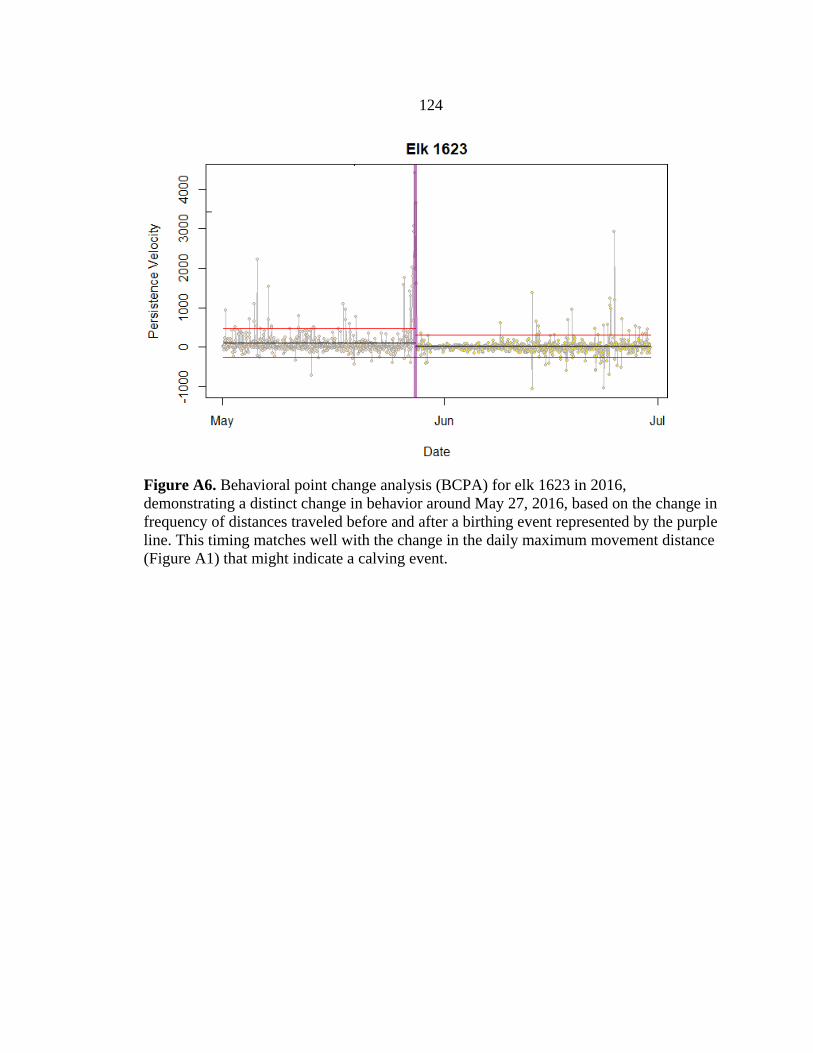
124
Figure A6. Behavioral point change analysis (BCPA) for elk 1623 in 2016, demonstrating a distinct change in behavior around May 27, 2016, based on the change in frequency of distances traveled before and after a birthing event represented by the purple line. This timing matches well with the change in the daily maximum movement distance (Figure A1) that might indicate a calving event.
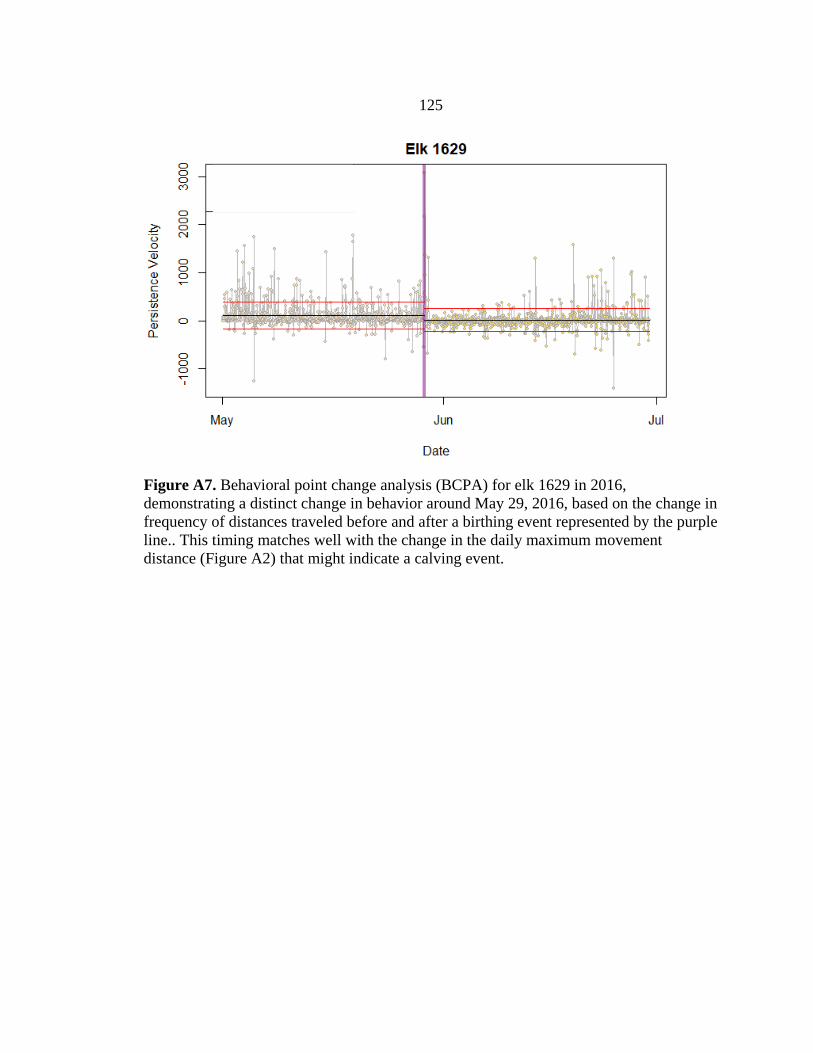
125
Figure A7. Behavioral point change analysis (BCPA) for elk 1629 in 2016, demonstrating a distinct change in behavior around May 29, 2016, based on the change in frequency of distances traveled before and after a birthing event represented by the purple line.. This timing matches well with the change in the daily maximum movement distance (Figure A2) that might indicate a calving event.

126
Figure A8. Buffered capture locations for elk calves in the early 2000s (with 900-m buffers in yellow), daily movement points, and behavioral change point analysis (BCPA) points of GPS collared elk, Northern Range (shaded in orange) 2016-2018. Daily distances traveled were broken down by quartiles. Blue points indicate the shortest daily distances traveled (i.e., first quartile), green points indicate second shortest distances traveled, orange points represent the second longest distances traveled, whereas red points indicate the longest daily distances. The BCPA points (purple) were located in close proximity to the shorter daily movement points (blue) and fell within or close to the buffered elk calf capture locations. In some cases, the daily movement points and BCPA suggested calving grounds not previously identified.
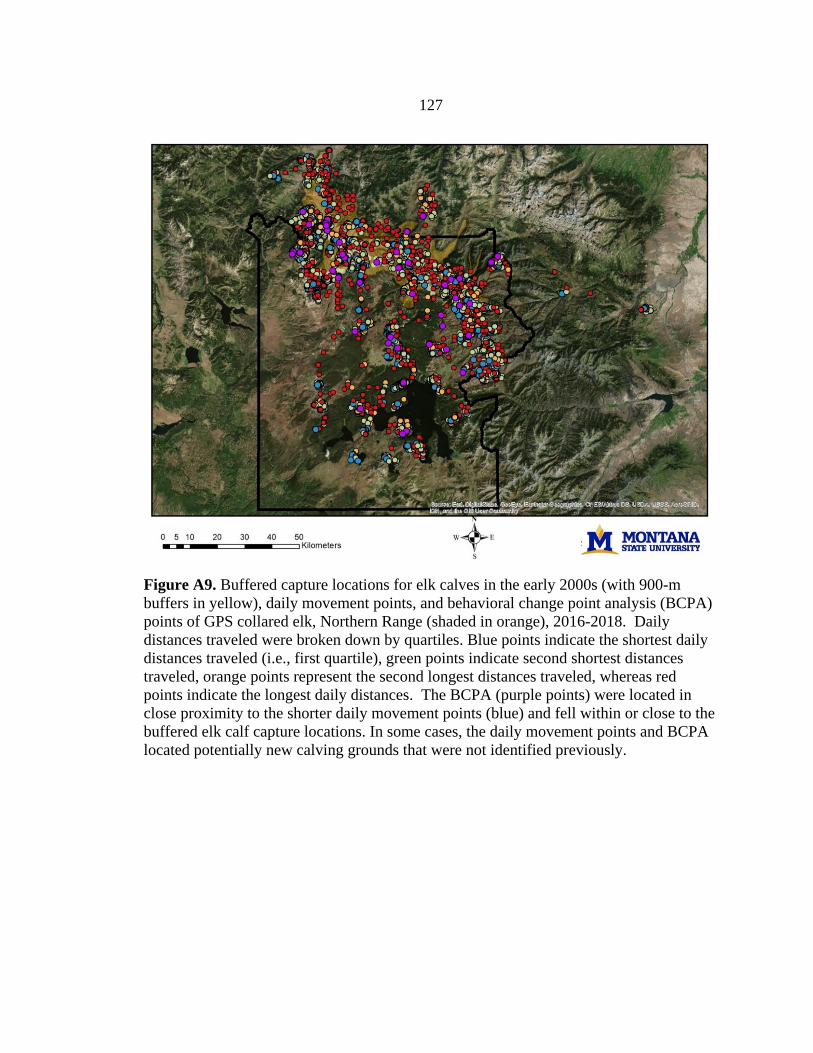
127
Figure A9. Buffered capture locations for elk calves in the early 2000s (with 900-m buffers in yellow), daily movement points, and behavioral change point analysis (BCPA) points of GPS collared elk, Northern Range (shaded in orange), 2016-2018. Daily distances traveled were broken down by quartiles. Blue points indicate the shortest daily distances traveled (i.e., first quartile), green points indicate second shortest distances traveled, orange points represent the second longest distances traveled, whereas red points indicate the longest daily distances. The BCPA (purple points) were located in close proximity to the shorter daily movement points (blue) and fell within or close to the buffered elk calf capture locations. In some cases, the daily movement points and BCPA located potentially new calving grounds that were not identified previously.
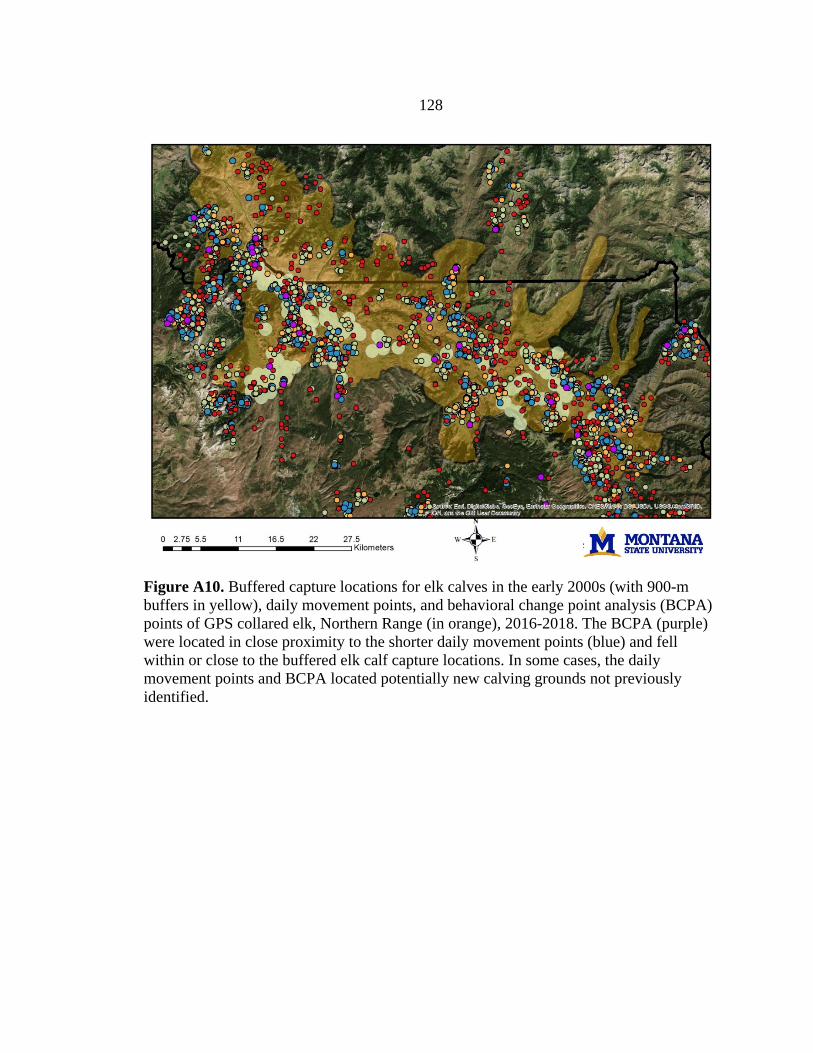
128
Figure A10. Buffered capture locations for elk calves in the early 2000s (with 900-m buffers in yellow), daily movement points, and behavioral change point analysis (BCPA) points of GPS collared elk, Northern Range (in orange), 2016-2018. The BCPA (purple) were located in close proximity to the shorter daily movement points (blue) and fell within or close to the buffered elk calf capture locations. In some cases, the daily movement points and BCPA located potentially new calving grounds not previously identified.
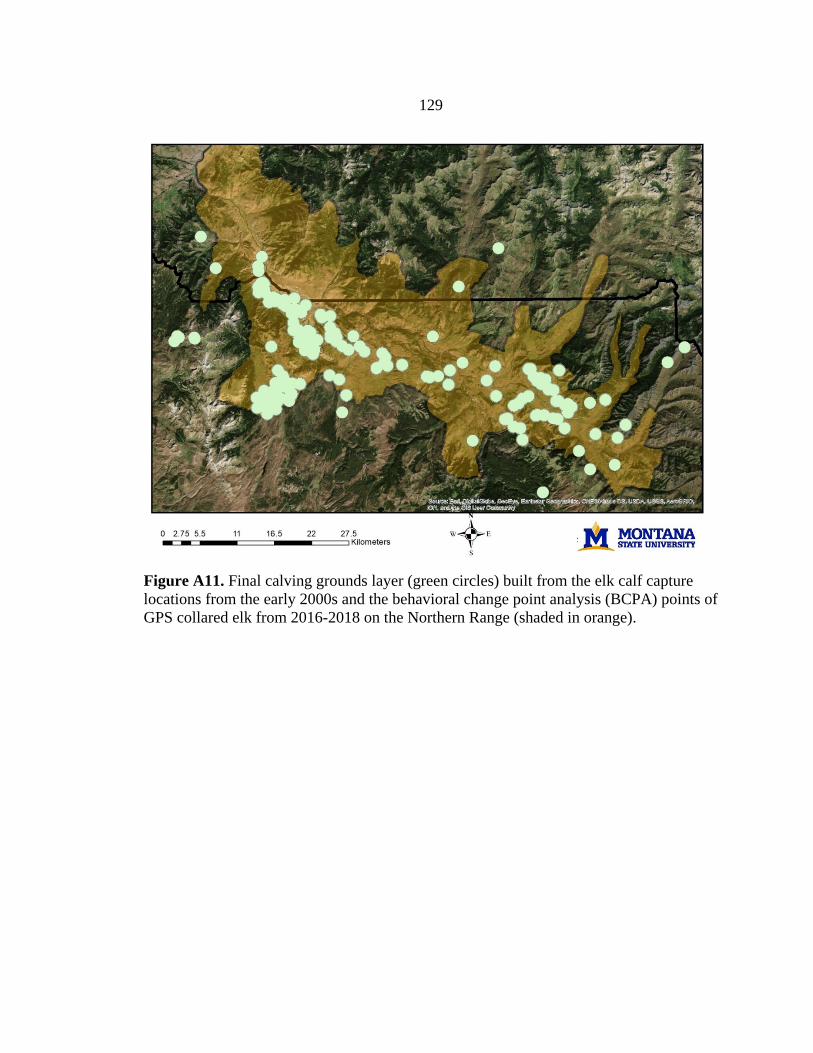
129
Figure A11. Final calving grounds layer (green circles) built from the elk calf capture locations from the early 2000s and the behavioral change point analysis (BCPA) points of GPS collared elk from 2016-2018 on the Northern Range (shaded in orange).
130
LITERATURE CITED
Barber-Meyer, S. M., L. D. Mech, and P. J. White. 2008. Elk calf survival and mortality following wolf restoration to Yellowstone National Park. Wildlife Monographs 169:1–30.
Calenge, C. 2006. The package “adehabitat” for the R software: a tool for the analysis of space and habitat use by animals. Ecological Modelling 197:516–519.
Clutton-Brock, T. H., and F. E. Guinness. 1975. Behaviour of red deer (Cervus elaphus L.) at calving time. Behaviour 55:287–300.
D’Angelo, G. J., C. E. Comer, J. C. Kilgo, C. D. Drennan, D. A. Osborn, and K. V. Miller. 2004. Daily movements of female white-tailed deer relative to parturition and breeding. Proceedings of the Annual Conference of the Southeastern Association of Fish and Wildlife Agencies 58:292–301.
DeMars, C. A., M. Auger-Méthé, U. E. Schlägel, and S. Boutin. 2013. Inferring parturition and neonate survival from movement patterns of female ungulates: A case study using woodland caribou. Ecology and Evolution 3:4149–4160.
French, S. P., and M. G. French. 1990. Predatory behavior of grizzly bears feeding on elk calves in Yellowstone National Park. International Conference on Bear Research and Management 8:335–341.
Gurarie, E., R. D. Andrews, and K. L. Laidre. 2009. A novel method for identifying behavioral changes in animal movement data. Ecology Letters 12:395–408.
Mattson, D. J. 1997. Use of ungulates by Yellowstone grizzly bears (Ursus arctos). Biological Conservation 81:161–177.
Mcgraw, A. M., J. Terry, and R. Moen. 2014. Pre-parturition movement patterns and birth site characteristics of moose in northeast Minnesota. Alces 50:93–103.
Middleton, A. D., M. J. Kauffman, D. E. McWhirter, J. G. Cook, R. C. Cook, A. A. Nelson, M. D. Jimenez, and R. W. Klaver. 2013. Animal migration amid shifting patterns of phenology and predation: Lessons from a Yellowstone elk herd. Ecology 94:1245–1256.
Nicholson, K. L., M. J. Warren, C. Rostan, J. Månsson, T. F. Paragi, and H. Sand. 2019. Using fine-scale movement patterns to infer ungulate parturition. Ecological Indicators 101:22–30.
Proffitt, K. M., J. A. Cunningham, K. L. Hamlin, and R. A. Garrott. 2014. Bottom-up and top-down influences on pregnancy rates and recruitment of northern Yellowstone elk. Journal of Wildlife Management 78:1383–1393.
131
R Development Core Team. 2013. R: A language and environment for statistical computing. R Foundation for Statistical Computing. Vienna, Austria.
Singer, F. J., A. Harting, K. K. Symonds, M. B. Coughenour, T. Journal, and N. Jan. 1997. Density dependence, compensation, and environmental effects on elk calf mortality in Yellowstone National Park. Journal of Wildlife Management 61:12–25.
Vore, J. M., and E. M. Schmidt. 2001. Movements of female elk during calving season in northwest Montana. 29:720–725.
132
APPENDIX B
ASSESSMENT OF GREEN WAVE TRACKING BASED ON VARYING
LANDSCAPE FEATURES
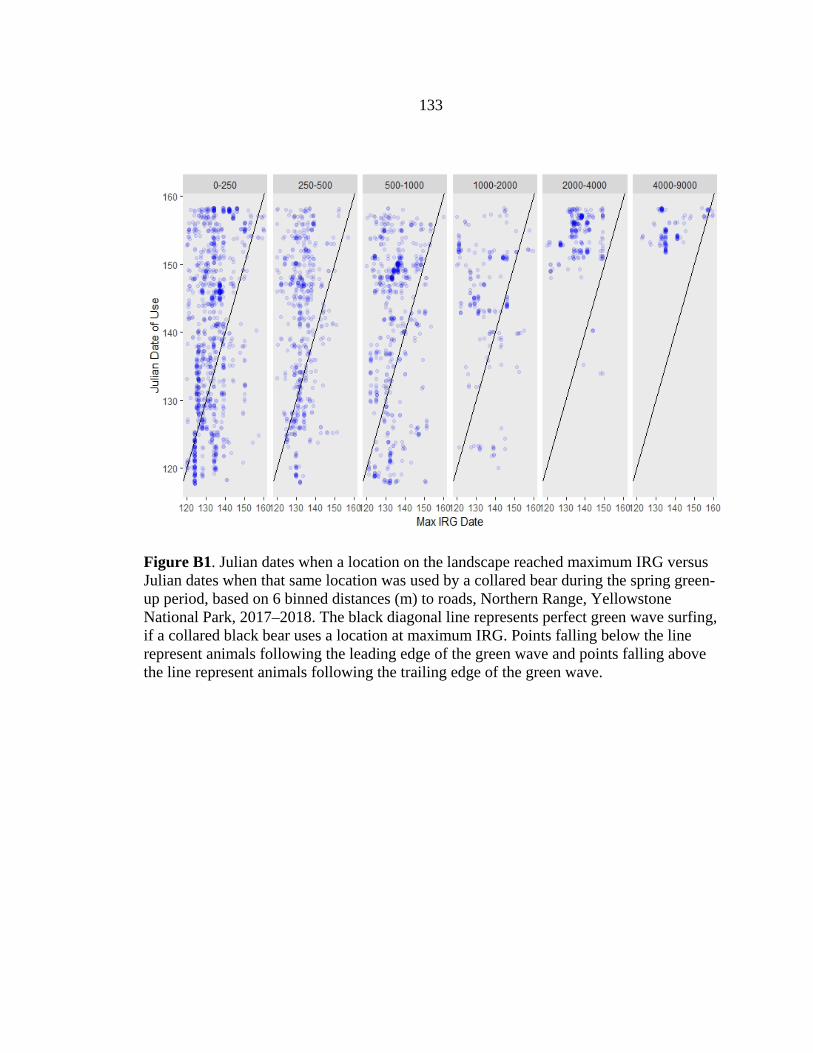
133
Figure B1. Julian dates when a location on the landscape reached maximum IRG versus Julian dates when that same location was used by a collared bear during the spring green-up period, based on 6 binned distances (m) to roads, Northern Range, Yellowstone National Park, 2017–2018. The black diagonal line represents perfect green wave surfing, if a collared black bear uses a location at maximum IRG. Points falling below the line represent animals following the leading edge of the green wave and points falling above the line represent animals following the trailing edge of the green wave.
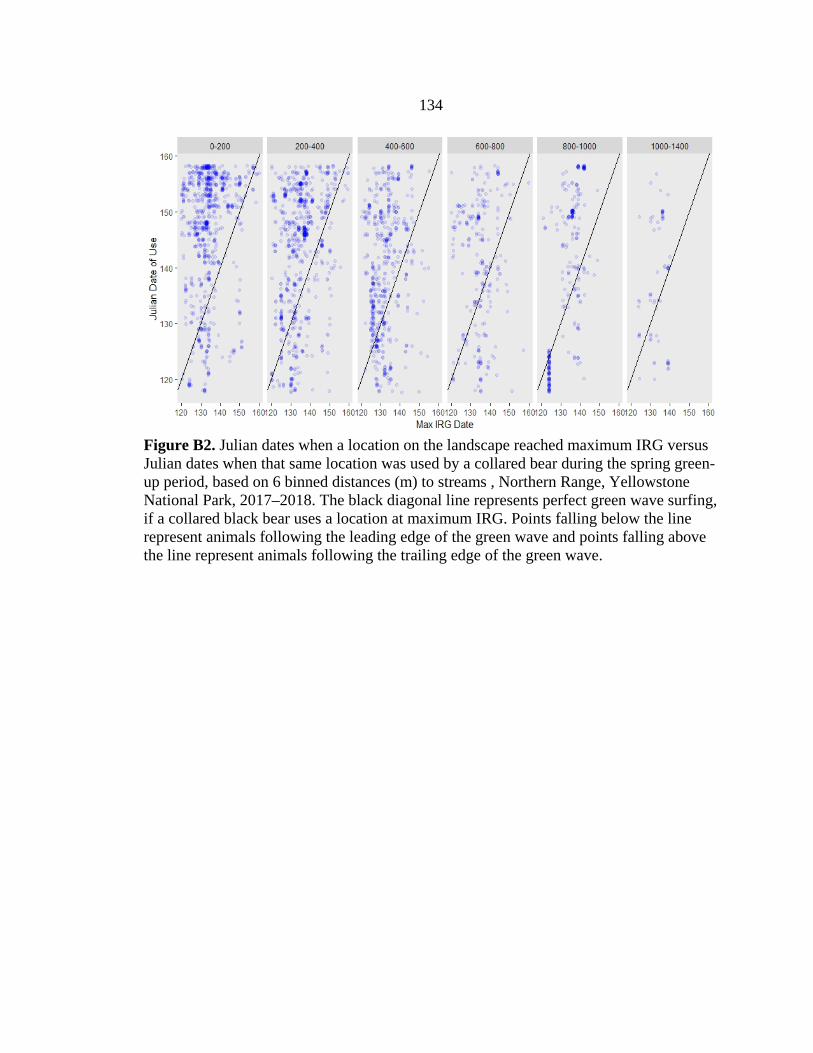
134
Figure B2. Julian dates when a location on the landscape reached maximum IRG versus Julian dates when that same location was used by a collared bear during the spring green-up period, based on 6 binned distances (m) to streams , Northern Range, Yellowstone National Park, 2017–2018. The black diagonal line represents perfect green wave surfing, if a collared black bear uses a location at maximum IRG. Points falling below the line represent animals following the leading edge of the green wave and points falling above the line represent animals following the trailing edge of the green wave.
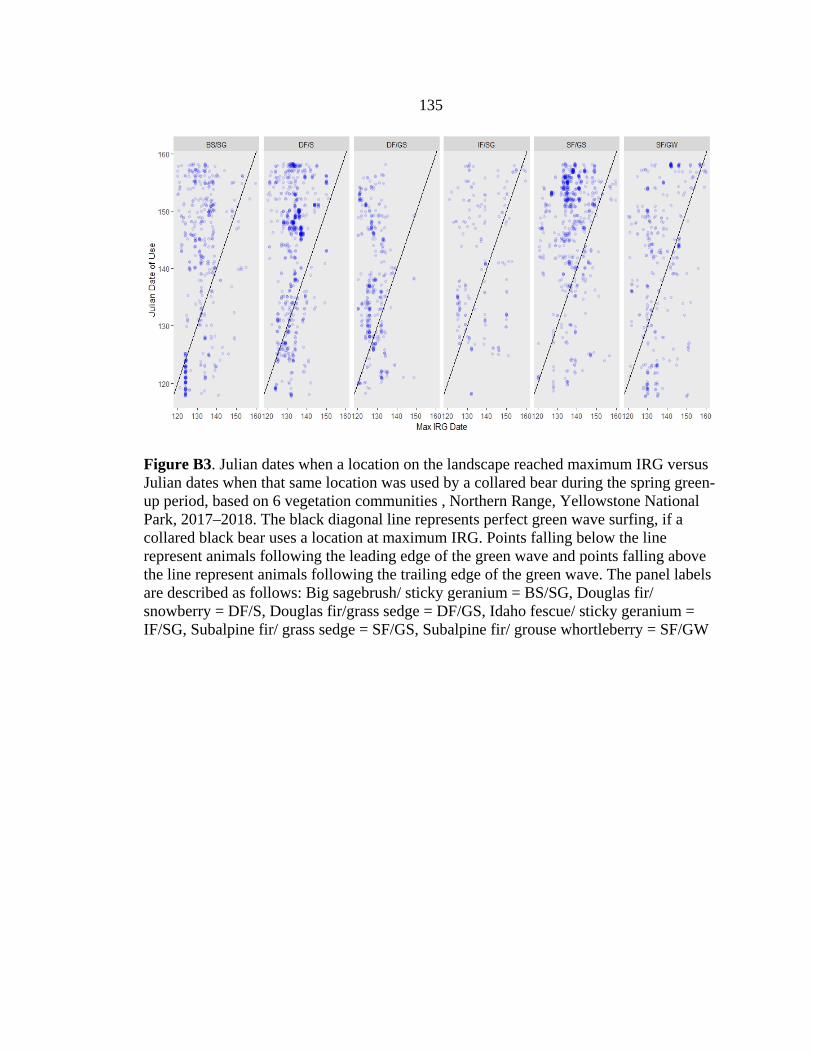
135
Figure B3. Julian dates when a location on the landscape reached maximum IRG versus Julian dates when that same location was used by a collared bear during the spring green-up period, based on 6 vegetation communities , Northern Range, Yellowstone National Park, 2017–2018. The black diagonal line represents perfect green wave surfing, if a collared black bear uses a location at maximum IRG. Points falling below the line represent animals following the leading edge of the green wave and points falling above the line represent animals following the trailing edge of the green wave. The panel labels are described as follows: Big sagebrush/ sticky geranium = BS/SG, Douglas fir/ snowberry = DF/S, Douglas fir/grass sedge = DF/GS, Idaho fescue/ sticky geranium = IF/SG, Subalpine fir/ grass sedge = SF/GS, Subalpine fir/ grouse whortleberry = SF/GW

136
APPENDIX C
MODEL SELECTION RESULTS FOR SPATIALLY EXPLICIT CAPTURE-
RECAPTURE MODELS FOR BLACK BEARS ON THE NORTHERN RANGE
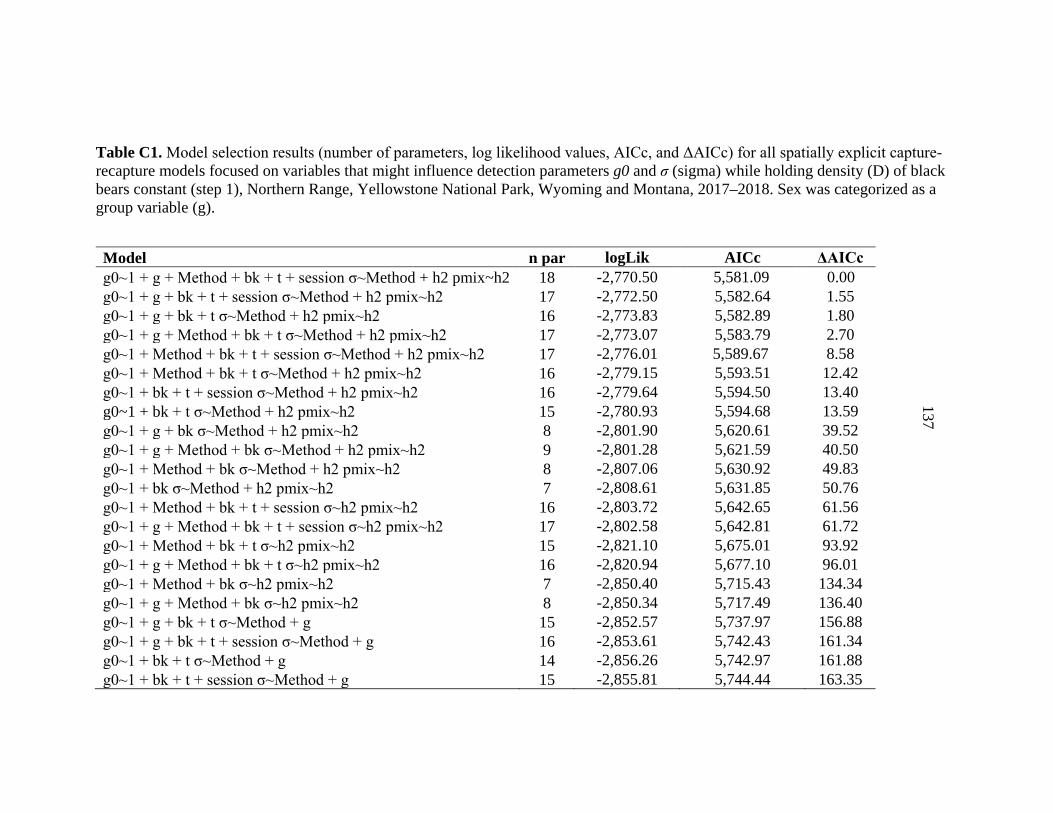
137
Table C1. Model selection results (number of parameters, log likelihood values, AICc, and ΔAICc) for all spatially explicit capture-recapture models focused on variables that might influence detection parameters g0 and σ (sigma) while holding density (D) of black bears constant (step 1), Northern Range, Yellowstone National Park, Wyoming and Montana, 2017–2018. Sex was categorized as a group variable (g).
Model n par logLik AICc ΔAICc g0~1 + g + Method + bk + t + session σ~Method + h2 pmix~h2 18 -2,770.50 5,581.09 0.00 g0~1 + g + bk + t + session σ~Method + h2 pmix~h2 17 -2,772.50 5,582.64 1.55 g0~1 + g + bk + t σ~Method + h2 pmix~h2 16 -2,773.83 5,582.89 1.80 g0~1 + g + Method + bk + t σ~Method + h2 pmix~h2 17 -2,773.07 5,583.79 2.70 g0~1 + Method + bk + t + session σ~Method + h2 pmix~h2 17 -2,776.01 5,589.67 8.58 g0~1 + Method + bk + t σ~Method + h2 pmix~h2 16 -2,779.15 5,593.51 12.42 g0~1 + bk + t + session σ~Method + h2 pmix~h2 16 -2,779.64 5,594.50 13.40 g0~1 + bk + t σ~Method + h2 pmix~h2 15 -2,780.93 5,594.68 13.59 g0~1 + g + bk σ~Method + h2 pmix~h2 8 -2,801.90 5,620.61 39.52 g0~1 + g + Method + bk σ~Method + h2 pmix~h2 9 -2,801.28 5,621.59 40.50 g0~1 + Method + bk σ~Method + h2 pmix~h2 8 -2,807.06 5,630.92 49.83 g0~1 + bk σ~Method + h2 pmix~h2 7 -2,808.61 5,631.85 50.76 g0~1 + Method + bk + t + session σ~h2 pmix~h2 16 -2,803.72 5,642.65 61.56 g0~1 + g + Method + bk + t + session σ~h2 pmix~h2 17 -2,802.58 5,642.81 61.72 g0~1 + Method + bk + t σ~h2 pmix~h2 15 -2,821.10 5,675.01 93.92 g0~1 + g + Method + bk + t σ~h2 pmix~h2 16 -2,820.94 5,677.10 96.01 g0~1 + Method + bk σ~h2 pmix~h2 7 -2,850.40 5,715.43 134.34 g0~1 + g + Method + bk σ~h2 pmix~h2 8 -2,850.34 5,717.49 136.40 g0~1 + g + bk + t σ~Method + g 15 -2,852.57 5,737.97 156.88 g0~1 + g + bk + t + session σ~Method + g 16 -2,853.61 5,742.43 161.34 g0~1 + bk + t σ~Method + g 14 -2,856.26 5,742.97 161.88 g0~1 + bk + t + session σ~Method + g 15 -2,855.81 5,744.44 163.35
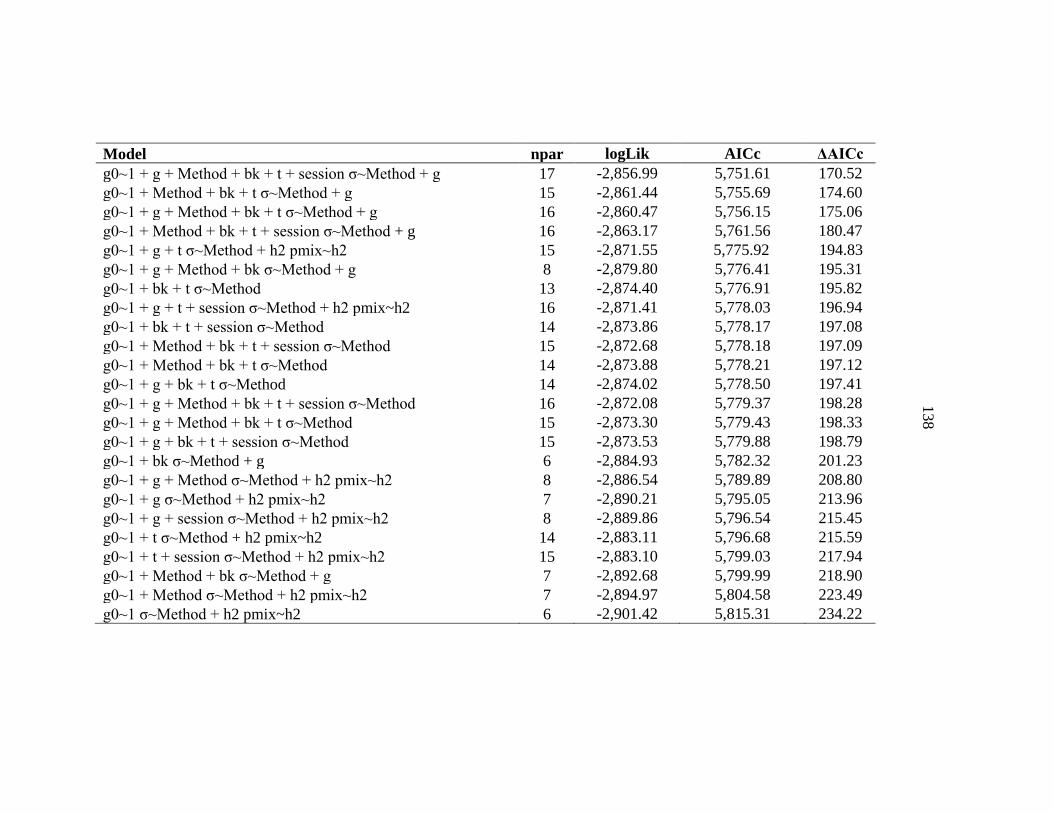
138
Model npar logLik AICc ΔAICc g0~1 + g + Method + bk + t + session σ~Method + g 17 -2,856.99 5,751.61 170.52 g0~1 + Method + bk + t σ~Method + g 15 -2,861.44 5,755.69 174.60 g0~1 + g + Method + bk + t σ~Method + g 16 -2,860.47 5,756.15 175.06 g0~1 + Method + bk + t + session σ~Method + g 16 -2,863.17 5,761.56 180.47 g0~1 + g + t σ~Method + h2 pmix~h2 15 -2,871.55 5,775.92 194.83 g0~1 + g + Method + bk σ~Method + g 8 -2,879.80 5,776.41 195.31 g0~1 + bk + t σ~Method 13 -2,874.40 5,776.91 195.82 g0~1 + g + t + session σ~Method + h2 pmix~h2 16 -2,871.41 5,778.03 196.94 g0~1 + bk + t + session σ~Method 14 -2,873.86 5,778.17 197.08 g0~1 + Method + bk + t + session σ~Method 15 -2,872.68 5,778.18 197.09 g0~1 + Method + bk + t σ~Method 14 -2,873.88 5,778.21 197.12 g0~1 + g + bk + t σ~Method 14 -2,874.02 5,778.50 197.41 g0~1 + g + Method + bk + t + session σ~Method 16 -2,872.08 5,779.37 198.28 g0~1 + g + Method + bk + t σ~Method 15 -2,873.30 5,779.43 198.33 g0~1 + g + bk + t + session σ~Method 15 -2,873.53 5,779.88 198.79 g0~1 + bk σ~Method + g 6 -2,884.93 5,782.32 201.23 g0~1 + g + Method σ~Method + h2 pmix~h2 8 -2,886.54 5,789.89 208.80 g0~1 + g σ~Method + h2 pmix~h2 7 -2,890.21 5,795.05 213.96 g0~1 + g + session σ~Method + h2 pmix~h2 8 -2,889.86 5,796.54 215.45 g0~1 + t σ~Method + h2 pmix~h2 14 -2,883.11 5,796.68 215.59 g0~1 + t + session σ~Method + h2 pmix~h2 15 -2,883.10 5,799.03 217.94 g0~1 + Method + bk σ~Method + g 7 -2,892.68 5,799.99 218.90 g0~1 + Method σ~Method + h2 pmix~h2 7 -2,894.97 5,804.58 223.49 g0~1 σ~Method + h2 pmix~h2 6 -2,901.42 5,815.31 234.22
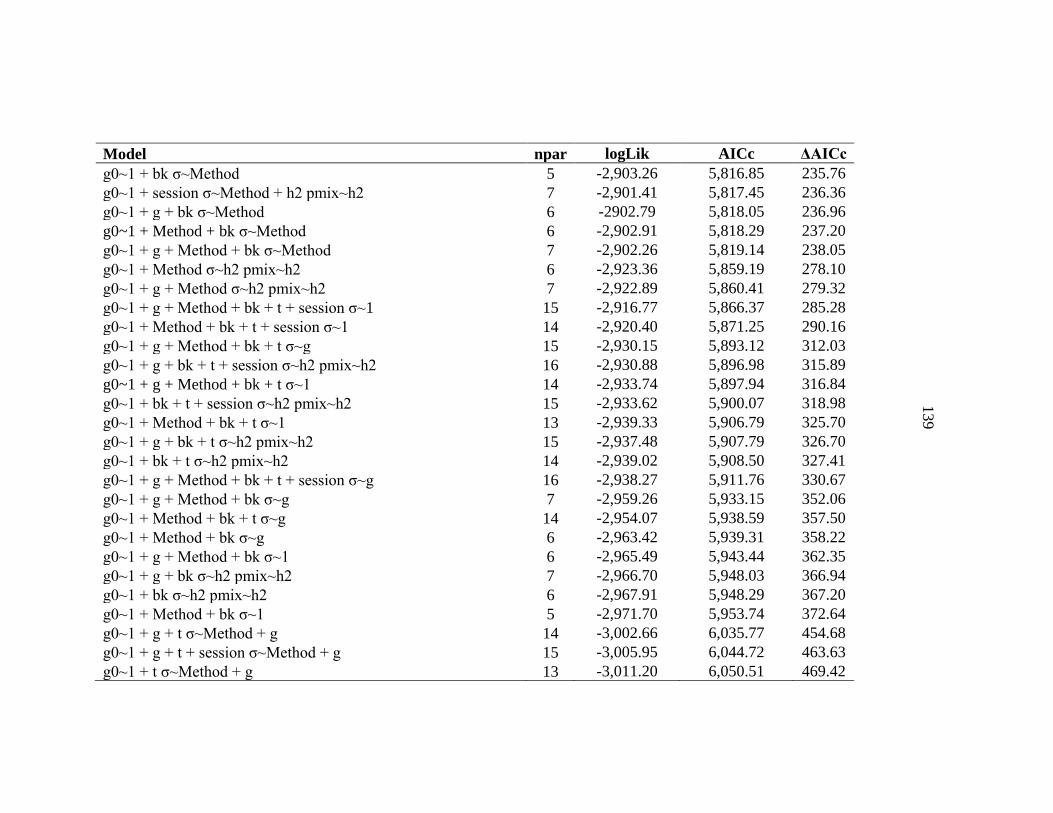
139
Model npar logLik AICc ΔAICc g0~1 + bk σ~Method 5 -2,903.26 5,816.85 235.76 g0~1 + session σ~Method + h2 pmix~h2 7 -2,901.41 5,817.45 236.36 g0~1 + g + bk σ~Method 6 -2902.79 5,818.05 236.96 g0~1 + Method + bk σ~Method 6 -2,902.91 5,818.29 237.20 g0~1 + g + Method + bk σ~Method 7 -2,902.26 5,819.14 238.05 g0~1 + Method σ~h2 pmix~h2 6 -2,923.36 5,859.19 278.10 g0~1 + g + Method σ~h2 pmix~h2 7 -2,922.89 5,860.41 279.32 g0~1 + g + Method + bk + t + session σ~1 15 -2,916.77 5,866.37 285.28 g0~1 + Method + bk + t + session σ~1 14 -2,920.40 5,871.25 290.16 g0~1 + g + Method + bk + t σ~g 15 -2,930.15 5,893.12 312.03 g0~1 + g + bk + t + session σ~h2 pmix~h2 16 -2,930.88 5,896.98 315.89 g0~1 + g + Method + bk + t σ~1 14 -2,933.74 5,897.94 316.84 g0~1 + bk + t + session σ~h2 pmix~h2 15 -2,933.62 5,900.07 318.98 g0~1 + Method + bk + t σ~1 13 -2,939.33 5,906.79 325.70 g0~1 + g + bk + t σ~h2 pmix~h2 15 -2,937.48 5,907.79 326.70 g0~1 + bk + t σ~h2 pmix~h2 14 -2,939.02 5,908.50 327.41 g0~1 + g + Method + bk + t + session σ~g 16 -2,938.27 5,911.76 330.67 g0~1 + g + Method + bk σ~g 7 -2,959.26 5,933.15 352.06 g0~1 + Method + bk + t σ~g 14 -2,954.07 5,938.59 357.50 g0~1 + Method + bk σ~g 6 -2,963.42 5,939.31 358.22 g0~1 + g + Method + bk σ~1 6 -2,965.49 5,943.44 362.35 g0~1 + g + bk σ~h2 pmix~h2 7 -2,966.70 5,948.03 366.94 g0~1 + bk σ~h2 pmix~h2 6 -2,967.91 5,948.29 367.20 g0~1 + Method + bk σ~1 5 -2,971.70 5,953.74 372.64 g0~1 + g + t σ~Method + g 14 -3,002.66 6,035.77 454.68 g0~1 + g + t + session σ~Method + g 15 -3,005.95 6,044.72 463.63 g0~1 + t σ~Method + g 13 -3,011.20 6,050.51 469.42
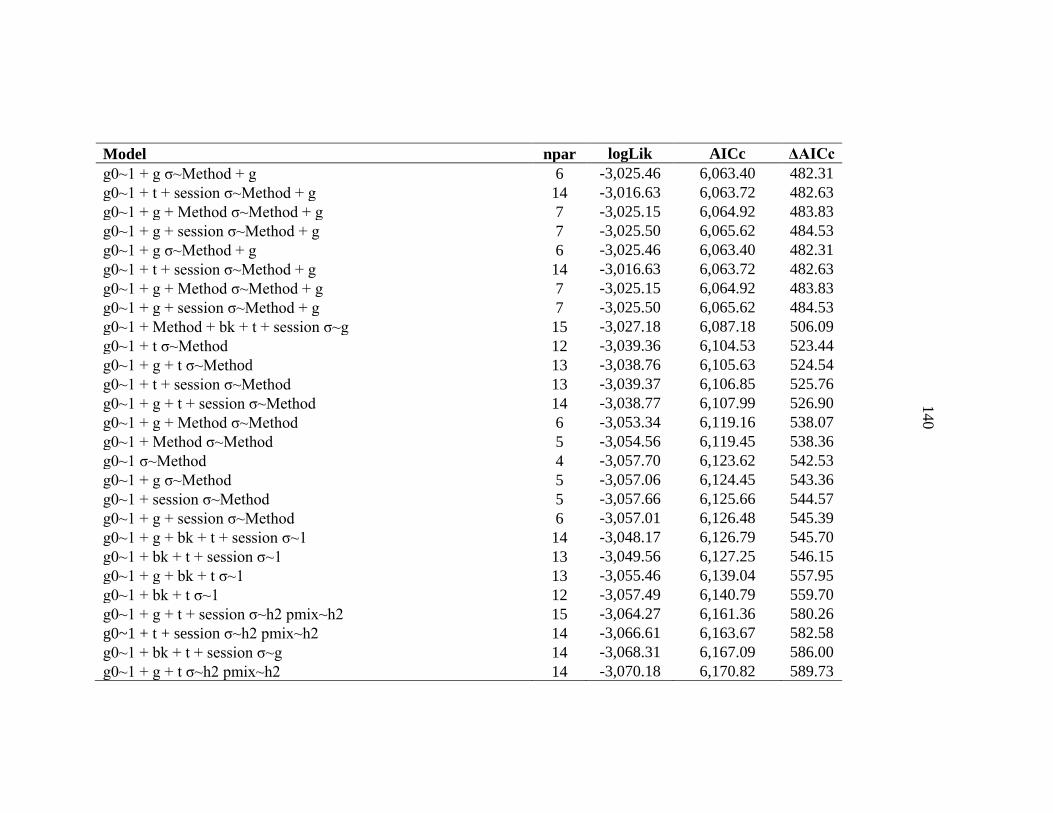
140
Model npar logLik AICc ΔAICc g0~1 + g σ~Method + g 6 -3,025.46 6,063.40 482.31 g0~1 + t + session σ~Method + g 14 -3,016.63 6,063.72 482.63 g0~1 + g + Method σ~Method + g 7 -3,025.15 6,064.92 483.83 g0~1 + g + session σ~Method + g 7 -3,025.50 6,065.62 484.53 g0~1 + g σ~Method + g 6 -3,025.46 6,063.40 482.31 g0~1 + t + session σ~Method + g 14 -3,016.63 6,063.72 482.63 g0~1 + g + Method σ~Method + g 7 -3,025.15 6,064.92 483.83 g0~1 + g + session σ~Method + g 7 -3,025.50 6,065.62 484.53 g0~1 + Method + bk + t + session σ~g 15 -3,027.18 6,087.18 506.09 g0~1 + t σ~Method 12 -3,039.36 6,104.53 523.44 g0~1 + g + t σ~Method 13 -3,038.76 6,105.63 524.54 g0~1 + t + session σ~Method 13 -3,039.37 6,106.85 525.76 g0~1 + g + t + session σ~Method 14 -3,038.77 6,107.99 526.90 g0~1 + g + Method σ~Method 6 -3,053.34 6,119.16 538.07 g0~1 + Method σ~Method 5 -3,054.56 6,119.45 538.36 g0~1 σ~Method 4 -3,057.70 6,123.62 542.53 g0~1 + g σ~Method 5 -3,057.06 6,124.45 543.36 g0~1 + session σ~Method 5 -3,057.66 6,125.66 544.57 g0~1 + g + session σ~Method 6 -3,057.01 6,126.48 545.39 g0~1 + g + bk + t + session σ~1 14 -3,048.17 6,126.79 545.70 g0~1 + bk + t + session σ~1 13 -3,049.56 6,127.25 546.15 g0~1 + g + bk + t σ~1 13 -3,055.46 6,139.04 557.95 g0~1 + bk + t σ~1 12 -3,057.49 6,140.79 559.70 g0~1 + g + t + session σ~h2 pmix~h2 15 -3,064.27 6,161.36 580.26 g0~1 + t + session σ~h2 pmix~h2 14 -3,066.61 6,163.67 582.58 g0~1 + bk + t + session σ~g 14 -3,068.31 6,167.09 586.00 g0~1 + g + t σ~h2 pmix~h2 14 -3,070.18 6,170.82 589.73
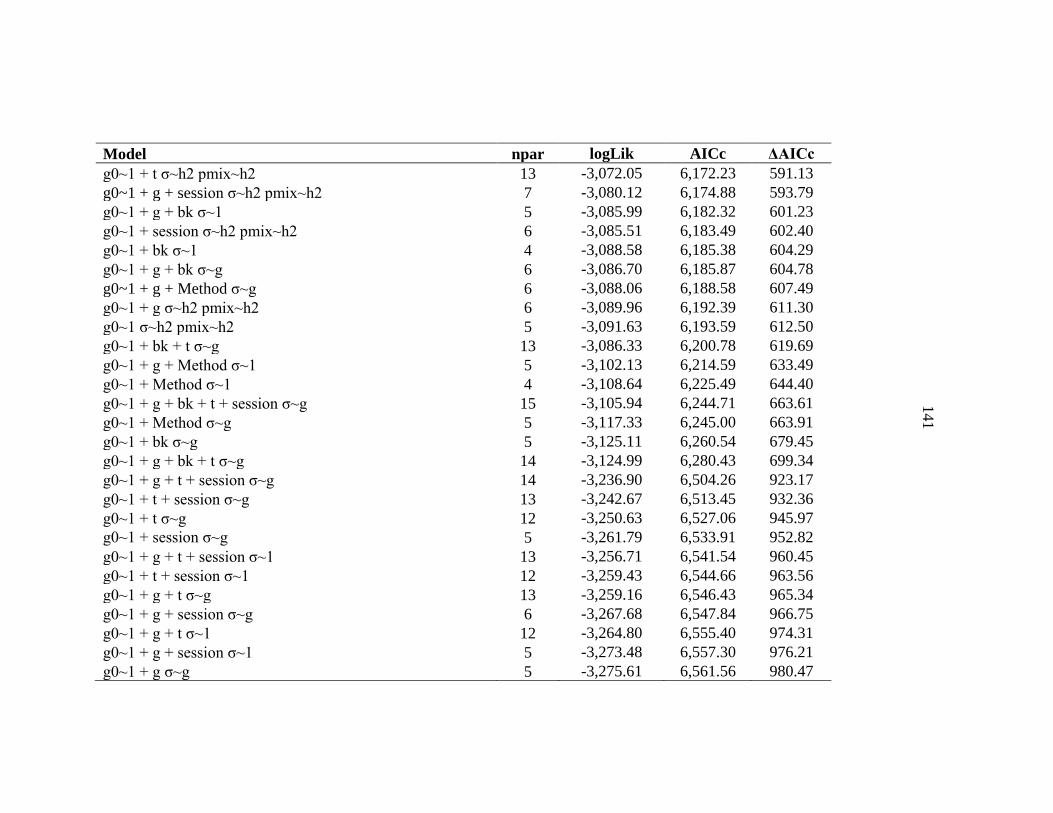
141
Model npar logLik AICc ΔAICc g0~1 + t σ~h2 pmix~h2 13 -3,072.05 6,172.23 591.13 g0~1 + g + session σ~h2 pmix~h2 7 -3,080.12 6,174.88 593.79 g0~1 + g + bk σ~1 5 -3,085.99 6,182.32 601.23 g0~1 + session σ~h2 pmix~h2 6 -3,085.51 6,183.49 602.40 g0~1 + bk σ~1 4 -3,088.58 6,185.38 604.29 g0~1 + g + bk σ~g 6 -3,086.70 6,185.87 604.78 g0~1 + g + Method σ~g 6 -3,088.06 6,188.58 607.49 g0~1 + g σ~h2 pmix~h2 6 -3,089.96 6,192.39 611.30 g0~1 σ~h2 pmix~h2 5 -3,091.63 6,193.59 612.50 g0~1 + bk + t σ~g 13 -3,086.33 6,200.78 619.69 g0~1 + g + Method σ~1 5 -3,102.13 6,214.59 633.49 g0~1 + Method σ~1 4 -3,108.64 6,225.49 644.40 g0~1 + g + bk + t + session σ~g 15 -3,105.94 6,244.71 663.61 g0~1 + Method σ~g 5 -3,117.33 6,245.00 663.91 g0~1 + bk σ~g 5 -3,125.11 6,260.54 679.45 g0~1 + g + bk + t σ~g 14 -3,124.99 6,280.43 699.34 g0~1 + g + t + session σ~g 14 -3,236.90 6,504.26 923.17 g0~1 + t + session σ~g 13 -3,242.67 6,513.45 932.36 g0~1 + t σ~g 12 -3,250.63 6,527.06 945.97 g0~1 + session σ~g 5 -3,261.79 6,533.91 952.82 g0~1 + g + t + session σ~1 13 -3,256.71 6,541.54 960.45 g0~1 + t + session σ~1 12 -3,259.43 6,544.66 963.56 g0~1 + g + t σ~g 13 -3,259.16 6,546.43 965.34 g0~1 + g + session σ~g 6 -3,267.68 6,547.84 966.75 g0~1 + g + t σ~1 12 -3,264.80 6,555.40 974.31 g0~1 + g + session σ~1 5 -3,273.48 6,557.30 976.21 g0~1 + g σ~g 5 -3,275.61 6,561.56 980.47
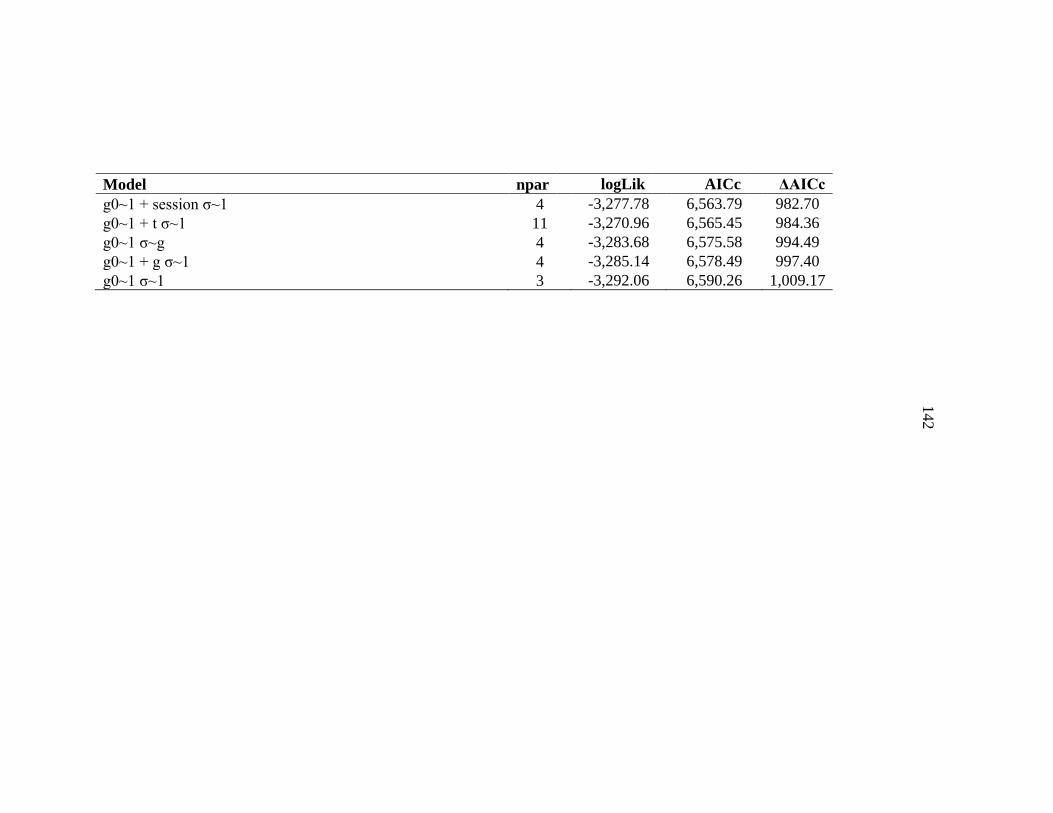
142
Model npar logLik AICc ΔAICc g0~1 + session σ~1 4 -3,277.78 6,563.79 982.70 g0~1 + t σ~1 11 -3,270.96 6,565.45 984.36 g0~1 σ~g 4 -3,283.68 6,575.58 994.49 g0~1 + g σ~1 4 -3,285.14 6,578.49 997.40 g0~1 σ~1 3 -3,292.06 6,590.26 1,009.17
143
APPENDIX D
HOME RANGE ESTIMATES FOR BLACK BEARS CAPTURED ON
YELLOWSTONE’S NORTHERN RANGE FROM 2014 - 2018
144
Home range estimates for black bears on Yellowstone National Park’s
Northern Range
Live Capture and Collaring
We captured 10 black bears (2 males, 8 females) using culvert traps from May to
October 2017 and May to June 2018 with the assistance of U. S. Geological Survey
(USGS) and National Park Service (NPS) personnel. Bears were chemically immobilized
using syringe jab poles, and handled following approved methods (MSU IACUC protocol
2017-24). We equipped 6 black bears (2 males, 6 females) with Iridium GPS collars and
2 female bears with VHF collars (Telonics, Inc., Mesa, AZ). The VHF active signal was
60 beats per minute (bpm) and the mortality signal was 30 bpm if the collar stopped
moving for >8 hours. During April 1–November 30, GPS collars were programmed to
record 1 location/hour in 2017 and 1 location/30 min in 2018. Locations were uploaded
to the Iridium satellite system every 8 hours. During hibernation (December 1–March
31), we saved battery life by recording only 1 GPS location/month and reducing the VHF
signal to 12 bpm. The GPS collars were fitted with a CR-5 collar release system
(Telonics, Inc., Mesa, AZ) programmed to release on 15 October 2018, so collars could
be retrieved from the field. We used cotton spacers as a secondary drop-off mechanism,
which would deteriorate over time causing the collar to drop from the bear if the drop off
mechanism failed (Hellgren et al. 1988). VHF collared bears were located, if possible,
weekly from the ground and additional locations were obtained from aerial flights on
occasion.
In addition, we used the GPS locations collected from 3 male black bears fitted
with GPS camera collars as part of a pilot study by NPS from 2014-2016. The camera
collars were programmed to record GPS locations every 20 minutes from 0600-2200, and
every hour from 2200 to 0600. The camera collars were fitted with remote drop-off
mechanism programed to release after 9 weeks, so collars could be retrieved from the
field. We again used cotton spacers as a secondary drop-off mechanism.
145
Home Range Estimates
We generated three different home range estimates for 13 black bears (5 males, 8
females) collared between 2014-2018 (Table D1): Minimum Convex Polygons (MCP),
Kernel Density Estimates (KDE), and Local Convex Hull (LoCoH), similar to other
studies of black bears in the Greater Yellowstone Area (Borger et al. 2006, Getz et al.
2007). Home ranges were estimated using the adhabitatHR package (Calenge 2006) in
program R (R Development Core Team 2013) for four different intervals: annual (April
1- October 20), spring (April 1 - June 30), summer (July 1 – August 20), and fall (August
20 – October 20). To be considered for each seasonal interval, bears had to be tracked for
at least half of the interval (Tables D2-5).
We calculated 95% MCP and 95% KDE as coarser estimates of home ranges and
LoCoH as a finer-scale estimate. Specifically, we used the adaptive or aLoCoH method,
which estimates the home range for an animal based on the maximum average distance
between ‘a’ number of points (Getz et al. 2007). We initially set a = 2 and subsequently
increased this value in increments of 0.5, until we generated the smallest estimated home
range for each individual that contained few to no polygon holes, which we inspected
visually in ArcMap (ArcGIS 2011, Bjornlie et al. 2014).
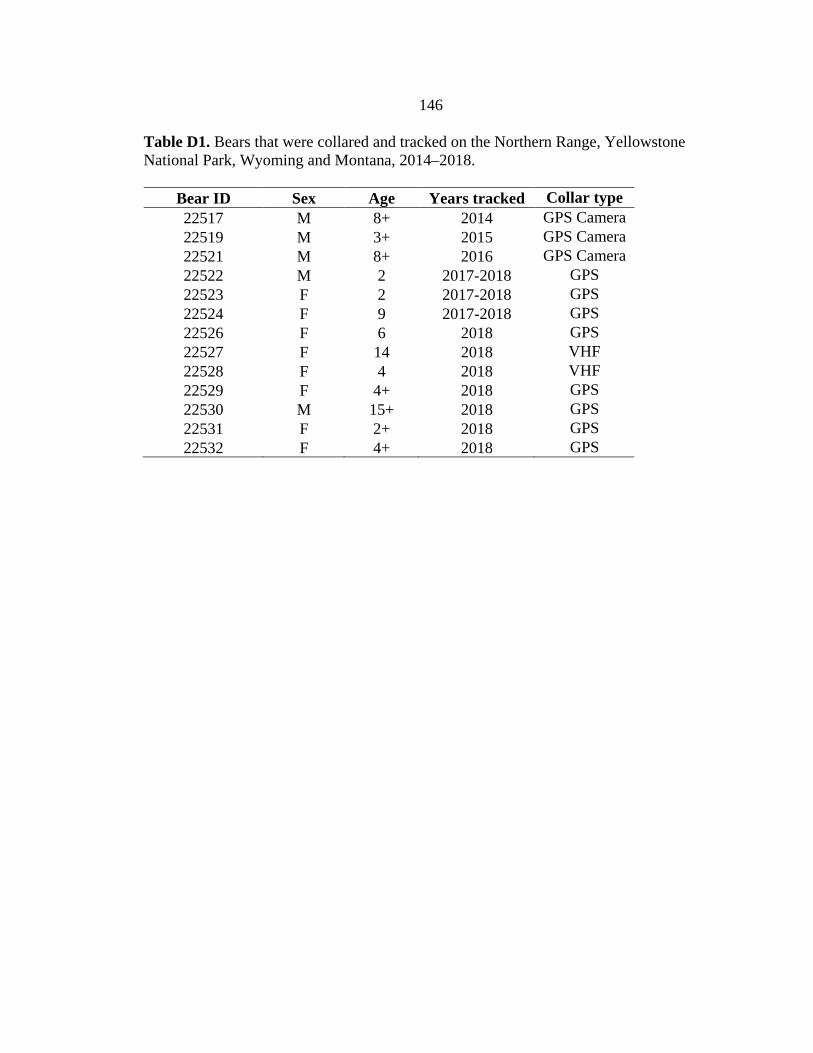
146
Table D1. Bears that were collared and tracked on the Northern Range, Yellowstone National Park, Wyoming and Montana, 2014–2018.
Bear ID Sex Age Years tracked Collar type 22517 M 8+ 2014 GPS Camera 22519 M 3+ 2015 GPS Camera 22521 M 8+ 2016 GPS Camera 22522 M 2 2017-2018 GPS 22523 F 2 2017-2018 GPS 22524 F 9 2017-2018 GPS 22526 F 6 2018 GPS 22527 F 14 2018 VHF 22528 F 4 2018 VHF 22529 F 4+ 2018 GPS 22530 M 15+ 2018 GPS 22531 F 2+ 2018 GPS 22532 F 4+ 2018 GPS
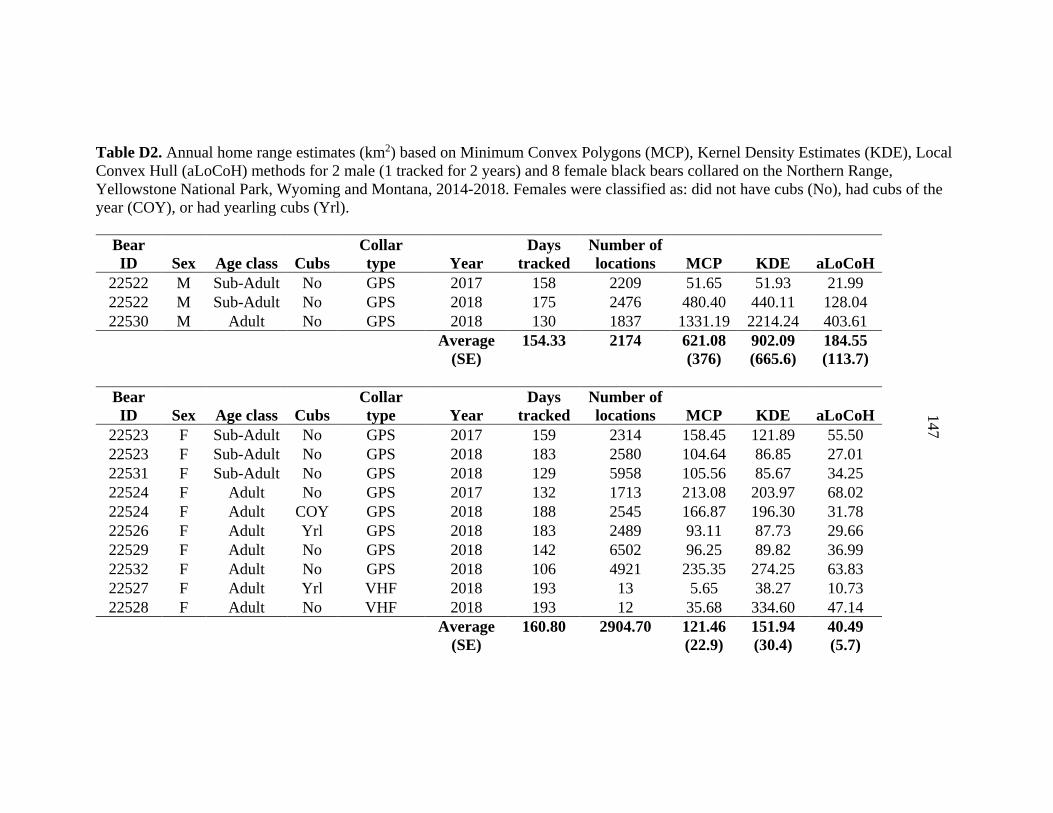
147
Table D2. Annual home range estimates (km2) based on Minimum Convex Polygons (MCP), Kernel Density Estimates (KDE), Local Convex Hull (aLoCoH) methods for 2 male (1 tracked for 2 years) and 8 female black bears collared on the Northern Range, Yellowstone National Park, Wyoming and Montana, 2014-2018. Females were classified as: did not have cubs (No), had cubs of the year (COY), or had yearling cubs (Yrl).
Bear ID Sex Age class Cubs
Collar type Year
Days tracked
Number of locations MCP KDE aLoCoH
22522 M Sub-Adult No GPS 2017 158 2209 51.65 51.93 21.99 22522 M Sub-Adult No GPS 2018 175 2476 480.40 440.11 128.04 22530 M Adult No GPS 2018 130 1837 1331.19 2214.24 403.61
Average
(SE) 154.33
2174
621.08 (376)
902.09 (665.6)
184.55 (113.7)
Bear ID Sex Age class Cubs
Collar type Year
Days tracked
Number of locations MCP KDE aLoCoH
22523 F Sub-Adult No GPS 2017 159 2314 158.45 121.89 55.50 22523 F Sub-Adult No GPS 2018 183 2580 104.64 86.85 27.01 22531 F Sub-Adult No GPS 2018 129 5958 105.56 85.67 34.25 22524 F Adult No GPS 2017 132 1713 213.08 203.97 68.02 22524 F Adult COY GPS 2018 188 2545 166.87 196.30 31.78 22526 F Adult Yrl GPS 2018 183 2489 93.11 87.73 29.66 22529 F Adult No GPS 2018 142 6502 96.25 89.82 36.99 22532 F Adult No GPS 2018 106 4921 235.35 274.25 63.83 22527 F Adult Yrl VHF 2018 193 13 5.65 38.27 10.73 22528 F Adult No VHF 2018 193 12 35.68 334.60 47.14
Average
(SE) 160.80
2904.70
121.46 (22.9)
151.94 (30.4)
40.49 (5.7)

148
Table D3. Spring home range estimates (km2) based on Minimum Convex Polygons (MCP), Kernel Density Estimates (KDE), Local Convex Hull (aLoCoH) methods for 4 male (1 tracked for 2 years) and 5 female black bears (2 tracked for 2 years) collared on the Northern Range, Yellowstone National Park, Wyoming and Montana, 2014-2018. Females were classified as: did not have cubs (No), had cubs of the year (COY), or had yearling cubs (Yrl).
Bear ID Sex Age class Cubs Collar type Year
Days tracked
Number of locations MCP KDE aLoCoH
22519 M Sub-adult No GPS Camera 2015 27 1539 696.98 1214.85 128.25 22522 M Sub-adult No GPS 2017 39 583 26.22 50.11 14.54 22522 M Sub-adult No GPS 2018 71 958 308.11 493.17 131.33 22521 M Adult No GPS Camera 2016 20 2257 99.25 149.35 39.52 22530 M Adult No GPS 2018 27 370 90.76 116.97 44.79
Average
(SE) 45.67
862.50
244.26 (122.7)
404.89 (216.6)
71.68 (24.3)
Bear ID Sex Age class Cubs Collar type Year
Days tracked
Number of locations MCP KDE aLoCoH
22523 F Sub-adult No GPS 2017 37 549 22.45 28.81 15.92 22523 F Sub-adult No GPS 2018 77 1089 14.13 17.71 10.72 22531 F Sub-adult No GPS 2018 22 1055 8.98 10.31 5.21 22524 F Adult No GPS 2017 28 421 34.04 40.56 23.58 22524 F Adult COY GPS 2018 84 1058 16.10 27.57 9.07 22526 F Adult Yrl GPS 2018 81 1016 8.45 11.76 6.18 22529 F Adult No GPS 2018 36 1670 38.48 55.69 18.96
Average
(SE) 52.14
979.71
20.38 (4.5)
27.49 (6.2)
12.81 (2.6)
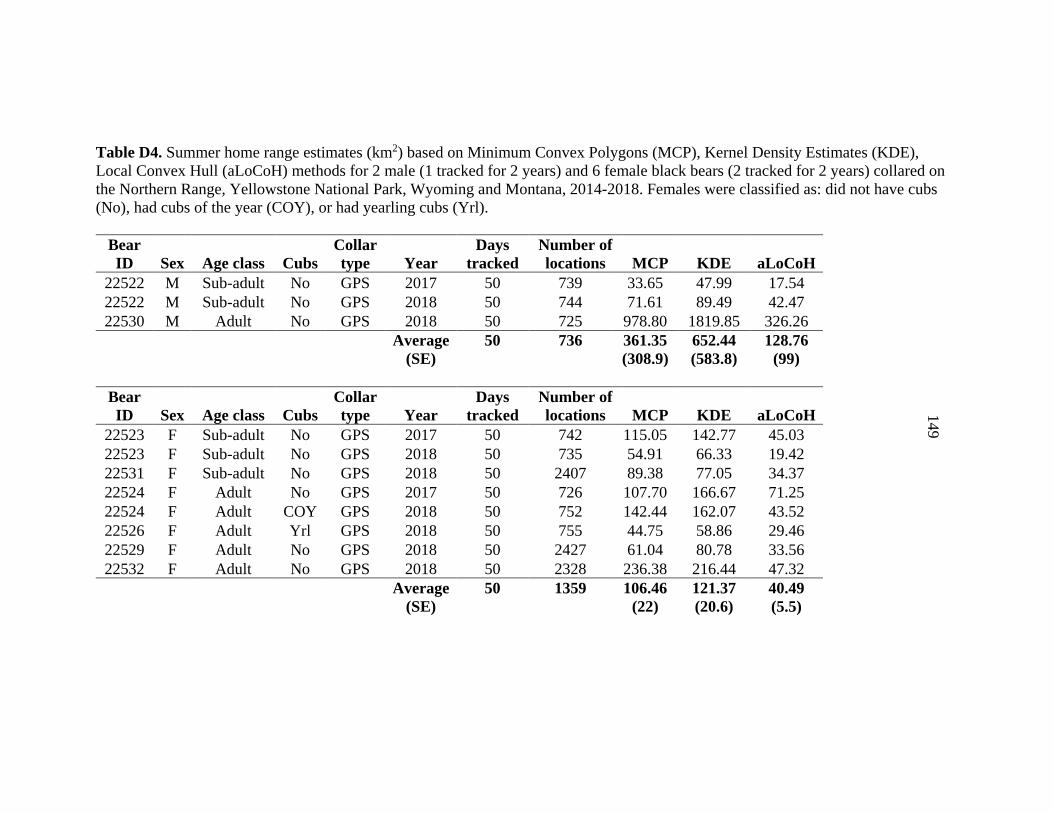
149
Table D4. Summer home range estimates (km2) based on Minimum Convex Polygons (MCP), Kernel Density Estimates (KDE), Local Convex Hull (aLoCoH) methods for 2 male (1 tracked for 2 years) and 6 female black bears (2 tracked for 2 years) collared on the Northern Range, Yellowstone National Park, Wyoming and Montana, 2014-2018. Females were classified as: did not have cubs (No), had cubs of the year (COY), or had yearling cubs (Yrl).
Bear ID Sex Age class Cubs
Collar type Year
Days tracked
Number of locations MCP KDE aLoCoH
22522 M Sub-adult No GPS 2017 50 739 33.65 47.99 17.54 22522 M Sub-adult No GPS 2018 50 744 71.61 89.49 42.47 22530 M Adult No GPS 2018 50 725 978.80 1819.85 326.26
Average
(SE) 50
736
361.35 (308.9)
652.44 (583.8)
128.76 (99)
Bear ID Sex Age class Cubs
Collar type Year
Days tracked
Number of locations MCP KDE aLoCoH
22523 F Sub-adult No GPS 2017 50 742 115.05 142.77 45.03 22523 F Sub-adult No GPS 2018 50 735 54.91 66.33 19.42 22531 F Sub-adult No GPS 2018 50 2407 89.38 77.05 34.37 22524 F Adult No GPS 2017 50 726 107.70 166.67 71.25 22524 F Adult COY GPS 2018 50 752 142.44 162.07 43.52 22526 F Adult Yrl GPS 2018 50 755 44.75 58.86 29.46 22529 F Adult No GPS 2018 50 2427 61.04 80.78 33.56 22532 F Adult No GPS 2018 50 2328 236.38 216.44 47.32
Average
(SE) 50
1359
106.46 (22)
121.37 (20.6)
40.49 (5.5)
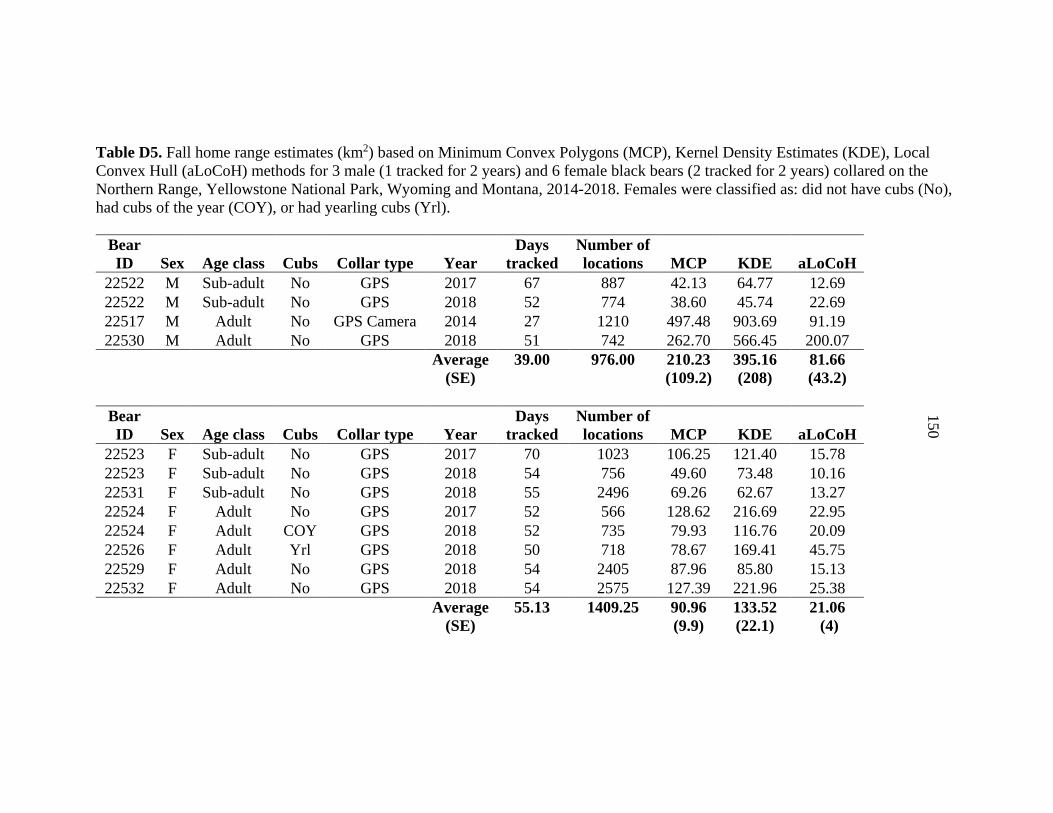
150
Table D5. Fall home range estimates (km2) based on Minimum Convex Polygons (MCP), Kernel Density Estimates (KDE), Local Convex Hull (aLoCoH) methods for 3 male (1 tracked for 2 years) and 6 female black bears (2 tracked for 2 years) collared on the Northern Range, Yellowstone National Park, Wyoming and Montana, 2014-2018. Females were classified as: did not have cubs (No), had cubs of the year (COY), or had yearling cubs (Yrl).
Bear ID Sex Age class Cubs Collar type Year
Days tracked
Number of locations MCP KDE aLoCoH
22522 M Sub-adult No GPS 2017 67 887 42.13 64.77 12.69 22522 M Sub-adult No GPS 2018 52 774 38.60 45.74 22.69 22517 M Adult No GPS Camera 2014 27 1210 497.48 903.69 91.19 22530 M Adult No GPS 2018 51 742 262.70 566.45 200.07
Average
(SE) 39.00
976.00
210.23 (109.2)
395.16 (208)
81.66 (43.2)
Bear ID Sex Age class Cubs Collar type Year
Days tracked
Number of locations MCP KDE aLoCoH
22523 F Sub-adult No GPS 2017 70 1023 106.25 121.40 15.78 22523 F Sub-adult No GPS 2018 54 756 49.60 73.48 10.16 22531 F Sub-adult No GPS 2018 55 2496 69.26 62.67 13.27 22524 F Adult No GPS 2017 52 566 128.62 216.69 22.95 22524 F Adult COY GPS 2018 52 735 79.93 116.76 20.09 22526 F Adult Yrl GPS 2018 50 718 78.67 169.41 45.75 22529 F Adult No GPS 2018 54 2405 87.96 85.80 15.13 22532 F Adult No GPS 2018 54 2575 127.39 221.96 25.38
Average
(SE) 55.13
1409.25
90.96 (9.9)
133.52 (22.1)
21.06 (4)
151
LITERATURE CITED
ArcGIS, E. 2011. Release 10. Desktop, ESRI ArcGIS. Environmental Systems Research Institute, Redlands, CA.
Borger, L., N. Franconi, G. De Michele, A. Gantz, F. Meschi, A. Manica, S. Lovari, and T. Coulson. 2006. Effects of sampling regime on the mean and variance of home range size estimates. Journal of Animal Ecology 75:1393–1405.
Calenge, C. 2006. The package “adehabitat” for the R software: a tool for the analysis of space and habitat use by animals. Ecological modelling 197:516–519.
Getz, W. M., S. Fortmann-Roe, P. C. Cross, A. J. Lyons, S. J. Ryan, and C. C. Wilmers. 2007. LoCoH: Nonparameteric kernel methods for constructing home ranges and utilization distributions. PLoS ONE 2.
Hellgren, E. C., D. W. Carney, N. P. Garner, and M. R. Vaughan. 1988. Use of breakaway cotton spacers on radio collars. Wildlife Society Bulletin 16:216–218.
R Development Core Team. 2013. R: A language and environment for statistical computing. R Foundation for Statistical Computing. Vienna, Austria.
152
APPENDIX E
DETECTIONS OF BLACK BEARS WITH DIFFERENT SCENT LURES USED AT
HAIR SNARE SITES ON YELLOWSTONE’S NORTHERN RANGE
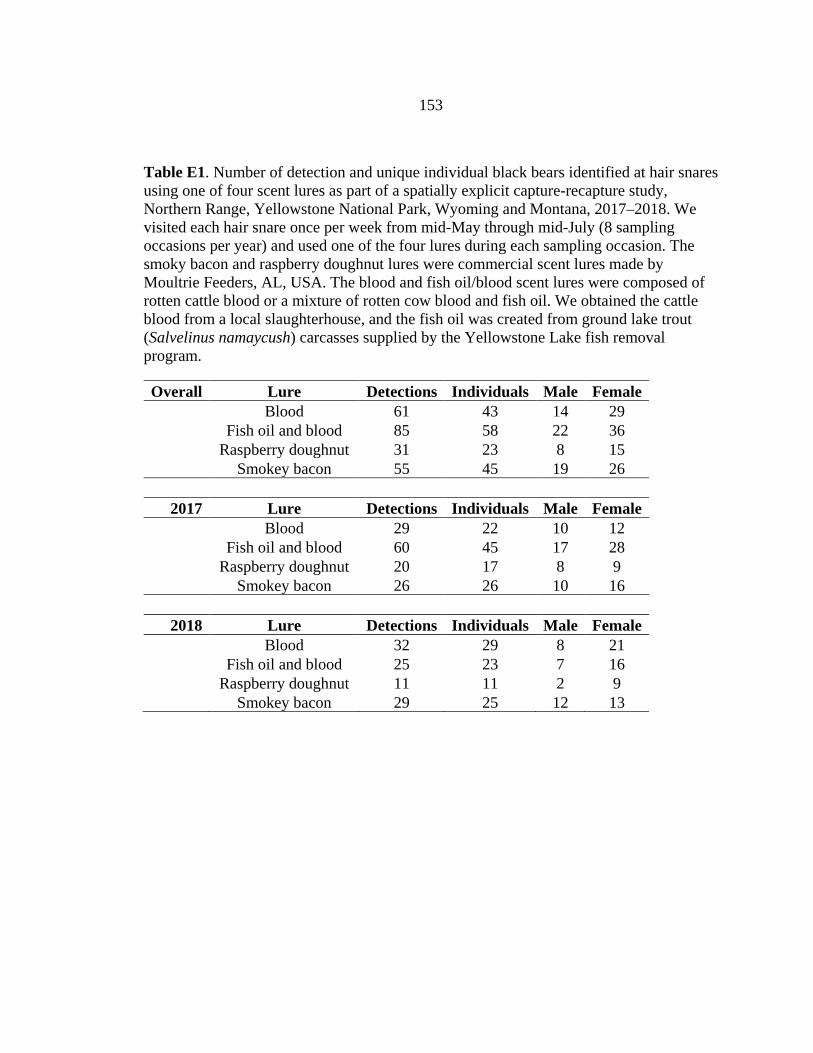
153
Table E1. Number of detection and unique individual black bears identified at hair snares using one of four scent lures as part of a spatially explicit capture-recapture study, Northern Range, Yellowstone National Park, Wyoming and Montana, 2017–2018. We visited each hair snare once per week from mid-May through mid-July (8 sampling occasions per year) and used one of the four lures during each sampling occasion. The smoky bacon and raspberry doughnut lures were commercial scent lures made by Moultrie Feeders, AL, USA. The blood and fish oil/blood scent lures were composed of rotten cattle blood or a mixture of rotten cow blood and fish oil. We obtained the cattle blood from a local slaughterhouse, and the fish oil was created from ground lake trout (Salvelinus namaycush) carcasses supplied by the Yellowstone Lake fish removal program.
Overall Lure Detections Individuals Male Female Blood 61 43 14 29
Fish oil and blood 85 58 22 36 Raspberry doughnut 31 23 8 15
Smokey bacon 55 45 19 26
2017 Lure Detections Individuals Male Female Blood 29 22 10 12
Fish oil and blood 60 45 17 28 Raspberry doughnut 20 17 8 9
Smokey bacon 26 26 10 16
2018 Lure Detections Individuals Male Female Blood 32 29 8 21
Fish oil and blood 25 23 7 16 Raspberry doughnut 11 11 2 9
Smokey bacon 29 25 12 13