Embed Size (px)
Citation preview

7/27/2019 SPD Traffic Stop Results
http://slidepdf.com/reader/full/spd-traffic-stop-results 1/23
7/27/2019 SPD Traffic Stop Results
http://slidepdf.com/reader/full/spd-traffic-stop-results 2/23
7/27/2019 SPD Traffic Stop Results
http://slidepdf.com/reader/full/spd-traffic-stop-results 3/23
2
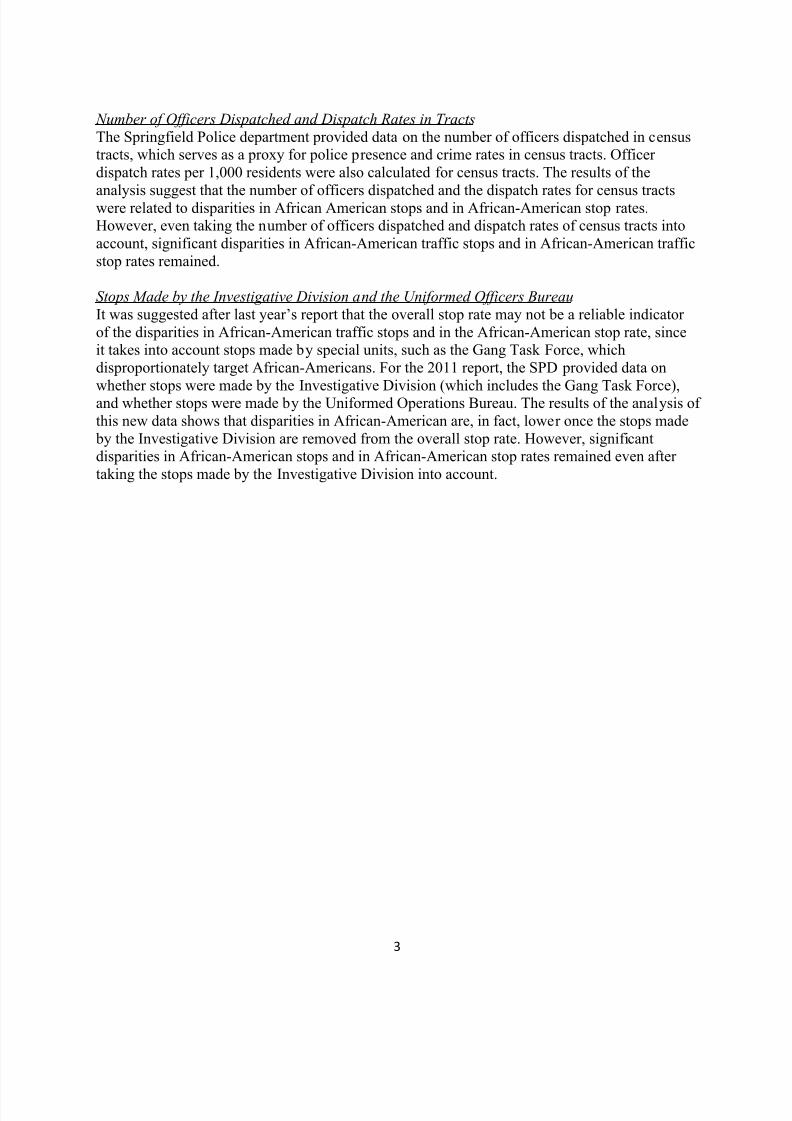
Executive Summary This report summarizes the results of an analysis of racial disparities in stops, searches, arrests,and contraband hits for the city of Springfield, Missouri in 2011.
Disparities in Stops, Searches, Arrests, and Contraband Hits
The results suggest that there are substantial race disparities in traffic stops in Springfield.African Americans were disproportionately stopped according to all three of the indicators thatwere examined (percent of stops, stop rate, and stop disparity).
There also appears to be substantial race disparities in search rates in Springfield. All threeindicators suggest that there are substantial disparities in search rates for African Americans, andtwo out of three indicators suggest there are disparities in search rates for Hispanics.
The data also revealed substantial race disparities in traffic stops that resulted in arrests in thecity. All three indicators suggest that traffic stops were more likely to result in arrests for AfricanAmericans. Two of the indicators suggest that traffic stops were more likely to result in arrests
for Hispanics.
There did not appear to be substantial race/ethnic disparities in contraband hit rates. AfricanAmericans had a contraband hit rate that was about equal to the city average, and the contrabandhit rate for Hispanics was about substantially lower than the city average.
Disparities in Reasons for Stop and Stop Outcomes
The data suggest that there are substantial race/ethnic disparities in the reasons given for trafficstops. Specifically, African Americans were substantially overrepresented (and whites weresubstantially underrepresented) in the percentage of traffic stops that were for investigativereasons. There was not much evidence of substantial race disparities in stop outcomes, in termsof whether there was a citation or a warning issued, or whether there was no action taken.
Disparities in Probable Cause/Authority to Search
There were substantial race/ethnic disparities in the reasons given for searches during trafficstops. The data show that the greatest disparities in probable cause/authority to search rates are inthe Hispanic population. However, there is also evidence of substantial disparities for whites and blacks as well.
Disparities in Traffic Stop Arrest ChargesAfrican Americans were substantially overrepresented in terms of being charged with offenseagainst person, resisting arrest, and traffic violations. Hispanics were overrepresented in terms of their charges for resisting arrest, traffic violations, DWI, and property offense.
The Socioeconomic and Racial Characteristics of Tracts
The results suggest that the socioeconomic (measured as average property values in tracts) andracial characteristics (measured as percent of residents who are non-white) of census tracts arerelated to disparities in African American traffic stops and in African-American stop rates.However, even taking the socioeconomic characteristics of census tracts into account, significantdisparities in African-American traffic stops and in African-American traffic stop rates remained.
7/27/2019 SPD Traffic Stop Results
http://slidepdf.com/reader/full/spd-traffic-stop-results 4/23
3
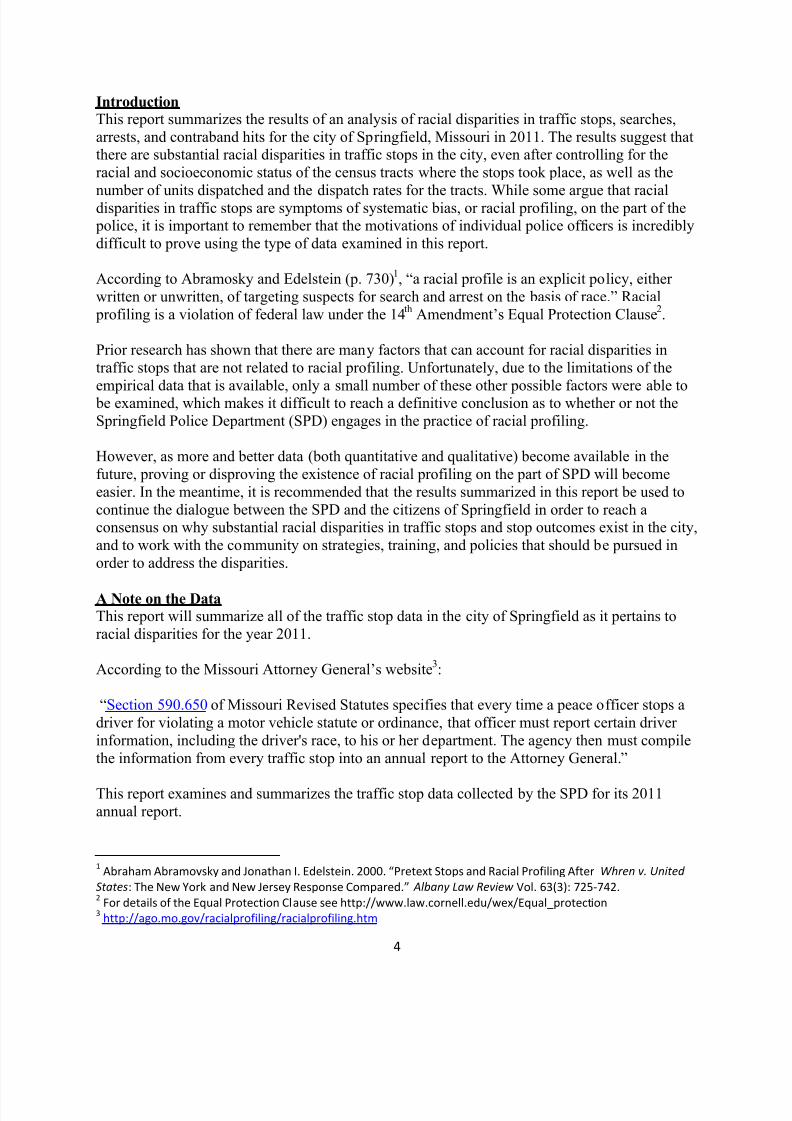
Number of Officers Dispatched and Dispatch Rates in Tracts The Springfield Police department provided data on the number of officers dispatched in censustracts, which serves as a proxy for police presence and crime rates in census tracts. Officer dispatch rates per 1,000 residents were also calculated for census tracts. The results of the
analysis suggest that the number of officers dispatched and the dispatch rates for census tractswere related to disparities in African American stops and in African-American stop rates.However, even taking the number of officers dispatched and dispatch rates of census tracts intoaccount, significant disparities in African-American traffic stops and in African-American trafficstop rates remained.
Stops Made by the Investigative Division and the Uniformed Officers Bureau
It was suggested after last year’s report that the overall stop rate may not be a reliable indicator of the disparities in African-American traffic stops and in the African-American stop rate, sinceit takes into account stops made by special units, such as the Gang Task Force, whichdisproportionately target African-Americans. For the 2011 report, the SPD provided data on
whether stops were made by the Investigative Division (which includes the Gang Task Force),and whether stops were made by the Uniformed Operations Bureau. The results of the analysis of this new data shows that disparities in African-American are, in fact, lower once the stops made by the Investigative Division are removed from the overall stop rate. However, significantdisparities in African-American stops and in African-American stop rates remained even after taking the stops made by the Investigative Division into account.
7/27/2019 SPD Traffic Stop Results
http://slidepdf.com/reader/full/spd-traffic-stop-results 5/23
4
Introduction This report summarizes the results of an analysis of racial disparities in traffic stops, searches,arrests, and contraband hits for the city of Springfield, Missouri in 2011. The results suggest thatthere are substantial racial disparities in traffic stops in the city, even after controlling for theracial and socioeconomic status of the census tracts where the stops took place, as well as the
number of units dispatched and the dispatch rates for the tracts. While some argue that racialdisparities in traffic stops are symptoms of systematic bias, or racial profiling, on the part of the police, it is important to remember that the motivations of individual police officers is incrediblydifficult to prove using the type of data examined in this report.
According to Abramosky and Edelstein (p. 730)1, “a racial profile is an explicit policy, either
written or unwritten, of targeting suspects for search and arrest on the basis of race.” Racial
profiling is a violation of federal law under the 14th Amendment’s Equal Protection Clause2.
Prior research has shown that there are many factors that can account for racial disparities intraffic stops that are not related to racial profiling. Unfortunately, due to the limitations of the
empirical data that is available, only a small number of these other possible factors were able to be examined, which makes it difficult to reach a definitive conclusion as to whether or not theSpringfield Police Department (SPD) engages in the practice of racial profiling.
However, as more and better data (both quantitative and qualitative) become available in thefuture, proving or disproving the existence of racial profiling on the part of SPD will becomeeasier. In the meantime, it is recommended that the results summarized in this report be used tocontinue the dialogue between the SPD and the citizens of Springfield in order to reach aconsensus on why substantial racial disparities in traffic stops and stop outcomes exist in the city,and to work with the community on strategies, training, and policies that should be pursued inorder to address the disparities.
A Note on the DataThis report will summarize all of the traffic stop data in the city of Springfield as it pertains toracial disparities for the year 2011.
According to the Missouri Attorney General’s website3:
“Section 590.650 of Missouri Revised Statutes specifies that every time a peace officer stops adriver for violating a motor vehicle statute or ordinance, that officer must report certain driver information, including the driver's race, to his or her department. The agency then must compilethe information from every traffic stop into an annual report to the Attorney General.”
This report examines and summarizes the traffic stop data collected by the SPD for its 2011annual report.
1 Abraham Abramovsky and Jonathan I. Edelstein. 2000. “Pretext Stops and Racial Profiling After Whren v. United
States: The New York and New Jersey Response Compared.” Albany Law Review Vol. 63(3): 725-742.2
For details of the Equal Protection Clause see http://www.law.cornell.edu/wex/Equal_protection3 http://ago.mo.gov/racialprofiling/racialprofiling.htm
7/27/2019 SPD Traffic Stop Results
http://slidepdf.com/reader/full/spd-traffic-stop-results 6/23
5
How is race measured?In the state of Missouri the race of the driver must be determined and recorded by the policeofficer making the stop, not by the operator of the vehicle. According to the Missouri AttorneyGeneral’s website
4, there are two reasons for this:
1.
If an officer is profiling based on race, that officer is deciding to pull the driver over based on the officer's perception of that driver's race.2. If the officer questions the driver about his race, the driver may become
confrontational or think his rights are being violated.
Using Census Data as a Benchmark In order to try to explain the racial disparities in traffic stops in the city of Springfield thisanalysis takes into account some of the contextual characteristics of the neighborhoods that thestops occur in. For the purposes of this study, census tracts were used to delineate the geographic boundaries of neighborhoods in the city. Specifically, the analysis examines whether thesocioeconomic and racial characteristics of the census tracts where a stop occurs is related to
racial disparities in traffic stops. Additionally, the SPD provided information on the number of units dispatched per census tract, and whether the stop was made by an officer from the SPDInvestigative Division (ID), or the Uniformed Officers Bureau (UOB). This information wasused as a proxy to determine whether there was an association between greater police presence ina census tract and race/ethnic disparities in traffic stops, and whether race/ethnic disparities wereassociated with targeted efforts by the IU and the UOB.
Weakness of Using Census Data as Benchmark:Census data measures the residential population of a given area. Whether the driving populationof the same area shares the demographic profile of the residential population is an importantconcern. Surveys of transportation and vehicle-ownership rates have suggested that the minoritydriving population may be significantly different from the minority residential population in astate or locality5.
In an effort to account for some of the weaknesses in using census data, this report looks only atthe segment of the city’s population that is 16 years of age and older. However, while this may provide a somewhat more reliable estimate of the driving population for a given area of the city,there are still important two significant weaknesses that must be mentioned:
First, just because someone is over the age of 16 does not necessarily mean that they have adriver’s license or a car. Ideally, benchmark data for racial profiling as it relates to traffic stops
would take into account the driving population. However, the Missouri Department of Motor Vehicles does not include race when administering driver’s licenses, so that information wasunavailable for this study.
Second, comparing data on traffic stops to the population of potential licensed drivers in the citydoes not take into account the differential rates at which minorities and whites travel through
4 http://ago.mo.gov/racialprofiling/vehiclestopfaqs.htm
5 Michael R. Smith and Geoffrey P. Alpert. 2002. “Searching for Direction: Courts, Social Science, and the
Adjudication of Racial Profiling Claims.” Justice Quarterly Vol. 19(4): 673-303.
7/27/2019 SPD Traffic Stop Results
http://slidepdf.com/reader/full/spd-traffic-stop-results 7/23
6
different areas of the city6. So, the characteristics of drivers in a given area do not necessarilyreflect the characteristics of the residential population in that area.
With these limitations in mind, the results of an analysis of racial disparities in traffic stops inSpringfield is examined in detail below.
Part I: Disparities in Stops, Searches, Arrests, and Contraband Hits
Table 1. City of Springfield 2011 Racial Disparities in Vehicle Stops, Searches, Arrests, andContraband Hits7
Key Indicators Total White Black Hispanic AsianAm.
Indian Other
Population 16+ 133,416 120,361 5,082 4,076 2,588 1,018 4,367Percent of population 16+ 100 90.21 3.81 3.06 1.94 0.76 3.27
Stops 27,518 23,974 2,513 512 340 31 148Stop percent 100 87.12 9.13 1.86 1.24 0.11 0.54Stop rate 20.63 19.92 49.45 12.56 13.14 3.05 3.39
Stops disparity index N/A 0.97 2.40 0.61 0.64 0.15 0.16Searches 3,486 2,796 576 84 18 2 10Search percent 100 80.21 16.52 2.41 0.52 0.06 0.29Search rate 12.51 11.32 21.92 15.88 5.06 6.25 6.41Search disparity index N/A 0.92 1.81 1.30 0.42 0.51 0.53
Arrests 1,922 1,546 300 54 15 0 7Arrest percent 100 80.44 15.61 2.81 0.78 0.00 0.36Arrest rate 6.90 6.26 11.42 10.21 4.21 0 4.49Arrest rate disparity index N/A 0.92 1.71 1.51 0.63 0.00 0.68
Contraband 729 587 126 12 3 0 1Contraband percent 100 80.52 17.28 1.65 0.41 0.00 0.14Contraband hit rate 20.91 20.99 21.88 14.29 16.67 0 10Contraband disparity index N/A 1.00 1.05 0.68 0.80 0.00 0.48
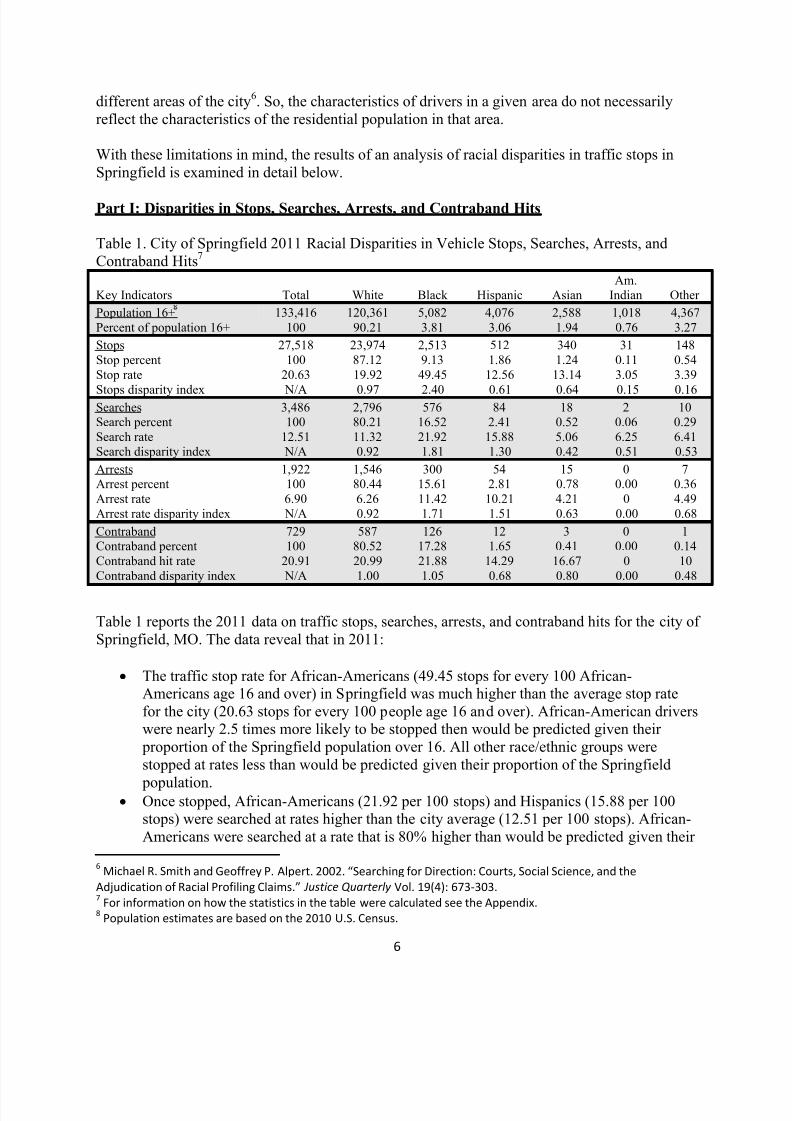
Table 1 reports the 2011 data on traffic stops, searches, arrests, and contraband hits for the city of Springfield, MO. The data reveal that in 2011:
The traffic stop rate for African-Americans (49.45 stops for every 100 African-Americans age 16 and over) in Springfield was much higher than the average stop ratefor the city (20.63 stops for every 100 people age 16 and over). African-American driverswere nearly 2.5 times more likely to be stopped then would be predicted given their proportion of the Springfield population over 16. All other race/ethnic groups werestopped at rates less than would be predicted given their proportion of the Springfield
population. Once stopped, African-Americans (21.92 per 100 stops) and Hispanics (15.88 per 100
stops) were searched at rates higher than the city average (12.51 per 100 stops). African-Americans were searched at a rate that is 80% higher than would be predicted given their
6Michael R. Smith and Geoffrey P. Alpert. 2002. “Searching for Direction: Courts, Social Science, and the
Adjudication of Racial Profiling Claims.” Justice Quarterly Vol. 19(4): 673-303.7
For information on how the statistics in the table were calculated see the Appendix.8
Population estimates are based on the 2010 U.S. Census.
7/27/2019 SPD Traffic Stop Results
http://slidepdf.com/reader/full/spd-traffic-stop-results 8/23
7
proportion of all stops, and Hispanics were searched at a rate that is 30% higher thanwould be predicted given their proportion of all stops.
Traffic stop arrest rates were also higher than the city average (6.90 per 100 stops) for African-Americans (11.42 per 100 stops) and Hispanics (10.21 per 100 stops). African-American stops resulted in arrest 71% more of the time than would be predicted based on
their proportion of stops, and Hispanic stops resulted in arrest 51% more of the time thanwould be predicted based on their proportion of stops.
The contraband hit rate for Hispanics (14.29 per 100 searches) was lower than theaverage contraband hit rate for the city (20.98 per 100 searches). Searches resulting incontraband hits were 38% lower for Hispanics than would be predicted given their proportion of all searches. The contraband hit rate for African-Americans was very closeto the average contraband hit rate for the city.
Part II: Reason for Stop and Stop Outcome
Table 2. City of Springfield 2011 Racial/Ethnic Disparities in Reasons for Vehicle Stops9
Vehicle Stop Stats Total White Black Hispanic AsianAm.
Indian Other
Reasonfor stop
Moving violation10 12,250 10,761 947 245 211 15 71
Moving violation percent 100 87.85 7.73 2.00 1.72 0.12 0.58
Moving violation rate 43.15 43.58 36.04 46.31 59.27 46.88 45.51
Moving disparity index N/A 1.01 0.85 1.08 1.39 1.09 1.08
Equipment violation11 5,003 4,303 513 104 58 3 22
Moving violation percent 100 86.01 10.25 2.08 1.16 0.06 0.44
Equipment violation rate 17.62 17.43 19.52 19.66 16.29 9.38 14.10
Disparity equipment N/A 0.99 1.12 1.12 0.94 0.53 0.82
License violation 10,236 8,925 1,007 153 79 12 60
License violation percent 100 87.19 9.32 1.49 0.77 0.12 0.59
License violation rate 36.05 36.15 38.32 28.92 22.19 37.5 38.46
License disparity index N/A 1.00 1.08 0.80 0.63 1.04 1.09
Investigative stops 902 701 161 27 8 2 3
Investigative stop percent 100 77.72 17.85 2.99 0.89 0.22 0.33
Investigative stop rate 3.18 2.84 6.13 6.82 2.25 6.25 1.92
Investigative disparity index N/A 0.89 1.95 1.61 0.72 1.97 0.62
9For information on how the statistics in the table were calculated see the Appendix.
10
Moving violations -- driving the wrong way on a one way street, speeding, any type of stop sign or signal violation, failing toyield to emergency vehicle, failing to stop for a school bus, driving on the sidewalk, passing violation, careless and imprudentdriving, etc.11 Equipment violations – headlight violations, taillight violations, motorcycle driver with no helmet, obstructed view, etc.12 License violations – a vehicle displaying no license plate, license plates that don’t check to that vehicle, license plates thatdon’t display a current annual registration tab, license plates displayed incorrectly, etc.13 Investigative stops – stops related to a crime where an officer has reason to believe the vehicle or driver was involved in acrime, stops where an officer has reason to believe the driver has no driver’s license (personal knowledge or an MDT check whilemoving), stops where an officer has reason to believe the driver or occupants have a warrant (personal knowledge or an MDTcheck on the plate while moving), etc.
7/27/2019 SPD Traffic Stop Results
http://slidepdf.com/reader/full/spd-traffic-stop-results 9/23
8
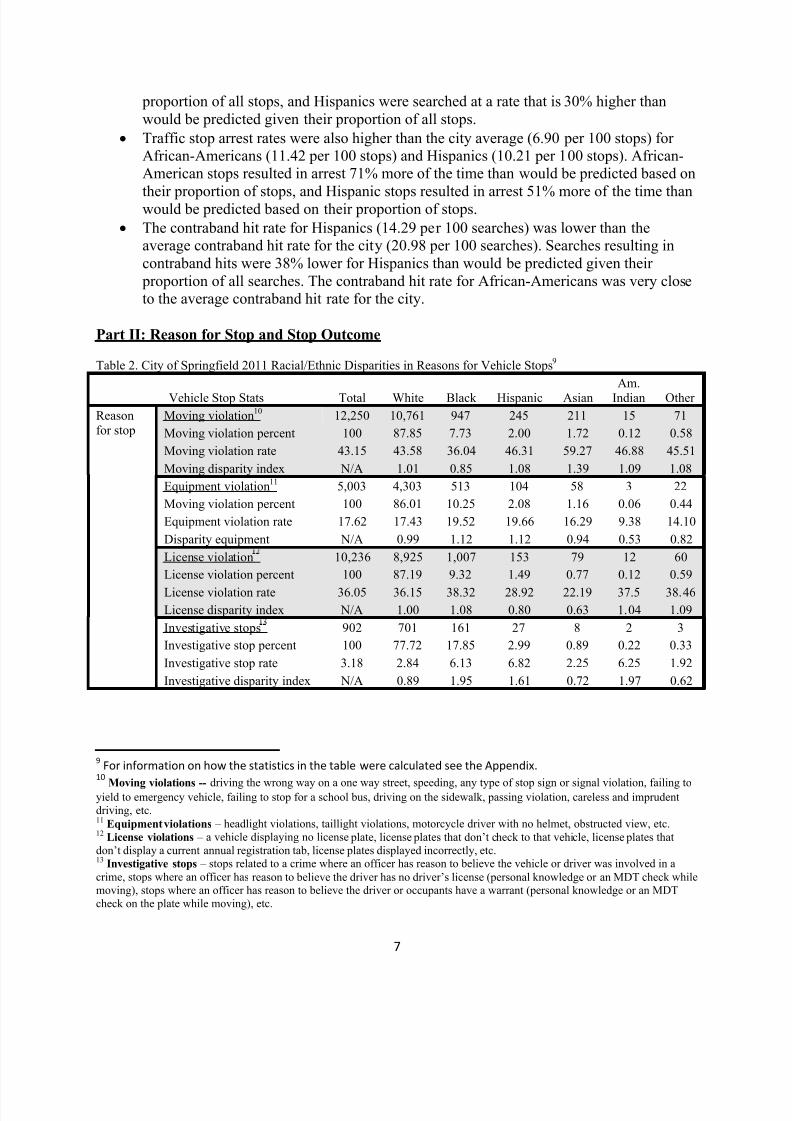
Table 2 reports the data on reasons for traffic stops in 2011. The data reveal that:
The moving violation rate for African-Americans (36.04 per 100 stops) was lower thanthe citywide average (43.15 per 100 stops). African-Americans were 15% less likely to
be stopped for moving violations than would be predicted given their proportion of allstops. The moving violation rate for Asians (59.27 per 100 stops) was higher than thecitywide average. For Asians, the proportion of stops due to moving violations was 39%higher than would be predicted given their overall proportion of stops.
African-Americans (19.52 per 100 stops) and Hispanics (19.66 per 100 stops) werestopped for equipment violations at rates that were somewhat higher than the citywideaverage (17.62 per 100 stops). Both groups were 12% more likely to be stopped for equipment violations than would be predicted given their overall proportion of stops.
Hispanics (28.92 per 100 stops) and Asians (22.19) were stopped due to licenseviolations at rates that were lower than the citywide average (36.05 per 100).
African-Americans (6.13 per 100 stops) and Hispanics (6.82 per 100 stops) were stopped
for investigative reasons at rates that were nearly double the citywide average (3.18 per 100). African-Americans were stopped for investigative reasons at a rate that was 95%higher than would be predicted given their proportion of all traffic stops, and Hispanicswere stopped for investigative reasons at a rate that was 61% higher than would be predicted given their proportion of all traffic stops.
Part III: Probable Cause/Authority to Search
Table 3. City of Springfield 2011 Racial Ethnic Disparities in Vehicle Stop Outcomes 14
Stopoutcome
Citation 11,821 10,406 983 225 143 15 49
Citation percent 100 88.03 8.32 1.90 1.21 0.13 0.42
Citation rate 41.64 42.15 37.40 42.53 40.17 46.88 31.41
Citation disparity index N/A 1.01 0.91 1.02 0.98 1.13 0.77
Warning 12,195 10,612 1,120 220 159 12 72
Warning percent 100 87.02 9.18 1.80 1.30 0.10 0.59
Warning rate 46.15 42.98 42.62 41.59 44.66 37.50 46.15
Warning disparity index N/A 1.00 1.01 0.97 1.06 0.87 1.10
No action 3,978 3,386 440 73 45 4 30
No action percent 100 85.12 11.06 1.84 1.13 0.10 0.75
No action rate 14.01 13.71 16.74 13.80 12.64 12.5 19.23
No action disparity index N/A 0.98 1.21 0.98 0.92 0.89 1.40
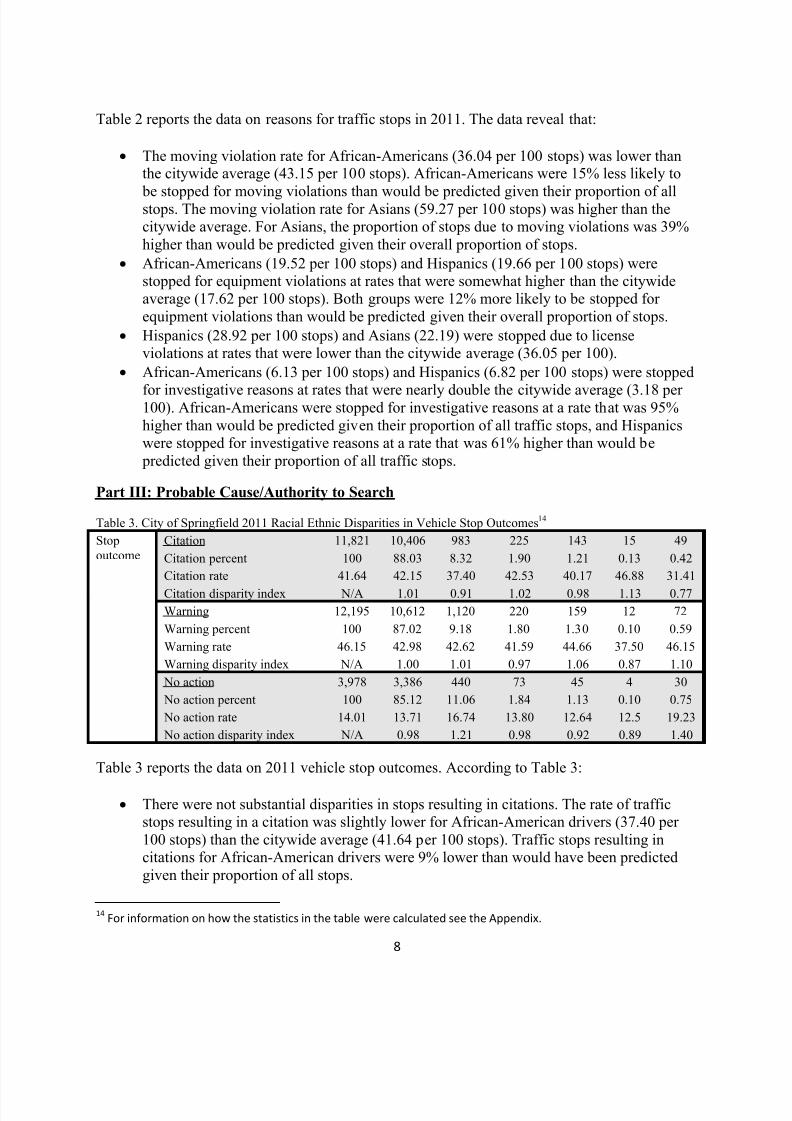
Table 3 reports the data on 2011 vehicle stop outcomes. According to Table 3:
There were not substantial disparities in stops resulting in citations. The rate of trafficstops resulting in a citation was slightly lower for African-American drivers (37.40 per 100 stops) than the citywide average (41.64 per 100 stops). Traffic stops resulting incitations for African-American drivers were 9% lower than would have been predictedgiven their proportion of all stops.
14For information on how the statistics in the table were calculated see the Appendix.
7/27/2019 SPD Traffic Stop Results
http://slidepdf.com/reader/full/spd-traffic-stop-results 10/23
9
There were not substantial disparities in vehicle stops resulting in warnings by race or ethnicity in 2011. All groups were issued warnings at rates similar to the citywideaverage (46.15 per 100 stops).
Traffic stops were somewhat more likely to result in no action for African-Americandrivers (16.74 per 100 stops) than the citywide average (14.01 per 100 stops). Vehicle
stops of African-American drivers resulted in no action at a rate that was 21% higher thanwould be predicted given their proportion of all stops.
7/27/2019 SPD Traffic Stop Results
http://slidepdf.com/reader/full/spd-traffic-stop-results 11/23
10
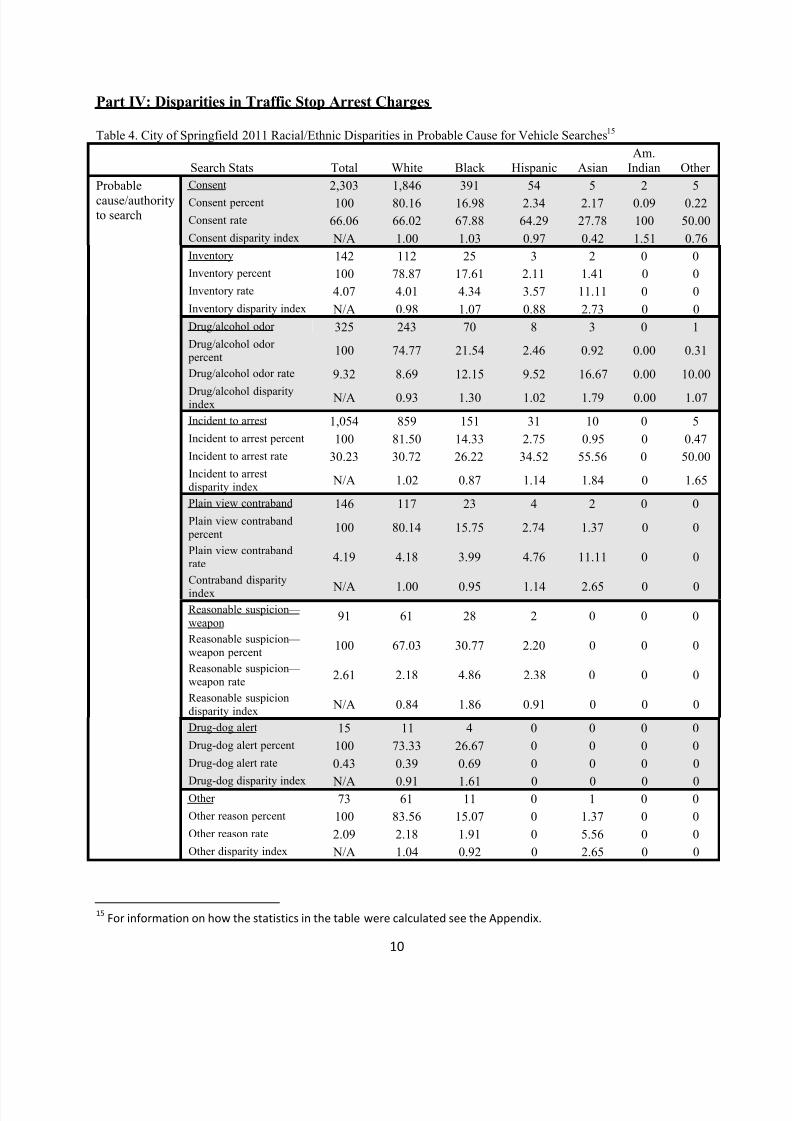
Part IV: Disparities in Traffic Stop Arrest Charges
Table 4. City of Springfield 2011 Racial/Ethnic Disparities in Probable Cause for Vehicle Searches15
Search Stats Total White Black Hispanic AsianAm.
Indian Other
Probable
cause/authorityto search
Consent 2,303 1,846 391 54 5 2 5
Consent percent 100 80.16 16.98 2.34 2.17 0.09 0.22
Consent rate 66.06 66.02 67.88 64.29 27.78 100 50.00
Consent disparity index N/A 1.00 1.03 0.97 0.42 1.51 0.76
Inventory 142 112 25 3 2 0 0
Inventory percent 100 78.87 17.61 2.11 1.41 0 0
Inventory rate 4.07 4.01 4.34 3.57 11.11 0 0
Inventory disparity index N/A 0.98 1.07 0.88 2.73 0 0
Drug/alcohol odor 325 243 70 8 3 0 1
Drug/alcohol odor percent
100 74.77 21.54 2.46 0.92 0.00 0.31
Drug/alcohol odor rate 9.32 8.69 12.15 9.52 16.67 0.00 10.00
Drug/alcohol disparityindex
N/A 0.93 1.30 1.02 1.79 0.00 1.07
Incident to arrest 1,054 859 151 31 10 0 5
Incident to arrest percent 100 81.50 14.33 2.75 0.95 0 0.47
Incident to arrest rate 30.23 30.72 26.22 34.52 55.56 0 50.00
Incident to arrestdisparity index
N/A 1.02 0.87 1.14 1.84 0 1.65
Plain view contraband 146 117 23 4 2 0 0
Plain view contraband percent
100 80.14 15.75 2.74 1.37 0 0
Plain view contrabandrate
4.19 4.18 3.99 4.76 11.11 0 0
Contraband disparity
index N/A 1.00 0.95 1.14 2.65 0 0Reasonable suspicion —
weapon91 61 28 2 0 0 0
Reasonable suspicion — weapon percent
100 67.03 30.77 2.20 0 0 0
Reasonable suspicion — weapon rate
2.61 2.18 4.86 2.38 0 0 0
Reasonable suspiciondisparity index
N/A 0.84 1.86 0.91 0 0 0
Drug-dog alert 15 11 4 0 0 0 0
Drug-dog alert percent 100 73.33 26.67 0 0 0 0
Drug-dog alert rate 0.43 0.39 0.69 0 0 0 0
Drug-dog disparity index N/A 0.91 1.61 0 0 0 0Other 73 61 11 0 1 0 0
Other reason percent 100 83.56 15.07 0 1.37 0 0
Other reason rate 2.09 2.18 1.91 0 5.56 0 0
Other disparity index N/A 1.04 0.92 0 2.65 0 0
15For information on how the statistics in the table were calculated see the Appendix.
7/27/2019 SPD Traffic Stop Results
http://slidepdf.com/reader/full/spd-traffic-stop-results 12/23
11
Table 4 reports the 2011 data on vehicle searches. According to the data:
There were not substantial race/ethnic disparities in searches where consent was given.
All race/ethnic groups were close to the citywide average for consent (66.06 per 100searches).
African-American search rates as the result of drug/alcohol odor (12.15 per 100 searches)were higher than the citywide average (9.32 per 100 searches). African-American driverswere searched due to drug/alcohol odor at a rate that was 30% higher than would have been predicted given their proportion of all searches.
African-American drivers were searched due to an incident to arrest at a rate (26.22 per 100 searches) that was lower than the citywide average (30.23 per 100 searches). Theincident to arrest rate for African-Americans was 13% lower than would have been predicted given their proportion of all searches. Hispanic drivers were searched due to anincident to arrest at a rate (34.52 per 100 searches) that was higher than the citywide
average. Hispanics had an incident to arrest rate that was 14% higher than would have been predicted given their overall proportion of searches.
African-Americans were searched due to reasonable suspicion of a weapon at a rate (4.86 per 100 searches) that was higher than the citywide average (2.61 per 100 searches).African-Americans were 85% more likely to be searched than would have been expectedgiven their overall proportion of searches.
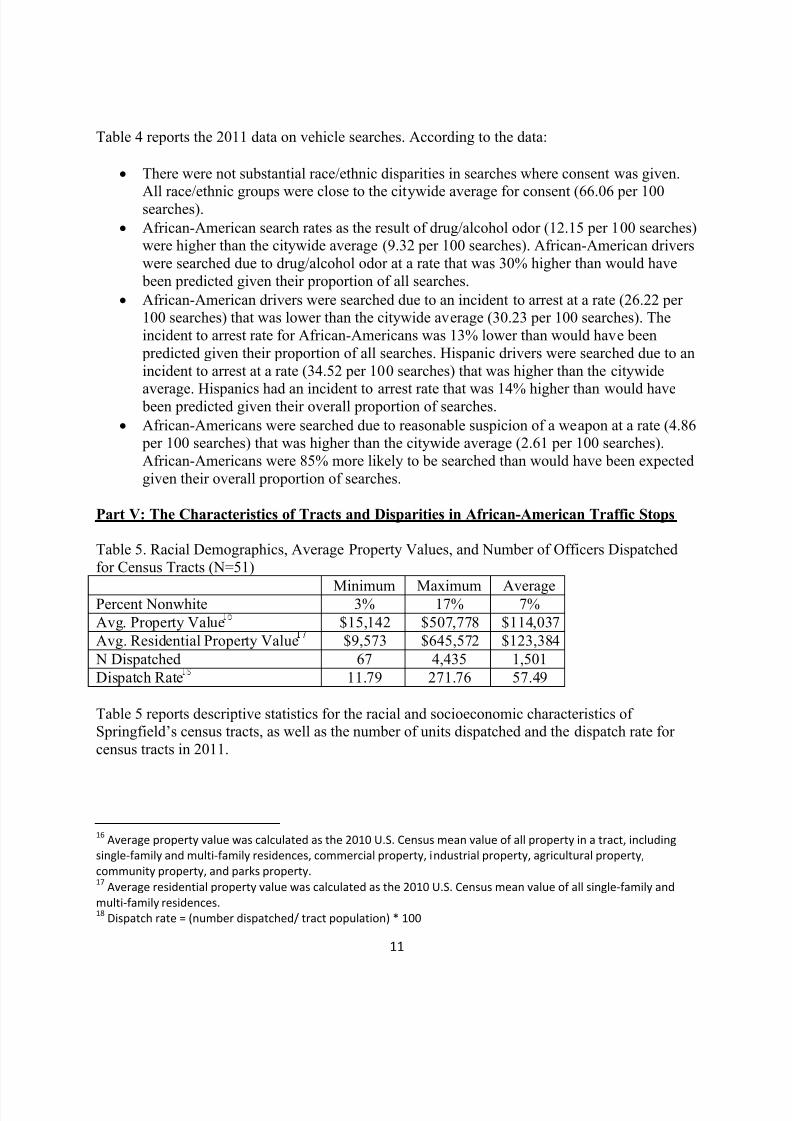
Part V: The Characteristics of Tracts and Disparities in African-American Traffic Stops
Table 5. Racial Demographics, Average Property Values, and Number of Officers Dispatchedfor Census Tracts (N=51)
Minimum Maximum AveragePercent Nonwhite 3% 17% 7%
Avg. Property Value $15,142 $507,778 $114,037
Avg. Residential Property Value $9,573 $645,572 $123,384
N Dispatched 67 4,435 1,501
Dispatch Rate 11.79 271.76 57.49
Table 5 reports descriptive statistics for the racial and socioeconomic characteristics of Springfield’s census tracts, as well as the number of units dispatched and the dispatch rate for census tracts in 2011.
16Average property value was calculated as the 2010 U.S. Census mean value of all property in a tract, including
single-family and multi-family residences, commercial property, industrial property, agricultural property,
community property, and parks property.17
Average residential property value was calculated as the 2010 U.S. Census mean value of all single-family and
multi-family residences.18
Dispatch rate = (number dispatched/ tract population) * 100
7/27/2019 SPD Traffic Stop Results
http://slidepdf.com/reader/full/spd-traffic-stop-results 13/23
12
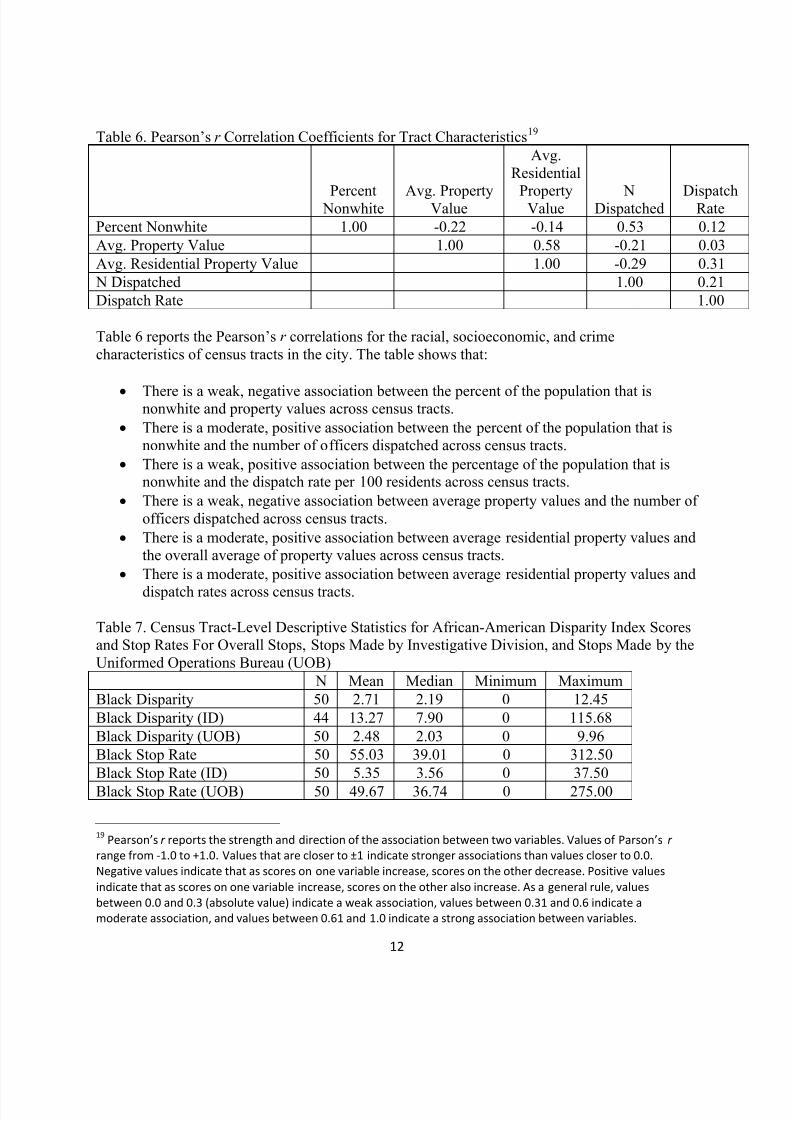
Table 6. Pearson’s r Correlation Coefficients for Tract Characteristics19
Percent Nonwhite Avg. PropertyValue
Avg.Residential
PropertyValue NDispatched DispatchRate
Percent Nonwhite 1.00 -0.22 -0.14 0.53 0.12
Avg. Property Value 1.00 0.58 -0.21 0.03
Avg. Residential Property Value 1.00 -0.29 0.31
N Dispatched 1.00 0.21
Dispatch Rate 1.00
Table 6 reports the Pearson’s r correlations for the racial, socioeconomic, and crimecharacteristics of census tracts in the city. The table shows that:
There is a weak, negative association between the percent of the population that isnonwhite and property values across census tracts.
There is a moderate, positive association between the percent of the population that isnonwhite and the number of officers dispatched across census tracts.
There is a weak, positive association between the percentage of the population that isnonwhite and the dispatch rate per 100 residents across census tracts.
There is a weak, negative association between average property values and the number of officers dispatched across census tracts.
There is a moderate, positive association between average residential property values andthe overall average of property values across census tracts.
There is a moderate, positive association between average residential property values and
dispatch rates across census tracts.
Table 7. Census Tract-Level Descriptive Statistics for African-American Disparity Index Scoresand Stop Rates For Overall Stops, Stops Made by Investigative Division, and Stops Made by theUniformed Operations Bureau (UOB)
N Mean Median Minimum Maximum
Black Disparity 50 2.71 2.19 0 12.45
Black Disparity (ID) 44 13.27 7.90 0 115.68
Black Disparity (UOB) 50 2.48 2.03 0 9.96
Black Stop Rate 50 55.03 39.01 0 312.50
Black Stop Rate (ID) 50 5.35 3.56 0 37.50
Black Stop Rate (UOB) 50 49.67 36.74 0 275.00
19 Pearson’s r reports the strength and direction of the association between two variables. Values of Parson’s r
range from -1.0 to +1.0. Values that are closer to ±1 indicate stronger associations than values closer to 0.0.
Negative values indicate that as scores on one variable increase, scores on the other decrease. Positive values
indicate that as scores on one variable increase, scores on the other also increase. As a general rule, values
between 0.0 and 0.3 (absolute value) indicate a weak association, values between 0.31 and 0.6 indicate a
moderate association, and values between 0.61 and 1.0 indicate a strong association between variables.
7/27/2019 SPD Traffic Stop Results
http://slidepdf.com/reader/full/spd-traffic-stop-results 14/23
13
Table 7 reports census tract-level descriptive statistics for African-American disparityindex scores and stop rates. The data are reported for the overall number of African-American stops, and for stops made by the ID and the UOB.
The data are significantly skewed for African-American disparity index scores and stop
rates. The median is a more accurate measure of central tendency, since there are a fewoutlier tracts where African-Americans make up a very small proportion of the population relative to their proportion of stops. For example, in the tract with the highestAfrican-American disparity index score, tract 45, there were only 12 stops in 2011. Of the 12 motor vehicles that were stopped, three (25%) were operated by African-Americandrivers. The tract has a total population of 1,245. Of that 1,245, only 25 are African-American (~2%). So, it appears there is a large disparity in that tract, even though a verysmall number of African-American drivers were actually stopped.
Overall, the median disparity index score for African-Americans was 2.19. The medianAfrican-American disparity index score for stops made by the investigative division(7.90) was much higher than the overall African-American disparity index score (2.19).
The median African-American disparity index score was somewhat lower for stops made by UOB (2.03), compared to the overall African-American median disparity index score.
Overall, the median African-American stop rate was 39.01 per 100 people. The median black stop rate for stops made by the investigative unit was much lower than the overallrate at 3.56 per 100 people. The median black stop rate for stops made by the UOB(36.74 per 100 people) was very close to the overall median black stop rate.
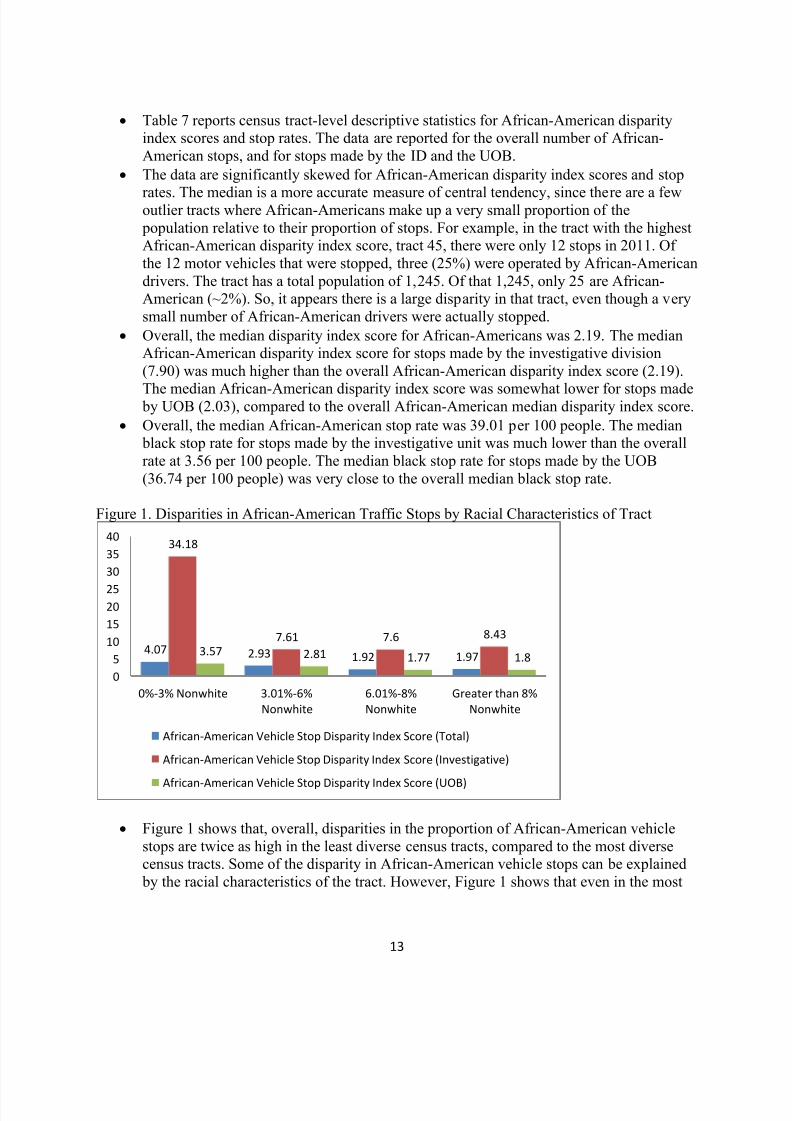
Figure 1. Disparities in African-American Traffic Stops by Racial Characteristics of Tract
Figure 1 shows that, overall, disparities in the proportion of African-American vehiclestops are twice as high in the least diverse census tracts, compared to the most diversecensus tracts. Some of the disparity in African-American vehicle stops can be explained by the racial characteristics of the tract. However, Figure 1 shows that even in the most
4.07 2.93 1.92 1.97
34.18
7.61 7.6 8.43
3.57 2.81 1.77 1.8
0
5
10
15
2025
30
35
40
0%-3% Nonwhite 3.01%-6%
Nonwhite
6.01%-8%
Nonwhite
Greater than 8%
Nonwhite
African-American Vehicle Stop Disparity Index Score (Total)
African-American Vehicle Stop Disparity Index Score (Investigative)
African-American Vehicle Stop Disparity Index Score (UOB)
7/27/2019 SPD Traffic Stop Results
http://slidepdf.com/reader/full/spd-traffic-stop-results 15/23
14
diverse census tracts African-Americans are still stopped at rates that are much higher than would be expected, given their proportion of the tract population.
In terms of investigative stops, disparities were large for all tracts, but the largestdisparities were in the least diverse tracts.
Separating the UOB stops from the investigative stops lowered the disparities in each
tract somewhat, but not enough to fully explain the disproportionate number of stops for African-Americans in Springfield’s census tracts.
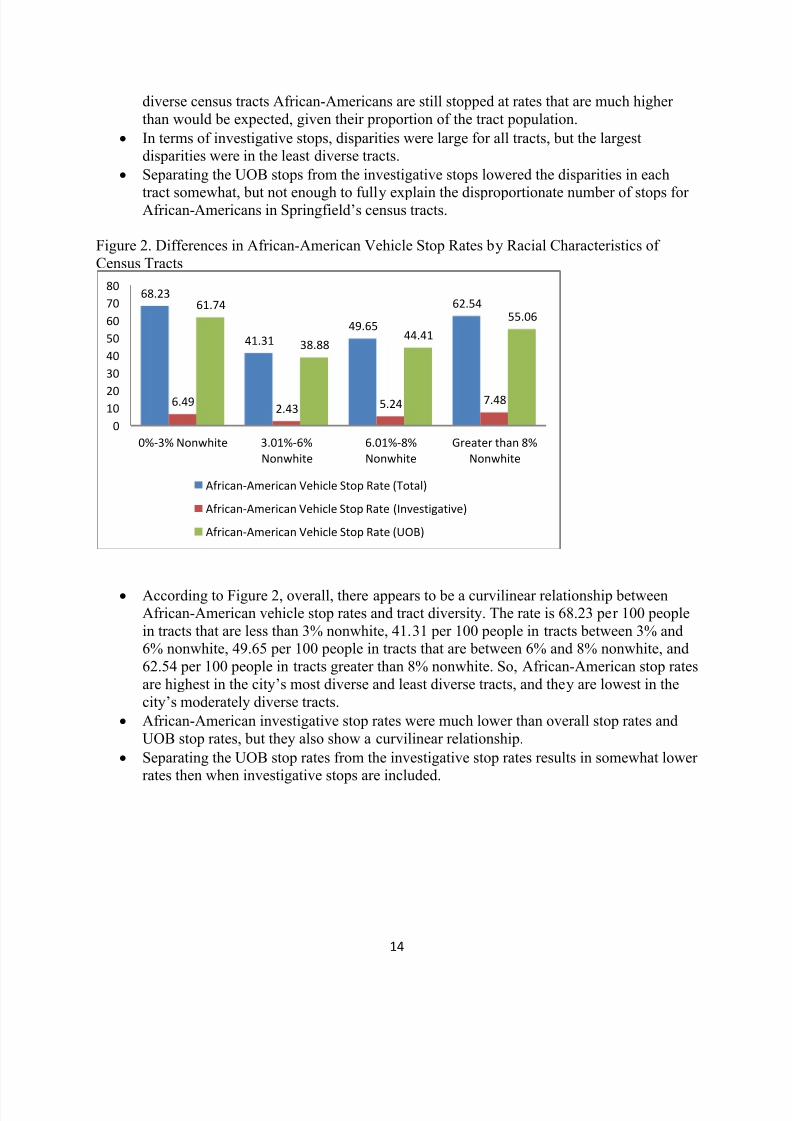
Figure 2. Differences in African-American Vehicle Stop Rates by Racial Characteristics of Census Tracts
According to Figure 2, overall, there appears to be a curvilinear relationship betweenAfrican-American vehicle stop rates and tract diversity. The rate is 68.23 per 100 peoplein tracts that are less than 3% nonwhite, 41.31 per 100 people in tracts between 3% and6% nonwhite, 49.65 per 100 people in tracts that are between 6% and 8% nonwhite, and62.54 per 100 people in tracts greater than 8% nonwhite. So, African-American stop ratesare highest in the city’s most diverse and least diverse tracts, and they are lowest in thecity’s moderately diverse tracts.
African-American investigative stop rates were much lower than overall stop rates andUOB stop rates, but they also show a curvilinear relationship.
Separating the UOB stop rates from the investigative stop rates results in somewhat lower rates then when investigative stops are included.
68.23
41.3149.65
62.54
6.492.43 5.24 7.48
61.74
38.8844.41
55.06
0
1020
30
40
50
60
70
80
0%-3% Nonwhite 3.01%-6%
Nonwhite
6.01%-8%
Nonwhite
Greater than 8%
Nonwhite
African-American Vehicle Stop Rate (Total)
African-American Vehicle Stop Rate (Investigative)
African-American Vehicle Stop Rate (UOB)
7/27/2019 SPD Traffic Stop Results
http://slidepdf.com/reader/full/spd-traffic-stop-results 16/23
15
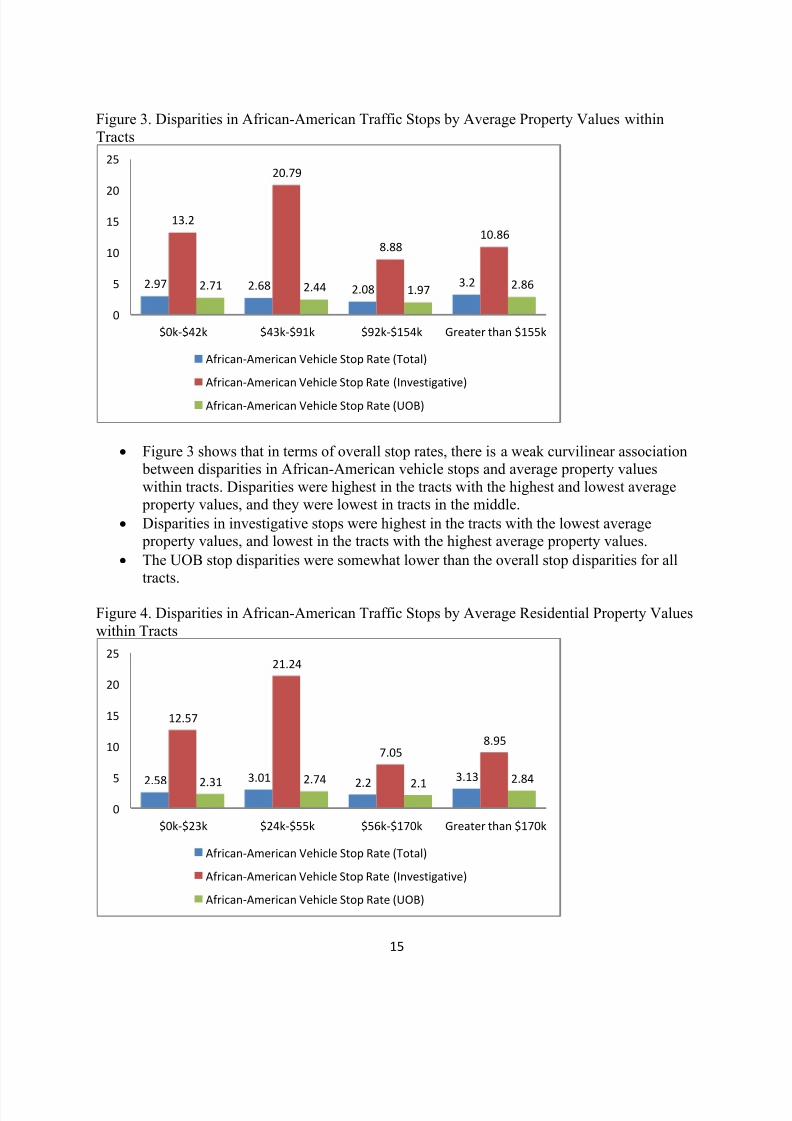
Figure 3. Disparities in African-American Traffic Stops by Average Property Values withinTracts
Figure 3 shows that in terms of overall stop rates, there is a weak curvilinear association between disparities in African-American vehicle stops and average property valueswithin tracts. Disparities were highest in the tracts with the highest and lowest average property values, and they were lowest in tracts in the middle.
Disparities in investigative stops were highest in the tracts with the lowest average property values, and lowest in the tracts with the highest average property values.
The UOB stop disparities were somewhat lower than the overall stop disparities for alltracts.
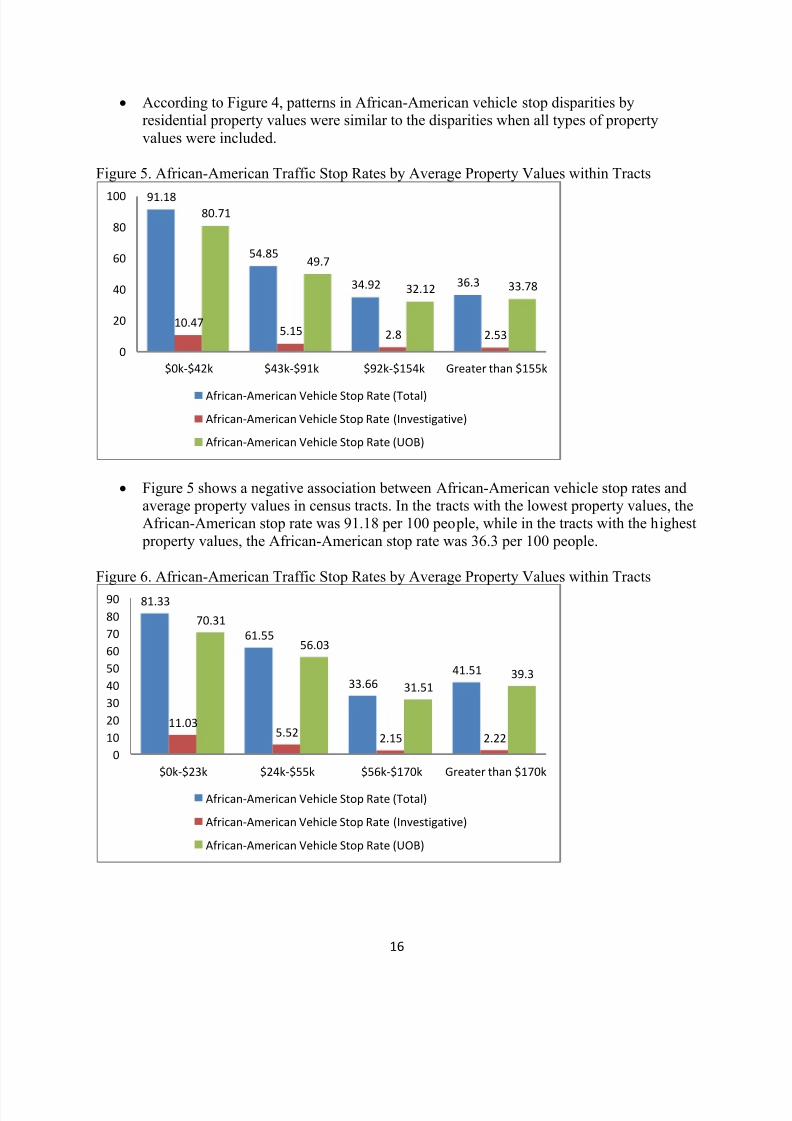
Figure 4. Disparities in African-American Traffic Stops by Average Residential Property Valueswithin Tracts
2.97 2.68 2.083.2
13.2
20.79
8.8810.86
2.71 2.44 1.97 2.86
0
5
10
15
20
25
$0k-$42k $43k-$91k $92k-$154k Greater than $155k
African-American Vehicle Stop Rate (Total)
African-American Vehicle Stop Rate (Investigative)
African-American Vehicle Stop Rate (UOB)
2.583.01
2.23.13
12.57
21.24
7.058.95
2.312.74
2.12.84
0
5
10
15
20
25
$0k-$23k $24k-$55k $56k-$170k Greater than $170k
African-American Vehicle Stop Rate (Total)
African-American Vehicle Stop Rate (Investigative)
African-American Vehicle Stop Rate (UOB)
7/27/2019 SPD Traffic Stop Results
http://slidepdf.com/reader/full/spd-traffic-stop-results 17/23
16
According to Figure 4, patterns in African-American vehicle stop disparities byresidential property values were similar to the disparities when all types of propertyvalues were included.
Figure 5. African-American Traffic Stop Rates by Average Property Values within Tracts
Figure 5 shows a negative association between African-American vehicle stop rates andaverage property values in census tracts. In the tracts with the lowest property values, theAfrican-American stop rate was 91.18 per 100 people, while in the tracts with the highest property values, the African-American stop rate was 36.3 per 100 people.
Figure 6. African-American Traffic Stop Rates by Average Property Values within Tracts
91.18
54.85
34.92 36.3
10.475.15 2.8 2.53
80.71
49.7
32.12 33.78
0
20
40
60
80
100
$0k-$42k $43k-$91k $92k-$154k Greater than $155k
African-American Vehicle Stop Rate (Total)
African-American Vehicle Stop Rate (Investigative)
African-American Vehicle Stop Rate (UOB)
81.33
61.55
33.6641.51
11.035.52 2.15 2.22
70.31
56.03
31.5139.3
0
10
20
30
40
50
60
70
80
90
$0k-$23k $24k-$55k $56k-$170k Greater than $170k
African-American Vehicle Stop Rate (Total)
African-American Vehicle Stop Rate (Investigative)
African-American Vehicle Stop Rate (UOB)
7/27/2019 SPD Traffic Stop Results
http://slidepdf.com/reader/full/spd-traffic-stop-results 18/23
17
Figure 6 shows that patterns in African-American vehicle stop rates by residential property values were similar to the disparities when all types of property values wereincluded.
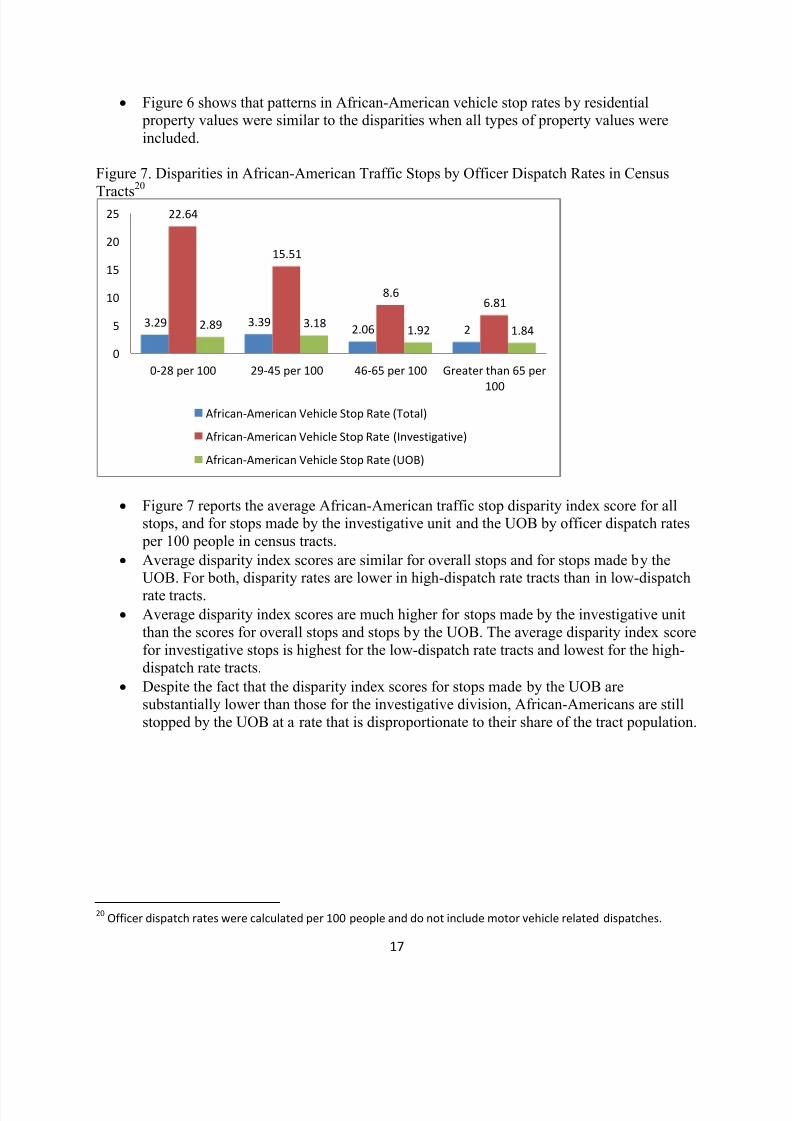
Figure 7. Disparities in African-American Traffic Stops by Officer Dispatch Rates in Census
Tracts
20
Figure 7 reports the average African-American traffic stop disparity index score for allstops, and for stops made by the investigative unit and the UOB by officer dispatch rates per 100 people in census tracts.
Average disparity index scores are similar for overall stops and for stops made by theUOB. For both, disparity rates are lower in high-dispatch rate tracts than in low-dispatchrate tracts.
Average disparity index scores are much higher for stops made by the investigative unitthan the scores for overall stops and stops by the UOB. The average disparity index scorefor investigative stops is highest for the low-dispatch rate tracts and lowest for the high-dispatch rate tracts.
Despite the fact that the disparity index scores for stops made by the UOB aresubstantially lower than those for the investigative division, African-Americans are stillstopped by the UOB at a rate that is disproportionate to their share of the tract population.
20Officer dispatch rates were calculated per 100 people and do not include motor vehicle related dispatches.
3.29 3.392.06 2
22.64
15.51
8.66.81
2.89 3.181.92 1.84
0
5
10
15
20
25
0-28 per 100 29-45 per 100 46-65 per 100 Greater than 65 per
100
African-American Vehicle Stop Rate (Total)
African-American Vehicle Stop Rate (Investigative)
African-American Vehicle Stop Rate (UOB)
7/27/2019 SPD Traffic Stop Results
http://slidepdf.com/reader/full/spd-traffic-stop-results 19/23
18
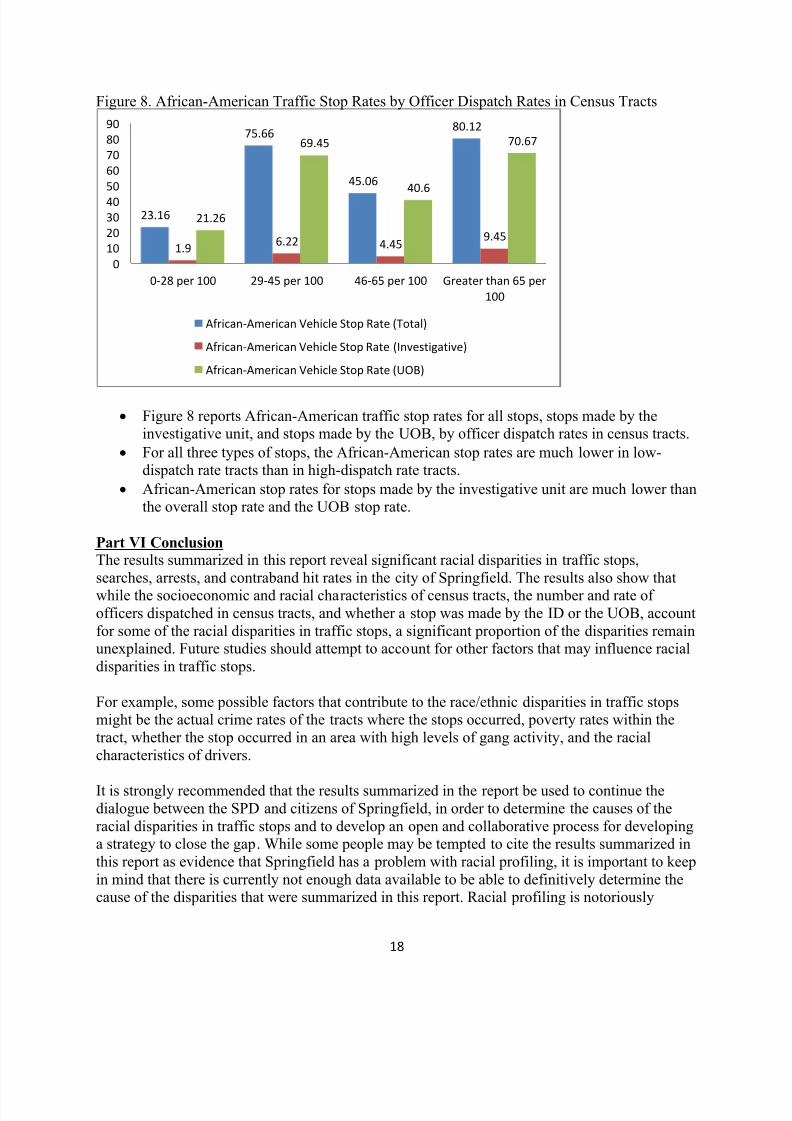
Figure 8. African-American Traffic Stop Rates by Officer Dispatch Rates in Census Tracts
Figure 8 reports African-American traffic stop rates for all stops, stops made by theinvestigative unit, and stops made by the UOB, by officer dispatch rates in census tracts.
For all three types of stops, the African-American stop rates are much lower in low-dispatch rate tracts than in high-dispatch rate tracts.
African-American stop rates for stops made by the investigative unit are much lower thanthe overall stop rate and the UOB stop rate.
Part VI Conclusion The results summarized in this report reveal significant racial disparities in traffic stops,searches, arrests, and contraband hit rates in the city of Springfield. The results also show thatwhile the socioeconomic and racial characteristics of census tracts, the number and rate of officers dispatched in census tracts, and whether a stop was made by the ID or the UOB, accountfor some of the racial disparities in traffic stops, a significant proportion of the disparities remainunexplained. Future studies should attempt to account for other factors that may influence racialdisparities in traffic stops.
For example, some possible factors that contribute to the race/ethnic disparities in traffic stopsmight be the actual crime rates of the tracts where the stops occurred, poverty rates within thetract, whether the stop occurred in an area with high levels of gang activity, and the racialcharacteristics of drivers.
It is strongly recommended that the results summarized in the report be used to continue thedialogue between the SPD and citizens of Springfield, in order to determine the causes of theracial disparities in traffic stops and to develop an open and collaborative process for developinga strategy to close the gap. While some people may be tempted to cite the results summarized inthis report as evidence that Springfield has a problem with racial profiling, it is important to keepin mind that there is currently not enough data available to be able to definitively determine thecause of the disparities that were summarized in this report. Racial profiling is notoriously
23.16
75.66
45.06
80.12
1.96.22 4.45
9.45
21.26
69.45
40.6
70.67
0
10
20
30
40
50
60
70
80
90
0-28 per 100 29-45 per 100 46-65 per 100 Greater than 65 per
100
African-American Vehicle Stop Rate (Total)
African-American Vehicle Stop Rate (Investigative)
African-American Vehicle Stop Rate (UOB)

7/27/2019 SPD Traffic Stop Results
http://slidepdf.com/reader/full/spd-traffic-stop-results 20/23
19
difficult to prove in a court of law and better data is needed in order to rule out all competingexplanations for the trends that were described in the report.
7/27/2019 SPD Traffic Stop Results
http://slidepdf.com/reader/full/spd-traffic-stop-results 21/23
20
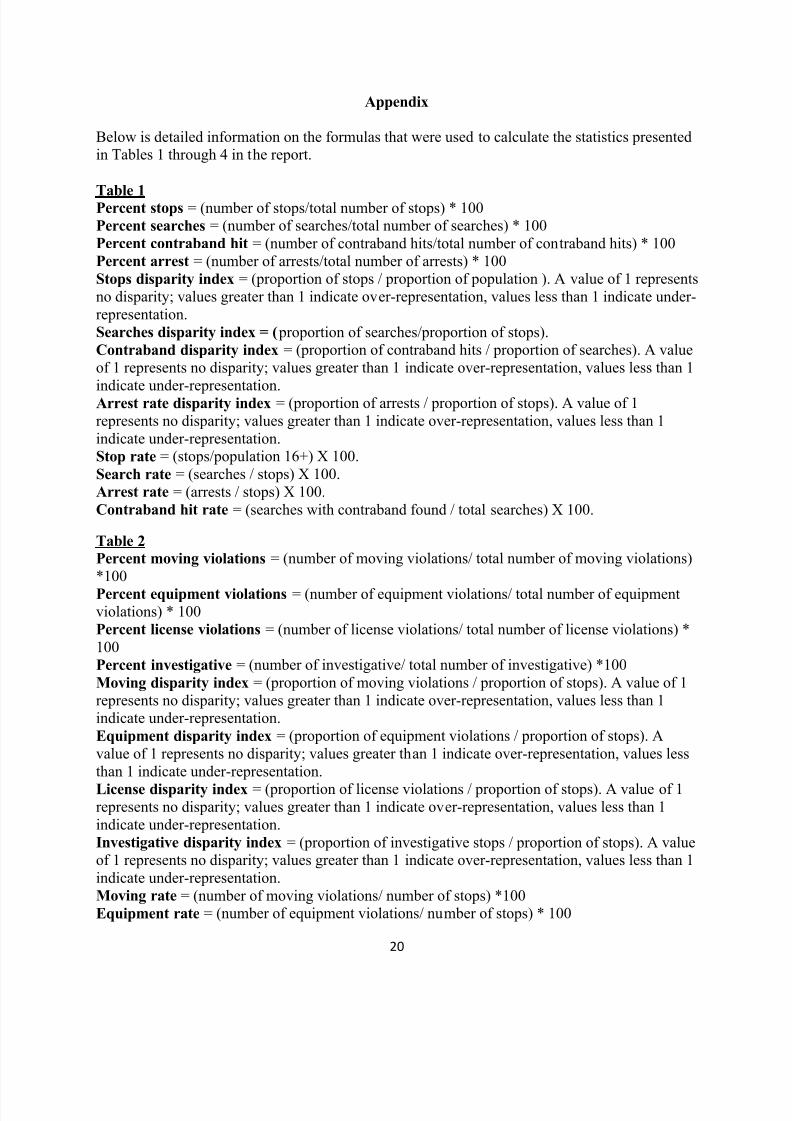
Appendix
Below is detailed information on the formulas that were used to calculate the statistics presentedin Tables 1 through 4 in the report.
Table 1Percent stops = (number of stops/total number of stops) * 100Percent searches = (number of searches/total number of searches) * 100Percent contraband hit = (number of contraband hits/total number of contraband hits) * 100Percent arrest = (number of arrests/total number of arrests) * 100Stops disparity index = (proportion of stops / proportion of population ). A value of 1 representsno disparity; values greater than 1 indicate over-representation, values less than 1 indicate under-representation.Searches disparity index = ( proportion of searches/proportion of stops). Contraband disparity index = (proportion of contraband hits / proportion of searches). A valueof 1 represents no disparity; values greater than 1 indicate over-representation, values less than 1
indicate under-representation.Arrest rate disparity index = (proportion of arrests / proportion of stops). A value of 1represents no disparity; values greater than 1 indicate over-representation, values less than 1indicate under-representation.Stop rate = (stops/population 16+) X 100.Search rate = (searches / stops) X 100.Arrest rate = (arrests / stops) X 100.Contraband hit rate = (searches with contraband found / total searches) X 100.
Table 2
Percent moving violations = (number of moving violations/ total number of moving violations)*100
Percent equipment violations = (number of equipment violations/ total number of equipmentviolations) * 100Percent license violations = (number of license violations/ total number of license violations) *100Percent investigative = (number of investigative/ total number of investigative) *100Moving disparity index = (proportion of moving violations / proportion of stops). A value of 1represents no disparity; values greater than 1 indicate over-representation, values less than 1indicate under-representation.Equipment disparity index = (proportion of equipment violations / proportion of stops). Avalue of 1 represents no disparity; values greater than 1 indicate over-representation, values lessthan 1 indicate under-representation.
License disparity index = (proportion of license violations / proportion of stops). A value of 1represents no disparity; values greater than 1 indicate over-representation, values less than 1indicate under-representation.Investigative disparity index = (proportion of investigative stops / proportion of stops). A valueof 1 represents no disparity; values greater than 1 indicate over-representation, values less than 1indicate under-representation. Moving rate = (number of moving violations/ number of stops) *100Equipment rate = (number of equipment violations/ number of stops) * 100

7/27/2019 SPD Traffic Stop Results
http://slidepdf.com/reader/full/spd-traffic-stop-results 22/23
21
License rate = (number of license violations/ number of stops) * 100Investigative rate = (number of investigative stops/ number of stops) * 100
Table 3
Percent citation = (number of citations/ total number of citations) * 100
Percent warning = (number of warnings/ total number of warnings) * 100Percent no action = (number no action/ total number no action) *100Citation disparity index = (proportion of citations / proportion of stops). A value of 1represents no disparity; values greater than 1 indicate over-representation, values less than 1indicate under-representation.Warning disparity index = (proportion of warnings / proportion of stops). A value of 1represents no disparity; values greater than 1 indicate over-representation, values less than 1indicate under-representation.No action disparity index = (proportion of no action / proportion of stops). A value of 1represents no disparity; values greater than 1 indicate over-representation, values less than 1indicate under-representation.
Citation rate = (number of citations/ number of stops) *100Warning rate = (number of warnings/ number of stops) *100No action rate = (number no action/ number of stops) * 100
Table 4
Percent consent = (number consent/ total number consent) *100Percent inventory = (number inventory/ total number inventory) * 100Percent drug/alcohol = (number drug or alcohol/ total number drug or alcohol) * 100Percent incident to arrest = (number incident to arrest/ total number incident to arrest) * 100Percent contraband = (number contraband/ total number contraband) * 100Percent reasonable suspicion = (number reasonable suspicion/ total number reasonablesuspicion) * 100
Percent drug dog = (number drug dog/ total number drug dog) * 100Percent other = (number other/ total number other) * 100Consent disparity index = (proportion giving consent to be searched / proportion of searches).A value of 1 represents no disparity; values greater than 1 indicate over-representation, valuesless than 1 indicate under-representation.Inventory disparity index = (proportion inventory/ proportion of searches). A value of 1represents no disparity; values greater than 1 indicate over-representation, values less than 1indicate under-representation.Drug/alcohol disparity index = (proportion drug/alcohol odor / proportion of searches). A valueof 1 represents no disparity; values greater than 1 indicate over-representation, values less than 1indicate under-representation.
Incident to arrest disparity index = (proportion incident to arrest / proportion of searches). Avalue of 1 represents no disparity; values greater than 1 indicate over-representation, values lessthan 1 indicate under-representation.Contraband disparity index = (proportion of plain view contraband / proportion of searches).A value of 1 represents no disparity; values greater than 1 indicate over-representation, valuesless than 1 indicate under-representation.
7/27/2019 SPD Traffic Stop Results
http://slidepdf.com/reader/full/spd-traffic-stop-results 23/23
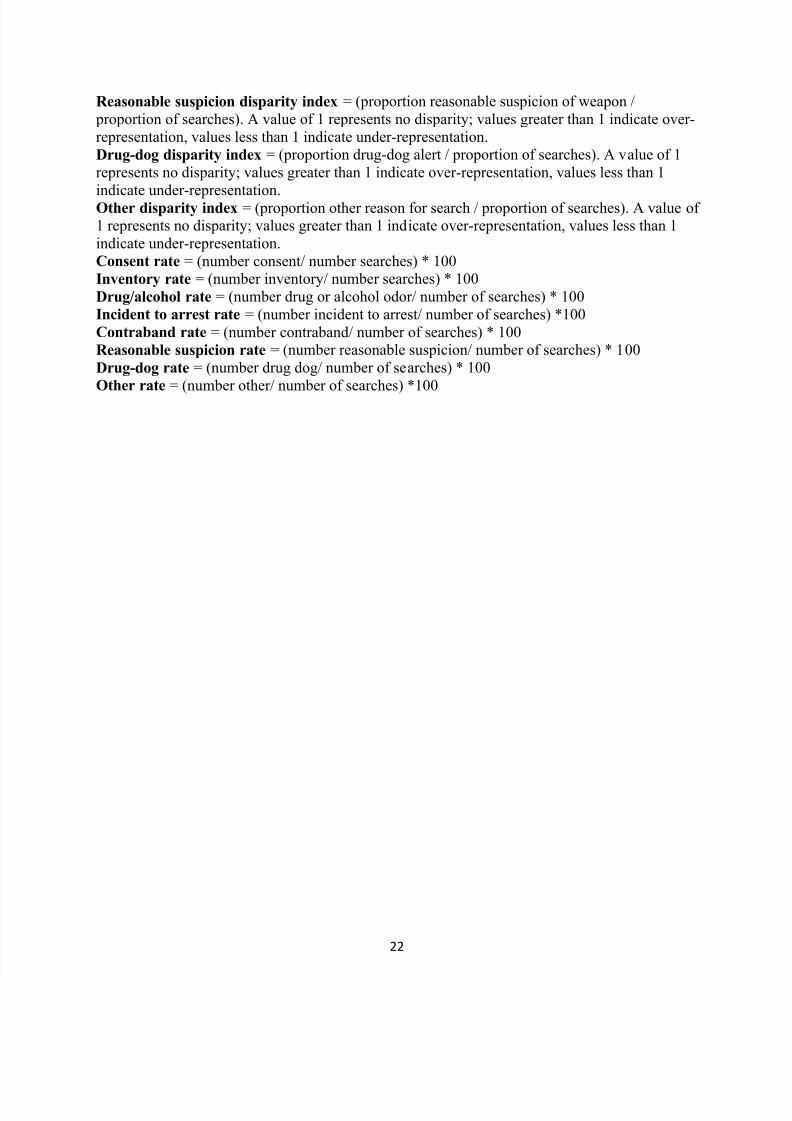
22
Reasonable suspicion disparity index = (proportion reasonable suspicion of weapon / proportion of searches). A value of 1 represents no disparity; values greater than 1 indicate over-representation, values less than 1 indicate under-representation.Drug-dog disparity index = (proportion drug-dog alert / proportion of searches). A value of 1represents no disparity; values greater than 1 indicate over-representation, values less than 1
indicate under-representation.Other disparity index = (proportion other reason for search / proportion of searches). A value of 1 represents no disparity; values greater than 1 indicate over-representation, values less than 1indicate under-representation.Consent rate = (number consent/ number searches) * 100Inventory rate = (number inventory/ number searches) * 100Drug/alcohol rate = (number drug or alcohol odor/ number of searches) * 100Incident to arrest rate = (number incident to arrest/ number of searches) *100Contraband rate = (number contraband/ number of searches) * 100Reasonable suspicion rate = (number reasonable suspicion/ number of searches) * 100Drug-dog rate = (number drug dog/ number of searches) * 100
Other rate = (number other/ number of searches) *100