Embed Size (px)
Citation preview

SPDR ETFsSECTORDASHBOARD
SPDR EMEA ETF Strategy TeamJune 2018
OverviewGlobal inflows into equity ETFs were up through most of May as investors continued to take advantage of economic growth worldwide and strong earnings momentum. Net inflows into sector ETFs during May show that investors appreciate investing by sector as a way of accessing select market opportunities. The focus afforded by sectors allows investors to potentially identify areas of risk and avoid them if desired.
Energy showed robust flows and performance across the regions in May. We continue to see positive prospects for Energy, and we retain it as a SPDR Sector Pick for the US, European and World equity markets for this month.
Sector FlowsTechnology sector ETFs had the highest inflows into both European and US-domiciled funds, cementing their position as the most popular sector ETFs year to date. Nevertheless, there are questions over valuation, which could dampen investor enthusiasm, and there will be important changes to the composition of the sector with the GICS changes on 24 September 2018 (we will provide more detail in our July Sector Dashboard).
Sectors to Watch
ENERGY (see page 4)
Energy is showing the strongest earnings revision momentum across all sectors, and is still supported by supply and demand dynamics.
FINANCIALS (see page 5)
Following recent price weakness, but emboldened by positive Q1 earnings, European Financials appear inexpensive compared with the broader market and with US peers.
MATERIALS (see page 6)
Sector earnings driven by demand in end markets, slow supply-side response, and corporate behaviour.
World US Europe
World US Europe
World US Europe
SECTOR FLOWSTechnology sector ETFs had the highest inflows during May, as some of the very large stocks (including the FANGs) reached record share price highs. Technology is also the most popular sector ETF by flows year to date.
Money flowed out of Financial sector ETFs, which also included specific bank industry ETFs. As discussed later, investors have been worried by political uncertainty and moves in the yield curve.
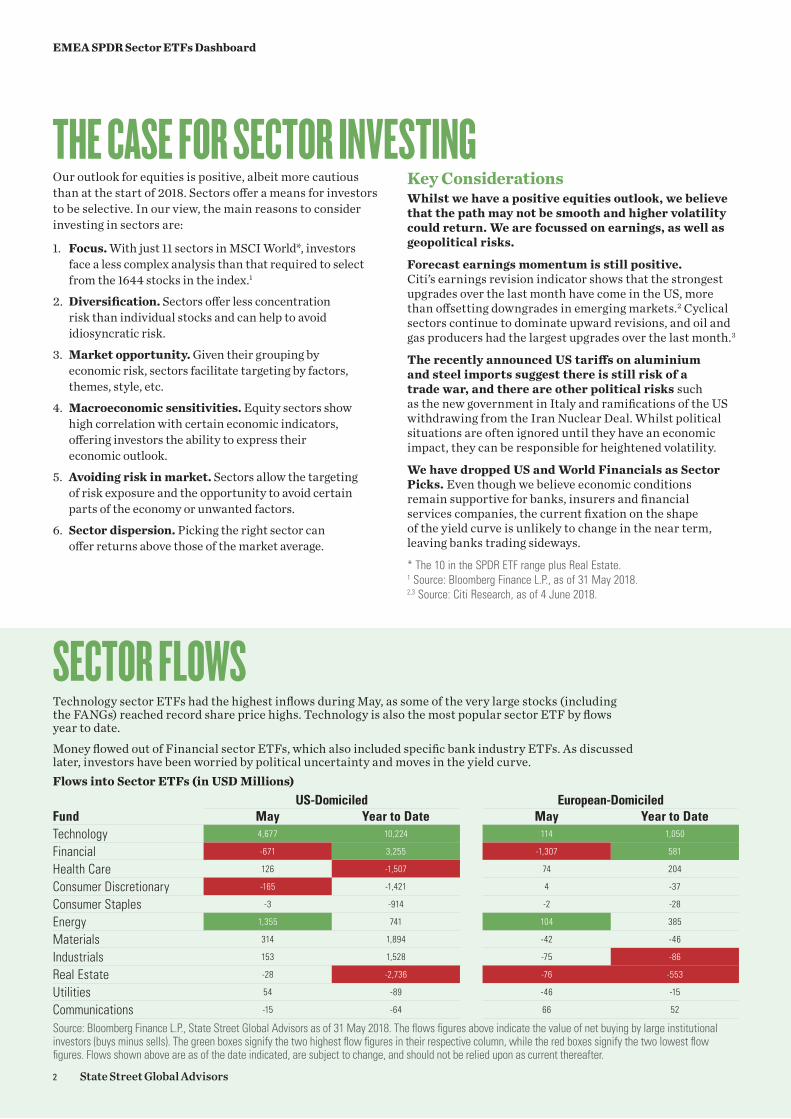
THE CASE FOR SECTOR INVESTINGOur outlook for equities is positive, albeit more cautious than at the start of 2018. Sectors offer a means for investors to be selective. In our view, the main reasons to consider investing in sectors are:
1. Focus. With just 11 sectors in MSCI World*, investors face a less complex analysis than that required to select from the 1644 stocks in the index.1
2. Diversification. Sectors offer less concentration risk than individual stocks and can help to avoid idiosyncratic risk.
3. Market opportunity. Given their grouping by economic risk, sectors facilitate targeting by factors, themes, style, etc.
4. Macroeconomic sensitivities. Equity sectors show high correlation with certain economic indicators, offering investors the ability to express their economic outlook.
5. Avoiding risk in market. Sectors allow the targeting of risk exposure and the opportunity to avoid certain parts of the economy or unwanted factors.
6. Sector dispersion. Picking the right sector can offer returns above those of the market average.
US-Domiciled European-DomiciledFund May Year to Date May Year to DateTechnology 4,677 10,224 114 1,050
Financial -671 3,255 -1,307 581
Health Care 126 -1,507 74 204
Consumer Discretionary -165 -1,421 4 -37
Consumer Staples -3 -914 -2 -28
Energy 1,355 741 104 385
Materials 314 1,894 -42 -46
Industrials 153 1,528 -75 -86
Real Estate -28 -2,736 -76 -553
Utilities 54 -89 -46 -15
Communications -15 -64 66 52
Source: Bloomberg Finance L.P., State Street Global Advisors as of 31 May 2018. The flows figures above indicate the value of net buying by large institutional investors (buys minus sells). The green boxes signify the two highest flow figures in their respective column, while the red boxes signify the two lowest flow figures. Flows shown above are as of the date indicated, are subject to change, and should not be relied upon as current thereafter.
Flows into Sector ETFs (in USD Millions)
Key ConsiderationsWhilst we have a positive equities outlook, we believe that the path may not be smooth and higher volatility could return. We are focussed on earnings, as well as geopolitical risks.
Forecast earnings momentum is still positive. Citi’s earnings revision indicator shows that the strongest upgrades over the last month have come in the US, more than offsetting downgrades in emerging markets.2 Cyclical sectors continue to dominate upward revisions, and oil and gas producers had the largest upgrades over the last month.3
The recently announced US tariffs on aluminium and steel imports suggest there is still risk of a trade war, and there are other political risks such as the new government in Italy and ramifications of the US withdrawing from the Iran Nuclear Deal. Whilst political situations are often ignored until they have an economic impact, they can be responsible for heightened volatility.
We have dropped US and World Financials as Sector Picks. Even though we believe economic conditions remain supportive for banks, insurers and financial services companies, the current fixation on the shape of the yield curve is unlikely to change in the near term, leaving banks trading sideways.
* The 10 in the SPDR ETF range plus Real Estate. 1 Source: Bloomberg Finance L.P., as of 31 May 2018. 2,3 Source: Citi Research, as of 4 June 2018.
2 State Street Global Advisors
EMEA SPDR Sector ETFs Dashboard
-5.4Telecoms
-8.4Consumer Staples
2.0Consumer Disc.
1.0Consumer Staples
-0.1Health Care
1.1Industrials
May (%) May (%) May (%)YTD (%) YTD (%) YTD (%)
WORLD SECTORS US SECTORS EUROPE SECTORS
-3.4Financials
4.8Consumer Disc.
-1.3Utilities
-2.4Utilities
1.8S&P500 NR
3.5Materials
1.5Materials
-1.5Materials
2.9Energy
3.3Energy
-2.8Utilities
-0.1Health Care
6.3Technology
-1.4Utilities
6.6Technology
6.5Technology
-12.5Consumer Staples
-6.0Financials
0.2Health Care
0.5Consumer Disc.
-1.4Industrials
1.0Utilities
1.2Industrials
-9.1Telecoms
2.9Industrials
4.3Materials
-8.9Telecoms
0.4Consumer Disc.
0.5MSCI World NR
-1.0Financials
0.1MSCI Europe
5.7Energy
5.2Consumer Disc.
2.0Materials
2.3Industrials
0.5Health Care
-1.3Industrials
1.7Energy
10.0Technology
7.5Consumer Disc.
8.9Technology
-7.6Telecoms
-2.2Utilities
5.3Energy
9.5Technology
12.4Energy
-1.7Consumer Staples
-6.3Financials
-1.3Consumer Staples
0.2Health Care
-2.4Financials
0.2MSCI Europe
0.6MSCI World NR
-4.4Financials
2.3S&P500 NR
3.0Health Care
-3.6Materials
-4.1Consumer Staples
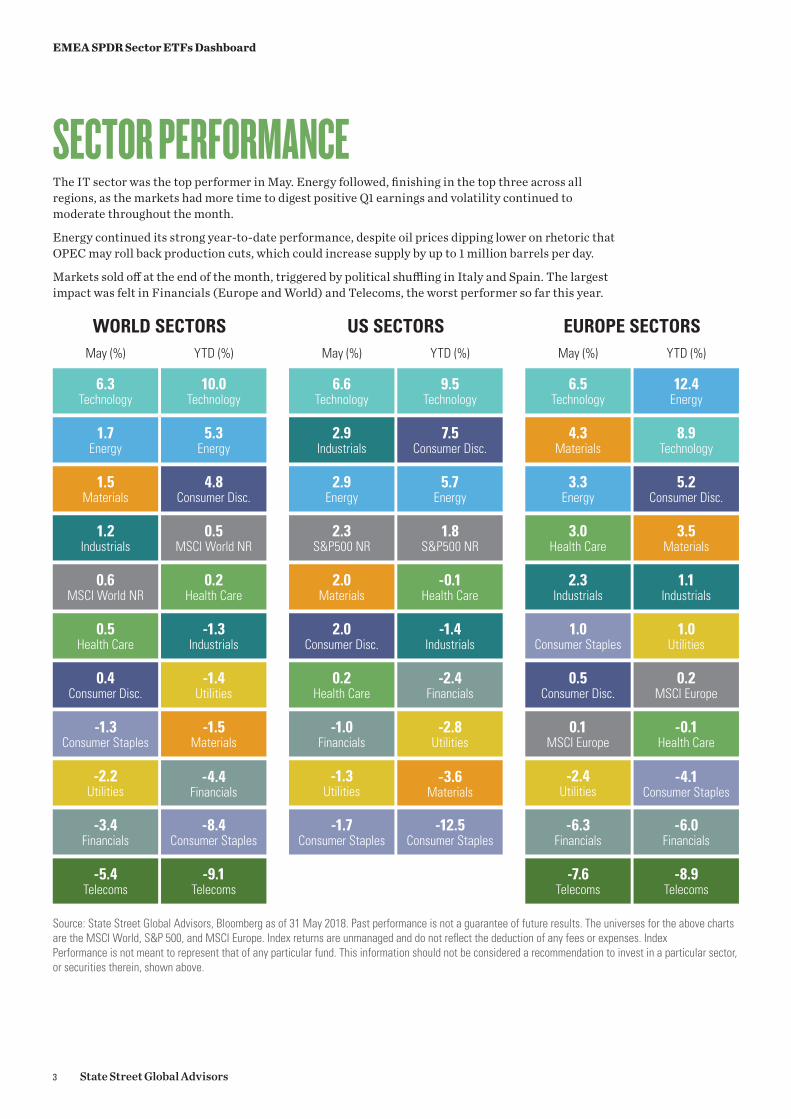
Source: State Street Global Advisors, Bloomberg as of 31 May 2018. Past performance is not a guarantee of future results. The universes for the above charts are the MSCI World, S&P 500, and MSCI Europe. Index returns are unmanaged and do not reflect the deduction of any fees or expenses. Index Performance is not meant to represent that of any particular fund. This information should not be considered a recommendation to invest in a particular sector, or securities therein, shown above.
SECTOR PERFORMANCEThe IT sector was the top performer in May. Energy followed, finishing in the top three across all regions, as the markets had more time to digest positive Q1 earnings and volatility continued to moderate throughout the month.
Energy continued its strong year-to-date performance, despite oil prices dipping lower on rhetoric that OPEC may roll back production cuts, which could increase supply by up to 1 million barrels per day.
Markets sold off at the end of the month, triggered by political shuffling in Italy and Spain. The largest impact was felt in Financials (Europe and World) and Telecoms, the worst performer so far this year.
3 State Street Global Advisors
EMEA SPDR Sector ETFs Dashboard
Money Has Continued to Pour into Oil• Oil price dynamics reflect strong demand factors
and supply in check• Strongest forecast earnings momentum of all sectors• Investors are respondingThe Energy sector posted strong flows and performance across the regions during May. This comes as no surprise. For several months we have talked about the sensitivity of Energy company share prices to the crude oil price and the drivers behind the crude oil price.
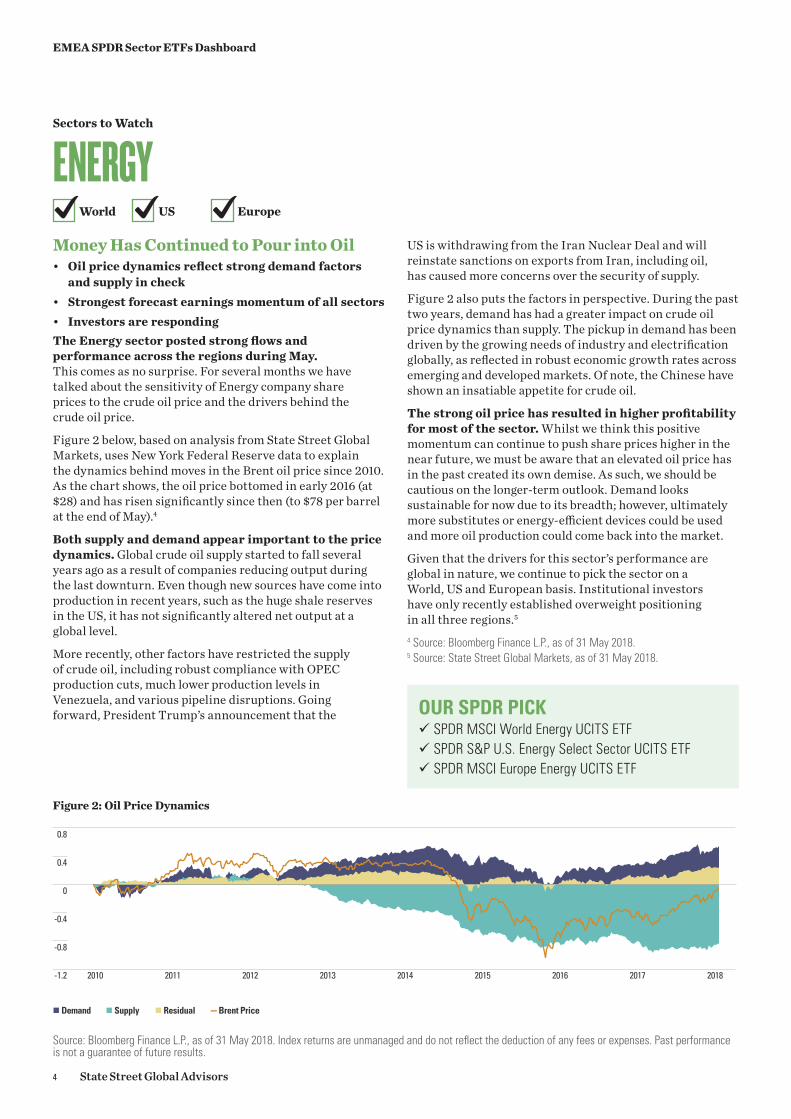
Figure 2 below, based on analysis from State Street Global Markets, uses New York Federal Reserve data to explain the dynamics behind moves in the Brent oil price since 2010. As the chart shows, the oil price bottomed in early 2016 (at $28) and has risen significantly since then (to $78 per barrel at the end of May).4
Both supply and demand appear important to the price dynamics. Global crude oil supply started to fall several years ago as a result of companies reducing output during the last downturn. Even though new sources have come into production in recent years, such as the huge shale reserves in the US, it has not significantly altered net output at a global level.
More recently, other factors have restricted the supply of crude oil, including robust compliance with OPEC production cuts, much lower production levels in Venezuela, and various pipeline disruptions. Going forward, President Trump’s announcement that the
US is withdrawing from the Iran Nuclear Deal and will reinstate sanctions on exports from Iran, including oil, has caused more concerns over the security of supply.
Figure 2 also puts the factors in perspective. During the past two years, demand has had a greater impact on crude oil price dynamics than supply. The pickup in demand has been driven by the growing needs of industry and electrification globally, as reflected in robust economic growth rates across emerging and developed markets. Of note, the Chinese have shown an insatiable appetite for crude oil.
The strong oil price has resulted in higher profitability for most of the sector. Whilst we think this positive momentum can continue to push share prices higher in the near future, we must be aware that an elevated oil price has in the past created its own demise. As such, we should be cautious on the longer-term outlook. Demand looks sustainable for now due to its breadth; however, ultimately more substitutes or energy-efficient devices could be used and more oil production could come back into the market.
Given that the drivers for this sector’s performance are global in nature, we continue to pick the sector on a World, US and European basis. Institutional investors have only recently established overweight positioning in all three regions.5
4 Source: Bloomberg Finance L.P., as of 31 May 2018.5 Source: State Street Global Markets, as of 31 May 2018.
OUR SPDR PICK 9 SPDR MSCI World Energy UCITS ETF 9 SPDR S&P U.S. Energy Select Sector UCITS ETF 9 SPDR MSCI Europe Energy UCITS ETF
Source: Bloomberg Finance L.P., as of 31 May 2018. Index returns are unmanaged and do not reflect the deduction of any fees or expenses. Past performance is not a guarantee of future results.
Figure 2: Oil Price Dynamics
2010 2011 2012 2013 2014 2015 2016 2017 2018-1.2
-0.8
-0.4
0
0.4
0.8
— Brent Price Demand Supply Residual
Sectors to Watch
ENERGYWorld US Europe
4 State Street Global Advisors
EMEA SPDR Sector ETFs Dashboard
Sectors to Watch
FINANCIALSYielding Much• Contrarian investors see buying opportunity6
• European Financials inexpensive relative to broader market and US equivalents7
• High yield and inflation sensitivity8
Whilst yield curve flattening is not helpful for banks, they can increasingly manage where they operate on the curve. This flexibility mutes the impact of the slope of the curve in favour of the overall level of interest rates. Nevertheless, despite our positive stance, we have dropped US Financials and its closely associated counterpart, World Financials, as sector picks for June, as we doubt that banks will see much investor demand whilst this scepticism lasts.
Europe, by contrast, is much earlier in its economic cycle, and the banks may benefit more from monetary policy normalisation. Given recent weakness in share prices, we could see contrarian investors use the buying opportunity.
Political uncertainty has brought unease to markets in recent weeks, as investors fret over the vulnerability of banks in Europe. Of note, the introduction of a new government in Italy has caused concern. These fears have left banks trading on low valuations, which appear to take little account of the fundamental quality of the companies.
World US Europe
European bank results for Q1 showed a net positive surprise. Retail banks broadly performed better than expected with regards to revenues, the level of operating expenditure, and provisions, offsetting the investment banks that missed consensus expectations on revenues and showed higher expenses. Earnings momentum remained positive for the year, led by lower provisioning costs.9
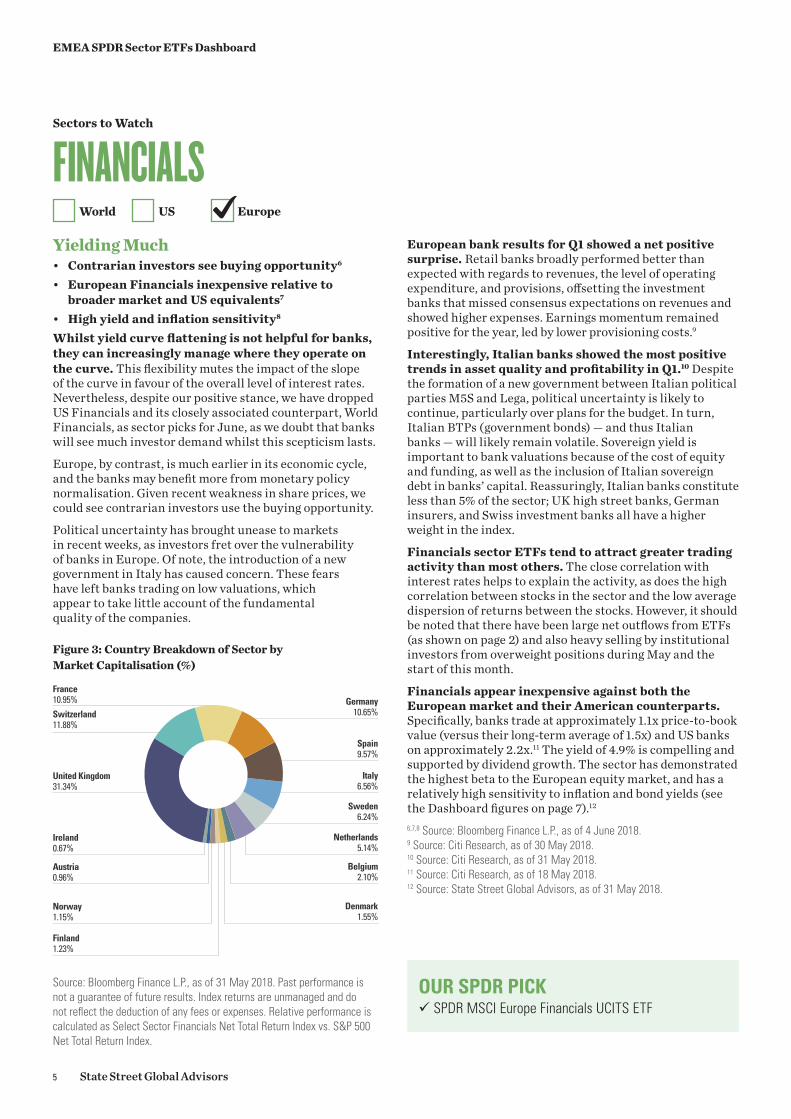
Interestingly, Italian banks showed the most positive trends in asset quality and profitability in Q1.10 Despite the formation of a new government between Italian political parties M5S and Lega, political uncertainty is likely to continue, particularly over plans for the budget. In turn, Italian BTPs (government bonds) — and thus Italian banks — will likely remain volatile. Sovereign yield is important to bank valuations because of the cost of equity and funding, as well as the inclusion of Italian sovereign debt in banks’ capital. Reassuringly, Italian banks constitute less than 5% of the sector; UK high street banks, German insurers, and Swiss investment banks all have a higher weight in the index.
Financials sector ETFs tend to attract greater trading activity than most others. The close correlation with interest rates helps to explain the activity, as does the high correlation between stocks in the sector and the low average dispersion of returns between the stocks. However, it should be noted that there have been large net outflows from ETFs (as shown on page 2) and also heavy selling by institutional investors from overweight positions during May and the start of this month.
Financials appear inexpensive against both the European market and their American counterparts. Specifically, banks trade at approximately 1.1x price-to-book value (versus their long-term average of 1.5x) and US banks on approximately 2.2x.11 The yield of 4.9% is compelling and supported by dividend growth. The sector has demonstrated the highest beta to the European equity market, and has a relatively high sensitivity to inflation and bond yields (see the Dashboard figures on page 7).12
6,7,8 Source: Bloomberg Finance L.P., as of 4 June 2018.9 Source: Citi Research, as of 30 May 2018.10 Source: Citi Research, as of 31 May 2018.11 Source: Citi Research, as of 18 May 2018.12 Source: State Street Global Advisors, as of 31 May 2018.
Source: Bloomberg Finance L.P., as of 31 May 2018. Past performance is not a guarantee of future results. Index returns are unmanaged and do not reflect the deduction of any fees or expenses. Relative performance is calculated as Select Sector Financials Net Total Return Index vs. S&P 500 Net Total Return Index.
Figure 3: Country Breakdown of Sector by Market Capitalisation (%)
United Kingdom31.34%
Austria0.96%
Ireland0.67%
Finland1.23%
Norway1.15%
Switzerland 11.88%
France 10.95% Germany
10.65%
Spain9.57%
Italy6.56%
Sweden6.24%
Netherlands5.14%
Belgium2.10%
Denmark1.55%
OUR SPDR PICK 9 SPDR MSCI Europe Financials UCITS ETF
5 State Street Global Advisors
EMEA SPDR Sector ETFs Dashboard

Sectors to Watch
MATERIALSMetals Continue to Shine• Earnings and price momentum have supported
cyclical sectors• Sector earnings driven by demand in end markets,
slow supply side response, and corporate behaviour• Hedge against inflation in commodities rallyWhilst global economic expansion seems to have slowed, we still anticipate buoyant growth (+3.5% for Q2 and 3.4% in H2, according to Citi Research).* For now, we do not expect the recent moderation in growth to mark the start of a major slowdown. In this environment, investors can look to cyclical sectors to deliver earnings and price momentum. Figure 4 shows that the upgrades in earnings for cyclical sectors continued in May.
The upgrades in Materials follow on from the majority of companies in the sector beating expectations when they reported Q1 results. This showed the impact of higher manufacturing and industrial demand for chemicals, metals and other raw materials produced by the Materials sector.13
China remains a key player in these markets in terms of both demand and supply. Chinese economic data, which is particularly important, has showed controlled slowdown as a result of sensible policy efforts to contain leverage, overcapacity, and new housing.
World US Europe
On the supply front, Chinese environmental legislation has enforced shutdowns for some base metals and coal.14 These supply-side restrictions have supported commodity prices. Inevitably, given the increased profitability, capital expenditure on chemicals and metals manufacturing facilities has picked up (after a period of cost-cutting). However, the long lead-time means that it will likely be several years before there is an impact and, hence, a threat to margins.
Whilst the inflation debate continues, with a close eye on near full employment levels in the US and many other developed markets, the Materials sector could offer a hedge. Materials has one of the highest correlations to price inflation, compared with other sectors (see Dashboard on page 7).
As with Energy, the industries in this sector, such as chemicals, mining, and construction materials, are all globally integrated and driven by similar worldwide forces. Continued economic growth would benefit European, US and World sectors, so we include all three as sector picks for June.
For investors who wish to focus more, the US sector has a much higher exposure (73% of market capitalisation) to large chemical manufacturers, including a global leader Dow DuPont, created by merger last year, with 10% in metals & mining and 13% in construction materials (the remainder is packaging). Europe, by contrast, has a higher exposure to metals & mining (36% of market capitalisation, boosted by miners operating in many countries but listed in London), followed by Chemicals (50%) and construction materials (9%). MSCI World Materials is 55% chemicals, 31% metals & mining, and 6% construction materials.15
13 Source: S&P Research, as of 31 May 2018.14 Source: Bloomberg Intelligence, as of 31 May 2018.15 Source: Bloomberg Finance L.P., as of 31 May 2018.* The above are estimates based on certain assumptions and analysis made.
There is no guarantee that the estimates will be achieved.
OUR SPDR PICK 9 SPDR MSCI World Materials UCITS ETF 9 SPDR S&P U.S. Materials Select Sector UCITS ETF 9 SPDR MSCI Europe Materials UCITS ETFSource: Bloomberg Finance L.P., as of 30 April 2018. Past performance is not
a guarantee of future results. Sectors shown are as of the date indicated and are subject to change. This information should not be considered a recommendation to invest in a particular sector or to buy or sell any security shown. It is not known whether the sectors or securities shown will be profitable in the future.
Figure 4: Global Sector Earnings Revisions — Net Analyst Upgrades
-40 -20 0 20 40%
Energy
Utilities
Industrials
IT
Materials
Cons Disc
Health Care
Financials
Cons Stpl
Telecoms
6 State Street Global Advisors
EMEA SPDR Sector ETFs Dashboard
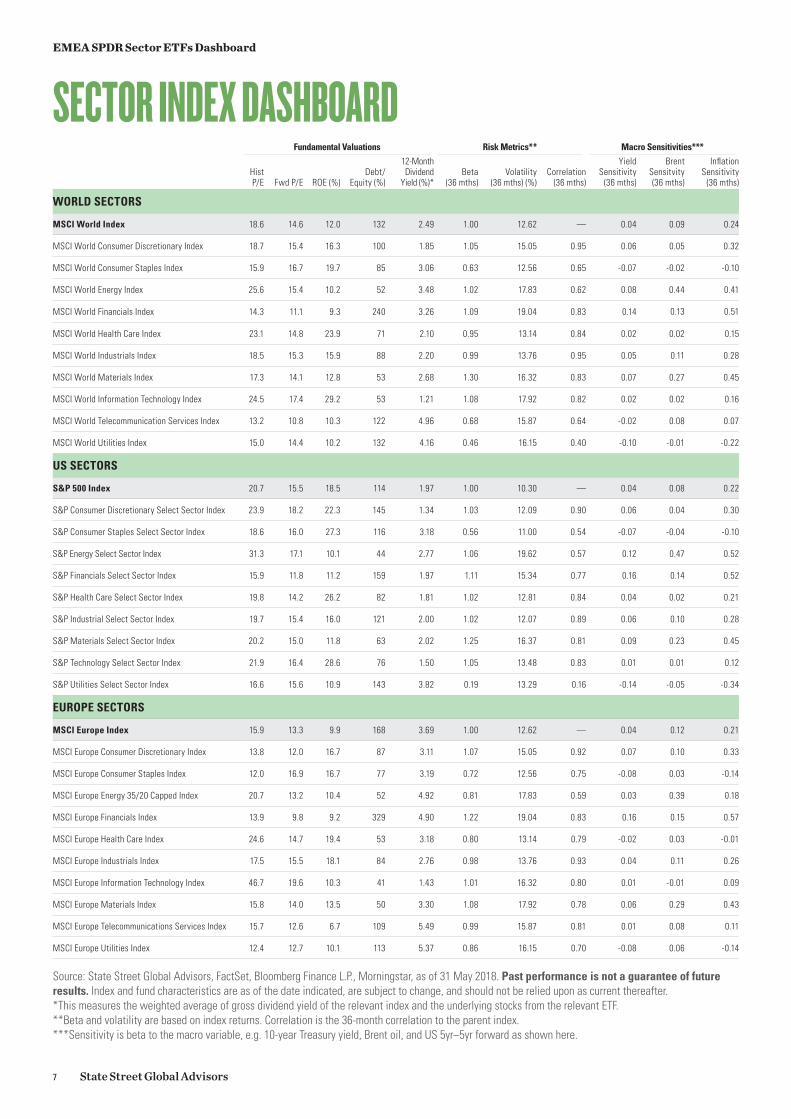
Fundamental Valuations Risk Metrics** Macro Sensitivities***
Hist P/E Fwd P/E ROE (%)
Debt/ Equity (%)
12-Month Dividend
Yield (%)*Beta
(36 mths)Volatility
(36 mths) (%)Correlation
(36 mths)
Yield Sensitivity
(36 mths)
Brent Sensitvity (36 mths)
Inflation Sensitivity
(36 mths)
WORLD SECTORS
MSCI World Index 18.6 14.6 12.0 132 2.49 1.00 12.62 — 0.04 0.09 0.24
MSCI World Consumer Discretionary Index 18.7 15.4 16.3 100 1.85 1.05 15.05 0.95 0.06 0.05 0.32
MSCI World Consumer Staples Index 15.9 16.7 19.7 85 3.06 0.63 12.56 0.65 -0.07 -0.02 -0.10
MSCI World Energy Index 25.6 15.4 10.2 52 3.48 1.02 17.83 0.62 0.08 0.44 0.41
MSCI World Financials Index 14.3 11.1 9.3 240 3.26 1.09 19.04 0.83 0.14 0.13 0.51
MSCI World Health Care Index 23.1 14.8 23.9 71 2.10 0.95 13.14 0.84 0.02 0.02 0.15
MSCI World Industrials Index 18.5 15.3 15.9 88 2.20 0.99 13.76 0.95 0.05 0.11 0.28
MSCI World Materials Index 17.3 14.1 12.8 53 2.68 1.30 16.32 0.83 0.07 0.27 0.45
MSCI World Information Technology Index 24.5 17.4 29.2 53 1.21 1.08 17.92 0.82 0.02 0.02 0.16
MSCI World Telecommunication Services Index 13.2 10.8 10.3 122 4.96 0.68 15.87 0.64 -0.02 0.08 0.07
MSCI World Utilities Index 15.0 14.4 10.2 132 4.16 0.46 16.15 0.40 -0.10 -0.01 -0.22
US SECTORS
S&P 500 Index 20.7 15.5 18.5 114 1.97 1.00 10.30 — 0.04 0.08 0.22
S&P Consumer Discretionary Select Sector Index 23.9 18.2 22.3 145 1.34 1.03 12.09 0.90 0.06 0.04 0.30
S&P Consumer Staples Select Sector Index 18.6 16.0 27.3 116 3.18 0.56 11.00 0.54 -0.07 -0.04 -0.10
S&P Energy Select Sector Index 31.3 17.1 10.1 44 2.77 1.06 19.62 0.57 0.12 0.47 0.52
S&P Financials Select Sector Index 15.9 11.8 11.2 159 1.97 1.11 15.34 0.77 0.16 0.14 0.52
S&P Health Care Select Sector Index 19.8 14.2 26.2 82 1.81 1.02 12.81 0.84 0.04 0.02 0.21
S&P Industrial Select Sector Index 19.7 15.4 16.0 121 2.00 1.02 12.07 0.89 0.06 0.10 0.28
S&P Materials Select Sector Index 20.2 15.0 11.8 63 2.02 1.25 16.37 0.81 0.09 0.23 0.45
S&P Technology Select Sector Index 21.9 16.4 28.6 76 1.50 1.05 13.48 0.83 0.01 0.01 0.12
S&P Utilities Select Sector Index 16.6 15.6 10.9 143 3.82 0.19 13.29 0.16 -0.14 -0.05 -0.34
EUROPE SECTORS
MSCI Europe Index 15.9 13.3 9.9 168 3.69 1.00 12.62 — 0.04 0.12 0.21
MSCI Europe Consumer Discretionary Index 13.8 12.0 16.7 87 3.11 1.07 15.05 0.92 0.07 0.10 0.33
MSCI Europe Consumer Staples Index 12.0 16.9 16.7 77 3.19 0.72 12.56 0.75 -0.08 0.03 -0.14
MSCI Europe Energy 35/20 Capped Index 20.7 13.2 10.4 52 4.92 0.81 17.83 0.59 0.03 0.39 0.18
MSCI Europe Financials Index 13.9 9.8 9.2 329 4.90 1.22 19.04 0.83 0.16 0.15 0.57
MSCI Europe Health Care Index 24.6 14.7 19.4 53 3.18 0.80 13.14 0.79 -0.02 0.03 -0.01
MSCI Europe Industrials Index 17.5 15.5 18.1 84 2.76 0.98 13.76 0.93 0.04 0.11 0.26
MSCI Europe Information Technology Index 46.7 19.6 10.3 41 1.43 1.01 16.32 0.80 0.01 -0.01 0.09
MSCI Europe Materials Index 15.8 14.0 13.5 50 3.30 1.08 17.92 0.78 0.06 0.29 0.43
MSCI Europe Telecommunications Services Index 15.7 12.6 6.7 109 5.49 0.99 15.87 0.81 0.01 0.08 0.11
MSCI Europe Utilities Index 12.4 12.7 10.1 113 5.37 0.86 16.15 0.70 -0.08 0.06 -0.14
SECTOR INDEX DASHBOARD
Source: State Street Global Advisors, FactSet, Bloomberg Finance L.P., Morningstar, as of 31 May 2018. Past performance is not a guarantee of future results. Index and fund characteristics are as of the date indicated, are subject to change, and should not be relied upon as current thereafter.*This measures the weighted average of gross dividend yield of the relevant index and the underlying stocks from the relevant ETF.**Beta and volatility are based on index returns. Correlation is the 36-month correlation to the parent index.***Sensitivity is beta to the macro variable, e.g. 10-year Treasury yield, Brent oil, and US 5yr–5yr forward as shown here.
7 State Street Global Advisors
EMEA SPDR Sector ETFs Dashboard
ETF Information
ISIN TER (%) Euronext LSEDeutsche Borse
Borsa Italiana SIX
1-Month Fund Flow
($mn)
3-Month Fund Flow
($mn)AUM ($mn)
WORLD SECTOR FUNDS
SPDR MSCI World Consumer Discretionary UCITS ETF IE00BYTRR640 0.30 WCOD WCOD — — WCOD 0 0 26
SPDR MSCI World Consumer Staples UCITS ETF IE00BYTRR756 0.30 WCOS WCOS — — WCOS -3 -3 24
SPDR MSCI World Energy UCITS ETF IE00BYTRR863 0.30 WNRG WNRG — — WNRG -2 238 320
SPDR MSCI World Financials UCITS ETF IE00BYTRR970 0.30 WFIN WFIN — — WFIN -177 -23 380
SPDR MSCI World Health Care UCITS ETF IE00BYTRRB94 0.30 WHEA WHEA — — WHEA 0 -41 70
SPDR MSCI World Industrials UCITS ETF IE00BYTRRC02 0.30 WIND WNDU — — WIND 0 4 41
SPDR MSCI World Materials UCITS ETF IE00BYTRRF33 0.30 WMAT WMAT — — WMAT 0 0 20
SPDR MSCI World Technology UCITS ETF IE00BYTRRD19 0.30 WTCH WTEC — — WTEC 0 -5 112
SPDR MSCI World Telecommunications UCITS ETF IE00BYTRRG40 0.30 WTEL WTEL — — WTEL 0 3 7
SPDR MSCI World Utilities UCITS ETF IE00BYTRRH56 0.30 WUTI WUTI — — WUTI 0 0 4
US SECTOR FUNDS
SPDR S&P U.S. Consumer Discretionary Select Sector UCITS ETF IE00BWBXM278 0.15 — SXLY ZPDD SXLY SXLY 3 15 63
SPDR S&P U.S. Consumer Staples Select Sector UCITS ETF IE00BWBXM385 0.15 — SXLP ZPDS SXLP SXLP 2 -3 18
SPDR S&P U.S. Energy Select Sector UCITS ETF IE00BWBXM492 0.15 — SXLE ZPDE SXLE SXLE -23 -241 374
SPDR S&P U.S. Financials Select Sector UCITS ETF IE00BWBXM500 0.15 — SXLF ZPDF SXLF SXLF -106 222 678
SPDR S&P U.S. Health Care Select Sector UCITS ETF IE00BWBXM617 0.15 — SXLV ZPDH SXLV SXLV 0 -1 89
SPDR S&P U.S. Industrials Select Sector UCITS ETF IE00BWBXM724 0.15 — SXLI ZPDI SXLI SXLI -16 1 72
SPDR S&P U.S. Materials Select Sector UCITS ETF IE00BWBXM831 0.15 — SXLB ZPDM SXLB SXLB -3 -5 13
SPDR S&P U.S. Technology Select Sector UCITS ETF IE00BWBXM948 0.15 — SXLK ZPDT SXLK SXLK 0 15 61
SPDR S&P U.S. Utilities Select Sector UCITS ETF IE00BWBXMB69 0.15 — SXLU ZPDU SXLU SXLU -1 2 8
EUROPE SECTOR FUNDS
SPDR MSCI Europe Consumer Discretionary UCITS ETF IE00BKWQ0C77 0.30 STR CDIS SPYR STRX STRX 18 -55 201
SPDR MSCI Europe Consumer Staples UCITS ETF IE00BKWQ0D84 0.30 STS CSTP SPYC STSX STSX -8 26 218
SPDR MSCI Europe Energy UCITS ETF IE00BKWQ0F09 0.30 STN ENGY SPYN STNX STNX 0 13 43
SPDR MSCI Europe Financials UCITS ETF IE00BKWQ0G16 0.30 STZ FNCL SPYZ STZX STZX 50 687 1,236
SPDR MSCI Europe Health Care UCITS ETF IE00BKWQ0H23 0.30 STW HLTH SPYH STWX STWX -18 -25 57
SPDR MSCI Europe Industrials UCITS ETF IE00BKWQ0J47 0.30 STQ NDUS SPYQ STQX STQX -5 0 95
SPDR MSCI Europe Materials UCITS ETF IE00BKWQ0L68 0.30 STP MTRL SPYP STPX STPX 0 4 60
SPDR MSCI Europe Technology UCITS ETF IE00BKWQ0K51 0.30 STK ITEC SPYK STKX STKX 0 0 16
SPDR MSCI Europe Telecommunications UCITS ETF IE00BKWQ0N82 0.30 STT TELE SPYT STTX STTX -2 7 10
SPDR MSCI Europe Utilities UCITS ETF IE00BKWQ0P07 0.30 STU UTIL SPYU STUX STUX -6 -5 13
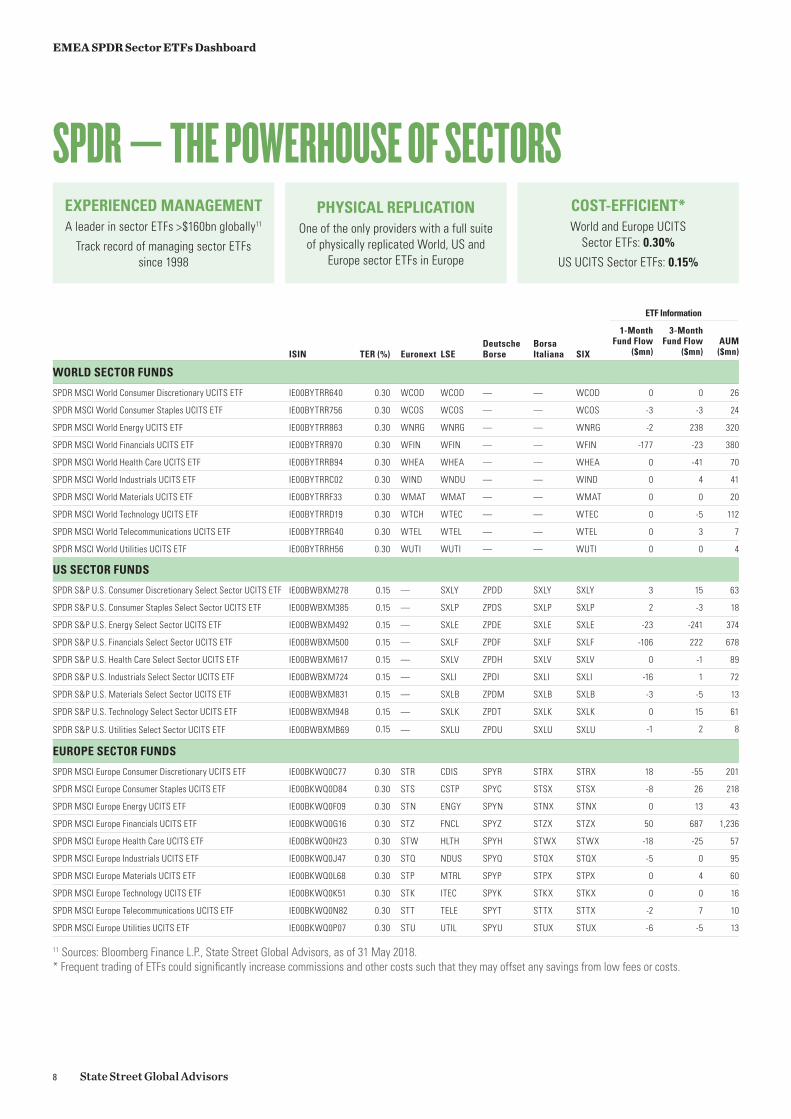
11 Sources: Bloomberg Finance L.P., State Street Global Advisors, as of 31 May 2018.* Frequent trading of ETFs could significantly increase commissions and other costs such that they may offset any savings from low fees or costs.
EXPERIENCED MANAGEMENTA leader in sector ETFs >$160bn globally11
Track record of managing sector ETFs since 1998
PHYSICAL REPLICATIONOne of the only providers with a full suite
of physically replicated World, US and Europe sector ETFs in Europe
COST-EFFICIENT*World and Europe UCITS
Sector ETFs: 0.30%
US UCITS Sector ETFs: 0.15%
SPDR — THE POWERHOUSE OF SECTORS
8 State Street Global Advisors
EMEA SPDR Sector ETFs Dashboard
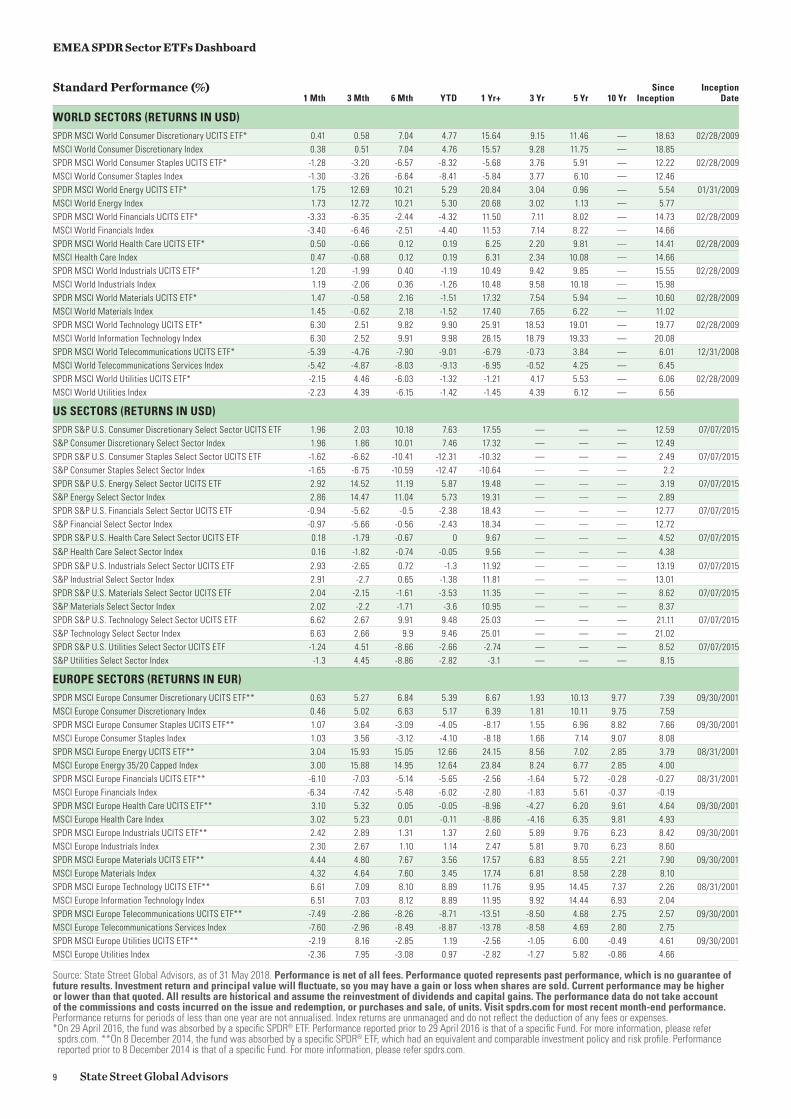
1 Mth 3 Mth 6 Mth YTD 1 Yr+ 3 Yr 5 Yr 10 YrSince
InceptionInception
Date
WORLD SECTORS (RETURNS IN USD)SPDR MSCI World Consumer Discretionary UCITS ETF* 0.41 0.58 7.04 4.77 15.64 9.15 11.46 — 18.63 02/28/2009MSCI World Consumer Discretionary Index 0.38 0.51 7.04 4.76 15.57 9.28 11.75 — 18.85SPDR MSCI World Consumer Staples UCITS ETF* -1.28 -3.20 -6.57 -8.32 -5.68 3.76 5.91 — 12.22 02/28/2009MSCI World Consumer Staples Index -1.30 -3.26 -6.64 -8.41 -5.84 3.77 6.10 — 12.46SPDR MSCI World Energy UCITS ETF* 1.75 12.69 10.21 5.29 20.84 3.04 0.96 — 5.54 01/31/2009MSCI World Energy Index 1.73 12.72 10.21 5.30 20.68 3.02 1.13 — 5.77SPDR MSCI World Financials UCITS ETF* -3.33 -6.35 -2.44 -4.32 11.50 7.11 8.02 — 14.73 02/28/2009MSCI World Financials Index -3.40 -6.46 -2.51 -4.40 11.53 7.14 8.22 — 14.66SPDR MSCI World Health Care UCITS ETF* 0.50 -0.66 0.12 0.19 6.25 2.20 9.81 — 14.41 02/28/2009MSCI Health Care Index 0.47 -0.68 0.12 0.19 6.31 2.34 10.08 — 14.66SPDR MSCI World Industrials UCITS ETF* 1.20 -1.99 0.40 -1.19 10.49 9.42 9.85 — 15.55 02/28/2009MSCI World Industrials Index 1.19 -2.06 0.36 -1.26 10.48 9.58 10.18 — 15.98SPDR MSCI World Materials UCITS ETF* 1.47 -0.58 2.16 -1.51 17.32 7.54 5.94 — 10.60 02/28/2009MSCI World Materials Index 1.45 -0.62 2.18 -1.52 17.40 7.65 6.22 — 11.02SPDR MSCI World Technology UCITS ETF* 6.30 2.51 9.82 9.90 25.91 18.53 19.01 — 19.77 02/28/2009MSCI World Information Technology Index 6.30 2.52 9.91 9.98 26.15 18.79 19.33 — 20.08SPDR MSCI World Telecommunications UCITS ETF* -5.39 -4.76 -7.90 -9.01 -6.79 -0.73 3.84 — 6.01 12/31/2008MSCI World Telecommunications Services Index -5.42 -4.87 -8.03 -9.13 -6.95 -0.52 4.25 — 6.45SPDR MSCI World Utilities UCITS ETF* -2.15 4.46 -6.03 -1.32 -1.21 4.17 5.53 — 6.06 02/28/2009MSCI World Utilities Index -2.23 4.39 -6.15 -1.42 -1.45 4.39 6.12 — 6.56
US SECTORS (RETURNS IN USD)SPDR S&P U.S. Consumer Discretionary Select Sector UCITS ETF 1.96 2.03 10.18 7.63 17.55 — — — 12.59 07/07/2015S&P Consumer Discretionary Select Sector Index 1.96 1.86 10.01 7.46 17.32 — — — 12.49SPDR S&P U.S. Consumer Staples Select Sector UCITS ETF -1.62 -6.62 -10.41 -12.31 -10.32 — — — 2.49 07/07/2015S&P Consumer Staples Select Sector Index -1.65 -6.75 -10.59 -12.47 -10.64 — — — 2.2SPDR S&P U.S. Energy Select Sector UCITS ETF 2.92 14.52 11.19 5.87 19.48 — — — 3.19 07/07/2015S&P Energy Select Sector Index 2.86 14.47 11.04 5.73 19.31 — — — 2.89SPDR S&P U.S. Financials Select Sector UCITS ETF -0.94 -5.62 -0.5 -2.38 18.43 — — — 12.77 07/07/2015S&P Financial Select Sector Index -0.97 -5.66 -0.56 -2.43 18.34 — — — 12.72SPDR S&P U.S. Health Care Select Sector UCITS ETF 0.18 -1.79 -0.67 0 9.67 — — — 4.52 07/07/2015
S&P Health Care Select Sector Index 0.16 -1.82 -0.74 -0.05 9.56 — — — 4.38
SPDR S&P U.S. Industrials Select Sector UCITS ETF 2.93 -2.65 0.72 -1.3 11.92 — — — 13.19 07/07/2015S&P Industrial Select Sector Index 2.91 -2.7 0.65 -1.38 11.81 — — — 13.01SPDR S&P U.S. Materials Select Sector UCITS ETF 2.04 -2.15 -1.61 -3.53 11.35 — — — 8.62 07/07/2015S&P Materials Select Sector Index 2.02 -2.2 -1.71 -3.6 10.95 — — — 8.37SPDR S&P U.S. Technology Select Sector UCITS ETF 6.62 2.67 9.91 9.48 25.03 — — — 21.11 07/07/2015S&P Technology Select Sector Index 6.63 2.66 9.9 9.46 25.01 — — — 21.02SPDR S&P U.S. Utilities Select Sector UCITS ETF -1.24 4.51 -8.66 -2.66 -2.74 — — — 8.52 07/07/2015S&P Utilities Select Sector Index -1.3 4.45 -8.86 -2.82 -3.1 — — — 8.15
EUROPE SECTORS (RETURNS IN EUR)SPDR MSCI Europe Consumer Discretionary UCITS ETF** 0.63 5.27 6.84 5.39 6.67 1.93 10.13 9.77 7.39 09/30/2001MSCI Europe Consumer Discretionary Index 0.46 5.02 6.63 5.17 6.39 1.81 10.11 9.75 7.59SPDR MSCI Europe Consumer Staples UCITS ETF** 1.07 3.64 -3.09 -4.05 -8.17 1.55 6.96 8.82 7.66 09/30/2001MSCI Europe Consumer Staples Index 1.03 3.56 -3.12 -4.10 -8.18 1.66 7.14 9.07 8.08SPDR MSCI Europe Energy UCITS ETF** 3.04 15.93 15.05 12.66 24.15 8.56 7.02 2.85 3.79 08/31/2001MSCI Europe Energy 35/20 Capped Index 3.00 15.88 14.95 12.64 23.84 8.24 6.77 2.85 4.00SPDR MSCI Europe Financials UCITS ETF** -6.10 -7.03 -5.14 -5.65 -2.56 -1.64 5.72 -0.28 -0.27 08/31/2001MSCI Europe Financials Index -6.34 -7.42 -5.48 -6.02 -2.80 -1.83 5.61 -0.37 -0.19SPDR MSCI Europe Health Care UCITS ETF** 3.10 5.32 0.05 -0.05 -8.96 -4.27 6.20 9.61 4.64 09/30/2001MSCI Europe Health Care Index 3.02 5.23 0.01 -0.11 -8.86 -4.16 6.35 9.81 4.93SPDR MSCI Europe Industrials UCITS ETF** 2.42 2.89 1.31 1.37 2.60 5.89 9.76 6.23 8.42 09/30/2001MSCI Europe Industrials Index 2.30 2.67 1.10 1.14 2.47 5.81 9.70 6.23 8.60SPDR MSCI Europe Materials UCITS ETF** 4.44 4.80 7.67 3.56 17.57 6.83 8.55 2.21 7.90 09/30/2001MSCI Europe Materials Index 4.32 4.64 7.60 3.45 17.74 6.81 8.58 2.28 8.10SPDR MSCI Europe Technology UCITS ETF** 6.61 7.09 8.10 8.89 11.76 9.95 14.45 7.37 2.26 08/31/2001MSCI Europe Information Technology Index 6.51 7.03 8.12 8.89 11.95 9.92 14.44 6.93 2.04SPDR MSCI Europe Telecommunications UCITS ETF** -7.49 -2.86 -8.26 -8.71 -13.51 -8.50 4.68 2.75 2.57 09/30/2001MSCI Europe Telecommunications Services Index -7.60 -2.96 -8.49 -8.87 -13.78 -8.58 4.69 2.80 2.75SPDR MSCI Europe Utilities UCITS ETF** -2.19 8.16 -2.85 1.19 -2.56 -1.05 6.00 -0.49 4.61 09/30/2001MSCI Europe Utilities Index -2.36 7.95 -3.08 0.97 -2.82 -1.27 5.82 -0.86 4.66
Standard Performance (%)
Source: State Street Global Advisors, as of 31 May 2018. Performance is net of all fees. Performance quoted represents past performance, which is no guarantee of future results. Investment return and principal value will fluctuate, so you may have a gain or loss when shares are sold. Current performance may be higher or lower than that quoted. All results are historical and assume the reinvestment of dividends and capital gains. The performance data do not take account of the commissions and costs incurred on the issue and redemption, or purchases and sale, of units. Visit spdrs.com for most recent month-end performance. Performance returns for periods of less than one year are not annualised. Index returns are unmanaged and do not reflect the deduction of any fees or expenses.* On 29 April 2016, the fund was absorbed by a specific SPDR® ETF. Performance reported prior to 29 April 2016 is that of a specific Fund. For more information, please refer spdrs.com. **On 8 December 2014, the fund was absorbed by a specific SPDR® ETF, which had an equivalent and comparable investment policy and risk profile. Performance reported prior to 8 December 2014 is that of a specific Fund. For more information, please refer spdrs.com.
9 State Street Global Advisors
EMEA SPDR Sector ETFs Dashboard
State Street Global Advisors
ssga.com | spdrs.comMarketing communication. For professional client use only.
For Investors in Austria: The offering of SPDR ETFs by the Company has been notified to the Financial Markets Authority (FMA) in accordance with section 139 of the Austrian Investment Funds Act. Prospective investors may obtain the current sales Prospectus, the articles of incorporation, the KIID as well as the latest annual and semi-annual reportfree of charge from State Street Global Advisors GmbH, Brienner Strasse 59, D-80333 Munich. T: +49 (0)89-55878-400. F: +49 (0)89-55878-440. For Investors in Finland: The offering of funds by the Companies has been notified to the Financial Supervision Authority in accordance with Section 127 of the Act on Common Funds (29.1.1999/48) and by virtue of confirmation from the Financial Supervision Authority the Companies may publicly distribute its Shares in Finland. Certain information and documents that the Companies must publish in Ireland pursuant to applicable Irish law are translated into Finnish and are available for Finnish investors by contacting State Street Custodial Services (Ireland) Limited, 78 Sir John Rogerson’s Quay, Dublin 2, Ireland. For Investors in France: This document does not constitute an offer or request to purchase shares in the Companies. Any subscription for shares shall be ade in accordance with the terms and conditions specified in the complete Prospectuses, the KIID, the addenda as well as the Companies’ Supplements. These documents are available from the Company centralising correspondent: State Street Banque S.A., 23-25 rue Delariviere- Lefoullon, 92064 Paris La Defense Cedex or on the French part of the site spdrs.com. The Companies re undertakings for collective investment in transferable securities (UCITS) governed by Irish law and accredited by the Central Bank of Ireland as a UCITS n accordance with European Regulations. European Directive no. 2014/91/EU dated 23 July 2014 on UCITS, as amended, established common rules pursuant to the cross-border marketing of UCITS with which they duly comply. This common base does not exclude differentiated implementation. This is why a European UCITS can be sold in France even though its activity does not comply with rules identical to those governing the approval of this type of product in France. The offering of these compartments has been notified to the Autorité des Marchés Financiers (AMF) in accordance with article L214-2-2 of the French Monetary and Financial Code. For Investors in Germany: The offering of SPDR ETFs by the Companies has been notified to the Bundesanstalt für Finanzdienstleistungsaufsicht (BaFin) in accordance with section 312 of the German Investment Act. Prospective investors may obtain the current sales Prospectuses, the articles of incorporation, the KIIDs as well as the latest annual and semiannual report free of charge from State Street Global Advisors GmbH, Brienner Strasse 59, D-80333 Munich. T: +49 (0)89-55878-400. Ireland Entity: State Street Global Advisors Ireland Limited is regulated by the Central Bank of Ireland. Registered office address 78 Sir John Rogerson’s Quay, Dublin 2. Registered number 145221. T: +353 (0)1 776 3000. F: +353 (0)1 776 3300. Web: ssga.com.Italy Entity: State Street Global Advisors Limited, Milan Branch (Sede Secondaria di Milano) is a branch of State Street Global Advisors Limited, a company registered in the UK, authorised and regulated by the Financial Conduct Authority (FCA ), with a capital of GBP 62’350’000, and whose registered office is at 20 Churchill Place, London E14 5HJ. State Street Global Advisors Limited, Milan Branch (Sede Secondaria di Milano), is registered in Italy with company number 06353340968 - R.E.A. 1887090 and VAT number 06353340968 and whose office is at Via dei Bossi, 4 - 20121 Milano, Italy. T: 39 02 32066 100. F: 39 02 32066 155.
For Investors in Luxembourg: The Companies have been notified to the Commission de Surveillance du Secteur Financier in Luxembourg in order to market their shares for sale to the public in Luxembourg and the Companies are notified Undertakings in Collective Investment for Transferable Securities (UCITS). For Investors in the Netherlands: This communication is directed at qualified investors within the meaning of Section 2:72 of the Dutch Financial Markets Supervision Act (Wet op het financieel toezicht) as amended. The products and services to which this communication relates are only available to such persons and persons of any other description should not rely on this communication. Distribution of this document does not trigger a licence requirement for the Companies or SSGA in the Netherlands and consequently no prudential and conduct of business supervision will be exercised over the Companies or SSGA by the Dutch Central Bank (De Nederlandsche Bank N.V.) and the Dutch Authority for the Financial Markets (Stichting Autoriteit Financiële Markten). The Companies have completed their notification to the Authority Financial Markets in the Netherlands in order to market their shares for sale to the public in the Netherlands and the Companies are, accordingly, investment institutions (beleggingsinstellingen) according to Section 2:72 Dutch Financial Markets Supervision Act of Investment Institutions. For Investors in Norway: The offering of SPDR ETFs by the Companies has been notified to the Financial Supervisory Authority of Norway (Kredittilsynet) in accordance with applicable Norwegian Securities Funds legislation. By virtue of a confirmation letter from the Financial Supervisory Authority dated 28 March 2013 (16 October 2013 for umbrella II) the Companies may market and sell their shares in Norway. For Investors in Spain: State Street Global Advisors SPDR ETFs Europe I and II plc have been authorised for public distribution in Spain and are registered with the Spanish Securities Market Commission (Comisión Nacional del Mercado de Valores) under no.1244 and no.1242. Before investing, investors may obtain a copy of the Prospectus and Key Investor Information Documents, the Marketing Memoranda, the fund rules or instruments of incorporation as well as the annual and semi-annual reports of State Street Global Advisors SPDR ETFs Europe I and II plc from Cecabank, S.A. Alcalá 27, 28014 Madrid (Spain) who is the Spanish Representative, Paying Agent and distributor in Spain or at spdrs.com. The authorised Spanish distributor of State Street Global Advisors SPDR ETFs is available on the website of the Securities Market Commission (Comisión Nacional del Mercado de Valores).For Investors in Switzerland: The collective investment schemes referred to herein are collective investment schemes under Irish law. Prospective investors may obtain the current sales prospectus, the articles of incorporation, the KIID as well as the latest annual and semi-annual reports free of charge from the Swiss Representative and Paying Agent, State Street Bank International GmbH, Munich, Zurich Branch, Beethovenstrasse 19, 8027 Zurich as well as from the main distributor in Switzerland, State Street Global Advisors AG, Beethovenstrasse 19, 8027 Zurich. Before investing please read the prospectus and the KIID, copies of which can be obtained from the Swiss representative, or at spdrs.com.For Investors in the UK: The Companies are recognised schemes under Section 264 of the Financial Services and Markets Act 2000 (“the Act”) and are directed at ‘professional clients’ in the UK (within the meaning of the rules of the Act) who are deemed both knowledgeable and experienced in matters relating to investments. The products and services to which this communication relates are only available to such persons and persons of any other description should not rely on this communication. Many of the protections provided by the UK regulatory system do not apply to the operation of the Companies, and compensation will not be available under the UK Financial Services Compensation Scheme.
State Street Global Advisors© 2018 State Street Corporation. All Rights Reserved.
ID13142-1990314.7.1.EMEA.INST 0618 Exp. Date: 31/07/2018
Investing involves risk including the risk of loss of principal. The whole or any part of this work may not be reproduced, copied or transmitted or any of its contents disclosed to third parties without SSGA’s express written consent.This communication is directed at professional clients (this includes eligible counterparties as defined by the Appropriate EU Regulator or applicable Swiss Regulation) who are deemed both knowledgeable and experienced in matters relating to investments. The products and services to which this communication relates are only available to such persons and persons of any other description (including retail clients) should not rely on this communication. The trademarks and service marks referenced herein are the property of their respective owners. Third party data providers make no warranties or representations of any kind relating to the accuracy, completeness or timeliness of the data and have no liability for damages of any kind relating to the use of such data. Important Information This document has been issued by State Street Global Advisors Limited (“SSGA”). Authorised and regulated by the Financial Conduct Authority. Registered No. 2509928. VAT No. 5776591 81. Registered office: 20 Churchill Place, Canary Wharf, London, E14 5HJ. T: 020 3395 6000. F: 020 3395 6350 Web: ssga.com.SPDR ETFs is the exchange traded funds (“ETF”) platform of State Street Global Advisors and is comprised of funds that have been authorised by European regulatory authorities as open-ended UCITS investment companies (“Companies”). SSGA SPDR ETFs Europe I and II plc issue SPDR ETFs, and is an open-ended investment company with variable capital having segregated liability between its sub-funds. The Company is organised as an Undertaking for Collective Investments in Transferable Securities (UCITS) under the laws of Ireland and authorised as a UCITS by the Central Bank of Ireland. This document is not, and under no circumstances is to be construed as, an offer or any other step in furtherance of a public offering in the United States, Canada or any province or territory thereof, where the Companies are not authorised or registered for distribution and where the Companies prospectuses have not been filed with any securities commission or regulatory authority. Neither this document nor any copy hereof should be taken, transmitted or distributed (directly or indirectly) into the United States. The Companies have not and will not be registered under the Investment Company Act of 1940 or qualified under any applicable state securities statutes. The information provided does not constitute investment advice as such term is defined under the Markets in Financial Instruments Directive (2014/65/EU) or applicable Swiss regulation and it should not be relied on as such. It should not be considered a solicitation to buy or an offer to sell any investment. It does not take into account any investor‘s or potential investor‘s particular investment objectives, strategies, tax status, risk appetite or investment horizon. If you require investment advice you should consult your tax and financial or other professional advisor. All material has been obtained from sources believed to be reliable. There is no representation or warranty as to the accuracy of the information and State Street shall have no liability for decisions based on such information. All the index performance results referred to are provided exclusively for comparison purposes only. It should not be assumed that they represent the performance of any particular investment.
Exchange traded funds (ETFs) trade like stocks, are subject to investment risk and will fluctuate in market value. The value of the investment can go down as well as up and the return upon the investment will therefore be variable. Changes in exchange rates may have an adverse effect on the value, price or income of an investment. Further, there is no guarantee an ETF will achieve its investment objective. Concentrated investments in a particular sector or industry tend to be more volatile than the overall market and increases risk that events negatively affecting such sectorsor industries could reduce returns, potentially causing the value of the Fund’s shares to decrease. Select Sector SPDR Funds bear a higher level of risk than more broadly diversified funds. All ETFs are subject to risk, including the possible loss of principal. Sector ETFs products are also subject to sector risk and non-diversification risk, which generally results in greater price fluctuations than the overall market. Equity securities may fluctuate in value in response to the activities of individual companies and general market and economic conditions. Investing in foreign domiciled securities may involve risk of capital loss from unfavourable fluctuation in currency values, withholding taxes, from differences in generally accepted accounting principles or from economic or political instability in other nations. The views expressed in this material are the views of Rebecca Chesworth through the period ended 04 May 2018 and are subject to change based on market and other conditions. The financial products referred to herein are not sponsored, endorsed, or promoted by MSCI and MSCI bears no liability with respect to any such financial products or any index on which such financial products are based. The Prospectus contains a more detailed description of the limited relationship MSCI has with SSGA and any related financial products. This information should not be considered a recommendation to invest in a particular sector or to buy or sell any security shown. It is not known whether the sectors or securities shown will be profitable in the future.Standard & Poor’s, S&P and SPDR are registered trademarks of Standard & Poor’s Financial Services LLC (S&P); Dow Jones is a registered trademark of Dow Jones Trademark Holdings LLC (Dow Jones); and these trademarks have been licensed for use by S&P Dow Jones Indices LLC (SPDJI) and sublicensed for certain purposes by State Street Corporation. State Street Corporation’s financial products are not sponsored, endorsed, sold or promoted by SPDJI, Dow Jones, S&P, their respective affiliates and third party licensors and none of such parties make any representation regarding the advisability of investing in such product(s) nor do they have any liability in relation thereto, including for any errors, omissions, or interruptions of any index. The information contained in this communication is not a research recommendation or ‘investment research’ and is classified as a ‘Marketing Communication’ in accordance with the Markets in Financial Instruments Directive (2014/65/EU) or applicable Swiss regulation. This means that this marketing communication (a) has not been prepared in accordance with legal requirements designed to promote the independence of investment research (b) is not subject to any prohibition on dealing ahead of the dissemination of investment research. You should obtain and read the SPDR prospectus and relevant Key Investor Information Document (KIID) prior to investing, which may be obtained from spdrs.com. These include further details relating to the SPDR funds, including information relating to costs, risks and where the funds are authorised for sale.