Embed Size (px)
Citation preview
SPE 159991
Rock Classification in Carbonate Reservoirs Based on Static and Dynamic Petrophysical Properties Estimated from Conventional Well Logs Chicheng Xu, SPE, The University of Texas at Austin; Zoya Heidari, SPE, Texas A&M University; Carlos Torres-Verdín, SPE, The University of Texas at Austin
Copyright 2012, Society of Petroleum Engineers This paper was prepared for presentation at the SPE Annual Technical Conference and Exhibition held in San Antonio, Texas, USA, 8-10 October 2012. This paper was selected for presentation by an SPE program committee following review of information contained in an abstract submitted by the author(s). Contents of the paper have not been reviewed by the Society of Petroleum Engineers and are subject to correction by the author(s). The material does not necessarily reflect any position of the Society of Petroleum Engineers, its officers, or members. Electronic reproduction, distribution, or storage of any part of this paper without the written consent of the Society of Petroleum Engineers is prohibited. Permission to reproduce in print is restricted to an abstract of not more than 300 words; illustrations may not be copied. The abstract must contain conspicuous acknowledgment of SPE copyright.
Abstract Rock typing in carbonate reservoirs is challenging due to high spatial heterogeneity and complex pore structure. In extreme cases, conventional rock typing methods such as Leverett’s J-function, Winland’s R35, and flow zone indicator are inadequate to capture the heterogeneity and complexity of carbonate petrofacies. Furthermore, these methods are based on core measurements, hence are not applicable to uncored reservoir zones. This paper introduces a new method for petrophysical rock classification in carbonate reservoirs that honors multiple well logs and emphasizes the signature of mud-filtrate invasion. The method classifies rocks based on both static and dynamic petrophysical properties. An inversion-based algorithm is implemented to simultaneously estimate mineralogy, porosity, and water saturation from well logs. We numerically simulate the process of mud-filtrate invasion in each rock type and quantify the corresponding effects on nuclear and resistivity measurements to derive invasion-induced well-log attributes, which are subsequently integrated into the rock classification. Under favorable conditions, the interpretation method advanced in this paper can distinguish bimodal from uni-modal behavior in saturation-dependent capillary pressure otherwise only possible with special core analysis. We successfully apply the new method to a mixed clastic-carbonate sequence in the Hugoton gas field, Kansas. Rock types derived with the new method are in good agreement with lithofacies described from core samples. The distribution of permeability and saturation estimated from well-log-derived rock types agrees with routine core measurements, with the corresponding uncertainty significantly reduced when compared to results obtained with conventional porosity-permeability correlations. Introduction Rock typing is critical for decision-making in mature fields for optimizing production. Conventional rock typing methods are highly dependent on core data, such as Leverett’s J-function (Leverett, 1941), Winland’s R35 (Pittman, 1992), flow zone indicator (FZI) (Amaefule, 1993), and rock fabrics number (RFN) (Lucia, 1999). New techniques adopt intelligent systems such as artificial neural networks to classify rock types using well logs, but require significant amounts of data, including both core measurements and well logs, for training (Dubois et al., 2006; Doveton, 2012). Conventional log-based rock typing techniques, however, often overlook dynamic petrophysical properties of rocks (e.g., permeability and saturation-dependent capillary pressure and relative permeability) in the absence of core measurements. For instance, assessment of permeability based on well logs has been only possible with empirical formulae, which correlate permeability to static petrophysical properties such as porosity and irreducible water saturation. The latter methods often yield large uncertainty in permeability assessments of carbonate formations. Recently developed methods take into account the physics of mud-filtrate invasion and its effect on well logs to estimate permeability (Salazar, et al., 2006) and saturation-dependent capillary pressure and relative permeability (Heidari and Torres-Verdín, 2010) using well logs. Similar work was also performed in carbonate formations (George et al., 2003; Miranda et al., 2009). Recent publications implemented such simulation-based techniques for reliable
2 SPE 159991
well-log-based rock typing in siliciclastic sedimentary sequences (Gandhi et al., 2010; Heidari et al., 2011). Rock typing in carbonate reservoirs, however, remains a challenging and unsolved topic among petrophysicists. In carbonate formations, various attributes can be used to distinguish rock types, such as lithology, pore-size distribution, fractures, vugs, micro-porosity, and non-connected pore space. In addition to petrophysical evaluation, lithology assessment is also difficult in carbonate formations due to the complex mineral composition. Porosity and permeability correlations are commonly not reliable in carbonates, which renders conventional well-log interpretation techniques unsatisfactory for permeability estimation. It has been shown that dynamic petrophysical properties such as saturation-dependent capillary pressure and relative permeability should also be considered in carbonate rock typing (Al-Farisi et al., 2009), which has been impossible thus far in the absence of significant amounts of special core measurements. All these technical challenges have made rock typing in carbonate formations extremely dependent on core measurements. The rapid variation of compositional and petrophysical properties in carbonate formations, however, makes it impossible for core measurements to capture all the rock types exhibited by spatially heterogeneous carbonates. Our proposed rock typing method for carbonate formations honors the geology of the reservoirs as well as static and dynamic petrophysical properties estimated from logs. The first step after pre-processing of the data is to apply a depth-by-depth nonlinear inversion of well logs to estimate porosity, water saturation, volumetric concentration of shale, and volumetric concentrations of mineral constituents (Heidari et al., 2012). We then use Leverett’s method to classify hydraulic rock types based on core measurements. The identified hydraulic rock types are then used to rank dynamic rock-fluid properties (i.e., saturation-dependent capillary pressure and relative permeability). In the next step, we investigate the effects of dynamic petrophysical properties (saturation-dependent capillary pressure and relative permeability) for different rock facies on well logs, by invoking the physics of mud-filtrate invasion followed by numerical simulation of well logs. The characterization of invasion-induced log signatures can be integrated into rock classification based on conventional well logs. Permeability is then estimated via porosity-permeability correlations specific for each rock type. We apply the proposed method to data acquired in the Hugoton gas field (Kansas), which comprises mixed clastic-carbonate gas-bearing rock sequences, to classify petrophysical rock types. The method introduced in this paper provides reliable rock classification of carbonate reservoirs, by taking into account both static and dynamic petrophysical properties; it only resorts to core measurements for assessment of basic formation properties such as Archie’s constants. We take into account both pore structure and fluid-flow mechanisms in rock typing to reduce uncertainty in petrophysical assessments. Reliable permeability assessments are also possible by assimilating rock types in type-dependent porosity-permeability correlations. Description of Methods Petrophysical Analysis Using Nonlinear Joint Inversion of Well Logs. A recent publication introduced depth-by-depth and bed-by-bed nonlinear joint inversion methods for assessment of petrophysical and compositional formation properties (Heidari et al., 2012). The main advantage of these methods over conventional multi-mineral solvers is their ability to take into account the nonlinear correlation between the volumetric concentration of mineral/fluid constituents and well logs, which becomes important in the presence of both gas and complex lithology. Furthermore, the bed-by-bed inversion technique enables corrections of shoulder-bed effects on low-resolution logs while performing the estimation of mineral/fluid concentrations. In this paper, we estimate compositional and petrophysical properties using depth-by-depth nonlinear joint inversion of well logs (Heidari et al., 2012). The reason for this choice over conventional multi-mineral solvers is the presence of gas and complex mineral composition in the studied field example, where conventional multi-mineral solvers are not accurate. In the field example studied here, the effect of shoulder beds on well logs is not significant in the pay zones. Accordingly, we implement a depth-by-depth joint inversion of well logs instead of bed-by-bed interpretation in order to reduce CPU time. The depth-by-depth nonlinear joint inversion of well logs takes conventional well logs as input. It then applies an inversion of physical properties of the formation (i.e., electrical conductivity, photoelectric factor, density, neutron migration length, and U, Th, and K concentrations) to estimate petrophysical and compositional properties (i.e., porosity, water saturation, volumetric concentration of shale, and volumetric concentrations of mineral constituents) at each well-log sampling point. In doing so, we use Schlumberger’s software, SNUPAR1, to estimate photoelectric factor and neutron migration length based on volumetric concentrations of mineral and fluid components of the formation and their chemical composition.
1 Mark of Schlumberger
SPE 159991 3
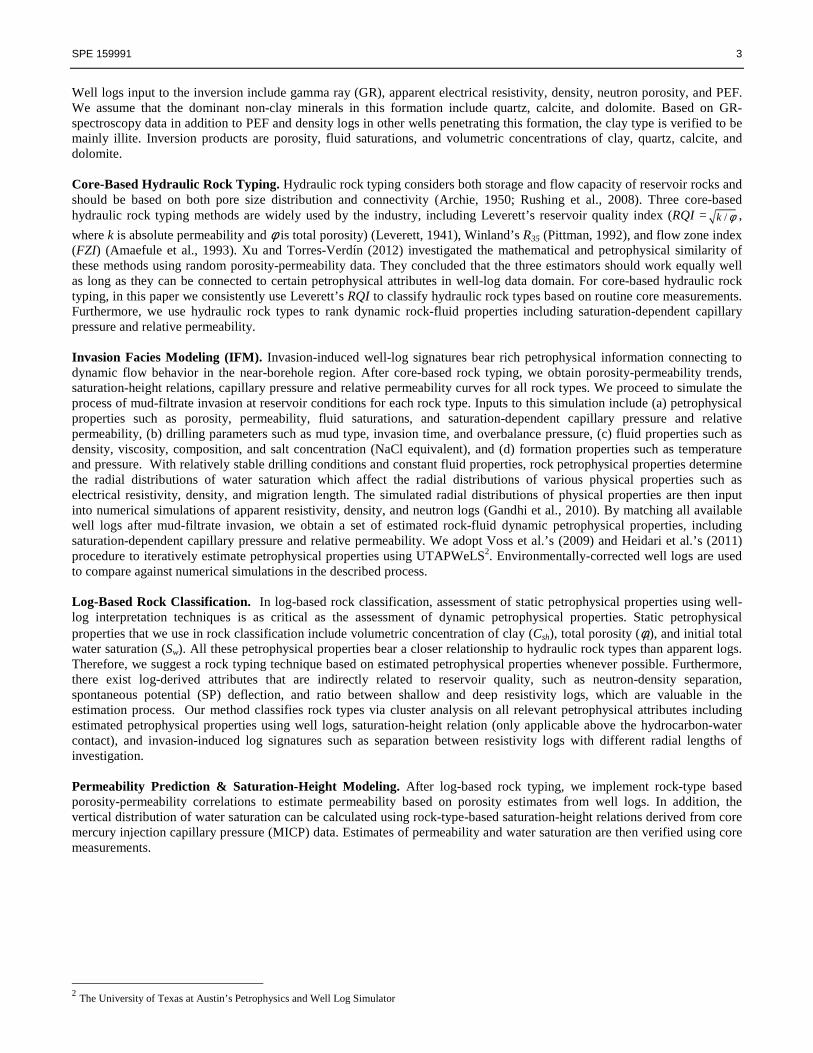
Well logs input to the inversion include gamma ray (GR), apparent electrical resistivity, density, neutron porosity, and PEF. We assume that the dominant non-clay minerals in this formation include quartz, calcite, and dolomite. Based on GR-spectroscopy data in addition to PEF and density logs in other wells penetrating this formation, the clay type is verified to be mainly illite. Inversion products are porosity, fluid saturations, and volumetric concentrations of clay, quartz, calcite, and dolomite. Core-Based Hydraulic Rock Typing. Hydraulic rock typing considers both storage and flow capacity of reservoir rocks and should be based on both pore size distribution and connectivity (Archie, 1950; Rushing et al., 2008). Three core-based hydraulic rock typing methods are widely used by the industry, including Leverett’s reservoir quality index (RQI = /k φ ,
where k is absolute permeability and φ is total porosity) (Leverett, 1941), Winland’s R35 (Pittman, 1992), and flow zone index (FZI) (Amaefule et al., 1993). Xu and Torres-Verdín (2012) investigated the mathematical and petrophysical similarity of these methods using random porosity-permeability data. They concluded that the three estimators should work equally well as long as they can be connected to certain petrophysical attributes in well-log data domain. For core-based hydraulic rock typing, in this paper we consistently use Leverett’s RQI to classify hydraulic rock types based on routine core measurements. Furthermore, we use hydraulic rock types to rank dynamic rock-fluid properties including saturation-dependent capillary pressure and relative permeability. Invasion Facies Modeling (IFM). Invasion-induced well-log signatures bear rich petrophysical information connecting to dynamic flow behavior in the near-borehole region. After core-based rock typing, we obtain porosity-permeability trends, saturation-height relations, capillary pressure and relative permeability curves for all rock types. We proceed to simulate the process of mud-filtrate invasion at reservoir conditions for each rock type. Inputs to this simulation include (a) petrophysical properties such as porosity, permeability, fluid saturations, and saturation-dependent capillary pressure and relative permeability, (b) drilling parameters such as mud type, invasion time, and overbalance pressure, (c) fluid properties such as density, viscosity, composition, and salt concentration (NaCl equivalent), and (d) formation properties such as temperature and pressure. With relatively stable drilling conditions and constant fluid properties, rock petrophysical properties determine the radial distributions of water saturation which affect the radial distributions of various physical properties such as electrical resistivity, density, and migration length. The simulated radial distributions of physical properties are then input into numerical simulations of apparent resistivity, density, and neutron logs (Gandhi et al., 2010). By matching all available well logs after mud-filtrate invasion, we obtain a set of estimated rock-fluid dynamic petrophysical properties, including saturation-dependent capillary pressure and relative permeability. We adopt Voss et al.’s (2009) and Heidari et al.’s (2011) procedure to iteratively estimate petrophysical properties using UTAPWeLS2. Environmentally-corrected well logs are used to compare against numerical simulations in the described process. Log-Based Rock Classification. In log-based rock classification, assessment of static petrophysical properties using well-log interpretation techniques is as critical as the assessment of dynamic petrophysical properties. Static petrophysical properties that we use in rock classification include volumetric concentration of clay (Csh), total porosity (φt), and initial total water saturation (Sw). All these petrophysical properties bear a closer relationship to hydraulic rock types than apparent logs. Therefore, we suggest a rock typing technique based on estimated petrophysical properties whenever possible. Furthermore, there exist log-derived attributes that are indirectly related to reservoir quality, such as neutron-density separation, spontaneous potential (SP) deflection, and ratio between shallow and deep resistivity logs, which are valuable in the estimation process. Our method classifies rock types via cluster analysis on all relevant petrophysical attributes including estimated petrophysical properties using well logs, saturation-height relation (only applicable above the hydrocarbon-water contact), and invasion-induced log signatures such as separation between resistivity logs with different radial lengths of investigation. Permeability Prediction & Saturation-Height Modeling. After log-based rock typing, we implement rock-type based porosity-permeability correlations to estimate permeability based on porosity estimates from well logs. In addition, the vertical distribution of water saturation can be calculated using rock-type-based saturation-height relations derived from core mercury injection capillary pressure (MICP) data. Estimates of permeability and water saturation are then verified using core measurements.
2 The University of Texas at Austin’s Petrophysics and Well Log Simulator
4 SPE 159991
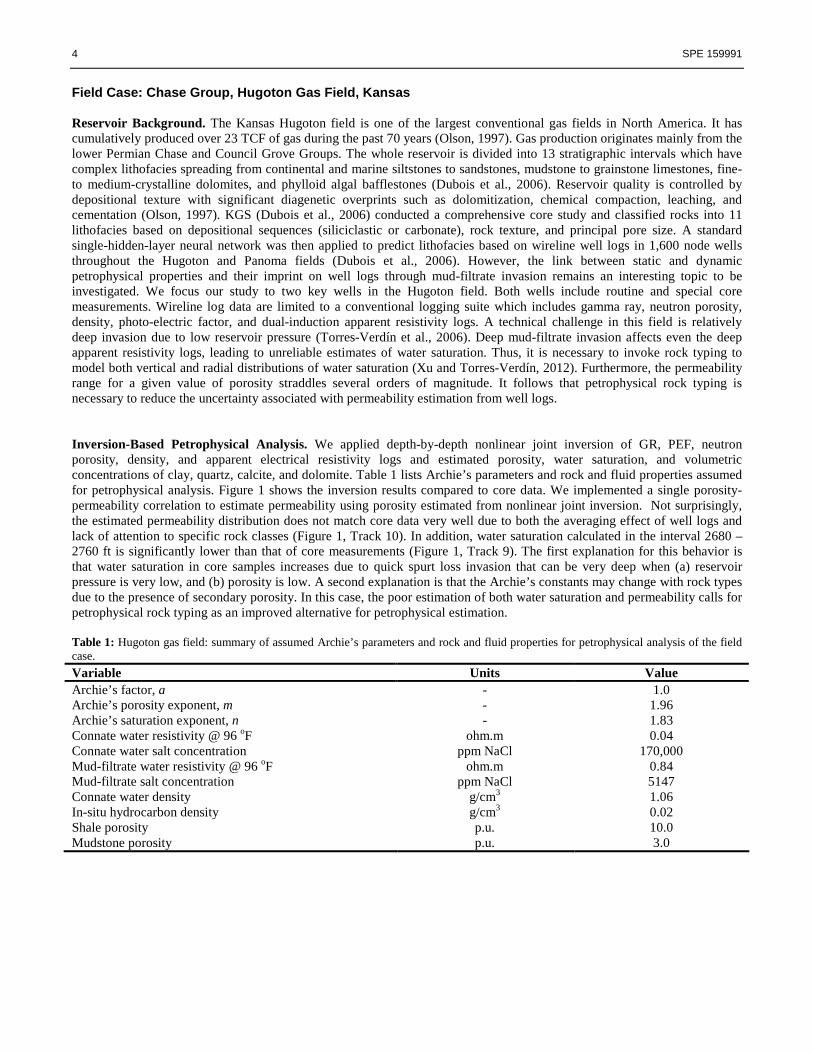
Field Case: Chase Group, Hugoton Gas Field, Kansas Reservoir Background. The Kansas Hugoton field is one of the largest conventional gas fields in North America. It has cumulatively produced over 23 TCF of gas during the past 70 years (Olson, 1997). Gas production originates mainly from the lower Permian Chase and Council Grove Groups. The whole reservoir is divided into 13 stratigraphic intervals which have complex lithofacies spreading from continental and marine siltstones to sandstones, mudstone to grainstone limestones, fine- to medium-crystalline dolomites, and phylloid algal bafflestones (Dubois et al., 2006). Reservoir quality is controlled by depositional texture with significant diagenetic overprints such as dolomitization, chemical compaction, leaching, and cementation (Olson, 1997). KGS (Dubois et al., 2006) conducted a comprehensive core study and classified rocks into 11 lithofacies based on depositional sequences (siliciclastic or carbonate), rock texture, and principal pore size. A standard single-hidden-layer neural network was then applied to predict lithofacies based on wireline well logs in 1,600 node wells throughout the Hugoton and Panoma fields (Dubois et al., 2006). However, the link between static and dynamic petrophysical properties and their imprint on well logs through mud-filtrate invasion remains an interesting topic to be investigated. We focus our study to two key wells in the Hugoton field. Both wells include routine and special core measurements. Wireline log data are limited to a conventional logging suite which includes gamma ray, neutron porosity, density, photo-electric factor, and dual-induction apparent resistivity logs. A technical challenge in this field is relatively deep invasion due to low reservoir pressure (Torres-Verdín et al., 2006). Deep mud-filtrate invasion affects even the deep apparent resistivity logs, leading to unreliable estimates of water saturation. Thus, it is necessary to invoke rock typing to model both vertical and radial distributions of water saturation (Xu and Torres-Verdín, 2012). Furthermore, the permeability range for a given value of porosity straddles several orders of magnitude. It follows that petrophysical rock typing is necessary to reduce the uncertainty associated with permeability estimation from well logs. Inversion-Based Petrophysical Analysis. We applied depth-by-depth nonlinear joint inversion of GR, PEF, neutron porosity, density, and apparent electrical resistivity logs and estimated porosity, water saturation, and volumetric concentrations of clay, quartz, calcite, and dolomite. Table 1 lists Archie’s parameters and rock and fluid properties assumed for petrophysical analysis. Figure 1 shows the inversion results compared to core data. We implemented a single porosity-permeability correlation to estimate permeability using porosity estimated from nonlinear joint inversion. Not surprisingly, the estimated permeability distribution does not match core data very well due to both the averaging effect of well logs and lack of attention to specific rock classes (Figure 1, Track 10). In addition, water saturation calculated in the interval 2680 – 2760 ft is significantly lower than that of core measurements (Figure 1, Track 9). The first explanation for this behavior is that water saturation in core samples increases due to quick spurt loss invasion that can be very deep when (a) reservoir pressure is very low, and (b) porosity is low. A second explanation is that the Archie’s constants may change with rock types due to the presence of secondary porosity. In this case, the poor estimation of both water saturation and permeability calls for petrophysical rock typing as an improved alternative for petrophysical estimation. Table 1: Hugoton gas field: summary of assumed Archie’s parameters and rock and fluid properties for petrophysical analysis of the field case.
Variable Units Value Archie’s factor, a - 1.0 Archie’s porosity exponent, m - 1.96 Archie’s saturation exponent, n - 1.83 Connate water resistivity @ 96 oF ohm.m 0.04 Connate water salt concentration ppm NaCl 170,000 Mud-filtrate water resistivity @ 96 oF ohm.m 0.84 Mud-filtrate salt concentration ppm NaCl 5147 Connate water density g/cm3 1.06 In-situ hydrocarbon density g/cm3 0.02 Shale porosity p.u. 10.0 Mudstone porosity p.u. 3.0
SPE 159991 5
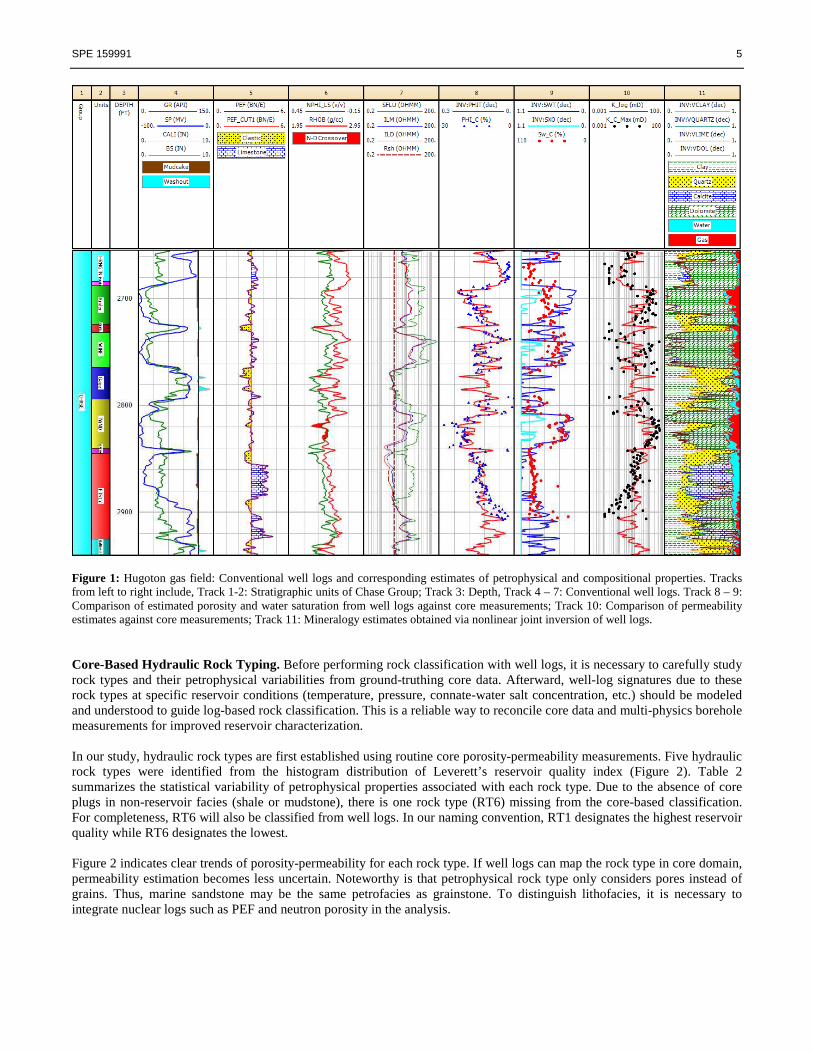
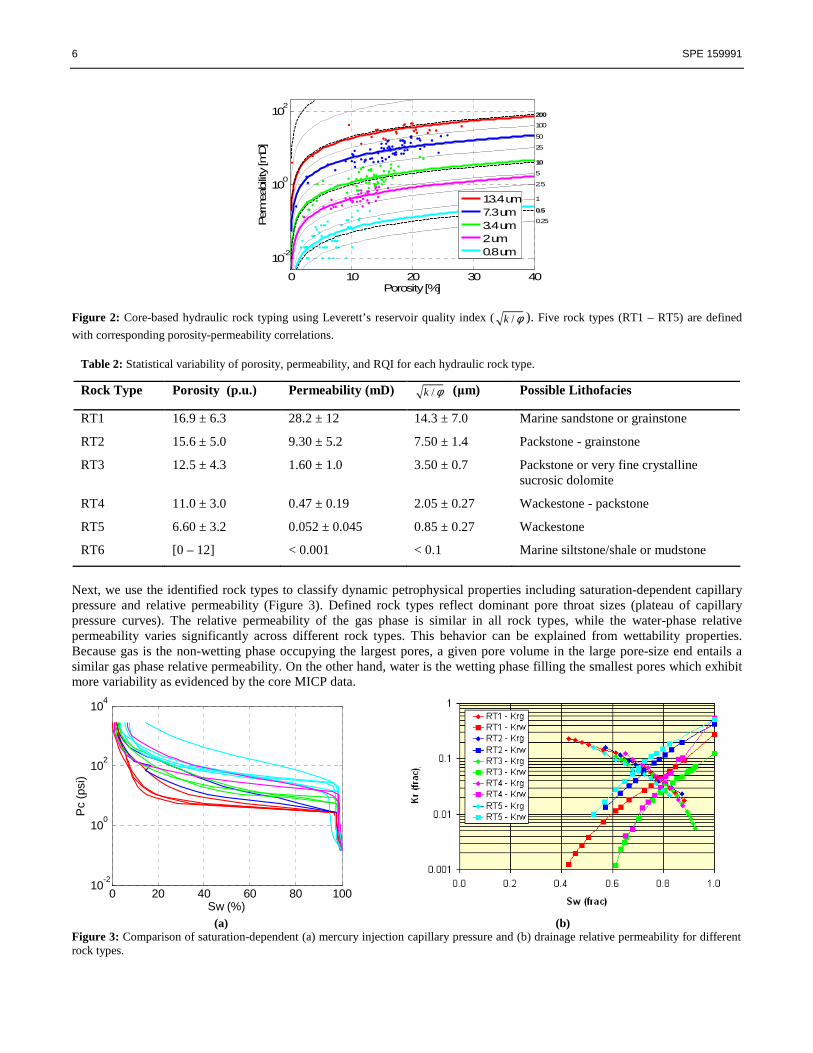
Figure 1: Hugoton gas field: Conventional well logs and corresponding estimates of petrophysical and compositional properties. Tracks from left to right include, Track 1-2: Stratigraphic units of Chase Group; Track 3: Depth, Track 4 – 7: Conventional well logs. Track 8 – 9: Comparison of estimated porosity and water saturation from well logs against core measurements; Track 10: Comparison of permeability estimates against core measurements; Track 11: Mineralogy estimates obtained via nonlinear joint inversion of well logs. Core-Based Hydraulic Rock Typing. Before performing rock classification with well logs, it is necessary to carefully study rock types and their petrophysical variabilities from ground-truthing core data. Afterward, well-log signatures due to these rock types at specific reservoir conditions (temperature, pressure, connate-water salt concentration, etc.) should be modeled and understood to guide log-based rock classification. This is a reliable way to reconcile core data and multi-physics borehole measurements for improved reservoir characterization. In our study, hydraulic rock types are first established using routine core porosity-permeability measurements. Five hydraulic rock types were identified from the histogram distribution of Leverett’s reservoir quality index (Figure 2). Table 2 summarizes the statistical variability of petrophysical properties associated with each rock type. Due to the absence of core plugs in non-reservoir facies (shale or mudstone), there is one rock type (RT6) missing from the core-based classification. For completeness, RT6 will also be classified from well logs. In our naming convention, RT1 designates the highest reservoir quality while RT6 designates the lowest. Figure 2 indicates clear trends of porosity-permeability for each rock type. If well logs can map the rock type in core domain, permeability estimation becomes less uncertain. Noteworthy is that petrophysical rock type only considers pores instead of grains. Thus, marine sandstone may be the same petrofacies as grainstone. To distinguish lithofacies, it is necessary to integrate nuclear logs such as PEF and neutron porosity in the analysis.
6 SPE 159991
0 10 20 30 40
10-2
100
102
0.25
0.5
1
2.5
5
10
25
50
100
200
Porosity [%]
Per
mea
bility
[mD]
13.4 um7.3 um3.4 um2 um0.8 um
Figure 2: Core-based hydraulic rock typing using Leverett’s reservoir quality index ( /k φ ). Five rock types (RT1 – RT5) are defined
with corresponding porosity-permeability correlations.
Table 2: Statistical variability of porosity, permeability, and RQI for each hydraulic rock type.
Rock Type Porosity (p.u.) Permeability (mD) /k φ (µm) Possible Lithofacies
RT1 16.9 ± 6.3 28.2 ± 12 14.3 ± 7.0 Marine sandstone or grainstone
RT2 15.6 ± 5.0 9.30 ± 5.2 7.50 ± 1.4 Packstone - grainstone
RT3 12.5 ± 4.3 1.60 ± 1.0 3.50 ± 0.7 Packstone or very fine crystalline sucrosic dolomite
RT4 11.0 ± 3.0 0.47 ± 0.19 2.05 ± 0.27 Wackestone - packstone
RT5 6.60 ± 3.2 0.052 ± 0.045 0.85 ± 0.27 Wackestone
RT6 [0 – 12] < 0.001 < 0.1 Marine siltstone/shale or mudstone
Next, we use the identified rock types to classify dynamic petrophysical properties including saturation-dependent capillary pressure and relative permeability (Figure 3). Defined rock types reflect dominant pore throat sizes (plateau of capillary pressure curves). The relative permeability of the gas phase is similar in all rock types, while the water-phase relative permeability varies significantly across different rock types. This behavior can be explained from wettability properties. Because gas is the non-wetting phase occupying the largest pores, a given pore volume in the large pore-size end entails a similar gas phase relative permeability. On the other hand, water is the wetting phase filling the smallest pores which exhibit more variability as evidenced by the core MICP data.
0 20 40 60 80 10010
-2
100
102
104
Sw (%)
Pc
(psi
)
(a) (b)
Figure 3: Comparison of saturation-dependent (a) mercury injection capillary pressure and (b) drainage relative permeability for different rock types.
SPE 159991 7
Invasion Facies Modeling (IFM) If log-based rock typing links static and dynamic petrophysical properties, the vertical distribution of water saturation can be accurately estimated based on rock types and height above the gas-water contact. Likewise, the saturation-dependent relative permeability of each layer can be upscaled to reservoir grids for accurate flow simulation. After core-based rock typing, we estimate average saturation-dependent capillary pressure and relative permeability for each rock type. We then select thick zones of each rock type at different reservoir heights, simulate the process of mud-filtrate invasion under observed drilling and reservoir conditions, calculate radial distributions of fluid saturations, and numerically simulate gamma-ray, bulk density, neutron porosity, photo-electric factor, and dual-induction apparent resistivity logs taking into account the effect of mud-filtrate invasion. Table 3 lists the assumed simulation parameters; these properties simultaneously honor routine core measurements, the well-log-derived saturation-height relation, and mud-filtrate invasion. Therefore, they are suitable for upscaling in reservoir simulation grids. One key advantage of invasion-calibrated dynamic petrophysical properties is that these properties have been calculated at reservoir conditions. It is observed that the best rock type gives rise to the highest resistivity due to the lowest connate water saturation. Additionally, permeable rocks allow deeper mud-filtrate invasion, which gives rise to separation of apparent resistivity logs with different lengths of investigation. Table 3: Summary of mudcake, fluid, and formation properties assumed in the simulation of mud-filtrate invasion. Variable Units Value Wellbore radius inch 4.0 Maximum invasion time days 2 Formation outer boundary ft 2000 Reservoir temperature oF 96 Initial reservoir pressure psi 200 Water viscosity (reservoir conditions) cP 0.9 Gas viscosity cP 0.0149 Overbalance pressure psi 1000 Salt dispersivity ft 0.4 - 1.0 Mud-filtrate density (at STP) g/cm3 1.04 Mud-filtrate viscosity (at STP) cP 0.9 Mud-filtrate compressibility (at STP) psi-1 3.6 x 10⁻⁶ Formation compressibility psi-1 4 x 10⁻⁷
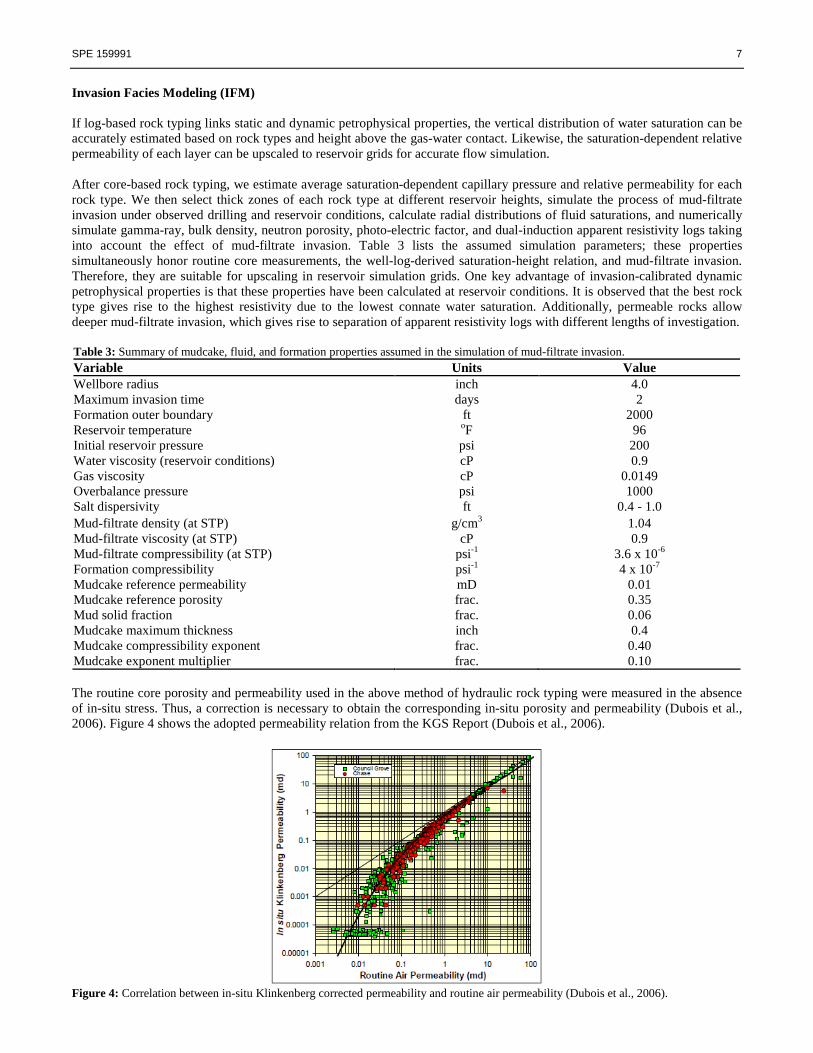
Mudcake reference permeability mD 0.01 Mudcake reference porosity frac. 0.35 Mud solid fraction frac. 0.06 Mudcake maximum thickness inch 0.4 Mudcake compressibility exponent frac. 0.40 Mudcake exponent multiplier frac. 0.10 The routine core porosity and permeability used in the above method of hydraulic rock typing were measured in the absence of in-situ stress. Thus, a correction is necessary to obtain the corresponding in-situ porosity and permeability (Dubois et al., 2006). Figure 4 shows the adopted permeability relation from the KGS Report (Dubois et al., 2006).
Figure 4: Correlation between in-situ Klinkenberg corrected permeability and routine air permeability (Dubois et al., 2006).
8 SPE 159991
In the following sections, we describe each invasion facies (IF) in detail. We use the same ranking convention, where IF-1 and IF-5 identify the best and poorest reservoir quality, respectively. Table 4 summarizes the properties of each invasion facies and their associated lithofacies interpretation. For improved understanding of invasion, we rank them from the least (IF-5) to the most invaded facies (IF-1). Table 4: Summary of petrophysical properties of each invasion facies and corresponding lithofacies interpretation. Invasion Facies
Average Porosity (p.u.)
Average In Situ Permeability (mD)
Invasion Depth Possible Lithofacies
IF-5 12 < 0.0001 Negligible Shale/Mudstone
IF-4 6 0.1 Skin invasion Wackestone
IF-3 13 1 Deep invasion Packstone or very fine crystalline sucrosic dolomite
IF-2 18 10 Medium invasion Packstone - grainstone
IF-1 24 50 Medium invasion Grainstone or marine sandstone
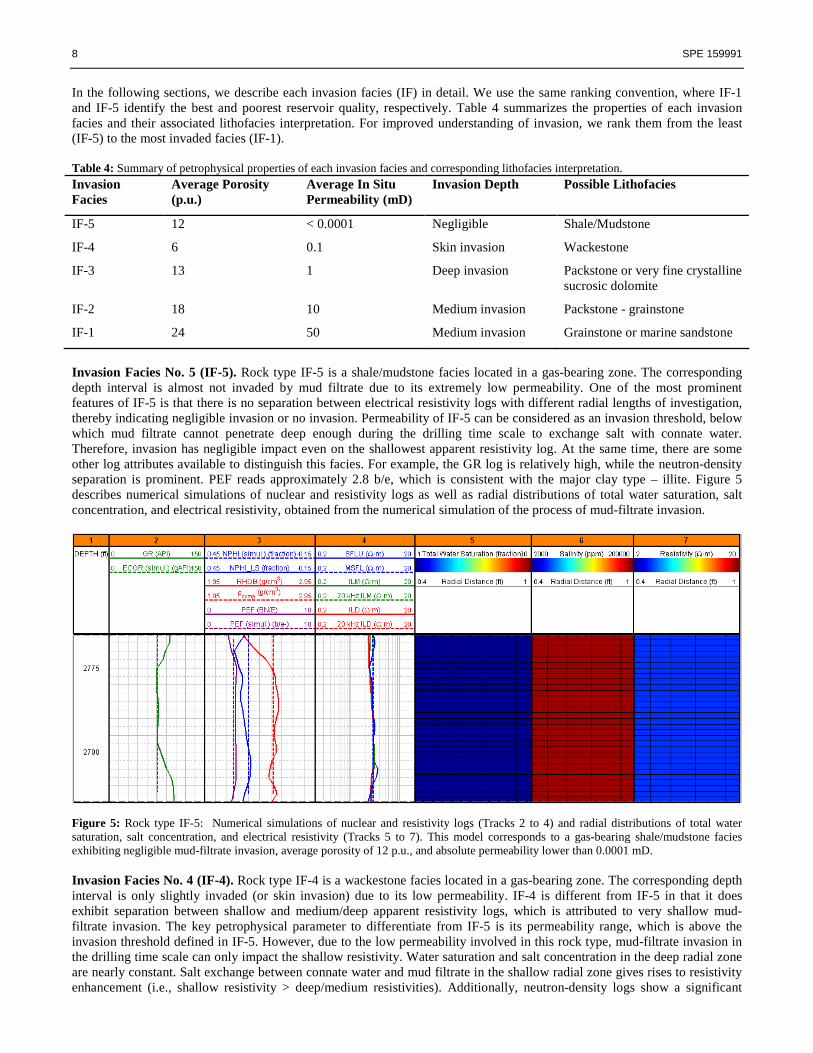
Invasion Facies No. 5 (IF-5). Rock type IF-5 is a shale/mudstone facies located in a gas-bearing zone. The corresponding depth interval is almost not invaded by mud filtrate due to its extremely low permeability. One of the most prominent features of IF-5 is that there is no separation between electrical resistivity logs with different radial lengths of investigation, thereby indicating negligible invasion or no invasion. Permeability of IF-5 can be considered as an invasion threshold, below which mud filtrate cannot penetrate deep enough during the drilling time scale to exchange salt with connate water. Therefore, invasion has negligible impact even on the shallowest apparent resistivity log. At the same time, there are some other log attributes available to distinguish this facies. For example, the GR log is relatively high, while the neutron-density separation is prominent. PEF reads approximately 2.8 b/e, which is consistent with the major clay type – illite. Figure 5 describes numerical simulations of nuclear and resistivity logs as well as radial distributions of total water saturation, salt concentration, and electrical resistivity, obtained from the numerical simulation of the process of mud-filtrate invasion.
Figure 5: Rock type IF-5: Numerical simulations of nuclear and resistivity logs (Tracks 2 to 4) and radial distributions of total water saturation, salt concentration, and electrical resistivity (Tracks 5 to 7). This model corresponds to a gas-bearing shale/mudstone facies exhibiting negligible mud-filtrate invasion, average porosity of 12 p.u., and absolute permeability lower than 0.0001 mD. Invasion Facies No. 4 (IF-4). Rock type IF-4 is a wackestone facies located in a gas-bearing zone. The corresponding depth interval is only slightly invaded (or skin invasion) due to its low permeability. IF-4 is different from IF-5 in that it does exhibit separation between shallow and medium/deep apparent resistivity logs, which is attributed to very shallow mud-filtrate invasion. The key petrophysical parameter to differentiate from IF-5 is its permeability range, which is above the invasion threshold defined in IF-5. However, due to the low permeability involved in this rock type, mud-filtrate invasion in the drilling time scale can only impact the shallow resistivity. Water saturation and salt concentration in the deep radial zone are nearly constant. Salt exchange between connate water and mud filtrate in the shallow radial zone gives rises to resistivity enhancement (i.e., shallow resistivity > deep/medium resistivities). Additionally, neutron-density logs show a significant
SPE 159991 9
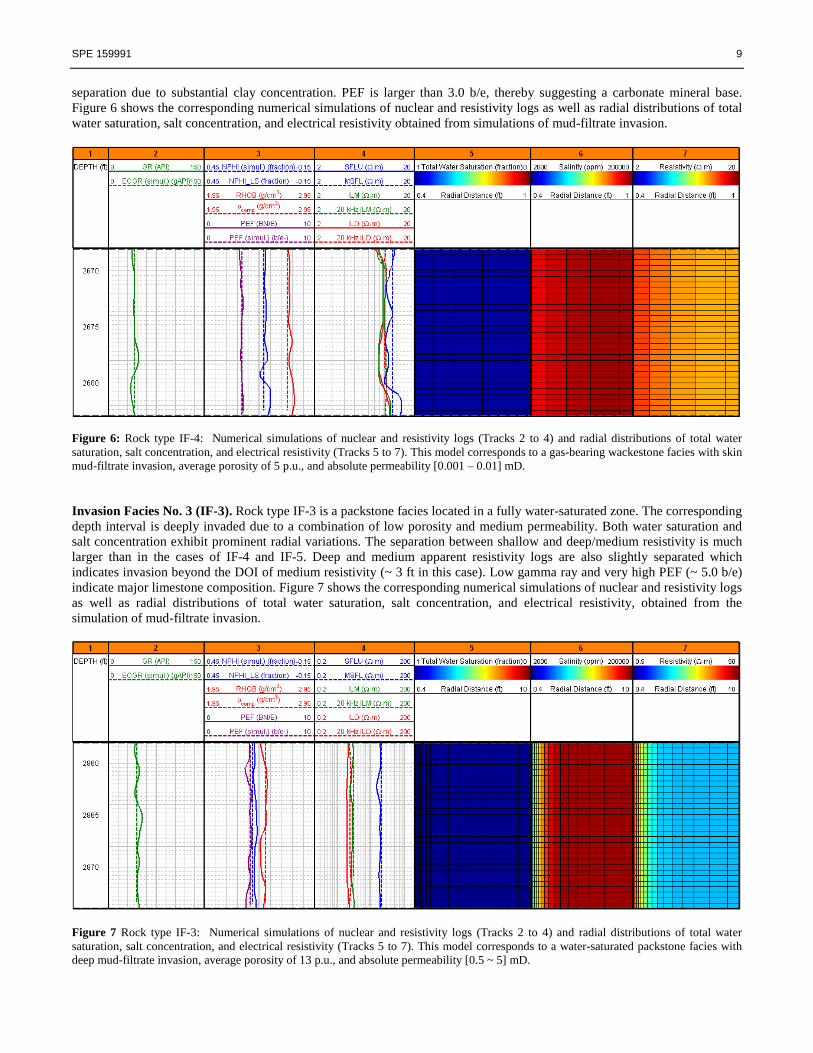
separation due to substantial clay concentration. PEF is larger than 3.0 b/e, thereby suggesting a carbonate mineral base. Figure 6 shows the corresponding numerical simulations of nuclear and resistivity logs as well as radial distributions of total water saturation, salt concentration, and electrical resistivity obtained from simulations of mud-filtrate invasion.
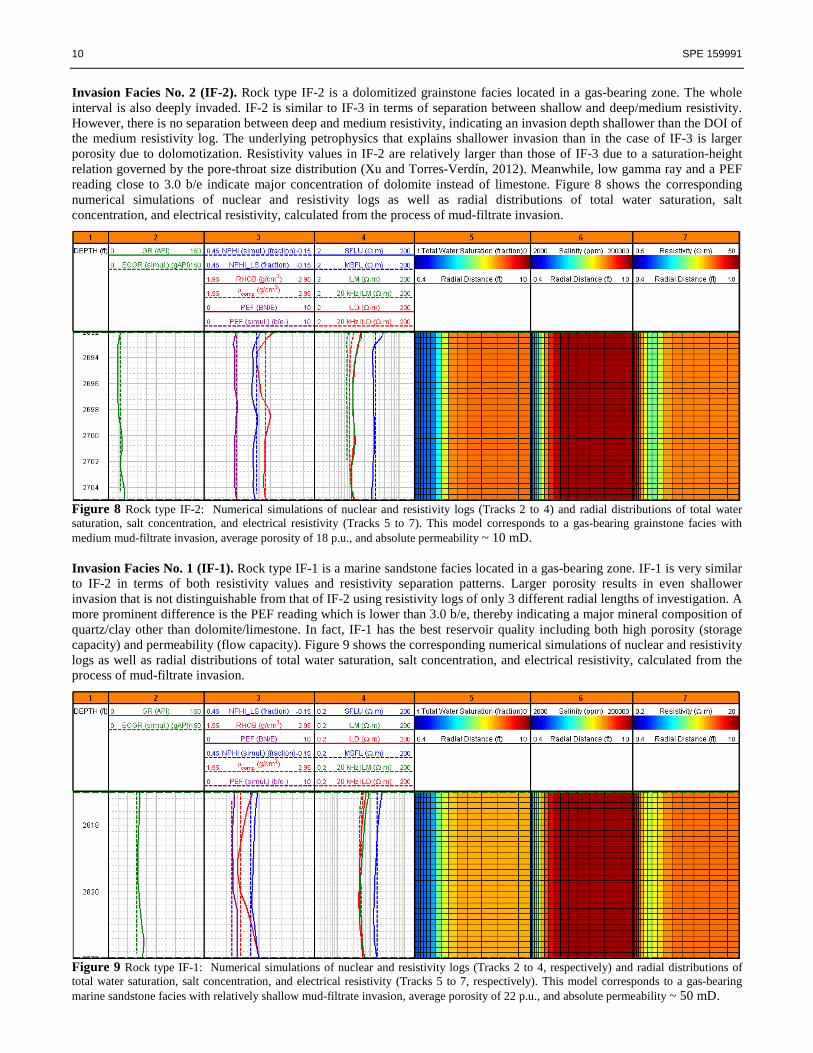
Figure 6: Rock type IF-4: Numerical simulations of nuclear and resistivity logs (Tracks 2 to 4) and radial distributions of total water saturation, salt concentration, and electrical resistivity (Tracks 5 to 7). This model corresponds to a gas-bearing wackestone facies with skin mud-filtrate invasion, average porosity of 5 p.u., and absolute permeability [0.001 – 0.01] mD. Invasion Facies No. 3 (IF-3). Rock type IF-3 is a packstone facies located in a fully water-saturated zone. The corresponding depth interval is deeply invaded due to a combination of low porosity and medium permeability. Both water saturation and salt concentration exhibit prominent radial variations. The separation between shallow and deep/medium resistivity is much larger than in the cases of IF-4 and IF-5. Deep and medium apparent resistivity logs are also slightly separated which indicates invasion beyond the DOI of medium resistivity (~ 3 ft in this case). Low gamma ray and very high PEF (~ 5.0 b/e) indicate major limestone composition. Figure 7 shows the corresponding numerical simulations of nuclear and resistivity logs as well as radial distributions of total water saturation, salt concentration, and electrical resistivity, obtained from the simulation of mud-filtrate invasion.
Figure 7 Rock type IF-3: Numerical simulations of nuclear and resistivity logs (Tracks 2 to 4) and radial distributions of total water saturation, salt concentration, and electrical resistivity (Tracks 5 to 7). This model corresponds to a water-saturated packstone facies with deep mud-filtrate invasion, average porosity of 13 p.u., and absolute permeability [0.5 ~ 5] mD.
10 SPE 159991
Invasion Facies No. 2 (IF-2). Rock type IF-2 is a dolomitized grainstone facies located in a gas-bearing zone. The whole interval is also deeply invaded. IF-2 is similar to IF-3 in terms of separation between shallow and deep/medium resistivity. However, there is no separation between deep and medium resistivity, indicating an invasion depth shallower than the DOI of the medium resistivity log. The underlying petrophysics that explains shallower invasion than in the case of IF-3 is larger porosity due to dolomotization. Resistivity values in IF-2 are relatively larger than those of IF-3 due to a saturation-height relation governed by the pore-throat size distribution (Xu and Torres-Verdín, 2012). Meanwhile, low gamma ray and a PEF reading close to 3.0 b/e indicate major concentration of dolomite instead of limestone. Figure 8 shows the corresponding numerical simulations of nuclear and resistivity logs as well as radial distributions of total water saturation, salt concentration, and electrical resistivity, calculated from the process of mud-filtrate invasion.
Figure 8 Rock type IF-2: Numerical simulations of nuclear and resistivity logs (Tracks 2 to 4) and radial distributions of total water saturation, salt concentration, and electrical resistivity (Tracks 5 to 7). This model corresponds to a gas-bearing grainstone facies with medium mud-filtrate invasion, average porosity of 18 p.u., and absolute permeability ~ 10 mD. Invasion Facies No. 1 (IF-1). Rock type IF-1 is a marine sandstone facies located in a gas-bearing zone. IF-1 is very similar to IF-2 in terms of both resistivity values and resistivity separation patterns. Larger porosity results in even shallower invasion that is not distinguishable from that of IF-2 using resistivity logs of only 3 different radial lengths of investigation. A more prominent difference is the PEF reading which is lower than 3.0 b/e, thereby indicating a major mineral composition of quartz/clay other than dolomite/limestone. In fact, IF-1 has the best reservoir quality including both high porosity (storage capacity) and permeability (flow capacity). Figure 9 shows the corresponding numerical simulations of nuclear and resistivity logs as well as radial distributions of total water saturation, salt concentration, and electrical resistivity, calculated from the process of mud-filtrate invasion.
Figure 9 Rock type IF-1: Numerical simulations of nuclear and resistivity logs (Tracks 2 to 4, respectively) and radial distributions of total water saturation, salt concentration, and electrical resistivity (Tracks 5 to 7, respectively). This model corresponds to a gas-bearing marine sandstone facies with relatively shallow mud-filtrate invasion, average porosity of 22 p.u., and absolute permeability ~ 50 mD.
SPE 159991 11
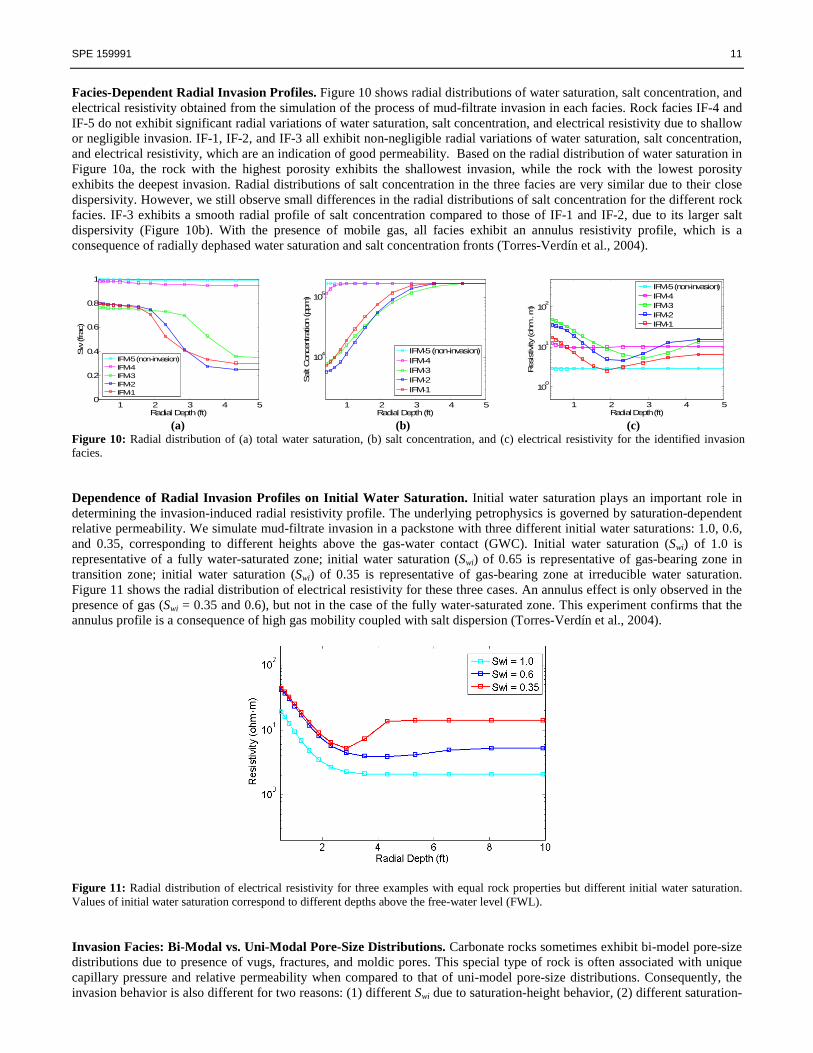
Facies-Dependent Radial Invasion Profiles. Figure 10 shows radial distributions of water saturation, salt concentration, and electrical resistivity obtained from the simulation of the process of mud-filtrate invasion in each facies. Rock facies IF-4 and IF-5 do not exhibit significant radial variations of water saturation, salt concentration, and electrical resistivity due to shallow or negligible invasion. IF-1, IF-2, and IF-3 all exhibit non-negligible radial variations of water saturation, salt concentration, and electrical resistivity, which are an indication of good permeability. Based on the radial distribution of water saturation in Figure 10a, the rock with the highest porosity exhibits the shallowest invasion, while the rock with the lowest porosity exhibits the deepest invasion. Radial distributions of salt concentration in the three facies are very similar due to their close dispersivity. However, we still observe small differences in the radial distributions of salt concentration for the different rock facies. IF-3 exhibits a smooth radial profile of salt concentration compared to those of IF-1 and IF-2, due to its larger salt dispersivity (Figure 10b). With the presence of mobile gas, all facies exhibit an annulus resistivity profile, which is a consequence of radially dephased water saturation and salt concentration fronts (Torres-Verdín et al., 2004).
1 2 3 4 50
0.2
0.4
0.6
0.8
1
Radial Depth (ft)
Sw
(frac
)
IFM-5 (non-invasion)IFM-4IFM-3IFM-2IFM-1
1 2 3 4 5
104
105
Radial Depth (ft)
Sal
t C
once
ntra
tion
(ppm
)
IFM-5 (non-invasion)IFM-4IFM-3IFM-2IFM-1
1 2 3 4 5
100
101
102
Radial Depth (ft)
Res
istiv
ity (oh
m .
m)
IFM-5 (non-invasion)IFM-4IFM-3IFM-2IFM-1
(a) (b) (c)
Figure 10: Radial distribution of (a) total water saturation, (b) salt concentration, and (c) electrical resistivity for the identified invasion facies.
Dependence of Radial Invasion Profiles on Initial Water Saturation. Initial water saturation plays an important role in determining the invasion-induced radial resistivity profile. The underlying petrophysics is governed by saturation-dependent relative permeability. We simulate mud-filtrate invasion in a packstone with three different initial water saturations: 1.0, 0.6, and 0.35, corresponding to different heights above the gas-water contact (GWC). Initial water saturation (Swi) of 1.0 is representative of a fully water-saturated zone; initial water saturation (Swi) of 0.65 is representative of gas-bearing zone in transition zone; initial water saturation (Swi) of 0.35 is representative of gas-bearing zone at irreducible water saturation. Figure 11 shows the radial distribution of electrical resistivity for these three cases. An annulus effect is only observed in the presence of gas (Swi = 0.35 and 0.6), but not in the case of the fully water-saturated zone. This experiment confirms that the annulus profile is a consequence of high gas mobility coupled with salt dispersion (Torres-Verdín et al., 2004).
Figure 11: Radial distribution of electrical resistivity for three examples with equal rock properties but different initial water saturation. Values of initial water saturation correspond to different depths above the free-water level (FWL).
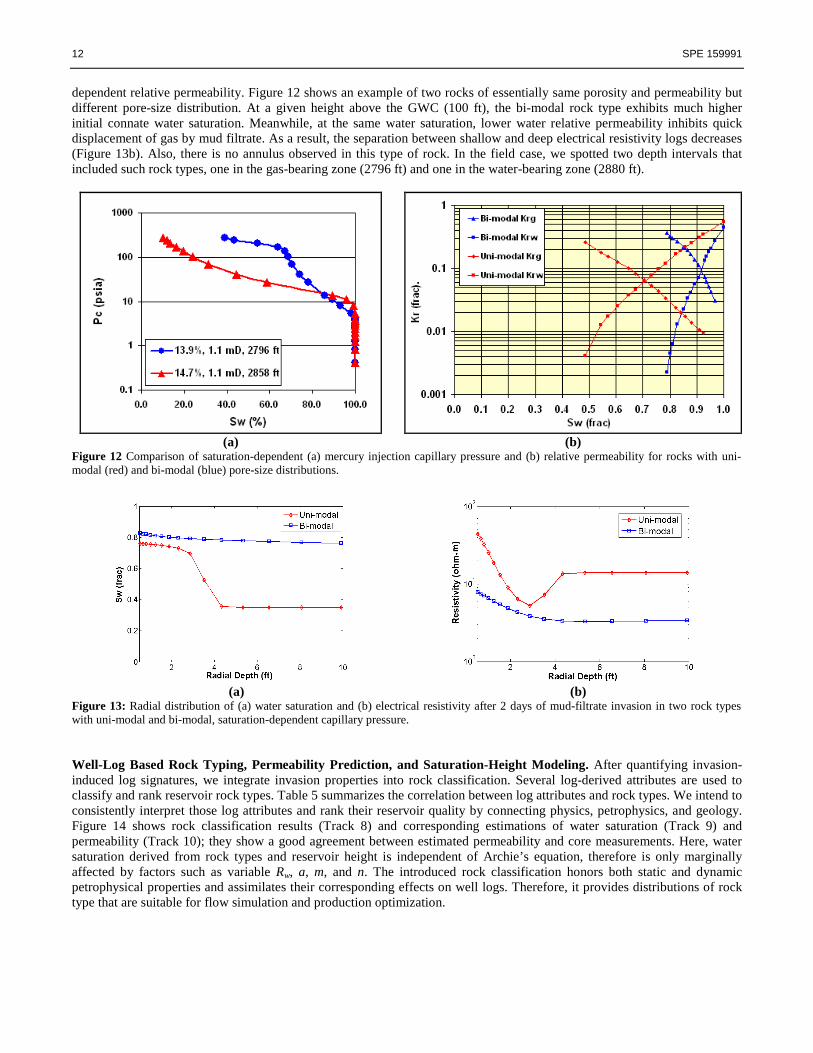
Invasion Facies: Bi-Modal vs. Uni-Modal Pore-Size Distributions. Carbonate rocks sometimes exhibit bi-model pore-size distributions due to presence of vugs, fractures, and moldic pores. This special type of rock is often associated with unique capillary pressure and relative permeability when compared to that of uni-model pore-size distributions. Consequently, the invasion behavior is also different for two reasons: (1) different Swi due to saturation-height behavior, (2) different saturation-
12 SPE 159991
dependent relative permeability. Figure 12 shows an example of two rocks of essentially same porosity and permeability but different pore-size distribution. At a given height above the GWC (100 ft), the bi-modal rock type exhibits much higher initial connate water saturation. Meanwhile, at the same water saturation, lower water relative permeability inhibits quick displacement of gas by mud filtrate. As a result, the separation between shallow and deep electrical resistivity logs decreases (Figure 13b). Also, there is no annulus observed in this type of rock. In the field case, we spotted two depth intervals that included such rock types, one in the gas-bearing zone (2796 ft) and one in the water-bearing zone (2880 ft).
(a) (b)
Figure 12 Comparison of saturation-dependent (a) mercury injection capillary pressure and (b) relative permeability for rocks with uni-modal (red) and bi-modal (blue) pore-size distributions.
(a) (b)
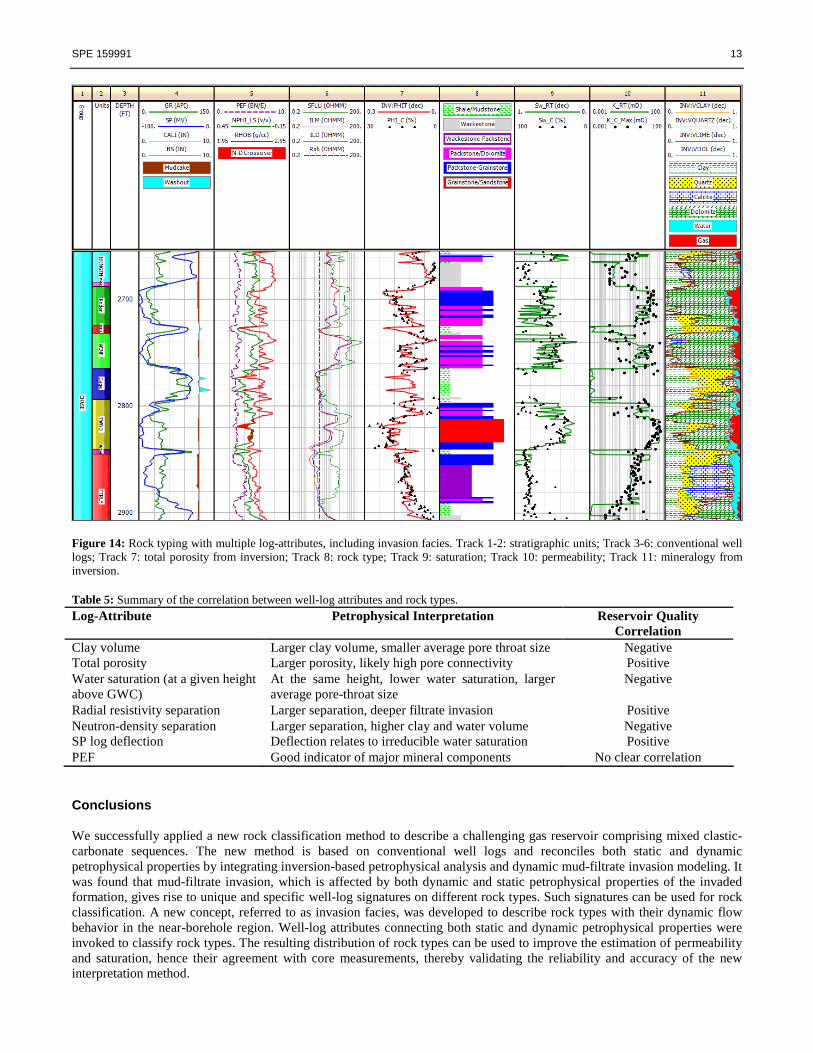
Figure 13: Radial distribution of (a) water saturation and (b) electrical resistivity after 2 days of mud-filtrate invasion in two rock types with uni-modal and bi-modal, saturation-dependent capillary pressure. Well-Log Based Rock Typing, Permeability Prediction, and Saturation-Height Modeling. After quantifying invasion-induced log signatures, we integrate invasion properties into rock classification. Several log-derived attributes are used to classify and rank reservoir rock types. Table 5 summarizes the correlation between log attributes and rock types. We intend to consistently interpret those log attributes and rank their reservoir quality by connecting physics, petrophysics, and geology. Figure 14 shows rock classification results (Track 8) and corresponding estimations of water saturation (Track 9) and permeability (Track 10); they show a good agreement between estimated permeability and core measurements. Here, water saturation derived from rock types and reservoir height is independent of Archie’s equation, therefore is only marginally affected by factors such as variable Rw, a, m, and n. The introduced rock classification honors both static and dynamic petrophysical properties and assimilates their corresponding effects on well logs. Therefore, it provides distributions of rock type that are suitable for flow simulation and production optimization.
SPE 159991 13
Figure 14: Rock typing with multiple log-attributes, including invasion facies. Track 1-2: stratigraphic units; Track 3-6: conventional well logs; Track 7: total porosity from inversion; Track 8: rock type; Track 9: saturation; Track 10: permeability; Track 11: mineralogy from inversion.
Table 5: Summary of the correlation between well-log attributes and rock types. Log-Attribute Petrophysical Interpretation Reservoir Quality
Correlation Clay volume Larger clay volume, smaller average pore throat size Negative Total porosity Larger porosity, likely high pore connectivity Positive Water saturation (at a given height above GWC)
At the same height, lower water saturation, larger average pore-throat size
Negative
Radial resistivity separation Larger separation, deeper filtrate invasion Positive Neutron-density separation Larger separation, higher clay and water volume Negative SP log deflection Deflection relates to irreducible water saturation Positive PEF Good indicator of major mineral components No clear correlation Conclusions We successfully applied a new rock classification method to describe a challenging gas reservoir comprising mixed clastic-carbonate sequences. The new method is based on conventional well logs and reconciles both static and dynamic petrophysical properties by integrating inversion-based petrophysical analysis and dynamic mud-filtrate invasion modeling. It was found that mud-filtrate invasion, which is affected by both dynamic and static petrophysical properties of the invaded formation, gives rise to unique and specific well-log signatures on different rock types. Such signatures can be used for rock classification. A new concept, referred to as invasion facies, was developed to describe rock types with their dynamic flow behavior in the near-borehole region. Well-log attributes connecting both static and dynamic petrophysical properties were invoked to classify rock types. The resulting distribution of rock types can be used to improve the estimation of permeability and saturation, hence their agreement with core measurements, thereby validating the reliability and accuracy of the new interpretation method.
14 SPE 159991
List of Symbols
a : Archie’s factor, ( ) Csh : Volumetric concentration of shale, ( ) k : Absolute permeability, (mD) kair : Air permeability, (mD) kr : Relative permeability, ( ) m : Archie’s porosity exponent, ( ) n : Archie’s saturation exponent, ( ) Pc : Capillary pressure, (psi) R35 : Pore throat radius at 35% non-wetting phase saturation, (µm) Rw : Connate water resistivity, (ohm.m) Sw : Total water saturation, ( ) Swi : Initial water saturation, ( ) φt : Total porosity, ( ) φD : Density porosity, ( ) φN : Neutron porosity, ( ) List of Acronyms
CPU : Computer Processing Unit DIT : Dual-Induction Tool DOI : Depth of Investigation FWL : Free Water Level GR : Gamma Ray GWC : Gas-Water Contact IF : Invasion Facies IFM : Invasion Facies Modeling K : Potassium KGS : Kansas Geological Survey MICP : Mercury Injection Capillary Pressure NaCl : Sodium Chloride PEF : Photo-Electric Factor p.u. : Porosity Unit ppm : Parts Per Million RFN : Rock Fabrics Number RQI : Reservoir Quality Index RT : Rock Type SNUPAR : Schlumberger Nuclear Parameter Code SP : Spontaneous Potential STP : Standard Temperature and Pressure TCF : Trillion Cubic Feet Th : Thorium U : Uranium UTAPWeLS : University of Texas at Austin’s Petrophysical and Well-Log Simulator WBM : Water-Base Mud
Acknowledgements
We thank Amoco (now BP), Anadarko, and Mobil (now ExxonMobil) for making well logs acquired in the Hugoton field available to the public. A note of special gratitude goes to the KGS Hugoton Asset Management Project for maintaining the database and for sharing their comprehensive reservoir study documents. The work reported in this paper was funded by The University of Texas at Austin’s Research Consortium on Formation Evaluation, jointly sponsored by Anadarko, Apache, Aramco, Baker-Hughes, BG, BHP Billiton, BP, Chevron, ConocoPhillips, ENI, ExxonMobil, Halliburton, Hess, Maersk, Marathon Oil Corporation, Mexican Institute for Petroleum, Nexen, ONGC, Petrobras, Repsol, RWE, Schlumberger, Shell, Statoil, Total, and Weatherford.
SPE 159991 15
References
Al-Farisi, O., Elhami, M., Al-Felasi, A., and Yammahi, F. 2009. Revelation of carbonate rock typing – the resolved gap. Paper SPE 125576 presented at SPE/EAGE Reservoir Characterization and Simulation Conference, Abu Dhabi, UAE, 19 – 21 October.
Amaefule, J.O., Altunbay, M., Tiab, D., Kersey, D.G., and Keelan, D.K. 1993. Enhanced Reservoir Description: Using Core and Log Data to Identify Hydraulic (Flow) Units and Predict Permeability in Uncored Intervals/Wells. Paper SPE 26436 presented at SPE Annual Technical Conference and Exhibition, Houston, Texas, 3 – 6 October.
Archie, G.E. 1950. Introduction to Petrophysics of Reservoir Rocks. AAPG Bulletin, 34 (5): 943 - 961. Doveton, J.H. 2012. Mathematical Petrophysics. Unpublished. Dubois, M.K., Byrnes, A.P., Bhattacharya, S., Bohling, G.C., Doveton J.H., and Barba, R.E. 2006. Hugoton Asset
Management Project (HAMP): Hugoton Geomodel Final Report. KGS Open File Report. Gandhi, A., Torres-Verdín, C., Voss, B., Gabulle, J., and Seminario, F. 2010. Construction of Reliable Static and Dynamic
Multi-Layer Petrophysical Models in Camisea Gas Reservoirs, Peru. SPWLA 51st Annual Logging Symposium, Perth, Australia, 19 – 23 June.
George, B. K., Torres-Verdín, C., Delshad, M., Sigal, R., Zouioueche, F., and Anderson, B. 2003. A case study integrating the physics of mud-filtrate invasion with the physics of induction logging: assessment of in-situ hydrocarbon saturation in the presence of deep invasion and highly saline connate water. SPWLA 44th Annual Logging Symposium, Galveston, TX, 22 – 25 June.
Heidari, Z., Hamman, J.G., Day, P.I., Gorney, D.L., and Alfred, D. 2011. Assessment of Movable Gas Saturation and Rock Typing Based on the Combined Simulation of Petrophysical Borehole Measurements. SPWLA 52nd Annual Logging Symposium, The Woodlands, Colorado Springs, USA, 14 – 18 May.
Heidari, Z., and Torres-Verdín, C. 2010. Estimation of dynamic petrophysical properties of water-bearing sands invaded with oil-base mud from multi-physics borehole geophysical measurements. Presented at Society of Exploration Geophysicists (SEG) 80th Annual International Meeting, Denver, Colorado, 17 - 22 October.
Heidari, Z., Torres-Verdín, C., Mendoza, A., and Wang G.L. 2011. Assessment of Residual Hydrocarbon Saturation with the Combined Quantitative Interpretation of Resistivity and Nuclear Logs. Petrophysics, 52 (3): 217 - 237.
Heidari Z., Torres-Verdín C., and Preeg W. E. 2012. Improved estimation of mineral and fluid volumetric concentrations in thinly bedded and invaded formations. Geophysics, 77 (3): WA79 – WA98.
Leverett, M.C. 1941. Capillary Behaviour in Porous Solids. Transactions of the AIME, 142 (1): 159 - 172. Lucia, F.J. 1999. Carbonate reservoir characterization. Springer-Verlag, Berlin. Olson, T. M., Babcock, J. A., Prasad, K. V. K., Boughton, S. D., Wagner, P. D., Franklin, M. K., and Thompson, K. A. 1997.
Reservoir characterization of the giant Hugoton Gas field, Kansas. AAPG Bulletin, 81 (11): 1785 - 1803. Miranda, L. J., Torres-Verdín, C., and Lucia, J. 2009. Modeling mud-filtrate invasion effects on resistivity logs to estimate
permeability of vuggy and fractured carbonate formations. Paper SPE 121136 presented at SPE 2008 EUROPEC Conference, Amsterdam, The Netherlands, 8 – 11 June.
Pittman, E.D. 1992. Relationship of Porosity and Permeability to Various Parameters Derived from Mercury Injection-Capillary Pressure Curves for Sandstone. AAPG Bulletin, 76 (2): 191 -198.
Rushing, J.A., Newsham, K.E., and Blasingame T.A. 2008. Rock Typing - Keys to Understanding Productivity in Tight Gas Sands. Paper SPE 114164 presented at SPE Unconventional Reservoirs Conference, Keystone, Colorado, 10 – 12 February.
Salazar, J. M., Torres-Verdín, C., Alpak, F. O., Habashy, T. M., and Klein, J. D. 2006. Estimation of permeability from array induction measurements: applications to the petrophysical assessment of tight-gas sands. Petrophysics, 47 (6): 527 - 544.
Torres-Verdín, C. 2012, Integrated Geological-Petrophysical Interpretation of Well Logs, Lecture Notes for Fundamentals of Well Logging. The University of Texas at Austin, Unpublished.
Torres-Verdín, C., Alpak, F. O., and Habashy, T. M. 2006. Petrophysical inversion of borehole array-induction log: Part II - Field data examples. Geophysics, 71 (5): G261 - G268.
Torres-Verdín, C., George, B. K., Delshad, M., Sigal, R., Zouioueche, F., and Anderson, B. 2004. Assessment of in-situ hydrocarbon saturation in the presence of deep invasion and highly saline connate water. Petrophysics, 45 (2): 141-156.
Voss, B., Torres-Verdín, C., Gandhi, A., Alabi, G., and Lemkecher, M. 2009. Common Stratigraphic Framework to Simulate Well Logs and to Cross-Validate Static and Dynamic Petrophysical Interpretations. SPWLA 50th Annual Logging Symposium, The Woodlands, Texas, USA, 21 – 24 June.
Xu, C.C., and Torres-Verdín, C. 2012. Saturation-Height and Invasion Consistent Hydraulic Rock Typing Using Multi-Well Conventional Log Data. SPWLA 53rd Annual Logging Symposium, Cartagena, Columbia, 16 – 20 June.