Embed Size (px)
Citation preview
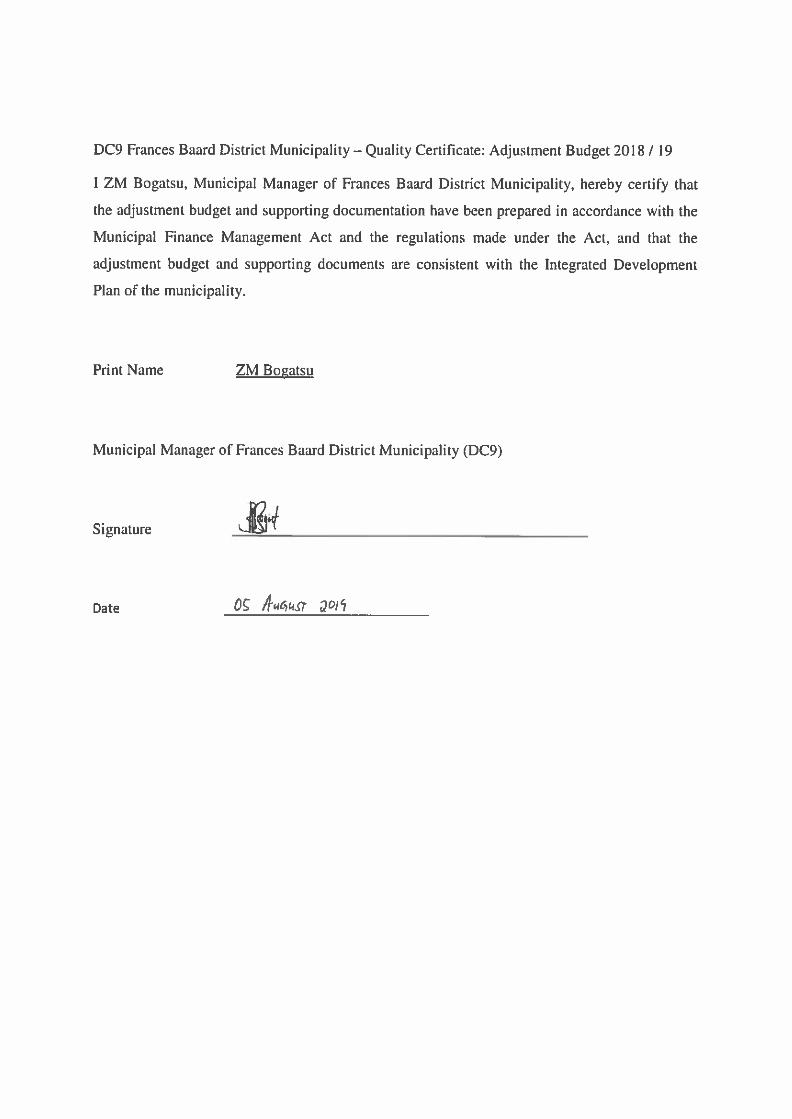
FRANCES BAARD DISTRICT MUNICIPALITY
SPECIAL ADJUSTMENT BUDGET
2018/ 2019
INDEX PAGE
1 Budget related resolutions
2 Proposed adjustments
3 Quality Certificate
4 Mayoral Budget Speech
5 Adjustment Budget Schedules
5,1 Table B1 Adjustments Budget Summary 1
5,2 Table B2 Adjustments Budget Financial Performance (standard classification) 2
5,3 Table B2 Adjustments Budget Financial Performance (standard classification) - B 4
5,4 Table B3 Adjustments Budget Financial Performance (revenue and expenditure by municipal vote) 5
5,5 Table B3 Adjustments Budget Financial Performance (revenue and expenditure by municipal vote) - B 6
5,6 Table B4 Adjustments Budget Financial Performance (revenue and expenditure) 7
5,7 Table B5 Adjustments Capital Expenditure Budget by vote and funding 8
5,8 Table B5 Adjustments Capital Expenditure Budget by vote and funding - B 10
5,9 Table B6 Adjustments Budget Financial Position 11
5.10 Table B7 Adjustments Budget Cash Flows 12
5,11 Table B8 Cash backed reserves/accumulated surplus reconciliation 13
5,12 Table B9 Asset Management 16
5,13 Table B10 Basic service delivery measurement 17
6 Adjustment Budget Supporting Documentation
6,1 Supporting Table SB1 Supporting detail to 'Budgeted Financial Performance' 19
6,2 Supporting Table SB2 Supporting detail to 'Financial Position Budget' 20
6,3 Supporting Table SB3 Adjustments to the SDBIP - performance objectives 22
6,4 Supporting Table SB4 Adjustments to budgeted performance indicators and benchmarks 23
6,5 Supporting Table SB5 Adjustments Budget - social, economic and demographic statistics and assumptions 24
6,6 Supporting Table SB6 Adjustments Budget - funding measurement 25
6,7 Supporting Table SB7 Adjustments Budget - transfers and grant receipts 26
6,8 Supporting Table SB8 Adjustments Budget - expenditure on transfers and grant programme 27
6,9 Supporting Table SB9 Adjustments Budget - reconciliation of transfers, grant receipts, and unspent funds 28
6.10 Supporting Table SB10 Adjustments Budget - transfers and grants made by the municipality 29
6,11 Supporting Table SB11 Adjustments Budget - councillor and staff benefits 30
6,12 Supporting Table SB12 Adjustments Budget - monthly revenue and expenditure (municipal vote) 31
6,13 Supporting Table SB13 Adjustments Budget - monthly revenue and expenditure (standard classification) 33
6,14 Supporting Table SB14 Adjustments Budget - monthly revenue and expenditure 34
6,15 Supporting Table SB15 Adjustments Budget - monthly cash flow 36
6,16 Supporting Table SB16 Adjustments Budget - monthly capital expenditure (municipal vote) 37
6,17 Supporting Table SB17 Adjustments Budget - monthly capital expenditure (standard classification) 38
6,18 Supporting Table SB18a Adjustments Budget - capital expenditure on new assets by asset class 40
6,19 Supporting Table SB18b Adjustments Budget - capital expenditure on renewal of existing assets by asset class 42
6.20 Supporting Table SB18c Adjustments Budget - expenditure on repairs and maintenance by asset class 44
6,21 Supporting Table SB18d Adjustments Budget - expenditure on depreciation by asset class 46
6,22 Supporting Table SB19 List of capital programmes and projects affected by Adjustments Budget 49
BUDGET RELATED RESOLUTIONS
ITEM: COUN 07/2019
DEPARTMENT OF FINANCE: SPECIAL ADJUSTMENTS BUDGET IN
RESPECT OF THE 2018/19 FINANCIAL YEAR
() (OM) (COUNCIL MEETING: 24 JULY 2019 ) ________________________________________________________________ The Assistant Director: Finance reports as follows: The purpose of this report is to present the special adjustment budget to Council in line with section 28 of the Municipal Finance Management Act (MFMA). The adjustment budget was approved in January 2019, furthermore, section 28 (2) allows the municipality to pass a special adjustment budget based on the following criteria:
• may appropriate additional revenues that have become available over and above those
anticipated in the annual budget, but only to revise or accelerate spending programmes already budgeted for;
• may correct any errors in the annual budget; and • may provide for any other expenditure within a prescribed framework.
Section 23(2) of the Municipal Budget & Reporting Regulations prescribe that only one adjustment budget be tabled in council during a financial year except when additional revenues become available from National / Provincial governments and / or unforeseeable and avoidable expenditure has been incurred. Circular 68 provides clarity on the procedures to be followed when dealing with unauthorized, irregular or fruitless and wasteful expenditure as defined in section 1 of the MFMA. The circular further provides guideline information on what process to follow when council may authorize unauthorized expenditure in an adjustment budget. An adjustment budget can be addressed in the following three different adjustments budgets:
Special adjustments budget to authorize unauthorized expenditure:
In terms of regulation 23(6)(b) of the Municipal Budget and Reporting Regulations, council may authorize unauthorized expenditure in a special adjustments budget which only deals with unauthorized expenditure from the previous financial year such as:
• Unauthorized expenditure that occurred in the first half of the previous financial year
that was not included in the main adjustments budget; • Unauthorized expenditure that occurred in the second half of the previous financial
year; and • Any unauthorized expenditure identified by the Auditor-General during the annual
audit process.
In order to avoid any unauthorized expenditure as prescribed in terms of section 15 of the MFMA, it is recommended that council considers approval of the special adjustment budget based allocations received from the provincial government as well as other unforeseeable expenditure incurred and / or approved after finalization of the mid-year financial and performance assessment when the main adjustments budget was approved by council during January 2019. The second adjustment budget is attached as Annexure __ (Bounded Separately) for council’s consideration and approval. The Municipal Manager, in consultation with the Assistant Director: Finance, recommends as follows: RECOMMENDATIONS 1. Council considers the approval of the special adjustment budget as
per recommended resolution tabled. 2. Council resolves that the special adjustment budget of Frances Baard
District Municipality for the financial year 2018/2019, and indicative for the projected outer years 2019/2020 and 2020/2021 be approved as set out in the following schedules:
2.1 Adjustment Budget Summary – Table B1 (Page 1); 2.2 Budgeted Financial Performance (Revenue and Expenditure
by standard Classification) –Table B2 (Page 2); 2.3 Budgeted Financial Performance (Revenue and Expenditure
by standard Classification) - B – Table B2 (Page 4); 2.4 Budgeted Financial Performance (revenue and expenditure by
municipal vote) Table B3 (Page 5); 2.5 Budgeted Financial Performance (revenue and expenditure by
municipal vote) – B -Table B3 (Page 5); 2.6 Budgeted Financial Performance (revenue and expenditure) –
Table B4 (Page 6); 2.7 Budgeted Capital Expenditure by vote and funding – Table B5
(Page 7&8); 2.8 Budgeted Financial Position – Table B6 (Page 9); 2.9 Budgeted Cash Flows Table B7 (Page 10); 2.10 Cash backed reserves/accumulated surplus reconciliation –
Table B8 (Page 11); 2.11 Asset Management – Table B9 (Page 12); 2.12 Basic service delivery measurement table B10 (Page 13)
3. Council resolves that the other related supporting documentation to
the approved budget be updated according to the adjustments made.
4. Council resolves that a hard and electronic copy of the complete
special adjustment budget be submitted to National; Provincial Treasury and Department of Cooperative Governance, Human Settlement and Traditional Affairs respectively for information.
PROPOSED ADJUSTMENTS OPERATIONAL BUDGET
FRANCES BAARD DISTRICT MUNICIPALITY
FRANCES BAARD DISTRICT MUNICIPALITY
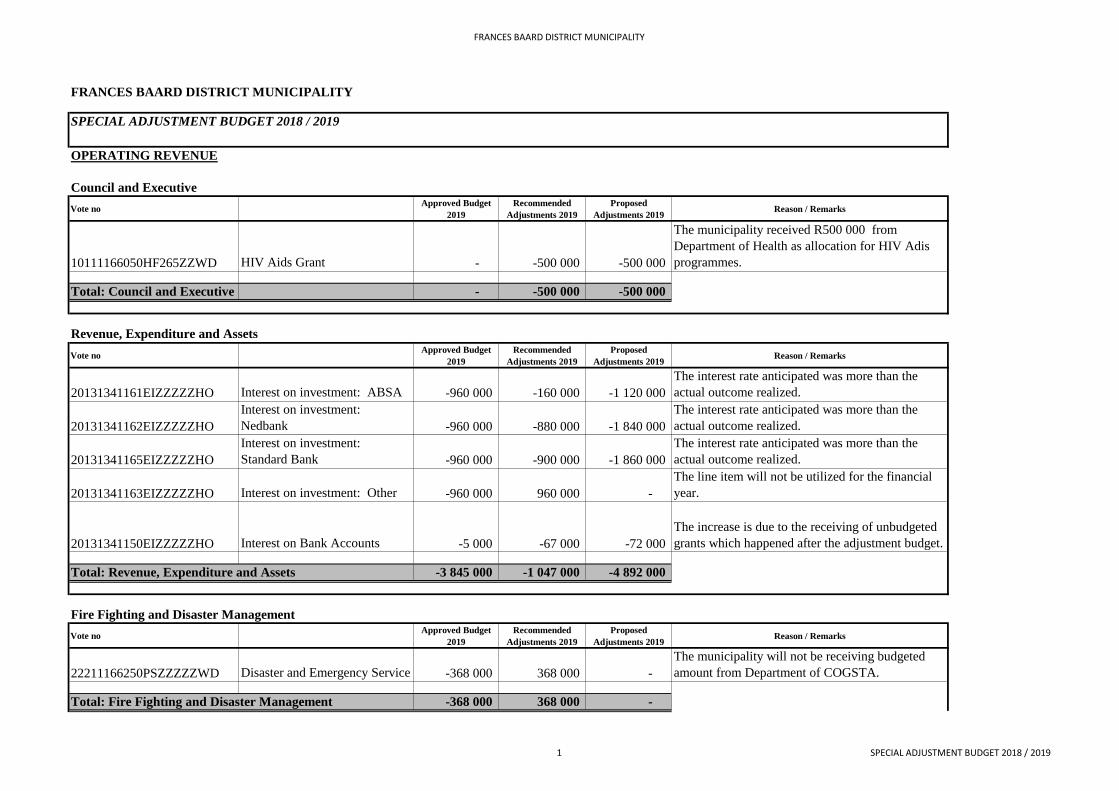
SPECIAL ADJUSTMENT BUDGET 2018 / 2019
OPERATING REVENUE
Council and Executive
Vote noApproved Budget
2019
Recommended
Adjustments 2019
Proposed
Adjustments 2019Reason / Remarks
10111166050HF265ZZWD HIV Aids Grant - -500 000 -500 000
The municipality received R500 000 from
Department of Health as allocation for HIV Adis
programmes.
Total: Council and Executive - -500 000 -500 000
Revenue, Expenditure and Assets
Vote noApproved Budget
2019
Recommended
Adjustments 2019
Proposed
Adjustments 2019Reason / Remarks
20131341161EIZZZZZHO Interest on investment: ABSA -960 000 -160 000 -1 120 000
The interest rate anticipated was more than the
actual outcome realized.
20131341162EIZZZZZHO
Interest on investment:
Nedbank -960 000 -880 000 -1 840 000
The interest rate anticipated was more than the
actual outcome realized.
20131341165EIZZZZZHO
Interest on investment:
Standard Bank -960 000 -900 000 -1 860 000
The interest rate anticipated was more than the
actual outcome realized.
20131341163EIZZZZZHO Interest on investment: Other -960 000 960 000 -
The line item will not be utilized for the financial
year.
20131341150EIZZZZZHO Interest on Bank Accounts -5 000 -67 000 -72 000
The increase is due to the receiving of unbudgeted
grants which happened after the adjustment budget.
Total: Revenue, Expenditure and Assets -3 845 000 -1 047 000 -4 892 000
Fire Fighting and Disaster Management
Vote noApproved Budget
2019
Recommended
Adjustments 2019
Proposed
Adjustments 2019Reason / Remarks
22211166250PSZZZZZWD Disaster and Emergency Service -368 000 368 000 -
The municipality will not be receiving budgeted
amount from Department of COGSTA.
Total: Fire Fighting and Disaster Management -368 000 368 000 -
1 SPECIAL ADJUSTMENT BUDGET 2018 / 2019
FRANCES BAARD DISTRICT MUNICIPALITY
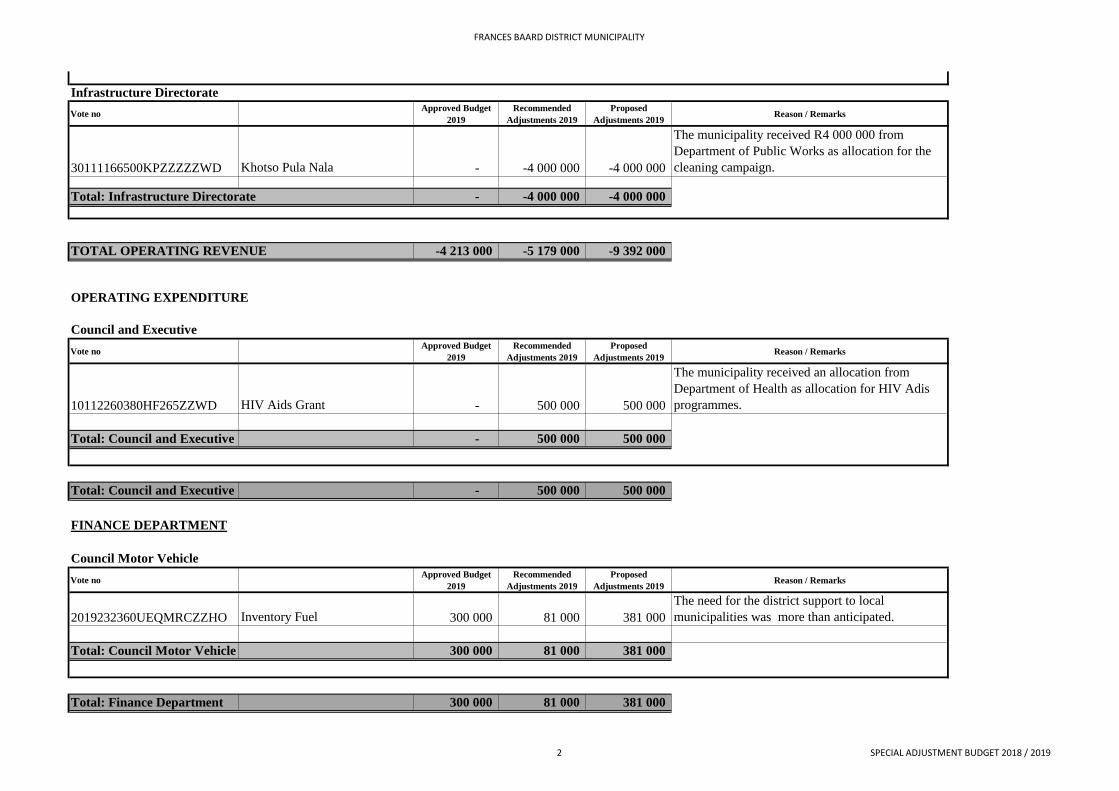
Infrastructure Directorate
Vote noApproved Budget
2019
Recommended
Adjustments 2019
Proposed
Adjustments 2019Reason / Remarks
30111166500KPZZZZZWD Khotso Pula Nala - -4 000 000 -4 000 000
The municipality received R4 000 000 from
Department of Public Works as allocation for the
cleaning campaign.
Total: Infrastructure Directorate - -4 000 000 -4 000 000
TOTAL OPERATING REVENUE -4 213 000 -5 179 000 -9 392 000
OPERATING EXPENDITURE
Council and Executive
Vote noApproved Budget
2019
Recommended
Adjustments 2019
Proposed
Adjustments 2019Reason / Remarks
10112260380HF265ZZWD HIV Aids Grant - 500 000 500 000
The municipality received an allocation from
Department of Health as allocation for HIV Adis
programmes.
Total: Council and Executive - 500 000 500 000
Total: Council and Executive - 500 000 500 000
FINANCE DEPARTMENT
Council Motor Vehicle
Vote noApproved Budget
2019
Recommended
Adjustments 2019
Proposed
Adjustments 2019Reason / Remarks
2019232360UEQMRCZZHO Inventory Fuel 300 000 81 000 381 000
The need for the district support to local
municipalities was more than anticipated.
Total: Council Motor Vehicle 300 000 81 000 381 000
Total: Finance Department 300 000 81 000 381 000
2 SPECIAL ADJUSTMENT BUDGET 2018 / 2019
FRANCES BAARD DISTRICT MUNICIPALITY
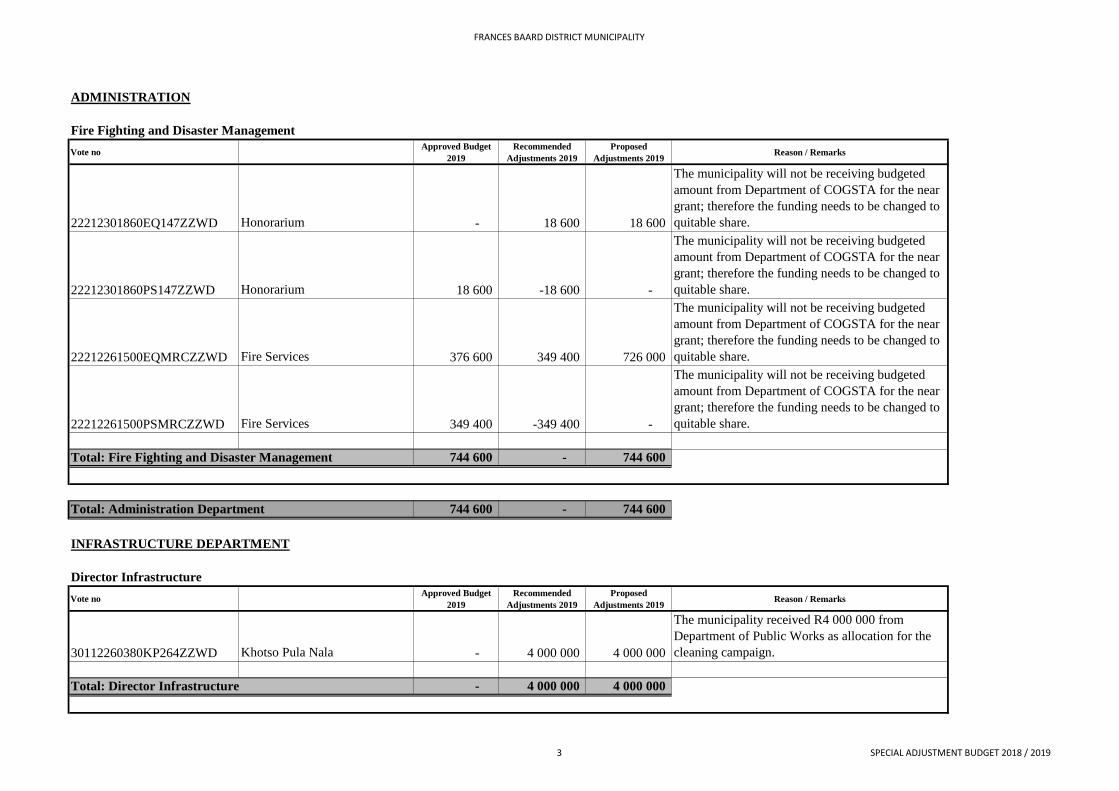
ADMINISTRATION
Fire Fighting and Disaster Management
Vote noApproved Budget
2019
Recommended
Adjustments 2019
Proposed
Adjustments 2019Reason / Remarks
22212301860EQ147ZZWD Honorarium - 18 600 18 600
The municipality will not be receiving budgeted
amount from Department of COGSTA for the near
grant; therefore the funding needs to be changed to
quitable share.
22212301860PS147ZZWD Honorarium 18 600 -18 600 -
The municipality will not be receiving budgeted
amount from Department of COGSTA for the near
grant; therefore the funding needs to be changed to
quitable share.
22212261500EQMRCZZWD Fire Services 376 600 349 400 726 000
The municipality will not be receiving budgeted
amount from Department of COGSTA for the near
grant; therefore the funding needs to be changed to
quitable share.
22212261500PSMRCZZWD Fire Services 349 400 -349 400 -
The municipality will not be receiving budgeted
amount from Department of COGSTA for the near
grant; therefore the funding needs to be changed to
quitable share.
Total: Fire Fighting and Disaster Management 744 600 - 744 600
Total: Administration Department 744 600 - 744 600
INFRASTRUCTURE DEPARTMENT
Director Infrastructure
Vote noApproved Budget
2019
Recommended
Adjustments 2019
Proposed
Adjustments 2019Reason / Remarks
30112260380KP264ZZWD Khotso Pula Nala - 4 000 000 4 000 000
The municipality received R4 000 000 from
Department of Public Works as allocation for the
cleaning campaign.
Total: Director Infrastructure - 4 000 000 4 000 000
3 SPECIAL ADJUSTMENT BUDGET 2018 / 2019
FRANCES BAARD DISTRICT MUNICIPALITY
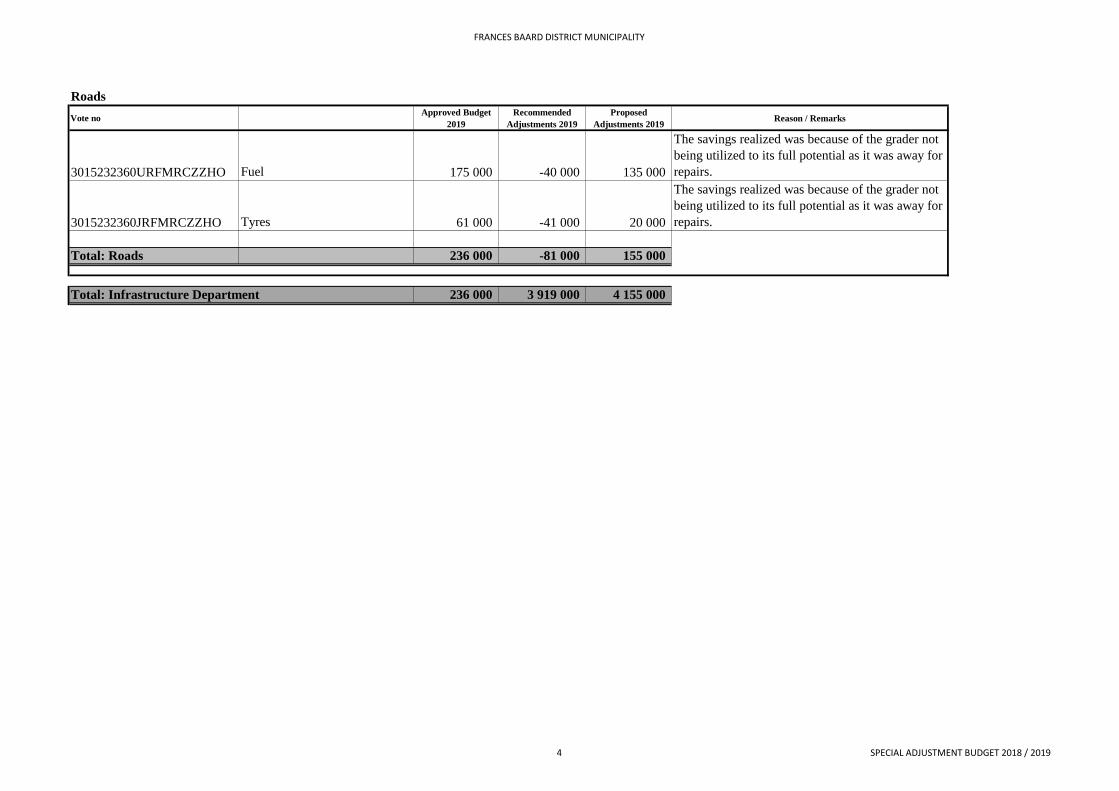
Roads
Vote noApproved Budget
2019
Recommended
Adjustments 2019
Proposed
Adjustments 2019Reason / Remarks
3015232360URFMRCZZHO Fuel 175 000 -40 000 135 000
The savings realized was because of the grader not
being utilized to its full potential as it was away for
repairs.
3015232360JRFMRCZZHO Tyres 61 000 -41 000 20 000
The savings realized was because of the grader not
being utilized to its full potential as it was away for
repairs.
Total: Roads 236 000 -81 000 155 000
Total: Infrastructure Department 236 000 3 919 000 4 155 000
4 SPECIAL ADJUSTMENT BUDGET 2018 / 2019
PROPOSED ADJUSTMENTS – CAPITAL BUDGET
MAYORAL BUDGET SPEECH
Page 1 of 10
BUDGET SPEECH 2018 / 2019
FRANCES BAARD DISTRICT MUNICIPALITY
Honourable Speaker,
Honourable Mayors and Speakers of our local municipalities,
Honourable Councillors,
Municipal Managers,
Partners in Local Government,
Members of the media,
Distinguished guests,
Ladies and gentlemen,
Good morning
Goeie more
Dumelang
Molweni
Page 2 of 10
Madam Speaker,
I am honoured to present to the Frances Baard District the 2th medium-term revenue and expenditure framework (MTREF) budget of the current
Council.
I would firstly like to take the opportunity to welcome all our esteemed guests and stakeholders to this important occasion.
Ladies and gentleman, this year we celebrate the life our nation’s founding father Nelson Mandela under the theme: “Be the legacy”. The centenary
celebration is a major milestone in the story of Madiba and our nation’s journey into freedom. It is therefore fitting that we throw our weight
behind this programme and pronounce our commitment to join our efforts to realise Madiba’s legacy where values of Ubuntu, peace, justice and
selfless service are a lived reality as we journey towards a peaceful, stable and prosperous South Africa and Africa.
Madam Speaker, after careful consideration of inputs received and consultative engagements, the municipality is compelled to have cost
containment measures in place to mitigate the emerging risk of depleting the accumulated reserves. The measures put in place are in line with the
MFMA Circular 82: Cost Containment Measures and draft regulations issued on 16 February 2018. A decision was therefore taken to cut on the
following operating expenditures to enable the municipality to invest in capital expenditures in the district as well as at our local municipalities:
• Advertisements;
• Bursaries and trainings;
• Catering for commemorative days;
• Entertainment;
• Resettlement cost;
Page 3 of 10
• Travel and accommodation; and
• Outsource Services.
The GDP growth rate is forecasted to increase by 1.8 per cent in 2019 and to improve moderately over the medium term with to 2.1 per cent and
in 2019 and 2020 respectively. This forecast is supported by marginally higher global growth, stabilising commodity prices, greater reliability of
the electricity network, more favourable weather conditions, recovering business and consumer confidence, and improved labour relations.
In his 2018 national budget speech, the former Minister of Finance, Mr. Malusi Gigaba, drew attention to the growth outlook over the medium
term, which is higher than projected in last year’s medium-term budget policy statement. He was optimistic that the government can and will do
its work effectively to ensure it aligns its objectives with the those of the national development plan (NDP) and fulfilling their constitutional
obligations.
The NDP responsibilities in translating this renewed energy into tangible and sustainable economic benefits for all our people includes:
• Creating the right environment for investment;
• Partnering with the social partners to create sustainable employment;
• Dealing decisively with governance and financial failures at state owned companies; and
• Addressing the concentrated and inequitable structure of the economy.
In terms of local government, Minister Gigaba went on to state that municipalities continue to face significant financial management and
governance challenges. He said that too many municipalities do not charge tariffs that reflect the full cost of the services they deliver, in particular
for water services, thus many municipalities do not collect the funds that are owed to them, and do not adopt credible budgets.
Page 4 of 10
Madam Speaker, we all know that in our district we have one local municipalities that are struggling with financial management and governance
challenges. It therefore becomes imperative that we give these municipalities as much support as possible through the programmes identified
through their needs analysis. Especially in areas such as Integrated Development Planning and financial management, we must assist municipalities
such as Dikgatlong and Magareng local municipalities, where we know there are financial and technical capacity constraints.
As a district municipality we continue to provide support to our local municipalities with capacity constraints in the preparation of annual financial
statements and to develop audit improvement plans. We have technicians that work within the Dikgatlong, Magareng and Phokwane local
municipalities daily. In fact, it is their job to look after these municipalities and to provide technical expertise in all infrastructure related activities
of these municipalities.
Madam Speaker, in terms of basic services, it is estimated that about 5,493 households in the district have no access to water and about 16,317
households lack access to proper sanitation. This is mainly due to the high cost to eradicate backlogs and increasing annually. Municipalities in
the district are also dependent mainly on grant funding for infrastructure provision. The recent draught that we are experiencing country-wide also
puts constraints on water conservation and demand becomes a very import consideration. Water losses and non-revenue water are still very high
in the local municipalities. Although we provide assistance with operation and maintenance (O&M) funding, management of the O&M still needs
to improve. The district municipality managed to assist the local municipalities to maintain water and waste water infrastructure, electrical
infrastructure and streets and storm water infrastructure and the maintenance of gravel roads, in the previous financial year, and will continue to
do so going forward. Budget constraints remains a factor and the only infrastructure allocations to the four local municipalities will concentrate
mainly on operation and maintenance.
The availability of energy also remains a serious resource challenge, even though in the last ten years community’s access to electricity has
significantly improved.
Page 5 of 10
Financing for the replacement of infrastructure is normally funded through government programmes which require counter funding and the smaller
local municipalities struggle to provide this counter funding. It is therefore foreseen that a large part of this counter funding will have to be provided
by the district municipality.
Madam Speaker, three years ago the district municipality received the Rural Roads Asset Management System (RRAMS) Grant which was initiated
by the Department of Transport as part of the S’Hambe Sonke Programme, to assist municipalities to establish a municipal road asset management
system. The municipality appointed a service provider, for a period of 3 years, to manage the process of establishing the system. The contract with
the current service provider will come to an end during 2017/18. One of the goals is to create capacity within the FBDM to continue with the
RRAMS after the lifespan of the grant. Through this programme, the extent and condition of all municipal streets are determined and reported to
be used for planning for upgrading, refurbishment and maintenance of roads.
Madam Speaker, the district economy is still very much primary based and skewed towards the Sol Plaatje Local Municipality’s economy. Sol
Plaatje Municipality alone is responsible for over 80% (rand value) of the value addition in the district while the secondary sector contributes well
under 7%. In terms of local economic development, we have several initiatives running which include:
• Establishment of a manufacturing hub/cluster;
• Establishment of incubation hubs in all local municipalities;
• Establishment of an agri-park;
• Transformation and expansion of the Sol Plaatje fresh produce market;
• Youth Skills development;
• Support and development of SMMEs;
• Product development and marketing of locally produced products;
Page 6 of 10
• Entrepreneurship promotion and development;
• Promotion and support of township economies;
• Informal economy support program
Madam Speaker, this budget has been a product of very careful planning and forward thinking to ensure that we do not lose sight of the identified
five-year Integrated Development Plan (IDP) priorities. The Municipal Systems Act requires us to ensure financially and economically viable
municipalities and essentially this is guided by the IDP, which is our principal strategic planning instrument.
Madam Speaker, I mentioned it last year and I feel it should be repeated this year. The financial position of the municipality has declined over the
years as accumulated reserves were utilized to supplement the deficit and the situation is threatening the existence of the municipality in the near
future. We must therefore remain vigilant and never lose sight of this fact when approving the MTREF budget for 2018/19.
The National Health Act of 2003 defines that municipal health services can only be rendered by district municipalities and metropolitan
municipalities. The Frances Baard District Municipality currently does not have the capacity to render the services to the entire district, due to
budget and personnel constraints. We are rendering the service to Dikgatlong and Magareng Municipalities only, whilst the Sol Plaatje and
Phokwane Municipalities have been rendering these services in their respective areas.
In 2016 the district municipality was authorised by the National Minister of Health to enforce the foodstuffs, cosmetics and disinfectants act. Sol
Plaatje Municipality will be able to enforce the act in its area of jurisdiction as soon as the service level agreement with them have been signed. A
memorandum of understanding was signed with Phokwane Municipality to continue with rendering the services until the end of June 2018, where
after the district municipality will start rendering the services in that area.
Page 7 of 10
Madam Speaker,
The district planning tribunal, established in 2016 to assess land development and land use applications, have been hard at work. The tribunal
consists of the district municipality, Dikgatlong, Magareng and Phokwane local municipalities. To date the tribunal have assessed 19 applications,
approved 10 and 9 were either not approved or put in abeyance. The applications ranged from rezoning and subdivision to township establishments.
In the Dikgatlong municipal area the assessed and approved the proposed closure of streets and registration of erven in Klein Boetsap.
The establishment of a firefighting function in the district remains encumbered by challenges such as the lack of human capital to execute the
function and funding for the establishment of firefighting facilities. The establishment of the District Disaster Management Centre remains a
challenge, even though the planning stages for the establishment of the Disaster Centre has been concluded. The district still only has fire services
in the Sol Plaatje local municipality. Extensive research has been done to investigate the possibility of establishing a fire station in the district, cost
estimates for the establishment of the district disaster management centre were completed, and a medium pumper fire engine has been procured.
Madam Speaker, we are continuing to promote the development of tourism in the local municipalities by enhancing tourism products. We remain
focussed on establishing the district as a vibrant and sought-after destination brand by increasing the market share, thereby increasing visitor
numbers and spending. This however, can only happen through strategic partnerships and participation of all FBDM tourism role players and
collaboration between provincial, district and local tourism stakeholders.
The human settlements sector plans and chapters of the IDP have been reviewed and the district municipality will continue to support the three
local municipalities in the development of human settlements going forward.
Page 8 of 10
Madam Speaker, as of 01 July 2017 the municipality implemented the Municipal Standard Chart of Accounts (mSCOA) regulations effectively
and has been transacting live on the financial system. There has not been any challenges encountered and manage to report accurately to National
Treasury on monthly basis.
The major revenue streams that supported the programmes and activities of the district municipality remains government grants and subsidies,
interest earned on external investments and actuarial gains.
Madam Speaker, I would now like to take you through a more detailed presentation of how we propose to invest the funds that have been entrusted
to us. The total budget for the 2018/19 financial year is R 127.619m. The operational budget is R 128.517m and the capital budget is R 8.050m,
the deficit for 2018/19 is R 8.948m after capital.
Madam Speaker, please allow me to give a breakdown of the infrastructure budget as this will be used to improve the quality of life in the local
municipalities. A seventy percent cut was made to the 2018/19 budget as compared to the 2017/18 financial year.due to the financial constrains
experienced by the municipality as a result in the decrease in cash backed reserves. For the 2018/19 financial year, the following allocations were
made in terms of Operation and Maintenance:
Sol Plaatje Municipality will receive:
• Allocation of R1,75m
Dikgatlong Municipality will receive:
• Allocation of R1.75m
Page 9 of 10
Magareng Municipality will receive:
• Allocation of R 1.75m
Phokwane Municipality will receive:
• Allocation of R1.75m
For improvement in the local economic development and tourism an amount of R3m and R2.6m has been allocated respectively. The two
departments also had a major cut on their budget due to the municipality’s financial position.
Madam Speaker, as said before, grants and subsidies remain to be our biggest source of income and we are at R116.2m for 2018/19 which is 90%
of the total revenue. This dependency on grants and subsidies influences our total operating expenditure.
The major grant funding that the district municipality is receiving from national government are as follows:
• Equitable Share: R 116.2m
• Finance Management Grant: R 1m
• Rural Asset Management Grant: R 2.521m
• EPWP: R 1.1m
• Provincial Grant – NEAR Control: R 368,000
• Skills Grant: R 100,000
Page 10 of 10
Madam Speaker
As you can see through this budget, we continue to be a district municipality which focuses most of its resources towards the support of our local
municipalities. We will continue to do so to ensure that we improve the lives and living conditions of the communities that we were elected to
serve.
As the 2018 national budget alluded, we should not turn a blind eye to the fact that enormous economic and fiscal challenges still face our country.
Economic growth is far too low to reduce alarmingly high unemployment and inequality. It will require us to be more disciplined and resilient in
how we spend our budget. I want to concur with the sentiments of the Minister of Finance when he said that we will continue to improve planning
for major infrastructure projects to ensure value for money.
As Tata Madiba said, “Money won’t create success, the freedom to make it will.”
Madam Speaker, I want to place on record my sincere appreciation to members of the mayoral committee and all the councillors involved in the
public participation processes. I would further like to show my gratitude to the municipal manager and her staff, who has worked tirelessly to
ensure that all legislative requirements are met and for the long hours worked to facilitate in putting together this budget.
Madam Speaker, lastly, I want to thank all stakeholders and members of the public who gave input to this process. I believe that this was
a team effort and by sharing credit and thanking all involved, I know we have your dedication and support always.
I thank you
QUALITY CERTIFICATE
ADJUSTMENT BUDGET SCHEDULES
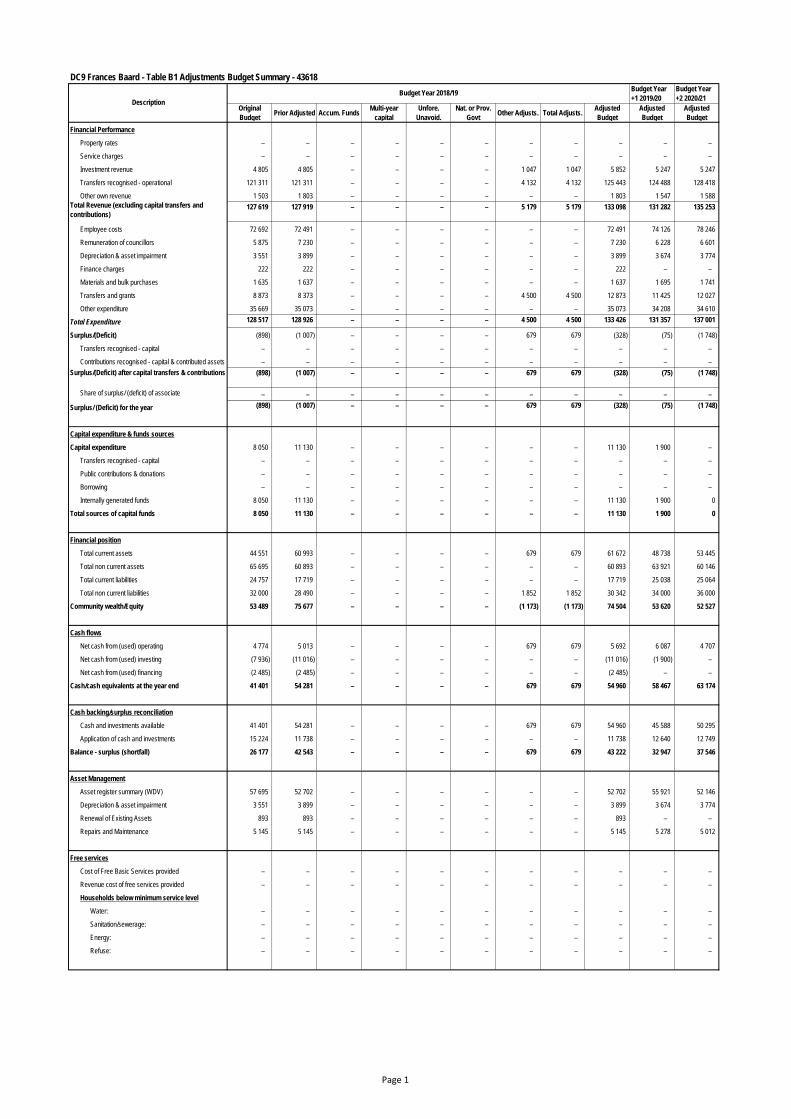
DC9 Frances Baard - Table B1 Adjustments Budget Summary - 43618
Budget Year
+1 2019/20
Budget Year
+2 2020/21
Original
BudgetPrior Adjusted Accum. Funds
Multi-year
capital
Unfore.
Unavoid.
Nat. or Prov.
GovtOther Adjusts. Total Adjusts.
Adjusted
Budget
Adjusted
Budget
Adjusted
Budget
Financial Performance
Property rates – – – – – – – – – – –
Service charges – – – – – – – – – – –
Investment revenue 4 805 4 805 – – – – 1 047 1 047 5 852 5 247 5 247
Transfers recognised - operational 121 311 121 311 – – – – 4 132 4 132 125 443 124 488 128 418
Other own revenue 1 503 1 803 – – – – – – 1 803 1 547 1 588
Total Revenue (excluding capital transfers and
contributions)127 619 127 919 – – – – 5 179 5 179 133 098 131 282 135 253
Employee costs 72 692 72 491 – – – – – – 72 491 74 126 78 246
Remuneration of councillors 5 875 7 230 – – – – – – 7 230 6 228 6 601
Depreciation & asset impairment 3 551 3 899 – – – – – – 3 899 3 674 3 774
Finance charges 222 222 – – – – – – 222 – –
Materials and bulk purchases 1 635 1 637 – – – – – – 1 637 1 695 1 741
Transfers and grants 8 873 8 373 – – – – 4 500 4 500 12 873 11 425 12 027
Other expenditure 35 669 35 073 – – – – – – 35 073 34 208 34 610
Total Expenditure 128 517 128 926 – – – – 4 500 4 500 133 426 131 357 137 001
Surplus/(Deficit) (898) (1 007) – – – – 679 679 (328) (75) (1 748)
Transfers recognised - capital – – – – – – – – – – –
Contributions recognised - capital & contributed assets – – – – – – – – – – –
Surplus/(Deficit) after capital transfers & contributions (898) (1 007) – – – – 679 679 (328) (75) (1 748)
Share of surplus/ (deficit) of associate – – – – – – – – – – –
Surplus/ (Deficit) for the year (898) (1 007) – – – – 679 679 (328) (75) (1 748)
Capital expenditure & funds sources
Capital expenditure 8 050 11 130 – – – – – – 11 130 1 900 –
Transfers recognised - capital – – – – – – – – – – –
Public contributions & donations – – – – – – – – – – –
Borrowing – – – – – – – – – – –
Internally generated funds 8 050 11 130 – – – – – – 11 130 1 900 0
Total sources of capital funds 8 050 11 130 – – – – – – 11 130 1 900 0
Financial position
Total current assets 44 551 60 993 – – – – 679 679 61 672 48 738 53 445
Total non current assets 65 695 60 893 – – – – – – 60 893 63 921 60 146
Total current liabilities 24 757 17 719 – – – – – – 17 719 25 038 25 064
Total non current liabilities 32 000 28 490 – – – – 1 852 1 852 30 342 34 000 36 000
Community wealth/Equity 53 489 75 677 – – – – (1 173) (1 173) 74 504 53 620 52 527
Cash flows
Net cash from (used) operating 4 774 5 013 – – – – 679 679 5 692 6 087 4 707
Net cash from (used) investing (7 936) (11 016) – – – – – – (11 016) (1 900) –
Net cash from (used) financing (2 485) (2 485) – – – – – – (2 485) – –
Cash/cash equivalents at the year end 41 401 54 281 – – – – 679 679 54 960 58 467 63 174
Cash backing/surplus reconciliation
Cash and investments available 41 401 54 281 – – – – 679 679 54 960 45 588 50 295
Application of cash and investments 15 224 11 738 – – – – – – 11 738 12 640 12 749
Balance - surplus (shortfall) 26 177 42 543 – – – – 679 679 43 222 32 947 37 546
Asset Management
Asset register summary (WDV) 57 695 52 702 – – – – – – 52 702 55 921 52 146
Depreciation & asset impairment 3 551 3 899 – – – – – – 3 899 3 674 3 774
Renewal of Existing Assets 893 893 – – – – – – 893 – –
Repairs and Maintenance 5 145 5 145 – – – – – – 5 145 5 278 5 012
Free services
Cost of Free Basic Services provided – – – – – – – – – – –
Revenue cost of free services provided – – – – – – – – – – –
Households below minimum service level
Water: – – – – – – – – – – –
Sanitation/sewerage: – – – – – – – – – – –
Energy: – – – – – – – – – – –
Refuse: – – – – – – – – – – –
Description
Budget Year 2018/19
Page 1
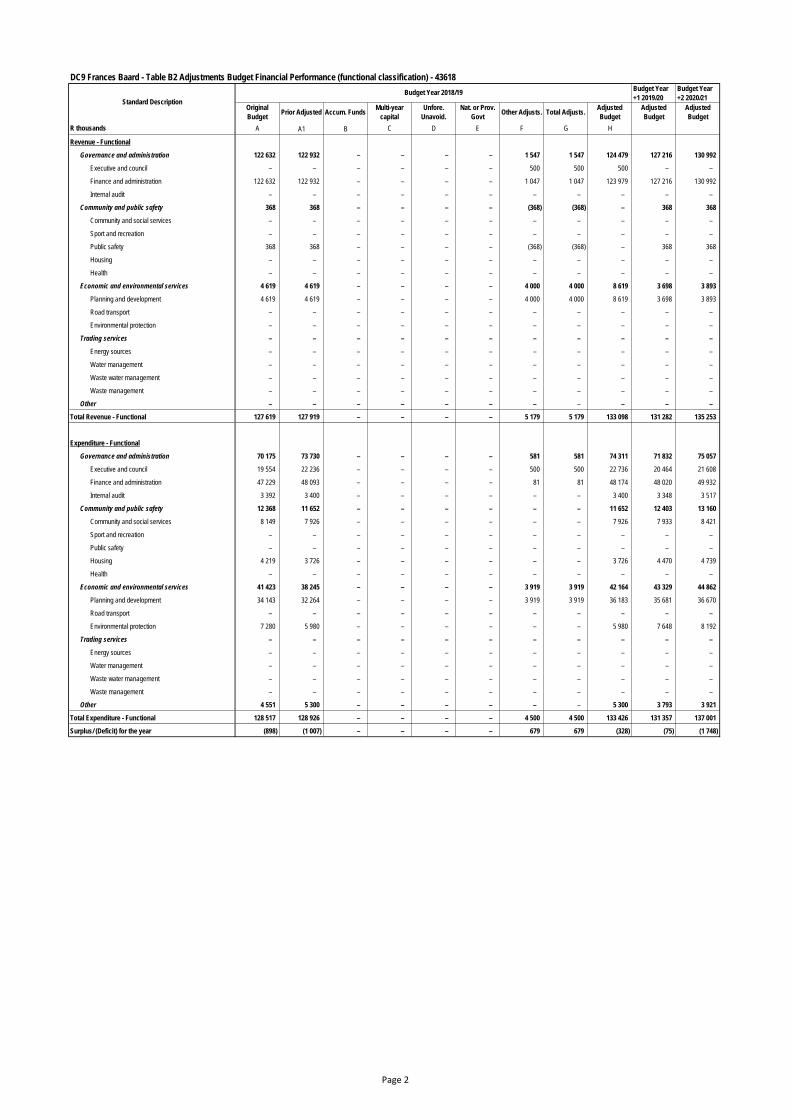
DC9 Frances Baard - Table B2 Adjustments Budget Financial Performance (functional classification) - 43618
Budget Year
+1 2019/20
Budget Year
+2 2020/21
Original
BudgetPrior Adjusted Accum. Funds
Multi-year
capital
Unfore.
Unavoid.
Nat. or Prov.
GovtOther Adjusts. Total Adjusts.
Adjusted
Budget
Adjusted
Budget
Adjusted
Budget
R thousands A A1 B C D E F G H
Revenue - Functional
Governance and administration 122 632 122 932 – – – – 1 547 1 547 124 479 127 216 130 992
Executive and council – – – – – – 500 500 500 – –
Finance and administration 122 632 122 932 – – – – 1 047 1 047 123 979 127 216 130 992
Internal audit – – – – – – – – – – –
Community and public safety 368 368 – – – – (368) (368) – 368 368
Community and social services – – – – – – – – – – –
Sport and recreation – – – – – – – – – – –
Public safety 368 368 – – – – (368) (368) – 368 368
Housing – – – – – – – – – – –
Health – – – – – – – – – – –
Economic and environmental services 4 619 4 619 – – – – 4 000 4 000 8 619 3 698 3 893
Planning and development 4 619 4 619 – – – – 4 000 4 000 8 619 3 698 3 893
Road transport – – – – – – – – – – –
Environmental protection – – – – – – – – – – –
Trading services – – – – – – – – – – –
Energy sources – – – – – – – – – – –
Water management – – – – – – – – – – –
Waste water management – – – – – – – – – – –
Waste management – – – – – – – – – – –
Other – – – – – – – – – – –
Total Revenue - Functional 127 619 127 919 – – – – 5 179 5 179 133 098 131 282 135 253
Expenditure - Functional
Governance and administration 70 175 73 730 – – – – 581 581 74 311 71 832 75 057
Executive and council 19 554 22 236 – – – – 500 500 22 736 20 464 21 608
Finance and administration 47 229 48 093 – – – – 81 81 48 174 48 020 49 932
Internal audit 3 392 3 400 – – – – – – 3 400 3 348 3 517
Community and public safety 12 368 11 652 – – – – – – 11 652 12 403 13 160
Community and social services 8 149 7 926 – – – – – – 7 926 7 933 8 421
Sport and recreation – – – – – – – – – – –
Public safety – – – – – – – – – – –
Housing 4 219 3 726 – – – – – – 3 726 4 470 4 739
Health – – – – – – – – – – –
Economic and environmental services 41 423 38 245 – – – – 3 919 3 919 42 164 43 329 44 862
Planning and development 34 143 32 264 – – – – 3 919 3 919 36 183 35 681 36 670
Road transport – – – – – – – – – – –
Environmental protection 7 280 5 980 – – – – – – 5 980 7 648 8 192
Trading services – – – – – – – – – – –
Energy sources – – – – – – – – – – –
Water management – – – – – – – – – – –
Waste water management – – – – – – – – – – –
Waste management – – – – – – – – – – –
Other 4 551 5 300 – – – – – – 5 300 3 793 3 921
Total Expenditure - Functional 128 517 128 926 – – – – 4 500 4 500 133 426 131 357 137 001
Surplus/ (Deficit) for the year (898) (1 007) – – – – 679 679 (328) (75) (1 748)
Standard Description
Budget Year 2018/19
Page 2
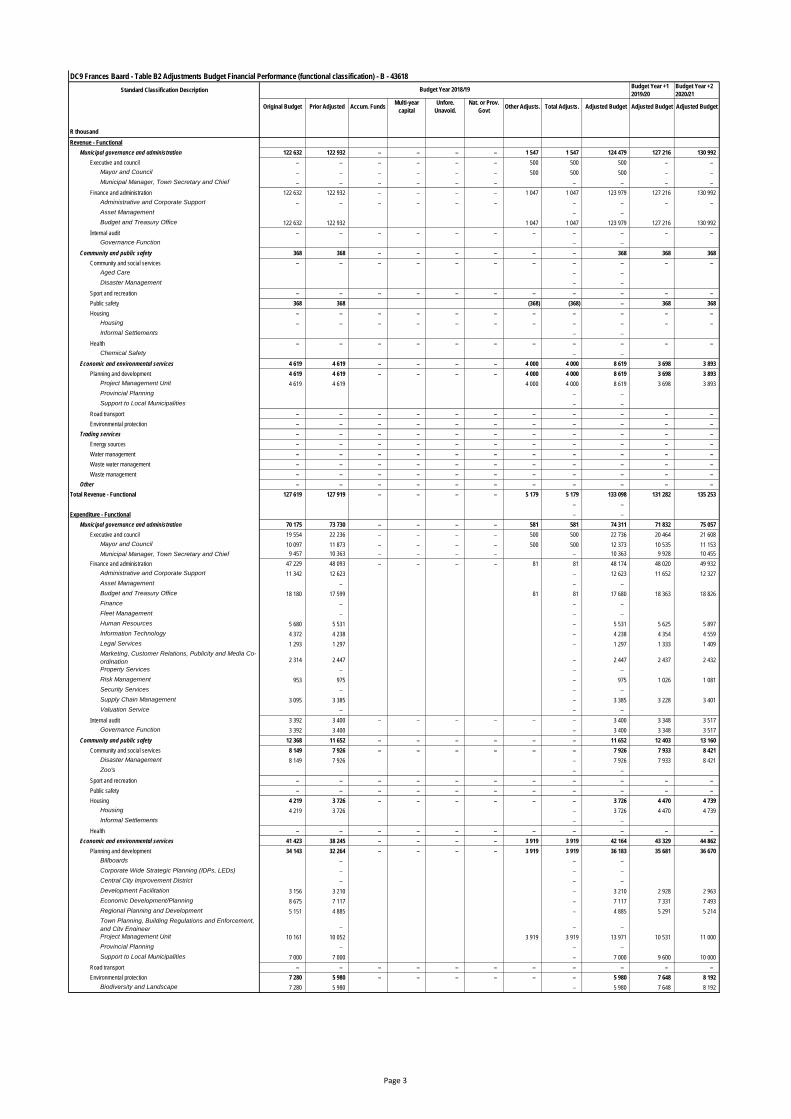
DC9 Frances Baard - Table B2 Adjustments Budget Financial Performance (functional classification) - B - 43618
Standard Classification DescriptionBudget Year +1
2019/20
Budget Year +2
2020/21
Original Budget Prior Adjusted Accum. FundsMulti-year
capital
Unfore.
Unavoid.
Nat. or Prov.
GovtOther Adjusts. Total Adjusts. Adjusted Budget Adjusted Budget Adjusted Budget
R thousand
Revenue - Functional
Municipal governance and administration 122 632 122 932 – – – – 1 547 1 547 124 479 127 216 130 992
Executive and council – – – – – – 500 500 500 – –
Mayor and Council – – – – – – 500 500 500 – –
Municipal Manager, Town Secretary and Chief
Executive
– – – – – – – – – –
Finance and administration 122 632 122 932 – – – – 1 047 1 047 123 979 127 216 130 992
Administrative and Corporate Support – – – – – – – – – –
Asset Management – –
Budget and Treasury Office 122 632 122 932 1 047 1 047 123 979 127 216 130 992
Internal audit – – – – – – – – – – –
Governance Function – –
Community and public safety 368 368 – – – – – – 368 368 368
Community and social services – – – – – – – – – – –
Aged Care – –
Disaster Management – –
Sport and recreation – – – – – – – – – – –
Public safety 368 368 (368) (368) – 368 368
Housing – – – – – – – – – – –
Housing – – – – – – – – – – –
Informal Settlements – –
Health – – – – – – – – – – –
Chemical Safety – –
Economic and environmental services 4 619 4 619 – – – – 4 000 4 000 8 619 3 698 3 893
Planning and development 4 619 4 619 – – – – 4 000 4 000 8 619 3 698 3 893
Project Management Unit 4 619 4 619 4 000 4 000 8 619 3 698 3 893
Provincial Planning – –
Support to Local Municipalities – –
Road transport – – – – – – – – – – –
Environmental protection – – – – – – – – – – –
Trading services – – – – – – – – – – –
Energy sources – – – – – – – – – – –
Water management – – – – – – – – – – –
Waste water management – – – – – – – – – – –
Waste management – – – – – – – – – – –
Other – – – – – – – – – – –
Total Revenue - Functional 127 619 127 919 – – – – 5 179 5 179 133 098 131 282 135 253
– –
Expenditure - Functional – –
Municipal governance and administration 70 175 73 730 – – – – 581 581 74 311 71 832 75 057
Executive and council 19 554 22 236 – – – – 500 500 22 736 20 464 21 608
Mayor and Council 10 097 11 873 – – – – 500 500 12 373 10 535 11 153
Municipal Manager, Town Secretary and Chief
Executive
9 457 10 363 – – – – – 10 363 9 928 10 455
Finance and administration 47 229 48 093 – – – – 81 81 48 174 48 020 49 932
Administrative and Corporate Support 11 342 12 623 – 12 623 11 652 12 327
Asset Management – – –
Budget and Treasury Office 18 180 17 599 81 81 17 680 18 363 18 826
Finance – – –
Fleet Management – – –
Human Resources 5 680 5 531 – 5 531 5 625 5 897
Information Technology 4 372 4 238 – 4 238 4 354 4 559
Legal Services 1 293 1 297 – 1 297 1 333 1 409
Marketing, Customer Relations, Publicity and Media Co-
ordination 2 314 2 447 – 2 447 2 437 2 432
Property Services – – –
Risk Management 953 975 – 975 1 026 1 081
Security Services – – –
Supply Chain Management 3 095 3 385 – 3 385 3 228 3 401
Valuation Service – – –
Internal audit 3 392 3 400 – – – – – – 3 400 3 348 3 517
Governance Function 3 392 3 400 – 3 400 3 348 3 517
Community and public safety 12 368 11 652 – – – – – – 11 652 12 403 13 160
Community and social services 8 149 7 926 – – – – – – 7 926 7 933 8 421
Disaster Management 8 149 7 926 – 7 926 7 933 8 421
Zoo's – –
Sport and recreation – – – – – – – – – – –
Public safety – – – – – – – – – – –
Housing 4 219 3 726 – – – – – – 3 726 4 470 4 739
Housing 4 219 3 726 – 3 726 4 470 4 739
Informal Settlements – –
Health – – – – – – – – – – –
Economic and environmental services 41 423 38 245 – – – – 3 919 3 919 42 164 43 329 44 862
Planning and development 34 143 32 264 – – – – 3 919 3 919 36 183 35 681 36 670
Billboards – – –
Corporate Wide Strategic Planning (IDPs, LEDs) – – –
Central City Improvement District – – –
Development Facilitation 3 156 3 210 – 3 210 2 928 2 963
Economic Development/Planning 8 675 7 117 – 7 117 7 331 7 493
Regional Planning and Development 5 151 4 885 – 4 885 5 291 5 214
Town Planning, Building Regulations and Enforcement,
and City Engineer – – –
Project Management Unit 10 161 10 052 3 919 3 919 13 971 10 531 11 000
Provincial Planning – – –
Support to Local Municipalities 7 000 7 000 – 7 000 9 600 10 000
Road transport – – – – – – – – – – –
Environmental protection 7 280 5 980 – – – – – – 5 980 7 648 8 192
Biodiversity and Landscape 7 280 5 980 – 5 980 7 648 8 192
Budget Year 2018/19
Page 3
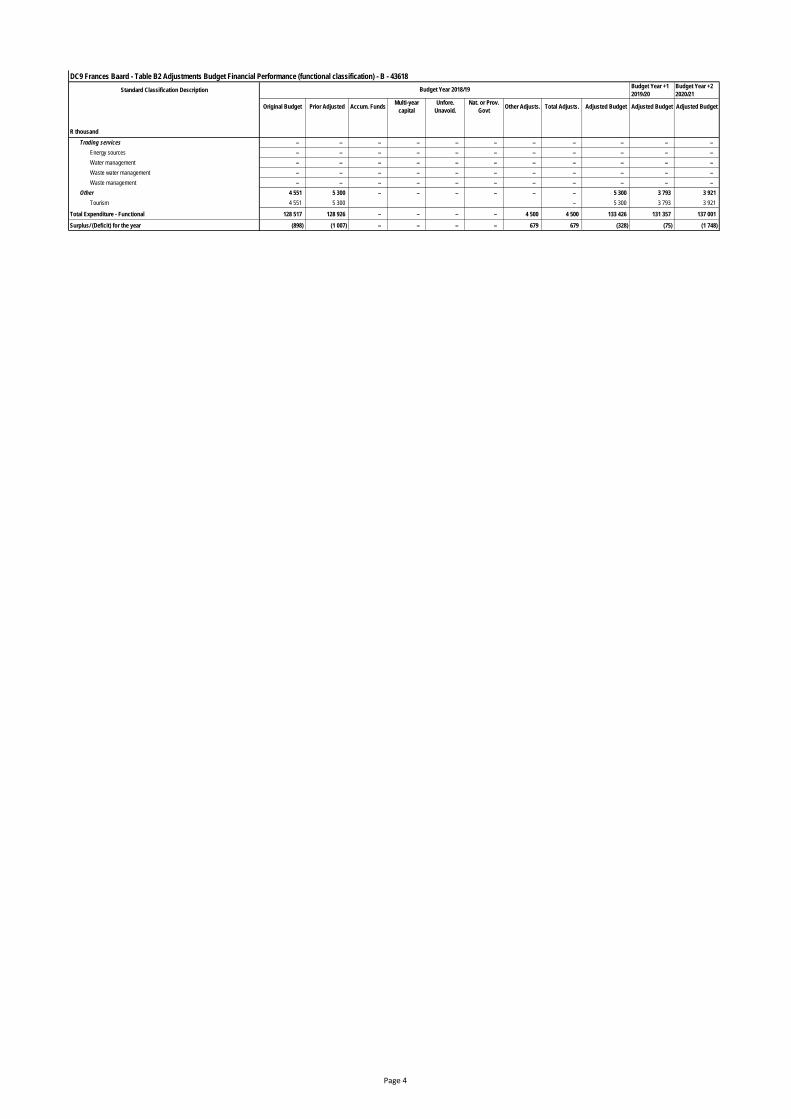
DC9 Frances Baard - Table B2 Adjustments Budget Financial Performance (functional classification) - B - 43618
Standard Classification DescriptionBudget Year +1
2019/20
Budget Year +2
2020/21
Original Budget Prior Adjusted Accum. FundsMulti-year
capital
Unfore.
Unavoid.
Nat. or Prov.
GovtOther Adjusts. Total Adjusts. Adjusted Budget Adjusted Budget Adjusted Budget
R thousand
Budget Year 2018/19
Trading services – – – – – – – – – – –
Energy sources – – – – – – – – – – –
Water management – – – – – – – – – – –
Waste water management – – – – – – – – – – –
Waste management – – – – – – – – – – –
Other 4 551 5 300 – – – – – – 5 300 3 793 3 921
Tourism 4 551 5 300 – 5 300 3 793 3 921
Total Expenditure - Functional 128 517 128 926 – – – – 4 500 4 500 133 426 131 357 137 001
Surplus/ (Deficit) for the year (898) (1 007) – – – – 679 679 (328) (75) (1 748)
Page 4
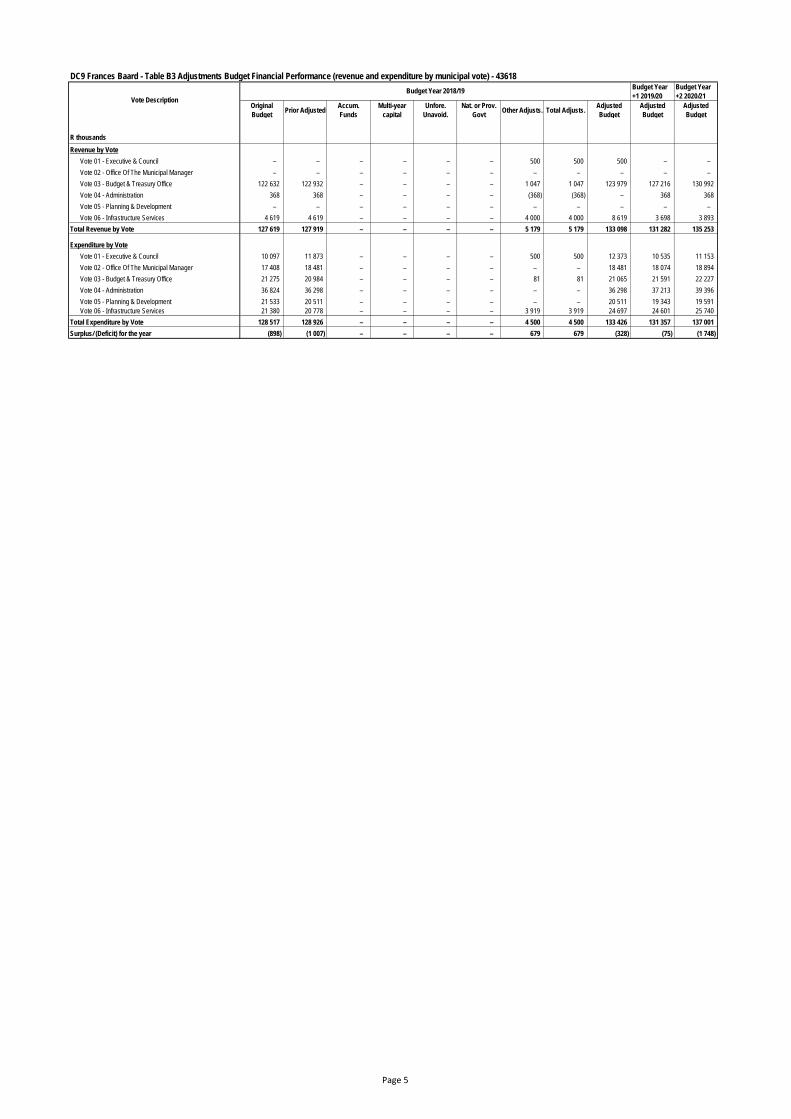
DC9 Frances Baard - Table B3 Adjustments Budget Financial Performance (revenue and expenditure by municipal vote) - 43618Budget Year
+1 2019/20
Budget Year
+2 2020/21
Original
BudgetPrior Adjusted
Accum.
Funds
Multi-year
capital
Unfore.
Unavoid.
Nat. or Prov.
GovtOther Adjusts. Total Adjusts.
Adjusted
Budget
Adjusted
Budget
Adjusted
Budget
R thousands
Revenue by Vote
Vote 01 - Executive & Council – – – – – – 500 500 500 – –
Vote 02 - Office Of The Municipal Manager – – – – – – – – – – –
Vote 03 - Budget & Treasury Office 122 632 122 932 – – – – 1 047 1 047 123 979 127 216 130 992
Vote 04 - Administration 368 368 – – – – (368) (368) – 368 368
Vote 05 - Planning & Development – – – – – – – – – – –
Vote 06 - Infrastructure Services 4 619 4 619 – – – – 4 000 4 000 8 619 3 698 3 893
Total Revenue by Vote 127 619 127 919 – – – – 5 179 5 179 133 098 131 282 135 253
Expenditure by Vote
Vote 01 - Executive & Council 10 097 11 873 – – – – 500 500 12 373 10 535 11 153
Vote 02 - Office Of The Municipal Manager 17 408 18 481 – – – – – – 18 481 18 074 18 894
Vote 03 - Budget & Treasury Office 21 275 20 984 – – – – 81 81 21 065 21 591 22 227
Vote 04 - Administration 36 824 36 298 – – – – – – 36 298 37 213 39 396
Vote 05 - Planning & Development 21 533 20 511 – – – – – – 20 511 19 343 19 591
Vote 06 - Infrastructure Services 21 380 20 778 – – – – 3 919 3 919 24 697 24 601 25 740
Total Expenditure by Vote 128 517 128 926 – – – – 4 500 4 500 133 426 131 357 137 001
Surplus/ (Deficit) for the year (898) (1 007) – – – – 679 679 (328) (75) (1 748)
Vote Description
Budget Year 2018/19
Page 5
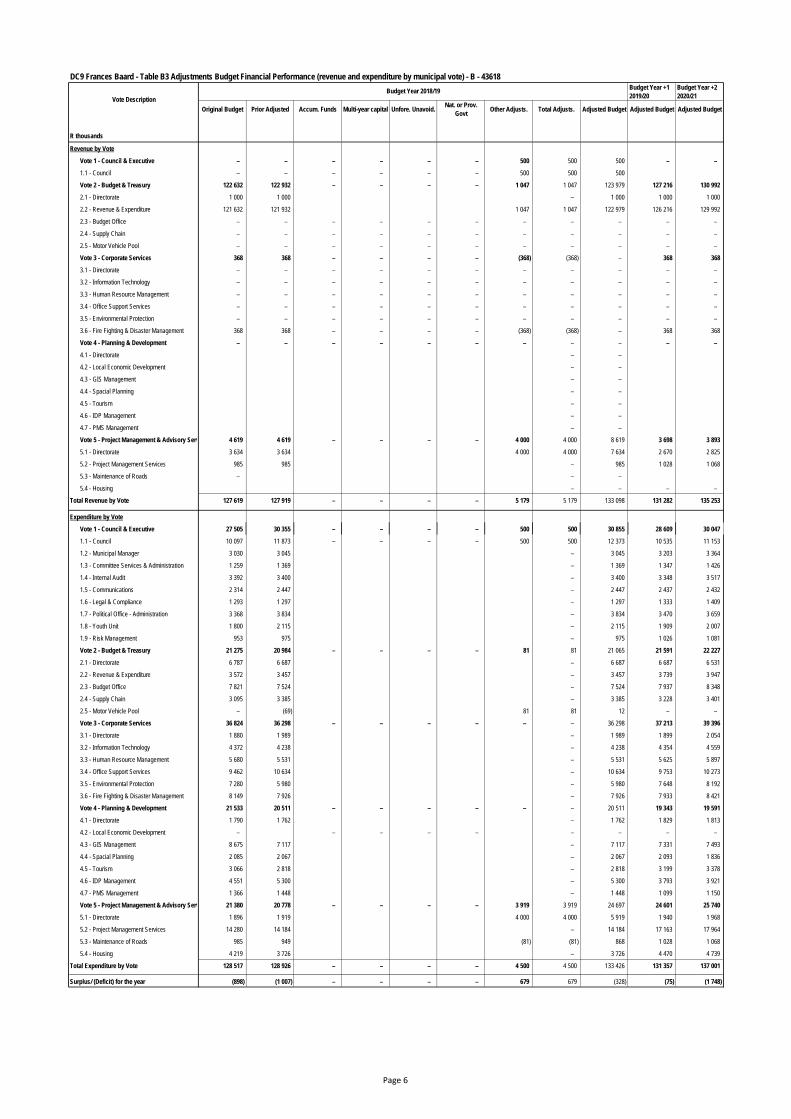
DC9 Frances Baard - Table B3 Adjustments Budget Financial Performance (revenue and expenditure by municipal vote) - B - 43618
Budget Year +1
2019/20
Budget Year +2
2020/21
Original Budget Prior Adjusted Accum. Funds Multi-year capital Unfore. Unavoid.Nat. or Prov.
GovtOther Adjusts. Total Adjusts. Adjusted Budget Adjusted Budget Adjusted Budget
R thousands
Revenue by Vote
Vote 1 - Council & Executive – – – – – – 500 500 500 – –
1.1 - Council – – – – – – 500 500 500
Vote 2 - Budget & Treasury 122 632 122 932 – – – – 1 047 1 047 123 979 127 216 130 992
2.1 - Directorate 1 000 1 000 – 1 000 1 000 1 000
2.2 - Revenue & Expenditure 121 632 121 932 1 047 1 047 122 979 126 216 129 992
2.3 - Budget Office – – – – – – – – – – –
2.4 - Supply Chain – – – – – – – – – – –
2.5 - Motor Vehicle Pool – – – – – – – – – – –
Vote 3 - Corporate Services 368 368 – – – – (368) (368) – 368 368
3.1 - Directorate – – – – – – – – – – –
3.2 - Information Technology – – – – – – – – – – –
3.3 - Human Resource Management – – – – – – – – – – –
3.4 - Office Support Services – – – – – – – – – – –
3.5 - Environmental Protection – – – – – – – – – – –
3.6 - Fire Fighting & Disaster Management 368 368 – – – – (368) (368) – 368 368
Vote 4 - Planning & Development – – – – – – – – – – –
4.1 - Directorate – –
4.2 - Local Economic Development – –
4.3 - GIS Management – –
4.4 - Spacial Planning – –
4.5 - Tourism – –
4.6 - IDP Management – –
4.7 - PMS Management – –
Vote 5 - Project Management & Advisory Services 4 619 4 619 – – – – 4 000 4 000 8 619 3 698 3 893
5.1 - Directorate 3 634 3 634 4 000 4 000 7 634 2 670 2 825
5.2 - Project Management Services 985 985 – 985 1 028 1 068
5.3 - Maintenance of Roads – – –
5.4 - Housing – – – –
Total Revenue by Vote 127 619 127 919 – – – – 5 179 5 179 133 098 131 282 135 253
Expenditure by Vote
Vote 1 - Council & Executive 27 505 30 355 – – – – 500 500 30 855 28 609 30 047
1.1 - Council 10 097 11 873 – – – – 500 500 12 373 10 535 11 153
1.2 - Municipal Manager 3 030 3 045 – 3 045 3 203 3 364
1.3 - Committee Services & Administration 1 259 1 369 – 1 369 1 347 1 426
1.4 - Internal Audit 3 392 3 400 – 3 400 3 348 3 517
1.5 - Communications 2 314 2 447 – 2 447 2 437 2 432
1.6 - Legal & Compliance 1 293 1 297 – 1 297 1 333 1 409
1.7 - Political Office - Administration 3 368 3 834 – 3 834 3 470 3 659
1.8 - Youth Unit 1 800 2 115 – 2 115 1 909 2 007
1.9 - Risk Management 953 975 – 975 1 026 1 081
Vote 2 - Budget & Treasury 21 275 20 984 – – – – 81 81 21 065 21 591 22 227
2.1 - Directorate 6 787 6 687 – 6 687 6 687 6 531
2.2 - Revenue & Expenditure 3 572 3 457 – 3 457 3 739 3 947
2.3 - Budget Office 7 821 7 524 – 7 524 7 937 8 348
2.4 - Supply Chain 3 095 3 385 – 3 385 3 228 3 401
2.5 - Motor Vehicle Pool – (69) 81 81 12 – –
Vote 3 - Corporate Services 36 824 36 298 – – – – – – 36 298 37 213 39 396
3.1 - Directorate 1 880 1 989 – 1 989 1 899 2 054
3.2 - Information Technology 4 372 4 238 – 4 238 4 354 4 559
3.3 - Human Resource Management 5 680 5 531 – 5 531 5 625 5 897
3.4 - Office Support Services 9 462 10 634 – 10 634 9 753 10 273
3.5 - Environmental Protection 7 280 5 980 – 5 980 7 648 8 192
3.6 - Fire Fighting & Disaster Management 8 149 7 926 – 7 926 7 933 8 421
Vote 4 - Planning & Development 21 533 20 511 – – – – – – 20 511 19 343 19 591
4.1 - Directorate 1 790 1 762 – 1 762 1 829 1 813
4.2 - Local Economic Development – – – – – – – – –
4.3 - GIS Management 8 675 7 117 – 7 117 7 331 7 493
4.4 - Spacial Planning 2 085 2 067 – 2 067 2 093 1 836
4.5 - Tourism 3 066 2 818 – 2 818 3 199 3 378
4.6 - IDP Management 4 551 5 300 – 5 300 3 793 3 921
4.7 - PMS Management 1 366 1 448 – 1 448 1 099 1 150
Vote 5 - Project Management & Advisory Services 21 380 20 778 – – – – 3 919 3 919 24 697 24 601 25 740
5.1 - Directorate 1 896 1 919 4 000 4 000 5 919 1 940 1 968
5.2 - Project Management Services 14 280 14 184 – 14 184 17 163 17 964
5.3 - Maintenance of Roads 985 949 (81) (81) 868 1 028 1 068
5.4 - Housing 4 219 3 726 – 3 726 4 470 4 739
Total Expenditure by Vote 128 517 128 926 – – – – 4 500 4 500 133 426 131 357 137 001
Surplus/ (Deficit) for the year (898) (1 007) – – – – 679 679 (328) (75) (1 748)
Vote Description
Budget Year 2018/19
Page 6
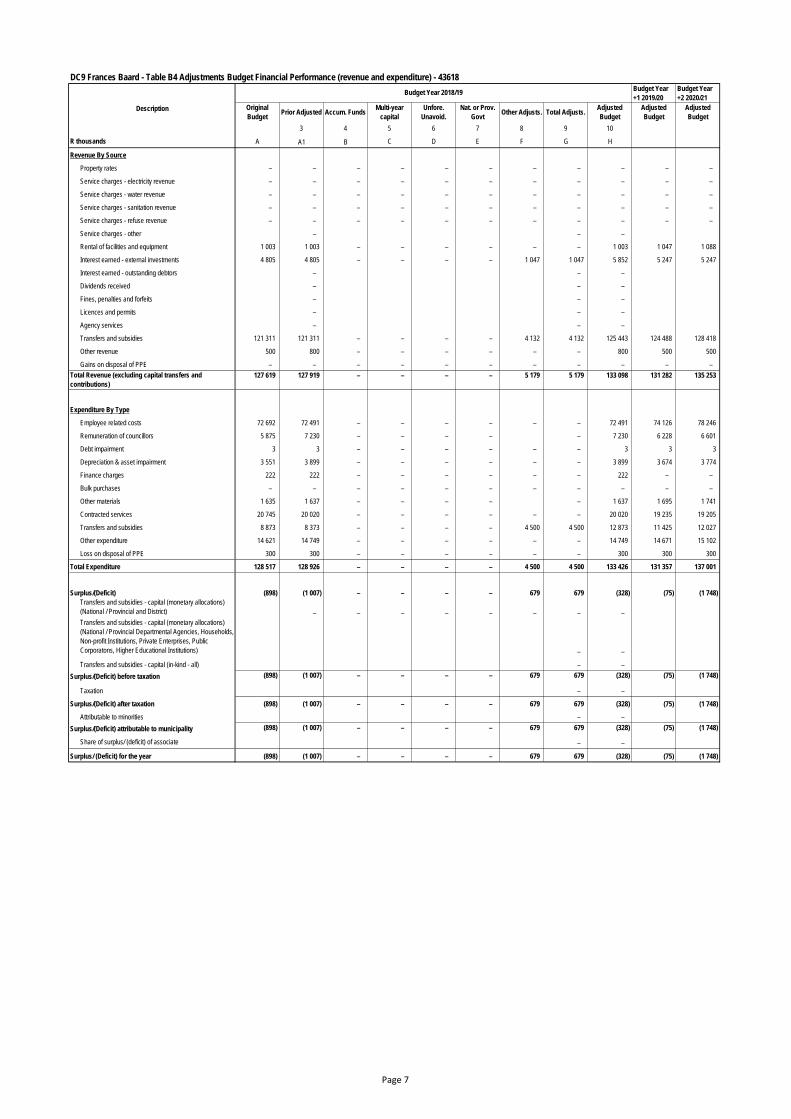
DC9 Frances Baard - Table B4 Adjustments Budget Financial Performance (revenue and expenditure) - 43618
Budget Year
+1 2019/20
Budget Year
+2 2020/21
Original
BudgetPrior Adjusted Accum. Funds
Multi-year
capital
Unfore.
Unavoid.
Nat. or Prov.
GovtOther Adjusts. Total Adjusts.
Adjusted
Budget
Adjusted
Budget
Adjusted
Budget
3 4 5 6 7 8 9 10
R thousands A A1 B C D E F G H
Revenue By Source
Property rates – – – – – – – – – – –
Service charges - electricity revenue – – – – – – – – – – –
Service charges - water revenue – – – – – – – – – – –
Service charges - sanitation revenue – – – – – – – – – – –
Service charges - refuse revenue – – – – – – – – – – –
Service charges - other – – –
Rental of facilities and equipment 1 003 1 003 – – – – – – 1 003 1 047 1 088
Interest earned - external investments 4 805 4 805 – – – – 1 047 1 047 5 852 5 247 5 247
Interest earned - outstanding debtors – – –
Dividends received – – –
Fines, penalties and forfeits – – –
Licences and permits – – –
Agency services – – –
Transfers and subsidies 121 311 121 311 – – – – 4 132 4 132 125 443 124 488 128 418
Other revenue 500 800 – – – – – – 800 500 500
Gains on disposal of PPE – – – – – – – – – – –
Total Revenue (excluding capital transfers and
contributions)
127 619 127 919 – – – – 5 179 5 179 133 098 131 282 135 253
Expenditure By Type
Employee related costs 72 692 72 491 – – – – – – 72 491 74 126 78 246
Remuneration of councillors 5 875 7 230 – – – – – 7 230 6 228 6 601
Debt impairment 3 3 – – – – – – 3 3 3
Depreciation & asset impairment 3 551 3 899 – – – – – – 3 899 3 674 3 774
Finance charges 222 222 – – – – – – 222 – –
Bulk purchases – – – – – – – – – – –
Other materials 1 635 1 637 – – – – – 1 637 1 695 1 741
Contracted services 20 745 20 020 – – – – – – 20 020 19 235 19 205
Transfers and subsidies 8 873 8 373 – – – – 4 500 4 500 12 873 11 425 12 027
Other expenditure 14 621 14 749 – – – – – – 14 749 14 671 15 102
Loss on disposal of PPE 300 300 – – – – – – 300 300 300
Total Expenditure 128 517 128 926 – – – – 4 500 4 500 133 426 131 357 137 001
Surplus/(Deficit) (898) (1 007) – – – – 679 679 (328) (75) (1 748)
Transfers and subsidies - capital (monetary allocations)
(National / Provincial and District) – – – – – – – –
Transfers and subsidies - capital (monetary allocations)
(National / Provincial Departmental Agencies, Households,
Non-profit Institutions, Private Enterprises, Public
Corporatons, Higher Educational Institutions) – –
Transfers and subsidies - capital (in-kind - all) – –
Surplus/(Deficit) before taxation (898) (1 007) – – – – 679 679 (328) (75) (1 748)
Taxation – –
Surplus/(Deficit) after taxation (898) (1 007) – – – – 679 679 (328) (75) (1 748)
Attributable to minorities – –
Surplus/(Deficit) attributable to municipality (898) (1 007) – – – – 679 679 (328) (75) (1 748)
Share of surplus/ (deficit) of associate – –
Surplus/ (Deficit) for the year (898) (1 007) – – – – 679 679 (328) (75) (1 748)
Description
Budget Year 2018/19
Page 7
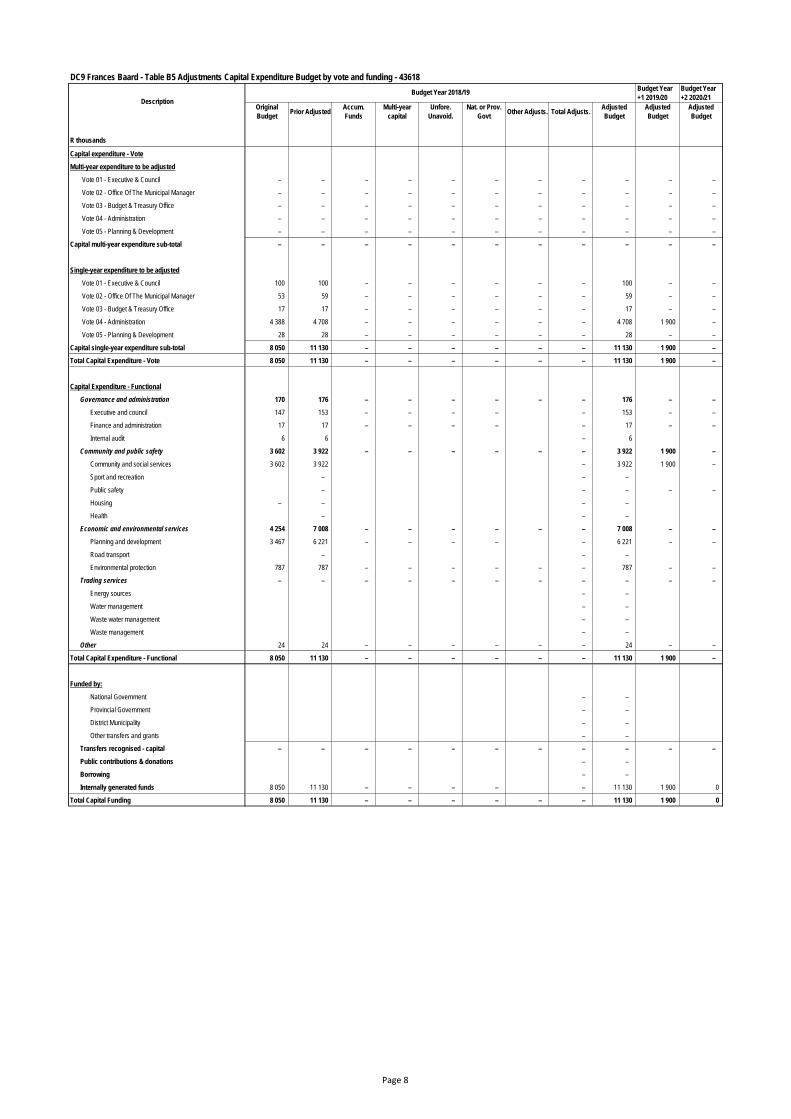
DC9 Frances Baard - Table B5 Adjustments Capital Expenditure Budget by vote and funding - 43618
Budget Year
+1 2019/20
Budget Year
+2 2020/21
Original
BudgetPrior Adjusted
Accum.
Funds
Multi-year
capital
Unfore.
Unavoid.
Nat. or Prov.
GovtOther Adjusts. Total Adjusts.
Adjusted
Budget
Adjusted
Budget
Adjusted
Budget
R thousands
Capital expenditure - Vote
Multi-year expenditure to be adjusted
Vote 01 - Executive & Council – – – – – – – – – – –
Vote 02 - Office Of The Municipal Manager – – – – – – – – – – –
Vote 03 - Budget & Treasury Office – – – – – – – – – – –
Vote 04 - Administration – – – – – – – – – – –
Vote 05 - Planning & Development – – – – – – – – – – –
Capital multi-year expenditure sub-total – – – – – – – – – – –
Single-year expenditure to be adjusted
Vote 01 - Executive & Council 100 100 – – – – – – 100 – –
Vote 02 - Office Of The Municipal Manager 53 59 – – – – – – 59 – –
Vote 03 - Budget & Treasury Office 17 17 – – – – – – 17 – –
Vote 04 - Administration 4 388 4 708 – – – – – – 4 708 1 900 –
Vote 05 - Planning & Development 28 28 – – – – – – 28 – –
Capital single-year expenditure sub-total 8 050 11 130 – – – – – – 11 130 1 900 –
Total Capital Expenditure - Vote 8 050 11 130 – – – – – – 11 130 1 900 –
Capital Expenditure - Functional
Governance and administration 170 176 – – – – – – 176 – –
Executive and council 147 153 – – – – – 153 – –
Finance and administration 17 17 – – – – – 17 – –
Internal audit 6 6 – 6
Community and public safety 3 602 3 922 – – – – – – 3 922 1 900 –
Community and social services 3 602 3 922 – 3 922 1 900 –
Sport and recreation – – –
Public safety – – – – –
Housing – – – –
Health – – –
Economic and environmental services 4 254 7 008 – – – – – – 7 008 – –
Planning and development 3 467 6 221 – – – – – 6 221 – –
Road transport – – –
Environmental protection 787 787 – – – – – – 787 – –
Trading services – – – – – – – – – – –
Energy sources – –
Water management – –
Waste water management – –
Waste management – –
Other 24 24 – – – – – – 24 – –
Total Capital Expenditure - Functional 8 050 11 130 – – – – – – 11 130 1 900 –
Funded by:
National Government – –
Provincial Government – –
District Municipality – –
Other transfers and grants – –
Transfers recognised - capital – – – – – – – – – – –
Public contributions & donations – –
Borrowing – –
Internally generated funds 8 050 11 130 – – – – – 11 130 1 900 0
Total Capital Funding 8 050 11 130 – – – – – – 11 130 1 900 0
Description
Budget Year 2018/19
Page 8
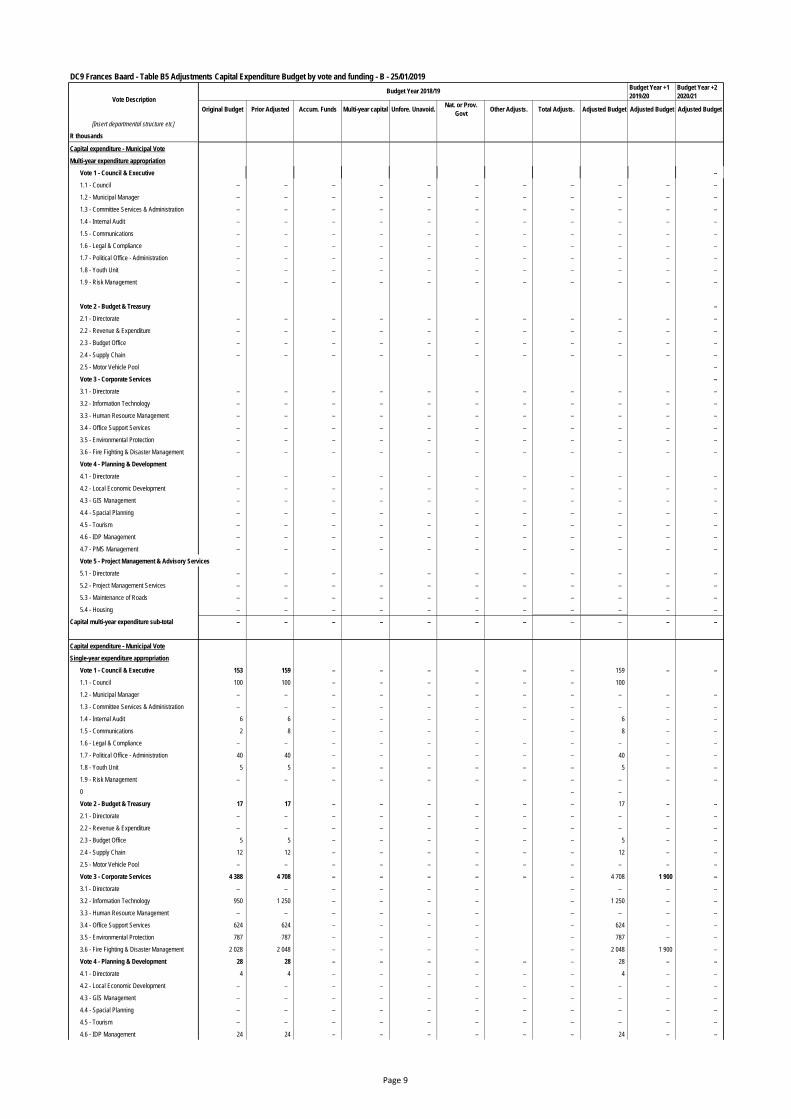
DC9 Frances Baard - Table B5 Adjustments Capital Expenditure Budget by vote and funding - B - 25/01/2019
Budget Year +1
2019/20
Budget Year +2
2020/21
Original Budget Prior Adjusted Accum. Funds Multi-year capital Unfore. Unavoid.Nat. or Prov.
GovtOther Adjusts. Total Adjusts. Adjusted Budget Adjusted Budget Adjusted Budget
[Insert departmental structure etc]
R thousands
Capital expenditure - Municipal Vote
Multi-year expenditure appropriation
Vote 1 - Council & Executive –
1.1 - Council – – – – – – – – – – –
1.2 - Municipal Manager – – – – – – – – – – –
1.3 - Committee Services & Administration – – – – – – – – – – –
1.4 - Internal Audit – – – – – – – – – – –
1.5 - Communications – – – – – – – – – – –
1.6 - Legal & Compliance – – – – – – – – – – –
1.7 - Political Office - Administration – – – – – – – – – – –
1.8 - Youth Unit – – – – – – – – – – –
1.9 - Risk Management – – – – – – – – – – –
Vote 2 - Budget & Treasury –
2.1 - Directorate – – – – – – – – – – –
2.2 - Revenue & Expenditure – – – – – – – – – – –
2.3 - Budget Office – – – – – – – – – – –
2.4 - Supply Chain – – – – – – – – – – –
2.5 - Motor Vehicle Pool –
Vote 3 - Corporate Services –
3.1 - Directorate – – – – – – – – – – –
3.2 - Information Technology – – – – – – – – – – –
3.3 - Human Resource Management – – – – – – – – – – –
3.4 - Office Support Services – – – – – – – – – – –
3.5 - Environmental Protection – – – – – – – – – – –
3.6 - Fire Fighting & Disaster Management – – – – – – – – – – –
Vote 4 - Planning & Development
4.1 - Directorate – – – – – – – – – – –
4.2 - Local Economic Development – – – – – – – – – – –
4.3 - GIS Management – – – – – – – – – – –
4.4 - Spacial Planning – – – – – – – – – – –
4.5 - Tourism – – – – – – – – – – –
4.6 - IDP Management – – – – – – – – – – –
4.7 - PMS Management – – – – – – – – – – –
Vote 5 - Project Management & Advisory Services
5.1 - Directorate – – – – – – – – – – –
5.2 - Project Management Services – – – – – – – – – – –
5.3 - Maintenance of Roads – – – – – – – – – – –
5.4 - Housing – – – – – – – – – – –
Capital multi-year expenditure sub-total – – – – – – – – – – –
Capital expenditure - Municipal Vote
Single-year expenditure appropriation
Vote 1 - Council & Executive 153 159 – – – – – – 159 – –
1.1 - Council 100 100 – – – – – – 100
1.2 - Municipal Manager – – – – – – – – – – –
1.3 - Committee Services & Administration – – – – – – – – – – –
1.4 - Internal Audit 6 6 – – – – – – 6 – –
1.5 - Communications 2 8 – – – – – 8 – –
1.6 - Legal & Compliance – – – – – – – – – – –
1.7 - Political Office - Administration 40 40 – – – – – – 40 – –
1.8 - Youth Unit 5 5 – – – – – – 5 – –
1.9 - Risk Management – – – – – – – – – – –
0 – –
Vote 2 - Budget & Treasury 17 17 – – – – – – 17 – –
2.1 - Directorate – – – – – – – – – – –
2.2 - Revenue & Expenditure – – – – – – – – – – –
2.3 - Budget Office 5 5 – – – – – – 5 – –
2.4 - Supply Chain 12 12 – – – – – – 12 – –
2.5 - Motor Vehicle Pool – – – – – – – – – – –
Vote 3 - Corporate Services 4 388 4 708 – – – – – – 4 708 1 900 –
3.1 - Directorate – – – – – – – – – –
3.2 - Information Technology 950 1 250 – – – – – 1 250 – –
3.3 - Human Resource Management – – – – – – – – – –
3.4 - Office Support Services 624 624 – – – – – 624 – –
3.5 - Environmental Protection 787 787 – – – – – 787 – –
3.6 - Fire Fighting & Disaster Management 2 028 2 048 – – – – – 2 048 1 900 –
Vote 4 - Planning & Development 28 28 – – – – – – 28 – –
4.1 - Directorate 4 4 – – – – – – 4 – –
4.2 - Local Economic Development – – – – – – – – – – –
4.3 - GIS Management – – – – – – – – – – –
4.4 - Spacial Planning – – – – – – – – – – –
4.5 - Tourism – – – – – – – – – – –
4.6 - IDP Management 24 24 – – – – – – 24 – –
Vote Description
Budget Year 2018/19
Page 9
DC9 Frances Baard - Table B5 Adjustments Capital Expenditure Budget by vote and funding - B - 25/01/2019
Budget Year +1
2019/20
Budget Year +2
2020/21
Original Budget Prior Adjusted Accum. Funds Multi-year capital Unfore. Unavoid.Nat. or Prov.
GovtOther Adjusts. Total Adjusts. Adjusted Budget Adjusted Budget Adjusted Budget
[Insert departmental structure etc]
R thousands
Vote Description
Budget Year 2018/19
4.7 - PMS Management – – – – – – – – – – –
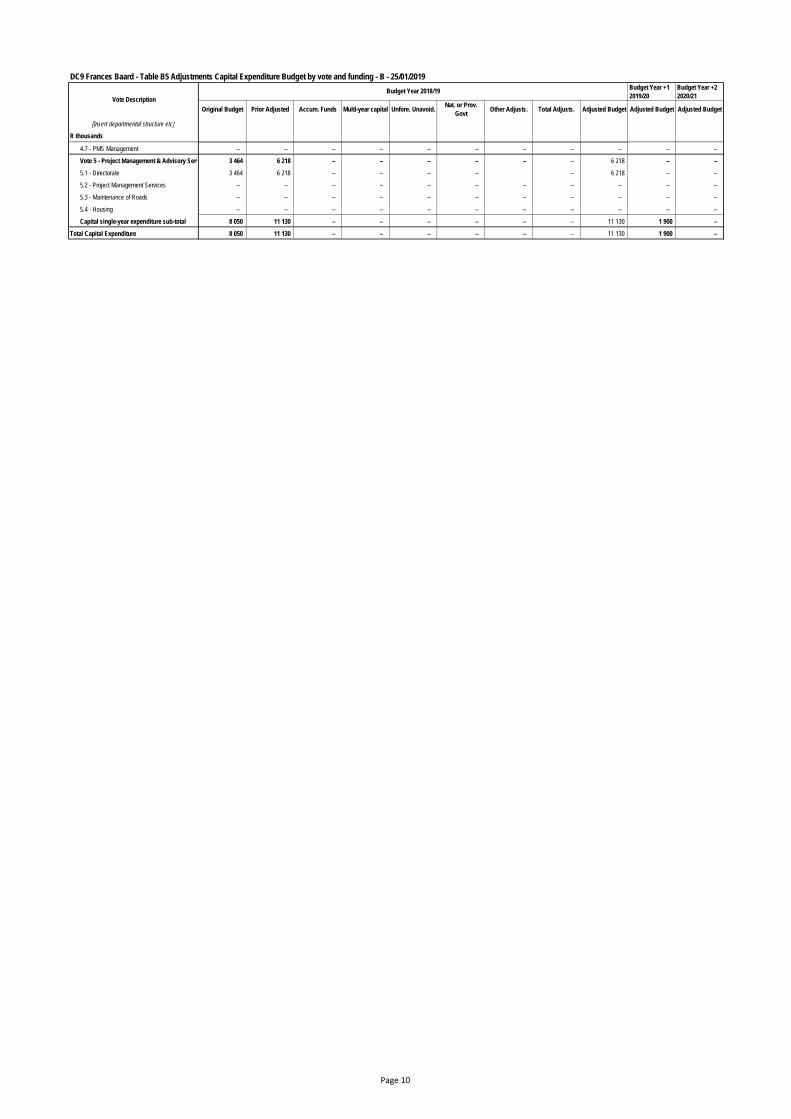
Vote 5 - Project Management & Advisory Services 3 464 6 218 – – – – – – 6 218 – –
5.1 - Directorate 3 464 6 218 – – – – – 6 218 – –
5.2 - Project Management Services – – – – – – – – – – –
5.3 - Maintenance of Roads – – – – – – – – – – –
5.4 - Housing – – – – – – – – – – –
Capital single-year expenditure sub-total 8 050 11 130 – – – – – – 11 130 1 900 –
Total Capital Expenditure 8 050 11 130 – – – – – – 11 130 1 900 –
Page 10
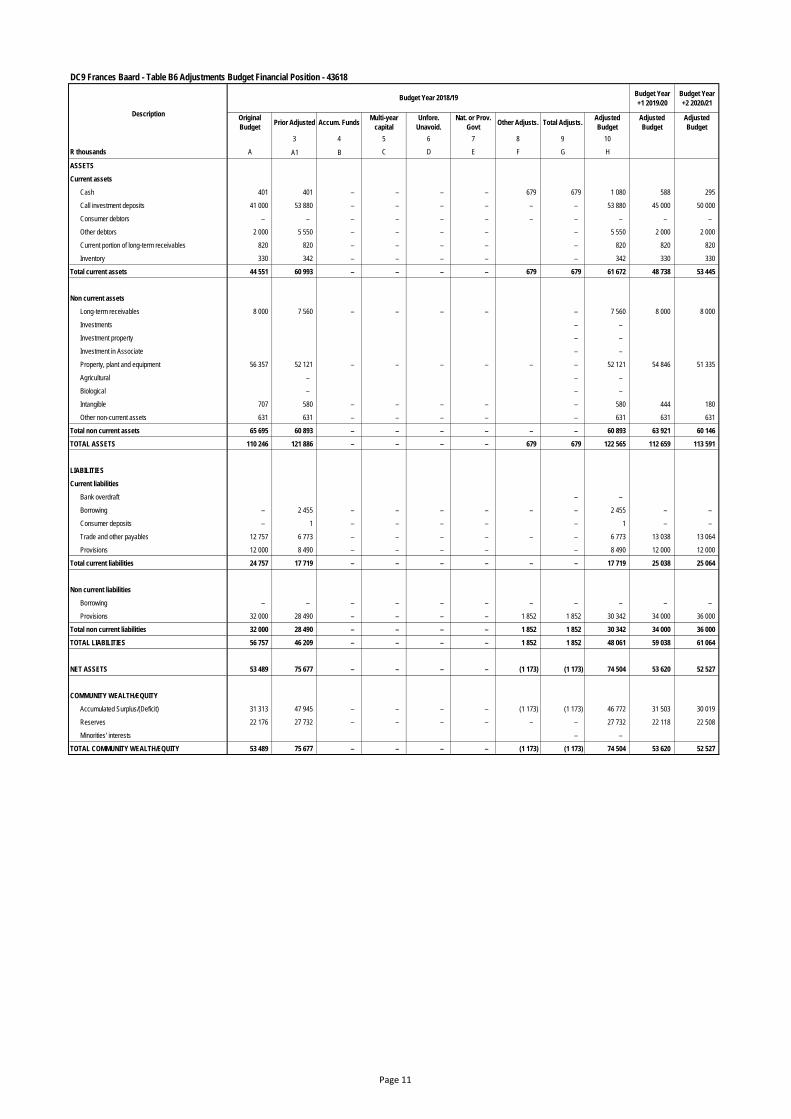
DC9 Frances Baard - Table B6 Adjustments Budget Financial Position - 43618
Budget Year
+1 2019/20
Budget Year
+2 2020/21
Original
BudgetPrior Adjusted Accum. Funds
Multi-year
capital
Unfore.
Unavoid.
Nat. or Prov.
GovtOther Adjusts. Total Adjusts.
Adjusted
Budget
Adjusted
Budget
Adjusted
Budget
3 4 5 6 7 8 9 10
R thousands A A1 B C D E F G H
ASSETS
Current assets
Cash 401 401 – – – – 679 679 1 080 588 295
Call investment deposits 41 000 53 880 – – – – – – 53 880 45 000 50 000
Consumer debtors – – – – – – – – – – –
Other debtors 2 000 5 550 – – – – – 5 550 2 000 2 000
Current portion of long-term receivables 820 820 – – – – – 820 820 820
Inventory 330 342 – – – – – 342 330 330
Total current assets 44 551 60 993 – – – – 679 679 61 672 48 738 53 445
Non current assets
Long-term receivables 8 000 7 560 – – – – – 7 560 8 000 8 000
Investments – –
Investment property – –
Investment in Associate – –
Property, plant and equipment 56 357 52 121 – – – – – – 52 121 54 846 51 335
Agricultural – – –
Biological – – –
Intangible 707 580 – – – – – 580 444 180
Other non-current assets 631 631 – – – – – 631 631 631
Total non current assets 65 695 60 893 – – – – – – 60 893 63 921 60 146
TOTAL ASSETS 110 246 121 886 – – – – 679 679 122 565 112 659 113 591
LIABILITIES
Current liabilities
Bank overdraft – –
Borrowing – 2 455 – – – – – – 2 455 – –
Consumer deposits – 1 – – – – – 1 – –
Trade and other payables 12 757 6 773 – – – – – – 6 773 13 038 13 064
Provisions 12 000 8 490 – – – – – 8 490 12 000 12 000
Total current liabilities 24 757 17 719 – – – – – – 17 719 25 038 25 064
Non current liabilities
Borrowing – – – – – – – – – – –
Provisions 32 000 28 490 – – – – 1 852 1 852 30 342 34 000 36 000
Total non current liabilities 32 000 28 490 – – – – 1 852 1 852 30 342 34 000 36 000
TOTAL LIABILITIES 56 757 46 209 – – – – 1 852 1 852 48 061 59 038 61 064
NET ASSETS 53 489 75 677 – – – – (1 173) (1 173) 74 504 53 620 52 527
COMMUNITY WEALTH/EQUITY
Accumulated Surplus/(Deficit) 31 313 47 945 – – – – (1 173) (1 173) 46 772 31 503 30 019
Reserves 22 176 27 732 – – – – – – 27 732 22 118 22 508
Minorities' interests – –
TOTAL COMMUNITY WEALTH/EQUITY 53 489 75 677 – – – – (1 173) (1 173) 74 504 53 620 52 527
Description
Budget Year 2018/19
Page 11
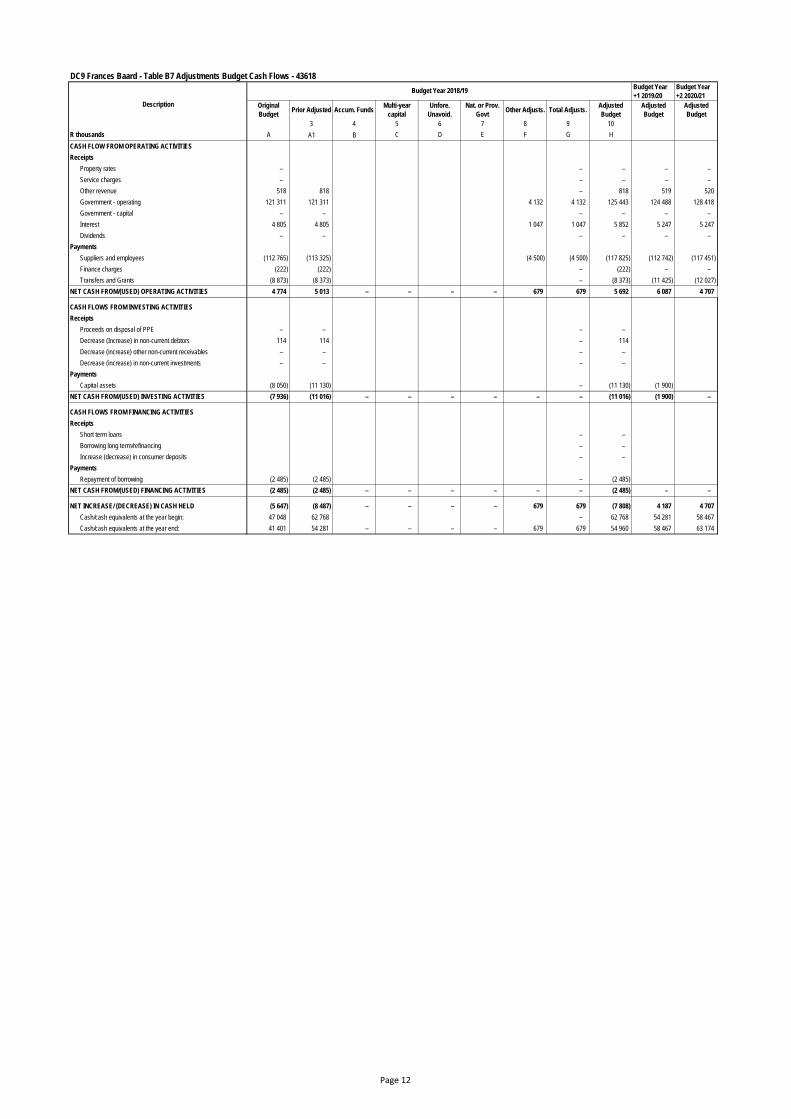
DC9 Frances Baard - Table B7 Adjustments Budget Cash Flows - 43618Budget Year
+1 2019/20
Budget Year
+2 2020/21
Original
BudgetPrior Adjusted Accum. Funds
Multi-year
capital
Unfore.
Unavoid.
Nat. or Prov.
GovtOther Adjusts. Total Adjusts.
Adjusted
Budget
Adjusted
Budget
Adjusted
Budget
3 4 5 6 7 8 9 10
R thousands A A1 B C D E F G H
CASH FLOW FROM OPERATING ACTIVITIES
Receipts
Property rates – – – – –
Service charges – – – – –
Other revenue 518 818 – 818 519 520
Government - operating 121 311 121 311 4 132 4 132 125 443 124 488 128 418
Government - capital – – – – – –
Interest 4 805 4 805 1 047 1 047 5 852 5 247 5 247
Dividends – – – – – –
Payments
Suppliers and employees (112 765) (113 325) (4 500) (4 500) (117 825) (112 742) (117 451)
Finance charges (222) (222) – (222) – –
Transfers and Grants (8 873) (8 373) – (8 373) (11 425) (12 027)
NET CASH FROM/(USED) OPERATING ACTIVITIES 4 774 5 013 – – – – 679 679 5 692 6 087 4 707
CASH FLOWS FROM INVESTING ACTIVITIES
Receipts
Proceeds on disposal of PPE – – – –
Decrease (Increase) in non-current debtors 114 114 – 114
Decrease (increase) other non-current receivables – – – –
Decrease (increase) in non-current investments – – – –
Payments
Capital assets (8 050) (11 130) – (11 130) (1 900)
NET CASH FROM/(USED) INVESTING ACTIVITIES (7 936) (11 016) – – – – – – (11 016) (1 900) –
CASH FLOWS FROM FINANCING ACTIVITIES
Receipts
Short term loans – –
Borrowing long term/refinancing – –
Increase (decrease) in consumer deposits – –
Payments
Repayment of borrowing (2 485) (2 485) – (2 485)
NET CASH FROM/(USED) FINANCING ACTIVITIES (2 485) (2 485) – – – – – – (2 485) – –
NET INCREASE/ (DECREASE) IN CASH HELD (5 647) (8 487) – – – – 679 679 (7 808) 4 187 4 707
Cash/cash equivalents at the year begin: 47 048 62 768 – 62 768 54 281 58 467
Cash/cash equivalents at the year end: 41 401 54 281 – – – – 679 679 54 960 58 467 63 174
Description
Budget Year 2018/19
Page 12
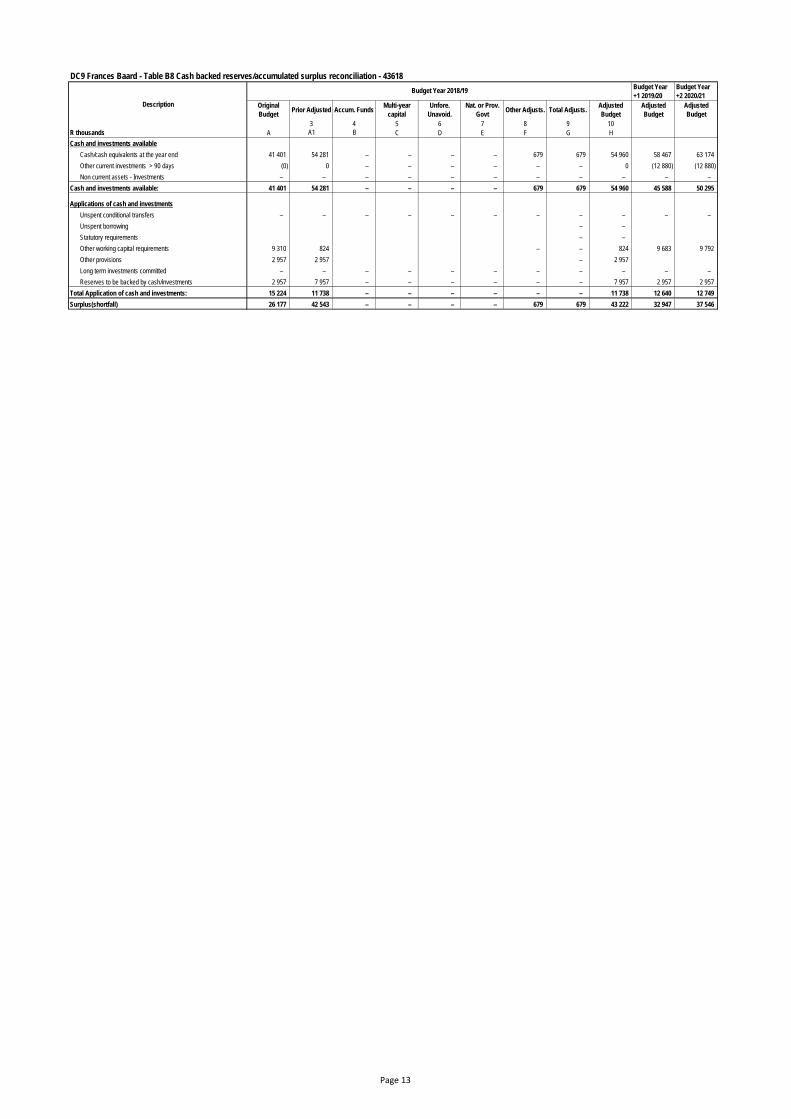
DC9 Frances Baard - Table B8 Cash backed reserves/accumulated surplus reconciliation - 43618Budget Year
+1 2019/20
Budget Year
+2 2020/21
Original
BudgetPrior Adjusted Accum. Funds
Multi-year
capital
Unfore.
Unavoid.
Nat. or Prov.
GovtOther Adjusts. Total Adjusts.
Adjusted
Budget
Adjusted
Budget
Adjusted
Budget
3 4 5 6 7 8 9 10
R thousands A A1 B C D E F G H
Cash and investments available
Cash/cash equivalents at the year end 41 401 54 281 – – – – 679 679 54 960 58 467 63 174
Other current investments > 90 days (0) 0 – – – – – – 0 (12 880) (12 880)
Non current assets - Investments – – – – – – – – – – –
Cash and investments available: 41 401 54 281 – – – – 679 679 54 960 45 588 50 295
Applications of cash and investments
Unspent conditional transfers – – – – – – – – – – –
Unspent borrowing – –
Statutory requirements – –
Other working capital requirements 9 310 824 – – 824 9 683 9 792
Other provisions 2 957 2 957 – 2 957
Long term investments committed – – – – – – – – – – –
Reserves to be backed by cash/investments 2 957 7 957 – – – – – – 7 957 2 957 2 957
Total Application of cash and investments: 15 224 11 738 – – – – – – 11 738 12 640 12 749
Surplus(shortfall) 26 177 42 543 – – – – 679 679 43 222 32 947 37 546
Description
Budget Year 2018/19
Page 13
DC9 Frances Baard - Table B9 Asset Management - 43618Budget Year
+1 2019/20
Budget Year
+2 2020/21
Original
BudgetPrior Adjusted Accum. Funds
Multi-year
capital
Unfore.
Unavoid.
Nat. or Prov.
GovtOther Adjusts. Total Adjusts.
Adjusted
Budget
Adjusted
Budget
Adjusted
Budget
R thousands
CAPITAL EXPENDITURE
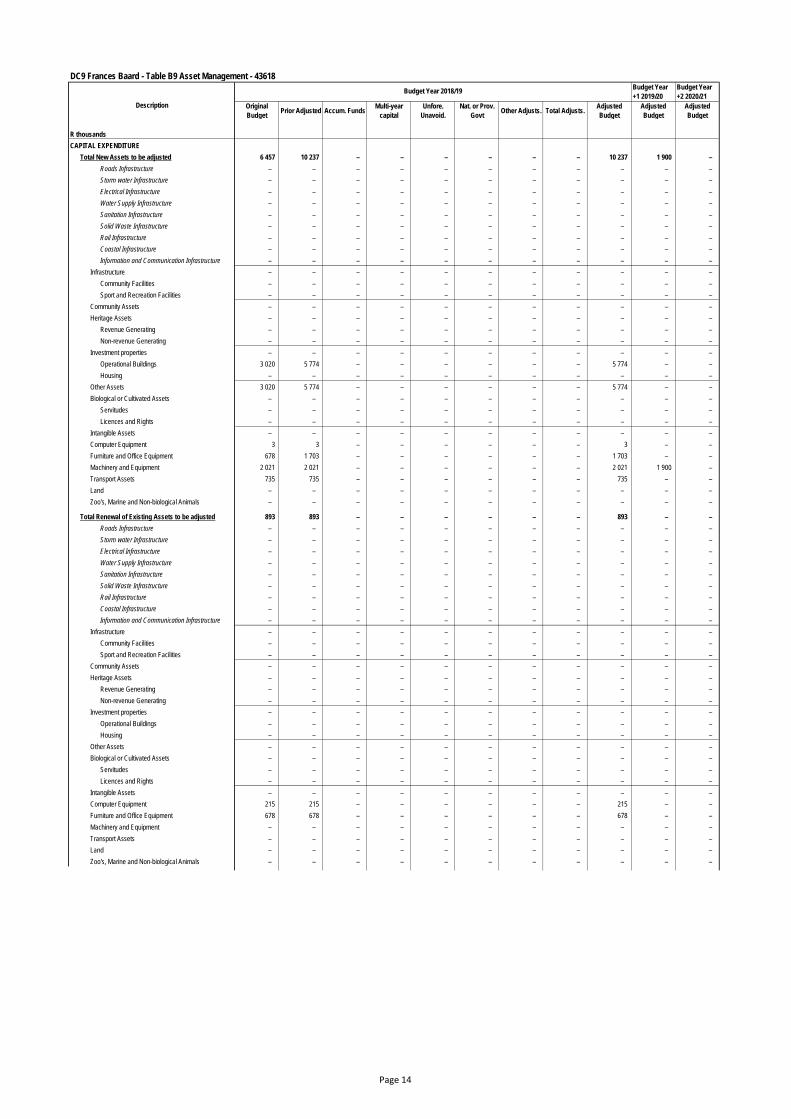
Total New Assets to be adjusted 6 457 10 237 – – – – – – 10 237 1 900 –
Roads Infrastructure – – – – – – – – – – –
Storm water Infrastructure – – – – – – – – – – –
Electrical Infrastructure – – – – – – – – – – –
Water Supply Infrastructure – – – – – – – – – – –
Sanitation Infrastructure – – – – – – – – – – –
Solid Waste Infrastructure – – – – – – – – – – –
Rail Infrastructure – – – – – – – – – – –
Coastal Infrastructure – – – – – – – – – – –
Information and Communication Infrastructure – – – – – – – – – – –
Infrastructure – – – – – – – – – – –
Community Facilities – – – – – – – – – – –
Sport and Recreation Facilities – – – – – – – – – – –
Community Assets – – – – – – – – – – –
Heritage Assets – – – – – – – – – – –
Revenue Generating – – – – – – – – – – –
Non-revenue Generating – – – – – – – – – – –
Investment properties – – – – – – – – – – –
Operational Buildings 3 020 5 774 – – – – – – 5 774 – –
Housing – – – – – – – – – – –
Other Assets 3 020 5 774 – – – – – – 5 774 – –
Biological or Cultivated Assets – – – – – – – – – – –
Servitudes – – – – – – – – – – –
Licences and Rights – – – – – – – – – – –
Intangible Assets – – – – – – – – – – –
Computer Equipment 3 3 – – – – – – 3 – –
Furniture and Office Equipment 678 1 703 – – – – – – 1 703 – –
Machinery and Equipment 2 021 2 021 – – – – – – 2 021 1 900 –
Transport Assets 735 735 – – – – – – 735 – –
Land – – – – – – – – – – –
Zoo's, Marine and Non-biological Animals – – – – – – – – – – –
Total Renewal of Existing Assets to be adjusted 893 893 – – – – – – 893 – –
Roads Infrastructure – – – – – – – – – – –
Storm water Infrastructure – – – – – – – – – – –
Electrical Infrastructure – – – – – – – – – – –
Water Supply Infrastructure – – – – – – – – – – –
Sanitation Infrastructure – – – – – – – – – – –
Solid Waste Infrastructure – – – – – – – – – – –
Rail Infrastructure – – – – – – – – – – –
Coastal Infrastructure – – – – – – – – – – –
Information and Communication Infrastructure – – – – – – – – – – –
Infrastructure – – – – – – – – – – –
Community Facilities – – – – – – – – – – –
Sport and Recreation Facilities – – – – – – – – – – –
Community Assets – – – – – – – – – – –
Heritage Assets – – – – – – – – – – –
Revenue Generating – – – – – – – – – – –
Non-revenue Generating – – – – – – – – – – –
Investment properties – – – – – – – – – – –
Operational Buildings – – – – – – – – – – –
Housing – – – – – – – – – – –
Other Assets – – – – – – – – – – –
Biological or Cultivated Assets – – – – – – – – – – –
Servitudes – – – – – – – – – – –
Licences and Rights – – – – – – – – – – –
Intangible Assets – – – – – – – – – – –
Computer Equipment 215 215 – – – – – – 215 – –
Furniture and Office Equipment 678 678 – – – – – – 678 – –
Machinery and Equipment – – – – – – – – – – –
Transport Assets – – – – – – – – – – –
Land – – – – – – – – – – –
Zoo's, Marine and Non-biological Animals – – – – – – – – – – –
Description
Budget Year 2018/19
Page 14
DC9 Frances Baard - Table B9 Asset Management - 43618Budget Year
+1 2019/20
Budget Year
+2 2020/21
Original
BudgetPrior Adjusted Accum. Funds
Multi-year
capital
Unfore.
Unavoid.
Nat. or Prov.
GovtOther Adjusts. Total Adjusts.
Adjusted
Budget
Adjusted
Budget
Adjusted
Budget
R thousands
Description
Budget Year 2018/19
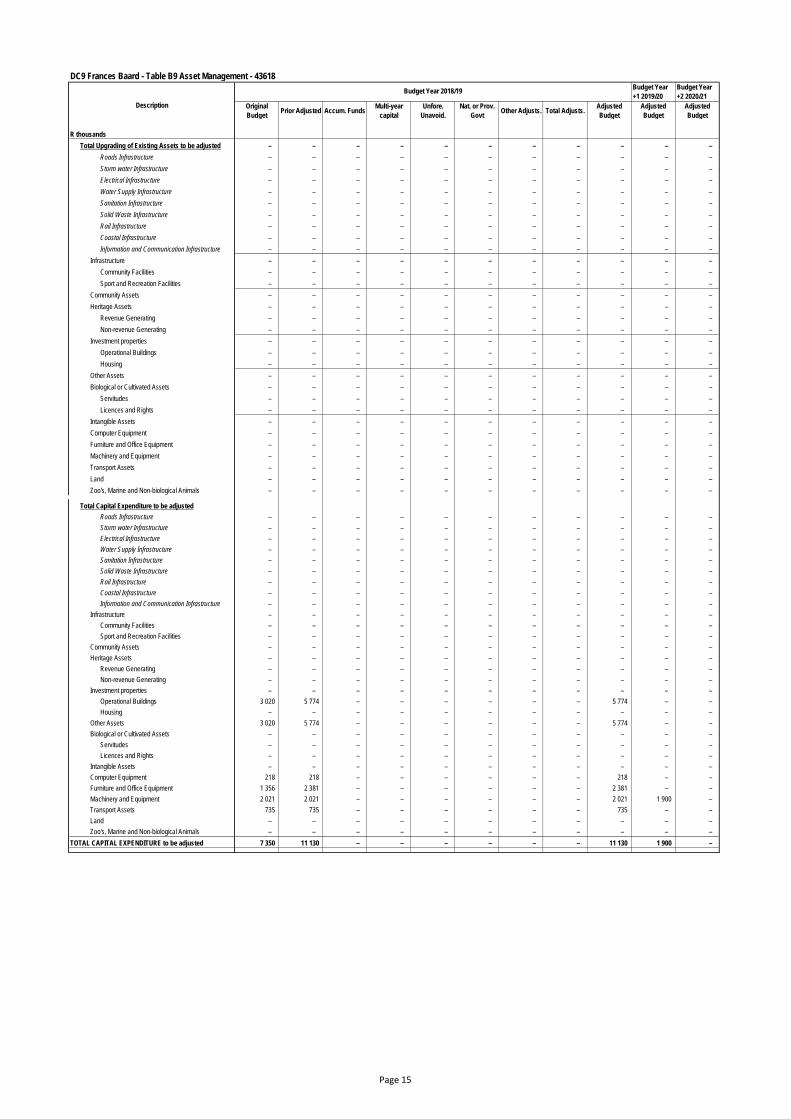
Total Upgrading of Existing Assets to be adjusted – – – – – – – – – – –
Roads Infrastructure – – – – – – – – – – –
Storm water Infrastructure – – – – – – – – – – –
Electrical Infrastructure – – – – – – – – – – –
Water Supply Infrastructure – – – – – – – – – – –
Sanitation Infrastructure – – – – – – – – – – –
Solid Waste Infrastructure – – – – – – – – – – –
Rail Infrastructure – – – – – – – – – – –
Coastal Infrastructure – – – – – – – – – – –
Information and Communication Infrastructure – – – – – – – – – – –
Infrastructure – – – – – – – – – – –
Community Facilities – – – – – – – – – – –
Sport and Recreation Facilities – – – – – – – – – – –
Community Assets – – – – – – – – – – –
Heritage Assets – – – – – – – – – – –
Revenue Generating – – – – – – – – – – –
Non-revenue Generating – – – – – – – – – – –
Investment properties – – – – – – – – – – –
Operational Buildings – – – – – – – – – – –
Housing – – – – – – – – – – –
Other Assets – – – – – – – – – – –
Biological or Cultivated Assets – – – – – – – – – – –
Servitudes – – – – – – – – – – –
Licences and Rights – – – – – – – – – – –
Intangible Assets – – – – – – – – – – –
Computer Equipment – – – – – – – – – – –
Furniture and Office Equipment – – – – – – – – – – –
Machinery and Equipment – – – – – – – – – – –
Transport Assets – – – – – – – – – – –
Land – – – – – – – – – – –
Zoo's, Marine and Non-biological Animals – – – – – – – – – – –
Total Capital Expenditure to be adjusted
Roads Infrastructure – – – – – – – – – – –
Storm water Infrastructure – – – – – – – – – – –
Electrical Infrastructure – – – – – – – – – – –
Water Supply Infrastructure – – – – – – – – – – –
Sanitation Infrastructure – – – – – – – – – – –
Solid Waste Infrastructure – – – – – – – – – – –
Rail Infrastructure – – – – – – – – – – –
Coastal Infrastructure – – – – – – – – – – –
Information and Communication Infrastructure – – – – – – – – – – –
Infrastructure – – – – – – – – – – –
Community Facilities – – – – – – – – – – –
Sport and Recreation Facilities – – – – – – – – – – –
Community Assets – – – – – – – – – – –
Heritage Assets – – – – – – – – – – –
Revenue Generating – – – – – – – – – – –
Non-revenue Generating – – – – – – – – – – –
Investment properties – – – – – – – – – – –
Operational Buildings 3 020 5 774 – – – – – – 5 774 – –
Housing – – – – – – – – – – –
Other Assets 3 020 5 774 – – – – – – 5 774 – –
Biological or Cultivated Assets – – – – – – – – – – –
Servitudes – – – – – – – – – – –
Licences and Rights – – – – – – – – – – –
Intangible Assets – – – – – – – – – – –
Computer Equipment 218 218 – – – – – – 218 – –
Furniture and Office Equipment 1 356 2 381 – – – – – – 2 381 – –
Machinery and Equipment 2 021 2 021 – – – – – – 2 021 1 900 –
Transport Assets 735 735 – – – – – – 735 – –
Land – – – – – – – – – – –
Zoo's, Marine and Non-biological Animals – – – – – – – – – – –
TOTAL CAPITAL EXPENDITURE to be adjusted 7 350 11 130 – – – – – – 11 130 1 900 –
Page 15
DC9 Frances Baard - Table B9 Asset Management - 43618Budget Year
+1 2019/20
Budget Year
+2 2020/21
Original
BudgetPrior Adjusted Accum. Funds
Multi-year
capital
Unfore.
Unavoid.
Nat. or Prov.
GovtOther Adjusts. Total Adjusts.
Adjusted
Budget
Adjusted
Budget
Adjusted
Budget
R thousands
Description
Budget Year 2018/19
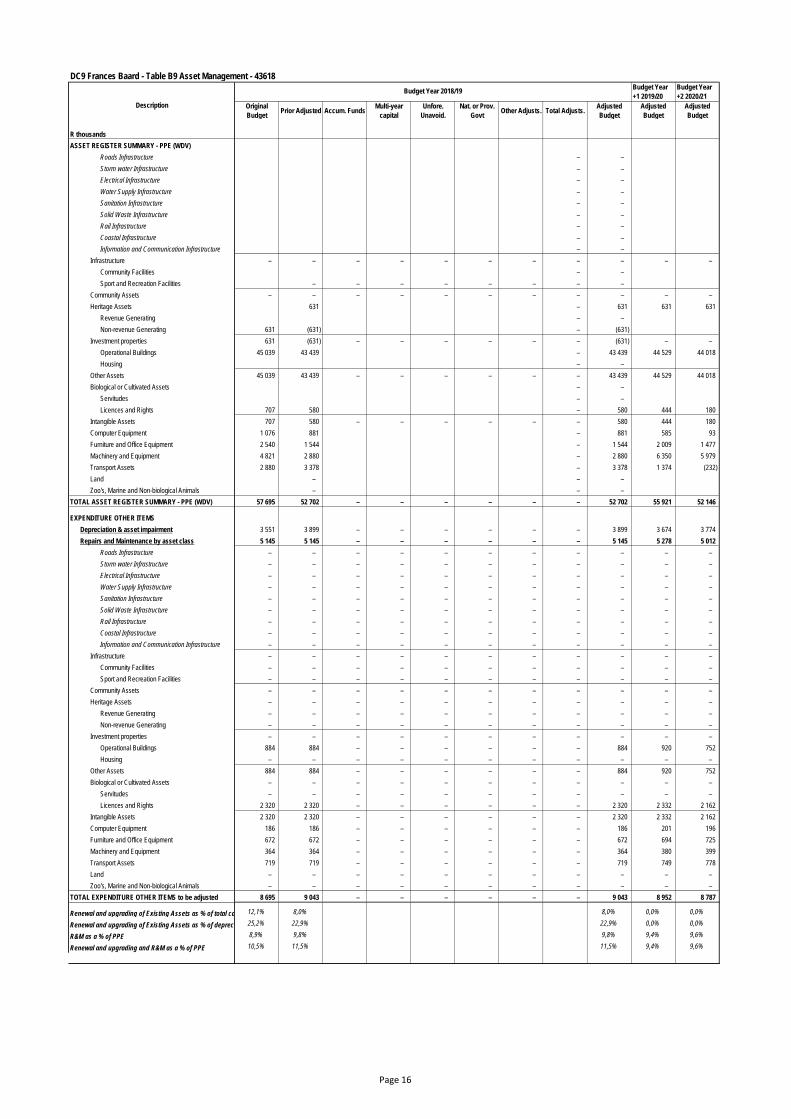
ASSET REGISTER SUMMARY - PPE (WDV)
Roads Infrastructure – –
Storm water Infrastructure – –
Electrical Infrastructure – –
Water Supply Infrastructure – –
Sanitation Infrastructure – –
Solid Waste Infrastructure – –
Rail Infrastructure – –
Coastal Infrastructure – –
Information and Communication Infrastructure – –
Infrastructure – – – – – – – – – – –
Community Facilities – –
Sport and Recreation Facilities – – – – – – – –
Community Assets – – – – – – – – – – –
Heritage Assets 631 – 631 631 631
Revenue Generating – –
Non-revenue Generating 631 (631) – (631)
Investment properties 631 (631) – – – – – – (631) – –
Operational Buildings 45 039 43 439 – 43 439 44 529 44 018
Housing – –
Other Assets 45 039 43 439 – – – – – – 43 439 44 529 44 018
Biological or Cultivated Assets – –
Servitudes – –
Licences and Rights 707 580 – 580 444 180
Intangible Assets 707 580 – – – – – – 580 444 180
Computer Equipment 1 076 881 – 881 585 93
Furniture and Office Equipment 2 540 1 544 – 1 544 2 009 1 477
Machinery and Equipment 4 821 2 880 – 2 880 6 350 5 979
Transport Assets 2 880 3 378 – 3 378 1 374 (232)
Land – – –
Zoo's, Marine and Non-biological Animals – – –
TOTAL ASSET REGISTER SUMMARY - PPE (WDV) 57 695 52 702 – – – – – – 52 702 55 921 52 146
EXPENDITURE OTHER ITEMS
Depreciation & asset impairment 3 551 3 899 – – – – – – 3 899 3 674 3 774
Repairs and Maintenance by asset class 5 145 5 145 – – – – – – 5 145 5 278 5 012
Roads Infrastructure – – – – – – – – – – –
Storm water Infrastructure – – – – – – – – – – –
Electrical Infrastructure – – – – – – – – – – –
Water Supply Infrastructure – – – – – – – – – – –
Sanitation Infrastructure – – – – – – – – – – –
Solid Waste Infrastructure – – – – – – – – – – –
Rail Infrastructure – – – – – – – – – – –
Coastal Infrastructure – – – – – – – – – – –
Information and Communication Infrastructure – – – – – – – – – – –
Infrastructure – – – – – – – – – – –
Community Facilities – – – – – – – – – – –
Sport and Recreation Facilities – – – – – – – – – – –
Community Assets – – – – – – – – – – –
Heritage Assets – – – – – – – – – – –
Revenue Generating – – – – – – – – – – –
Non-revenue Generating – – – – – – – – – – –
Investment properties – – – – – – – – – – –
Operational Buildings 884 884 – – – – – – 884 920 752
Housing – – – – – – – – – – –
Other Assets 884 884 – – – – – – 884 920 752
Biological or Cultivated Assets – – – – – – – – – – –
Servitudes – – – – – – – – – – –
Licences and Rights 2 320 2 320 – – – – – – 2 320 2 332 2 162
Intangible Assets 2 320 2 320 – – – – – – 2 320 2 332 2 162
Computer Equipment 186 186 – – – – – – 186 201 196
Furniture and Office Equipment 672 672 – – – – – – 672 694 725
Machinery and Equipment 364 364 – – – – – – 364 380 399
Transport Assets 719 719 – – – – – – 719 749 778
Land – – – – – – – – – – –
Zoo's, Marine and Non-biological Animals – – – – – – – – – – –
TOTAL EXPENDITURE OTHER ITEMS to be adjusted 8 695 9 043 – – – – – – 9 043 8 952 8 787
Renewal and upgrading of Existing Assets as % of total capex 12,1% 8,0% 8,0% 0,0% 0,0%
Renewal and upgrading of Existing Assets as % of deprecn" 25,2% 22,9% 22,9% 0,0% 0,0%
R&M as a % of PPE 8,9% 9,8% 9,8% 9,4% 9,6%
Renewal and upgrading and R&M as a % of PPE 10,5% 11,5% 11,5% 9,4% 9,6%
Page 16
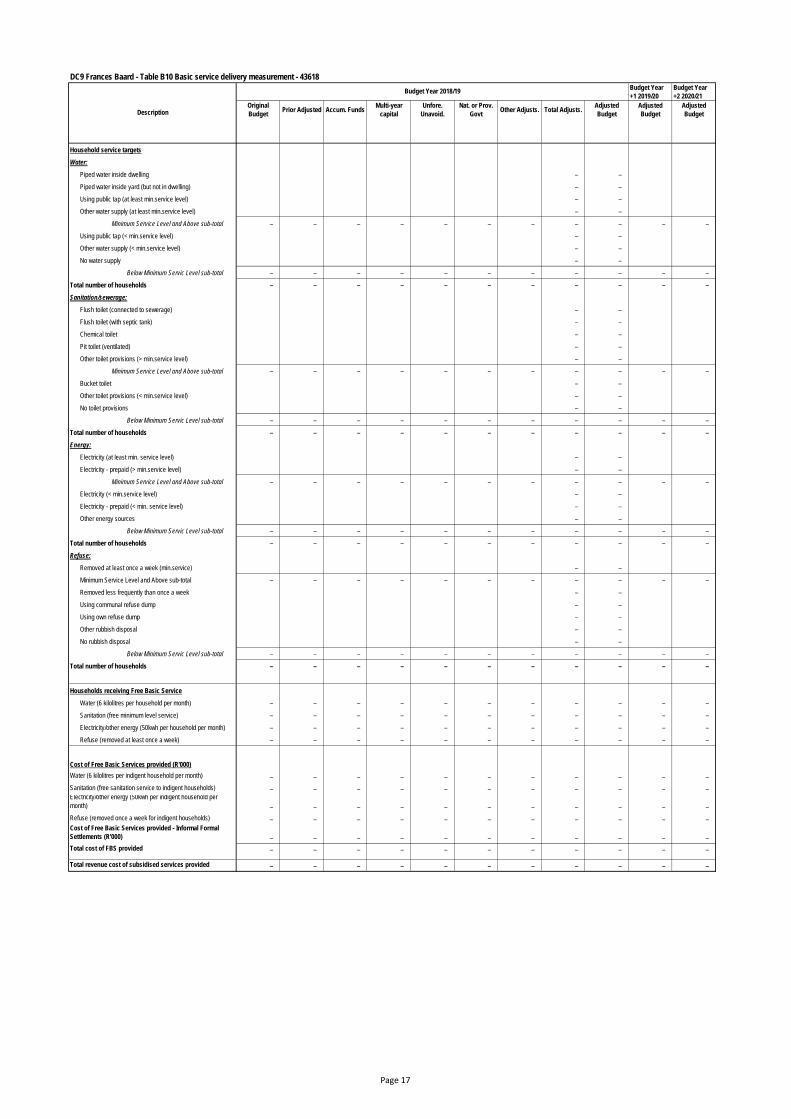
DC9 Frances Baard - Table B10 Basic service delivery measurement - 43618
Budget Year
+1 2019/20
Budget Year
+2 2020/21
Original
BudgetPrior Adjusted Accum. Funds
Multi-year
capital
Unfore.
Unavoid.
Nat. or Prov.
GovtOther Adjusts. Total Adjusts.
Adjusted
Budget
Adjusted
Budget
Adjusted
Budget
Household service targets
Water:
Piped water inside dwelling – –
Piped water inside yard (but not in dwelling) – –
Using public tap (at least min.service level) – –
Other water supply (at least min.service level) – –
Minimum Service Level and Above sub-total – – – – – – – – – – –
Using public tap (< min.service level) – –
Other water supply (< min.service level) – –
No water supply – –
Below Minimum Servic Level sub-total – – – – – – – – – – –
Total number of households – – – – – – – – – – –
Sanitation/sewerage:
Flush toilet (connected to sewerage) – –
Flush toilet (with septic tank) – –
Chemical toilet – –
Pit toilet (ventilated) – –
Other toilet provisions (> min.service level) – –
Minimum Service Level and Above sub-total – – – – – – – – – – –
Bucket toilet – –
Other toilet provisions (< min.service level) – –
No toilet provisions – –
Below Minimum Servic Level sub-total – – – – – – – – – – –
Total number of households – – – – – – – – – – –
Energy:
Electricity (at least min. service level) – –
Electricity - prepaid (> min.service level) – –
Minimum Service Level and Above sub-total – – – – – – – – – – –
Electricity (< min.service level) – –
Electricity - prepaid (< min. service level) – –
Other energy sources – –
Below Minimum Servic Level sub-total – – – – – – – – – – –
Total number of households – – – – – – – – – – –
Refuse:
Removed at least once a week (min.service) – –
Minimum Service Level and Above sub-total – – – – – – – – – – –
Removed less frequently than once a week – –
Using communal refuse dump – –
Using own refuse dump – –
Other rubbish disposal – –
No rubbish disposal – –
Below Minimum Servic Level sub-total – – – – – – – – – – –
Total number of households – – – – – – – – – – –
Households receiving Free Basic Service
Water (6 kilolitres per household per month) – – – – – – – – – – –
Sanitation (free minimum level service) – – – – – – – – – – –
Electricity/other energy (50kwh per household per month) – – – – – – – – – – –
Refuse (removed at least once a week) – – – – – – – – – – –
Cost of Free Basic Services provided (R'000)
Water (6 kilolitres per indigent household per month) – – – – – – – – – – –
Sanitation (free sanitation service to indigent households) – – – – – – – – – – – Electricity/other energy (50kwh per indigent household per
month) – – – – – – – – – – –
Refuse (removed once a week for indigent households) – – – – – – – – – – –
Cost of Free Basic Services provided - Informal Formal
Settlements (R'000) – – – – – – – – – – –
Total cost of FBS provided – – – – – – – – – – –
Total revenue cost of subsidised services provided – – – – – – – – – – –
Description
Budget Year 2018/19
Page 17
ADJUSTMENT BUDGET SUPPORTING DOCUMENTATION
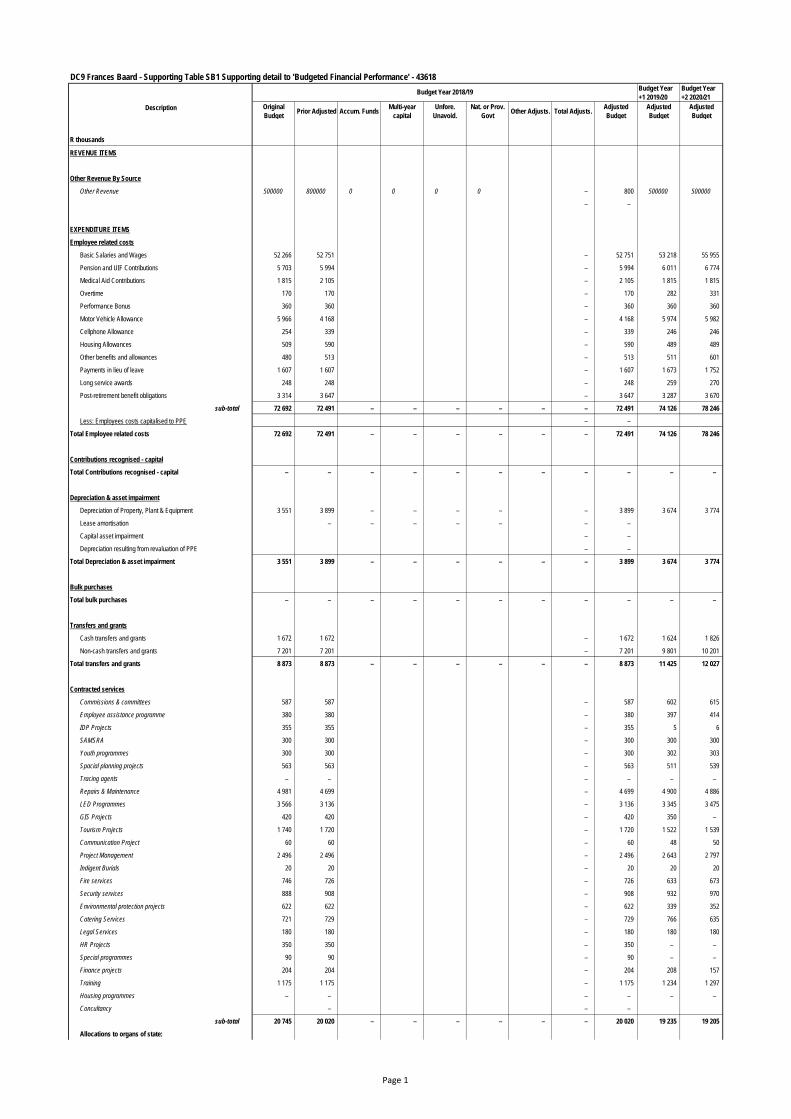
DC9 Frances Baard - Supporting Table SB1 Supporting detail to 'Budgeted Financial Performance' - 43618
Budget Year
+1 2019/20
Budget Year
+2 2020/21
Original
BudgetPrior Adjusted Accum. Funds
Multi-year
capital
Unfore.
Unavoid.
Nat. or Prov.
GovtOther Adjusts. Total Adjusts.
Adjusted
Budget
Adjusted
Budget
Adjusted
Budget
R thousands
REVENUE ITEMS
Other Revenue By Source
Other Revenue 500000 800000 0 0 0 0 – 800 500000 500000
– –
EXPENDITURE ITEMS
Employee related costs
Basic Salaries and Wages 52 266 52 751 – 52 751 53 218 55 955
Pension and UIF Contributions 5 703 5 994 – 5 994 6 011 6 774
Medical Aid Contributions 1 815 2 105 – 2 105 1 815 1 815
Overtime 170 170 – 170 282 331
Performance Bonus 360 360 – 360 360 360
Motor Vehicle Allowance 5 966 4 168 – 4 168 5 974 5 982
Cellphone Allowance 254 339 – 339 246 246
Housing Allowances 509 590 – 590 489 489
Other benefits and allowances 480 513 – 513 511 601
Payments in lieu of leave 1 607 1 607 – 1 607 1 673 1 752
Long service awards 248 248 – 248 259 270
Post-retirement benefit obligations 3 314 3 647 – 3 647 3 287 3 670
sub-total 72 692 72 491 – – – – – – 72 491 74 126 78 246
Less: Employees costs capitalised to PPE – –
Total Employee related costs 72 692 72 491 – – – – – – 72 491 74 126 78 246
Contributions recognised - capital
Total Contributions recognised - capital – – – – – – – – – – –
Depreciation & asset impairment
Depreciation of Property, Plant & Equipment 3 551 3 899 – – – – – 3 899 3 674 3 774
Lease amortisation – – – – – – –
Capital asset impairment – –
Depreciation resulting from revaluation of PPE – –
Total Depreciation & asset impairment 3 551 3 899 – – – – – – 3 899 3 674 3 774
Bulk purchases
Total bulk purchases – – – – – – – – – – –
Transfers and grants
Cash transfers and grants 1 672 1 672 – 1 672 1 624 1 826
Non-cash transfers and grants 7 201 7 201 – 7 201 9 801 10 201
Total transfers and grants 8 873 8 873 – – – – – – 8 873 11 425 12 027
Contracted services
Commissions & committees 587 587 – 587 602 615
Employee assistance programme 380 380 – 380 397 414
IDP Projects 355 355 – 355 5 6
SAMSRA 300 300 – 300 300 300
Youth programmes 300 300 – 300 302 303
Spacial planning projects 563 563 – 563 511 539
Tracing agents – – – – – –
Repairs & Maintenance 4 981 4 699 – 4 699 4 900 4 886
LED Programmes 3 566 3 136 – 3 136 3 345 3 475
GIS Projects 420 420 – 420 350 –
Tourism Projects 1 740 1 720 – 1 720 1 522 1 539
Communication Project 60 60 – 60 48 50
Project Management 2 496 2 496 – 2 496 2 643 2 797
Indigent Burials 20 20 – 20 20 20
Fire services 746 726 – 726 633 673
Security services 888 908 – 908 932 970
Environmental protection projects 622 622 – 622 339 352
Catering Services 721 729 – 729 766 635
Legal Services 180 180 – 180 180 180
HR Projects 350 350 – 350 – –
Special programmes 90 90 – 90 – –
Finance projects 204 204 – 204 208 157
Training 1 175 1 175 – 1 175 1 234 1 297
Housing programmes – – – – – –
Concultancy – – –
sub-total 20 745 20 020 – – – – – – 20 020 19 235 19 205
Allocations to organs of state:
Description
Budget Year 2018/19
Page 1
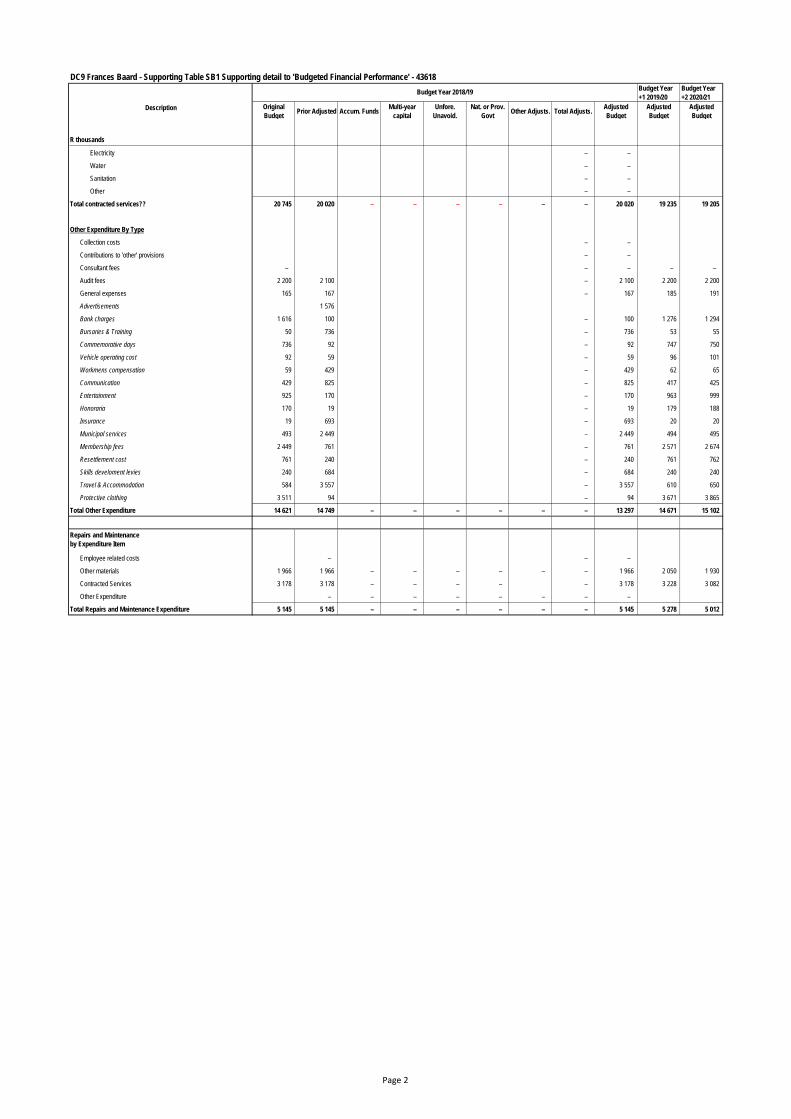
DC9 Frances Baard - Supporting Table SB1 Supporting detail to 'Budgeted Financial Performance' - 43618
Budget Year
+1 2019/20
Budget Year
+2 2020/21
Original
BudgetPrior Adjusted Accum. Funds
Multi-year
capital
Unfore.
Unavoid.
Nat. or Prov.
GovtOther Adjusts. Total Adjusts.
Adjusted
Budget
Adjusted
Budget
Adjusted
Budget
R thousands
Description
Budget Year 2018/19
Electricity – –
Water – –
Sanitation – –
Other – –
Total contracted services?? 20 745 20 020 – – – – – – 20 020 19 235 19 205
Other Expenditure By Type
Collection costs – –
Contributions to 'other' provisions – –
Consultant fees – – – – –
Audit fees 2 200 2 100 – 2 100 2 200 2 200
General expenses 165 167 – 167 185 191
Advertisements 1 576
Bank charges 1 616 100 – 100 1 276 1 294
Bursaries & Training 50 736 – 736 53 55
Commemorative days 736 92 – 92 747 750
Vehicle operating cost 92 59 – 59 96 101
Workmens compensation 59 429 – 429 62 65
Communication 429 825 – 825 417 425
Entertainment 925 170 – 170 963 999
Honoraria 170 19 – 19 179 188
Insurance 19 693 – 693 20 20
Municipal services 493 2 449 – 2 449 494 495
Membership fees 2 449 761 – 761 2 571 2 674
Resettlement cost 761 240 – 240 761 762
Skills develoment levies 240 684 – 684 240 240
Travel & Accommodation 584 3 557 – 3 557 610 650
Protective clothing 3 511 94 – 94 3 671 3 865
Total Other Expenditure 14 621 14 749 – – – – – – 13 297 14 671 15 102
Repairs and Maintenance
by Expenditure Item
Employee related costs – – –
Other materials 1 966 1 966 – – – – – – 1 966 2 050 1 930
Contracted Services 3 178 3 178 – – – – – 3 178 3 228 3 082
Other Expenditure – – – – – – – –
Total Repairs and Maintenance Expenditure 5 145 5 145 – – – – – – 5 145 5 278 5 012
Page 2
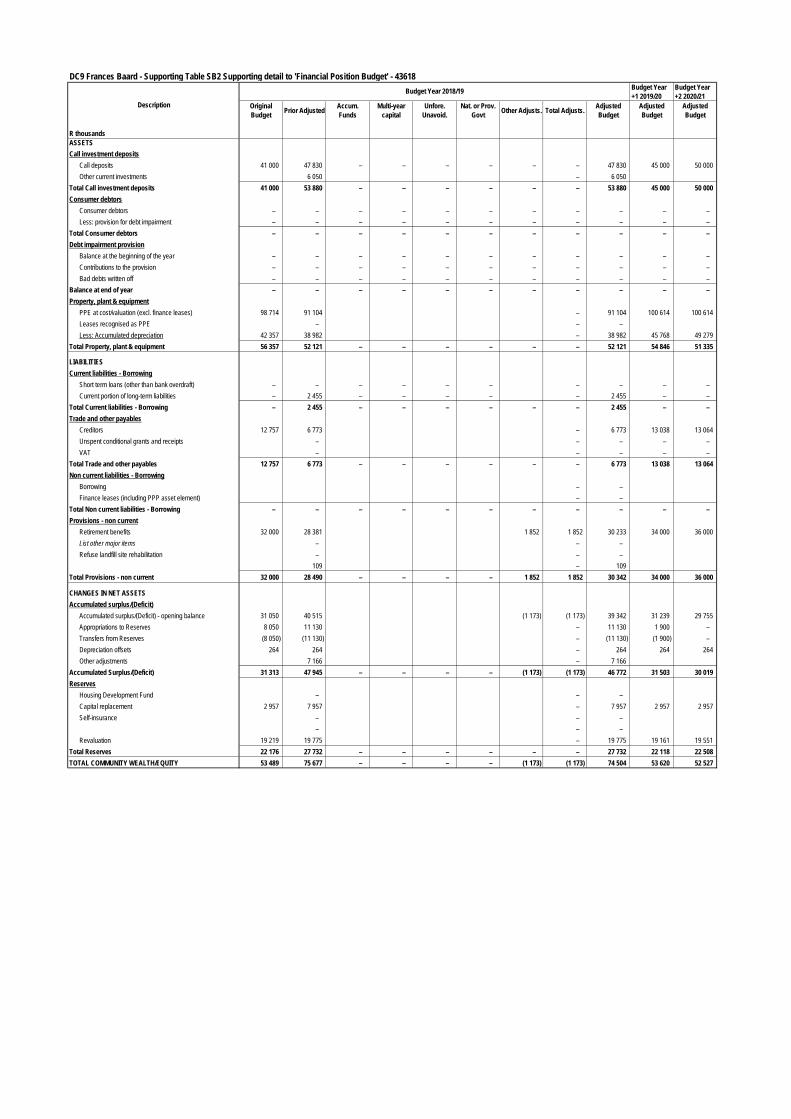
DC9 Frances Baard - Supporting Table SB2 Supporting detail to 'Financial Position Budget' - 43618Budget Year
+1 2019/20
Budget Year
+2 2020/21
Original
BudgetPrior Adjusted
Accum.
Funds
Multi-year
capital
Unfore.
Unavoid.
Nat. or Prov.
GovtOther Adjusts. Total Adjusts.
Adjusted
Budget
Adjusted
Budget
Adjusted
Budget
R thousands
ASSETS
Call investment deposits
Call deposits 41 000 47 830 – – – – – – 47 830 45 000 50 000
Other current investments 6 050 – 6 050
Total Call investment deposits 41 000 53 880 – – – – – – 53 880 45 000 50 000
Consumer debtors
Consumer debtors – – – – – – – – – – –
Less: provision for debt impairment – – – – – – – – – – –
Total Consumer debtors – – – – – – – – – – –
Debt impairment provision
Balance at the beginning of the year – – – – – – – – – – –
Contributions to the provision – – – – – – – – – – –
Bad debts written off – – – – – – – – – – –
Balance at end of year – – – – – – – – – – –
Property, plant & equipment
PPE at cost/valuation (excl. finance leases) 98 714 91 104 – 91 104 100 614 100 614
Leases recognised as PPE – – –
Less: Accumulated depreciation 42 357 38 982 – 38 982 45 768 49 279
Total Property, plant & equipment 56 357 52 121 – – – – – – 52 121 54 846 51 335
LIABILITIES
Current liabilities - Borrowing
Short term loans (other than bank overdraft) – – – – – – – – – –
Current portion of long-term liabilities – 2 455 – – – – – 2 455 – –
Total Current liabilities - Borrowing – 2 455 – – – – – – 2 455 – –
Trade and other payables
Creditors 12 757 6 773 – 6 773 13 038 13 064
Unspent conditional grants and receipts – – – – –
VAT – – – – –
Total Trade and other payables 12 757 6 773 – – – – – – 6 773 13 038 13 064
Non current liabilities - Borrowing
Borrowing – –
Finance leases (including PPP asset element) – –
Total Non current liabilities - Borrowing – – – – – – – – – – –
Provisions - non current
Retirement benefits 32 000 28 381 1 852 1 852 30 233 34 000 36 000
List other major items – – –
Refuse landfill site rehabilitation – – –
109 – 109
Total Provisions - non current 32 000 28 490 – – – – 1 852 1 852 30 342 34 000 36 000
CHANGES IN NET ASSETS
Accumulated surplus/(Deficit)
Accumulated surplus/(Deficit) - opening balance 31 050 40 515 (1 173) (1 173) 39 342 31 239 29 755
Appropriations to Reserves 8 050 11 130 – 11 130 1 900 –
Transfers from Reserves (8 050) (11 130) – (11 130) (1 900) –
Depreciation offsets 264 264 – 264 264 264
Other adjustments 7 166 – 7 166
Accumulated Surplus/(Deficit) 31 313 47 945 – – – – (1 173) (1 173) 46 772 31 503 30 019
Reserves
Housing Development Fund – – –
Capital replacement 2 957 7 957 – 7 957 2 957 2 957
Self-insurance – – –
– – –
Revaluation 19 219 19 775 – 19 775 19 161 19 551
Total Reserves 22 176 27 732 – – – – – – 27 732 22 118 22 508
TOTAL COMMUNITY WEALTH/EQUITY 53 489 75 677 – – – – (1 173) (1 173) 74 504 53 620 52 527
Description
Budget Year 2018/19
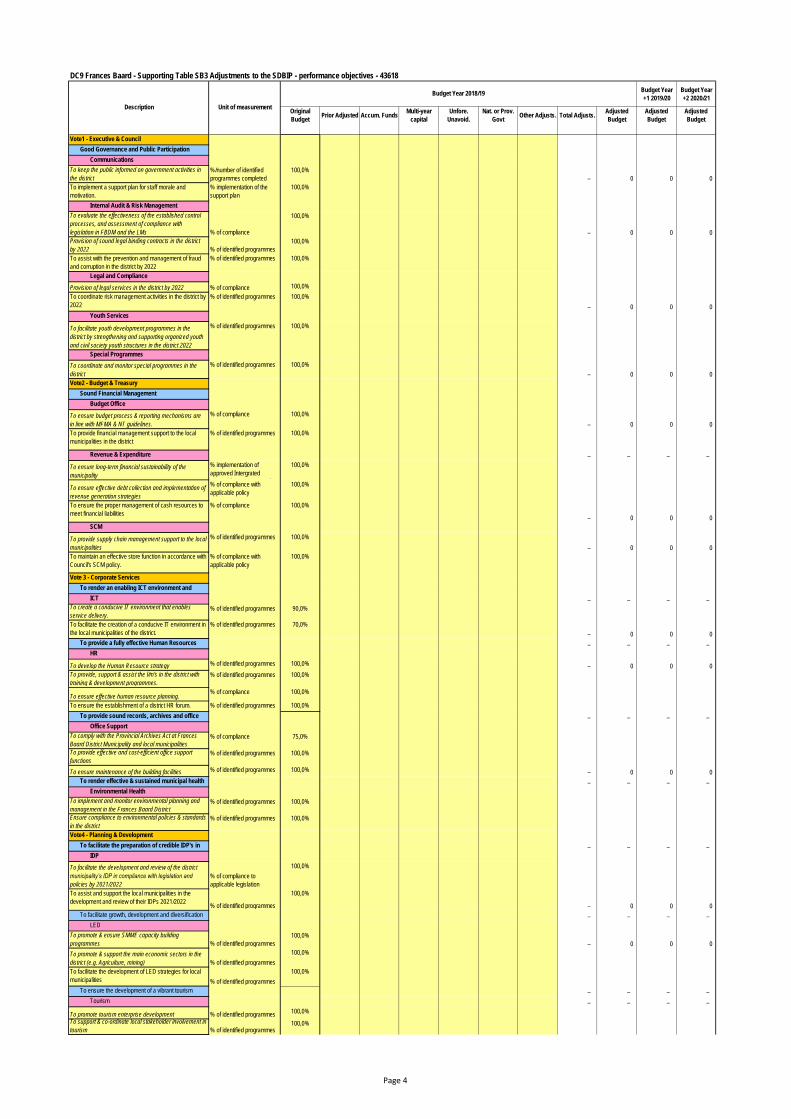
DC9 Frances Baard - Supporting Table SB3 Adjustments to the SDBIP - performance objectives - 43618
Budget Year
+1 2019/20
Budget Year
+2 2020/21
Original
BudgetPrior Adjusted Accum. Funds
Multi-year
capital
Unfore.
Unavoid.
Nat. or Prov.
GovtOther Adjusts. Total Adjusts.
Adjusted
Budget
Adjusted
Budget
Adjusted
Budget
Vote1 - Executive & Council
Good Governance and Public Participation
Communications
To keep the public informed on government activities in
the district
%/number of identified
programmes completed
100,0%
– 0 0 0
To implement a support plan for staff morale and
motivation.
% implementation of the
support plan
100,0%
Internal Audit & Risk Management
To evaluate the effectiveness of the established control
processes, and assessment of compliance with
legislation in FBDM and the LMs % of compliance
100,0%
– 0 0 0
Provision of sound legal binding contracts in the district
by 2022 % of identified programmes
100,0%
To assist with the prevention and management of fraud
and corruption in the district by 2022
% of identified programmes 100,0%
Legal and Compliance
Provision of legal services in the district by 2022 % of compliance 100,0%
To coordinate risk management activities in the district by
2022
% of identified programmes 100,0%
– 0 0 0
Youth Services
To facilitate youth development programmes in the
district by strengthening and supporting organized youth
and civil society youth structures in the district 2022
% of identified programmes 100,0%
Special Programmes
To coordinate and monitor special programmes in the
district
% of identified programmes 100,0%
– 0 0 0
Vote2 - Budget & Treasury
Sound Financial Management
Budget Office
To ensure budget process & reporting mechanisms are
in line with MFMA & NT guidelines.
% of compliance 100,0%
– 0 0 0
To provide financial management support to the local
municipalities in the district
% of identified programmes 100,0%
Revenue & Expenditure – – – –
To ensure long-term financial sustainability of the
municipality
% implementation of
approved Intergrated
Financial Management Plan
100,0%
To ensure effective debt collection and implementation of
revenue generation strategies
% of compliance with
applicable policy
100,0%
To ensure the proper management of cash resources to
meet financial liabilities
% of compliance 100,0%
– 0 0 0
SCM
To provide supply chain management support to the local
municipalities
% of identified programmes 100,0%
– 0 0 0
To maintain an effective store function in accordance with
Council's SCM policy.
% of compliance with
applicable policy
100,0%
Vote 3 - Corporate Services
To render an enabling ICT environment and
support within the district.ICT – – – – To create a conducive IT environment that enables
service delivery.% of identified programmes 90,0%
To facilitate the creation of a conducive IT environment in
the local municipalities of the district.
% of identified programmes 70,0%
– 0 0 0
To provide a fully effective Human Resources
Management function to FBDM and offer support – – – –
HR
To develop the Human Resource strategy % of identified programmes 100,0% – 0 0 0
To provide, support & assist the l/m's in the district with
training & development programmes.
% of identified programmes 100,0%
To ensure effective human resource planning.% of compliance 100,0%
To ensure the establishment of a district HR forum. % of identified programmes 100,0%
To provide sound records, archives and office
support services– – – –
Office Support
To comply with the Provincial Archives Act at Frances
Baard District Municipality and local municipalities
% of compliance 75,0%
To provide effective and cost-efficient office support
functions
% of identified programmes 100,0%
To ensure maintenance of the building facilities % of identified programmes 100,0% – 0 0 0
To render effective & sustained municipal health
services in the district– – – –
Environmental Health
To implement and monitor environmental planning and
management in the Frances Baard District
% of identified programmes 100,0%
Ensure compliance to environmental policies & standards
in the district
% of identified programmes 100,0%
Vote4 - Planning & Development
To facilitate the preparation of credible IDP's in
the district– – – –
IDP
To facilitate the development and review of the district
municipality’s IDP in compliance with legislation and
policies by 2021/2022
% of compliance to
applicable legislation
100,0%
To assist and support the local municipalities in the
development and review of their IDPs 2021/2022% of identified programmes
100,0%
– 0 0 0
To facilitate growth, development and diversification
of the district economy by optimizing all available – – – –
LED
To promote & ensure SMME capacity building
programmes % of identified programmes
100,0%
– 0 0 0
To promote & support the main economic sectors in the
district (e.g. Agriculture, mining) % of identified programmes
100,0%
To facilitate the development of LED strategies for local
municipalities % of identified programmes
100,0%
To ensure the development of a vibrant tourism
sector that facilitates sustainable economic, – – – –
Tourism – – – –
To promote tourism enterprise development % of identified programmes100,0%
To support & co-ordinate local stakeholder involvement in
tourism % of identified programmes100,0%
Description Unit of measurement
Budget Year 2018/19
Page 4
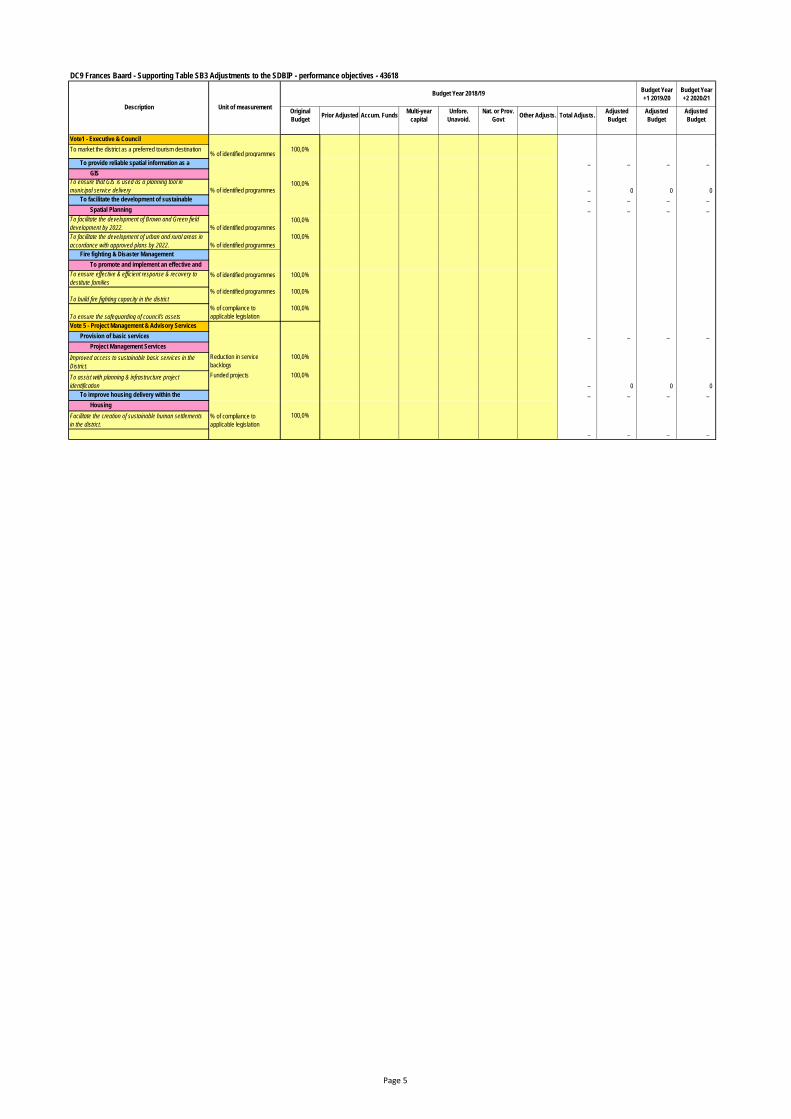
DC9 Frances Baard - Supporting Table SB3 Adjustments to the SDBIP - performance objectives - 43618
Budget Year
+1 2019/20
Budget Year
+2 2020/21
Original
BudgetPrior Adjusted Accum. Funds
Multi-year
capital
Unfore.
Unavoid.
Nat. or Prov.
GovtOther Adjusts. Total Adjusts.
Adjusted
Budget
Adjusted
Budget
Adjusted
Budget
Vote1 - Executive & Council
Description Unit of measurement
Budget Year 2018/19
To market the district as a preferred tourism destination% of identified programmes
100,0%
To provide reliable spatial information as a
planning and management tool to enhance – – – –
GIS
To ensure that GIS is used as a planning tool in
municipal service delivery % of identified programmes100,0%
– 0 0 0
To facilitate the development of sustainable
human settlements through effective town and – – – –
Spatial Planning – – – –
To facilitate the development of Brown and Green field
development by 2022. % of identified programmes100,0%
To facilitate the development of urban and rural areas in
accordance with approved plans by 2022. % of identified programmes
100,0%
Fire fighting & Disaster Management
To promote and implement an effective and
efficient Disaster Management and Fire-To ensure effective & efficient response & recovery to
destitute families
% of identified programmes 100,0%
To build fire fighting capacity in the district
% of identified programmes 100,0%
To ensure the safeguarding of council's assets
% of compliance to
applicable legislation
100,0%
Vote 5 - Project Management & Advisory Services
Provision of basic services – – – –
Project Management Services
Improved access to sustainable basic services in the
District.
Reduction in service
backlogs
100,0%
To assist with planning & infrastructure project
identification
Funded projects 100,0%
– 0 0 0
To improve housing delivery within the
framework of sustainable human settlements– – – –
Housing
Facilitate the creation of sustainable human settlements
in the district.
% of compliance to
applicable legislation
100,0%
– – – –
Page 5
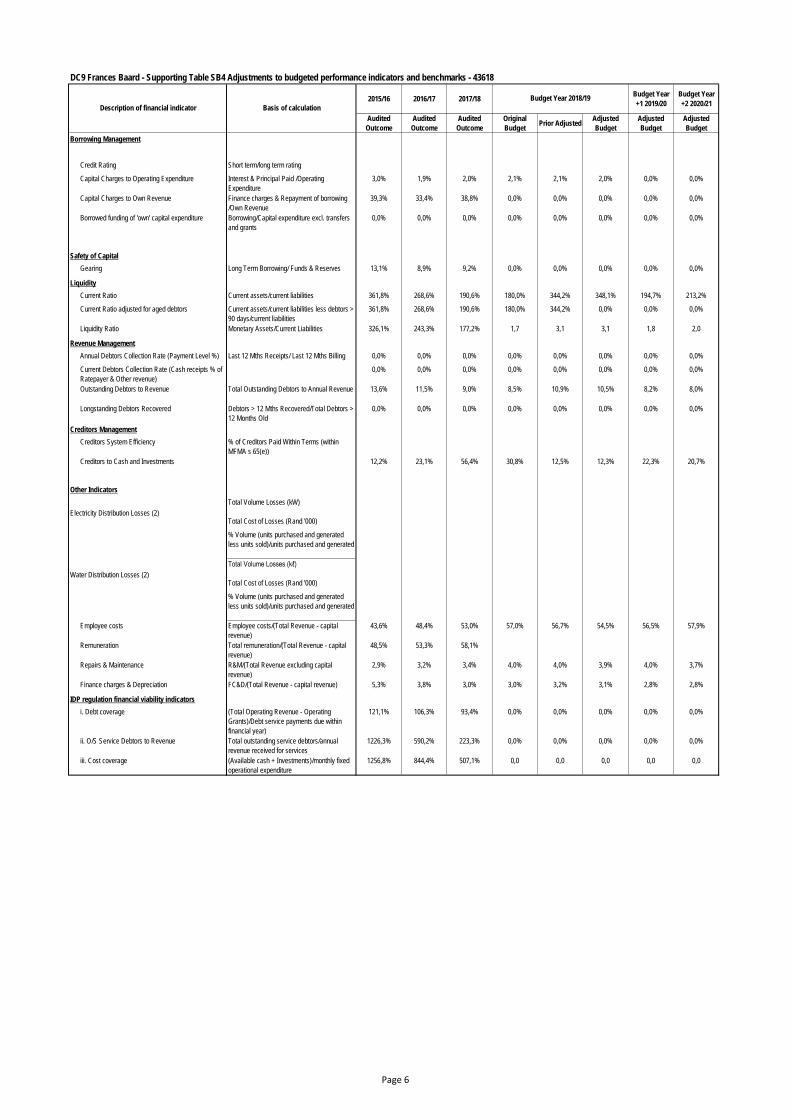
DC9 Frances Baard - Supporting Table SB4 Adjustments to budgeted performance indicators and benchmarks - 43618
2015/16 2016/17 2017/18Budget Year
+1 2019/20
Budget Year
+2 2020/21
Audited
Outcome
Audited
Outcome
Audited
Outcome
Original
BudgetPrior Adjusted
Adjusted
Budget
Adjusted
Budget
Adjusted
Budget
Borrowing Management
Credit Rating Short term/long term rating
Capital Charges to Operating Expenditure Interest & Principal Paid /Operating
Expenditure
3,0% 1,9% 2,0% 2,1% 2,1% 2,0% 0,0% 0,0%
Capital Charges to Own Revenue Finance charges & Repayment of borrowing
/Own Revenue
39,3% 33,4% 38,8% 0,0% 0,0% 0,0% 0,0% 0,0%
Borrowed funding of 'own' capital expenditure Borrowing/Capital expenditure excl. transfers
and grants
0,0% 0,0% 0,0% 0,0% 0,0% 0,0% 0,0% 0,0%
Safety of Capital
Gearing Long Term Borrowing/ Funds & Reserves 13,1% 8,9% 9,2% 0,0% 0,0% 0,0% 0,0% 0,0%
Liquidity
Current Ratio Current assets/current liabilities 361,8% 268,6% 190,6% 180,0% 344,2% 348,1% 194,7% 213,2%
Current Ratio adjusted for aged debtors Current assets/current liabilities less debtors >
90 days/current liabilities
361,8% 268,6% 190,6% 180,0% 344,2% 0,0% 0,0% 0,0%
Liquidity Ratio Monetary Assets/Current Liabilities 326,1% 243,3% 177,2% 1,7 3,1 3,1 1,8 2,0
Revenue Management
Annual Debtors Collection Rate (Payment Level %) Last 12 Mths Receipts/ Last 12 Mths Billing 0,0% 0,0% 0,0% 0,0% 0,0% 0,0% 0,0% 0,0%
Current Debtors Collection Rate (Cash receipts % of
Ratepayer & Other revenue)
0,0% 0,0% 0,0% 0,0% 0,0% 0,0% 0,0% 0,0%
Outstanding Debtors to Revenue Total Outstanding Debtors to Annual Revenue 13,6% 11,5% 9,0% 8,5% 10,9% 10,5% 8,2% 8,0%
Longstanding Debtors Recovered Debtors > 12 Mths Recovered/Total Debtors >
12 Months Old
0,0% 0,0% 0,0% 0,0% 0,0% 0,0% 0,0% 0,0%
Creditors Management
Creditors System Efficiency % of Creditors Paid Within Terms (within
MFMA s 65(e))
Creditors to Cash and Investments 12,2% 23,1% 56,4% 30,8% 12,5% 12,3% 22,3% 20,7%
Other Indicators
Total Volume Losses (kW)
Total Cost of Losses (Rand '000)
% Volume (units purchased and generated
less units sold)/units purchased and generated
Total Volume Losses (kℓ)
Total Cost of Losses (Rand '000)
% Volume (units purchased and generated
less units sold)/units purchased and generated
Employee costs Employee costs/(Total Revenue - capital
revenue)
43,6% 48,4% 53,0% 57,0% 56,7% 54,5% 56,5% 57,9%
Remuneration Total remuneration/(Total Revenue - capital
revenue)
48,5% 53,3% 58,1%
Repairs & Maintenance R&M/(Total Revenue excluding capital
revenue)
2,9% 3,2% 3,4% 4,0% 4,0% 3,9% 4,0% 3,7%
Finance charges & Depreciation FC&D/(Total Revenue - capital revenue) 5,3% 3,8% 3,0% 3,0% 3,2% 3,1% 2,8% 2,8%
IDP regulation financial viability indicators
i. Debt coverage (Total Operating Revenue - Operating
Grants)/Debt service payments due within
financial year)
121,1% 106,3% 93,4% 0,0% 0,0% 0,0% 0,0% 0,0%
ii. O/S Service Debtors to Revenue Total outstanding service debtors/annual
revenue received for services
1226,3% 590,2% 223,3% 0,0% 0,0% 0,0% 0,0% 0,0%
iii. Cost coverage (Available cash + Investments)/monthly fixed
operational expenditure
1256,8% 844,4% 507,1% 0,0 0,0 0,0 0,0 0,0
Description of financial indicator Basis of calculation
Budget Year 2018/19
Electricity Distribution Losses (2)
Water Distribution Losses (2)
Page 6
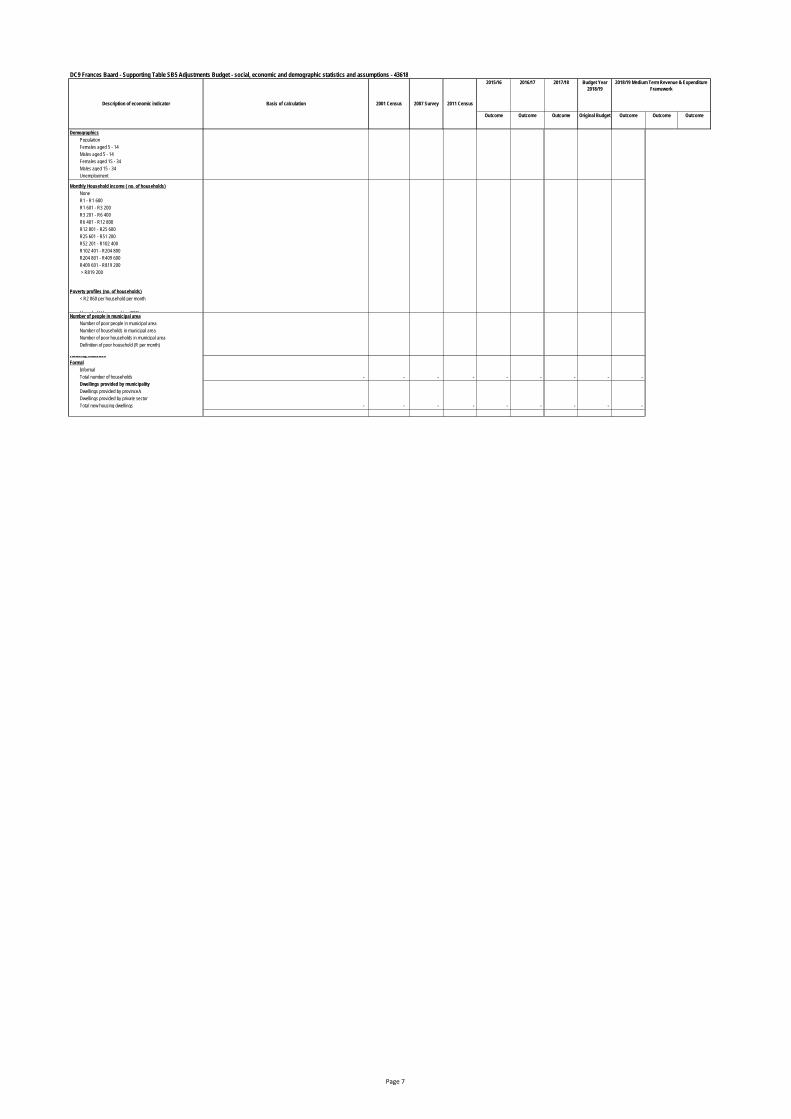
DC9 Frances Baard - Supporting Table SB5 Adjustments Budget - social, economic and demographic statistics and assumptions - 436182015/16 2016/17 2017/18 Budget Year
2018/19
Outcome Outcome Outcome Original Budget Outcome Outcome Outcome
Demographics
Population
Females aged 5 - 14
Males aged 5 - 14
Females aged 15 - 34
Males aged 15 - 34
Unemployment
Monthly Household income ( no. of households)
None
R1 - R1 600
R1 601 - R3 200
R3 201 - R6 400
R6 401 - R12 800
R12 801 - R25 600
R25 601 - R51 200
R52 201 - R102 400
R102 401 - R204 800
R204 801 - R409 600
R409 601 - R819 200
> R819 200
Poverty profiles (no. of households)
< R2 060 per household per month
Household/demographics (000)Number of people in municipal area
Number of poor people in municipal area
Number of households in municipal area
Number of poor households in municipal area
Definition of poor household (R per month)
Housing statistics
Formal
Informal
Total number of households - - - - - - - - -
Dwellings provided by municipality
Dwellings provided by province/s
Dwellings provided by private sector
Total new housing dwellings - - - - - - - - -
2018/19 Medium Term Revenue & Expenditure
Framework
Description of economic indicator Basis of calculation 2001 Census 2007 Survey 2011 Census
Page 7
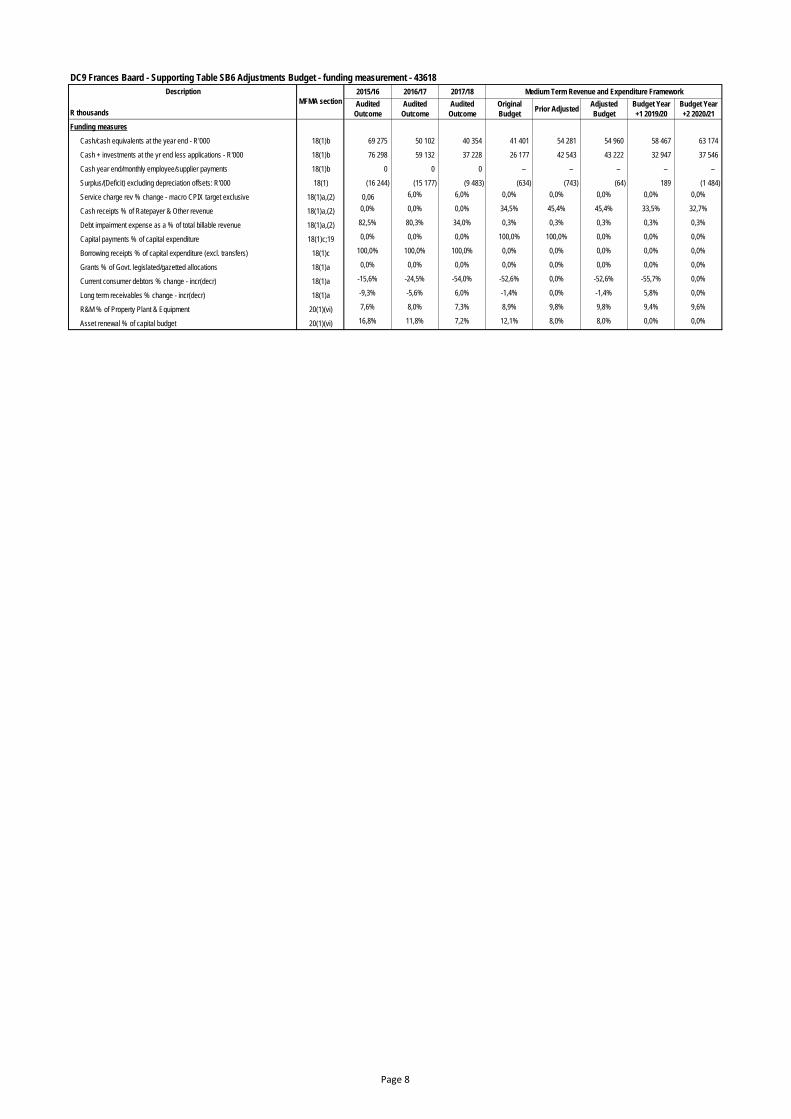
DC9 Frances Baard - Supporting Table SB6 Adjustments Budget - funding measurement - 43618
Description 2015/16 2016/17 2017/18 Medium Term Revenue and Expenditure Framework
R thousandsAudited
Outcome
Audited
Outcome
Audited
Outcome
Original
BudgetPrior Adjusted
Adjusted
Budget
Budget Year
+1 2019/20
Budget Year
+2 2020/21
Funding measures
Cash/cash equivalents at the year end - R'000 18(1)b 69 275 50 102 40 354 41 401 54 281 54 960 58 467 63 174
Cash + investments at the yr end less applications - R'000 18(1)b 76 298 59 132 37 228 26 177 42 543 43 222 32 947 37 546
Cash year end/monthly employee/supplier payments 18(1)b 0 0 0 – – – – –
Surplus/(Deficit) excluding depreciation offsets: R'000 18(1) (16 244) (15 177) (9 483) (634) (743) (64) 189 (1 484)
Service charge rev % change - macro CPIX target exclusive 18(1)a,(2) 0,06 6,0% 6,0% 0,0% 0,0% 0,0% 0,0% 0,0%
Cash receipts % of Ratepayer & Other revenue 18(1)a,(2) 0,0% 0,0% 0,0% 34,5% 45,4% 45,4% 33,5% 32,7%
Debt impairment expense as a % of total billable revenue 18(1)a,(2) 82,5% 80,3% 34,0% 0,3% 0,3% 0,3% 0,3% 0,3%
Capital payments % of capital expenditure 18(1)c;19 0,0% 0,0% 0,0% 100,0% 100,0% 0,0% 0,0% 0,0%
Borrowing receipts % of capital expenditure (excl. transfers) 18(1)c 100,0% 100,0% 100,0% 0,0% 0,0% 0,0% 0,0% 0,0%
Grants % of Govt. legislated/gazetted allocations 18(1)a 0,0% 0,0% 0,0% 0,0% 0,0% 0,0% 0,0% 0,0%
Current consumer debtors % change - incr(decr) 18(1)a -15,6% -24,5% -54,0% -52,6% 0,0% -52,6% -55,7% 0,0%
Long term receivables % change - incr(decr) 18(1)a -9,3% -5,6% 6,0% -1,4% 0,0% -1,4% 5,8% 0,0%
R&M % of Property Plant & Equipment 20(1)(vi) 7,6% 8,0% 7,3% 8,9% 9,8% 9,8% 9,4% 9,6%
Asset renewal % of capital budget 20(1)(vi) 16,8% 11,8% 7,2% 12,1% 8,0% 8,0% 0,0% 0,0%
MFMA section
Page 8
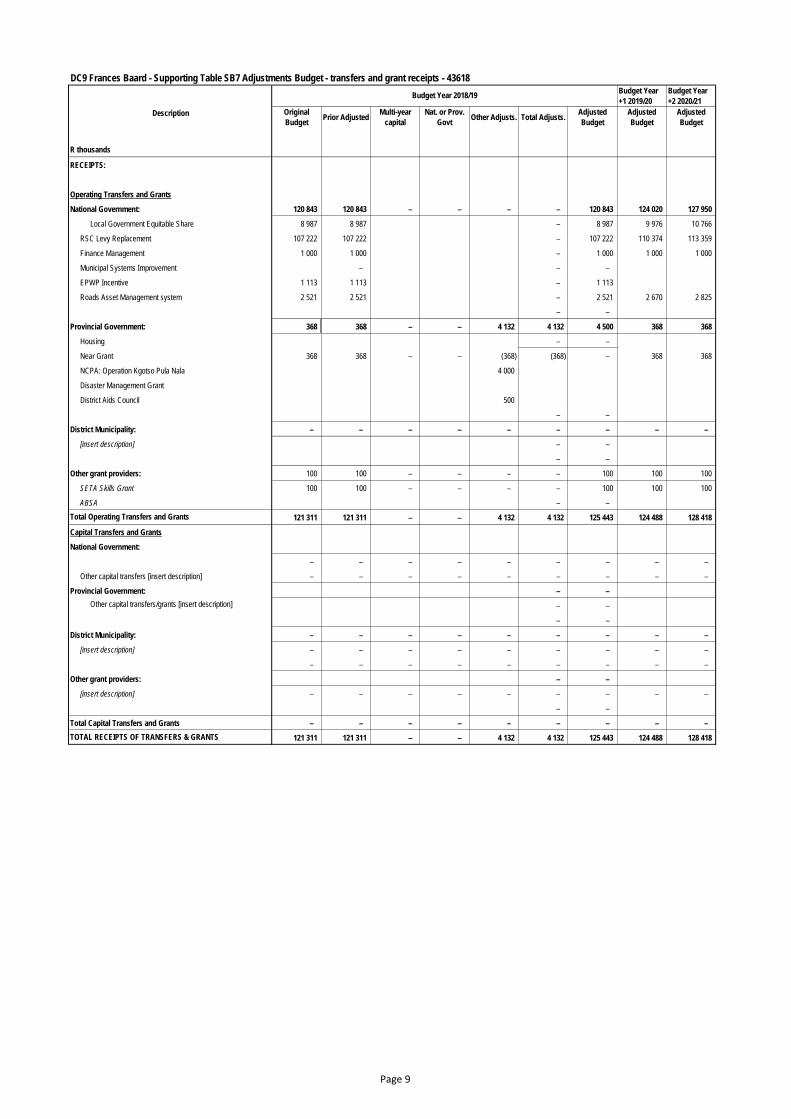
DC9 Frances Baard - Supporting Table SB7 Adjustments Budget - transfers and grant receipts - 43618
Budget Year
+1 2019/20
Budget Year
+2 2020/21
Original
BudgetPrior Adjusted
Multi-year
capital
Nat. or Prov.
GovtOther Adjusts. Total Adjusts.
Adjusted
Budget
Adjusted
Budget
Adjusted
Budget
R thousands
RECEIPTS:
Operating Transfers and Grants
National Government: 120 843 120 843 – – – – 120 843 124 020 127 950
Local Government Equitable Share 8 987 8 987 – 8 987 9 976 10 766
RSC Levy Replacement 107 222 107 222 – 107 222 110 374 113 359
Finance Management 1 000 1 000 – 1 000 1 000 1 000
Municipal Systems Improvement – – –
EPWP Incentive 1 113 1 113 – 1 113
Roads Asset Management system 2 521 2 521 – 2 521 2 670 2 825
– –
Provincial Government: 368 368 – – 4 132 4 132 4 500 368 368
Housing – –
Near Grant 368 368 – – (368) (368) – 368 368
NCPA: Operation Kgotso Pula Nala 4 000
Disaster Management Grant
District Aids Council 500
– –
District Municipality: – – – – – – – – –
[insert description] – –
– –
Other grant providers: 100 100 – – – – 100 100 100
SETA Skills Grant 100 100 – – – – 100 100 100
ABSA – –
Total Operating Transfers and Grants 121 311 121 311 – – 4 132 4 132 125 443 124 488 128 418
Capital Transfers and Grants
National Government:
– – – – – – – – –
Other capital transfers [insert description] – – – – – – – – –
Provincial Government: – –
Other capital transfers/grants [insert description] – –
– –
District Municipality: – – – – – – – – –
[insert description] – – – – – – – – –
– – – – – – – – –
Other grant providers: – –
[insert description] – – – – – – – – –
– –
Total Capital Transfers and Grants – – – – – – – – –
TOTAL RECEIPTS OF TRANSFERS & GRANTS 121 311 121 311 – – 4 132 4 132 125 443 124 488 128 418
Description
Budget Year 2018/19
Page 9
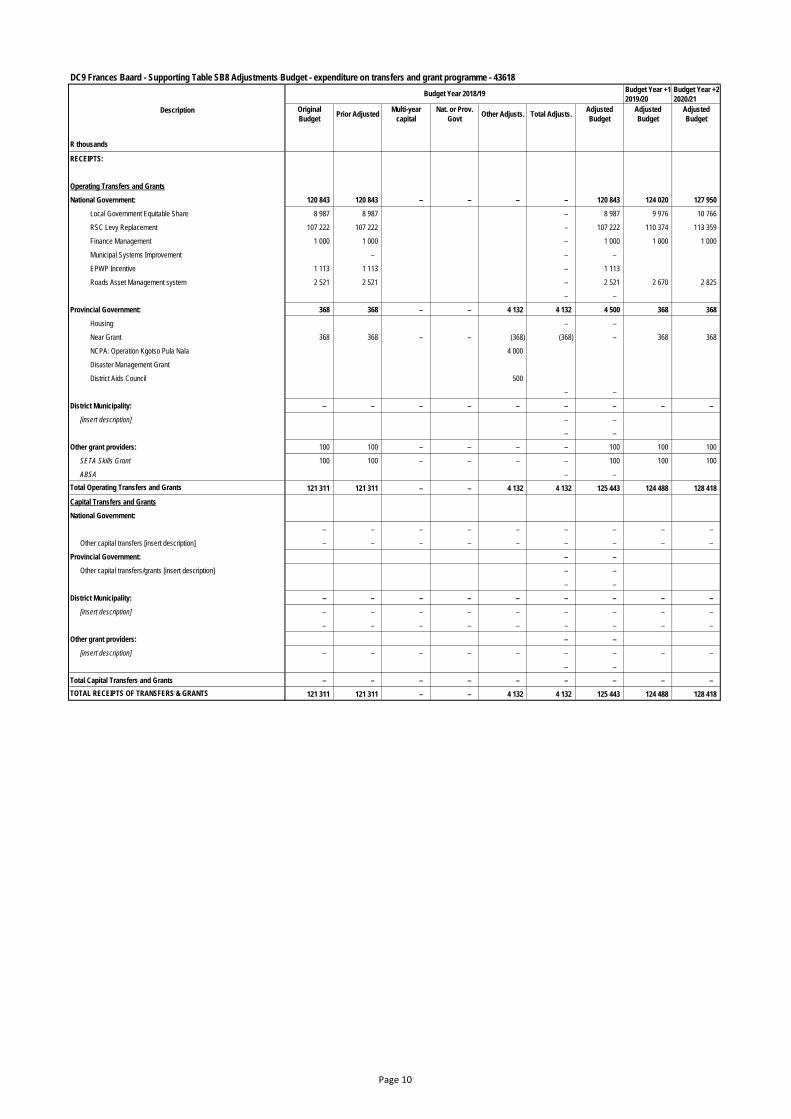
DC9 Frances Baard - Supporting Table SB8 Adjustments Budget - expenditure on transfers and grant programme - 43618
Budget Year +1
2019/20
Budget Year +2
2020/21
Original
BudgetPrior Adjusted
Multi-year
capital
Nat. or Prov.
GovtOther Adjusts. Total Adjusts.
Adjusted
Budget
Adjusted
Budget
Adjusted
Budget
R thousands
RECEIPTS:
Operating Transfers and Grants
National Government: 120 843 120 843 – – – – 120 843 124 020 127 950
Local Government Equitable Share 8 987 8 987 – 8 987 9 976 10 766
RSC Levy Replacement 107 222 107 222 – 107 222 110 374 113 359
Finance Management 1 000 1 000 – 1 000 1 000 1 000
Municipal Systems Improvement – – –
EPWP Incentive 1 113 1 113 – 1 113
Roads Asset Management system 2 521 2 521 – 2 521 2 670 2 825
– –
Provincial Government: 368 368 – – 4 132 4 132 4 500 368 368
Housing – –
Near Grant 368 368 – – (368) (368) – 368 368
NCPA: Operation Kgotso Pula Nala 4 000
Disaster Management Grant
District Aids Council 500
– –
District Municipality: – – – – – – – – –
[insert description] – –
– –
Other grant providers: 100 100 – – – – 100 100 100
SETA Skills Grant 100 100 – – – – 100 100 100
ABSA – –
Total Operating Transfers and Grants 121 311 121 311 – – 4 132 4 132 125 443 124 488 128 418
Capital Transfers and Grants
National Government:
– – – – – – – – –
Other capital transfers [insert description] – – – – – – – – –
Provincial Government: – –
Other capital transfers/grants [insert description] – –
– –
District Municipality: – – – – – – – – –
[insert description] – – – – – – – – –
– – – – – – – – –
Other grant providers: – –
[insert description] – – – – – – – – –
– –
Total Capital Transfers and Grants – – – – – – – – –
TOTAL RECEIPTS OF TRANSFERS & GRANTS 121 311 121 311 – – 4 132 4 132 125 443 124 488 128 418
Description
Budget Year 2018/19
Page 10
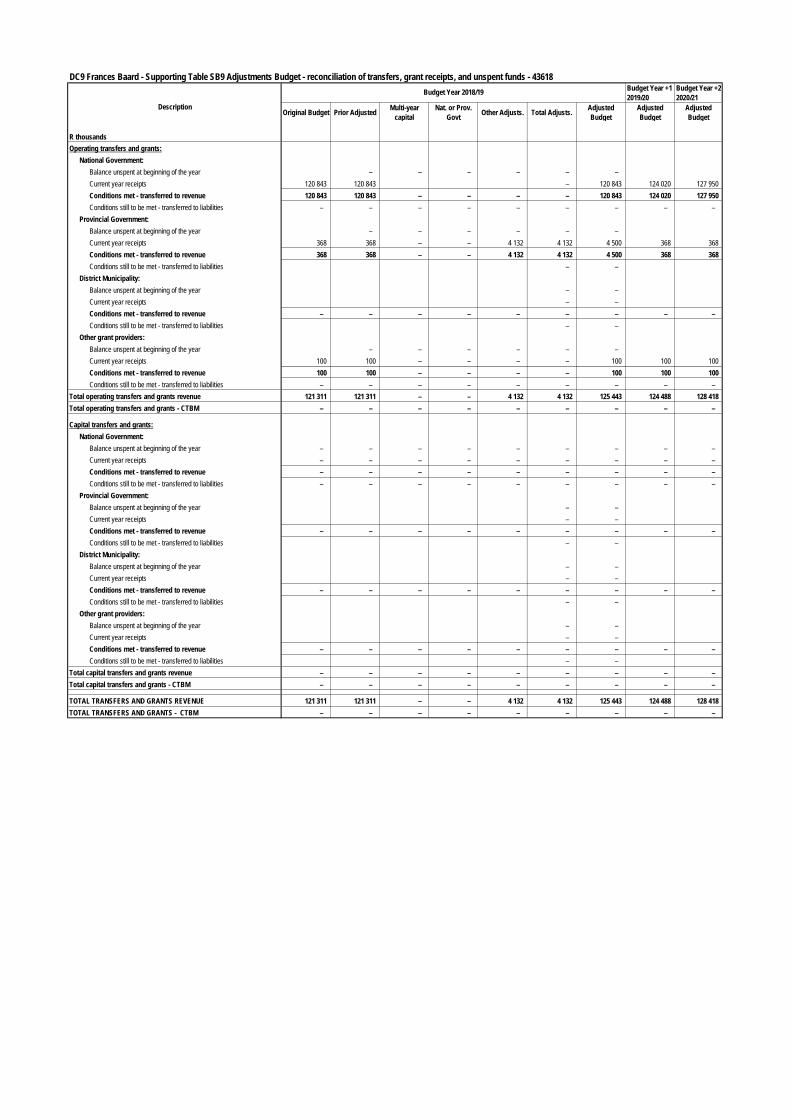
DC9 Frances Baard - Supporting Table SB9 Adjustments Budget - reconciliation of transfers, grant receipts, and unspent funds - 43618Budget Year +1
2019/20
Budget Year +2
2020/21
Original Budget Prior AdjustedMulti-year
capital
Nat. or Prov.
GovtOther Adjusts. Total Adjusts.
Adjusted
Budget
Adjusted
Budget
Adjusted
Budget
R thousands
Operating transfers and grants:
National Government:
Balance unspent at beginning of the year – – – – – –
Current year receipts 120 843 120 843 – 120 843 124 020 127 950
Conditions met - transferred to revenue 120 843 120 843 – – – – 120 843 124 020 127 950
Conditions still to be met - transferred to liabilities – – – – – – – – –
Provincial Government:
Balance unspent at beginning of the year – – – – – –
Current year receipts 368 368 – – 4 132 4 132 4 500 368 368
Conditions met - transferred to revenue 368 368 – – 4 132 4 132 4 500 368 368
Conditions still to be met - transferred to liabilities – –
District Municipality:
Balance unspent at beginning of the year – –
Current year receipts – –
Conditions met - transferred to revenue – – – – – – – – –
Conditions still to be met - transferred to liabilities – –
Other grant providers:
Balance unspent at beginning of the year – – – – – –
Current year receipts 100 100 – – – – 100 100 100
Conditions met - transferred to revenue 100 100 – – – – 100 100 100
Conditions still to be met - transferred to liabilities – – – – – – – – –
Total operating transfers and grants revenue 121 311 121 311 – – 4 132 4 132 125 443 124 488 128 418
Total operating transfers and grants - CTBM – – – – – – – – –
Capital transfers and grants:
National Government:
Balance unspent at beginning of the year – – – – – – – – –
Current year receipts – – – – – – – – –
Conditions met - transferred to revenue – – – – – – – – –
Conditions still to be met - transferred to liabilities – – – – – – – – –
Provincial Government:
Balance unspent at beginning of the year – –
Current year receipts – –
Conditions met - transferred to revenue – – – – – – – – –
Conditions still to be met - transferred to liabilities – –
District Municipality:
Balance unspent at beginning of the year – –
Current year receipts – –
Conditions met - transferred to revenue – – – – – – – – –
Conditions still to be met - transferred to liabilities – –
Other grant providers:
Balance unspent at beginning of the year – –
Current year receipts – –
Conditions met - transferred to revenue – – – – – – – – –
Conditions still to be met - transferred to liabilities – –
Total capital transfers and grants revenue – – – – – – – – –
Total capital transfers and grants - CTBM – – – – – – – – –
TOTAL TRANSFERS AND GRANTS REVENUE 121 311 121 311 – – 4 132 4 132 125 443 124 488 128 418
TOTAL TRANSFERS AND GRANTS - CTBM – – – – – – – – –
Description
Budget Year 2018/19
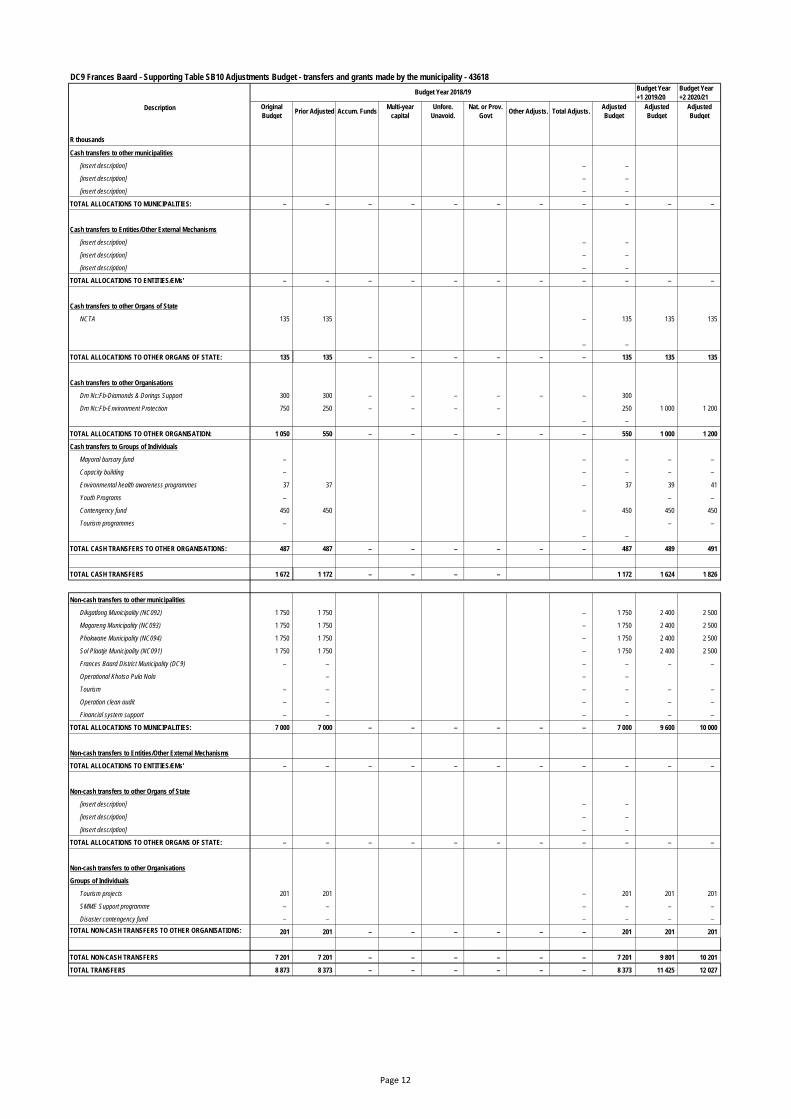
DC9 Frances Baard - Supporting Table SB10 Adjustments Budget - transfers and grants made by the municipality - 43618
Budget Year
+1 2019/20
Budget Year
+2 2020/21
Original
BudgetPrior Adjusted Accum. Funds
Multi-year
capital
Unfore.
Unavoid.
Nat. or Prov.
GovtOther Adjusts. Total Adjusts.
Adjusted
Budget
Adjusted
Budget
Adjusted
Budget
R thousands
Cash transfers to other municipalities
[insert description] – –
[insert description] – –
[insert description] – –
TOTAL ALLOCATIONS TO MUNICIPALITIES: – – – – – – – – – – –
Cash transfers to Entities/Other External Mechanisms
[insert description] – –
[insert description] – –
[insert description] – –
TOTAL ALLOCATIONS TO ENTITIES/EMs' – – – – – – – – – – –
Cash transfers to other Organs of State
NCTA 135 135 – 135 135 135
– –
TOTAL ALLOCATIONS TO OTHER ORGANS OF STATE: 135 135 – – – – – – 135 135 135
Cash transfers to other Organisations
Dm Nc:Fb-Diamonds & Dorings Support 300 300 – – – – – – 300
Dm Nc:Fb-Environment Protection 750 250 – – – – 250 1 000 1 200
– –
TOTAL ALLOCATIONS TO OTHER ORGANISATION: 1 050 550 – – – – – – 550 1 000 1 200
Cash transfers to Groups of Individuals
Mayoral bursary fund – – – – –
Capacity building – – – – –
Environmental health awareness programmes 37 37 – 37 39 41
Youth Programs – – –
Contengency fund 450 450 – 450 450 450
Tourism programmes – – –
– –
TOTAL CASH TRANSFERS TO OTHER ORGANISATIONS: 487 487 – – – – – – 487 489 491
TOTAL CASH TRANSFERS 1 672 1 172 – – – – 1 172 1 624 1 826
Non-cash transfers to other municipalities
Dikgatlong Municipality (NC092) 1 750 1 750 – 1 750 2 400 2 500
Magareng Municipality (NC093) 1 750 1 750 – 1 750 2 400 2 500
Phokwane Municipality (NC094) 1 750 1 750 – 1 750 2 400 2 500
Sol Plaatje Municipality (NC091) 1 750 1 750 – 1 750 2 400 2 500
Frances Baard District Municipality (DC9) – – – – – –
Operational Khotso Pula Nala – – –
Tourism – – – – – –
Operation clean audit – – – – – –
Financial system support – – – – – –
TOTAL ALLOCATIONS TO MUNICIPALITIES: 7 000 7 000 – – – – – – 7 000 9 600 10 000
Non-cash transfers to Entities/Other External Mechanisms
TOTAL ALLOCATIONS TO ENTITIES/EMs' – – – – – – – – – – –
Non-cash transfers to other Organs of State
[insert description] – –
[insert description] – –
[insert description] – –
TOTAL ALLOCATIONS TO OTHER ORGANS OF STATE: – – – – – – – – – – –
Non-cash transfers to other Organisations
Groups of Individuals
Tourism projects 201 201 – 201 201 201
SMME Support programme – – – – – –
Disaster contengency fund – – – – – –
TOTAL NON-CASH TRANSFERS TO OTHER ORGANISATIONS: 201 201 – – – – – – 201 201 201
TOTAL NON-CASH TRANSFERS 7 201 7 201 – – – – – – 7 201 9 801 10 201
TOTAL TRANSFERS 8 873 8 373 – – – – – – 8 373 11 425 12 027
Description
Budget Year 2018/19
Page 12
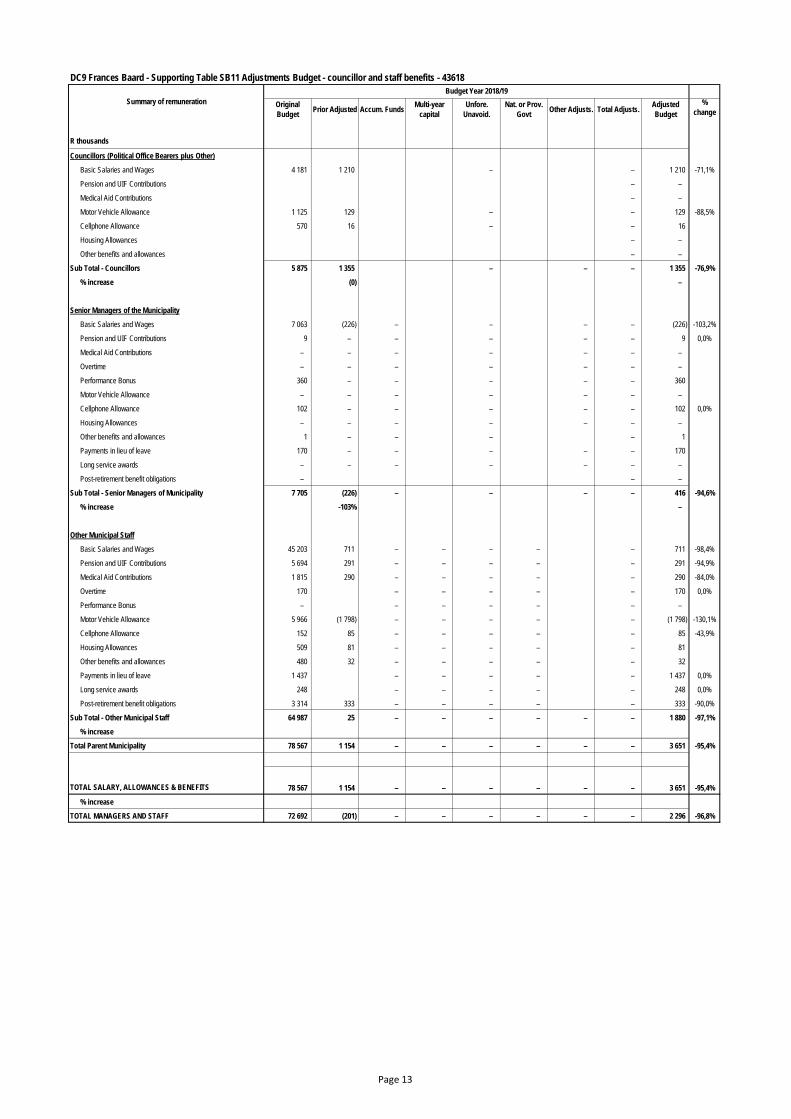
DC9 Frances Baard - Supporting Table SB11 Adjustments Budget - councillor and staff benefits - 43618
Original
BudgetPrior Adjusted Accum. Funds
Multi-year
capital
Unfore.
Unavoid.
Nat. or Prov.
GovtOther Adjusts. Total Adjusts.
Adjusted
Budget
%
change
R thousands
Councillors (Political Office Bearers plus Other)
Basic Salaries and Wages 4 181 1 210 – – 1 210 -71,1%
Pension and UIF Contributions – –
Medical Aid Contributions – –
Motor Vehicle Allowance 1 125 129 – – 129 -88,5%
Cellphone Allowance 570 16 – – 16
Housing Allowances – –
Other benefits and allowances – –
Sub Total - Councillors 5 875 1 355 – – – 1 355 -76,9%
% increase (0) –
Senior Managers of the Municipality
Basic Salaries and Wages 7 063 (226) – – – – (226) -103,2%
Pension and UIF Contributions 9 – – – – – 9 0,0%
Medical Aid Contributions – – – – – – –
Overtime – – – – – – –
Performance Bonus 360 – – – – – 360
Motor Vehicle Allowance – – – – – – –
Cellphone Allowance 102 – – – – – 102 0,0%
Housing Allowances – – – – – – –
Other benefits and allowances 1 – – – – 1
Payments in lieu of leave 170 – – – – – 170
Long service awards – – – – – – –
Post-retirement benefit obligations – – –
Sub Total - Senior Managers of Municipality 7 705 (226) – – – – 416 -94,6%
% increase -103% –
Other Municipal Staff
Basic Salaries and Wages 45 203 711 – – – – – 711 -98,4%
Pension and UIF Contributions 5 694 291 – – – – – 291 -94,9%
Medical Aid Contributions 1 815 290 – – – – – 290 -84,0%
Overtime 170 – – – – – 170 0,0%
Performance Bonus – – – – – – –
Motor Vehicle Allowance 5 966 (1 798) – – – – – (1 798) -130,1%
Cellphone Allowance 152 85 – – – – – 85 -43,9%
Housing Allowances 509 81 – – – – – 81
Other benefits and allowances 480 32 – – – – – 32
Payments in lieu of leave 1 437 – – – – – 1 437 0,0%
Long service awards 248 – – – – – 248 0,0%
Post-retirement benefit obligations 3 314 333 – – – – – 333 -90,0%
Sub Total - Other Municipal Staff 64 987 25 – – – – – – 1 880 -97,1%
% increase
Total Parent Municipality 78 567 1 154 – – – – – – 3 651 -95,4%
TOTAL SALARY, ALLOWANCES & BENEFITS 78 567 1 154 – – – – – – 3 651 -95,4%
% increase
TOTAL MANAGERS AND STAFF 72 692 (201) – – – – – – 2 296 -96,8%
Summary of remuneration
Budget Year 2018/19
Page 13
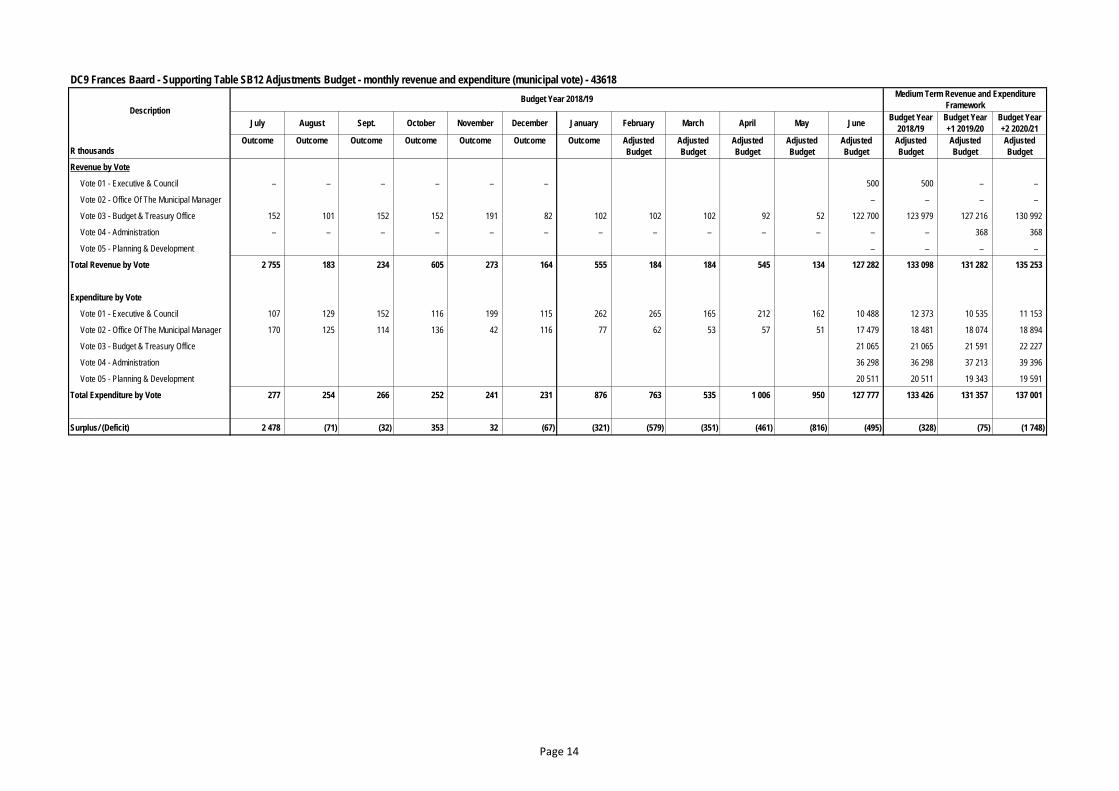
DC9 Frances Baard - Supporting Table SB12 Adjustments Budget - monthly revenue and expenditure (municipal vote) - 43618
Medium Term Revenue and Expenditure
Framework
July August Sept. October November December January February March April May JuneBudget Year
2018/19
Budget Year
+1 2019/20
Budget Year
+2 2020/21
R thousandsOutcome Outcome Outcome Outcome Outcome Outcome Outcome Adjusted
Budget
Adjusted
Budget
Adjusted
Budget
Adjusted
Budget
Adjusted
Budget
Adjusted
Budget
Adjusted
Budget
Adjusted
Budget
Revenue by Vote
Vote 01 - Executive & Council – – – – – – 500 500 – –
Vote 02 - Office Of The Municipal Manager – – – –
Vote 03 - Budget & Treasury Office 152 101 152 152 191 82 102 102 102 92 52 122 700 123 979 127 216 130 992
Vote 04 - Administration – – – – – – – – – – – – – 368 368
Vote 05 - Planning & Development – – – –
Total Revenue by Vote 2 755 183 234 605 273 164 555 184 184 545 134 127 282 133 098 131 282 135 253
Expenditure by Vote
Vote 01 - Executive & Council 107 129 152 116 199 115 262 265 165 212 162 10 488 12 373 10 535 11 153
Vote 02 - Office Of The Municipal Manager 170 125 114 136 42 116 77 62 53 57 51 17 479 18 481 18 074 18 894
Vote 03 - Budget & Treasury Office 21 065 21 065 21 591 22 227
Vote 04 - Administration 36 298 36 298 37 213 39 396
Vote 05 - Planning & Development 20 511 20 511 19 343 19 591
Total Expenditure by Vote 277 254 266 252 241 231 876 763 535 1 006 950 127 777 133 426 131 357 137 001
Surplus/ (Deficit) 2 478 (71) (32) 353 32 (67) (321) (579) (351) (461) (816) (495) (328) (75) (1 748)
Description
Budget Year 2018/19
Page 14
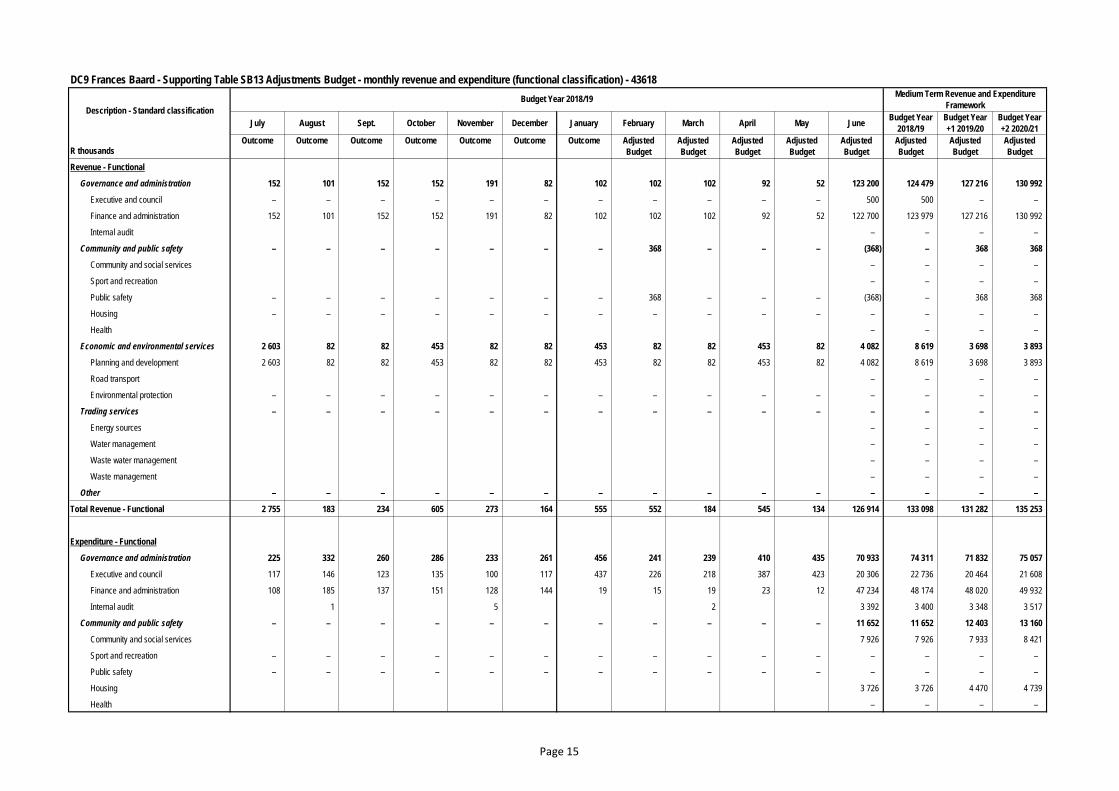
DC9 Frances Baard - Supporting Table SB13 Adjustments Budget - monthly revenue and expenditure (functional classification) - 43618
Medium Term Revenue and Expenditure
Framework
July August Sept. October November December January February March April May JuneBudget Year
2018/19
Budget Year
+1 2019/20
Budget Year
+2 2020/21
R thousandsOutcome Outcome Outcome Outcome Outcome Outcome Outcome Adjusted
Budget
Adjusted
Budget
Adjusted
Budget
Adjusted
Budget
Adjusted
Budget
Adjusted
Budget
Adjusted
Budget
Adjusted
Budget
Revenue - Functional
Governance and administration 152 101 152 152 191 82 102 102 102 92 52 123 200 124 479 127 216 130 992
Executive and council – – – – – – – – – – – 500 500 – –
Finance and administration 152 101 152 152 191 82 102 102 102 92 52 122 700 123 979 127 216 130 992
Internal audit – – – –
Community and public safety – – – – – – – 368 – – – (368) – 368 368
Community and social services – – – –
Sport and recreation – – – –
Public safety – – – – – – – 368 – – – (368) – 368 368
Housing – – – – – – – – – – – – – – –
Health – – – –
Economic and environmental services 2 603 82 82 453 82 82 453 82 82 453 82 4 082 8 619 3 698 3 893
Planning and development 2 603 82 82 453 82 82 453 82 82 453 82 4 082 8 619 3 698 3 893
Road transport – – – –
Environmental protection – – – – – – – – – – – – – – –
Trading services – – – – – – – – – – – – – – –
Energy sources – – – –
Water management – – – –
Waste water management – – – –
Waste management – – – –
Other – – – – – – – – – – – – – – –
Total Revenue - Functional 2 755 183 234 605 273 164 555 552 184 545 134 126 914 133 098 131 282 135 253
Expenditure - Functional
Governance and administration 225 332 260 286 233 261 456 241 239 410 435 70 933 74 311 71 832 75 057
Executive and council 117 146 123 135 100 117 437 226 218 387 423 20 306 22 736 20 464 21 608
Finance and administration 108 185 137 151 128 144 19 15 19 23 12 47 234 48 174 48 020 49 932
Internal audit 1 5 2 3 392 3 400 3 348 3 517
Community and public safety – – – – – – – – – – – 11 652 11 652 12 403 13 160
Community and social services 7 926 7 926 7 933 8 421
Sport and recreation – – – – – – – – – – – – – – –
Public safety – – – – – – – – – – – – – – –
Housing 3 726 3 726 4 470 4 739
Health – – – –
Description - Standard classification
Budget Year 2018/19
Page 15
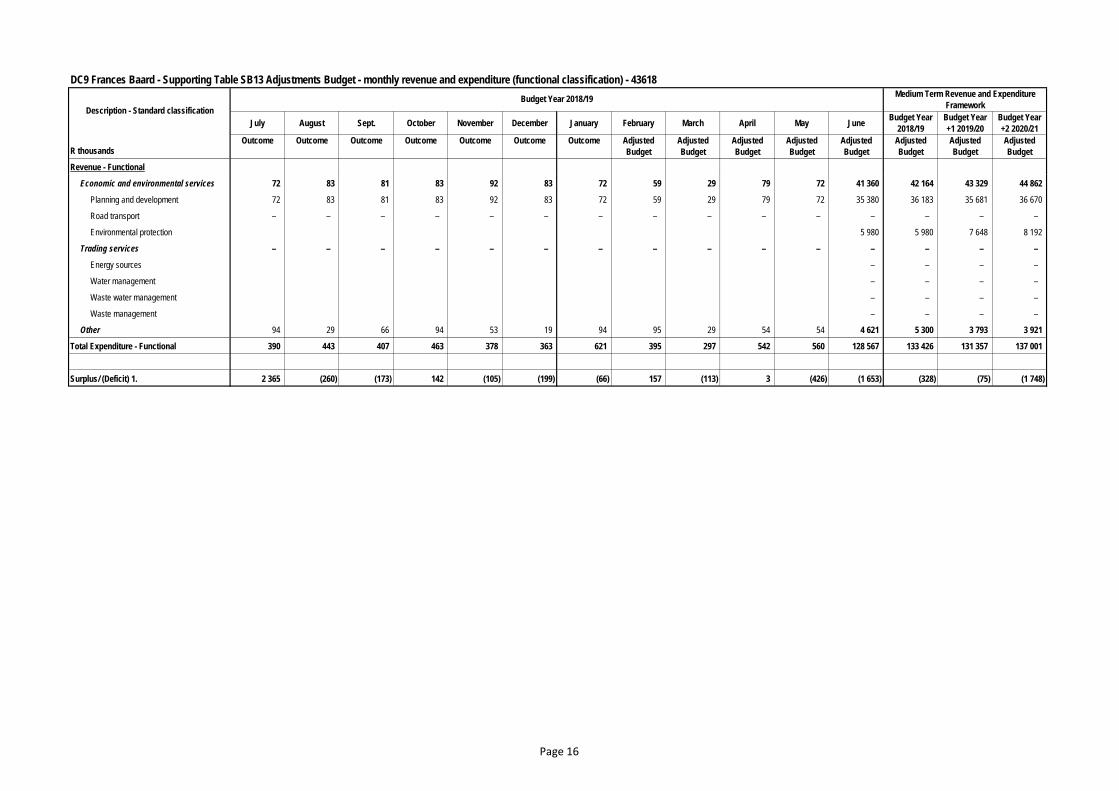
DC9 Frances Baard - Supporting Table SB13 Adjustments Budget - monthly revenue and expenditure (functional classification) - 43618
Medium Term Revenue and Expenditure
Framework
July August Sept. October November December January February March April May JuneBudget Year
2018/19
Budget Year
+1 2019/20
Budget Year
+2 2020/21
R thousandsOutcome Outcome Outcome Outcome Outcome Outcome Outcome Adjusted
Budget
Adjusted
Budget
Adjusted
Budget
Adjusted
Budget
Adjusted
Budget
Adjusted
Budget
Adjusted
Budget
Adjusted
Budget
Revenue - Functional
Description - Standard classification
Budget Year 2018/19
Economic and environmental services 72 83 81 83 92 83 72 59 29 79 72 41 360 42 164 43 329 44 862
Planning and development 72 83 81 83 92 83 72 59 29 79 72 35 380 36 183 35 681 36 670
Road transport – – – – – – – – – – – – – – –
Environmental protection 5 980 5 980 7 648 8 192
Trading services – – – – – – – – – – – – – – –
Energy sources – – – –
Water management – – – –
Waste water management – – – –
Waste management – – – –
Other 94 29 66 94 53 19 94 95 29 54 54 4 621 5 300 3 793 3 921
Total Expenditure - Functional 390 443 407 463 378 363 621 395 297 542 560 128 567 133 426 131 357 137 001
Surplus/ (Deficit) 1. 2 365 (260) (173) 142 (105) (199) (66) 157 (113) 3 (426) (1 653) (328) (75) (1 748)
Page 16
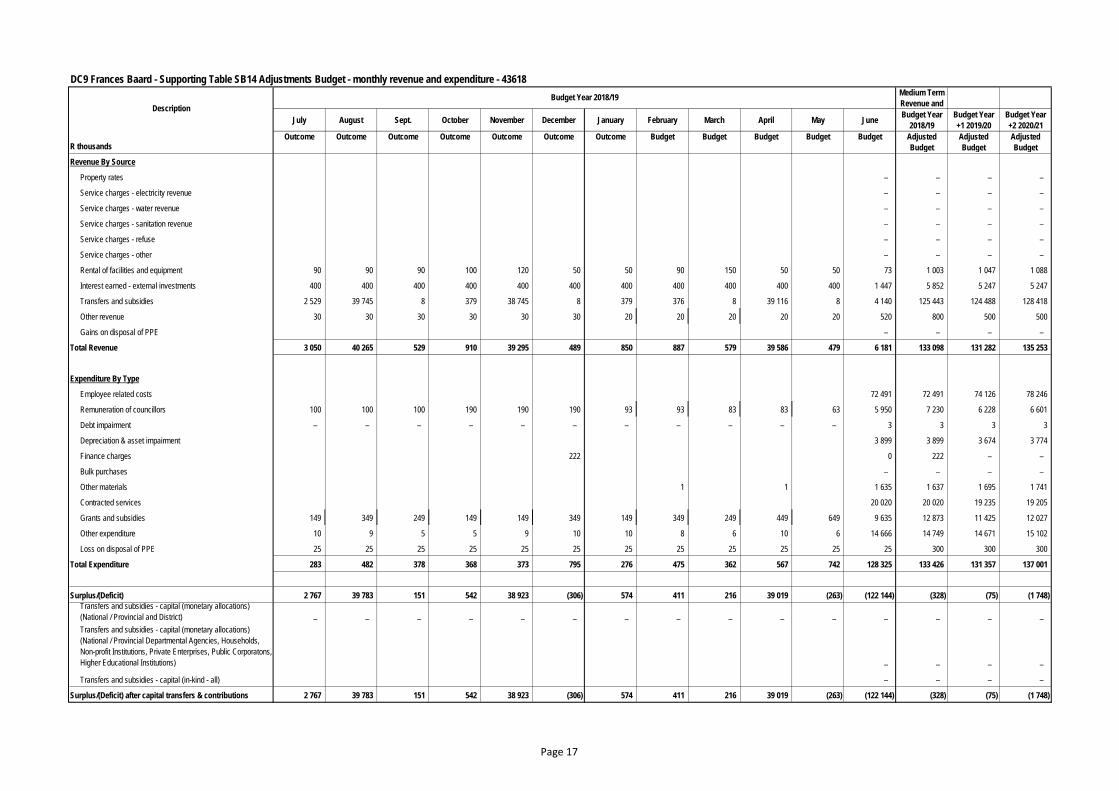
DC9 Frances Baard - Supporting Table SB14 Adjustments Budget - monthly revenue and expenditure - 43618
Medium Term
Revenue and
July August Sept. October November December January February March April May JuneBudget Year
2018/19
Budget Year
+1 2019/20
Budget Year
+2 2020/21
R thousandsOutcome Outcome Outcome Outcome Outcome Outcome Outcome Budget Budget Budget Budget Budget Adjusted
Budget
Adjusted
Budget
Adjusted
Budget
Revenue By Source
Property rates – – – –
Service charges - electricity revenue – – – –
Service charges - water revenue – – – –
Service charges - sanitation revenue – – – –
Service charges - refuse – – – –
Service charges - other – – – –
Rental of facilities and equipment 90 90 90 100 120 50 50 90 150 50 50 73 1 003 1 047 1 088
Interest earned - external investments 400 400 400 400 400 400 400 400 400 400 400 1 447 5 852 5 247 5 247
Transfers and subsidies 2 529 39 745 8 379 38 745 8 379 376 8 39 116 8 4 140 125 443 124 488 128 418
Other revenue 30 30 30 30 30 30 20 20 20 20 20 520 800 500 500
Gains on disposal of PPE – – – –
Total Revenue 3 050 40 265 529 910 39 295 489 850 887 579 39 586 479 6 181 133 098 131 282 135 253
Expenditure By Type
Employee related costs 72 491 72 491 74 126 78 246
Remuneration of councillors 100 100 100 190 190 190 93 93 83 83 63 5 950 7 230 6 228 6 601
Debt impairment – – – – – – – – – – – 3 3 3 3
Depreciation & asset impairment 3 899 3 899 3 674 3 774
Finance charges 222 0 222 – –
Bulk purchases – – – –
Other materials 1 1 1 635 1 637 1 695 1 741
Contracted services 20 020 20 020 19 235 19 205
Grants and subsidies 149 349 249 149 149 349 149 349 249 449 649 9 635 12 873 11 425 12 027
Other expenditure 10 9 5 5 9 10 10 8 6 10 6 14 666 14 749 14 671 15 102
Loss on disposal of PPE 25 25 25 25 25 25 25 25 25 25 25 25 300 300 300
Total Expenditure 283 482 378 368 373 795 276 475 362 567 742 128 325 133 426 131 357 137 001
Surplus/(Deficit) 2 767 39 783 151 542 38 923 (306) 574 411 216 39 019 (263) (122 144) (328) (75) (1 748)
Transfers and subsidies - capital (monetary allocations)
(National / Provincial and District) – – – – – – – – – – – – – – –
Transfers and subsidies - capital (monetary allocations)
(National / Provincial Departmental Agencies, Households,
Non-profit Institutions, Private Enterprises, Public Corporatons,
Higher Educational Institutions) – – – –
Transfers and subsidies - capital (in-kind - all) – – – –
Surplus/(Deficit) after capital transfers & contributions 2 767 39 783 151 542 38 923 (306) 574 411 216 39 019 (263) (122 144) (328) (75) (1 748)
Description
Budget Year 2018/19
Page 17
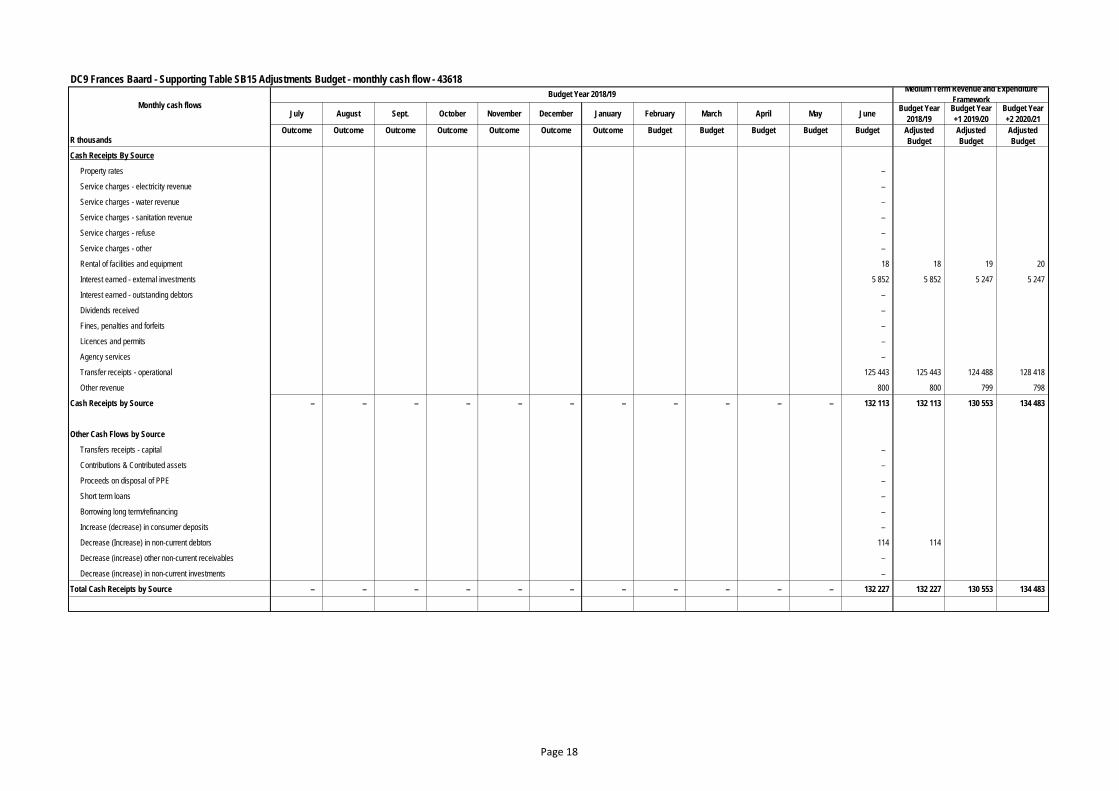
DC9 Frances Baard - Supporting Table SB15 Adjustments Budget - monthly cash flow - 43618
July August Sept. October November December January February March April May JuneBudget Year
2018/19
Budget Year
+1 2019/20
Budget Year
+2 2020/21
R thousandsOutcome Outcome Outcome Outcome Outcome Outcome Outcome Budget Budget Budget Budget Budget Adjusted
Budget
Adjusted
Budget
Adjusted
Budget
Cash Receipts By Source
Property rates –
Service charges - electricity revenue –
Service charges - water revenue –
Service charges - sanitation revenue –
Service charges - refuse –
Service charges - other –
Rental of facilities and equipment 18 18 19 20
Interest earned - external investments 5 852 5 852 5 247 5 247
Interest earned - outstanding debtors –
Dividends received –
Fines, penalties and forfeits –
Licences and permits –
Agency services –
Transfer receipts - operational 125 443 125 443 124 488 128 418
Other revenue 800 800 799 798
Cash Receipts by Source – – – – – – – – – – – 132 113 132 113 130 553 134 483
Other Cash Flows by Source
Transfers receipts - capital –
Contributions & Contributed assets –
Proceeds on disposal of PPE –
Short term loans –
Borrowing long term/refinancing –
Increase (decrease) in consumer deposits –
Decrease (Increase) in non-current debtors 114 114
Decrease (increase) other non-current receivables –
Decrease (increase) in non-current investments –
Total Cash Receipts by Source – – – – – – – – – – – 132 227 132 227 130 553 134 483
Monthly cash flows
Budget Year 2018/19Medium Term Revenue and Expenditure
Framework
Page 18
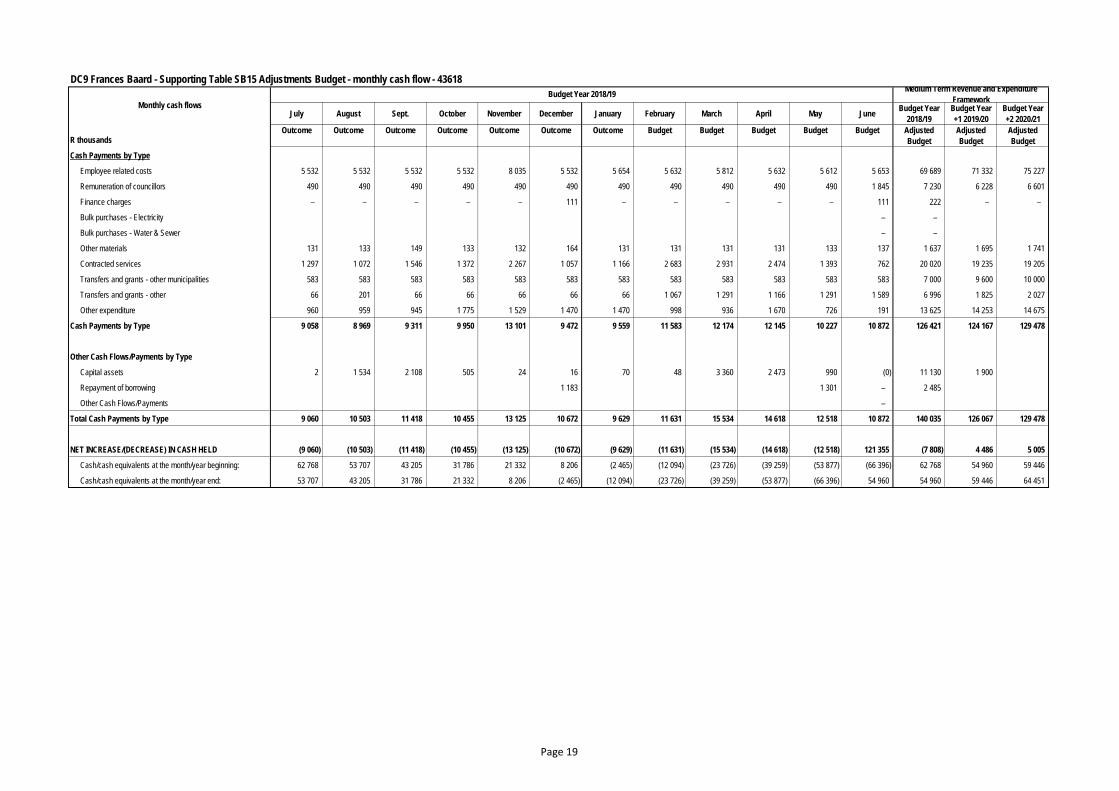
DC9 Frances Baard - Supporting Table SB15 Adjustments Budget - monthly cash flow - 43618
July August Sept. October November December January February March April May JuneBudget Year
2018/19
Budget Year
+1 2019/20
Budget Year
+2 2020/21
R thousandsOutcome Outcome Outcome Outcome Outcome Outcome Outcome Budget Budget Budget Budget Budget Adjusted
Budget
Adjusted
Budget
Adjusted
Budget
Monthly cash flows
Budget Year 2018/19Medium Term Revenue and Expenditure
Framework
Cash Payments by Type
Employee related costs 5 532 5 532 5 532 5 532 8 035 5 532 5 654 5 632 5 812 5 632 5 612 5 653 69 689 71 332 75 227
Remuneration of councillors 490 490 490 490 490 490 490 490 490 490 490 1 845 7 230 6 228 6 601
Finance charges – – – – – 111 – – – – – 111 222 – –
Bulk purchases - Electricity – –
Bulk purchases - Water & Sewer – –
Other materials 131 133 149 133 132 164 131 131 131 131 133 137 1 637 1 695 1 741
Contracted services 1 297 1 072 1 546 1 372 2 267 1 057 1 166 2 683 2 931 2 474 1 393 762 20 020 19 235 19 205
Transfers and grants - other municipalities 583 583 583 583 583 583 583 583 583 583 583 583 7 000 9 600 10 000
Transfers and grants - other 66 201 66 66 66 66 66 1 067 1 291 1 166 1 291 1 589 6 996 1 825 2 027
Other expenditure 960 959 945 1 775 1 529 1 470 1 470 998 936 1 670 726 191 13 625 14 253 14 675
Cash Payments by Type 9 058 8 969 9 311 9 950 13 101 9 472 9 559 11 583 12 174 12 145 10 227 10 872 126 421 124 167 129 478
Other Cash Flows/Payments by Type
Capital assets 2 1 534 2 108 505 24 16 70 48 3 360 2 473 990 (0) 11 130 1 900
Repayment of borrowing 1 183 1 301 – 2 485
Other Cash Flows/Payments –
Total Cash Payments by Type 9 060 10 503 11 418 10 455 13 125 10 672 9 629 11 631 15 534 14 618 12 518 10 872 140 035 126 067 129 478
NET INCREASE/(DECREASE) IN CASH HELD (9 060) (10 503) (11 418) (10 455) (13 125) (10 672) (9 629) (11 631) (15 534) (14 618) (12 518) 121 355 (7 808) 4 486 5 005
Cash/cash equivalents at the month/year beginning: 62 768 53 707 43 205 31 786 21 332 8 206 (2 465) (12 094) (23 726) (39 259) (53 877) (66 396) 62 768 54 960 59 446
Cash/cash equivalents at the month/year end: 53 707 43 205 31 786 21 332 8 206 (2 465) (12 094) (23 726) (39 259) (53 877) (66 396) 54 960 54 960 59 446 64 451
Page 19
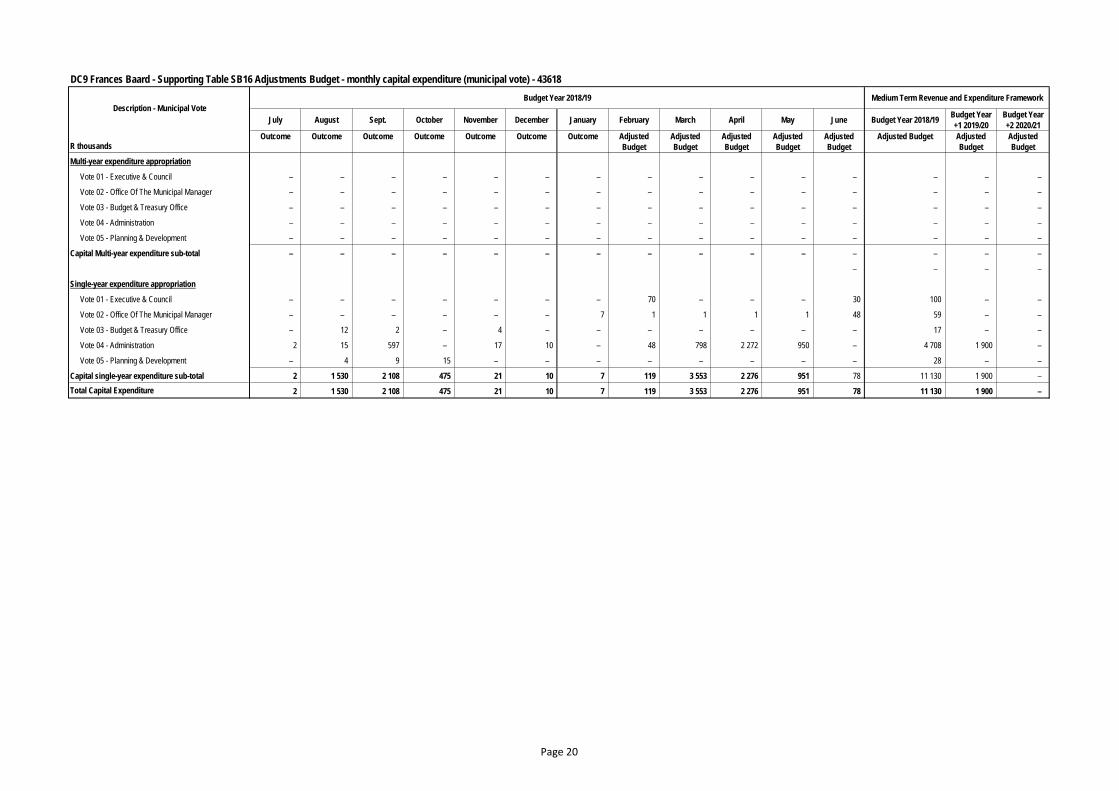
DC9 Frances Baard - Supporting Table SB16 Adjustments Budget - monthly capital expenditure (municipal vote) - 43618
Budget Year 2018/19 Medium Term Revenue and Expenditure Framework
July August Sept. October November December January February March April May June Budget Year 2018/19Budget Year
+1 2019/20
Budget Year
+2 2020/21
R thousandsOutcome Outcome Outcome Outcome Outcome Outcome Outcome Adjusted
Budget
Adjusted
Budget
Adjusted
Budget
Adjusted
Budget
Adjusted
Budget
Adjusted Budget Adjusted
Budget
Adjusted
Budget
Multi-year expenditure appropriation
Vote 01 - Executive & Council – – – – – – – – – – – – – – –
Vote 02 - Office Of The Municipal Manager – – – – – – – – – – – – – – –
Vote 03 - Budget & Treasury Office – – – – – – – – – – – – – – –
Vote 04 - Administration – – – – – – – – – – – – – – –
Vote 05 - Planning & Development – – – – – – – – – – – – – – –
Capital Multi-year expenditure sub-total – – – – – – – – – – – – – – –
– – – –
Single-year expenditure appropriation
Vote 01 - Executive & Council – – – – – – – 70 – – – 30 100 – –
Vote 02 - Office Of The Municipal Manager – – – – – – 7 1 1 1 1 48 59 – –
Vote 03 - Budget & Treasury Office – 12 2 – 4 – – – – – – – 17 – –
Vote 04 - Administration 2 15 597 – 17 10 – 48 798 2 272 950 – 4 708 1 900 –
Vote 05 - Planning & Development – 4 9 15 – – – – – – – – 28 – –
Capital single-year expenditure sub-total 2 1 530 2 108 475 21 10 7 119 3 553 2 276 951 78 11 130 1 900 –
Total Capital Expenditure 2 1 530 2 108 475 21 10 7 119 3 553 2 276 951 78 11 130 1 900 –
Description - Municipal Vote
Page 20
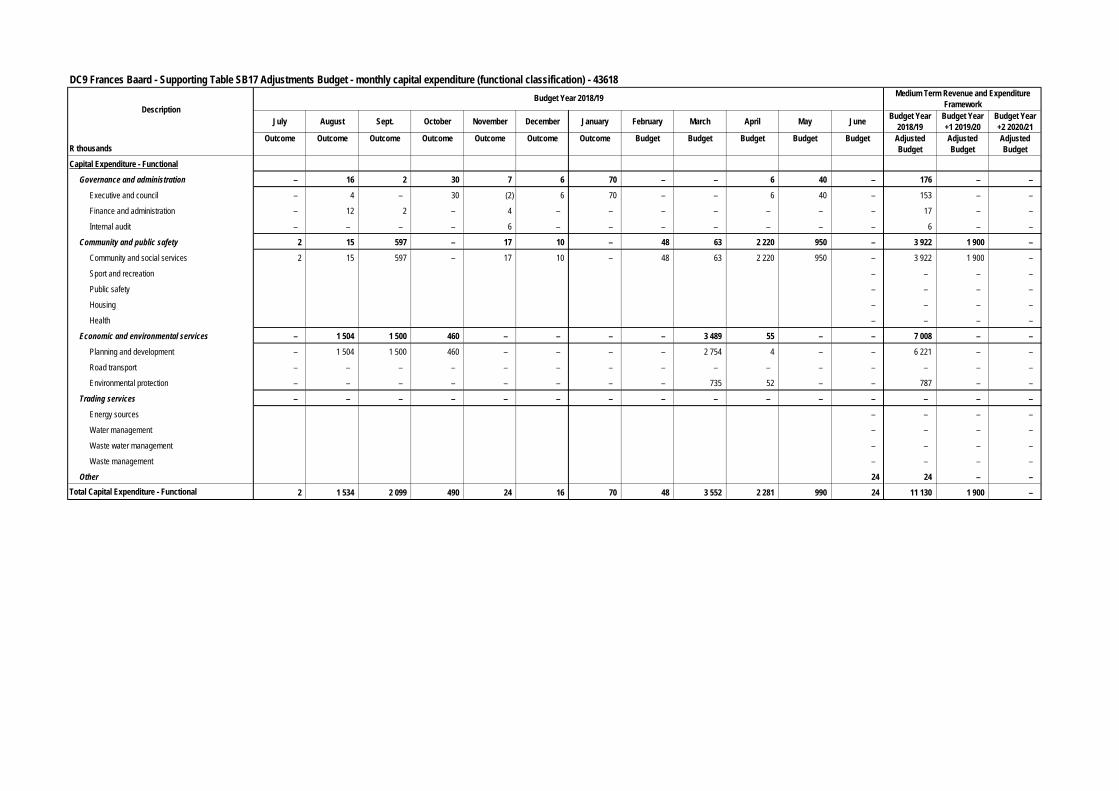
DC9 Frances Baard - Supporting Table SB17 Adjustments Budget - monthly capital expenditure (functional classification) - 43618
Medium Term Revenue and Expenditure
Framework
July August Sept. October November December January February March April May JuneBudget Year
2018/19
Budget Year
+1 2019/20
Budget Year
+2 2020/21
R thousandsOutcome Outcome Outcome Outcome Outcome Outcome Outcome Budget Budget Budget Budget Budget Adjusted
Budget
Adjusted
Budget
Adjusted
Budget
Capital Expenditure - Functional
Governance and administration – 16 2 30 7 6 70 – – 6 40 – 176 – –
Executive and council – 4 – 30 (2) 6 70 – – 6 40 – 153 – –
Finance and administration – 12 2 – 4 – – – – – – – 17 – –
Internal audit – – – – 6 – – – – – – – 6 – –
Community and public safety 2 15 597 – 17 10 – 48 63 2 220 950 – 3 922 1 900 –
Community and social services 2 15 597 – 17 10 – 48 63 2 220 950 – 3 922 1 900 –
Sport and recreation – – – –
Public safety – – – –
Housing – – – –
Health – – – –
Economic and environmental services – 1 504 1 500 460 – – – – 3 489 55 – – 7 008 – –
Planning and development – 1 504 1 500 460 – – – – 2 754 4 – – 6 221 – –
Road transport – – – – – – – – – – – – – – –
Environmental protection – – – – – – – – 735 52 – – 787 – –
Trading services – – – – – – – – – – – – – – –
Energy sources – – – –
Water management – – – –
Waste water management – – – –
Waste management – – – –
Other 24 24 – –
Total Capital Expenditure - Functional 2 1 534 2 099 490 24 16 70 48 3 552 2 281 990 24 11 130 1 900 –
Description
Budget Year 2018/19
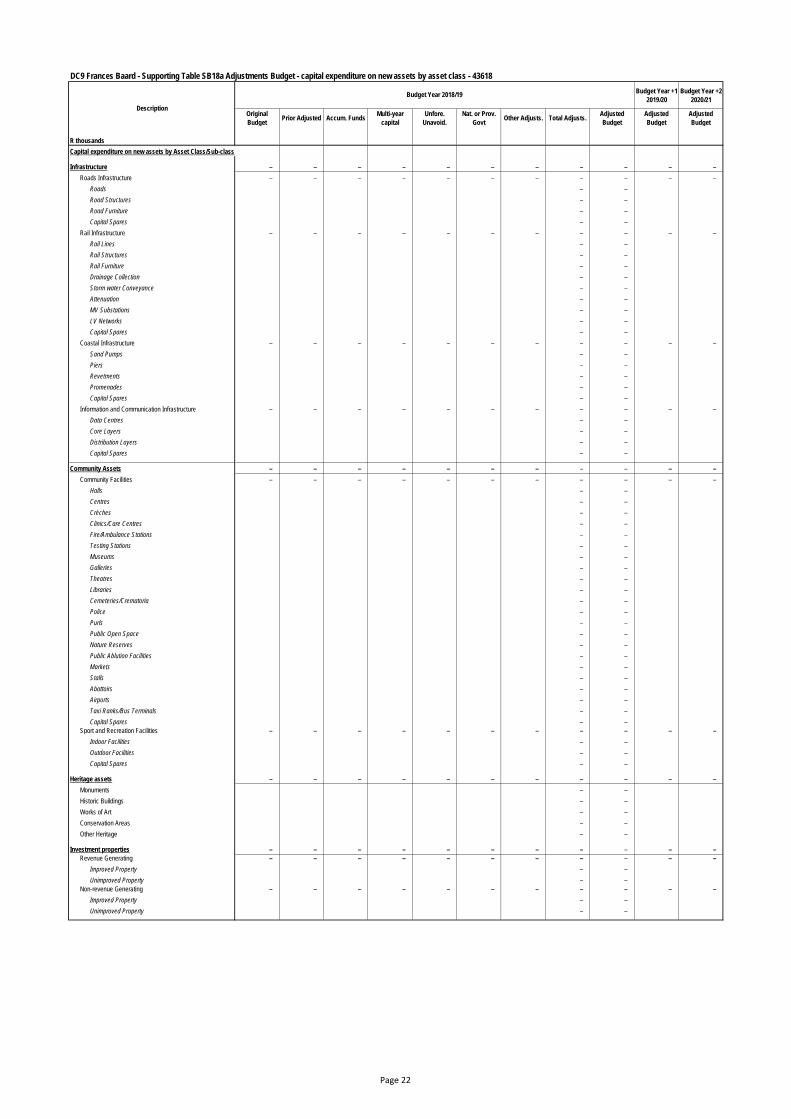
DC9 Frances Baard - Supporting Table SB18a Adjustments Budget - capital expenditure on new assets by asset class - 43618
Budget Year +1
2019/20
Budget Year +2
2020/21
Original
BudgetPrior Adjusted Accum. Funds
Multi-year
capital
Unfore.
Unavoid.
Nat. or Prov.
GovtOther Adjusts. Total Adjusts.
Adjusted
Budget
Adjusted
Budget
Adjusted
Budget
R thousands
Capital expenditure on new assets by Asset Class/Sub-class
Infrastructure – – – – – – – – – – –
Roads Infrastructure – – – – – – – – – – –
Roads – –
Road Structures – –
Road Furniture – –
Capital Spares – –
Rail Infrastructure – – – – – – – – – – –
Rail Lines – –
Rail Structures – –
Rail Furniture – –
Drainage Collection – –
Storm water Conveyance – –
Attenuation – –
MV Substations – –
LV Networks – –
Capital Spares – –
Coastal Infrastructure – – – – – – – – – – –
Sand Pumps – –
Piers – –
Revetments – –
Promenades – –
Capital Spares – –
Information and Communication Infrastructure – – – – – – – – – – –
Data Centres – –
Core Layers – –
Distribution Layers – –
Capital Spares – –
Community Assets – – – – – – – – – – –
Community Facilities – – – – – – – – – – –
Halls – –
Centres – –
Crèches – –
Clinics/Care Centres – –
Fire/Ambulance Stations – –
Testing Stations – –
Museums – –
Galleries – –
Theatres – –
Libraries – –
Cemeteries/Crematoria – –
Police – –
Purls – –
Public Open Space – –
Nature Reserves – –
Public Ablution Facilities – –
Markets – –
Stalls – –
Abattoirs – –
Airports – –
Taxi Ranks/Bus Terminals – –
Capital Spares – –
Sport and Recreation Facilities – – – – – – – – – – –
Indoor Facilities – –
Outdoor Facilities – –
Capital Spares – –
Heritage assets – – – – – – – – – – –
Monuments – –
Historic Buildings – –
Works of Art – –
Conservation Areas – –
Other Heritage – –
Investment properties – – – – – – – – – – –
Revenue Generating – – – – – – – – – – –
Improved Property – –
Unimproved Property – –
Non-revenue Generating – – – – – – – – – – –
Improved Property – –
Unimproved Property – –
Description
Budget Year 2018/19
Page 22
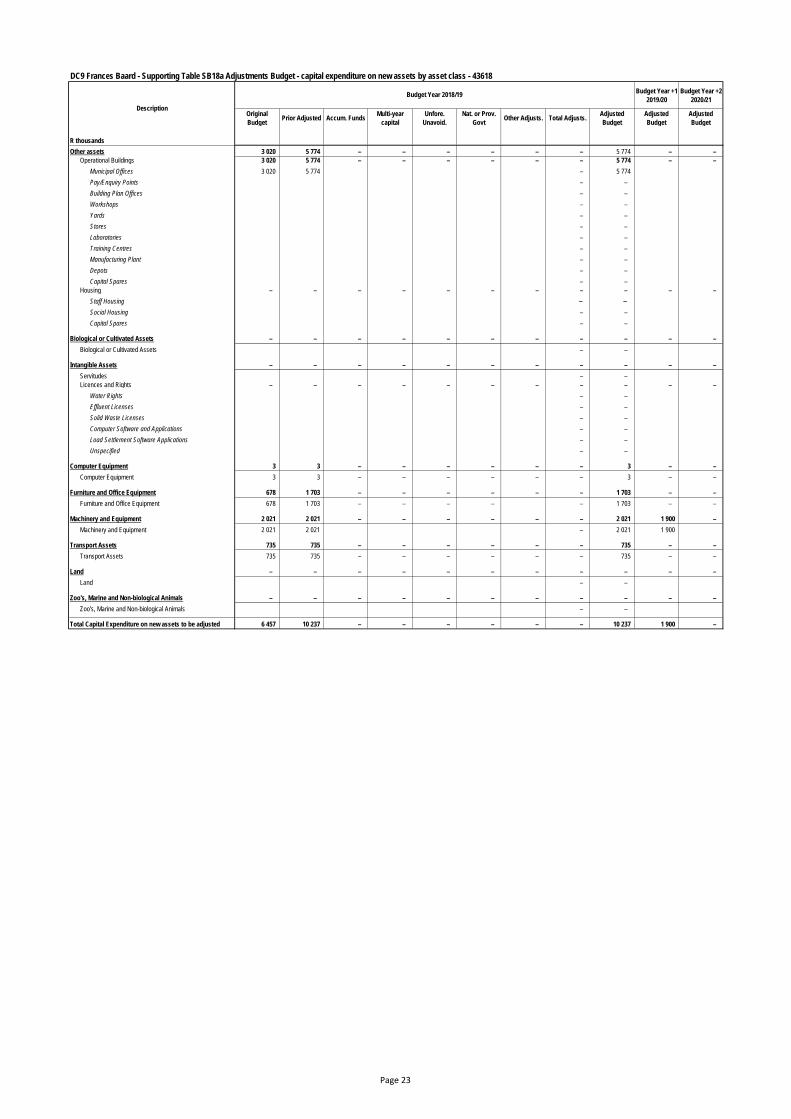
DC9 Frances Baard - Supporting Table SB18a Adjustments Budget - capital expenditure on new assets by asset class - 43618
Budget Year +1
2019/20
Budget Year +2
2020/21
Original
BudgetPrior Adjusted Accum. Funds
Multi-year
capital
Unfore.
Unavoid.
Nat. or Prov.
GovtOther Adjusts. Total Adjusts.
Adjusted
Budget
Adjusted
Budget
Adjusted
Budget
R thousands
Description
Budget Year 2018/19
Other assets 3 020 5 774 – – – – – – 5 774 – –
Operational Buildings 3 020 5 774 – – – – – – 5 774 – –
Municipal Offices 3 020 5 774 – 5 774
Pay/Enquiry Points – –
Building Plan Offices – –
Workshops – –
Yards – –
Stores – –
Laboratories – –
Training Centres – –
Manufacturing Plant – –
Depots – –
Capital Spares – –
Housing – – – – – – – – – – –
Staff Housing – –
Social Housing – –
Capital Spares – –
Biological or Cultivated Assets – – – – – – – – – – –
Biological or Cultivated Assets – –
Intangible Assets – – – – – – – – – – –
Servitudes – –
Licences and Rights – – – – – – – – – – –
Water Rights – –
Effluent Licenses – –
Solid Waste Licenses – –
Computer Software and Applications – –
Load Settlement Software Applications – –
Unspecified – –
Computer Equipment 3 3 – – – – – – 3 – –
Computer Equipment 3 3 – – – – – – 3 – –
Furniture and Office Equipment 678 1 703 – – – – – – 1 703 – –
Furniture and Office Equipment 678 1 703 – – – – – 1 703 – –
Machinery and Equipment 2 021 2 021 – – – – – – 2 021 1 900 –
Machinery and Equipment 2 021 2 021 – 2 021 1 900
Transport Assets 735 735 – – – – – – 735 – –
Transport Assets 735 735 – – – – – – 735 – –
Land – – – – – – – – – – –
Land – –
Zoo's, Marine and Non-biological Animals – – – – – – – – – – –
Zoo's, Marine and Non-biological Animals – –
Total Capital Expenditure on new assets to be adjusted 6 457 10 237 – – – – – – 10 237 1 900 –
Page 23
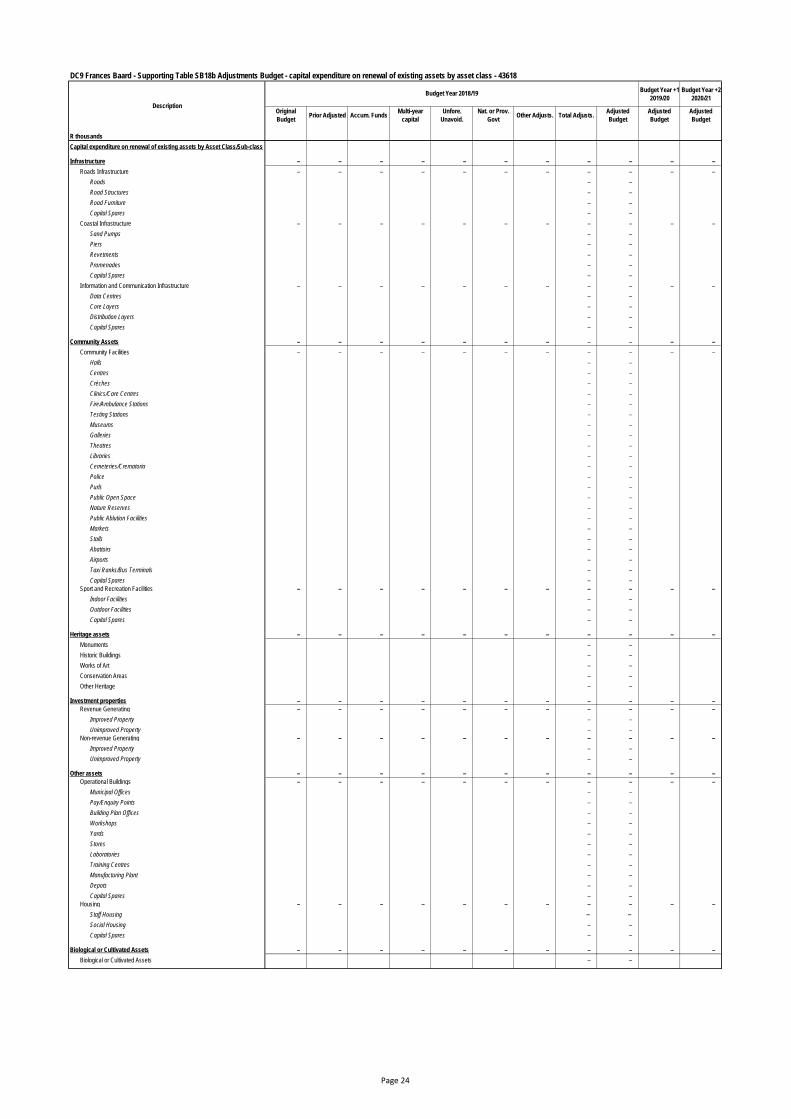
DC9 Frances Baard - Supporting Table SB18b Adjustments Budget - capital expenditure on renewal of existing assets by asset class - 43618
Budget Year +1
2019/20
Budget Year +2
2020/21
Original
BudgetPrior Adjusted Accum. Funds
Multi-year
capital
Unfore.
Unavoid.
Nat. or Prov.
GovtOther Adjusts. Total Adjusts.
Adjusted
Budget
Adjusted
Budget
Adjusted
Budget
R thousands
Capital expenditure on renewal of existing assets by Asset Class/Sub-class
Infrastructure – – – – – – – – – – –
Roads Infrastructure – – – – – – – – – – –
Roads – –
Road Structures – –
Road Furniture – –
Capital Spares – –
Coastal Infrastructure – – – – – – – – – – –
Sand Pumps – –
Piers – –
Revetments – –
Promenades – –
Capital Spares – –
Information and Communication Infrastructure – – – – – – – – – – –
Data Centres – –
Core Layers – –
Distribution Layers – –
Capital Spares – –
Community Assets – – – – – – – – – – –
Community Facilities – – – – – – – – – – –
Halls – –
Centres – –
Crèches – –
Clinics/Care Centres – –
Fire/Ambulance Stations – –
Testing Stations – –
Museums – –
Galleries – –
Theatres – –
Libraries – –
Cemeteries/Crematoria – –
Police – –
Purls – –
Public Open Space – –
Nature Reserves – –
Public Ablution Facilities – –
Markets – –
Stalls – –
Abattoirs – –
Airports – –
Taxi Ranks/Bus Terminals – –
Capital Spares – –
Sport and Recreation Facilities – – – – – – – – – – –
Indoor Facilities – –
Outdoor Facilities – –
Capital Spares – –
Heritage assets – – – – – – – – – – –
Monuments – –
Historic Buildings – –
Works of Art – –
Conservation Areas – –
Other Heritage – –
Investment properties – – – – – – – – – – –
Revenue Generating – – – – – – – – – – –
Improved Property – –
Unimproved Property – –
Non-revenue Generating – – – – – – – – – – –
Improved Property – –
Unimproved Property – –
Other assets – – – – – – – – – – –
Operational Buildings – – – – – – – – – – –
Municipal Offices – –
Pay/Enquiry Points – –
Building Plan Offices – –
Workshops – –
Yards – –
Stores – –
Laboratories – –
Training Centres – –
Manufacturing Plant – –
Depots – –
Capital Spares – –
Housing – – – – – – – – – – –
Staff Housing – –
Social Housing – –
Capital Spares – –
Biological or Cultivated Assets – – – – – – – – – – –
Biological or Cultivated Assets – –
Description
Budget Year 2018/19
Page 24
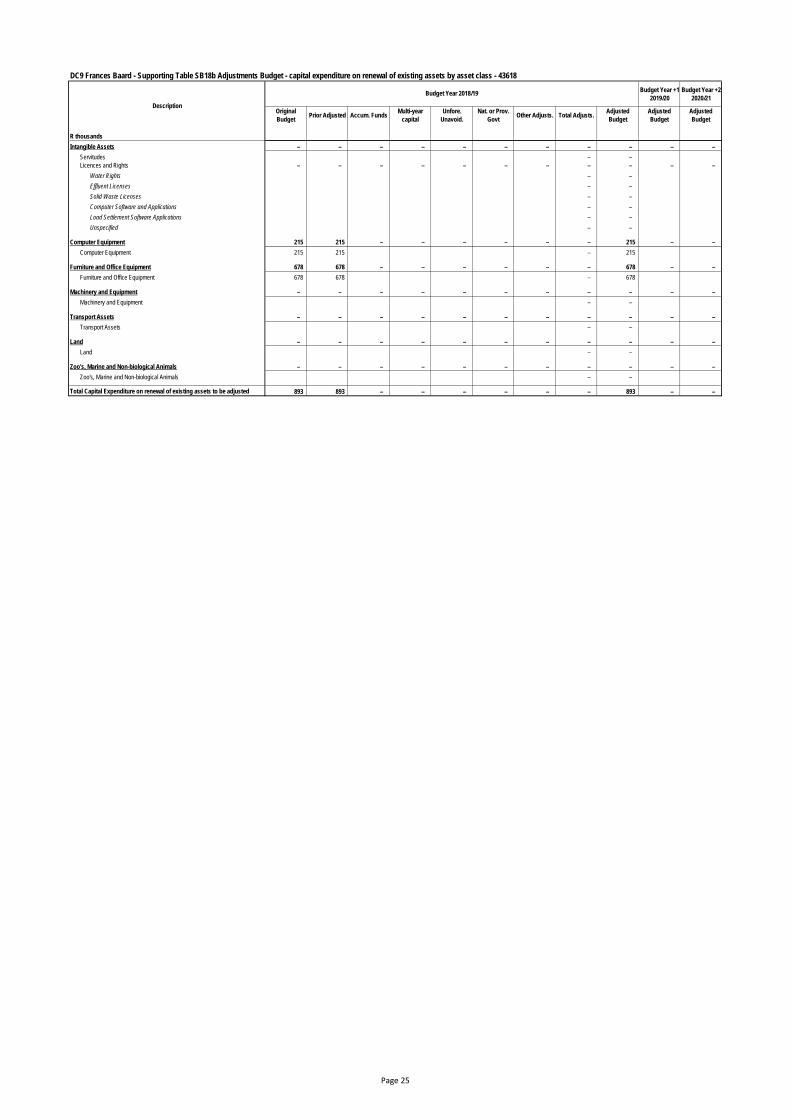
DC9 Frances Baard - Supporting Table SB18b Adjustments Budget - capital expenditure on renewal of existing assets by asset class - 43618
Budget Year +1
2019/20
Budget Year +2
2020/21
Original
BudgetPrior Adjusted Accum. Funds
Multi-year
capital
Unfore.
Unavoid.
Nat. or Prov.
GovtOther Adjusts. Total Adjusts.
Adjusted
Budget
Adjusted
Budget
Adjusted
Budget
R thousands
Description
Budget Year 2018/19
Intangible Assets – – – – – – – – – – –
Servitudes – –
Licences and Rights – – – – – – – – – – –
Water Rights – –
Effluent Licenses – –
Solid Waste Licenses – –
Computer Software and Applications – –
Load Settlement Software Applications – –
Unspecified – –
Computer Equipment 215 215 – – – – – – 215 – –
Computer Equipment 215 215 – 215
Furniture and Office Equipment 678 678 – – – – – – 678 – –
Furniture and Office Equipment 678 678 – 678
Machinery and Equipment – – – – – – – – – – –
Machinery and Equipment – –
Transport Assets – – – – – – – – – – –
Transport Assets – –
Land – – – – – – – – – – –
Land – –
Zoo's, Marine and Non-biological Animals – – – – – – – – – – –
Zoo's, Marine and Non-biological Animals – –
Total Capital Expenditure on renewal of existing assets to be adjusted 893 893 – – – – – – 893 – –
Page 25
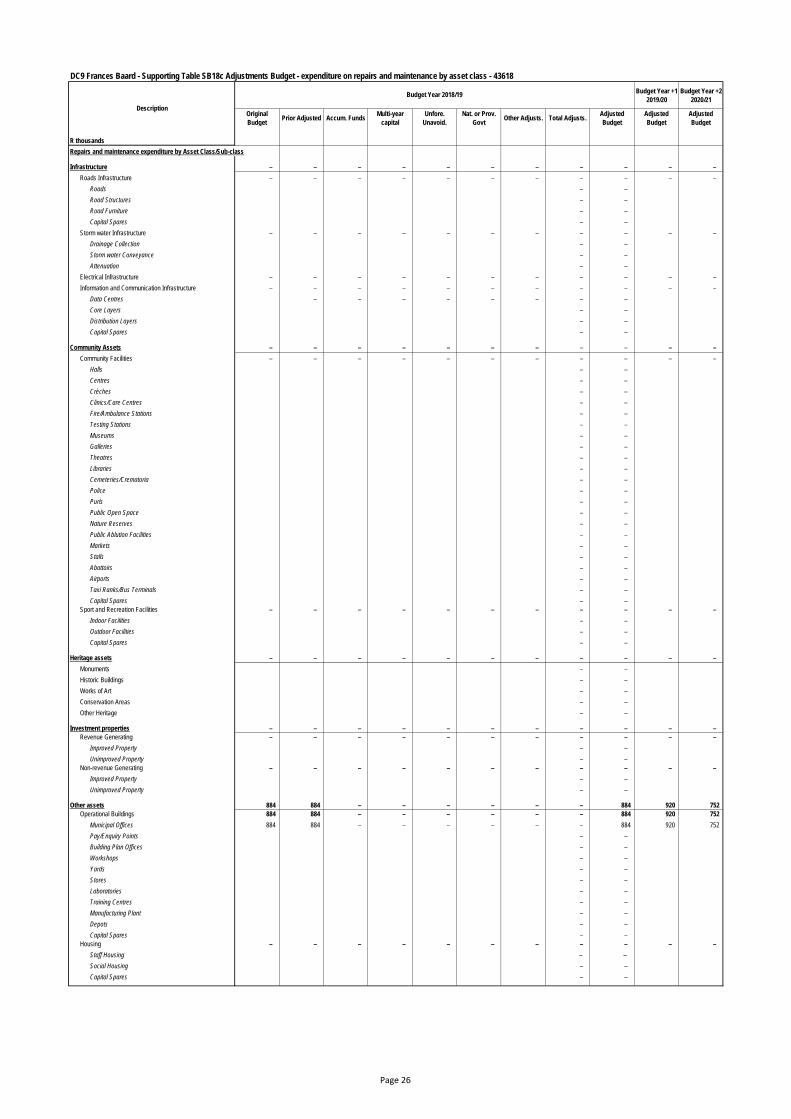
DC9 Frances Baard - Supporting Table SB18c Adjustments Budget - expenditure on repairs and maintenance by asset class - 43618
Budget Year +1
2019/20
Budget Year +2
2020/21
Original
BudgetPrior Adjusted Accum. Funds
Multi-year
capital
Unfore.
Unavoid.
Nat. or Prov.
GovtOther Adjusts. Total Adjusts.
Adjusted
Budget
Adjusted
Budget
Adjusted
Budget
R thousands
Repairs and maintenance expenditure by Asset Class/Sub-class
Infrastructure – – – – – – – – – – –
Roads Infrastructure – – – – – – – – – – –
Roads – –
Road Structures – –
Road Furniture – –
Capital Spares – –
Storm water Infrastructure – – – – – – – – – – –
Drainage Collection – –
Storm water Conveyance – –
Attenuation – –
Electrical Infrastructure – – – – – – – – – – –
Information and Communication Infrastructure – – – – – – – – – – –
Data Centres – – – – – – – –
Core Layers – –
Distribution Layers – –
Capital Spares – –
Community Assets – – – – – – – – – – –
Community Facilities – – – – – – – – – – –
Halls – –
Centres – –
Crèches – –
Clinics/Care Centres – –
Fire/Ambulance Stations – –
Testing Stations – –
Museums – –
Galleries – –
Theatres – –
Libraries – –
Cemeteries/Crematoria – –
Police – –
Purls – –
Public Open Space – –
Nature Reserves – –
Public Ablution Facilities – –
Markets – –
Stalls – –
Abattoirs – –
Airports – –
Taxi Ranks/Bus Terminals – –
Capital Spares – –
Sport and Recreation Facilities – – – – – – – – – – –
Indoor Facilities – –
Outdoor Facilities – –
Capital Spares – –
Heritage assets – – – – – – – – – – –
Monuments – –
Historic Buildings – –
Works of Art – –
Conservation Areas – –
Other Heritage – –
Investment properties – – – – – – – – – – –
Revenue Generating – – – – – – – – – – –
Improved Property – –
Unimproved Property – –
Non-revenue Generating – – – – – – – – – – –
Improved Property – –
Unimproved Property – –
Other assets 884 884 – – – – – – 884 920 752
Operational Buildings 884 884 – – – – – – 884 920 752
Municipal Offices 884 884 – – – – – – 884 920 752
Pay/Enquiry Points – –
Building Plan Offices – –
Workshops – –
Yards – –
Stores – –
Laboratories – –
Training Centres – –
Manufacturing Plant – –
Depots – –
Capital Spares – –
Housing – – – – – – – – – – –
Staff Housing – –
Social Housing – –
Capital Spares – –
Description
Budget Year 2018/19
Page 26
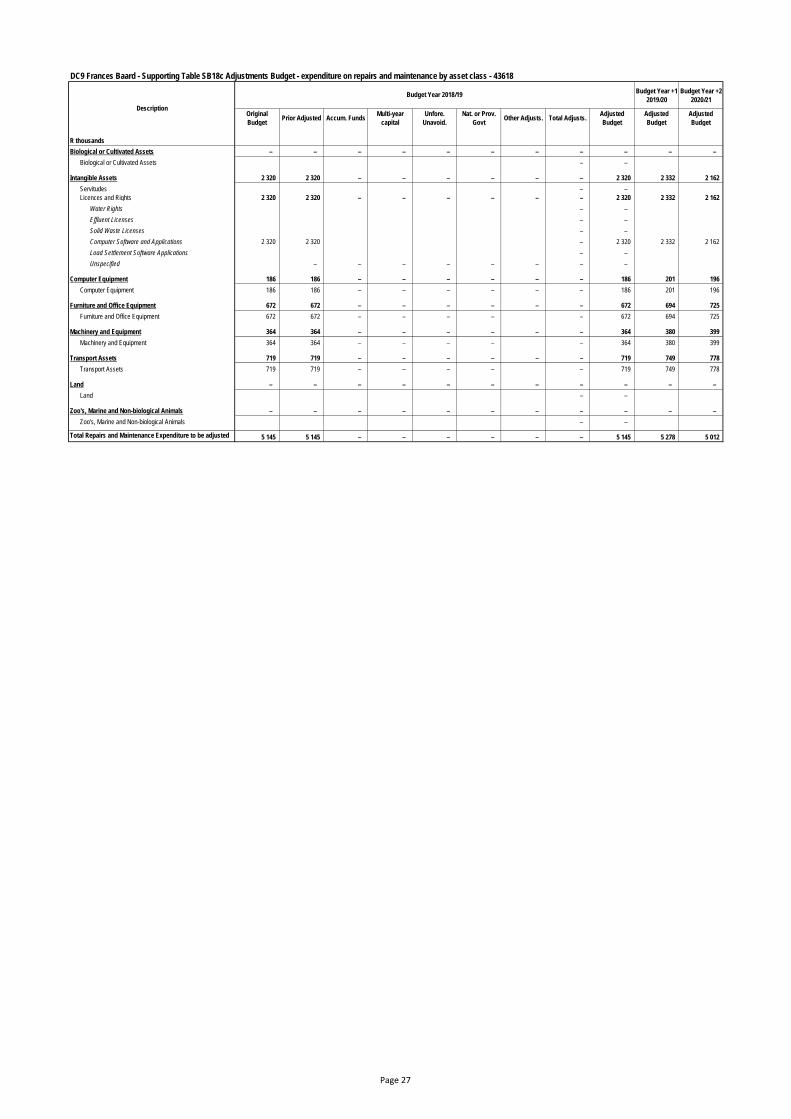
DC9 Frances Baard - Supporting Table SB18c Adjustments Budget - expenditure on repairs and maintenance by asset class - 43618
Budget Year +1
2019/20
Budget Year +2
2020/21
Original
BudgetPrior Adjusted Accum. Funds
Multi-year
capital
Unfore.
Unavoid.
Nat. or Prov.
GovtOther Adjusts. Total Adjusts.
Adjusted
Budget
Adjusted
Budget
Adjusted
Budget
R thousands
Description
Budget Year 2018/19
Biological or Cultivated Assets – – – – – – – – – – –
Biological or Cultivated Assets – –
Intangible Assets 2 320 2 320 – – – – – – 2 320 2 332 2 162
Servitudes – –
Licences and Rights 2 320 2 320 – – – – – – 2 320 2 332 2 162
Water Rights – –
Effluent Licenses – –
Solid Waste Licenses – –
Computer Software and Applications 2 320 2 320 – 2 320 2 332 2 162
Load Settlement Software Applications – –
Unspecified – – – – – – – –
Computer Equipment 186 186 – – – – – – 186 201 196
Computer Equipment 186 186 – – – – – – 186 201 196
Furniture and Office Equipment 672 672 – – – – – – 672 694 725
Furniture and Office Equipment 672 672 – – – – – 672 694 725
Machinery and Equipment 364 364 – – – – – – 364 380 399
Machinery and Equipment 364 364 – – – – – 364 380 399
Transport Assets 719 719 – – – – – – 719 749 778
Transport Assets 719 719 – – – – – 719 749 778
Land – – – – – – – – – – –
Land – –
Zoo's, Marine and Non-biological Animals – – – – – – – – – – –
Zoo's, Marine and Non-biological Animals – –
Total Repairs and Maintenance Expenditure to be adjusted 5 145 5 145 – – – – – – 5 145 5 278 5 012
Page 27
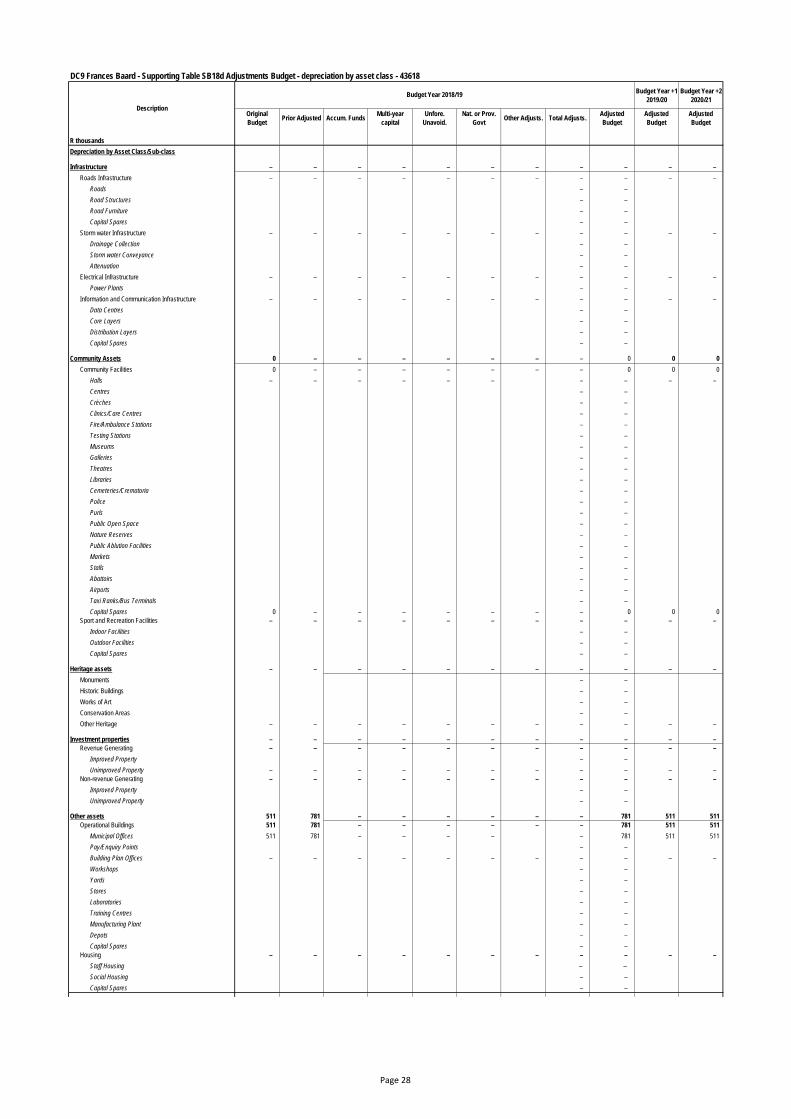
DC9 Frances Baard - Supporting Table SB18d Adjustments Budget - depreciation by asset class - 43618
Budget Year +1
2019/20
Budget Year +2
2020/21
Original
BudgetPrior Adjusted Accum. Funds
Multi-year
capital
Unfore.
Unavoid.
Nat. or Prov.
GovtOther Adjusts. Total Adjusts.
Adjusted
Budget
Adjusted
Budget
Adjusted
Budget
R thousands
Depreciation by Asset Class/Sub-class
Infrastructure – – – – – – – – – – –
Roads Infrastructure – – – – – – – – – – –
Roads – –
Road Structures – –
Road Furniture – –
Capital Spares – –
Storm water Infrastructure – – – – – – – – – – –
Drainage Collection – –
Storm water Conveyance – –
Attenuation – –
Electrical Infrastructure – – – – – – – – – – –
Power Plants – –
Information and Communication Infrastructure – – – – – – – – – – –
Data Centres – –
Core Layers – –
Distribution Layers – –
Capital Spares – –
Community Assets 0 – – – – – – – 0 0 0
Community Facilities 0 – – – – – – – 0 0 0
Halls – – – – – – – – – –
Centres – –
Crèches – –
Clinics/Care Centres – –
Fire/Ambulance Stations – –
Testing Stations – –
Museums – –
Galleries – –
Theatres – –
Libraries – –
Cemeteries/Crematoria – –
Police – –
Purls – –
Public Open Space – –
Nature Reserves – –
Public Ablution Facilities – –
Markets – –
Stalls – –
Abattoirs – –
Airports – –
Taxi Ranks/Bus Terminals – –
Capital Spares 0 – – – – – – – 0 0 0
Sport and Recreation Facilities – – – – – – – – – – –
Indoor Facilities – –
Outdoor Facilities – –
Capital Spares – –
Heritage assets – – – – – – – – – – –
Monuments – –
Historic Buildings – –
Works of Art – –
Conservation Areas – –
Other Heritage – – – – – – – – – – –
Investment properties – – – – – – – – – – –
Revenue Generating – – – – – – – – – – –
Improved Property – –
Unimproved Property – – – – – – – – – – –
Non-revenue Generating – – – – – – – – – – –
Improved Property – –
Unimproved Property – –
Other assets 511 781 – – – – – – 781 511 511
Operational Buildings 511 781 – – – – – – 781 511 511
Municipal Offices 511 781 – – – – – 781 511 511
Pay/Enquiry Points – –
Building Plan Offices – – – – – – – – – – –
Workshops – –
Yards – –
Stores – –
Laboratories – –
Training Centres – –
Manufacturing Plant – –
Depots – –
Capital Spares – –
Housing – – – – – – – – – – –
Staff Housing – –
Social Housing – –
Capital Spares – –
Description
Budget Year 2018/19
Page 28
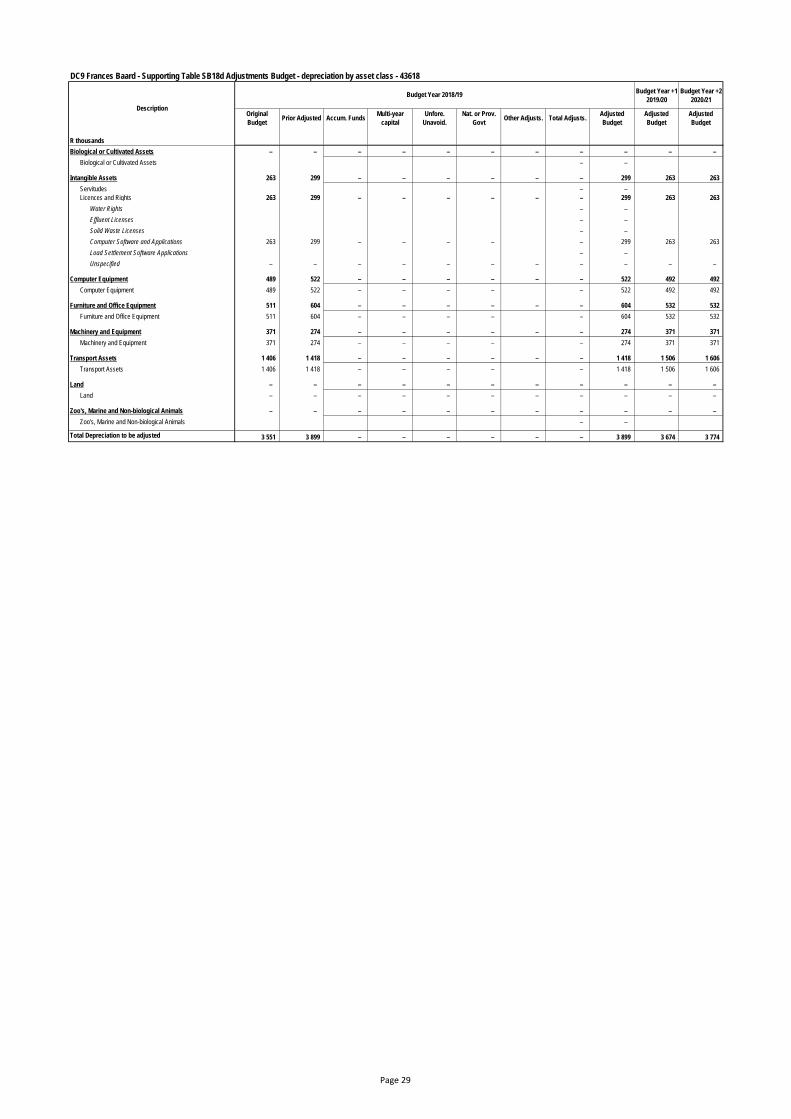
DC9 Frances Baard - Supporting Table SB18d Adjustments Budget - depreciation by asset class - 43618
Budget Year +1
2019/20
Budget Year +2
2020/21
Original
BudgetPrior Adjusted Accum. Funds
Multi-year
capital
Unfore.
Unavoid.
Nat. or Prov.
GovtOther Adjusts. Total Adjusts.
Adjusted
Budget
Adjusted
Budget
Adjusted
Budget
R thousands
Description
Budget Year 2018/19
Biological or Cultivated Assets – – – – – – – – – – –
Biological or Cultivated Assets – –
Intangible Assets 263 299 – – – – – – 299 263 263
Servitudes – –
Licences and Rights 263 299 – – – – – – 299 263 263
Water Rights – –
Effluent Licenses – –
Solid Waste Licenses – –
Computer Software and Applications 263 299 – – – – – 299 263 263
Load Settlement Software Applications – –
Unspecified – – – – – – – – – – –
Computer Equipment 489 522 – – – – – – 522 492 492
Computer Equipment 489 522 – – – – – 522 492 492
Furniture and Office Equipment 511 604 – – – – – – 604 532 532
Furniture and Office Equipment 511 604 – – – – – 604 532 532
Machinery and Equipment 371 274 – – – – – – 274 371 371
Machinery and Equipment 371 274 – – – – – 274 371 371
Transport Assets 1 406 1 418 – – – – – – 1 418 1 506 1 606
Transport Assets 1 406 1 418 – – – – – 1 418 1 506 1 606
Land – – – – – – – – – – –
Land – – – – – – – – – – –
Zoo's, Marine and Non-biological Animals – – – – – – – – – – –
Zoo's, Marine and Non-biological Animals – –
Total Depreciation to be adjusted 3 551 3 899 – – – – – – 3 899 3 674 3 774
Page 29
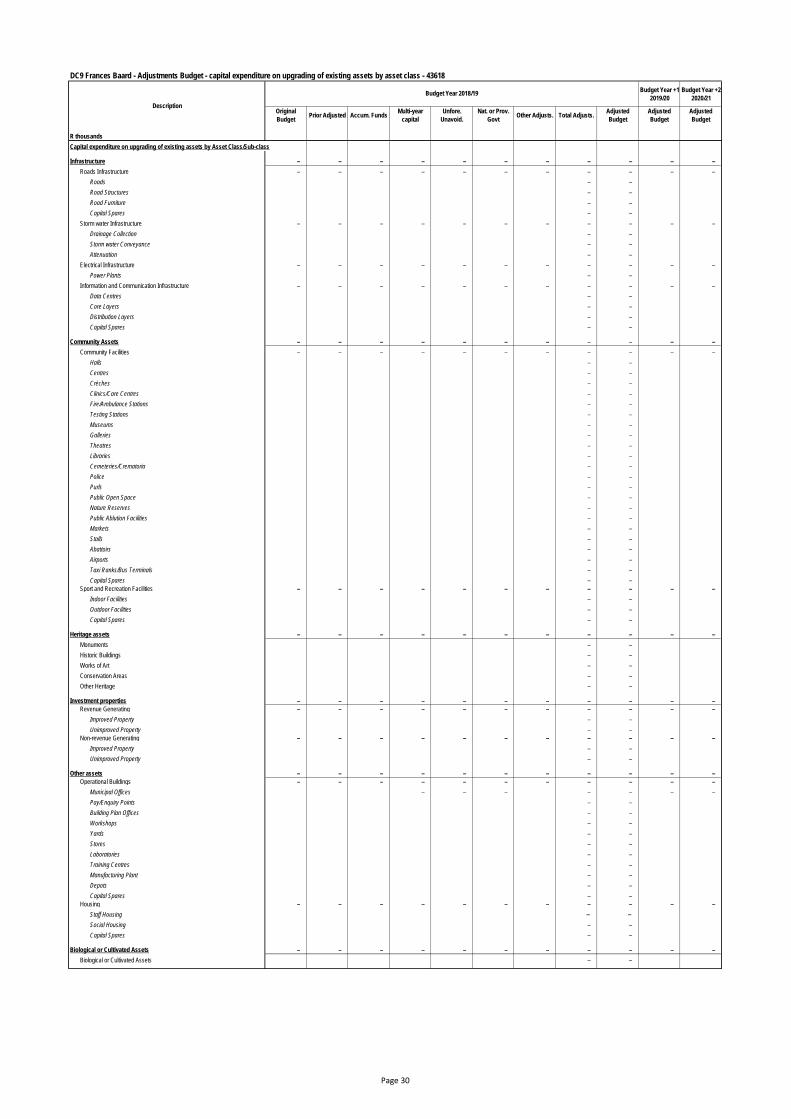
DC9 Frances Baard - Adjustments Budget - capital expenditure on upgrading of existing assets by asset class - 43618
Budget Year +1
2019/20
Budget Year +2
2020/21
Original
BudgetPrior Adjusted Accum. Funds
Multi-year
capital
Unfore.
Unavoid.
Nat. or Prov.
GovtOther Adjusts. Total Adjusts.
Adjusted
Budget
Adjusted
Budget
Adjusted
Budget
R thousands
Capital expenditure on upgrading of existing assets by Asset Class/Sub-class
Infrastructure – – – – – – – – – – –
Roads Infrastructure – – – – – – – – – – –
Roads – –
Road Structures – –
Road Furniture – –
Capital Spares – –
Storm water Infrastructure – – – – – – – – – – –
Drainage Collection – –
Storm water Conveyance – –
Attenuation – –
Electrical Infrastructure – – – – – – – – – – –
Power Plants – –
Information and Communication Infrastructure – – – – – – – – – – –
Data Centres – –
Core Layers – –
Distribution Layers – –
Capital Spares – –
Community Assets – – – – – – – – – – –
Community Facilities – – – – – – – – – – –
Halls – –
Centres – –
Crèches – –
Clinics/Care Centres – –
Fire/Ambulance Stations – –
Testing Stations – –
Museums – –
Galleries – –
Theatres – –
Libraries – –
Cemeteries/Crematoria – –
Police – –
Purls – –
Public Open Space – –
Nature Reserves – –
Public Ablution Facilities – –
Markets – –
Stalls – –
Abattoirs – –
Airports – –
Taxi Ranks/Bus Terminals – –
Capital Spares – –
Sport and Recreation Facilities – – – – – – – – – – –
Indoor Facilities – –
Outdoor Facilities – –
Capital Spares – –
Heritage assets – – – – – – – – – – –
Monuments – –
Historic Buildings – –
Works of Art – –
Conservation Areas – –
Other Heritage – –
Investment properties – – – – – – – – – – –
Revenue Generating – – – – – – – – – – –
Improved Property – –
Unimproved Property – –
Non-revenue Generating – – – – – – – – – – –
Improved Property – –
Unimproved Property – –
Other assets – – – – – – – – – – –
Operational Buildings – – – – – – – – – – –
Municipal Offices – – – – – – –
Pay/Enquiry Points – –
Building Plan Offices – –
Workshops – –
Yards – –
Stores – –
Laboratories – –
Training Centres – –
Manufacturing Plant – –
Depots – –
Capital Spares – –
Housing – – – – – – – – – – –
Staff Housing – –
Social Housing – –
Capital Spares – –
Biological or Cultivated Assets – – – – – – – – – – –
Biological or Cultivated Assets – –
Description
Budget Year 2018/19
Page 30
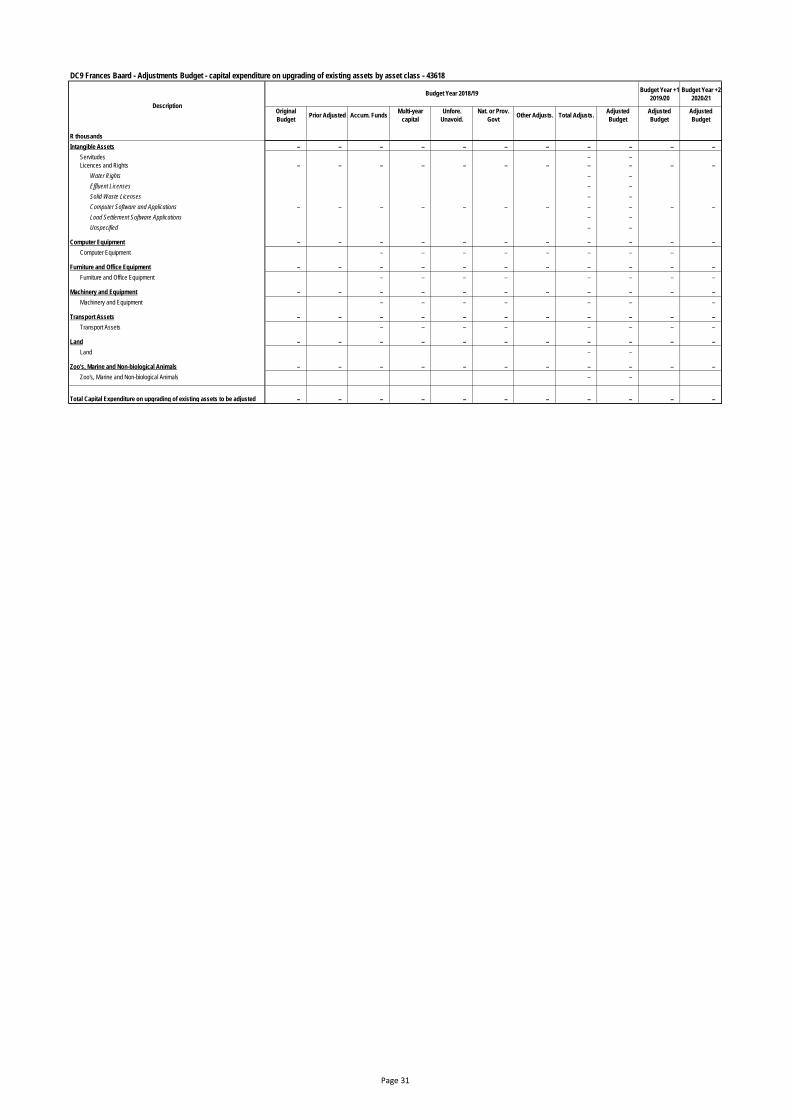
DC9 Frances Baard - Adjustments Budget - capital expenditure on upgrading of existing assets by asset class - 43618
Budget Year +1
2019/20
Budget Year +2
2020/21
Original
BudgetPrior Adjusted Accum. Funds
Multi-year
capital
Unfore.
Unavoid.
Nat. or Prov.
GovtOther Adjusts. Total Adjusts.
Adjusted
Budget
Adjusted
Budget
Adjusted
Budget
R thousands
Description
Budget Year 2018/19
Intangible Assets – – – – – – – – – – –
Servitudes – –
Licences and Rights – – – – – – – – – – –
Water Rights – –
Effluent Licenses – –
Solid Waste Licenses – –
Computer Software and Applications – – – – – – – – – – –
Load Settlement Software Applications – –
Unspecified – –
Computer Equipment – – – – – – – – – – –
Computer Equipment – – – – – – – –
Furniture and Office Equipment – – – – – – – – – – –
Furniture and Office Equipment – – – – – – – –
Machinery and Equipment – – – – – – – – – – –
Machinery and Equipment – – – – – – –
Transport Assets – – – – – – – – – – –
Transport Assets – – – – – – – –
Land – – – – – – – – – – –
Land – –
Zoo's, Marine and Non-biological Animals – – – – – – – – – – –
Zoo's, Marine and Non-biological Animals – –
Total Capital Expenditure on upgrading of existing assets to be adjusted – – – – – – – – – – –
Page 31
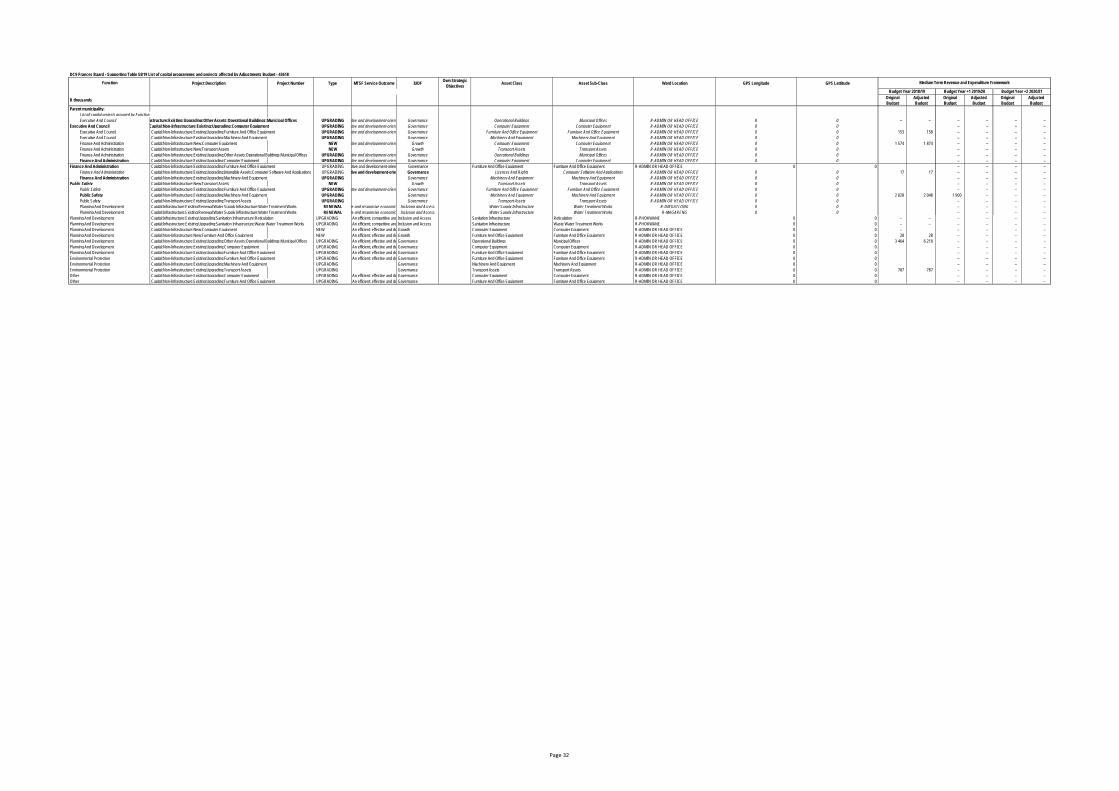
DC9 Frances Baard - Supporting Table SB19 List of capital programmes and projects affected by Adjustments Budget - 43618
Function Project Description Project Number Type MTSF Service Outcome IUDFOwn Strategic
ObjectivesAsset Class Asset Sub-Class Ward Location GPS Longitude GPS Lattitude
R thousandsOriginal
Budget
Adjusted
Budget
Original
Budget
Adjusted
Budget
Original
Budget
Adjusted
Budget
Parent municipality:
List all capital projects grouped by Function
Executive And Council Capital:Non-Infrastructure:Existing:Upgrading:Other Assets:Operational Buildings:Municipal Offices UPGRADINGAn efficient; effective and development-oriented public serviceGovernance Operational Buildings Municipal Offices R-ADMIN OR HEAD OFFICE 0 0 – – – – – –
Executive And Council Capital:Non-Infrastructure:Existing:Upgrading:Computer Equipment UPGRADINGAn efficient; effective and development-oriented public serviceGovernance Computer Equipment Computer Equipment R-ADMIN OR HEAD OFFICE 0 0 – – – –
Executive And Council Capital:Non-Infrastructure:Existing:Upgrading:Furniture And Office Equipment UPGRADINGAn efficient; effective and development-oriented public serviceGovernance Furniture And Office Equipment Furniture And Office Equipment R-ADMIN OR HEAD OFFICE 0 0 153 158 – – – –
Executive And Council Capital:Non-Infrastructure:Existing:Upgrading:Machinery And Equipment UPGRADING Governance Machinery And Equipment Machinery And Equipment R-ADMIN OR HEAD OFFICE 0 0 – – – –
Finance And Administration Capital:Non-Infrastructure:New:Computer Equipment NEWAn efficient; effective and development-oriented public serviceGrowth Computer Equipment Computer Equipment R-ADMIN OR HEAD OFFICE 0 0 1 574 1 874 – – – –
Finance And Administration Capital:Non-Infrastructure:New:Transport Assets NEW Growth Transport Assets Transport Assets R-ADMIN OR HEAD OFFICE 0 0 – – – –
Finance And Administration Capital:Non-Infrastructure:Existing:Upgrading:Other Assets:Operational Buildings:Municipal Offices UPGRADINGAn efficient; effective and development-oriented public serviceGovernance Operational Buildings Municipal Offices R-ADMIN OR HEAD OFFICE 0 0 – – – –
Finance And Administration Capital:Non-Infrastructure:Existing:Upgrading:Computer Equipment UPGRADINGAn efficient; effective and development-oriented public serviceGovernance Computer Equipment Computer Equipment R-ADMIN OR HEAD OFFICE 0 0 – – – –
Finance And Administration Capital:Non-Infrastructure:Existing:Upgrading:Furniture And Office Equipment UPGRADINGAn efficient; effective and development-oriented public serviceGovernance Furniture And Office Equipment Furniture And Office Equipment R-ADMIN OR HEAD OFFICE 0 0 – – – –
Finance And Administration Capital:Non-Infrastructure:Existing:Upgrading:Intangible Assets:Computer Software And Applications UPGRADINGAn efficient; effective and development-oriented public serviceGovernance Licences And Rights Computer Software And Applications R-ADMIN OR HEAD OFFICE 0 0 17 17 – – – –
Finance And Administration Capital:Non-Infrastructure:Existing:Upgrading:Machinery And Equipment UPGRADING Governance Machinery And Equipment Machinery And Equipment R-ADMIN OR HEAD OFFICE 0 0 – – – –
Public Safety Capital:Non-Infrastructure:New:Transport Assets NEW Growth Transport Assets Transport Assets R-ADMIN OR HEAD OFFICE 0 0 – – – –
Public Safety Capital:Non-Infrastructure:Existing:Upgrading:Furniture And Office Equipment UPGRADINGAn efficient; effective and development-oriented public serviceGovernance Furniture And Office Equipment Furniture And Office Equipment R-ADMIN OR HEAD OFFICE 0 0 – – – –
Public Safety Capital:Non-Infrastructure:Existing:Upgrading:Machinery And Equipment UPGRADING Governance Machinery And Equipment Machinery And Equipment R-ADMIN OR HEAD OFFICE 0 0 2 028 2 048 1 900 – – –
Public Safety Capital:Non-Infrastructure:Existing:Upgrading:Transport Assets UPGRADING Governance Transport Assets Transport Assets R-ADMIN OR HEAD OFFICE 0 0 – – – –
Planning And Development Capital:Infrastructure:Existing:Renewal:Water Supply Infrastructure:Water Treatment Works RENEWALAn efficient; competitive and responsive economic infrastructure networkInclusion and Access Water Supply Infrastructure Water Treatment Works R-DIKGATLONG 0 0 – – – –
Planning And Development Capital:Infrastructure:Existing:Renewal:Water Supply Infrastructure:Water Treatment Works RENEWALAn efficient; competitive and responsive economic infrastructure networkInclusion and Access Water Supply Infrastructure Water Treatment Works R-MAGARENG 0 0 – – – –
Planning And Development Capital:Infrastructure:Existing:Upgrading:Sanitation Infrastructure:Reticulation UPGRADING An efficient; competitive and responsive economic infrastructure networkInclusion and Access Sanitation Infrastructure Reticulation R-PHOKWANE 0 0 – – – – – –
Planning And Development Capital:Infrastructure:Existing:Upgrading:Sanitation Infrastructure:Waste Water Treatment Works UPGRADING An efficient; competitive and responsive economic infrastructure networkInclusion and Access Sanitation Infrastructure Waste Water Treatment Works R-PHOKWANE 0 0 – – – – – –
Planning And Development Capital:Non-Infrastructure:New:Computer Equipment NEW An efficient; effective and development-oriented public serviceGrowth Computer Equipment Computer Equipment R-ADMIN OR HEAD OFFICE 0 0 – – – – –
Planning And Development Capital:Non-Infrastructure:New:Furniture And Office Equipment NEW An efficient; effective and development-oriented public serviceGrowth Furniture And Office Equipment Furniture And Office Equipment R-ADMIN OR HEAD OFFICE 0 0 28 28 – – – –
Planning And Development Capital:Non-Infrastructure:Existing:Upgrading:Other Assets:Operational Buildings:Municipal Offices UPGRADING An efficient; effective and development-oriented public serviceGovernance Operational Buildings Municipal Offices R-ADMIN OR HEAD OFFICE 0 0 3 464 6 218 – – – –
Planning And Development Capital:Non-Infrastructure:Existing:Upgrading:Computer Equipment UPGRADING An efficient; effective and development-oriented public serviceGovernance Computer Equipment Computer Equipment R-ADMIN OR HEAD OFFICE 0 0 – – – –
Planning And Development Capital:Non-Infrastructure:Existing:Upgrading:Furniture And Office Equipment UPGRADING An efficient; effective and development-oriented public serviceGovernance Furniture And Office Equipment Furniture And Office Equipment R-ADMIN OR HEAD OFFICE 0 0 – – – –
Environmental Protection Capital:Non-Infrastructure:Existing:Upgrading:Furniture And Office Equipment UPGRADING An efficient; effective and development-oriented public serviceGovernance Furniture And Office Equipment Furniture And Office Equipment R-ADMIN OR HEAD OFFICE 0 0 – – – –
Environmental Protection Capital:Non-Infrastructure:Existing:Upgrading:Machinery And Equipment UPGRADING Governance Machinery And Equipment Machinery And Equipment R-ADMIN OR HEAD OFFICE 0 0 – – – –
Environmental Protection Capital:Non-Infrastructure:Existing:Upgrading:Transport Assets UPGRADING Governance Transport Assets Transport Assets R-ADMIN OR HEAD OFFICE 0 0 787 787 – – – –
Other Capital:Non-Infrastructure:Existing:Upgrading:Computer Equipment UPGRADING An efficient; effective and development-oriented public serviceGovernance Computer Equipment Computer Equipment R-ADMIN OR HEAD OFFICE 0 0 – – – –
Other Capital:Non-Infrastructure:Existing:Upgrading:Furniture And Office Equipment UPGRADING An efficient; effective and development-oriented public serviceGovernance Furniture And Office Equipment Furniture And Office Equipment R-ADMIN OR HEAD OFFICE 0 0 – – – –
Medium Term Revenue and Expenditure Framework
Budget Year 2018/19 Budget Year +1 2019/20 Budget Year +2 2020/21
Page 32
Budget Year
+1 2019/20
Budget Year
+2 2020/21
Original
BudgetPrior Adjusted Accum. Funds
Multi-year
capital
Unfore.
Unavoid.
Nat. or Prov.
GovtOther Adjusts. Total Adjusts.
Adjusted
Budget
Adjusted
Budget
Adjusted
Budget
R thousands
Revenue By Municipal Entity
Entity 1 total revenue – –
Entity 2 total revenue – –
Entity 3 (etc) total revenue – –
– –
– –
– –
– –
– –
– –
– –
Total Operating Revenue – – – – – – – – – – –
Expenditure By Municipal Entity
Entity 1 total operating expenditure – –
Entity 2 total operating expenditure – –
Entity 3 etc. total operating expenditure – –
– –
– –
– –
– –
– –
– –
– –
Total Operating Expenditure – – – – – – – – – – –
Capital Expenditure By Municipal Entity
Entity 1 total capital expenditure – –
Entity 2 total capital expenditure – –
Entity 3 etc. total capital expenditure – –
– –
– –
– –
– –
– –
– –
– –
Total Capital Expenditure – – – – – – – – – – –
DC9 Frances Baard - Supporting Table SB20 Not required - 43618
Description
Budget Year 2018/19
Page 33