Embed Size (px)
Citation preview

FOR OFFICIAL USE ONLY
SPECIAL ASSISTANCE FOR PROJECT FORMATION
(SAPROF)
FOR
UTTAR PRADESH NATURAL RESOURCE
MANAGEMENT AND
POVERTY ALLEVIATION PROJECT
(UPNRMPAP)
INDIA
FINAL REPORT
VOLUME II: ANNEXES
OCTOBER 2007
SAPROF TEAM
FOR
JAPAN BANK FOR INTERNATIONAL COOPERATION (JBIC)
NIPPON KOEI CO., LTD.

Special Assistance for Project Formation (SAPROF)
for Uttar Pradesh Natural Resource Management and Poverty Alleviation Project (NRMPAP)
Final Report
Structure of the Report
Volume II: Annexes
Location Map of Project Area Cover Page Maps Photos SAPROF Design Matrix (SDM) Table of Contents Abbreviations Local Terms Local and Botanical Names Measurement Units PART I: EXECUTIVE SUMMARY PART II: THE STUDY PART III: IMPLEMENTATION PROGRAMME (I/P)
Volume I MAIN REPORT
Attachments ANNEX-1 THE STUDY AREA (THE STATE OF UTTAR
PRADESH) ANNEX-2 FORESTS AND FOREST AREAS IN UTTAR
PRADESH ANNEX-3 WORLD BANK FORESTRY RELATED PROJECTS ANNEX-4 CONSULTATIVE MEETING WITH
STAKEHOLDERS ANNEX-5 NGO CASE STUDY ANNEX-6 RESULT OF HOUSEHOLD SURVEY ANNEX-7 REPORT ON EXPOSURE TRIP ANNEX-8 STUDY ON INSTITUTIONAL ARRANGEMENT ANNEX-9 RAPID TRAINING NEEDS ANALYSIS (TNA) ANNEX-10 DIVISION WISE WORK QUANTITY AND
METHODOLOGY OF BENEFIT VALUATION ANNEX-11 SATELLITE IMAGE ANALYSIS ANNEX-12 AR-CDM IN INDIA
Volume II ANNEXES
ANNEX-13 DRAFT PROJECT STATUS REPORT (PSR)
For Official Use Only Special Assistance for Project Formation (SAPROF) for
Uttar Pradesh Natural Resources Management and Poverty Alleviation Project (UPNRMPAP)
Final Report- Volume II i
Special Assistance for Project Formation (SAPROF)
for Uttar Pradesh Natural Resource Management and Poverty Alleviation Project (NRMPAP)
Final Report
Table of Contents
Volume II: ANNEXES
ANNEX-1 THE STUDY AREA (THE STATE OF UTTAR PRADESH) ANNEX-2 FORESTS AND FOREST AREAS IN UTTAR PRADESH ANNEX-3 WORLD BANK FORESTRY RELATED PROJECTS ANNEX-4 CONSULTATIVE MEETING WITH STAKEHOLDERS ANNEX-5 NGO CASE STUDY ANNEX-6 RESULT OF HOUSEHOLD SURVEY ANNEX-7 REPORT ON EXPOSURE TRIP ANNEX-8 STUDY ON INSTITUTIONAL ARRANGEMENT ANNEX-9 RAPID TRAINING NEEDS ANALYSIS (TNA) ANNEX-10 DIVISION WISE WORK QUANTITY AND METHODOLOGY OF BENEFIT
VALUATION ANNEX-11 SATELLITE IMAGE ANALYSIS ANNEX-12 AR-CDM IN INDIA ANNEX-13 DRAFT PROJECT STATUS REPORT (PSR)
For Official Use Only Special Assistance for Project Formation (SAPROF) for
Uttar Pradesh Natural Resources Management and Poverty Alleviation Project (UPNRMPAP)
Final Report- Volume II ii
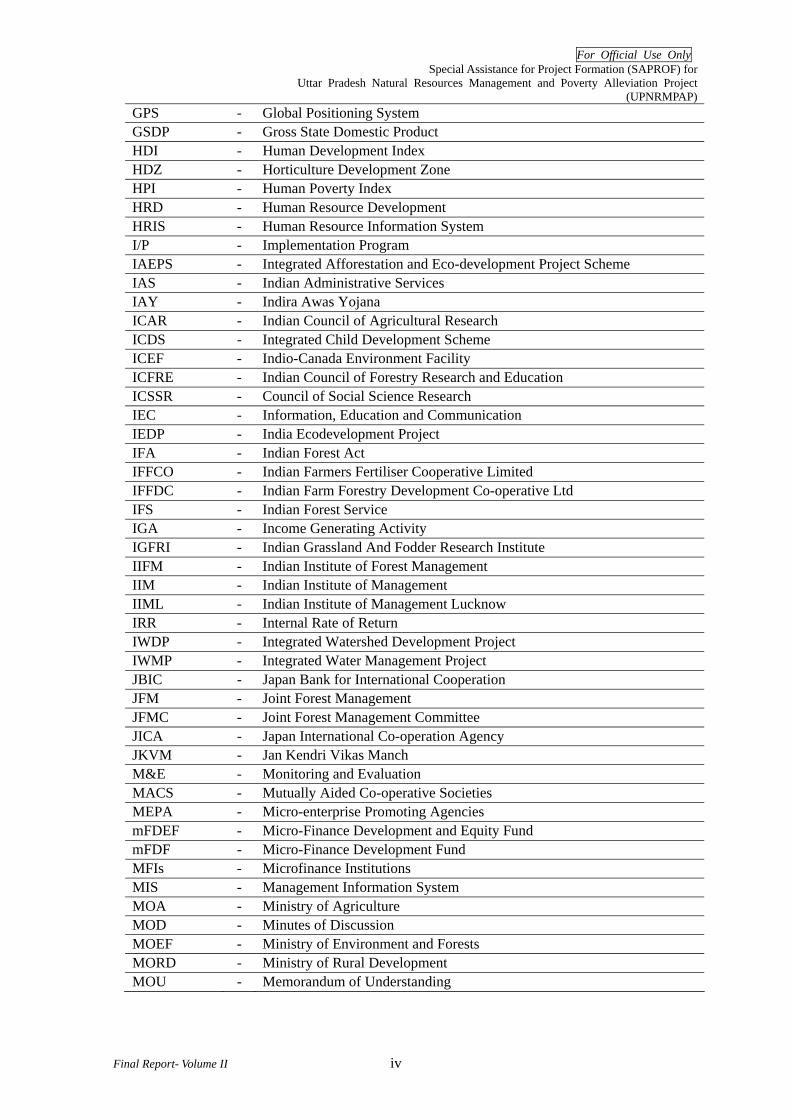
Abbreviations
ABN-AMRO - Algemene Bank Nederland and the Amsterdamsche-Rotterdamsche BankACF - Assistant Conservator of Forests ADB - Asian Development Bank ADM - Assistant District Magistrate AGVY - Ambedkar Gram Vikas Yojna (Ambedkar Village Development
Programme) ALOs - Assistant Logging Officers AMC - Agriculture Management Centre AMU - Aligarh Muslim University ANR - Assisted Natural Regeneration AOFFPS - Area Oriented Fuel wood and Fodder Projects Scheme APC - Agricultural Production Commissioner APCCF - Assistant Principal Chief Conservator of Forests APFA - Andhra Pradesh Forest Academy ATMA - Agriculture Technology Management Agency AVRY - Ambedkar Visesh Rojgar Yojana BHNs - Basic Human Needs BPL - Below Poverty Line BRGF - Backward Region Grant Fund C.D.F - Central Dairy Farm C/P - counterparts CASA - Church’s Auxiliary for Social Action CASHPOR - Credit and Savings for the Hardcore Poor CBD - Convention on Biological Diversity CCF - Chief Conservator of Forests CCL - Cash Credit Limit CDM - Clean Development Mechanism CF - Conservator of Forest CHS - Compartment History System CIMAP - Central Institute for Aromatic and Medicinal Plants CITES - Convention on International Trade in Endangered Species CMF - Centre for Training and Management of Soil, Water and Forest CMFR - Centre for Micro-Finance Research CMS - Content Management System CNFA - Cultivable Non-Forest Area CPI - Commodity Price Index CPI-RL - Consumer Price Index for Rural Labourers CPR - Common Pool Resource CREDA - Centre for Rural Education and Development Action CRS - Christian Relief Services CSIR - Council of Scientific and Industrial Research CVO - Central Vigilance Officer CWW - Chief Wildlife Warden DASP - Diversified Agricultural Support Programme DCCB - District Credit Cooperative Banks
For Official Use Only Special Assistance for Project Formation (SAPROF) for
Uttar Pradesh Natural Resources Management and Poverty Alleviation Project (UPNRMPAP)
Final Report- Volume II iii
DFID - Department for International Development, UK DFI - Development Financial Institution DFO - Divisional Forest Officer DIC - District Industrial Centre DIP - Digital Image Processing DLM - Divisional Logging Managers DM - District Magistrate DMU - Division Management Unit DOA - Department of Agriculture DPAP - Drought Prone Areas Programme DPC - District Project Coordinator DPMU - District Project Management Unit DPR - Detailed Project Report DRDA - District Rural Development Agency DSM - Divisional Sales Manger EB - Executive Board EC - Executive Committee ECB - External Commercial Borrowings ED - Eco-Development EDC - Eco-Development Committee EEC - European Economic Community EIRR - Economic Internal Rate of Return EXIM - Export-Import Bank of India FCSD - Food & Civil Supplies Department FD - Forest Department FDA - Forest Development Agency FEM - Forest Encroachment Mapping FES - Forest Enumeration System FFDA - Fish Farmers Development Agency FGTC - Forest Guard Training Centre FIRR - Financial Internal Rate of Return FMIS - Forest Management Information System FMU - Field Management Unit FORRAD - Foundation for Rural Recovery And Development FPD - Forest Protection Division FSI - Forest Survey of India FTI - Forest Training Institute FUG - Forest User Group FWPC - Forest Working Plan Circle G.O. - Government Order GBPSSI - Govind Ballabh Pant Social Science Institute GDP - Gross Domestic Product GDS - Grameen Development Services GIDS - Giri Institute of Development Studies GIS - Geographical Information System GOI - Government of India GOUP - Government of Uttar Pradesh
For Official Use Only Special Assistance for Project Formation (SAPROF) for
Uttar Pradesh Natural Resources Management and Poverty Alleviation Project (UPNRMPAP)
Final Report- Volume II iv
GPS - Global Positioning System GSDP - Gross State Domestic Product HDI - Human Development Index HDZ - Horticulture Development Zone HPI - Human Poverty Index HRD - Human Resource Development HRIS - Human Resource Information System I/P - Implementation Program IAEPS - Integrated Afforestation and Eco-development Project Scheme IAS - Indian Administrative Services IAY - Indira Awas Yojana ICAR - Indian Council of Agricultural Research ICDS - Integrated Child Development Scheme ICEF - Indio-Canada Environment Facility ICFRE - Indian Council of Forestry Research and Education ICSSR - Council of Social Science Research IEC - Information, Education and Communication IEDP - India Ecodevelopment Project IFA - Indian Forest Act IFFCO - Indian Farmers Fertiliser Cooperative Limited IFFDC - Indian Farm Forestry Development Co-operative Ltd IFS - Indian Forest Service IGA - Income Generating Activity IGFRI - Indian Grassland And Fodder Research Institute IIFM - Indian Institute of Forest Management IIM - Indian Institute of Management IIML - Indian Institute of Management Lucknow IRR - Internal Rate of Return IWDP - Integrated Watershed Development Project IWMP - Integrated Water Management Project JBIC - Japan Bank for International Cooperation JFM - Joint Forest Management JFMC - Joint Forest Management Committee JICA - Japan International Co-operation Agency JKVM - Jan Kendri Vikas Manch M&E - Monitoring and Evaluation MACS - Mutually Aided Co-operative Societies MEPA - Micro-enterprise Promoting Agencies mFDEF - Micro-Finance Development and Equity Fund mFDF - Micro-Finance Development Fund MFIs - Microfinance Institutions MIS - Management Information System MOA - Ministry of Agriculture MOD - Minutes of Discussion MOEF - Ministry of Environment and Forests MORD - Ministry of Rural Development MOU - Memorandum of Understanding

For Official Use Only Special Assistance for Project Formation (SAPROF) for
Uttar Pradesh Natural Resources Management and Poverty Alleviation Project (UPNRMPAP)
Final Report- Volume II v
MTFF - Medium-Term Fiscal Framework NABARD - National Bank for Agriculture and Rural Development NAEB - National Afforestation and Eco development Board NAP - National Afforestation Programme NBFC - Non-banking Financial Corporation NBSAP - National Biodiversity Strategy and Action Plan NDP - Net Domestic Product NFAP - National Forest Action Programme NFFW - National Food for Work Programme NGO - Non-Governmental Organization NHM - National Horticulture Mission NIC - National Informatics Centre NOAPS - National Old Age Pension Scheme NPV - Net Present Value NREGP - National Rural Employment Guarantee Program NRSA - National Remote Sensing Agency NSDP - Net State Domestic Product NSS - National Sample Survey NSSO - National Sample Survey Organisation NTFP - Non Timber Forest Product NWAP - National Wildlife Action Plan NWFP - Non Wood Forest Product O&M - Operation & Maintenance OBC - Other Backward Classes OEI - Operation and Effective Indicator OPEC - Organization of Petroleum Exporting Countries OPME - Operation, Planning, Monitoring & Evaluation PACS - Poverty Areas Civil Service PA - Protected Area PCCF - Principal Chief Conservator of Forests PCR - Project Completion Report PDS - Public Distribution System PESA - Panchayats Extension to the Scheduled Area PF - Protected Forest PFFCS - Primary Farm Forestry Co-operative Societies PFS - Provisional Forest Service PHC - Primary Health Centre PIA - Project Implementing Agency PIU - Project Implementation Units PMGSY - Pradhan Mantri Gramin Sadak Yojana PMU - Project Management Unit PO - People's Organization PRA - Participatory Rural Appraisal PRI - Panchayati Raj Institution PSMS-II - Second Poverty and Social Monitoring Survey II PTG - Primitive Tribal Groups RBI - Reserve Bank of India

For Official Use Only Special Assistance for Project Formation (SAPROF) for
Uttar Pradesh Natural Resources Management and Poverty Alleviation Project (UPNRMPAP)
Final Report- Volume II vi
RDBMS - Relational Database Management System RDD - Rural Development Department RF - Reserved Forest RFO - Range Forest Officer RMK - Rashtriya Mahila Kosh RO - Range Officer RRB - Regional Rural Bank RSAC - Remote Sensing Application Center RSVY - Rashtriya Sam Vikas Yojana RUPFOR - Resource Unit for Participatory Forestry SAPROF - Special Assistance for Project Formation SC - Scheduled Caste SDFO - Sub-Divisional Forest Officer SF - Social Forestry SFAA - State Financial Accountability Assessment SFC - State Finance Commission SFD - Social Forestry Division SFP - Social Forestry Programme SFRI - State Forestry Research Institute SGRY - Sampoorna Gramin Rozgar Yojana SGSY - Swarnjayanti Gram Swarozgar Yojana (Village Poor Self-employment
Project) SGVY - Samagra Gram Vikas Yojana SHG - Self Help Group SHM - State Horticulture Mission SHPI - Self Help Promoting Institutions SIDBI - Small Industries Development Bank of India SIRD - State Institute of Rural Development SISI - Small Industries Service Institute SJGSY - Swarna Jayanti Gram Swarozgaar Yojana SKS - Swayam Krishi Sangam SLCC - State Level Coordination Committee SOI - Survey of India SSA - Sarva Shiksha Abhiyan ST - Scheduled Tribe SWC - Soil Water Conservation SWM - State Water Supply & Sanitation Mission TAP - Tamilnadu Afforestation Project TARA - Technology and Action for Rural Advancement TNA - Training Needs Analysis TOT - Training of Trainers UF - Un-classed forest UNA - User Need Assessment UNDP - United Nations Development Programs UNICEF - United Nations International Children education Fund UP - Uttar Pradesh UP-BSN - UP Bhumi Sudhar Nigam

For Official Use Only Special Assistance for Project Formation (SAPROF) for
Uttar Pradesh Natural Resources Management and Poverty Alleviation Project (UPNRMPAP)
Final Report- Volume II vii
UPDASP - Uttar Pradesh Diversified Agriculture Support Project UPFC - Uttar Pradesh Forest Corporation UPFD - Uttar Pradesh Forest Department UPFP - Uttar Pradesh Forest Programme UPFS - UP Forest Service UPLDC - Uttar Pradesh Land Development Corporation UP-NRMPAP - Uttar Pradesh Natural Resources Management and Poverty Alleviation
Project UPREGS - UP Rural Employment Guarantee Scheme UPSLR - Uttar Pradesh Sodic Land Reclamation UPSLRP-II - UP Sodic Lands Reclamation Project II UPVAN - Uttar Pradesh Voluntary Action Network VAT - Value Added Tax VDF - Village Development Fund VF - Village Forest VFC - Village Forest Committee VFJM - Village Forest Joint Management WB - World Bank WC - Working Circle WCWD - Women & Child Welfare Department WFP - World Food Programme WHO - World Health Organization WII - Wildlife Institute of India WL - Wildlife WPC - Working Plan Circle WPI - Whole sale Price Index WPR - Work Participation Rate WTO - World Trade Organization
For Official Use Only Special Assistance for Project Formation (SAPROF) for
Uttar Pradesh Natural Resources Management and Poverty Alleviation Project (UPNRMPAP)
Final Report- Volume II viii
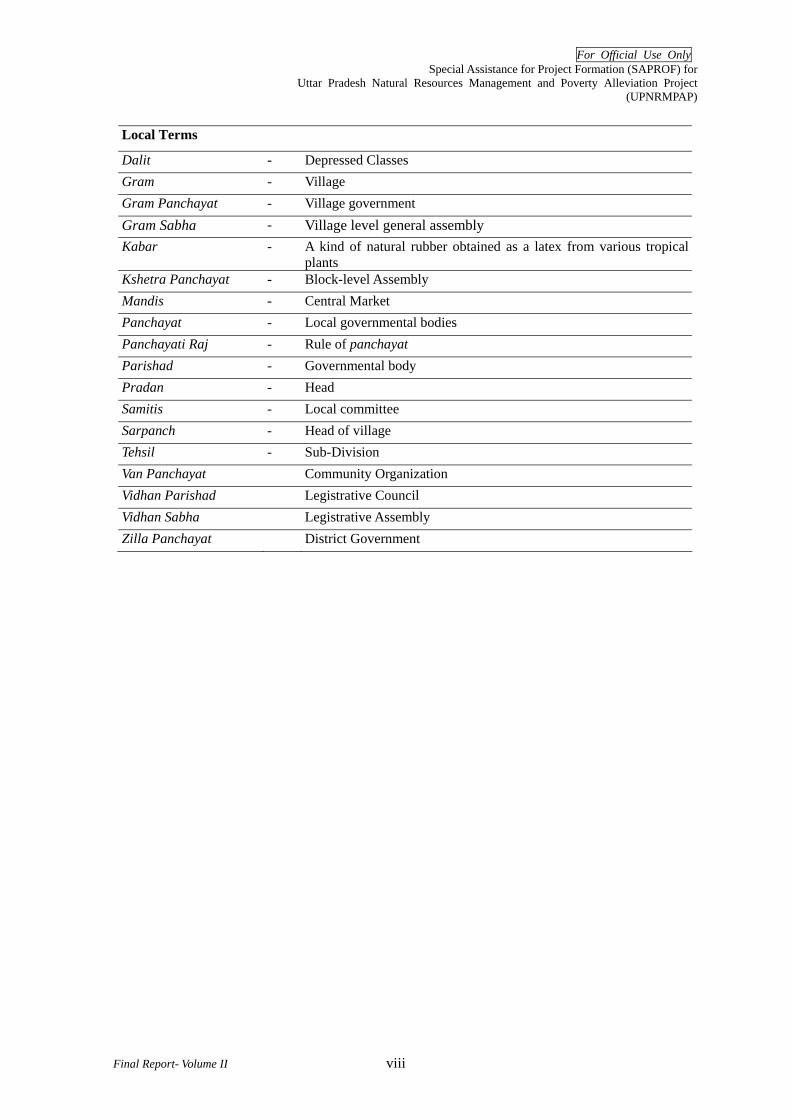
Local Terms
Dalit - Depressed Classes Gram - Village Gram Panchayat - Village government Gram Sabha - Village level general assembly Kabar - A kind of natural rubber obtained as a latex from various tropical
plants Kshetra Panchayat - Block-level Assembly Mandis - Central Market Panchayat - Local governmental bodies Panchayati Raj - Rule of panchayat Parishad - Governmental body Pradan - Head Samitis - Local committee Sarpanch - Head of village Tehsil - Sub-Division Van Panchayat Community Organization Vidhan Parishad Legistrative Council Vidhan Sabha Legistrative Assembly Zilla Panchayat District Government

For Official Use Only Special Assistance for Project Formation (SAPROF) for
Uttar Pradesh Natural Resources Management and Poverty Alleviation Project (UPNRMPAP)
Final Report- Volume II ix
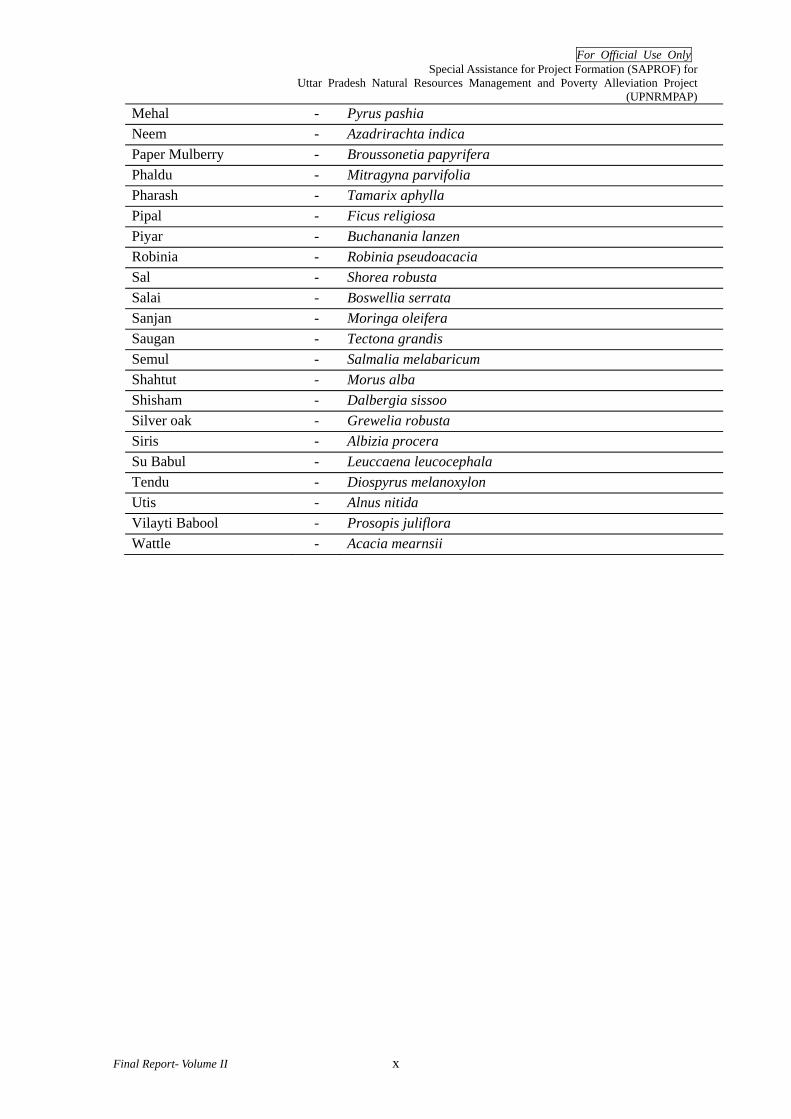
LIST SHOWING LOCAL and BOTANICAL NAMES Local Name Botanical Name Am - Mangifera indica Amaltas - Cassia fistula Amla/Aonla - Phyllanthus emblica/Emblica officinalis Arjun - Terminalia arjuna Aru - Ailanthus exelsa Ashok - Saraca indica Asna - Terminalia tomentosa August - Sesbania grandiflora Ayar - Lyonia ovalifolia Babul - Acacia nilotica Bakain - Melia azedderach Bargad - Ficus bengalencis Behda - Terminalia blerica Bel - Aegle marmilose Ber - Zizyphus jujuba Bhimal - Grewia oppositifollia Bijasal - Pterocarpus marsupium Casuarina - Casuarina equisatifolia Chironji - Buchanania latifolia Dhak, Palas - Butea monosperma Guler - Ficus glomerata Gul Mohar - Delonix regia Gutel - Trewia nudiflora Harr - Terminalia chebula Haldu - Adina cordfolia Imli - Tamarindus indica Jamun - Syzygium cuminii Jangal Jalebi - Pithecellobium dulce Jhingan - Lanea coramandelica Kachnar - Bauhinia variegata Kanak Champa - Pterospermum acerifolium Kanju - Holoptelia integrifolia Kardhai - Anogeisus pendula Kathber - Zyzyphus glaberrimma Khair - Acacia catechu Kharik - Celtis tetraandra Kusum - Schleichera trijuga Lasura - Cordia myxa Mahua - Mahdhuka latifolia Maulsari - Minusops elengi
For Official Use Only Special Assistance for Project Formation (SAPROF) for
Uttar Pradesh Natural Resources Management and Poverty Alleviation Project (UPNRMPAP)
Final Report- Volume II x
Mehal - Pyrus pashia Neem - Azadrirachta indica Paper Mulberry - Broussonetia papyrifera Phaldu - Mitragyna parvifolia Pharash - Tamarix aphylla Pipal - Ficus religiosa Piyar - Buchanania lanzen Robinia - Robinia pseudoacacia Sal - Shorea robusta Salai - Boswellia serrata Sanjan - Moringa oleifera Saugan - Tectona grandis Semul - Salmalia melabaricum Shahtut - Morus alba Shisham - Dalbergia sissoo Silver oak - Grewelia robusta Siris - Albizia procera Su Babul - Leuccaena leucocephala Tendu - Diospyrus melanoxylon Utis - Alnus nitida Vilayti Babool - Prosopis juliflora Wattle - Acacia mearnsii
For Official Use Only Special Assistance for Project Formation (SAPROF) for
Uttar Pradesh Natural Resources Management and Poverty Alleviation Project (UPNRMPAP)
Final Report- Volume II xi
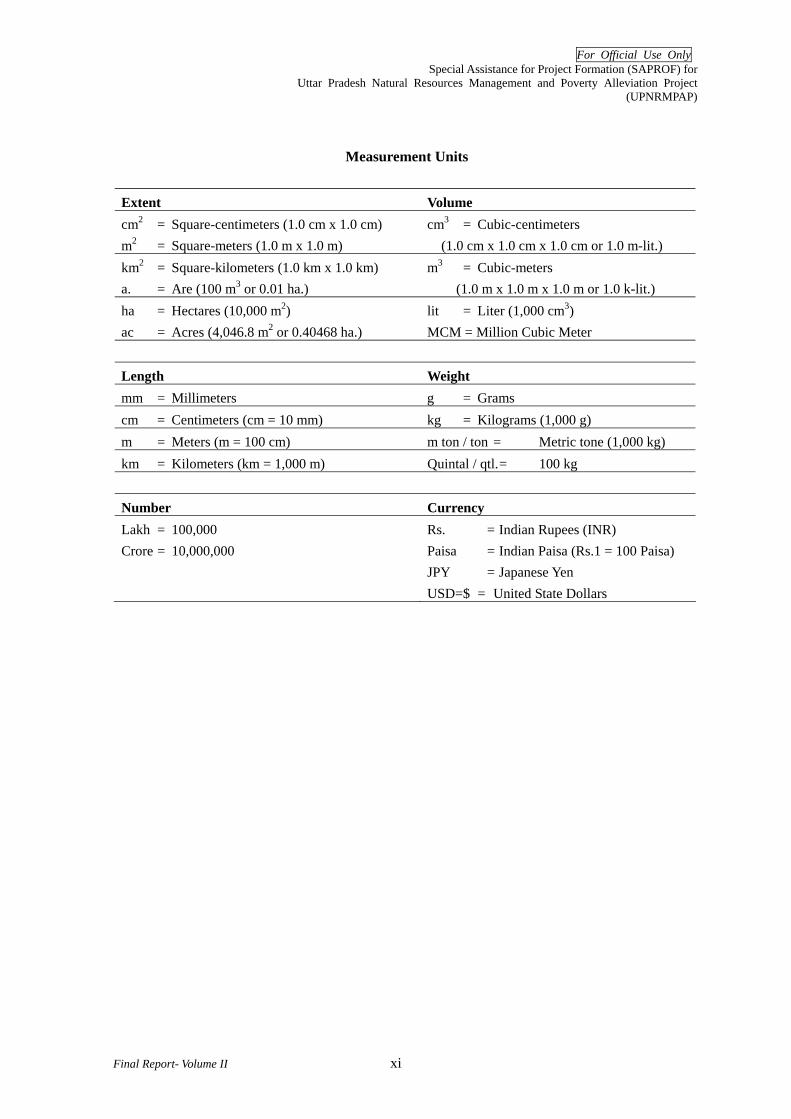
Measurement Units
Extent Volume cm2 = Square-centimeters (1.0 cm x 1.0 cm) m2 = Square-meters (1.0 m x 1.0 m)
cm3 = Cubic-centimeters (1.0 cm x 1.0 cm x 1.0 cm or 1.0 m-lit.)
km2 = Square-kilometers (1.0 km x 1.0 km) a. = Are (100 m3 or 0.01 ha.)
m3 = Cubic-meters (1.0 m x 1.0 m x 1.0 m or 1.0 k-lit.)
ha = Hectares (10,000 m2) ac = Acres (4,046.8 m2 or 0.40468 ha.)
lit = Liter (1,000 cm3) MCM = Million Cubic Meter
Length Weight mm = Millimeters g = Grams cm = Centimeters (cm = 10 mm) kg = Kilograms (1,000 g) m = Meters (m = 100 cm) m ton / ton = Metric tone (1,000 kg) km = Kilometers (km = 1,000 m) Quintal / qtl. = 100 kg Number Currency Lakh = 100,000 Crore = 10,000,000
Rs. = Indian Rupees (INR) Paisa = Indian Paisa (Rs.1 = 100 Paisa) JPY = Japanese Yen USD=$ = United State Dollars

For Official Use Only Special Assistance for Project Formation (SAPROF) for
Uttar Pradesh Natural Resource Management and Poverty Alleviation Project (UPNRMPAP)
Final Report- Volume II
Special Assistance for Project Formation
for Uttar Pradesh Natural Resource Management and Poverty Alleviation Project
(UPNRMPAP)
Final Report
Volume II: ANNEXES
ANNEX-1 THE STUDY AREA
(THE STATE OF UTTAR PRADESH)

For Official Use Only Special Assistance for Project Formation (SAPROF) for
Uttar Pradesh Natural Resources Management and Poverty Alleviation Project (UPNRMPAP)
Final Report-Volume II i
Special Assistance for Project Formation (SAPROF)
for
Uttar Pradesh Natural Resource Management and Poverty Alleviation Project (UPNRMPAP)
Final Report
Volume II: Annexes
ANNEX 1 THE STUDY AREA (THE STATE OF UTTAR PRADESH)
Table of Contents 1. Size, Location and Topography.............................................................................Annex 1 -1 2 Administration.......................................................................................................Annex 1 -2
2.1 State Administrative Structure....................................................................Annex 1 -2 2.2 Administrative System ...............................................................................Annex 1 -2 2.3 Panchayati Raj Institutions.........................................................................Annex 1 -3 2.4 Fiscal Conditions........................................................................................Annex 1 -6 2.5 Governance Reforms..................................................................................Annex 1 -8
3 Socio-Economy ...................................................................................................Annex 1 -10 3.1 State Domestic Product and Other Major Economic Indicators ..............Annex 1 -10 3.2 Demography and Unemployment ............................................................Annex 1 -12 3.3 Poverty and Land Holdings......................................................................Annex 1 -15 3.4 Gender and Development.........................................................................Annex 1 -17 3.5 Major Industries in Uttar Pradesh ............................................................Annex 1 -18
4 Assisting Systems for Poverty Alleviation in Uttar Pradesh ...............................Annex 1 -19 4.1 Key Features of Government Poverty Alleviation Programme in UP .....Annex 1 -19 4.2 Special Note on ST Related Scheme in UP..............................................Annex 1 -21 4.3 Microfinance ............................................................................................Annex 1 -22 4.4 Self Help Groups (SHGs) for Poverty Alleviation...................................Annex 1 -26
5 Natural Conditions ..............................................................................................Annex 1 -29 5.1 Agro-Climate............................................................................................Annex 1 -29 5.2 Land Use ..................................................................................................Annex 1 -31 5.3 Soil ...........................................................................................................Annex 1 -33 5.4 River Systems and Catchments ................................................................Annex 1 -34 5.5 Rainfall and Temperature .........................................................................Annex 1 -36 5.6 Natural Disasters in Uttar Pradesh ...........................................................Annex 1 -37
6 Relevant Organisations .......................................................................................Annex 1 -39 6.1 Relevant Government Agencies ...............................................................Annex 1 -39 6.2 Academies / Research Institutions ...........................................................Annex 1 -45 6.3 Non-Government Organisations (NGOs).................................................Annex 1 -47 6.4 Cooperatives and Other Village Level Organisations ..............................Annex 1 -49
7 Development Plans..............................................................................................Annex 1 -51 7.1 Uttar Pradesh Tenth Five Year Plan (2002 – 2007) ..................................Annex 1 -51 7.2 Perspective Eleventh Five Year Plan of Uttar Pradesh (2008–2013) .......Annex 1 -53 7.3 Uttar Pradesh Forest Sector Tenth Year Plan (2002–2007) ......................Annex 1 -55 7.4 The Eleventh Five Year Plan for Forestry Sector (2008-2013) ................Annex 1 -56
8 Development Programme and Projects ...............................................................Annex 1 -59 8.1 State and Centrally Funded Projects and Programmes ............................Annex 1 -59 8.2 Externally Aided Projects.........................................................................Annex 1 -64
For Official Use Only Special Assistance for Project Formation (SAPROF) for
Uttar Pradesh Natural Resources Management and Poverty Alleviation Project (UPNRMPAP)
Final Report-Volume II ii
Attachments
Attachment A1.3-1 Per capita Income in UP Compared with Other States ...Annex 1 -A1 Attachment A1.3-2 Consumer Price Index in Rural Areas of UP over the Period 1986/87
to 1999/2000 .................................................................. Annex 1 -A 1 Attachment A1.3-3: Relevant Articles on Scheduled Castes (SC) and Scheduled Tribes
(ST) in the Constitution of India.................................... Annex 1 -A 2 Attachment A1.3-4 List of Notified Scheduled Castes and Scheduled Tribes in Uttar
Pradesh........................................................................... Annex 1 -A 3 Attachment A1.3-5 District-wise Percentage of BPL Households and Population in
Rural Uttar Pradesh........................................................ Annex 1 -A 4 Attachment A1.5-1 District-wise Land-use of Uttar Pradesh State (2002/03) .................... ....................................................................................... Annex 1 -A 6 Attachment A1.5-2 Major Soils in Uttar Pradesh.......................................... Annex 1 -A 8 Attachment A1.5-3 Average Monthly Rainfall (Based on observations from 1952-1980)
..................................................................................... Annex 1 -A 10 Attachment A1.5-4 Average Monthly Maximum & Minimum Temperature (Based on
observations from 1952-1980)..................................... Annex 1 -A 11 Attachment A1.5-5 Average Monthly Relative Humidity (Based on observations from
1952-1980)................................................................... Annex 1 -A 12 Attachment A1.5-6 Salient Features about Flood Damage in the State of Uttar Pradesh ...
..................................................................................... Annex 1 -A 13 Attachment A1.5-7 Effect of Drought on Agriculture of Districts of UP (October 2004)
..................................................................................... Annex 1 -A 14 Attachment A1.6-1 Activities of Department of Animal Husbandry .......... Annex 1 -A 15 Attachment A1.7-1 Scheme-wise Outlay, Budget Provision, and Expenditure for Plan
Scheme in UPFD under 10th Five Year Plan............... Annex 1 -A 16 Attachment A1.7-2 Description of Major Plantation Scheme- under 10th Five Year Plan
..................................................................................... Annex 1 -A 21 Attachment A1.7-3 Scheme-wise Proposed Financial Outlay for 11th Five Year Plan
..................................................................................... Annex 1 -A 23
For Official Use Only Special Assistance for Project Formation (SAPROF) for
Uttar Pradesh Natural Resources Management and Poverty Alleviation Project (UPNRMPAP)
Final Report-Volume II Annex 1-1
ANNEX 1 THE STUDY AREA (THE STATE OF UTTAR PRADESH)
1. Size, Location and Topography
The state of Uttar Pradesh covers geographical area of 240,928 km2, which comprises 7 % of the total geographical area of India. The State has no coastline, and located in the north-eastern part of the country (Location Map). Uttar Pradesh lies between latitudes 23° 52’ N - 30° 25’ N and longitudes 77° 05’ E - 84° 38’ E, and shares an international border with Nepal on the north. Uttar Pradesh is bounded by the state of Uttarakhand to the north, the State of Haryana, Delhi, and Rajasthan in the east, the sate of Madhya Pradesh and Chhattisgarh in the south and southeast, and the state of Jharkhand and Bihar to the west and southwest.
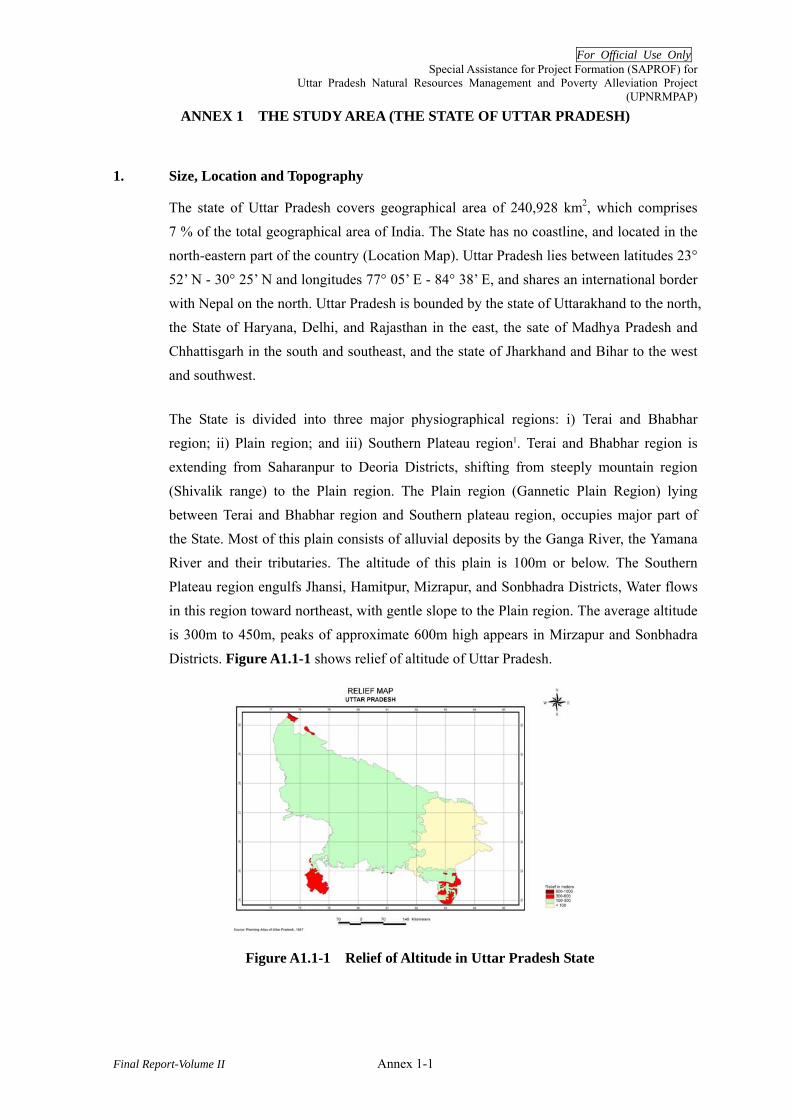
The State is divided into three major physiographical regions: i) Terai and Bhabhar region; ii) Plain region; and iii) Southern Plateau region1. Terai and Bhabhar region is extending from Saharanpur to Deoria Districts, shifting from steeply mountain region (Shivalik range) to the Plain region. The Plain region (Gannetic Plain Region) lying between Terai and Bhabhar region and Southern plateau region, occupies major part of the State. Most of this plain consists of alluvial deposits by the Ganga River, the Yamana River and their tributaries. The altitude of this plain is 100m or below. The Southern Plateau region engulfs Jhansi, Hamitpur, Mizrapur, and Sonbhadra Districts, Water flows in this region toward northeast, with gentle slope to the Plain region. The average altitude is 300m to 450m, peaks of approximate 600m high appears in Mirzapur and Sonbhadra
Districts. Figure A1.1-1 shows relief of altitude of Uttar Pradesh.
Figure A1.1-1 Relief of Altitude in Uttar Pradesh State
For Official Use Only Special Assistance for Project Formation (SAPROF) for
Uttar Pradesh Natural Resources Management and Poverty Alleviation Project (UPNRMPAP)
Final Report-Volume II Annex 1-2
2 Administration
2.1 State Administrative Structure
The administrative structure in the State consists of a number of offices and key officers
with different functions to run the State Government. Table 2-1 shows the overview of state administrative structure.
Table A1.2-1 State Administrative Structure Office/Officer Description
High Court Situated in the city of Allahabad, with a bench in capital city of Lucknow by the provision of Constitution of India.
Legislative Assembly (Vidhan Sabha)
It contains 403 elected members and one nominated Anglo-Indian member2 with a 5-year term.
Legislative Council (Vidhan Parishad)
It contains 100 members both elected and nominated for a 6-year term; one-third of them retire after every 2 years3.
Governor Appointed by the President of India; Head of the Government of Uttar Pradesh (GOUP).
Chief Minister Chief of political executive of the State; Elected representative of Legislative Assembly and the leader of the majority political party or the majority coalition of political parties of the Legislative Assembly. Chief Minister is appointed by the Governor.
Council of Ministers Council of Ministers is appointed by the Governor on the advice of the Chief Minister. The size of the Council of Ministers shall not exceed 15% of the total number of members of the Legislative Assembly of the State4. The size of the Council of Ministers in the State should not be more than 60.
Chief Secretary Head of the bureaucracy entrusted with duties and responsibilities to assist the Chief Minister and Council of Ministers and coordination among the various departments.
There are 77 departments to manage the functioning of GOUP. Each department is headed by either Principal Secretary or Secretary, who is from the Indian Administrative Services (IAS) or promoted senior officers from the State Civil Services cadre.
2.2 Administrative System
The State is divided into administrative units at various levels from Division to Gram
Panchayat. The numbers of each administrative unit are shown in Table 2-2.
Table A1.2-2 Number of each Administrative Unit Division District Tehsil5 Block Gram Panchayat Villages
17 70 303 813 52,000 104,440 Source: Census 2001
1 UTTAR PRADESH 2006, Information and Public Relations Department Utar Pradesh, Lucknow, 2006 2 Source – http://uplegisassembly.gov.in 3 Source – The Uttar Predesh Reorganisation Act, 2000 4 Source – The Constitution (Ninety-First Amendment) Act, 2003 5 Tehsil means Sub-Division; few sub-divisions make a district

For Official Use Only Special Assistance for Project Formation (SAPROF) for
Uttar Pradesh Natural Resources Management and Poverty Alleviation Project (UPNRMPAP)
Final Report-Volume II Annex 1-3
Each Division is administered by the Divisional Commissioner. Each District is administered by the District Magistrate cum Collector. The Sub-Divisional Officer manages a Tehsil . Block is administered by the Block Development Officer.
2.3 Panchayati Raj Institutions
The Panchayati Raj Institutions in India is a political hierarchy system to realize a
democratic society in the country (Figure 2-1). It had been practiced in the State since December 7th, 1947 by promulgation of Unified Provinces Panchayati Raj Act. The three-tier Panchayat Raj Institution (PRI) system has been in place since the adoption of the 73rd amendment of Constitution of India in the State.
Note: “Gram” literary means “village”. A Gram Panchayat under the PRI system is an artificial creation in
which a number of natural villages and hamlets are bundled together for administrative purposes. There are 97,134 natural villages existing in UP.
Figure A1.2-1 Structure and Composition of PRI
At each tier, there are six permanent committees (samity) for supervising the implementation of the development activities, and one of the elected members chairs the
committee. The permanent committees and their functions are summarised in Table A1 2-3.
Gram level
Block level
District level
Composition
Pramukh (head), Senior & Junior Deputy Pramukh,
Member Secretary – Block
Pradhan (head), Up-Pradhan, Panchayat Secretary –Development
Officer
Chairperson, Deputy Chairperson, Member Secretary – Chief Development
Officer
Zilla Panchayat (District Assembly)
Kshetra Panchayat (Block-level Assembly)
Gram Panchayat (Gram-level Assembly)

For Official Use Only Special Assistance for Project Formation (SAPROF) for
Uttar Pradesh Natural Resources Management and Poverty Alleviation Project (UPNRMPAP)
Final Report-Volume II Annex 1-4
Table A1.2-3 Permanent Committees and their Functions Sr. No
Name of Committee Functions
1 Construction work
Monitoring and supervision of all types of construction and maintenance.
2 Administrative Subject related to management of Panchayat-level functionaries of various departments. Monitoring of fair price shops.
3 Education Execution and monitoring of various programmes related with primary, upper primary, informal education and literacy programme.
4 Health & welfare
Monitoring of programmes related to medical health & family welfare.
5 Water management
Execution and monitoring of drinking water and sanitation programmes.
6 Planning & development
Preparation of development plans and execution of these plans.
After the constitutional amendment, first general elections were held in the year 1995. Thereafter, second general elections were held in the year 2000. In the months of August 2005 elections to 52,000 Gram Panchayats were completed and elections to 820 Kshtera Panchayats and 70 Zila Panchayats have also been held in October 2005.
The Article 243 (G) of the 73rd Constitutional Amendment delineates the powers and responsibilities that are devolved to Gram Panchayat in order to make them effective institutions for local self-governments. In each state, the state government has to implement the provisions of the Article 243 (G), whereby the function of all the 29th subjects mentioned in the 11th Schedule of the Constitution of India need to be devolved
Total number of representative elected in 2005 election Total elected member in Zilla Panchayat = 2631 Total elected member in Kshetra Panchayat = 65,004 Total elected member in Gram Panchayat = 654,637 % of women representative elected in 2005 election Chairperson of Zilla Panchayat = 76% Member of Zilla Panchayat = 40% Pramukh (head) of Kshetra Panchayat = 51% Member of Kshetra Panchayat = 37% Pradhan (head) of Gram Panchayat = 50% Member of Gram Panchayat = 38% Size of Gram Panchayat ≤ 1,000 population = 829 1,001 – 2,000 population = 32,541 2,001 – 3,000 population = 11,517 3,001 – 5,000 population = 5,519 5,001 – 10,000 population = 1,457 ≥ 10,000 population = 137 Source: Panchayati Raj Institutions: An Approach to the 11th Five Year Plan; Panchayati Raj Department, Government of Uttar Pradesh

For Official Use Only Special Assistance for Project Formation (SAPROF) for
Uttar Pradesh Natural Resources Management and Poverty Alleviation Project (UPNRMPAP)
Final Report-Volume II Annex 1-5
to PRIs. However, only 16 functions have been transferred to the PRIs so far in the State, and only 10 funds for the 16 functions have been vested to the same as shown in
Table A1.2-4.
Table A1.2-4 Functions and Funds Transferred to the PRIs6 in Uttar Pradesh 1 Functions i. Poverty Alleviation Programmes;
ii. Operations & Maintenance of Rural Water Supply; iii. Operations and Maintenance of Rural Markets and Fairs; iv. Basic Education Including Mid-day Meal Programme; v. Rural Sanitation Programme; vi. Women & Child Welfare - Construction of Anganwadi Centre; vii. Welfare Programme for SC, ST and Other Weaker Sections – Selection
of Pensioners and distribution of Scholarships; viii. Food and Civil Supplies – Supervision of public distribution system
(PDS) and Jan Kerosene Programme; ix. Maintenance of Assets Created in Panchayat Areas; x. Rural library; xi. Youth Welfare Programmes at village-level; xii. Rural Housing Schemes – Selection of Beneficiary; xiii. Minor Irrigation - Selection of Beneficiary; xiv. Maintenance of Assets Created under Sodic Land Reclamation Project;xv. Verification of Functioning of PHCs7 to Kshetra Panchayat; xvi. Maintenance of Seed Stores etc., to Kshetra Panchayats;
2 Funds i. Poverty Alleviation Programmes; ii. Rural Water Supply – Operations & Maintenance; iii. Construction & Maintenance of Rural Markets & Fairs; iv. Rural Sanitation programme; v. Construction of Anganwadi Centre vi. Distribution of scholarships; vii. Maintenance of assets created in villages through various programmes;viii. Rural library; ix. Youth Welfare programmes; x. Maintenance of Street light
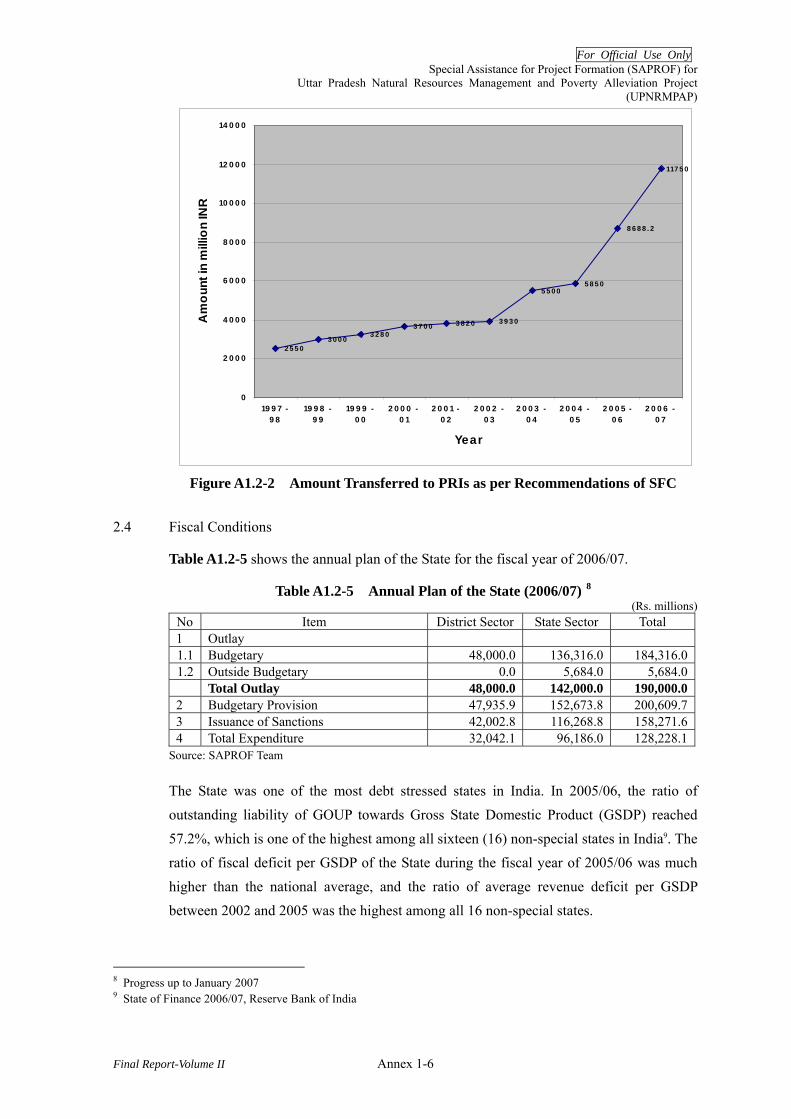
The Article 243 (I) of the 73rd Constitutional Amendment provides the provisions for the constitutions of a State finance commission (SFC) to review the financial conditions of the PRIs. GOUP has accepted the recommendations and has devolved 5% of the State net income from taxes to the PRIs. The amount transferred so far to the PRIs as per
recommendations of SFC are shown in Figure A1.2-2.
6 Source – Panchayati Raj Institutions – An Approach to the 11th Five Year Plan, Panchayati Raj Department,
Government of Uttar Pradesh 7 PHC = Primary Health Center
For Official Use Only Special Assistance for Project Formation (SAPROF) for
Uttar Pradesh Natural Resources Management and Poverty Alleviation Project (UPNRMPAP)
Final Report-Volume II Annex 1-6
2 5 5 03 0 0 0
3 2 8 03 7 0 0 3 8 2 0 3 9 3 0
5 5 0 05 8 5 0
8 6 8 8 . 2
117 5 0
0
2 0 0 0
4 0 0 0
6 0 0 0
8 0 0 0
10 0 0 0
12 0 0 0
14 0 0 0
19 9 7 -9 8
19 9 8 -9 9
19 9 9 -0 0
2 0 0 0 -0 1
2 0 0 1 -0 2
2 0 0 2 -0 3
2 0 0 3 -0 4
2 0 0 4 -0 5
2 0 0 5 -0 6
2 0 0 6 -0 7
Year
Am
ount
in m
illio
n IN
R
Figure A1.2-2 Amount Transferred to PRIs as per Recommendations of SFC
2.4 Fiscal Conditions
Table A1.2-5 shows the annual plan of the State for the fiscal year of 2006/07.
Table A1.2-5 Annual Plan of the State (2006/07) 8 (Rs. millions)
No Item District Sector State Sector Total 1 Outlay 1.1 Budgetary 48,000.0 136,316.0 184,316.01.2 Outside Budgetary 0.0 5,684.0 5,684.0 Total Outlay 48,000.0 142,000.0 190,000.02 Budgetary Provision 47,935.9 152,673.8 200,609.73 Issuance of Sanctions 42,002.8 116,268.8 158,271.64 Total Expenditure 32,042.1 96,186.0 128,228.1
Source: SAPROF Team
The State was one of the most debt stressed states in India. In 2005/06, the ratio of outstanding liability of GOUP towards Gross State Domestic Product (GSDP) reached 57.2%, which is one of the highest among all sixteen (16) non-special states in India9. The ratio of fiscal deficit per GSDP of the State during the fiscal year of 2005/06 was much higher than the national average, and the ratio of average revenue deficit per GSDP between 2002 and 2005 was the highest among all 16 non-special states.
8 Progress up to January 2007 9 State of Finance 2006/07, Reserve Bank of India
For Official Use Only Special Assistance for Project Formation (SAPROF) for
Uttar Pradesh Natural Resources Management and Poverty Alleviation Project (UPNRMPAP)
Final Report-Volume II Annex 1-7
However, GOUP took a significant step toward correcting revenue deficit in 2006/07. GOUP has proposed a budget for revenue surplus in 2006/07 with a correction of Rs.42,550 million of fiscal deficit. This attempt seems to succeed, though the final account of financial status in 2006/07 is not yet available.
More disciplined fiscal policy of the State started when GOUP has enacted The Uttar Pradesh Fiscal Responsibility and Budget Management Act, 2004 through the gazette notification. It intends to provide the responsibility of GOUP to ensure fiscal stability and sustainability, and also to enhance the scope for improving social and physical infrastructure and human development by achieving sufficient revenue surplus, reducing fiscal deficit and removing impediments to the effective conduct of fiscal policy and prudent debt management10.
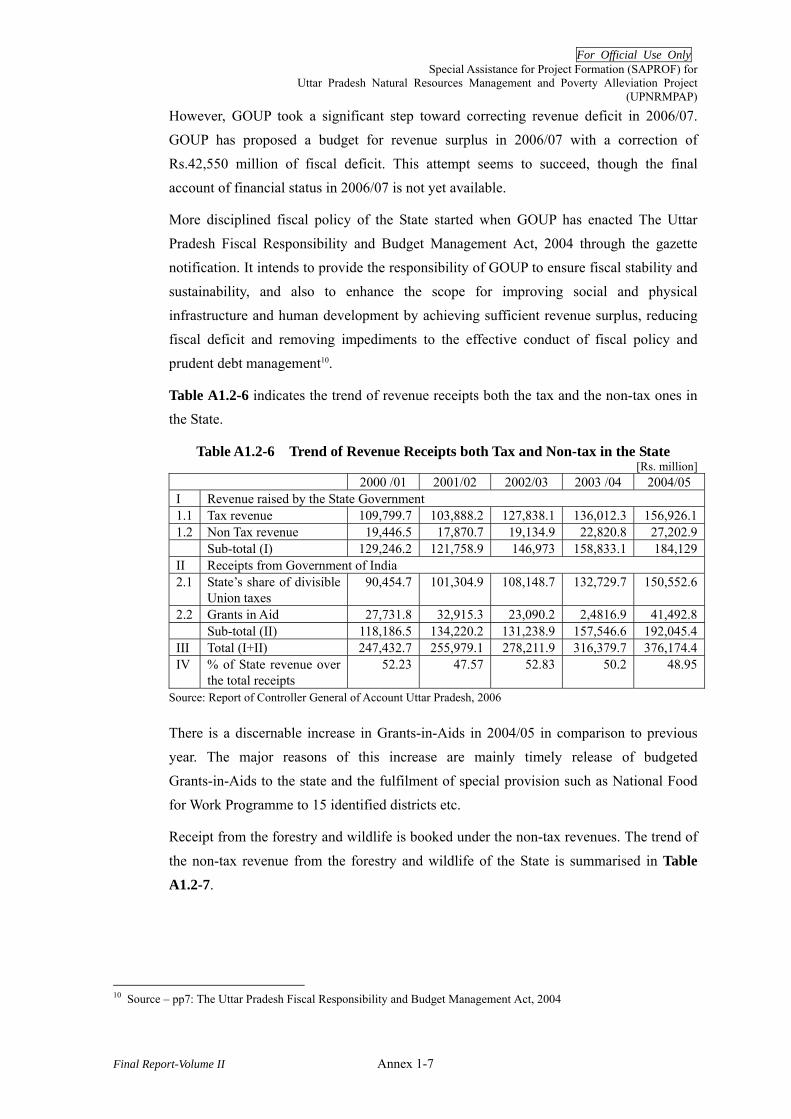
Table A1.2-6 indicates the trend of revenue receipts both the tax and the non-tax ones in the State.
Table A1.2-6 Trend of Revenue Receipts both Tax and Non-tax in the State [Rs. million]
2000 /01 2001/02 2002/03 2003 /04 2004/05 I Revenue raised by the State Government 1.1 Tax revenue 109,799.7 103,888.2 127,838.1 136,012.3 156,926.11.2 Non Tax revenue 19,446.5 17,870.7 19,134.9 22,820.8 27,202.9 Sub-total (I) 129,246.2 121,758.9 146,973 158,833.1 184,129II Receipts from Government of India 2.1 State’s share of divisible
Union taxes 90,454.7 101,304.9 108,148.7 132,729.7 150,552.6
2.2 Grants in Aid 27,731.8 32,915.3 23,090.2 2,4816.9 41,492.8 Sub-total (II) 118,186.5 134,220.2 131,238.9 157,546.6 192,045.4III Total (I+II) 247,432.7 255,979.1 278,211.9 316,379.7 376,174.4IV % of State revenue over
the total receipts 52.23 47.57 52.83 50.2 48.95
Source: Report of Controller General of Account Uttar Pradesh, 2006
There is a discernable increase in Grants-in-Aids in 2004/05 in comparison to previous year. The major reasons of this increase are mainly timely release of budgeted Grants-in-Aids to the state and the fulfilment of special provision such as National Food for Work Programme to 15 identified districts etc.
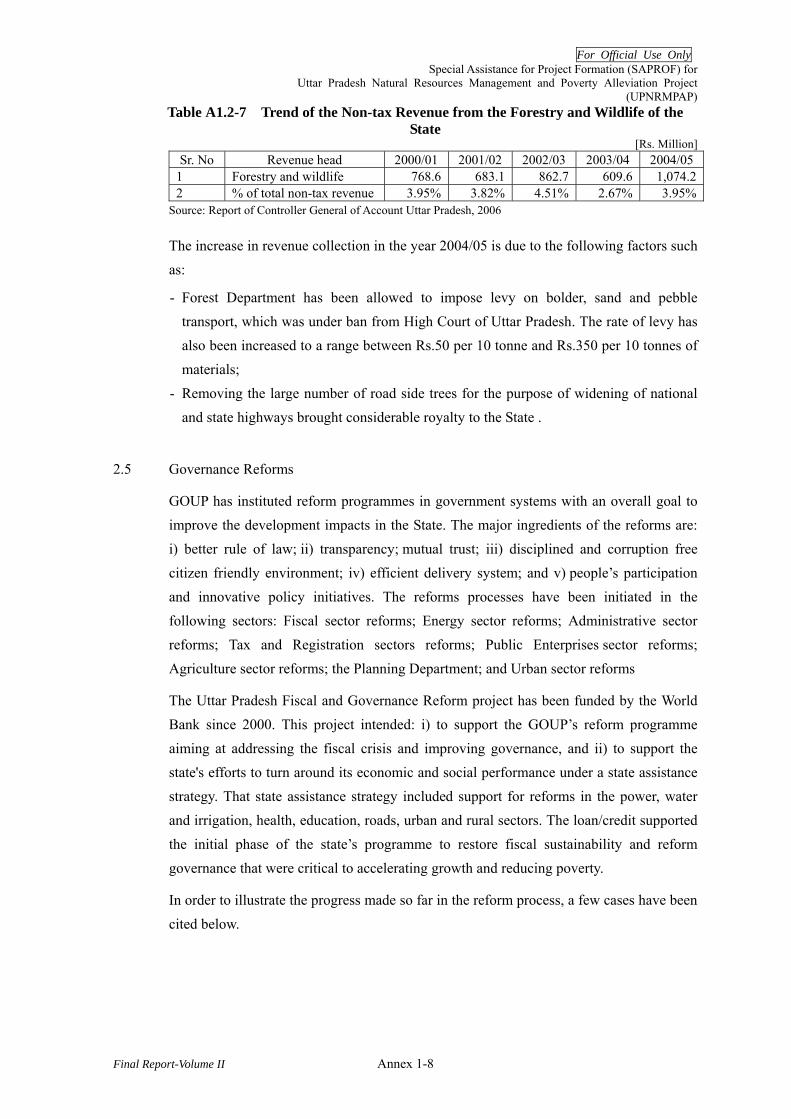
Receipt from the forestry and wildlife is booked under the non-tax revenues. The trend of
the non-tax revenue from the forestry and wildlife of the State is summarised in Table A1.2-7.
10 Source – pp7: The Uttar Pradesh Fiscal Responsibility and Budget Management Act, 2004
For Official Use Only Special Assistance for Project Formation (SAPROF) for
Uttar Pradesh Natural Resources Management and Poverty Alleviation Project (UPNRMPAP)
Final Report-Volume II Annex 1-8
Table A1.2-7 Trend of the Non-tax Revenue from the Forestry and Wildlife of the State
[Rs. Million] Sr. No Revenue head 2000/01 2001/02 2002/03 2003/04 2004/05
1 Forestry and wildlife 768.6 683.1 862.7 609.6 1,074.22 % of total non-tax revenue 3.95% 3.82% 4.51% 2.67% 3.95%
Source: Report of Controller General of Account Uttar Pradesh, 2006
The increase in revenue collection in the year 2004/05 is due to the following factors such as:
- Forest Department has been allowed to impose levy on bolder, sand and pebble transport, which was under ban from High Court of Uttar Pradesh. The rate of levy has also been increased to a range between Rs.50 per 10 tonne and Rs.350 per 10 tonnes of materials;
- Removing the large number of road side trees for the purpose of widening of national and state highways brought considerable royalty to the State .
2.5 Governance Reforms
GOUP has instituted reform programmes in government systems with an overall goal to improve the development impacts in the State. The major ingredients of the reforms are: i) better rule of law; ii) transparency; mutual trust; iii) disciplined and corruption free citizen friendly environment; iv) efficient delivery system; and v) people’s participation and innovative policy initiatives. The reforms processes have been initiated in the following sectors: Fiscal sector reforms; Energy sector reforms; Administrative sector reforms; Tax and Registration sectors reforms; Public Enterprises sector reforms; Agriculture sector reforms; the Planning Department; and Urban sector reforms
The Uttar Pradesh Fiscal and Governance Reform project has been funded by the World Bank since 2000. This project intended: i) to support the GOUP’s reform programme aiming at addressing the fiscal crisis and improving governance, and ii) to support the state's efforts to turn around its economic and social performance under a state assistance strategy. That state assistance strategy included support for reforms in the power, water and irrigation, health, education, roads, urban and rural sectors. The loan/credit supported the initial phase of the state’s programme to restore fiscal sustainability and reform governance that were critical to accelerating growth and reducing poverty.
In order to illustrate the progress made so far in the reform process, a few cases have been cited below.

For Official Use Only Special Assistance for Project Formation (SAPROF) for
Uttar Pradesh Natural Resources Management and Poverty Alleviation Project (UPNRMPAP)
Final Report-Volume II Annex 1-9
(1) Poverty and Social Monitoring of the Planning Department
- Implementation of public discussion and dissemination of the results of the first baseline survey carried out in 2000/01;
- Launching of the second poverty and social monitoring survey
(2) Reforms Measures undertaken by the Vigilance Department
- Piloting of the Anti-corruption Action Plan in three or four selected sectors such as trade tax, stamp, registration, revenue;
- GOUP has approved the Anti-corruption Action Plan and published it; - Strengthening of core accountability agencies was done in the year 2000/01.
Budgetary support for strengthening of such agencies is maintained; - Anti-corruption functions in departments are being strengthened through the
institution of Vigilance Officers/ CVOs11; - At the UPFD, a Chief Conservator of Forest (Administration) has been
appointed as Vigilance Officer of the department through the Government Order of Chief Secretary, Government of Uttar Pradesh vide 837/39-4-2001 which become effective from May 15, 2001
(3) Fiscal consolidation by the Finance Department
- Revised Medium-Term Fiscal Framework (MTFF) has been published for the State for the period of 2001-07, that includes: i) increase in own revenue as share of GSDP12 annually; ii) reduction in the revenue deficit as the ratio of revenue receipts by at least 5% points annually; iii) reduction in the consolidated public sector deficit (including power sector deficit) as the ratio of GSDP annually; iv) revised level of budget support to the power sector consistent with the revised business case and with other public expenditure priorities; v) improved allocations for education and health, non-wage O&M in irrigation and roads, etc.; and vi) stabilization of debt and debt servicing ratio before 2005/06. The State Cabinet has ratified it.
- The Uttar Pradesh Fiscal Responsibility and Budget Management Act, 2004 has been enacted.
- Strengthening of procurement procedures (using the findings of the Procurement Audit) has been done by establishing and publishing: i) standard terms and conditions for all contracts for procurement of goods and services; ii) a Government Purchase Manual for procurement of goods and services by all departments of GOUP.
11 CVO = Central Vigilance Officer 12 GSDP = Gross State Domestic Product
For Official Use Only Special Assistance for Project Formation (SAPROF) for
Uttar Pradesh Natural Resources Management and Poverty Alleviation Project (UPNRMPAP)
Final Report-Volume II Annex 1-10
- A state-wide information and publication system including the past performance of suppliers/contractors has been developed. Each department will need to maintain a centralized information system related to the respective departments.
- A Government Order has been proclaimed that provides for stiff penalties and an independent appeal process, and places tenders and decisions on tender bulletin open to the public via the internet and other means. The implementation of the order has partially been done.
- The Government Order regarding transparency in tenders and publishing them through the web site has already been issued by the Finance Department in April 2001.
3 Socio-Economy
3.1 State Domestic Product and Other Major Economic Indicators
The State has long been the granary of India. In spite of, or maybe because of, its success in establishing agriculture-dominant state, the State has been struggling in its economic development.
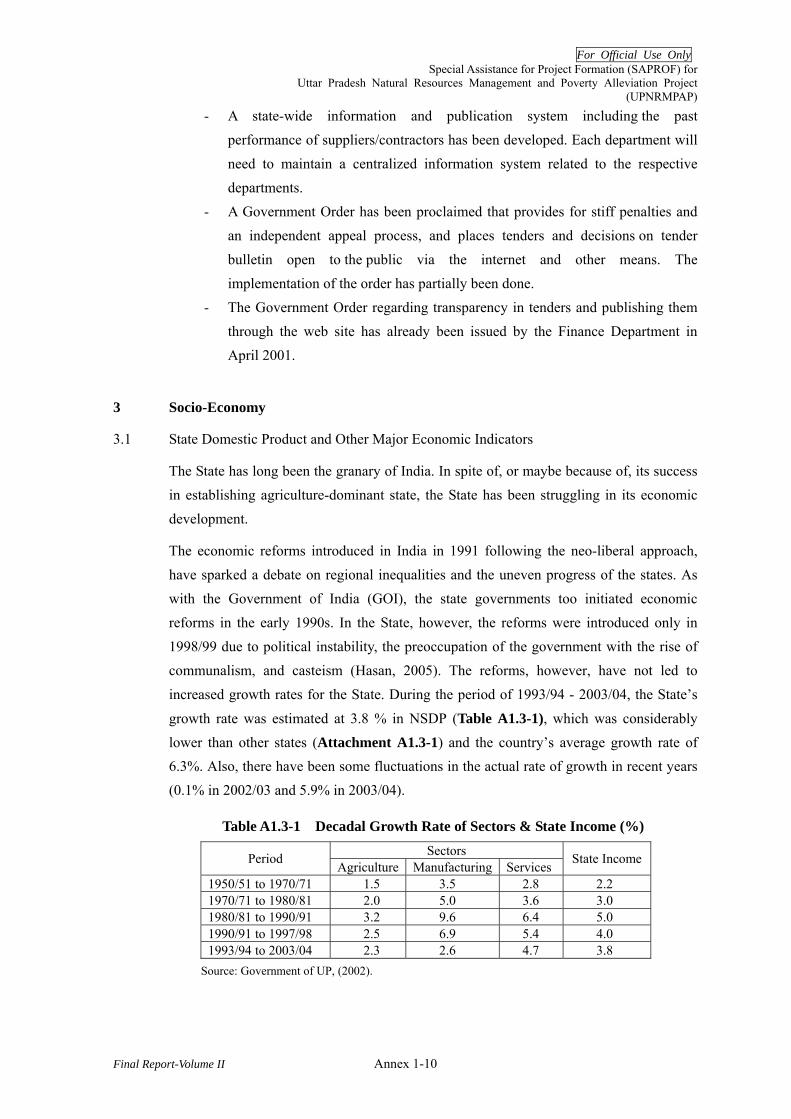
The economic reforms introduced in India in 1991 following the neo-liberal approach, have sparked a debate on regional inequalities and the uneven progress of the states. As with the Government of India (GOI), the state governments too initiated economic reforms in the early 1990s. In the State, however, the reforms were introduced only in 1998/99 due to political instability, the preoccupation of the government with the rise of communalism, and casteism (Hasan, 2005). The reforms, however, have not led to increased growth rates for the State. During the period of 1993/94 - 2003/04, the State’s
growth rate was estimated at 3.8 % in NSDP (Table A1.3-1), which was considerably lower than other states (Attachment A1.3-1) and the country’s average growth rate of 6.3%. Also, there have been some fluctuations in the actual rate of growth in recent years (0.1% in 2002/03 and 5.9% in 2003/04).
Table A1.3-1 Decadal Growth Rate of Sectors & State Income (%)
Sectors Period Agriculture Manufacturing Services State Income
1950/51 to 1970/71 1.5 3.5 2.8 2.2 1970/71 to 1980/81 2.0 5.0 3.6 3.0 1980/81 to 1990/91 3.2 9.6 6.4 5.0 1990/91 to 1997/98 2.5 6.9 5.4 4.0 1993/94 to 2003/04 2.3 2.6 4.7 3.8
Source: Government of UP, (2002).

For Official Use Only Special Assistance for Project Formation (SAPROF) for
Uttar Pradesh Natural Resources Management and Poverty Alleviation Project (UPNRMPAP)
Final Report-Volume II Annex 1-11
The State’s NSDP in 2002/03 was estimated as Rs 1,704 million (US$ 36.26 billion).
While the per capita net state domestic product (NSDP) in the State (at current prices) became more than doubled from Rs.5,066 in 1993/94 to Rs.11,477 in 2004/05 (an increase of 1.4% per annum in real per capita terms), it shows an indication of some improvement in average living standards. However, the corresponding all-India average figure for 2004/05 is Rs.23,24113, and the gap between the two are widening each year
(Figure A1.3-1).
11,47710,637
9,9639,3209,1628,970
8,470
5,0666,331
7,476 7,826
23,24
1
20,98
9
19,04
0
17,82
3
16,55
5
15,62
5
14,39
6
12,70
7
11,56
4
10,14
9
7,690
0
5000
10000
15000
20000
25000
1993-94 1995-96 1996-97 1997-98 1998-99 1999-2000 2000-01 2001-02 2002-03 2003-04 2004-05
Uttar Pradesh All India
Source: Hand Book of Statistics on the Indian Economy, RBI 2005-06
Figure A1.3-1 Per Capita NSDP of UP vis-à-vis NNP at Current Prices (1993-94 Series)
The State’s per capita Non-Tax revenue is the lowest among all non-special category states in the country, standing at Rs.474 in 2005/06 (Revised estimates), and Rs.624 in 2006/07 (budgeted estimates) – compare this with the average of all states – Rs.1,235 is 2005/06 (R.E.) and Rs.1,336 in 2006/07.
While banks still remain the major source of credit to the State, and other sources like capital market and development financial institutions (DFIs) formed only a miniscule proportion of total credit, the bank credit to the State in the post-reform period is lower than in the pre-reform period. Umesh (2006)14 reports that credit has declined in the rural areas and increased significantly to the services sector in urban areas. The total credit to
13 Revised Estimates, Directorate of Economics and Statistics, GoI, 2005 14 Umesh Rashmi, 2006. Economic Reforms and the Less Developed Regions: A Study of Uttar Pradesh in India. Paper
presented to the 16th Biennial Conference of the Asian Studies Association of Australia in Wollongong 26 June - 29 June 2006.

For Official Use Only Special Assistance for Project Formation (SAPROF) for
Uttar Pradesh Natural Resources Management and Poverty Alleviation Project (UPNRMPAP)
Final Report-Volume II Annex 1-12
the State in 1972 was 4.9 %. In 2004 this has gone down to 4.5 % i.e., the share has even reduced from its level in 1972.
The growth-inflation trade-off is a matter of controversy in development economics; however, the rate of inflation continues to be used as a measure of economic performance. The rate of inflation in the country (national average) for the period 2000/01-2004/05 is
shown in Table A1.3-2.
Table A1.3-2 Inflation Rate in India based on Wholesale Price Index (Base Price: 1993-94=100)
Inflation Rate | Year Unit 2000-01 2001-02 2002-03 2003-04 2004-05Point-to-point % 4.9 1.6 6.5 4.6 5.0
Average % 7.2 3.6 3.5 5.4 6.4 Source: RBI Bulletin, Reserve Bank of India
The national annual point-to-point inflation rate based on wholesale price index (WPI) stood at 6.46 % for the week ended March 10, 2007, which was 3.80 % lower than the rate during the corresponding week last year. At the State level, there is no direct measure of inflation.
The Consumer Price Index (CPI) for Agricultural & Rural Labourers is often used as a
proxy for rural inflation rates (Table A1.3-3).
Table A1.3-3 Consumer Price Index for Agricultural & Rural Labourers in February 2007 (Base Price: 1986/87=100)
Sl CPI15 Agricultural Labourers
Rural Labourers
Industrial Workers (Base Price 2001=100)
1 Uttar Pradesh 412 412 126 – 132 (for different Centres) 2 India 392 393 128
Source: RBI Bulletin, Reserve Bank of India
The variation in CPI in rural areas of the State over the last two decades is shown in
Attachment A1.3-2.
3.2 Demography and Unemployment
With its population of 166.2 million (Census 2001), UP is the most populous state in the country, accounting for 16.2 % of India’s population. The population of UP was 139.1 million in 1991 (Census 1991). Over one-fifth (21%) of the population belongs to the Scheduled Caste (SC) category16, with 66 social groups that have been notified as SC in
15 CPI numbers for Industrial Workers is released on the last working day of the succeeding month; CPI numbers for
Agricultural and Rural Labourers is released on the 20th day of the succeeding month 16 Relevant Articles on Scheduled Castes (SC) and Scheduled Tribes (ST) in the Constitution of India are shown in
Attachment A1 2.3-3.

For Official Use Only Special Assistance for Project Formation (SAPROF) for
Uttar Pradesh Natural Resources Management and Poverty Alleviation Project (UPNRMPAP)
Final Report-Volume II Annex 1-13
the State in accordance with the Scheduled Castes and Scheduled Tribes Orders (Amendment) Act, 1976. This ratio has been almost unchanged sine 1991 Census. A number of these social groups are in fact tribes, and notified as Scheduled Tribes (STs) in neighbouring states. In UP, only 0.1% of the population, belonging to five different tribal
groups, has been notified as ST (Attachment A1.3-4).
Information on major demographic indicators for the State is provided in Table A1.3-4.
Table A1.3-4 Some Important Demographic Indicators for UP vis-à-vis India
Sl Indicator Reference Year Value
UP India 1 Population density (persons per sq.km) 2001 689 3252 Sex Ratio (Number of females/ 1,000 males) 2001 898 9332a Sex Ratio – Rural (Number of females/ 1,000 2001 904 9462b Sex Ratio – Urban (Number of females/ 1,000 2001 876 9002c Sex Ratio – Scheduled Caste Population 2001 900 N.A.2d Sex Ratio – Scheduled Tribe Population 2001 934 N.A.3 Rural population (%) 2001 79.2 72.14 Decadal population growth rate (%) 1991-2001 25.82 21.35 Scheduled Caste population (% of Total) 2001 21.1 16.26 Scheduled Tribe population (% of Total) 2001 0.1 8.27 Birth Rate (per 1,000 population) 2005 30.4 23.87a Birth Rate – Rural (per 1,000 population) 2005 31.3 25.67b Birth Rate – Urban (per 1,000 population) 2005 26.5 19.18 Death Rate (per 1,000 population) 2005 8.7 7.68a Death Rate – Rural (per 1,000 population) 2005 9.1 8.18b Death Rate – Urban (per 1,000 population) 2005 6.8 6.09 Infant Mortality Rate (per 1,000 births) 2005 73 589a Infant Mortality Rate - Rural (per 1,000 births) 2005 77 649b Infant Mortality Rate - Urban (per 1,000 births) 2005 54 4010 Literacy rate (%) 2001 56.27 64.811 Gender gap in literacy (%) 2001 27.25 21.612 Population below poverty line (%) 2002/ (2005)a 29.02 26.1
(1999- 2000)
13 Workers (% of population) 2001 32.5 39.113a Main workers (% of population) 2001 23.7 30.413b Marginal workers (% of population) 2001 8.8 8.714 Number of Households 2001 25,757 193,579
a Though referred to as the BPL 2002 Census, this census was stalled after its start and re-initiated/completed in 2005 Source: Census 2001; NSS Report, 60th Round; PSMS-II, 2006; SRS Bulletin, Oct 2006
The work participation rate was 32.5 % and the total number of workers in the State was 53.98 million in 2001, an increase of 12 million over 1991. However, the annual growth

For Official Use Only Special Assistance for Project Formation (SAPROF) for
Uttar Pradesh Natural Resources Management and Poverty Alleviation Project (UPNRMPAP)
Final Report-Volume II Annex 1-14
rate of total workers during this decade declined from 2.78 % in the previous decade to 2.55 %, indicating a deceleration in employment generation in the State. This is further corroborated by the increase in the share of marginal workers to total workers17 from 5 % in1981 to 7 and 27 % in the years 1991 and 2001, respectively. Main and marginal
workers in the State are shown in Table A1.3-5.
Table A1.3-5 Main and Marginal Workers in Uttar Pradesh Total workers by year
1991 2001 Growth of
workers (%)Category Number (million) % of Total Number
(million) % of Total 1991-2001
Main workers 38.88 93 39.34 73 0.12 Marginal workers 3.10 7 14.65 27 16.79 Total workers 41.98 100 53.98 100 2.55
Source: Census 2001
The activity-wise distribution of workers in four broad categories for 2001 is as shown in
Figure A1.3-2.
18.48
3.69
5.96
7.44
2.09
0.94
12.81
2.57
0
5
10
15
20
25
Num
ber o
f Wor
kers
(in
mill
ion)
Cultivators Agricultural Labourer Workers in HouseholdIndustries
Other Workers
Main Workers Marginal Workers Figure A1.3-2 Distribution of Main & Marginal Workers in Uttar Pradesh
The data from different rounds of NSS shows a declining trend in self employment and a definite increase is found in the proportion of casual workers18 in the last two decades, from 18.78% in 1987/88 (NSS, 43rd Round) to 20.03% in 1999/2000 (NSS, 55th Round).
17 Total workers comprises marginal and main workers; main workers are those who had worked for the major part of
the year preceding the date of enumeration i.e., those who were engaged in any economically productive activity for 183 days (or six months) or more during the year. Marginal workers are those who worked any time at all in the year preceding the enumeration but did not work for a major part of the year, i.e., those who worked for less than 183 days (or six months)
18 A person who is engaged through an appointment order or otherwise on daily rated basis for rendering casual service (i.e., not on a regular or permanent basis); casual workers are informal workers as they get the wage returns according to the terms of daily or periodic work contract, both in formal and informal sectors. Note: Informal workers are analysed by status in employment - self-employed, regular salary/ wage earner, casual worker etc.
For Official Use Only Special Assistance for Project Formation (SAPROF) for
Uttar Pradesh Natural Resources Management and Poverty Alleviation Project (UPNRMPAP)
Final Report-Volume II Annex 1-15
On the other hand, the self-employed percentage reduced from 71.95 to 69.41%. Of the total number of workers, 96% are engaged in the unorganized sector.
Unemployment rate of labour force increased from 3.2 % in 1987/88 to 3.6 % in 1999/200019 in rural areas, and from 5.0 % to 6.2 % in urban areas over the same period (NSS). The increase in incidence of unemployment in urban areas is a reflection of the increasing trend of migration from rural to urban centres in search of gainful employment, as well as poor infrastructural conditions in rural areas.20
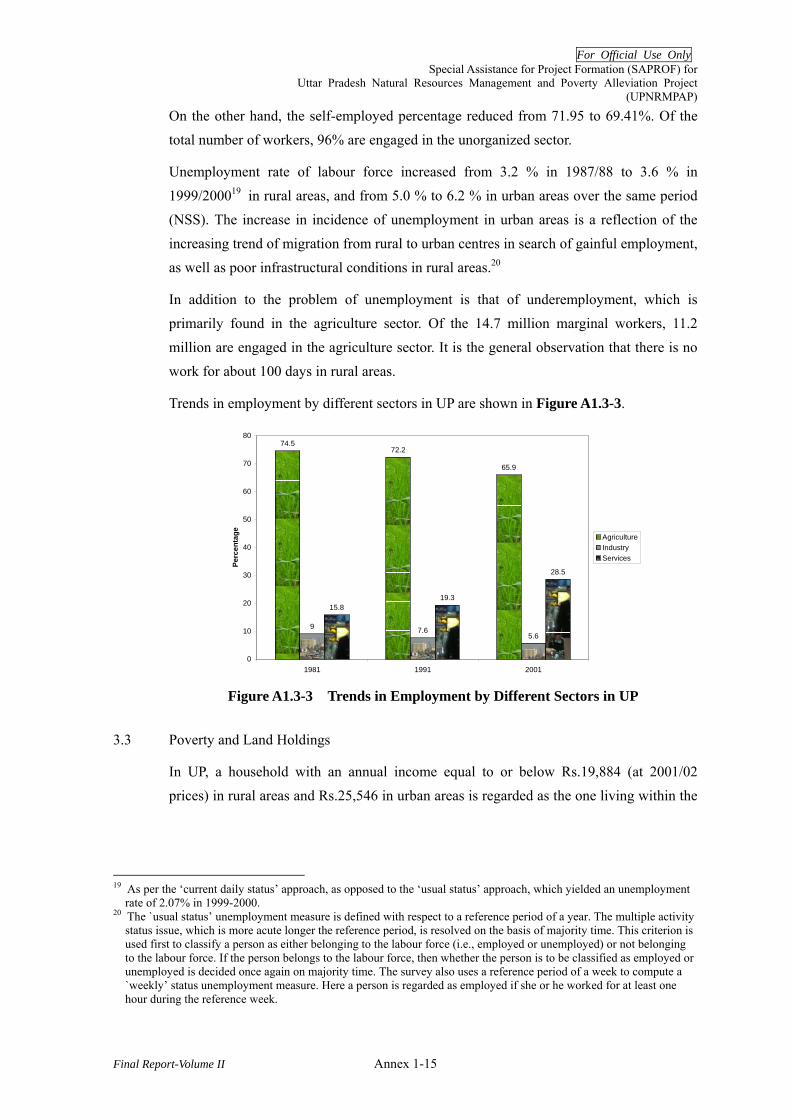
In addition to the problem of unemployment is that of underemployment, which is primarily found in the agriculture sector. Of the 14.7 million marginal workers, 11.2 million are engaged in the agriculture sector. It is the general observation that there is no work for about 100 days in rural areas.
Trends in employment by different sectors in UP are shown in Figure A1.3-3.
74.572.2
65.9
9 7.65.6
15.819.3
28.5
0
10
20
30
40
50
60
70
80
1981 1991 2001
Perc
enta
ge AgricultureIndustryServices
Figure A1.3-3 Trends in Employment by Different Sectors in UP
3.3 Poverty and Land Holdings
In UP, a household with an annual income equal to or below Rs.19,884 (at 2001/02 prices) in rural areas and Rs.25,546 in urban areas is regarded as the one living within the
19 As per the ‘current daily status’ approach, as opposed to the ‘usual status’ approach, which yielded an unemployment
rate of 2.07% in 1999-2000. 20 The `usual status’ unemployment measure is defined with respect to a reference period of a year. The multiple activity
status issue, which is more acute longer the reference period, is resolved on the basis of majority time. This criterion is used first to classify a person as either belonging to the labour force (i.e., employed or unemployed) or not belonging to the labour force. If the person belongs to the labour force, then whether the person is to be classified as employed or unemployed is decided once again on majority time. The survey also uses a reference period of a week to compute a `weekly’ status unemployment measure. Here a person is regarded as employed if she or he worked for at least one hour during the reference week.

For Official Use Only Special Assistance for Project Formation (SAPROF) for
Uttar Pradesh Natural Resources Management and Poverty Alleviation Project (UPNRMPAP)
Final Report-Volume II Annex 1-16
range of poverty21. In absolute terms, the number of poor in the state is 48.8 million; there has been a stronger fall in rural poverty as compared to urban poverty, as a result of which incidence of poverty in urban areas (32.3%) is now more pronounced than in rural areas (28.5%). The poverty line at the all-India level is Rs.19,654 and Rs.27,247 in rural and urban areas respectively.22
Between 1973/74 and 2002/03, the percentage population living below the poverty line (BPL) in the State decreased from 57.07 to 29.02 % (28.5 % in rural area and 32.3% in urban area) (NSSO, various rounds; Planning Commission, GOI, 2000; PSMS-II, 2006). The increasing gap between the State and the national average is as shown in the
following Figure A1.3-4; within a span of 30 years, the State has fallen 5% points behind the national average, whereas it was ahead of it by over 2%, 30 years ago.
Poverty (Percent) in UP and India
19.3
47.07
40.85
31.15
26.1
3638.9
44.5
51.3
49.05
41.46
15
20
25
30
35
40
45
50
55
1977-78 1983-84 1987-88 1993-94 1999-00 2007*
Per
cent
age
Pove
rty
India Uttar Pradesh 2007*: projected
Figure A1.3-4 Poverty in UP and India (%)
The latest available estimates of BPL households based on a survey (BPL Census 2002) conducted by GOUP indicate that the rates of BPL (rural) population and BPL household were pegged at 39% and 42%23, respectively (UP State Government Website). The SC, ST and Other Backward Castes categories comprise 38%,1% and 57%, respectively, of the remainder (4%) belongs to the General Category and other religions. The district-wise
details of BPL households are placed at Attachment A1 3-5.
A Human Poverty Index (HPI) defined by the Planning Commission charts the
21 The GoI Planning Commission methodology for estimation of poor – the population with monthly per capita
expenditure (MPCE) (as calculated by the NSS household consumption surveys) below the level defined by the official poverty line is counted as poor.
22 The ‘poverty line’ at all-India level is worked out from the expenditure class-wise distribution of persons and the poverty ratio at all-India level. The latter is obtained as the weighted average of the State wise poverty ratios.
23 2002 survey conducted by the State government, results published in 2006 – these results are based on a census survey in contrast to the NSS results that are based on a thin sample, and hence are considered more reliable.

For Official Use Only Special Assistance for Project Formation (SAPROF) for
Uttar Pradesh Natural Resources Management and Poverty Alleviation Project (UPNRMPAP)
Final Report-Volume II Annex 1-17
development of the States in the context of deprivation of people in significant human development aspects, including economic, education and health. As per HPI status, the State showed a slight decrease from 54.84 to 48.27 points during the period of 1981-91.
Land distribution in the State is highly skewed, with 3% of rural households owning large24 land holdings, and 13% of the same are landless. Nearly half of the rural households (62% of the poor) owned less than half a hectare of land in 1999/2000. Some 31% of the BPL households in the State are landless, and have no productive assets to help them escape the poverty trap. The State has 6.9 million farmer households under debt in the country, accounting for 40.3% of the farmer households in the State. However, this figure is lower than the national average of 48.6% (MoA, GoI, 2005). The incidence of poverty is found to be the highest among those with marginal and small land holdings.
The average income per worker in the agriculture sector in the State is Rs.6,912, while it is Rs.21,464 for the workers involved in manufacturing and Rs.27,347 for the workers involved in other activities (UP Annual Plan 2006-07, GoUP).
3.4 Gender and Development
‘Gender bias’ is a term commonly used to describe how far behind women remained in seizing opportunities for improving their level of living. Focusing on gender issues in the context of the social sector, development means empowering women as agents of socio-economic change. The status of women in the society remains subordinate to that of men in almost every respect. Some gender-disaggregated socio-economic indicators of
the State are summarised in Table A1.3-6, which are indicative of the poor situation on the gender and development front.
Table A1.3-6 Gender Disaggregated Indicators Sl Indicator Unit, Year Total Male Female1. Infant Mortality Rate per 1,000 births, 2003 76 69 842. Literacy rate %, 2001 56.3 68.8 42.22a Literacy rate – Rural %, 2001 52.5 66.6 36.92b Literacy rate – Urban %, 2001 69.8 76.8 61.73. Work Participation Rate (WPR) % of population, 2001 32.5 46.8 16.53a WPR - Rural % of population, 2001 33.9 47.4 19.03b WPR – Urban % of population, 2001 26.9 44.6 6.84. Main workers %, 2001 23.7 39.2 6.45 Marginal workers %, 2001 8.8 7.6 10.2
Source: Census 2001; NSS Report, 60th Round; PSMS-II, 2006; SRS Bulletin, Oct 2006
24 Large landholdings = more than 10 ha; small holding= 1 – 2 ha land ; marginal land holding = less than 1 ha land
For Official Use Only Special Assistance for Project Formation (SAPROF) for
Uttar Pradesh Natural Resources Management and Poverty Alleviation Project (UPNRMPAP)
Final Report-Volume II Annex 1-18
A study of empowerment among women in Eastern UP found: i) that the empowerment of women is extremely low, ii) that access to ownership of assets, property, credit and education too, has not been important in women’s empowerment in this case, and ii) that decision making was more significant in women empowerment.25
3.5 Major Industries in Uttar Pradesh
Agriculture is the major source of income for about 72 % of the population, and contributes 1/3rd of the total state income. The State is one of the leading producers of food grains and other commercial crops in the country, with the highest irrigation intensity at 66%. The State also has well-developed agro-based, food processing and traditional industries, including textiles, handicrafts and carpets. It is one of the leading producers of dairy and horticulture, and is better known as the sugar bowl of the country with the highest sugar cane production.
The three most important industries in the state are sugar, cotton fabrics and diversified food preparations. The State is also the fourth largest producer of power in the country at 7,600 MW26, with 88% of it being thermal. The State ranks second in the total number of sugar mills and is the largest exporter of electronics and software services in the country (totalling USD 899 million in 2003/04). Tourism is another important industry in the state, with a range of pilgrimages and other destinations that are domestic as well as international favourites.
There are about 389,000 registered small-scale industries as hand-knitted woollen carpets, wood carving, brass metal, terracotta, etc., which provide employment to a large number
of workers in the State. Figure A1.3-5 indicates the sectoral contribution of different segments to the state GDP (Planning Atlas of Uttar Pradeshv 2005, Planning Department).
25 Pandey and Mishra (2004) 26 As on 31.01.2003

For Official Use Only Special Assistance for Project Formation (SAPROF) for
Uttar Pradesh Natural Resources Management and Poverty Alleviation Project (UPNRMPAP)
Final Report-Volume II Annex 1-19
Industry26%
Agriculture32%Services
42%
Figure A1.3-5 Uttar Pradesh – Sectoral contribution to GDP
4 Assisting Systems for Poverty Alleviation in Uttar Pradesh
Poverty alleviation has consistently been a crucial challenge facing the State and the country. The main determinants of poverty have been identified to be the lack of income and purchasing power due to a lack of productive employment opportunities, consistent rise in prices, and inadequate social infrastructure, which affects the quality of life of people.
While overall economic growth is accepted as an important component of development, equally important is the pattern of growth, its distribution and impact on the quality of life of people, as well as the social and institutional fabric of the State. With these considerations GOUP is implementing several programmes aiming at poverty alleviation and human welfare. The salient features of these programmes and their results are discussed in the following sections.
4.1 Key Features of Government Poverty Alleviation Programme in UP
The key feature of the State government towards poverty alleviation can be highlighted in the following points:
- Allocations are enhanced for the provision of education, health, sanitation and other facilities which promote capacity building and well being of the poor.
- Investments in agriculture, area development programmes and afforestation provide avenues for employment and income.
- Special programmes are provided for the SC, ST, disabled and vulnerable groups. and
- Anti poverty programmes for self employment are coupled with public works programmes to generate wage labourers.

For Official Use Only Special Assistance for Project Formation (SAPROF) for
Uttar Pradesh Natural Resources Management and Poverty Alleviation Project (UPNRMPAP)
Final Report-Volume II Annex 1-20
The important poverty alleviation and employment generation programmes that are being implemented in the State include:
- Swarnajayanti Gram Swarozgaar Yojana (SGSY); - National Rural Employment Guarantee Scheme (NREGS-UP); - National Food for Work Programme (NFFWP); - Bhoomi Sena Yojana; - Integrated Child Development Scheme (ICDS) for maternal and child health; - Sarva Shiksha Abhiyan (SSA) for universal education; and - Total Sanitation Campaign, Rural Housing, etc.
The cross-cutting salient features of the major poverty alleviation programmes stated above are identified as follows:
- Combination of technical, managerial and social engineering aspects; - Emphasis on people’s participation and their involvement in decision-making; - Provision for capacity building of people as an integral component of
development projects; - Combination of loan (credit) and grant assistance with differential rates of
beneficiary contribution based on social and economic criteria; - Special attention given to the inclusion of women and socially marginalized
groups; - Focus on self help groups (SHGs), micro-enterprise development and self
employment, in addition to employment generation through infrastructure development and natural resource management projects; and
- Linkages with local self-governance bodies, and prominent role for PRIs in employment generation programmes.
Besides, the Samagra Gram Vikas Yojana (SGVY), which is a programme of RDD for the holistic development of villages and habe been implemented since 2003 in all 70 districts of the States, includes the following three schemes:
- Swarnajayanti Gram Swarozgaar Yojana (SGSY); - Indira Awas Yojana; and - Drinking Water Scheme
During the Tenth Plan period, GOUP took a serious view towards creating self-employment opportunities in various sectors based on the concept of "maximum production by maximum hands for maximum people" and the umbrella concept that all the schemes for providing gainful employment to the rural and urban poor, especially to the BPL, are grouped together. A scheme formulated under this concept is called "Rozgar Chhattri Yojana". This scheme includes different nature of economic activities like small
For Official Use Only Special Assistance for Project Formation (SAPROF) for
Uttar Pradesh Natural Resources Management and Poverty Alleviation Project (UPNRMPAP)
Final Report-Volume II Annex 1-21
and cottage industries, handicrafts, sericulture, handloom, dairy, poultry, floriculture, herbal & aromatic plants, processing works and traditional local industry based on agriculture, value addition of rural produce, transportation and technical service centres, etc.
In addition to the above mentioned programme and scheme, a new initiative for setting up “Rural Growth Centres” has been launched to provide basic marketing and infrastructure facilities to agriculture and rural development. This scheme is proposed to be implemented on a Public-Private-Partnership model.
4.2 Special Note on ST Related Scheme in UP
The State has a high percentage of ST population (Annex 1 Section 3.2), who are socially and economically the most deprived and marginalized communities. Despite various policy measures and programme interventions aiming at uplifting of these groups, the results have consistently fallen short of expectations. With a view to take up this challenge head on, GOUP announced the “Ambedkar Gram Vikas Yojana” (AGVY) in the year 1990/91, The aim of the AGVY is to ensure direct benefit of development schemes to villages with SC/ST-domination through intensive and integrated development
of these villages (Annex 1 Section 8.1 (2)). Along with eligible SC/ST families, members from other weaker and marginalized households are also included in the benefit provisions of the scheme.
The scheme is being implemented in SC/ST-dominated villages by creating establishment funds for their holistic development. The scheme covers implementation of 32 projects in the target SC/ST villages, to be implemented by 14 line departments, with special attention to 11 specific aspects27.
At the same time, the Ambedkar Vishesh Rojgar Yojana (AVRY) was launched to accelerate sustained employment generation in the rural areas of the State. The AVRY is a specific area based scheme which taps local resources and skills in order to generate sustained employment and thus brings about economic development in the area. The AVRY is a project-based scheme using backward and forward linkages to ensure economic viability of the project. Institutional finance is the key element of the scheme.
27 Construction of link road, electrification, SGSY, IAY, drinking water facility, primary school, old age pension, widow
pension, free boring scheme, rural road/drain and clean toilet.

For Official Use Only Special Assistance for Project Formation (SAPROF) for
Uttar Pradesh Natural Resources Management and Poverty Alleviation Project (UPNRMPAP)
Final Report-Volume II Annex 1-22
4.3 Microfinance
(1) Present Situation
In Uttar Pradesh, a World Bank study28 revealed that 87 % of the rural families have no access to credit, 85 % had no access to insurance and 56 % borrow from moneylenders. The emphasis of support under microfinance is on the poor in ‘pre-micro-enterprise’ stage for building up their capabilities to handle larger resources.
The formal microfinance institutions comprising commercial banks (CBs), regional rural banks (RRBs) and cooperative banks (Coops) has provided Rs.1,997.7 million to 42,263 SHGs during 2005/06.
Apart from the above, the State is characterised by the presence of few non-bank microfinance institutes (MFIs) and a low level of micro-credit penetration. Among the 15 largest MFIs of India, CASHPOR (Credit and Savings for the Hardcore Poor) is the only one working in the State. Swayam Krishi Sangam (SKS) Microfinance is another large MFI, which has recently started operations in the State. Most of these MFIs are concentrated in the western, central and eastern parts of the State. Bundelkhand seems to have no perceptible presence of non-bank MFIs. Non-bank microfinance institutions in
the State are listed in Table A1.4-1
Table A1.4-1 Non-Bank Micro Finance Institutions in Uttar Pradesh Micro-finance
Institutes Types of
Organisation Area of Operation Remark
CASHPOR Micro-Credit
Section 25 Company under the Company Act, 1956
Mirzapur, Gazipur, Chandauli, Mau and Ballia in Eastern UP and two districts in Bihar
100% women client
SKS Microfinance
Non-Banking Finance Company
In Andhra, Karnataka, Maharastra; In UP: Agra and Lucknow
Has opened office in UP this year and now has 8 branches
Sonata Finance Private Limited
Non-Banking Finance Company
Allahabad, UP A new venture in Eastern UP
Nirman Bharati Section 25 Company Lucknow, UP - NEED Society registered
under SRA, 1860 Lucknow & Hardoi districts -
Ishara Foundation Section 25 Company Deoria district, UP - Trust Micro-finance
- State of UP Refinancing to other
Disha Social Organisation
Society Western UP (Saharanpur) Just started the work as an MFI
Source: JBIC SAPROF Team
Microfinance service providers which are the wholesaler of microfinance products include apex institutions like National Bank for Agriculture and Rural Development
28 Rural Finance Access Study, World Bank and India National Council for Applied Economic Research (NCAER),
2003

For Official Use Only Special Assistance for Project Formation (SAPROF) for
Uttar Pradesh Natural Resources Management and Poverty Alleviation Project (UPNRMPAP)
Final Report-Volume II Annex 1-23
(NABARD), Small Industries Development Bank of India (SIDBI), and Rashtriya Mahila Kosh (RMK). At the retail level, Commercial Banks, Regional Rural Banks, and Cooperative Banks provide micro finance services. Since 1999, public (e.g. SIDBI) and private sector Banks (e.g. ICICI Bank, ABN-AMRO Bank, etc.) and later the Venture Capital Funds (e.g. Bellweather Fund, Aviskar etc.) have also entered into the fray to extend capital and knowledge based support to the MFIs. In the State, the major micro-finance service providers are NABARD, SIDBI, ICICI Bank and Bellweather Fund
(Table A1.4-2).
Table A1.4-2 Microfinance Service Providers in UP
MF Service Providers
MFIs being promoted
MFIs approached for
funding Remark
NABARD CASHPOR Financial & Technical Services Ltd
Ishara Foundation, NEED, CASHPOR
Concerns were to provide timely credit to the poor in under banked regions and to further improve the outreach of rural credit through alternate credit delivery mechanisms.
SIDBI Sonata, Nirman Bharati, Ishara Foundation, NEED, Trust Micro-finance
Disha Social Organisation
For financing micro enterprises and non-farm income generating activities including agri-allied activities.
ICICI Bank CASHPOR - Promotes a micro-finance research institute (CMFR)
BELL WEATHER FUND
Sonata - Established in 2004, it is the India’s first Microfinance investment fund
Source: JBIC SAPROF Team
(2) Microfinance Policy Situation
India has followed a policy of non-regulation of MFIs formally. The requirements applicable to MFIs do not go beyond the administrative and simple accounting requirements of charities, trusts, etc. The country has been relying on self-regulation as an effective way of ensuring the proper functioning of MFIs. However, there are five pressing regulatory impediments identified to India's micro credit sector: i) interest rate regulation, ii) transparency and disclosure norms, iii) third party ratings, iv) equity investment, and v) minimum capital requirement for NBFC (non-banking financial corporation) licenses. Some initiatives have been taken quite successfully by state governments (e.g., Andhra Pradesh) to curb the high interest rates charged by the MFIs.
Legal statuses of different types of MFIs in India are described in Table A1.4-3.

For Official Use Only Special Assistance for Project Formation (SAPROF) for
Uttar Pradesh Natural Resources Management and Poverty Alleviation Project (UPNRMPAP)
Final Report-Volume II Annex 1-24
Table A1.4-3 Legal status of different types of MFIs in India
Types of MFI NGO MFIs Non-Profit Companies as MFIs
Mutual Benefit MFIs For Profit MFIs
Registration As Trust or Society under SRA, 1860
Under Section 25 companies under the Company Act, 1956
Respective state Acts
Companies Act, 1956; Reserve Bank of India Act, 1934
Capital Requirement
Not regulated by RBI and therefore not subjected to minimum capital requirements, prudential norms etc. NGO MFIs to become NBFCs are required to have a minimum entry capital requirement of Rs.20 million ($ 0.5 million).
NBFCs require minimum net owned funds of Rs. 2.5 million
Deposit Mobilization
By the Reserve Bank of India, barred from mobilizing any type of savings
Can accept savings from their members.
MFIs rated by approved credit rating agencies can accept deposits.
Foreign Investment
By way of grant By way of grant Minimum investment of $500,000 by way of equity
Borrowings Public and private banks in the commercial sector extend sizeable loans to MFIs at interest rate ranging from 8 to 11 % per annum. Banks have the operational freedom to prescribe their own lending norms as per the ground realities. Not-for-profit MFIs are not permitted to raise external commercial borrowings (ECB). The current policy allows only corporations registered under the Companies Act to access ECB for permitted end use.
Interest rate The interest rates are deregulated for private MFIs. The comparatively higher interest rate (12 to 24 % per annum) charged by the MFIs has been a contentious issue. The high interest rate collected by the MFIs from their poor clients is perceived as exploitative. Since most MFIs have lower business volumes, their transaction costs are far higher than that of the formal banking channels.
Collateral Requirement
All the legal forms of MFIs have the freedom to waive physical collateral requirements from their clients. Even the credit policy guidelines of the RBI allow them to waive any type of collateral and margin requirement for loans up to Rs. 50,000 ($1,100).

For Official Use Only Special Assistance for Project Formation (SAPROF) for
Uttar Pradesh Natural Resources Management and Poverty Alleviation Project (UPNRMPAP)
Final Report-Volume II Annex 1-25
Types of MFI NGO MFIs Non-Profit Companies as MFIs
Mutual Benefit MFIs For Profit MFIs
Regulatory Framework
Absence of any regulation has allowed many MFIs to be innovative in their approach particularly in designing new products and processes. But the flip side is that the management and governance of MFIs generally remains weak, as there is no compulsion to adopt widely accepted systems, procedures and standards.
Regulated by RBI
Remarks Structurally not viable institutions as their byelaws prevents commercial operations and borrowings funds from higher financial institutions; need of establishing policy and regulatory framework
Started by NGO, to separate micro finance operations and to take up more effectively the banking functions; prohibited from paying any dividend to its members; enjoy privileges as per a recent RBI notification29
State Governments have enacted the Mutually Aided Co-operative Societies (MACS) Act for promotion of co-operative Societies ; MACS enjoy operational freedom and virtually no interference from government; cannot accept share capital or loan from the State Government; SHG federation can be registered as MACS
Obligatory to apply to RBI for a certificate of registration; Require capital adequacy requirements and prudential norms30 for accepting public deposits t; very few MFIs in India are registered as NBFCs; number of NBFCs having exclusive focus on mF is negligible.
Source: JBIC SAPROF Team
The 2005 national budget has strengthened the policy perspective on microfinance.31 During 2005/06, Government of India has decided to re-designate the existing Micro-Finance Development Fund (mFDF) as Micro-Finance Development and Equity Fund (mFDEF). It has also been decided to enhance the fund size from the existing Rs.1 billion to Rs.2 billion. The additional amount of Rs.1 billion will be contributed by the Reserve Bank of India, NABARD and the commercial banks as 40:40:20 respectively.
29 In terms of Reserve Bank of India’s Notification dated 13 January 2000, relevant provisions of RBI Act, 1934 as
applicable to NBFCs will not apply for NBFCs (i) licensed under Section 25 of Companies Act, 1956, (ii) providing credit not exceeding Rs.50,000 ($1,112) for a business enterprise and Rs.125,000 ($2,778) for meeting the cost of a dwelling unit to any poor person, and, (iii) not accepting public deposits.
30 NBFCs are required to achieve capital adequacy of 12% and to maintain liquid assets of 15% on public deposits. 31 The Finance Minister of Govt of India has mentioned "Government intends to promote MFIs in a big way. The way
forward, I believe, is to identify MFIs, classify and rate such institutions, and empower them to intermediate between the lending banks and the beneficiaries. "http://www.uncdf.org/english/microfinance/pubs/newsletter/pages/2005_06/news_india.php

For Official Use Only Special Assistance for Project Formation (SAPROF) for
Uttar Pradesh Natural Resources Management and Poverty Alleviation Project (UPNRMPAP)
Final Report-Volume II Annex 1-26
4.4 Self Help Groups (SHGs) for Poverty Alleviation
In India, SHGs evolved out of a deliberate policy initiative by NABARD in the early 1990s and supported by the far reaching innovation by the Reserve Bank of India in allowing banks to lend to totally informal (unregistered) women's groups without collateral. Some 30 million women have formed 2.2 million small businesses in India and another 400,000 are expected to be in place by March 2007 according to NABARD. About $2.48 billion has been extended to these predominantly women run groups, over the last decade throughout the country.
In the State, a total of 242,000 SHGs have been formed, of which 174,000 have been credit-linked (as of November 2006). Till March 31, 2006, a total of Rs.4,920 million was disbursed through banks to 162,000 SHGs. Average loan per SHGs in the State is
Rs.37,000 (Table A1.4-4).
Table A1.4-4 Status of SHGs financed in UP Year No of SHG financed Bank Loan Disbursed (Rs. Million)
2001-02 During the year Cumulative During the year Cumulative 2001-02 11,490 33,114 170.5 260 2002-03 20,582 53,696 619.2 880 2003-04 25,514 79,210 841.7 1,720 2004-05 40,438 119,648 1,192.6 2,910 2005-06 42,263 161,911 1,997.7 4,920
Source: Progress of SHG-Bank Linkage in India- 2005-06, Micro-credit Innovation Department, NABARD
Examples of small business activities financed by MFIs include regular crop business, dairy, poultry, sheep/goat/piggery, fishery, crop storage, godown, minor irrigation, land development, farm machineries, plantation and horticulture, renewable energy, etc.
The Swarnajayanti Gram Swarozgar Yojana (SGSY) is a government programme that started in 1999 in order to assist BPL families by organizing the rural poor into SHGs for income generating activities. The District Rural Development Agency (DRDA) implements the programme through the rural development blocks, nationalized banks, regional rural banks and cooperative banks. DRDAs of the State have been implementing the SGSY programme through a number of commercial Banks, who will provide loan support to the mature SHGs. The funds have been utilized in three broad categories such as Infrastructure development, Capacity development and Revolving Fund support.
Physical and financial progress under SGSY (1999-2002) in the State are shown in Table A1.4-5.
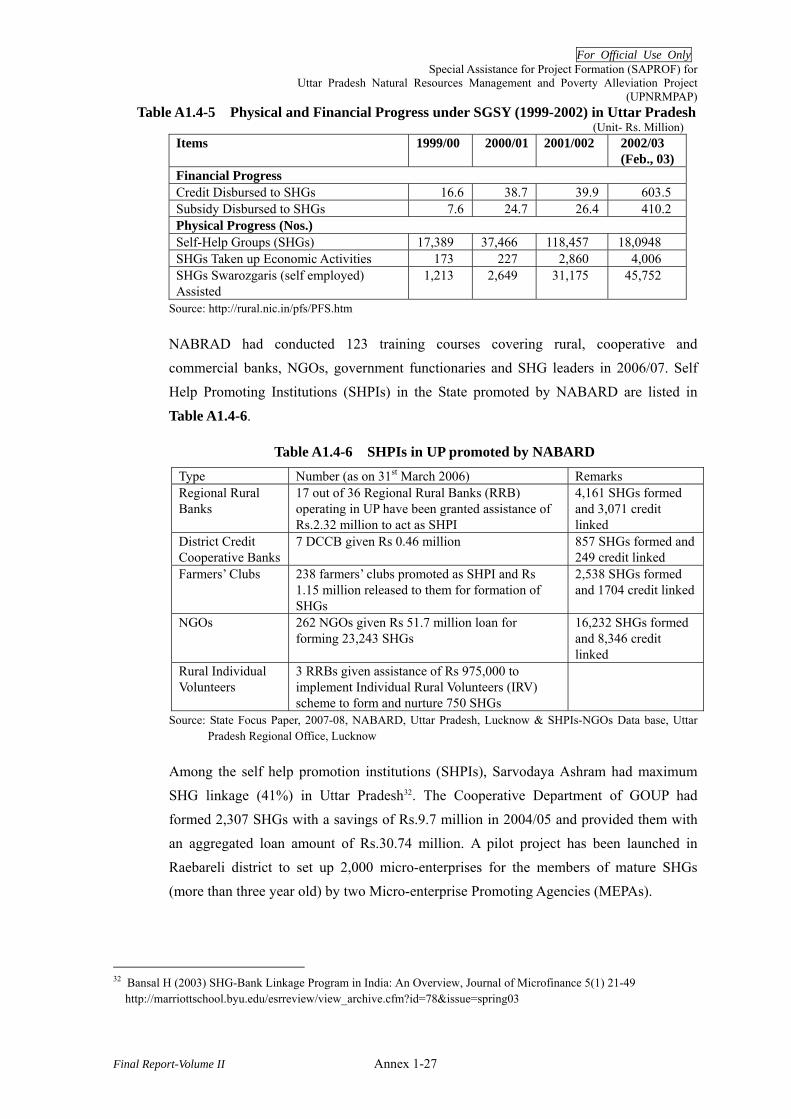
For Official Use Only Special Assistance for Project Formation (SAPROF) for
Uttar Pradesh Natural Resources Management and Poverty Alleviation Project (UPNRMPAP)
Final Report-Volume II Annex 1-27
Table A1.4-5 Physical and Financial Progress under SGSY (1999-2002) in Uttar Pradesh (Unit- Rs. Million)
Items 1999/00 2000/01 2001/002 2002/03 (Feb., 03)
Financial Progress Credit Disbursed to SHGs 16.6 38.7 39.9 603.5 Subsidy Disbursed to SHGs 7.6 24.7 26.4 410.2 Physical Progress (Nos.) Self-Help Groups (SHGs) 17,389 37,466 118,457 18,0948 SHGs Taken up Economic Activities 173 227 2,860 4,006 SHGs Swarozgaris (self employed) Assisted
1,213 2,649 31,175 45,752
Source: http://rural.nic.in/pfs/PFS.htm
NABRAD had conducted 123 training courses covering rural, cooperative and commercial banks, NGOs, government functionaries and SHG leaders in 2006/07. Self Help Promoting Institutions (SHPIs) in the State promoted by NABARD are listed in
Table A1.4-6.
Table A1.4-6 SHPIs in UP promoted by NABARD Type Number (as on 31st March 2006) Remarks Regional Rural Banks
17 out of 36 Regional Rural Banks (RRB) operating in UP have been granted assistance of Rs.2.32 million to act as SHPI
4,161 SHGs formed and 3,071 credit linked
District Credit Cooperative Banks
7 DCCB given Rs 0.46 million 857 SHGs formed and 249 credit linked
Farmers’ Clubs 238 farmers’ clubs promoted as SHPI and Rs 1.15 million released to them for formation of SHGs
2,538 SHGs formed and 1704 credit linked
NGOs 262 NGOs given Rs 51.7 million loan for forming 23,243 SHGs
16,232 SHGs formed and 8,346 credit linked
Rural Individual Volunteers
3 RRBs given assistance of Rs 975,000 to implement Individual Rural Volunteers (IRV) scheme to form and nurture 750 SHGs
Source: State Focus Paper, 2007-08, NABARD, Uttar Pradesh, Lucknow & SHPIs-NGOs Data base, Uttar Pradesh Regional Office, Lucknow
Among the self help promotion institutions (SHPIs), Sarvodaya Ashram had maximum SHG linkage (41%) in Uttar Pradesh32. The Cooperative Department of GOUP had formed 2,307 SHGs with a savings of Rs.9.7 million in 2004/05 and provided them with an aggregated loan amount of Rs.30.74 million. A pilot project has been launched in Raebareli district to set up 2,000 micro-enterprises for the members of mature SHGs (more than three year old) by two Micro-enterprise Promoting Agencies (MEPAs).
32 Bansal H (2003) SHG-Bank Linkage Program in India: An Overview, Journal of Microfinance 5(1) 21-49
http://marriottschool.byu.edu/esrreview/view_archive.cfm?id=78&issue=spring03
For Official Use Only Special Assistance for Project Formation (SAPROF) for
Uttar Pradesh Natural Resources Management and Poverty Alleviation Project (UPNRMPAP)
Final Report-Volume II Annex 1-28
CASHPOR Ltd. and the Grameen Project of Oriental Bank of Commerce have also supported a number of SHG credit links in Uttar Pradesh. By the year 2000, 11% of SHG were linked with banks in UP, and most of them were linked through the Kanpur Regional Rural Bank. Among the states supported by CASHPOR, the average loan per household was lowest (Rs.293) in Uttar Pradesh.
Having adopted an approach that soil reclamation only is not the ‘end in itself’, the Uttar Pradesh Land Development Corporation (UPLDC), under World Bank–aided UP Sodic Lands Reclamation Project (UPSLRP-II; 1999-2007) has been organizing women as groups for savings, thrift and credit linkages to take up micro-enterprises to ensure higher participation in water management. It has formed 7,517 women SHGs and 3,666 men SHGs with a savings of Rs.108.9 million, out of which 6,361 groups have been linked with bank by March 200533.
NABARD, as a key facilitator for the promotion of SHG movement, formulated a set of strategies to accelerate the expansion of SHG programmes as summarised below34.
(1) Key Strategies to Upscale the Programme
- Promoting network NGOs to act as nodal centres for formation of quality SHGs and to widely publicize bank-SHG linkage
- Large number of new and small NGOs in backward areas of Bundelkhand, Kaimur and Doab areas are being roped in as partners to promote SHGs
- Promotion of SHGs through farmers’ clubs launched by bank branches - Mature SHGs, preferably older than 3 years, are being imparted skills to start
micro-enterprises
(2) Key Constraints
- Field level staff of NGOs and banks need greater role clarity and more harmonious approach
- Low level of publicity among rural poor regarding SHG-Bank linkage - More affinity of NGOs towards formation of supply driven and grant-based
groups under SGSY
(3) Key Strategies to Overcome the Constraints
- Utilizing services of individual animators on honorarium basis to spread the message
- Involving more local NGOs even though they are new and small - Utilization of farmers’ clubs
33 Uttar Pradesh, 2006, Information and Public Relations Department , Uttar Pradesh, Lucknow (p. 181). 34 State Focus Paper, 2007-08, NABARD, Uttar Pradesh, Lucknow
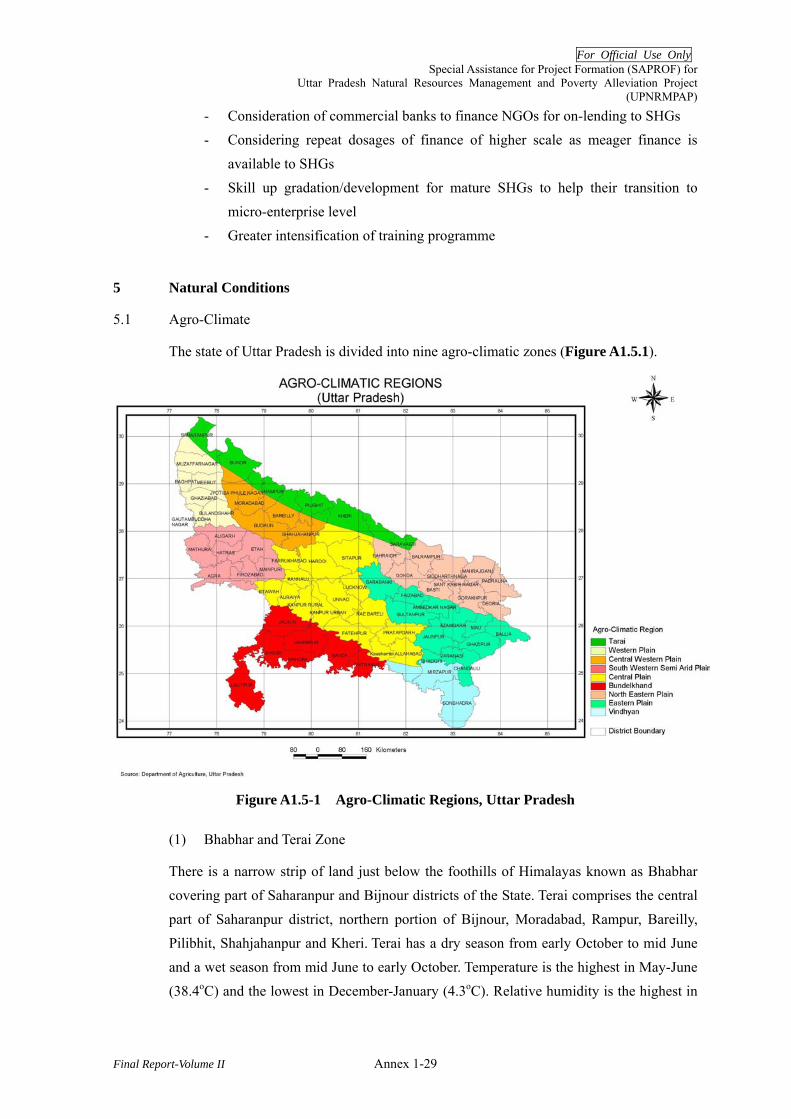
For Official Use Only Special Assistance for Project Formation (SAPROF) for
Uttar Pradesh Natural Resources Management and Poverty Alleviation Project (UPNRMPAP)
Final Report-Volume II Annex 1-29
- Consideration of commercial banks to finance NGOs for on-lending to SHGs - Considering repeat dosages of finance of higher scale as meager finance is
available to SHGs - Skill up gradation/development for mature SHGs to help their transition to
micro-enterprise level - Greater intensification of training programme
5 Natural Conditions
5.1 Agro-Climate
The state of Uttar Pradesh is divided into nine agro-climatic zones (Figure A1.5.1).
Figure A1.5-1 Agro-Climatic Regions, Uttar Pradesh
(1) Bhabhar and Terai Zone
There is a narrow strip of land just below the foothills of Himalayas known as Bhabhar covering part of Saharanpur and Bijnour districts of the State. Terai comprises the central part of Saharanpur district, northern portion of Bijnour, Moradabad, Rampur, Bareilly, Pilibhit, Shahjahanpur and Kheri. Terai has a dry season from early October to mid June and a wet season from mid June to early October. Temperature is the highest in May-June (38.4oC) and the lowest in December-January (4.3oC). Relative humidity is the highest in
For Official Use Only Special Assistance for Project Formation (SAPROF) for
Uttar Pradesh Natural Resources Management and Poverty Alleviation Project (UPNRMPAP)
Final Report-Volume II Annex 1-30
July (81.7 %) and the lowest in May (39 %). The average rainfall is 1,400 mm. Soils of Terai Zone are alluvial in nature, low to medium in phosphorus, medium to high in potassium and high in organic matter. The main crops of the area are wheat and rice. Gram and lentil are the major pulses while rapeseed and mustard are the principal oilseed crops.
(2) Western Plain Zone
The zone is highly productive with light colourer loam soil. The average annual rainfall is 795 mm. Relative humidity ranges from 32 to 85% and the temperature ranges from 1.50 C to 430 C. Rice-wheat-sugarcane based cropping system is prevalent in the zone. The principal crops of these regions are rice, wheat, maize, pearl millet, black gram, red gram, groundnut, sugarcane, rapeseed and mustard. In addition, commercial flower cultivation is also practiced in this Zone.
(3) Central Western Plain Zone
Rainfall in this zone is received during mid June to mid October. Annual rainfall is 1,032 mm and the temperature ranges from 4.50C to 45.40C. The soils of the region are mostly alluvial and have developed on alluvial deposited by the Ganga River and its tributaries. Soils are neutral to moderately alkaline and are medium in organic content. Major crops in this zone consist of wheat, rice, sugarcane, barley, sorghum, maize, groundnut, rapeseed and mustard, gram, peas, lentil, urd, pigeon pea. Cultivation of mentha is becoming popular.
(4) South Western Semi-Arid Zone
The soils are alluvial in nature and affected by salts. Average annual rainfall is 662 mm and the maximum temperature reaches 470C. The average relative humidity ranges from 32 to 82 %. The ground water of Agra, Mathura and Aligarh districts is brackish. Pearl millet, maize, paddy, wheat, rapeseed and mustard are the major field crops of the zone.
(5) Central Plain Zone
It is the largest zone of highly productive alluvial soils, high fertility with intensive irrigation and increased cropping intensity. The soils of this region vary widely from sandy loam to clay loam. The average annual rainfall of the zone is 863 mm and the temperature ranges from 5.50C to 450C. Monthly mean relative humidity ranges from 33% to 86 %. The crops of the zone are rice, wheat, maize, pearl millet, sorghum, barley, gram, pigeon pea, mung bean, urd, lentil, groundnut, rapeseed and mustard and sugarcane. Flower cultivation is also popular in some areas.
For Official Use Only Special Assistance for Project Formation (SAPROF) for
Uttar Pradesh Natural Resources Management and Poverty Alleviation Project (UPNRMPAP)
Final Report-Volume II Annex 1-31
(6) Bundelkhand Zone
Hot climate, undulating topography, residual and low depth of soil and exploitation of groundwater because of land impermeable rock on the surface characterise the zone. It has semi arid climate with average annual rainfall of 800 mm and the temperature ranges form 3.00C to 47.80C. The relative humidity ranges from 26 to 88 %. The zone has four broad soil groups, namely, Rakar, Parwa, Kabar and Mar. The prominent crops are wheat, gram, bajra (pearl millet) and sorghum. Other crops grown are pigeon pea, lentil, linseed and rice. Ginger and beetle vine cultivation is prominent in this zone.
(7) North Eastern Plain Zone
This zone has abundant surface and ground water. Two main soil types are found, namely alluvial and calcareous. The annual average rainfall is 1,240 mm and the temperature ranges from 4.90C to 44.20C. The relative humidity ranges from 39% to 85%. Rice, wheat, maize, gram, peas, rapeseed and mustard are major crops.
(8) Eastern Plain Zone
The zone has plenty of groundwater, however, the surface water is scanty. Three types of soils, namely, alluvial, Usar and Diara land are found in this zone. Usar soils are found in Sultanpur, Pratapgarh, Ballia and Azamgarh districts. Average annual rainfall is 800 mm, of which about 96 % is received during June to September. The temperature ranges form 5.70C to 41.40C and the relative humidity ranges from 30 to 86%. The major crops of the zone are rice, wheat, maize, sugarcane, gram, pea and pigeon pea. Commercial flower cultivation is also practiced in few districts of this zone.
(9) Vindhyan Zone
Most of the land is undulating and rocky and the soils are black and heavy and red and coarse soils. The soils are alluvial in plain area. The average annual rainfall is 1,134 mm and the temperature varies from 50C to 45.20C. About 40% of the total area is used under forest and about 33% is under cultivation. Mostly single cropping is practiced except for the areas with irrigation facilities. The crops grown in black soils are rice, wheat, gram, pigeon pea and linseed and in red soils barley, gram and small millets.
5.2 Land Use
(1) General Description
According to the Uttar Pradesh State Government, Statistical Diary 2005, the agriculture (actual area sown) is the largest land use in the state, covers approximately 69% of state’s

For Official Use Only Special Assistance for Project Formation (SAPROF) for
Uttar Pradesh Natural Resources Management and Poverty Alleviation Project (UPNRMPAP)
Final Report-Volume II Annex 1-32
reported area in 2002/03. The area under forest is 6.98% of the state’s reported area. Approximately 10% of the reported area is categorised as either barren uncultivable, or wasteland, whereas approximately 2% is considered as cultivable wasteland. The
Table A1.5-1 describes land-use patterns reported in 1991/92, 2001/02, and 2002/03. There are some variations in the land-use pattern from year to year, but agriculture maintains the dominant land-use pattern, constantly covering more than 16,430,000 ha of state’s reported areas. The summary of district-wise land use reported in 2002/03 is
summarised in Attachment A1 5-1.
Table A1.5-1 Land-use of Uttar Pradesh State 1991/92 2001/02 2002/03
Land Use Area (km2)
% of Reported Area
Area (km2)
% of Reported Area
Area (km2)
% of Reported Area
Reported area*1 242,450 100.0% 242,020 100.0% 242,020 100.0%Forests*2 16,980 7.0% 16,890 7.0% 16,890 7.0%Barren (user) and Uncultivable 7,200 3.0% 5,950 2.5% 5,750 2.4%Other Uses land besides Agriculture
23,230 9.6% 25,140 10.4% 25,330 10.5%
Cultivable Waste 7,090 2.9% 5,180 2.1% 5,000 2.1%Permanent pastures/grazing land 740 0.3% 710 0.3% 690 0.3%Other trees and brushwood land 3,300 1.4% 3,550 1.5% 3,420 1.4%Present wasteland 11,520 4.8% 10,260 4.2% 12,470 5.2%Other wasteland 8,090 3.3% 6,240 2.6% 6,300 2.6%Actual area sown 164,300 67.8% 168,120 69.5% 165,970 68.6%Area sown more than once 75,850 - 86,350 - 77,140 - Source- UP Government Statistical Diary 2005 (P.98.99) *1: Total Area reported for land use (Total Geographical Area is 240,928 km2) *2: 2000/01 data is used for2001/02 and 2002/03
(2) Wasteland
According to UP Government Statistical Diary 2005, wasteland in the State occupies 29,520km2, consisting of 18,770km2 of present wasteland and other wasteland, 5,000km2
of cultivable wasteland and 5,750km2 of barren/uncultivable. Though the definitions for the wasteland are different from the UP Government Statistical Diary 2005, the area categorised wasteland was studied by the National Remote Sensing Agency (NRSA) by using IRS LISS-III 2003 satellite data. The study shows that there is a total area of 17,084.16 km2 wasteland, which represents approximately 7.0% of the total geographical area in the State. The study also shows that 1,807.61 km2 of notified forest area is under
utilized or degraded and categorised as the wasteland. Table A1.5-3 summarises the wasteland in Uttar Pradesh identified by NRSA study.

For Official Use Only Special Assistance for Project Formation (SAPROF) for
Uttar Pradesh Natural Resources Management and Poverty Alleviation Project (UPNRMPAP)
Final Report-Volume II Annex 1-33
Table A1.5-3 Wasteland in Uttar Pradesh (2003)
Wasteland Category Area (km2) shallow 1,521.14 medium 1,493.04 Gullied and ravenous land deep 238.60
Land with scrub 3,001.78 Land without scrub 617.16
permanent 884.28 Waterlogged and marshy land seasonal 964.29 strong 1,558.01 moderate 2,621.28 Land affected by salinity/alkalinity slight 763.20
Abandoned Shifting cultivation (hum) area abandoned 20.35 Under utilized/degraded notified forest land 1,807.61 Under utilized/degraded notified forest land (agri) 358.76 Degraded pasture/ grazing land 79.84 Degraded land under plantation crop 13.31
flood plain 626.39 levees 4.43 Sands coastal sand 78.52
Mining wasteland 9.12 Industrial wasteland 31.94 Barren rocky/stone waste/sheet rock 379.75 Steep sloping 11.36 Total Wasteland Area 17,084.16 Total Geographical Area 240,928.00
Source-Wasteland Atlas of India 2005, Natural Remote Sensing Agency
As per these records, the majority salt affected soils are alkali/sodic in nature. These are widely distributed in the lower Ganga-Ghaghra and lower and middle Ganga-Yamuna plains. The ravine lands are located along the banks of the river Yamuna, Chambal, Sindh and Betwa. The marshy water-logged lands are dominated in eastern parts of the state.
5.3 Soil
The State has a large variety of soils. Their zonal properties vary according to parent material, topography, climate and weathering conditions. Distribution of major soils in the
State is given in Figure A1.5-2.
Basically, the dominant soil is alluvial soils due to topographical and hydrological characteristics of the State.
In the Southern Plateau region, soils are little poor in comparison with the Gange Plain region, and are associated with rock, iron, and semi arid climate. This natural condition would be not favorable factor for plantation. The detail site survey in terms of natural conditions would be necessary for selection of the actual plantation sites and silvicultural

For Official Use Only Special Assistance for Project Formation (SAPROF) for
Uttar Pradesh Natural Resources Management and Poverty Alleviation Project (UPNRMPAP)
Final Report-Volume II Annex 1-34
prescriptions to be applied in accordance with the objective of such plantation. Detailed
description of the soil group appearing in the State is given in Attachment A1 5-2.
Figure A1.5-2 Soil Map in the State
5.4 River Systems and Catchments
The general trend of the flow of the rivers in the state is from west to east (Figure A1.5-3). Major rivers of the state have two distinct source of origin:
i) Himalayan Origin: The Ganges, Yamuna, Ramganga, Sarda, Ghaghra and Rapti Rivers, which flow from north-western to south-eastern direction.
ii) Vindhyan and Malwa Plateau: The Chambal, Betwa, Ken, Tons and Son Rivers, flowing from south-west to north-east direction and meets the Yamuna and Ganges River in the downstream reaches.

For Official Use Only Special Assistance for Project Formation (SAPROF) for
Uttar Pradesh Natural Resources Management and Poverty Alleviation Project (UPNRMPAP)
Final Report-Volume II Annex 1-35
Figure A1.5-3 River Network and Catchments, Uttar Pradesh
Due to glacial source of origin, the rivers flowing from Himalayan ranges are perennial in nature. The rivers originating from Vindhyan ranges are seasonal in nature. The catchment’s details of the dominant rivers are mentioned in detailed in the table below:
Table A1.5-1 Major River Catchments of Uttar Pradesh
Source: Department of Irrigation and Flood Management, Govt. of Uttar Pradesh HFL – High Flood Level
Sl No.
Name of River Basin/Sub-basin
Length of River in the sub-basin (Km)
Danger Level of River (m)
HFL of river (m -Year)
At Confluence or nearest Gauge site
1 Ganga River 1,309 (Haridwar to Balia) 57.61 60.25 - 2003 Balia 2 Ram Ganga River 396 (Bijnor-Kannauj) 137.30 139.69 - 1983 Dabari
(Shahjahanpur) 3 Yamuna River 1,265
(Saharanpur- Allahabad) 84.73 87.99 - 1978 Naini (Allahabad)
4 Betwa River 297 (Lalitpur-Hamirpur) 104.54 108.67 - 1983 Sahizana (Hamirpur) 5 Ken River 264
(Amanganj, M.P.-Banda) 104.00 113.29 - 2005 Banda
6 Gomti River 694 (Pilibhit-Gazipur) 74.06 77.73 - 1971 Jaunpur 7 Chambal River 215 (Dhaulpur, -Auriya) - 145.50 - 1996 Dhaulpur (Rajasthan) 8 Sharda River 330 (Tanakpur-Sitapur) 135.49 136.55 - 1993 Sharda Nagar (Khiri) 9 Ghaghra River 616 (Nepal-Balia) 64.01 66.00 - 1998 Turtipur (Balia) 10 Rapti River 440 (Baharaich-Debaria) 74.98 77.54 - 1998 Gorakhpur 11 Gandak River - 96.00 97.15 - 2001 Khadda (Kushinagar) 12 Kuwano River - 78.65 79.84 - 1998 Mukhalishpur (Basti)
Uttarakhand
Madhya Pradesh
Nepal

For Official Use Only Special Assistance for Project Formation (SAPROF) for
Uttar Pradesh Natural Resources Management and Poverty Alleviation Project (UPNRMPAP)
Final Report-Volume II Annex 1-36
5.5 Rainfall and Temperature
(1) Rainfall (Figures A1.5-4 and Attachment A1.5-3)
The rainfall in the State is heaviest in the northeast and decreases towards the north-west. The rainy season lasts for a minimum period of five months from June to October. The total average rainfall in the State is 850-950 mm (15 years average). Maximum rainfall is generally received in the months of June to September. The pattern of rainfall, however, is not homogenous throughout the year and also in terms of spatial variability.
Figure A1.5-4 Average Annual Rainfall
(2) Temperature (Attachment A1.5-4)
Uttar Pradesh lies in the warm temperate zone and remains hot during the summer months. In the Terai region the climate is hot and humid while in the southern plateau the heat is simply over-powering without a grain of humidity. Summer temperatures shoot up to 470-500C in the months of April, May and June. Torrid scorching winds blow throughout the plains of the State. Agra and Jhansi are the hottest districts during summers, while Bareilly being the least. In the winters, the temperature fluctuates from 20 C -120C.
(3) Humidity (Attachment A1.5-5)
During the rainy season the relative humidity is generally high being over 70%. Thereafter the humidity decreases to 30-35 % by summer, which is the driest season of the year.

For Official Use Only Special Assistance for Project Formation (SAPROF) for
Uttar Pradesh Natural Resources Management and Poverty Alleviation Project (UPNRMPAP)
Final Report-Volume II Annex 1-37
(4) Pan Evaporation (Table A1.5-2)
In the state there are two meteorological observatory maintained at Kanpur and Faizabad by Indian Council of Agricultural Research (ICAR). Pan-evaporation data are available only at these observatories.
Table A1.5-2 Average Monthly Pan-evaporation during 1986-2000
Month Kanpur Faizabad mm/month January 68.4 71.5February 93.3 91.8March 152.6 145.2April 295.2 282.2May 279.0 245.3June 240.4 183.1July 174.9 170.0August 116.6 123.3September 109.2 116.0October 119.3 140.7November 69.0 83.6December 52.5 61.4Total 1,770.4 1,714.1Source: http://www.cropweatheroutlook.org
5.6 Natural Disasters in Uttar Pradesh
(1) Floods
Floods are a recurring problem in the State, causing damage to crops, life and property. The eastern districts are the most vulnerable to floods, the western districts slightly less and the central region markedly less. The eastern districts susceptibility to floods is ascribed, among other things, to heavy rainfall, low flat country, high subsoil water level and the silting of beds which causes river levels to rise. The problem in the western districts is mainly poor drainage caused by the obstruction of roads, railways, canals, new built-up areas. The north-eastern plains comprising of Gonda, Bahraich, Basti, Gorakhpur and Deoria districts are more seriously affected because of low level basin type physiography. In general, lower areas of the Ganga basin are more affected by floods than upper areas. The major flood-prone rivers are the Ganga, Jamuna, Gomti, Ghaghara, Rapti, Sarda and Ramganga Rivers. The inadequate drainage capacity of the smaller western Sirsa, Kali and the Aligarh drain is also a cause of floods.
About one fourth of the geographical area of the State is flood prone, and based on extra ordinary floods experienced in 1978, it was found that an area of 7.3 million ha is flood

For Official Use Only Special Assistance for Project Formation (SAPROF) for
Uttar Pradesh Natural Resources Management and Poverty Alleviation Project (UPNRMPAP)
Final Report-Volume II Annex 1-38
prone within the state 35. On the basis of 33 years of data (1973-2005: Attachment A1 5-6), it was reported that on an average 36 districts, 14,494 villages, 886 people, 2 million ha of land (of which 1.16million ha is agricultural land) were affected by floods every year, and on an average, 373 human and 1,616 livestock were killed and financial loss of Rs 4,322 million is caused every year. Out of the total flood prone area of the state, only 22.4 % area has been protected by 1,910 km of embankments along the flood causing rivers and 13,072 km of drainage channels were made to drain the accumulated flood water by the end of Ninth Five Year Plan. The expenditure on flood sector has been coming down over the years. This is mainly because frequency of the large scale flood producing rains was less in the recent years.
(2) Earthquakes
The current major earthquake in India was earthquake in Gujarat in 200136. Uttar Pradesh has not experienced major and disastrous earthquakes, but the state falls into High Damage Risk Zone (zone IV) in Terai-Bhabhar region and the northwestern part of the State, and Moderate Damage Risk Zone (zone III) in majority of the Gannetic Plain region and Vindhyan region in the southeast, the remaining area falls into Low Damage Risk Zone (zone II)37. Therefore, Uttar Pradesh has risks of potential hazard from earthquakes.
(3) Cyclone
There are no significant records on serious damages by cyclone in Uttar Pradesh. Rather, flood damages because of vast plain zone with 5 big rivers are prevalent in the state.
(4) Drought
While the plains of Uttar Pradesh are affected by floods, the areas of Bundelkhand and Vindhyan suffer from frequent droughts. This area is declared as drought prone area where special soil and water conservation and afforestation programmes have been launched by the government. The Working Plans of Jalaun, Banda, Hamirpur and Jhansi Forest Divisions describe of droughts leading to drying out of ponds, wells and streams. Not only the rain-fed crops fail but forests also suffer from moisture stress. The communities keep more livestock to supplement income. There is high variability in
35 Uttar Pradesh Development Report Vol.2, Planning Commission N. Delhi pp.308. 36 Disaster Risk Management Programme [2002 – 2007], Ministry of Home Affairs, Government of India, Feb. 2006 37 Vulnerability Atlas, BMPTC, GSDMA.Vulnerability zones are categorised as follows: zone I-Very Low Damage Risk
Zone; zone II- Low Damage Risk Zone; zone III- Moderate Damage Risk Zone; zone IV – High Damage Risk Zone; and zone V – Very High Damage Risk Zone.

For Official Use Only Special Assistance for Project Formation (SAPROF) for
Uttar Pradesh Natural Resources Management and Poverty Alleviation Project (UPNRMPAP)
Final Report-Volume II Annex 1-39
rainfall which also leads to drought. For example in Banda, the rainfall was1,178 mm in 1999 but only 694 mm in 2004.38
An assessment of losses to crops due to droughts is made by the Revenue Department. According to its assessment, 56 districts are variously affected by the droughts
(Attachment A1.5-7). The overall crop loss is more than 70 % in 14, between 60-70 % in 13 and 50-60 % in 29 districts of the state. During extreme droughts, the realization of land revenue and irrigation dues are postponed and farmers are given seeds of alternate crops, pesticides and insecticides to reduce the grief of the farmers. The State also provides cash/kind relief to those who suffer loss from natural clematis like drought, floods, cold wave, hailstorm and cloud burst.
6 Relevant Organisations
6.1 Relevant Government Agencies
(1) Department of Externally Aided Projects
This department works as the nodal department for externally aided projects. It is responsible for seeking external aid according to the planed priorities of State government, presenting project proposals to donor agencies, preparing project guidelines, monitoring progress of continuing and pipeline projects, etc. The department is also responsible for securing external fund every year to be made available for the priority projects for which the state or national funds are inadequate. It usually steps in when the project faces significant problems during the implementation.
Planning for the foreign aid flow is essentially an annual exercise. Although the broad framework of resource gap and financing pattern of the public sector investment is available from the five year plan prepared by the State Planning Commission, annual flows depend on a number of inter-linked factors like past commitments, projects in pipeline, pace of implementation of externally aided projects, balance of payments, and annual indicators for fresh commitments by donors.
GOUP has tapped a number of sources of external assistance. These include assistance from various countries through the Government of India under bilateral assistance, and assistance from multilateral donor agencies such as the World Bank (WB), Asian Development Bank (ADB), Organisation of Petroleum Exporting Countries (OPEC), European Economic Community (EEC), etc. Technical assistance provided by certain countries and organisations such as the WB, United Nations Development Programmes
38 Working Plan of Forest Division Banda (Bundelkhand) 2005/06 to 2014/15, UPFD
For Official Use Only Special Assistance for Project Formation (SAPROF) for
Uttar Pradesh Natural Resources Management and Poverty Alleviation Project (UPNRMPAP)
Final Report-Volume II Annex 1-40
(UNDP), United Nations International Children education Fund (UNICEF), World Health Organisation (WHO), Japan International Co-operation Agency (JICA), etc. for training of personnel, import of equipment for research projects, etc. are important inputs in the conception of implementation of development projects.
(2) Rural Development Department (RDD)
The Rural Development Department (RDD) is responsible for coordinating implementation of various state and centrally funded programmes:
• Provision of basic infrastructure facilities in the rural areas, e.g. schools, health facilities, roads, drinking water, electrification, etc.;
• Implementing schemes to promote rural industry, increase agriculture productivity, provide rural employment, etc. ; and
• Assistance to individual families and their SHGs living below poverty line (BPL) by providing productive resources through credits and subsidies.
Implementation of the programme at the district level is entrusted with the District Rural Development Agency (DRDA).
RDD works closely with the Panchayat Raj Department, which is responsible for coordinating the functioning of the 3-tier administrative system in the state comprising Zilla Panchayats at District level, Kshetra Panchayats at Block level and Gram
Panchayats at village level (Annex 1 Section 2.3)
(3) Department of Land Development and Water Resources
This department is responsible for the implementation of a number of development projects regarding the agricultural land reclamation and soil and water conservation works (i.e., construction of check dams and water harvesting facilities, gully plugging, terracing, contour trenching, etc.) in close collaboration with RDD. The department is the nodal agency for the implementation of major centrally-funded projects including Drought Prone Areas Programme (DPAP) and Integrated Wasteland Development Programme (IWDP).
(4) Department of Agriculture (DOA)
This department is responsible for improving the productivity of agricultural crops through activities such as farm input management, training and extension, support for storage and marketing of agriculture produces. Among others, some of the major initiatives are:
• Diversification of agriculture: One of the past major efforts of DOA was the Diversified Agriculture Support Project (1998 – 2003) with a loan from the WB.

For Official Use Only Special Assistance for Project Formation (SAPROF) for
Uttar Pradesh Natural Resources Management and Poverty Alleviation Project (UPNRMPAP)
Final Report-Volume II Annex 1-41
The project was implemented in 157 blocks (6,178 villages) with an outlay of US$ 145 million.
• Land improvement: Approximately 1.15 million ha of farm lands are affected by problems of salinity and alkalinity. The Uttar Pradesh Land Improvement Corporation, a subsidiary of GOUP, has been engaged in tackling these problems and improving land quality since 1978. Over 100,000 ha of agricultural land have been treated to make available for cultivation under various projects supported by the WB, EU and NABARD.
• Seed improvement: DOA has set up the Seed Improvement Corporation with a view to facilitate adoption of improved seeds of food and cash crops and vegetables. As a result, improved seeds have been taken up in 73 districts over an area of approximately 50,000 ha.
• Development of agriculture markets: In order to provide farmers with access to market and also fair pricing, DOA has set up 265 mandis (central markets) and 382 associated sub-mandis. Keeping in mind the welfare and needs of the farmers, Mandi Committees have been set up to manage the mandis. The State Agriculture Production Mandi Board has been set up to coordinate the functioning of all mandis in the State.
(5) Cooperative Department
The Cooperative Department promotes and develops cooperative movement in the State, and its functions at various levels are summarised below:
• State level: The Head of the Cooperative Department is called the Registrar, who helps in planning, direction administration and monitoring to ensure proper management of cooperative movement in compliance to the cooperative laws of GOUP.
• Division and District levels: The Deputy Registrar of Cooperative Societies is appointed at each of the 17 Divisions. For each of the 70 Districts of the State, a District Assistant Registrar is posted. They support the Register at their respective levels and jurisdictions.
• Sub-District (Tehsil) level: At each sub-district, a Sub District Cooperative Officer is assigned to manage and monitor cooperative movement and support cooperative societies.
• Block level: An Assistant Block Development Officer of Cooperative Societies are appointed to look after the cooperative movement, distribution of agricultural investment and monitoring of the cooperative societies.
• Panchayat level: At a cooperative society level, there is a Managing Director, who assumes the Chief Executive Officer as well. The crop loan, fertilizers and
For Official Use Only Special Assistance for Project Formation (SAPROF) for
Uttar Pradesh Natural Resources Management and Poverty Alleviation Project (UPNRMPAP)
Final Report-Volume II Annex 1-42
other agricultural input are distributed through primary agri-loan cooperative societies at a Gram Panchayat level.
(6) Department of Animal Husbandry
This department has the following objectives:
• To provide health care for livestock and containment of diseases through prophylactic, diagnostic and curative service.
• To bring about qualitative and quantitative improvement in production potential of livestock through improved breeding practices.
• To provide self employment opportunities and subsidiary occupation, in order to ensure sustainable income to rural people.
• To encourage occupational diversification of people. • To improve feed and fodder resources through biomass production and
silvi-pasture development.
The activities of the department are summarised in Attachment A1.6-1:
(7) Department of Horticulture and Food Processing Department
The department is implementing various programmes in the areas of: i) fruit development; ii) vegetable development; iii) potato development; iv) development of spices; v) food processing; vi) bee keeping; vii) betel (Paan) development; viii) mushroom development; ix) agriculture export zone (mango, potato); x) horticulture development zone (HDZ) with the following roles:
• Improvement in production and quality of horticulture produce through training farmers for adoption of improved technology;
• Change in intensity and cropping pattern to maximize benefits to the farmers; • Formation of Primary Horticulture Cooperative Societies for assistance to
farmers who are involve in horticulture cultivation; and
• Promotion and training for processing of fruits and vegetables, cookery, bakery, mushroom cultivation, etc.
(8) Ambedkar Rural Development Department
This department was created as a nodal agency to implement the Ambedkar Gram Vikas Yojna (AGVY: Ambedkar Village Development Programme), which was initiated in 1990/91 with a view to bring about the socio-economic development of communities
belonging to SC/STs (Annex 1 Section 8.1 (2)).
For Official Use Only Special Assistance for Project Formation (SAPROF) for
Uttar Pradesh Natural Resources Management and Poverty Alleviation Project (UPNRMPAP)
Final Report-Volume II Annex 1-43
(9) Industrial Development Department
Under this department, the Directorate of Industries is an executive agency and engaged in implementation of GOUP policies for village and small industries sector for all round development of industries in the State. It has a network of District Industrial Centres (DICs) at the district level, industrial officers at the sub-divisional (Tehsil) level and extension officers at the block level.
The roles of the DIC are as follows:
• To promote entrepreneurship in Uttar Pradesh; • To generate employment opportunities; • To provide all facilities and knowledge for setting up industries under one roof; • To manage infrastructure and to impart entrepreneurial development training for
the development of small and village industries; and
• To provide approvals and sanctions needed at various levels to small entrepreneurs.
DIC registers temporary/permanent small industries and provide technical assistance for the following areas: i) land and building;, ii) raw material; iii) machines, tools and equipments; iv) technical guidance; v) loans; vi) electricity; vii) trade tax settlements; viii) single table clearance system; and ix) one time settlement.
Small Industries Service Institute (SISI) at Kanpur caters to the promotional and developmental needs of the small industries sector in 22 districts as indicated in the jurisdiction list. The Institute maintains a close liaison with the Industrial Development Department, financial institutions, NGOs and other agencies concerned with the development of small scale industries. Effective linkage is maintained with DICs for providing the technical and managerial support for the benefit of entrepreneurs
(Table A1.6-1).
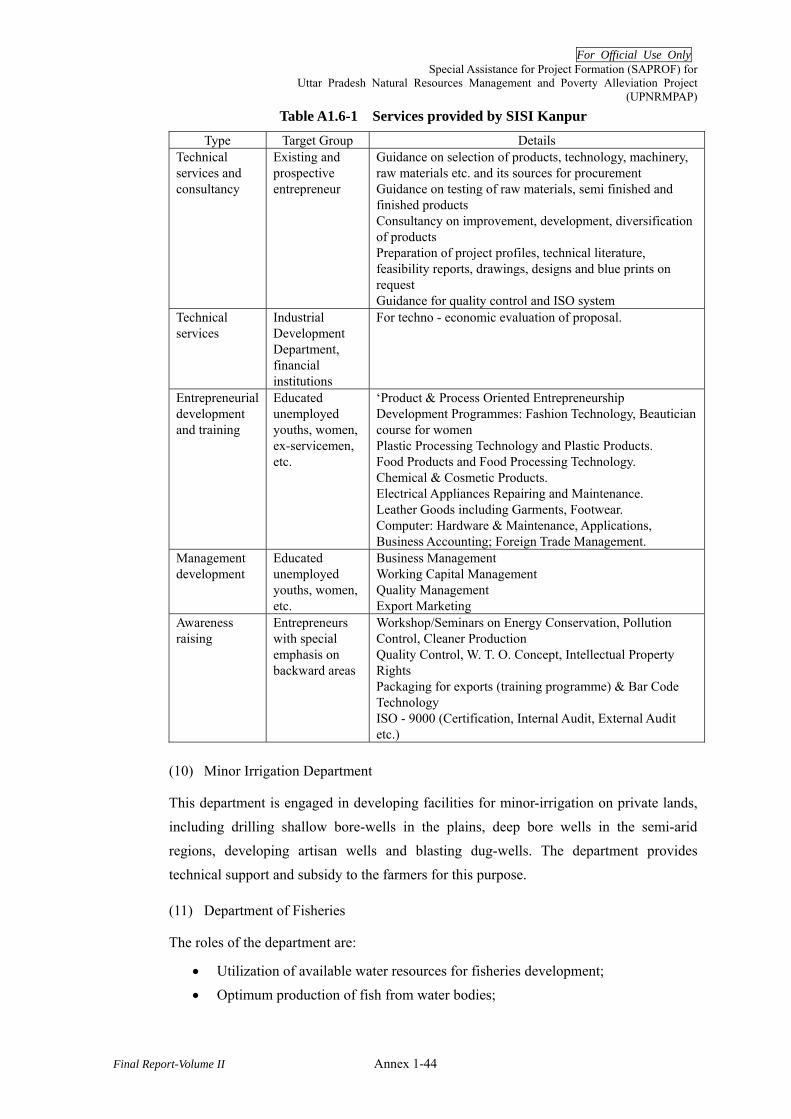
For Official Use Only Special Assistance for Project Formation (SAPROF) for
Uttar Pradesh Natural Resources Management and Poverty Alleviation Project (UPNRMPAP)
Final Report-Volume II Annex 1-44
Table A1.6-1 Services provided by SISI Kanpur Type Target Group Details
Technical services and consultancy
Existing and prospective entrepreneur
Guidance on selection of products, technology, machinery, raw materials etc. and its sources for procurement Guidance on testing of raw materials, semi finished and finished products Consultancy on improvement, development, diversification of products Preparation of project profiles, technical literature, feasibility reports, drawings, designs and blue prints on request Guidance for quality control and ISO system
Technical services
Industrial Development Department, financial institutions
For techno - economic evaluation of proposal.
Entrepreneurial development and training
Educated unemployed youths, women, ex-servicemen, etc.
‘Product & Process Oriented Entrepreneurship Development Programmes: Fashion Technology, Beautician course for women Plastic Processing Technology and Plastic Products. Food Products and Food Processing Technology. Chemical & Cosmetic Products. Electrical Appliances Repairing and Maintenance. Leather Goods including Garments, Footwear. Computer: Hardware & Maintenance, Applications, Business Accounting; Foreign Trade Management.
Management development
Educated unemployed youths, women, etc.
Business Management Working Capital Management Quality Management Export Marketing
Awareness raising
Entrepreneurs with special emphasis on backward areas
Workshop/Seminars on Energy Conservation, Pollution Control, Cleaner Production Quality Control, W. T. O. Concept, Intellectual Property Rights Packaging for exports (training programme) & Bar Code Technology ISO - 9000 (Certification, Internal Audit, External Audit etc.)
(10) Minor Irrigation Department
This department is engaged in developing facilities for minor-irrigation on private lands, including drilling shallow bore-wells in the plains, deep bore wells in the semi-arid regions, developing artisan wells and blasting dug-wells. The department provides technical support and subsidy to the farmers for this purpose.
(11) Department of Fisheries
The roles of the department are:
• Utilization of available water resources for fisheries development; • Optimum production of fish from water bodies;
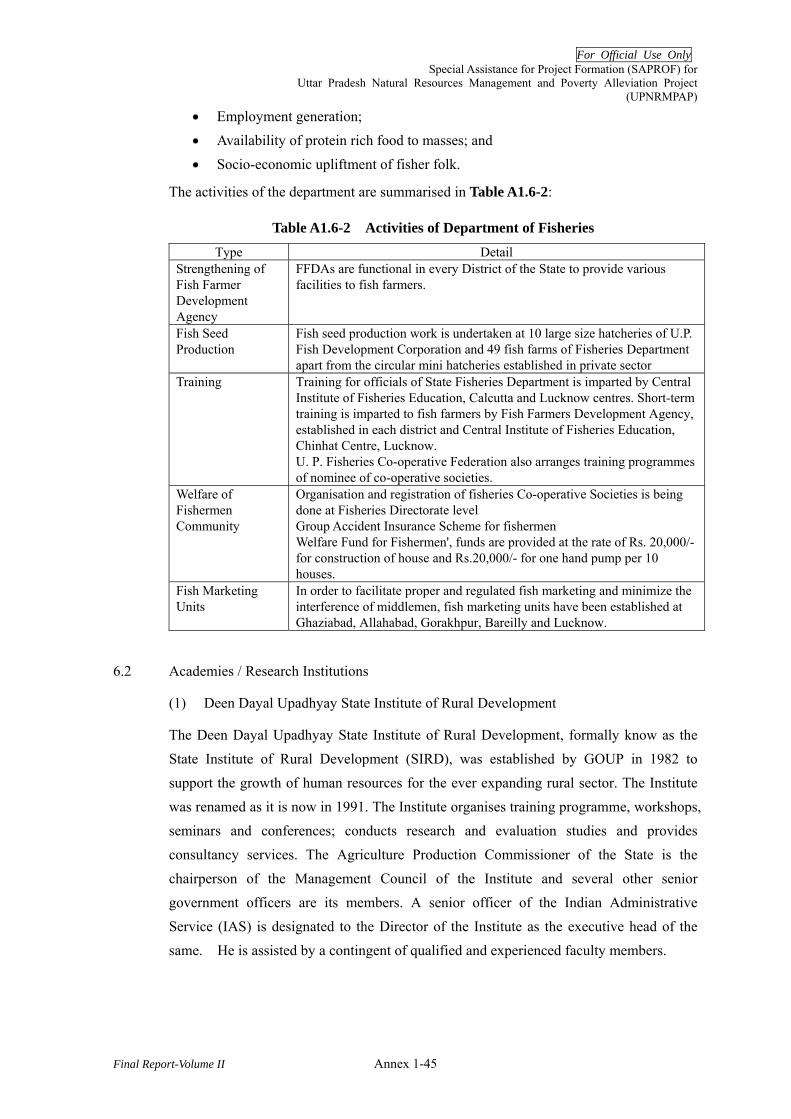
For Official Use Only Special Assistance for Project Formation (SAPROF) for
Uttar Pradesh Natural Resources Management and Poverty Alleviation Project (UPNRMPAP)
Final Report-Volume II Annex 1-45
• Employment generation; • Availability of protein rich food to masses; and • Socio-economic upliftment of fisher folk.
The activities of the department are summarised in Table A1.6-2:
Table A1.6-2 Activities of Department of Fisheries Type Detail
Strengthening of Fish Farmer Development Agency
FFDAs are functional in every District of the State to provide various facilities to fish farmers.
Fish Seed Production
Fish seed production work is undertaken at 10 large size hatcheries of U.P. Fish Development Corporation and 49 fish farms of Fisheries Department apart from the circular mini hatcheries established in private sector
Training Training for officials of State Fisheries Department is imparted by Central Institute of Fisheries Education, Calcutta and Lucknow centres. Short-term training is imparted to fish farmers by Fish Farmers Development Agency, established in each district and Central Institute of Fisheries Education, Chinhat Centre, Lucknow. U. P. Fisheries Co-operative Federation also arranges training programmes of nominee of co-operative societies.
Welfare of Fishermen Community
Organisation and registration of fisheries Co-operative Societies is being done at Fisheries Directorate level Group Accident Insurance Scheme for fishermen Welfare Fund for Fishermen', funds are provided at the rate of Rs. 20,000/- for construction of house and Rs.20,000/- for one hand pump per 10 houses.
Fish Marketing Units
In order to facilitate proper and regulated fish marketing and minimize the interference of middlemen, fish marketing units have been established at Ghaziabad, Allahabad, Gorakhpur, Bareilly and Lucknow.
6.2 Academies / Research Institutions
(1) Deen Dayal Upadhyay State Institute of Rural Development
The Deen Dayal Upadhyay State Institute of Rural Development, formally know as the State Institute of Rural Development (SIRD), was established by GOUP in 1982 to support the growth of human resources for the ever expanding rural sector. The Institute was renamed as it is now in 1991. The Institute organises training programme, workshops, seminars and conferences; conducts research and evaluation studies and provides consultancy services. The Agriculture Production Commissioner of the State is the chairperson of the Management Council of the Institute and several other senior government officers are its members. A senior officer of the Indian Administrative Service (IAS) is designated to the Director of the Institute as the executive head of the same. He is assisted by a contingent of qualified and experienced faculty members.

For Official Use Only Special Assistance for Project Formation (SAPROF) for
Uttar Pradesh Natural Resources Management and Poverty Alleviation Project (UPNRMPAP)
Final Report-Volume II Annex 1-46
Area of Specialisation: The Institute organises training programmes, workshops, seminars and conferences; conducts research and evaluation studies and provides consultancy services mainly for Government departments and PRIs.
(2) Govind Ballabh Pant Social Science Institute (GBPSSI)
GBPSSI was established at Allahabad in 1980 under the joint support of the Indian Council of Social Science Research (ICSSR) of the Government of India and GOUP as a constituent institute of the University of Allahabad. It is engaged in theoretical and applied research in social sciences, particularly in the fields of socio-economic development, popular culture, public policies and social technologies of modernity.
The major activities of GBSSI are:
• It conducts Doctoral programmes and MBA programme in Rural Development • Project Outreach through 4 rural stations in the state • It provides academic and professional training, guidance, consultancy and
research feedback to institutions and government organisations.
(3) Central Institute for Aromatic and Medicinal Plants (CIMAP)
CIMAP, Lucknow is a constituent research laboratory of the Council of Scientific and Industrial Research (CSIR), New Delhi. It is a multidisciplinary research institution with departments ranging from genetic resources and biotechnology, bioinformatics, cytogenetics, genetics and plant breeding, tissue culture, agronomy, chemistry, biochemistry, plant protection, process development, product development, chemical engineering, technology transfer and business development, research planning and monitoring, publications, etc.
CIMAP specializes in conducting “Agro Industrial Entrepreneurship Development Trainings’ sponsored by Small Industries Development Bank – India (SIDBI). An Annual Training Calendar is developed for this purpose.
(4) Indian Institute of Management, Lucknow (IIML)
IIML was established in 1984, by the Government of India, as a part of national level school of excellence in management science. Its mission is to be a global, socially conscious and integrated school of management, contributing towards management development, both in India and abroad. Towards this, IIML undertakes a diverse range of academic activities and interventions aiming at creation, dissemination, and application of management knowledge and practices.
The Agriculture Management Centre (AMC) has been established at IIML as a part of a research programme for providing advice with implementing agencies of agricultural
For Official Use Only Special Assistance for Project Formation (SAPROF) for
Uttar Pradesh Natural Resources Management and Poverty Alleviation Project (UPNRMPAP)
Final Report-Volume II Annex 1-47
development projects for improving the effectiveness of their projects. AMC is providing consultancy services, primarily on management information system (MIS) and monitoring and evaluation (M&E) to the Uttar Pradesh Diversified Agriculture Support Project (UPDASP) funded by the WB.
(5) Giri Institute of Development Studies (GIDS)
GIDS Lucknow is a social sciences research institute. It aims at:
• Undertaking, aiding, coordinating and promoting research on development with special emphasis on the problems of the weaker sections of the society and of balanced regional development;
• Providing academic and professional guidance, advice and consultancy with agencies, institutions and individuals in the field of research and action on development;
• Offering programme of advanced training to researchers and practitioners in the field of development with a view to improving the quality of research, programme formulation and implementation; and
• Collaborating with other agencies, institutions and organisations in their research and training activities
The Institute accepts international and national research projects related to developments. The recent activities of GIDS include:
• Monitoring of the Sarva Shiksha Abhyan programme of the Government of India. • Research studies for the Planning Commission, Government of India. • Mid-term evaluation of DPAP, WFP and IWDP.
6.3 Non-Government Organisations (NGOs)
There is significant presence of NGOs in the State, and many of them are involved in livelihood related issues and projects such as the Forestry Project and Diversified Agriculture Support Project funded by the WB, World Food Programme (WFP),
centrally-sponsored SGSY (Annex 1 Section 4.1), various watershed projects, land development schemes, rural sanitation programme, trainings for PRIs among others funded by various agencies and national/international NGOs. According to a registrar firm called the Societies and Chits UP, approximately 421,000 NGOs are registered as of March 2005. GOUP has established an NGO Cell in the Planning Department, which acts as a nodal agency for voluntary sector interface of the state government.
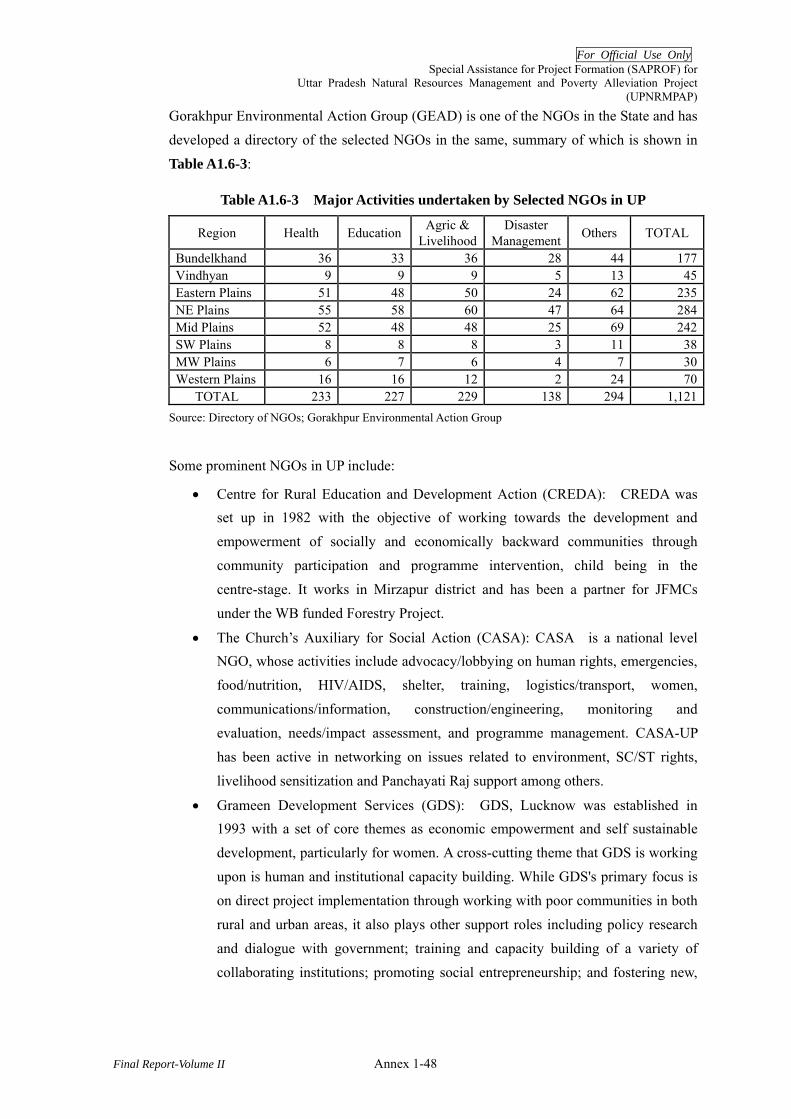
For Official Use Only Special Assistance for Project Formation (SAPROF) for
Uttar Pradesh Natural Resources Management and Poverty Alleviation Project (UPNRMPAP)
Final Report-Volume II Annex 1-48
Gorakhpur Environmental Action Group (GEAD) is one of the NGOs in the State and has developed a directory of the selected NGOs in the same, summary of which is shown in
Table A1.6-3:
Table A1.6-3 Major Activities undertaken by Selected NGOs in UP
Region Health Education Agric & Livelihood
Disaster Management Others TOTAL
Bundelkhand 36 33 36 28 44 177Vindhyan 9 9 9 5 13 45Eastern Plains 51 48 50 24 62 235NE Plains 55 58 60 47 64 284Mid Plains 52 48 48 25 69 242SW Plains 8 8 8 3 11 38MW Plains 6 7 6 4 7 30Western Plains 16 16 12 2 24 70
TOTAL 233 227 229 138 294 1,121Source: Directory of NGOs; Gorakhpur Environmental Action Group
Some prominent NGOs in UP include:
• Centre for Rural Education and Development Action (CREDA): CREDA was set up in 1982 with the objective of working towards the development and empowerment of socially and economically backward communities through community participation and programme intervention, child being in the centre-stage. It works in Mirzapur district and has been a partner for JFMCs under the WB funded Forestry Project.
• The Church’s Auxiliary for Social Action (CASA): CASA is a national level NGO, whose activities include advocacy/lobbying on human rights, emergencies, food/nutrition, HIV/AIDS, shelter, training, logistics/transport, women, communications/information, construction/engineering, monitoring and evaluation, needs/impact assessment, and programme management. CASA-UP has been active in networking on issues related to environment, SC/ST rights, livelihood sensitization and Panchayati Raj support among others.
• Grameen Development Services (GDS): GDS, Lucknow was established in 1993 with a set of core themes as economic empowerment and self sustainable development, particularly for women. A cross-cutting theme that GDS is working upon is human and institutional capacity building. While GDS's primary focus is on direct project implementation through working with poor communities in both rural and urban areas, it also plays other support roles including policy research and dialogue with government; training and capacity building of a variety of collaborating institutions; promoting social entrepreneurship; and fostering new,
For Official Use Only Special Assistance for Project Formation (SAPROF) for
Uttar Pradesh Natural Resources Management and Poverty Alleviation Project (UPNRMPAP)
Final Report-Volume II Annex 1-49
local, development initiatives. These initiatives are coordinated through the "Learning Centre" that has been created within GDS.
• Gorakhpur Environmental Action Group (GEAG): Since its inception in 1975, GEAG has launched and completed several development projects, research & studies based on ecological principles and social equality. GEAG has concentrated its efforts to develop, promote and popularise agricultural systems that are ecologically sound, economically viable and sustainable. GEAG has implemented capacity building programme for various stakeholders including women farmers, civil society groups, government officials etc. GEAG was one of the nodal NGOs for the Diversified Agricultural Support Programme funded by the WB.
In general, many large-scale NGOs in the State implement projects not directly by through smaller-scale partner NGOs at the field level. Under such an arrangement, the mother NGOs provide technical and managerial assistance to those partner NGOs and function as a bridge between the financer (both national and international) and the local NGOs. Overall, the smaller-scale, local level NGOs have limited technical expertise and resources.
In addition to the regular NGOs, there are a number of NGO networks active in the State. Some of these are:
• Uttar Pradesh Voluntary Action Network (UPVAN): UPVAN is a broad-based network of voluntary organisations in the State. Its mission is to increase cumulative strength of active, dynamic and vibrant voluntary organisations by enabling them to accelerate their voice for social change.
• Jan Kendri Vikas Manch (JKVM): JKVM is a people institution for the social action, articulating right-based approach to the development process for human and related issues for the cause. It provides grassroots organisations of the State with a platform for discussion, sharing of information and experiences and collective action.
6.4 Cooperatives and Other Village Level Organisations
Although the cooperative movement in the State is underdeveloped comparing with other states as Gujarat or Maharashtra, GOUP has been putting efforts to promote and strengthen the cooperatives in the State to free the poor, small and marginal farmers, agriculture labourers and entrepreneurs of rural areas from clutches of money-lenders.
GOUP enacted the State Cooperative Act in 1965 with a view to give institutional form to the cooperative movement. Later, GOUP formulated the Sate Cooperative Societies Rules.

For Official Use Only Special Assistance for Project Formation (SAPROF) for
Uttar Pradesh Natural Resources Management and Poverty Alleviation Project (UPNRMPAP)
Final Report-Volume II Annex 1-50
Since then, the cooperative societies are functioning under this Act and Rules. The cooperative societies in the State have been involved in the distribution of loan facilities, agriculture investment, chemical fertilisers, progressive seeds, insecticides as well as stocking of agriculture produce for price control, production control and collective marketing. About 18,000 cooperative societies are functioning in the State at present, which include 50 District-Cooperative Banks.
Some important cooperative organisations existing in the State are summarised in Table A1.6-4:
Table A1.6-4 Important Cooperative Organisations existing in the State Institution Role
UP Cooperative Union Limited, Lucknow (PCU)
Training of members, staff of societies, leadership development programme With the help of Insurance Companies provide various kind of policy covers with reasonable premium to the cooperative institutions, their assets and employees.
UP Cooperative Federation, Lucknow (PCF)
Agri–input distribution, purchase and sale of agri-produce, running Agri Service Centres and cold storages
UP Cooperative Bank Limited, Lucknow (State level institution of cooperative loaning institutions).
It is a Scheduled Bank established with the objectives: • To keep financial discipline on district central cooperative banks • To provide them business suggestions and consultancy • To work as a centre for balancing distribution of agri-loan. The Bank itself takes loan from NABARD on subsidized rates and further disburses it through District Cooperative Banks for agri –business. The Bank extends its financial support to the industries largely based on agri–products like sugar mills, rice mMills, vegetable oil mills, cottage industries, cold storages, etc.
UP Cooperative Rural Development Bank Limited, Lucknow
This Bank provides loans to the farmers for small irrigation, agri-equipments like tractor and thrasher and other related businesses. Tha Bank also has a NABARD supported training centre for its officers and other employees.
UP Consumer Cooperative Federation Limited, Lucknow (Apex body for consumer cooperative societies)
This Federation helps member societies and other cooperative societies working for consumers and bringing collaboration among them. The Federation works with government and other organisations so as to make consumer goods available to the societies, does production and marketing of consumer goods, provides business consultancy as well as financial support to it’s member societies. The Federation also acts as price monitoring body.
Source: Cooperative Institutions of U.P. www.upgov.nic.in
Various projects running to help cooperative movement are as follows:
(1) Cooperative Loan and Banking Project
Under the project, short-, mid- and long-terms loan are provided to farmers at fair rates of interest for cropping so they can increase their income and improve their financial conditions. For mid- and short-term loans, there are leading banks at the state level,

For Official Use Only Special Assistance for Project Formation (SAPROF) for
Uttar Pradesh Natural Resources Management and Poverty Alleviation Project (UPNRMPAP)
Final Report-Volume II Annex 1-51
District Cooperative Banks at the district level and Primary Agri-Loan Cooperative Societies are available at a Gram Panchayat level. Long-term loan is provided by the Sub-division (Tehsil) level branches of the Uttar Pradesh Cooperative Rural Development Bank.
(2) Cooperative Purchase and Sale (Kraya-Vikraya) Project
Cooperative Purchase and Sale Societies are formed to help farmer in getting right price of their produce by removal of middlemen and thus improving their financial status. Under the project, Uttar Pradesh Cooperative Federation is formed at a state level, District Cooperative Saga are formed at district level in 53 places, and 242 cooperative buying-selling societies are formed at sub-division level. Wheat purchase has been done through the societies of Uttar Pradesh Consumer Cooperative Federation and UP Potato Development and Marketing Cooperative Federation under a price support scheme.
(3) Cooperative Education, Training and Communication
Cooperative members as well as officials are supposed to be trained so they can perform their job effectively. Currently UP Cooperative Union is running 7 training centres at Ayodhya Varanasi, Etawah, Merrut, Moradabad, Mahoba and Mathura. Indian National Cooperative Federation is running a cooperative management training institute in Lucknow. The Institute of Cooperative and Corporate Management Research and Training is working for the training of senior officers.
7 Development Plans
7.1 Uttar Pradesh Tenth Five Year Plan (2002 – 2007)
The outlay of UP Tenth Five Year Plan is shown in Table A1.7-1:
Table A1.7-1 Sector-Wise Outlay of Ninth and Tenth Five Year Plans of Uttar Pradesh (Rs. million)
Sr. No Department 9th Plan Outlay
% to Total
Outlay
10th Plan Outlay
% to Total
Outlay 1 ECONOMIC SERVICES 308,563.2 73.62 431,943.6 72.34
1.1 Agriculture & Allied Activities 22,093.9 5.27 51,424.0 8.621.2 Rural Development 42,347.5 10.1 71,179.1 11.921.3 Special Areas Programme 5,750.0 1.37 10,472.5 1.751.4 irrigation & Flood Control 32,090.0 7.66 76,073.5 12.741.5 Energy 71,331.5 17.02 96,119.9 16.11.6 Industry & Minerals 4,669.5 1.11 12,624.6 2.111.7 Transport 89,547.2 21.37 67,402.5 11.291.8 Science, Technology & Environment 20,730.0 4.95 24,147.5 4.041.9 General Economic Services 20,003.6 4.77 22,500.0 3.77

For Official Use Only Special Assistance for Project Formation (SAPROF) for
Uttar Pradesh Natural Resources Management and Poverty Alleviation Project (UPNRMPAP)
Final Report-Volume II Annex 1-52
Sr. No Department 9th Plan Outlay
% to Total
Outlay
10th Plan Outlay
% to Total
Outlay 2 SOCIAL SERVICES 109,287.6 26.08 161,011.9 26.97
2.1 Education 16,610.0 3.96 43,028.1 7.212.2 Medical & Public Health 11,140.0 2.66 24,054.3 4.032.3 Water Supply & Sanitation 56,843.8 13.56 53,379.7 8.942.4 Housing 3,707.5 0.88 4,750.0 0.792.5 Urban Development 7,011.3 1.67 10,206.6 1.712.6 Information & Publicity 120.0 0.03 250.0 0.042.7 Welfare of SCs, STs & OBC39 7,345.0 1.75 11,089.5 1.862.8 Labour & Employment 785.0 0.19 726.0 0.122.9 Social Security & Welfare 3,705.0 0.90 5,733.0 0.96
2.10 Nutrition 2,020.0 0.48 7,794.7 1.313 GENERAL SERVICES 1,249.2 0.30 4,124.5 0.69 GRAND TOTAL 419,100.0 597,080.0
Source: Uttar Pradesh Ninth Five Year Plan (1997/98-2001/02), Tenth Five Year Plan (2002/03-2006/07)
The total outlay allocated to the Agriculture and Allied Activities has increased from 5.27% of the Ninth Plan to 8.62% of the Tenth Plan period.
Forestry sub-sector has been included in the broad category of Agriculture and Allied
Services. Table A1.7-2 shows the share of forestry sector within the Ninth and Tenth Five Year Plans:
Table A1.7-2 Share of Forestry Sector within the Five Year Plans Ninth Plan Period (1997–2002) Tenth Plan Period (2002–2007)
Outlay (Rs.million)
% of Agriculture & Allied Activities sector
% of the Total Outlay
Outlay (Rs. million)
% of Agriculture & Allied Activities sector
% of the Total Outlay
2,800.00 12.67% 0.7% 12,080.00 23.5% 2%Source: SAPROF Team
Though the total outlay to the forestry sector remained marginal and inadequate, there was an increase both in the total outlay and the percentage. It signifies the increasing level of interest of GOUP in promoting forestry activities in the State.
Table A1.7-3 shows the annual plan of the State for the fiscal year of 2006/07.
39 OBC: Other Backward Classes
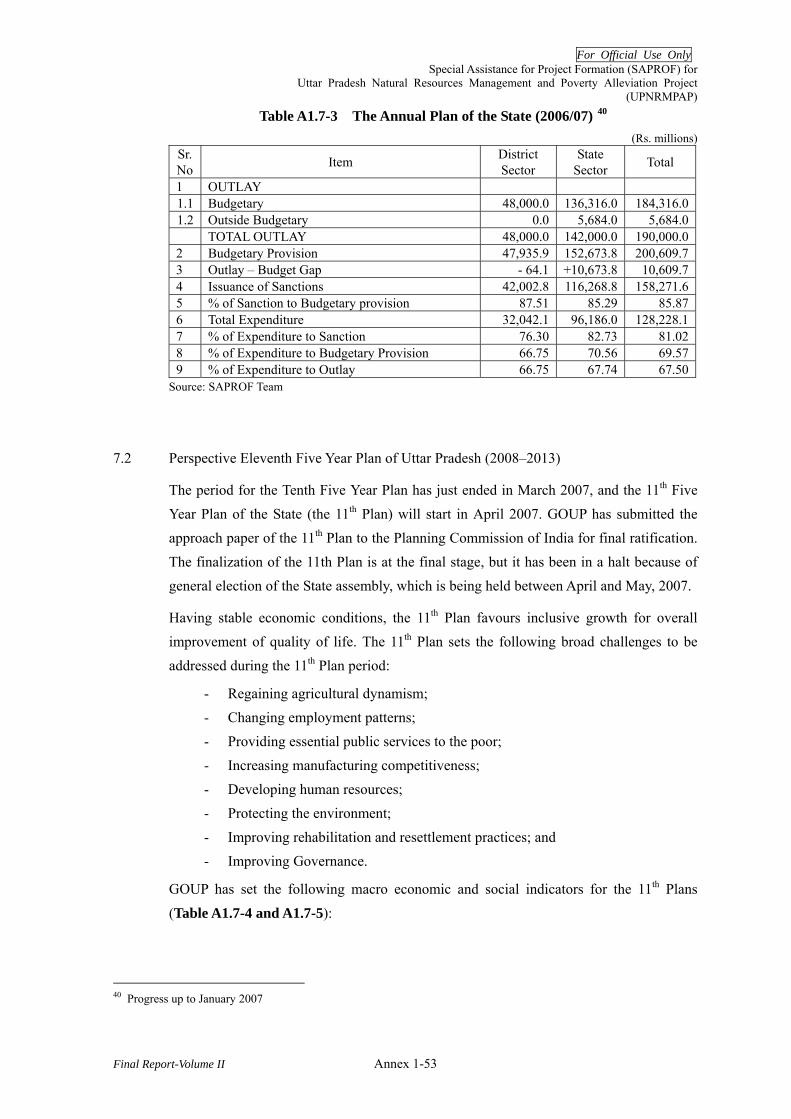
For Official Use Only Special Assistance for Project Formation (SAPROF) for
Uttar Pradesh Natural Resources Management and Poverty Alleviation Project (UPNRMPAP)
Final Report-Volume II Annex 1-53
Table A1.7-3 The Annual Plan of the State (2006/07) 40 (Rs. millions)
Sr. No Item District
Sector State
Sector Total
1 OUTLAY 1.1 Budgetary 48,000.0 136,316.0 184,316.01.2 Outside Budgetary 0.0 5,684.0 5,684.0 TOTAL OUTLAY 48,000.0 142,000.0 190,000.02 Budgetary Provision 47,935.9 152,673.8 200,609.73 Outlay – Budget Gap - 64.1 +10,673.8 10,609.74 Issuance of Sanctions 42,002.8 116,268.8 158,271.65 % of Sanction to Budgetary provision 87.51 85.29 85.876 Total Expenditure 32,042.1 96,186.0 128,228.17 % of Expenditure to Sanction 76.30 82.73 81.028 % of Expenditure to Budgetary Provision 66.75 70.56 69.579 % of Expenditure to Outlay 66.75 67.74 67.50
Source: SAPROF Team
7.2 Perspective Eleventh Five Year Plan of Uttar Pradesh (2008–2013)
The period for the Tenth Five Year Plan has just ended in March 2007, and the 11th Five Year Plan of the State (the 11th Plan) will start in April 2007. GOUP has submitted the approach paper of the 11th Plan to the Planning Commission of India for final ratification. The finalization of the 11th Plan is at the final stage, but it has been in a halt because of general election of the State assembly, which is being held between April and May, 2007.
Having stable economic conditions, the 11th Plan favours inclusive growth for overall improvement of quality of life. The 11th Plan sets the following broad challenges to be addressed during the 11th Plan period:
- Regaining agricultural dynamism; - Changing employment patterns; - Providing essential public services to the poor; - Increasing manufacturing competitiveness; - Developing human resources; - Protecting the environment; - Improving rehabilitation and resettlement practices; and - Improving Governance.
GOUP has set the following macro economic and social indicators for the 11th Plans
(Table A1.7-4 and A1.7-5):
40 Progress up to January 2007
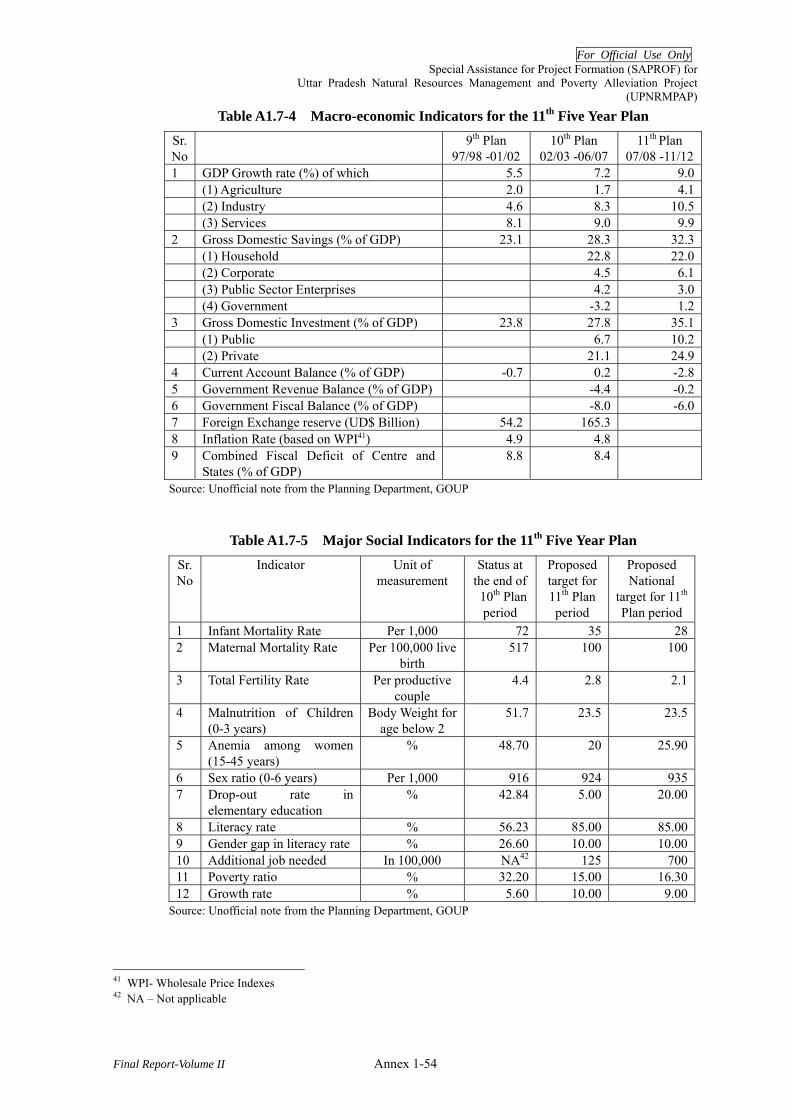
For Official Use Only Special Assistance for Project Formation (SAPROF) for
Uttar Pradesh Natural Resources Management and Poverty Alleviation Project (UPNRMPAP)
Final Report-Volume II Annex 1-54
Table A1.7-4 Macro-economic Indicators for the 11th Five Year Plan Sr. No
9th Plan 97/98 -01/02
10th Plan 02/03 -06/07
11th Plan 07/08 -11/12
1 GDP Growth rate (%) of which 5.5 7.2 9.0 (1) Agriculture 2.0 1.7 4.1 (2) Industry 4.6 8.3 10.5 (3) Services 8.1 9.0 9.92 Gross Domestic Savings (% of GDP) 23.1 28.3 32.3 (1) Household 22.8 22.0 (2) Corporate 4.5 6.1 (3) Public Sector Enterprises 4.2 3.0 (4) Government -3.2 1.23 Gross Domestic Investment (% of GDP) 23.8 27.8 35.1 (1) Public 6.7 10.2 (2) Private 21.1 24.94 Current Account Balance (% of GDP) -0.7 0.2 -2.85 Government Revenue Balance (% of GDP) -4.4 -0.26 Government Fiscal Balance (% of GDP) -8.0 -6.07 Foreign Exchange reserve (UD$ Billion) 54.2 165.3 8 Inflation Rate (based on WPI41) 4.9 4.8 9 Combined Fiscal Deficit of Centre and
States (% of GDP) 8.8 8.4
Source: Unofficial note from the Planning Department, GOUP
Table A1.7-5 Major Social Indicators for the 11th Five Year Plan Sr. No
Indicator Unit of measurement
Status at the end of 10th Plan
period
Proposed target for 11th Plan period
Proposed National
target for 11th Plan period
1 Infant Mortality Rate Per 1,000 72 35 282 Maternal Mortality Rate Per 100,000 live
birth 517 100 100
3 Total Fertility Rate Per productive couple
4.4 2.8 2.1
4 Malnutrition of Children (0-3 years)
Body Weight for age below 2
51.7 23.5 23.5
5 Anemia among women (15-45 years)
% 48.70 20 25.90
6 Sex ratio (0-6 years) Per 1,000 916 924 9357 Drop-out rate in
elementary education % 42.84 5.00 20.00
8 Literacy rate % 56.23 85.00 85.009 Gender gap in literacy rate % 26.60 10.00 10.0010 Additional job needed In 100,000 NA42 125 70011 Poverty ratio % 32.20 15.00 16.3012 Growth rate % 5.60 10.00 9.00
Source: Unofficial note from the Planning Department, GOUP
41 WPI- Wholesale Price Indexes 42 NA – Not applicable
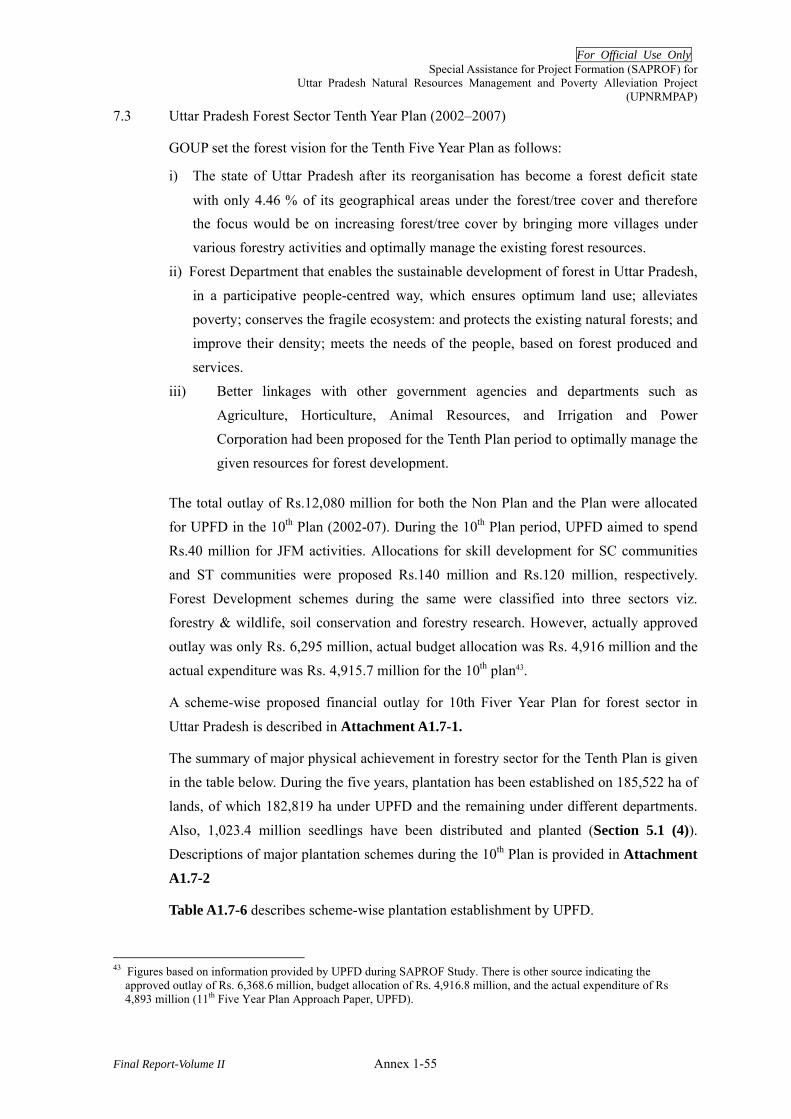
For Official Use Only Special Assistance for Project Formation (SAPROF) for
Uttar Pradesh Natural Resources Management and Poverty Alleviation Project (UPNRMPAP)
Final Report-Volume II Annex 1-55
7.3 Uttar Pradesh Forest Sector Tenth Year Plan (2002–2007)
GOUP set the forest vision for the Tenth Five Year Plan as follows:
i) The state of Uttar Pradesh after its reorganisation has become a forest deficit state
with only 4.46 % of its geographical areas under the forest/tree cover and therefore the focus would be on increasing forest/tree cover by bringing more villages under various forestry activities and optimally manage the existing forest resources.
ii) Forest Department that enables the sustainable development of forest in Uttar Pradesh, in a participative people-centred way, which ensures optimum land use; alleviates poverty; conserves the fragile ecosystem: and protects the existing natural forests; and improve their density; meets the needs of the people, based on forest produced and services.
iii) Better linkages with other government agencies and departments such as Agriculture, Horticulture, Animal Resources, and Irrigation and Power Corporation had been proposed for the Tenth Plan period to optimally manage the given resources for forest development.
The total outlay of Rs.12,080 million for both the Non Plan and the Plan were allocated for UPFD in the 10th Plan (2002-07). During the 10th Plan period, UPFD aimed to spend Rs.40 million for JFM activities. Allocations for skill development for SC communities and ST communities were proposed Rs.140 million and Rs.120 million, respectively. Forest Development schemes during the same were classified into three sectors viz. forestry & wildlife, soil conservation and forestry research. However, actually approved outlay was only Rs. 6,295 million, actual budget allocation was Rs. 4,916 million and the actual expenditure was Rs. 4,915.7 million for the 10th plan43.
A scheme-wise proposed financial outlay for 10th Fiver Year Plan for forest sector in
Uttar Pradesh is described in Attachment A1.7-1.
The summary of major physical achievement in forestry sector for the Tenth Plan is given in the table below. During the five years, plantation has been established on 185,522 ha of lands, of which 182,819 ha under UPFD and the remaining under different departments.
Also, 1,023.4 million seedlings have been distributed and planted (Section 5.1 (4)). Descriptions of major plantation schemes during the 10th Plan is provided in Attachment
A1.7-2
Table A1.7-6 describes scheme-wise plantation establishment by UPFD.
43 Figures based on information provided by UPFD during SAPROF Study. There is other source indicating the
approved outlay of Rs. 6,368.6 million, budget allocation of Rs. 4,916.8 million, and the actual expenditure of Rs 4,893 million (11th Five Year Plan Approach Paper, UPFD).
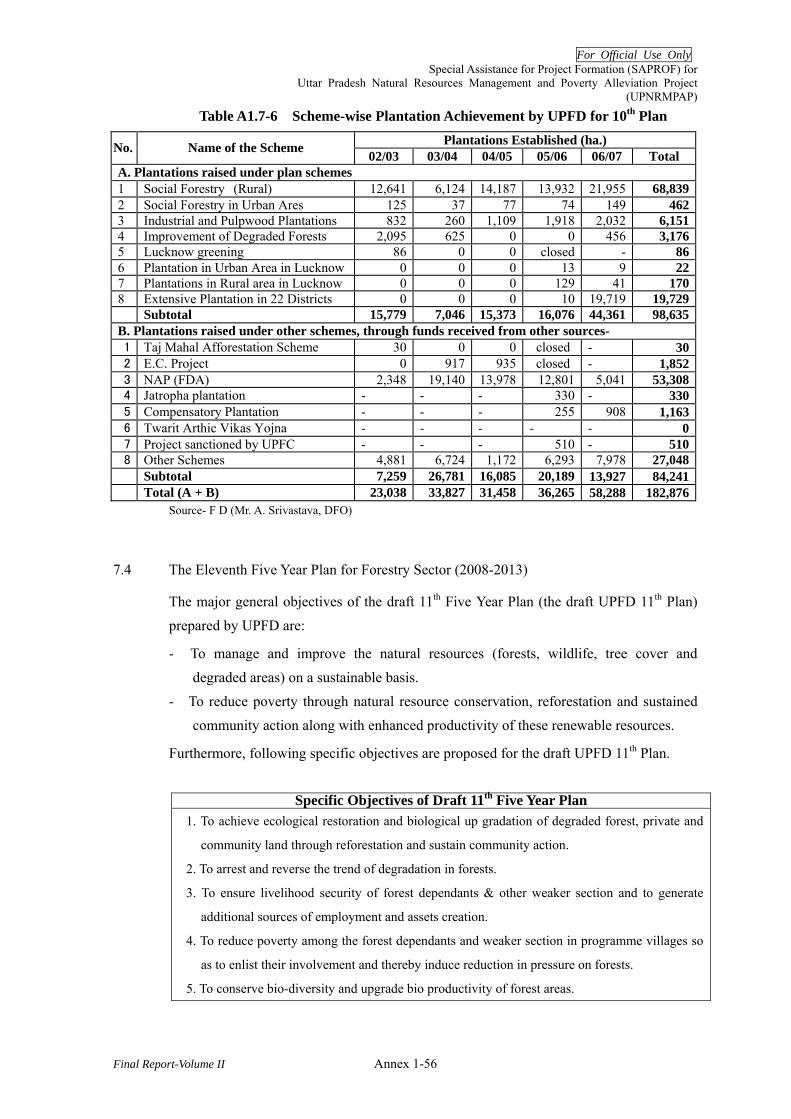
For Official Use Only Special Assistance for Project Formation (SAPROF) for
Uttar Pradesh Natural Resources Management and Poverty Alleviation Project (UPNRMPAP)
Final Report-Volume II Annex 1-56
Table A1.7-6 Scheme-wise Plantation Achievement by UPFD for 10th Plan Plantations Established (ha.) No. Name of the Scheme 02/03 03/04 04/05 05/06 06/07 Total
A. Plantations raised under plan schemes 1 Social Forestry (Rural) 12,641 6,124 14,187 13,932 21,955 68,839 2 Social Forestry in Urban Ares 125 37 77 74 149 462 3 Industrial and Pulpwood Plantations 832 260 1,109 1,918 2,032 6,151 4 Improvement of Degraded Forests 2,095 625 0 0 456 3,1765 Lucknow greening 86 0 0 closed - 86 6 Plantation in Urban Area in Lucknow 0 0 0 13 9 22 7 Plantations in Rural area in Lucknow 0 0 0 129 41 170 8 Extensive Plantation in 22 Districts 0 0 0 10 19,719 19,729 Subtotal 15,779 7,046 15,373 16,076 44,361 98,635 B. Plantations raised under other schemes, through funds received from other sources- 1 Taj Mahal Afforestation Scheme 30 0 0 closed - 30 2 E.C. Project 0 917 935 closed - 1,852 3 NAP (FDA) 2,348 19,140 13,978 12,801 5,041 53,308 4 Jatropha plantation - - - 330 - 330 5 Compensatory Plantation - - - 255 908 1,163 6 Twarit Arthic Vikas Yojna - - - - - 0 7 Project sanctioned by UPFC - - - 510 - 5108 Other Schemes 4,881 6,724 1,172 6,293 7,978 27,048 Subtotal 7,259 26,781 16,085 20,189 13,927 84,241 Total (A + B) 23,038 33,827 31,458 36,265 58,288 182,876
Source- F D (Mr. A. Srivastava, DFO)
7.4 The Eleventh Five Year Plan for Forestry Sector (2008-2013)
The major general objectives of the draft 11th Five Year Plan (the draft UPFD 11th Plan) prepared by UPFD are:
- To manage and improve the natural resources (forests, wildlife, tree cover and degraded areas) on a sustainable basis.
- To reduce poverty through natural resource conservation, reforestation and sustained community action along with enhanced productivity of these renewable resources.
Furthermore, following specific objectives are proposed for the draft UPFD 11th Plan.
Specific Objectives of Draft 11th Five Year Plan
1. To achieve ecological restoration and biological up gradation of degraded forest, private and
community land through reforestation and sustain community action.
2. To arrest and reverse the trend of degradation in forests.
3. To ensure livelihood security of forest dependants & other weaker section and to generate
additional sources of employment and assets creation.
4. To reduce poverty among the forest dependants and weaker section in programme villages so
as to enlist their involvement and thereby induce reduction in pressure on forests.
5. To conserve bio-diversity and upgrade bio productivity of forest areas.

For Official Use Only Special Assistance for Project Formation (SAPROF) for
Uttar Pradesh Natural Resources Management and Poverty Alleviation Project (UPNRMPAP)
Final Report-Volume II Annex 1-57
6. To encourage, motivate and render necessary assistance to people to take up tree growing
private land on massive scale to increase tree cover.
7. To ensure active people’s participation especially the weaker sections of the society and
women in implementation of programmes.
8. To enhance capabilities and motivation of forestry personnel so as to enable them to perform
their functions effectively.
9. To improve capacity and technical capabilities of UPFD.
The main features of the forestry sector described in the approach paper and draft 11th Five Year Plan prepared are summarised as follows:
i) State forest management would need to work for attaining productivity potential of the forests. Timber and non-timber benefits must be optimized with adequate investment for regeneration. The 12th Finance Commission has also supported this cause through grants-in-aid for forest maintenance.
ii) Joint Forest Management (JFM) evolved in 1990s aimed at involving communities in improving degraded forests. This was largely based on benefit sharing. It failed where the forests managed by the communities were so degraded that no significant benefits accrued to the communities. However, there was success in places where leadership was in the hands of highly motivated individuals and significant benefits could be generated. Certain aspects of empowerment, reciprocal commitment for protection and sense of ownership remain to be strengthened in JFM.
iii) The emphasis will be placed on consolidation of JFM through augmenting productivity and linking forests with livelihood and gainful employment generation. Management of NTFP for value addition and linkage to markets need to be organized for better returns to the communities.
iv) The draft UPFD 11th Plan also pays attention to: - Encourage PRIs to revive common property resources through social forestry; - Rationalize forest regulations to allow industry to partner farmers in
undertaking agro-forestry for augmenting the raw material base for forest based industries like paper and pulp;
- Encourage the corporate sector to participate in development of degraded land for forestry, without compromising communities priorities; and
- Rationalize rules and procedures under environmental laws to expedite investment, production and employment growth.
v) Management planning for the Protected Areas will be a priority and each sanctuary/national park will be enabled to maintain a database of vital information on its biodiversity and habitat status.

For Official Use Only Special Assistance for Project Formation (SAPROF) for
Uttar Pradesh Natural Resources Management and Poverty Alleviation Project (UPNRMPAP)
Final Report-Volume II Annex 1-58
vi) Important wildlife habitats of the country will be conserved and protected with participation of the local people. While an interface with communities will be developed. Communication and surveillance of forests and wildlife will be augmented through the Integrated Forest Protection Scheme of MOEF.
vii) People living in deep forests will be encouraged to shift to fringes voluntarily for providing inviolate space for wildlife. To facilitate this process, an appropriate programme including provision for livelihood opportunities will be formulated as suggested by the Tiger Task Force.
viii) Overuse of resources will be identified as a major cause of land degradation. Creation of forest/biomass resources in all the cultivable wastelands will be taken up for strengthening life support system of communities and maintaining soil/water regimes.
ix) A programme for social forestry will support development and sustainable management of the common property resources through Panchayati Raj Institutions.
x) An enabling environment will be created for encouraging tree growing by farmers. Subsidized supply of raw material to industries from government forests will be discouraged. Domestic and international trade on farm forestry produce by support price mechanisms and EXIM/ tariff regulation will be considered. Forest management will be encouraged to withdraw from raising farm forestry plantations in government forests to provide better market opportunities to the farmers.
xi) Other focuses in the draft UPFD 11th Plan are elaborated below: a. Promotion of producing “12 feet tall plants” to reduce biotic damage; b. Promotion of decentralized nurseries to contribute to the increase of tree cover; c. Promotion of forestry awareness programme though establishment and
maintenance of forestry extension excellence centres; d. Implementing the Social Wildlife Scheme in and outside forest areas for
conservation and promotion of wildlife, giving emphasis on alleviation of man animal conflict.
e. Promotion of multi-tier canopy forestry for optimizing land utilization and production from such land;
f. Development of GIS for efficient forest resources management and planning; g. Development of Forest Management Information System (FMIS) to upgrade
existing reporting and information procedures/system in UPFD in concurrence with the e-governance plan prepared by the State’s Information Technology Department;
h. Provision for consultancy services and outsourcing for technical expertise in the following fields: planning, project formulation, M&E, GIS and FMIS; and
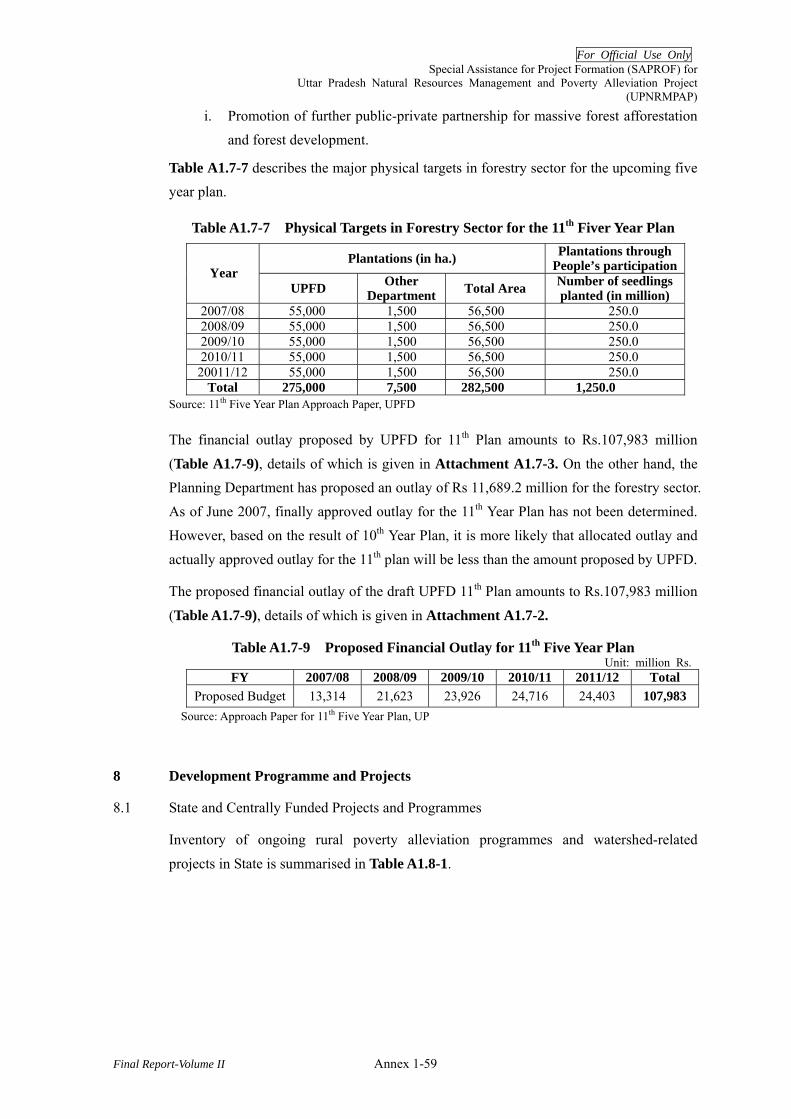
For Official Use Only Special Assistance for Project Formation (SAPROF) for
Uttar Pradesh Natural Resources Management and Poverty Alleviation Project (UPNRMPAP)
Final Report-Volume II Annex 1-59
i. Promotion of further public-private partnership for massive forest afforestation and forest development.
Table A1.7-7 describes the major physical targets in forestry sector for the upcoming five year plan.
Table A1.7-7 Physical Targets in Forestry Sector for the 11th Fiver Year Plan
Plantations (in ha.) Plantations through People’s participationYear
UPFD Other Department Total Area Number of seedlings
planted (in million) 2007/08 55,000 1,500 56,500 250.0 2008/09 55,000 1,500 56,500 250.0 2009/10 55,000 1,500 56,500 250.0 2010/11 55,000 1,500 56,500 250.0
20011/12 55,000 1,500 56,500 250.0 Total 275,000 7,500 282,500 1,250.0
Source: 11th Five Year Plan Approach Paper, UPFD
The financial outlay proposed by UPFD for 11th Plan amounts to Rs.107,983 million
(Table A1.7-9), details of which is given in Attachment A1.7-3. On the other hand, the Planning Department has proposed an outlay of Rs 11,689.2 million for the forestry sector. As of June 2007, finally approved outlay for the 11th Year Plan has not been determined. However, based on the result of 10th Year Plan, it is more likely that allocated outlay and actually approved outlay for the 11th plan will be less than the amount proposed by UPFD.
The proposed financial outlay of the draft UPFD 11th Plan amounts to Rs.107,983 million
(Table A1.7-9), details of which is given in Attachment A1.7-2.
Table A1.7-9 Proposed Financial Outlay for 11th Five Year Plan Unit: million Rs.
FY 2007/08 2008/09 2009/10 2010/11 2011/12 Total Proposed Budget 13,314 21,623 23,926 24,716 24,403 107,983
Source: Approach Paper for 11th Five Year Plan, UP
8 Development Programme and Projects
8.1 State and Centrally Funded Projects and Programmes
Inventory of ongoing rural poverty alleviation programmes and watershed-related
projects in State is summarised in Table A1.8-1.
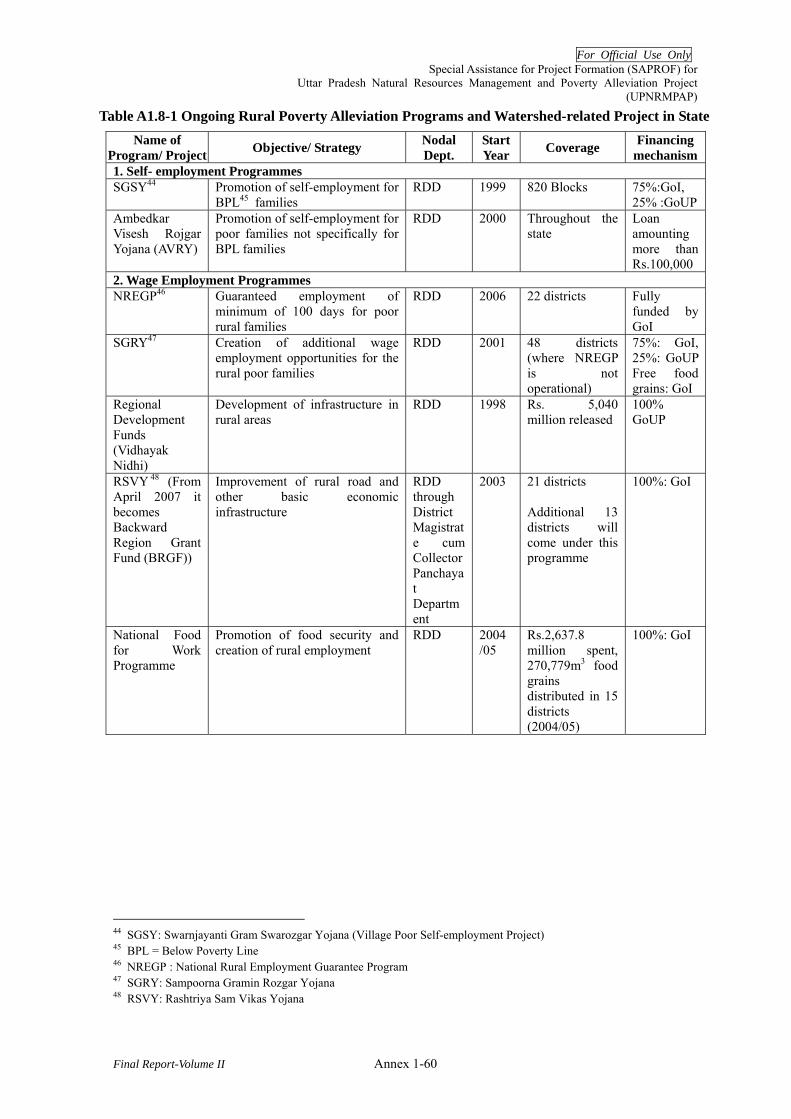
For Official Use Only Special Assistance for Project Formation (SAPROF) for
Uttar Pradesh Natural Resources Management and Poverty Alleviation Project (UPNRMPAP)
Final Report-Volume II Annex 1-60
Table A1.8-1 Ongoing Rural Poverty Alleviation Programs and Watershed-related Project in State Name of
Program/ Project Objective/ Strategy Nodal Dept.
Start Year Coverage Financing
mechanism1. Self- employment Programmes SGSY44 Promotion of self-employment for
BPL45 families RDD 1999 820 Blocks 75%:GoI,
25% :GoUPAmbedkar Visesh Rojgar Yojana (AVRY)
Promotion of self-employment for poor families not specifically for BPL families
RDD 2000 Throughout the state
Loan amounting more than Rs.100,000
2. Wage Employment Programmes NREGP46 Guaranteed employment of
minimum of 100 days for poor rural families
RDD 2006 22 districts Fully funded by GoI
SGRY47 Creation of additional wage employment opportunities for the rural poor families
RDD 2001 48 districts (where NREGP is not operational)
75%: GoI, 25%: GoUP Free food grains: GoI
Regional Development Funds (Vidhayak Nidhi)
Development of infrastructure in rural areas
RDD 1998 Rs. 5,040 million released
100% GoUP
RSVY 48 (From April 2007 it becomes Backward Region Grant Fund (BRGF))
Improvement of rural road and other basic economic infrastructure
RDD through District Magistrate cum CollectorPanchayat Department
2003 21 districts Additional 13 districts will come under this programme
100%: GoI
National Food for Work Programme
Promotion of food security and creation of rural employment
RDD 2004 /05
Rs.2,637.8 million spent, 270,779m3 food grains distributed in 15 districts (2004/05)
100%: GoI
44 SGSY: Swarnjayanti Gram Swarozgar Yojana (Village Poor Self-employment Project) 45 BPL = Below Poverty Line 46 NREGP : National Rural Employment Guarantee Program 47 SGRY: Sampoorna Gramin Rozgar Yojana 48 RSVY: Rashtriya Sam Vikas Yojana
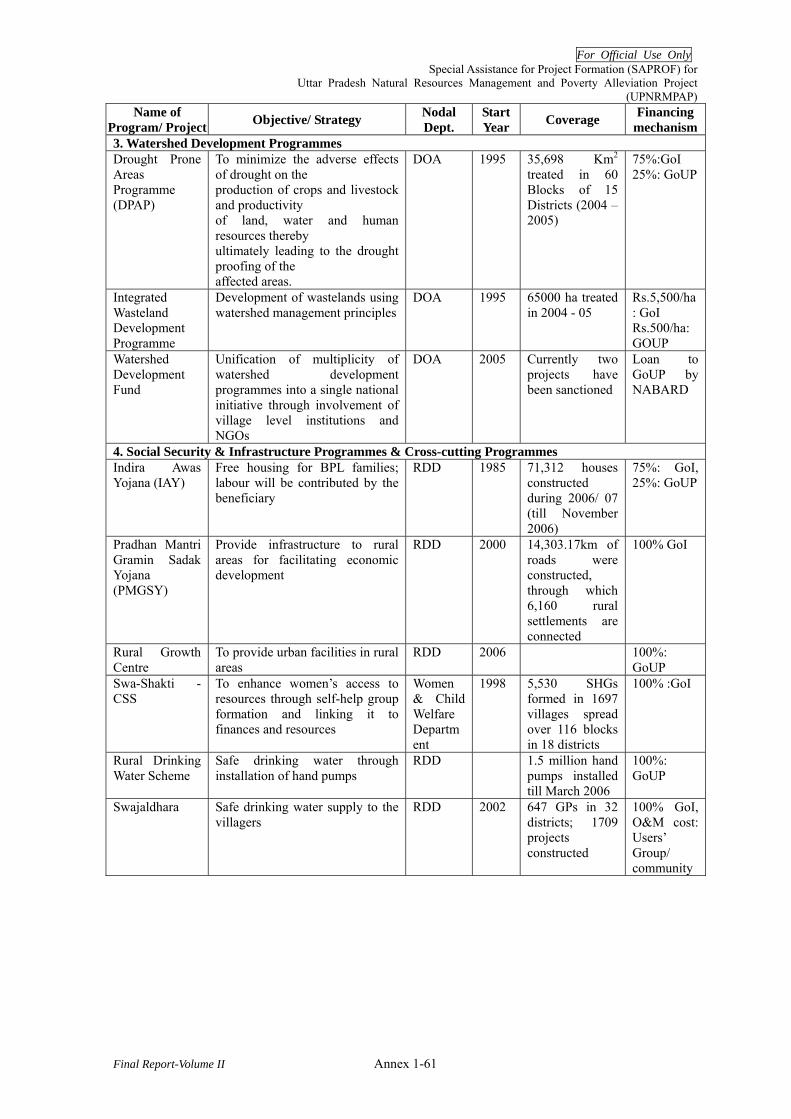
For Official Use Only Special Assistance for Project Formation (SAPROF) for
Uttar Pradesh Natural Resources Management and Poverty Alleviation Project (UPNRMPAP)
Final Report-Volume II Annex 1-61
Name of Program/ Project Objective/ Strategy Nodal
Dept. Start Year Coverage Financing
mechanism3. Watershed Development Programmes Drought Prone Areas Programme (DPAP)
To minimize the adverse effects of drought on the production of crops and livestock and productivity of land, water and human resources thereby ultimately leading to the drought proofing of the affected areas.
DOA 1995 35,698 Km2 treated in 60 Blocks of 15 Districts (2004 – 2005)
75%:GoI 25%: GoUP
Integrated Wasteland Development Programme
Development of wastelands using watershed management principles
DOA 1995 65000 ha treated in 2004 - 05
Rs.5,500/ha: GoI Rs.500/ha: GOUP
Watershed Development Fund
Unification of multiplicity of watershed development programmes into a single national initiative through involvement of village level institutions and NGOs
DOA 2005 Currently two projects have been sanctioned
Loan to GoUP by NABARD
4. Social Security & Infrastructure Programmes & Cross-cutting Programmes Indira Awas Yojana (IAY)
Free housing for BPL families; labour will be contributed by the beneficiary
RDD 1985 71,312 houses constructed during 2006/ 07 (till November 2006)
75%: GoI, 25%: GoUP
Pradhan Mantri Gramin Sadak Yojana (PMGSY)
Provide infrastructure to rural areas for facilitating economic development
RDD 2000 14,303.17km of roads were constructed, through which 6,160 rural settlements are connected
100% GoI
Rural Growth Centre
To provide urban facilities in rural areas
RDD 2006 100%: GoUP
Swa-Shakti - CSS
To enhance women’s access to resources through self-help group formation and linking it to finances and resources
Women & Child Welfare Department
1998 5,530 SHGs formed in 1697 villages spread over 116 blocks in 18 districts
100% :GoI
Rural Drinking Water Scheme
Safe drinking water through installation of hand pumps
RDD 1.5 million hand pumps installed till March 2006
100%: GoUP
Swajaldhara Safe drinking water supply to the villagers
RDD 2002 647 GPs in 32 districts; 1709 projects constructed
100% GoI, O&M cost: Users’ Group/ community
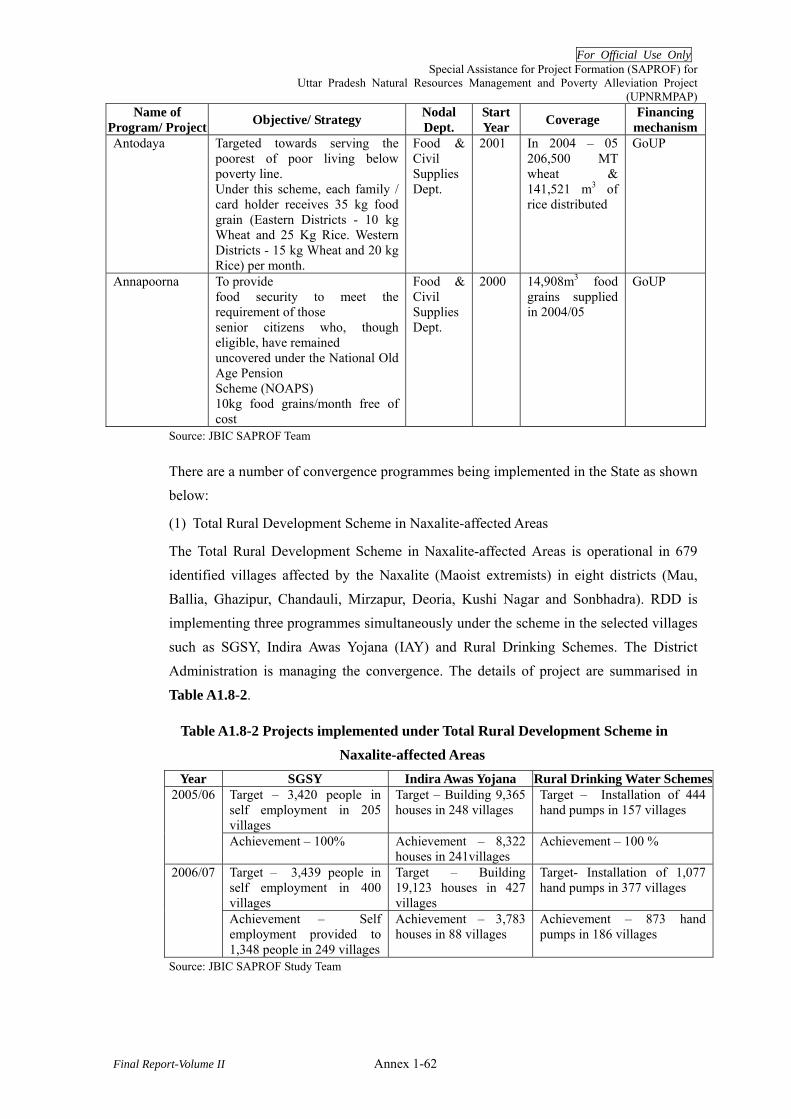
For Official Use Only Special Assistance for Project Formation (SAPROF) for
Uttar Pradesh Natural Resources Management and Poverty Alleviation Project (UPNRMPAP)
Final Report-Volume II Annex 1-62
Name of Program/ Project Objective/ Strategy Nodal
Dept. Start Year Coverage Financing
mechanismAntodaya Targeted towards serving the
poorest of poor living below poverty line. Under this scheme, each family / card holder receives 35 kg food grain (Eastern Districts - 10 kg Wheat and 25 Kg Rice. Western Districts - 15 kg Wheat and 20 kg Rice) per month.
Food & Civil Supplies Dept.
2001 In 2004 – 05 206,500 MT wheat & 141,521 m3 of rice distributed
GoUP
Annapoorna To provide food security to meet the requirement of those senior citizens who, though eligible, have remained uncovered under the National Old Age Pension Scheme (NOAPS) 10kg food grains/month free of cost
Food & Civil Supplies Dept.
2000 14,908m3 food grains supplied in 2004/05
GoUP
Source: JBIC SAPROF Team
There are a number of convergence programmes being implemented in the State as shown below:
(1) Total Rural Development Scheme in Naxalite-affected Areas
The Total Rural Development Scheme in Naxalite-affected Areas is operational in 679 identified villages affected by the Naxalite (Maoist extremists) in eight districts (Mau, Ballia, Ghazipur, Chandauli, Mirzapur, Deoria, Kushi Nagar and Sonbhadra). RDD is implementing three programmes simultaneously under the scheme in the selected villages such as SGSY, Indira Awas Yojana (IAY) and Rural Drinking Schemes. The District Administration is managing the convergence. The details of project are summarised in
Table A1.8-2.
Table A1.8-2 Projects implemented under Total Rural Development Scheme in Naxalite-affected Areas
Year SGSY Indira Awas Yojana Rural Drinking Water Schemes2005/06 Target – 3,420 people in
self employment in 205 villages
Target – Building 9,365 houses in 248 villages
Target – Installation of 444 hand pumps in 157 villages
Achievement – 100% Achievement – 8,322 houses in 241villages
Achievement – 100 %
2006/07 Target – 3,439 people in self employment in 400 villages
Target – Building 19,123 houses in 427 villages
Target- Installation of 1,077 hand pumps in 377 villages
Achievement – Self employment provided to 1,348 people in 249 villages
Achievement – 3,783 houses in 88 villages
Achievement – 873 hand pumps in 186 villages
Source: JBIC SAPROF Study Team

For Official Use Only Special Assistance for Project Formation (SAPROF) for
Uttar Pradesh Natural Resources Management and Poverty Alleviation Project (UPNRMPAP)
Final Report-Volume II Annex 1-63
(2) Ambedkar Gram Vikas Programme
This Programme was launched in 1990/91 with the objective to benefit the people living in areas with higher percentage of population of SC/ST. A number of schemes have been identified for implementation simultaneously in the identified villages under this
Programme. Those schemes are listed in TableA1. 8-3.
Table A1.8-3 Schemes implemented by Ambedkar Gram Vikas Yojana No Department Programme
1. Public Works Department Linking Ambedkar Villages to the Main Roads 2. Power Department Electrification of Ambedkar Villages 3. Rural Development Department Golden Jubilee Rural Self Employment Scheme
Indira Awas Yojana Smokeless Stove Drinking water
4.
Education Department Primary School Education for all Total Literacy Programme Non- formal Education programme
5. Department of Social Welfare & Welfare of Handicapped
Pension to Senior Citizens Scholarship Schemes Handicapped Pension Equipment support to physically challenged
6. Department of Women and Child Development
Widow Pension Scheme Integrated Child Development Scheme
7. Revenue Department Allotment of Agricultural land Allotment of surplus land after sealing Allotment of Housing Place Allotment of Panchayat pond for fisheries Allotment of place to potter Ensuring possession on allotted land
8. Medical and Public Health Department
Immunization of infant Construction of Health Sub Centres
9. Minor Irrigation Department Free Boring well 10 Panchayati Raj Department Drainage formation/Putting Bricks around
drainage Toilet formation
11. Dairy Development Department Women Dairy Scheme Mini Dairy Scheme
12. Animal Husbandry Department Immunization of cattle Artificial insemination
13. Directorate of Silk Development of Silk Industry
Year-wise detail of selected villages and targeted population by the scheme is summarised
in Table A1.8-4.
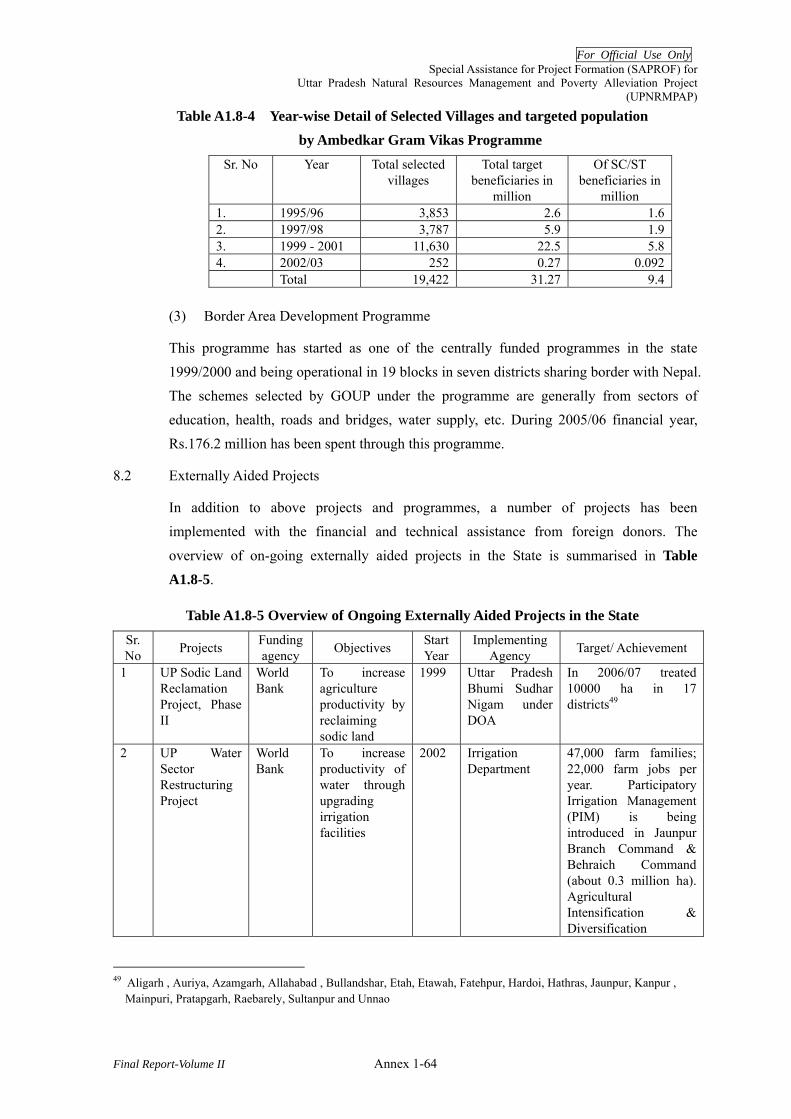
For Official Use Only Special Assistance for Project Formation (SAPROF) for
Uttar Pradesh Natural Resources Management and Poverty Alleviation Project (UPNRMPAP)
Final Report-Volume II Annex 1-64
Table A1.8-4 Year-wise Detail of Selected Villages and targeted population by Ambedkar Gram Vikas Programme
Sr. No Year Total selected villages
Total target beneficiaries in
million
Of SC/ST beneficiaries in
million 1. 1995/96 3,853 2.6 1.62. 1997/98 3,787 5.9 1.93. 1999 - 2001 11,630 22.5 5.84. 2002/03 252 0.27 0.092 Total 19,422 31.27 9.4
(3) Border Area Development Programme
This programme has started as one of the centrally funded programmes in the state 1999/2000 and being operational in 19 blocks in seven districts sharing border with Nepal. The schemes selected by GOUP under the programme are generally from sectors of education, health, roads and bridges, water supply, etc. During 2005/06 financial year, Rs.176.2 million has been spent through this programme.
8.2 Externally Aided Projects
In addition to above projects and programmes, a number of projects has been implemented with the financial and technical assistance from foreign donors. The
overview of on-going externally aided projects in the State is summarised in Table A1.8-5.
Table A1.8-5 Overview of Ongoing Externally Aided Projects in the State Sr. No Projects Funding
agency Objectives Start Year
Implementing Agency Target/ Achievement
1 UP Sodic Land Reclamation Project, Phase II
World Bank
To increase agriculture productivity by reclaiming sodic land
1999 Uttar Pradesh Bhumi Sudhar Nigam under DOA
In 2006/07 treated 10000 ha in 17 districts49
2 UP Water Sector Restructuring Project
World Bank
To increase productivity of water through upgrading irrigation facilities
2002 Irrigation Department
47,000 farm families; 22,000 farm jobs per year. Participatory Irrigation Management (PIM) is being introduced in Jaunpur Branch Command & Behraich Command (about 0.3 million ha). Agricultural Intensification & Diversification
49 Aligarh , Auriya, Azamgarh, Allahabad , Bullandshar, Etah, Etawah, Fatehpur, Hardoi, Hathras, Jaunpur, Kanpur ,
Mainpuri, Pratapgarh, Raebarely, Sultanpur and Unnao
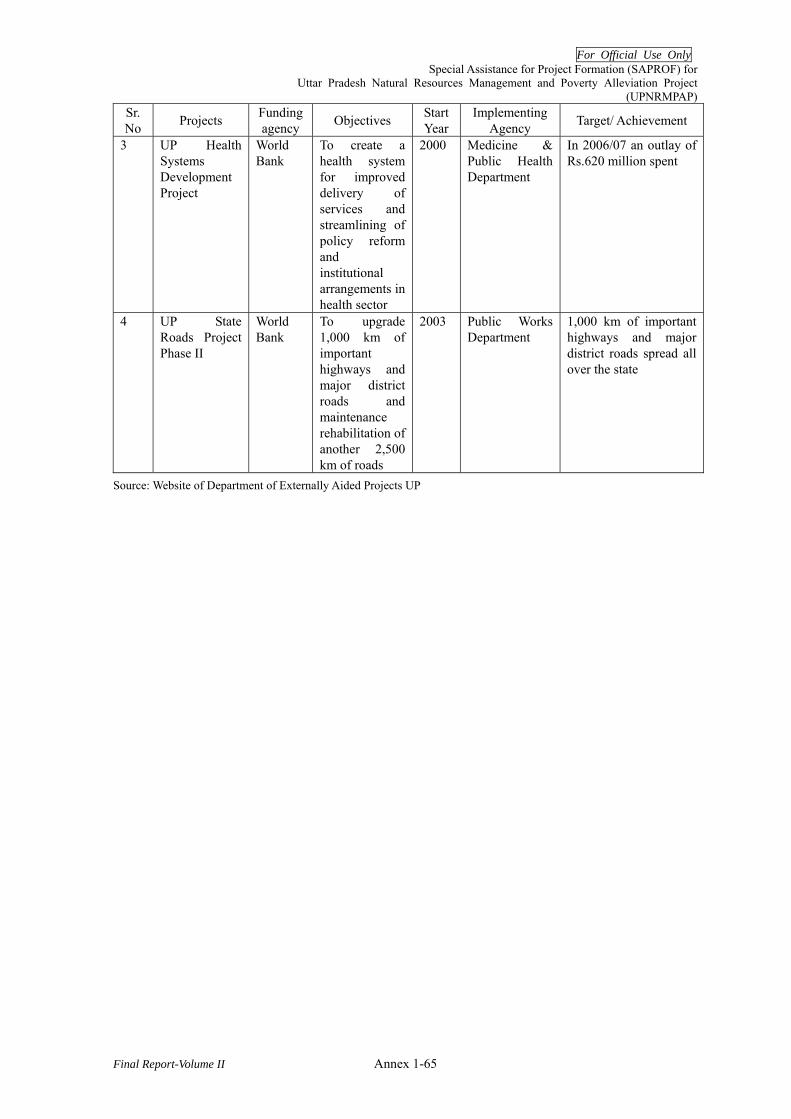
For Official Use Only Special Assistance for Project Formation (SAPROF) for
Uttar Pradesh Natural Resources Management and Poverty Alleviation Project (UPNRMPAP)
Final Report-Volume II Annex 1-65
Sr. No Projects Funding
agency Objectives Start Year
Implementing Agency Target/ Achievement
3 UP Health Systems Development Project
World Bank
To create a health system for improved delivery of services and streamlining of policy reform and institutional arrangements in health sector
2000 Medicine & Public Health Department
In 2006/07 an outlay of Rs.620 million spent
4 UP State Roads Project Phase II
World Bank
To upgrade 1,000 km of important highways and major district roads and maintenance rehabilitation of another 2,500 km of roads
2003 Public Works Department
1,000 km of important highways and major district roads spread all over the state
Source: Website of Department of Externally Aided Projects UP
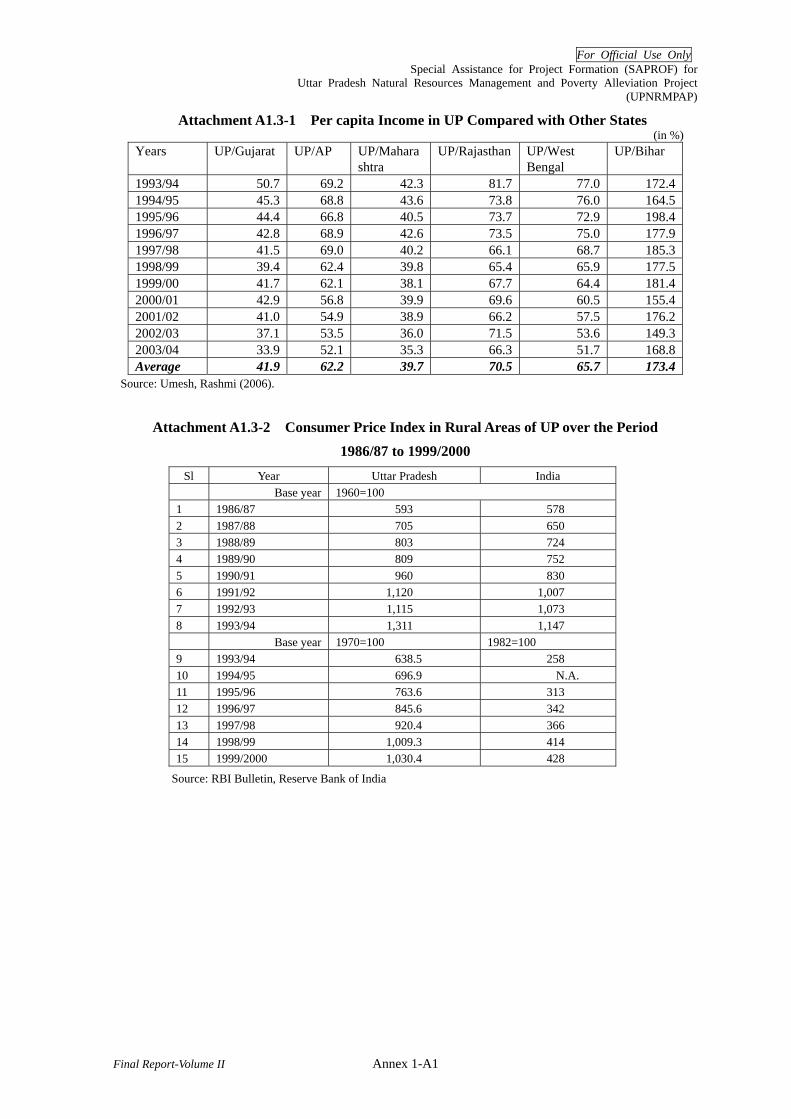
For Official Use Only Special Assistance for Project Formation (SAPROF) for
Uttar Pradesh Natural Resources Management and Poverty Alleviation Project (UPNRMPAP)
Final Report-Volume II Annex 1-A1
Attachment A1.3-1 Per capita Income in UP Compared with Other States (in %)
Years UP/Gujarat UP/AP UP/Maharashtra
UP/Rajasthan UP/West Bengal
UP/Bihar
1993/94 50.7 69.2 42.3 81.7 77.0 172.41994/95 45.3 68.8 43.6 73.8 76.0 164.51995/96 44.4 66.8 40.5 73.7 72.9 198.41996/97 42.8 68.9 42.6 73.5 75.0 177.91997/98 41.5 69.0 40.2 66.1 68.7 185.31998/99 39.4 62.4 39.8 65.4 65.9 177.51999/00 41.7 62.1 38.1 67.7 64.4 181.42000/01 42.9 56.8 39.9 69.6 60.5 155.42001/02 41.0 54.9 38.9 66.2 57.5 176.22002/03 37.1 53.5 36.0 71.5 53.6 149.32003/04 33.9 52.1 35.3 66.3 51.7 168.8Average 41.9 62.2 39.7 70.5 65.7 173.4
Source: Umesh, Rashmi (2006).
Attachment A1.3-2 Consumer Price Index in Rural Areas of UP over the Period 1986/87 to 1999/2000
Sl Year Uttar Pradesh India Base year 1960=100 1 1986/87 593 578 2 1987/88 705 650 3 1988/89 803 724 4 1989/90 809 752 5 1990/91 960 830 6 1991/92 1,120 1,007 7 1992/93 1,115 1,073 8 1993/94 1,311 1,147 Base year 1970=100 1982=100 9 1993/94 638.5 258 10 1994/95 696.9 N.A. 11 1995/96 763.6 313 12 1996/97 845.6 342 13 1997/98 920.4 366 14 1998/99 1,009.3 414 15 1999/2000 1,030.4 428
Source: RBI Bulletin, Reserve Bank of India

For Official Use Only Special Assistance for Project Formation (SAPROF) for
Uttar Pradesh Natural Resources Management and Poverty Alleviation Project (UPNRMPAP)
Final Report-Volume II Annex 1-A2
Attachment A1.3-3: Relevant Articles on Scheduled Castes (SC) and Scheduled Tribes (ST) in the Constitution of India
Scheduled Castes
Article 341
(1) The President may with respect to any State or Union Territory, and where it is a state, after consultation with the Governor thereof, by public notification, specify the castes, races or tribes or parts of or groups within castes, races or tribes which shall for the purposes of this Constitution be deemed to be Scheduled Castes in relation to that State or Union Territory, as the case may be.
(2) Parliament by law include in or exclude from the list of Scheduled Castes specified in a notification issued under clause (1) any caste, race or tribe or part of or group within any caste, race or tribe, but save as aforesaid a notification issued under the said clause shall not be varied by any subsequent notification.
Scheduled Tribes
Article 342
(1) The President may with respect to any State or Union Territory, and where it is a state, after consultation with the Governor thereof, by public notification, specify the tribes or tribal communities or parts of or groups within tribes or tribal communities which shall for the purposes of this Constitution be deemed to be Scheduled Tribes in relation to that State or Union Territory, as the case may be.
(2) Parliament by law include in or exclude from the list of Scheduled Tribes specified in a notification issued under clause (1) any tribe or tribal community or part of or group within any tribe or tribal community, but save as aforesaid a notification issued under the said clause shall not be varied by any subsequent notification.
Under the constitutional order, 1950 as amended in 1990, SCs can be only from Hindus, Sikhs and Buddhists, while STs can be from any of the religions.
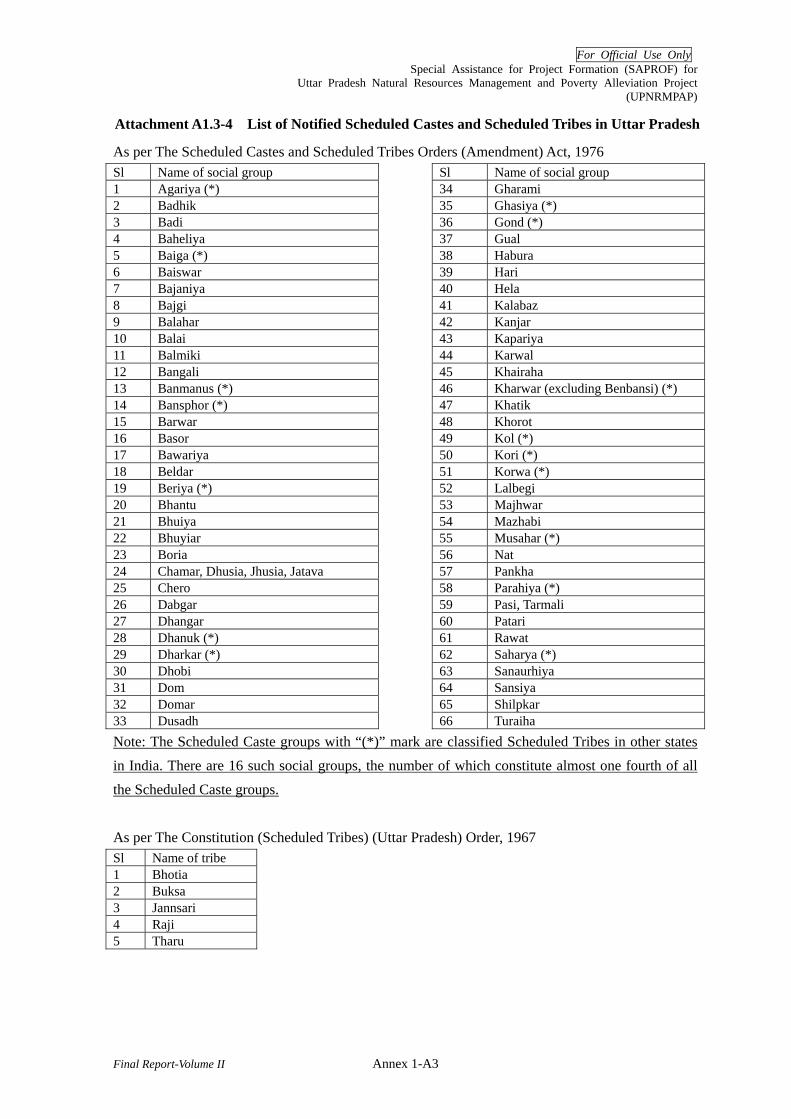
For Official Use Only Special Assistance for Project Formation (SAPROF) for
Uttar Pradesh Natural Resources Management and Poverty Alleviation Project (UPNRMPAP)
Final Report-Volume II Annex 1-A3
Attachment A1.3-4 List of Notified Scheduled Castes and Scheduled Tribes in Uttar Pradesh
As per The Scheduled Castes and Scheduled Tribes Orders (Amendment) Act, 1976 Sl Name of social group Sl Name of social group 1 Agariya (*) 34 Gharami 2 Badhik 35 Ghasiya (*) 3 Badi 36 Gond (*) 4 Baheliya 37 Gual 5 Baiga (*) 38 Habura 6 Baiswar 39 Hari 7 Bajaniya 40 Hela 8 Bajgi 41 Kalabaz 9 Balahar 42 Kanjar 10 Balai 43 Kapariya 11 Balmiki 44 Karwal 12 Bangali 45 Khairaha 13 Banmanus (*) 46 Kharwar (excluding Benbansi) (*) 14 Bansphor (*) 47 Khatik 15 Barwar 48 Khorot 16 Basor 49 Kol (*) 17 Bawariya 50 Kori (*) 18 Beldar 51 Korwa (*) 19 Beriya (*) 52 Lalbegi 20 Bhantu 53 Majhwar 21 Bhuiya 54 Mazhabi 22 Bhuyiar 55 Musahar (*) 23 Boria 56 Nat 24 Chamar, Dhusia, Jhusia, Jatava 57 Pankha 25 Chero 58 Parahiya (*) 26 Dabgar 59 Pasi, Tarmali 27 Dhangar 60 Patari 28 Dhanuk (*) 61 Rawat 29 Dharkar (*) 62 Saharya (*) 30 Dhobi 63 Sanaurhiya 31 Dom 64 Sansiya 32 Domar 65 Shilpkar 33 Dusadh 66 Turaiha Note: The Scheduled Caste groups with “(*)” mark are classified Scheduled Tribes in other states in India. There are 16 such social groups, the number of which constitute almost one fourth of all the Scheduled Caste groups. As per The Constitution (Scheduled Tribes) (Uttar Pradesh) Order, 1967 Sl Name of tribe 1 Bhotia 2 Buksa 3 Jannsari 4 Raji 5 Tharu

For Official Use Only Special Assistance for Project Formation (SAPROF) for
Uttar Pradesh Natural Resources Management and Poverty Alleviation Project (UPNRMPAP)
Final Report-Volume II Annex 1-A4
Attachment A1.3-5 District-wise Percentage of BPL Households and Population in Rural Uttar Pradesh
District Total rural household
Total rural population
Total BPL household
Total BPL population
% BPL household
% BPL population
1 AGRA 335,364 2,012,184 71,088 390,984 21% 19%2 ALIGARH 415,518 2,127,592 58,088 311,484 14% 15%3 ALLAHABAD 992,445 3,742,129 279,542 1,054,045 28% 28%4 AMBEDKAR NAGAR 299,942 2,099,594 195,919 1,241,926 65% 59%5 AZAMGARH 563,993 4,076,080 216,733 1,339,711 38% 33%6 BAGPAT 139,459 978,709 11,996 65,230 9% 7%7 BAHRAICH 430,681 2,589,517 310,724 1,867,191 72% 72%8 BALLIA 361,725 2,492,000 181,771 1,284,626 50% 52%9 BALRAMPUR 239,639 1,471,241 94,789 525,107 40% 36%
10 BANDA 244,224 1,293,316 105,663 528,315 43% 41%11 BARABANKI 665,429 3,131,034 314,363 1,445,025 47% 46%12 BAREILLY 554,761 2,427,139 152,992 667,507 28% 28%13 BASTI 323,702 1,824,258 166,565 869,106 51% 48%14 BIJNOR 427,209 2,231,784 110,395 528,215 26% 24%15 BUDAUN 577,734 2,250,390 163,932 275,409 28% 12%16 BULANDSHAHAR 387,935 2,426,222 46,066 250,987 12% 10%17 CHANDAULI 250,844 1,550,716 135,893 668,349 54% 43%18 CHITRAKOOT 141,559 707,795 78,047 390,235 55% 55%19 DEORIA 372,724 1,195,362 131,101 139,521 35% 12%20 ETAH 352,174 2,276,687 92,071 392,942 26% 17%21 ETAWAH 212,659 1,124,339 103,978 521,051 49% 46%22 FAIZABAD 245,929 1,233,414 140,752 594,763 57% 48%23 FARUKKHABAD 235,387 1,455,722 95,932 475,111 41% 33%24 FATEHPUR 361,922 2,070,634 138,304 885,684 38% 43%25 FIROZABAD 241,800 1,290,217 41,264 175,621 17% 14%26 GAUTAM BUDH NAGAR 105,470 553,042 21,050 105,100 20% 19%27 GHAZIABAD 230,850 1,247,457 20,976 88,765 9% 7%28 GHAZIPUR 415,905 2,532,992 215,132 1,228,614 52% 49%29 GONDA 599,584 2,407,336 222,383 889,532 37% 37%30 GORAKHPUR 502,107 2,472,732 206,223 698,247 41% 28%31 HAMIRPUR 119,259 819,984 80,834 371,591 68% 45%32 HARDOI 477,022 2,994,568 352,986 2,215,910 74% 74%33 HATHRAS 203,854 1,071,551 37,101 191,875 18% 18%34 JALAUN (ORAI) 203,670 1,113,926 102,962 538,487 51% 48%35 JAUNPUR 510,266 3,622,268 222,730 1,581,112 44% 44%36 JHANSI 216,158 1,283,978 71,962 374,746 33% 29%37 J P NAGAR 220,736 1,129,823 57,106 276,260 26% 24%38 KANNAUJ 197,103 1,148,701 75,218 411,864 38% 36%39 KANPUR (DEHAT) 291,618 1,463,658 183,532 890,939 63% 61%40 KANPUR (NAGAR) 271,478 1,380,255 133,243 689,198 49% 50%41 KAUSHAMBI 203,518 1,201,369 149,471 896,826 73% 75%42 KUSHI NAGAR 570,156 2,515,309 282,522 1,072,976 50% 43%43 LAKHIMPUR-KHERI 573,332 2,997,052 317,547 1,528,832 55% 51%

For Official Use Only Special Assistance for Project Formation (SAPROF) for
Uttar Pradesh Natural Resources Management and Poverty Alleviation Project (UPNRMPAP)
Final Report-Volume II Annex 1-A5
District Total rural household
Total rural population
Total BPL household
Total BPL population
% BPL household
% BPL population
44 LALITPUR 168,925 858,394 55,215 261,551 33% 30%45 LUCKNOW 272,717 1,349,073 134,809 661,860 49% 49%46 MAHARAJGANJ 328,427 1,825,541 117,638 561,585 36% 31%47 MAHOBA 129,304 603,484 37,109 128,753 29% 21%48 MAINPURI 239,420 1,317,334 118,199 560,158 49% 43%49 MATHURA 260,417 1,487,191 42,290 241,509 16% 16%50 MAU NATH BHANJAN 268,628 1,611,768 116,424 698,544 43% 43%51 MEERUT 223,097 1,082,081 19,543 90,645 9% 8%52 MIRZAPUR 310,506 1,592,830 213,658 1,089,110 69% 68%53 MORADABAD 502,185 2,133,582 92,857 421,752 18% 20%54 MUZAFAR NAGAR 391,923 2,655,824 58,513 310,069 15% 12%55 ORRAIYA 223,223 1,046,184 99,783 452,252 45% 43%56 PILIBHIT 271,393 1,197,750 112,869 541,741 42% 45%57 PRATAPGARH 525,352 2,626,760 257,907 1,289,535 49% 49%58 RAEBARELI 511,914 2,378,134 316,948 1,374,099 62% 58%59 RAMPUR 249,874 1,478,312 84,416 470,617 34% 32%60 SAHARANPUR 390,856 2,008,965 97,096 493,349 25% 25%61 SANT KABIR NAGAR 271,902 1,150,597 138,999 529,207 51% 46%62 SANT RAVIDAS NAGAR 207,978 740,073 51,352 168,313 25% 23%63 SHAHJAHANPUR 404,400 2,022,329 181,413 1,094,198 45% 54%64 SHRAVASTI 153,248 927,889 93,614 561,684 61% 61%65 SIDDH. NAGAR 335,435 1,885,943 151,438 806,017 45% 43%66 SITAPUR 579,680 2,859,848 348,592 1,643,186 60% 57%67 SONBHADRA 232,005 1,294,835 221,480 1,231,151 95% 95%68 SULTANPUR 548,763 2,743,815 299,713 1,498,565 55% 55%69 UNNAO 451,256 2,400,410 283,272 1,428,578 63% 60%70 VARANASI 286,504 1,878,100 91,043 455,215 32% 24%
Total 24,026,176 127,191,122 10,027,136 50,002,262 42% 39%
Source: Uttar Pradesh BPL Census 2002 published in 2005
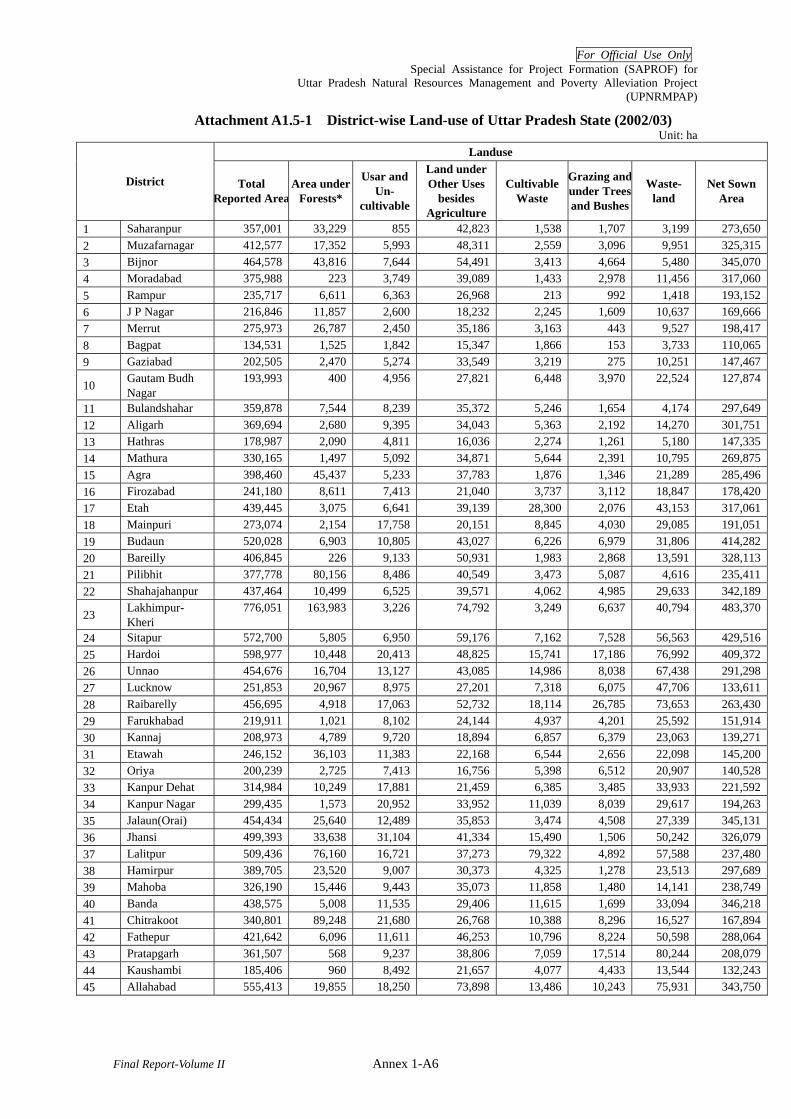
For Official Use Only Special Assistance for Project Formation (SAPROF) for
Uttar Pradesh Natural Resources Management and Poverty Alleviation Project (UPNRMPAP)
Final Report-Volume II Annex 1-A6
Attachment A1.5-1 District-wise Land-use of Uttar Pradesh State (2002/03) Unit: ha
Landuse
District Total Reported Area
Area under Forests*
Usar and Un-
cultivable
Land under Other Uses
besides Agriculture
Cultivable Waste
Grazing andunder Trees and Bushes
Waste- land
Net Sown Area
1 Saharanpur 357,001 33,229 855 42,823 1,538 1,707 3,199 273,650 2 Muzafarnagar 412,577 17,352 5,993 48,311 2,559 3,096 9,951 325,315 3 Bijnor 464,578 43,816 7,644 54,491 3,413 4,664 5,480 345,070 4 Moradabad 375,988 223 3,749 39,089 1,433 2,978 11,456 317,060 5 Rampur 235,717 6,611 6,363 26,968 213 992 1,418 193,152 6 J P Nagar 216,846 11,857 2,600 18,232 2,245 1,609 10,637 169,666 7 Merrut 275,973 26,787 2,450 35,186 3,163 443 9,527 198,417 8 Bagpat 134,531 1,525 1,842 15,347 1,866 153 3,733 110,065 9 Gaziabad 202,505 2,470 5,274 33,549 3,219 275 10,251 147,467
10 Gautam Budh Nagar
193,993 400 4,956 27,821 6,448 3,970 22,524 127,874
11 Bulandshahar 359,878 7,544 8,239 35,372 5,246 1,654 4,174 297,649 12 Aligarh 369,694 2,680 9,395 34,043 5,363 2,192 14,270 301,751 13 Hathras 178,987 2,090 4,811 16,036 2,274 1,261 5,180 147,335 14 Mathura 330,165 1,497 5,092 34,871 5,644 2,391 10,795 269,875 15 Agra 398,460 45,437 5,233 37,783 1,876 1,346 21,289 285,496 16 Firozabad 241,180 8,611 7,413 21,040 3,737 3,112 18,847 178,420 17 Etah 439,445 3,075 6,641 39,139 28,300 2,076 43,153 317,061 18 Mainpuri 273,074 2,154 17,758 20,151 8,845 4,030 29,085 191,051 19 Budaun 520,028 6,903 10,805 43,027 6,226 6,979 31,806 414,282 20 Bareilly 406,845 226 9,133 50,931 1,983 2,868 13,591 328,113 21 Pilibhit 377,778 80,156 8,486 40,549 3,473 5,087 4,616 235,411 22 Shahajahanpur 437,464 10,499 6,525 39,571 4,062 4,985 29,633 342,189
23 Lakhimpur- Kheri
776,051 163,983 3,226 74,792 3,249 6,637 40,794 483,370
24 Sitapur 572,700 5,805 6,950 59,176 7,162 7,528 56,563 429,516 25 Hardoi 598,977 10,448 20,413 48,825 15,741 17,186 76,992 409,372 26 Unnao 454,676 16,704 13,127 43,085 14,986 8,038 67,438 291,298 27 Lucknow 251,853 20,967 8,975 27,201 7,318 6,075 47,706 133,611 28 Raibarelly 456,695 4,918 17,063 52,732 18,114 26,785 73,653 263,430 29 Farukhabad 219,911 1,021 8,102 24,144 4,937 4,201 25,592 151,914 30 Kannaj 208,973 4,789 9,720 18,894 6,857 6,379 23,063 139,271 31 Etawah 246,152 36,103 11,383 22,168 6,544 2,656 22,098 145,200 32 Oriya 200,239 2,725 7,413 16,756 5,398 6,512 20,907 140,528 33 Kanpur Dehat 314,984 10,249 17,881 21,459 6,385 3,485 33,933 221,592 34 Kanpur Nagar 299,435 1,573 20,952 33,952 11,039 8,039 29,617 194,263 35 Jalaun(Orai) 454,434 25,640 12,489 35,853 3,474 4,508 27,339 345,131 36 Jhansi 499,393 33,638 31,104 41,334 15,490 1,506 50,242 326,079 37 Lalitpur 509,436 76,160 16,721 37,273 79,322 4,892 57,588 237,480 38 Hamirpur 389,705 23,520 9,007 30,373 4,325 1,278 23,513 297,689 39 Mahoba 326,190 15,446 9,443 35,073 11,858 1,480 14,141 238,749 40 Banda 438,575 5,008 11,535 29,406 11,615 1,699 33,094 346,218 41 Chitrakoot 340,801 89,248 21,680 26,768 10,388 8,296 16,527 167,894 42 Fathepur 421,642 6,096 11,611 46,253 10,796 8,224 50,598 288,064 43 Pratapgarh 361,507 568 9,237 38,806 7,059 17,514 80,244 208,079 44 Kaushambi 185,406 960 8,492 21,657 4,077 4,433 13,544 132,243 45 Allahabad 555,413 19,855 18,250 73,898 13,486 10,243 75,931 343,750
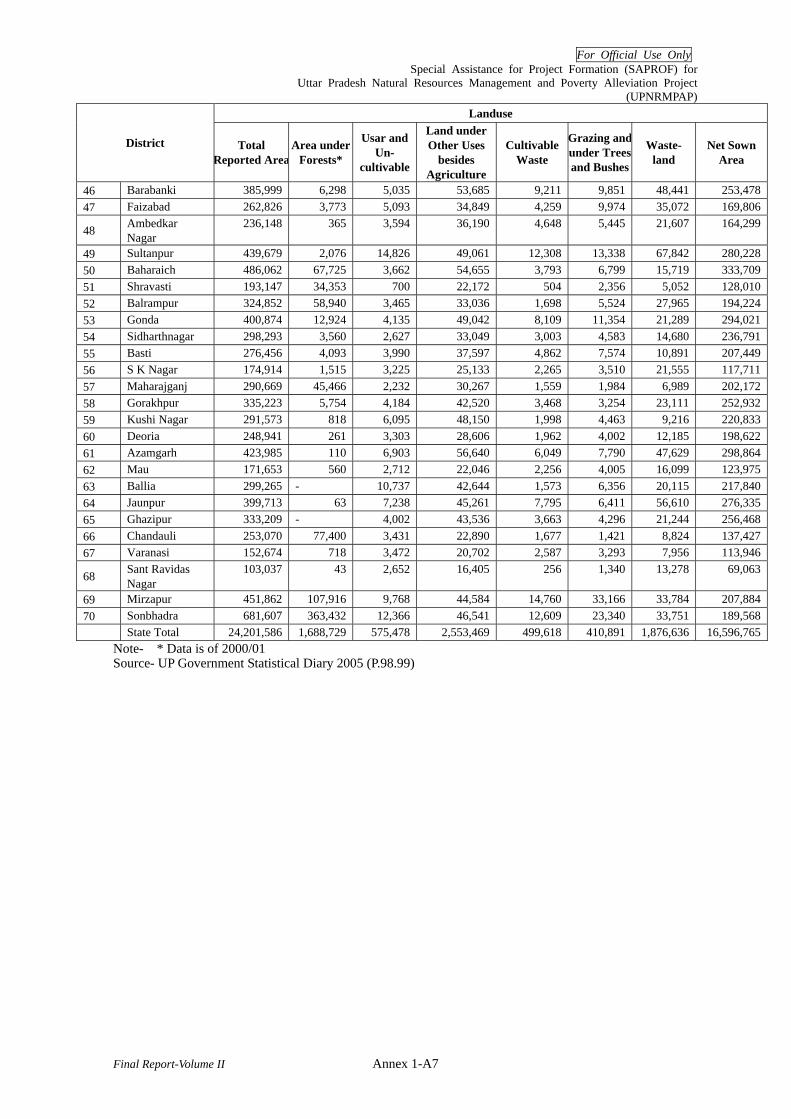
For Official Use Only Special Assistance for Project Formation (SAPROF) for
Uttar Pradesh Natural Resources Management and Poverty Alleviation Project (UPNRMPAP)
Final Report-Volume II Annex 1-A7
Landuse
District Total Reported Area
Area under Forests*
Usar and Un-
cultivable
Land under Other Uses
besides Agriculture
Cultivable Waste
Grazing andunder Trees and Bushes
Waste- land
Net Sown Area
46 Barabanki 385,999 6,298 5,035 53,685 9,211 9,851 48,441 253,478 47 Faizabad 262,826 3,773 5,093 34,849 4,259 9,974 35,072 169,806
48 Ambedkar Nagar
236,148 365 3,594 36,190 4,648 5,445 21,607 164,299
49 Sultanpur 439,679 2,076 14,826 49,061 12,308 13,338 67,842 280,228 50 Baharaich 486,062 67,725 3,662 54,655 3,793 6,799 15,719 333,709 51 Shravasti 193,147 34,353 700 22,172 504 2,356 5,052 128,010 52 Balrampur 324,852 58,940 3,465 33,036 1,698 5,524 27,965 194,224 53 Gonda 400,874 12,924 4,135 49,042 8,109 11,354 21,289 294,021 54 Sidharthnagar 298,293 3,560 2,627 33,049 3,003 4,583 14,680 236,791 55 Basti 276,456 4,093 3,990 37,597 4,862 7,574 10,891 207,449 56 S K Nagar 174,914 1,515 3,225 25,133 2,265 3,510 21,555 117,711 57 Maharajganj 290,669 45,466 2,232 30,267 1,559 1,984 6,989 202,172 58 Gorakhpur 335,223 5,754 4,184 42,520 3,468 3,254 23,111 252,932 59 Kushi Nagar 291,573 818 6,095 48,150 1,998 4,463 9,216 220,833 60 Deoria 248,941 261 3,303 28,606 1,962 4,002 12,185 198,622 61 Azamgarh 423,985 110 6,903 56,640 6,049 7,790 47,629 298,864 62 Mau 171,653 560 2,712 22,046 2,256 4,005 16,099 123,975 63 Ballia 299,265 - 10,737 42,644 1,573 6,356 20,115 217,840 64 Jaunpur 399,713 63 7,238 45,261 7,795 6,411 56,610 276,335 65 Ghazipur 333,209 - 4,002 43,536 3,663 4,296 21,244 256,468 66 Chandauli 253,070 77,400 3,431 22,890 1,677 1,421 8,824 137,427 67 Varanasi 152,674 718 3,472 20,702 2,587 3,293 7,956 113,946
68 Sant Ravidas Nagar
103,037 43 2,652 16,405 256 1,340 13,278 69,063
69 Mirzapur 451,862 107,916 9,768 44,584 14,760 33,166 33,784 207,884 70 Sonbhadra 681,607 363,432 12,366 46,541 12,609 23,340 33,751 189,568 State Total 24,201,586 1,688,729 575,478 2,553,469 499,618 410,891 1,876,636 16,596,765
Note- * Data is of 2000/01 Source- UP Government Statistical Diary 2005 (P.98.99)

For Official Use Only Special Assistance for Project Formation (SAPROF) for
Uttar Pradesh Natural Resources Management and Poverty Alleviation Project (UPNRMPAP)
Final Report-Volume II Annex 1-A8
Attachment A1.5-2 Major Soils in Uttar Pradesh No Soil Groups Major Distribution (Districts) Properties 1 Bhabar Soils Parts of Saharanpur and Bijnour These soils occur in a narrow strip along the foot-hills.
They are mostly coarse-textured, sand to gravelly, highly porous and excessively drained soils. They are largely infertile and poor.
2 Terai Soils Parts of Moradabad, Rampur, Bareilly, Pilibhit, Kheri, Bahraich, Shravasti, Balrampur, Siddharth Nagar, Mahrajganj, Kushinagar
Lies immediately south of the Bhabar Zone but is more extensive, extending in an elongated belt from Saharanpur in the west to Deoria District in the east. The Tarai soils are noted for rich clayey loams, with some proportions of fine sand and humus. They are mildly calcarious and rich in nitrogen. They are well suited for sugar cane and paddy cultivation.
3 Alluvial Soils Parts of Saharanpur, Muzaffar Nagar, Baghpat, Meerut, Ghaziabad, Mehboob Nagar, Aligarh, Mathura, Hathras, Buland Shahar, J.P. Nagar, Moradabad, Rampur, Baduan, Patna, Firozabad, Mainpuri, Etawah, Oria, Kannauj, Farrukhabad, Pilibhit, Shahjahanpur, Kheri, Sitapur, Hardoi, Kanpur, Unnao, Lucknow, Bahraich, Barabanki, Raebareli, Fatehpur, Kaushambi, Pratapgarh, Sultanpur, Faizabad, Gonda, Shrawasti, Balrampur, Siddharth Nagar, Mahrajganj, Ambedkar Nagar, Azamgarh, Jaunpur, Varanasi, Ghazipur, Ballia, Mau, Deoria
The alluvial soils cover the entire Ganga Plain of Uttar Pradesh. They constitute the most important soil group as they support more than 90 % of its population and account for its rich agricultural wealth. They are composed of alluvium deposited by the Ganga and its tributaries. But they vary in texture due to local and regional variations in the younger Khadar soils and relatively older Bangar soils with occasional bhur racts or usar (reh) tracts. In clayey areas, nodules of concentrated lime (Khankar) appear near the surface, particularly noted in Eastern Uttar Pradesh. These soils are moderately alkaline and calcareous. They are poor in nitrogenous matter but are rich in potash, phosphorous and calcium.
4 Calcareous Soils
Deoria and parts of Gorakhpur They form a variant group of the Bhat Soils which occur in the Eastern Saryupar Plain between the Gandak and the little Gandak in Deoria District. They are noted for a high proportion of calcium (25-30 %). They are fairly well-drained and are good for tilth purposes. They have alkaline reaction as well as good moisture-holding capacity. They are particularly suited for sugarcane cultivation.
5 Medium Black Soil
Jhansi, Jalaun, Hamirpur, Banda, Chitrakoot and parts of Mahoba
They cover nearly two-thirds of the Bundelkhand Region of Uttar Pradesh, extending from Jhansi to Banda District. They are highly argillaceous and are noted for their moisture retentive capacity. They are rich in iron, calcium and alunina, but are poor in phosphorous and organic matter. They are associate with granitic and basic gneissic formations and their black color is attributed to the presence of iron. They are noted for their fertility and are suited for cotton cultivation.
6 Mixed Red and Black Soils
Parts of Lalitpur, Jhansi and Mahoba
They are confined to the south-western portion of the Bundelkhand in Jhansi and Lalitpur Districts. The black soils occur in low-lying areas or flat topography and are noted for their black color, clayey texture and moisture retentive capacity whereas the red soils occupy uplands and are light textured and well drained.
7 Red and Yellow Soils
Mirzapur, Sonbhadra and parts of Chandauli and Allahabad
They are associated with rock formations having large quantities of iron which, under uniformly high temperature, disintegrates and gives red or yellow hue to the soils. They are quite porous and light textured and

For Official Use Only Special Assistance for Project Formation (SAPROF) for
Uttar Pradesh Natural Resources Management and Poverty Alleviation Project (UPNRMPAP)
Final Report-Volume II Annex 1-A9
No Soil Groups Major Distribution (Districts) Properties are fertile only where they are deep and fine-grained. They are usually poor in nitrogen, phosphorous and calcium.
8 Red Sandy Soils
Southern Lalitpur and parts of Agra
They are a variant group of red soils and are associated with crystalline formations. The red sandy soils overlie heavy sub-soils, usually on recent erosion surfaces in semi-arid climate. In their chemical composition they are mainly siliceous and aluminous with free quartz as sand. They are generally deficient in calcium, phosphates, nitrogen and humus but are fairly rich in potash.
9 Red Brown Soils
Parts of Agra These soils are found adjoining the chain of the Aravalli hillocks. They have developed from the detritus material carried by the streams. They are largely sandy with reddish brown color and coarse texture. They are calcareous in nature with neutral to slight alkaline reaction. They have a low fertility status and are not suitable for good agricultural harvests.
Source: Planning Atlas of Uttar Pradesh 1987. Planning Department, Govt. of Uttar Pradesh, Lucknow.
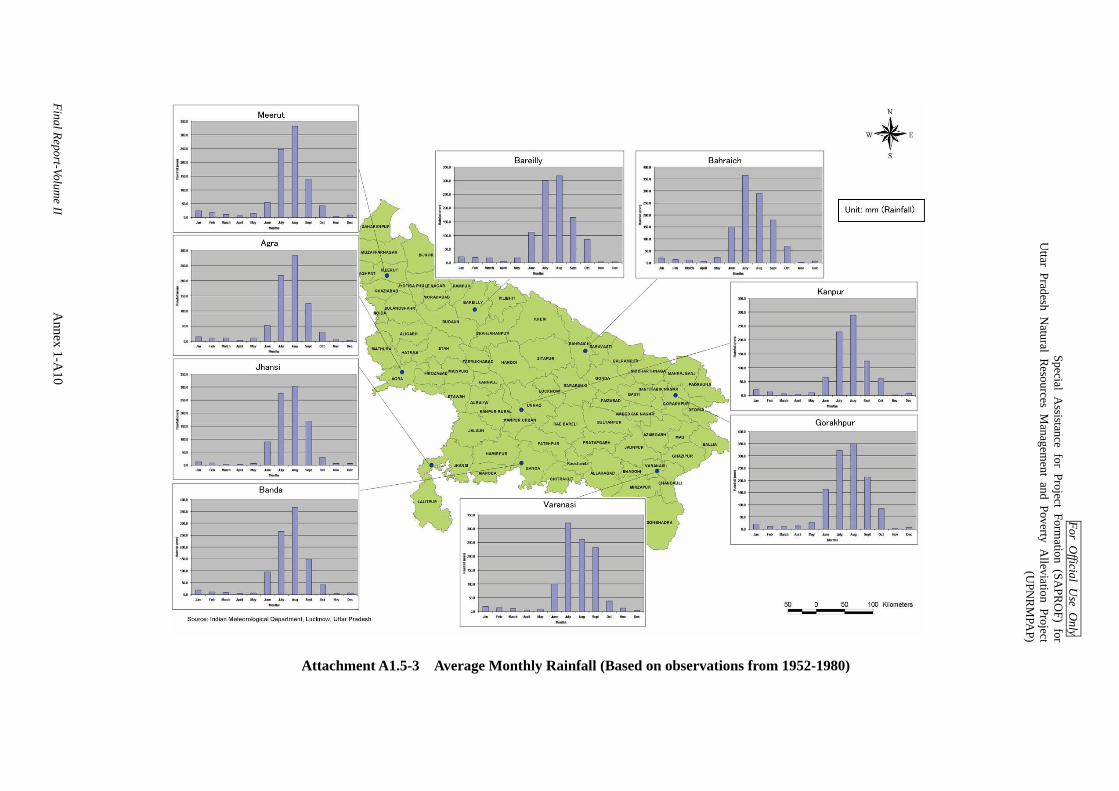
For Official U
se Only
Special Assistance for Project Form
ation (SAPR
OF) for
Uttar Pradesh N
atural Resources M
anagement and Poverty A
lleviation Project (U
PNR
MPA
P)
Final Report-Volume II
Annex 1-A
10
Attachment A1.5-3 Average Monthly Rainfall (Based on observations from 1952-1980)

For Official U
se Only
Special Assistance for Project Form
ation (SAPR
OF) for
Uttar Pradesh N
atural Resources M
anagement and Poverty A
lleviation Project (U
PNR
MPA
P)
Final Report-Volume II
Annex 1-A
11
Attachment A1.5-4 Average Monthly Maximum & Minimum Temperature (Based on observations from 1952-1980)
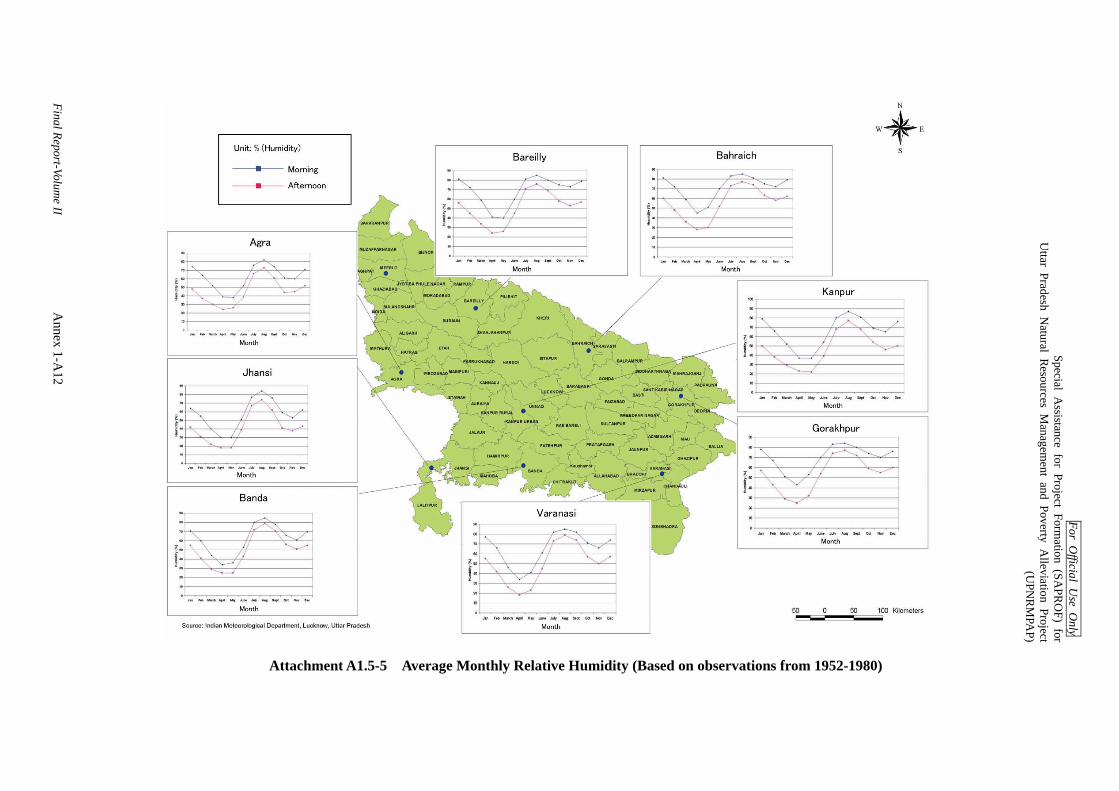
For Official U
se Only
Special Assistance for Project Form
ation (SAPR
OF) for
Uttar Pradesh N
atural Resources M
anagement and Poverty A
lleviation Project (U
PNR
MPA
P)
Final Report-Volume II
Annex 1-A
12
Attachment A1.5-5 Average Monthly Relative Humidity (Based on observations from 1952-1980)

For Official Use Only Special Assistance for Project Formation (SAPROF) for
Uttar Pradesh Natural Resources Management and Poverty Alleviation Project (UPNRMPAP)
Final Report-Volume II Annex 1-A13
Attachment A1.5-6 Salient Features about Flood Damage in the State of Uttar Pradesh
Affected Districts
Affected Population
Affected Villages
Total Area Affected
Total Agriculture
Land AffectedLoss of Life
Estimated Financial
Loss NO Year
(No) 0 (No) (0000 ha) (0000ha) Human (no)
Livestock(no)
( million Rs)
1 1973 40 1,415 30,004 350 222 163 375 2,968 2 1974 39 739 14,948 199 122 72 160 1,732 3 1975 35 921 18,629 237 142 181 892 1,924 4 1976 36 1,320 32,962 335 183 240 1,434 2,348 5 1977 31 370 7,536 129 64 157 887 770 6 1978 55 2,259 48,889 725 388 739 7,430 6,884 7 1979 16 211 3,913 70 52 77 220 576 8 1980 46 3,035 44,629 586 309 1,309 5,244 7,907 9 1981 33 1,463 20,706 299 164 427 1,356 2,864
10 1982 44 2,329 32,459 554 331 562 2,517 5,857 11 1983 56 1,553 24,731 386 250 519 2,101 7,540 12 1984 39 658 11,600 167 103 209 432 2,622 13 1985 55 1,956 27,113 403 242 804 3,808 12,163 14 1986 45 592 8,925 103 65 233 725 2,786 15 1987 9 382 5,807 58 32 163 990 1,861 16 1988 46 1,820 24,721 317 171 765 2,102 8,346 17 1989 25 486 8,281 100 65 168 516 NA18 1990 51 853 15,524 220 106 471 2,889 NA19 1991 29 242 3,372 81 21 214 369 NA20 1992 20 292 4,254 59 33 140 979 NA21 1993 34 751 11,765 151 79 314 2,088 NA22 1994 45 391 9,627 99 60 317 4,855 NA23 1995 51 369 8,874 128 80 321 1,257 NA24 1996 44 722 8,827 112 68 313 1,232 NA25 1997 29 102 2,284 35 16 102 144 NA26 1998 55 1,291 15,618 252 142 1,356 3,384 NA27 1999 11 18 299 54 41 17 9 NA28 2000 40 638 5,882 78 47 453 977 NA29 2001 21 272 3,819 46 29 201 251 NA30 2002 14 39 770 11 6 33 36 NA31 2003 54 1,348 17,011 236 150 964 3,201 NA32 2004 2 144 865 24 0 88 217 NA33 2005 35 245 3,652 36 38 203 259 NA
Avg. 36 886 14,494 201 116 373 1,616 4,322
Source: Uttar Pradesh Irrigation Department, Investigation and Floods Division ,Lucknow, Report 2005

For Official Use Only Special Assistance for Project Formation (SAPROF) for
Uttar Pradesh Natural Resources Management and Poverty Alleviation Project (UPNRMPAP)
Final Report-Volume II Annex 1-A14
Attachment A1.5-7 Effect of Drought on Agriculture of Districts of UP (October 2004)
District Target Area
Actual Area Sown
% Loss to Area
sown
Overall Loss % District Target
Area
Actual Area Sown
% Loss to Area sown
Overall Loss %
(ha) (ha) % % (ha) (ha) % % A )> 70 % overall loss C) 50-60 % overall loss
Agra 231,502 221,517 57 59 Azamgarh 231,502 221,517 57 59
Aligarh 153,764 149,276 52 53 Ballia 153,764 149,276 52 53
Etah 98,142 108,249 51 51 Mau 98,142 108,249 51 51
Mathura 140,827 119,576 52 59 Fatehpur 140,827 119,576 52 59
Allahabad 125,514 114,619 53 57 Kanpur Dehat 125,514 114,619 53 57
Kaushambi 98,047 99,910 56 56 Kannauj 98,047 99,910 56 56
Etawah 199,498 204,599 52 52 Basti 199,498 204,599 52 52
Orai 155,886 162,945 57 57 Sidarthnagar 155,886 162,945 57 57
Hamirpur 102,740 102,802 51 51 Sant K.Nagar 102,740 102,802 51 51
Jhansi 65,322 61,995 53 55 Mahoba 65,322 61,995 53 55
Gaziabad 209,593 209,325 52 52 Barabanki 209,593 209,325 52 52
Mirzapur 191,648 189,039 51 52 Sultanpur 191,648 189,039 51 52
SRD Nagar 125,316 122,693 52 53 Ambedkarnagar 125,316 122,693 52 53
Mahamayanagar 279,922 280,665 52 52 Gonda 279,922 280,665 52 52
B) 60-70 % overall loss Bahraich 274,762 272,572 52 52
Firozabad 157,677 150,973 55 57 Balrampur 157,677 150,973 55 57
Mainpuri 106,018 105,172 50 51 Shravasti 106,018 105,172 50 51
Pratapnagar 280,549 274,971 51 52 Moradabad 280,549 274,971 51 52
Kanpur Nagar 174,609 167,877 52 53 Meerut 174,609 167,877 52 53
Farukhabad 91,786 90,048 50 51 Bagpat 91,786 90,048 50 51
Banda 281,975 275,031 54 55 Mazaffarnagar 281,975 275,031 54 55
Chitrakoot 238,500 231,647 50 51 Saharanpur 238,500 231,647 50 51
Jalaun 63,752 53,462 49 57 Lucknow 63,752 53,462 49 57
Badaun 272,909 263,359 55 56 Hardoi 272,909 263,359 55 56
Bulandshahr 319,268 318,168 55 55 Sitapur 319,268 318,168 55 55 Gautambudh Nagar 193,684 153,527 37 50 Raibarely 193,684 153,527 37 50
Gazipur 176,462 124,880 30 50 Unnao 176,462 124,880 30 50
Jaunpur 75,501 49,177 30 54 Varanasi 75,501 49,177 30 54
Chandauli 118,419 55,838 10 58 Source: UP Revenue Department Web Site

For Official Use Only Special Assistance for Project Formation (SAPROF) for
Uttar Pradesh Natural Resources Management and Poverty Alleviation Project (UPNRMPAP)
Final Report-Volume II Annex 1-A15
Attachment A1.6-1 Activities of Department of Animal Husbandry Type Detail
Animal Health Care and Veterinary Services
Central disease diagnostic laboratory at Directorate which functions as referral lab beside 12 regional labs for disease diagnostic facilities and containment of diseases in the state. Quality treatment services are being provided by number of veterinary hospitals in the state.
Poultry Development
Uttar Pradesh is 9th largest producer of eggs in the country and has been able to achieve of late a growth rate of 20%. As a milestone achievement U.P. has become first state of country to give the status of industry to poultry production.
Sheep and Goat Development
Sheep in U.P. are traditionally reared for wool and meat while goats are primarily for meat. U.P. has a unique resource of indigenous goat breeds like Jamunapari and Barbari. The sheep breeds viz. Ramboullet and Marino are maintained in hilly areas with the objectives to improve local breeds for the production of fine apparel wool. Nali breed is being maintained in the eastern region for the improvement of local breed to enhance the production of coarse wool for carpet manufacturing.
Pig Development
The cross breeding programme has been taken up by using Middle White Yorkshire boars to improve the local stock. The department has established one piggery development training center at C.D.F. Aligarh. 10 days training programme is being conducted by department free of cost.
Feed, Fodder and Forage Development
During different plan periods, concerted efforts have been made to popularise nutritious fodder crops by giving various incentives to the farmers like subsidy in fodder demonstration & distribution of fodder seed minikits.
Self Employment Schemes
Under Ambedkar Vishesh Rojgar Yojna, training is imparted to rural unemployed youths in A.I. Besides this they are being encouraged to establish milch animal, sheep, goat, pig, and poultry units for self employment and sustained income generation.
Marketing Development
To collect, compile and publish the average monthly, quarterly and annual reports regarding the rates of selected cities of milk and milk by products, meat and its by product, cattle seeds, cattle feed, green fodder etc. live livestock of various categories; to maintain the byelaws of cooperative societies and help the desirable persons to form cooperative societies for pig, sheep, poultry and cattle and their by-products.
Goshala (Cattle pen) , Goseva Ayog:
Registration of Goshalas established by public trusts for maintaining old, infirm, unproductive cows and its progeny. Under National Bull Production Programme these Goshalas have been used to produce good quality indigenous bulls and preservation & conservation of indigenous breeds.
Training Facilities
One month Poultry Training at Chakganjaria, Lucknow Ten day Poultry Training at Chakganjaria, Lucknow Ten Days Piggery Training at C.D.F. Aligarh 2 month to 3 month inseminator training/private training. 45 days Sheep & Wool development training at Pashulok, Rishikesh

For Official U
se Only
Special Assistance for Project Form
ation (SAPR
OF) for
Uttar Pradesh N
atural Resources M
anagement and Poverty A
lleviation Project(U
PNR
MPA
P)
Final Report - Volume II
Annex
1-A16
Attachment A1.7-1 Scheme-wise Outlay, Budget Provision, and Expenditure for Plan Scheme in UPFD under 10th Five Year Plan Unit: Rs. million
# 2002/03 2003/04 2004/05 2005/06 2006/07 Total
Sector/Name of Schemes O B E O B E O B E O B E O B E * O B E
A Grant No. 60 I State Sector- 1 Forest Research 2.5 2.3 2.3 0.5 0.5 0.5 1.3 1.0 1.0 3.0 3.0 3.0 3.0 3.0 3.0 10.3 9.8 9.8 2 Seed
Development Scheme
0.0 0.0 0.0 0.0 2.7 2.6 0.0 0.0 0.0 0.0 0.0 0.0 0.0 0.0 0.0 0.0 2.7 2.6
3 Development of Lucknow Zoo
2.0 2.0 2.0 0.5 0.5 0.5 1.0 1.0 1.0 5.0 0.0 0.0 0.0 0.0 0.0 8.5 3.5 3.5
4 U.P.Forestry Project (World Bank Aided)
480.0 180.7 180.7 4.4 4.0 4.0 0.0 0.0 0.0 0.0 0.0 0.0 0.0 0.0 0.0 484.4 184.6 184.6
5 U.P. Forestry Project -II
0.0 0.0 0.0 0.4 0.0 0.0 0.0 0.0 0.0 0.0 0.0 0.0 0.0 0.0 0.0 0.4 0.0 0.0
6 Modern Forest Fire Protection Project
0.0 2.1 2.1 0.0 0.0 0.0 0.0 0.0 0.0 0.0 0.0 0.0 0.0 0.0 0.0 0.0 2.1 2.1
7 Project Tiger (CSS)
54.2 4.3 4.3 53.9 24.6 24.6 26.5 26.6 26.6 29.6 24.3 24.3 8.5 26.9 26.9 172.7 106.6 106.6
8 Development of Parks &Birds Sanctuary
0.0 13.2 13.0 0.0 17.7 17.7 0.0 29.3 28.8 0.2 34.7 34.7 0.0 30.7 30.7 0.2 125.5 124.9
9 Forest fire control project (ACA)
0.6 0.6 0.6 0.0 0.0 0.0 0.0 0.0 0.0 0.0 0.0 0.0 0.0 0.0 0.0 0.6 0.6 0.6
10 Border Area development Programme
8.4 8.4 8.4 2.9 2.7 2.7 1.1 0.9 0.9 3.3 3.3 3.3 0.0 0.0 0.0 15.7 15.3 15.3
11 Improvement of degraded forests
30.0 30.0 30.0 16.0 16.0 16.0 14.6 7.7 7.7 11.2 8.0 8.0 4.1 4.1 4.1 75.9 65.8 65.8
12 Social Forestry (Operation Green)
12.5 12.3 12.3 1.3 1.3 1.2 0.0 0.0 0.0 0.0 0.0 0.0 0.0 0.0 0.0 13.8 13.5 13.5
13 Plantation in Lucknow City(A.C.A.)
4.0 4.0 4.0 0.0 0.0 0.0 0.0 0.0 0.0 0.0 0.0 0.0 0.0 0.0 0.0 4.0 4.0 4.0

For Official U
se Only
Special Assistance for Project Form
ation (SAPR
OF) for
Uttar Pradesh N
atural Resources M
anagement and Poverty A
lleviation Project(U
PNR
MPA
P)
Final Report - Volume II
Annex
1-A17
# 2002/03 2003/04 2004/05 2005/06 2006/07 Total
Sector/Name of Schemes O B E O B E O B E O B E O B E * O B E
14 Integrated Afforestation &Ecodevelopment
0.0 2.4 2.4 0.0 2.0 2.0 0.0 0.0 0.0 0.0 0.0 0.0 0.0 0.0 0.0 0.0 4.4 4.4
Project District Hardoi Bijnor, &Agra
0.0 0.0 0.0 0.0 0.0 0.0 0.0 0.0 0.0 0.0 0.0 0.0 0.0 0.0 0.0 0.0 0.0 0.0
15 Integrated forest protection scheme
0.0 8.0 8.0 3.3 11.2 11.2 10.2 28.7 28.6 7.1 10.1 10.1 6.8 27.1 27.1 27.4 85.0 84.9
16 Training for Scheduled Caste
0.0 0.0 0.0 10.0 0.0 0.0 0.0 0.0 0.0 0.0 0.0 0.0 0.0 0.0 0.0 10.0 0.0 0.0
17 Building (State Sector)
7.0 6.9 6.9 0.0 0.0 0.0 0.0 0.0 0.0 0.0 0.0 0.0 0.0 0.0 0.0 7.0 6.9 6.9
18 Plantation in Lucknow
0.0 0.0 0.0 0.0 0.0 0.0 6.6 6.6 6.6 6.6 6.6 6.6 6.6 6.6 6.6 19.8 19.8 19.8
19 Plantation in rural area of Lucknow District
0.0 0.0 0.0 0.0 0.0 0.0 3.4 3.4 3.4 3.4 3.4 3.4 3.4 3.4 3.4 10.2 10.2 10.2
20 Roadside plantation in Manpuri and Etawa District
0.0 0.0 0.0 0.0 0.0 0.0 0.0 0.0 0.0 10.0 10.0 10.0 4.4 4.4 4.4 14.4 14.4 14.4
21 Crane Conservation Scheme
0.0 0.0 0.0 0.0 0.0 0.0 0.0 0.0 0.0 0.0 0.0 0.0 100.0 100.0 100.0 100.0 100.0 100.0
22 Beautification of Vasudharwah in Balia District
0.0 0.0 0.0 0.0 0.0 0.0 0.0 0.0 0.0 4.1 4.0 4.0 11.3 3.0 3.0 15.4 7.0 7.0
23 Beautification of central zone of Karjan& National highway
0.0 0.0 0.0 0.0 0.0 0.0 0.0 0.0 0.0 0.0 0.0 0.0 9.7 9.7 9.7 9.7 9.7 9.7
24 Lion Safari Park in Fisher Forest Etawa
0.0 0.0 0.0 0.0 0.0 0.0 5.4 0.0 0.0 35.3 0.0 0.0 15.3 15.3 15.3 56.1 15.3 15.3

For Official U
se Only
Special Assistance for Project Form
ation (SAPR
OF) for
Uttar Pradesh N
atural Resources M
anagement and Poverty A
lleviation Project(U
PNR
MPA
P)
Final Report - Volume II
Annex
1-A18
# 2002/03 2003/04 2004/05 2005/06 2006/07 Total
Sector/Name of Schemes O B E O B E O B E O B E O B E * O B E
25 Dense plantation
0.0 0.0 0.0 0.0 0.0 0.0 0.0 0.0 0.0 427.2 427.2 427.2 715.8 715.8 715.8 1,143.0
1,143.0
1,143.0
26 N. T.F.P. 0.0 0.0 0.0 0.0 0.0 0.0 0.0 3.2 3.2 0.0 0.0 0.0 0.0 0.0 0.0 0.0 3.2 3.2 27 Bamboo
Plantation scheme in Bundelkhund
0.0 0.0 0.0 0.0 0.0 0.0 24.5 0.0 0.0 19.7 0.0 0.0 0.0 0.0 0.0 44.2 0.0 0.0
28 Schemes governed by Water shed development fund
0.0 0.0 0.0 0.0 0.0 0.0 15.0 0.0 0.0 0.0 0.0 0.0 0.0 0.0 0.0 15.0 0.0 0.0
29 Project Elephant
0.0 0.0 0.0 0.0 0.0 0.0 0.0 1.2 1.2 0.0 0.0 0.0 0.0 0.6 0.6 0.0 1.8 1.8
30 Development of Kanpur Zoo
0.0 0.0 0.0 0.0 0.0 0.0 0.0 0.0 0.0 5.0 0.0 0.0 0.0 0.0 0.0 5.0 0.0 0.0
31 Conservation of Dudhwa National Park
0.0 0.0 0.0 0.0 0.0 0.0 0.0 0.0 0.0 22.5 0.0 0.0 0.0 0.0 0.0 22.5 0.0 0.0
32 Forestland survey demarcation and boundary wall
0.0 0.0 0.0 0.0 0.0 0.0 0.0 0.0 0.0 67.3 0.0 0.0 0.0 0.0 0.0 67.3 0.0 0.0
33 National Wetland Conservation Programme
0.0 0.0 0.0 0.0 0.0 0.0 0.0 0.0 0.0 0.0 0.0 0.0 0.0 27.4 27.4 0.0 27.4 27.4
34 Bamboo Forest Conservation & Improvement in Vindhya & Bundelkhand Regions
0.0 0.0 0.0 0.0 0.0 0.0 0.0 0.0 0.0 0.0 0.0 0.0 19.7 0.0 0.0 19.7 0.0 0.0
35 Chaudhary charan Singh birds Development
0.0 0.0 0.0 0.0 0.0 0.0 0.0 0.0 0.0 0.0 0.0 0.0 0.0 5.0 5.0 0.0 5.0 5.0
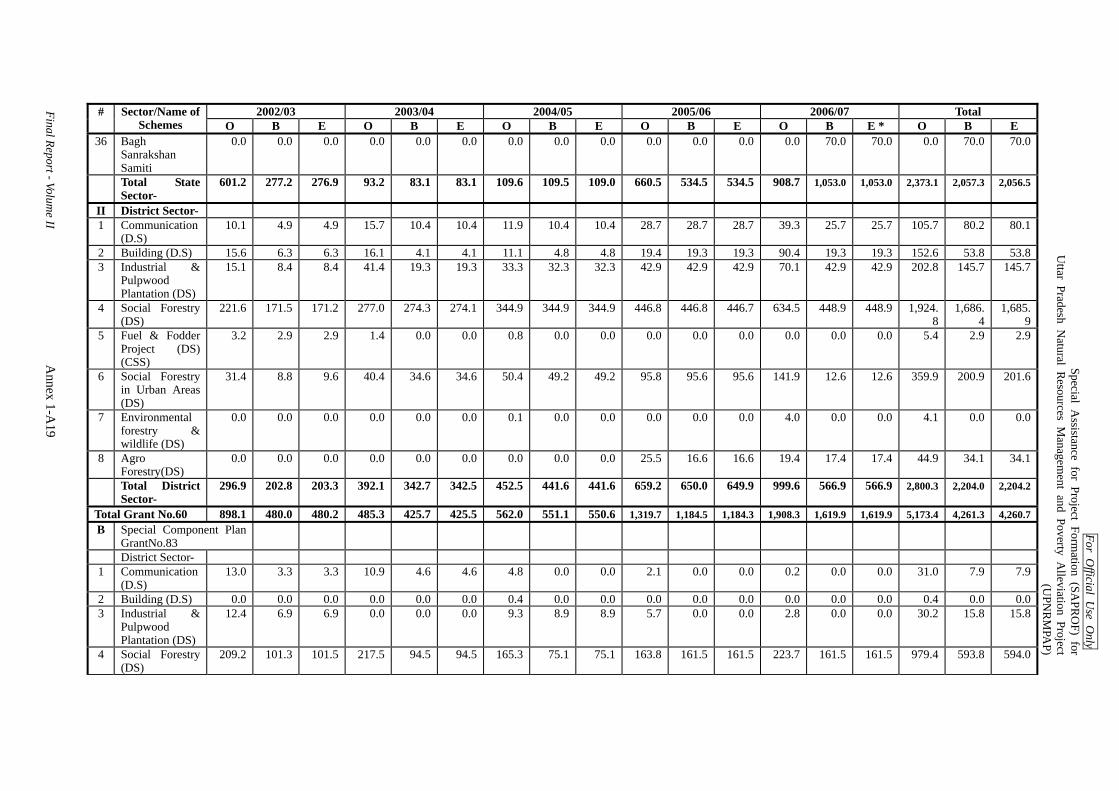
For Official U
se Only
Special Assistance for Project Form
ation (SAPR
OF) for
Uttar Pradesh N
atural Resources M
anagement and Poverty A
lleviation Project(U
PNR
MPA
P)
Final Report - Volume II
Annex
1-A19
# 2002/03 2003/04 2004/05 2005/06 2006/07 Total
Sector/Name of Schemes O B E O B E O B E O B E O B E * O B E
36 Bagh Sanrakshan Samiti
0.0 0.0 0.0 0.0 0.0 0.0 0.0 0.0 0.0 0.0 0.0 0.0 0.0 70.0 70.0 0.0 70.0 70.0
Total State Sector-
601.2 277.2 276.9 93.2 83.1 83.1 109.6 109.5 109.0 660.5 534.5 534.5 908.7 1,053.0 1,053.0 2,373.1 2,057.3 2,056.5
II District Sector- 1 Communication
(D.S) 10.1 4.9 4.9 15.7 10.4 10.4 11.9 10.4 10.4 28.7 28.7 28.7 39.3 25.7 25.7 105.7 80.2 80.1
2 Building (D.S) 15.6 6.3 6.3 16.1 4.1 4.1 11.1 4.8 4.8 19.4 19.3 19.3 90.4 19.3 19.3 152.6 53.8 53.8 3 Industrial &
Pulpwood Plantation (DS)
15.1 8.4 8.4 41.4 19.3 19.3 33.3 32.3 32.3 42.9 42.9 42.9 70.1 42.9 42.9 202.8 145.7 145.7
4 Social Forestry (DS)
221.6 171.5 171.2 277.0 274.3 274.1 344.9 344.9 344.9 446.8 446.8 446.7 634.5 448.9 448.9 1,924.8
1,686.4
1,685.9
5 Fuel & Fodder Project (DS) (CSS)
3.2 2.9 2.9 1.4 0.0 0.0 0.8 0.0 0.0 0.0 0.0 0.0 0.0 0.0 0.0 5.4 2.9 2.9
6 Social Forestry in Urban Areas (DS)
31.4 8.8 9.6 40.4 34.6 34.6 50.4 49.2 49.2 95.8 95.6 95.6 141.9 12.6 12.6 359.9 200.9 201.6
7 Environmental forestry & wildlife (DS)
0.0 0.0 0.0 0.0 0.0 0.0 0.1 0.0 0.0 0.0 0.0 0.0 4.0 0.0 0.0 4.1 0.0 0.0
8 Agro Forestry(DS)
0.0 0.0 0.0 0.0 0.0 0.0 0.0 0.0 0.0 25.5 16.6 16.6 19.4 17.4 17.4 44.9 34.1 34.1
Total District Sector-
296.9 202.8 203.3 392.1 342.7 342.5 452.5 441.6 441.6 659.2 650.0 649.9 999.6 566.9 566.9 2,800.3 2,204.0 2,204.2
Total Grant No.60 898.1 480.0 480.2 485.3 425.7 425.5 562.0 551.1 550.6 1,319.7 1,184.5 1,184.3 1,908.3 1,619.9 1,619.9 5,173.4 4,261.3 4,260.7 B Special Component Plan
GrantNo.83
District Sector- 1 Communication
(D.S) 13.0 3.3 3.3 10.9 4.6 4.6 4.8 0.0 0.0 2.1 0.0 0.0 0.2 0.0 0.0 31.0 7.9 7.9
2 Building (D.S) 0.0 0.0 0.0 0.0 0.0 0.0 0.4 0.0 0.0 0.0 0.0 0.0 0.0 0.0 0.0 0.4 0.0 0.0 3 Industrial &
Pulpwood Plantation (DS)
12.4 6.9 6.9 0.0 0.0 0.0 9.3 8.9 8.9 5.7 0.0 0.0 2.8 0.0 0.0 30.2 15.8 15.8
4 Social Forestry (DS)
209.2 101.3 101.5 217.5 94.5 94.5 165.3 75.1 75.1 163.8 161.5 161.5 223.7 161.5 161.5 979.4 593.8 594.0
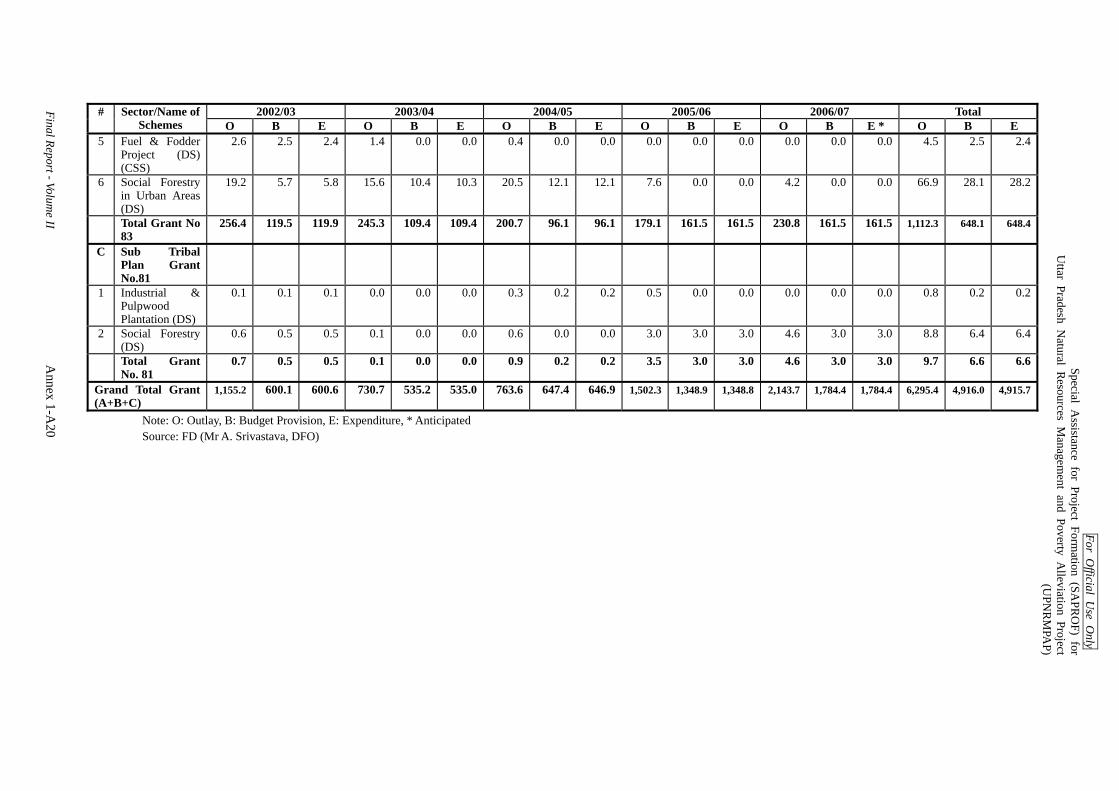
For Official U
se Only
Special Assistance for Project Form
ation (SAPR
OF) for
Uttar Pradesh N
atural Resources M
anagement and Poverty A
lleviation Project(U
PNR
MPA
P)
Final Report - Volume II
Annex
1-A20
# 2002/03 2003/04 2004/05 2005/06 2006/07 Total
Sector/Name of Schemes O B E O B E O B E O B E O B E * O B E
5 Fuel & Fodder Project (DS) (CSS)
2.6 2.5 2.4 1.4 0.0 0.0 0.4 0.0 0.0 0.0 0.0 0.0 0.0 0.0 0.0 4.5 2.5 2.4
6 Social Forestry in Urban Areas (DS)
19.2 5.7 5.8 15.6 10.4 10.3 20.5 12.1 12.1 7.6 0.0 0.0 4.2 0.0 0.0 66.9 28.1 28.2
Total Grant No 83
256.4 119.5 119.9 245.3 109.4 109.4 200.7 96.1 96.1 179.1 161.5 161.5 230.8 161.5 161.5 1,112.3 648.1 648.4
C Sub Tribal Plan Grant No.81
1 Industrial & Pulpwood Plantation (DS)
0.1 0.1 0.1 0.0 0.0 0.0 0.3 0.2 0.2 0.5 0.0 0.0 0.0 0.0 0.0 0.8 0.2 0.2
2 Social Forestry (DS)
0.6 0.5 0.5 0.1 0.0 0.0 0.6 0.0 0.0 3.0 3.0 3.0 4.6 3.0 3.0 8.8 6.4 6.4
Total Grant No. 81
0.7 0.5 0.5 0.1 0.0 0.0 0.9 0.2 0.2 3.5 3.0 3.0 4.6 3.0 3.0 9.7 6.6 6.6
Grand Total Grant (A+B+C)
1,155.2 600.1 600.6 730.7 535.2 535.0 763.6 647.4 646.9 1,502.3 1,348.9 1,348.8 2,143.7 1,784.4 1,784.4 6,295.4 4,916.0 4,915.7
Note: O: Outlay, B: Budget Provision, E: Expenditure, * Anticipated Source: FD (Mr A. Srivastava, DFO)

For Official U
se Only
Special Assistance for Project Form
ation (SAPR
OF) for
Uttar Pradesh N
atural Resources M
anagement and Poverty A
lleviation Project(U
PNR
MPA
P)
Final Report - Volume II
Annex
1-A21
Attachment A1.7-2 Description of Major Plantation Scheme- under 10th Five Year Plan Description of Schemes
Target area No. Name of the Scheme Area (Ha.)
Target Districts Type of land
Source of Budget Objectives Major features
A- Plantations raised under plan schemes
1 Social Forestry 68,839
All districts of U.P
Forest land & other State Plan To provide fuel & fodder and others NTFP to villagers.
Road side, Rail side plantation was priority.
2 Social Forestry in urban area
462
All districts of U.P
Forest land & other State Plan Plantation is raised for environmental improvement.
Ornamental Species were planted in urban areas
3 Industrial and Pulpwood Plantation
6,151
20 districts I Forest land & other State Plan To raise plantation of Industrial value.
Plantation were raised in Terai areas of U.P.
4 Improvement of Degraded Forests
3,176
18 districts II Forest land & other State Plan Improvement of degraded forest to increase productivity of land.
Assisted Natural regeneration plantation.
5 Lucknow greening 86
Lucknow Other land State Plan To increase the green cover through plantations.
Road side, park, ponds and other vacant land has been taken under this scheme.
6 Plantation in urban area of Lucknow District.
22
Lucknow Other land State Plan To increase the green cover plantations.
ditto
7 Plantation in Rural area of Lucknow District.
170
Lucknow Forest land & other State Plan To increase the green cover plantations.
ditto
8 Dense plantation 19,729
22 districts III Forest land & other State Plan To increase forest cover through extensive plantation.
To increase the forest & tree cover of these districts.
9 Plantation along roadside in Etawah-Mainpuri
13
Etawah, Mainpuri
Roadside State Plan
B- Plantations raised under other schemes, through funds received from other sources
1 Taj Afforestation Scheme
30
Agra Forest land & other Central To raise plantation around Taj vicinity.
To protect monument from pollution.
2 E.C. Project 1,852
6 districts IV Forest land & other Central Ravine reclamation greening of land.
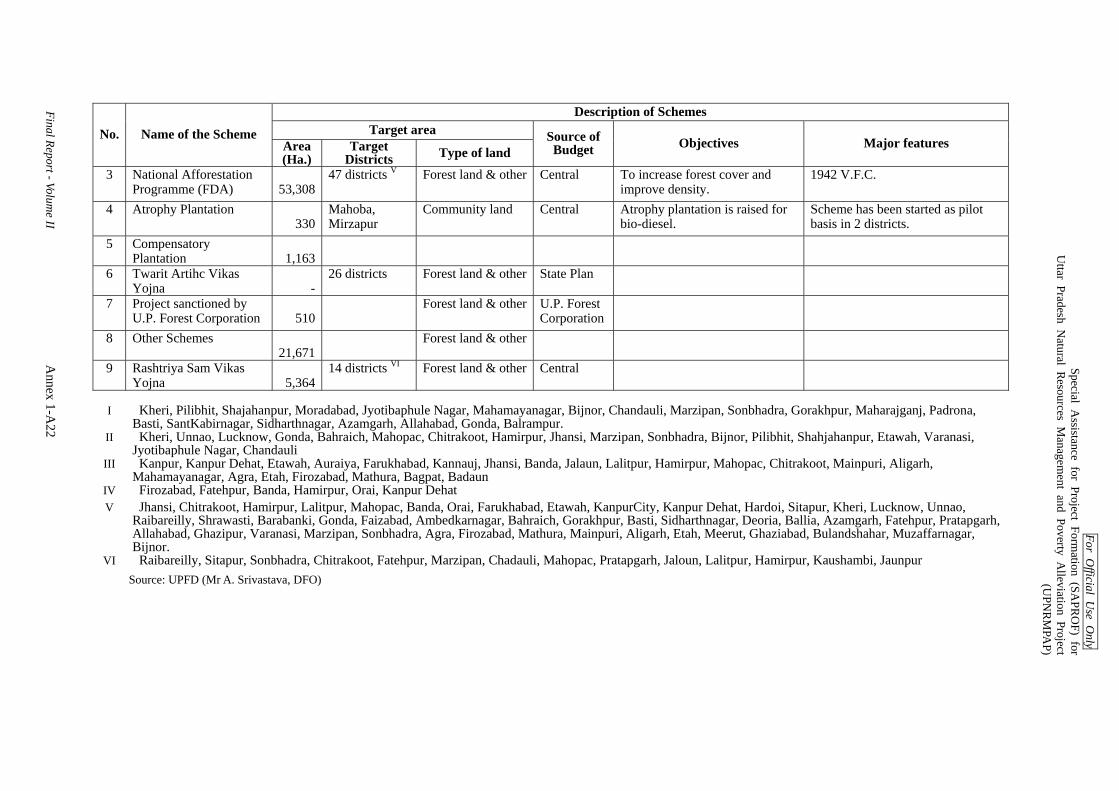
For Official U
se Only
Special Assistance for Project Form
ation (SAPR
OF) for
Uttar Pradesh N
atural Resources M
anagement and Poverty A
lleviation Project(U
PNR
MPA
P)
Final Report - Volume II
Annex
1-A22
Description of Schemes Target area No. Name of the Scheme
Area (Ha.)
Target Districts Type of land
Source of Budget Objectives Major features
3 National Afforestation Programme (FDA)
53,308
47 districts V Forest land & other Central To increase forest cover and improve density.
1942 V.F.C.
4 Atrophy Plantation 330
Mahoba, Mirzapur
Community land Central Atrophy plantation is raised for bio-diesel.
Scheme has been started as pilot basis in 2 districts.
5 Compensatory Plantation
1,163
6 Twarit Artihc Vikas Yojna
-
26 districts Forest land & other State Plan
7 Project sanctioned by U.P. Forest Corporation
510
Forest land & other U.P. Forest Corporation
8 Other Schemes 21,671
Forest land & other
9 Rashtriya Sam Vikas Yojna
5,364
14 districts VI Forest land & other Central
I Kheri, Pilibhit, Shajahanpur, Moradabad, Jyotibaphule Nagar, Mahamayanagar, Bijnor, Chandauli, Marzipan, Sonbhadra, Gorakhpur, Maharajganj, Padrona,
Basti, SantKabirnagar, Sidharthnagar, Azamgarh, Allahabad, Gonda, Balrampur. II Kheri, Unnao, Lucknow, Gonda, Bahraich, Mahopac, Chitrakoot, Hamirpur, Jhansi, Marzipan, Sonbhadra, Bijnor, Pilibhit, Shahjahanpur, Etawah, Varanasi,
Jyotibaphule Nagar, Chandauli III Kanpur, Kanpur Dehat, Etawah, Auraiya, Farukhabad, Kannauj, Jhansi, Banda, Jalaun, Lalitpur, Hamirpur, Mahopac, Chitrakoot, Mainpuri, Aligarh,
Mahamayanagar, Agra, Etah, Firozabad, Mathura, Bagpat, Badaun IV Firozabad, Fatehpur, Banda, Hamirpur, Orai, Kanpur Dehat V Jhansi, Chitrakoot, Hamirpur, Lalitpur, Mahopac, Banda, Orai, Farukhabad, Etawah, KanpurCity, Kanpur Dehat, Hardoi, Sitapur, Kheri, Lucknow, Unnao,
Raibareilly, Shrawasti, Barabanki, Gonda, Faizabad, Ambedkarnagar, Bahraich, Gorakhpur, Basti, Sidharthnagar, Deoria, Ballia, Azamgarh, Fatehpur, Pratapgarh, Allahabad, Ghazipur, Varanasi, Marzipan, Sonbhadra, Agra, Firozabad, Mathura, Mainpuri, Aligarh, Etah, Meerut, Ghaziabad, Bulandshahar, Muzaffarnagar, Bijnor.
VI Raibareilly, Sitapur, Sonbhadra, Chitrakoot, Fatehpur, Marzipan, Chadauli, Mahopac, Pratapgarh, Jaloun, Lalitpur, Hamirpur, Kaushambi, Jaunpur Source: UPFD (Mr A. Srivastava, DFO)

For Official Use Only Special Assistance for Project Formation (SAPROF) for
Uttar Pradesh Natural Resources Management and Poverty Alleviation Project (UPNRMPAP)
Final Report-Volume II Annex 1-A23
Attachment A1.7-3 Scheme-wise Proposed Financial Outlay for 11th Five Year Plan Unit: million Rs.
Year-wise Proposed Outlay No Name of Scheme
Total Outlay
2007/08 2008/09 2009/10 2010/11 2011/12A State Sector I Plantation Scheme 1 Extensive plantation in 22 districts
in U.P. 5,664.1 880.0 880.0 968.0 1,764.8 1,171.3
2 Plantation in Urban Areas of Lucknow
145.4 23.8 26.2 28.8 31.7 34.9
3 Plantation Rural Areas of Lucknow
79.3 13.0 14.3 15.7 17.3 19.0
4 Improvement of Degraded Forests 15.5 2.5 2.8 3.1 3.4 3.7 5 Roadside Plantation in Mainpuri
and Etawah districts 6.0 1.0 1.1 1.2 1.3 1.4
6 Beautification of Karjan bridge, Phaphamau, Allahabad
0.1 0.1 0.0 0.0 0.0 0.0
7 Beautification of Vasudharpah district, Balia
0.1 0.1 0.0 0.0 0.0 0.0
Total: Plantation Schemes 5,910.5 920.5 924.4 1,016.8 1,818.5 1,230.3 II Wild life Conservation Schemes 1 Project Tiger (C.S.S.) 48.5 7.9 8.7 9.6 10.6 11.7 2 Development of National Parks
and Bird Sanctuaries (C.S.S.) 1.6 0.2 0.2 0.3 0.4 0.5
3 Lion Safari in Fisher Forest, Etawah
132.0 15.3 16.7 18.5 38.8 42.7
4 Chaudhari Charan Singh Birds Development Projects
38.7 6.4 7.0 7.7 8.4 9.2
5 Conservation of Saras (Saras Sanrakhshan Samiti)
0.1 0.1 0.0 0.0 0.0 0.0
6 Conservation of Tiger (Bagh Sanrakhshan Samiti)
0.1 0.1 0.0 0.0 0.0 0.0
Total: Wild life Conservation Schemes 221.0 30.0 32.6 36.1 58.2 64.1 III Other Schemes 1 Integrated Forest Protection
Scheme(C.S.S.) 34.9 5.7 6.3 6.9 7.6 8.4
2 Forest Research 100.0 20.0 20.0 20.0 20.0 20.0 Total: Other Schemes 134.9 25.7 26.3 26.9 27.6 28.4
Total: State Sector (i+ii+iii) 6,266.4 976.2 983.3 1,079.8 1,904.3 1,322.8 B District Sector I Plantation Schemes 1 Social Forestry 18,927.1 3,100.9 3,410.1 3,751.1 4,126.2 4,538.8 2 Social Forestry in Urban Areas 730.2 119.6 131.6 144.7 159.2 175.1 3 Industrial Pulp wood 668.8 109.8 120.9 132.9 144.6 160.6
Total: Plantation Schemes 20,326.1 3,330.3 3,662.6 4,028.7 4,430.0 4,874.5 II Other Schemes 1 Building 89.7 15.0 16.5 18.2 20.0 20.0 2 Communication 69.9 12.0 13.2 13.5 14.9 16.3 3 Agro Forestry 111.5 18.3 20.1 22.1 24.3 26.7
Total: Other Schemes 271.1 45.3 49.8 53.8 59.2 63.0
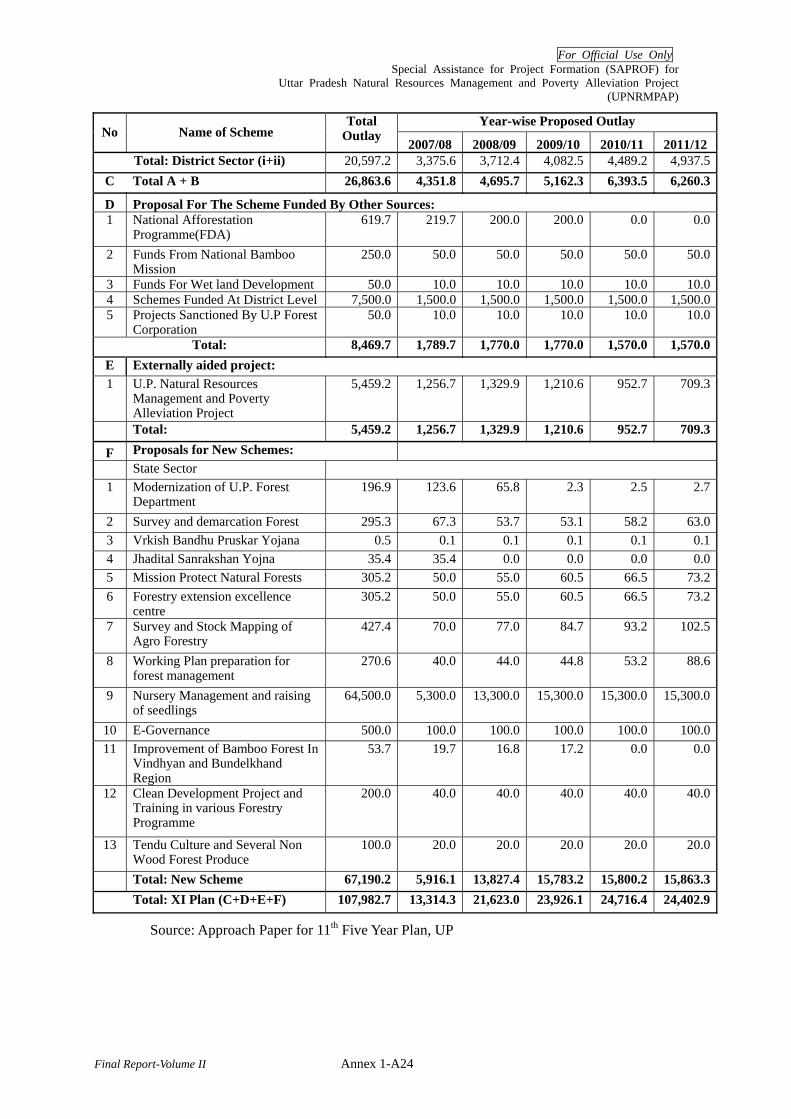
For Official Use Only Special Assistance for Project Formation (SAPROF) for
Uttar Pradesh Natural Resources Management and Poverty Alleviation Project (UPNRMPAP)
Final Report-Volume II Annex 1-A24
Year-wise Proposed Outlay No Name of Scheme
Total Outlay
2007/08 2008/09 2009/10 2010/11 2011/12Total: District Sector (i+ii) 20,597.2 3,375.6 3,712.4 4,082.5 4,489.2 4,937.5
C Total A + B 26,863.6 4,351.8 4,695.7 5,162.3 6,393.5 6,260.3
D Proposal For The Scheme Funded By Other Sources: 1 National Afforestation
Programme(FDA) 619.7 219.7 200.0 200.0 0.0 0.0
2 Funds From National Bamboo Mission
250.0 50.0 50.0 50.0 50.0 50.0
3 Funds For Wet land Development 50.0 10.0 10.0 10.0 10.0 10.0 4 Schemes Funded At District Level 7,500.0 1,500.0 1,500.0 1,500.0 1,500.0 1,500.0 5 Projects Sanctioned By U.P Forest
Corporation 50.0 10.0 10.0 10.0 10.0 10.0
Total: 8,469.7 1,789.7 1,770.0 1,770.0 1,570.0 1,570.0 E Externally aided project: 1 U.P. Natural Resources
Management and Poverty Alleviation Project
5,459.2 1,256.7 1,329.9 1,210.6 952.7 709.3
Total: 5,459.2 1,256.7 1,329.9 1,210.6 952.7 709.3
F Proposals for New Schemes:
State Sector 1 Modernization of U.P. Forest
Department 196.9 123.6 65.8 2.3 2.5 2.7
2 Survey and demarcation Forest 295.3 67.3 53.7 53.1 58.2 63.0 3 Vrkish Bandhu Pruskar Yojana 0.5 0.1 0.1 0.1 0.1 0.1 4 Jhadital Sanrakshan Yojna 35.4 35.4 0.0 0.0 0.0 0.0 5 Mission Protect Natural Forests 305.2 50.0 55.0 60.5 66.5 73.2 6 Forestry extension excellence
centre 305.2 50.0 55.0 60.5 66.5 73.2
7 Survey and Stock Mapping of Agro Forestry
427.4 70.0 77.0 84.7 93.2 102.5
8 Working Plan preparation for forest management
270.6 40.0 44.0 44.8 53.2 88.6
9 Nursery Management and raising of seedlings
64,500.0 5,300.0 13,300.0 15,300.0 15,300.0 15,300.0
10 E-Governance 500.0 100.0 100.0 100.0 100.0 100.0 11 Improvement of Bamboo Forest In
Vindhyan and Bundelkhand Region
53.7 19.7 16.8 17.2 0.0 0.0
12 Clean Development Project and Training in various Forestry Programme
200.0 40.0 40.0 40.0 40.0 40.0
13 Tendu Culture and Several Non Wood Forest Produce
100.0 20.0 20.0 20.0 20.0 20.0
Total: New Scheme 67,190.2 5,916.1 13,827.4 15,783.2 15,800.2 15,863.3 Total: XI Plan (C+D+E+F) 107,982.7 13,314.3 21,623.0 23,926.1 24,716.4 24,402.9
Source: Approach Paper for 11th Five Year Plan, UP
For Official Use Only Special Assistance for Project Formation (SAPROF) for
Uttar Pradesh Natural Resource Management and Poverty Alleviation Project (UPNRMPAP)
Final Report- Volume II
Special Assistance for Project Formation
for Uttar Pradesh Natural Resource Management and Poverty Alleviation Project
(UPNRMPAP)
Final Report
Volume II: ANNEXES
ANNEX-2 FORESTS AND FOREST AREAS
IN UTTAR PRADESH

For Official Use Only Special Assistance for Project Formation (SAPROF) for
Uttar Pradesh Natural Resources Management and Poverty Alleviation Project (UPNRMPAP)
Final Report-Volume II i
Special Assistance for Project Formation (SAPROF)
for
Uttar Pradesh Natural Resource Management and Poverty Alleviation Project (UPNRMPAP)
Final Report
Volume II: Annexes
ANNEX 2 FORESTS AND FOREST AREAS IN UTTAR PRADESH
Table of Contents 1 Forest Laws and Policies............................................................................................ Annex 2 -1
1.1 Legal Regime .................................................................................................. Annex 2 -1 1.2 General Forest Policy...................................................................................... Annex 2 -2 1.3. Laws and Policies Related to Wildlife and Biodiversity ................................. Annex 2 -6 1.4 Major Laws and Policies related to Forest Produces ...................................... Annex 2 -9 1.5 Policies on Scheduled Castes, Scheduled Tribes and Forest Management ....Annex 2 -11
2 Forest Administration................................................................................................. Annex 2 -13 2.1 Institutional Setup ......................................................................................... Annex 2 -13 2.2 Duties and Functions of Key Staff Members of UPFD................................. Annex 2 -15 2.3 Human Resources of UPFD .......................................................................... Annex 2 -19 2.4 Training Mechanism of UPFD Staff ............................................................. Annex 2 -20 2.5 Budget of UPFD............................................................................................ Annex 2 -24 2.6 Financial Procedure of UPFD ....................................................................... Annex 2 -25 2.7 Facilities and Mobility of Uttar Pradesh Forest Department (UPFD)........... Annex 2 -28 2.8 GIS/MIS Expertise of Uttar Pradesh Forest Department .............................. Annex 2 -29 2.9 Monitoring and Evaluation in UPFD ............................................................ Annex 2 -33 2.10 The Uttar Pradesh Forest Corporation (UPFC)............................................. Annex 2 -34
3 Present Conditions of Forest in UP .......................................................................... Annex 2 -36 3.1 Forest Area Classification ............................................................................. Annex 2 -36 3.2 Forest Cover .................................................................................................. Annex 2 -40 3.3 Forest Type.................................................................................................... Annex 2 -43
4 Wildlife and Biodiversity ......................................................................................... Annex 2 -43 4.1. Biodiversity profile of Uttar Pradesh ............................................................ Annex 2 -43 4.2. Protected Areas.............................................................................................. Annex 2 -47 4.3 Past and On-going Projects Related to Biodiversity ..................................... Annex 2 -53
5 Forest Management and Forestry ............................................................................. Annex 2 -54 5.1 Forest Management System .......................................................................... Annex 2 -54 5.2 Soil and Moisture Conservation.................................................................... Annex 2 -67 5.3 Forest Produces and Markets ........................................................................ Annex 2 -72 5.4 Forest Based Industries ................................................................................. Annex 2 -75
6 Livelihoods of Forest Dependents............................................................................ Annex 2 -77 6.1 Forest Dependent Communities in UP.......................................................... Annex 2 -77 6.2 Availability of Common Pool Resources (CPRs) and Access to ForestlandsAnnex 2 -80 6.3 Collections from CPR Lands......................................................................... Annex 2 -81 6.4 Employment in Forestry Activities ............................................................... Annex 2 -83
7 Joint Forest Management ......................................................................................... Annex 2 -83 7.1 JFM Policy and Legal Framework in Uttar Pradesh ..................................... Annex 2 -84 7.2 Institutional Framework for JFM in UP........................................................ Annex 2 -85
For Official Use Only Special Assistance for Project Formation (SAPROF) for
Uttar Pradesh Natural Resources Management and Poverty Alleviation Project (UPNRMPAP)
Final Report-Volume II ii
7.3 Implementation of JFM in UP....................................................................... Annex 2 -90 7.4 Achievement of JFM in UP........................................................................... Annex 2 -90 7.5 Present State of JFM in UP ........................................................................... Annex 2 -92 7.6 FDA in UP..................................................................................................... Annex 2 -93
8 Social Forestry ......................................................................................................... Annex 2 -97 8.1 Origin, Scope and Growth of Social Forestry in UP..................................... Annex 2 -98 8.2 Achievement of Social Forestry in UP.......................................................... Annex 2 -98 8.3 Village Wood Lots....................................................................................... Annex 2 -100 8.4 Learning from the Social Forestry Projects in UP ...................................... Annex 2 -101 8.5 Farm Forestry .............................................................................................. Annex 2 -101
9 Ecodevelopment in Uttar Pradesh .......................................................................... Annex 2 -106 9.1 Introduction ................................................................................................. Annex 2 -106 9.2 Ecodevelopment Committee (EDC)............................................................ Annex 2 -107 9.3 Overview of Past Ecodevelopment Works .................................................. Annex 2 -108 9.4 Activities and Budget .................................................................................. Annex 2 -109
Attachments Attachment A2.2-1 Organisation Chart of UP Forest Department ...................................Annex 2 -A1 Attachment A2.2-2 Division-wide manpower.................................................................Annex 2 -A 2 Attachment A2.2-3 Details of Faculty / Resource Persons..............................................Annex 2 -A 6 Attachment A2.2-4 GIS Expertise and Development in UP outside UPFD ..................Annex 2 -A 10 Attachment A2.2-5 Organisation Chart of UPVN.........................................................Annex 2 -A 12 Attachment A2.2-6 Financial Help Given by UPVN to FD ..........................................Annex 2 -A 13 Attachment A2.2-7 Financial Situation of UPVN .........................................................Annex 2 -A 14 Attachment A2.3-1 Forest Division-wise Notified Forest Area (2007) Studied by SAPROF Team .... .......................................................................................................Annex 2 -A 15 Attachment A2.3-2 District-wise Forest Cover in Uttar Pradesh (2003).......................Annex 2 -A 18 Attachment A2.3-3 Forest Types Occurring in Uttar Pradesh .......................................Annex 2 -A 21 Attachment A2.5-1 Status of Working Plans in Uttar Pradesh 2007 .............................Annex 2 -A 23 Attachment A2.5-2 Indicative Working Circle Name and Group in UP........................Annex 2 -A 25 Attachment A2.5-3 Major Achievements of Research Wing in UPFD..........................Annex 2 -A 26 Attachment A2.5-4 Central and Foreign Funded Major Watershed Development Programmes in India ...............................................................................................Annex 2 -A 31 Attachment A2.5-5 Milestones in the History of Soil and Water Conservation ............Annex 2 -A 32 Attachment A2.5-6 Key Features for SWC in Problematic Lands in UP......................Annex 2 -A 33 Attachment A2.5-7 Important Non-Wood Forest Produces in UP.................................Annex 2 -A 36 Attachment A2.5-8 Tendu Leaf Production (1997 to 2005) ..........................................Annex 2 -A 37 Attachment A2.5-9 Legal Provisions Governing Access to NWFP in UP ....................Annex 2 -A 38 Attachment A2.6-1 Districts in Three Major Agro-climatic Zones in UP .....................Annex 2 -A 39 Attachment A2.6-2 A Case of Forest Dependents – Chitrakoot Forest Division in UP Annex 2 -A 40 Attachment A2.7-1 Definition of Village Forest in India ..............................................Annex 2 -A 42 Attachment A2.7-2 Division-wise number of JFMCs supported under NAP in UP......Annex 2 -A 43 Attachment A2.8-1 Proforma of agreement between Gram Panchayat and UPFD for EstablishingVillage Woodlots over Panchayat Lands ....................Annex 2 -A 44 Attachment A2.8-2 Restrictions of Tree Felling in UP..................................................Annex 2 -A 49 Attachment A2.8-3 Circle-wise and Year-wise Seedlings Distributed/Sold under Extensive Plantation (2002-07) ......................................................................Annex 2 -A 51

For Official Use Only Special Assistance for Project Formation (SAPROF) for
Uttar Pradesh Natural Resources Management and Poverty Alleviation Project (UPNRMPAP)
Final Report-Volume II Annex 2-1
ANNEX 2 FORESTS AND FOREST AREAS IN UTTAR PRADESH
1 Forest Laws and Policies
1.1 Legal Regime
The management of forests in India has come under the concurrent jurisdiction of the central and state governments since the Constitution was enacted in 1977. Earlier than that, forest management was a state subject. Therefore, it is essential to take cognizance of both the National (GOI) and the state levels laws and rules for the governance of the forests.
GOI and the GOUP have complex and multitude laws/acts, rules and directives including their amendments toward sustainable forest management. In addition, keen attention is paid for recognition of importance regarding social aspects of sustainable forest managements, i.e., traditional rights, livelihood issues on indigenous people and other local communities.
(1) National Level
During the British colonial regime and after independence, several forestry legislations were enacted. The recent major forestry related laws under GOI directives are given in
Table A2.1-1.
Table A2.1-1 Forestry related Legal Regime in India Item Major Features Indian Forest Act 1927 (IFA)
- The Act extends over the whole country. - Provides three categories of managed forest-Reserved, Village and Protected Forests.
-Gives power to the States to control and manage non-government forests -Empowers the government to impose duty on forest produce - Provides penalties for violations
Forest Conservation Act 1980 (amendment 1988)
- Restricts and controls the de-reservation or conversion of forests to non forest purposes.
- Prior approval of GOI is required for any diversion of forests for non forest purposes.
- Permission is given based on environmental impact assessment and subject to compensatory plantations.
Supreme Court Order 1996
- The dictionary meaning of “forest” should be used as the definition of the forest.
- Provisions of the Act apply to all forests irrespective of nature of ownership or classification.
- Directed the termination of all on-going activities within any forest that does not have prior approval of GOI.
Supreme Court Order 2001
- Prohibited felling of naturally grown trees except under the GOI approved working plan
Forest Conservation Rules 2003
- In Sec. 3 of the Forest Conservation Act 1980, there is a provision of constituting an advisory committee.
- These rule prescribes 5 members committee at the central and 3 members

For Official Use Only Special Assistance for Project Formation (SAPROF) for
Uttar Pradesh Natural Resources Management and Poverty Alleviation Project (UPNRMPAP)
Final Report-Volume II Annex 2-2
committee at the Regional level. - Terms of appointment of the committee members, conduct of business, duties and proceeding against persons guilty of offences under act are prescribed.
Source: Related acts and rules and resolutions.
(2) The State Level
The Indian Forest Act (IFA) 1927 and its amendments are applied to the State as state acts, rules and resolutions. Moreover, other acts and rules relevant to forestry sector have also been introduced to the State. The current major legal regimes in the State are summarised
in Table A2.1-2.
Table A2.1-2 State Level Forestry related Legal Regime in Uttar Pradesh Item Major Features
UP Private Forest Act 1948 and Rules 1950
- Manage forests as per the working plan - Control of private forests can be taken by the Govt. if the management of the forest is not according to the laid down forest management rules.
- Settlement procedure for such Vested forests is prescribed. Indian Forest UP Rules 1964
-Under Sec.38M of the IFA the State has the power to make rules to take over management of any forest area or land.
- Management of a forest area can be taken over for which the payments will be made by the owner of the area.
-The owner will be given notice for it and his claim will be heard by the dept.
Indian Forest (UP amendment) Act 1965
- It revised Sec.19 (Pleaders). A claimant can be represented by a pleader for forest settlement cases.
- It amended Sec.22 of IFA (Powers to make arrangement made under Sec 15 or 18). It empowered the State to rescind or modify rights etc. even after settlement under Sec 20.
- It revised Sec.61 (saving of power to release property seized).It allowed summary eviction of persons convicted of certain offences.
The UP Protection of Trees Act 1976
- Felling of trees (timber and fruit trees) on private land was permitted only after getting permission to fell trees from the DFO.
- Procedure for obtaining permission is laid down. Amendment of Tree Protection Act. (GO. Dt. 28-01-1982)
- Under Sec. 27 of above Act (1976), 27 species were exempted from the provisions of the act.
UP Village Forest Joint Management Rules 1997
- Different levels of committees to be formed - Duties and responsibilities of various committees given
Indian Forest (UP Amendment) Act 2000
- It made amendments mainly in Sec 26 (Acts Prohibited in Reserved forests) and in Sec.52 (Seizure of Property) of the IFA
The UP Village Forest Joint Management Rules 2002
- A forest allotted to a JFM Committee is regarded as the village forest and will be managed jointly by the JFM Committee.
- Constitution, powers, duties etc of JFM committees are given.
Note: “GO” = Government Order Source: Related acts, rules, orders, and resolutions.
1.2 General Forest Policy
The current forest policies and prevalent directives at the national level as well as state level are listed as follows:

For Official Use Only Special Assistance for Project Formation (SAPROF) for
Uttar Pradesh Natural Resources Management and Poverty Alleviation Project (UPNRMPAP)
Final Report-Volume II Annex 2-3
National Level:
- The National Forest Policy 1988 - The National Forest Action Programme (NFAP) 1999 - Report of National Forestry Commission 2006
State Level:
- The UP State Forest Policy 1998 - The UP State Forest Policy 2007 (Proposed)
(1) The National Forest Policy, 1988
The National Forest Policy (1988) enunciated by GOI is a basic and important policy as it spells out the objectives and the strategies to follow sustainable management of the forests of the country from the viewpoints of environment, economic, and social aspects. The policy encourages giving initiatives to communities for effective forest management
including afforestation through JFM. Its framework is described in Table A2.1-3.
Table A2.1-3 Framework of Forest Policy 1988 Basic Objectives Strategy
- Environmental stability - Check erosion - Meet local demand of forest produce. - Improve utilization - Conserve natural heritage - Increase sustainability - Increase productivity - Create peoples’ movement
Essential of Forest Management - Protect existing forests. - Discourage diversion of good agricultural land to forestry.
- Manage Protected Areas (PAs) - Afforest to meet local needs
- The national goal is to have 1/3 area under forests
- Afforestation, social forestry and farm forestry- Work under working plans - No clear felling of natural forest. - Exotics species will be introduced only after research.
- Rights and concessions within carrying capacity
- Avoid diversion of forest land - Wildlife conservation - Associate tribes with forests - Protect forests - Forest industry should raise raw material
Source : Based on National Forest Policy 1988
The salient features of the National Forest Policy 1988 are enumerated below:
- Maintenance of environmental stability through preservation and, where necessary, restoration of the ecological balance that has been adversely disturbed by serious depletion of forests of the country.
- Conserving the natural heritage of the country by preserving the remaining natural forests with the vast variety of flora and fauna, which represent the remarkable biological diversity and genetic resources of the country.
- Checking soil erosion and denudation in catchments areas of rivers, lakes, and
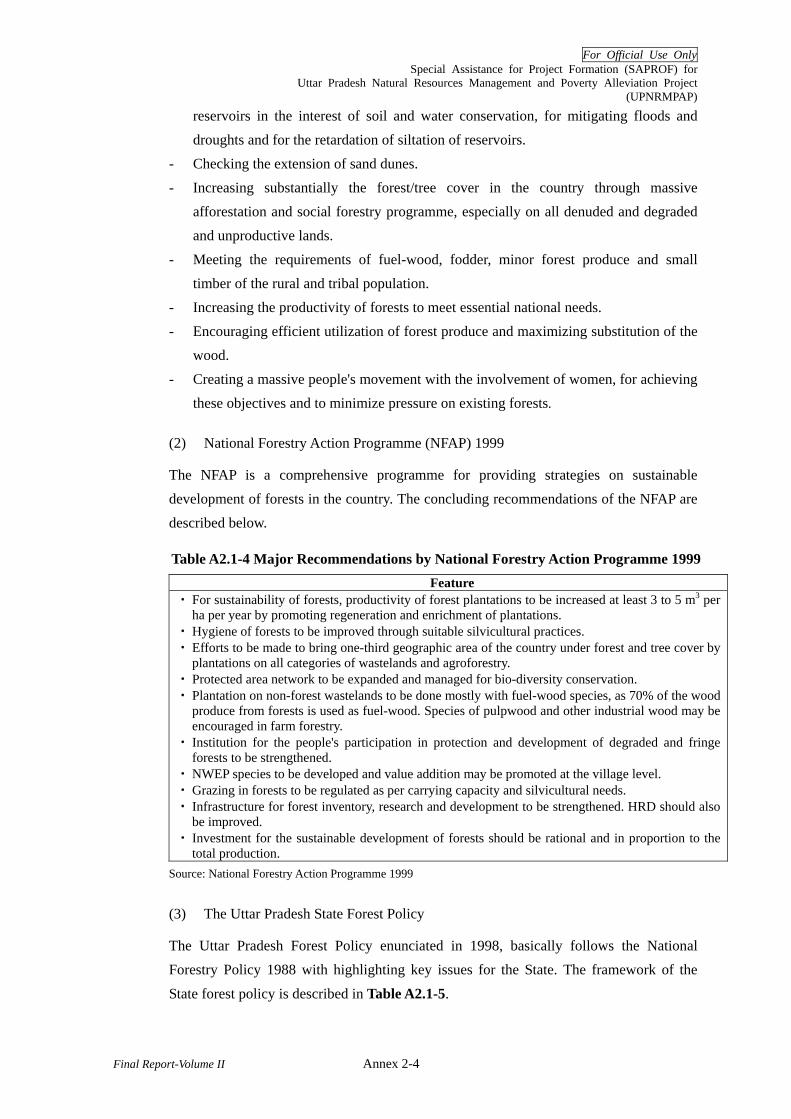
For Official Use Only Special Assistance for Project Formation (SAPROF) for
Uttar Pradesh Natural Resources Management and Poverty Alleviation Project (UPNRMPAP)
Final Report-Volume II Annex 2-4
reservoirs in the interest of soil and water conservation, for mitigating floods and droughts and for the retardation of siltation of reservoirs.
- Checking the extension of sand dunes. - Increasing substantially the forest/tree cover in the country through massive
afforestation and social forestry programme, especially on all denuded and degraded and unproductive lands.
- Meeting the requirements of fuel-wood, fodder, minor forest produce and small timber of the rural and tribal population.
- Increasing the productivity of forests to meet essential national needs. - Encouraging efficient utilization of forest produce and maximizing substitution of the
wood. - Creating a massive people's movement with the involvement of women, for achieving
these objectives and to minimize pressure on existing forests.
(2) National Forestry Action Programme (NFAP) 1999
The NFAP is a comprehensive programme for providing strategies on sustainable development of forests in the country. The concluding recommendations of the NFAP are described below.
Table A2.1-4 Major Recommendations by National Forestry Action Programme 1999 Feature
・ For sustainability of forests, productivity of forest plantations to be increased at least 3 to 5 m3 per ha per year by promoting regeneration and enrichment of plantations.
・ Hygiene of forests to be improved through suitable silvicultural practices. ・ Efforts to be made to bring one-third geographic area of the country under forest and tree cover by
plantations on all categories of wastelands and agroforestry. ・ Protected area network to be expanded and managed for bio-diversity conservation. ・ Plantation on non-forest wastelands to be done mostly with fuel-wood species, as 70% of the wood
produce from forests is used as fuel-wood. Species of pulpwood and other industrial wood may be encouraged in farm forestry.
・ Institution for the people's participation in protection and development of degraded and fringe forests to be strengthened.
・ NWEP species to be developed and value addition may be promoted at the village level. ・ Grazing in forests to be regulated as per carrying capacity and silvicultural needs. ・ Infrastructure for forest inventory, research and development to be strengthened. HRD should also
be improved. ・ Investment for the sustainable development of forests should be rational and in proportion to the
total production. Source: National Forestry Action Programme 1999
(3) The Uttar Pradesh State Forest Policy
The Uttar Pradesh Forest Policy enunciated in 1998, basically follows the National Forestry Policy 1988 with highlighting key issues for the State. The framework of the
State forest policy is described in Table A2.1-5.
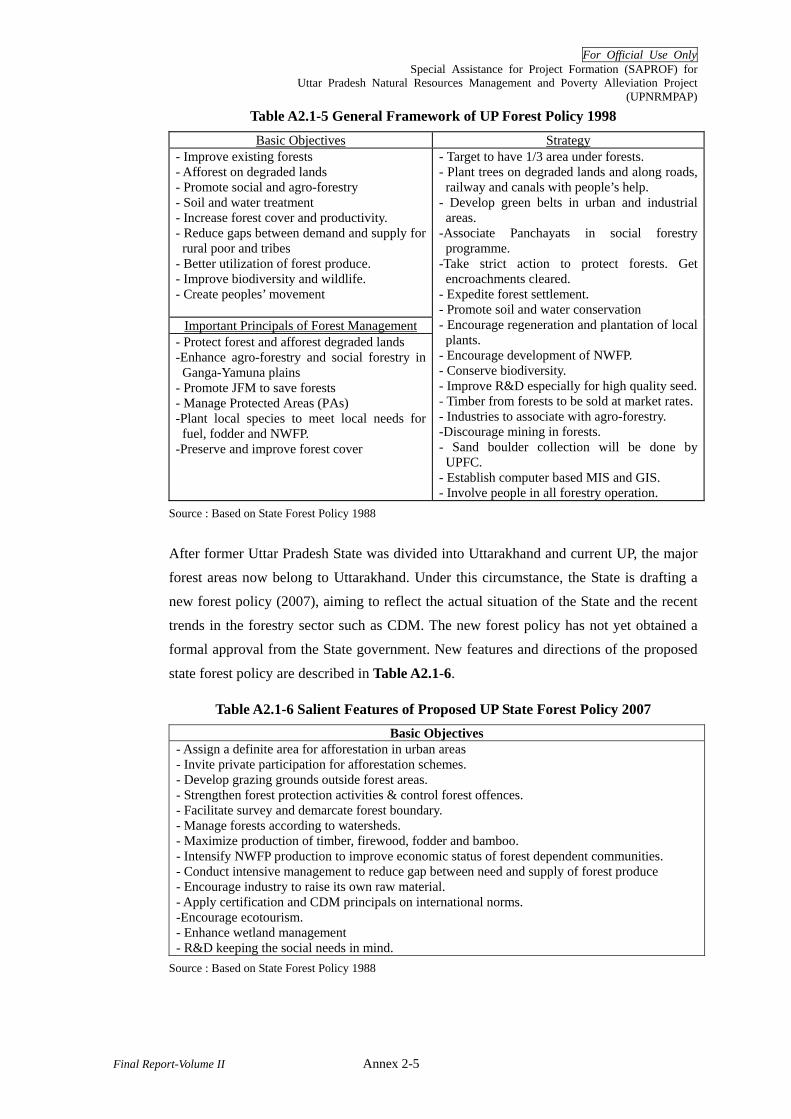
For Official Use Only Special Assistance for Project Formation (SAPROF) for
Uttar Pradesh Natural Resources Management and Poverty Alleviation Project (UPNRMPAP)
Final Report-Volume II Annex 2-5
Table A2.1-5 General Framework of UP Forest Policy 1998 Basic Objectives Strategy
- Improve existing forests - Afforest on degraded lands - Promote social and agro-forestry - Soil and water treatment - Increase forest cover and productivity. - Reduce gaps between demand and supply for rural poor and tribes
- Better utilization of forest produce. - Improve biodiversity and wildlife. - Create peoples’ movement
Important Principals of Forest Management - Protect forest and afforest degraded lands -Enhance agro-forestry and social forestry in Ganga-Yamuna plains
- Promote JFM to save forests - Manage Protected Areas (PAs) -Plant local species to meet local needs forfuel, fodder and NWFP.
-Preserve and improve forest cover
- Target to have 1/3 area under forests. - Plant trees on degraded lands and along roads, railway and canals with people’s help.
- Develop green belts in urban and industrial areas.
-Associate Panchayats in social forestryprogramme.
-Take strict action to protect forests. Get encroachments cleared.
- Expedite forest settlement. - Promote soil and water conservation - Encourage regeneration and plantation of local plants.
- Encourage development of NWFP. - Conserve biodiversity. - Improve R&D especially for high quality seed.- Timber from forests to be sold at market rates.- Industries to associate with agro-forestry. -Discourage mining in forests. - Sand boulder collection will be done by UPFC.
- Establish computer based MIS and GIS. - Involve people in all forestry operation.
Source : Based on State Forest Policy 1988
After former Uttar Pradesh State was divided into Uttarakhand and current UP, the major forest areas now belong to Uttarakhand. Under this circumstance, the State is drafting a new forest policy (2007), aiming to reflect the actual situation of the State and the recent trends in the forestry sector such as CDM. The new forest policy has not yet obtained a formal approval from the State government. New features and directions of the proposed
state forest policy are described in Table A2.1-6.
Table A2.1-6 Salient Features of Proposed UP State Forest Policy 2007 Basic Objectives
- Assign a definite area for afforestation in urban areas - Invite private participation for afforestation schemes. - Develop grazing grounds outside forest areas. - Strengthen forest protection activities & control forest offences. - Facilitate survey and demarcate forest boundary. - Manage forests according to watersheds. - Maximize production of timber, firewood, fodder and bamboo. - Intensify NWFP production to improve economic status of forest dependent communities. - Conduct intensive management to reduce gap between need and supply of forest produce - Encourage industry to raise its own raw material. - Apply certification and CDM principals on international norms. -Encourage ecotourism. - Enhance wetland management - R&D keeping the social needs in mind.
Source : Based on State Forest Policy 1988
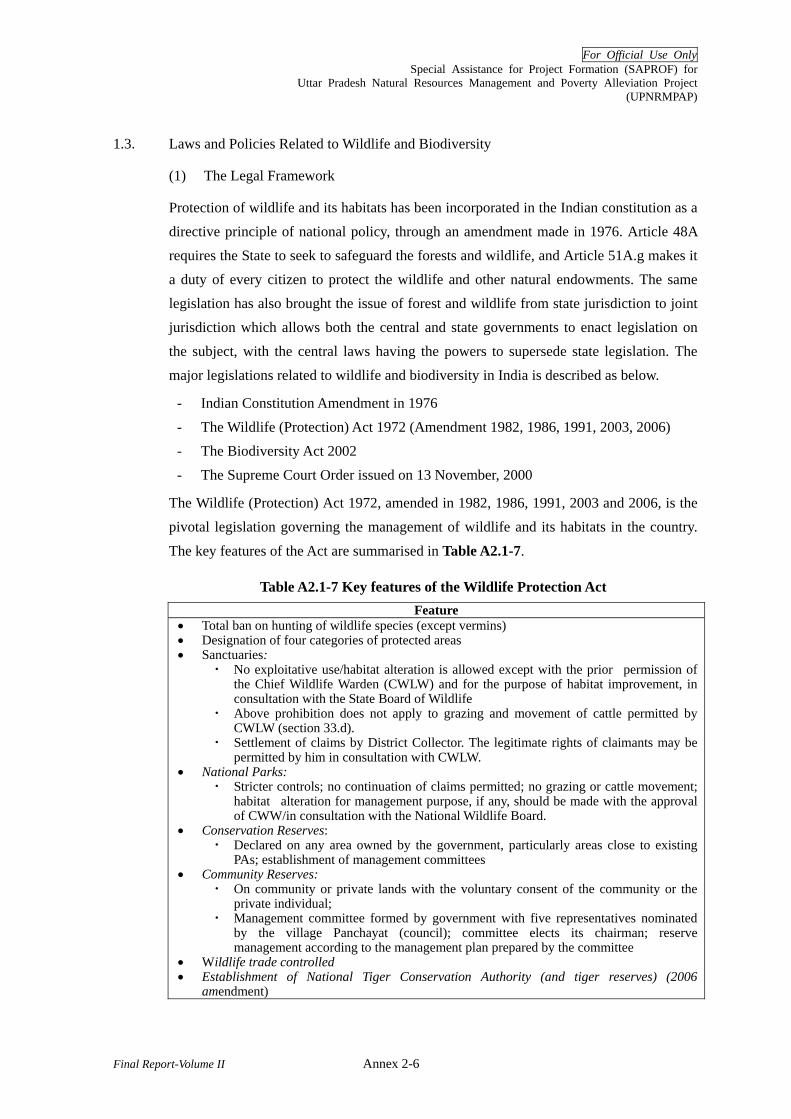
For Official Use Only Special Assistance for Project Formation (SAPROF) for
Uttar Pradesh Natural Resources Management and Poverty Alleviation Project (UPNRMPAP)
Final Report-Volume II Annex 2-6
1.3. Laws and Policies Related to Wildlife and Biodiversity
(1) The Legal Framework
Protection of wildlife and its habitats has been incorporated in the Indian constitution as a directive principle of national policy, through an amendment made in 1976. Article 48A requires the State to seek to safeguard the forests and wildlife, and Article 51A.g makes it a duty of every citizen to protect the wildlife and other natural endowments. The same legislation has also brought the issue of forest and wildlife from state jurisdiction to joint jurisdiction which allows both the central and state governments to enact legislation on the subject, with the central laws having the powers to supersede state legislation. The major legislations related to wildlife and biodiversity in India is described as below.
- Indian Constitution Amendment in 1976 - The Wildlife (Protection) Act 1972 (Amendment 1982, 1986, 1991, 2003, 2006) - The Biodiversity Act 2002 - The Supreme Court Order issued on 13 November, 2000
The Wildlife (Protection) Act 1972, amended in 1982, 1986, 1991, 2003 and 2006, is the pivotal legislation governing the management of wildlife and its habitats in the country.
The key features of the Act are summarised in Table A2.1-7.
Table A2.1-7 Key features of the Wildlife Protection Act Feature
• Total ban on hunting of wildlife species (except vermins) • Designation of four categories of protected areas • Sanctuaries:
・ No exploitative use/habitat alteration is allowed except with the prior permission of the Chief Wildlife Warden (CWLW) and for the purpose of habitat improvement, in consultation with the State Board of Wildlife
・ Above prohibition does not apply to grazing and movement of cattle permitted by CWLW (section 33.d).
・ Settlement of claims by District Collector. The legitimate rights of claimants may be permitted by him in consultation with CWLW.
• National Parks: ・ Stricter controls; no continuation of claims permitted; no grazing or cattle movement;
habitat alteration for management purpose, if any, should be made with the approval of CWW/in consultation with the National Wildlife Board.
• Conservation Reserves: ・ Declared on any area owned by the government, particularly areas close to existing
PAs; establishment of management committees • Community Reserves:
・ On community or private lands with the voluntary consent of the community or the private individual;
・ Management committee formed by government with five representatives nominated by the village Panchayat (council); committee elects its chairman; reserve management according to the management plan prepared by the committee
• Wildlife trade controlled • Establishment of National Tiger Conservation Authority (and tiger reserves) (2006
amendment)

For Official Use Only Special Assistance for Project Formation (SAPROF) for
Uttar Pradesh Natural Resources Management and Poverty Alleviation Project (UPNRMPAP)
Final Report-Volume II Annex 2-7
The first two categories of PAs are highly conservation oriented. However, the Resolution and Guidelines issued by state governments for implementing the eco-development programme enables addressing livelihood concerns of the forest dependent local communities in and around Sanctuaries and National Parks. The latter two categories (Conservation and Community Reserves), introduced by an amendment in 2003, allow varying degrees of community participation but no PA has been established in these two categories so far, though some states are in the process of doing so. A Community Reserve is managed by a committee of local representatives appointed by the government and is run according to a management plan prepared by the Committee, this provides ample scope for developing community lead conservation and sustainable resource use areas.
The Biological Diversity Act 2002, promulgated in 2003 has the objectives of conservation, sustainable use of biodiversity and the equitable sharing of benefits derived out of its use. This law was enacted for the national implementation of the Convention on Biological Diversity (CBD), which was ratified by India in 1993. The key features of this Act are summarised below.
Key features of the Biological Diversity Act 2002 • Regulates access to biodiversity and traditional knowledge and provision for benefit sharing.• Establishes National Biodiversity Authority and State Biodiversity Boards. Biodiversity
Management Committees and Local Biodiversity Funds at the village level • Establishment of Biodiversity Heritage Sites.
A Supreme Court Order issued on 13.11.2000 has an important legal bearing on the management of PAs. The interim order issued in a protracted case related to forest conservation has stipulated that no forest or protected area shall be de-reserved without the prior approval of the Supreme Court and that no non-forest activities shall be undertaken in protected areas without the approval of an Empowered Committee created by the Supreme Court for this purpose.
UP implements all the central laws related to wildlife and biodiversity. The UP Wildlife Protection Rules for the implementation of the Wildlife (Protection) Act 1972 was issued in 1974. The State has started the implementation of the Biological Diversity Act 2002, with the formation of the State Biodiversity Board in 2006.
(2) The Policy Matrix
Wildlife and biodiversity management in the country and in UP is guided by a set of policy and strategy instruments, in addition to the related laws that are in place. The National Environmental Policy 2006 proclaimed by the cabinet emphasizes the need for increasing the coverage of PAs by designating new community and conservation reserves

For Official Use Only Special Assistance for Project Formation (SAPROF) for
Uttar Pradesh Natural Resources Management and Poverty Alleviation Project (UPNRMPAP)
Final Report-Volume II Annex 2-8
and also by expanding community involvement in the PA enterprise, especially through the means of eco-development. It also calls for the protection of wildlife outside protected areas. The Policy stresses the need for protecting biodiversity hotspots and creating mechanisms for equitable benefit sharing.
India has formulated a National Biodiversity Strategy and Action Plan (NBSAP) in 2002 through a widely participatory process and building on the National Biodiversity Action Plan of 1994.The NBSAP, still awaiting official approval, is based on the concept of integrating the objectives of biodiversity conservation, sustainable use and the equitable sharing of benefits resulting from the use of biodiversity. A State Biodiversity Strategy and Action Plan for UP was formulated as part of this national exercise; a strategy and action plan for the Gangetic plains of UP and Bihar was also prepared. The National Wildlife Action Plan (NWAP) of 1984 deals with the strengthening of the national PA network and the development of participatory management system for protected areas and this is being pursued in UP as well.
The UP State Forest Forestry Action Programme adopted in 1996 calls for the capacity strengthening of the Wildlife Wing, expanding the research programme, enhancing protected area management and the identification and protection of biodiversity hotspots, among others. Another key strategy document has been a Strategy and Action Plan for Biodiversity Conservation in UP (2002) formulated, with the help of a consulting group, as an activity under the UP Forestry Project. This document addresses issues related to the strengthening of protected area management, conservation of biodiversity outside protected areas, pursuing a landscape approach to conservation, transboundary wildlife issues with Nepal, sustainable NTFP policy, etc. The State has also formalized the community-based implementation of eco-development programme in and around protected areas, through a government Resolution and a set of Guidelines.
This comprehensive set of laws and policy instruments provide a sound legal and policy basis for sustainable management of wildlife and biodiversity in the country and in UP. And there is a perceptible progression in the conservation doctrine towards involving the local communities in the management of biodiversity. The UP NRMPAP is thus placed in a sound legal and policy framework for its implementation with respect to wildlife and biodiversity.

For Official Use Only Special Assistance for Project Formation (SAPROF) for
Uttar Pradesh Natural Resources Management and Poverty Alleviation Project (UPNRMPAP)
Final Report-Volume II Annex 2-9
1.4 Major Laws and Policies related to Forest Produces
(1) National Level
The following table highlights major laws and policy directives at national level with regard to forest produces.
Table A2.1-8 Major Laws and Policies Related to Forest Produces Item Feature Forest Policy, 1988
- Emphasised meeting the requirements of rural and tribal populations of fuelwood, fodder, minor forest produce and small timber
- Emphasised efficient utilisation of forest produce and maximising substitution of wood
- Prescribed to cease supply of forest produce to industry at concessional prices and encouraged industry to use alternative raw materials or growing own raw material as far as possible.
- Employing local people in the industry and growing raw material by them. - Restraining no forest based industry, except village or cottage level, from
exploiting in order to assure the availability of forest in the future. Panchayats (Extension to the Scheduled Area) Act (PESA), 1996 (Amendment 1997)
- Extending the condition of the Panchayat Act to the Scheduled Areas, and giving ownership rights on several resources.
- Describing the necessity of cooperating among the State legislation on the Panchayats, the customary law, social and religious practices, and traditional management practice of community resource
- Panchayat (Grama Sabha: all electorates of Gram Panchayat) is entitled to ownership right and work on exploit the non timber forest products (minor forest products).
National Forest Commission, 2006
- Out of the three distinct medium term forestry sector goals set up by the commission, two are relevant to forest produce development
- To meet the subsistence requirement of the forest-fringe communities for fuelwood, fodder, small timber and non-wood forest products through a system that ensures prevention of further degradation of the well stocked areas and regeneration of the degraded areas (Objective1)
- To meet the market requirements, including the needs of forest-based industries, through increased productivity of the existing forests and expansion of forest and tree cover by encouraging investments by all stakeholders, especially on private land holdings (Objective 3)
- Provides 460 recommendations regarding forest produce including forest based industry, and major features out of 460 recommendations are addressed as below: → Assisting regeneration and afforestation through JFM to improve degraded
forests (crown density 10-40%). → Requesting for a strategy to meet the needs of industries regarding the
construction timber, panel, pulp, paper, etc. through fast growing high yield plantation of softwood.
→ Requesting for an approach to meet the subsistence requirement of the forest-fringe communities with respect to forest products through a system to promote regeneration of degraded areas as well as prevention of further degradation.
→ Requesting a new strategy for socio- and agro-forestry to invoice industry in distribution of high quality seedling with buy back guarantee to the farmer.
(2) State Level
Major state level rules and orders regarding forest produce and its transit is tabulated in
Table A2.1-9. Uttar Pradesh Forest Corporation (UPFC) is the only enterprise which has a right to control extraction and marketing of all forest produce.

For Official Use Only Special Assistance for Project Formation (SAPROF) for
Uttar Pradesh Natural Resources Management and Poverty Alleviation Project (UPNRMPAP)
Final Report-Volume II Annex 2-10
Table A2.1-9 Major Rules Concerning Forest Produce and Its Transit Item Major Features
Rules regarding Drift and Stranded Wood 1963
- No person without permission of a forest officer can salvage any drift or stranded wood.
- Procedure for obtaining permission is laid down. Forest Produce Control Order 1971
- Nobody can hold timber stock more than required for his personal use.
- Any quantity more than the specified limit will have to be sold at a price fixed by the competent authorities.
The UP Forest Corporation Act 1974
- UPFC was created to better preserve and develop forests and for exploitation of forests produce.
The UP Protection of Trees in Rural and Hill Areas Act 1976
- It restricted felling of trees except under permission from the DFO concerned.
- The person will have to plant two trees for felling one tree. - The penalty for violation of this act can be imprisonment up to 6 months or a fine up to Rs.1000/-, or both.
UP Transit of Timber and Other Forest Produce Rules 1978
- Free movement of forest produce in the State is restricted without transit permit from the competent authority.
-Procedure, terms & conditions for transit permit are determined. UP Saw Mills Establishment and Running Rules 1978
- Within the limits of any reserved or protected forests or within a radius 80 km .of such limits no saw mill can be established or operated without prior approval of the local DFO.
- Procedure and system under which the license can be granted is determined.
Collection of certain NTFP free by forest dwellers and tribes: G.O. No 6922/14-2 Dt. 31-03-1999
- Amla (fruit of Emblica), Gum, Honey and Wax can be collected free of cost.
Extraction of Boulders, Bajri, Sand and Other Minor Minerals from Rivers Passing through Forest Areas G.O.No.4557/77 Dt. 22-07-1999
-Determines UPFC to conduct sand, boulder extraction from the forest area
Collection of Fallen Firewood and NTFP-Mahua and Chironji G.O. No. 1236/16-45 Dt.29-12-2000
- Free collection by forest dwellers and tribes are permitted under this GO.
UP Govt. Order No.2758/14 Dt.30-12-2000 regarding Amendment of Tree Felling rules
- It gives a list of 16 tree species baring which the rest can be felled in listed therein 46 districts.
- It gives another list of 28 species baring which the rest can be felled in listed 24 districts.
UP Timber and other Forest Produce Transit (First Amendments) Rules 2004
- It revised the fee rates of timber transit.
UP Saw Mills Establishment and Running (Third Amendment) Rules (2004)
- It increased the fee to Rs.5000/- for renewing the license and Rs.10000/- for re-establishment.
Source: UP Forest Manual (2000), UPFD, etc.
(4) Privileges and Rights over Forest Produce
At the time of forest settlement (Reservation process under Sec. 5 to Sec. 19 of IFA 1927), local residents were admitted the rights to exercise in their adjacent forest areas such as: i) grazing of certain number of animals; ii) collecting firewood and NWFP; and iii)

For Official Use Only Special Assistance for Project Formation (SAPROF) for
Uttar Pradesh Natural Resources Management and Poverty Alleviation Project (UPNRMPAP)
Final Report-Volume II Annex 2-11
supplying fixed number of trees above a standard diameter of certain species. The forest settlement records the quantity of free grants of each right-holding village from a specific forest area. These admissions / grant of rights are notified as and when a forest area is notified under Sec. 20 of IFA at the time of final declaration of reservation of the particular forest area. Beside rights, local residents get wood at concessional rate for special local bonafide uses.
1.5 Policies on Scheduled Castes, Scheduled Tribes and Forest Management
(1) Tribes Notified as Scheduled Castes in UP
A number of tribal groups which have been notified as Scheduled Tribes (ST) in other states have been notified as Scheduled Caste (SC) in UP State and are included in the category of Dalits (depressed classes). These groups are: Agariya, Baiga, Banmanus, Bansphor, Basor, Bhuiya, Dhanuk, Dharkar, Ghasiya, Gond, Kharwar (excluding Benbansi), Kol, Kori, Korwa, Musahar, Parahiya and Saharya.
Under this peculiar context of UP, the Scheduled Tribes and Other Traditional Forest Dwellers (Recognition of Forest Rights) Act, 2006, passed by the Parliament of India in December 2006, has particular implications on the SC and STs in UP.
(2) The Scheduled Tribes and Other Traditional Forest Dwellers (Recognition of Forest Rights) Act, 2006
The rights of forest dwelling communities who inhabit forest areas for generations and are in occupation of forestland, have not been adequately recognized, resulting in historical injustice to these communities. Almost two years after it was first conceived, The Scheduled Tribes and Other Traditional Forest Dwellers (Recognition of Forest Rights) Act was passed in the Parliament of India on December 18, and it received the assent of the President of India on December 29, 2006.
The main and most relevant features and provisions under this Act are summarised below:
- Recognition of the rights of STs and other forest dwelling (non-ST) communities in respect of occupation of forestland for cultivation and/or habitation (secure individual or community tenure or both);
- Right of ownership, access to collect, use, and dispose of minor forest produce; - Community rights of uses or entitlements such as fish and other products of water
bodies, grazing and traditional seasonal resource access; - Rights including community tenures of habitat and habitation for primitive tribal
groups (PTGs) and pre-agricultural communities;
For Official Use Only Special Assistance for Project Formation (SAPROF) for
Uttar Pradesh Natural Resources Management and Poverty Alleviation Project (UPNRMPAP)
Final Report-Volume II Annex 2-12
- Rights for conversion of localized land ownership (patta), leases or grants issued on forestlands to title by any local authority or any state government;
- Right to protect, regenerate, conserve or manage any community forest resource which they have been traditionally protecting and conserving for sustainable use;
- Right to in situ rehabilitation including alternative land in cases where the STs and other traditional forest dwellers have been illegally evicted or displaced from forest land of any description without receiving their legal entitlement to rehabilitation prior to the 13th day of December, 2005.
The Gram Sabha shall have the authority to initiate the process for determining the nature and extent of individual or community forest rights or both that may be given to the forest dwelling ST and other traditional forest dwellers within the local limits of its jurisdiction under this Act. There shall be a Sub-Divisional Level Committee to examine the resolution passed by the Gram Sabha and prepare the record of forest rights and forward it through the Sub-Divisional Officer to the District Level Committee for a final decision. The process for appeal against decisions at different levels has also been specified in the Act, as also the offences and penalties.
The Ministry of Tribal Affairs (GoI) has constituted a Technical Support Group for framing Rules under the Act, consisting of 11 non-official and 10 official members (on February 12, 2007).
(3) Implications of the Scheduled Tribes and Other Traditional Forest Dwellers (Recognition of Forest Rights) Act in UP
In the light of the Act, the tribal groups in UP which are classified as SCs ought to be classified as “other traditional forest dweller”, which are defined as ‘any member or community who has for at least three generations1 prior to the 13th day of December, 2005 primarily resided in and who depend on the forest or forestland for bonafide livelihood needs.’
When the community of family failed to prove it, their rights over the forests would be denied despite of the Act because they are not recognized as STs but as SCs or “other traditional forest dwellers” in UP.
(4) Beginning of Land Settlement Issues in Forestlands
One of the pressing problems faced by UPFD is ‘encroachment’ or illegal occupation of forestlands for non-forestry purposes, generally for cultivation due to the high population pressure on the forestlands.
1 For the purpose of this clause, ‘generation’ means a period of 25 years)

For Official Use Only Special Assistance for Project Formation (SAPROF) for
Uttar Pradesh Natural Resources Management and Poverty Alleviation Project (UPNRMPAP)
Final Report-Volume II Annex 2-13
The introduction of the concept of private property began with the permanent settlement of British in 1793 and the establishment of the "Zamindari system" that conferred control over vast territories to designated feudal lords for the purpose of revenue collection by the British. This commenced the restructuring of the relationship of tribes to their territories as well as the power relationship between tribes and others, drastically. Lands under the possession of tribes got recorded as government lands and were often transferred to the Forest Department. In other words, the lands where tribes resides and they utilize its forest resources came under the scope applicable to the Indian Forest Act of 1927, the Forest Policy of 1952, the Wildlife Protection Act of 1972 and Forest Conservation Act of 1980 through which the occupation and forest resource utilizations are restricted.
Thus the tribes have been defined as encroachers even on lands which were cultivated by their ancestors. In such cases, no compensation was given to the farmers because their land rights were not properly recorded.
(5) Regularisation Effort
In May 2002, the Supreme Court directed all state governments to immediately evict ‘encroachers’ from all forests. The massive eviction drive targeted forest dependent communities. It was estimated in 2002 that 25,200 ha of forest lands in UP are under ‘encroachment’2. Some of the “encroachers” have been regularised if they could prove their settlement before 1980 (before the enactment of Forest Conservation Act of 1980).
The dispute over ownership of ‘forestlands’ is not only between the people and the forest department, but also between the forest and the revenue departments; in 1998, the State revenue departments reported that a total of 68.86 million ha of land in the country is officially classified as ‘forest’, but in 1999 the State forest departments reported that a total of 76.52 million ha is officially classified as ‘forest’ – a difference of 7.66 million ha. This dispute over ownership between departments implies the inaccuracy of land delineation and land records. It can be presumed that a number of policies have been created and enforced based on unreliable records and maps in India and UP.
2 Forest Administration
2.1 Institutional Setup
The objectives of Uttar Pradesh Forest Department (UPFD) are;
• Protection, conservation and development of forests and wildlife within the political and administrative jurisdiction of the State;

For Official Use Only Special Assistance for Project Formation (SAPROF) for
Uttar Pradesh Natural Resources Management and Poverty Alleviation Project (UPNRMPAP)
Final Report-Volume II Annex 2-14
• Adoption of soil and moisture conservation for the sustenance of the forest resources in the State;
• Sustainable utilization of forest resources so as to obtain optimal yield consistent with the permanent maintenance and supply of the needs of the people of the State;
• Achievement of the goals of National Forest Policy 1988 to cover the maximum area with forests;
• Research for facilitating regeneration and development of forests in the State; • Awareness raising among the people about forests and environment; • Enhancement of the participation of people in conservation of forests.
The administrative set-up and number of offices of the Forest Department are shown in
Figure A2.2-1 and Table A2.2-1.
Figure A2.2-1 Administrative Set-up of Forest Department
Table A2.2-1 Number of Office of UPFD Forestry Wildlife Offices
Territorial Functional Territorial Functional Total
Zone 6 5 - 1 12Circle 17 10 3 - 30Division 69 8 8 - 85Range 425 38 67 - 530Beat 2,351 43 373 - 2,767Source: UP Forest Department 2007
The functional unit has no particular territorial jurisdiction for operations; it is generally covers a function which may cover either all or part of territorial areas.
2 Bahuguna, V K, 2002. Presentation on Problems of Encroachments on Forestlands, RUPFOR Series No. 3, presented at Van Vigyan Bhavan, New Delhi, November 15, 2002.
Managed by PCCF
Consisting of a few Circles
Consisting of a few to several Divisions
Consisting of several Ranges
Consisting of several Beats
Lowest functional unit
HEADQUARTERS
ZONE
CIRCLE
DIVISION
RANGE
BEAT
For Official Use Only Special Assistance for Project Formation (SAPROF) for
Uttar Pradesh Natural Resources Management and Poverty Alleviation Project (UPNRMPAP)
Final Report-Volume II Annex 2-15
- Six Territorial Zones are: 1) Western; 2) Rohalkhand; 3) Central; 4) Bundelkhand; 5) Eastern; and 6) South.
- Six Functional Zones are: 1) Administration; 2) Protection; 3) State Forestry Research Institute (SFRI); 4) Forest Training Institute (FTI); 5) JFM; and 6) Eco Development.
- Respective Zones are headed by CCF or equivalent rank officers. - Ten Functional Circles are: 1) Working Plan; 2) Head quarters; 3) Administration; 4)
Publicity & Extension; 5) World Food Programme (WFP); 6) Monitoring; 7) Planning; 8) Forest Conservation Act; 9) Project; and 10) Human Resource Development (HRD);
- Eight Functional Divisions are: 1) 4 working Plan divisions; 2) 1 in PCCF office; 3) 3 offices of Silviculturist.
- Functional Ranges are those with functional activities such as court cases, monitoring etc.
- Functional Beats are those under the functional range offices.
The organisational chart of UPFD is shown in Attachment A2.2-1.
In the State, there are generally three types of territorial forest divisions: i) (regular) territorial divisions; ii) social forestry divisions; and iii) wildlife divisions. The social forestry divisions were created during the World Bank-funded Social Forestry Project Phase I and II to implement their activities mostly outside the forestlands. These social forestry divisions are indifferent from regular territorial divisions except that they usually have limited forestlands within their jurisdictions. The wildlife divisions are also territorial, and those divisions have a National Park and wildlife sanctuaries within their territorial jurisdictions. Because of that, the wildlife divisions are under the supervision of Chief Wildlife Warden (APCCF) and Wildlife Circles. The wildlife divisions are also responsible for regular forestlands outside the Protected Areas (PAs) within their jurisdictions.
2.2 Duties and Functions of Key Staff Members of UPFD3
(1) The Principal Chief Conservator of Forests (PCCF)
PCCF is the officer in charge of the general administration of UPFD. His office is known as general direction division. Beside exercising jurisdiction over the zonal direction charges mentioned below, APCCF (Project), APCCF (Training, Research and WP), APCCF (Social Forestry & Agro-Forestry), APCCF (Wildlife), CCF (Administration & Planning) are directly under his charge.
3 Source: UP Forest Manual, 8th edition; UP FD RTI 2001.
For Official Use Only Special Assistance for Project Formation (SAPROF) for
Uttar Pradesh Natural Resources Management and Poverty Alleviation Project (UPNRMPAP)
Final Report-Volume II Annex 2-16
The duties and functions of the PCCF include:
- Assisting the Secretariat in dealing with forest business; - Department and technical adviser to the State Government in forest matters; - Approval of final drafts of working plans and sanction of all major deviations
which affect the basis of management; - Sanction of formation and redistribution of beats and ranges, submission of
proposals to the Government regarding redistribution of divisions and circles; - Preparation of budget estimates (proposed, revised and latest) and its
re-appropriations, distribution of funds amongst circles; - Overall supervision regarding implementation of the 5 Year Plan; - Financial sanctions beyond the competence of the Chief Conservators of
Forests (CCFs) and Conservators of Forests (CFs) subject to limits of his own powers.
- Control over establishment and dealing with references relating to recruitment of officers of UPFD.
(2) Chief Conservator of Forests (CCF)
The territorial jurisdiction of the notified forest areas of the State has been divided into six zones- Eastern, Central, Western, Bareilly, Bundelkhand, and Southern. A Chief Conservator of Forests (CCF) is the officer in the administrative charge of a zone. In addition to the CCFs assigned as the zonal chiefs, there are functional CCFs for special works such as working plan, training, administration, etc.
(3) Conservator of Forests (CF)
CF (territorial) is the officer in the administrative charge of the assigned forest circle. His office is also known as the direction division.
The duties of the CF are as follows.
- CFs shall deal with the PCCF and with the CCFs on all matters as applicable. They shall also deal with the PCCF and the CCFs on all matters which involve any change in sanctioned budget grant or future budget provision.
- Subject to the above provisions, CFs have the general control of forest matters within their circles, and in view of their status as "head of departments", they should correspond direct with Government on matters that affect their circles exclusively.
- A CF should make frequent tours of inspection and to visit once a year as many of the forests under his control as possible. Special attention will be given to surveys and settlements, Working plans, condition of forests, infrastructure,

For Official Use Only Special Assistance for Project Formation (SAPROF) for
Uttar Pradesh Natural Resources Management and Poverty Alleviation Project (UPNRMPAP)
Final Report-Volume II Annex 2-17
executive and protective staff, method of working and management in force, timber depots etc.
- The protection of the wildlife and fauna of the State forests. - The CF should see that all money transactions are conducted in accordance with
the rules in force, and should examine the cost of current works, as well as of those which have been spread over several years.
- He should also ascertain that the Divisional Forest Officers (DFOs) and other members of the controlling staff are conversant with their duties, that discipline is maintained and that work is properly supervised.
- The CF is responsible for paying attention to all existing rules for the execution of contracts and other instruments connected with the administration of forests and with the business of the Forest Department generally.
(4) Divisional Forest Officer (DFO)
A forest circle is ordinarily divided into divisions for controlling charges, which are held by DFOs. As in-charge of a territorial division, the DFO shall be responsible for running the division smoothly and efficiently according to the rules, orders and directions of the competent authority. Apart from the duties enjoined upon him under the provisions of the various Acts, the following are some of his important duties.
- DFO shall draw up a divisional plan of operations in accordance with the working plan prescriptions and budged provisions, and will submit monthly and annual reports about the current works to his CF
- DFO shall apply and obtain sanctions in advance for any deviations required in the working plan prescriptions.
- DFO shall inspect, guide and supervise all the technical operations going on in his division.
- DFO shall ensure that compartment histories and plantation journals are maintained. He shall also submit the control forms and deviation statements on due dates to CFs, Working Plan Circle through the territorial CF concerned.
- As a drawing and disbursing officer, DFO shall conform in financial matters to the various regulations as prescribed in the Financial Hand Book. He shall issue sanctions for all such works as far as they lie within his power of sanction; for the rest he shall seek sanction of the appropriate higher authority.
- DFO shall conduct the annual and periodical sales of his division and be responsible for enforcing the terms of contracts. He shall accept tenders and execute contracts on behalf of GOUP.
- DFO shall watch closely the realisation of government dues and submit a monthly return to the CF concerned in this regard.

For Official Use Only Special Assistance for Project Formation (SAPROF) for
Uttar Pradesh Natural Resources Management and Poverty Alleviation Project (UPNRMPAP)
Final Report-Volume II Annex 2-18
- He shall also maintain a list of undesirable contractors and report the names of other defaulting contractors to the CF concerned.
- He will ensure that members of his subordinate staff are conversant with their duties, that discipline is maintained and that work is properly executed and supervised.
- DFO shall inspect annually, all the range offices and submit a report to the CF concerned. Such inspections will normally be done after the close of financial year and preferably before the 15th of September each year.
- DFO shall ensure annual inspection of the outer and inner boundaries of his forests to ensure that no encroachment of any kind has taken place. He shall himself inspect part of the boundary. Encroachments, if any, shall be dealt with on priority basis under the provisions of the Indian Forest Act, Land Eviction Act. etc.
- DFO shall take adequate measures for fire protection. - DFO shall check either himself or through his gazetted assistants, the stocks
lying in his division at least once a year. - DFO shall extend full cooperation to the Chief Wildlife Warden in the matter of
Wildlife Conservation, and to the Silviculturist in the matter of affording necessary protection to all research and statistical plots
(5) Sub-Divisional Forest Officers (SDO)
Many forest divisions have been subdivided in to sub-divisions. The charges of the sub-division are held by officers of the rank of Assistant Conservator of Forests (ACF) known in UPFD as SDO. The duties and functions of the SDO are as follows.
- SDO shall inspect, guide and supervise all technical operations in his sub-division. In particular he will approve all silvicultural operations like markings, cultural operations and plantation works. He will similarly inspect and approve all works of communications and buildings. In this respect he will perform for his sub-division the same functions as the DFO for the division as a whole.
- SDO shall be responsible for effective check and control over all expenditure incurred and over realisation of revenue.
- SDO shall have general control over the duties and work of all subordinate officers.
- The SDO shall also perform other duties as may be allotted to him from time to time by the DFO or the CF concerned.

For Official Use Only Special Assistance for Project Formation (SAPROF) for
Uttar Pradesh Natural Resources Management and Poverty Alleviation Project (UPNRMPAP)
Final Report-Volume II Annex 2-19
(6) Forest Rangers
A forest division or sub-division is further divided into ranges or other executive charges which are normally held by Forest Rangers or Deputy Rangers. For purposes of training, IFS Officer in probation and junior UPFD officers are also appointed to hold charge of ranges. The designation is RO or Range Officers. The post of forest rangers has been upgraded from subordinate officer to gazetted officer as of G.O. No. 977/14-3- 95/700(79) /92dt21-9-95.
(7) Forest Guards
A range is divided into beats of protective charges held by Forest Guards (Beat Officers). In certain special divisions e.g. Silviculture and Working Plan etc., the charges are different from forest guards in territorial beat offices and may have no regular ranges or beats. Subordinates attached to such division are engaged to help them in their special work of research or making working plans etc.
2.3 Human Resources of UPFD
Table A2.2-2 summarises the existing manpower of UPFD at different cadres and ranks.
Table A2.2-2 Staffing of UP Forest Department (as on December 2006)
Cadre Sanctioned
Post Posted Cadre
Sanctioned Post
Posted
Forest Officers Legal Cell 1 1Indian Forest Service (IFS) 199 155 Statistical Wing 155 126Provisional Forest Service (PFS) 180 175 Ministerial Staff (State level) 645 554Front Line Staff Ministerial Staff (Circle level) 587 567Range Officer 710 500 Support Staff 2,122 1,777Deputy Ranger 528 497 TOTAL 12,388 10,567Forester 2,338 2,030Forest Guard 3,570 3,001Wildlife Guard 255 213Gardener (Mali) 996 947
Source: Office of the CCF-Administration, UPFD, 2006.
The division-wise number of officers at various ranks is given in Attachment A2.2-2. As shown the tables, there are significant gap between the sanctioned manpower and officers actually in position. The sanctioned positions are not filled by the State Government because of various reasons. UPFD is trying its best for the executing of its works and responsibilities with the given officers.

For Official Use Only Special Assistance for Project Formation (SAPROF) for
Uttar Pradesh Natural Resources Management and Poverty Alleviation Project (UPNRMPAP)
Final Report-Volume II Annex 2-20
2.4 Training Mechanism of UPFD Staff
(1) Coordination and Execution
- The Office of the APCCF Training and Research is responsible for coordination of training activities of UPFD Staff.
- Forest Training Institute (FTI), Kanpur is the nodal agency entrusted with implementation of training.
- The Centre for Training and Management of Soil, Water and Forest (CMF) has been set up as an autonomous organisation (registered as a society) to assist the FTI in organisation of short-term trainings, development of training materials, documentation, etc. CMF generates its own income and operates from the FTI Campus at Kanpur. The staff members of CMF are all on deputation from FTI.
- The FTI is associated with five Forest Guard Training Centres (FGTCs) at Mau in Azamgarh Circle in East Zone, Mirzapur in Varanasi Circle in South Zone, Pratapgarth in Allhabad Circle in South Zone, Agra in Agra Circle in Rohalkand Zone and Meerut in Meerut Circle in West Zone for training of Forest Guards. The coverage area of various forest guards training centres is not so rigidly fixed and sometimes varies on the number of trainees joining there and/or nearest centre from the concerned circle/division. The normal coverage area adhered for various centre is as follows:
Table A2.2-3 Coverage Area under various FGTCs
FGTC Coverage Area Vandevi FGTC, Mau Azamgarh, Gorakhpur, Saryu (Faizabad); Wild Life
(Eastern) Gonda Circles Kotwa FGTC, Mirzapur Varanasi, Vindhya Circles, Kaimoor Wild Life Division Lalganj FGTC, Pratapgarh
Kanpur, Avadh (Lucknow), Allahabad and Research Circles, Dudhwa National Park; All offices situated at Lucknow
Baipur FGTC, Agra Agra, Jhansi, Bariely Circles, Chambal Wild Life Division Hastinapur FGTC, Meerut
Meerut, Moradabad and Saharanpur Circles
Source: FTI-Kanpur.
Table A2.2-4 summarises the existing training facilities of UPFD.
Table A2.2-4 Training Facilities of UPFD Unit FTI
Kanpur
FGTC WaipurMau
FGTC Kotwa Mirzapur
FGTC Lalgunj Pratapgarh
FGTC Waipur Agra
FGTC Hastinapur Meerut
1 Infrastructure -Lecture halls No.(Capacity) 5 1(30) 1(50) n.a. 1(30) 1(40) -Auditorium No. 1 1 0 1 0 1 -Conference room person 35 20 0 300 0 - -Hostel person 110 32 40 40 30 40 -Kitchen & D. Hall person 110 30 20 40 30 40

For Official Use Only Special Assistance for Project Formation (SAPROF) for
Uttar Pradesh Natural Resources Management and Poverty Alleviation Project (UPNRMPAP)
Final Report-Volume II Annex 2-21
Unit FTI Kanpur
FGTC WaipurMau
FGTC Kotwa Mirzapur
FGTC Lalgunj Pratapgarh
FGTC Waipur Agra
FGTC Hastinapur Meerut
-Recreation room person 35 30 0 25 0 1 nos -Officers guest room room 11 0 0 0 0 0 -Scientist guest room room 6 0 0 0 0 0 -Library seating 40 30 20 20 0 1 nos -Library book 6,500 n.a. n.a. n.a. 0 n.a -Office room room 11 1 4 6 1 1 -Staff quarters No. 55 18 1 12 12 9 -Tube well No. 2 1 - 1 0 1 -Hand pump No. 0 2 - 7 0 2 -Water supply Set/tank 1 1 - 1 1 1 2 Equipment - Computers No. 31 0 0 0 0 0 - LCD projector No. 1 0 0 0 0 0 - OHP No. 1 1 1 2 0 1 - Slide projector No. 1 0 0 0 0 0 - GIS unit No. 1 0 0 0 0 0 - TV No. 1 1 0 1 0 1 - VCR No. 1 0 0 0 0 1 - Survey equipment set 1 0 n.a. n.a. 0 n.a. - Bus No. 3 1 0 1 3 2 - Car/Jeep No. 3 0 1 0 0 0 - Generator No. 2 1 1 1 0 1 3 Human Resources i) Posted Staff - CCF No. 1 0 0 0 0 0 - DCF No. 3 0 0 0 0 0 - RFO No. 5 0 1 1 1 1 - Deputy Ranger No. 4 2 2 1 1 1 - Social Worker No. 1 0 0 0 0 0 - ICC No. 1 0 0 0 0 0 - Forester No. 3 0 0 1 0 1 - Forest Guard No. 0 1 1 0 1 0 - Clerk No. 2 0 0 0 0 0 - Driver No. 1 0 0 0 0 0 - Class-IV No. 7 2 0 2 3 3 ii) External Resource Person - University No. 4 0 0 0 0 0 - Departments No. 13 0 0 0 0 0 - Others No. 0 0 0 0 0 1
Source: JBIC SAPROF Team
FTI submits an annual budget to UPFD. Funds are allocated to FTI on a Quarterly basis.
The budget and expenditure of FTI form 2003-2008 is presented in Table A2.2-5.
Table A2.2-5 Budget / Expenditure of FTI, Kanpur (2003-04 to 2007-08) Head 2003-04
Expenditure2004-05
Expenditure2005-06
Expenditure2006-07
Expenditure 2007-08 Budget*
Pay, Labour & Allowances 5,057,707 3,813,287 4,128,885 6,104,968 1,682,000Office Expenses & Maint. 556,001 407,000 295,000 249,000 36,000Training 1,664,000 2,595,000 1,997,000 1,460,000 700,000FD (Forests deposits)** 219719 1,080,054 627,663 248,430 2,335,077Total 7,497,427 7,895,341 7,048,548 8,062,398 4,753,077
Note: * April – June 2007 **Bank Deposits
CMF receives funds from UPFD, GOI and other departments for conducting 2 week

For Official Use Only Special Assistance for Project Formation (SAPROF) for
Uttar Pradesh Natural Resources Management and Poverty Alleviation Project (UPNRMPAP)
Final Report-Volume II Annex 2-22
Forester Refresher courses and Special trainings; building repair and maintenance, running expenses.
Table A2.2-6 Budget of CMF Kanpur
Source of Funds 2005-6 Sanctioned
2005-06 Expenditure
2006-07 Proposed
Forest Department 1,265,000 1,565,000 1,600,000 UP Other Departments 0 29,000 50,000 Government of India 3,600,000 1,705,000 2,000,000 Other Sources 150,000 189,000 400,000 Cash Balance 4,407,000 4,407,000 4,701,000 Total 9,422,000 7,895,000 8,751,000
Budget provision for the FGTCs is made as part of the budget for the respective Division. Expenditure on each Training (6 month) is approximately Rs. 75,000.
(2) Development of Training Calendar
A state-level committee has been constituted for preparation of the annual training calendar and approval of issues related to training resources such as external resource faculty, honorariums, etc. The committee is chaired by APCCF Training and Research, while the Director of FTI is the member secretary.
(3) Nomination of Candidates for Training
The CF for human resource development (HRD) is entrusted with the responsibility of nominations of trainees at the level of ACF and above. Nominations are made based on the past training received, the present posting, training need and relevant training scheduled. In case of frontline staff, FTI issues a letter to the CF for each Circle requesting nominations of staff members for training. Priority is to be given to seniority and to the staff members who have not attended the trainings in the past.
(4) Identification of Training Needs
A detailed competency-based training module exercise was undertaken under the World Bank Forestry Project during 1999-2000. This included a training needs analysis (TNA) component wherein the training needs of the different staff cadres were identified and subject-wise modules were developed. The report on the TNA indicates general needs of forest officers and recommendations on the training courses to be provided to them. However, the real training needs (the gap between the required skills/knowledge /experience and existing skills/knowledge/experience) was not measured properly during the exercise.
During the JBIC SAPROF, a rapid training needs analysis (TNA) was conducted targeting
For Official Use Only Special Assistance for Project Formation (SAPROF) for
Uttar Pradesh Natural Resources Management and Poverty Alleviation Project (UPNRMPAP)
Final Report-Volume II Annex 2-23
selected officers who are likely to be involved in UP-NRMPAP. The report on TNA is
given in Annex 9.
(5) Training Courses and Modules
- The lecturers or resource persons for the training are mostly from UPFD. The details
of resource persons form UPFD are given in Attachment A2.2-3. Some resource persons have a long teaching experience, while others are not.
- The evaluation of training was not undertaken systematically. - Basic (for freshly and directly recruited staff) and refresher (for promoted staff)
trainings are organized at FTI and Forest Guard Training Centres (FGTCs) for the officers above Foresters (below IFS and UPFS cadres) and below Forest Guards, respectively. The modules include subjects such as plantation and nursery management, assisted natural regeneration (ANR), forest protection, wildlife, legal issues, etc.
- In addition, need-based short-term trainings are organized by the Centre for Training and Management of Soil, Water and Forest (CMF) at FTI, Kanpur as part of the training calendar on s such subjects as FDA/NAP, JFM, micro-planning, GIS, bio-diversity, eco-tourism, forest management information system (FMIS), IT, etc. These training are offered also to the officers above IFS or UPFS cadres.
- In addition, trainings for the Professional Civil Service Officers are also organized by CMF as per demand of GOUP. These training have been generating income for CMF.
- The overview of training courses offered is summarised in Table A2.2-7, 2-8 and 2.9 below.
Table A2.2-7 Regular Trainings at FTI and FGTCs Refresher Basic (1) Basic (2)
Target Promoted RFO, Dy. Ranger, Forester
Directly recruited Foresters
Forest Guards
Venue FTI Kanpur FTI Kanpur FGTCs Duration 2.5 months / 2 months 6 months 6 months Frequency 4 courses/ year 2 courses/ year 2 courses/ FGTC/ yr
No. of Trainings (and Participants) from 1988 to 2006 (19 years)
RFO = 4 (101), Dy. R = 2 (36), Forester = 8 (231), FG = 1 (9), Combined = 16 (364)
23 (1,478) TBA (945)
Major Topics covered Forest Protection, Silviculture, Survey, Civil Engineering, Soil and Water Conservation, Staff Discipline, Weekly Field Visits, Village Meeting, Environment (JFM is included under this topic), Community Mobilisation, Involvement of Women, Micro-planning
Source: JBIC SAPROF Team

For Official Use Only Special Assistance for Project Formation (SAPROF) for
Uttar Pradesh Natural Resources Management and Poverty Alleviation Project (UPNRMPAP)
Final Report-Volume II Annex 2-24
Table A2.2-8 Special Training by CMF at FTI, Kanpur Number of Trainings
Subject / Name of Training Course
Duration Days
Participants No
Trained 2002 2003 2004 2005 2006
Front Line Staff Training 14 Front-line staff 534 0 0 0 10 10 Micro-Planning & JFM 2 – 3 Officers, Front Line, NGO 48 1 1 0 0 0 FDA 2 Officers, Front line, VFC 148 0 1 3 1 0 Training for Women’s Groups, NGOs
4 Women SHG members, NGO
213 6 0 1 0 0
Marketing of NWFP 3 Officers 41 2 0 0 0 0 Wild-Life, Bio-Diversity 1 – 4 Officers, Front Line 153 0 1 2 2 0 Agro-Forestry 4 Officers, Front Line,
NGO, VFC 582 0 0 8 2 9
Ravine Stabilization 2 Farmers 74 0 0 2 0 0 Medicinal Plants 3 Farmers 19 0 0 0 0 1 Logging Operations 6 DFO, Ranger 19 0 1 0 0 0 Tall, Intensive Plantation 1 Officers 156 0 0 0 0 3 Captive Management 5 IFS Officers 23 0 0 0 0 1 Computer Training 15 Officers, Office Staff 73 2 0 0 2 0 FMIAS 17/2 Officers, Office Staff 395 0 17 0 0 0 GIS 2 Officers 32 0 1 1 0 0 Accounts, Admin 3 DFO, ACF 113 0 0 0 6 0 Leadership Development
1 Officers / RFOs 67 0 0 0 0 2
IAS / PCS Training 2 Probationary Officers 59 0 2 1 2 2 TOTAL 2749 11 24 18 25 28 Source: JBIC SAPROF Team
Table A2.2-9 Number of trainees from the various FGTCs
Year Vandevi (Mau)
Kotwa (Mirzapur)
Lalganj (Pratapgarh)
Baipur (Agra)
Hastinapur (Meerut)
Total
2002 51 21 20 28 27 147 2003 48 41 60 50 56 255 2004 17 49 66 46 46 224 2005 50 31 28 28 33 170 2006 32 28 31 30 28 149
Source: JBIC SAPROF Team
2.5 Budget of UPFD
The budget of the State has two major components i.e., Plan and Non-Plan. The Plan budget is for specific schemes, projects etc. and is funded either by GOI or the State Government. The Non-plan budget is for the routine administrative expenditure including salaries, normal allowances, running and maintenance costs, travelling expenses, diesel and petrol, telephones etc., which are not covered by the Plan budget. For the Non-plan
budget, about 10% annual increase is observed over last few years (Table A2.2-10). All economy cuts are mainly in the Non-plan budget.
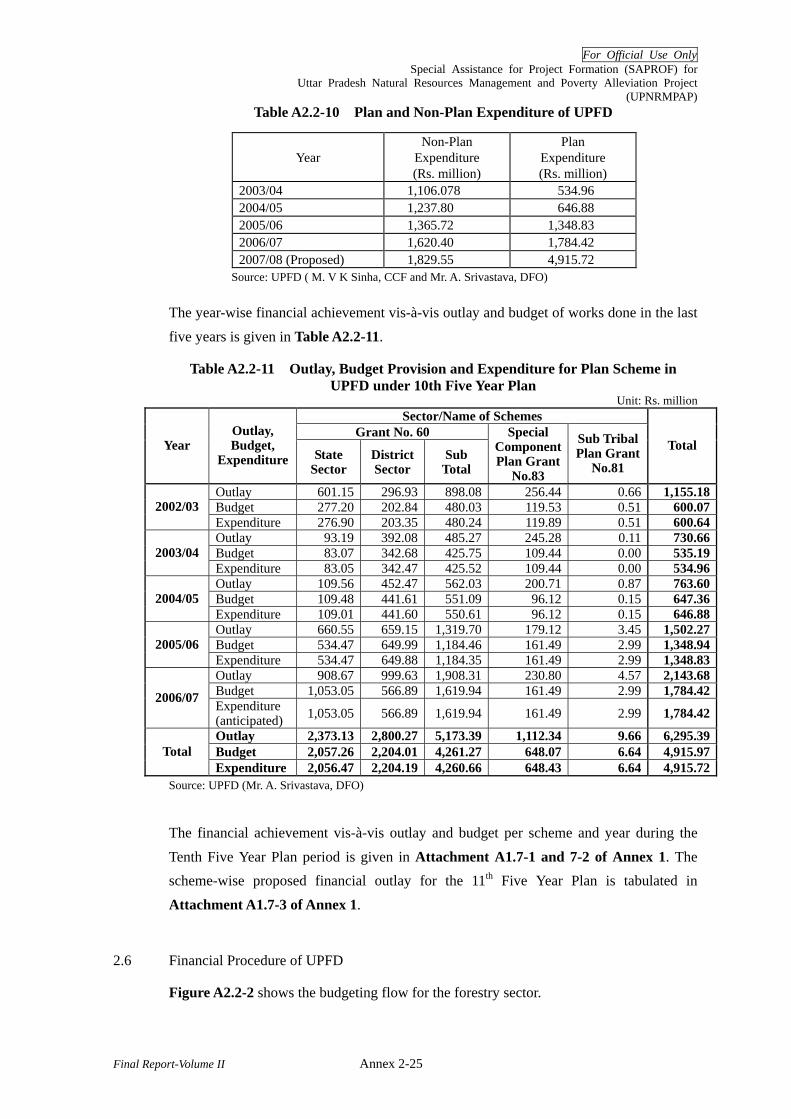
For Official Use Only Special Assistance for Project Formation (SAPROF) for
Uttar Pradesh Natural Resources Management and Poverty Alleviation Project (UPNRMPAP)
Final Report-Volume II Annex 2-25
Table A2.2-10 Plan and Non-Plan Expenditure of UPFD
Year Non-Plan
Expenditure (Rs. million)
Plan Expenditure (Rs. million)
2003/04 1,106.078 534.96 2004/05 1,237.80 646.88 2005/06 1,365.72 1,348.83 2006/07 1,620.40 1,784.42 2007/08 (Proposed) 1,829.55 4,915.72
Source: UPFD ( M. V K Sinha, CCF and Mr. A. Srivastava, DFO)
The year-wise financial achievement vis-à-vis outlay and budget of works done in the last
five years is given in Table A2.2-11.
Table A2.2-11 Outlay, Budget Provision and Expenditure for Plan Scheme in UPFD under 10th Five Year Plan
Unit: Rs. million Sector/Name of Schemes
Grant No. 60 Year
Outlay, Budget,
Expenditure State Sector
District Sector
Sub Total
Special Component Plan Grant
No.83
Sub Tribal Plan Grant
No.81
Total
Outlay 601.15 296.93 898.08 256.44 0.66 1,155.18Budget 277.20 202.84 480.03 119.53 0.51 600.072002/03 Expenditure 276.90 203.35 480.24 119.89 0.51 600.64Outlay 93.19 392.08 485.27 245.28 0.11 730.66Budget 83.07 342.68 425.75 109.44 0.00 535.192003/04 Expenditure 83.05 342.47 425.52 109.44 0.00 534.96Outlay 109.56 452.47 562.03 200.71 0.87 763.60Budget 109.48 441.61 551.09 96.12 0.15 647.362004/05 Expenditure 109.01 441.60 550.61 96.12 0.15 646.88Outlay 660.55 659.15 1,319.70 179.12 3.45 1,502.27Budget 534.47 649.99 1,184.46 161.49 2.99 1,348.942005/06 Expenditure 534.47 649.88 1,184.35 161.49 2.99 1,348.83Outlay 908.67 999.63 1,908.31 230.80 4.57 2,143.68Budget 1,053.05 566.89 1,619.94 161.49 2.99 1,784.422006/07 Expenditure (anticipated) 1,053.05 566.89 1,619.94 161.49 2.99 1,784.42
Outlay 2,373.13 2,800.27 5,173.39 1,112.34 9.66 6,295.39Budget 2,057.26 2,204.01 4,261.27 648.07 6.64 4,915.97Total Expenditure 2,056.47 2,204.19 4,260.66 648.43 6.64 4,915.72
Source: UPFD (Mr. A. Srivastava, DFO)
The financial achievement vis-à-vis outlay and budget per scheme and year during the
Tenth Five Year Plan period is given in Attachment A1.7-1 and 7-2 of Annex 1. The scheme-wise proposed financial outlay for the 11th Five Year Plan is tabulated in
Attachment A1.7-3 of Annex 1.
2.6 Financial Procedure of UPFD
Figure A2.2-2 shows the budgeting flow for the forestry sector.

For Official Use Only Special Assistance for Project Formation (SAPROF) for
Uttar Pradesh Natural Resources Management and Poverty Alleviation Project (UPNRMPAP)
Final Report-Volume II Annex 2-26
Figure A2.2-2 Flow of Budgeting of UPFD
Step 1: Forest Department submits their Annual Plan (Plan, Non-Plan and contribution for Centrally Sponsored Plan) to Planning Department;
Step 2: District Plan also allocates for Forestry and related activities in the district. It goes directly to Planning Department. The outlay suggested in the District Plan is being communicated to Forest Department;
Step 3: Planning Department consolidates all Departmental Plan and District Plans and forward the State Plan to Planning Commission of India with a concurrence of state Finance Department. Planning Commission prepares the State Annual Plan Outlay in consultation with State Government keeping national fiscal situation and priorities into consideration;
Step 4: Forest Department issues Letter of Sanction to PCCF in concurrence of Finance Department;
Step 5: Forest Department then prepares Annual Budget based on the actual outlay sanctioned by the State Government and submits to Finance Department;
Step 6: Finance Department consolidates all Departmental budgets to prepare State
Step 3: Prepare State Annual Plan Layout
Step 3: Consolidation of all Departments’ plans & submitting to Planning
Commission
FINANCE DEPARTMENT, GOUP
PLANNING DEPARTMENT, GOUP
Step 4: Communicate Annual Plan Outlay Budget Ceiling
Step 1: Preparation of Annual Plan
UTTAR PRADESH FOREST DEPARTMENT Step 2: Preparation of Annual
District Plan Component
Concurrences
DIVISIONAL FOREST OFFICE (OFFICE OF DFO)
DISTRICT COLLECTOR
OFFICE
Step 2: Preparation of Annual District
Plan of Forest Department
DEVELOPMENT COMMISSIONER
OFFICE
PLANNING COMMISSION, GOI
District Sector Plan
State Sector Plan

For Official Use Only Special Assistance for Project Formation (SAPROF) for
Uttar Pradesh Natural Resources Management and Poverty Alleviation Project (UPNRMPAP)
Final Report-Volume II Annex 2-27
Annual budget, which gets passes in the State Assembly.
In the State, usually each Department, including the Forest Department, prepares Annual Plan and forwards it to the Planning Department as Proposed Estimate (PE) in September of the previous year for the budget in the following year.
This implies that the counterpart fund of the GOUP required for UPNRMPAP should be known by September 2007.
Based on the sanctioned budget for the Department, the actual fund request and disbursement follows a certain procedure, which has illustrated below;
Note: CCL – Cash Credit Limit
Figure A2.2-3 Procedure for Actual Fund Request and Disbursement of UPFD
Step 1: State Sector and District Sector Budget transfer to Forest Department from the Finance Department;
Step 2: The State sector budget then transfers to PCCF; whereas District sector budget directly goes to DFO;
Step 3: Finance Department directly forwards the Cash Credit Limit (CCL) to PCCF. The amount of CCL is governed by scheduled rates and working plan. It is also depending on the amount incurred during that quarter;
Forest Department Finance Department
Step 1: Releases annual provision in one trance –
State Sector
PCCF Office
Step 2: Request for
disbursement
Step 2: Letter of Sanction
CCF/ CF Office
Division Office (DFO)
Range Office
District Collector
Step 4: Rural Development
e.g., SGSY, etc
Treasury
Step 1: Releases annual
provision in one trance – District Sector
Government of IndiaNon-budget, e.g., NAP
Step 7: Copy of Letter of Sanction/CCL
Step 8 Issuance of Check
Step 8: Delivery of
Cheque
Bank
Step 3: Forwarding
For Official Use Only Special Assistance for Project Formation (SAPROF) for
Uttar Pradesh Natural Resources Management and Poverty Alleviation Project (UPNRMPAP)
Final Report-Volume II Annex 2-28
Step 4: Non-budget fund from Government of India such as NAEB goes directly to DFO in a form of grant without CCL;
Step 5: Rural development fund goes directly to DFO through District Collector cum Magistrate in a form of grant without CCL;
Step 6: State sector budget then goes to either CCF, CF or DFO depending on the nature of activity and the expenditure thereof.
Step 7: DFO forwards the copy of the sanction letter and the CCL to Treasury; Treasury issues the cheque to DFO;
Step 8: DFO hands over cheque to Range Office for expenditure.
A standard auditing process is shown below:
(a) Collect information about the audited entity and its Organisation in order to assess risk and to determine materiality;
(b) Define the objective and scope of the audit; (c) Undertake preliminary analysis to determine the approach to be adopted and the
nature and extent of enquiries to be made later; (d) Highlight special problems foreseen when planning the audit; (e) Prepare a budget and a schedule for the audit; (f) Identify staff requirements and a team for the audit; (g) Familiarise the audited entity about the scope, objectives and the assessment criteria
of the audit and discuss with them as necessary. (h) The members of the audit team have a clear and consistent understanding of the audit
plan; (i) The audit is carried out in accordance with the auditing standards and practices of the
Supreme Audit Institution of India (SAI); (j) The audit plan and action steps specified in that plan are followed unless a variation is
authorised; (k) Working papers contain evidence adequately supporting all conclusions,
recommendations and opinions; (l) The auditor achieves the stated audit objectives; and (m) The audit report includes the audit conclusions, recommendations and opinions, as
appropriate.
2.7 Facilities and Mobility of Uttar Pradesh Forest Department (UPFD)
At the time of this Interim Report, the questionnaires that were distributed to concerned offices of UPFD have not been returned to the JBIC SAPROF Team completely. While no
For Official Use Only Special Assistance for Project Formation (SAPROF) for
Uttar Pradesh Natural Resources Management and Poverty Alleviation Project (UPNRMPAP)
Final Report-Volume II Annex 2-29
existing comprehensive data available on the facilities and equipments of UPFD, the information must be awaited.
Based on the several questionnaires already collected and the field visits by the JBIC SAPROF Team, the following general observations can be drawn.
- The office buildings of UPFD, especially for the frontline offices as the Range offices, are generally old and less equipped.
- The training facilities are also old and gloomy. - Most frontline offices and training centres do not have proper generators while the
electric power failure is so frequent in the State. The office work and training are often hampered without lights.
- Most range offices and below have no computer unit and inadequate vehicle/motor cycle.
- If there is one motorcycle available in a range office, it is considered as very lucky. Most vehicles at the Division level are generally old, and the numbers are inadequate.
- Almost no range offices and below has an access to telephone line. A lot of radio units available at the range offices and below are old or dysfunctional.
- The survey tools at the field offices are inadequate and old. Almost no range offices and below have fire fighting equipments.
2.8 GIS/MIS Expertise of Uttar Pradesh Forest Department
The existing computer system, MIS and GIS facilities of Uttar Pradesh Forest Department and the Government of Uttar Pradesh are discussed as follows.
(1) Evaluation of the Present Computer Network/Infrastructure in UPFD
UPFD set up a GIS laboratory in FTI in Kanpur, in the year 2006 after recognizing the potential utility of GIS tools for forest resource management. However, the GIS facility/infrastructure is in infant stage and has not been used for planning and monitoring in the past six months of its existence.
1) Computer Network/Infrastructure in UPFD
In UPFD, PCCF, CCFs , CFs DFOs, and DCFs are provided computers by the department. In addition, every office in UPFD headquarters is also provided one
computer (Table A2.2-12). All together 220 computer units and related equipment were procured under the World Bank funded UP Forestry Project up to the division office level between 2000 and 2005.
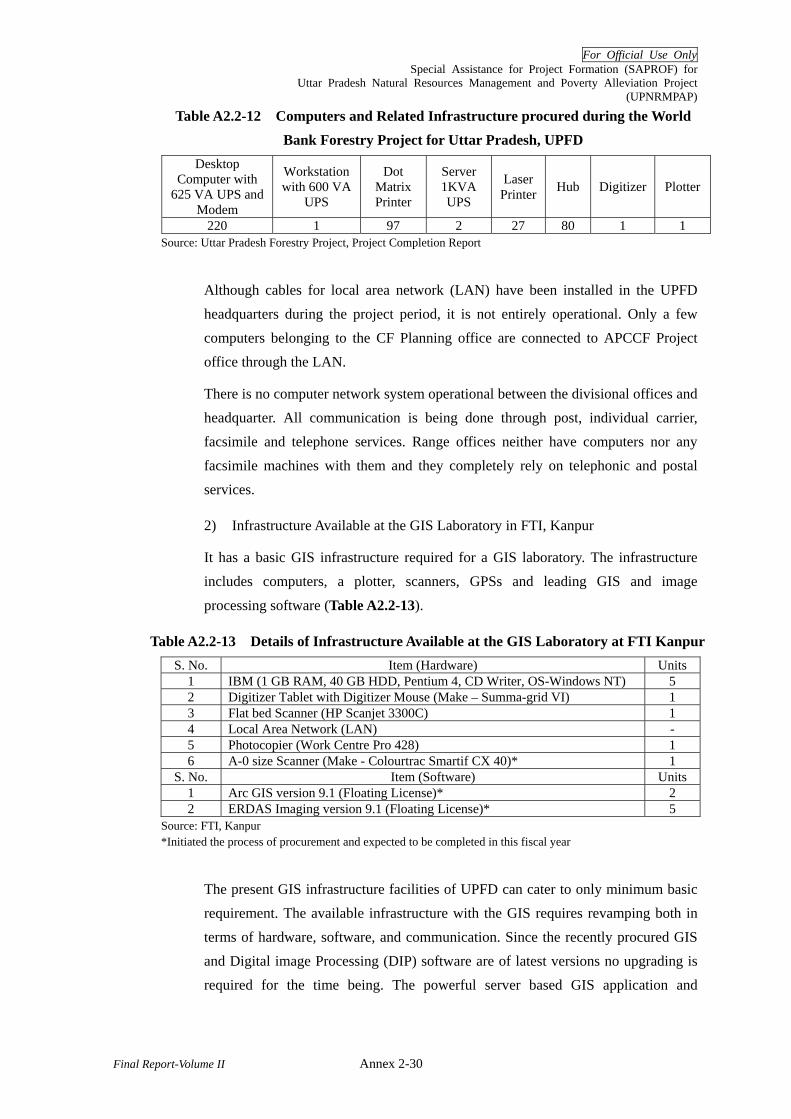
For Official Use Only Special Assistance for Project Formation (SAPROF) for
Uttar Pradesh Natural Resources Management and Poverty Alleviation Project (UPNRMPAP)
Final Report-Volume II Annex 2-30
Table A2.2-12 Computers and Related Infrastructure procured during the World Bank Forestry Project for Uttar Pradesh, UPFD
Desktop Computer with
625 VA UPS and Modem
Workstation with 600 VA
UPS
Dot Matrix Printer
Server 1KVA UPS
Laser Printer Hub Digitizer Plotter
220 1 97 2 27 80 1 1 Source: Uttar Pradesh Forestry Project, Project Completion Report
Although cables for local area network (LAN) have been installed in the UPFD headquarters during the project period, it is not entirely operational. Only a few computers belonging to the CF Planning office are connected to APCCF Project office through the LAN.
There is no computer network system operational between the divisional offices and headquarter. All communication is being done through post, individual carrier, facsimile and telephone services. Range offices neither have computers nor any facsimile machines with them and they completely rely on telephonic and postal services.
2) Infrastructure Available at the GIS Laboratory in FTI, Kanpur
It has a basic GIS infrastructure required for a GIS laboratory. The infrastructure includes computers, a plotter, scanners, GPSs and leading GIS and image
processing software (Table A2.2-13).
Table A2.2-13 Details of Infrastructure Available at the GIS Laboratory at FTI Kanpur S. No. Item (Hardware) Units
1 IBM (1 GB RAM, 40 GB HDD, Pentium 4, CD Writer, OS-Windows NT) 5 2 Digitizer Tablet with Digitizer Mouse (Make – Summa-grid VI) 1 3 Flat bed Scanner (HP Scanjet 3300C) 1 4 Local Area Network (LAN) - 5 Photocopier (Work Centre Pro 428) 1 6 A-0 size Scanner (Make - Colourtrac Smartif CX 40)* 1
S. No. Item (Software) Units 1 Arc GIS version 9.1 (Floating License)* 2 2 ERDAS Imaging version 9.1 (Floating License)* 5
Source: FTI, Kanpur *Initiated the process of procurement and expected to be completed in this fiscal year
The present GIS infrastructure facilities of UPFD can cater to only minimum basic requirement. The available infrastructure with the GIS requires revamping both in terms of hardware, software, and communication. Since the recently procured GIS and Digital image Processing (DIP) software are of latest versions no upgrading is required for the time being. The powerful server based GIS application and

For Official Use Only Special Assistance for Project Formation (SAPROF) for
Uttar Pradesh Natural Resources Management and Poverty Alleviation Project (UPNRMPAP)
Final Report-Volume II Annex 2-31
database software, would be required for GIS processes and online viewing. In order to make both Internet and Intranet based MIS application, LAN and WAN networkings would also be required. The GIS expertise outside the Forest
Department should be tapped and utilized (Attachment A2.2-4).
3) Human Resources for Operation of the GIS Laboratory
During the World Bank-funded project, five forest officers had gone for overseas advanced training in GIS and 11 officials got training in Andhra Pradesh Forest
Academy (APFA) (Table A2.2-14). None of them, however, have been assigned for GIS operation after the training.
Table A2.2-14 Details of GIS Trainings conducted during the World Bank-funded Project No. Name of the
training Rank of Officials No. of
OfficialsDuration of
training Place of training
1 GIS Advanced Training
Special Secretary, GoUP
1 3 Months Murray State University, U.S.A.
2 -do- DFO, UPFD 3 -do- -do- 3 -do- Regional Manager,
UPFC 1 -do- -do-
4 GIS and Remote Sensing
(not available) 11 One Week APFA, India
Source: Uttar Pradesh Forestry Project, Project Completion Report
At present, the GIS Laboratory in FTI Kanpur, a sole GIS unit within UPFD, has five staff members consisting of two research associates, one ACF, one deputy Ranger, and one Forester. Except one researcher who recently joined the Laboratory, four members have undergone a 5-day professional GIS training course held by a private GIS organisation.
Out of the five staff members, two research associates (contract based for a 3-year employment), are conversant with the usage of GIS technology and are having hands on experience of using the same. No provision is available for employing technical persons for the GIS Laboratory.
Although the basic GIS infrastructure was procured during the World Bank-assisted projects, still not much work has been done with the GIS facilities by the Laboratory, mainly due to its recent setup and shortage of skilled manpower as stated above.
(2) Major GIS/MIS Activities in UPFD
1) Major GIS Related Work Undertaken in UPFD
Under the World Bank-funded projects, there was a provision of procurement of
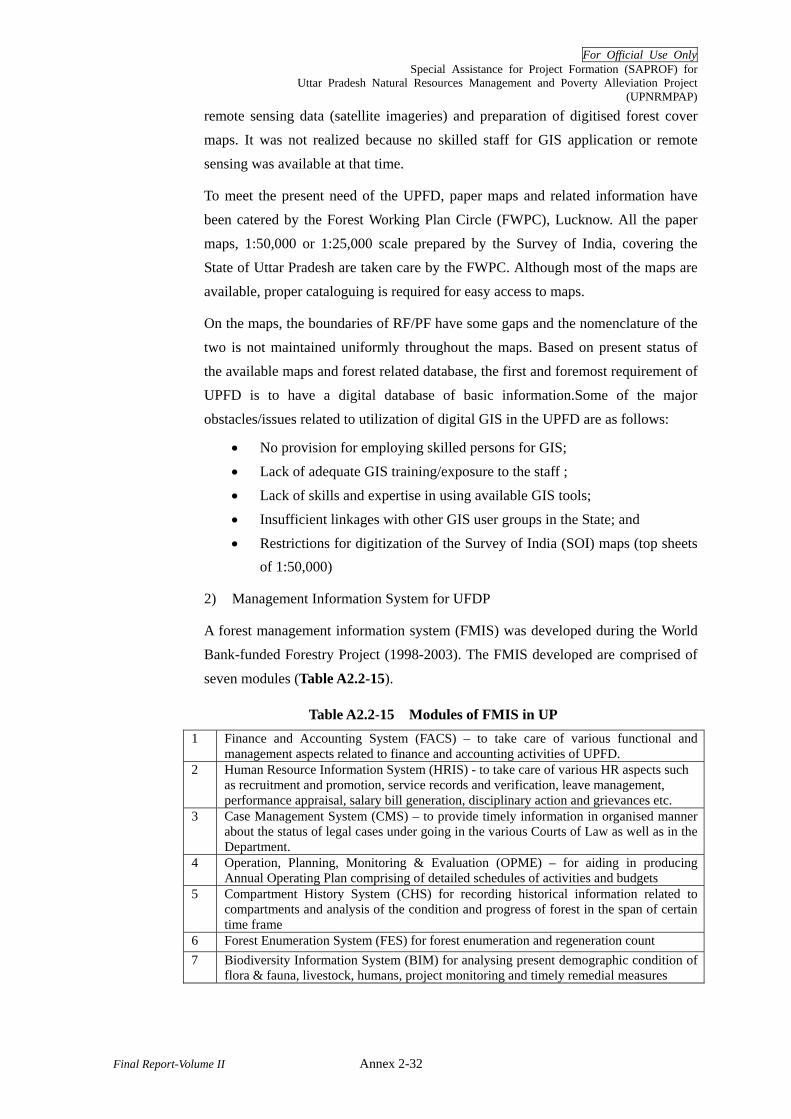
For Official Use Only Special Assistance for Project Formation (SAPROF) for
Uttar Pradesh Natural Resources Management and Poverty Alleviation Project (UPNRMPAP)
Final Report-Volume II Annex 2-32
remote sensing data (satellite imageries) and preparation of digitised forest cover maps. It was not realized because no skilled staff for GIS application or remote sensing was available at that time.
To meet the present need of the UPFD, paper maps and related information have been catered by the Forest Working Plan Circle (FWPC), Lucknow. All the paper maps, 1:50,000 or 1:25,000 scale prepared by the Survey of India, covering the State of Uttar Pradesh are taken care by the FWPC. Although most of the maps are available, proper cataloguing is required for easy access to maps.
On the maps, the boundaries of RF/PF have some gaps and the nomenclature of the two is not maintained uniformly throughout the maps. Based on present status of the available maps and forest related database, the first and foremost requirement of UPFD is to have a digital database of basic information.Some of the major obstacles/issues related to utilization of digital GIS in the UPFD are as follows:
• No provision for employing skilled persons for GIS; • Lack of adequate GIS training/exposure to the staff ; • Lack of skills and expertise in using available GIS tools; • Insufficient linkages with other GIS user groups in the State; and • Restrictions for digitization of the Survey of India (SOI) maps (top sheets
of 1:50,000)
2) Management Information System for UFDP
A forest management information system (FMIS) was developed during the World Bank-funded Forestry Project (1998-2003). The FMIS developed are comprised of
seven modules (Table A2.2-15).
Table A2.2-15 Modules of FMIS in UP 1 Finance and Accounting System (FACS) – to take care of various functional and
management aspects related to finance and accounting activities of UPFD. 2 Human Resource Information System (HRIS) - to take care of various HR aspects such
as recruitment and promotion, service records and verification, leave management, performance appraisal, salary bill generation, disciplinary action and grievances etc.
3 Case Management System (CMS) – to provide timely information in organised manner about the status of legal cases under going in the various Courts of Law as well as in the Department.
4 Operation, Planning, Monitoring & Evaluation (OPME) – for aiding in producing Annual Operating Plan comprising of detailed schedules of activities and budgets
5 Compartment History System (CHS) for recording historical information related to compartments and analysis of the condition and progress of forest in the span of certain time frame
6 Forest Enumeration System (FES) for forest enumeration and regeneration count 7 Biodiversity Information System (BIM) for analysing present demographic condition of
flora & fauna, livestock, humans, project monitoring and timely remedial measures

For Official Use Only Special Assistance for Project Formation (SAPROF) for
Uttar Pradesh Natural Resources Management and Poverty Alleviation Project (UPNRMPAP)
Final Report-Volume II Annex 2-33
Software for the FMIS was installed in the computers at all the Forest and Wildlife Divisions, Circle Office and PCCF Office. And training of UPFD officials in charge of handling the same was conducted. Basic Computer Literacy and FMIS Trainings
conducted during the World Bank Project are summarised in Table A2.2-16.
Table A2.2-16 Basic Computer Literacy and FMIS Trainings during the World Bank Project
No. Name of Training Duration No. of Persons trained Objective of Training1 Basic Computer
training 5 days - 517 (including officers) Basic computer
literacy 2 Higher end training
for FMIS core group members
45 days - 12 core members Database management system
3 FMIS training for pilot stations
29 days - 15 Assistant Clerk from Accounts & establishments - 14 Compiler, draftsman/ Surveyor & Research Assistant - 17 Core group members & trainers
- To train users required to work on FMIS - To impart in house training in future
4 FMIS Rollout training for users of 70 offices
2days - 224 user group members - 131 officers)
To provide operational training in seven modules of FMIS to the user groups
Source: Uttar Pradesh Forestry Project, Project Completion Report, Vol-1
The FMIS, however, never got operational due to various constraints as:
- complexity of the software covering most of the streams of the forest department, - existence of software bags, - limited availability of electricity, - preference of conventional monitoring system to the computerised FMIS by the
concerned officials.
Because of the problems above, it is recommendable to establish a new system from a scratch.
2.9 Monitoring and Evaluation in UPFD
The Office of APCCF Social Forestry and Agroforestry is responsible for M&E of UPFD. The main objective of M&E under social forestry is to have a mechanism for periodical assessment of the plantation activities carried out by the department. M&E is completely
a manual process. Existing M&E System for Plantation Activity are summarised in Table A2.2-17.
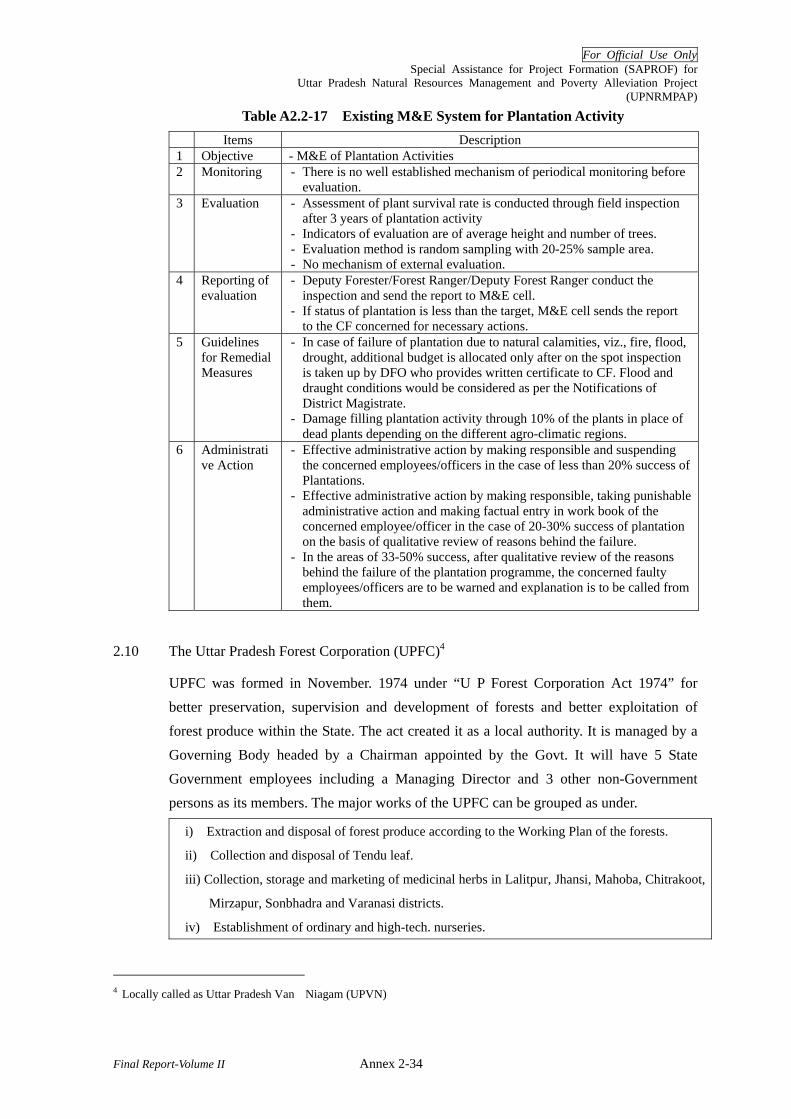
For Official Use Only Special Assistance for Project Formation (SAPROF) for
Uttar Pradesh Natural Resources Management and Poverty Alleviation Project (UPNRMPAP)
Final Report-Volume II Annex 2-34
Table A2.2-17 Existing M&E System for Plantation Activity Items Description
1 Objective - M&E of Plantation Activities 2 Monitoring - There is no well established mechanism of periodical monitoring before
evaluation. 3 Evaluation - Assessment of plant survival rate is conducted through field inspection
after 3 years of plantation activity - Indicators of evaluation are of average height and number of trees. - Evaluation method is random sampling with 20-25% sample area. - No mechanism of external evaluation.
4 Reporting of evaluation
- Deputy Forester/Forest Ranger/Deputy Forest Ranger conduct the inspection and send the report to M&E cell.
- If status of plantation is less than the target, M&E cell sends the report to the CF concerned for necessary actions.
5 Guidelines for Remedial Measures
- In case of failure of plantation due to natural calamities, viz., fire, flood, drought, additional budget is allocated only after on the spot inspection is taken up by DFO who provides written certificate to CF. Flood and draught conditions would be considered as per the Notifications of District Magistrate.
- Damage filling plantation activity through 10% of the plants in place of dead plants depending on the different agro-climatic regions.
6 Administrative Action
- Effective administrative action by making responsible and suspending the concerned employees/officers in the case of less than 20% success of Plantations.
- Effective administrative action by making responsible, taking punishable administrative action and making factual entry in work book of the concerned employee/officer in the case of 20-30% success of plantation on the basis of qualitative review of reasons behind the failure.
- In the areas of 33-50% success, after qualitative review of the reasons behind the failure of the plantation programme, the concerned faulty employees/officers are to be warned and explanation is to be called from them.
2.10 The Uttar Pradesh Forest Corporation (UPFC)4
UPFC was formed in November. 1974 under “U P Forest Corporation Act 1974” for better preservation, supervision and development of forests and better exploitation of forest produce within the State. The act created it as a local authority. It is managed by a Governing Body headed by a Chairman appointed by the Govt. It will have 5 State Government employees including a Managing Director and 3 other non-Government persons as its members. The major works of the UPFC can be grouped as under.
i) Extraction and disposal of forest produce according to the Working Plan of the forests.
ii) Collection and disposal of Tendu leaf.
iii) Collection, storage and marketing of medicinal herbs in Lalitpur, Jhansi, Mahoba, Chitrakoot,
Mirzapur, Sonbhadra and Varanasi districts.
iv) Establishment of ordinary and high-tech. nurseries.
4 Locally called as Uttar Pradesh Van Niagam (UPVN)
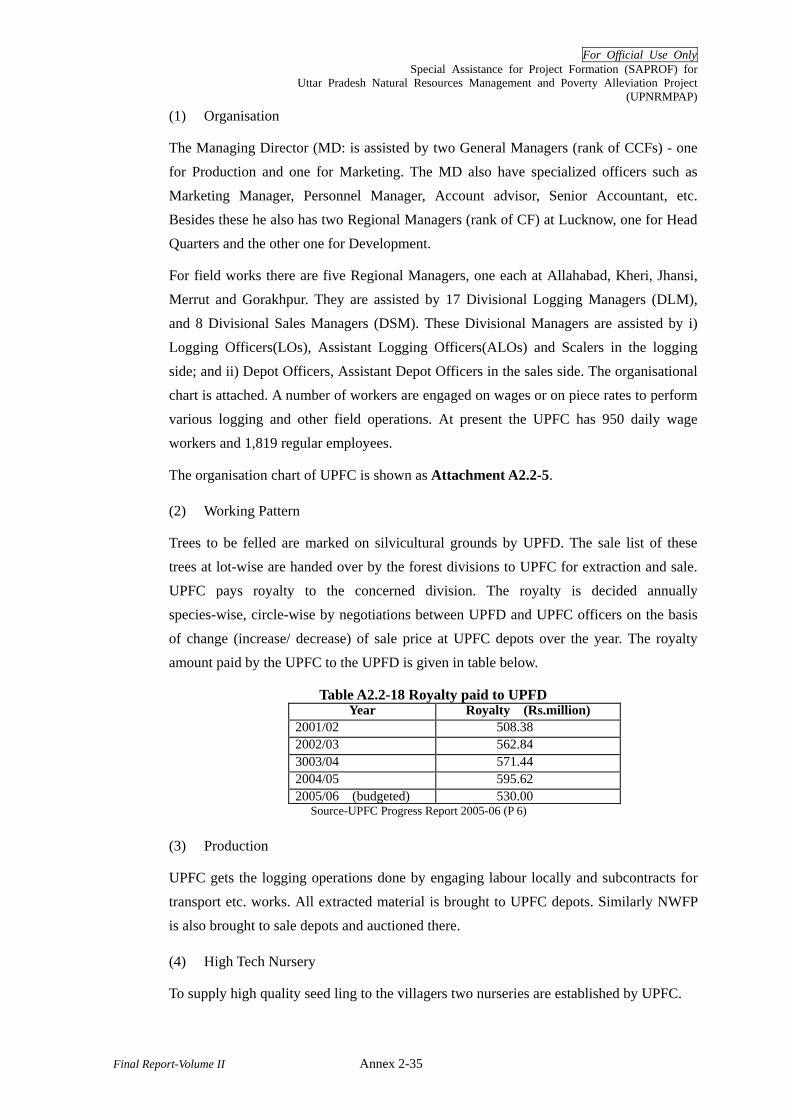
For Official Use Only Special Assistance for Project Formation (SAPROF) for
Uttar Pradesh Natural Resources Management and Poverty Alleviation Project (UPNRMPAP)
Final Report-Volume II Annex 2-35
(1) Organisation
The Managing Director (MD: is assisted by two General Managers (rank of CCFs) - one for Production and one for Marketing. The MD also have specialized officers such as Marketing Manager, Personnel Manager, Account advisor, Senior Accountant, etc. Besides these he also has two Regional Managers (rank of CF) at Lucknow, one for Head Quarters and the other one for Development.
For field works there are five Regional Managers, one each at Allahabad, Kheri, Jhansi, Merrut and Gorakhpur. They are assisted by 17 Divisional Logging Managers (DLM), and 8 Divisional Sales Managers (DSM). These Divisional Managers are assisted by i) Logging Officers(LOs), Assistant Logging Officers(ALOs) and Scalers in the logging side; and ii) Depot Officers, Assistant Depot Officers in the sales side. The organisational chart is attached. A number of workers are engaged on wages or on piece rates to perform various logging and other field operations. At present the UPFC has 950 daily wage workers and 1,819 regular employees.
The organisation chart of UPFC is shown as Attachment A2.2-5.
(2) Working Pattern
Trees to be felled are marked on silvicultural grounds by UPFD. The sale list of these trees at lot-wise are handed over by the forest divisions to UPFC for extraction and sale. UPFC pays royalty to the concerned division. The royalty is decided annually species-wise, circle-wise by negotiations between UPFD and UPFC officers on the basis of change (increase/ decrease) of sale price at UPFC depots over the year. The royalty amount paid by the UPFC to the UPFD is given in table below.
Table A2.2-18 Royalty paid to UPFD Year Royalty (Rs.million)
2001/02 508.38 2002/03 562.84 3003/04 571.44 2004/05 595.62 2005/06 (budgeted) 530.00
Source-UPFC Progress Report 2005-06 (P 6)
(3) Production
UPFC gets the logging operations done by engaging labour locally and subcontracts for transport etc. works. All extracted material is brought to UPFC depots. Similarly NWFP is also brought to sale depots and auctioned there.
(4) High Tech Nursery
To supply high quality seed ling to the villagers two nurseries are established by UPFC.

For Official Use Only Special Assistance for Project Formation (SAPROF) for
Uttar Pradesh Natural Resources Management and Poverty Alleviation Project (UPNRMPAP)
Final Report-Volume II Annex 2-36
Table A2.2-19 Nursery of UPFC Name of the Nursery Species Available Production (no)
Lucknow (Kursi Road) Teak ,Aegle, Bauhania 20,000 Kanpur Depot, Kanpur Neem(Azadrachta), Jamun (Jambolina) 30,000
(5) Other Works
Besides paying royalty to UPFD, UPFC contributes to the following activities:
1 Repair and maintenance of forest roads and rest houses; 2 Upkeep of zoos and wildlife conservation; 3 Protection and development of PAs; and 4 Bio-conservancy.
The financial help given by the UPFC to the FD is shown as Attachment A2 2-6.
(6) Financial Situation-
UPFC is a profit making government enterprise. It made a net average profit of Rs. 45.35
million in last four years (2002/03 to 2005/06), as per details given as Attachment A2.2-7.
3 Present Conditions of Forest in UP
3.1 Forest Area Classification
(1) Historical Background of Forest Area Classification
Before the British period, forests came under the territorial jurisdiction of princely rulers. The Indian Forest Act 1865, the first forest act of the India, notified forests as a state property. The Indian Forest Act 1878 had created forest categories of “Reserved Forest” and “Protected Forest, and also endowed authorities over forest areas to the Forest Department. The settlements of most of forests areas to the Forest Department were done in 1930’s after the enactment of the Indian Forest Act 1927, which provided the classification of forests into three legal categories of Reserved Forests, Protected Forests and Village Forests. In Uttar Pradesh, control of forest areas owned by small rulers and big landlords was taken over by UPFD after enactment of the Private Forest Act 1948 and Zamindari5 Abolition Act 1951. The management of smaller private forests was taken over post amendment of Section 38 of the Indian Forest Act in 1964. Most of the existing Protected and Un-classed forest came under the Forest Department’s control after the independence.
5 The ex-rulers used to donate village/lands of their territory to royal members or loyal nobles as Zamindari and forests
donated were called Zamindari forests.
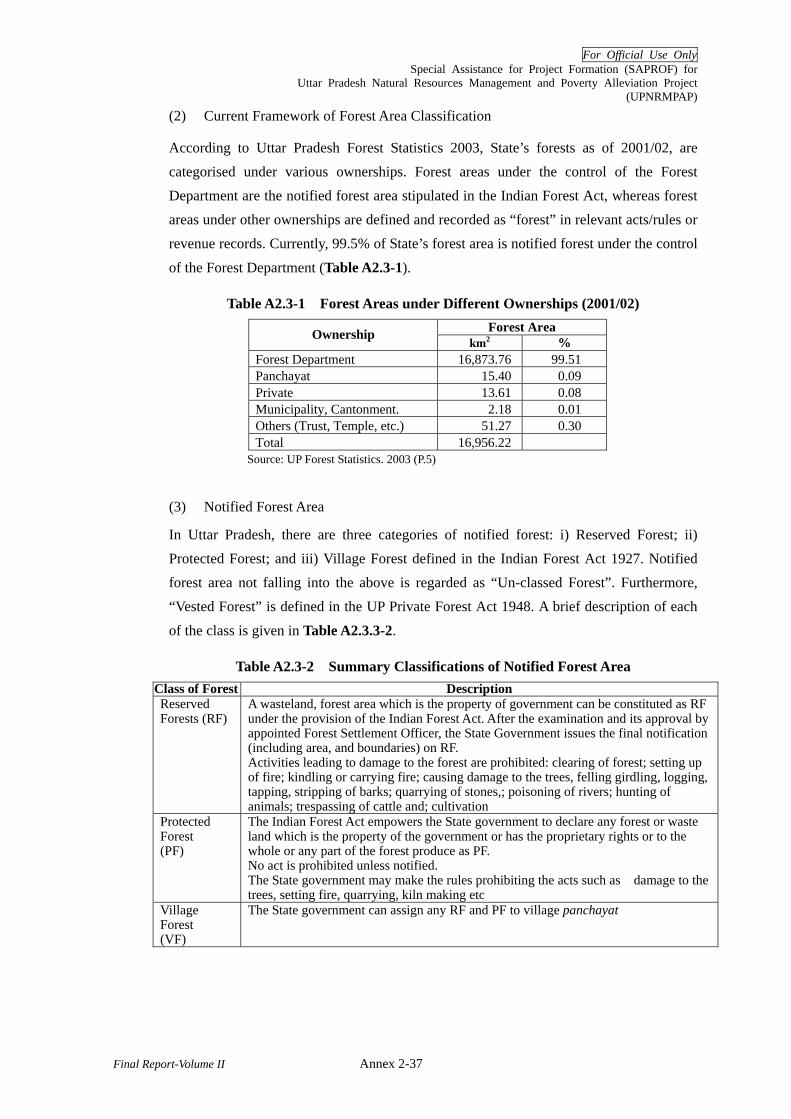
For Official Use Only Special Assistance for Project Formation (SAPROF) for
Uttar Pradesh Natural Resources Management and Poverty Alleviation Project (UPNRMPAP)
Final Report-Volume II Annex 2-37
(2) Current Framework of Forest Area Classification
According to Uttar Pradesh Forest Statistics 2003, State’s forests as of 2001/02, are categorised under various ownerships. Forest areas under the control of the Forest Department are the notified forest area stipulated in the Indian Forest Act, whereas forest areas under other ownerships are defined and recorded as “forest” in relevant acts/rules or revenue records. Currently, 99.5% of State’s forest area is notified forest under the control
of the Forest Department (Table A2.3-1).
Table A2.3-1 Forest Areas under Different Ownerships (2001/02) Forest Area Ownership
km2 % Forest Department 16,873.76 99.51 Panchayat 15.40 0.09 Private 13.61 0.08 Municipality, Cantonment. 2.18 0.01 Others (Trust, Temple, etc.) 51.27 0.30 Total 16,956.22
Source: UP Forest Statistics. 2003 (P.5)
(3) Notified Forest Area
In Uttar Pradesh, there are three categories of notified forest: i) Reserved Forest; ii) Protected Forest; and iii) Village Forest defined in the Indian Forest Act 1927. Notified forest area not falling into the above is regarded as “Un-classed Forest”. Furthermore, “Vested Forest” is defined in the UP Private Forest Act 1948. A brief description of each
of the class is given in Table A2.3.3-2.
Table A2.3-2 Summary Classifications of Notified Forest Area Class of Forest Description Reserved Forests (RF)
A wasteland, forest area which is the property of government can be constituted as RF under the provision of the Indian Forest Act. After the examination and its approval by appointed Forest Settlement Officer, the State Government issues the final notification (including area, and boundaries) on RF. Activities leading to damage to the forest are prohibited: clearing of forest; setting up of fire; kindling or carrying fire; causing damage to the trees, felling girdling, logging, tapping, stripping of barks; quarrying of stones,; poisoning of rivers; hunting of animals; trespassing of cattle and; cultivation
Protected Forest (PF)
The Indian Forest Act empowers the State government to declare any forest or waste land which is the property of the government or has the proprietary rights or to the whole or any part of the forest produce as PF. No act is prohibited unless notified. The State government may make the rules prohibiting the acts such as damage to the trees, setting fire, quarrying, kiln making etc
Village Forest (VF)
The State government can assign any RF and PF to village panchayat
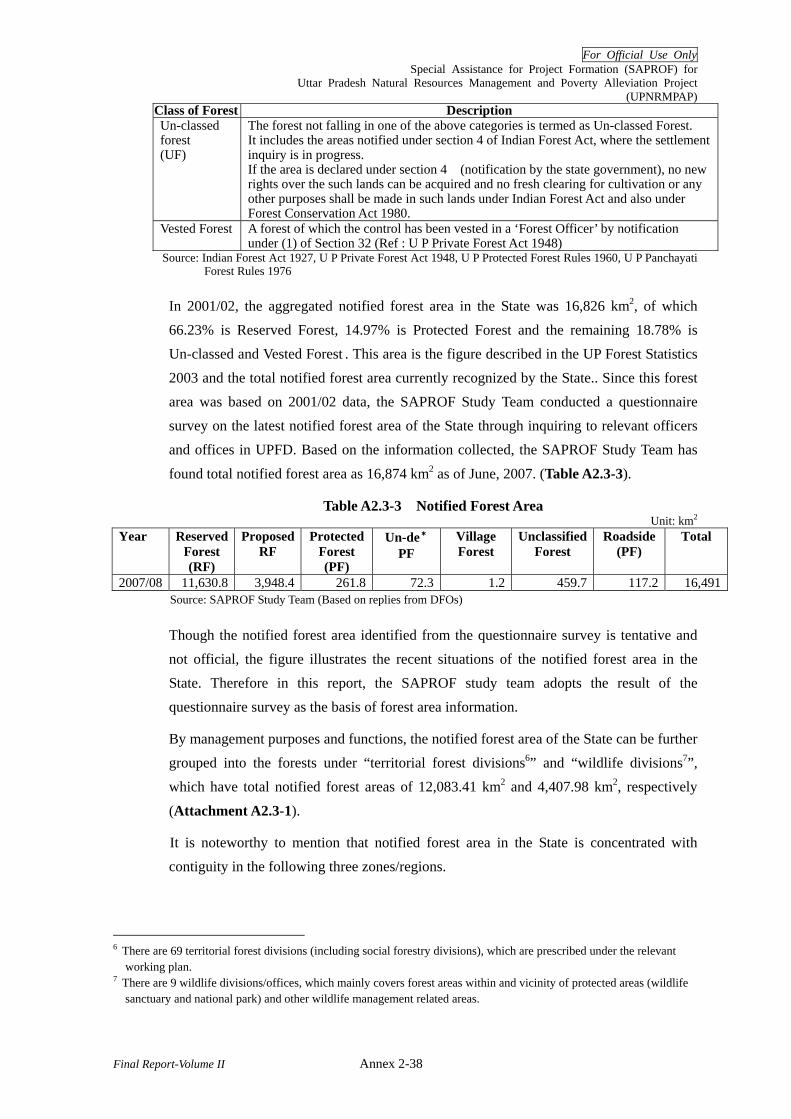
For Official Use Only Special Assistance for Project Formation (SAPROF) for
Uttar Pradesh Natural Resources Management and Poverty Alleviation Project (UPNRMPAP)
Final Report-Volume II Annex 2-38
Class of Forest Description Un-classed forest (UF)
The forest not falling in one of the above categories is termed as Un-classed Forest. It includes the areas notified under section 4 of Indian Forest Act, where the settlement inquiry is in progress. If the area is declared under section 4 (notification by the state government), no new rights over the such lands can be acquired and no fresh clearing for cultivation or any other purposes shall be made in such lands under Indian Forest Act and also under Forest Conservation Act 1980.
Vested Forest
A forest of which the control has been vested in a ‘Forest Officer’ by notification under (1) of Section 32 (Ref : U P Private Forest Act 1948)
Source: Indian Forest Act 1927, U P Private Forest Act 1948, U P Protected Forest Rules 1960, U P Panchayati Forest Rules 1976
In 2001/02, the aggregated notified forest area in the State was 16,826 km2, of which 66.23% is Reserved Forest, 14.97% is Protected Forest and the remaining 18.78% is Un-classed and Vested Forest . This area is the figure described in the UP Forest Statistics 2003 and the total notified forest area currently recognized by the State.. Since this forest area was based on 2001/02 data, the SAPROF Study Team conducted a questionnaire survey on the latest notified forest area of the State through inquiring to relevant officers and offices in UPFD. Based on the information collected, the SAPROF Study Team has
found total notified forest area as 16,874 km2 as of June, 2007. (Table A2.3-3).
Table A2.3-3 Notified Forest Area Unit: km2
Year Reserved Forest (RF)
Proposed RF
Protected Forest (PF)
Un-de*
PF Village Forest
Unclassified Forest
Roadside (PF)
Total
2007/08 11,630.8 3,948.4 261.8 72.3 1.2 459.7 117.2 16,491Source: SAPROF Study Team (Based on replies from DFOs)
Though the notified forest area identified from the questionnaire survey is tentative and not official, the figure illustrates the recent situations of the notified forest area in the State. Therefore in this report, the SAPROF study team adopts the result of the questionnaire survey as the basis of forest area information.
By management purposes and functions, the notified forest area of the State can be further grouped into the forests under “territorial forest divisions6” and “wildlife divisions7”, which have total notified forest areas of 12,083.41 km2 and 4,407.98 km2, respectively
(Attachment A2.3-1).
It is noteworthy to mention that notified forest area in the State is concentrated with contiguity in the following three zones/regions.
6 There are 69 territorial forest divisions (including social forestry divisions), which are prescribed under the relevant
working plan. 7 There are 9 wildlife divisions/offices, which mainly covers forest areas within and vicinity of protected areas (wildlife
sanctuary and national park) and other wildlife management related areas.

For Official Use Only Special Assistance for Project Formation (SAPROF) for
Uttar Pradesh Natural Resources Management and Poverty Alleviation Project (UPNRMPAP)
Final Report-Volume II Annex 2-39
- South Region (Vindhya, Allhabad Areas) - Bundelkhand Region - Central Terai Region8
The forest areas under territorial forest divisions (territorial forest area) in these three regions sum up to 882,510 ha, which covers 73% of total territorial forest area and approximately 53% of total forest area in the State. Especially, the South region and Bundelkhand region located in southern part of the State are the area where the notified forest area is the most concentrated and exceed 54% of state’s total territorial forest area.
In association with the concentration of territorial forest areas, forest areas under wildlife divisions are also clumped in these three regions, having the total areas of 374,335ha. This is approximately 22.5% of state’s total notified forest area, and with the territorial forest areas, these three regions have 75% of state’s total notified forest area. The
following Table A2.3-4 shows summary of notified forest areas in the three regions mentioned above.
Table A2.3-4 Regions with High Concentration of Notified Forest Area Ratio to Total Forest Area
Circle Forest Division Forestland
under UPFD (ha)
To Territorial To All
A. Territorial Forest Division 1. South Region (Vindhya, Allhabad Area)
Allahabad Allahabad (SF), Fathepur (SF), Kaushambi (SF), Pratapgarh (SF)
28,700
Varanasi Badohi (SF), Mirzapur, Obra, Rainukoot, Sonbhadra
400,328
Total 429,028 35.4% 2. Bundelkhand Region
Jhansi Banda, Chitrakoot, Hamirpur, Jhansi, Lallitpur (SF), Mahoba, Orai (SF)
230,044
Total 230,044 19.0% 3. Central Terai Region
Gonda Bahraich, Gonda, Shrawasti 49,648
Lucknow North Kheri, South Kheri 91,008
Bareilly Bareilly (SF), Pilibhit, Pilibhit (SF), Shajahan Pur (SF)
82,782
Total 223,438 18.5% Total of Above 882,510 72.9% 53.0%
8 Traditionally, so called “Terai Region” in UP covered districts of Saharanpur, Bijnor, Rampur, Bareilly,
Pilibhit, Kheri, Bahraich, Gonda, Basti, Siddharthnagar, Gorakhpur, Maharajganj, and Deoria districts, in accordance with geographical homogeneity (Uttar Pradesh 2006, Information and Public Relations Department)
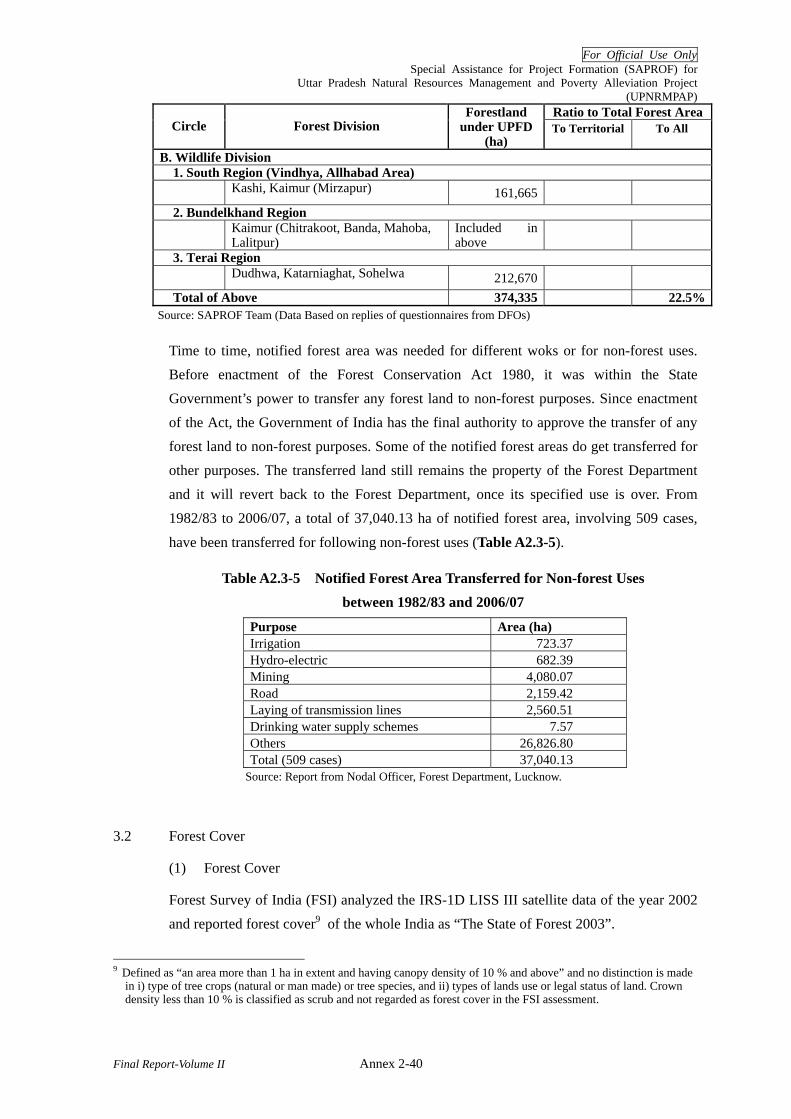
For Official Use Only Special Assistance for Project Formation (SAPROF) for
Uttar Pradesh Natural Resources Management and Poverty Alleviation Project (UPNRMPAP)
Final Report-Volume II Annex 2-40
Ratio to Total Forest Area Circle Forest Division
Forestland under UPFD
(ha) To Territorial To All
B. Wildlife Division 1. South Region (Vindhya, Allhabad Area)
Kashi, Kaimur (Mirzapur) 161,665
2. Bundelkhand Region Kaimur (Chitrakoot, Banda, Mahoba,
Lalitpur) Included in above
3. Terai Region Dudhwa, Katarniaghat, Sohelwa 212,670
Total of Above 374,335 22.5%Source: SAPROF Team (Data Based on replies of questionnaires from DFOs)
Time to time, notified forest area was needed for different woks or for non-forest uses. Before enactment of the Forest Conservation Act 1980, it was within the State Government’s power to transfer any forest land to non-forest purposes. Since enactment of the Act, the Government of India has the final authority to approve the transfer of any forest land to non-forest purposes. Some of the notified forest areas do get transferred for other purposes. The transferred land still remains the property of the Forest Department and it will revert back to the Forest Department, once its specified use is over. From 1982/83 to 2006/07, a total of 37,040.13 ha of notified forest area, involving 509 cases,
have been transferred for following non-forest uses (Table A2.3-5).
Table A2.3-5 Notified Forest Area Transferred for Non-forest Uses between 1982/83 and 2006/07
Purpose Area (ha) Irrigation 723.37 Hydro-electric 682.39 Mining 4,080.07 Road 2,159.42 Laying of transmission lines 2,560.51 Drinking water supply schemes 7.57 Others 26,826.80 Total (509 cases) 37,040.13
Source: Report from Nodal Officer, Forest Department, Lucknow.
3.2 Forest Cover
(1) Forest Cover
Forest Survey of India (FSI) analyzed the IRS-1D LISS III satellite data of the year 2002 and reported forest cover9 of the whole India as “The State of Forest 2003”.
9 Defined as “an area more than 1 ha in extent and having canopy density of 10 % and above” and no distinction is made
in i) type of tree crops (natural or man made) or tree species, and ii) types of lands use or legal status of land. Crown density less than 10 % is classified as scrub and not regarded as forest cover in the FSI assessment.
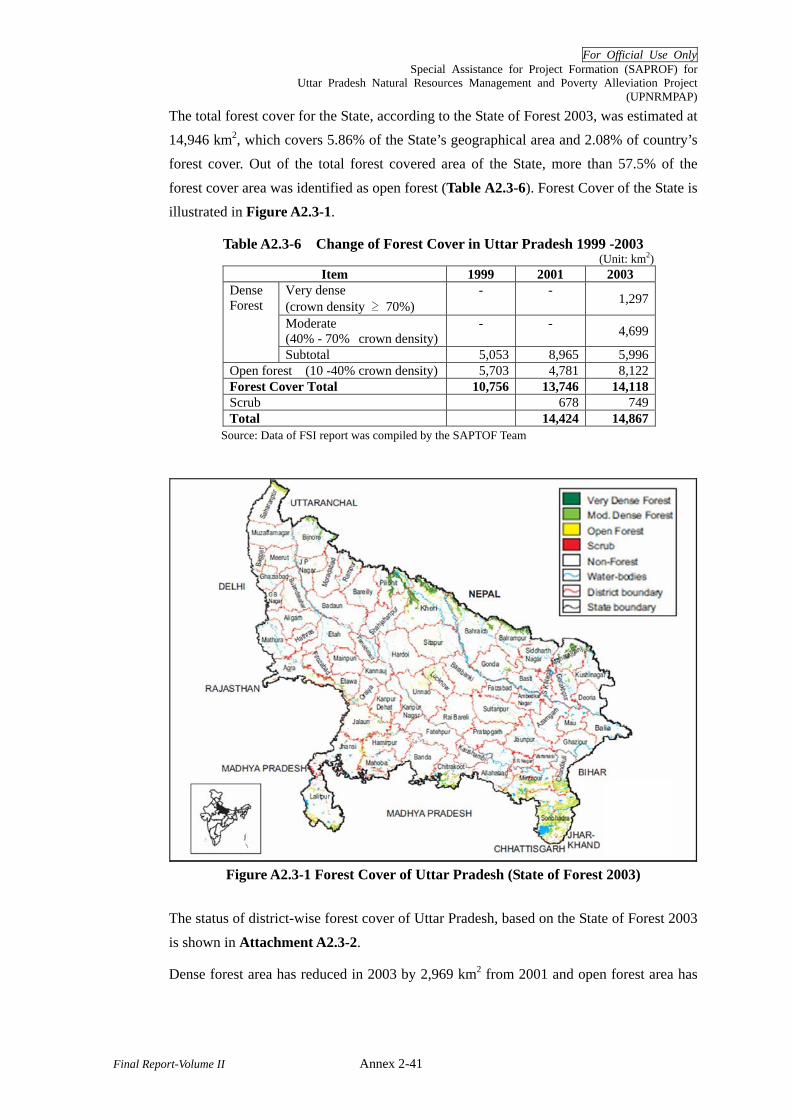
For Official Use Only Special Assistance for Project Formation (SAPROF) for
Uttar Pradesh Natural Resources Management and Poverty Alleviation Project (UPNRMPAP)
Final Report-Volume II Annex 2-41
The total forest cover for the State, according to the State of Forest 2003, was estimated at 14,946 km2, which covers 5.86% of the State’s geographical area and 2.08% of country’s forest cover. Out of the total forest covered area of the State, more than 57.5% of the
forest cover area was identified as open forest (Table A2.3-6). Forest Cover of the State is illustrated in Figure A2.3-1.
Table A2.3-6 Change of Forest Cover in Uttar Pradesh 1999 -2003 (Unit: km2)
Item 1999 2001 2003 Very dense (crown density ≥ 70%)
- - 1,297
Moderate (40% - 70% crown density)
- - 4,699
Dense Forest
Subtotal 5,053 8,965 5,996 Open forest (10 -40% crown density) 5,703 4,781 8,122 Forest Cover Total 10,756 13,746 14,118 Scrub 678 749 Total 14,424 14,867
Source: Data of FSI report was compiled by the SAPTOF Team
Figure A2.3-1 Forest Cover of Uttar Pradesh (State of Forest 2003)
The status of district-wise forest cover of Uttar Pradesh, based on the State of Forest 2003
is shown in Attachment A2.3-2.
Dense forest area has reduced in 2003 by 2,969 km2 from 2001 and open forest area has
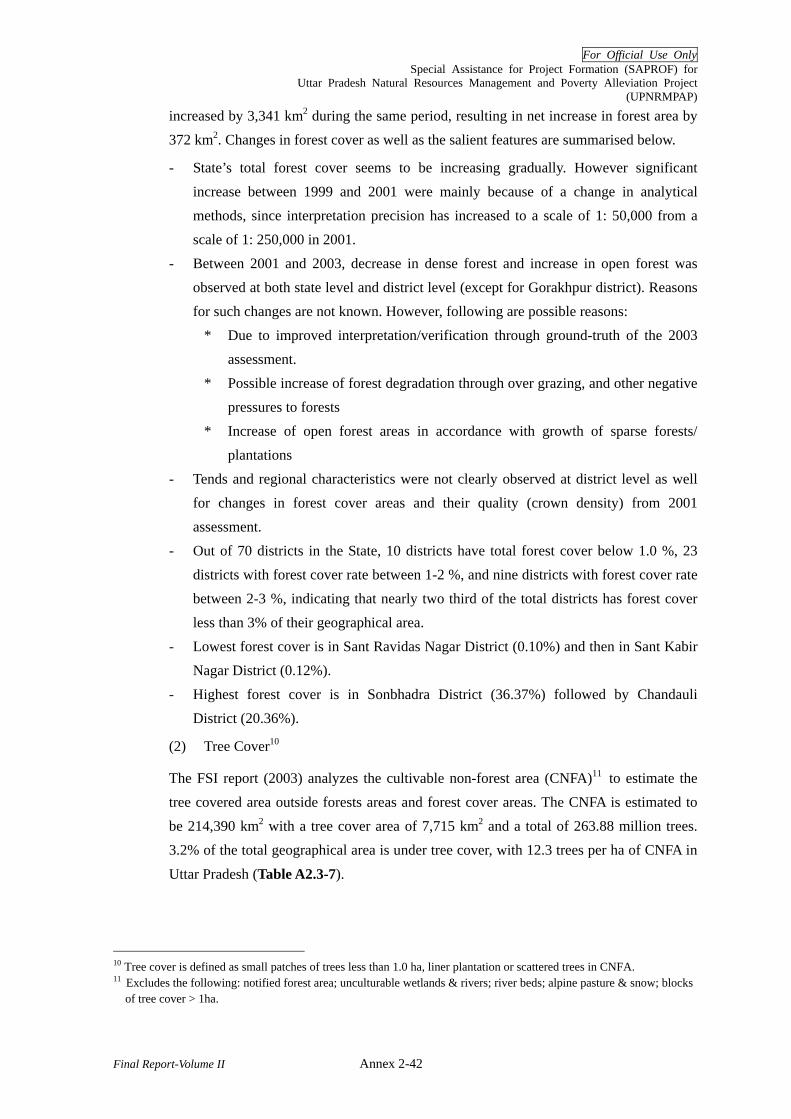
For Official Use Only Special Assistance for Project Formation (SAPROF) for
Uttar Pradesh Natural Resources Management and Poverty Alleviation Project (UPNRMPAP)
Final Report-Volume II Annex 2-42
increased by 3,341 km2 during the same period, resulting in net increase in forest area by 372 km2. Changes in forest cover as well as the salient features are summarised below.
- State’s total forest cover seems to be increasing gradually. However significant increase between 1999 and 2001 were mainly because of a change in analytical methods, since interpretation precision has increased to a scale of 1: 50,000 from a scale of 1: 250,000 in 2001.
- Between 2001 and 2003, decrease in dense forest and increase in open forest was observed at both state level and district level (except for Gorakhpur district). Reasons for such changes are not known. However, following are possible reasons:
* Due to improved interpretation/verification through ground-truth of the 2003 assessment.
* Possible increase of forest degradation through over grazing, and other negative pressures to forests
* Increase of open forest areas in accordance with growth of sparse forests/ plantations
- Tends and regional characteristics were not clearly observed at district level as well for changes in forest cover areas and their quality (crown density) from 2001 assessment.
- Out of 70 districts in the State, 10 districts have total forest cover below 1.0 %, 23 districts with forest cover rate between 1-2 %, and nine districts with forest cover rate between 2-3 %, indicating that nearly two third of the total districts has forest cover less than 3% of their geographical area.
- Lowest forest cover is in Sant Ravidas Nagar District (0.10%) and then in Sant Kabir Nagar District (0.12%).
- Highest forest cover is in Sonbhadra District (36.37%) followed by Chandauli District (20.36%).
(2) Tree Cover10
The FSI report (2003) analyzes the cultivable non-forest area (CNFA)11 to estimate the tree covered area outside forests areas and forest cover areas. The CNFA is estimated to be 214,390 km2 with a tree cover area of 7,715 km2 and a total of 263.88 million trees. 3.2% of the total geographical area is under tree cover, with 12.3 trees per ha of CNFA in
Uttar Pradesh (Table A2.3-7).
10 Tree cover is defined as small patches of trees less than 1.0 ha, liner plantation or scattered trees in CNFA. 11 Excludes the following: notified forest area; unculturable wetlands & rivers; river beds; alpine pasture & snow; blocks
of tree cover > 1ha.
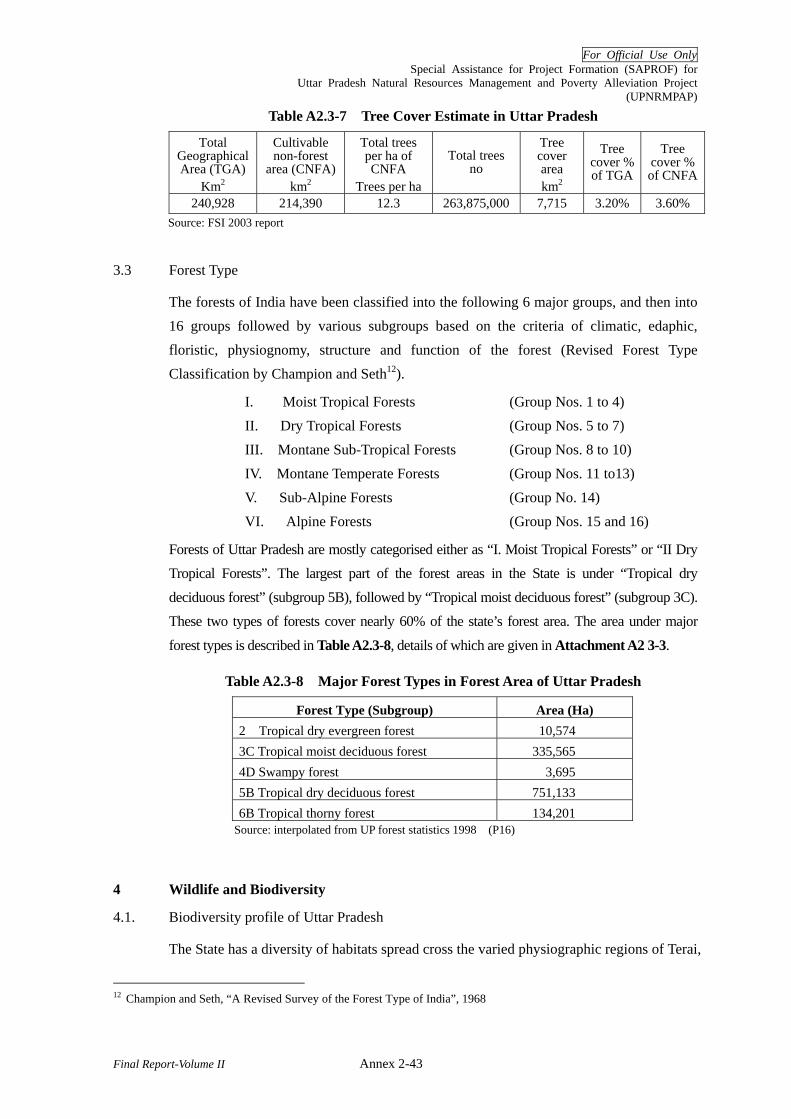
For Official Use Only Special Assistance for Project Formation (SAPROF) for
Uttar Pradesh Natural Resources Management and Poverty Alleviation Project (UPNRMPAP)
Final Report-Volume II Annex 2-43
Table A2.3-7 Tree Cover Estimate in Uttar Pradesh
Total Geographical Area (TGA)
Cultivable non-forest
area (CNFA)
Total trees per ha of CNFA
Tree cover area
Km2 km2 Trees per ha
Total trees no
km2
Tree cover % of TGA
Tree cover % of CNFA
240,928 214,390 12.3 263,875,000 7,715 3.20% 3.60% Source: FSI 2003 report
3.3 Forest Type
The forests of India have been classified into the following 6 major groups, and then into 16 groups followed by various subgroups based on the criteria of climatic, edaphic, floristic, physiognomy, structure and function of the forest (Revised Forest Type Classification by Champion and Seth12).
I. Moist Tropical Forests (Group Nos. 1 to 4) II. Dry Tropical Forests (Group Nos. 5 to 7) III. Montane Sub-Tropical Forests (Group Nos. 8 to 10) IV. Montane Temperate Forests (Group Nos. 11 to13) V. Sub-Alpine Forests (Group No. 14) VI. Alpine Forests (Group Nos. 15 and 16)
Forests of Uttar Pradesh are mostly categorised either as “I. Moist Tropical Forests” or “II Dry Tropical Forests”. The largest part of the forest areas in the State is under “Tropical dry deciduous forest” (subgroup 5B), followed by “Tropical moist deciduous forest” (subgroup 3C). These two types of forests cover nearly 60% of the state’s forest area. The area under major
forest types is described in Table A2.3-8, details of which are given in Attachment A2 3-3.
Table A2.3-8 Major Forest Types in Forest Area of Uttar Pradesh
Forest Type (Subgroup) Area (Ha) 2 Tropical dry evergreen forest 10,574 3C Tropical moist deciduous forest 335,565 4D Swampy forest 3,695 5B Tropical dry deciduous forest 751,133 6B Tropical thorny forest 134,201
Source: interpolated from UP forest statistics 1998 (P16)
4 Wildlife and Biodiversity
4.1. Biodiversity profile of Uttar Pradesh
The State has a diversity of habitats spread cross the varied physiographic regions of Terai,
12 Champion and Seth, “A Revised Survey of the Forest Type of India”, 1968

For Official Use Only Special Assistance for Project Formation (SAPROF) for
Uttar Pradesh Natural Resources Management and Poverty Alleviation Project (UPNRMPAP)
Final Report-Volume II Annex 2-44
the Gangetic plains and the Bundelkhand, holding a wide variety of flora and fauna
(Table A2.4-1).
Table A2.4-1 The Habitat Types and Key Vegetation of UP13 Physiographic
Region Habitat type Key vegetation
Moist deciduous forests (Sal dominated, and mixed)
Shorea robusta, Adina cordifolia, Syzygium cumini, Mallotus philippensis, Callicarpa macrophylla, Murraya koenigii, Clerodendrum viscosum, Helecteres isora, Mitragyna parviflora, Maghania macrophylla, Grewia asiatica, Zizyphus mauritiana, Carissa spinarum, Aegle marmelos, Tectona granids, Ficus semicordata, Acacia catechu, Terminalia bellerica, T. arjuna etc
Riparian forests Acacia catechu and Dalbergia sissoo and associates like Trewia nudiflora, Mallotus philippensis etc along the shoreline.
Terai
Grasslands Saccharum benghalensis, Phragmites karka, Vetiveria zizanoides, Cymbopogon flexuosus, Desmostachya bipinnata, Themeda arundinacea, Dichanthium annulatum, etc
Sal&mixed forests (scattered)
Lagerstroemia parviflora, Miliusa velutina, Cassia fistula, Buchanania latifolia, Diospyros tomentosa, Dillenia entagyna, Bauhina vahlii, Milletia extensa, Clerodendurm viscosum, etc
Gangetic plains
Dry thorny forests
Ziziphus xylocarpus, Z. mauritiana, Z. mummularia, Butea monosperma, Calotropis procera, Prosopis spicigera, etc.
Bundelkhand Dry deciduous forests (mixed/ thorny)
Terminalia bellerica, T. elliptica, Tectona grandis, Bombax ceiba, Cochlospermum religiosum, Diospyros melanoxylon, Lagerstroemia parviflora, Acacia catehu, Calotropis procera, Rhynchosia minima, Mucuna pruriens, Tinsopora cordifolia, Dioscorea hispida, Ziziphus xylocarpus, Prosopis spicigera, Butea monosperma, Acacia nilotica, Gardenia spinosa, etc
In addition to the terrestrial habitats mentioned above, the wetlands spread across the State are repositories of biodiversity. The large network of wetlands covers an area of over 3,200 km2 in the rainy season- including both stagnant and running waters. Some wetlands are contributions of the mighty rivers in the plains and many dry out in the summer months. Of the 25 important bird area sites identified in the State, 18 are wetland sites14. Thirteen of the State’s 25 PAs are wetland sites, and though small in area these sites are critical habitats for water birds, both migratory and breeding. Stretches of the rivers are home to the endangered Gangetic dolphin and two crocodile species- Gharial (Gavialis gangeticus) and Muggar (Crocodylus palustris). The freshwater wetlands are thus a critical ecological endowment of the State.
13 Mudgal & Hajra (1999) Floristic Diversity and Conservation Strategies in India. Uttar Pradesh. Vol. III. Bot.Survey of
India; NBSAP Team (2002) UP Biodiversity Strategy & Action Plan. 14 Islam &Rahmani, A. 2004 Important Bird Areas in India: Priority sites for conservation. Bombay Natural History
Society.
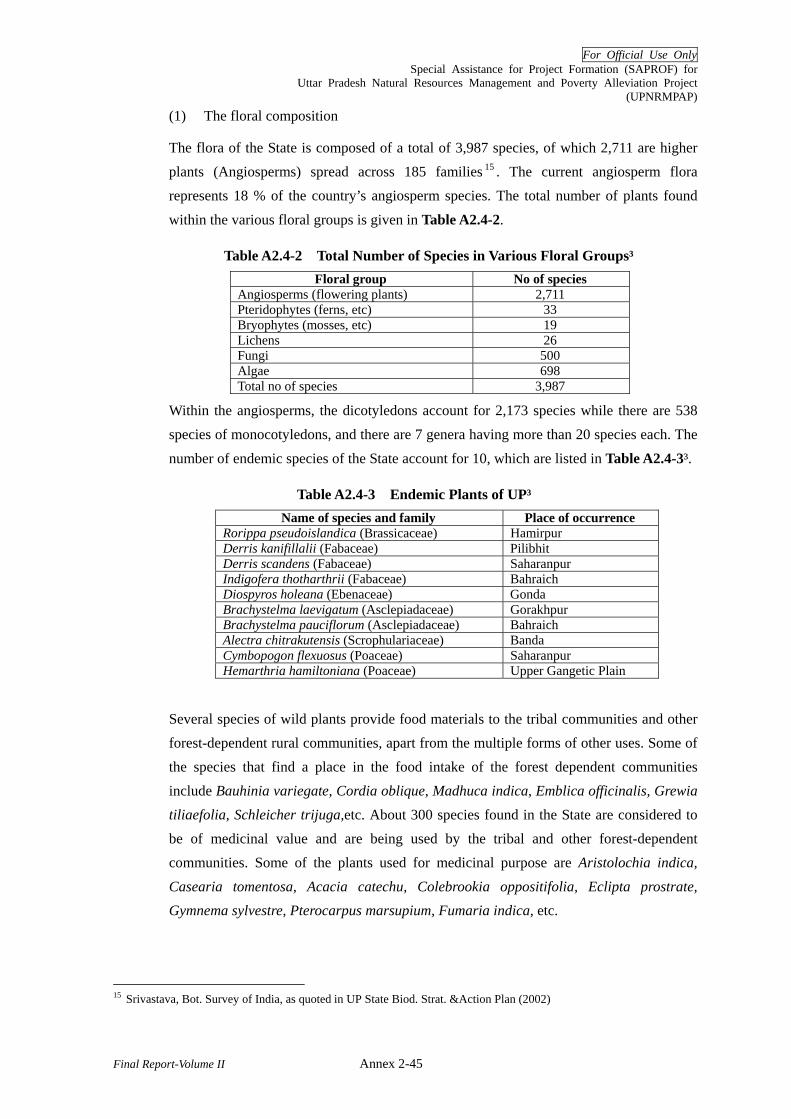
For Official Use Only Special Assistance for Project Formation (SAPROF) for
Uttar Pradesh Natural Resources Management and Poverty Alleviation Project (UPNRMPAP)
Final Report-Volume II Annex 2-45
(1) The floral composition
The flora of the State is composed of a total of 3,987 species, of which 2,711 are higher plants (Angiosperms) spread across 185 families 15 . The current angiosperm flora represents 18 % of the country’s angiosperm species. The total number of plants found
within the various floral groups is given in Table A2.4-2.
Table A2.4-2 Total Number of Species in Various Floral Groups³ Floral group No of species
Angiosperms (flowering plants) 2,711 Pteridophytes (ferns, etc) 33 Bryophytes (mosses, etc) 19 Lichens 26 Fungi 500 Algae 698 Total no of species 3,987
Within the angiosperms, the dicotyledons account for 2,173 species while there are 538 species of monocotyledons, and there are 7 genera having more than 20 species each. The
number of endemic species of the State account for 10, which are listed in Table A2.4-3³.
Table A2.4-3 Endemic Plants of UP³ Name of species and family Place of occurrence
Rorippa pseudoislandica (Brassicaceae) Hamirpur Derris kanifillalii (Fabaceae) Pilibhit Derris scandens (Fabaceae) Saharanpur Indigofera thotharthrii (Fabaceae) Bahraich Diospyros holeana (Ebenaceae) Gonda Brachystelma laevigatum (Asclepiadaceae) Gorakhpur Brachystelma pauciflorum (Asclepiadaceae) Bahraich Alectra chitrakutensis (Scrophulariaceae) Banda Cymbopogon flexuosus (Poaceae) Saharanpur Hemarthria hamiltoniana (Poaceae) Upper Gangetic Plain
Several species of wild plants provide food materials to the tribal communities and other forest-dependent rural communities, apart from the multiple forms of other uses. Some of the species that find a place in the food intake of the forest dependent communities include Bauhinia variegate, Cordia oblique, Madhuca indica, Emblica officinalis, Grewia tiliaefolia, Schleicher trijuga,etc. About 300 species found in the State are considered to be of medicinal value and are being used by the tribal and other forest-dependent communities. Some of the plants used for medicinal purpose are Aristolochia indica,
Casearia tomentosa, Acacia catechu, Colebrookia oppositifolia, Eclipta prostrate, Gymnema sylvestre, Pterocarpus marsupium, Fumaria indica, etc.
15 Srivastava, Bot. Survey of India, as quoted in UP State Biod. Strat. &Action Plan (2002)

For Official Use Only Special Assistance for Project Formation (SAPROF) for
Uttar Pradesh Natural Resources Management and Poverty Alleviation Project (UPNRMPAP)
Final Report-Volume II Annex 2-46
(2) The Fauna
The mammalian fauna totalling 56 species includes some of the charismatic animals of the subcontinent. The Terai is an important home for the endangered tiger, where the other mega-mammals leopard, Asian elephant, sloth bear, single horned rhino are also found. The Katarniaghat wildlife sanctuary in Bahraich district has the only natural population of the rhino in the country after the Kaziranga national park in Assam, while the Dudhwa national park in Kheri district has a re-introduced population. In UP’s grasslands ungulate species i.e., blackbuck, chinkara (Gazella gazella) and bluebull, and deer species such as swamp deer, sambar deer, and spotted deer are found. The endangered Gangetic dolphin has its critical refuge in the waters of the State. Population counts of the key mammalian
species are given in Table A2.4-4.
Table A2.4-4 Populations of Key Mammals of UP 2001&2003
Name of species 2001 2003 Tiger (Panthera tigris) 284 283 Leopard (Panthera pardus) 207 208 Asian elephant (Elephas maximus) 143 144
Source: Forest Statistics 2003, UPFD
Eight mammalian species found in the State are regarded as endangered or critically
endangered (Table A2.4.5).
Table A2.4-5 Endangered Mammals in UP Name of Species Name of Species Cervus duvaucelli (Swamp deer) Panthera tigris (Tiger) Cuon alpinus (Wild dog) Panthera pardus (Leopard) Marmota bobak (Bobak’s marmot) Platanista gangetica (Gangetic dolphin) Moschus chrysogaster (Musk deer) Elephas maximus (Asian elephant)
Source: IUCN/SSC Red List Programme
The avifauna of the State comprises of 552 species16, which is reflection of the diversity of habitats spread across the State. This represents a 44.8 % of the bird species of the country (totalling 1,232 species). A large number of these are winter migrants to the extensive network of wetlands. The State is also home to critical populations of species such as Sarus crane, Swamp francolin and Bengal florican. Rahmani and Islam² list 25 species of the State facing various levels of threat, including three critically endangered vulture species. The key bird species found in different habitats, represented in protected areas.
The reptilian fauna of the State is composed of 47 species, including the crocodiles Gharial (Gavialis gangeticus) and Muggar (Crocodylus palustris) and 16 species of
16 UPFD 2005. Birds of Uttar Pradesh: a check-list.

For Official Use Only Special Assistance for Project Formation (SAPROF) for
Uttar Pradesh Natural Resources Management and Poverty Alleviation Project (UPNRMPAP)
Final Report-Volume II Annex 2-47
turtles. The diversity of turtles includes the endangered red-crowned roofed turtle (Kachuga kachuga). There are 19 amphibian species in the State while the fish fauna is composed of 79 species. The invertebrate groups, by far, outnumber the vertebrates both in diversity and population size but the information available is scanty.
4.2. Protected Areas
The protected area (PA) network of the State includes most of the representative biodiversity sites and totals 25 sites covering 5,734.16 km2 of area, which consist of 24 sanctuaries and one national park. Thirteen of the protected areas are small wetland sites of importance to the waterfowl, mainly spread across the Gangetic plains. No Community Reserve or Conservation Reserve has been established in the State. The PAs range in size from 2,073 km2 (Hastinapur) to 1.08 km2 (Patna). The protected areas represent 2.13 % of the area of the State which is a relatively low proportion when compared with the national coverage of 4.2 % and global coverage of about 12 %.
A profile of the protected areas of the State is given in Table A2.4-6 and a map of PAs in the State is shown in Figure A2.4-1. The PA sites cover the critical ecosystems and wildlife species. Management effectiveness of different PAs varies considerably, with the Dudhwa National Park, being a prime tiger habitat in the country, receiving high management priority. Most of the protected areas have human settlements in and around. Final notification of Sanctuary, after settlement of claims as per the Wildlife (Protection) Act 1972, is due for most of the sanctuaries while the final notification has been issued for two sites; settlement of claims is not required for five sites which were established on Reserve Forests, according to section 66.4 of the Act.
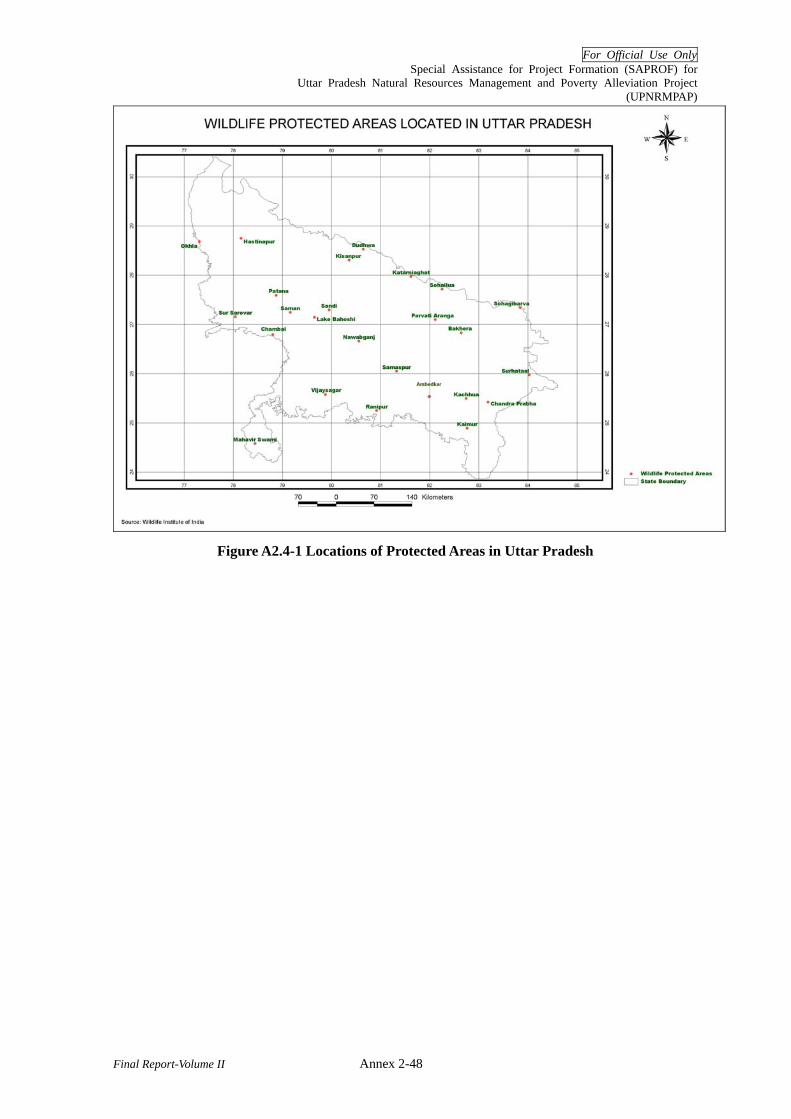
For Official Use Only Special Assistance for Project Formation (SAPROF) for
Uttar Pradesh Natural Resources Management and Poverty Alleviation Project (UPNRMPAP)
Final Report-Volume II Annex 2-48
Figure A2.4-1 Locations of Protected Areas in Uttar Pradesh
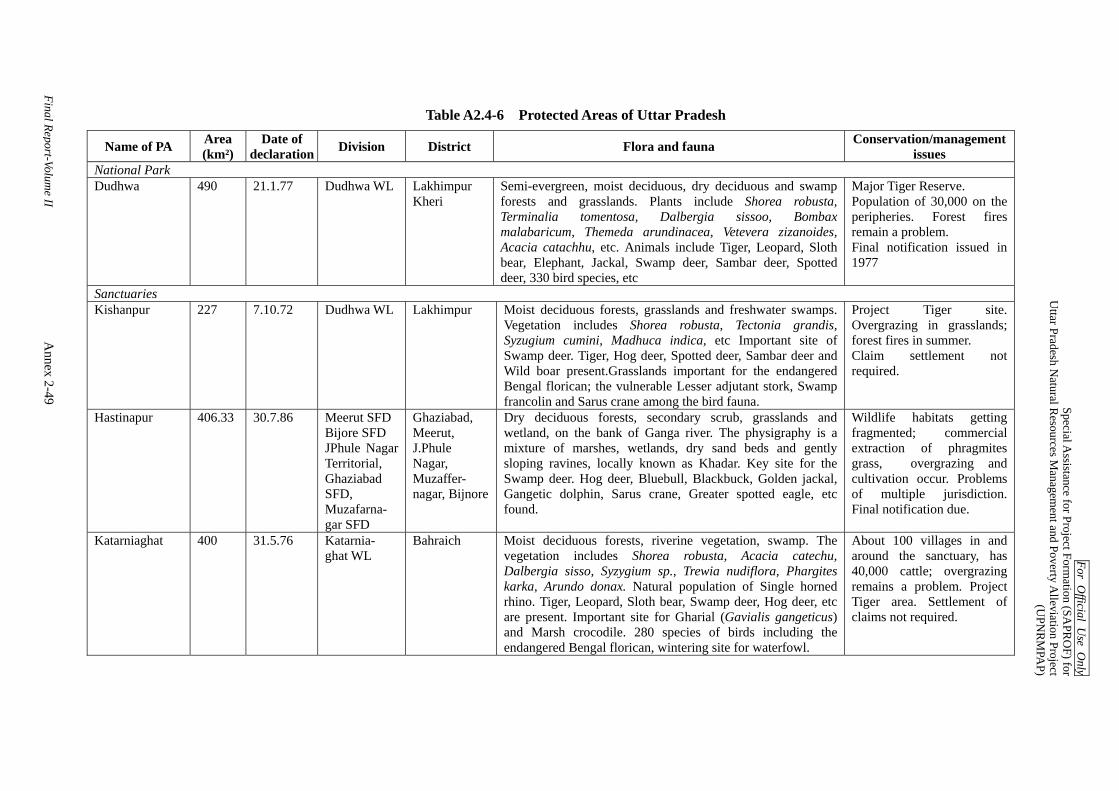
For Official U
se Only
Special Assistance for Project Form
ation (SAPR
OF) for
Uttar Pradesh N
atural Resources M
anagement and Poverty A
lleviation Project(U
PNR
MPA
P)
Final Report-Volume II
Annex 2-49
Table A2.4-6 Protected Areas of Uttar Pradesh
Name of PA Area (km²)
Date of declaration Division District Flora and fauna Conservation/management
issues National Park Dudhwa 490 21.1.77 Dudhwa WL Lakhimpur
Kheri Semi-evergreen, moist deciduous, dry deciduous and swamp forests and grasslands. Plants include Shorea robusta, Terminalia tomentosa, Dalbergia sissoo, Bombax malabaricum, Themeda arundinacea, Vetevera zizanoides, Acacia catachhu, etc. Animals include Tiger, Leopard, Sloth bear, Elephant, Jackal, Swamp deer, Sambar deer, Spotted deer, 330 bird species, etc
Major Tiger Reserve. Population of 30,000 on the peripheries. Forest fires remain a problem. Final notification issued in 1977
Sanctuaries Kishanpur 227 7.10.72 Dudhwa WL
Lakhimpur
Moist deciduous forests, grasslands and freshwater swamps. Vegetation includes Shorea robusta, Tectonia grandis, Syzugium cumini, Madhuca indica, etc Important site of Swamp deer. Tiger, Hog deer, Spotted deer, Sambar deer and Wild boar present.Grasslands important for the endangered Bengal florican; the vulnerable Lesser adjutant stork, Swamp francolin and Sarus crane among the bird fauna.
Project Tiger site. Overgrazing in grasslands; forest fires in summer. Claim settlement not required.
Hastinapur 406.33 30.7.86 Meerut SFD Bijore SFD JPhule Nagar Territorial, Ghaziabad SFD, Muzafarna- gar SFD
Ghaziabad, Meerut, J.Phule Nagar, Muzaffer- nagar, Bijnore
Dry deciduous forests, secondary scrub, grasslands and wetland, on the bank of Ganga river. The physigraphy is a mixture of marshes, wetlands, dry sand beds and gently sloping ravines, locally known as Khadar. Key site for the Swamp deer. Hog deer, Bluebull, Blackbuck, Golden jackal, Gangetic dolphin, Sarus crane, Greater spotted eagle, etc found.
Wildlife habitats getting fragmented; commercial extraction of phragmites grass, overgrazing and cultivation occur. Problems of multiple jurisdiction. Final notification due.
Katarniaghat 400 31.5.76 Katarnia- ghat WL
Bahraich Moist deciduous forests, riverine vegetation, swamp. The vegetation includes Shorea robusta, Acacia catechu, Dalbergia sisso, Syzygium sp., Trewia nudiflora, Phargites karka, Arundo donax. Natural population of Single horned rhino. Tiger, Leopard, Sloth bear, Swamp deer, Hog deer, etc are present. Important site for Gharial (Gavialis gangeticus) and Marsh crocodile. 280 species of birds including the endangered Bengal florican, wintering site for waterfowl.
About 100 villages in and around the sanctuary, has 40,000 cattle; overgrazing remains a problem. Project Tiger area. Settlement of claims not required.

For Official U
se Only
Special Assistance for Project Form
ation (SAPR
OF) for
Uttar Pradesh N
atural Resources M
anagement and Poverty A
lleviation Project(U
PNR
MPA
P)
Final Report-Volume II
Annex 2-50
Name of PA Area (km²)
Date of declaration Division District Flora and fauna Conservation/management
issues Sohelwa 452.47 14.11.88 Sohelwa WL Balrampur,
Shrvasti Mainly dry Sal forests. Among the plant species are Shorea robusta, Syzygium cumini, Acacia catechu, etc. Animals include Tiger, Leopard, Sambhar deer, Spotted deer, Hog deer, Bluebull, etc; important site for Swamp francolin.
Grazing pressure, agricultural encroachments. Claims settlement not required
Sohagibarwa 428 29.6.87 Sohagibarwa WL
Maharaj- gunj
The habitats include moist deciduous forests, grasslands, canebrakes, swamps and wetlands. Shorea robusta and Moghania chappar are widespread species while Rauwolfia serpentina, and Desmodium latifolium are among the rare. Tiger, Leopard, Spotted deer, Sambar deer, Hog deer, Barking deer, Black-necked stork, Sarus crane etc are found. Has loose corridor with Chitwan National Park of Nepal and Valmiki Tiger Reserve of Bihar.
Pressure from villages, overgrazing. Final notification in progress.
Bakhira 29 8.5.90 Sohagibar- wa WL
Sant Kabir Nagar
Wetland of importance to waterfowls. Key species include Red crested prochard, Northern pintail duck, Northern shoveller. Breeding populations of Purple moorhen and Swamphen. 23 species of waterfowl recorded.
24 villages on the peripheries. Intensive fishing and draining of water for agriculture. Final notification due.
Parvati Arga 10.84 23.5.90 Sohagibar- wa WL
Gonda Interconnected Parvati and Aranga water bodies, home to a large number of water birds, large population of Sarus crane.
Agriculture expansion growing to the sanctuary area. Final notification due.
Chandraprabha 78 25.5.57 Kashi WL Chandauli Dry deciduous forests and woodlands. Key plant species are Diospyros tomentosa, Acacia catechu, Dalbergia sissoo, Madhuca latifolia, etc. The fauna includes Blackbuck, Spotted deer, Sambar deer, Bluebull, Chinkara (Gazella gazelle), etc
Lions introduced in the 50s, failed after initial success. Claim settlement not needed.
Kachhua 7 km (river length)
21.12.89 Kashi WL Varanasi Established on a 7 km long stretch of the Ganga as a release site of Ganges soft-shelled turtle captive-reared at the adjacent breeding centre. The key fauna also includes Gangetic dolphin, wintering water birds.
With the exhaustion of funds the captive rearing/release was stopped. Final declaration due.
Jayprakash Narayan (Surhataal)
34.32 27.3.91 Kashi WL Balia Rainfed lake surrounded by agricultural villages, important for water birds. Significant site for Sarus crane.
Water hyacinth infestation, drainage of water for irrigation. Final notification due.

For Official U
se Only
Special Assistance for Project Form
ation (SAPR
OF) for
Uttar Pradesh N
atural Resources M
anagement and Poverty A
lleviation Project(U
PNR
MPA
P)
Final Report-Volume II
Annex 2-51
Name of PA Area (km²)
Date of declaration Division District Flora and fauna Conservation/management
issues Kaimur 501 10.8.92 Kaimur WL Mirzapur,
Sonbhadra Dry deciduous and scrub forests with savannah patches. Tiger, Leopard, Sloth bear, Sambar deer, Blackbuck, Four horned antelope, etc are among the major animals.
Weeds Lantana and Cassia tora widespread; overgrazing. Final notification due.
Ranipur 230 24.1.77 Kaimur WL Chitrakoot Dry deciduous forests. Species include Zizyphus xylopyrus, Anogeissus latifolia, Terminalia tomentosa. Acacia catechu, etc. Key animals found are Tiger, Leopard, Blackbuck, Spotted deer, etc.
Overgrazing and forest fires. Final notification due.
Mahavirswamy 5 25.3.77 Kaimur WL Lalitpur Dry mixed deciduous and dry teak forests. Plants include Madhuca indica, Diospyros melanoxylon. Leopard, Hyena, and Sambar deer among the animals.
Proposal alive for Sanctuary expansion; distant Divisional office. Illegal tree felling. Claim settlement not required
Vijay Sagar 2.62 26.6.90 Kaimur WL Mahoba Wetland of importance to water birds, about 100,000 birds of 223 species listed in one season.
Distance of the Divisional office; no demarcation of boundary. Final notification due.
National Chambal
431.22 20.1.79 National Chambal WL
Etawah, Agra Part of a larger sanctuary covering contiguous stretches of River Chambal in Rajastan and Madhya Pradesh. 180 km stretch of the river. Focal species are Gharial (Gavialis gangeticus) and Gangetic dolphin. Smooth Indian otter, Bluebull, Wildboar, Chinkara (Gazella bennettii), several species of turtles, Palla’s fish eagle, Sarus crane, waterfowls also found.
Illegal sand mining occurs, hide out of bandits (which prevents tourists),irrigation canals reduce water level in summer. Final notification due.
Okhla 4 5.5..90 National Chambal WL
Gautambu- dha Nagar
Reservoir created on Yamuna due to a barrage. Large number of water birds including Bar-headed goose, Red-crested pochard, Common shelduck, several species of gulls, Black ibis, Greater flamingo, sandpipers, Red-headed falcon, Black francolin, lapwings, etc.
Heavy pollution of the river, removal of shoreline vegetation, expanding urbanisation. Final notification due.
Patna 1.08 22.12.90 National Chambal WL
Etah Rainfed wetland; doted with date palms in the central part. 180 species of birds recorded, mostly water birds including 18 anatidae species. Birds include Comb duck, Cotton teal, Spot billed duck, Rosy pelican, Lesser flamingo etc.
Infestation by water hyacinth and ipomea. Fona; notification due.

For Official U
se Only
Special Assistance for Project Form
ation (SAPR
OF) for
Uttar Pradesh N
atural Resources M
anagement and Poverty A
lleviation Project(U
PNR
MPA
P)
Final Report-Volume II
Annex 2-52
Name of PA Area (km²)
Date of declaration Division District Flora and fauna Conservation/management
issues Sur Sarovar 4.03 27.3.91 National
Chambal WLAgra Wetland having about 30,000 water birds and large heronries.
The birds include Grey heron, Northern pintail duck, Wigeon, Shoveller, four species of storks, Sarus crane, Eurasian spoonbill, White ibis, etc
Water hyacinth widespread. Land tenure with Irrigation Dept. Final notification in progress
Saman 5.26 23.5.90 National Chambal WL
Mainpuri Freshwater lake that dries up in summer, important for waterfowl congregation. Birds include the Sarus crane, Common teal, Northern pintail duck, White pelican, Night heron, etc.
Eight villages inside and several on the periphery. Infestation by water hyacinth. Final notification due.
Sandi 3.08 8.5.90 Endangered Species Programme
Hardoi Freshwater swamp important for water birds. Key birds are Sarus crane, Brahmini duck, Red crested porchard, Shoveller, Painted stork, Black necked stork, etc
Part of the area in private ownership; some areas being converted to farmland. Final notification due.
Lakh Bahoshi 80.23 31.3.88 Endangered Species Programme
Kanauj Lakh and Bahosi water bodies, surrounding swamps and forest patch, holding over 50,000 water birds of 240 species. These include the Greater spotted eagle, Black necked stork, Sarus crane, Bar headed goose, etc
A large portion of the area is private land. Bohosi infested with ipomia. Final notification due.
Nawabganj 2.24 7.8.84 Endangered Species Programme
Unnao Wetland holding water birds of about 200 species, including Darter, Black crowned night heron, Eurasian spoonbill, Pheasant tailed jacana, Coot, etc; breeding site for Sarus crane
Water hyacinth. Stoppage of grazing has negatively affected the habitat. Rain-dependent. Final notification due.
Samaspur 7.99 10.8.87 Endangered Species Programme
Rai Barely A network of 7 small lakes, perennial. Includes 110 bird species, numbering over 80,000 birds. Key species are Black necked stork, Palla’s fish eagle, Sarus crane, White ibis, etc.
Water hyacinth infestation, eutrophi -cation of the lakes. Final notification due.
Ambedkar 4.27 30.1.03 Pratapgarh Territorial
Pratapgarh A system of four small lakes, important site for water birds. Final notification issued in 2003 itself.
Sources: Progress on settlement in National Parks and Sanctuaries. Submission made by UPFD to Supreme Court (2004), and data provided by the Chief Wildlife Warden (used for the size of the PA, date of declaration and status of final notification) Islam, M Z and Rahmani, A. (2004). Important Bird Areas in India: Priority sites for conservation. BNHS and Birdlife International, Mumbai. NBSAP Team (2002) Biodiversity Strategy and Action Plan, Uttar Pradesh. Prepared under the National Biodiversity Strategy and Action Plan process. Rodgers WA and Panwar HS (1988) Planning a Protected Area Network in India. Vol II. Wildlife Institute of India. Tata Energy Research Institute (2002?) Strategies and Action Plan for Biodiversity Conservation in Uttar Pradesh. (three volumes) Report submitted to UPFD. World Protected Area Database of WCMC-UNEP www.unep-wcmc.org
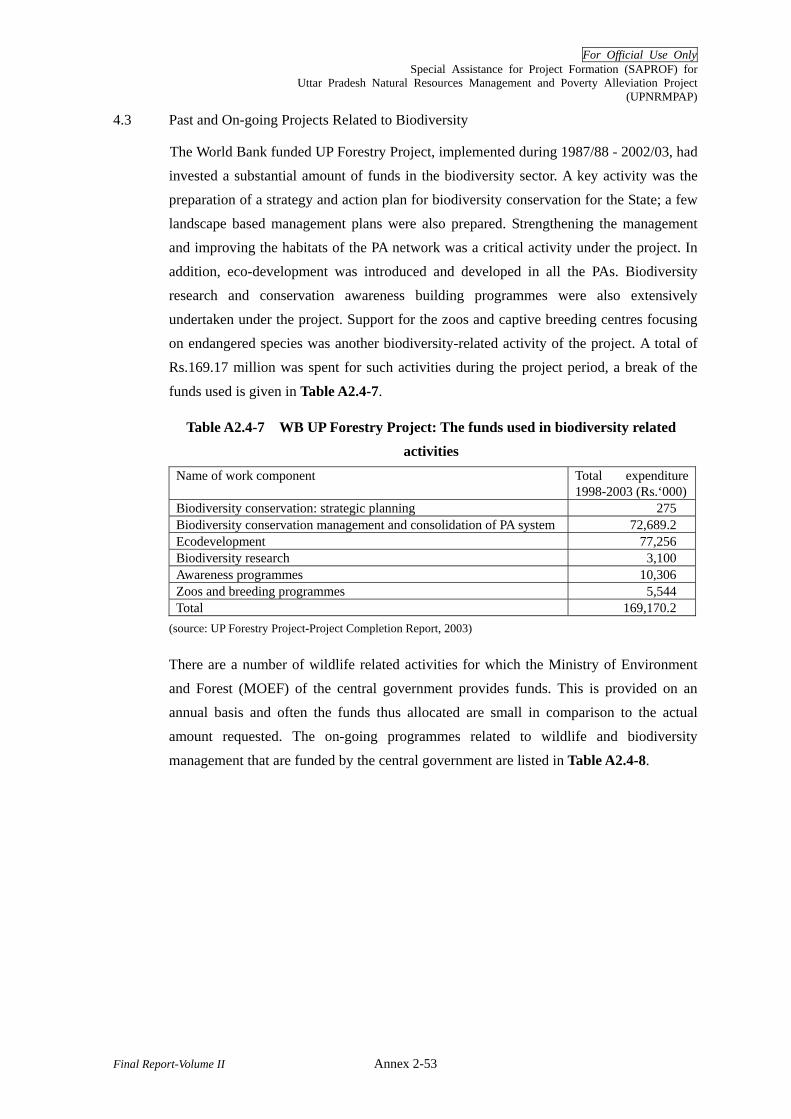
For Official Use Only Special Assistance for Project Formation (SAPROF) for
Uttar Pradesh Natural Resources Management and Poverty Alleviation Project (UPNRMPAP)
Final Report-Volume II Annex 2-53
4.3 Past and On-going Projects Related to Biodiversity
The World Bank funded UP Forestry Project, implemented during 1987/88 - 2002/03, had invested a substantial amount of funds in the biodiversity sector. A key activity was the preparation of a strategy and action plan for biodiversity conservation for the State; a few landscape based management plans were also prepared. Strengthening the management and improving the habitats of the PA network was a critical activity under the project. In addition, eco-development was introduced and developed in all the PAs. Biodiversity research and conservation awareness building programmes were also extensively undertaken under the project. Support for the zoos and captive breeding centres focusing on endangered species was another biodiversity-related activity of the project. A total of Rs.169.17 million was spent for such activities during the project period, a break of the
funds used is given in Table A2.4-7.
Table A2.4-7 WB UP Forestry Project: The funds used in biodiversity related activities
Name of work component Total expenditure 1998-2003 (Rs.‘000)
Biodiversity conservation: strategic planning 275 Biodiversity conservation management and consolidation of PA system 72,689.2 Ecodevelopment 77,256 Biodiversity research 3,100 Awareness programmes 10,306 Zoos and breeding programmes 5,544 Total 169,170.2
(source: UP Forestry Project-Project Completion Report, 2003)
There are a number of wildlife related activities for which the Ministry of Environment and Forest (MOEF) of the central government provides funds. This is provided on an annual basis and often the funds thus allocated are small in comparison to the actual amount requested. The on-going programmes related to wildlife and biodiversity
management that are funded by the central government are listed in Table A2.4-8.

For Official Use Only Special Assistance for Project Formation (SAPROF) for
Uttar Pradesh Natural Resources Management and Poverty Alleviation Project (UPNRMPAP)
Final Report-Volume II Annex 2-54
Table A2.4-8 Ongoing Programmes related to Wildlife, funded by Central Government
Sources: information supplied by UPFD, interviews with UPFD officials, MoEF reports describing the respective programmes.
* anticipated in the middle of March 2007
5 Forest Management and Forestry
5.1 Forest Management System
(1) Working Plan
Working plans are the basis of forest management of forest areas in India. Under the Supreme Court orders 1996, no forest divisions can work without the prior approval of the working plan by the Government of India (GOI). Currently, working plans are prepared in accordance with the National Working Plan Code 2002.
Traditionally, working plans were formulated for achieving sustained volume yield from forest. However current working plans have shifted more toward improving conservation and development of forest resources and clear-felling of forest area is not prescribed in any of the work plans due to the implication of the ban on all green natural forest felling.
The working plan is normally effective for 10 years in Uttar Pradesh. According to the
Amount spent during 2002-3 to 2006-7 (Rs million)Name of programme Description of programme 02-3 03-4 04-5 05-6 06-7* Totals
Development of PAs
Allocation based on submission of Annual Plan of Operation for PAs. Activities include PA habitat improvement, strengthening management and ecodevelopment
12.97 17.74 28.81 34.67 30.65 124.84
Project Tiger For the Tiger Reserve consisting of Dhudwa, Katarniaghat and Kishanpur. Activities to improve tiger habitat improvement and to strengthen protection measures.
4.27 24.57 26.56 24.25 26.92 106.57
Project Elephant
Started during 2004-5 for the Elephant Reserve (not a legal but management designation) consisting of Bijnor SFD, Shivalik TD and Nazibabad TD. Activities to improve habitat, corridor development, addressing animal-human conflicts, strengthening protection. Implementation under the supervision of the Chief Wildlife Warden.
0 0 1.15 0 0.62 1.77
National Wetlands Conservation Programme
Started during 2006-7. Activities for wetland habitat improvement, and for protection of birds. Allocation based on submission of Annual Plan of Operation. Sites include wetlands other than sanctuaries as well.
0 0 0 27.39 27.39

For Official Use Only Special Assistance for Project Formation (SAPROF) for
Uttar Pradesh Natural Resources Management and Poverty Alleviation Project (UPNRMPAP)
Final Report-Volume II Annex 2-55
working plan circle office, there are 68 working plans covering 75 forest divisions in the State, and currently there are 50 working plans under sanction and effective in the State. Out of these, 17 working plans are for 17 territorial divisions covering an area of 906,752.2 ha, 30 working plans are for 30 social forestry divisions covering an area of
124,929.05 ha, and the remaining 3 working plans cover 3 wildlife division. Table A2.5-1 describes status of the working plans by forest divisions. Details of working plans are
shown in Attachment A2.5-1.
Table A2.5-1 Current Status of Working Plans (WP) in Uttar Pradesh Current Status Working Plan Name (Forest Division)
Working Plans under Sanction ( 50 Working Plans )
Shevalik, Sahranpur, Muzzafar Nagar, Bijnore (Social F), Nazibabad (includes J.P. Nagar), Moradabad, Rampur, Meerut, Gaziabad, Bulandshar, Gautam Buddh Nagar, Pilibhit, Pilibhit (Social F), Aligarh (includes Mahamaya Nagar), Mathura, Etah, Firozabad, Agra, Mainpuri, North Kheri , South Kheri, Sitapur, Hardoi, Avadh, Unnao, Raiberally, Bahraich, Shrawasti, Gonda, Shrawasti, Barabanki, Farokabad, Etawa, Kanpur, Kanpur Dehat, Hamirpur, Mahoba, Banda, Chitrakoot, Siddhart Nagar, Basti, Ballia, Jaunpur, Varanasi, Ghazipur, Badohi, Mirzapur, Obra, Sonbhadra, Rainukoot, Katarniaghat WL, Kashi WL
Expired Working Plans ( 18 Working Plans)
Bareilly, Badhau, Shajahan Pur, Faizabad (includes Amdekar Nagar), Sultanpur, Orai, Jhansi, Lallitpur, Gorakhpur, Pandrauna, Deoria (Deavariya), Azamgarh, Mau, Fathepur, Allahabad (includes Kaushambi), Pratapgarh, Sohelwa WL, Sohagibarnal WL
Divisions which Working Plan Status unknown ( 2 Divisions )
Dudhwa WL、Kaimur WL
Source: Working Plan Circle Office, UPFD..
Working plans in UP are generally regarded as “compilation of all of plans related to forestry management and operations in concerned forest divisions”, rather than “plan(s) formulated for concerned forest areas”. In this context, working plans for UP also includes plans for management and operations in non forest areas (i.e. social forestry). Plans and operations for both forest areas and non forest areas coexist in a single working plan sometimes without proper sorting/ distinction.
(2) Working Circle (WC)
In a working plan, a specific management practice for each of specific areas is prescribed as a working circle. The forest division at compartment-wise is allocated to different working circles, and each working circle is managed under a particular silvicultural treatment system. The working circles are broadly divided into main working circles and overlapping working circles. The main working circle prescribes certain treatment to single area, whereas the overlapping working circle covers more than one main working circle for which a common treatment is applicable. The prescriptions of the overlapping circles facilitate continuation of on going activities or strengthening the activities of the main working circles.

For Official Use Only Special Assistance for Project Formation (SAPROF) for
Uttar Pradesh Natural Resources Management and Poverty Alleviation Project (UPNRMPAP)
Final Report-Volume II Annex 2-56
Each of the working circles may be divided into “felling series” and then further into “coupes”, if necessary. However, most of the working circles in the State do not determine felling series or coupes, and rather recognize “forest compartments” and/or a “sub-compartments” as the lower unit for forestry operation since felling is limited due to the green fell ban.
The National Working Plan Code prescribes inclusion of following overlapping working circles, applicable over the whole division.
i) Plantation ii) NTFP (Separate WC for important NTFP as tendu leaf etc.) iii) Bamboo (if applicable) iv) Forest Protection (fire, illicit felling, encroachment, illegal mining, poaching,
jhumming (shifting cultivation) etc.) v) Joint Forest Management (JFM) vi) Wild Life Management
In addition to the main working circle and overlapping working circle, working plans of UP categorise another type of working circle called “partially overlapping circle”. The partially overlapping circle is a combination of the same type of both main working circle and overlapping working circle17; however this partially overlapping circle is causing confusions in calculation and understanding of forest areas even for some of UPFD staff. Based on the observation of SAPROF Study Team, quite few UPFD staff considered the partially overlapping circle as an analogy to the overlapping circle and when calculating forest areas, less attention was paid to main working circle part of such partially overlapping circle.
Furthermore, in UP, working circles are defined for non forest areas. These are mostly overlapping or partially overlapping circles such as urban forestry, and forestry extension.
Though, names, definitions and areas for existing working circles are described in the respective working plans, currently such information is not properly compiled at the state level, therefore, it was not possible for the SAPROF Study team to obtain comprehensive state-wise working circle information (particularly of working circle-wise forest area information sorted according to main working circle, overlapping circle, and partially overlapping circle) during its field study.
17 For example, if there is a 10,000ha of “plantation partially overlapping working circle”, and 2,000 ha is “plantation main working circle” (forest area solely for plantation), then he remaining 8,000ha is “plantation overlapping working circle (which overlaps with other main working circles).
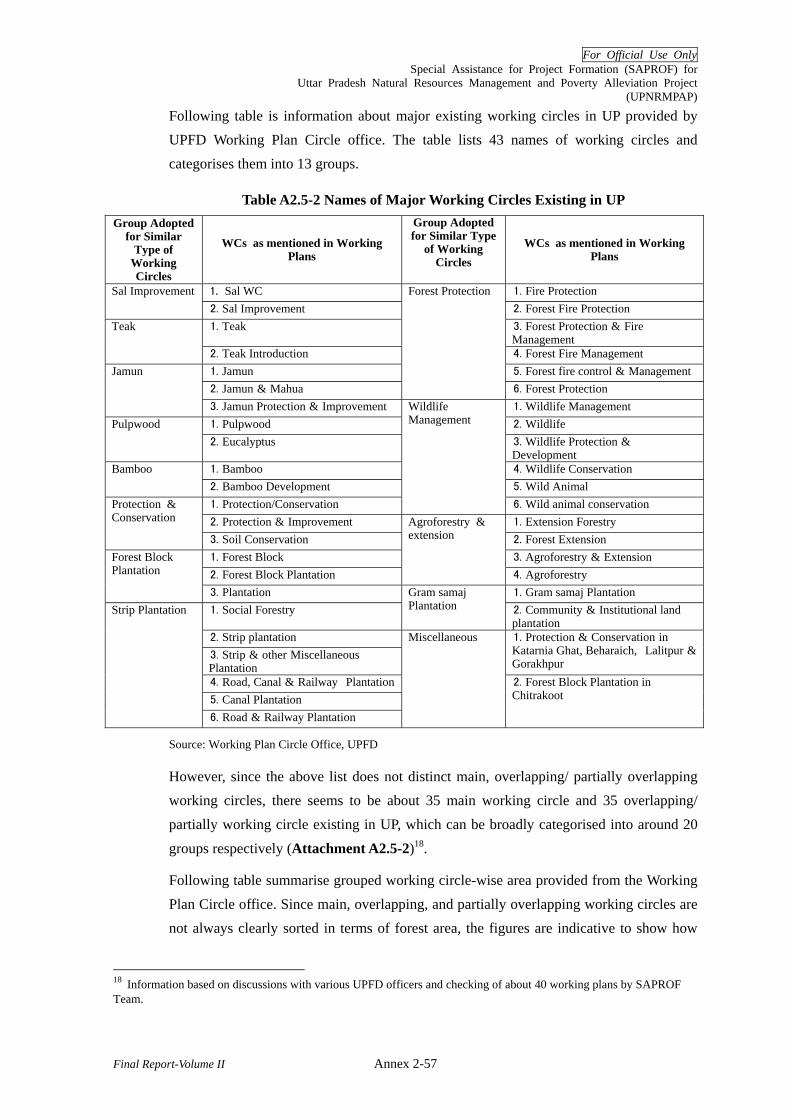
For Official Use Only Special Assistance for Project Formation (SAPROF) for
Uttar Pradesh Natural Resources Management and Poverty Alleviation Project (UPNRMPAP)
Final Report-Volume II Annex 2-57
Following table is information about major existing working circles in UP provided by UPFD Working Plan Circle office. The table lists 43 names of working circles and categorises them into 13 groups.
Table A2.5-2 Names of Major Working Circles Existing in UP Group Adopted
for Similar Type of
Working Circles
WCs as mentioned in Working Plans
Group Adopted for Similar Type
of Working Circles
WCs as mentioned in Working Plans
1. Sal WC 1. Fire Protection Sal Improvement 2. Sal Improvement 2. Forest Fire Protection 1. Teak 3. Forest Protection & Fire
Management Teak
2. Teak Introduction 4. Forest Fire Management 1. Jamun 5. Forest fire control & Management 2. Jamun & Mahua
Forest Protection
6. Forest Protection Jamun
3. Jamun Protection & Improvement 1. Wildlife Management 1. Pulpwood 2. Wildlife Pulpwood 2. Eucalyptus 3. Wildlife Protection &
Development 1. Bamboo 4. Wildlife Conservation Bamboo 2. Bamboo Development 5. Wild Animal 1. Protection/Conservation
Wildlife Management
6. Wild animal conservation 2. Protection & Improvement 1. Extension Forestry
Protection & Conservation
3. Soil Conservation 2. Forest Extension 1. Forest Block 3. Agroforestry & Extension 2. Forest Block Plantation
Agroforestry & extension
4. Agroforestry Forest Block Plantation
3. Plantation 1. Gram samaj Plantation 1. Social Forestry
Gram samaj Plantation 2. Community & Institutional land
plantation 2. Strip plantation 3. Strip & other Miscellaneous Plantation
1. Protection & Conservation in Katarnia Ghat, Beharaich, Lalitpur & Gorakhpur
4. Road, Canal & Railway Plantation5. Canal Plantation
Strip Plantation
6. Road & Railway Plantation
Miscellaneous
2. Forest Block Plantation in Chitrakoot
Source: Working Plan Circle Office, UPFD
However, since the above list does not distinct main, overlapping/ partially overlapping working circles, there seems to be about 35 main working circle and 35 overlapping/ partially working circle existing in UP, which can be broadly categorised into around 20
groups respectively (Attachment A2.5-2)18.
Following table summarise grouped working circle-wise area provided from the Working Plan Circle office. Since main, overlapping, and partially overlapping working circles are not always clearly sorted in terms of forest area, the figures are indicative to show how
18 Information based on discussions with various UPFD officers and checking of about 40 working plans by SAPROF Team.
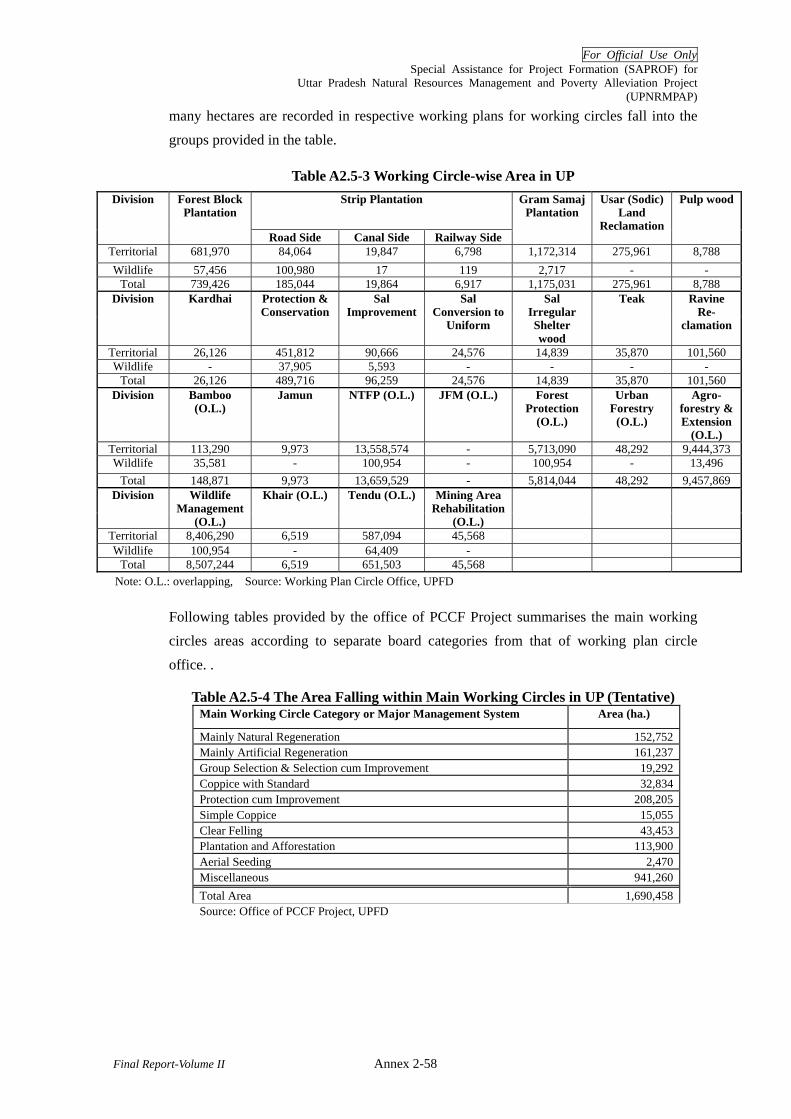
For Official Use Only Special Assistance for Project Formation (SAPROF) for
Uttar Pradesh Natural Resources Management and Poverty Alleviation Project (UPNRMPAP)
Final Report-Volume II Annex 2-58
many hectares are recorded in respective working plans for working circles fall into the groups provided in the table.
Table A2.5-3 Working Circle-wise Area in UP Strip Plantation Division
Forest Block Plantation
Road Side Canal Side Railway Side
Gram Samaj Plantation
Usar (Sodic) Land
Reclamation
Pulp wood
Territorial 681,970 84,064 19,847 6,798 1,172,314 275,961 8,788 Wildlife 57,456 100,980 17 119 2,717 - -
Total 739,426 185,044 19,864 6,917 1,175,031 275,961 8,788 Division Kardhai Protection &
ConservationSal
ImprovementSal
Conversion to Uniform
Sal Irregular Shelter wood
Teak Ravine Re-
clamation
Territorial 26,126 451,812 90,666 24,576 14,839 35,870 101,560 Wildlife - 37,905 5,593 - - - -
Total 26,126 489,716 96,259 24,576 14,839 35,870 101,560 Division Bamboo
(O.L.)
Jamun
NTFP (O.L.) JFM (O.L.) Forest Protection
(O.L.)
Urban Forestry
(O.L.)
Agro- forestry & Extension
(O.L.) Territorial 113,290 9,973 13,558,574 - 5,713,090 48,292 9,444,373Wildlife 35,581 - 100,954 - 100,954 - 13,496
Total 148,871 9,973 13,659,529 - 5,814,044 48,292 9,457,869Division Wildlife
Management (O.L.)
Khair (O.L.) Tendu (O.L.) Mining Area Rehabilitation
(O.L.)
Territorial 8,406,290 6,519 587,094 45,568 Wildlife 100,954 - 64,409 -
Total 8,507,244 6,519 651,503 45,568 Note: O.L.: overlapping, Source: Working Plan Circle Office, UPFD
Following tables provided by the office of PCCF Project summarises the main working circles areas according to separate board categories from that of working plan circle office. .
Table A2.5-4 The Area Falling within Main Working Circles in UP (Tentative) Main Working Circle Category or Major Management System Area (ha.)
Mainly Natural Regeneration 152,752 Mainly Artificial Regeneration 161,237 Group Selection & Selection cum Improvement 19,292 Coppice with Standard 32,834 Protection cum Improvement 208,205 Simple Coppice 15,055 Clear Felling 43,453 Plantation and Afforestation 113,900 Aerial Seeding 2,470 Miscellaneous 941,260 Total Area 1,690,458 Source: Office of PCCF Project, UPFD
For Official Use Only Special Assistance for Project Formation (SAPROF) for
Uttar Pradesh Natural Resources Management and Poverty Alleviation Project (UPNRMPAP)
Final Report-Volume II Annex 2-59
(3) On - Going Forest Management Operation
1) Major on-going forest management operations
The major forest management operation currently undertaken by UPFD is to regenerate forests through artificial and/or natural regeneration.
From the view points of the state forest policy and other relevant frameworks, the forest management in the forest areas of the State may be broadly categorised into the following four main areas.
a) Sustainable development of production forest b) Improvement of open forest - Improve existing forests (density and quality) c) Rehabilitation and Creation of the forest area - Afforest on degraded land - Increase forest cover and productivity e) Conservation of biodiversity with emphasis on rare fauna and flora - Improve biodiversity and wildlife - Manage PAs
2) Technical Guideline
Nursery technologies (clonal multiplication, germination technique), planting technology, and natural regeneration technology are being developed/improved at research institutes. “Plantation Manual 2003” is a technical guideline for plantation activities being used within the State, and provides guidelines and standards for the following activities: i) nursery management; ii) urban plantation; iii) strip plantation; iv) block plantation; v) monitoring & evaluation; vi) assessment of survival rate; vii) miscellaneous (plantation and nursery record keeping). In addition working plans provide technical guidelines and standards which are applicable for forestry operations in the concerned areas.
3) Forestry Related Researches
The research wing of UPFD, including the State Forest Research Institute (SFRI), Kanpur, has been given the responsibility for undertaking the scientific research, development and application in forestry and allied natural resources. The research activities is aiming to developing appropriate technologies for efficient management and utilization of trees and other forest resources through increased availability of timbers / forest produces and their associated services for all the time. There are 13 research centres (5 in Sal region at Bareilly, 4 in Southern region at Kanpur, and 4 in Vindhyan region at Varanasi) in total under the research wing of UPFD. Research

For Official Use Only Special Assistance for Project Formation (SAPROF) for
Uttar Pradesh Natural Resources Management and Poverty Alleviation Project (UPNRMPAP)
Final Report-Volume II Annex 2-60
topics being conducted currently by the research wing of UPFD is summarised below.
On-going Research Topics 1. Genetic/Tree improvement of various forestry species. 2. Ex-situ conservation of medicinal plants and establishment of herbal gardens. 3. Development of disease resistant improved protocol for clonal propagation of
Shisham (Dalbergia sissoo) and Rudraksha (Elaeocarpus tuberculatus). 4. Extension and technology demonstration for in vitro clonal multiplication of
bamboo and Shisham and their establishment in UP. 5. Field trials for identifying new promising clones of Populus deltoides. 6. Selection, ex-situ conservation and evaluation of genetic resources of different
species of bamboo. 7. Development of technology for collection, processing and testing of the seeds of
the forestry species. 8. Research in mortality of Dalbergia sissoo .
Source: SFRI, UPFD
The past major research topics covered by the research wing of UPFD are listed below:
- Previous Topics: technologies (clonal multiplication, root trainers, seed supply, etc); and
- During UP Forestry Project: clonal technique, teak seedlings, natural regeneration of Sal forest, nursery and planting techniques of NFTP, standardization of advanced nursery technique, forestry extension services.
Details of research related activities of UPFD are described in Attachment A2.5-3.
(4) Achievement
1) Regeneration Operation
The year-wise natural regeneration achievement in the period 1994 to 2002 is given below. It is noteworthy to mention that majority of natural regeneration operation were conducted in Uttarakhand, formerly part of UP, and has extensive forest areas.
Table A2.5-5 Acheivement of Natural regeneration Year Ha
1994/95 34,416 1995/96 28,598 1996/97 34,909 1997/98 59,256 1998/99 58,188
1999/00* 3,273 2000/01* 5,168 2001/02* 3,402
* only in recasted UP, Source- UP Forest Statistics. 2003 (P39)
Sal Assisted Natural Regeneration (ANR) activity was implemented under the World Bank assisted Forestry Project. GOUP laid down the rules to apply appropriate and timely silvicultural treatments, including selective felling for maximizing economical and ecological returns from Sal forests (G.O. No.242/14

For Official Use Only Special Assistance for Project Formation (SAPROF) for
Uttar Pradesh Natural Resources Management and Poverty Alleviation Project (UPNRMPAP)
Final Report-Volume II Annex 2-61
dated 19-02-2001).The GO prescribes that only the Sal forest area that has more than 100 m3 standing volume should be selected for ANR and at least 6.5 m3 is available for felling. This GO also directs that 1/3 earning of income from the Sal ANR should be deposited in a separate “Forest Deposit Account” that is to be utilized for the further operation of SAL ANR. The Departmental Orders dated 04-05-2001 and 17-09-2001 lay down the guidelines19 to use this deposit fund.
2) Plantation
According to the available information, accumulated plantation area in the State has reached 1.44 million ha on forestland by UPFD and 0.65 million ha on other lands by other government agencies. Though these figures (prior to 1998/99) also include plantation areas in the current Uttarkhand and respective data for each state is not available, it is estimated that about the half of plantation achievement is implemented in the current UP. These records imply that an area equivalent to nearly 5 to 10% of the State’s geographical area has been intervened for plantation activities. From 1993/94 and onward an average annual total plantation achievement in the current UP was approximately 29,700ha. After 2002/03, annual plantation establishment by UPFD exceeded 20,000 ha and has been gradually increasing up to 58,232 ha by 2006/07. Seedling distribution has been conducted since 1993/94 and annual seedling distribution ranges between 100 and 420 million in number. The following table shows year-wise plantation achievement in the State.
Table A2.5-6 Year-wise Plantations Achievement in UP+ Total (ha.)
Year Forest Land (FD) (ha.)
On other land (ha.) Former UP Current UP
No. of seedlings planted (in
million) Upto1992/93 1,030,314 479,608 1,577,957 n/a 0 1993/94 22,175 36,954 59,129 25,393 409.7 1994/95 31,493 26,292 57,785 26,206 419.8 1995/96 32,000 27,140 59,140 32,144 311.8 1996/97 36,000 23,441 59,441 32,009 292.5 1997/98 29,000 17,247 46,247 25,625 264.4 1998/99 36,580 16,765 53,345 30,188 248.6 1999/00 19,155 8,336 27,491 27,491 213.3 2000/01 10,892 3,353 14,245 14,245 217.1 2001/02 12,839 4,508 17,347 17,347 131.5 Sub Total A 1,260,448 643,644 1,972,127 230,648 2,509.0 2002/03 23,037 - 23,037 123.8 2003/04 33,827 - 33,827 125.9 2004/05 31,458 - 31,458 203.6 2005/06 36,265 1,225* 37,490 267.9 2006/07 58,232 1,478* 59,710 302.2
19 The guidelines define prepration of 10-year Division Action Plan for Sal ANR Fund which should include i) revenue/ expentiure plans, ii) implementation plan, and iii) fund cash-flow
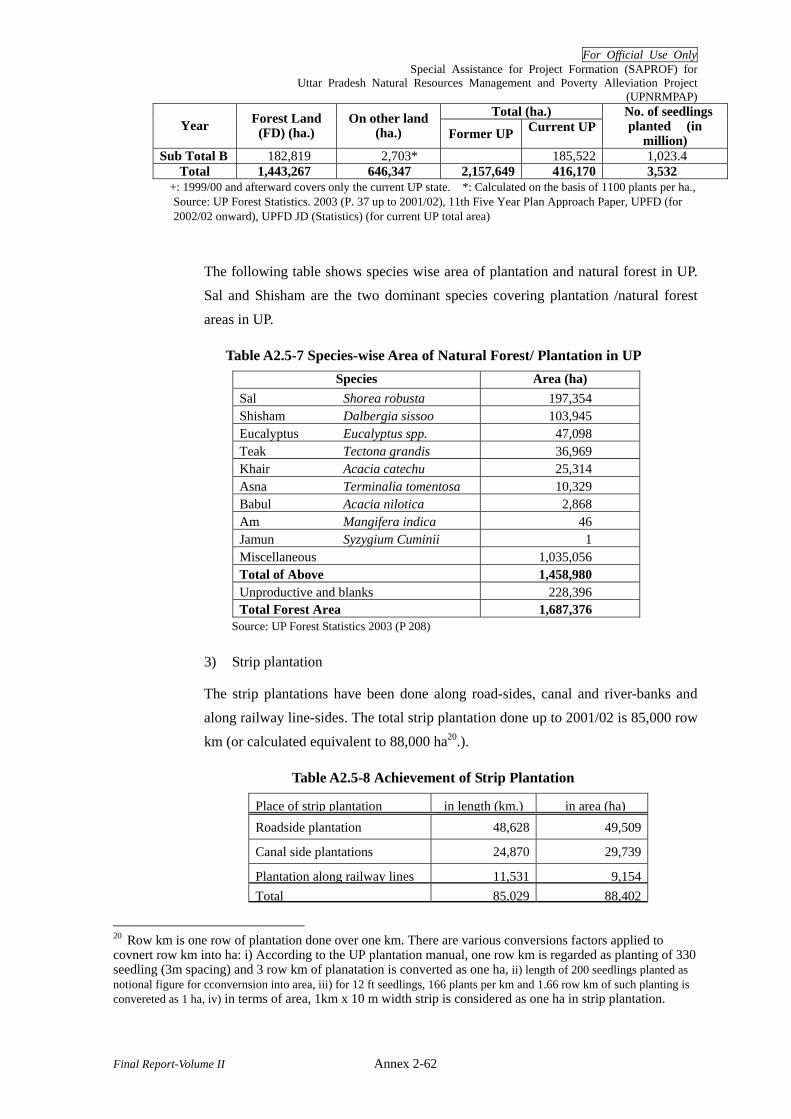
For Official Use Only Special Assistance for Project Formation (SAPROF) for
Uttar Pradesh Natural Resources Management and Poverty Alleviation Project (UPNRMPAP)
Final Report-Volume II Annex 2-62
Total (ha.) Year Forest Land
(FD) (ha.) On other land
(ha.) Former UP Current UP No. of seedlings
planted (in million)
Sub Total B 182,819 2,703* 185,522 1,023.4 Total 1,443,267 646,347 2,157,649 416,170 3,532
+: 1999/00 and afterward covers only the current UP state. *: Calculated on the basis of 1100 plants per ha., Source: UP Forest Statistics. 2003 (P. 37 up to 2001/02), 11th Five Year Plan Approach Paper, UPFD (for 2002/02 onward), UPFD JD (Statistics) (for current UP total area)
The following table shows species wise area of plantation and natural forest in UP. Sal and Shisham are the two dominant species covering plantation /natural forest areas in UP.
Table A2.5-7 Species-wise Area of Natural Forest/ Plantation in UP Species Area (ha)
Sal Shorea robusta 197,354 Shisham Dalbergia sissoo 103,945 Eucalyptus Eucalyptus spp. 47,098 Teak Tectona grandis 36,969 Khair Acacia catechu 25,314 Asna Terminalia tomentosa 10,329 Babul Acacia nilotica 2,868 Am Mangifera indica 46 Jamun Syzygium Cuminii 1 Miscellaneous 1,035,056 Total of Above 1,458,980 Unproductive and blanks 228,396 Total Forest Area 1,687,376
Source: UP Forest Statistics 2003 (P 208)
3) Strip plantation
The strip plantations have been done along road-sides, canal and river-banks and along railway line-sides. The total strip plantation done up to 2001/02 is 85,000 row km (or calculated equivalent to 88,000 ha20.).
Table A2.5-8 Achievement of Strip Plantation
Place of strip plantation in length (km.) in area (ha) Roadside plantation 48,628 49,509
Canal side plantations 24,870 29,739
Plantation along railway lines 11,531 9,154 Total 85,029 88,402
20 Row km is one row of plantation done over one km. There are various conversions factors applied to covnert row km into ha: i) According to the UP plantation manual, one row km is regarded as planting of 330 seedling (3m spacing) and 3 row km of planatation is converted as one ha, ii) length of 200 seedlings planted as notional figure for cconvernsion into area, iii) for 12 ft seedlings, 166 plants per km and 1.66 row km of such planting is convereted as 1 ha, iv) in terms of area, 1km x 10 m width strip is considered as one ha in strip plantation.
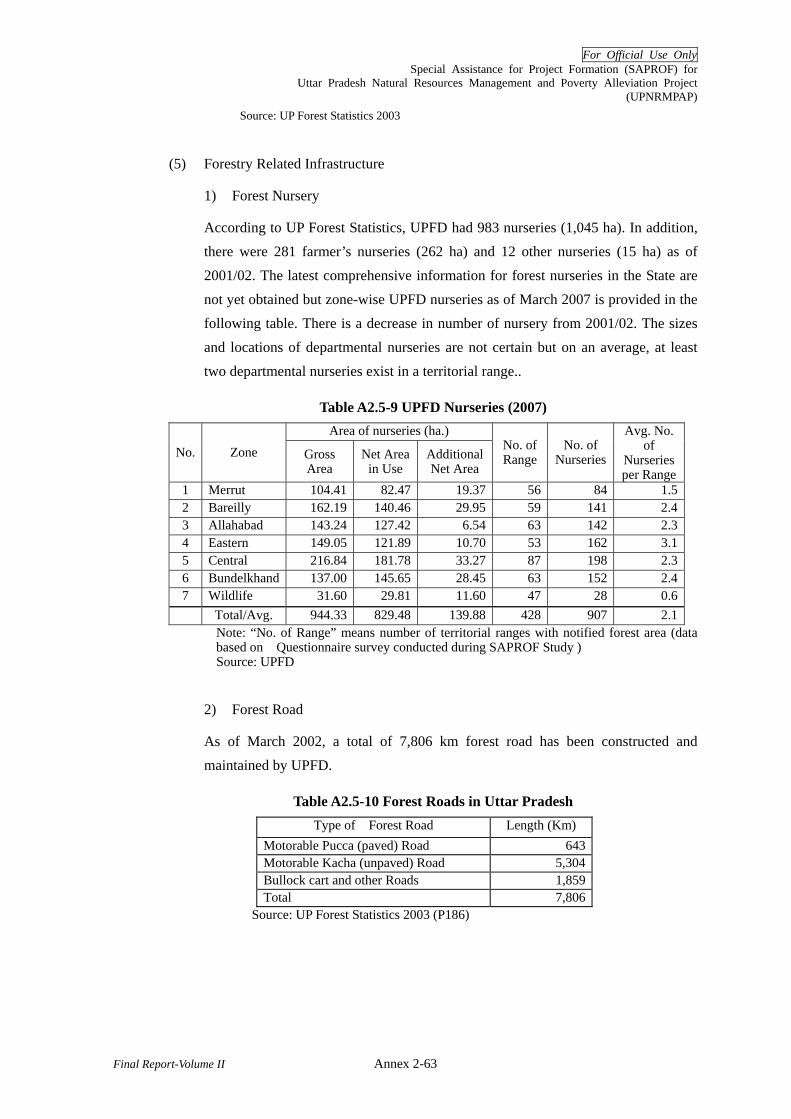
For Official Use Only Special Assistance for Project Formation (SAPROF) for
Uttar Pradesh Natural Resources Management and Poverty Alleviation Project (UPNRMPAP)
Final Report-Volume II Annex 2-63
Source: UP Forest Statistics 2003
(5) Forestry Related Infrastructure
1) Forest Nursery
According to UP Forest Statistics, UPFD had 983 nurseries (1,045 ha). In addition, there were 281 farmer’s nurseries (262 ha) and 12 other nurseries (15 ha) as of 2001/02. The latest comprehensive information for forest nurseries in the State are not yet obtained but zone-wise UPFD nurseries as of March 2007 is provided in the following table. There is a decrease in number of nursery from 2001/02. The sizes and locations of departmental nurseries are not certain but on an average, at least two departmental nurseries exist in a territorial range..
Table A2.5-9 UPFD Nurseries (2007) Area of nurseries (ha.)
No. Zone Gross Area
Net Area in Use
Additional Net Area
No. of Range
No. of Nurseries
Avg. No. of
Nurseriesper Range
1 Merrut 104.41 82.47 19.37 56 84 1.52 Bareilly 162.19 140.46 29.95 59 141 2.43 Allahabad 143.24 127.42 6.54 63 142 2.34 Eastern 149.05 121.89 10.70 53 162 3.15 Central 216.84 181.78 33.27 87 198 2.36 Bundelkhand 137.00 145.65 28.45 63 152 2.4 7 Wildlife 31.60 29.81 11.60 47 28 0.6 Total/Avg. 944.33 829.48 139.88 428 907 2.1
Note: “No. of Range” means number of territorial ranges with notified forest area (data based on Questionnaire survey conducted during SAPROF Study ) Source: UPFD
2) Forest Road
As of March 2002, a total of 7,806 km forest road has been constructed and maintained by UPFD.
Table A2.5-10 Forest Roads in Uttar Pradesh Type of Forest Road Length (Km)
Motorable Pucca (paved) Road 643 Motorable Kacha (unpaved) Road 5,304 Bullock cart and other Roads 1,859 Total 7,806
Source: UP Forest Statistics 2003 (P186)

For Official Use Only Special Assistance for Project Formation (SAPROF) for
Uttar Pradesh Natural Resources Management and Poverty Alleviation Project (UPNRMPAP)
Final Report-Volume II Annex 2-64
(6) Planting Stock Production Capacity and Afforestation Capacity
1) Planting stock production capacity
The annual planting stock production by UPFD was 52.8 million in 2001/02, and 20 million by others, totalling to 74.2 million. The capacity of these nurseries is approximately 80.6 million by UPFD, 23.9 million by others, 104.5 million in total21. The recorded annual planting stock production in UPFD nurseries as of March 2007 was 45.4 million. Zone-wise seedling production reveals that Bundelkhand zone has the highest production amount of 10.9 million, followed by
Central zone of 8.2 million, Barilly zone of 7.6 million (Table A2.5-11).
Table A2.5-11 Planting Stock Production in UPFD Nursery (2007) Height (Feet)
No. Zone <4 4-8 8-12 >12 Total No. of
NurseriesAvg.
Production/ Nursery
1 Merrut 3,833,904 643,276 47,961 0 4,525,141 84 53,871 2 Bareilly 6,737,301 747,085 122,450 31 7,606,867 141 53,949 3 Allahabad 5,349,674 669,381 27,383 82 6,046,520 142 42,581 4 Eastern 6,077,537 833,083 46,457 7,100 6,964,177 162 42,989 5 Central 7,355,609 783,814 85,541 1,170 8,226,134 198 41,546 6 Bundelkhand 9,803,102 1,005,894 113,876 9,800 10,932,672 152 71,925 7 Wildlife 956,306 127,776 1,950 0 1,086,032 28 38,787
Total 40,113,433 4,810,309 445,618 18,183 45,387,543 907
Source: UPFD
2) Afforestation/Reforestation Capacity
In forestland, the average annual plantation during 1993/94 - 1999/00 was 29,486
ha, whereas 29,507 ha during 2000/01 to 2006/07 (Table A2.5-6), indicating annual plantation maintained around 30,000 ha on an average. However, the record shows that the annual plantation area has been increasing since 2002/03, and the average
annual plantation area after the same exceeded 36,500 ha (Table A2.5-6). Based on the recent achievement, it is reasonable to say that the current annual afforestation/ reforestation capacity in forestland is in a range of 30,000 to 50,000 ha.
3). Available Area for Tree Plantation
The State is keen to increase the area under forest cover. It has been identified that 783,760 ha of forest area is available for further plantation22.
21 UP Forest Statistics 2003 p100 -111 22 UP Forest Statistics, 2003

For Official Use Only Special Assistance for Project Formation (SAPROF) for
Uttar Pradesh Natural Resources Management and Poverty Alleviation Project (UPNRMPAP)
Final Report-Volume II Annex 2-65
(7) Forest Protection
Forests have to be protected in many ways from different forest offences. The state of
violation of different forest related Acts in the year of 2000/01 is summarised in Table A2.5-12.
Table A2.5 -12 Violation of Different Forestry related Acts
Violation of the Act Cases Pending at the Start of
the Year
Cases Happened in
the Year
Cases Filed /Action Started
Cases Disposed
Off
Pending cases at the end
March 31,2001IFA 1927 19,852 6,326 6,100 5,015 21,163Wildlife Conservation Act 1927 1,035 464 1,262 322 1,177Forest Conservation Act 1980 374 719 195 409 684Tree protection Act 1976 20 55 0 31 44Total 21,281 7,564 7,557 5,777 23,068
Source UP Forest Statistics 2003 p100 -111
1) Encroachment
A total of 26,536 ha has been encroached as of end 2002/03. The following table describes encroached area vacated. In recent year, vacated area is decreasing compared to the total area under encroachment.
Table A2.5-13 Encroached Forest Area got vacated Year Forest Area got Vacated (ha)
1993/94 2,458 1994/95 7,370 1995/96 2,862 1996/97 1,651 1997/98 1,388 1998/99 1,967
1999/00* 1,081 2000/01* 860 2001/02* 835 2002/03* 163
Total 20,635 *Only of recast UP Source-U.P. Forest Statistics 2003 (P 6)
2) Illicit Felling
Illicit felling is major forest offence in UP. During 2000/01 to 2006/07 the number of illicitly felling case was in a range of 2,000 to 6,000 per year, while the number of illicitly felled tree was between 9,000 and 39,000 per year.

For Official Use Only Special Assistance for Project Formation (SAPROF) for
Uttar Pradesh Natural Resources Management and Poverty Alleviation Project (UPNRMPAP)
Final Report-Volume II Annex 2-66
Table A2.5-13 Details of Illicit Felling Offence Year No. of
Illicit Felling Cases
No. of Illicitly Felled Trees
Price of Illicitly Felled
Trees (1000 Rs.)
Price of Confiscated
Wood (1000 Rs.)
Total Price(1000 Rs.)
2000/01 6,602 39,747 12,290 8,368 20,6582001/02 4,897 28,660 9,965 7,366 17,3312002/03 5,101 24,291 9,816 8,533 18,3492003/04 4,279 18,421 9,106 8,774 17,8802004/05 3,881 16,087 9,275 9,990 19,2652005/06 3,629 14,575 9,374 8,613 17,9872006/07 2,987 9,515 8,303 6,883 15,186
Total 31,376 151,296 68,129 58,527 51,611Source- FD records
3) Forest Fires
The number of annual forest fire reported was in a range from 48 to 153 during 2001/02 to 2006/07, affected area totalled to 4,490 ha. Though estimated total value of loss was not available for all of forest divisions, recorded estimate during 2001/02 to 2006/07 was Rs.824,458.
Table A2.5-14 Detail of Forest Fire in UP Year No. of fires
reported Area affected by fire (ha)
Recorded estimated value of
loss due to fire (Rs.)
Remarks
2001/02 153 1,194.96 153,492 Surface/ground fire 2002/03 75 537.76 117,059 Surface/ground fire 2003/04 84 754.46 119,550 Surface/ground fire 2004/05 48 413.30 24,245 Surface/ground fire 2005/06 138 991.16 64,766 Surface/ground fire 2006/07 77 597.56 345,346 Surface/ground fire Total 575 4,489.20 824,458
Source- CF, Planning, UPFD
Some fires occurred naturally, some accidentally but most of the fire incidences were due to wilful burning or due to carelessness. After harvesting a crop farmers burn its residue. At the time of this burning, fire used to spread to adjacent forest areas. Local grazier commonly have conducted burning the coarse grassland and shrubby area to get fresh green flush of grass for their animals. Thus forests have to be rigidly fire protected for at least 3 months from mid April to mid July.
4) Other Forest Offence
Besides above, other forest offences such as illegal grazing, poaching and illegal stealing of forest produces (NTFP, etc.) also have taken place in the forests. In 2001/02, 48,516 animals were reported to illegally grazing in the Reserved Forest in 320 instances. In the same year, confiscated were 46 deer skins, 1 panther skin, 1 crocodile skin, 20 tortoises, 1 elephant tusk, 6 rifles etc.
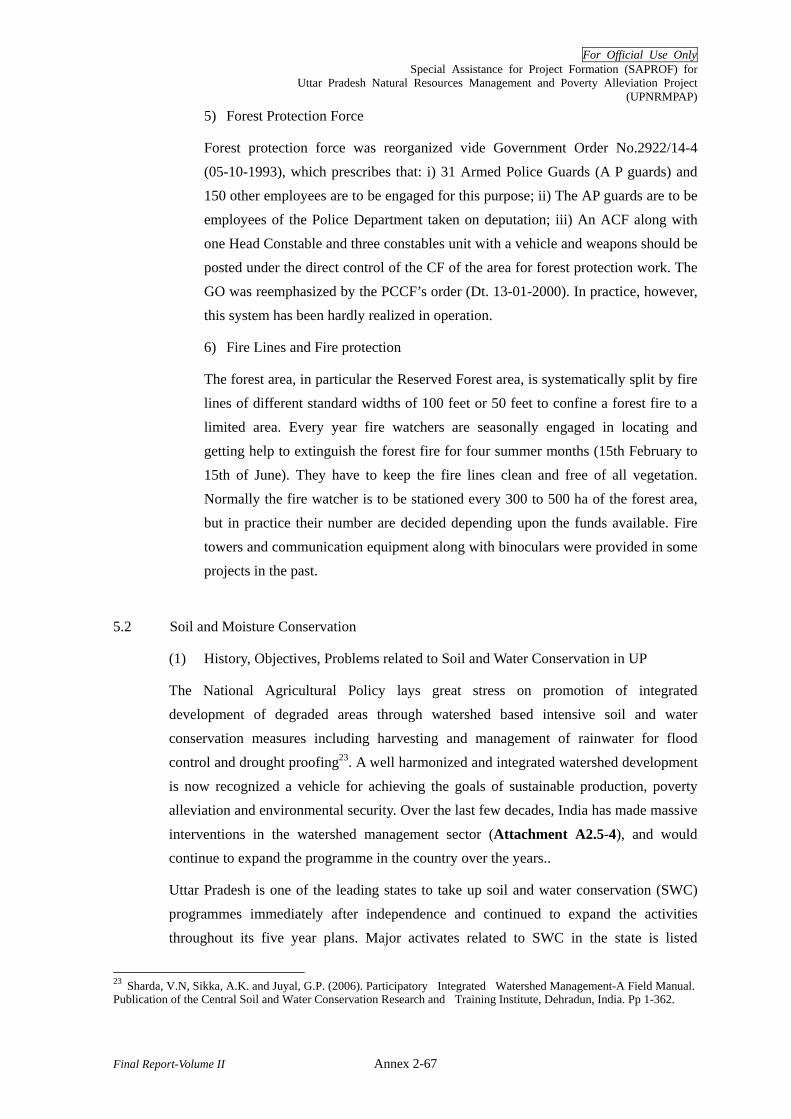
For Official Use Only Special Assistance for Project Formation (SAPROF) for
Uttar Pradesh Natural Resources Management and Poverty Alleviation Project (UPNRMPAP)
Final Report-Volume II Annex 2-67
5) Forest Protection Force
Forest protection force was reorganized vide Government Order No.2922/14-4 (05-10-1993), which prescribes that: i) 31 Armed Police Guards (A P guards) and 150 other employees are to be engaged for this purpose; ii) The AP guards are to be employees of the Police Department taken on deputation; iii) An ACF along with one Head Constable and three constables unit with a vehicle and weapons should be posted under the direct control of the CF of the area for forest protection work. The GO was reemphasized by the PCCF’s order (Dt. 13-01-2000). In practice, however, this system has been hardly realized in operation.
6) Fire Lines and Fire protection
The forest area, in particular the Reserved Forest area, is systematically split by fire lines of different standard widths of 100 feet or 50 feet to confine a forest fire to a limited area. Every year fire watchers are seasonally engaged in locating and getting help to extinguish the forest fire for four summer months (15th February to 15th of June). They have to keep the fire lines clean and free of all vegetation. Normally the fire watcher is to be stationed every 300 to 500 ha of the forest area, but in practice their number are decided depending upon the funds available. Fire towers and communication equipment along with binoculars were provided in some projects in the past.
5.2 Soil and Moisture Conservation
(1) History, Objectives, Problems related to Soil and Water Conservation in UP
The National Agricultural Policy lays great stress on promotion of integrated development of degraded areas through watershed based intensive soil and water conservation measures including harvesting and management of rainwater for flood control and drought proofing23. A well harmonized and integrated watershed development is now recognized a vehicle for achieving the goals of sustainable production, poverty alleviation and environmental security. Over the last few decades, India has made massive
interventions in the watershed management sector (Attachment A2.5-4), and would continue to expand the programme in the country over the years..
Uttar Pradesh is one of the leading states to take up soil and water conservation (SWC) programmes immediately after independence and continued to expand the activities throughout its five year plans. Major activates related to SWC in the state is listed
23 Sharda, V.N, Sikka, A.K. and Juyal, G.P. (2006). Participatory Integrated Watershed Management-A Field Manual. Publication of the Central Soil and Water Conservation Research and Training Institute, Dehradun, India. Pp 1-362.
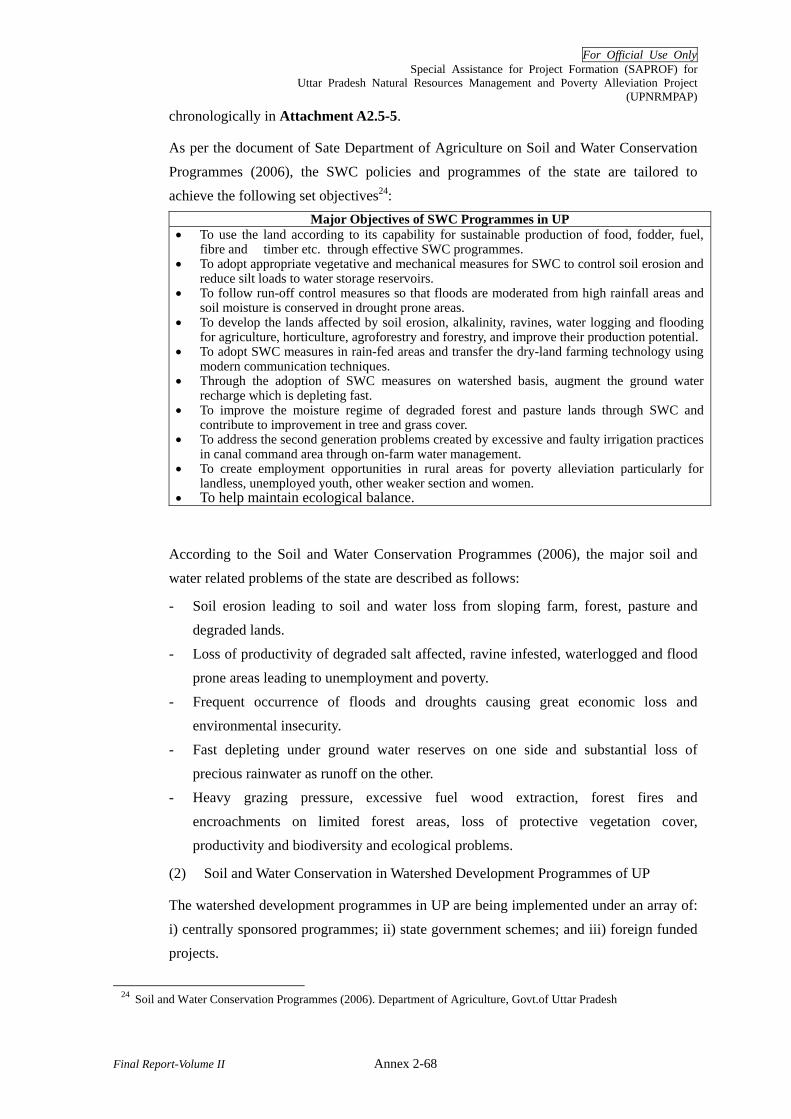
For Official Use Only Special Assistance for Project Formation (SAPROF) for
Uttar Pradesh Natural Resources Management and Poverty Alleviation Project (UPNRMPAP)
Final Report-Volume II Annex 2-68
chronologically in Attachment A2.5-5.
As per the document of Sate Department of Agriculture on Soil and Water Conservation Programmes (2006), the SWC policies and programmes of the state are tailored to achieve the following set objectives24:
Major Objectives of SWC Programmes in UP • To use the land according to its capability for sustainable production of food, fodder, fuel,
fibre and timber etc. through effective SWC programmes. • To adopt appropriate vegetative and mechanical measures for SWC to control soil erosion and
reduce silt loads to water storage reservoirs. • To follow run-off control measures so that floods are moderated from high rainfall areas and
soil moisture is conserved in drought prone areas. • To develop the lands affected by soil erosion, alkalinity, ravines, water logging and flooding
for agriculture, horticulture, agroforestry and forestry, and improve their production potential. • To adopt SWC measures in rain-fed areas and transfer the dry-land farming technology using
modern communication techniques. • Through the adoption of SWC measures on watershed basis, augment the ground water
recharge which is depleting fast. • To improve the moisture regime of degraded forest and pasture lands through SWC and
contribute to improvement in tree and grass cover. • To address the second generation problems created by excessive and faulty irrigation practices
in canal command area through on-farm water management. • To create employment opportunities in rural areas for poverty alleviation particularly for
landless, unemployed youth, other weaker section and women. • To help maintain ecological balance.
According to the Soil and Water Conservation Programmes (2006), the major soil and water related problems of the state are described as follows:
- Soil erosion leading to soil and water loss from sloping farm, forest, pasture and degraded lands.
- Loss of productivity of degraded salt affected, ravine infested, waterlogged and flood prone areas leading to unemployment and poverty.
- Frequent occurrence of floods and droughts causing great economic loss and environmental insecurity.
- Fast depleting under ground water reserves on one side and substantial loss of precious rainwater as runoff on the other.
- Heavy grazing pressure, excessive fuel wood extraction, forest fires and encroachments on limited forest areas, loss of protective vegetation cover, productivity and biodiversity and ecological problems.
(2) Soil and Water Conservation in Watershed Development Programmes of UP
The watershed development programmes in UP are being implemented under an array of: i) centrally sponsored programmes; ii) state government schemes; and iii) foreign funded projects.
24 Soil and Water Conservation Programmes (2006). Department of Agriculture, Govt.of Uttar Pradesh

For Official Use Only Special Assistance for Project Formation (SAPROF) for
Uttar Pradesh Natural Resources Management and Poverty Alleviation Project (UPNRMPAP)
Final Report-Volume II Annex 2-69
1) Centrally Sponsored Schemes
Two important ministries of the Government of India, the Ministry of Rural Development (MORD) and the Ministry of Agriculture (MOA) support the major watershed development programmes in the country. The MORD programmes are designed for more
difficult terrain including wastelands having major share of common property resources25. The MOA aims to increase production and productivity of more than 90 million ha rain
fed areas where poverty and resource starvation is rampant26. SWC including rainwater harvesting and small scale water resources development forms the heart of the interventions supported by MOA and MORD. Most of these programmes in the state are handled by the Department of Agriculture(DOA). Guidelines have been issued by the
GOI, MORD called “ Haryali” Guidelines27 and by the MOA called WARASA- Jan Sehbhagita28 for the implementation of the programme. There are commonalities in the concept and approach of both the guidelines. Four important programmes operated in the sate are described in the following table. These centrally supported projects aim to improve the productivity of rainfed farm lands and also raise production of livestock and minimize the adverse impacts of frequent droughts.
Table A2.5-15 Major Centrally Sponsored Watershed Development Projects in the UP Name of the Programme
Objective Nodal Dept
Start year
Coverage in 2004-05
Financing mechanism
Drought Prone Area Programme
To minimize the effect of droughts on crops and livestock production and improve the productivity of land and water resources.
DOA 1995 35.698 km2 treated in 60 blocks of 15 districts
75% GOI 25% GOUP
Integrated wasteland development programmes
Development of wastelands using watershed management principles
DOA 1995 65000 ha. Rs. 5500 /ha GOI Rs. 500/ ha GOUP
Wasteland Development Programme
Unification of watershed programmes into a single national initiative involving NGO/ village level institutions
DOA 2005 Currently two projects have been sanctioned
Loan to GOUP by NABARD.
National watershed development project for Rain-fed Areas
Improve productivity of rain fed areas through soil and water conservation
DOA 1991 MOA, GOI Rs.6,000/ha for more than 8% slope Rs. 4,500/ha for less than 8% slope
Source: IWDP (HILLS) 2005. Final Report of the Integrated Watershed Development Project, Watershed Management Directorate, Govt. of Uttarkhand.
25 MORD (2001). Guidelines for Watershed Development (Revised-2001) Department of Land Resources, Ministry of Rural Development, Govt. of India, New Delhi. 26 MOA (1991). National Watershed Development Project for Rain Fed Areas (NWDRA) Guidelines: Department of Agriculture, Ministry of Agriculture Govt. of India, New Delhi 27 Implementation guidelines of Integrated Watershed Development Project for Rainfed Areas, MOA,GOI. 28 Implementation guidelines for the programmes supported by the MORD, GOI.

For Official Use Only Special Assistance for Project Formation (SAPROF) for
Uttar Pradesh Natural Resources Management and Poverty Alleviation Project (UPNRMPAP)
Final Report-Volume II Annex 2-70
2) State Government Schemes
The state government also support large number of SWC schemes with the loan assistance from NABARD and from its own resources. The district development plans provide funds for water resources development including construction of masonry check dams, earthen embankments for rainwater harvesting, construction of village ponds and desiltation and renovation of existing ponds and recharging of wells. Various relevant departments (Department of Agriculture, Land Reform and Water Resource Department, and Forest Department, etc.) receive funds against their approved proposals included by planning department in annual plans.
3) Foreign Funded Projects.
In the composite state of UP, several watershed development programmes were initiated including Doon Valley Project (1993-98) funded by EEC and Integrated Watershed Development Project Hills (1999-2004) funded by the World Bank. The Uttar Pradesh Social Forestry Project was started in 1977 with the World Bank assistance. The Uttar Pradesh Forestry Project funded by the World Bank operated from 1988 to 2003. Similarly, the European Community supported Ravine Stabilization Programme was completed in 2004. A sodic soils reclamation project was also implemented in the state with the financial assistance of the World Bank. The Bhumi Sudhar Nigam (Land Reclamation Corporation) is the nodal agency in UP for executing the land reclamation schemes.
Table A2.5-16 Detail of World Bank Assisted Sodic Soil Reclamation Projects in UP Name of the
Project Duration Target
(ha) Main Objectives Districts Covered
U.P. Sodic Lands Reclamation Project (UPSLR)
1993-94 to 2000-01
68,800
Develop model for environmental protection and improved agricultural production through large scale reclamation of sodic soils and strengthening of local institutions for poverty alleviation.
Aligarh, Etah Allahabad, Etawah, Hardoi, Fatehpur, Mainpuri, Pratapgarh, Raebareli Sultanpur.
U.P. Alkali Land Reclamation Development Project
1993 to 2000-01
26,375
Develop model for environmental protection and improved agricultural production by reclamation of sodic lands and strengthening of local institutions.
Unnao, Kanpur, Jaunpur, Azamgarh, Buland Shahar
U.P. Sodic Lands Reclamation II Project (UPLSR II)
1999 to 2005
150,000
To increase agricultural productivity by reclaiming sodic lands.
Aligarh, Etah Hathras, Allahabad, Auraiya, Etawah, Hardoi, Fatehpur, Mainpuri, Partapgarh, Raebareli, Sultanpur, Unnao, Kanpur, Jaunpur, Azamgarh, Bulandshahar *
Source: U.P. Sodic Lands Reclamation II Project Report 2005, Bhumi Sudhar Nigam, Govt. of Uttar Pradesh.

For Official Use Only Special Assistance for Project Formation (SAPROF) for
Uttar Pradesh Natural Resources Management and Poverty Alleviation Project (UPNRMPAP)
Final Report-Volume II Annex 2-71
(3) Soil and Water Conservation works on Problem Soils of UP
Soil and water conservation forms the basis for the development of wastelands of the state having low productivity/ rain-fed/ marginal and all such land which suffer from one or the other soil related constraint. Some important categories of soil and water related problem land include:
- Salt affected lands mostly sodic - Ravine infested lands along some rivers - Erosion prone Degraded Non Arable/ Forest Lands - Waterlogged lands - Flood prone lands
The key feature of the SWC works of the important reclamation programmes under
taken on above problematic lands a are highlighted in Attachment A2.5-6.
(4) Regions most relevant for SWC in UP Forestry Sector
In view of runoff, soil loss and resource degradation, poverty and water crisis problems in UP, Bhabar, Terai, Budelkhand and Vindhyan regions are considered to be major areas for SWC interventions in UP29 . The main distinguishing features important for SWC interventions are summarised as under:
29 Imapct assements reports of watershed management projects, relevant working plans, and other documents suggests/ implies that need based and demand driven watershed approach with natural resources management and poverty alleviation is one of approporiate approach to alleviate such problems (Singh, R.A., Sharma, P; Meena, B.S., Singh, R. and S.K. Das (2005). Ex-post Impact Assessment of Tejpura watershed project. A report of the Indian Grassland and Fodder Research Institute; CSWCR TI, Research Centre Datia (2004). Participatory watershed management for sustainable development in Bagni watershed of Datia developed under integrated wasteland development programme of the Ministry of Rural Development GOI)

For Official Use Only Special Assistance for Project Formation (SAPROF) for
Uttar Pradesh Natural Resources Management and Poverty Alleviation Project (UPNRMPAP)
Final Report-Volume II Annex 2-72
Table A2.5-17 Distinguishing Features of Four Soil Erosion Prone Zones of UP Features Bhabbar Terai
Rainfall 500-1,100mm 500-1,000 mm Moisture Moist Moist Water table Shallow: 4-10m Shallow: 3-8m Soils Coarse, sandy, gravel, porous, low to
medium fertility. Clay, humus and nitrogen rich, fertile
Reaction Acidic to neutral Slightly alkaline Slope Moderate Slight Main problems
Disposal of erosive runoff from upper hilly watersheds.
Disposal of erosive runoff from upper hilly watersheds which by stream bank erosion, wash away farm lands and cause extensive damages.
Main SWC practices
Drainage line treatment like brushwood check dams, live hedges, dry stone check dams, vegetative and mechanical spurs. SMC practices in plantations like organic and soil mulching
Drainage line treatment like continuous live hedges along banks, vegetative and crate wire spurs, retaining walls and revetments, sills.
Features Bundelkhand Vindhyas Rainfall 500-900 mm 600-1,100 mm Moisture Mostly dry Mostly dry Water table Deep: 15-30m Deep :15-30m Soils Medium black soil retentive, rich in Fe and
Ca, poor in P (66%), and mixed; black soil in lower and red soil in upper areas.
Red and yellow soils, porous, light textured, shallow, largely poor and infertile; fertile only when deep and fine grained.
Reaction Moderate alkaline Moderate alkaline Slope Moderate to steep Moderate to steep Main SWC problems
Heavy soil erosion, extension of ravines/ gullies to farm lands, loss of rainwater as run off, moisture stress, scarcity of water for human livestock, and wildlife.
Main SWC practices
Improvised pits, staggered trenches, earthen bunds, dry stone check dams, protection trenches, stone walls, water harvesting structures.
Source:1) Working Plan of Renukoot, Mirzapur, Sonbhadra, Chitarkoot, Hamirpur, Banda, Mahoba, Lalitpur, Bahraich and Pillibhit Forest Divisions, Department of Forest, Govt. of UP.
5.3 Forest Produces and Markets
The forest produces in UP are broadly categorised into timber, fuel wood, and NWFPs (includes bamboo, tendu leaf, bhabhar grass and other grasses, grazing, edible fruits, herbs, honey, gums, cane, fish, hides & skins, boulder, bajri (pebble), sand, etc.).
(1) Forest Produces
All forest produce extraction and sale is routed through the State Forest Corporation (UPFC), which was created mainly for this purpose vide the U P Forest Corporation Act 1974. The production of timber and firewood by different agencies are shown in table below.

For Official Use Only Special Assistance for Project Formation (SAPROF) for
Uttar Pradesh Natural Resources Management and Poverty Alleviation Project (UPNRMPAP)
Final Report-Volume II Annex 2-73
Table A2.5-18 Timber and Firewood Produce by Agency and year Agency 1999/2000 2000/01 2001/02 TIMBER (cub.m.) 1. Departmental 5,957 277 272 2. UPFC 113,783 176,882 165,555 3. Rights and Concessions 1,314 4 5,456 4. Free 26 19 14 TOTAL 121,080 177,182 171,297 FIREWOOD (cub. m. stacked) 1. Departmental 1,031 68 122 2. UPFC 5,176 20,130 18,002 3. Rights and Concessions 20 20 0 4. Free 5,290 8,272 7,437 Total 11,517 28,490 25,561 Source-U P For. Stat. 2003 (P 119)
The timber and firewood produces collected by UPFC in the last five years is given in the table below.
Table A2.5-19 Production of Major Forest Produces (2000 to 2006) Production
Timber Firewood Bamboo Tendu leaf Bhabhar grass Year (m3) (m3) (kaudi) (St. bag) (m ton)
Value ( Rs.
million)2000/01 456,217 147,119 152,808 571,005 1,078 2,117.2 2001/02 196,981 56,369 140,286 440,901 45 1,090.9 2002/03 178,160 36,945 22,035 479,861 38 1,108.0 2003/04 205,715 21,299 142,076 454,428 43 1,281.8 2004/05 188,022 18,948 228,230 472,530 30 1,322.8 2005/06 (Target)
214,992 29,822 46,600 264,563 436
Source-UPFC annual Report 2005-06 (P 2)
The details of major NWFP produced annually between 1999/2000 to 2001/02 and its value is given in table below
Table A2.5 -20 Details of NWFP Produced and Their Values Production Value (Rs. million) Produce Unit 1999/00 2000/01 2001/02 1999/00 2000/01 2001/02
Tendu Leaves Std. bag#
533,237 495,508 457,769 5,392.89 5,392.89 410.10
Bamboo Kaudi* 151,255 178,936 168,410 116.47 116.47 9.10Bhabhar grass Tones 1,154 1,125 55 10.88 10.88 0.033 Herbs Quintals 10,564 20,599 4,463 13.38 9.52 1.45 Hides & horns Quintals 796 790 573 1.59 1.57 0.16Honey & wax Quintals 2,870 2,212 1,881 3.09 3.63 0.39Gums Quintals 432 448 0 1.60 0.16 0 Fish Quintals 1,545 1,449 1,164 20.81 31.90 3.18 Grass/grazing Quintals 9,444 9,404 14,161 4.96 4.82 1.12Canes Quintals 1,737 1,737 30 8.14 8.14 0.098 Miscellaneous - - - - 46.34 54.28 8.98 TOTAL - - - - 5,620.15 5,634.26 434.61 Note- # A standard bag of Tendu leaves contains 1000 bundles of 50 leaves each. It weighs approximately 40 kg.
* A kaudi is a bundle of 20 bamboos. 1Quintal is 100kg Source- For. Stat 2003 (P 118,119)
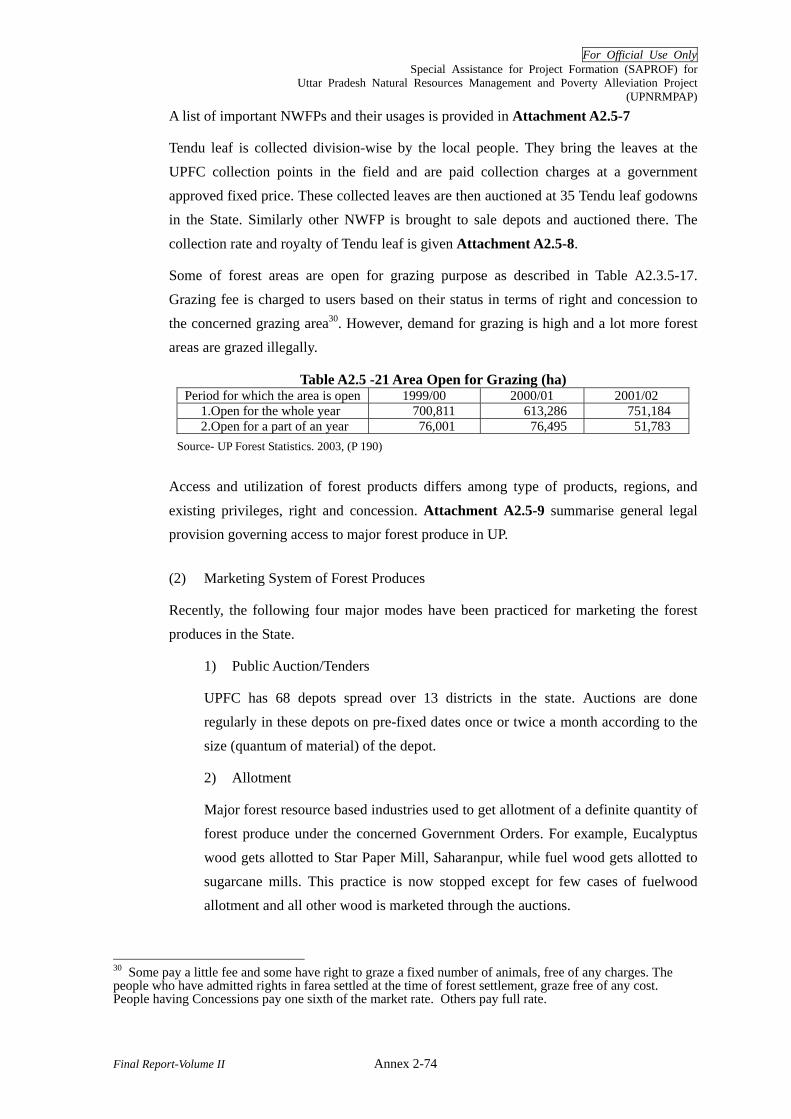
For Official Use Only Special Assistance for Project Formation (SAPROF) for
Uttar Pradesh Natural Resources Management and Poverty Alleviation Project (UPNRMPAP)
Final Report-Volume II Annex 2-74
A list of important NWFPs and their usages is provided in Attachment A2.5-7
Tendu leaf is collected division-wise by the local people. They bring the leaves at the UPFC collection points in the field and are paid collection charges at a government approved fixed price. These collected leaves are then auctioned at 35 Tendu leaf godowns in the State. Similarly other NWFP is brought to sale depots and auctioned there. The
collection rate and royalty of Tendu leaf is given Attachment A2.5-8.
Some of forest areas are open for grazing purpose as described in Table A2.3.5-17. Grazing fee is charged to users based on their status in terms of right and concession to the concerned grazing area30. However, demand for grazing is high and a lot more forest areas are grazed illegally.
Table A2.5 -21 Area Open for Grazing (ha) Period for which the area is open 1999/00 2000/01 2001/02 1.Open for the whole year 700,811 613,286 751,184 2.Open for a part of an year 76,001 76,495 51,783
Source- UP Forest Statistics. 2003, (P 190)
Access and utilization of forest products differs among type of products, regions, and
existing privileges, right and concession. Attachment A2.5-9 summarise general legal provision governing access to major forest produce in UP.
(2) Marketing System of Forest Produces
Recently, the following four major modes have been practiced for marketing the forest produces in the State.
1) Public Auction/Tenders
UPFC has 68 depots spread over 13 districts in the state. Auctions are done regularly in these depots on pre-fixed dates once or twice a month according to the size (quantum of material) of the depot.
2) Allotment
Major forest resource based industries used to get allotment of a definite quantity of forest produce under the concerned Government Orders. For example, Eucalyptus wood gets allotted to Star Paper Mill, Saharanpur, while fuel wood gets allotted to sugarcane mills. This practice is now stopped except for few cases of fuelwood allotment and all other wood is marketed through the auctions.
30 Some pay a little fee and some have right to graze a fixed number of animals, free of any charges. The people who have admitted rights in farea settled at the time of forest settlement, graze free of any cost. People having Concessions pay one sixth of the market rate. Others pay full rate.
For Official Use Only Special Assistance for Project Formation (SAPROF) for
Uttar Pradesh Natural Resources Management and Poverty Alleviation Project (UPNRMPAP)
Final Report-Volume II Annex 2-75
3) Direct Sale to Consumers
A fixed quantity of construction wood up to maximum 10 m3 can be sold at 120 % of the procured price (fixed price determined by UPFC) to bonafide direct users. Besides these, UPFC have four retail depots in four districts (Lucknow, Kheri, Pihibhit, and Bijnor) also for sale of firewood at a fixed price.
4) Sale of Tendu Leaf and Bhabhar grass
For storage and sale of Tendu leaf, 35 separate depots/godowns in ten Tendu producing districts of southern and Bundelkhand regions are being maintained. Its sale is done through tenders.
Bhabhar grass is stored at separate grass depots. It is used by rope making units and for pulping purposes as it has long fibre.
The ordinary consumer can not easily buy timber through the auctions so he/she has to buy timber from the timber traders or saw-mills. Thus ordinary consumer has to pay more for the timber due to this middleman.
5.4 Forest Based Industries
The description of forest based industries in the state are as under.
(1) Paper Mill
The largest forest resource based industry in the State is a paper mill at Saharanpur named as Star Paper Mills, which requires nearly 300,000m3 of Eucalyptus wood every year, a large quantity of inferior quality bamboo for long fibre, and some Bhabhar grass for pulping.
(2) Plywood and Veneer Industry
As of December 2006, the State has in all 314 plywood and veneer units. They are classified in following 5 categories according to the period since when they are in existence. This industry generally prefers to use Poplars, Ailanthus, Gutel (Trewia nudiflora), Jihingan (Lanea coramandalica), Behra (Terminalia blerica), Haldu (Adina cordifolia), and Phaldu (Mitragyna parvifolia).

For Official Use Only Special Assistance for Project Formation (SAPROF) for
Uttar Pradesh Natural Resources Management and Poverty Alleviation Project (UPNRMPAP)
Final Report-Volume II Annex 2-76
Table A2.5-22 Plywood/ Veneer units Category
No. Description No. of Units
I Units established earlier than 26-07-1989 29 II Units established between 27-07-1989 and 15-02-1995 49 III Units established between 16-02-1995 and 04-03 1997 58 IV Unit established after 04- 03- 1997 121 - Special- Not sufficiently proved to be established before 04-03-1997
(The cut-off date after which no unit can be established as per the Supreme Court’s order)
57
Total 314 Source-Report Dt. 21/12/2006 of State level committee in respect of Veneer/Plywood Units
(3) Match factory
Wimco Match Co. has its unit at Bareilly. It is among large match factories of India. Its annual requirement is 10,000 m3 of wood. It prefers Poplars, Semul (Salmalia malabaricum), Kanju (Holoptelia integrifolia), Gutel species.
(4) Artificial Limb Making Factory
A GOI artificial limb making factory is in Kanpur. It requires about 600 m3 of poplar wood every year.
(5) Katha making units
The state has eight large Katha making factories listed below. Besides, there are seven smaller katha making units in the state. Katha is also made by small cottage industry type small units. Katha industry need about 100,000 m3 of Khair (Acacia catechu) wood annually.
- The Indian wood products Co Ltd., Barelly. - Goyal industries Pvt. Ltd., Bareilly. - Chandra Katha Industries, Najibabad, Bijnor. - Amar shikha wood products, Agra. - Awadh wood products, Mahipurva, Baharaich. - Naresh chand agarwal, Najibabad, Bijnor. - P. K. katha industries, Noida, Gaziabad. - Om gram udyog vikas sangh, Nasir nagna, Moradabad
(6) Saw Mills
2,346 saw mills were licensed in the state on 04-03-1997. Besides these, there were 3,220 saw mills in the state whose license was not renewed on 04-03-1997.
(7) Beedi Industry
Beedi industry needs Tendu leaf to wrap Tobacco to make beedis. There are a few beedi making units in the state itself, most of the material is consumed within the state at places

For Official Use Only Special Assistance for Project Formation (SAPROF) for
Uttar Pradesh Natural Resources Management and Poverty Alleviation Project (UPNRMPAP)
Final Report-Volume II Annex 2-77
like Varanasi, Jaunpur, Amroha, etc and balance goes to other states like adjoining areas of Madhya Pradesh, Maharashtra, and some goes up to West Bengal. A large number of beedi making factories are in neighbouring states of Madhya Pradesh and Maharashtra.
6 Livelihoods of Forest Dependents
6.1 Forest Dependent Communities in UP
Forests play a prominent role in the traditional livelihoods of tribal and other forest dwelling communities in the State, as in other parts of the country. There are 22 tribal groups that are most dependent on forests for their livelihoods, and they include the following: Agariya, Baiga, Banmanus, Bansphor, Basor, Bhuiya, Bhotia, Buksa, Dhanuk, Dharkar, Ghasiya, Gond, Jaunsari, Kharwar (excluding Benbansi), Kol, Kori, Korwa, Musahar, Parahiya, Raji, Saharya and Tharu
A number of the tribal groups stated above are notified as SC, but they do not traditionally belong to the Hindu caste system and are culturally as well as socially distinct from the mainstream Hindu communities. The areas where these groups reside overlap with the forest areas in the State. The locations of the groups are as shown in
Table A2.6-1 below.
Table A2.6-1 Social Groups Dependent on Forests in UP Name of
group Official status Sub-castes Location (districts) Remarks
1 Bhotia Scheduled Tribe (ST)
Limited to Uttarakhand
2 Buksa Scheduled Tribe (ST)
Kheri
3 Jaunsari Scheduled Tribe (ST)
Limited to Uttarakhand
4 Raji Scheduled Tribe (ST)
Limited to Uttarakhand
5 Tharu Scheduled Tribe (ST)
Choudhary, Rana, Katharia
Bahraich, Pilibhit, Basti, Gonda, Siddharthnagar, Bahraich, Shrawasti, Maharajganj, Balrampur
Reported to have come from Thar region of Rajsthan and settled here
6 Agariya Scheduled Caste (SC)
Ahinwar, Baghel, Banjhakunwar, Barangiya, Gidhel, Koriyaz, Markan, Paraswar, Sunmogariya, Sanwar
Sonabhadra, Mirzapur, Agra, Mathura
Claim to have descended from Rajputs. They are displaced from Rewa (M.P.)
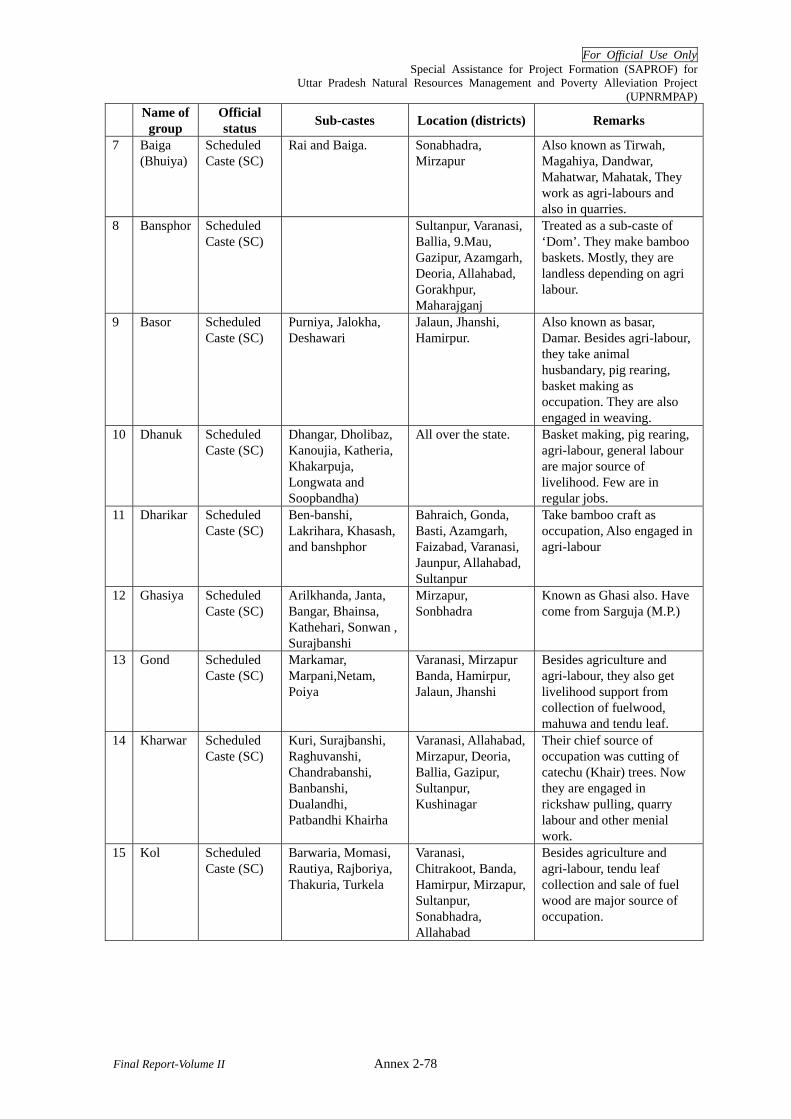
For Official Use Only Special Assistance for Project Formation (SAPROF) for
Uttar Pradesh Natural Resources Management and Poverty Alleviation Project (UPNRMPAP)
Final Report-Volume II Annex 2-78
Name of group
Official status Sub-castes Location (districts) Remarks
7 Baiga (Bhuiya)
Scheduled Caste (SC)
Rai and Baiga. Sonabhadra, Mirzapur
Also known as Tirwah, Magahiya, Dandwar, Mahatwar, Mahatak, They work as agri-labours and also in quarries.
8 Bansphor Scheduled Caste (SC)
Sultanpur, Varanasi, Ballia, 9.Mau, Gazipur, Azamgarh, Deoria, Allahabad, Gorakhpur, Maharajganj
Treated as a sub-caste of ‘Dom’. They make bamboo baskets. Mostly, they are landless depending on agri labour.
9 Basor Scheduled Caste (SC)
Purniya, Jalokha, Deshawari
Jalaun, Jhanshi, Hamirpur.
Also known as basar, Damar. Besides agri-labour, they take animal husbandary, pig rearing, basket making as occupation. They are also engaged in weaving.
10 Dhanuk Scheduled Caste (SC)
Dhangar, Dholibaz, Kanoujia, Katheria, Khakarpuja, Longwata and Soopbandha)
All over the state. Basket making, pig rearing, agri-labour, general labour are major source of livelihood. Few are in regular jobs.
11 Dharikar Scheduled Caste (SC)
Ben-banshi, Lakrihara, Khasash, and banshphor
Bahraich, Gonda, Basti, Azamgarh, Faizabad, Varanasi, Jaunpur, Allahabad, Sultanpur
Take bamboo craft as occupation, Also engaged in agri-labour
12 Ghasiya Scheduled Caste (SC)
Arilkhanda, Janta, Bangar, Bhainsa, Kathehari, Sonwan , Surajbanshi
Mirzapur, Sonbhadra
Known as Ghasi also. Have come from Sarguja (M.P.)
13 Gond Scheduled Caste (SC)
Markamar, Marpani,Netam, Poiya
Varanasi, Mirzapur Banda, Hamirpur, Jalaun, Jhanshi
Besides agriculture and agri-labour, they also get livelihood support from collection of fuelwood, mahuwa and tendu leaf.
14 Kharwar Scheduled Caste (SC)
Kuri, Surajbanshi, Raghuvanshi, Chandrabanshi, Banbanshi, Dualandhi, Patbandhi Khairha
Varanasi, Allahabad, Mirzapur, Deoria, Ballia, Gazipur, Sultanpur, Kushinagar
Their chief source of occupation was cutting of catechu (Khair) trees. Now they are engaged in rickshaw pulling, quarry labour and other menial work.
15 Kol Scheduled Caste (SC)
Barwaria, Momasi, Rautiya, Rajboriya, Thakuria, Turkela
Varanasi, Chitrakoot, Banda, Hamirpur, Mirzapur, Sultanpur, Sonabhadra, Allahabad
Besides agriculture and agri-labour, tendu leaf collection and sale of fuel wood are major source of occupation.
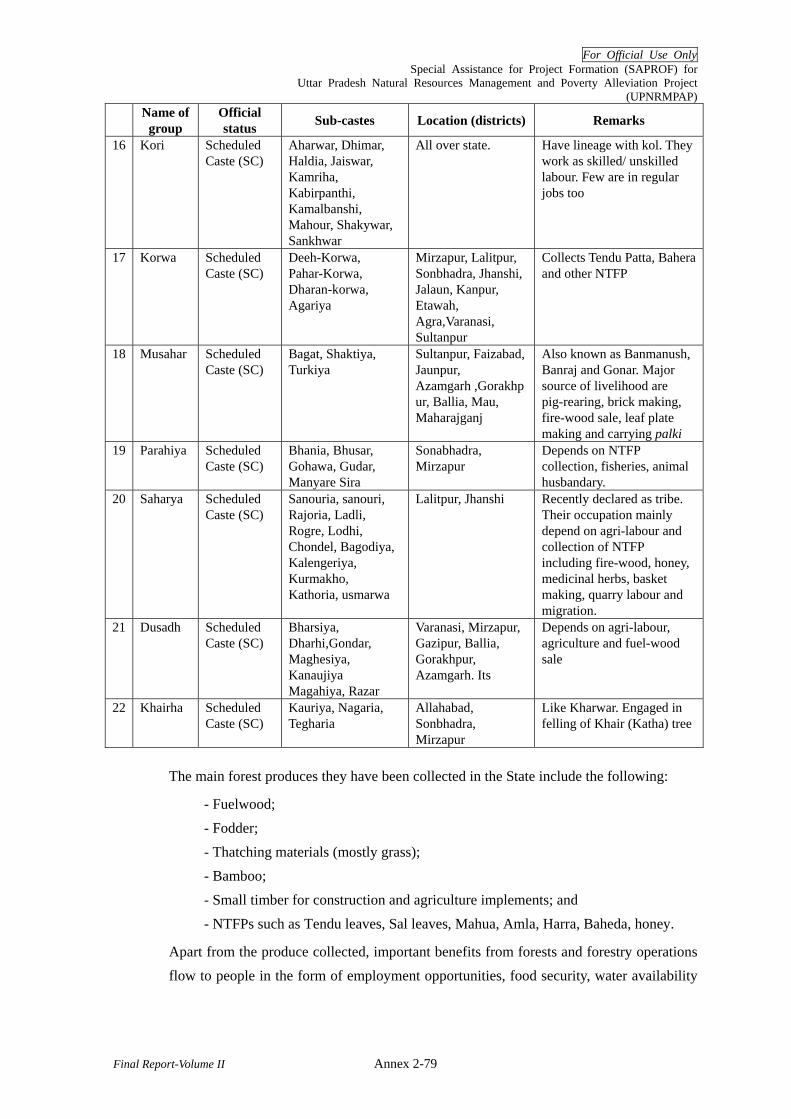
For Official Use Only Special Assistance for Project Formation (SAPROF) for
Uttar Pradesh Natural Resources Management and Poverty Alleviation Project (UPNRMPAP)
Final Report-Volume II Annex 2-79
Name of group
Official status Sub-castes Location (districts) Remarks
16 Kori Scheduled Caste (SC)
Aharwar, Dhimar, Haldia, Jaiswar, Kamriha, Kabirpanthi, Kamalbanshi, Mahour, Shakywar, Sankhwar
All over state. Have lineage with kol. They work as skilled/ unskilled labour. Few are in regular jobs too
17 Korwa Scheduled Caste (SC)
Deeh-Korwa, Pahar-Korwa, Dharan-korwa, Agariya
Mirzapur, Lalitpur, Sonbhadra, Jhanshi, Jalaun, Kanpur, Etawah, Agra,Varanasi, Sultanpur
Collects Tendu Patta, Bahera and other NTFP
18 Musahar Scheduled Caste (SC)
Bagat, Shaktiya, Turkiya
Sultanpur, Faizabad, Jaunpur, Azamgarh ,Gorakhpur, Ballia, Mau, Maharajganj
Also known as Banmanush, Banraj and Gonar. Major source of livelihood are pig-rearing, brick making, fire-wood sale, leaf plate making and carrying palki
19 Parahiya Scheduled Caste (SC)
Bhania, Bhusar, Gohawa, Gudar, Manyare Sira
Sonabhadra, Mirzapur
Depends on NTFP collection, fisheries, animal husbandary.
20 Saharya Scheduled Caste (SC)
Sanouria, sanouri, Rajoria, Ladli, Rogre, Lodhi, Chondel, Bagodiya, Kalengeriya, Kurmakho, Kathoria, usmarwa
Lalitpur, Jhanshi Recently declared as tribe. Their occupation mainly depend on agri-labour and collection of NTFP including fire-wood, honey, medicinal herbs, basket making, quarry labour and migration.
21 Dusadh Scheduled Caste (SC)
Bharsiya, Dharhi,Gondar, Maghesiya, Kanaujiya Magahiya, Razar
Varanasi, Mirzapur, Gazipur, Ballia, Gorakhpur, Azamgarh. Its
Depends on agri-labour, agriculture and fuel-wood sale
22 Khairha Scheduled Caste (SC)
Kauriya, Nagaria, Tegharia
Allahabad, Sonbhadra, Mirzapur
Like Kharwar. Engaged in felling of Khair (Katha) tree
The main forest produces they have been collected in the State include the following:
- Fuelwood; - Fodder; - Thatching materials (mostly grass); - Bamboo; - Small timber for construction and agriculture implements; and - NTFPs such as Tendu leaves, Sal leaves, Mahua, Amla, Harra, Baheda, honey.
Apart from the produce collected, important benefits from forests and forestry operations flow to people in the form of employment opportunities, food security, water availability

For Official Use Only Special Assistance for Project Formation (SAPROF) for
Uttar Pradesh Natural Resources Management and Poverty Alleviation Project (UPNRMPAP)
Final Report-Volume II Annex 2-80
and livelihood support for livestock rearing activities. Gathering of these produces and use of forest lands is an important subsistence activity, in addition to being a source of income, especially for poor women who constitute 60-70% of the gatherers (Gera, 2000).
The main forest based activities from which people derive employment and income are31:
- Sale of firewood and fodder - Rearing of livestock (grazing in and/or collecting fodder from forests) - Collection and processing of NTFPs - Forest based handicrafts and cottage industries; and - Wage labour
6.2 Availability of Common Pool Resources (CPRs)32 and Access to Forestlands
The features relating to use and availability of common pool resources (CPRs) in the
three major agro-climatic zones (Attachment A2.6-1) found in the state of UP are:
Middle Gangetic Plains and Trans-Gangetic Plains: Low to moderate accessibility to CPR land and/or forests, with both the average value of collection per household and percentage of households reporting collection being low. Besides fuelwood, which formed an important constituent of the collections from CPR lands in these zones, a large part of the total value of collections accrued from fodder collection.
Central Plateau and Hills: About 80% of the households in this zone reside in villages having 0.10 ha of CPR land per household or a forest within reach of the villagers. But neither the average value of collections nor the level of participation in collection activity can be said to be appreciably high. Fuelwood accounts for 60% of the total value of collections33.
Per capita per household availability of CPR land in UP vis-à-vis the country is as shown
in Table A2.6-2 below.
31 (Kaur, 1991 cited in Gera, 2000) 32 For the purpose of this study, CPR land is understood to include those lands within the boundary of the village and were formally (i.e. by legal sanction or official assignment) held by the village Panchayat or a community of the village (the de jure approach). However, CPRs were understood natural resources on the lands including the one mentioned above and other lands such as revenue lands not formally assigned to the Panchayat or a community of the village, forest land, or even private land in use of the community by convention (the de facto approach). 33 There is a dearth of UP-specific information on the dependence of rural communities on forests for their livelihoods. Most of the secondary literature on forest dependence and NTFPs pertains to the hilly regions of undivided UP, now part of Uttarakhand. Within the region that is now UP, high levels of dependence on forest resources are said to be found in districts that have traditionally had good forest cover, i.e., the south-eastern tip adjoining MP, parts of the Nepal-Terai belt, and the southern districts (part of Bundelkhand). To illustrate the nature of dependence on forests for livelihoods, the case of Chitrakoot Forest Division (district Chitrakoot) is provided in Attachment A1 6-2.

For Official Use Only Special Assistance for Project Formation (SAPROF) for
Uttar Pradesh Natural Resources Management and Poverty Alleviation Project (UPNRMPAP)
Final Report-Volume II Annex 2-81
Table A2.6-2 Availability of CPR Land in UP Agro-climatic zone CPR land to
geographical area (%)
CPR land per household
(ha)
Average household
size
CPR land per capita
(ha) Middle Gangetic Plains 8 0.07 5.69 0.01 Trans-Gangetic Plains 5 0.07 5.61 0.01 Central Plateau & Hills 20 0.65 5.23 0.12 India 15 0.31 5.04 0.06
Source: Based on NSS 54th Round, 1998
The availability of CPR land of the country ranges from 9% to 38% of the geographical area in the arid and semi-arid areas. However, the availability of CPR land in the Middle Gangetic and Trans-Gangetic Plains in UP was found to be rather low (5-8%). These are believed to be among the agriculturally developed areas endowed with rich and fertile soils. The ratio of households by access to forest within or outside the village is as shown
in Table A2.6-3 below.
Table A2.6-3 % of Households by Access to Forest in UP Forest
within the village Forest
outside village only Zone
Reserved only
Others Reserved only
Others
No forest (within or
outside village)
Middle Gangetic 4% 7.3% 2.6% 9.5% 76.7% Trans-Gangetic 3.6% 7.8% 1.1% 5.8% 81.6% Central Plateau & Hills 9.8% 17.1% 13% 19.6% 40.6% Average/ Total 4% 7.9% 2.1% 7.8% 78.3%
Source: Based on NSS 54th Round, 1998
It is observed that only about 22% of the villages in the State have access to forests on an average, of which about 6% have access to Reserved Forests only (within or outside the village), while 16% have access to forests other than Reserved Forests.
6.3 Collections from CPR Lands
The products that were reportedly being collected from CPR lands are fuelwood, fodder, manure, leaves, weeds, honey, fish and medicinal herbs. Based on the materials reportedly collected by households from CPR lands, the average values of collections in the Middle Gangetic (MG), Trans-Gangetic (TG) and Central Plateau and Hills (CHg) are estimated at Rs.464, Rs.528 and Rs.744. respectively. The value of collections in the MG and TG compares poorly with the average value of collections (all India) of Rs.693, and the highest value of collections (Rs.1,939) in Western Himalayas. The corresponding percentages of households reporting collection are 39%, 30% and 47%, respectively. The
resources collected by the type of produce are as shown in Table A2.6-4 below.
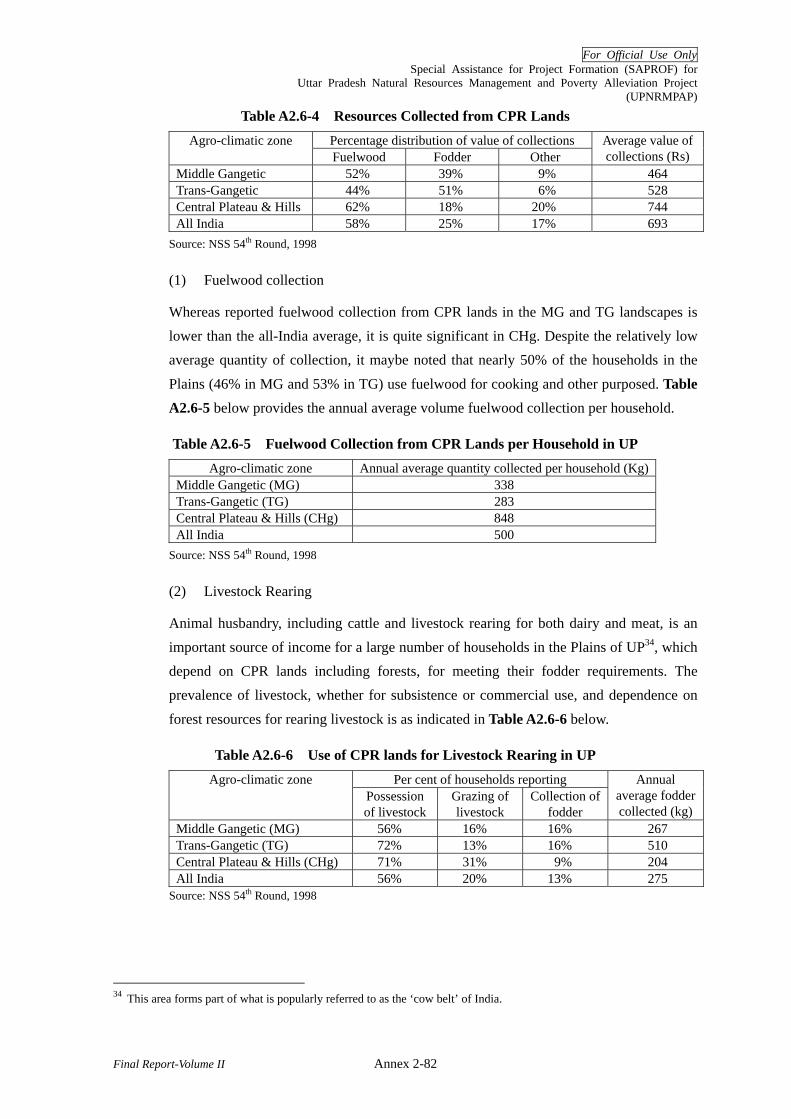
For Official Use Only Special Assistance for Project Formation (SAPROF) for
Uttar Pradesh Natural Resources Management and Poverty Alleviation Project (UPNRMPAP)
Final Report-Volume II Annex 2-82
Table A2.6-4 Resources Collected from CPR Lands Percentage distribution of value of collections Agro-climatic zone Fuelwood Fodder Other
Average value of collections (Rs)
Middle Gangetic 52% 39% 9% 464 Trans-Gangetic 44% 51% 6% 528 Central Plateau & Hills 62% 18% 20% 744 All India 58% 25% 17% 693
Source: NSS 54th Round, 1998
(1) Fuelwood collection
Whereas reported fuelwood collection from CPR lands in the MG and TG landscapes is lower than the all-India average, it is quite significant in CHg. Despite the relatively low average quantity of collection, it maybe noted that nearly 50% of the households in the
Plains (46% in MG and 53% in TG) use fuelwood for cooking and other purposed. Table A2.6-5 below provides the annual average volume fuelwood collection per household.
Table A2.6-5 Fuelwood Collection from CPR Lands per Household in UP Agro-climatic zone Annual average quantity collected per household (Kg)
Middle Gangetic (MG) 338 Trans-Gangetic (TG) 283 Central Plateau & Hills (CHg) 848 All India 500
Source: NSS 54th Round, 1998
(2) Livestock Rearing
Animal husbandry, including cattle and livestock rearing for both dairy and meat, is an important source of income for a large number of households in the Plains of UP34, which depend on CPR lands including forests, for meeting their fodder requirements. The prevalence of livestock, whether for subsistence or commercial use, and dependence on
forest resources for rearing livestock is as indicated in Table A2.6-6 below.
Table A2.6-6 Use of CPR lands for Livestock Rearing in UP Per cent of households reporting Agro-climatic zone
Possession of livestock
Grazing of livestock
Collection of fodder
Annual average fodder collected (kg)
Middle Gangetic (MG) 56% 16% 16% 267 Trans-Gangetic (TG) 72% 13% 16% 510 Central Plateau & Hills (CHg) 71% 31% 9% 204 All India 56% 20% 13% 275
Source: NSS 54th Round, 1998
34 This area forms part of what is popularly referred to as the ‘cow belt’ of India.

For Official Use Only Special Assistance for Project Formation (SAPROF) for
Uttar Pradesh Natural Resources Management and Poverty Alleviation Project (UPNRMPAP)
Final Report-Volume II Annex 2-83
6.4 Employment in Forestry Activities
Employment opportunities generated in regular forestry activities and special afforestation programmes are an important means of livelihood for rural communities living in forest fringe villages. The activities are largely sporadic owing to the seasonal nature of forestry operations, and are either contracted on a daily-wage or a piece-rate basis, with women frequently getting lower wages than men, being not paid regularly and harassed if they complain (Bajaj, M., 2001). The gender distribution of work in forestry
operations is as shown in Table A2.6-7 below.
Table A2.6-7: Gender distribution of work in forestry operations SL Forestry Operations Women Men I Development Works 1 Nursery operation X 2 Clearing and road work X X 3 Earth work X X II Maintenance Works 4 Watering X 5 Weeding & applying pesticides/ insecticides X 6 Protection X X III Harvesting 7 Major produce X 8 Minor produce X IV Management 9 Forest officials X 10 Village Extension Workers X X
Source: Gera, 2000
7 Joint Forest Management
Joint forest management refers to the management of forests jointly by the people that depend on them and the State Forest Department that is the custodian of the forests. The concept was introduced in India in the late 1980s, and received government backing in the form of issuance of a JFM Circular35 by the Ministry of Environment & Forests (MoEF) in June 1990. A MoEF letter to the State governments expressed the need of “involving village communities and voluntary agencies for regeneration of degraded forest lands.” This was in the aftermath of the 1988 National Forest Policy that showed a paradigm shift in the objectives of forest management, from revenue generation to ecological security and environmental stability.
Subsequent to the directive of the central government, respective state governments enabled operationalisation of the JFM programme in their states through issuance of
35 No. 6.21/89-FP dated 1st June, 1990

For Official Use Only Special Assistance for Project Formation (SAPROF) for
Uttar Pradesh Natural Resources Management and Poverty Alleviation Project (UPNRMPAP)
Final Report-Volume II Annex 2-84
supportive state JFM resolutions. At present, JFM programme is being implemented in 27 states across the country.
7.1 JFM Policy and Legal Framework in Uttar Pradesh
Uttar Pradesh (undivided) was a front runner in the involvement of village communities in forest protection and management; its support for this concept dates back to 1931 (pre-independence) when the Van Panchayat Regulation Act was passed by the then government, institutionalizing the Van Panchayats36 that existed in the hill regions of the State (now in Uttarakhand). The Act was subsequently revised in 1976.
In the undivided State of UP, the Uttar Pradesh Village Forest Joint Management Rules (UP-VFJM Rules) were passed in 1997 as a precursor to the World Bank funded UP Forestry Project (UPFP) (1997/98 - 2002/03), with the objective of creating a conducive legal environment for JFM, and as an evidence of the State government’s commitment to the operationalisation and sustenance of JFM programme. One of the other objectives was to bring the Van Panchayats under the fold of the UP-VFJM Rules.
The village institutions that were formed as part of the UPFP were named Village Forest Committees (VFCs), most of which ceased functioning when the project came to an end in 2002/03, except the ones that were restructured and/or renamed as Joint Forest
Management Committees (JFMC) according to subsequent guidelines (Annex 2, Section 7.2(2) and Section 7.5).
With the aim of expanding and strengthening JFM programme and making the village institution stronger as well as more representation, MoEF issued guidelines in 2000 and
2002, the provisions of which are summarised in Table A2.7-1.
36 Van Panchayat: Community organisations at the Gram Sabha level, unique to the hill regions of undivided UP (now
Uttarakhand), responsible for organized utilization & protection of forests and related natural resources by local communities. Van Panchayat literally means “forest council”.
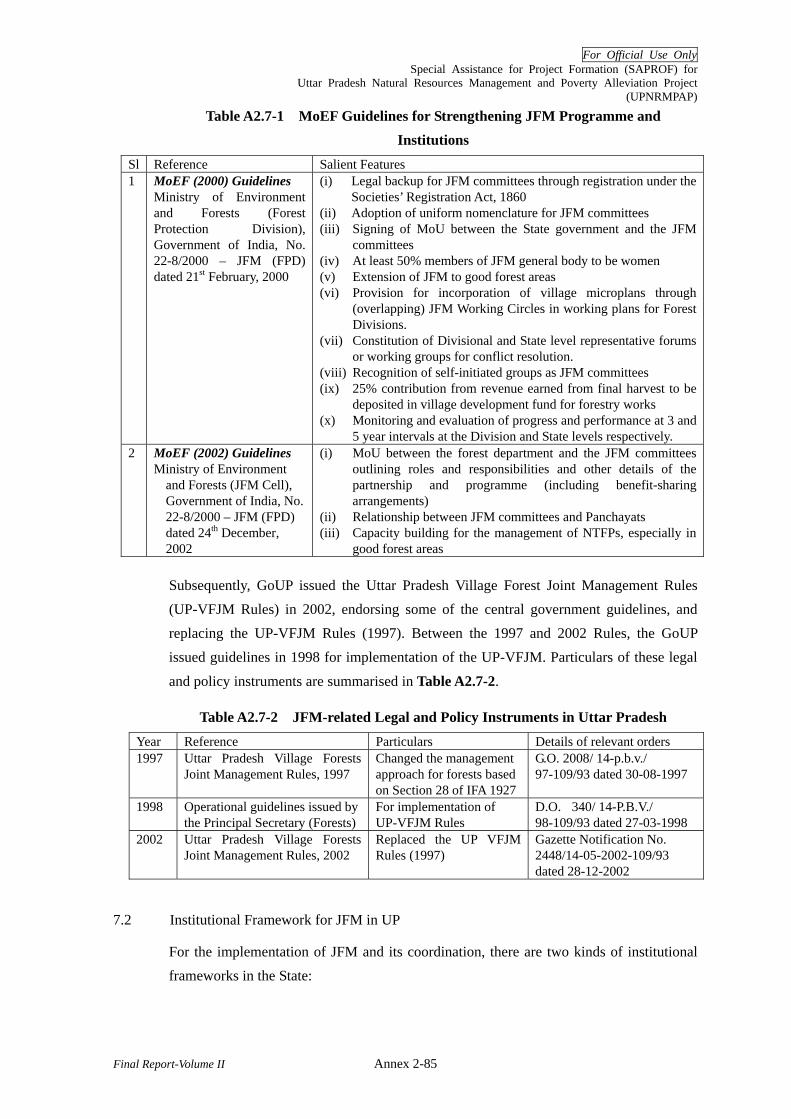
For Official Use Only Special Assistance for Project Formation (SAPROF) for
Uttar Pradesh Natural Resources Management and Poverty Alleviation Project (UPNRMPAP)
Final Report-Volume II Annex 2-85
Table A2.7-1 MoEF Guidelines for Strengthening JFM Programme and Institutions
Sl Reference Salient Features 1 MoEF (2000) Guidelines
Ministry of Environment and Forests (Forest Protection Division), Government of India, No. 22-8/2000 – JFM (FPD) dated 21st February, 2000
(i) Legal backup for JFM committees through registration under the Societies’ Registration Act, 1860
(ii) Adoption of uniform nomenclature for JFM committees (iii) Signing of MoU between the State government and the JFM
committees (iv) At least 50% members of JFM general body to be women (v) Extension of JFM to good forest areas (vi) Provision for incorporation of village microplans through
(overlapping) JFM Working Circles in working plans for Forest Divisions.
(vii) Constitution of Divisional and State level representative forums or working groups for conflict resolution.
(viii) Recognition of self-initiated groups as JFM committees (ix) 25% contribution from revenue earned from final harvest to be
deposited in village development fund for forestry works (x) Monitoring and evaluation of progress and performance at 3 and
5 year intervals at the Division and State levels respectively. 2 MoEF (2002) Guidelines
Ministry of Environment and Forests (JFM Cell), Government of India, No. 22-8/2000 – JFM (FPD) dated 24th December, 2002
(i) MoU between the forest department and the JFM committees outlining roles and responsibilities and other details of the partnership and programme (including benefit-sharing arrangements)
(ii) Relationship between JFM committees and Panchayats (iii) Capacity building for the management of NTFPs, especially in
good forest areas
Subsequently, GoUP issued the Uttar Pradesh Village Forest Joint Management Rules (UP-VFJM Rules) in 2002, endorsing some of the central government guidelines, and replacing the UP-VFJM Rules (1997). Between the 1997 and 2002 Rules, the GoUP issued guidelines in 1998 for implementation of the UP-VFJM. Particulars of these legal
and policy instruments are summarised in Table A2.7-2.
Table A2.7-2 JFM-related Legal and Policy Instruments in Uttar Pradesh Year Reference Particulars Details of relevant orders 1997 Uttar Pradesh Village Forests
Joint Management Rules, 1997 Changed the management approach for forests based on Section 28 of IFA 1927
G.O. 2008/ 14-p.b.v./ 97-109/93 dated 30-08-1997
1998 Operational guidelines issued by the Principal Secretary (Forests)
For implementation of UP-VFJM Rules
D.O. 340/ 14-P.B.V./ 98-109/93 dated 27-03-1998
2002 Uttar Pradesh Village Forests Joint Management Rules, 2002
Replaced the UP VFJM Rules (1997)
Gazette Notification No. 2448/14-05-2002-109/93 dated 28-12-2002
7.2 Institutional Framework for JFM in UP
For the implementation of JFM and its coordination, there are two kinds of institutional frameworks in the State:

For Official Use Only Special Assistance for Project Formation (SAPROF) for
Uttar Pradesh Natural Resources Management and Poverty Alleviation Project (UPNRMPAP)
Final Report-Volume II Annex 2-86
i) As specified by the UP VFJM (2002) Rules; and ii) As specified by the operational guidelines for the National Afforestation
Programme (NAP)
The details of these are provided in the following paragraphs, but for all practical purposes, it is the NAP guidelines that are in force since the UP VFJM Rules have not been operationalised since their promulgation in 2002.37
(1) Institutional Framework as per the UP VFJM Rules (2002)
The Joint Forest Management Committee (JFMC) at the village level is the project implementing agency. Working Groups / Committees are constituted at the Range and Division levels for conflict resolution, approval of plans and release of funds, and there is a State-level Steering / Coordination Committee, which is the highest decision-making body in the context of the JFM in the State.
Figure A2.7-1 is a diagrammatic illustration of the institutional framework as envisaged under the UP-VFJM Rules (2002).
37 The UP VFJM (2002) Rules were promulgated towards the end of the World Bank-supported UP Forestry Project,
which was expected to continue providing support for a second phase. However, the programme ended with the end of the first Phase, and in the absence of further funding for the programme, the Rules as well as the mechanisms suggested therein, remained unrealized.

For Official Use Only Special Assistance for Project Formation (SAPROF) for
Uttar Pradesh Natural Resources Management and Poverty Alleviation Project (UPNRMPAP)
Final Report-Volume II Annex 2-87
Figure A2.7-1 Institutional Framework as per the UP VFJM Rules (2002)
(2) Institutional Framework as per the Operational Guidelines for NAP
The NAP is a centrally sponsored scheme of MoEF and is implemented through the mechanism of the Forest Development Agency (FDA). The institutional framework for it
is as shown in Figure A2.7-2.
State Level Coordination Committee
(Not Constituted)
Divisional Committee Chairperson - Divisional Forest Officer Member Secretary – ACF/SDFO nominated by the DFO One member of FUG nominated by the Chairperson of Zilla Parishad One woman member of FUG nominated by the Chairperson of Zilla Parishad One NGO representative nominated by DFO
Range Committee Trustee – Chairperson of concerned Kshetra Panchayat (Ex-officio) Chairperson – Range Forest Officer Member Secretary – Forester/Deputy ranger (DFO nominee) One Motivator from NGO/other organisation nominated by DFOOne SC/ST Pradhan nominated by the Trustee One woman Gram Pradhan nominated by the Trustee
Joint Forest Management Committee (Village level)
Forest User Group (Permanent Membership) Joint Forest Management Committee (5-year term)
Function: Ratification of
Plans reviewed by the Range Committee
Function: Review of Microplan and
Annual Implementation
Plans
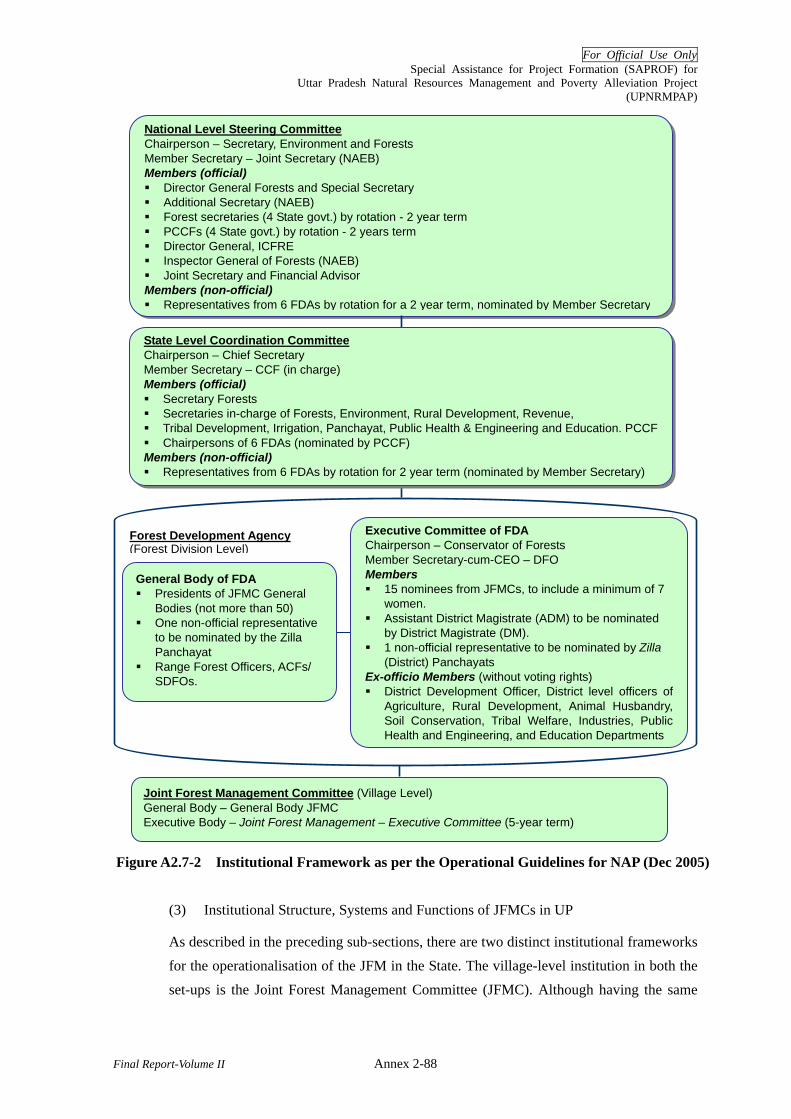
For Official Use Only Special Assistance for Project Formation (SAPROF) for
Uttar Pradesh Natural Resources Management and Poverty Alleviation Project (UPNRMPAP)
Final Report-Volume II Annex 2-88
Figure A2.7-2 Institutional Framework as per the Operational Guidelines for NAP (Dec 2005)
(3) Institutional Structure, Systems and Functions of JFMCs in UP
As described in the preceding sub-sections, there are two distinct institutional frameworks for the operationalisation of the JFM in the State. The village-level institution in both the set-ups is the Joint Forest Management Committee (JFMC). Although having the same
National Level Steering Committee Chairperson – Secretary, Environment and Forests Member Secretary – Joint Secretary (NAEB) Members (official) Director General Forests and Special Secretary Additional Secretary (NAEB) Forest secretaries (4 State govt.) by rotation - 2 year term PCCFs (4 State govt.) by rotation - 2 years term Director General, ICFRE Inspector General of Forests (NAEB) Joint Secretary and Financial Advisor
Members (non-official) Representatives from 6 FDAs by rotation for a 2 year term, nominated by Member Secretary
Joint Forest Management Committee (Village Level) General Body – General Body JFMC Executive Body – Joint Forest Management – Executive Committee (5-year term)
Forest Development Agency (Forest Division Level)
State Level Coordination Committee Chairperson – Chief Secretary Member Secretary – CCF (in charge) Members (official) Secretary Forests Secretaries in-charge of Forests, Environment, Rural Development, Revenue, Tribal Development, Irrigation, Panchayat, Public Health & Engineering and Education. PCCF Chairpersons of 6 FDAs (nominated by PCCF)
Members (non-official) Representatives from 6 FDAs by rotation for 2 year term (nominated by Member Secretary)
General Body of FDA Presidents of JFMC General
Bodies (not more than 50) One non-official representative
to be nominated by the Zilla Panchayat
Range Forest Officers, ACFs/ SDFOs.
Executive Committee of FDA Chairperson – Conservator of Forests Member Secretary-cum-CEO – DFO Members 15 nominees from JFMCs, to include a minimum of 7
women. Assistant District Magistrate (ADM) to be nominated
by District Magistrate (DM). 1 non-official representative to be nominated by Zilla
(District) Panchayats Ex-officio Members (without voting rights) District Development Officer, District level officers of
Agriculture, Rural Development, Animal Husbandry, Soil Conservation, Tribal Welfare, Industries, Public Health and Engineering, and Education Departments
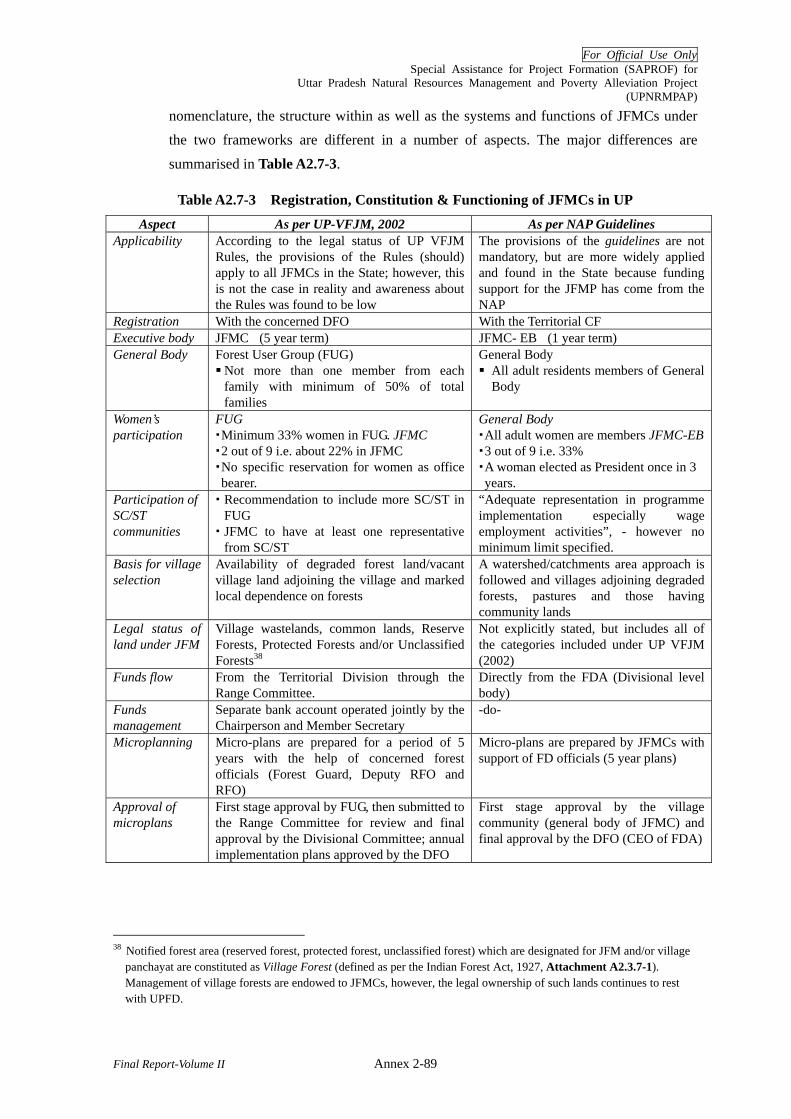
For Official Use Only Special Assistance for Project Formation (SAPROF) for
Uttar Pradesh Natural Resources Management and Poverty Alleviation Project (UPNRMPAP)
Final Report-Volume II Annex 2-89
nomenclature, the structure within as well as the systems and functions of JFMCs under the two frameworks are different in a number of aspects. The major differences are
summarised in Table A2.7-3.
Table A2.7-3 Registration, Constitution & Functioning of JFMCs in UP Aspect As per UP-VFJM, 2002 As per NAP Guidelines
Applicability According to the legal status of UP VFJM Rules, the provisions of the Rules (should) apply to all JFMCs in the State; however, this is not the case in reality and awareness about the Rules was found to be low
The provisions of the guidelines are not mandatory, but are more widely applied and found in the State because funding support for the JFMP has come from the NAP
Registration With the concerned DFO With the Territorial CF Executive body JFMC (5 year term) JFMC- EB (1 year term) General Body Forest User Group (FUG)
Not more than one member from each family with minimum of 50% of total families
General Body All adult residents members of General
Body
Women’s participation
FUG Minimum 33% women in FUG. JFMC 2 out of 9 i.e. about 22% in JFMC No specific reservation for women as office bearer.
General Body All adult women are members JFMC-EB 3 out of 9 i.e. 33% A woman elected as President once in 3 years.
Participation of SC/ST communities
Recommendation to include more SC/ST in FUG
JFMC to have at least one representative from SC/ST
“Adequate representation in programme implementation especially wage employment activities”, - however no minimum limit specified.
Basis for village selection
Availability of degraded forest land/vacant village land adjoining the village and marked local dependence on forests
A watershed/catchments area approach is followed and villages adjoining degraded forests, pastures and those having community lands
Legal status of land under JFM
Village wastelands, common lands, Reserve Forests, Protected Forests and/or Unclassified Forests38
Not explicitly stated, but includes all of the categories included under UP VFJM (2002)
Funds flow From the Territorial Division through the Range Committee.
Directly from the FDA (Divisional level body)
Funds management
Separate bank account operated jointly by the Chairperson and Member Secretary
-do-
Microplanning Micro-plans are prepared for a period of 5 years with the help of concerned forest officials (Forest Guard, Deputy RFO and RFO)
Micro-plans are prepared by JFMCs with support of FD officials (5 year plans)
Approval of microplans
First stage approval by FUG, then submitted to the Range Committee for review and final approval by the Divisional Committee; annual implementation plans approved by the DFO
First stage approval by the village community (general body of JFMC) and final approval by the DFO (CEO of FDA)
38 Notified forest area (reserved forest, protected forest, unclassified forest) which are designated for JFM and/or village
panchayat are constituted as Village Forest (defined as per the Indian Forest Act, 1927, Attachment A2.3.7-1). Management of village forests are endowed to JFMCs, however, the legal ownership of such lands continues to rest with UPFD.

For Official Use Only Special Assistance for Project Formation (SAPROF) for
Uttar Pradesh Natural Resources Management and Poverty Alleviation Project (UPNRMPAP)
Final Report-Volume II Annex 2-90
Aspect As per UP-VFJM, 2002 As per NAP Guidelines Roles and responsibilities of JFMC
Preparation of micro-plans, implementation of approved micro-plans and for the protection of Village Forests; accounting and book keeping.
Preparation of micro plans, suggesting physical and financial targets, identifying entry point activities, conducting awareness programme, management of funds and sharing of usufruct benefits
Benefit sharing Timber: JFMC receives 50% of the net income from ‘final’ harvest (after deduction of cost of harvest, transportation and marketing) received from the UP Forest Corporation; income restricted to 10% in case of destruction caused by natural calamities, subject to a maximum of Rs. 0.1 million Bamboo: In the event of the UPFC not being able to harvest bamboo, the JFMC has the autonomy to harvest, collect and market bamboo and retain 50% of the net income NTFPs: 100% of the usufructs, including all non-nationalised NTFPs may be retained by the JFMC
Not specified in the guidelines (UP VFJM (2002) Rules apply)
7.3 Implementation of JFM in UP
Although GOUP has shown its commitment to the implementation of JFM as stated above, till date the financial support for JFM implementation have been limitedly provided through the WB-funded UP Forestry Project (1997/98-2002/03) and the National Afforestation Programme (2002 onwards).
7.4 Achievement of JFM in UP
Implementation of the JFM in the State started with the WB-funded UP Forestry Project in 1998; since then, over 2000 JFMCs (village level institutions for implementation of JFM, but bearing different names) have been formed in the State in two distinct phases: i) Phase I (UP Forestry Project): 510 VFCs were formed and supported during 1997/98 –2002/03, ii) Phase II (NAP Support): 1,942 JFMCs were formed and supported (2002-2007 and ongoing)
(1) Phase I: UP Forestry Project
During the project period, a total of 510 VFCs covering a total area of 49,911 ha were constituted, spread over 50 Territorial Forest Divisions under 12 Forest Circles. In terms of benefits derived by the communities, the project provided employment opportunities at the village level and also led to an increase in the production of fuelwood and fodder from areas through the protection by VFCs. It was also observed that the Village Development

For Official Use Only Special Assistance for Project Formation (SAPROF) for
Uttar Pradesh Natural Resources Management and Poverty Alleviation Project (UPNRMPAP)
Final Report-Volume II Annex 2-91
Funds39 of the VFCs accumulated substantially. Income generation activities based on diversified forest based activities like basket making, mat making and making leaf plates were also initiated. In the Vindhyan region, women’s SHGs were formed for Tasar cultivation and production, and Tendu leaf collection.40
(2) Phase II: NAP Support
Under the NAP, a total of 1,942 JFMCs have been supported41, spread over 58 Forest and Wildlife Divisions, covering 15 Forest Circles. A total of 58,631 ha has been taken up for intervention under the programme. This includes plantation activities over 34,338 ha, assisted natural regeneration (ANR) over 19,324 ha and pasture development over 4,968 ha. The plantation and protection activities have contributed towards increasing the availability of biomass (particularly fuelwood and fodder) in the intervention area. Entry point activities (EPAs) like construction/repair of schools, repair/construction of approach roads, erection/repair of hand pumps, deepening/desilting of ponds, repair of wells and construction of check dams have led to the creation of community assets. Plantation and EPAs have generated 8.78 million person days of employment42.
The physical and financial achievements of the two programmes are summarised in Table A2.7-4.
39 Village Development Fund (VDF) is a kind of corpus fund in which the VFC members make savings, and such fund
will be invested to productive activities. Weak VDF or its mismanagement is common among many VFCs. 40 UP Forestry Project, PCR, Vol. II: pp 88-89. 41 It is important to mention here that although most of these JFMCs were newly formed but a small number out of the
already formed VFCs (under UP Forestry Project) were also included under the NAP support. 42 Quarterly Progress report of NAP, Qtr. III (ending December, 2006), UPFD

For Official Use Only Special Assistance for Project Formation (SAPROF) for
Uttar Pradesh Natural Resources Management and Poverty Alleviation Project (UPNRMPAP)
Final Report-Volume II Annex 2-92
Table A2.7-4 Physical and Financial Achievements of WB-UP Forestry Project and National Afforestation Programme
Some of the JFMCs are former VFCs converted into JFMCs Source: Completion Report of World Bank-funded UP Forestry Project
The Division-wise details of number of JFMCs and area planted are provided in
Attachment A2.7-2.
7.5 Present State of JFM in UP
Given the intermittent financial support for the implementation of JFM in the State, the JFM institutions at the village level (JFMCs) have not received sustained support, and considerable variations are observed in the nature and constitution of these institutions. The structural and functional differences between the VFCs (formed in accordance with the UP VFJM Rules (1997) and the JFMCs (formed in accordance with the NAP guidelines) have not been reconciled. As a result, there exists significant confusion over the operating institutional mechanisms within JFMCs in the State. These differences are further compounded by a lack of clarity over the legal status of JFMCs, their low levels of awareness and multiple interpretations of the rules/guidelines.
It may be deduced from the existing literature that there are at least three kinds of JFM village institutions in the State –
WB-UP Forestry Project (1997/98- 2002/03)
National Afforestation Programme (2002 onwards)
Sl Circle No of VFCs
Area managed
(Ha)
Average area under a VFC (Ha)
No of JFMCs*
Area planted
(Ha)
Average area planted per JFMC (Ha)
1 Allahabad 10 1,305 130.50 55 2,121 38.6 2 Awadh 41 4,874 118.88 294 11,482 39.1 3 Azamgarh 17 309 18.16 188 2,603 13.8 4 Bareilly 42 4,679 111.41 106 3,980 37.5 5 Brijbhumi -- -- -- 233 5,535 23.8 6 Bundelkhand 96 12,349 128.64 145 8,890 61.3 7 Eastern Varanasi 140 11,607 82.91 -- -- -- 8 F.D. Dudhwa -- -- -- 50 887 17.7 9 Gorakhpur 27 1,341 49.67 225 3,817 17.0 10 Kanpur 27 1,753 64.91 125 2,427 19.4 11 Meerut 9 983 109.27 61 3,139 51.5 12 Moradabad 15 678 45.22 25 700 28.0 13 Sarayu 37 2,465 66.62 199 7,081 35.6 14 Western Agra 49 7,568 154.44 -- -- -- 15 Varanasi -- -- -- 133 4,370 32.9 16 WL Eastern Gonda -- -- -- 37 275 7.4 17 WL Lucknow -- -- -- 66 1,324 20.1 Total/ Average 510 49,911 97.87 1,942 58,631 30.2
For Official Use Only Special Assistance for Project Formation (SAPROF) for
Uttar Pradesh Natural Resources Management and Poverty Alleviation Project (UPNRMPAP)
Final Report-Volume II Annex 2-93
a) VFCs formed under the UP VFJM Rules (1997): Most of these have become dysfunctional.
b) VFCs that were reconstituted as JFMCs for inclusion under the NAP: The exact number is still unknown, but it is expected to be small.
c) JFMCs that were constituted for pursuing the NAP; Within this category, there are those JFMCs that received funding support and are believed to be ‘functional’, as well as those that were registered under the FDA but did not receive any funding support and are therefore not functional (or not activated).
Based on information received from some territorial Forest Divisions, it may be inferred that a majority of the JFMCs in the State are dysfunctional. For example, in Kheri (North) Division, only 43 of the total of 161 JFMCs (i.e., 27%) are believed to be functional.
Most JFMCs supported under the NAP have completed EPAs and plantation activities and are currently being supported for the maintenance of plantations. Plantations raised in the latter part of the 10th Five Year Plan are expected to be supported under the 11th Plan period for maintenance activities.
Active participation of local communities in preparation of micro-plans has been a grey area due to limited awareness generation and capacity building efforts. Field visits revealed that copies of micro-plans were not available with the JFMC but were kept only with the Member Secretary (Forester) in some instances.
Participation of women in JFMCs is dismal, and even those villages where the programme is believed to be doing well have little or no participation of women in decision-making. As in the case of PRIs, even in JFMCs it was found that the spouses of women members participated in the meetings on their behalf and the women representatives were often asked to put their signatures to meeting minutes without being aware of the contents of the same.
NGO involvement was limited under the NAP programme, although the UP Forestry Project had utilized services of NGOs for community mobilization and capacity building aspects.
7.6 FDA in UP
During the last two years of the 9th plan period (1997-2002), the Integrated Afforestation and Eco-development Project Scheme (IAEPS) was implemented through the Forest Development Agency (FDA) on a pilot basis. The results of the Scheme were found to be encouraging and subsequently, the National Afforestation Programme (NAP) was launched for implementation during the 10th plan by merging four centrally sponsored

For Official Use Only Special Assistance for Project Formation (SAPROF) for
Uttar Pradesh Natural Resources Management and Poverty Alleviation Project (UPNRMPAP)
Final Report-Volume II Annex 2-94
afforestation schemes43.
Broadly, NAP includes protection, conservation and sustainable utilization of natural resources through community participation as its broad objectives. The scheme is operationalised through the FDAs at the Divisional level and JFMCs at the village level. There is a provision under NAP to support to Eco Development Committees in PAs (sanctuaries and national parks), but this source has not been tapped in the State.
(1) Institutional Structure of FDA
FDA is a Federation of JFMCs within a territorial/wildlife Forest Division and is registered under the Societies Registration Act, 1860. JFMC, which is registered with the concerned CF, sign a Minutes of Understanding (MoU) with the concerned DFO who is also the Member-Secretary and CEO of the FDA.
FDAs have a two-tiered structure being composed of: a) General Body; and b) Executive Body. The Executive Body is the key decision making body of FDA with the Divisional Forest Officer (DFO) as the ex-officio Member Secretary.
(2) FDA Systems
Within the two-tiered institutional structure of the FDA in the State, all funding decisions and implementation plans are made according to the NAP guidelines. A summary of these
is provided in Table A2.7-5.
43 a) Integrated Afforestation and Eco-Development Project Scheme (IAEPS) b) Area Oriented Fuel wood and Fodder Projects Scheme (AOFFPS) c) Conservation and Development of Non-Timber Forest Produce including Medicinal Plants Scheme (NTFPS) d) Area Oriented Fuelwood and Fodder Projects Scheme (AOFFPS)
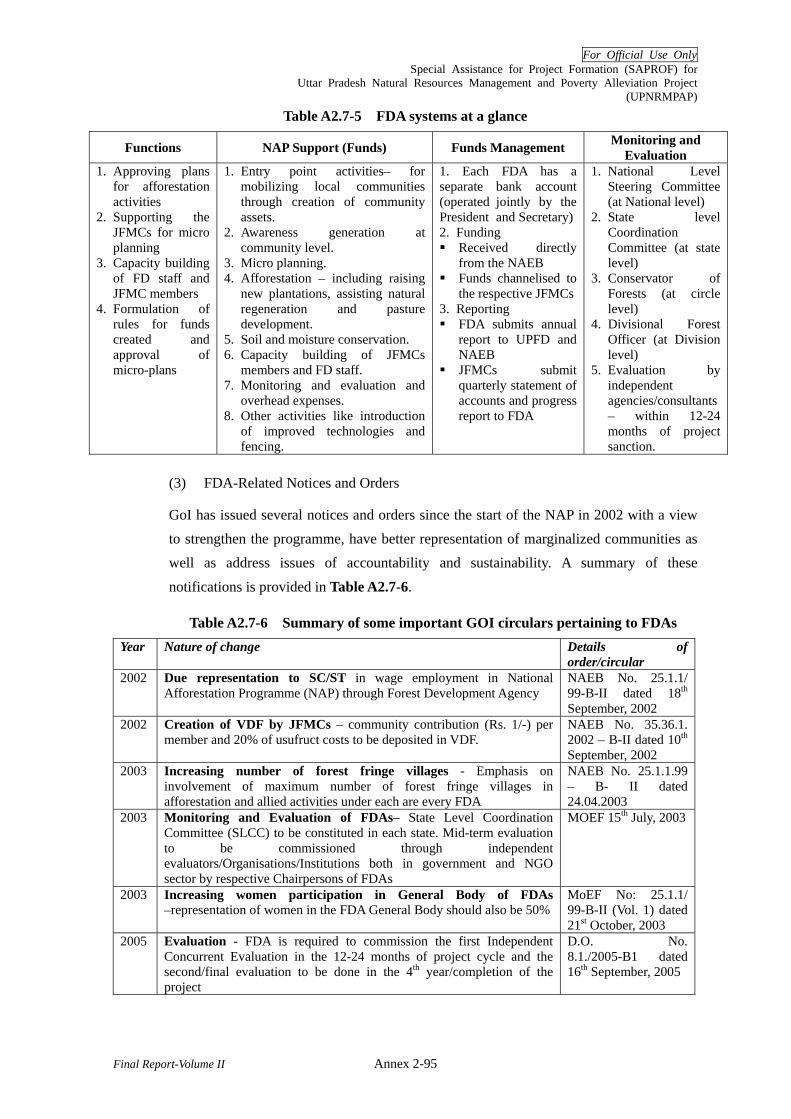
For Official Use Only Special Assistance for Project Formation (SAPROF) for
Uttar Pradesh Natural Resources Management and Poverty Alleviation Project (UPNRMPAP)
Final Report-Volume II Annex 2-95
Table A2.7-5 FDA systems at a glance
Functions NAP Support (Funds) Funds Management Monitoring and Evaluation
1. Approving plans for afforestation activities
2. Supporting the JFMCs for micro planning
3. Capacity building of FD staff and JFMC members
4. Formulation of rules for funds created and approval of micro-plans
1. Entry point activities– for mobilizing local communities through creation of community assets.
2. Awareness generation at community level.
3. Micro planning. 4. Afforestation – including raising
new plantations, assisting natural regeneration and pasture development.
5. Soil and moisture conservation. 6. Capacity building of JFMCs
members and FD staff. 7. Monitoring and evaluation and
overhead expenses. 8. Other activities like introduction
of improved technologies and fencing.
1. Each FDA has a separate bank account (operated jointly by the President and Secretary) 2. Funding Received directly
from the NAEB Funds channelised to
the respective JFMCs 3. Reporting FDA submits annual
report to UPFD and NAEB
JFMCs submit quarterly statement of accounts and progress report to FDA
1. National Level Steering Committee (at National level)
2. State level Coordination Committee (at state level)
3. Conservator of Forests (at circle level)
4. Divisional Forest Officer (at Division level)
5. Evaluation by independent agencies/consultants – within 12-24 months of project sanction.
(3) FDA-Related Notices and Orders
GoI has issued several notices and orders since the start of the NAP in 2002 with a view to strengthen the programme, have better representation of marginalized communities as well as address issues of accountability and sustainability. A summary of these
notifications is provided in Table A2.7-6.
Table A2.7-6 Summary of some important GOI circulars pertaining to FDAs Year Nature of change Details of
order/circular 2002 Due representation to SC/ST in wage employment in National
Afforestation Programme (NAP) through Forest Development Agency NAEB No. 25.1.1/ 99-B-II dated 18th September, 2002
2002 Creation of VDF by JFMCs – community contribution (Rs. 1/-) per member and 20% of usufruct costs to be deposited in VDF.
NAEB No. 35.36.1. 2002 – B-II dated 10th September, 2002
2003 Increasing number of forest fringe villages - Emphasis on involvement of maximum number of forest fringe villages in afforestation and allied activities under each are every FDA
NAEB No. 25.1.1.99 – B- II dated 24.04.2003
2003 Monitoring and Evaluation of FDAs– State Level Coordination Committee (SLCC) to be constituted in each state. Mid-term evaluation to be commissioned through independent evaluators/Organisations/Institutions both in government and NGO sector by respective Chairpersons of FDAs
MOEF 15th July, 2003
2003 Increasing women participation in General Body of FDAs –representation of women in the FDA General Body should also be 50%
MoEF No: 25.1.1/ 99-B-II (Vol. 1) dated 21st October, 2003
2005 Evaluation - FDA is required to commission the first Independent Concurrent Evaluation in the 12-24 months of project cycle and the second/final evaluation to be done in the 4th year/completion of the project
D.O. No. 8.1./2005-B1 dated 16th September, 2005

For Official Use Only Special Assistance for Project Formation (SAPROF) for
Uttar Pradesh Natural Resources Management and Poverty Alleviation Project (UPNRMPAP)
Final Report-Volume II Annex 2-96
(4) Current Status
In the State, FDAs were operationalised in five Forest Divisions during 2000-2002 on a pilot basis. Subsequently, under the 10th Five Year Plan, NAP was extended to include a total of 58 Forest/Wildlife Divisions, spread over 12 Territorial Circles and three Wildlife Circles. At the village level, 1,942 JFMCs have been constituted (as on 30th December, 2006)44.
In terms of physical progress, the various programme components under the FDAs have been instrumental in plantation activities in 34,338 ha, Assisted Natural Regeneration (ANR) in 19,324 ha and pasture development in 4,968 ha. A total of 8.78 million person days of employment have been generated.
The total disbursements made to the FDAs amounted to Rs.902.7 million over the period 2002-07, while the total amount utilized up to December 2006 was Rs.839.7 million
(Table A2.7-7).
Table A2.7-7 Annual Physical & Financial Progress of FDAs in Uttar Pradesh (2002-07)
Year No. of
sanctioned FDAs
No. of JFMCs45
Proposed area of project
(ha)
Area of plantations
(ha)
Total Project
Outlay (Rs million)
Amount Released
(Rs million)
Expenditure(Rs million)
2000/01 5 179 7,334 - 130.78 30.23 -2001/02 0 0 0 3,447 0 44.14 69.232002/03 25 826 33,615 2,348 579.24 200.12 147.532003/04 24 833 19,028 19,140 281.01 213.43 211.982004/05 2 54 2,000 13,974 30.52 181.64 203.502005/06 2 32 1,106 12,800 19.86 170.39 150.55
2006/07* - - - 6,922 - 45.07 56.90Total 58 1,942 63,083 58,361 1,041.41 885.02 839.69
Source: UPFD, January 2007. *:Up to Jan-07
In Year 2004/5 and 2005/6, MoFE conducted a sample survey on the survival rate of plantation under NAP scheme for 23 selected States. The figures are only indicative sine the number of samples are insufficient, but it appears that UP rank 21st among 23 surveyed states with the survival rate of 70% average.
44 QPR of National Afforestation Programme (October-December, 2006) CCF, JFM, Uttar Pradesh Forest Department, 45 This number includes a few VFCs (World Bank Project) that were reconstituted as JFMCs.

For Official Use Only Special Assistance for Project Formation (SAPROF) for
Uttar Pradesh Natural Resources Management and Poverty Alleviation Project (UPNRMPAP)
Final Report-Volume II Annex 2-97
Table A2.7-8 Survival rate of plantation under NAP Survival percentage No. Name of State Average Minimum Maximum
1 Jharkhand 88 88 88 2 Uttaranchal 88 85 90 3 Maharashtra 86 74 96 4 Arunachal Pradesh 85 85 85 5 Orissa 85 85 85 6 West Bengal 85 75 95 7 Tripura 84 80 90 8 Tamil Nadu 83 70 93 9 Chhattishgarh 82 80 85 10 Haryana 82 75 90 11 Andhra Pradesh 81 60 95 12 Madhya Pradesh 81 70 98 13 Gujarat 81 78 83 14 Punjab 80 80 80 15 Manipur 77 70 85 16 Sikkim 76 67 81 17 Mizoram 75 58 90 18 Karnataka 74 1 91 19 J&K 72 59 85 20 Rajasthan 71 60 79 21 Uttar Pradesh 70 55 84 22 Nagaland 65 60 70 23 Kerala 61 10 90
Source: Ministry of Environment and Forest, GOI
(5) Proposal for 11th Five Year Plan
For the 11th Five Year Plan UPFD has sent a proposal for financial support to the FDAs under 67 Territorial and 5 Wildlife Divisions totalling Rs. 1041.86 million.
8 Social Forestry
The term ‘social forestry’ came into prevalence in India in the 1970s, when the National Commission on Agriculture (1976) identified biotic pressure on forest lands as a cause for their degradation and recommended the growing of trees on areas outside the forests (viz., village commons and privately held marginal landholdings) for meeting the requirements of the local populace for fuelwood, fodder and small timber. For the first time in the history of ‘scientific’ management of forests, the needs of people were recognized officially; a distinction was made between forests for ‘economic’ purposes (revenue generation for the State) and ‘social’ purposes (for meeting people’s needs), and hence emerged the concept of social forestry.
The social forestry programme (SFP) was therefore introduced in the country with the aim of : i) taking pressure off from the State forest areas by increasing the biomass outside the forest areas (non-state forestland); ii) making better use of all underutilized and fallow lands; and at the same time iii) generating employment opportunities for the

For Official Use Only Special Assistance for Project Formation (SAPROF) for
Uttar Pradesh Natural Resources Management and Poverty Alleviation Project (UPNRMPAP)
Final Report-Volume II Annex 2-98
rural poor. Initially, the programme was funded through externally aided projects and subsequently through Government of India and respective State Governments.
SF plantations were raised on 16.57 million ha in entire India during 1980/81-1994/95, and thereafter over one million ha have been brought under plantation annually, taking the total area planted to over 20 million ha46 equivalent to 6% of the nation’s geographical area.
8.1 Origin, Scope and Growth of Social Forestry in UP
The social forestry was first introduced in the State through the World Bank aided UP Social Forestry Project in 1979/80. The project was implemented in two phases of five years each – Phase I from 1979/80 to 1984/85, and Phase II from 1985/86 to 1992/93. Thereafter, the social forestry in the State has continued to receive financial support from the State government.
The social forestry covers land areas outside notified forest areas, and includes the following:
i) Non-forestland Government lands - roadsides, canals banks, railway tracks, premises of government establishments
ii) Land under Revenue Department – cultivable and uncultivable wastelands iii) Community Lands / Panchayat Land – community pastures/wastelands adjoining
villages and under the ownership of the Gram Panchayat iv) Private Farmlands – including cultivated/uncultivated farmlands and uncultivable
wastelands v) Other Private Lands – lands owned by industries, private institutions, schools and
temples
Total plantations raised under the World Bank and state-sponsored social forestry programme (SFP) in the State (excluding farm forestry) add up to nearly 300,000 ha during the period 1979/80-2006/07.
8.2 Achievement of Social Forestry in UP
The achievements of the SFP in the State maybe discussed in three distinct categories: i) the WB-funded Social Forestry Project , Phase I; ii) Phase II of the same; and iii) the one supported under the Plans (1993/94 - 2006/07).
46 Based on an unpublished note by the Ministry of Environment and Forests, India: c.f. Saigal, S. (undated) Joint Forest Management: A decade and beyond: Resource Unit for Participatory Forestry (RUPFOR), Winrock International.
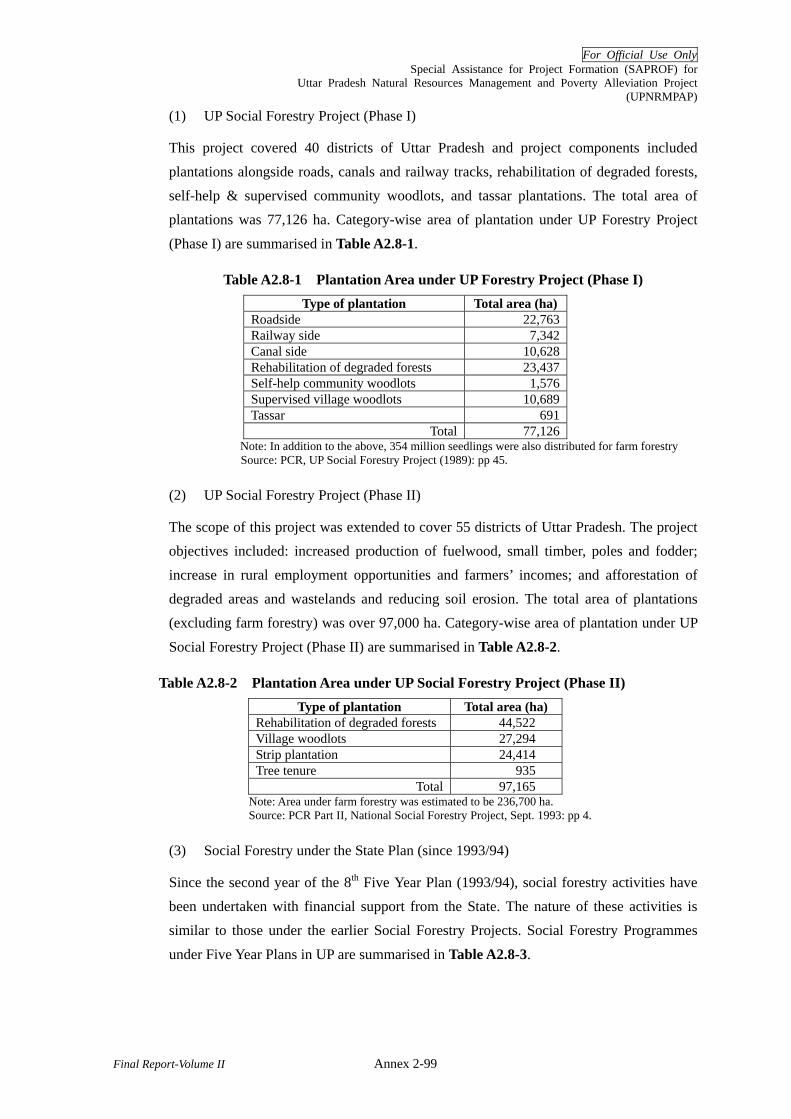
For Official Use Only Special Assistance for Project Formation (SAPROF) for
Uttar Pradesh Natural Resources Management and Poverty Alleviation Project (UPNRMPAP)
Final Report-Volume II Annex 2-99
(1) UP Social Forestry Project (Phase I)
This project covered 40 districts of Uttar Pradesh and project components included plantations alongside roads, canals and railway tracks, rehabilitation of degraded forests, self-help & supervised community woodlots, and tassar plantations. The total area of plantations was 77,126 ha. Category-wise area of plantation under UP Forestry Project
(Phase I) are summarised in Table A2.8-1.
Table A2.8-1 Plantation Area under UP Forestry Project (Phase I) Type of plantation Total area (ha)
Roadside 22,763 Railway side 7,342 Canal side 10,628 Rehabilitation of degraded forests 23,437 Self-help community woodlots 1,576 Supervised village woodlots 10,689 Tassar 691
Total 77,126 Note: In addition to the above, 354 million seedlings were also distributed for farm forestry Source: PCR, UP Social Forestry Project (1989): pp 45.
(2) UP Social Forestry Project (Phase II)
The scope of this project was extended to cover 55 districts of Uttar Pradesh. The project objectives included: increased production of fuelwood, small timber, poles and fodder; increase in rural employment opportunities and farmers’ incomes; and afforestation of degraded areas and wastelands and reducing soil erosion. The total area of plantations (excluding farm forestry) was over 97,000 ha. Category-wise area of plantation under UP
Social Forestry Project (Phase II) are summarised in Table A2.8-2.
Table A2.8-2 Plantation Area under UP Social Forestry Project (Phase II) Type of plantation Total area (ha)
Rehabilitation of degraded forests 44,522 Village woodlots 27,294 Strip plantation 24,414 Tree tenure 935
Total 97,165 Note: Area under farm forestry was estimated to be 236,700 ha. Source: PCR Part II, National Social Forestry Project, Sept. 1993: pp 4.
(3) Social Forestry under the State Plan (since 1993/94)
Since the second year of the 8th Five Year Plan (1993/94), social forestry activities have been undertaken with financial support from the State. The nature of these activities is similar to those under the earlier Social Forestry Projects. Social Forestry Programmes
under Five Year Plans in UP are summarised in Table A2.8-3.
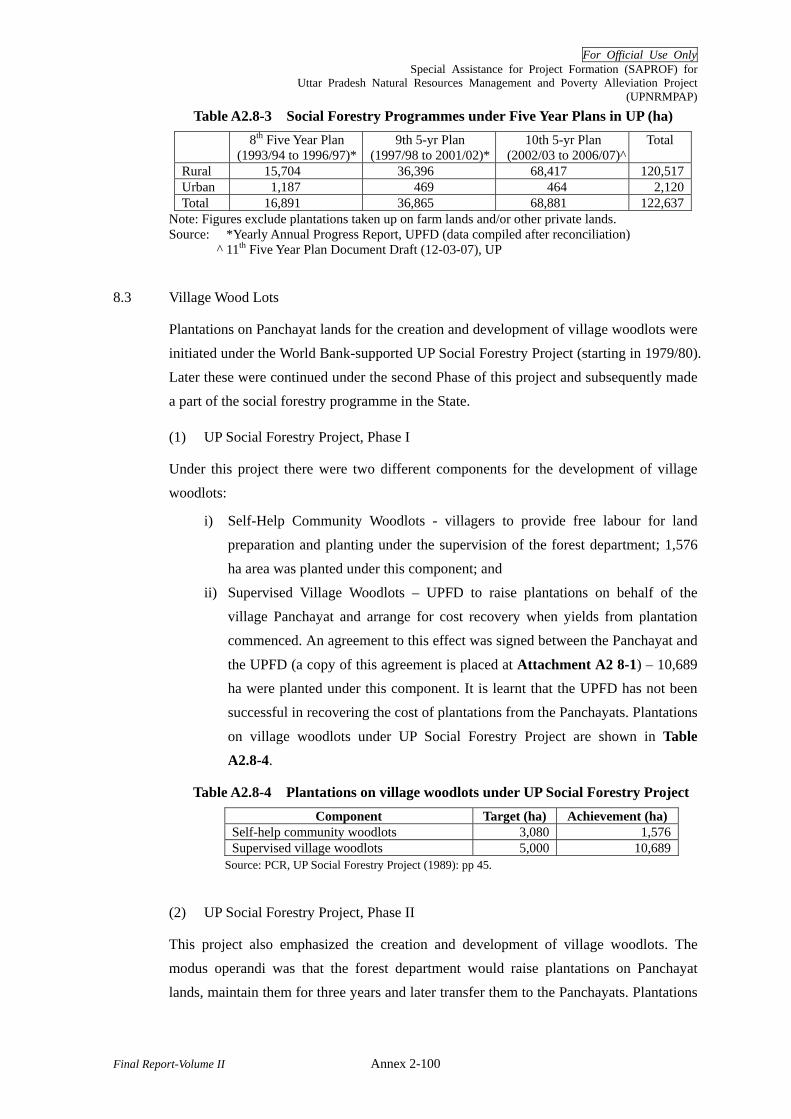
For Official Use Only Special Assistance for Project Formation (SAPROF) for
Uttar Pradesh Natural Resources Management and Poverty Alleviation Project (UPNRMPAP)
Final Report-Volume II Annex 2-100
Table A2.8-3 Social Forestry Programmes under Five Year Plans in UP (ha) 8th Five Year Plan
(1993/94 to 1996/97)*9th 5-yr Plan
(1997/98 to 2001/02)*10th 5-yr Plan
(2002/03 to 2006/07)^ Total
Rural 15,704 36,396 68,417 120,517Urban 1,187 469 464 2,120Total 16,891 36,865 68,881 122,637
Note: Figures exclude plantations taken up on farm lands and/or other private lands. Source: *Yearly Annual Progress Report, UPFD (data compiled after reconciliation)
^ 11th Five Year Plan Document Draft (12-03-07), UP
8.3 Village Wood Lots
Plantations on Panchayat lands for the creation and development of village woodlots were initiated under the World Bank-supported UP Social Forestry Project (starting in 1979/80). Later these were continued under the second Phase of this project and subsequently made a part of the social forestry programme in the State.
(1) UP Social Forestry Project, Phase I
Under this project there were two different components for the development of village woodlots:
i) Self-Help Community Woodlots - villagers to provide free labour for land preparation and planting under the supervision of the forest department; 1,576 ha area was planted under this component; and
ii) Supervised Village Woodlots – UPFD to raise plantations on behalf of the village Panchayat and arrange for cost recovery when yields from plantation commenced. An agreement to this effect was signed between the Panchayat and
the UPFD (a copy of this agreement is placed at Attachment A2 8-1) – 10,689 ha were planted under this component. It is learnt that the UPFD has not been successful in recovering the cost of plantations from the Panchayats. Plantations
on village woodlots under UP Social Forestry Project are shown in Table A2.8-4.
Table A2.8-4 Plantations on village woodlots under UP Social Forestry Project Component Target (ha) Achievement (ha)
Self-help community woodlots 3,080 1,576Supervised village woodlots 5,000 10,689
Source: PCR, UP Social Forestry Project (1989): pp 45.
(2) UP Social Forestry Project, Phase II
This project also emphasized the creation and development of village woodlots. The modus operandi was that the forest department would raise plantations on Panchayat lands, maintain them for three years and later transfer them to the Panchayats. Plantations
For Official Use Only Special Assistance for Project Formation (SAPROF) for
Uttar Pradesh Natural Resources Management and Poverty Alleviation Project (UPNRMPAP)
Final Report-Volume II Annex 2-101
were raised on 27,294 ha, against a target of 18,900 ha. This component was similar to the Supervised Village Woodlots component of Phase I of the Project.
(3) Initiatives by UPFD since 1993
Since 1993, creation of village woodlots has been taken up by UPFD. The operational aspects of this initiative are similar to those adopted under the UP Social Forestry Project (Phase II).
8.4 Learning from the Social Forestry Projects in UP
Under the UP Social Forestry (Phase I), the component of Self-Help Village Woodlots had limited success, and the project targets remained unachieved. The primary reason for this shortfall was identified as the reluctance on the part of the rural people to provide voluntary labour, particularly the economically poor whose only asset was their labour. Moreover, the Supervised Village Woodlot Model appeared to be a better alternative.
Plantations raised directly by the UPFD too have not had remarkable success. The following have been identified as the reasons for it:
Plantations on extremely alkaline lands limiting the survival rate of planted seedlings. Limited availability of community land for plantations greatly restricted the size of the
woodlots. This meant that: i) planted area was not sufficient to fulfill usufruct demands of the entire village community and hence community lost interest to conserve the plantations; and ii) it was difficult to protect the plantations.
Species selected for plantation were mostly commercial species which had limited NTFP yields for village communities.
8.5 Farm Forestry
Farm forestry may be referred to as the incorporation of commercial tree growing into farming systems. It can take various forms i.e. large-scale block plantations on farms or wide-spaced tree plantings inter-mixed with agriculture and plantations on boundaries of farmland (commonly referred to as agroforestry). It can also mean simple planting stock dispersal to individual farmers.
Government support for farm forestry in the State was initiated through the UP SFP Phase I and later extended under Phase II. From 1990 onwards, farm forestry activities have also been funded by GOUP.
The broad objectives of the farm forestry programme in the State are47:
47 Farm Forestry (a booklet), UPFD.

For Official Use Only Special Assistance for Project Formation (SAPROF) for
Uttar Pradesh Natural Resources Management and Poverty Alleviation Project (UPNRMPAP)
Final Report-Volume II Annex 2-102
To enhance agricultural production and economic progress along with increased employment opportunities;
To improve the productivity of lands currently unfit for cultivation; To provide alternate sources of fodder, fuelwood and timber for fulfilling the growing
demands; To reduce dependencies on available forest resources; and To increase forest cover for soil and moisture conservation.
(1) Legal framework related to farm forestry in UP
Farm forestry activities in the State are governed by the following Acts and Rules: i) UP Tree Protection Act, 1976 (subsequently revised), which regulates the
felling of trees; and ii) UP Transit of Timber and other Forest Produce Rules, 1978 which regulates
their transportation.
The Act and Rules mentioned above were found to constrain the spread of farm forestry in the State, and with a view to relax some of its provisions, Government Orders (GOs) were issued in the year 1997 and 2000. The details of the current provisions in the State
are summarised in Table A2.8-5 (the details of table below are provided in Attachment A2.8-2).
Table A2.8-5 Acts and Rules Pertaining to the Harvest and Transportation of Trees in UP Relevant Act/GO Main provisions
UP Tree Protection Act, 1976 (Subsequently Revised) and UP Transit of Timber and other Forest Produce Rules, 1978
Necessity to obtain permission for felling and transportation of trees harvested from agricultural lands.
Complete restriction on felling of 13 tree species (however only 7 out of these occur naturally in the State).
28 tree species are free from all provisions of the Act in 24 districts and 3 Tehsils (Sub-divisions)
The owner of tree is allowed to fell one tree per year for own use (apart from the restricted varieties). However, a 15 day notice has to be given to the competent authorities.
In 42 districts 20 tree species have been exempted from the necessity to obtain transit permits.
GO No. 2530/14-2-97/377/76 T.C. dated 14.8.1997
For 20 tree species, exemption from obtaining Transit permits in 42 districts.
GO No: 2758/14 – P. B.V 2000-7/93 dated 30-12-2000 and 2759/14 – P.B.V. 2000-7/93 dated 30-12-2000
In 46 districts, with the exception 16 tree species (out of which only 10 occur naturally in UP48) all other species of trees growing on private cultivated or uncultivated lands have been exempted from all provisions of the UP Tree Protection Act, 1976. In 24 other districts (and 3 sub-divisions of some of the districts included above) 28 tree species have been exempted from all provisions of the UP Tree Protection Act, 1976.
Source: Rules for cutting private trees (pamphlet), UPFD.
48 Azadiracta Indica, Madhuca latifolia, Shorea robusta, Ficus religiosa, Ficus bengalensis, Mangifera spp., Pterocarpus
marsupium, Acacia catechu, Dalbergia sissoo and Tectona grandis.

For Official Use Only Special Assistance for Project Formation (SAPROF) for
Uttar Pradesh Natural Resources Management and Poverty Alleviation Project (UPNRMPAP)
Final Report-Volume II Annex 2-103
(2) Progress and Achievements
Distribution to free/subsidised seedlings was initiated in the State since the Phase I of the UP Social Forestry Project. Under the Phase I (1979/80–1984/85) a total of 354 million seedlings were sold to farmers, out of which about 70% were purchased by medium and large farmers and the rest 30% by small farmers49.
Under the Phase II (1985/86-1992/93), an area of 236,700 ha (notional; 500 million seedlings were distributed) was brought under farm forestry in the State50. However, it was reported51 that during this period adoption of farm forestry in Eastern UP was lesser than that in the Western parts of UP. It was reported that there was increase in plantations by marginal farmers, along the boundaries of their fields.
Subsequent to the termination of the UP Social Forestry Project, the efforts of UPFD in promoting farm forestry have been rather limited. UPFD sells seedlings of suitable tree species to the farmers at specified rates (ranging from Rs.2.0 to Rs.10.0, depending on the species and age of the seedling) and also publishes some booklets/pamphlets for promotion of farm forestry among the farmers.
The recorded number of planting stock sold in the State (officially referred to as “Extensive Plantation”) through private and forest department nurseries, during the period
1995/96-2006/07 are presented in Table A2.8-6. A majority of these planting stock were raised by private (farmer) nurseries.
Table A2.8-6 Number of seedlings distributed/sold under Extensive Plantation
Period Duration No. of seedlings distributed (million)*
Annual seedling distribution (million)
1995/96 to 1999/00 4 years 1,012.37 253.092000/01 to 2004/05 4 years 763.47 190.872005/06 to 2006/07 (up to 28-02-07)
< 1 year (11 months)
571.86 571.86
Total 9 years 2,347.70 Average 260.86Note: * Includes seedlings distributed to farmers for private lands as well as institutional and other areas Source: UPFD Records
During the 10th Five Year Plan (2002-07), a total of 948.12 million planting stocks have been distributed under the Extensive Plantation Component, the details of which are
provided in Attachment A2.8-3.
49 Small farmer – between 1-2 ha; Medium farmer – 2-5 ha; Large farmer – More than 5 ha as their land holdings 50 These figures include the seedlings distributed to farmers in the State of Uttarakhand (which was then part of Uttar
Pradesh). 51 PCR Part II (Septemer, 1993) National Social Forestry Project, UPFD.

For Official Use Only Special Assistance for Project Formation (SAPROF) for
Uttar Pradesh Natural Resources Management and Poverty Alleviation Project (UPNRMPAP)
Final Report-Volume II Annex 2-104
(3) Role of UP Forest Corporation in Farm Forestry in UP
The UP Forest Corporation (UPFC) has established nurseries at different places for selling planting stocks to farmers for the promotion of farm forestry in the State. However, the most important contribution of the UPFC is towards providing a minimum price to the farmers for their tree-crop under a scheme for sale of private trees52. Under this scheme the UPFC has established a minimum support price for the sale of trees. In addition to trees grown on private farmlands, this scheme is also available to institutions. This scheme was initiated in 1988 with the objective of ensuring fair price to farmers and preventing their exploitation by contractors.
The UPFC has officers in all districts of the State and payment is made for the standing trees to the farmers and responsibilities for felling and transportation of trees are taken over by the UPFC. Minimum support rates prescribed by UP Forest Corporation are
shown in Table A2.3.8-7.
The following procedure is adopted for valuation and sale:
(i) The farmer applies to the nearest UPFC office for the valuation of trees growing on his/her land.
(ii) For valuation purposes a service charge of Rs 0.25 per tree for eucalyptus and Rs. 1.00 per m3 for other tree species has to be deposited by the farmer with UPFC; this fee is refundable in case the farmer sells his trees to the UPFC.
(iii) After deposition of service charge, officials of the UPFC assess the volume of trees/ plantation and estimate its value based on prescribed rates.
(iv) If the farmer is willing to sell the trees at the estimated value, then an affidavit (attested by Pradhan) along with a copy of the Khasra Khatoni (attested by the Patwari) is submitted to the UPFC.
(v) The corporation undertakes removal of trees (vi) Upon completion of felling, payment is made to the farmer through a cheque/
bank draft.
52 Uttar Pradesh Van Nigam Ke Badhte Kadam, UP Forest Corporation (undated pamphlet).
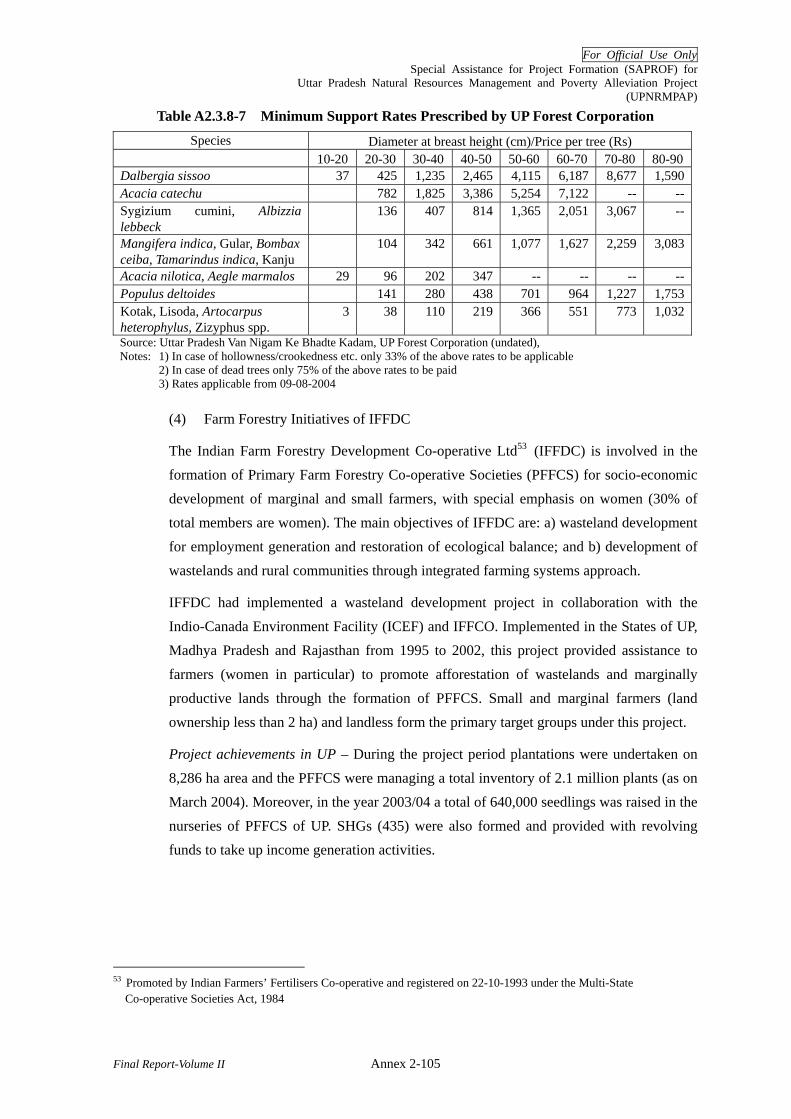
For Official Use Only Special Assistance for Project Formation (SAPROF) for
Uttar Pradesh Natural Resources Management and Poverty Alleviation Project (UPNRMPAP)
Final Report-Volume II Annex 2-105
Table A2.3.8-7 Minimum Support Rates Prescribed by UP Forest Corporation Species Diameter at breast height (cm)/Price per tree (Rs)
10-20 20-30 30-40 40-50 50-60 60-70 70-80 80-90Dalbergia sissoo 37 425 1,235 2,465 4,115 6,187 8,677 1,590Acacia catechu 782 1,825 3,386 5,254 7,122 -- --Sygizium cumini, Albizzia lebbeck
136 407 814 1,365 2,051 3,067 --
Mangifera indica, Gular, Bombax ceiba, Tamarindus indica, Kanju
104 342 661 1,077 1,627 2,259 3,083
Acacia nilotica, Aegle marmalos 29 96 202 347 -- -- -- --Populus deltoides 141 280 438 701 964 1,227 1,753Kotak, Lisoda, Artocarpus heterophylus, Zizyphus spp.
3 38 110 219 366 551 773 1,032
Source: Uttar Pradesh Van Nigam Ke Bhadte Kadam, UP Forest Corporation (undated), Notes: 1) In case of hollowness/crookedness etc. only 33% of the above rates to be applicable 2) In case of dead trees only 75% of the above rates to be paid 3) Rates applicable from 09-08-2004
(4) Farm Forestry Initiatives of IFFDC
The Indian Farm Forestry Development Co-operative Ltd53 (IFFDC) is involved in the formation of Primary Farm Forestry Co-operative Societies (PFFCS) for socio-economic development of marginal and small farmers, with special emphasis on women (30% of total members are women). The main objectives of IFFDC are: a) wasteland development for employment generation and restoration of ecological balance; and b) development of wastelands and rural communities through integrated farming systems approach.
IFFDC had implemented a wasteland development project in collaboration with the Indio-Canada Environment Facility (ICEF) and IFFCO. Implemented in the States of UP, Madhya Pradesh and Rajasthan from 1995 to 2002, this project provided assistance to farmers (women in particular) to promote afforestation of wastelands and marginally productive lands through the formation of PFFCS. Small and marginal farmers (land ownership less than 2 ha) and landless form the primary target groups under this project.
Project achievements in UP – During the project period plantations were undertaken on 8,286 ha area and the PFFCS were managing a total inventory of 2.1 million plants (as on March 2004). Moreover, in the year 2003/04 a total of 640,000 seedlings was raised in the nurseries of PFFCS of UP. SHGs (435) were also formed and provided with revolving funds to take up income generation activities.
53 Promoted by Indian Farmers’ Fertilisers Co-operative and registered on 22-10-1993 under the Multi-State
Co-operative Societies Act, 1984
For Official Use Only Special Assistance for Project Formation (SAPROF) for
Uttar Pradesh Natural Resources Management and Poverty Alleviation Project (UPNRMPAP)
Final Report-Volume II Annex 2-106
9 Ecodevelopment in Uttar Pradesh
9.1 Introduction
Protected areas programmes that displace people and extinguish their means for livelihood are the imperatives of conventional conservation. The exclusionary nature of protected areas has caused the intractable social conflicts and the resultant conservation crisis, which has prompted forums such as the World Parks Congress (in its tenth edition held in 2003) to call for inclusive management of protected areas and to factor in the local communities while designing protected area plans. The Programme of Work on Protected Areas (2004) formulated within the Convention on Biological Diversity requires the full participation of local communities and indigenous people at all levels in the management of protected areas.
The conventional protected area management in India left little room for addressing the community concerns. The increasing social conflicts around protected areas on the one hand and the lessons emerging from the practice of the Joint Forest Management programme on the other have prompted the emergence of new approach that promotes the livelihood of the forest dependent communities in and around the protected areas. This approach is widely referred to as “ecodevelopment” in India.
The Eighth Five Year Plan (1992-97) of India included ecodevelopment as a scheme for implementation in protected areas. The objective of ecodevelopment is to reduce the negative impact of local communities on the protected area and to mitigate the negative impact of the protected area on the local communities. The ecodevelopment concept, as a means to engage the local communities in conservation and to improve their livelihood security, has gradually gained wider acceptance. The India Ecodevelopment Project (IEDP), involving 7 well known protected areas of the country (no site from UP) and launched in 1998, with the financial support of the Global Environment Facility, has helped to strengthen the practice of ecodevelopment.
In UP, ecodevelopment started in the Dudhwa National Park during 1996-7. However, it was formalized in the State in 1999 with the issuance of a Government Resolution on the subject, followed by the issuance of a set of Guidelines formulated by the government in the same year. These two instruments set the basis for the implementation of ecodevelopment in the State. The objectives of the ecodevelopment programme in UP are as follows:
- Improve the livelihood with communities living inside and on the peripheries of protected areas within the limitations on resource use in protected area
- Strengthen the conservation of the protected area by mobilizing the local people in favour of conservation
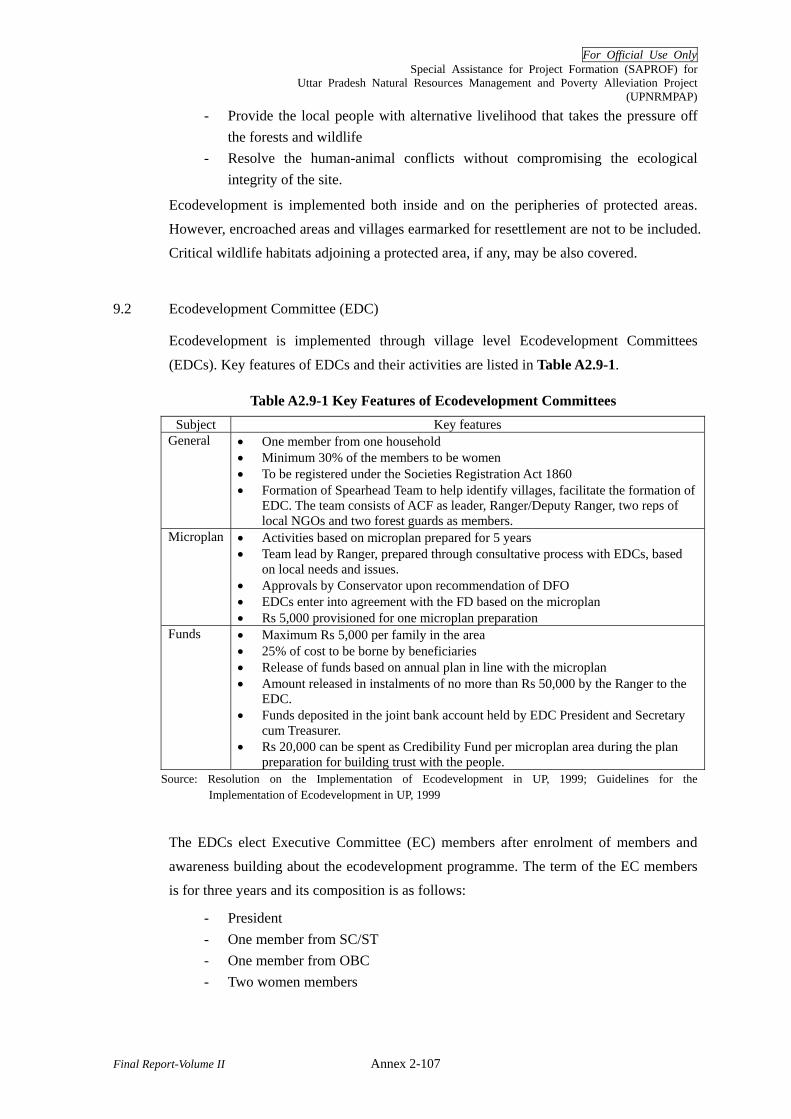
For Official Use Only Special Assistance for Project Formation (SAPROF) for
Uttar Pradesh Natural Resources Management and Poverty Alleviation Project (UPNRMPAP)
Final Report-Volume II Annex 2-107
- Provide the local people with alternative livelihood that takes the pressure off the forests and wildlife
- Resolve the human-animal conflicts without compromising the ecological integrity of the site.
Ecodevelopment is implemented both inside and on the peripheries of protected areas. However, encroached areas and villages earmarked for resettlement are not to be included. Critical wildlife habitats adjoining a protected area, if any, may be also covered.
9.2 Ecodevelopment Committee (EDC)
Ecodevelopment is implemented through village level Ecodevelopment Committees
(EDCs). Key features of EDCs and their activities are listed in Table A2.9-1.
Table A2.9-1 Key Features of Ecodevelopment Committees Subject Key features
General • One member from one household • Minimum 30% of the members to be women • To be registered under the Societies Registration Act 1860 • Formation of Spearhead Team to help identify villages, facilitate the formation of
EDC. The team consists of ACF as leader, Ranger/Deputy Ranger, two reps of local NGOs and two forest guards as members.
Microplan • Activities based on microplan prepared for 5 years • Team lead by Ranger, prepared through consultative process with EDCs, based
on local needs and issues. • Approvals by Conservator upon recommendation of DFO • EDCs enter into agreement with the FD based on the microplan • Rs 5,000 provisioned for one microplan preparation
Funds • Maximum Rs 5,000 per family in the area • 25% of cost to be borne by beneficiaries • Release of funds based on annual plan in line with the microplan • Amount released in instalments of no more than Rs 50,000 by the Ranger to the
EDC. • Funds deposited in the joint bank account held by EDC President and Secretary
cum Treasurer. • Rs 20,000 can be spent as Credibility Fund per microplan area during the plan
preparation for building trust with the people. Source: Resolution on the Implementation of Ecodevelopment in UP, 1999; Guidelines for the
Implementation of Ecodevelopment in UP, 1999
The EDCs elect Executive Committee (EC) members after enrolment of members and awareness building about the ecodevelopment programme. The term of the EC members is for three years and its composition is as follows:
- President - One member from SC/ST - One member from OBC - Two women members
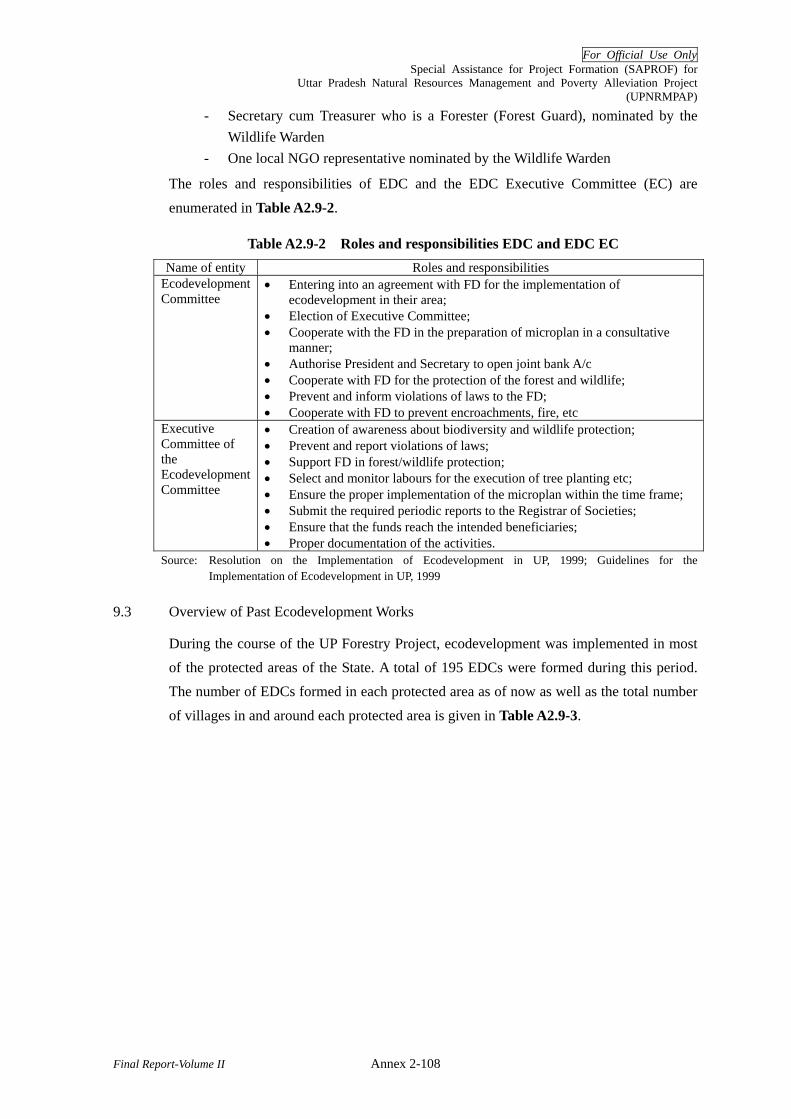
For Official Use Only Special Assistance for Project Formation (SAPROF) for
Uttar Pradesh Natural Resources Management and Poverty Alleviation Project (UPNRMPAP)
Final Report-Volume II Annex 2-108
- Secretary cum Treasurer who is a Forester (Forest Guard), nominated by the Wildlife Warden
- One local NGO representative nominated by the Wildlife Warden
The roles and responsibilities of EDC and the EDC Executive Committee (EC) are
enumerated in Table A2.9-2.
Table A2.9-2 Roles and responsibilities EDC and EDC EC Name of entity Roles and responsibilities
Ecodevelopment Committee
• Entering into an agreement with FD for the implementation of ecodevelopment in their area;
• Election of Executive Committee; • Cooperate with the FD in the preparation of microplan in a consultative
manner; • Authorise President and Secretary to open joint bank A/c • Cooperate with FD for the protection of the forest and wildlife; • Prevent and inform violations of laws to the FD; • Cooperate with FD to prevent encroachments, fire, etc
Executive Committee of the Ecodevelopment Committee
• Creation of awareness about biodiversity and wildlife protection; • Prevent and report violations of laws; • Support FD in forest/wildlife protection; • Select and monitor labours for the execution of tree planting etc; • Ensure the proper implementation of the microplan within the time frame; • Submit the required periodic reports to the Registrar of Societies; • Ensure that the funds reach the intended beneficiaries; • Proper documentation of the activities.
Source: Resolution on the Implementation of Ecodevelopment in UP, 1999; Guidelines for the Implementation of Ecodevelopment in UP, 1999
9.3 Overview of Past Ecodevelopment Works
During the course of the UP Forestry Project, ecodevelopment was implemented in most of the protected areas of the State. A total of 195 EDCs were formed during this period. The number of EDCs formed in each protected area as of now as well as the total number
of villages in and around each protected area is given in Table A2.9-3.

For Official Use Only Special Assistance for Project Formation (SAPROF) for
Uttar Pradesh Natural Resources Management and Poverty Alleviation Project (UPNRMPAP)
Final Report-Volume II Annex 2-109
Table A2.9-3 Number of EDCs and Villages in/around Protected Areas Name of protected
area Number of EDC
Number of village
Name of protected area
Number of EDC
Number of village
Chandraprabha 5 43 Dudhwa 49 131Kaimur 24 130 Kishanpur 15 42Ranipur 21 48 Katarniaghat 29 61Vijay Sagar 4 18 Sohelwa 14 105National Chambal 3 130 Sohagibarwa 21 86Sur Sarovar 4 11 Kachua - 4Patna 2 16 JP Narayanan - 12Hastinapur 1 389 Mahavirswami - 5Saman 2 12 Parvati Arga - 16Sandi 4 23 Bakhira - 18Nawabganj 1 19 Okhla - 26Samaspur 1 21 Ambedkar - 4Lakh Bahosi 1 21 Total 201 1,391
Sources: Note about Ecodevelopment in UP by the UPFD; interviews with FD officials
9.4 Activities and Budget
The community based activities undertaken by the EDCs include fodder development, measures to prevent crop raiding by wildlife, plantation works, fish farming and community based livelihood programmes while the support for individuals include the supply of new breeds of cattle, assistance to open small shops, farming and other livelihood measures.
A development fund was also set up. A total of Rs. 69.96 million was released for ecodevelopment in 195 EDCs during the World Bank-funded UP Forestry Project, against the total budget outlay of Rs. 92.54 million, with an average allocation of about Rs. 350,000 per EDC for five years54. There has been a shortage of funds for ecodevelopment after the UP Forestry Project, and therefore EDCs could not continue to be at the same level of activity after the said project.
54 UP Forestry Project: Project Completion Report (2003). UPFD
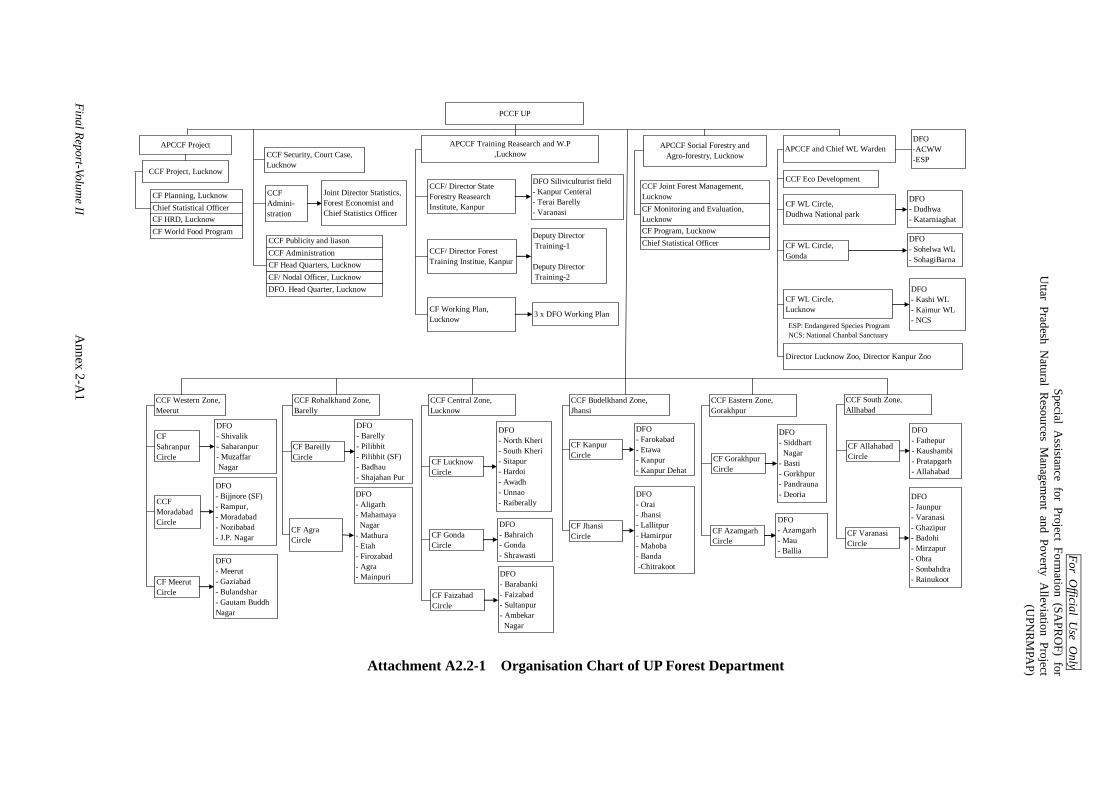
For Official U
se Only
Special Assistance for Project Form
ation (SAPR
OF) for
Uttar Pradesh N
atural Resources M
anagement and Poverty A
lleviation Project(U
PNR
MPA
P)
Final Report-Volume II A
nnex 2-A1
APCCF Training Reasearch and W.P,Lucknow
CCF/ Director StateForestry ReasearchInstitute, Kanpur
DFO Siliviculturist field- Kanpur Centeral- Terai Barelly- Varanasi
CCF/ Director ForestTraining Institue, Kanpur
Deputy Director Training-1
Deputy Director Training-2
CF Working Plan,Lucknow
3 x DFO Working Plan
CCF Project, Lucknow
APCCF ProjectCCF Security, Court Case,Lucknow
CCFAdmini-stration
Joint Director Statistics,Forest Economist andChief Statistics Officer
APCCF Social Forestry andAgro-forestry, Lucknow
APCCF and Chief WL Warden
CCF Eco Development
CF WL Circle,Lucknow
CF WL Circle,Dudhwa National park
CF WL Circle,Gonda
PCCF UP
Director Lucknow Zoo, Director Kanpur Zoo
DFO- Dudhwa- Katarniaghat
DFO- Sohelwa WL- SohagiBarna
DFO- Kashi WL- Kaimur WL- NCS
CCF Western Zone,Meerut
CCF Rohalkhand Zone,Barelly
CCF Central Zone,Lucknow
CCF Budelkhand Zone,Jhansi
CCF Eastern Zone,Gorakhpur
CCF South Zone,Allhabad
CFSahranpurCircle
DFO- Shivalik- Saharanpur- Muzaffar Nagar
CCFMoradabadCircle
DFO- Bijjnore (SF)- Rampur,- Moradabad- Nozibabad- J.P. Nagar
CF MeerutCircle
DFO- Meerut- Gaziabad- Bulandshar- Gautam BuddhNagar
CF BareillyCircle
DFO- Barelly- Pilibhit- Pilibhit (SF)- Badhau- Shajahan Pur
CF AgraCircle
DFO- Aligarh- Mahamaya Nagar- Mathura- Etah- Firozabad- Agra- Mainpuri
CF LucknowCircle
DFO- North Kheri- South Kheri- Sitapur- Hardoi- Awadh- Unnao- Raiberally
CF GondaCircle
DFO- Bahraich- Gonda- Shrawasti
DFO- Barabanki- Faizabad- Sultanpur- Ambekar Nagar
CF FaizabadCircle
DFO- Farokabad- Etawa- Kanpur- Kanpur Dehat
CF KanpurCircle
DFO- Orai- Jhansi- Lallitpur- Hamirpur- Mahoba- Banda -Chitrakoot
CF JhansiCircle
DFO- Siddhart Nagar- Basti- Gorkhpur- Pandrauna- Deoria
CF GorakhpurCircle
DFO- Azamgarh- Mau- Ballia
CF AzamgarhCircle
DFO- Fathepur- Kaushambi- Pratapgarh- Allahabad
CF AllahabadCircle
DFO- Jaunpur- Varanasi- Ghazipur- Badohi- Mirzapur- Obra- Sonbahdra- Rainukoot
CF VaranasiCircle
CF Planning, LucknowChief Statistical OfficerCF HRD, LucknowCF World Food Program
CCF Publicity and liasonCCF AdministrationCF Head Quarters, LucknowCF/ Nodal Officer, LucknowDFO. Head Quarter, Lucknow
CCF Joint Forest Management,LucknowCF Monitoring and Evaluation,LucknowCF Program, LucknowChief Statistical Officer
DFO-ACWW-ESP
ESP: Endangered Species ProgramNCS: National Chanbal Sanctuary
Attachment A2.2-1 Organisation Chart of UP Forest Department
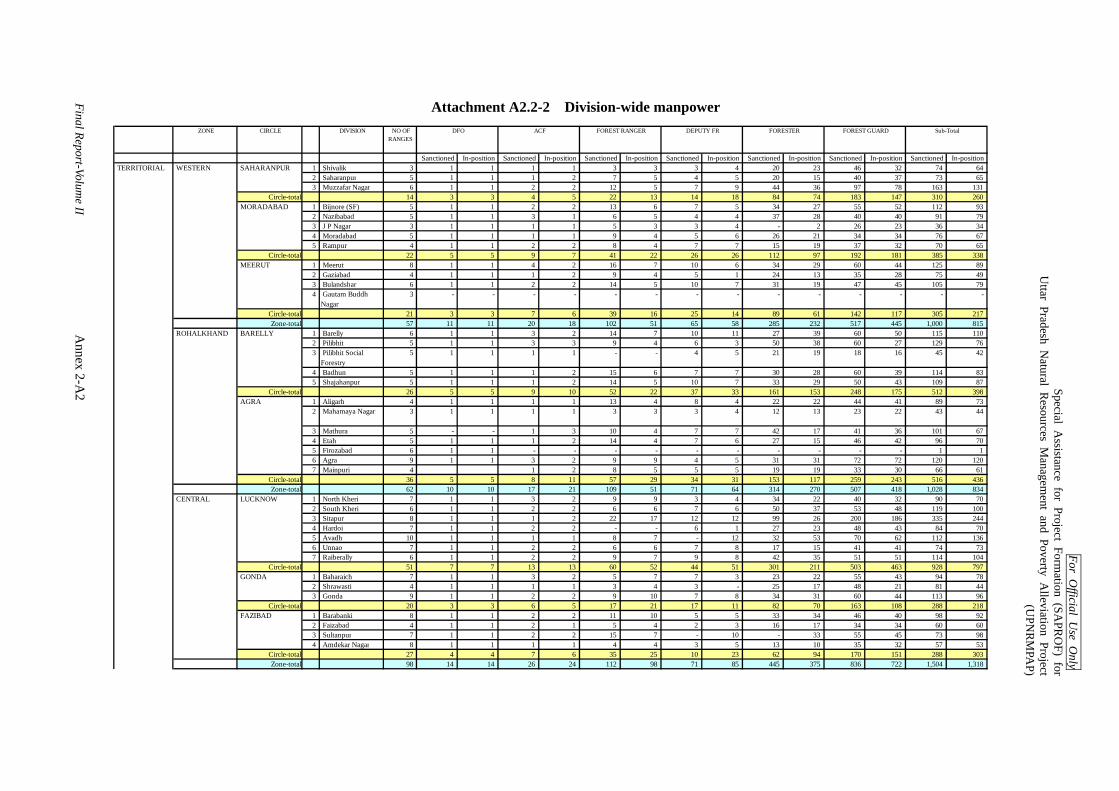
For Official U
se Only
Special Assistance for Project Form
ation (SAPR
OF) for
Uttar Pradesh N
atural Resources M
anagement and Poverty A
lleviation Project(U
PNR
MPA
P)
Final Report-Volume II A
nnex 2-A2
Attachment A2.2-2 Division-wide manpower ZONE CIRCLE DIVISION NO OF
RANGES
Sanctioned In-position Sanctioned In-position Sanctioned In-position Sanctioned In-position Sanctioned In-position Sanctioned In-position Sanctioned In-position TERRITORIAL WESTERN SAHARANPUR 1 Shivalik 3 1 1 1 1 3 3 3 4 20 23 46 32 74 64
2 Saharanpur 5 1 1 1 2 7 5 4 5 20 15 40 37 73 65 3 Muzzafar Nagar 6 1 1 2 2 12 5 7 9 44 36 97 78 163 131
Circle-total 14 3 3 4 5 22 13 14 18 84 74 183 147 310 260 MORADABAD 1 Bijnore (SF) 5 1 1 2 2 13 6 7 5 34 27 55 52 112 93
2 Nazibabad 5 1 1 3 1 6 5 4 4 37 28 40 40 91 79 3 J P Nagar 3 1 1 1 1 5 3 3 4 - 2 26 23 36 34 4 Moradabad 5 1 1 1 1 9 4 5 6 26 21 34 34 76 67 5 Rampur 4 1 1 2 2 8 4 7 7 15 19 37 32 70 65
Circle-total 22 5 5 9 7 41 22 26 26 112 97 192 181 385 338 MEERUT 1 Meerut 8 1 1 4 2 16 7 10 6 34 29 60 44 125 89
2 Gaziabad 4 1 1 1 2 9 4 5 1 24 13 35 28 75 49 3 Bulandshar 6 1 1 2 2 14 5 10 7 31 19 47 45 105 79 4 Gautam Buddh
Nagar 3 - - - - - - - - - - - - - -
Circle-total 21 3 3 7 6 39 16 25 14 89 61 142 117 305 217 Zone-total 57 11 11 20 18 102 51 65 58 285 232 517 445 1,000 815
ROHALKHAND BARELLY 1 Barelly 6 1 1 3 2 14 7 10 11 27 39 60 50 115 110 2 Pilibhit 5 1 1 3 3 9 4 6 3 50 38 60 27 129 76 3 Pilibhit Social
Forestry 5 1 1 1 1 - - 4 5 21 19 18 16 45 42
4 Badhun 5 1 1 1 2 15 6 7 7 30 28 60 39 114 83 5 Shajahanpur 5 1 1 1 2 14 5 10 7 33 29 50 43 109 87
Circle-total 26 5 5 9 10 52 22 37 33 161 153 248 175 512 398 AGRA 1 Aligarh 4 1 1 1 1 13 4 8 4 22 22 44 41 89 73
2 Mahamaya Nagar 3 1 1 1 1 3 3 3 4 12 13 23 22 43 44
3 Mathura 5 - - 1 3 10 4 7 7 42 17 41 36 101 67 4 Etah 5 1 1 1 2 14 4 7 6 27 15 46 42 96 70 5 Firozabad 6 1 1 - - - - - - - - - - 1 1 6 Agra 9 1 1 3 2 9 9 4 5 31 31 72 72 120 120 7 Mainpuri 4 1 2 8 5 5 5 19 19 33 30 66 61
Circle-total 36 5 5 8 11 57 29 34 31 153 117 259 243 516 436 Zone-total 62 10 10 17 21 109 51 71 64 314 270 507 418 1,028 834
CENTRAL LUCKNOW 1 North Kheri 7 1 1 3 2 9 9 3 4 34 22 40 32 90 70 2 South Kheri 6 1 1 2 2 6 6 7 6 50 37 53 48 119 100 3 Sitapur 8 1 1 1 2 22 17 12 12 99 26 200 186 335 244 4 Hardoi 7 1 1 2 2 - - 6 1 27 23 48 43 84 70 5 Avadh 10 1 1 1 1 8 7 - 12 32 53 70 62 112 136 6 Unnao 7 1 1 2 2 6 6 7 8 17 15 41 41 74 73 7 Raiberally 6 1 1 2 2 9 7 9 8 42 35 51 51 114 104
Circle-total 51 7 7 13 13 60 52 44 51 301 211 503 463 928 797 GONDA 1 Baharaich 7 1 1 3 2 5 7 7 3 23 22 55 43 94 78
2 Shrawasti 4 1 1 1 1 3 4 3 - 25 17 48 21 81 44 3 Gonda 9 1 1 2 2 9 10 7 8 34 31 60 44 113 96
Circle-total 20 3 3 6 5 17 21 17 11 82 70 163 108 288 218 FAZIBAD 1 Barabanki 8 1 1 2 2 11 10 5 5 33 34 46 40 98 92
2 Faizabad 4 1 1 2 1 5 4 2 3 16 17 34 34 60 60 3 Sultanpur 7 1 1 2 2 15 7 - 10 - 33 55 45 73 98 4 Amdekar Nagar 8 1 1 1 1 4 4 3 5 13 10 35 32 57 53
Circle-total 27 4 4 7 6 35 25 10 23 62 94 170 151 288 303 Zone-total 98 14 14 26 24 112 98 71 85 445 375 836 722 1,504 1,318
FORESTER FOREST GUARD Sub-Total DFO ACF FOREST RANGER DEPUTY FR
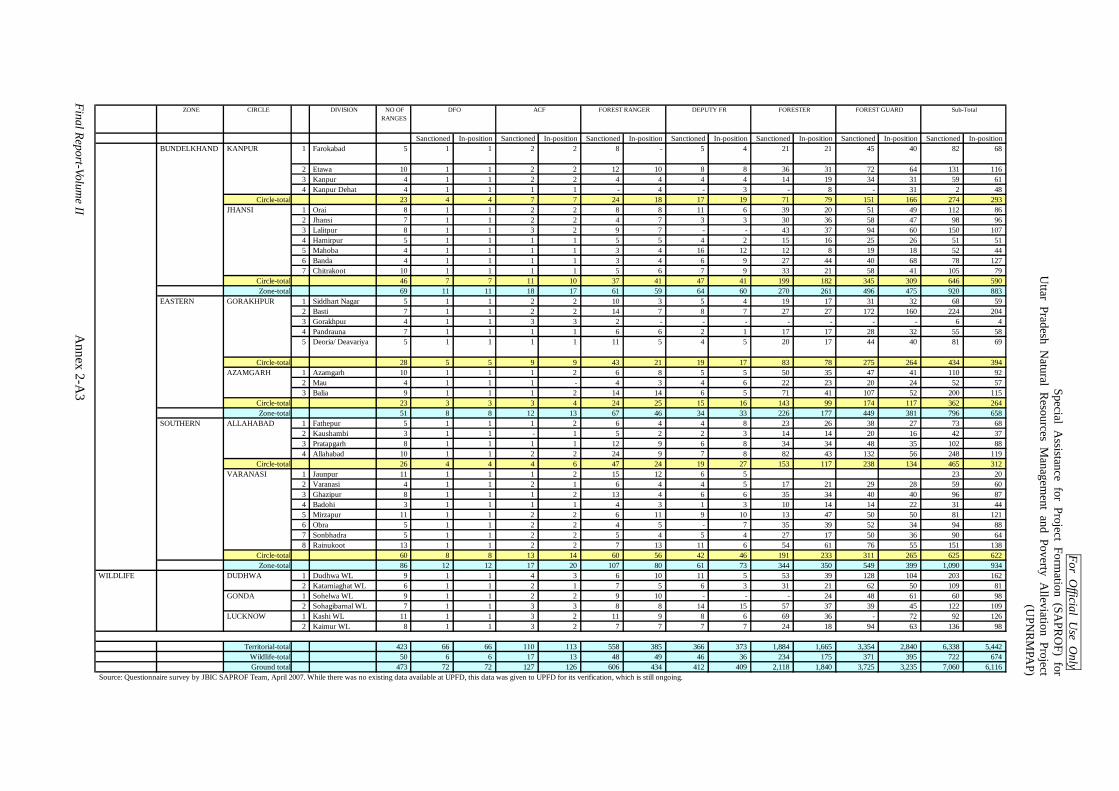
For Official U
se Only
Special Assistance for Project Form
ation (SAPR
OF) for
Uttar Pradesh N
atural Resources M
anagement and Poverty A
lleviation Project(U
PNR
MPA
P)
Final Report-Volume II A
nnex 2-A3
ZONE CIRCLE DIVISION NO OFRANGES
Sanctioned In-position Sanctioned In-position Sanctioned In-position Sanctioned In-position Sanctioned In-position Sanctioned In-position Sanctioned In-position BUNDELKHAND KANPUR 1 Farokabad 5 1 1 2 2 8 - 5 4 21 21 45 40 82 68
2 Etawa 10 1 1 2 2 12 10 8 8 36 31 72 64 131 116 3 Kanpur 4 1 1 2 2 4 4 4 4 14 19 34 31 59 61 4 Kanpur Dehat 4 1 1 1 1 - 4 - 3 - 8 - 31 2 48
Circle-total 23 4 4 7 7 24 18 17 19 71 79 151 166 274 293JHANSI 1 Orai 8 1 1 2 2 8 8 11 6 39 20 51 49 112 86
2 Jhansi 7 1 1 2 2 4 7 3 3 30 36 58 47 98 96 3 Lalitpur 8 1 1 3 2 9 7 - - 43 37 94 60 150 107 4 Hamirpur 5 1 1 1 1 5 5 4 2 15 16 25 26 51 51 5 Mahoba 4 1 1 1 1 3 4 16 12 12 8 19 18 52 44 6 Banda 4 1 1 1 1 3 4 6 9 27 44 40 68 78 127 7 Chitrakoot 10 1 1 1 1 5 6 7 9 33 21 58 41 105 79
Circle-total 46 7 7 11 10 37 41 47 41 199 182 345 309 646 590 Zone-total 69 11 11 18 17 61 59 64 60 270 261 496 475 920 883
EASTERN GORAKHPUR 1 Siddhart Nagar 5 1 1 2 2 10 3 5 4 19 17 31 32 68 59 2 Basti 7 1 1 2 2 14 7 8 7 27 27 172 160 224 204 3 Gorakhpur 4 1 1 3 3 2 - - - - - - - 6 4 4 Pandrauna 7 1 1 1 1 6 6 2 1 17 17 28 32 55 58 5 Deoria/ Deavariya 5 1 1 1 1 11 5 4 5 20 17 44 40 81 69
Circle-total 28 5 5 9 9 43 21 19 17 83 78 275 264 434 394AZAMGARH 1 Azamgarh 10 1 1 1 2 6 8 5 5 50 35 47 41 110 92
2 Mau 4 1 1 1 - 4 3 4 6 22 23 20 24 52 57 3 Balia 9 1 1 1 2 14 14 6 5 71 41 107 52 200 115
Circle-total 23 3 3 3 4 24 25 15 16 143 99 174 117 362 264 Zone-total 51 8 8 12 13 67 46 34 33 226 177 449 381 796 658
SOUTHERN ALLAHABAD 1 Fathepur 5 1 1 1 2 6 4 4 8 23 26 38 27 73 68 2 Kaushambi 3 1 1 - 1 5 2 2 3 14 14 20 16 42 37 3 Pratapgarh 8 1 1 1 1 12 9 6 8 34 34 48 35 102 88 4 Allahabad 10 1 1 2 2 24 9 7 8 82 43 132 56 248 119
Circle-total 26 4 4 4 6 47 24 19 27 153 117 238 134 465 312VARANASI 1 Jaunpur 11 1 1 1 2 15 12 6 5 23 20
2 Varanasi 4 1 1 2 1 6 4 4 5 17 21 29 28 59 60 3 Ghazipur 8 1 1 1 2 13 4 6 6 35 34 40 40 96 87 4 Badohi 3 1 1 1 1 4 3 1 3 10 14 14 22 31 44 5 Mirzapur 11 1 1 2 2 6 11 9 10 13 47 50 50 81 121 6 Obra 5 1 1 2 2 4 5 - 7 35 39 52 34 94 88 7 Sonbhadra 5 1 1 2 2 5 4 5 4 27 17 50 36 90 64 8 Rainukoot 13 1 1 2 2 7 13 11 6 54 61 76 55 151 138
Circle-total 60 8 8 13 14 60 56 42 46 191 233 311 265 625 622 Zone-total 86 12 12 17 20 107 80 61 73 344 350 549 399 1,090 934
DUDHWA 1 Dudhwa WL 9 1 1 4 3 6 10 11 5 53 39 128 104 203 162 2 Katarniaghat WL 6 1 1 2 1 7 5 6 3 31 21 62 50 109 81
GONDA 1 Sohelwa WL 9 1 1 2 2 9 10 - - - 24 48 61 60 98 2 Sohagibarnal WL 7 1 1 3 3 8 8 14 15 57 37 39 45 122 109
LUCKNOW 1 Kashi WL 11 1 1 3 2 11 9 8 6 69 36 - 72 92 126 2 Kaimur WL 8 1 1 3 2 7 7 7 7 24 18 94 63 136 98
Territorial-total 423 66 66 110 113 558 385 366 373 1,884 1,665 3,354 2,840 6,338 5,442 Wildlife-total 50 6 6 17 13 48 49 46 36 234 175 371 395 722 674 Ground total 473 72 72 127 126 606 434 412 409 2,118 1,840 3,725 3,235 7,060 6,116
Source: Questionnaire survey by JBIC SAPROF Team, April 2007. While there was no existing data available at UPFD, this data was given to UPFD for its verification, which is still ongoing.
Sub-Total FOREST RANGER DEPUTY FR FORESTER FOREST GUARD
WILDLIFE
DFO ACF
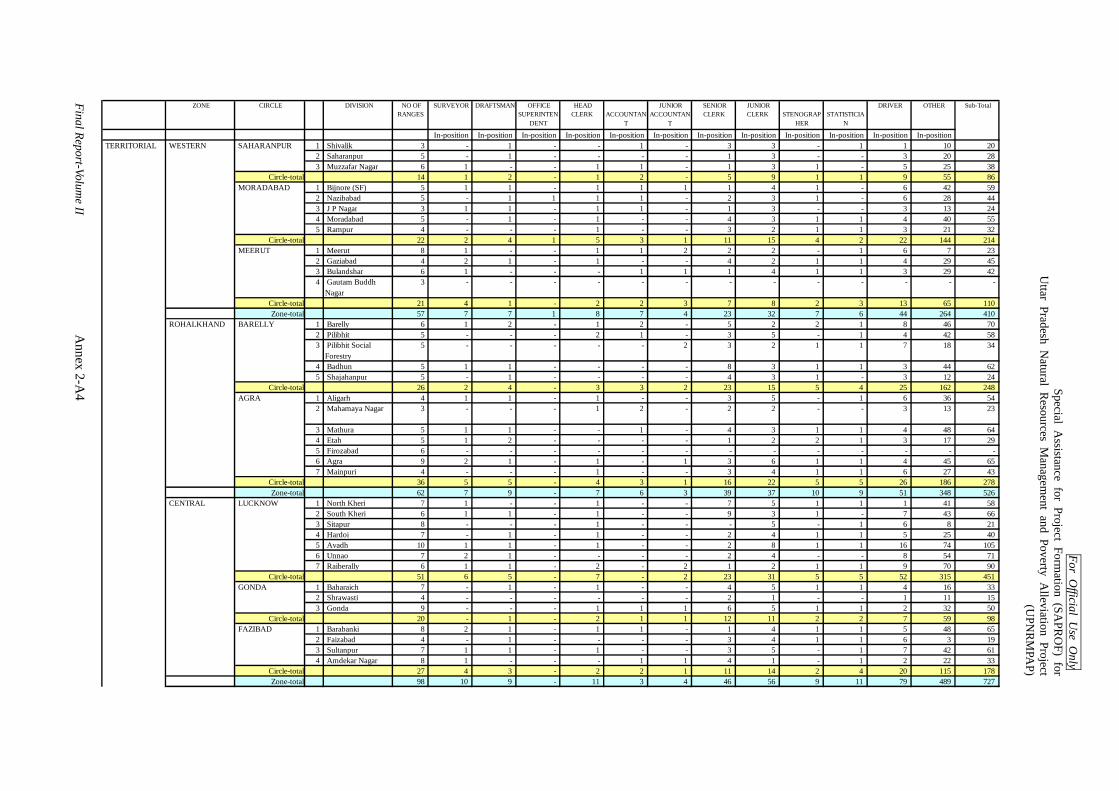
For Official U
se Only
Special Assistance for Project Form
ation (SAPR
OF) for
Uttar Pradesh N
atural Resources M
anagement and Poverty A
lleviation Project(U
PNR
MPA
P)
Final Report-Volume II A
nnex 2-A4
ZONE CIRCLE DIVISION NO OFRANGES
SURVEYOR DRAFTSMAN OFFICESUPERINTEN
DENT
HEADCLERK
ACCOUNTAN
T
JUNIORACCOUNTAN
T
SENIORCLERK
JUNIORCLERK
STENOGRAP
HER
STATISTICIA
N
DRIVER OTHER Sub-Total
In-position In-position In-position In-position In-position In-position In-position In-position In-position In-position In-position In-position TERRITORIAL WESTERN SAHARANPUR 1 Shivalik 3 - 1 - - 1 - 3 3 - 1 1 10 20
2 Saharanpur 5 - 1 - - - - 1 3 - - 3 20 28 3 Muzzafar Nagar 6 1 - - 1 1 - 1 3 1 - 5 25 38
Circle-total 14 1 2 - 1 2 - 5 9 1 1 9 55 86 MORADABAD 1 Bijnore (SF) 5 1 1 - 1 1 1 1 4 1 - 6 42 59
2 Nazibabad 5 - 1 1 1 1 - 2 3 1 - 6 28 44 3 J P Nagar 3 1 1 - 1 1 - 1 3 - - 3 13 24 4 Moradabad 5 - 1 - 1 - - 4 3 1 1 4 40 55 5 Rampur 4 - - - 1 - - 3 2 1 1 3 21 32
Circle-total 22 2 4 1 5 3 1 11 15 4 2 22 144 214 MEERUT 1 Meerut 8 1 - - 1 1 2 2 2 - 1 6 7 23
2 Gaziabad 4 2 1 - 1 - - 4 2 1 1 4 29 45 3 Bulandshar 6 1 - - - 1 1 1 4 1 1 3 29 42 4 Gautam Buddh
Nagar 3 - - - - - - - - - - - - -
Circle-total 21 4 1 - 2 2 3 7 8 2 3 13 65 110 Zone-total 57 7 7 1 8 7 4 23 32 7 6 44 264 410
ROHALKHAND BARELLY 1 Barelly 6 1 2 - 1 2 - 5 2 2 1 8 46 70 2 Pilibhit 5 - - - 2 1 - 3 5 - 1 4 42 58 3 Pilibhit Social
Forestry 5 - - - - - 2 3 2 1 1 7 18 34
4 Badhun 5 1 1 - - - - 8 3 1 1 3 44 62 5 Shajahanpur 5 - 1 - - - - 4 3 1 - 3 12 24
Circle-total 26 2 4 - 3 3 2 23 15 5 4 25 162 248 AGRA 1 Aligarh 4 1 1 - 1 - - 3 5 - 1 6 36 54
2 Mahamaya Nagar 3 - - - 1 2 - 2 2 - - 3 13 23
3 Mathura 5 1 1 - - 1 - 4 3 1 1 4 48 64 4 Etah 5 1 2 - - - - 1 2 2 1 3 17 29 5 Firozabad 6 - - - - - - - - - - - - - 6 Agra 9 2 1 - 1 - 1 3 6 1 1 4 45 65 7 Mainpuri 4 - - - 1 - - 3 4 1 1 6 27 43
Circle-total 36 5 5 - 4 3 1 16 22 5 5 26 186 278 Zone-total 62 7 9 - 7 6 3 39 37 10 9 51 348 526
CENTRAL LUCKNOW 1 North Kheri 7 1 - - 1 - - 7 5 1 1 1 41 58 2 South Kheri 6 1 1 - 1 - - 9 3 1 - 7 43 66 3 Sitapur 8 - - - 1 - - - 5 - 1 6 8 21 4 Hardoi 7 - 1 - 1 - - 2 4 1 1 5 25 40 5 Avadh 10 1 1 - 1 - - 2 8 1 1 16 74 105 6 Unnao 7 2 1 - - - - 2 4 - - 8 54 71 7 Raiberally 6 1 1 - 2 - 2 1 2 1 1 9 70 90
Circle-total 51 6 5 - 7 - 2 23 31 5 5 52 315 451 GONDA 1 Baharaich 7 - 1 - 1 - - 4 5 1 1 4 16 33
2 Shrawasti 4 - - - - - - 2 1 - - 1 11 15 3 Gonda 9 - - - 1 1 1 6 5 1 1 2 32 50
Circle-total 20 - 1 - 2 1 1 12 11 2 2 7 59 98 FAZIBAD 1 Barabanki 8 2 1 - 1 1 - 1 4 1 1 5 48 65
2 Faizabad 4 - 1 - - - - 3 4 1 1 6 3 19 3 Sultanpur 7 1 1 - 1 - - 3 5 - 1 7 42 61 4 Amdekar Nagar 8 1 - - - 1 1 4 1 - 1 2 22 33
Circle-total 27 4 3 - 2 2 1 11 14 2 4 20 115 178 Zone-total 98 10 9 - 11 3 4 46 56 9 11 79 489 727

For Official U
se Only
Special Assistance for Project Form
ation (SAPR
OF) for
Uttar Pradesh N
atural Resources M
anagement and Poverty A
lleviation Project(U
PNR
MPA
P)
Final Report-Volume II A
nnex 2-A5
ZONE CIRCLE DIVISION NO OFRANGES
SURVEYOR DRAFTSMAN OFFICESUPERINTEN
DENT
HEADCLERK
ACCOUNTAN
T
JUNIORACCOUNTAN
T
SENIORCLERK
JUNIORCLERK
STENOGRAP
HER
STATISTICIA
N
DRIVER OTHER Sub-Total
In-position In-position In-position In-position In-position In-position In-position In-position In-position In-position In-position In-position BUNDELKHAND KANPUR 1 Farokabad 5 - - - - - - 2 5 - - 6 - 13
2 Etawa 10 - 1 - 1 - - 2 9 1 - 10 47 71 3 Kanpur 4 2 - - 1 - - 2 3 - 1 3 15 27 4 Kanpur Dehat 4 1 - - 1 - - 2 2 - - - 16 22
Circle-total 23 3 1 - 3 - - 8 19 1 1 19 78 133 JHANSI 1 Orai 8 1 - - 1 - - 7 3 - - 3 7 22
2 Jhansi 7 - 1 - 1 1 - 8 3 - 1 3 20 38 3 Lalitpur 8 1 - - 1 1 - 5 5 - 1 3 37 54 4 Hamirpur 5 4 - - - - - 3 3 - 1 2 10 23 5 Mahoba 4 1 - - - - - 4 3 1 - 2 5 16 6 Banda 4 2 - - - 1 - 8 5 - 1 2 15 34 7 Chitrakoot 10 - - - 1 - - 2 6 1 - 3 42 55
Circle-total 46 9 1 - 4 3 - 37 28 2 4 18 136 242 Zone-total 69 12 2 - 7 3 - 45 47 3 5 37 214 375
EASTERN GORAKHPUR 1 Siddhart Nagar 5 1 1 - - - - 1 7 1 - 3 4 18 2 Basti 7 2 - - 1 1 1 1 6 1 1 3 46 63 3 Gorakhpur 4 - 1 - 1 - - 8 11 1 1 6 51 80 4 Pandrauna 7 1 1 - - 1 - - 3 1 - 3 10 20 5 Deoria/ Deavariya 5 1 1 - 1 - - 3 - 1 1 5 38 51
Circle-total 28 5 4 - 3 2 1 13 27 5 3 20 149 232 AZAMGARH 1 Azamgarh 10 1 1 - - - - 2 2 1 1 8 54 70
2 Mau 4 - 1 - 1 - 1 2 2 1 - 5 28 41 3 Balia 9 - 1 - - 1 1 - 4 1 1 2 65 76
Circle-total 23 1 3 - 1 1 2 4 8 3 2 15 147 187 Zone-total 51 6 7 - 4 3 3 17 35 8 5 35 296 419
SOUTHERN ALLAHABAD 1 Fathepur 5 1 1 - 1 - - 2 2 1 1 5 53 67 2 Kaushambi 3 - 1 - 1 - - 1 3 1 - 1 7 15 3 Pratapgarh 8 - - - - - - 3 6 1 - 8 63 81 4 Allahabad 10 - 1 - 1 - - 3 5 1 1 9 68 89
Circle-total 26 1 3 - 3 - - 9 16 4 2 23 191 252 VARANASI 1 Jaunpur 11 1 1 - - - - 5 1 - 1 7 121 137
2 Varanasi 4 2 1 - 1 - - 2 4 - 1 5 44 60 3 Ghazipur 8 - 1 - - - 3 2 1 - 9 68 84 4 Badohi 3 14 14 5 Mirzapur 11 - 1 - 1 - - 2 10 1 1 3 18 37 6 Obra 5 - - - - - 5 3 - - 1 19 28 7 Sonbhadra 5 - 1 - 1 - - 3 4 1 1 1 25 37 8 Rainukoot 13 - 1 - 1 1 - 6 2 2 1 2 38 54
Circle-total 60 3 6 - 4 1 - 26 26 5 5 28 347 451 Zone-total 86 4 9 - 7 1 - 35 42 9 7 51 538 703
DUDHWA 1 Dudhwa WL 9 - 1 - - - - 6 3 1 - 4 17 32 2 Katarniaghat WL 6 - - - - - - 8 6 - - 8 1 23
GONDA 1 Sohelwa WL 9 - - - 3 - - 3 7 - - 4 31 48 2 Sohagibarnal WL 7 1 - - - - - 5 6 - 1 6 38 57
LUCKNOW 1 Kashi WL 11 - - - 1 - 1 3 2 1 1 6 56 71 2 Kaimur WL 8 1 - - - - - 5 2 - - 3 2 13
Territorial-total 423 46 43 1 44 23 14 205 249 46 43 297 2,149 3,160 Wildlife-total 50 2 1 - 4 - 1 30 26 2 2 31 145 244 Ground total 473 48 44 1 48 23 15 235 275 48 45 328 2,294 3,404
Source: Questionnaire survey by JBIC SAPROF Team, April 2007. While there was no existing data available at UPFD, this data was given to UPFD for its verification, which is still ongoing.
WILDLIFE
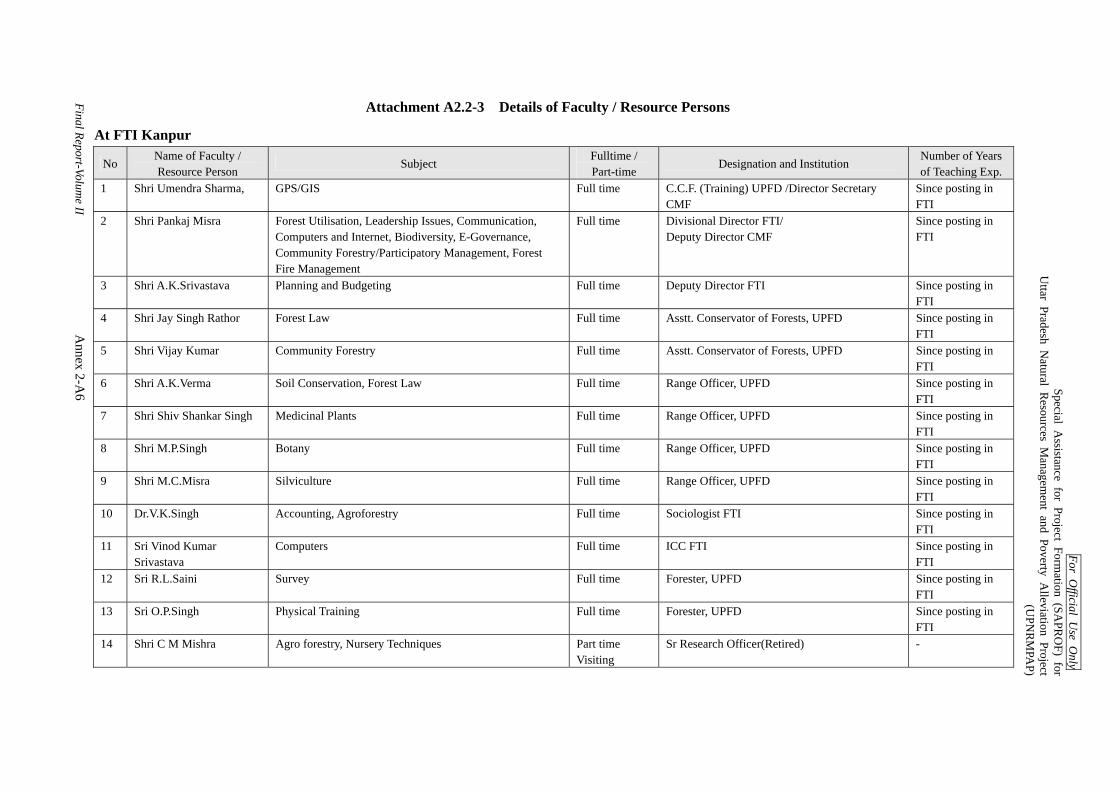
For Official U
se Only
Special Assistance for Project Form
ation (SAPR
OF) for
Uttar Pradesh N
atural Resources M
anagement and Poverty A
lleviation Project(U
PNR
MPA
P)
Final Report-Volume II A
nnex 2-A6
Attachment A2.2-3 Details of Faculty / Resource Persons
At FTI Kanpur
No Name of Faculty / Resource Person
Subject Fulltime / Part-time
Designation and Institution Number of Years of Teaching Exp.
1 Shri Umendra Sharma, GPS/GIS Full time C.C.F. (Training) UPFD /Director Secretary CMF
Since posting in FTI
2 Shri Pankaj Misra Forest Utilisation, Leadership Issues, Communication, Computers and Internet, Biodiversity, E-Governance, Community Forestry/Participatory Management, Forest Fire Management
Full time Divisional Director FTI/ Deputy Director CMF
Since posting in FTI
3 Shri A.K.Srivastava Planning and Budgeting Full time Deputy Director FTI Since posting in FTI
4 Shri Jay Singh Rathor Forest Law Full time Asstt. Conservator of Forests, UPFD Since posting in FTI
5 Shri Vijay Kumar Community Forestry Full time Asstt. Conservator of Forests, UPFD Since posting in FTI
6 Shri A.K.Verma Soil Conservation, Forest Law Full time Range Officer, UPFD Since posting in FTI
7 Shri Shiv Shankar Singh Medicinal Plants Full time Range Officer, UPFD Since posting in FTI
8 Shri M.P.Singh Botany Full time Range Officer, UPFD Since posting in FTI
9 Shri M.C.Misra Silviculture Full time Range Officer, UPFD Since posting in FTI
10 Dr.V.K.Singh Accounting, Agroforestry Full time Sociologist FTI Since posting in FTI
11 Sri Vinod Kumar Srivastava
Computers Full time ICC FTI Since posting in FTI
12 Sri R.L.Saini Survey Full time Forester, UPFD Since posting in FTI
13 Sri O.P.Singh Physical Training Full time Forester, UPFD Since posting in FTI
14 Shri C M Mishra Agro forestry, Nursery Techniques Part time Visiting
Sr Research Officer(Retired) -

For Official U
se Only
Special Assistance for Project Form
ation (SAPR
OF) for
Uttar Pradesh N
atural Resources M
anagement and Poverty A
lleviation Project(U
PNR
MPA
P)
Final Report-Volume II A
nnex 2-A7
No Name of Faculty / Resource Person
Subject Fulltime / Part-time
Designation and Institution Number of Years of Teaching Exp.
15 Shri V.S.Choubey .A.S.(Retd.)
Land Revenue Part time Visiting
Member, State Consumer Redressal Forum, Lucknow
-
16 Shri R.Hemant Kumar I.F.S.
Wild Life, Bio diversity, Land Revenue Part time Visiting
Director, Kanpur Zoo, Kanpur -
17 Sri Satish Kumar Stamp Duty /Registration Part time Visiting
D.I.G., Stamps & Registration, Kanpur -
18 Shri Rupak Dey I.F.S. Wild Life, Bio diversity, Part time Visiting
C.C.F.(Social Forestry) -
19 Sri C.P.Goyal I.F.S. Tree Protection Act, Timber Transit Rules Part time Visiting
Conservator, Kanpur Circle -
20 Sri Shailesh Prasad I.F.S. Mining, Land Revenue Systems Part time Visiting
Conservator, Allahabad Circle -
21 Sri G.P.Singh Geology and Mining of Minor Minerals Part time Visiting
Geologist, U.P.Mining & Minor Minerals Dept -
22 Sri Iqbal Singh I.F.S. Agro forestry Part time Visiting
CCF, Gorakhpur -
23 Sri Mohd. Ahsan I.F.S. Wild Life, Bio diversity, Part time Visiting
A.P.C.C.F/C.W.L.W., U.P., Lucknow -
24 Sri Rajiv Garg I.F.S. FMIS, E-Governance Part time Visiting
Conservator, Jhansi Circle -
24 Prof NK Sharma Leadership Issues Part time Visiting
IIT Kanpur -
26 Prof Archana Shukla Leadership Issues Part time Visiting
IIM Lucknow -
26 Prof R Srinivasan Leadership Issues Part time Visiting
IIM Lucknow -
27 Sri Devesh Chaturvedi IAS
E-Governance Part time Visiting
Secretary , Forest -
29 Sri Puneet Mohan Srivastava
Leadership Issues Part time Visiting
AMITY Business School, Lucknow -
30 Mr G.P.Singh E-Governance Part time Visiting
Technical Director -
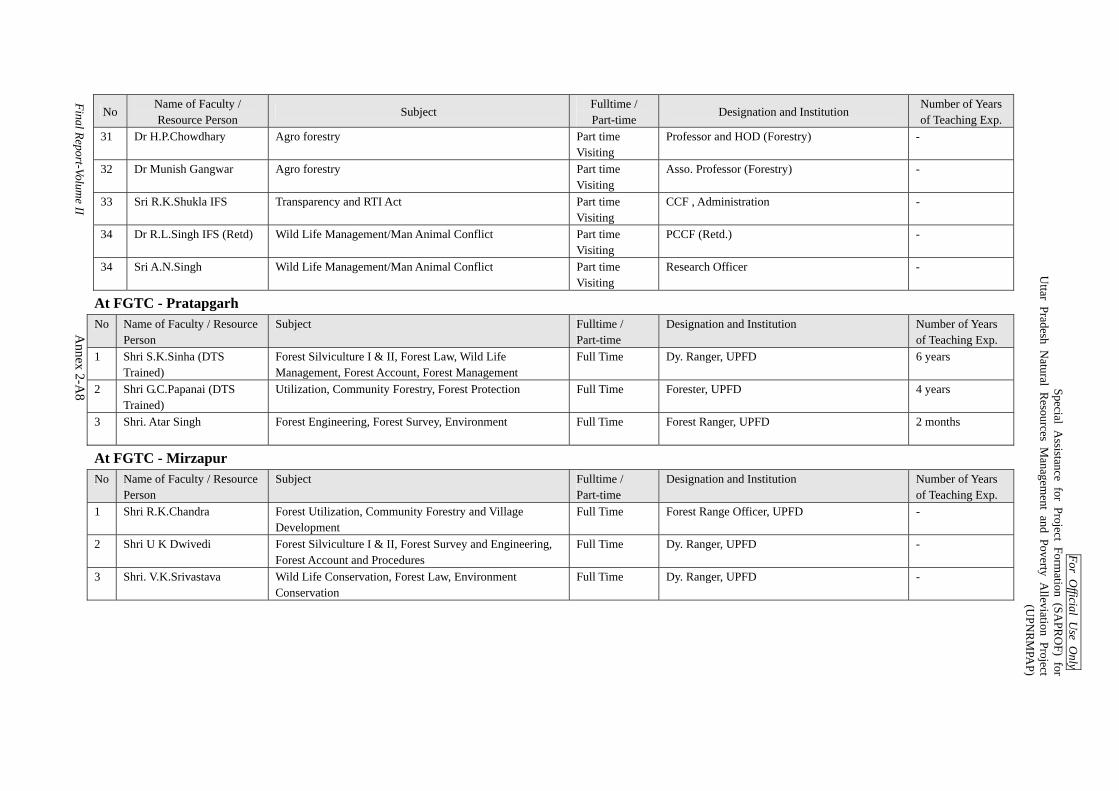
For Official U
se Only
Special Assistance for Project Form
ation (SAPR
OF) for
Uttar Pradesh N
atural Resources M
anagement and Poverty A
lleviation Project(U
PNR
MPA
P)
Final Report-Volume II A
nnex 2-A8
No Name of Faculty / Resource Person
Subject Fulltime / Part-time
Designation and Institution Number of Years of Teaching Exp.
31 Dr H.P.Chowdhary Agro forestry Part time Visiting
Professor and HOD (Forestry) -
32 Dr Munish Gangwar Agro forestry Part time Visiting
Asso. Professor (Forestry) -
33 Sri R.K.Shukla IFS Transparency and RTI Act Part time Visiting
CCF , Administration -
34 Dr R.L.Singh IFS (Retd) Wild Life Management/Man Animal Conflict Part time Visiting
PCCF (Retd.) -
34 Sri A.N.Singh Wild Life Management/Man Animal Conflict Part time Visiting
Research Officer -
At FGTC - Pratapgarh No Name of Faculty / Resource
Person Subject Fulltime /
Part-time Designation and Institution Number of Years
of Teaching Exp. 1 Shri S.K.Sinha (DTS
Trained) Forest Silviculture I & II, Forest Law, Wild Life Management, Forest Account, Forest Management
Full Time Dy. Ranger, UPFD 6 years
2 Shri G.C.Papanai (DTS Trained)
Utilization, Community Forestry, Forest Protection Full Time Forester, UPFD 4 years
3 Shri. Atar Singh
Forest Engineering, Forest Survey, Environment Full Time Forest Ranger, UPFD 2 months
At FGTC - Mirzapur No Name of Faculty / Resource
Person Subject Fulltime /
Part-time Designation and Institution Number of Years
of Teaching Exp. 1 Shri R.K.Chandra
Forest Utilization, Community Forestry and Village Development
Full Time Forest Range Officer, UPFD -
2 Shri U K Dwivedi Forest Silviculture I & II, Forest Survey and Engineering, Forest Account and Procedures
Full Time Dy. Ranger, UPFD -
3 Shri. V.K.Srivastava
Wild Life Conservation, Forest Law, Environment Conservation
Full Time Dy. Ranger, UPFD -

For Official U
se Only
Special Assistance for Project Form
ation (SAPR
OF) for
Uttar Pradesh N
atural Resources M
anagement and Poverty A
lleviation Project(U
PNR
MPA
P)
Final Report-Volume II A
nnex 2-A9
At FGTC - Meerut No Name of Faculty /
Resource Person Subject Fulltime /
Part-time Designation and Institution Number of Years
of Teaching Exp. 1 Shri S.P. Srivastava
Forest Silviculture I & II, Forest Law, Forest Protection, Environment Conservation.
Full Time Forest Ranger, UPFD 9 years
2 Shri U K Dwivedi Wild Life Protection Act, Forest Utilization, Community Forestry
Full Time Dy. Ranger, UPFD 18 years
3 Shri. V.K.Srivastava
Forest Survey and Engineering, Forest Account and Procedures
Full Time Forester, UPFD 20 years
4
Dr. S.K.Sharma First Aid Part Time Visiting 15 years
At FGTC - Mau No Name of Faculty /
Resource Person Subject Fulltime /
Part-time Designation and Institution Number of Years
of Teaching Exp. 1 Shri. K.K.Pandey
Forest Uitlization Full Time Forest Range Officer, UPFD 10 years
2 Shri. V.B.Tripathi
Silviculture, Forest Protection Laws, Accounts Full Time Dy. Ranger, UPFD 14 years
3 Shri. Om Prakash Singh Environmental Conservation, Social Forestry, Wild Life Conservation, Surveys, Engineering, Silviculture
Full Time Forester, UPFD 9 months
4 Shri. Basant Lal
P.T., Practical and Games Full Time Forest Guard 3 years
Note: The data of FGTC Agra was not provided in spite of repeated request by the JBIC SAPROF Team

For Official Use Only Special Assistance for Project Formation (SAPROF) for
Uttar Pradesh Natural Resources Management and Poverty Alleviation Project (UPNRMPAP)
Final Report-Volume II Annex 2-A10
Attachment A2.2-4 GIS Expertise and Development in UP outside UPFD
Some of the departments that are using GIS in some form or other were either visited or studied in order to collect the required GIS based information that was prerequisite for the present project. Some of the major institutions outside UPFD that are working in Uttar Pradesh and dealing with GIS include:
Uttar Pradesh Remote Sensing Application Centre Uttar Pradesh Land Development Corporation
Comparative summary of the institutes in Uttar Pradesh having GIS expertise is given in the tables below.
Comparative Summary of GIS Institutes in Uttar Pradesh Name of
Organisation GIS Laboratory,
Uttar Pradesh Forest Training Institute
Uttar Pradesh Remote Sensing Application Centre
Uttar Pradesh Land Development Corporation
Status (Govt./Auto)
Government of Uttar Pradesh Estb. In Year 2002
Autonomus Estb. In Year 1982
U. P. Govt. Undertaking Estb. In Year 1978
Affiliation Forest department, Government of Uttar Pradesh
Department of Science and technology, Government of Uttar Pradesh
Government of Uttar Pradesh
Activities 1. Training to Forest Officials on various aspects of Forest and Wild Life including training on computers 2. Use of GIS for mapping of territorial divisions and wild life sanctuaries
1. Undertake Natural resource base mapping 2. Use of GIS for various application areas 3. Pilot studies
1. Preserving the health and productivity of land resources in a sustainable manner 2. Maintenance of Web-based MIS Application3. Maintenance of Web-based GIS Application
Potentials 1. Basic GIS infrastructure is available 2. Availability of market leading GIS and Digital Image Processing Software 3. Forest Management Information System
1. Good Infrastructure is available 2. Availability of market leading GIS and Image Processing Software 3. Technical expertise and skilled manpower in image interpretation
1. Web-based GIS Application
Constraints 1. Limited staff for GIS activities 2. Limited knowledge and skills in latest GIS software 3. Restricted access to the maps
1. State level data base on natural resources is not readily available
Review of major past, on-going and planned projects on GIS/MIS in Uttar Pradesh are discussed in the following paragraphs.
(1) Uttar Pradesh Sodic Lands Reclamation Project
The project was part of a long-term programme to improve agricultural productivity in areas with high concentration of sodic lands and was to be implemented over a 7-year period in 10 districts of UP. It had three objectives: (i) to develop models for environmental protection and improved agricultural production through large-scale reclamation of sodic lands; (ii) to strengthen local institutions to manage such schemes; and (iii) to contribute to poverty alleviation of the families concerned.

For Official Use Only Special Assistance for Project Formation (SAPROF) for
Uttar Pradesh Natural Resources Management and Poverty Alleviation Project (UPNRMPAP)
Final Report-Volume II Annex 2-A11
The UP Bhumi Sudhar Nigam (UPBSN) was the project implementing agency. A Project Management Committee headed by the Agriculture Secretary with heads of the participating agencies as members was appointed to ensure inter-departmental coordination. The Remote Sensing Application Center (RSAC) was responsible for site identification and selection and for monitoring of changes in soil and groundwater environments. The Indian Institute of Management Lucknow (IIML) provided support for development of the computerised project management information system. IIML also worked as the external monitoring and evaluation (M&E) agency.
Districts covered under Sodic Land Reclamation Project, Uttar Pradesh
(2) Encroachment Mapping in Uttar Pradesh
State Forest Department has received a project on ‘Forest encroachment mapping in Uttar Pradesh using remotely sensed data and GIS’ funded by Ministry of Environment and Forest (MoE&F). The total cost of the project is Rs 6,000,000. The project duration is 3 years and covers 10 districts of Uttar Pradesh, namely, Kheri, Pilibhit, Shahjahanpur, Rampur, Mirzapur, Sonbhadra, Gorakhpur, Maharajganj, Etawah, Chandoli. State Forest Research Institute (SFRI) along with FTI will execute the project. FTI has already received the invoice for procurement of satellite images from National Remote Sensing Agency (NRSA).
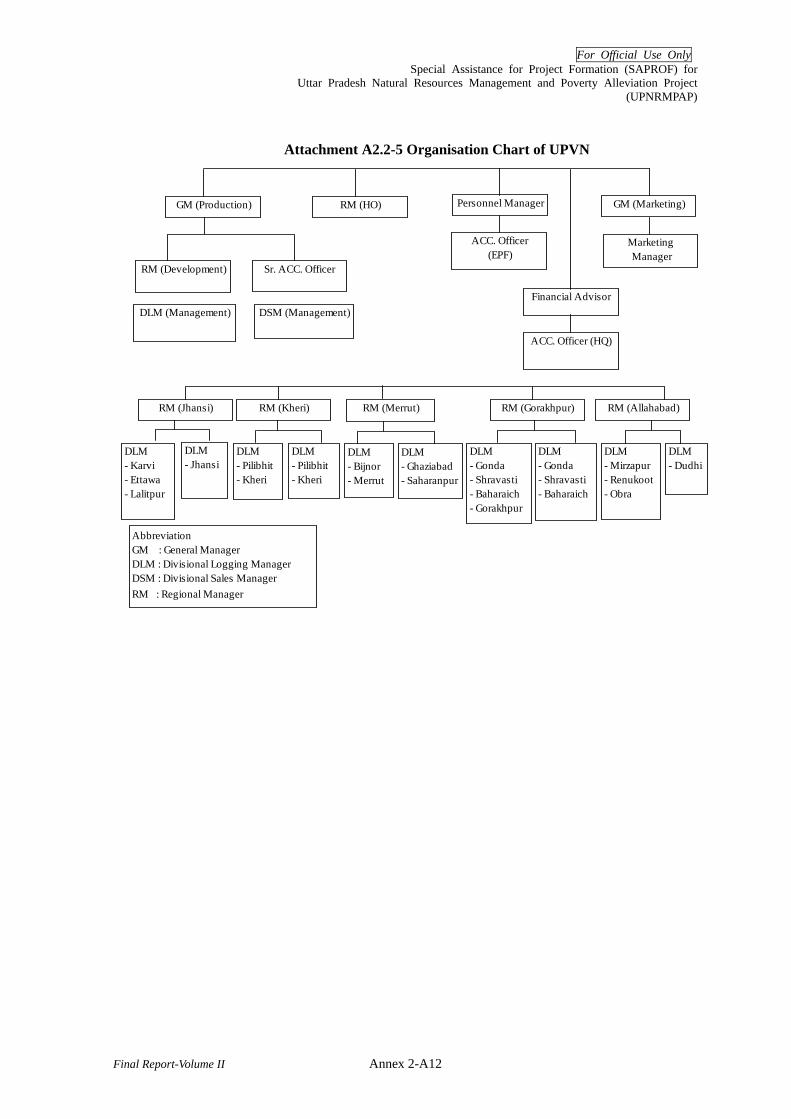
For Official Use Only Special Assistance for Project Formation (SAPROF) for
Uttar Pradesh Natural Resources Management and Poverty Alleviation Project (UPNRMPAP)
Final Report-Volume II Annex 2-A12
Attachment A2.2-5 Organisation Chart of UPVN
GM (Marketing)Personnel ManagerRM (HO)GM (Production)
Sr. ACC. OfficerRM (Development)
DSM (Management)DLM (Management)
ACC. Officer(EPF)
Marketing Manager
Financial Advisor
ACC. Officer (HQ)
RM (Gorakhpur)RM (Merrut) RM (Allahabad)RM (Kheri)RM (Jhansi)
DLM- Karvi- Ettawa- Lalitpur
DLM- Gonda- Shravasti- Baharaich- Gorakhpur
DLM- Mirzapur- Renukoot- Obra
DLM- Gonda- Shravasti- Baharaich
DLM- Pilibhit- Kheri
DLM- Jhansi
DLM- Ghaziabad- Saharanpur
DLM- Dudhi
DLM- Bijnor- Merrut
DLM- Pilibhit- Kheri
AbbreviationGM : General ManagerDLM : Divisional Logging ManagerDSM : Divisional Sales ManagerRM : Regional Manager
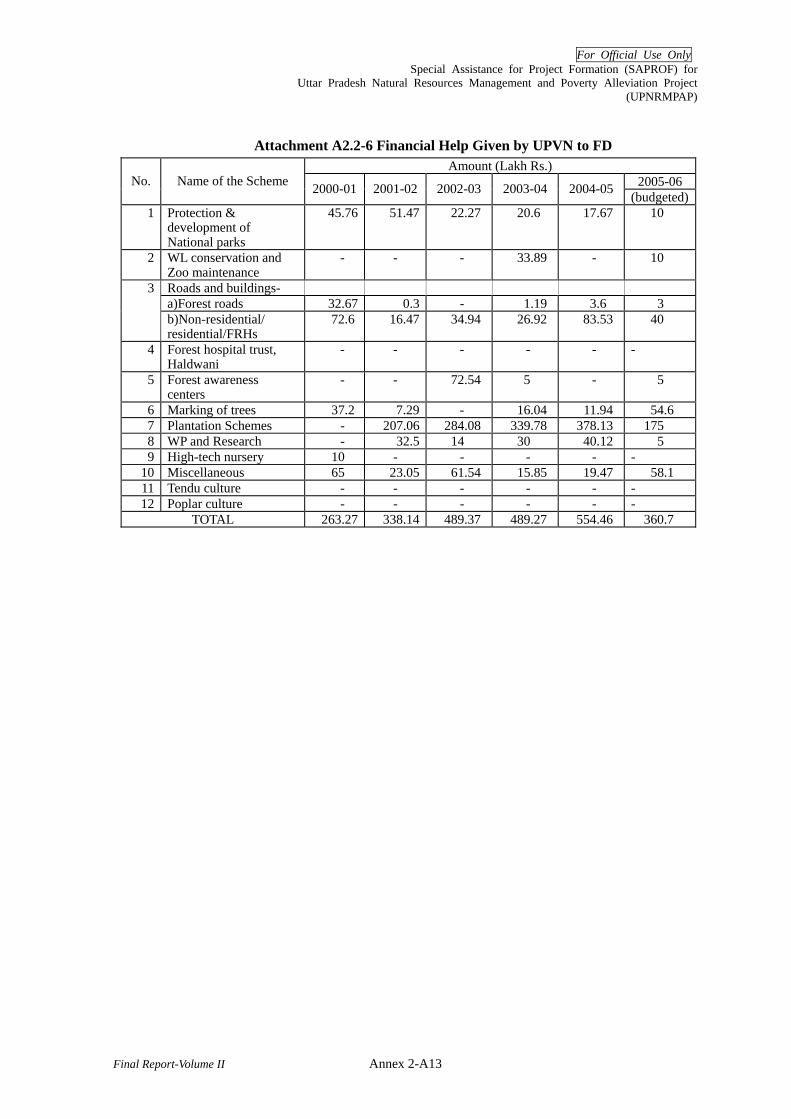
For Official Use Only Special Assistance for Project Formation (SAPROF) for
Uttar Pradesh Natural Resources Management and Poverty Alleviation Project (UPNRMPAP)
Final Report-Volume II Annex 2-A13
Attachment A2.2-6 Financial Help Given by UPVN to FD Amount (Lakh Rs.)
2005-06 No. Name of the Scheme 2000-01 2001-02 2002-03 2003-04 2004-05 (budgeted)1 Protection &
development of National parks
45.76 51.47 22.27 20.6 17.67 10
2 WL conservation and Zoo maintenance
- - - 33.89 - 10
3 Roads and buildings- a)Forest roads 32.67 0.3 - 1.19 3.6 3 b)Non-residential/
residential/FRHs 72.6 16.47 34.94 26.92 83.53 40
4 Forest hospital trust, Haldwani
- - - - - -
5 Forest awareness centers
- - 72.54 5 - 5
6 Marking of trees 37.2 7.29 - 16.04 11.94 54.6 7 Plantation Schemes - 207.06 284.08 339.78 378.13 175 8 WP and Research - 32.5 14 30 40.12 5 9 High-tech nursery 10 - - - - -
10 Miscellaneous 65 23.05 61.54 15.85 19.47 58.1 11 Tendu culture - - - - - - 12 Poplar culture - - - - - -
TOTAL 263.27 338.14 489.37 489.27 554.46 360.7

For Official Use Only Special Assistance for Project Formation (SAPROF) for
Uttar Pradesh Natural Resources Management and Poverty Alleviation Project (UPNRMPAP)
Final Report-Volume II Annex 2-A14
Attachment A2.2-7 Financial Situation of UPVN
(lakh Rs.) 2005/06
Item 2002/03 2003/04 2004/05 (Budgeted)
I - INCOME A Sale and other Receipts 1 Timber 7,175 8,716 10,418 9,724 2 Fuel wood 120 95 70 92 3 Tendu leaf 3,683 3,917 2,574 3,620 4 Bamboo 56 43 80 123 5 Miscellaneous 46 45 86 200
6 Intrest and other income 3,720 8,139 2,849 2,451
7 Other additions 34 95 - - Total 14,834 21,05 16,077 16,210
B Value of balance stock 1 Timber 7,337 6,979 5,726 6,217 2 Fuel wood 40 16 21 14 3 Tendu leaf 508 498 1,443 688 4 Bamboo 7 53 17 9 5 Miscallenous 27 49 65 121
Total 7,919 7,595 7,272 7,049 TOTAL (A+B) 22,753 28,647 23,349 23,259
II - EXPENDITURE C Total Expenditure 12,147 13,399 13,105 12,635 D Opening Stock 1 Timber 6,824 7,337 6,979 5,726 2 Fire wood 72 40 16 21 3 Tendu leaf 838 508 498 1,443 4 Bamboo 46 7 53 17 5 Miscellaneous 37 27 49 65
Total 7,817 7,919 7,595 7,272 TOTAL (C+D) 19,964 21,318 20,700 19,907
III – Balance INCOME 2,789 7,329 2,649 3,352
IV – Expenditure for Forest Development and Use
489 476 543 306
Source-UPVN Progress Report 2005-06
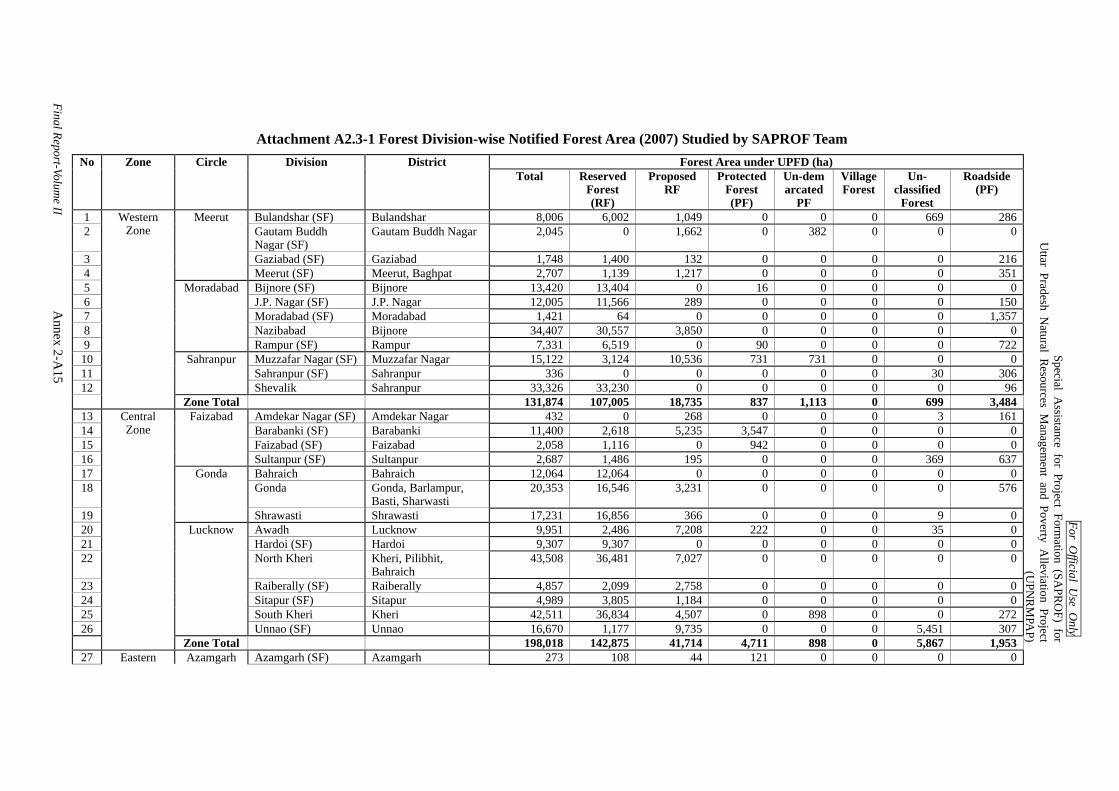
For Official U
se Only
Special Assistance for Project Form
ation (SAPR
OF) for
Uttar Pradesh N
atural Resources M
anagement and Poverty A
lleviation Project (U
PNR
MPA
P)
Final Report-Volume II
Annex 2-A
15
Attachment A2.3-1 Forest Division-wise Notified Forest Area (2007) Studied by SAPROF Team Forest Area under UPFD (ha) No Zone Circle Division District
Total Reserved Forest (RF)
Proposed RF
Protected Forest (PF)
Un-demarcated
PF
Village Forest
Un- classified
Forest
Roadside (PF)
1 Bulandshar (SF) Bulandshar 8,006 6,002 1,049 0 0 0 669 286 2 Gautam Buddh
Nagar (SF) Gautam Buddh Nagar 2,045 0 1,662 0 382 0 0 0
3 Gaziabad (SF) Gaziabad 1,748 1,400 132 0 0 0 0 216 4
Meerut
Meerut (SF) Meerut, Baghpat 2,707 1,139 1,217 0 0 0 0 351 5 Bijnore (SF) Bijnore 13,420 13,404 0 16 0 0 0 0 6 J.P. Nagar (SF) J.P. Nagar 12,005 11,566 289 0 0 0 0 150 7 Moradabad (SF) Moradabad 1,421 64 0 0 0 0 0 1,357 8 Nazibabad Bijnore 34,407 30,557 3,850 0 0 0 0 0 9
Moradabad
Rampur (SF) Rampur 7,331 6,519 0 90 0 0 0 722 10 Muzzafar Nagar (SF) Muzzafar Nagar 15,122 3,124 10,536 731 731 0 0 0 11 Sahranpur (SF) Sahranpur 336 0 0 0 0 0 30 306 12
Sahranpur
Shevalik Sahranpur 33,326 33,230 0 0 0 0 0 96
Western Zone
Zone Total 131,874 107,005 18,735 837 1,113 0 699 3,484 13 Amdekar Nagar (SF) Amdekar Nagar 432 0 268 0 0 0 3 161 14 Barabanki (SF) Barabanki 11,400 2,618 5,235 3,547 0 0 0 0 15 Faizabad (SF) Faizabad 2,058 1,116 0 942 0 0 0 0 16
Faizabad
Sultanpur (SF) Sultanpur 2,687 1,486 195 0 0 0 369 637 17 Bahraich Bahraich 12,064 12,064 0 0 0 0 0 0 18 Gonda Gonda, Barlampur,
Basti, Sharwasti 20,353 16,546 3,231 0 0 0 0 576
19
Gonda
Shrawasti Shrawasti 17,231 16,856 366 0 0 0 9 0 20 Awadh Lucknow 9,951 2,486 7,208 222 0 0 35 0 21 Hardoi (SF) Hardoi 9,307 9,307 0 0 0 0 0 0 22 North Kheri Kheri, Pilibhit,
Bahraich 43,508 36,481 7,027 0 0 0 0 0
23 Raiberally (SF) Raiberally 4,857 2,099 2,758 0 0 0 0 0 24 Sitapur (SF) Sitapur 4,989 3,805 1,184 0 0 0 0 0 25 South Kheri Kheri 42,511 36,834 4,507 0 898 0 0 272 26
Lucknow
Unnao (SF) Unnao 16,670 1,177 9,735 0 0 0 5,451 307
Central Zone
Zone Total 198,018 142,875 41,714 4,711 898 0 5,867 1,953 27 Eastern Azamgarh Azamgarh (SF) Azamgarh 273 108 44 121 0 0 0 0

For Official U
se Only
Special Assistance for Project Form
ation (SAPR
OF) for
Uttar Pradesh N
atural Resources M
anagement and Poverty A
lleviation Project (U
PNR
MPA
P)
Final Report-Volume II
Annex 2-A
16
Forest Area under UPFD (ha) No Zone Circle Division District Total Reserved
Forest (RF)
Proposed RF
Protected Forest (PF)
Un-demarcated
PF
Village Forest
Un- classified
Forest
Roadside (PF)
28 Ballia (SF) Ballia 4,793 0 0 0 4,785 0 8 0 29
Mau (SF) Mau 853 172 194 0 0 0 0 487
30 Basti (SF) Basti, Sank Kibar Nagar
5,406 2,219 1,123 0 0 0 1,597 467
31 Deoria (SF) Deoria (Deavariya) 0 0 0 0 0 0 0 0 32 Gorakhpur Gorakpur,
Maharajiganji 15,802 14,964 308 454 0 0 76 0
33 Pandrauna (SF) Kushinagar 381 247 134 0 0 0 0 0 34
Zone
Gorakhpur
Siddhart Nagar (SF) Siddhart Nagar 3,556 2,396 0 1,156 0 0 4 0 Zone Total 31,064 20,106 1,803 1,731 4,785 0 1,685 954
35 Agra Agra 20,685 19,080 1,605 0 0 0 0 0 36 Aligarh (SF) Aligarh 2,926 168 2,026 0 6 0 75 651 37 Etah (SF) Etah 2,948 154 35 2,737 0 0 22 0 38 Firozabad (SF) Firozabad 8,491 8,037 0 454 0 0 0 0 39 Mahamaya Nagar
(SF) Mahamaya Nagar 2,514 85 1,336 1,093 0 0 0 0
40 Mainpuri (SF) Mainpuri 1,883 1,418 0 0 0 0 0 465 41
Agra
Mathura (SF) Mathura 2,011 1,179 193 0 0 0 0 639 42 Badhau (SF) Badhau 7,881 6,885 15 981 0 0 0 0 43 Bareilly (SF) Bareilly 224 213 1 0 0 0 10 0 44 Pilibhit Pilibhit 71,281 66,589 4,126 0 0 0 566 0 45 Pilibhit (SF) Pilibhit 1,125 938 74 0 0 0 0 113 46
Rohalkhand
Bareilly
Shajahan Pur (SF) Shajahan Pur 10,152 9,248 614 0 0 0 0 290 Zone Total 132,121 113,994 10,025 5,265 6 0 673 2,158
47 Banda Banda 6,040 3,295 2,122 623 0 0 0 0 48 Chitrakoot Chitrakoot 49,080 34,452 10,777 0 0 121 3,637 93 49 Hamirpur Hamirpur 23,640 11,860 11,256 524 0 0 0 0 50 Jhansi Jhansi 33,414 25,895 0 571 0 0 6,948 0 51 Lallitpur (SF) Lallitpur 74,403 68,212 0 4,194 0 0 1,997 0 52 Mahoba Mahoba 16,372 2,703 12,268 975 426 0 0 0 53
Jhansi
Orai (SF) Jalaun 27,095 18,527 7,207 1,361 0 0 0 0 54 Etawa Etawah, Auraiya(Orai) 28,930 16,770 0 697 0 0 11,463 0 55 Farokabad (SF) Farokabad, Kannaui 3,332 2,590 0 0 0 0 0 742 56 Kanpur (SF) Kanpur 6,916 5,398 588 930 0 0 0 0 57
Budelkhand
Kanpur
Knapur Dehat Knapur Dehat 7,862 619 5,580 80 0 0 1,583 0 Zone Total 277,084 190,321 49,798 9,955 426 121 25,628 835
58 Eastern Allahabad Allahabad (SF) Allahabad 21,507 19,659 126 0 0 0 1,722 0
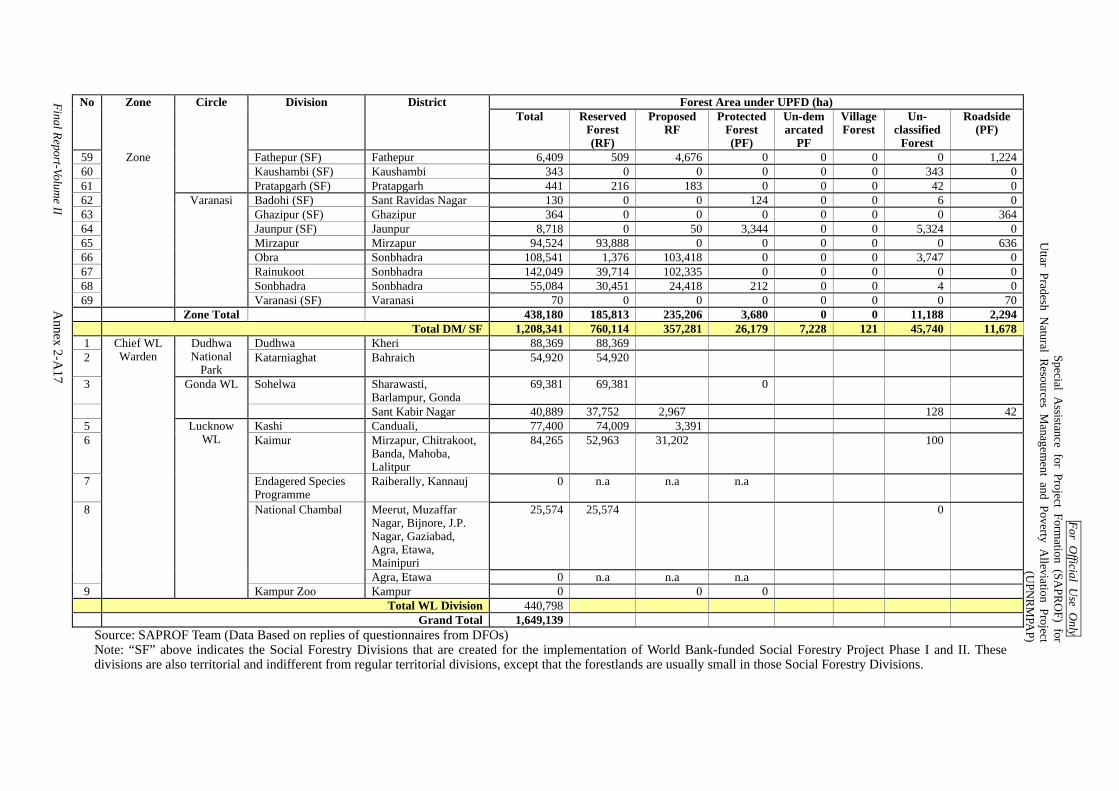
For Official U
se Only
Special Assistance for Project Form
ation (SAPR
OF) for
Uttar Pradesh N
atural Resources M
anagement and Poverty A
lleviation Project (U
PNR
MPA
P)
Final Report-Volume II
Annex 2-A
17
Forest Area under UPFD (ha) No Zone Circle Division District Total Reserved
Forest (RF)
Proposed RF
Protected Forest (PF)
Un-demarcated
PF
Village Forest
Un- classified
Forest
Roadside (PF)
59 Fathepur (SF) Fathepur 6,409 509 4,676 0 0 0 0 1,224 60 Kaushambi (SF) Kaushambi 343 0 0 0 0 0 343 0 61
Pratapgarh (SF) Pratapgarh 441 216 183 0 0 0 42 0 62 Badohi (SF) Sant Ravidas Nagar 130 0 0 124 0 0 6 0 63 Ghazipur (SF) Ghazipur 364 0 0 0 0 0 0 364 64 Jaunpur (SF) Jaunpur 8,718 0 50 3,344 0 0 5,324 0 65 Mirzapur Mirzapur 94,524 93,888 0 0 0 0 0 636 66 Obra Sonbhadra 108,541 1,376 103,418 0 0 0 3,747 0 67 Rainukoot Sonbhadra 142,049 39,714 102,335 0 0 0 0 0 68 Sonbhadra Sonbhadra 55,084 30,451 24,418 212 0 0 4 0 69
Zone
Varanasi
Varanasi (SF) Varanasi 70 0 0 0 0 0 0 70 Zone Total 438,180 185,813 235,206 3,680 0 0 11,188 2,294 Total DM/ SF 1,208,341 760,114 357,281 26,179 7,228 121 45,740 11,678
1 Dudhwa Kheri 88,369 88,369 2
Dudhwa National
Park Katarniaghat Bahraich 54,920 54,920
3 Sohelwa Sharawasti, Barlampur, Gonda
69,381 69,381 0
Gonda WL
Sant Kabir Nagar 40,889 37,752 2,967 128 42 5 Kashi Canduali, 77,400 74,009 3,391 6 Kaimur Mirzapur, Chitrakoot,
Banda, Mahoba, Lalitpur
84,265 52,963 31,202 100
7 Endagered Species Programme
Raiberally, Kannauj 0 n.a n.a n.a
8 Meerut, Muzaffar Nagar, Bijnore, J.P. Nagar, Gaziabad, Agra, Etawa, Mainipuri
25,574 25,574 0
National Chambal
Agra, Etawa 0 n.a n.a n.a 9
Chief WL Warden
Lucknow WL
Kampur Zoo Kampur 0 0 0 Total WL Division 440,798
Grand Total 1,649,139 Source: SAPROF Team (Data Based on replies of questionnaires from DFOs) Note: “SF” above indicates the Social Forestry Divisions that are created for the implementation of World Bank-funded Social Forestry Project Phase I and II. These divisions are also territorial and indifferent from regular territorial divisions, except that the forestlands are usually small in those Social Forestry Divisions.
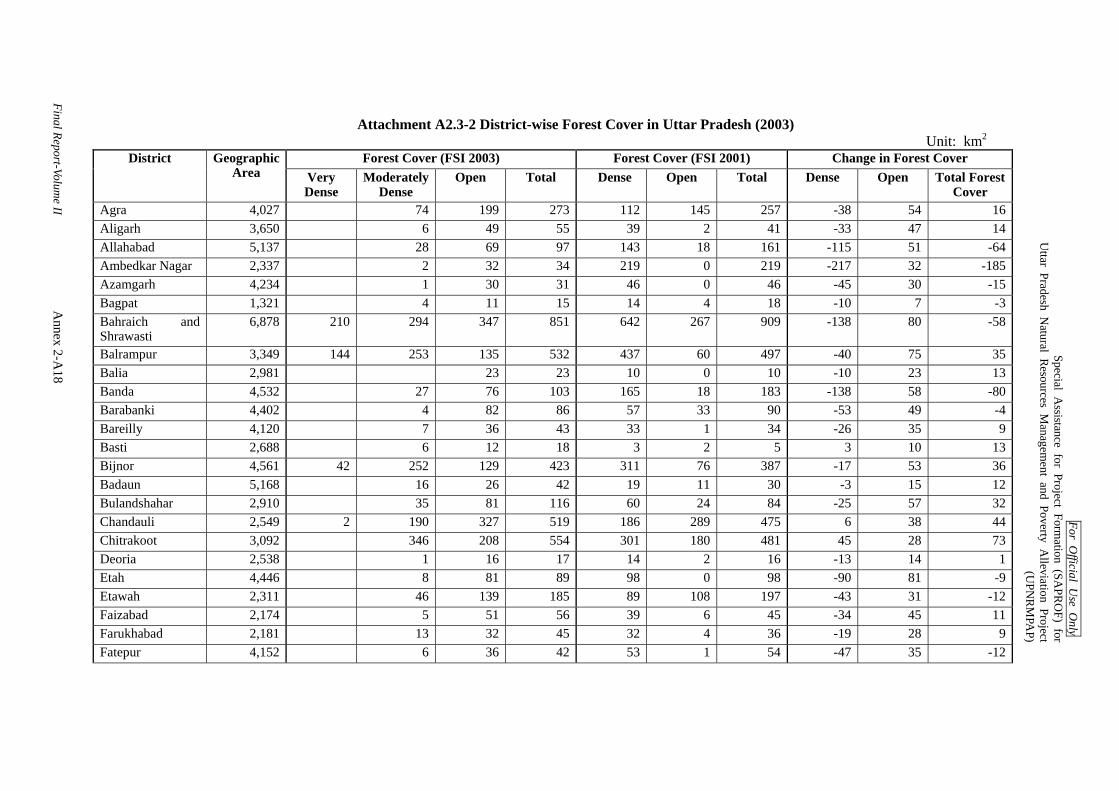
For Official U
se Only
Special Assistance for Project Form
ation (SAPR
OF) for
Uttar Pradesh N
atural Resources M
anagement and Poverty A
lleviation Project (U
PNR
MPA
P)
Final Report-Volume II
Annex 2-A
18
Attachment A2.3-2 District-wise Forest Cover in Uttar Pradesh (2003) Unit: km2
Forest Cover (FSI 2003) Forest Cover (FSI 2001) Change in Forest Cover District Geographic Area Very
Dense Moderately
Dense Open Total Dense Open Total Dense Open Total Forest
Cover Agra 4,027 74 199 273 112 145 257 -38 54 16 Aligarh 3,650 6 49 55 39 2 41 -33 47 14 Allahabad 5,137 28 69 97 143 18 161 -115 51 -64 Ambedkar Nagar 2,337 2 32 34 219 0 219 -217 32 -185 Azamgarh 4,234 1 30 31 46 0 46 -45 30 -15 Bagpat 1,321 4 11 15 14 4 18 -10 7 -3 Bahraich and Shrawasti
6,878 210 294 347 851 642 267 909 -138 80 -58
Balrampur 3,349 144 253 135 532 437 60 497 -40 75 35 Balia 2,981 23 23 10 0 10 -10 23 13 Banda 4,532 27 76 103 165 18 183 -138 58 -80 Barabanki 4,402 4 82 86 57 33 90 -53 49 -4 Bareilly 4,120 7 36 43 33 1 34 -26 35 9 Basti 2,688 6 12 18 3 2 5 3 10 13 Bijnor 4,561 42 252 129 423 311 76 387 -17 53 36 Badaun 5,168 16 26 42 19 11 30 -3 15 12 Bulandshahar 2,910 35 81 116 60 24 84 -25 57 32 Chandauli 2,549 2 190 327 519 186 289 475 6 38 44 Chitrakoot 3,092 346 208 554 301 180 481 45 28 73 Deoria 2,538 1 16 17 14 2 16 -13 14 1 Etah 4,446 8 81 89 98 0 98 -90 81 -9 Etawah 2,311 46 139 185 89 108 197 -43 31 -12 Faizabad 2,174 5 51 56 39 6 45 -34 45 11 Farukhabad 2,181 13 32 45 32 4 36 -19 28 9 Fatepur 4,152 6 36 42 53 1 54 -47 35 -12
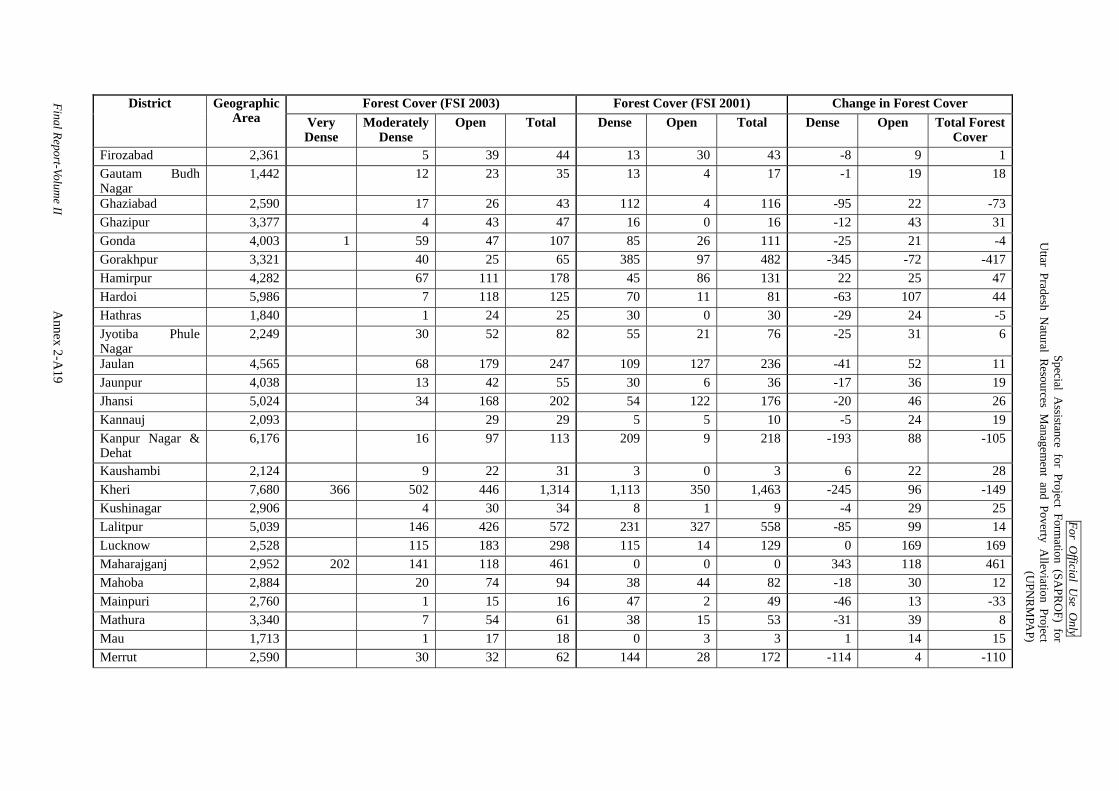
For Official U
se Only
Special Assistance for Project Form
ation (SAPR
OF) for
Uttar Pradesh N
atural Resources M
anagement and Poverty A
lleviation Project (U
PNR
MPA
P)
Final Report-Volume II
Annex 2-A
19
Forest Cover (FSI 2003) Forest Cover (FSI 2001) Change in Forest Cover District Geographic Area Very
Dense Moderately
Dense Open Total Dense Open Total Dense Open Total Forest
Cover Firozabad 2,361 5 39 44 13 30 43 -8 9 1 Gautam Budh Nagar
1,442 12 23 35 13 4 17 -1 19 18
Ghaziabad 2,590 17 26 43 112 4 116 -95 22 -73 Ghazipur 3,377 4 43 47 16 0 16 -12 43 31 Gonda 4,003 1 59 47 107 85 26 111 -25 21 -4 Gorakhpur 3,321 40 25 65 385 97 482 -345 -72 -417 Hamirpur 4,282 67 111 178 45 86 131 22 25 47 Hardoi 5,986 7 118 125 70 11 81 -63 107 44 Hathras 1,840 1 24 25 30 0 30 -29 24 -5 Jyotiba Phule Nagar
2,249 30 52 82 55 21 76 -25 31 6
Jaulan 4,565 68 179 247 109 127 236 -41 52 11 Jaunpur 4,038 13 42 55 30 6 36 -17 36 19 Jhansi 5,024 34 168 202 54 122 176 -20 46 26 Kannauj 2,093 29 29 5 5 10 -5 24 19 Kanpur Nagar & Dehat
6,176 16 97 113 209 9 218 -193 88 -105
Kaushambi 2,124 9 22 31 3 0 3 6 22 28 Kheri 7,680 366 502 446 1,314 1,113 350 1,463 -245 96 -149 Kushinagar 2,906 4 30 34 8 1 9 -4 29 25 Lalitpur 5,039 146 426 572 231 327 558 -85 99 14 Lucknow 2,528 115 183 298 115 14 129 0 169 169 Maharajganj 2,952 202 141 118 461 0 0 0 343 118 461 Mahoba 2,884 20 74 94 38 44 82 -18 30 12 Mainpuri 2,760 1 15 16 47 2 49 -46 13 -33 Mathura 3,340 7 54 61 38 15 53 -31 39 8 Mau 1,713 1 17 18 0 3 3 1 14 15 Merrut 2,590 30 32 62 144 28 172 -114 4 -110

For Official U
se Only
Special Assistance for Project Form
ation (SAPR
OF) for
Uttar Pradesh N
atural Resources M
anagement and Poverty A
lleviation Project (U
PNR
MPA
P)
Final Report-Volume II
Annex 2-A
20
Forest Cover (FSI 2003) Forest Cover (FSI 2001) Change in Forest Cover District Geographic Area Very
Dense Moderately
Dense Open Total Dense Open Total Dense Open Total Forest
Cover Mirzapur 4,521 316 466 782 198 433 631 118 33 151 Moradabad 3,718 4 21 25 17 0 17 -13 21 8 Muzzafarnagar 4,008 13 27 40 26 14 40 -13 13 0 Oraiya 2,015 10 59 69 37 34 71 -27 25 -2 Pilibhit 3,499 290 204 203 697 488 196 684 6 7 13 Pratapgarh 3,717 28 67 95 34 4 38 -6 63 57 Raibareilly 4,609 6 91 97 53 10 63 -47 81 34 Rampur 2,367 3 20 49 72 57 28 85 -34 21 -13 Saharanpur 3,689 147 224 371 151 138 289 -4 86 82 Sant Kabir Nagar 1,646 2 2 0 0 0 0 2 2 Sant Ravidas Nagar
1,015 1 1 0 0 0 0 1 1
Shahjahanpur 4,575 20 54 44 118 85 24 109 -11 20 9 Sidharth Nagar 2,895 10 29 39 66 8 74 -56 21 -35 Sitapur 5,743 15 201 216 332 16 348 -317 185 -132 Sonbhadra 6,788 17 846 1,606 2,469 1,221 1,276 2,497 -358 330 -28 Sultanpur 4,436 18 157 175 74 14 88 -56 143 87 Unnao 4,558 34 197 231 36 2 38 -2 195 193 Varanasi 1,528 1 11 12 0 1 1 1 10 11 TOTAL 240,928 1,297 4,699 8,122 14,118 8,965 4,781 13,746 -2,969 3,341 372
Source: Based on FSI “States of Forest 2001” and “States of Forest 2003”

For Official Use Only Special Assistance for Project Formation (SAPROF) for
Uttar Pradesh Natural Resources Management and Poverty Alleviation Project (UPNRMPAP)
Final Report-Volume II Annex 2-A21
Attachment A2.3-3 Forest Types Occurring in Uttar Pradesh Group No. and
Description Forest Type
Code Name of the Forest Type Forest Divisions
2/E1 (Cane Brakes) Gorakhpur, 2/E3 Moist Bamboo Brakes North Kheri, Dudhwa NP,
2Tropical Semi-Evergreen Forests 2/2S1 Secondary Moist Bamboo
brakes Dudhwa NP,
3C/C2(a to e) Moist Sal-bearing forest North Kheri, Dudwa NP, N-Gonda, S-Gonda, Chitrakoot, Kashi WL., Sonbhedra, Gorakhpur, Basti, Sidharth Nagar, Sohagibarwa, Shahjahanpur,
3C/C2/DS1 Moist Sal savannah Dudhwa NP, Sohelwa Wild Life (North Gonda),3C/C3(a) West Gangetic Moist mixed
deciduous forest Sohagibarwa, Bijnor SF,
3C/C3/2S1 Northern secondary moist mixed deciduous forest
BijnorSF, North Kheri,
3/E1 Terminalia tomentosa forest Sohelwa Wild Life (North Gonda), Gorakhpur, Sohagibarwa,
3 Tropical Moist Deciduous Forests
3/1S1 Low alluvial savannah woodland(Salmalia-albizzia)
North Kheri, Dudhwa NP, Gorakhpur, Deoria, Sohagibarwa, Shahjahanpur, Moradabad, Bijnor SF,
4D/SS2,3&4 Seasonal swamp forest(Barrington,Syzygium,Ceptalenthus)
Dudhwa NP, Sohelwa Wild Life (North Gonda), S-Gonda, Gorakhpur, Basti, Sidharth Nagar, Sohagibarwa, Shahjahanpur,
4 Littoral and Swamp Forests
4E/RS1 Riparian fringe forest Chitrakoot, Banda, Mahoba, Kashi WL., Sonbhedra, Obra, Renukoot,
5A/C1(b) Dry Teak forest
Jhansi,
5A/C3 Southern dry mixed deciduous forest
Jhansi, Kashi WL., Renukoot,
5B/C1(a to c) Dry Sal-bearing forest DudhwaNP, Sonbhedra, Obra, Renukoot, Bijnor, , Bijnor SF, Shivalik,
5B/C2 Northern dry mixed deciduous forest
Awadh, Hardoi, Raibarelly, Bareilly, Sitapur, Unnao, Faizabad, Sultanpur, Pratapgarh, Barabanki, Basti, Sohelwa Wild Life (North Gonda),, South Gonda, Chitrakoot, Banda, Mahoba, Sonbhedra, Renukoot, Obra, Sidharth Nagar, Badaun, Shahjahanpur, J P Nagar, Rampur, , Bijnor SF, Merrut, Muzafarnagar, Shivalik,
5/DS1 Dry deciduous forest Sohelwa Wild Life (North Gonda), Urai/Jaulon, Sonbhedra, Chitrakoot, Banda, Mahoba, Obra, Renukoot, Shahjahanpur, , Shivalik,
5/DS2 Dry savannah forest Chitrakoot, Mahoba, Hamirpur, 5/DS3 Euphorbia scrub Jhansi, Mahoba, 5/DS4 Dry grassland Saharanpur, 5/E1 Anogeissus pendula forest Jhansi, Banda, Mahoba, Hamirpur, Renukoot,
Agra, 5/E1/DS1 Anogeissus pendula forest Jhansi, Urai/Jaulon, Chitrakoot, Banda, Mahoba,
Hamirpur, 5/E2 Boswellia forest Jhansi, Urai/Jaulon, Chitrakoot, Banda, Mahoba,
Hamirpur, Kashi WL., Sonbhedra, 5/E3 Babul forest Banda, Mahoba, 5/E5 Butea forest S-Gonda, Mahoba, Sidharth Nagar,
Shahjahanpur, J P Nagar,Shahjahanpur, , Bijnor SF,
5/E6 Aegle forest Jhansi, Shahjahanpur,
5 Tropical Dry Deciduous Forests
5/E8 Saline/alkaline scrub savannah forest
Awadh, Hardoi, Raibarelly, Sitapur, Unnao, Faizabad, Sultanour, Pratapgarh, Ambedkar nagar, Barabanki, Urai/jaulon, Azamgarh, Bareilly, Badaun, Shahjahanpur, J P Nagar, , Bijnor SF, Merrut, Ghaziabad, Bulandshahar,
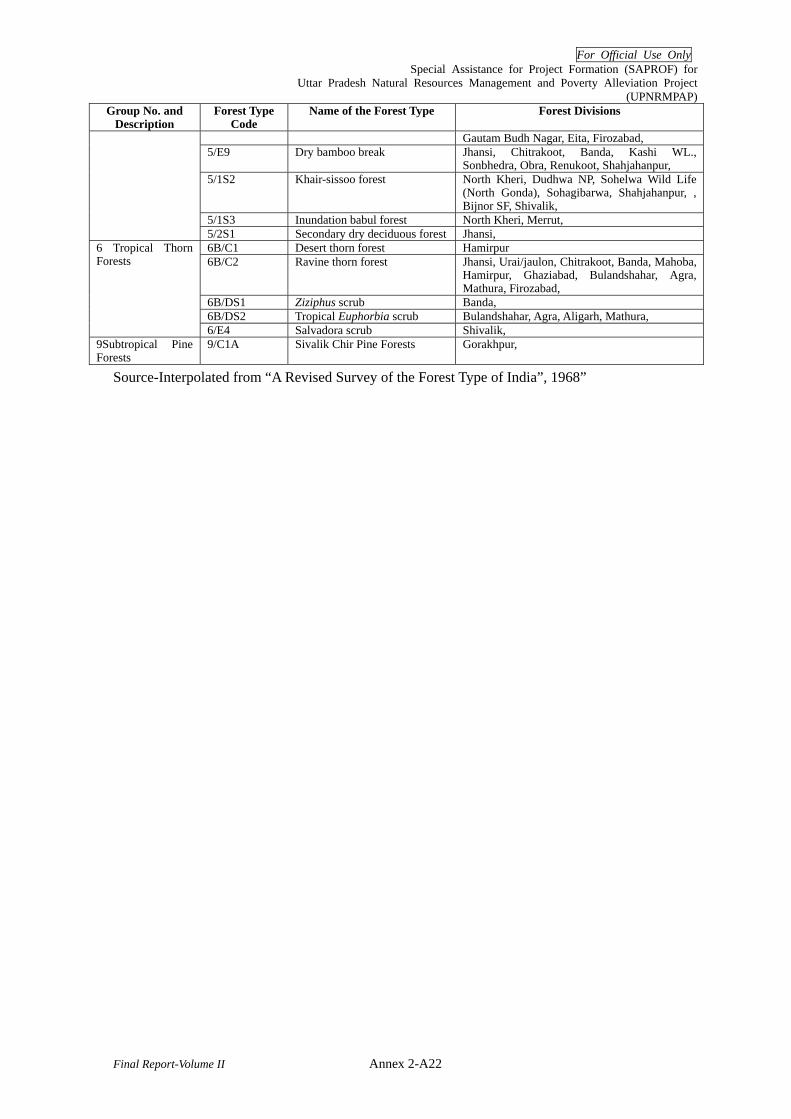
For Official Use Only Special Assistance for Project Formation (SAPROF) for
Uttar Pradesh Natural Resources Management and Poverty Alleviation Project (UPNRMPAP)
Final Report-Volume II Annex 2-A22
Group No. and Description
Forest Type Code
Name of the Forest Type Forest Divisions
Gautam Budh Nagar, Eita, Firozabad, 5/E9 Dry bamboo break Jhansi, Chitrakoot, Banda, Kashi WL.,
Sonbhedra, Obra, Renukoot, Shahjahanpur, 5/1S2 Khair-sissoo forest North Kheri, Dudhwa NP, Sohelwa Wild Life
(North Gonda), Sohagibarwa, Shahjahanpur, , Bijnor SF, Shivalik,
5/1S3 Inundation babul forest North Kheri, Merrut,
5/2S1 Secondary dry deciduous forest Jhansi, 6B/C1 Desert thorn forest Hamirpur 6B/C2 Ravine thorn forest Jhansi, Urai/jaulon, Chitrakoot, Banda, Mahoba,
Hamirpur, Ghaziabad, Bulandshahar, Agra, Mathura, Firozabad,
6B/DS1 Ziziphus scrub Banda, 6B/DS2 Tropical Euphorbia scrub Bulandshahar, Agra, Aligarh, Mathura,
6 Tropical Thorn Forests
6/E4 Salvadora scrub Shivalik, 9Subtropical Pine Forests
9/C1A Sivalik Chir Pine Forests Gorakhpur,
Source-Interpolated from “A Revised Survey of the Forest Type of India”, 1968”

For Official Use Only Special Assistance for Project Formation (SAPROF) for
Uttar Pradesh Natural Resources Management and Poverty Alleviation Project (UPNRMPAP)
Final Report-Volume II Annex 2-A23
Attachment A2.5-1 Status of Working Plans in Uttar Pradesh 2007 Period of WP Zone Circle WP name Division Valid/
Expired/ no data
from to
1 01-Sahranpur Shevalik Shevalik Valid 99/00 08/092
Western Zone, Meerut Sahranpur Sahranpur Valid 02/03 11/12
3 Muzzafar Nagar Muzzafar Nagar Valid 02/03 11/124 02-Moradabad Bijnore (Social F) Bijnore (Social F) Valid 05/06 14/15
5 Nazibabad Nazibabad Valid 00/01 09/10 J.P. Nagar Valid 05/06 14/15
6 Moradabad Moradabad Valid 05/06 14/157 Rampur Rampur Valid 05/06 14/158 03-Meerut Meerut Meerut Valid 02/03 11/129 Gaziabad Gaziabad Valid 02/03 11/1210 Bulandshar Bulandshar Valid 02/03 11/1211 Gautam Buddh
Nagar Gautam Buddh Nagar
Valid 02/03 11/12
12 04-Bareilly Bareilly Bareilly Expired 85/86 94/9513
Rohalkhand, Bareilly Pilibhit Pilibhit Valid 01/02 10/11
14 Pilibhit (Social F) Pilibhit (Social F) Valid 01/02 10/1115 Badhau Badhau Expired 85/86 94/9516 Shajahan Pur Shajahan Pur Expired 85/86 94/9517 05-Agra Aligarh Aligarh Valid 04/05 13/14 Mahamaya Nagar Valid 04/05 14/14
18 Mathura Mathura Valid 04/05 13/1419 Etah Etah Valid 04/05 13/1420 Firozabad Firozabad Valid 04/05 13/1421 Agra Agra Valid 04/05 13/1422 Mainpuri Mainpuri Valid 04/05 13/1423 06-Lucknow North kheri North kheri Valid 03/04 12/1324 South Kheri South Kheri Valid 00/01 09/1025
Central Zone, Lucknow Sitapur Sitapur Valid 98/99 07/08
26 Hardoi Hardoi Valid 98/99 07/0827 Avadh Avadh Valid 98/99 07/0828 Unnao Unnao Valid 98/99 07/0829 Raiberally Raiberally Valid 98/99 07/0830 07-Gonda
(Deavipatan) Bahraich, Shrawasti
Bahraich, Shrawasti
Valid 05/06 14/15
31 Gonda, Shrawasti Gonda, Shrawasti
Valid 98/99 07/08
32 08-Faizabad Barabanki Barabanki Valid 05/06 14/1533 Faizabad Faizabad Expired 85/86 94/95
Central Zone, Lucknow Amdekar Nagar Expired 85/86 94/95
34 Sultanpur Sultanpur Expired 84/85 93/9435 09-Kanpur Farokabad Farokabad Valid 95/96 04/0536
Budelkhand, Jhansi Etawah Etawa Valid 95/96 04/05
37 Kanpur Kanpur Valid 95/96 04/0538 Kanpur Dehat Kanpur Dehat Valid 95/96 04/0539 10-Jhansi Orai Orai Expired 97/98 06/0740 Jhansi Jhansi Expired 97/98 06/0741 Lallitpur Lallitpur Expired 97/98 06/0742 Hamirpur Hamirpur Valid 05/06 14/1543 Mahoba Mahoba Valid 05/06 14/1544 Banda Banda Valid 05/06 14/1545 Chitrakoot Chitrakoot Valid 05/06 14/1546 Eastern 11-Gorakhpur Siddhart Nagar Siddhart Nagar Valid 98/99 07/08

For Official Use Only Special Assistance for Project Formation (SAPROF) for
Uttar Pradesh Natural Resources Management and Poverty Alleviation Project (UPNRMPAP)
Final Report-Volume II Annex 2-A24
Period of WP Zone Circle WP name Division Valid/ Expired/ no data
from to
47 Zone, Gorakhpur
Basti Basti Valid 98/99 07/08
48 Gorakhpur Gorakhpur Expired 94/95 03/0449 Pandrauna Pandrauna Expired 85/86 94/9550 Deoria (Deavariya) Deoria
(Deavariya) Expired 85/86 94/95
51 12-Azamgarh Azamgarh Azamgarh Expired 85/86 94/9552 Mau Mau Expired 85/86 94/9553 Ballia Ballia Valid 98/99 07/0854 13-Allahabad Fathepur Fathepur Expired 95/96 04/0555 Allahabad Kaushambi Expired 95/96 04/05 Allahabad Expired 94/95 04/05
56 Pratapgarh Pratapgarh Expired 95/96 04/0557 14-Varanasi Jaunpur Jaunpur Valid 98/99 07/0858 Varanasi Varanasi Valid 98/99 07/0859 Ghazipur Ghazipur Valid 98/99 07/0860 Badohi Badohi Valid 98/99 07/0861 Mirzapur Mirzapur Valid 01/02 10/1162 Obra Obra Valid 02/03 11/1263 Sonbhadra Sonbhadra Valid 01/02 10/1164 Rainukoot Rainukoot Valid 02/03 11/1265 Dudhwa
National Park Katarniaghat WL Katarniaghat WL Valid 05/06 14/15
66
Chief WL Warden
Gonda WL Sohelwa WL Sohelwa WL Expired 98/99 04/0567 Sohagibarnal WL Sohagibarnal WL Expired 94/95 03/0468 Lucknow WL Kashi WL Kashi WL Valid 98/99 07/0869 Dudhwa
National Park by CWL Warden Dudhwa WL no data by CWL
Warden 70 by CWL Warden Kaimur WL no data by CWL
Warden
Source: Working Plan Circle Office, UPFD..
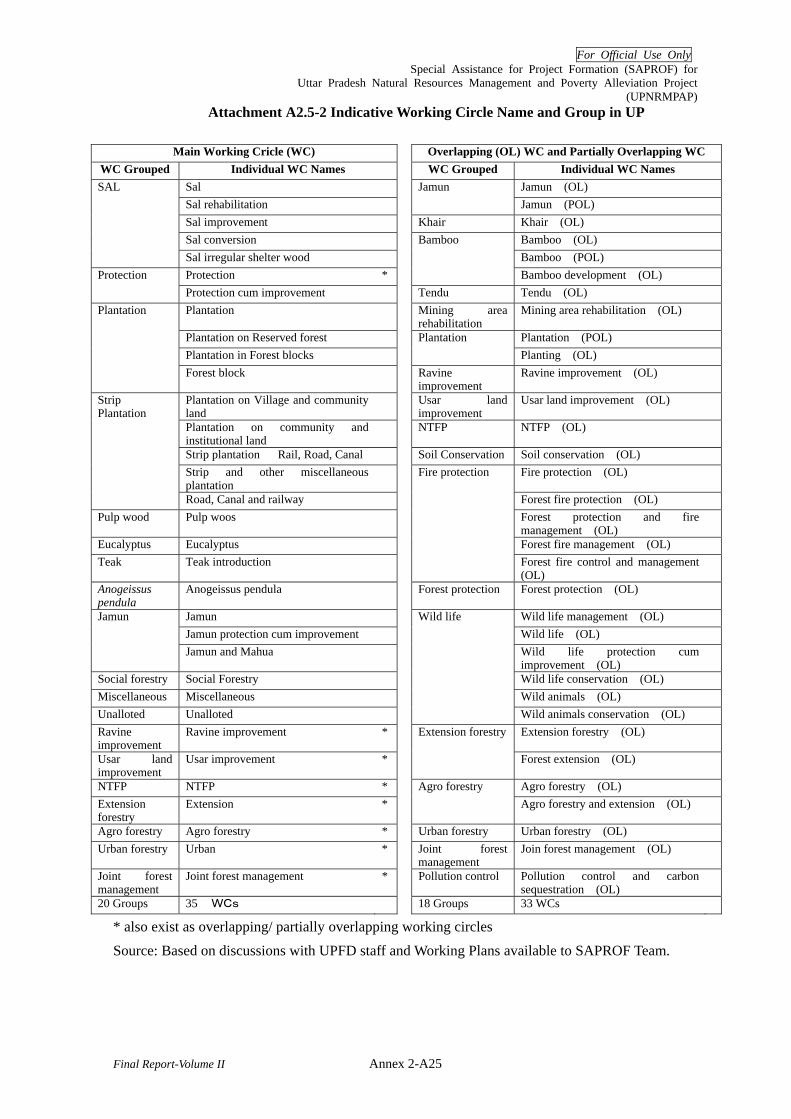
For Official Use Only Special Assistance for Project Formation (SAPROF) for
Uttar Pradesh Natural Resources Management and Poverty Alleviation Project (UPNRMPAP)
Final Report-Volume II Annex 2-A25
Attachment A2.5-2 Indicative Working Circle Name and Group in UP
Main Working Cricle (WC) Overlapping (OL) WC and Partially Overlapping WC WC Grouped Individual WC Names WC Grouped Individual WC Names
Sal Jamun (OL)
Sal rehabilitation
Jamun Jamun (POL)
Sal improvement Khair Khair (OL)
Sal conversion Bamboo (OL)
SAL
Sal irregular shelter wood Bamboo (POL)
Protection *
Bamboo
Bamboo development (OL) Protection Protection cum improvement Tendu Tendu (OL)
Plantation Mining area rehabilitation
Mining area rehabilitation (OL)
Plantation on Reserved forest Plantation (POL)
Plantation in Forest blocks
Plantation Planting (OL)
Plantation
Forest block Ravine improvement
Ravine improvement (OL)
Plantation on Village and community land
Usar land improvement
Usar land improvement (OL)
Plantation on community and institutional land
NTFP NTFP (OL)
Strip plantation Rail, Road, Canal Soil Conservation Soil conservation (OL)
Strip and other miscellaneous plantation
Fire protection (OL)
Strip Plantation
Road, Canal and railway Forest fire protection (OL)
Pulp wood Pulp woos Forest protection and fire management (OL)
Eucalyptus Eucalyptus Forest fire management (OL)
Teak Teak introduction
Fire protection
Forest fire control and management (OL)
Anogeissus pendula
Anogeissus pendula Forest protection Forest protection (OL)
Jamun Wild life management (OL)
Jamun protection cum improvement Wild life (OL)
Jamun
Jamun and Mahua Wild life protection cum improvement (OL)
Social forestry Social Forestry Wild life conservation (OL)
Miscellaneous Miscellaneous Wild animals (OL)
Unalloted Unalloted
Wild life
Wild animals conservation (OL)
Ravine improvement
Ravine improvement * Extension forestry (OL)
Usar land improvement
Usar improvement *
Extension forestry
Forest extension (OL)
NTFP NTFP * Agro forestry (OL)
Extension forestry
Extension *Agro forestry Agro forestry and extension (OL)
Agro forestry Agro forestry * Urban forestry Urban forestry (OL)
Urban forestry Urban * Joint forest management
Join forest management (OL)
Joint forest management
Joint forest management * Pollution control Pollution control and carbon sequestration (OL)
20 Groups 35 WCs 18 Groups 33 WCs
* also exist as overlapping/ partially overlapping working circles Source: Based on discussions with UPFD staff and Working Plans available to SAPROF Team.

For Official Use Only Special Assistance for Project Formation (SAPROF) for
Uttar Pradesh Natural Resources Management and Poverty Alleviation Project (UPNRMPAP)
Final Report-Volume II Annex 2-A26
Attachment A2.5-3 Major Achievements of Research Wing in UPFD
1. Organisation
Forestry research in Uttar Pradesh started way back in 1918. The State Forest Research Laboratory was established in Kanpur in 1970. Subsequently, this laboratory was upgraded to the State Forest Research Institute (SFRI) in 1993.
Currently, the forestry research wing of UPFD is headed by Additional Principal Chief Conservator of Forests (Working Plan, Research and Training), stationed in Lucknow. For coordinating the research activities in the entire state, a Research Circle is developed. The Research Circle office is located in Kanpur, and headed by Chief Conservator of Forests (Research) who is also the ex-officio Director of SFRI. Under Research Circle, there are 3 divisions headed by Silviculturists. The field units (known as research centres) of the respective divisions and there major tasks is described in the following table:
Research Centre Major Task
Terai (Sal )Region, Bareilly 1. Bareilly 2. Palia 3. Mankapur 4. Anandnagar 5. Meerut
Eucalyptus related research Poplar related research Shisham related research Sal and Sagon related research Khola & Khadar areas related research
Vindhyan Region, Ramnagar (Varanasi) 1. Mau 2. Ramnagar 3. Kotwa 4. Jhansi
Industrial pollution, brackish water and dry zone species Ravenous areas Usar land reclamation & Biomass research Germplasm bank of some important species
Southern Region, Kanpur 1. Mathura 2. Etawa 3. Kukrail 4. Kanpur
Industrial pollution, brackish water and dry zone species Ravenous areas Usar land reclamation & Biomass research Germplasm bank of some important species
2. Achievements
Major achievements of the research wing are summarised as follows: 1. Improvement in nursery technology and use of root trainers for producing quality seedlings and clonal multiplication
of tree species like Eucalyptus, Dalbergia sissoo, Bamboo etc. 2. Development of new poplar clones and research on suitability of poplar clones in different agro-climatic zones. 3. Establishment of seed production areas (SPA), seedling seed orchards (SSO), clonal seed orchards (CSO), and
selection / identification of candidate plus trees (CPTs) of important forest tree species. 4. Supply of quality seed to different forest divisions, institutes, farmers and NGOs. 5. Developing technique for vermin-composting with the help of red-worms. 6. Development of suitable models for afforestation of saline-alkali soils (usar), ravines & brackish water areas of UP. 7. Ecological survey of Dudwa National Park and Samaspur and Nawabganj Bird Sanctuaries. 8. Determination of calorific values, wood density and burning properties of 100 tree species. 9. Studies of root behaviour of different tree species in usar areas. 10. Study of D.sissoo mortality in eastern Uttar Pradesh 11. Evaluation of azadirachtin rich neem seed zones available in different ecosystems. 12. Study of fire as a management tool for enchancing the productivity of D. strictus forests of Vindhyan Region. 13. Climatological studies including establishment of meteorological observatories and recording of various
meteorological parameters.

For Official Use Only Special Assistance for Project Formation (SAPROF) for
Uttar Pradesh Natural Resources Management and Poverty Alleviation Project (UPNRMPAP)
Final Report-Volume II Annex 2-A27
14. Study on forest hydrology and watershed management including water uptake and biomass production relationship. 15. Studies on screening of suitable tree species for afforestation in areas infested by industrial effluents, e.g., tannery,
dairy, distillery and refinery. 16. Environmental effects of forests including role of forest trees in mitigating air pollution. 17. Studies on biological method of fly ash stabilization through afforestation on ash dump and yard near thermal power
station. 18. Studies on variation in the soft moisture regime under various tree species during stress months. 19. Reclamation and restoration of degraded ecosystems including ravines and dry rainfed areas of Vindhyan Region
through in-situ soil and moisture conservation vegetative technology. 20. Development and standardization of germination technique for forest tree seeds viz. Azadirachta
indica, Acacia lebbek, Dalbergia sissoo and Prosopis juliflora 21. Survey and selection of bamboo CPCs from diffirent agro-climatic zones of UP. for ex-situ conservation and
evaluation of genetic resources of bamboo. 22. Standardization of cultivation techniques of some important medicinal plant species. 23. Protocol development for Dalbergia sissoo, Dendrocalamus asper and Bambusa wamin in the tissue culture
laboratory at SFRI, Kanpur. 24. Study on development of the disease resistant clones of Dalbergia sissoo. 25. Study on development of Agroforestry models on different agroclimatic zones of the state. 26. Setting up of research-cum-demonstration plots of problematic areas. 27. Preparation of volume and yield tables of different timber species. 28. Publications of research bulletins, leaflets, research papers and lab-to-land leaflets in Hindi for dissemination of
technologies developed. 29. Recognition of the Institute as Research Centre for Ph.D.
Of the above, details of seed/ tree improvement related achievements are described in the following two tables.
Existing Quality Seed Production Capacity of the Research Wing for Major Species
Seed Production Area (SPA)
Seedling Seed Orchard (SSO)
Clonal Seed Orchard (CSO)Species Area (ha.) No.* Area
(ha.) No.* Area
(ha.) No.*
Total No.*
Average* (kg)
Total* (100kg/
year)
Tectona grandis 100.8 5,040 1.0 300 912 3,280 8,620 5.0 431 Dalbergia sissoo 53.0 2,650 20.1 6,030 5.8 2,090 10,770 5.0 538 Eucalyptus hybrid - - 7.6 3,040 1.0 480 3,520 0.5 17.6 Prosopis juliflora 66.0 3,300 2.2 880 0.2 96 4,276 10.0 425 Acacia nilotica 8.0 400 - - - - 400 100.0 200 Acacia catechu 45.0 125 3.0 1,200 - - 2,325 2.0 46.5
Note* No.* : No. of seed trees, Average*: Average of Seed production per tree/year, Total* : Total expected Seed production Source- Note from APCCF(WP< Research and Training)
Acheivement of SPAs, SSOs, CSOs and CPTs for Other Species Species SPAs
( ha) SSOs ( ha)
CSOs (ha)
CPTs. (no)
Acacia auriculiformis - - - 2,106 Acacia leucophloea - - - 110 Adina cordiafolia - - - 816 Aegle marmelos - - - 7 Ailanthus excelsa - - - 432 Albizia procera 0.76 - - 41 Albizzia lebbek - - - 2,638 Anthocephalus chinensis - - - 226 Azadirachta indica 1.95 - - 1,416 Bambusa bambos - - 0.5 - Bambusa wamin - - 0.1 - Bauhinia variegata - - - 57 Bombax ceiba 1.0 - 0.24 2,443

For Official Use Only Special Assistance for Project Formation (SAPROF) for
Uttar Pradesh Natural Resources Management and Poverty Alleviation Project (UPNRMPAP)
Final Report-Volume II Annex 2-A28
Species SPAs ( ha)
SSOs ( ha)
CSOs (ha)
CPTs. (no)
Buchanania lanzan - 0.30 - 292 Cassia fistula - - - 216 Cassia siamia - - - 401 Casuarina equisetifolia - - - 50 Cordia dichotoma - - - 12 Delonix regia - - - 743 Dendrocalamus asper - - 0.6 - Emblica officinalis 15.0 - 0.1 2,913 Feronia limonia - - - 101 Grevillea robusta - - - 3 Haplofragma adenophylum - - - 842 Holoptelia intgrefolia - - - 1,314 Leucaena leucocephala - - - 247 Madhuca longifolia - - - 519 Melia azaderach - - - 110 Moringa oleifera - - - 4 Pithecellobium dulce - - - 7 Polyalthia longifolia - - - 30 Pongamia pinnata - - - 1,718 Prosopis cineraria - - - 174 Prosopis juliflora (Thornless variety) - - 0.38 - Putrangiva roxburghii - - - 96 Schleichera oleosa - - - 5 Shorea robusta - - - 466 Syzygium cumini - - - 1,082 Tamarindus indica - - 3.95 16 Terminalia arjuna 0.9 - - 4,903 Terminalia bellerica - - - 215 Terminalia chebula - - - 175 Terminalia tomentosa - - - 1,026 Trewia nudiflora - - - 3,882 Zizyphus zazuba - - - 842
Note SPA: Seed Production Area, SSO: Seedling Seed Orchard, CSO: Clonal Seed Orchard CPT: Candidate Plus Tree
The following table summarises 10 major research projects undertaken under the UP Forestry Project during the period 1997/98 to 2003/04.
Summary of Research Projects Conducted during the UP Forestry Project 1. Silviculturist, Sal Region, Bareilly No. 1 Name of the Project : Tree improvement of Dalbergia sissoo through Clonal techniques Cost Rs. (thousand) : 1,000 Period Years: four Date of Start: October 1998 Progress/Achievement (June 2003) Out of 293 selected CPT’s 160,000 clonal plants of Dalbergia sissoo were raised. Multi-location field trials for further selection in the form of CTA’s/CMA’s established at Anandnagar, Meerut, Bareilly and Mankapur (5.37 Ha.) and the same is also supplied to various forest divisions for field testing. Outstanding individual trees have been selected as new CPT’s which includes selections from gene banks, CTA’s and field plantations. 125 CPT’s have been selected, as Anandnagar and 92 CPT’s have been selected at Bareilly. All these selected CPT’s have been given clear and separate identity numbers. Selection from gene-bank/ CTA’s has been pollarded and root-suckers from field selection has been collected and planted in nursery beds. At Anandnagar, site preparations for CTA/CMA has been done. A set of protocol for local cloning technique has been developed and disseminated to forest staff through demonstrations, workshops, seminars and leaflets. No. 2 Name of the Project Improvement of planting material through Scientific Culling of Tectona grandis
Seedling in Nursery. Cost Rs. (thousand) : 960 Period Years: Four Date of Start: October 2001 Progress/Achievement (June 2003) Under this project, quality seeds were collected from CPT’s and were sown in the nursery beds with various treatments. The germination was observed carefully and culling was done. After thorough selection, seedlings were pricked into polybags as well as in root trainers. Out of these two field trials raised at Campiarganj in 0.97 ha. area with 1,050 polybags plants and 0.95 ha. area with 1,050 root trainer plants. The remaining planting material was supplied to South Kheri, Bahraich, Gorakhpur divisions and Bijnor plantation division with experimental design to evaluate their field performance. The field trials of scientifically culled material is under observation. The suggestive culling for root trainer plants is 7-8% and for polybags plants 15-16% from the true nursery stock.

For Official Use Only Special Assistance for Project Formation (SAPROF) for
Uttar Pradesh Natural Resources Management and Poverty Alleviation Project (UPNRMPAP)
Final Report-Volume II Annex 2-A29
No. 3 Name of the Project Tree Improvement of Eucalyptus hybrid through Clonal technique. Cost Rs. (thousand) : 3,914 Period Years:Four Date of Start: October 1998 Progress/Achievement (June 2003) More than 100,000 clonal plants were raised from selected 394 CPT’s. Multi-locational field trials established in the form of CTAs/CMAs at Campierganj, Meerut and Bareilly research centres and the same were supplied to different forest divisions for field performance. Individual outstanding trees (CPTs) have been selected from CMAs, CTAs and old plantation, 50 CPTs at Anandnagar, 106 CPTs Bareilly and 18 CPTs at Rithani (Meerut) have been selected. All these selected CPTs have been given clear and separate identity numbers. All these selected CPTs were pollarded in two phases i.e. in Oct. 02 and Jan-Feb. 03. Cloning has been started. Site preparation for CTAs and CMAs has been done at Anandnagar. A set of protocol for local-cloning technique has been developed and disseminated to field staff through demonstration, workshop and seminars. Development of promising clone is still under way. 3 to 4 more years will be required for clone identification. S.No. 4 Name of the Project : Development of model for natural regeneration of Sal including study of effect of fire
on Sal forest. Cost Rs. (thousand) : 2,905 Period Years:Four Date of Start: April 1998 Progress/Achievement (June 2003) Four problems sites were selected in different areas of Sal region. Out of them, two are existing in Uttaranchal state. The experiments were laid out as a split plot design with 3 replications of each of the three main treatments and replications of each of the three sub-treatments. A fairly mixed area of mature Sal with practically no advanced natural regeneration was selected in Pilibhit division (Mala range) and in Gorakhpur division (Campiarganj range) The area was fenced and demarcated into 3 equal blocks of 2 ha each, of which each block was then divided into three main plots (further subdivided into three equal subplots) for allocation of treatments: (1)Allocation of treatments The treatments allocated at random to main plots and subplots are as follows. Main plot treatments: A) overhead canopy up to 0.7,B) overhead canopy up to 0.5 and C)overhead canopy up to 0.3. Sub-plot treatments: A-T 1) area subjected to fire and soil working, B-T 2) area subjected to fire only, and C-T 3)area subjected to fire only. (2)Artificial regeneration treatments: Treatment PT1- Pure Sal seed sowing in the lines Treatment PT2- Sal seed mixed with associates. Treatment PT3- Sal seed mixed with Eucalyptus hybrid. Since it was not possible for the regeneration felling, the area was chosen deliberately that are having crown density as mentioned above. After regeneration survey the shrub cutting of the whole area was carried out. The regeneration survey conducted in beginning would be an indicator and to be treated as control for the future computations. 2. Silviculturist, Southern Region, Kanpur1 No. 1 Name of the Project Development of suitable management & silvicultural technique to maximise production
of Prosopis juliflora and its improvement for usar and ravinous areas. Cost Rs. (thousand) : 1,492 Period Years: 3 Date of Start: April 1999 Progress/Achievement (June 2003) 1. In this project 350 CPT’s have been selected from base population of P. juliflora through the state. 2. Measurement of 350 CPTs have been recorded for clear bole height, DBH, crown diameter and other phonological characters. Scoring method has been followed. 3. Photographs and herbarium have also been prepared for each CPT. 4. Socio-economic survey has been conducted in nearby villages for utility of species for fuel wood , fodder and timber. 5. Sample plots have also been laid out for P.juliflora at Mau, Mathura, Lucknow, Kanpur, Etawah, Hamirpur and Fatehpur. 6. Progeny trials have been carried out at 6 sites representing 4 seed zones. Growth data of the trials are being recorded for selection of suitable genotype for a particular site. 7. Cleft grafting was done at FRI, Kanpur. It was found that the root stock of Etawah was more compatible to scion taken from already marked CPTs. 8. Experiments regarding development of suitable management techniques are underway. 9. The suggestions received upon Interim report have been incorporated and final report of the project is being prepared. No. 2 Name of the Project Studies on use of fire as management tool for enhancing the bamboo and miscellaneous
forests in Vindhyan region. Cost Rs. (thousand) : 1,110 Period Years: 3 Date of Start: April 1999 1. Three study sites were selected, two at Mirzapur and one at Renukoot forest division of Vindhyan region of UP. 2. The objective of the present project was to study the impact of prescribed burning/ fire treatments, hence, fire line with
effective stone wall of 1 meter height has been constructed at Mirzapur, while at Renukoot, the study site was protected by digging trenches of 1.20 X 1.00 X 0.90 meter. Each plot of one hectare has been divided into 4 subplots and again each subplots has been divided into 2 study plots of 10 X 10m, size for recording the data.
3. The fire treatment viz. control (T0), fire during the entire project (T1), fire during winter season (T2), fire during summer season(T3), have been applied in respective seasons.
4. According to the objective of the project data were collected for (i) Study of effect of fire on physio-chemical properties
1 At the time of commencement of these projects the research division – Vindhyan Region did not exist and its present
jurisdiction was covered by Southern region

For Official Use Only Special Assistance for Project Formation (SAPROF) for
Uttar Pradesh Natural Resources Management and Poverty Alleviation Project (UPNRMPAP)
Final Report-Volume II Annex 2-A30
of soil, (ii) Study of effect of fire on regeneration of bamboo species, (iii) Study of effect of fire on ground flora.
Data related to growth parameters of Dendrocalamus strictus have reveled that the total number of bamboo culms increased in all the treatment with significant improvement after summer burning. Similarly total number of new culms has also been increased 4-5 times after summer burning. Height of new culms was increased with significant difference. However the diameter of new culms was not improved significantly. This may be attributed to the fact that at each counting only the fresh culms were taken leaving the older ones. The over all impact of fire on soil properties appeared to be beneficial which ultimately resulted in increased number of culms and density of other species.
No. 3 Name of the Project Development of nursery and planting techniques of various NTFP species including medicinal plants and establishing JFM based NTFP model in plains and Vindhyan regions.
Cost Rs. (thousand) : 1,340 Period Years: 3 Date of Start: April 1999 Progress/Achievement (June 2003) 1. Survey and selection of forest areas in Vindhyan region for identification of superior quality seed/ planting material of
selected NTFP species including medicinal plants was carried out during 1999-2000. 2. Two village forest communities (VFCs) were selected in Mirzapur Forest Division for JFM of selected NTFP species. 3. A nursery (1.0 ha) was established at Upper Khajuri, Kotwah Research Range (Mirzapur) for developing nursery
techniques and raising of planting stocks of selected NTFP species was carried out for field trial. 4. Nursery technique of Kureya (Holarrhena antidysentrica), Ghumchi (Abrus precatorius), Marorphali (Helicteris isora),
Jharberi (Zizyphus nummularia), Khus grass (Vetiveria zizanoides), Jangli karonda (Carissa opaca), Gurch(Tinospora cordifolia), Dhak (Butea monosperma), Kulu (Sterculia urens), Chironji (Buchanania lanzan), Satavar (Asparagus racemosus), and Mahua (Mudhuca indica) have been standardized.
5. Herbarium of NTFP species from the selected sites had been prepared. 6. For standardization of planting techniques of selected NTFPs including medicinal plants, 3.0 ha area at each site was
selected for advance soil work (digging of pits and trenches) including construction of stone walls (for protection from grazing etc.) was completed and experimental planting was carried out during the rainy season (July-Aug.2000).
7. The survival and growth parameters of NTFP species after two years of field trial at both experimental sites was recorded. The growth data was statistically analyzed and the results are being incorporated.
8. Action plan for harvesting of selected NTFP species including medicinal plants was prepared and was circulated among the villagers to keep their knowledge update. Estimation of root yield of Vetiveria zizanoides and Asparagus racemoses as well as the yield of pods of Helicteris isora and seeds of Abrus precatorius at both the experimental sites was evaluated.
9. The prevailing market rates of medicinal plants were collected from the dealers of herbal products at Varanasi. After extensive survey of market, the price list of some medicinal plants was prepared.
10. The field performance of selected NTFPs was evaluated during December 2002 in a non qualitative way.For this purposes, a questionnaire was framed in vernacular language and information was collected by members of both the VFCs. The collected information were compiled and subsequently analyzed to extract inferences.
11. The NTFP plants as raised in research nursery were distributed to the local villagers. The species preferred by the villagers are Mudhuca indica, Buchanania lanzan, Asparagus racemosus, Holarrhena antidysentrica and Helicteris isora.
No. 4 Name of the Project Development and standardization of advanced nursery techniques for various forestry species of plains and Vindhyan region
Cost Rs. (thousand) : 922 Period Years: 3 Date of Start: April 1999 Progress/Achievement (June 2003)
1. Experiments for 7 species are completed. Different size of root trainers and potting mixtures were tried to standardized the nursery techniques.
2. Experiment for standardization of potting mix and root trainer size has been laid. 3. Size of appropriate root trainers and potting mixture were determined for 7 species covered
3. Research Circle Office, Kanpur No. 1 Name of the Project : Development of Forestry Extension Services. Cost Rs. (thousand) : 922 Period Years: Four Date of Start: April 1999 Progress/Achievement (June 2003) 1. Aimed for the better dissemination of the technical knowledge to the farmers and the forester. New addition in this series is Lab to Land leaflet no. 11 entitled “High-tech nursery” and leaflet no. 12 entitled “Bamboo” its nursery and management techniques. 2. A state level workshop on Agroforestry was organized. The proceedings of workshop was compiled and published as lab to land leaflet no. 10 entitled “Significance and use of Agroforestry system”. 3. A state level exhibition of forestry research and extension work was organized at Lucknow and Balia districts. 4. Orientation Workshop was organized at FRI, UP., Kanpur on 31 March 2002 to motivate the field foresters for proper execution of the Experiments in the field. 5. A two day workshop (19-20 August 2002) on “ Clonal Technology” was organized by the research wing of UPFD ay FRI, UP., Kanpur to promote clonal forestry in the field to enhance the forest productivity. S.N.2 Name of the Project : Development of Forestry Research Information System Cost Rs. (thousand) : 922 Period Years: Four Date of Start: April 1999 Progress/Achievement (June 2003) 1.For the better interaction regarding forestry research, the research circle of UPFD has launched a website. 2. There are about 4,000books available in the research library.

For Official Use Only Special Assistance for Project Formation (SAPROF) for
Uttar Pradesh Natural Resources Management and Poverty Alleviation Project (UPNRMPAP)
Final Report-Volume II Annex 2-A31
Attachment A2.5-4 Central and Foreign Funded Major Watershed Development Programmes in India
Scheme/Project Year of Start
Watershed No/Area
Supporting agency Funding Source
Research Watersheds 1956 42 MOA,GOI,ICAR C Soil conservation in River Valley Project catchments
1961-62 29 catchments in 9 states
MOA, GOI C
Operational Research Watersheds 1974 4 ICAR C Watershed Management in catchment of Flood Prone Rivers
1980-81 10 Catchments MOA, GOI C
Model Watersheds 1983 47 ICAR C Watershed Development in Ravine Area 1987 62000 ha EEC FOR
Drought Prone Area Programme (DPAP) 1987* 91 Districts 615 Blocks
MRAE,GOI C
Desert Development Programme (DDP) 1987* 21 Districts 131 Blocks
MRAE, GOI C
Western Ghat Development Programs 1987* 158 Blocks 5 States
GOI,Planning Commission
C
Indo-German Watershed Project 1990 Maharashtra Germany F Indo-German, Bilateral Project 1990 Monitoring Germany F National Watershed Development Programme for Rain-fed Areas
1991 2479 Watershed MOA,GOI C
Integrated Watershed Development Project IWDP (Hills & Plains)
1991 1,12,000ha WorldBank F
Comprehensive watershed development Project
1991 1,13,000 ha (3 States)
DANIDA F
Doon Valley Project , UP 1993 1,72,000 ha EEC F Integ. wasteland development project 1994 25 states MRAE GOI C Indo- Swiss Participatory watershed development Project
1995 35,000 ha SWISS GOVT F
Attapadi wasteland comprehensive environment conservation project
1996 50,700ha OECF (JBIC), Japan F
*Note C: Centrally funded, F: Foreign funded
Source : Sharda, V.N, Sikka, A.K. and Juyal, G.P. (2006). Participatory Integrated Watershed Management-A Field Manual. Publication of the Central Soil and Water Conservation Research & Training Institute, Dehradun, India. Pp 1-362.
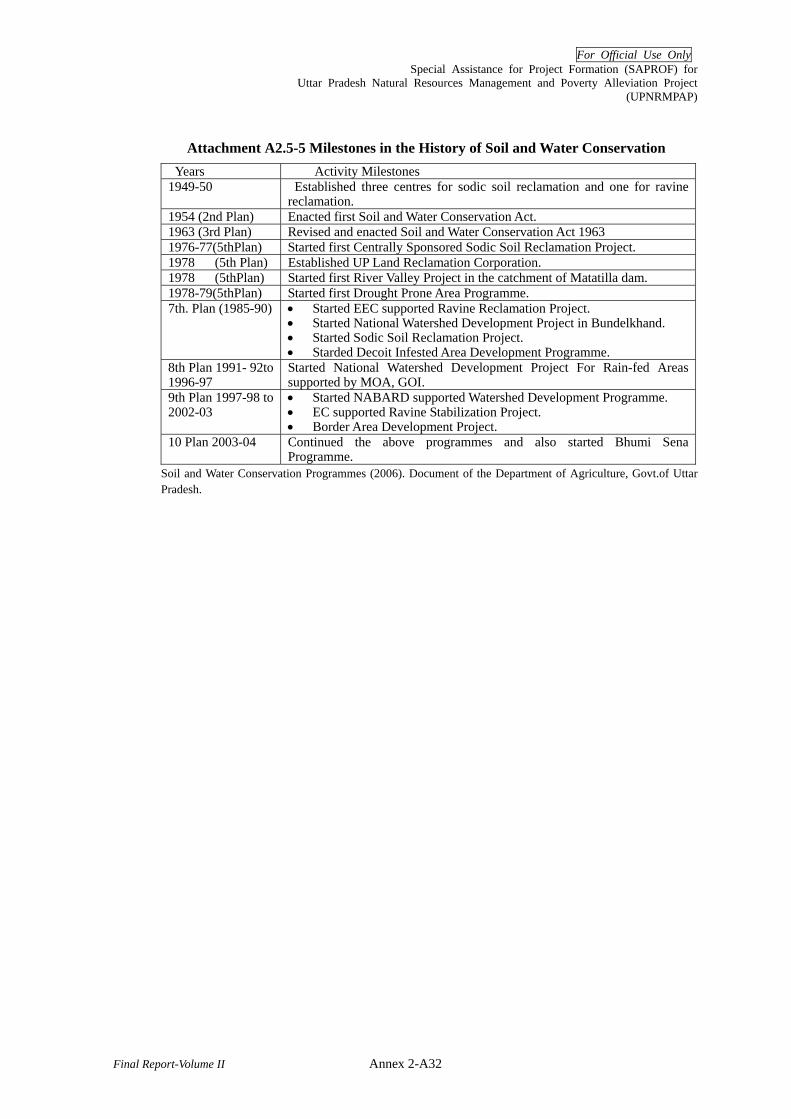
For Official Use Only Special Assistance for Project Formation (SAPROF) for
Uttar Pradesh Natural Resources Management and Poverty Alleviation Project (UPNRMPAP)
Final Report-Volume II Annex 2-A32
Attachment A2.5-5 Milestones in the History of Soil and Water Conservation Years Activity Milestones 1949-50 Established three centres for sodic soil reclamation and one for ravine
reclamation. 1954 (2nd Plan) Enacted first Soil and Water Conservation Act. 1963 (3rd Plan) Revised and enacted Soil and Water Conservation Act 1963 1976-77(5thPlan) Started first Centrally Sponsored Sodic Soil Reclamation Project. 1978 (5th Plan) Established UP Land Reclamation Corporation. 1978 (5thPlan) Started first River Valley Project in the catchment of Matatilla dam. 1978-79(5thPlan) Started first Drought Prone Area Programme. 7th. Plan (1985-90) • Started EEC supported Ravine Reclamation Project.
• Started National Watershed Development Project in Bundelkhand. • Started Sodic Soil Reclamation Project. • Starded Decoit Infested Area Development Programme.
8th Plan 1991- 92to 1996-97
Started National Watershed Development Project For Rain-fed Areas supported by MOA, GOI.
9th Plan 1997-98 to 2002-03
• Started NABARD supported Watershed Development Programme. • EC supported Ravine Stabilization Project. • Border Area Development Project.
10 Plan 2003-04 Continued the above programmes and also started Bhumi Sena Programme.
Soil and Water Conservation Programmes (2006). Document of the Department of Agriculture, Govt.of Uttar Pradesh.

For Official Use Only Special Assistance for Project Formation (SAPROF) for
Uttar Pradesh Natural Resources Management and Poverty Alleviation Project (UPNRMPAP)
Final Report-Volume II Annex 2-A33
Attachment A2.5-6 Key Features for SWC in Problematic Lands in UP
A. Soil and Water Conservation in Reclamation of Salt Affected Lands
Salt affected soils occur in irrigated, semi-irrigated and arid regions where surface horizons of soil contain excess salts and annual evaporation is more than rainfall. Due to poor drainage and impermeable sub–strata, the water soluble salts movement is restricted. The irrigation net-work leads to rise in water table causing accumulation of salts in surface layers. Majority (90%) of these soils are sodic (alkali) while small area in Agra and Mathura districts is saline. They mostly occur in small patches or in contiguous blocks varying in area from some 100 to 500 ha2 . Sodic soils have high exchangeable sodium, dominance of carbonate & bicarbonate salts, high pH, low calcium, nitrogen and zinc, presence of CaCo3 (Kankar) layer, poor physical conditions and poor water transmission. The reclamation technologies include measures desribed in the following table.
SWC Practices Main focus of the Technological Intervention. Contour bunding To conserve maximum rainwater in-situ at field level. Land levelling Ensure uniform distribution of stored water in the field. Drainage channel To dispose of bad quality saline water from fields. Field and link drains To carry saline and excess rain water to main drains through field and link drains3.Irrigation facility Needed to leach the salts through irrigation. Amendment use Soil test/ pH based use of gypsum, iron pyrite and press mud Manure/ compost Apply organic manure to improve fertility, aeration. Cultural practices Follow prescribed crop rotations, irrigation schedules and fertilizer dose and
method of application. Special practices for raising trees
Use augerhole technique to bypass calcareous pan; Plant fruit trees in deeper and wider (1x1x1m) pits; Fill pits with soil test based amendments and manure; Select salt tolerant and recommended tree species4.
Source: DOA (2006). Soil and water conservation programmes in UP, Document of the Department of Agriculture, Govt. of Uttar Pradesh.pp 1-46.
B. Soil and Water conservation in Ravine Reclamation
The U.P. State has 1.23 million ha area infested with ravine problem out of which about one third has so far been treated5. Ravine formation has taken place along the river banks mainly of Yamuna, Sengar, Rind, Chambal etc. The soils are very deep (even more than 100 meter), and mainly alkaline, with exposed calcareous pans. These problem soils are mainly confined to recent alluvial deposits and light textured soils located between Bundelkhand and Yamuna geological unit. The rivers especially
2 Uttar Pradesh Bhumi Sudhar Nigam (1997). Usar lands of Uttar Pradesh and their reclaimation (Hindi). Part3.
Publication of U.P. Land Reclamation Corporation pp 1-213 3 CSSRI,Karnal. Alkali soils: Steps for reclamation. Central Soil Salinity Research Institute, Karnal India. 4 Uttar Pradesh Bhumi Sudhar Nigam 2001. Usar Suduar Management Guidelines,Publication of Bhumi Sudhar
Nigam Gout of UP. 5 Records of the Department of Agriculture, Govt. of Uttar Pradesh.

For Official Use Only Special Assistance for Project Formation (SAPROF) for
Uttar Pradesh Natural Resources Management and Poverty Alleviation Project (UPNRMPAP)
Final Report-Volume II Annex 2-A34
Yamuna flows through deep alluvium and surface run off from table lands moves through drainage network towards the river and form defined water-ways which cut deep into the landscape and form network of gullies. The elevation difference between the table land and river being large, it generates high velocity flows which erode banks and deepen the gully beds. The SWC package adopted in these areas aimed to increase in-site rainwater conservation, reduce length and degree of slope to reduce velocity of run off water and increase infiltration and integrate site specific, biological and mechanical measures6. The practices include are desribed in the following table.-
SWC Practices Main focus of the Technological Intervention. Practices for shallow ravines: Contour bunding Done in upper table land for in-situ rainwater harvesting. Peripheral bunds Store runoff from peripheral lands, check gully extension. Levelling/terracing To reduce over land slope, arrest runoff and safe disposal of water from
shallow ravines. Practices for medium ravines: Bunds across slope Erosion control and runoff harvesting. Drop inlet spillway For safe disposal of excess runoff. Grass planting On slopes of bunds for soil binding and forage supplies. Tree planting Raising hardy fruit trees to improve cover and income. Practices for deep ravines: Contour trenches To store rainwater, improve moisture regime and tree planting. Pits for planting Trees are also planted in pits which store rainwater. Gully pluggs Grass planting
To intercept runoff, improve moisture regime. For soil binding, cover improvement and forage.
Tree planting Recommended tree species are planted to protect slopes.
C. Soil and Water Conservation on Erosion prone Degraded Non Arable/ Forest Lands
Forest lands and non arable land are variously degraded and impoverished The new working plans of Bundelkhand region, have detailed prescriptions of biological and mechanical measures for degraded forest lands area 7 Following table desribes major intervention in such areas.
SWC Practices Main focus of the Technological Intervention. Vegetative barriers To reduce the velocity of runoff water and conserve soil Drystone checkdams Same as above but constructed in drainagelines if stones are locally available Earthen bunds/ gully plugs Constructed where stones are not available in drainage lines to reduce reduce
runoff and soil loss and improve moisture regime Improvised pits Deeper and wider pits refilled with worked up soil, manure/amendment with ring
bund to store rainwater. Staggered contour trenches A standard technique to harvest rainwater in-situ for improving moisture regime. Live hedges Close sowing(by seed) of lacal hardy tree species on ridges made on lower side
of trenches to act as barriers to the flow of of water. Protection trenches These are made all around plantation block. The parallel bund made on the inner
side of plot out of excavated soil helps conserving soil and water within the plot. Water harvesting structures These include earthen bund supported checkdams, ponds, and box-inlet type
structures to store rainwater, improve moisture regime, recharge ground water.
6 Records of the Department of Agriculture, Govt. of Uttar Pradesh. 7 Working Plan of Banda, Jhansi, U.P. Forest Department

For Official Use Only Special Assistance for Project Formation (SAPROF) for
Uttar Pradesh Natural Resources Management and Poverty Alleviation Project (UPNRMPAP)
Final Report-Volume II Annex 2-A35
D. Reclamation of Waterlogged Lands
The water logged soils occupy 0.81 million ha area in UP8. These soils mostly occur in eastern parts below the confluence of Yamuna with the Ganga in the districts of Allahabad, Sultanpur, Pratapgarh, Jaunpur, Mirzapur, Varanasi, Ghazipur, Ballia and Azamgarh9. In these typical hydromorphic soils, the surface drainage is impeded and water table is high. The Irrigation and Drainage Department has undertaken some schemes to reclaim the area in isolated pockets. Only 10% of water logged area has been reclaimed10. The preventive measures are summaraized in the following table.
SWC Practices Main focus of the Technological Intervention. Surface drainage
When outlets are available, net work of field, link and main drains is designed to dispose water and lower water table.
Hydroponics Where outlets are not available, hydroponics is done in which crops like Singhara, Makhana,and jute are raised.
Vertical drainage through shallow tube walls Sub-surface drainage compled with fish farming Bio-drainage/ Ridge planting
In temporarily flooded areas, high water demanding tree species like Eucalyptus are promoted to pump water11. Under shallow water table conditions, high water demanding trees are raised on parallel ridges made by excavating earth from parallel trenches
E Sandy Flood Plains
Sandy flood plains occur all along major river systems and cover an area of 1.5 million ha in UP and soils remain submerge during rainy season12. The main districts having flood plains are Allahabad, Azamgarh, Bareilly, Chandausi, Fatehpur, Ghazipur, Gorakhpur, Kushinagar, Lakhimpur Kheri, Raebareli, Shahjahanpur and Varanasi13. The cultivated lands, habitation and infrastructure located near the river banks are protected by structures desribied in the following table.
SWC Practices Main focus of the Technological Intervention. Vegetative spurs Flow deflecting shrubs are planted along stream banks. Mechanical spurs/ Retaining wall
Construced at strategic locations to defect water
Retaining walls Constructed to protect infrastructure along river banks. Vegetative means Suitable plant species are promoted along waterways to protect the banks and
channelize the flow Temporary protection spurs/ retaining walls made by sand filled gunny bags
8 Records of the Department of Agriculture, Govt. of Uttar Pradesh 9 MORD (2005) Wastelands Atlas of India, Ministry of Rural Development, Department of Land
Resources, Govt of India, New Delhi. 10 Records of the Department of Agriculture, Govt. of Uttar Pradesh. 11 Singh A.V. and Singh G.N. 1993. Drainage impedence in Sharda Sahayak Command Area Project. (In)
Mehrotra, N.K. and Garg V.K. (Eds). Management of Productivity constrained U.P. Soils, Publication of Council of Science and Technology, U.P. Lucknow PP-70-76.
12 Records of the Department of Agriculture, Govt. of Uttar Pradesh 13 MORD (2005) Wastelands Atlas of India, Ministry of Rural Development, Department of Land
Resources, Govt of India, New Delhi.
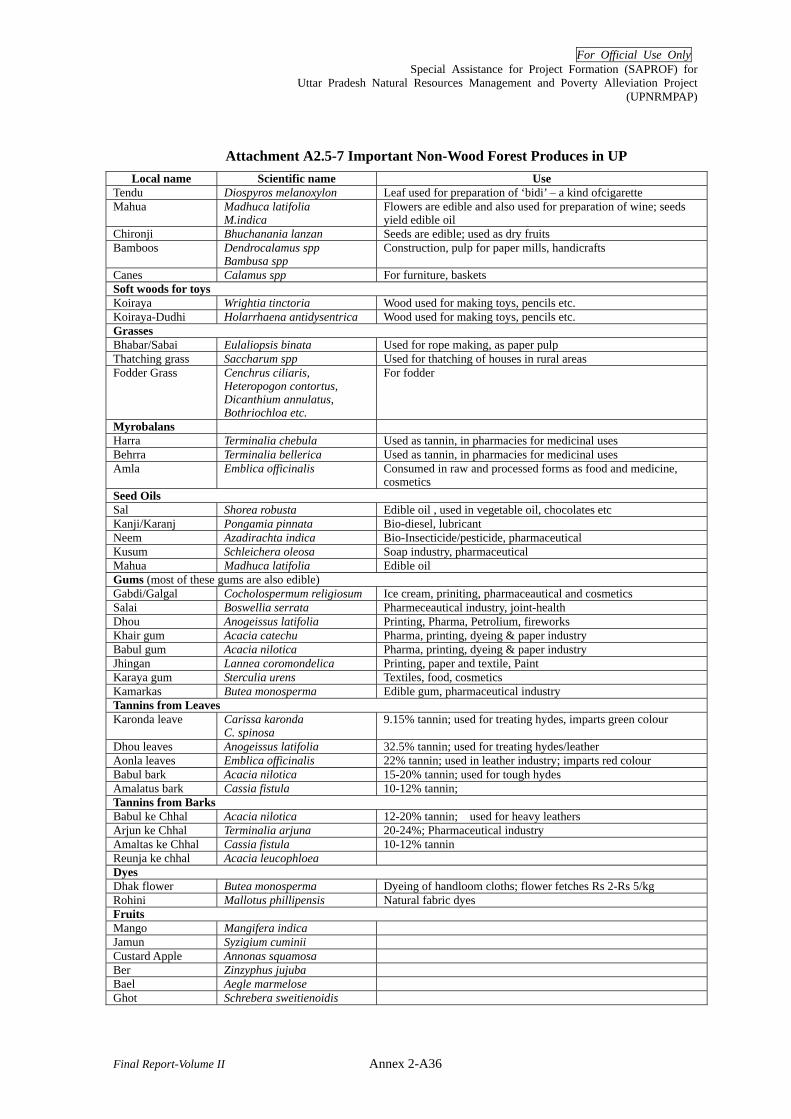
For Official Use Only Special Assistance for Project Formation (SAPROF) for
Uttar Pradesh Natural Resources Management and Poverty Alleviation Project (UPNRMPAP)
Final Report-Volume II Annex 2-A36
Attachment A2.5-7 Important Non-Wood Forest Produces in UP Local name Scientific name Use
Tendu Diospyros melanoxylon Leaf used for preparation of ‘bidi’ – a kind ofcigarette Mahua Madhuca latifolia
M.indica Flowers are edible and also used for preparation of wine; seeds yield edible oil
Chironji Bhuchanania lanzan Seeds are edible; used as dry fruits Bamboos Dendrocalamus spp
Bambusa spp Construction, pulp for paper mills, handicrafts
Canes Calamus spp For furniture, baskets Soft woods for toys Koiraya Wrightia tinctoria Wood used for making toys, pencils etc. Koiraya-Dudhi Holarrhaena antidysentrica Wood used for making toys, pencils etc. Grasses Bhabar/Sabai Eulaliopsis binata Used for rope making, as paper pulp Thatching grass Saccharum spp Used for thatching of houses in rural areas Fodder Grass Cenchrus ciliaris,
Heteropogon contortus, Dicanthium annulatus, Bothriochloa etc.
For fodder
Myrobalans Harra Terminalia chebula Used as tannin, in pharmacies for medicinal uses Behrra Terminalia bellerica Used as tannin, in pharmacies for medicinal uses Amla Emblica officinalis Consumed in raw and processed forms as food and medicine,
cosmetics Seed Oils Sal Shorea robusta Edible oil , used in vegetable oil, chocolates etc Kanji/Karanj Pongamia pinnata Bio-diesel, lubricant Neem Azadirachta indica Bio-Insecticide/pesticide, pharmaceutical Kusum Schleichera oleosa Soap industry, pharmaceutical Mahua Madhuca latifolia Edible oil Gums (most of these gums are also edible) Gabdi/Galgal Cocholospermum religiosum Ice cream, priniting, pharmaceautical and cosmetics Salai Boswellia serrata Pharmeceautical industry, joint-health Dhou Anogeissus latifolia Printing, Pharma, Petrolium, fireworks Khair gum Acacia catechu Pharma, printing, dyeing & paper industry Babul gum Acacia nilotica Pharma, printing, dyeing & paper industry Jhingan Lannea coromondelica Printing, paper and textile, Paint Karaya gum Sterculia urens Textiles, food, cosmetics Kamarkas Butea monosperma Edible gum, pharmaceutical industry Tannins from Leaves Karonda leave Carissa karonda
C. spinosa 9.15% tannin; used for treating hydes, imparts green colour
Dhou leaves Anogeissus latifolia 32.5% tannin; used for treating hydes/leather Aonla leaves Emblica officinalis 22% tannin; used in leather industry; imparts red colour Babul bark Acacia nilotica 15-20% tannin; used for tough hydes Amalatus bark Cassia fistula 10-12% tannin; Tannins from Barks Babul ke Chhal Acacia nilotica 12-20% tannin; used for heavy leathers Arjun ke Chhal Terminalia arjuna 20-24%; Pharmaceutical industry Amaltas ke Chhal Cassia fistula 10-12% tannin Reunja ke chhal Acacia leucophloea Dyes Dhak flower Butea monosperma Dyeing of handloom cloths; flower fetches Rs 2-Rs 5/kg Rohini Mallotus phillipensis Natural fabric dyes Fruits Mango Mangifera indica Jamun Syzigium cuminii Custard Apple Annonas squamosa Ber Zinzyphus jujuba Bael Aegle marmelose Ghot Schrebera sweitienoidis
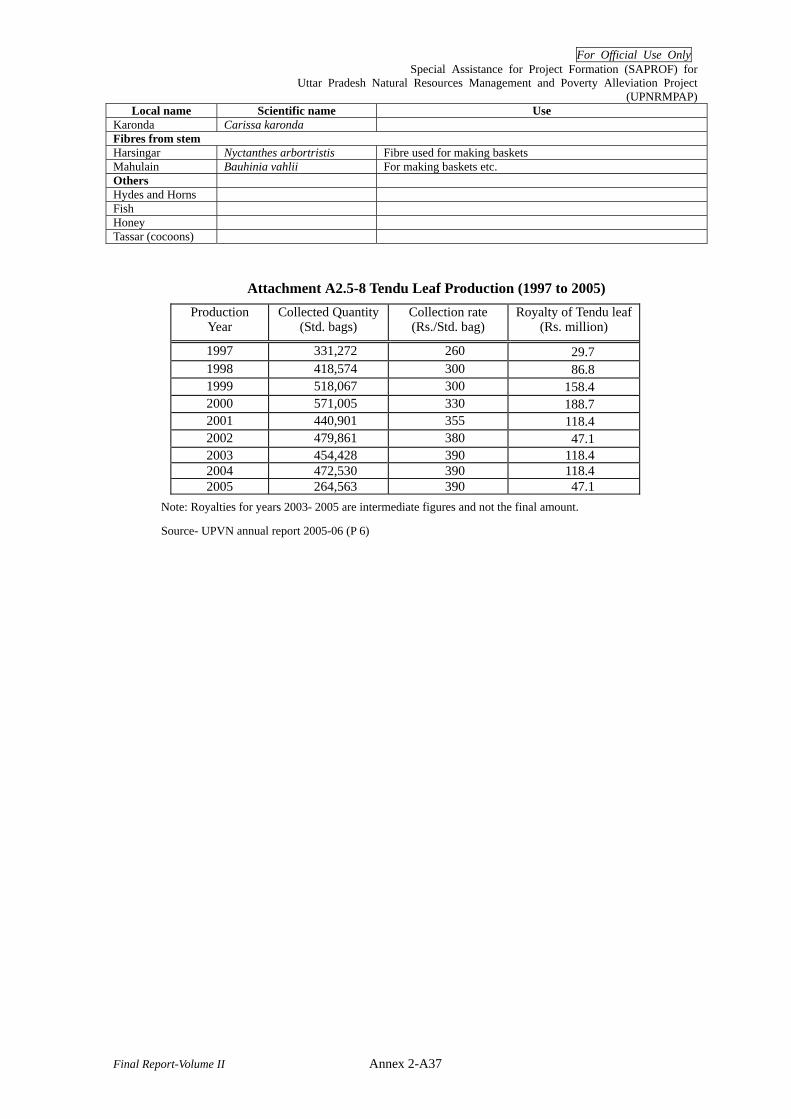
For Official Use Only Special Assistance for Project Formation (SAPROF) for
Uttar Pradesh Natural Resources Management and Poverty Alleviation Project (UPNRMPAP)
Final Report-Volume II Annex 2-A37
Local name Scientific name Use Karonda Carissa karonda Fibres from stem Harsingar Nyctanthes arbortristis Fibre used for making baskets Mahulain Bauhinia vahlii For making baskets etc. Others Hydes and Horns Fish Honey Tassar (cocoons)
Attachment A2.5-8 Tendu Leaf Production (1997 to 2005) Production
Year Collected Quantity
(Std. bags) Collection rate (Rs./Std. bag)
Royalty of Tendu leaf (Rs. million)
1997 331,272 260 29.7 1998 418,574 300 86.8 1999 518,067 300 158.4 2000 571,005 330 188.7 2001 440,901 355 118.4 2002 479,861 380 47.1 2003 454,428 390 118.4 2004 472,530 390 118.4 2005 264,563 390 47.1
Note: Royalties for years 2003- 2005 are intermediate figures and not the final amount.
Source- UPVN annual report 2005-06 (P 6)
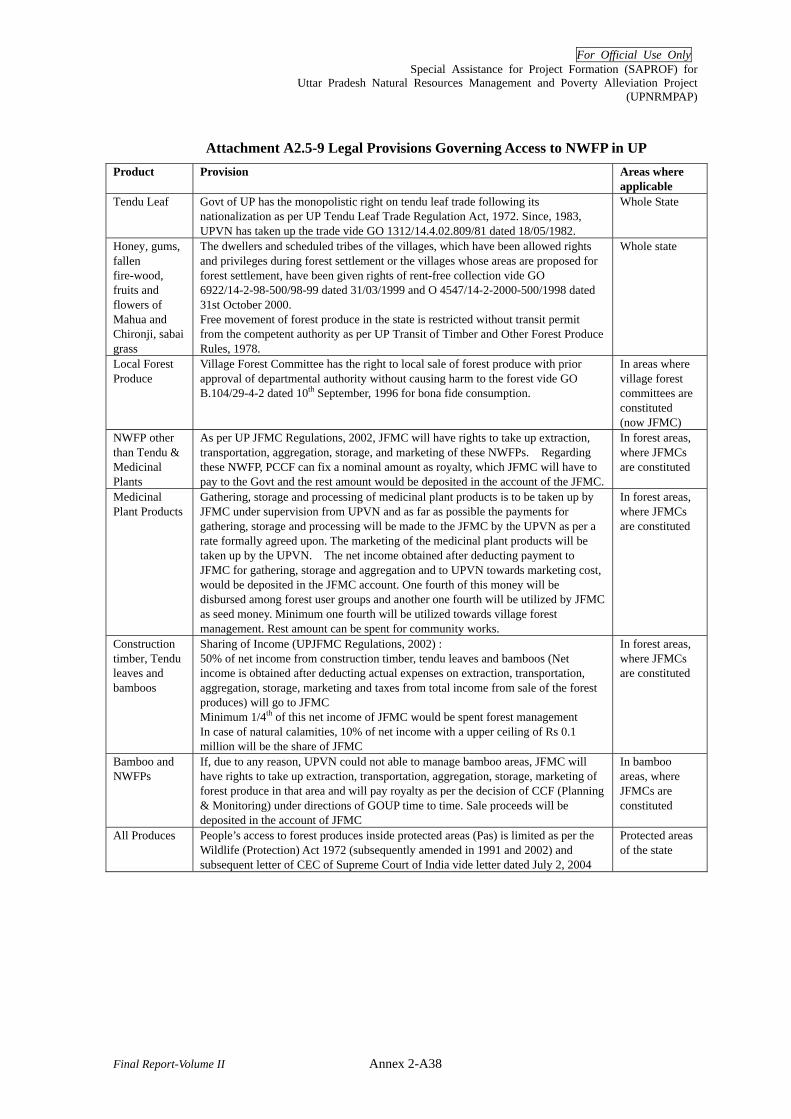
For Official Use Only Special Assistance for Project Formation (SAPROF) for
Uttar Pradesh Natural Resources Management and Poverty Alleviation Project (UPNRMPAP)
Final Report-Volume II Annex 2-A38
Attachment A2.5-9 Legal Provisions Governing Access to NWFP in UP Product Provision Areas where
applicable Tendu Leaf Govt of UP has the monopolistic right on tendu leaf trade following its
nationalization as per UP Tendu Leaf Trade Regulation Act, 1972. Since, 1983, UPVN has taken up the trade vide GO 1312/14.4.02.809/81 dated 18/05/1982.
Whole State
Honey, gums, fallen fire-wood, fruits and flowers of Mahua and Chironji, sabai grass
The dwellers and scheduled tribes of the villages, which have been allowed rights and privileges during forest settlement or the villages whose areas are proposed for forest settlement, have been given rights of rent-free collection vide GO 6922/14-2-98-500/98-99 dated 31/03/1999 and O 4547/14-2-2000-500/1998 dated 31st October 2000. Free movement of forest produce in the state is restricted without transit permit from the competent authority as per UP Transit of Timber and Other Forest Produce Rules, 1978.
Whole state
Local Forest Produce
Village Forest Committee has the right to local sale of forest produce with prior approval of departmental authority without causing harm to the forest vide GO B.104/29-4-2 dated 10th September, 1996 for bona fide consumption.
In areas where village forest committees are constituted (now JFMC)
NWFP other than Tendu & Medicinal Plants
As per UP JFMC Regulations, 2002, JFMC will have rights to take up extraction, transportation, aggregation, storage, and marketing of these NWFPs. Regarding these NWFP, PCCF can fix a nominal amount as royalty, which JFMC will have to pay to the Govt and the rest amount would be deposited in the account of the JFMC.
In forest areas, where JFMCs are constituted
Medicinal Plant Products
Gathering, storage and processing of medicinal plant products is to be taken up by JFMC under supervision from UPVN and as far as possible the payments for gathering, storage and processing will be made to the JFMC by the UPVN as per a rate formally agreed upon. The marketing of the medicinal plant products will be taken up by the UPVN. The net income obtained after deducting payment to JFMC for gathering, storage and aggregation and to UPVN towards marketing cost, would be deposited in the JFMC account. One fourth of this money will be disbursed among forest user groups and another one fourth will be utilized by JFMC as seed money. Minimum one fourth will be utilized towards village forest management. Rest amount can be spent for community works.
In forest areas, where JFMCs are constituted
Construction timber, Tendu leaves and bamboos
Sharing of Income (UPJFMC Regulations, 2002) : 50% of net income from construction timber, tendu leaves and bamboos (Net income is obtained after deducting actual expenses on extraction, transportation, aggregation, storage, marketing and taxes from total income from sale of the forest produces) will go to JFMC Minimum 1/4th of this net income of JFMC would be spent forest management In case of natural calamities, 10% of net income with a upper ceiling of Rs 0.1 million will be the share of JFMC
In forest areas, where JFMCs are constituted
Bamboo and NWFPs
If, due to any reason, UPVN could not able to manage bamboo areas, JFMC will have rights to take up extraction, transportation, aggregation, storage, marketing of forest produce in that area and will pay royalty as per the decision of CCF (Planning & Monitoring) under directions of GOUP time to time. Sale proceeds will be deposited in the account of JFMC
In bamboo areas, where JFMCs are constituted
All Produces People’s access to forest produces inside protected areas (Pas) is limited as per the Wildlife (Protection) Act 1972 (subsequently amended in 1991 and 2002) and subsequent letter of CEC of Supreme Court of India vide letter dated July 2, 2004
Protected areas of the state
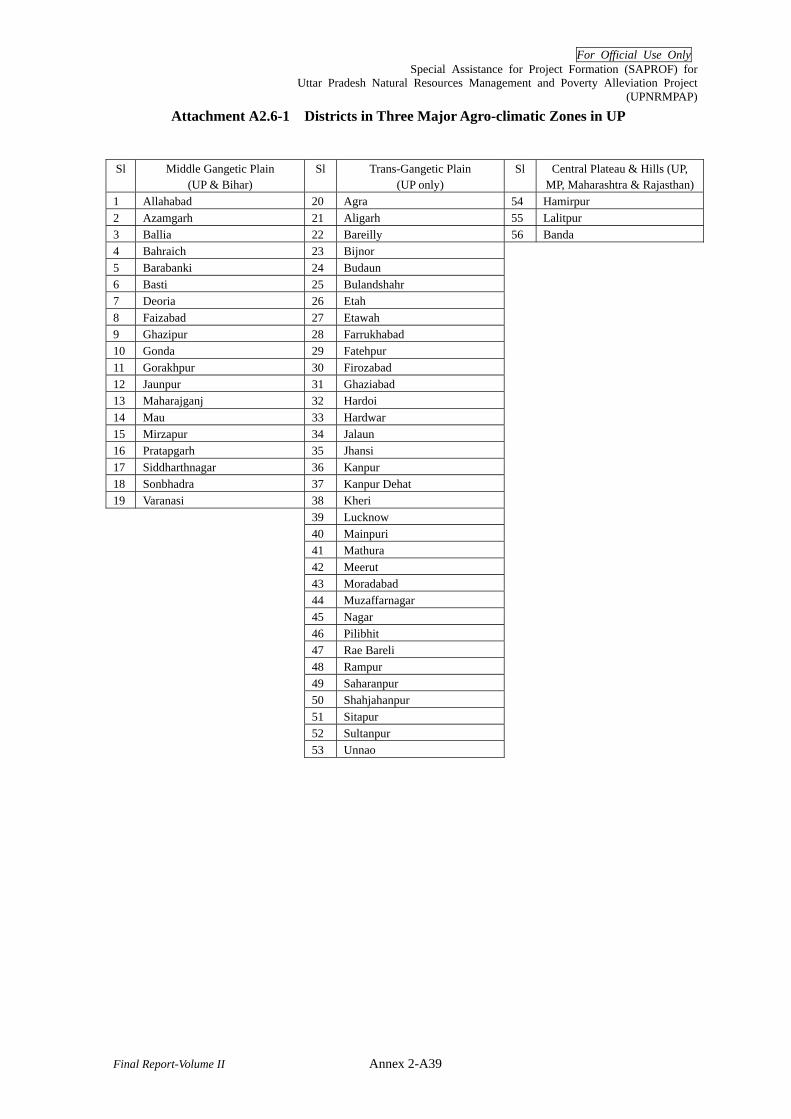
For Official Use Only Special Assistance for Project Formation (SAPROF) for
Uttar Pradesh Natural Resources Management and Poverty Alleviation Project (UPNRMPAP)
Final Report-Volume II Annex 2-A39
Attachment A2.6-1 Districts in Three Major Agro-climatic Zones in UP
Sl Middle Gangetic Plain (UP & Bihar)
Sl Trans-Gangetic Plain (UP only)
Sl Central Plateau & Hills (UP, MP, Maharashtra & Rajasthan)
1 Allahabad 20 Agra 54 Hamirpur 2 Azamgarh 21 Aligarh 55 Lalitpur 3 Ballia 22 Bareilly 56 Banda 4 Bahraich 23 Bijnor 5 Barabanki 24 Budaun 6 Basti 25 Bulandshahr 7 Deoria 26 Etah 8 Faizabad 27 Etawah 9 Ghazipur 28 Farrukhabad 10 Gonda 29 Fatehpur 11 Gorakhpur 30 Firozabad 12 Jaunpur 31 Ghaziabad 13 Maharajganj 32 Hardoi 14 Mau 33 Hardwar 15 Mirzapur 34 Jalaun 16 Pratapgarh 35 Jhansi 17 Siddharthnagar 36 Kanpur 18 Sonbhadra 37 Kanpur Dehat 19 Varanasi 38 Kheri 39 Lucknow 40 Mainpuri 41 Mathura 42 Meerut 43 Moradabad 44 Muzaffarnagar 45 Nagar 46 Pilibhit 47 Rae Bareli 48 Rampur 49 Saharanpur 50 Shahjahanpur 51 Sitapur 52 Sultanpur 53 Unnao

For Official Use Only Special Assistance for Project Formation (SAPROF) for
Uttar Pradesh Natural Resources Management and Poverty Alleviation Project (UPNRMPAP)
Final Report-Volume II Annex 2-A40
Attachment A2.6-2 A Case of Forest Dependents – Chitrakoot Forest Division in UP
(1) Population and forest resources in Chitrakoot Forest Division
15.56% of the total geographical area of the district has forest cover (FSI, 2002). The recorded forest area in the district is 75,194.6 ha, of which 26,323.3 ha forms part of the Ranipur Wildlife Sanctuary and 48,871.8 ha is under Chitrakoot Forest Division (Territorial). The district has a population of 766,255; thus, the average per capita forest in the district is 0.98 ha.
(2) Forest-based livelihoods of rural communities in Chitrakoot
Animal husbandry
Animal husbandry is the primary occupation of rural communities in this tract, along with rainfed agriculture. Traditionally, the communities in the Bundelkhand region have possessed large livestock holdings, primarily for meeting their requirements of fuelwood and farm yard manure (from cow dung). The area has low rainfall and there is acute fodder scarcity, particularly during the summer months. To tide over this problem, the practice of free grazing is common for 4-5 months in a year, from the month of March till July/August when the rains begin and the agriculture land is ready for fresh sowing. During this period, cattle graze freely both in (on agriculture lands) and outside the village (forest lands).
Forestry operations
Employment in forestry operations, including felling and harvesting of forest produce, form another important livelihood. The details of these works and their estimated magnitude are provided in table below.
Employment opportunities in forestry operations in Chitrakoot Forest Division Nature of activity/
work Estimated volume of work Remarks
Felling of dead, dry and dying trees
Insignificant As per the Working Plan
Bamboo felling (3-year felling cycle)
7,000 to 8,000 ha worked annually Rs. 1,000-1,500 earnings per household per annum
Works carried out by the UPFC
Kauraiya felling (Dudhi14 tree)
Insignificant
(Rs 1,000-1,500 earnings per household per annum – when operations were on)
Tendu leaf collection 60-65 notional bags15 p.a. (avg one person month employment per household in April-May)
Collections have reduced in villages/ areas surrounding the Ranipur Sanctuary because of restrictions imposed by
14 Dudhi – Holoharenna antidysentrica 15 One notional bag contains 1,000 bundles of 50 leaves each
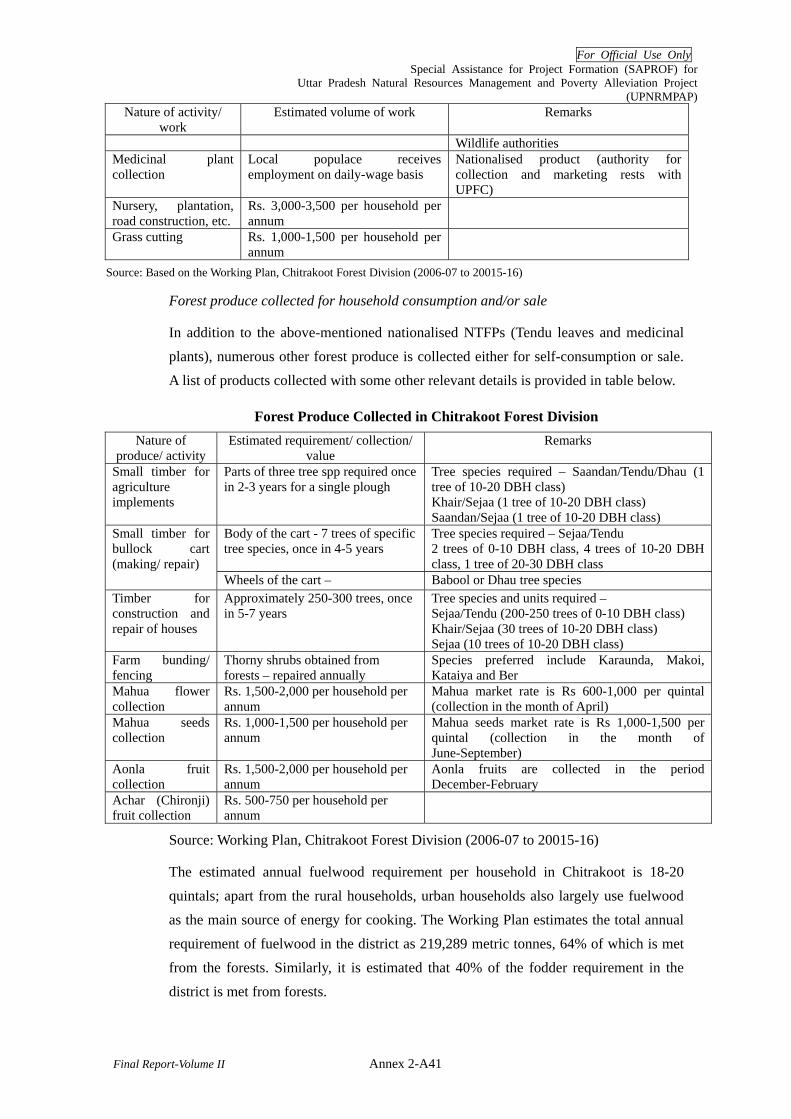
For Official Use Only Special Assistance for Project Formation (SAPROF) for
Uttar Pradesh Natural Resources Management and Poverty Alleviation Project (UPNRMPAP)
Final Report-Volume II Annex 2-A41
Nature of activity/ work
Estimated volume of work Remarks
Wildlife authorities Medicinal plant collection
Local populace receives employment on daily-wage basis
Nationalised product (authority for collection and marketing rests with UPFC)
Nursery, plantation, road construction, etc.
Rs. 3,000-3,500 per household per annum
Grass cutting Rs. 1,000-1,500 per household per annum
Source: Based on the Working Plan, Chitrakoot Forest Division (2006-07 to 20015-16)
Forest produce collected for household consumption and/or sale
In addition to the above-mentioned nationalised NTFPs (Tendu leaves and medicinal plants), numerous other forest produce is collected either for self-consumption or sale. A list of products collected with some other relevant details is provided in table below.
Forest Produce Collected in Chitrakoot Forest Division Nature of
produce/ activity Estimated requirement/ collection/
value Remarks
Small timber for agriculture implements
Parts of three tree spp required once in 2-3 years for a single plough
Tree species required – Saandan/Tendu/Dhau (1 tree of 10-20 DBH class) Khair/Sejaa (1 tree of 10-20 DBH class) Saandan/Sejaa (1 tree of 10-20 DBH class)
Body of the cart - 7 trees of specific tree species, once in 4-5 years
Tree species required – Sejaa/Tendu 2 trees of 0-10 DBH class, 4 trees of 10-20 DBH class, 1 tree of 20-30 DBH class
Small timber for bullock cart (making/ repair)
Wheels of the cart – Babool or Dhau tree species Timber for construction and repair of houses
Approximately 250-300 trees, once in 5-7 years
Tree species and units required – Sejaa/Tendu (200-250 trees of 0-10 DBH class) Khair/Sejaa (30 trees of 10-20 DBH class) Sejaa (10 trees of 10-20 DBH class)
Farm bunding/ fencing
Thorny shrubs obtained from forests – repaired annually
Species preferred include Karaunda, Makoi, Kataiya and Ber
Mahua flower collection
Rs. 1,500-2,000 per household per annum
Mahua market rate is Rs 600-1,000 per quintal (collection in the month of April)
Mahua seeds collection
Rs. 1,000-1,500 per household per annum
Mahua seeds market rate is Rs 1,000-1,500 per quintal (collection in the month of June-September)
Aonla fruit collection
Rs. 1,500-2,000 per household per annum
Aonla fruits are collected in the period December-February
Achar (Chironji) fruit collection
Rs. 500-750 per household per annum
Source: Working Plan, Chitrakoot Forest Division (2006-07 to 20015-16)
The estimated annual fuelwood requirement per household in Chitrakoot is 18-20 quintals; apart from the rural households, urban households also largely use fuelwood as the main source of energy for cooking. The Working Plan estimates the total annual requirement of fuelwood in the district as 219,289 metric tonnes, 64% of which is met from the forests. Similarly, it is estimated that 40% of the fodder requirement in the district is met from forests.
For Official Use Only Special Assistance for Project Formation (SAPROF) for
Uttar Pradesh Natural Resources Management and Poverty Alleviation Project (UPNRMPAP)
Final Report-Volume II Annex 2-A42
Attachment A2.7-1 Definition of Village Forest in India
Village Forests
Village Forests as defined under Section 28 of Indian Forest Act, 1927
[including Amendments made in the State of Uttar Pradesh vide Uttar Pradesh Act 21 of 1960, sec. 3 (w.e.f. 2-11-1960).]
28. Formation of village forests – (1) The State Government may assign to any village community the rights of Government to or over any land which has been constituted a reserved forest or declared a protected forest or is a forest belonging to the government, and may cancel such assignment. All forests so assigned shall be called village forests, and, subject to the rules made under the sub-section (2), all the provision of this Act relating to reserved forests, protected forests belonging to the Government, shall as the case may be apply to them.
(2) The State Government may make rules for regulating the management of village forests, prescribing the conditions under which the community to which any such assignment is made may be provided with timber or other forest-produce or pasture, and their duties for the protection and improvement of such forest.

For Official Use Only Special Assistance for Project Formation (SAPROF) for
Uttar Pradesh Natural Resources Management and Poverty Alleviation Project (UPNRMPAP)
Final Report-Volume II Annex 2-A43
Attachment A2.7-2 Division-wise number of JFMCs supported under NAP in UP
S. No.
Name of FDA No. of JFMCs
Area Planted (ha)
Employment generated ('000 md)
S. No.
Name of FDA No. of JFMCs
Area Planted (ha)
Employment generated ('000 md)
1 Agra 43 1,500 210 31 Kanpur Dehat 29 600 482 Aligarh 21 320 54 32 Kanpur Nagar 21 417 293 Allahabad 32 1,200 91 33 Kashi 35 624 774 Ambedkarnagar 27 581 66 34 Katarniaghat 50 887 1635 Awadh 39 2,046 163 35 Lalitpur 30 2,200 2336 Azamgarh 48 1,200 444 36 Mahoba 18 1,100 1427 Badaun 11 835 132 37 Mainpuri 10 500 198 Bahraich 50 600 65 38 Mathura 41 490 279 Ballia 113 1,100 144 39 Mau 27 303 45
10 Banda 14 680 85 40 Meerut 11 1,031 15311 Barabanki 36 1,365 240 41 Mirzapur 31 1,279 18212 Bareilly 24 365 22 42 Muzaffarnagar 12 330 1613 Basti 125 1,930 318 43 Najibabad 25 700 8614 Bulandshahar 28 978 45 44 North Kheri 35 1,950 23915 Chitrakoot 26 900 150 45 Obra 22 800 9216 Deoria 55 232 11 46 Orai 20 1,100 20617 Etah 38 725 141 47 Pilibhit 33 680 8518 Etawah 51 1,000 63 48 Pratapgarh 13 180 1919 Faizabad 27 1,495 143 49 Raibareilly 43 1,366 18120 Farrukhabad 24 410 72 50 Renukoot 27 1,500 25321 Fatehpur 10 741 137 51 Shahjahanpur 38 2,100 30622 Firozabad 80 2,000 556 52 Shrawasti 28 1,500 29423 Gaziabad 10 800 46 53 Sidharthnagar 25 925 10524 Gazipur 30 517 61 54 Sitapur 62 1,450 34925 Gonda 31 1,540 266 55 Sohagibarwa 37 275 3126 Gorakhpur 20 730 114 56 South Kheri 54 1,570 34727 Hamirpur 11 910 246 57 Unnao 31 1,600 23328 Hardoi 30 1,500 294 58 Varanasi 23 274 1829 Jhansi 26 2,000 382 Total 1,942 58,631 8,77830 Kaimoor 31 700 39
Source: Quarterly Progress report of NAP, Qtr. III (ending December, 2006), UPFD.

For Official Use Only Special Assistance for Project Formation (SAPROF) for
Uttar Pradesh Natural Resources Management and Poverty Alleviation Project (UPNRMPAP)
Final Report-Volume II Annex 2-A44
Attachment A2.8-1 Proforma of agreement between Gram Panchayat and UPFD for Establishing Village Woodlots over Panchayat Lands
Formal Agreement received under Govt. Order Number 8476/14-1-606/80 dated 13 February 1981, Forest Section-1 This agreement has been signed today on ----------date-----------month-------accordingly saka---------------- between Gram sabha -------District---------that has been established under UP Panchayati Raj Act 1947 (has been called as GAON SABHA further) one party and Governor of the State of Uttar Pradesh ( has been called as GOVERNOR further ) second party. As Government of Uttar Pradesh (has been called SARKAR here further) has prepared Uttar Pradesh Social Forestry for the unfertile or unutilized land for developing multi utility Planted Forest with the help of Govt. of India and World Bank to make fuel, fodder, construction/timber wood and raw material for cottage industry available and provide employment opportunities with active participation of the villages showing interest in planted forest and their conservation and as land fully described in its schedule is under GAON SABHA is available for the Planted Forest and GAON SABHA is willing to have implementation of above said Social Forestry Programme on said land and GAON SABHA is willing to extend its full support in implementation of this programme. So, parties of this are getting agreed and contracting- 1. Possession of land – GAON SABHA will hand over the possession of land described in enclosed schedule with in 30 days of signing of this agreement to the Director Social Forestry ( has been called as Director here further)without any encroachment or burden.
2. Village Forest Society- GAON SABHA will form a Village Forest Committee (has been called as Society here further) through its commitment. Society will comprise of the following to support Director in programme implementation-
Gaon Pradhan - Sitting President Up Gaon (Deputy) Pradhan - Deputy President Forest Expansion worker – Member Gram Sevak (servent)- Member Secretary Panchayat- Member Patwari /Lekhpal ( Registrar of village’s land document) - Member
Nominated villagers of GAON SABHA having keen interest in Plantation programme whose number will not be more than ------ including at least one female and one ST member, two members of land management committee, Secretary of the society will be sitting forest guard or Forest Expansion worker.
Society has to be formed with in 45 days of signing of this document and information of that has to be send to the Director.
For Official Use Only Special Assistance for Project Formation (SAPROF) for
Uttar Pradesh Natural Resources Management and Poverty Alleviation Project (UPNRMPAP)
Final Report-Volume II Annex 2-A45
3. Financial and Implementation Planning – 1) Director will develop a Financial and programme Implementation plan for the area to be
taken under planted forest in consultation with society with in 60 days of receiving the possession of land.
2) As much as possible this plan should be parallel with the 10 ideal plans recommended by International Development Association and apart from that should also have the following –
a. Details of the mixed species to be used in Plantation b. Details related with implementation, required time and estimated labour days c. Estimated free of cost labour provided as fund by Gaon sabha d. Method through which produce will be disburse between Govt. and Gaon Sabha e. Special Rights provided to the members of Gaon sabha f. Estimated repetitive and one time expenditure ( periodic and non periodic) of plan g. Method to recover expenditure by selling of produce
3) After getting recommendation of Gaon Sabha on plan Director will arrange all the material,
technical support and paid labour and according to the planning of Gram Panchayat arrangements will be made for voluntary labour for plantation and it’s security on the land of Gaon sabha as described in the part 4.
4) Planning of Labour- Forest Plantation will be labour oriented and will be managed as
described here- Voluntary Labour
i) Voluntary labour by any member of Gaon Sabha for community benefit will be welcome. Gaon Sabha has to send his members for such kind of support.
ii a.) Gaon sabha has to estimate possible labour days as stated in para (i ) and will inform it to the Director and Society
ii.b.) Paid labour – Rest of the labour requirement will be fulfilled by daily wages based labour. Only local labours will be engaged for the purpose in consultation with Gaon sabha. Poorest of the village would be given preference and paid as per the Govt. rules.
In view of difficulties of hiring labours at the time of first rains most of the jobs ( up to 70%)will be done at the times when no much Agri-work goes on.
5. Type of Plantation- Planted forest will be of multi utility but preference would be given to fuel and fodder arrangements. A mix of 70% fuel and fodder and 30% commercial species will be planted. To generate immense Nutritive Fodder through project activities Forest Grazing Management System will be adopted and grasses and small grazing plants will be planted in the spaces left between the Plants. 6. Training of the Villagers i) Director will establish Project Communication Units at small sectional level to
make villagers aware of harms of deforestation and benefits of plantation. ii) Project Communication Units will be making field visits to the following areas and
making arrangements for the Social Forestry Training to both males and females-
For Official Use Only Special Assistance for Project Formation (SAPROF) for
Uttar Pradesh Natural Resources Management and Poverty Alleviation Project (UPNRMPAP)
Final Report-Volume II Annex 2-A46
• In the areas have been successfully transformed into productive planted forests and when possible to the villages engaged in the activities of Social forestry.
• In the villages utilizing fuel wood stoves • To the cottage industries based on Social forestry
iii) Where ever required transportation cost would be borne and Lunch would be arranged by Project Communication Units.
7. Facilities to the Villagers 1. Members of the GAON SABHA will be permitted to- A. Free of Cost –
1. Collecting Mahua Flowers 2. Collecting dried and defoliated branches 3. Taking fodder and grass
B. Produce available at culling or final removal of a tree like fuel wood, timber etc would be provided to the landless marginalized farmer at the price not more than 25% of the market price and if remaining rest will be sold to the other members of the GAON SABHA for their home consumption purposes according to the selling prices/procedures established by the committee. But the Director has authority to suspend any of above said specific rights described in para A and B in view of integrated development of planted forest or to make any produce available continuously (2) Collection and Monitoring of fodder and fuel is proposed to be done by the society, Social development Forest Guard or any nominated officer of the Social Forestry Directorate. When demand of fuel and fodder increases than asset then Society has to generate passes for Antyodaya families (Most marginalized) on the basis of priority.
(3) Even after being under above clause (2) all of the villagers will have equal right for the supply of fuel wood either it may free or on nominal payments, this would be calculated in head loads per family in decided numbers. (4) Sale/Auction of the all other Fruits/Flowers/Seeds and produce and timber wood of commercial species would be done as regular tradition or as per planning under above clause (3) lease may be accepted for Fruits or commercial trees.
8. Accounts Statement 1. Apart from voluntary labour or any cash share by GAON SABHA, plantation and security expenditure of planted forest are to be borne primarily by Director till it is not taken over by the GAON SABHA. This amount would be debited to the Social forestry account of the GAON SABHA open in the books of Director( this has been called as GAON SABHA account further) and would be considered as interest free advance to the GAON SABHA
For Official Use Only Special Assistance for Project Formation (SAPROF) for
Uttar Pradesh Natural Resources Management and Poverty Alleviation Project (UPNRMPAP)
Final Report-Volume II Annex 2-A47
2. Disbursement of the sale proceeds gained under the clause 4 of para 7 between Director and GAON SABHA will be based on financial planning as per para 3. Share of GAON SABHA would be credited to the GAON SABHA Account in order to recovery of advance. 3. Proceeds under 7 (1) B will go the Gaon Sabha and would not be utilized for recovery of advance. 4. (A) Director will present Income –Expenditure statement of the planted forest to the GAON SABHA with in 30 days of end of the Financial Year. If GAON SABHA is not making any written objection on any item of the statement with in 90 days of receiving, it will be taken as final and GAON SABHA will be bonded to obey that. (B) Director has to re-think the objections raised under above said 4 (A) and if no any consensus develop Collector’s decision will be followed by both Director and GAON SABHA. 9. Handing Over to the GAON SABHA (A) Director has to take care of management and security the planted forest for the 5 years since the date of first plantation, after that if GAON SABHA is making a written request to transfer the management and security the planted forest to it then it would be transferred to GAON SABHA on the recommendation of Collector and possession of the land would be transferred to GAON SABHA. (B) Director has to transfer the possession with in 30 days of recommendation of collector. 10. Recovery of accruing on land All the investments made towards the planted forest and debited to the gaon sanha according to the GAON SABHA Account described above has to be recovered by the income generated through the sale of planted forest produce by the Government with in 30 years of starting of developing Planted Forest. If all the investment is not recovered through the sale of produce of planted forest then Government may expect only payment of wages and material cost from GAON SABHA Fund. Firstly this payment has to be done from the produce of commercial Trees and then timber. 11. All timber, Trees, Forest produce and grass will be the property of Gaon Sabha even under being in recovery by the Government according to the above para 10 but till the security is under the control of Director GAON SABHA will not be allowed to cutting, culling or trading of trees in planted forest except for the descriptions in para 3 12. GAON SABHA will have a separate account for Social Forestry in its fund. Gaon sabha will credit all its income through forest produce or leasing the forest in this account. This amount would be invested only on Village Development projects as per the sub para ahead 13. Recommendation of Village Development project- (1) GAON SABHA will develop Village Development project for the utilization of Social forestry Account Fund and will send it with the commitment to the director to forward to the collector.

For Official Use Only Special Assistance for Project Formation (SAPROF) for
Uttar Pradesh Natural Resources Management and Poverty Alleviation Project (UPNRMPAP)
Final Report-Volume II Annex 2-A48
(2) Director is supposed to send this Village Development project along with his recommendation to the collector with in ……days of receiving and collector has to approve this poject finally by keeping Directors recommendations in mind Inspection Right of Social Forestry Directorate / In forcing Indian Forest Act 14. Directorate of Social Forestry has rights to enter the forest for inspecting and observing that contract is being implemented the properly. 15.GAON SABHA is agreed on that if Govt. finds a need to in force any clause under Indian Forest Act in favour of implementing planted Forest scheme on the said land then GRAM SABHA will not object it but that has not be against the fundamental specialties of this contract, in this regard directors decision will be the last. 16. Arbitrator – through this contract both the parties have also agreed that if any debate, dispute or question related with this contract get raised by any person or the party any time it has to bring for the single arbitration of the collector and his decision has to be followed up by both the parties. Arbitrator may increase the time limit of giving and printing the decisions on taking the consensus of both the parties (2) Stamp duty will be borne by the Govt. on this document. 17. GAON SABHA has recommended clause and conditions of this contract by its commitment dated --------- and authorised GAON PRADHAN to sign this document. Mr. --------Pradhan -------for GAON SABH ________________ and on behalf of GAON SABHA and Mr. ------------ for the Governor and on behalf of him has signed this document on above said date and year. Directed Schedule under this Signed in the presence of Following for the Governor on behalf of him 1---------------------- 2---------------------------------------------- Signed in the presence of Following for the GAON SABHA District and on behalf of that 1--------------------------- 2-----------------------------------------

For Official Use Only Special Assistance for Project Formation (SAPROF) for
Uttar Pradesh Natural Resources Management and Poverty Alleviation Project (UPNRMPAP)
Final Report-Volume II Annex 2-A49
Attachment A2.8-2 Restrictions of Tree Felling in UP
List of 13 tree species that are completely restricted from felling in UP16:
Sl Species Sl Species 1 Juglans regia (Akhrot) 8 Shorea robusta (Sal) 2 Fraxinus micrantha (Angoo) 9 Ficus religiosa (Pipal) 3 Carpinus viminea (Chamkharik) 10 Ficus bengalensis (Bargad) 4 Prunus cornuta (Jamnoi) 11 Cedrus deodara (Deodar) 5 Azadirachta indica (Neem) 12 Mangifera indica (Aam) 6 Quercus spp. (Oak) 13 Pterucarpus marsupium (Bija sal) 7 Madhuca latifolia (Mahua)
List of 46 districts where all species of trees growing on private cultivated or uncultivated lands have been exempted from all provisions of the UP Tree Protection Act, 1976 other than 16 specified ones (out of which 10 occur naturally in UP17):
Sl District Sl District
1 Muzaffarnagar 24 Kaushambhi 2 Meerut 25 Varanasi 3 Ghaziabad 26 Jaunpur 4 Bulundshahar 27 Ghazipur 5 Gautambudh Nagar 28 Sant Ravidas Nagar 6 Baghpat 29 Azamgarh 7 Mathura 30 Mau 8 Aligarh 31 Baliya 9 Firozabad 32 Deoria 10 Mainpuri 33 Kushinagar (expect Khadda sub-division) 11 Eta 34 Basti 12 Hathras 35 Siddharthnagar (except Naugarh Sub-division) 13 Bareilly 36 Sant Kabir Nagar 14 Badaun 37 Lucknow 15 Moradabad 38 Unnao 16 Rampur (except Pipali Sub-division) 39 Raibareilly 17 Kanpur Nagar 40 Sitapur 18 Kanpur Dehat 41 Hardoi 19 Farrukhabad 42 Faizabad 20 Kannauj 43 Sultanpur 21 Orai 44 Barabanki 22 Fatehpur 45 Ambedkarnagar 23 Pratapgarh 46 Banda
16 (unless the tree is dead or decaying or it constitutes dangers to person or property or its felling is necessary for
executing a development work approved by the government and permission has been obtained) in UP (until December 31 2000). GO No. 2759/XIV-PBV-2000-7-93 dated 30-12-2000)
17 Azadiracta Indica, Madhuca latifolia, Shorea robusta, Ficus religiosa, Ficus bengalensis, Mangifera spp., Pterocarpus marsupium, Acacia catechu, Dalbergia sissoo and Tectona grandis.
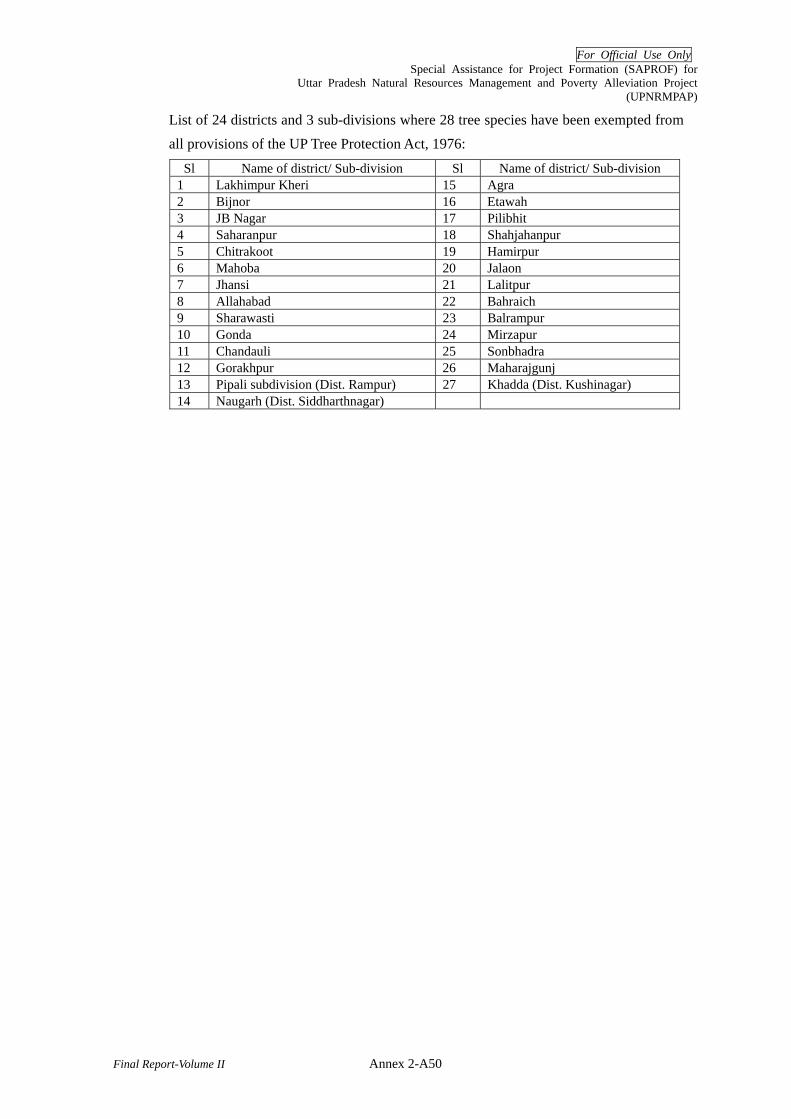
For Official Use Only Special Assistance for Project Formation (SAPROF) for
Uttar Pradesh Natural Resources Management and Poverty Alleviation Project (UPNRMPAP)
Final Report-Volume II Annex 2-A50
List of 24 districts and 3 sub-divisions where 28 tree species have been exempted from all provisions of the UP Tree Protection Act, 1976:
Sl Name of district/ Sub-division Sl Name of district/ Sub-division 1 Lakhimpur Kheri 15 Agra 2 Bijnor 16 Etawah 3 JB Nagar 17 Pilibhit 4 Saharanpur 18 Shahjahanpur 5 Chitrakoot 19 Hamirpur 6 Mahoba 20 Jalaon 7 Jhansi 21 Lalitpur 8 Allahabad 22 Bahraich 9 Sharawasti 23 Balrampur 10 Gonda 24 Mirzapur 11 Chandauli 25 Sonbhadra 12 Gorakhpur 26 Maharajgunj 13 Pipali subdivision (Dist. Rampur) 27 Khadda (Dist. Kushinagar) 14 Naugarh (Dist. Siddharthnagar)
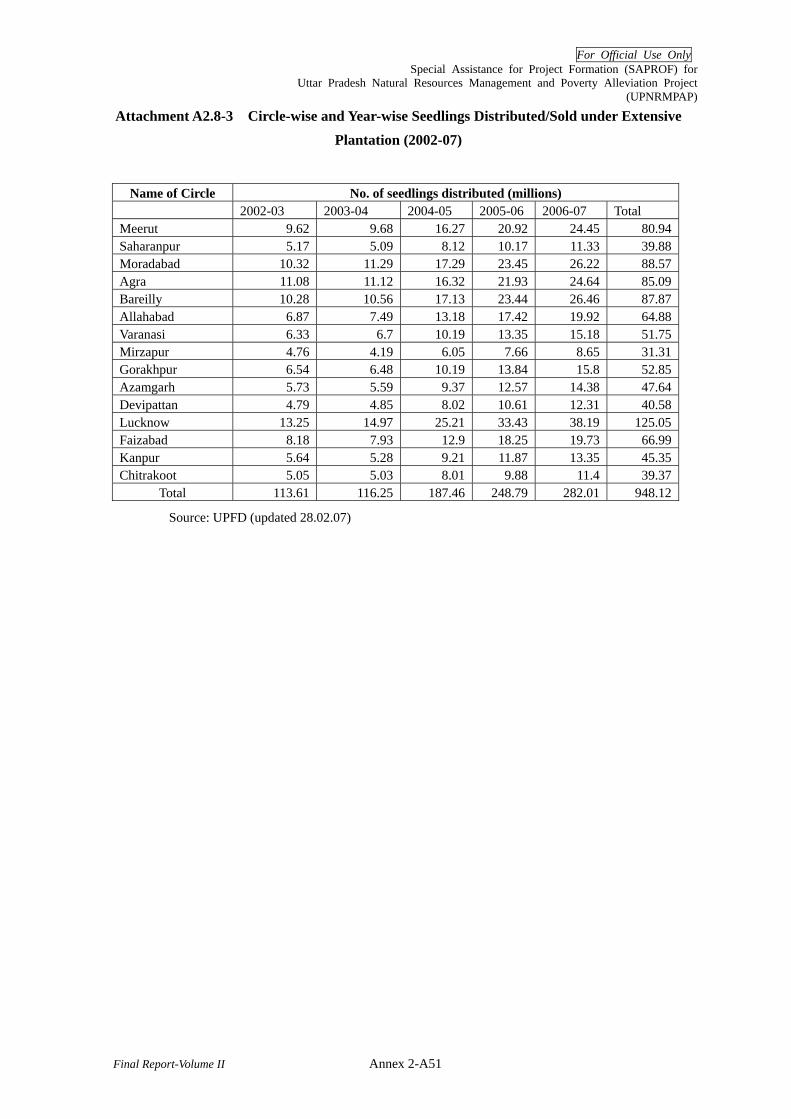
For Official Use Only Special Assistance for Project Formation (SAPROF) for
Uttar Pradesh Natural Resources Management and Poverty Alleviation Project (UPNRMPAP)
Final Report-Volume II Annex 2-A51
Attachment A2.8-3 Circle-wise and Year-wise Seedlings Distributed/Sold under Extensive Plantation (2002-07)
Name of Circle No. of seedlings distributed (millions) 2002-03 2003-04 2004-05 2005-06 2006-07 Total Meerut 9.62 9.68 16.27 20.92 24.45 80.94Saharanpur 5.17 5.09 8.12 10.17 11.33 39.88Moradabad 10.32 11.29 17.29 23.45 26.22 88.57Agra 11.08 11.12 16.32 21.93 24.64 85.09Bareilly 10.28 10.56 17.13 23.44 26.46 87.87Allahabad 6.87 7.49 13.18 17.42 19.92 64.88Varanasi 6.33 6.7 10.19 13.35 15.18 51.75Mirzapur 4.76 4.19 6.05 7.66 8.65 31.31Gorakhpur 6.54 6.48 10.19 13.84 15.8 52.85Azamgarh 5.73 5.59 9.37 12.57 14.38 47.64Devipattan 4.79 4.85 8.02 10.61 12.31 40.58Lucknow 13.25 14.97 25.21 33.43 38.19 125.05Faizabad 8.18 7.93 12.9 18.25 19.73 66.99Kanpur 5.64 5.28 9.21 11.87 13.35 45.35Chitrakoot 5.05 5.03 8.01 9.88 11.4 39.37
Total 113.61 116.25 187.46 248.79 282.01 948.12
Source: UPFD (updated 28.02.07)
For Official Use Only Special Assistance for Project Formation (SAPROF) for
Uttar Pradesh Natural Resource Management and Poverty Alleviation Project (UPNRMPAP)
Final Report- Volume II
Special Assistance for Project Formation
for Uttar Pradesh Natural Resource Management and Poverty Alleviation Project
(UPNRMPAP)
Final Report
Volume II: ANNEXES
ANNEX-3 WORLD BANK FORESTRY RELATED
PROJECTS
For Official Use Only Special Assistance for Project Formation (SAPROF) for
Uttar Pradesh Natural Resources Management and Poverty Alleviation Project (UPNRMPAP)
Final Report-Volume II i
Special Assistance for Project Formation (SAPROF)
for
Uttar Pradesh Natural Resource Management and Poverty Alleviation Project (UPNRMPAP)
Final Report
Volume II: Annexes
ANNEX 3 WORLD BANK FORESTRY RELATED PROJECTS
Table of Contents 1. Introduction ................................................................................................................ Annex 3 -1 2. World Bank Social Forestry Projects ......................................................................... Annex 3 -1
2.1 Objective ......................................................................................................... Annex 3 -1 2.2 Component ...................................................................................................... Annex 3 -2 2.3 Achievements.................................................................................................. Annex 3 -2 2.4 Lessons and Findings ...................................................................................... Annex 3 -3
3. UP Forestry Project .................................................................................................... Annex 3 -6 3.1 Objectives........................................................................................................ Annex 3 -6 3.2 Components..................................................................................................... Annex 3 -7 3.3 Achievements.................................................................................................. Annex 3 -7 3.4 Findings and Lessons .....................................................................................Annex 3 -11
Attachments Attachment A3 3-1 Organisation Chart of UP Forest Department ..........................................Annex 3 -A1

For Official Use Only Special Assistance for Project Formation (SAPROF) for
Uttar Pradesh Natural Resources Management and Poverty Alleviation Project (UPNRMPAP)
Final Report - Volume II Annex 3-1
ANNEX 3 WORLD BANK FORESTRY RELATED PROJECTS1
1. Introduction
There were three Word Bank funded forestry related projects implemented in UP. They are UP Social Forestry Project Phase I (1979/80 -1984/85), UP Social Forestry Project Phase II (1985/6 -1992/93), and UP Forestry Project (1997/98 -2002/03). Brief descriptions of each project as well as findings and lessons derived from implementation of the projects are summarised in below.
2 World Bank Social Forestry Projects
2.1 Objective
Objectives of social forestry projects are summarised as follows:
(1) Social Forestry Project Phase I (1979/80 -1984/85)
- To provide paid employment to the poorest sectors of the villages for planting under the social forestry projects which would be primarily used by the villagers and also development of cottage industries
- To carry out plantations on the public and village lands (under various models) to demonstrate the benefits of afforestation as well as undertake plantation on private lands
- To ensure participation of local population in planning and execution of social forestry plantations
- To build organisation required to support long-term social forestry programme through on-the-job training of forestry personnel on community development
(2) Social Forestry Project Phase II (1985/6 -1992/93)
- To increase production of fuelwood, small timber, poles and fodder - To increase rural employment, farmers’ income and opportunities for participation of
landless persons - To afforest degraded areas and wastelands and reduce soil erosion - To strengthen forestry institutions
1 Review based on available project related documents prepared by UPFD or the World Bank.

For Official Use Only Special Assistance for Project Formation (SAPROF) for
Uttar Pradesh Natural Resources Management and Poverty Alleviation Project (UPNRMPAP)
Final Report - Volume II Annex 3-2
2.2 Component
Social forestry projects had following major components, respectively:
(1) Social Forestry Project Phase I (1979/80 -1984/85)
- Farm Forestry - Nurseries - Extension - Self-help village woodlots - Supervised community woodlots - Rehabilitated Degraded Forests and Wastelands - Strip Plantations - Pilot Tassar Production
(2) Social Forestry Project Phase II (1985/6 -1992/93)
- Farm forestry - Tree tenure: block and strip plantations: on lease basis with right of ownership over
planted trees with the poor and landless persons - Community Woodlots - Strip plantations: sharing of benefits to the nearby villages was added - RDF (Rehabilitation of Degraded Forest: with conditions of benefit-sharing with
communities, developing of management plans, develop low cost models) - Extension - Research
2.3 Achievements
Major achievements of two social forestry projects are described in the following tables.
(1) Social Forestry Project Phase I (1979/80 -1984/85)
Major Achievement of UP Social Forestry Project Phase I Phase I Component Units
Target Achievement Farm Forestry ha 8 101 Nurseries no 140 1,166
unit 5 3 Units Extension (Communication Units) 160,00 SMF* trained
Self Help Village Woodlots2 ha 3,080 1,576 Supervised Woodlots ha 5,000 10,689 Rehabilitation of Degraded Forests ha 13,600 23,437 Strip Plantation ha 27,000 40,733
2 The components on ‘Self Help Village Woodlots’ and the ‘Supervised woodlots’ were combined as ‘Community Woodlots’ in the second phase

For Official Use Only Special Assistance for Project Formation (SAPROF) for
Uttar Pradesh Natural Resources Management and Poverty Alleviation Project (UPNRMPAP)
Final Report - Volume II Annex 3-3
Phase I Component UnitsTarget Achievement
Pilot Tassar Plantation ha - 109 Efficient Wood Burning Stoves no 1,000 - Research Multi-Functional Unit to be
established Used traditional research units
Training no - 502 FEWs** - 2 training schools -250,00 villagers to be trained every year
- FEWs established - 2 training schools
*small marginal farmer, ** Field Extension Workers
(2) Social Forestry Project Phase II (1985/6 -1992/93)
Major Achievement of UP Social Forestry Project Phase II Phase II Component Units
Target Achievements Farm Forestry ha 218,050 236,700 Nurseries no School/kissan nurseries in 800
Blocks Network of nurseries (1 nursery to 10 villages)
Community Woodlands ha 18,900 27,294.31 Rehabilitation of Degraded Forests ha 35,700 44,521.93 Strip Plantation ha 9,800 24,413.60 Tree Tenure ha - 1,100 ha in unirrigated blocks
- 1,210 ha of Strip plantations - 1,000 ha of Arjun Plantations
- 1,320 ha achieved (as target was lowered to 1,500 ha)
Training no Strengthening of training schools
2.4 Lessons and Findings
Major lessons and findings derived from the two social forestry projects are summarised as follows:
Components and Descriptions 1 Farm Forestry (a) Findings/ Issues - Good agricultural land was converted into tree plantations
- Lack of assessment and suggestion on adequate techniques for plantation and its maintenance (that can be attributed to low survival rates)
- Inequitable distribution of seedlings (70% to large and medium farmers and only 30% to small and marginal farmers)
- Inconsistency between WB projects and other national / state level programmes on costing of seedlings. Various other national and state level programmes had different costs (including free of charge)
- The desired project beneficiaries were farmers including small and marginal farmers. However, the actual beneficiaries of the project were large farmers having adequate availability of land, resources, influence, access to information and some irrigation facilities
(b) Lessons - Selection criteria for target beneficiaries as well as the design of the component need to be
revised and give emphasis on small and marginal farmers. - Number of free seedlings should be accompanied by certain arrangements to ensure sustainable
care (especially those distributed to small and marginal farmers) - Need for co-ordination with other programmes
2 Nurseries (a) Findings/ Issues - Poor quality of seedlings owing to poor nursery techniques
- FD issued guidelines for quality control of the seedlings. However, this remained on the papers

For Official Use Only Special Assistance for Project Formation (SAPROF) for
Uttar Pradesh Natural Resources Management and Poverty Alleviation Project (UPNRMPAP)
Final Report - Volume II Annex 3-4
Components and Descriptions and not put into practice.
- Conflicts with other programmes on costing of seedlings. - Funds from other rural development schemes were utilized to expand the nurseries
(b) Lessons - It became evident that nurseries can be a focal point for demonstration and extension activities
- Efforts should be made towards introducing low-cost decentralized nurseries that are managed by the communities
- Realistic pricing of the seedlings based on prevailing market prices or the actual cost for production
- Technical and management inputs should be regularly provided by UPFD for the sustainable management of nurseries
3 Extension (a) Findings/ Issues - Lack of capacities and time of the UPFD staffs for extension activities
- Difficulties in identification and selection of capable NGOs to facilitate the extension activities - Extension efforts were lagging compared to the distributed seedlings - Selection of farmers was more favoured to large farmers who were literate, easily accessible and
had large tracts of land for plantations (b) Lessons - Need careful selection of organisations that could facilitate extension programmes
- Need further inter-linkages with extension activities of other agencies and departments - Need to identify community structures and design extension programmes based on site and
community-specific experiences. 4 Self Help Village Woodlots (Phase I) (a) Findings/ Issues - Voluntary labour was not preferred by landless and poor households, thus they were not much
involved in this component - Less incentive and motivation among participants due to long gestation period before the
benefits are realized - There were uncertainty in benefit-sharing beyond the expiry of MoU - Conflict and competition on usage of community land (encroachment, conflicts of land use
owing to influential individuals in the village and other common needs (such as grazing)) - Lack of clarity and awareness on the process of agreement as well as the agreement itself
between the FD and the communities (mostly done between the Gram Pradhan and the FD personnel without prior consultation or consensus of the general village communities)
- Lack of awareness as regards distribution of usufructs at local levels. Ambiguity in the government’s orders on distribution of produce3
(b) Lessons - Sustainability of benefits realization and access to the resources by poor and landless
households should be ensured - Site-specific selection of species based on local needs and assessment of land - Need to include short-term and intermittent benefits
5 Supervised Woodlots (Phase I) (a) Findings/ Issues - Conflicting roles and responsibilities of FD staff involved in social forestry and territorial
divisions - Majority of benefits (70%) was taken by FD - Handing over of management responsibility of woodlots to the communities, had not yet taken
place owing to lack of readiness on the part of communities (b) Lessons - Need further awareness/ development on MoUs and benefit-sharing arrangements
- Proper guidelines need to be developed by UPFD 6 Community Woodlands (Phase II) (a) Findings/ Issues - Transfer of woodlots (3yrs old) was hastily done without assessing the readiness of the VFCs
(hence the local forester was instructed to look after the transferred plantation)
3 The UP-VFJM,2002 provides the guidelines on share of usufruct

For Official Use Only Special Assistance for Project Formation (SAPROF) for
Uttar Pradesh Natural Resources Management and Poverty Alleviation Project (UPNRMPAP)
Final Report - Volume II Annex 3-5
Components and Descriptions - The woodlots were small and had low productivity hence they were unable to provide enough
benefits and incentives to villagers - Emphasis was given for commercial species having market demands - Introduced management by micro-plans - Lack of technical inputs especially for the plantation of fodder species
(b) Lessons - Need capacity building of VFCs for woodland management before transferring the woodlots
- Minimum area needed to provide benefits to communities should be assessed - Species selection should be based on common needs of the village - In case the area available for a community woodlot is insufficient, a sub-group of poor and
landless households should be identified and handed over the management of the woodlot - The low cost models need to be explored
7 Rehabilitation of Degraded Forests or Wastelands (a) Findings/ Issues - Survival rates were good at sites with good quality soil. However, the usar lands taken under
this component had poor survival - Limited land availability and competition with other usages - Lack of legal arrangements for usufruct sharing - Plantation of fuel-wood and fodder species on the degraded forests did not have much success
owing to unclear plans for distribution of benefits among the communities (b) Lessons - Need to clarify and define usufruct sharing
- Need to develop local management plans based on proper analysis of the land and community needs
- Need to develop site specific community-based plans 8 Strip Plantation (a) Findings/ Issues - Low economic returns to the villagers
- Scattered and limited resources - Less awareness and emphasis on benefit-sharing arrangements
(b) Lessons - Selection of species should be based on site quality and the needs of the communities
- Plans should include harvesting and benefit sharing mechanism 9 Pilot Tassar Plantation (to support and encourage Cottage industry) (a) Findings/ Issues - Mostly done on degraded land
- Besides tassar no other attempts had been made to encourage cottage industries (local small scale activities)
(b) Lessons - Plantations should be in accordance with site condition, capabilities of stakeholders and the
market demand - Value-addition of products should be considered based on productivity and available markets for
concerned forest products. 10 Tree Tenure (Phase II ) (a) Findings/ Issues - Low participation of poor and landless
- High investment was required - Issues of encroachment by powerful lobbies in the village were observed - Conflict with other land uses - Lack of clarity on economic returns
(b) Lessons - Species selection should be based on the specific needs of the beneficiary
- The usufruct rights should be clearly defined in the community meetings. The village community should also design control mechanisms in case of any conflicting uses like encroachments
- Proper assessment of the land should be done prior to deciding of beneficiaries and activities(to reduce the associated risks)
11 Efficient Wood Burning Stoves (a) Findings/ Issues

For Official Use Only Special Assistance for Project Formation (SAPROF) for
Uttar Pradesh Natural Resources Management and Poverty Alleviation Project (UPNRMPAP)
Final Report - Volume II Annex 3-6
Components and Descriptions - Poor acceptability by poor families
- More successful in the eastern region where female took the decision (b) Lessons - Pre-assessments of demand for the stoves and cooking situation are essential 12 Research (a) Findings/ Issues - The primary focus was extension and trainings and thus research was not emphasised.
- Traditional research wing could not appreciate the research needs of social forestry and hence inputs were insufficient
(b) Lessons - Proper identification of research needs and identification of research agencies (including
subcontracting) - More input required on management techniques for tree growing as per different objectives (i.e.
fodder, fuelwood etc.) as well as tree improvements, contour plantation and soil and water conservation
13 Training (a) Findings/ Issues - Lack of training capacities and facilities within UPFD to meet the training needs (b) Lessons - Need for comprehensive training needs assessment and providing adequate capacities and
facilities to meet the training needs
3. UP Forestry Project
3.1 Objectives
Main Objective of the project was to assist GOUP for implementation of its strategy for development of the forestry sector that aimed to achieve the following three development objectives:
- To improve public sector management of the sector - To increase forest cover and productivity - To conserve biodiversity in an environmentally and socially sustainable manner.
Followings are approaches adopted to achieve the development objectives: Development
Objectives Approach
Improvement of Public Sector Management
(a) Introduction of necessary changes to ensure that policies, management processes and the structure and resources of the Forestry Departments were appropriate to its role as the nodal public sector agency in the forestry sector;
(b) Development of human resources for the planning, implementation and monitoring of the strategy; and
(c) Development of information systems to assist with all aspects of the planning and management of the forest resource.
Increase of Forest Cover and Productivity
(a) Development of participatory processes for management and use of forest resources, taking special account of the interests of disadvantaged groups;
(b) Development and adoption of improved technologies for management of forest resources; and
(c) Privatization of the production of forest products through improving incentives for forest management and the cultivation of trees on non-forest land and the provision of technical and management advice.
Conservation of Biodiversity
(a) Improved strategic planning; (b) Improved management of Protected Areas (PAs), and (c) Ecodevelopment programmes to involve communities in PA management.

For Official Use Only Special Assistance for Project Formation (SAPROF) for
Uttar Pradesh Natural Resources Management and Poverty Alleviation Project (UPNRMPAP)
Final Report - Volume II Annex 3-7
After bifurcation of the state into Uttar Pradesh and Uttarakhand, and based on the result of the mid term review in 2000, project’s development objectives were re-phrased as follows:
- To assist Uttar Pradesh in developing and testing new processes, systems and skills to improve sector management of the Forest Department
- To increase forest cover and productivity, - To improve bio-diversity conservation, and - To sustain and improve the livelihood of rural poor through sustainable forest
management
3.2 Components
To achieve the project objectives, the project consist of following four major components: 1 Institutional Development 2 Forest Development 3 Research and Technology 4 Biodiversity Conservation
Each component is further divided into sub-components indicated below. Components Subcomponents
Institutional Development - Sector management, - Human Resource Development, - Forest Management Information System (FMIS) - Project Unit.
Forest Development - JFM - Assisted Natural Regeneration (ANR) - Industrial Plantation - Forest Protection - Strip Plantation - Urban Forestry - Farm Forestry
Research and Technology - Research projects for improvement of reproductive technologies and NTFPs
- Planting material improvement programme - Development of seed handling facilities and research nurseries - Provision of equipment and training
Biodiversity conservation - Long-term strategic planning for forest biodiversity conservation - Improved Protected Area Management - Village level ecodevelopment through EDC - Associated programmes for research, monitoring of indicators of
biodiversity conservation, pilot habitat restoration and public awareness
3.3 Achievements
Major achievements of UP forestry projects are described in the following table.
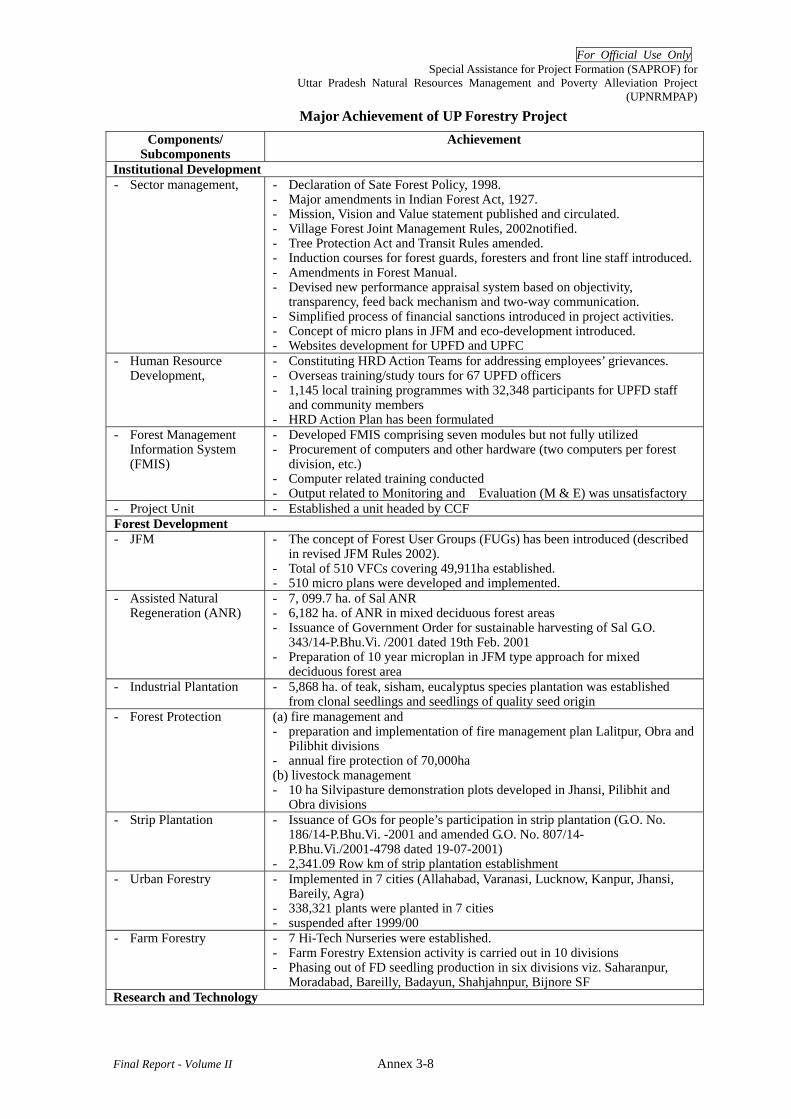
For Official Use Only Special Assistance for Project Formation (SAPROF) for
Uttar Pradesh Natural Resources Management and Poverty Alleviation Project (UPNRMPAP)
Final Report - Volume II Annex 3-8
Major Achievement of UP Forestry Project Components/
Subcomponents Achievement
Institutional Development - Sector management, - Declaration of Sate Forest Policy, 1998.
- Major amendments in Indian Forest Act, 1927. - Mission, Vision and Value statement published and circulated. - Village Forest Joint Management Rules, 2002notified. - Tree Protection Act and Transit Rules amended. - Induction courses for forest guards, foresters and front line staff introduced.- Amendments in Forest Manual. - Devised new performance appraisal system based on objectivity,
transparency, feed back mechanism and two-way communication. - Simplified process of financial sanctions introduced in project activities. - Concept of micro plans in JFM and eco-development introduced. - Websites development for UPFD and UPFC
- Human Resource Development,
- Constituting HRD Action Teams for addressing employees’ grievances. - Overseas training/study tours for 67 UPFD officers - 1,145 local training programmes with 32,348 participants for UPFD staff
and community members - HRD Action Plan has been formulated
- Forest Management Information System (FMIS)
- Developed FMIS comprising seven modules but not fully utilized - Procurement of computers and other hardware (two computers per forest
division, etc.) - Computer related training conducted - Output related to Monitoring and Evaluation (M & E) was unsatisfactory
- Project Unit - Established a unit headed by CCF Forest Development - JFM - The concept of Forest User Groups (FUGs) has been introduced (described
in revised JFM Rules 2002). - Total of 510 VFCs covering 49,911ha established. - 510 micro plans were developed and implemented.
- Assisted Natural Regeneration (ANR)
- 7, 099.7 ha. of Sal ANR - 6,182 ha. of ANR in mixed deciduous forest areas - Issuance of Government Order for sustainable harvesting of Sal G.O.
343/14-P.Bhu.Vi. /2001 dated 19th Feb. 2001 - Preparation of 10 year microplan in JFM type approach for mixed
deciduous forest area - Industrial Plantation - 5,868 ha. of teak, sisham, eucalyptus species plantation was established
from clonal seedlings and seedlings of quality seed origin - Forest Protection (a) fire management and
- preparation and implementation of fire management plan Lalitpur, Obra and Pilibhit divisions
- annual fire protection of 70,000ha (b) livestock management - 10 ha Silvipasture demonstration plots developed in Jhansi, Pilibhit and
Obra divisions - Strip Plantation - Issuance of GOs for people’s participation in strip plantation (G.O. No.
186/14-P.Bhu.Vi. -2001 and amended G.O. No. 807/14- P.Bhu.Vi./2001-4798 dated 19-07-2001)
- 2,341.09 Row km of strip plantation establishment - Urban Forestry - Implemented in 7 cities (Allahabad, Varanasi, Lucknow, Kanpur, Jhansi,
Bareily, Agra) - 338,321 plants were planted in 7 cities - suspended after 1999/00
- Farm Forestry - 7 Hi-Tech Nurseries were established. - Farm Forestry Extension activity is carried out in 10 divisions - Phasing out of FD seedling production in six divisions viz. Saharanpur,
Moradabad, Bareilly, Badayun, Shahjahnpur, Bijnore SF Research and Technology

For Official Use Only Special Assistance for Project Formation (SAPROF) for
Uttar Pradesh Natural Resources Management and Poverty Alleviation Project (UPNRMPAP)
Final Report - Volume II Annex 3-9
Components/ Subcomponents
Achievement
- Research projects for improvement of reproductive technologies and NTFPs
- 10 study areas identified and research work completed. - Under lab to land programme 4 bulletins and 13 leaf lets published.
- Planting material improvement programme
- Clonal plants of popular, eucalyptus, teak and etc. were raised. - Procedure for seed certification developed.
- Development of seed handling facilities and research nurseries
- Nurseries for NTFP established in Jhansi and Kanpur. Training is provided at these centres.
- Quality improvement in planting material (Clonal Seedlings, Improved Seed, Seed Production areas)
- Provision of equipment and training
- Lab equipment, office equipment, library equipment were procured by the research wing.
Biodiversity conservation - Long-term strategic
planning for forest biodiversity conservation
- Formulation of comprehensive biodiversity conservation strategy and action plan for UP.
- Formulation of 4 biodiversity landscape conservation management plans.
- Improved Protected Area Management
- Formulation of 24 pa management plans. - Building of infrastructure communication network and consolidation of pa
boundaries. -
- Village level eco-development through EDC
- Implementation of eco-development programmes in 196 PA fringe communities as EDC, and generation of revolving fund for sustainability of the programme.
- Associated Programmes
- Comprehensive research on 11 vital issues in biodiversity and wildlife management and protection
- Public awareness campaigns in biodiversity through development of eight nature interpretation centres.
- Multi level training and competence building for UPFD staff as well as other stakeholders in biodiversity conservation.
Under the UP Forestry Project, plantation establishment and planting were conducted in extensive area of the state. Following table lists forest divisions targeted for plantation establishment and planting activities.
Division with Plantation/Planting Conducted during UP Forestry Project Component Circle Division
Awadh North Kheri, South Kheri, Awadh, Sitapur, Unnao, Hardoi Saryu Gonda, Bahraich, Faizabad, Sravasti Kanpur Kanpur, Etawah, Farukhabad, Bundelkhand Jhansi, Banda, Orai, Lalitpur, Hamirpur, Mahoba, Chitrakoot Varanasi Varansi, Gazipur, Jaunpur, Vindya Mirzapur, Rainukoot, Obra, Sonbhadra Allahabad Allahabad, Fatehpur, Gorakhpur Gorakhpur, Basti, Padrauna Azamgarh Azamagarh, Mau, Ballia Agra Mainpuri, Aligarh, Agra, Etah, Firozabad, Mhamaynagar Meerut Muzzafar Nagar, Meerut, Gaziabad, Bulandshar, Shevalik Bareilly Bareilly, Badhau, Pilibhit,
JFM
Moradabad Bijnore, Nazibabad Awadh South Kheri, ANR Sal Saryu Bahraich, Sravasti
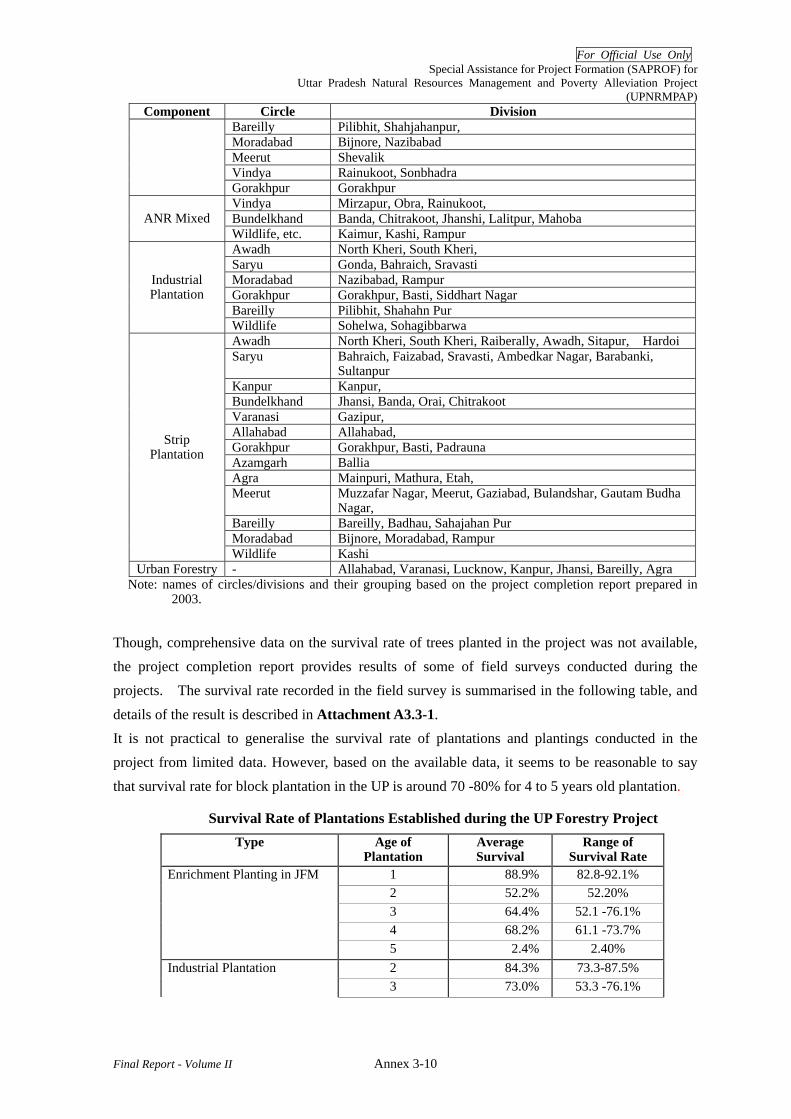
For Official Use Only Special Assistance for Project Formation (SAPROF) for
Uttar Pradesh Natural Resources Management and Poverty Alleviation Project (UPNRMPAP)
Final Report - Volume II Annex 3-10
Component Circle Division Bareilly Pilibhit, Shahjahanpur, Moradabad Bijnore, Nazibabad Meerut Shevalik Vindya Rainukoot, Sonbhadra
Gorakhpur Gorakhpur Vindya Mirzapur, Obra, Rainukoot, Bundelkhand Banda, Chitrakoot, Jhanshi, Lalitpur, Mahoba ANR Mixed Wildlife, etc. Kaimur, Kashi, Rampur Awadh North Kheri, South Kheri, Saryu Gonda, Bahraich, Sravasti Moradabad Nazibabad, Rampur Gorakhpur Gorakhpur, Basti, Siddhart Nagar Bareilly Pilibhit, Shahahn Pur
Industrial Plantation
Wildlife Sohelwa, Sohagibbarwa Awadh North Kheri, South Kheri, Raiberally, Awadh, Sitapur, Hardoi Saryu Bahraich, Faizabad, Sravasti, Ambedkar Nagar, Barabanki,
Sultanpur Kanpur Kanpur, Bundelkhand Jhansi, Banda, Orai, Chitrakoot Varanasi Gazipur, Allahabad Allahabad, Gorakhpur Gorakhpur, Basti, Padrauna Azamgarh Ballia Agra Mainpuri, Mathura, Etah, Meerut Muzzafar Nagar, Meerut, Gaziabad, Bulandshar, Gautam Budha
Nagar, Bareilly Bareilly, Badhau, Sahajahan Pur Moradabad Bijnore, Moradabad, Rampur
Strip Plantation
Wildlife Kashi Urban Forestry - Allahabad, Varanasi, Lucknow, Kanpur, Jhansi, Bareilly, Agra
Note: names of circles/divisions and their grouping based on the project completion report prepared in 2003.
Though, comprehensive data on the survival rate of trees planted in the project was not available, the project completion report provides results of some of field surveys conducted during the projects. The survival rate recorded in the field survey is summarised in the following table, and
details of the result is described in Attachment A3.3-1. It is not practical to generalise the survival rate of plantations and plantings conducted in the project from limited data. However, based on the available data, it seems to be reasonable to say that survival rate for block plantation in the UP is around 70 -80% for 4 to 5 years old plantation.
Survival Rate of Plantations Established during the UP Forestry Project Type Age of
Plantation Average Survival
Range of Survival Rate
1 88.9% 82.8-92.1% 2 52.2% 52.20% 3 64.4% 52.1 -76.1% 4 68.2% 61.1 -73.7%
Enrichment Planting in JFM
5 2.4% 2.40% 2 84.3% 73.3-87.5% Industrial Plantation 3 73.0% 53.3 -76.1%
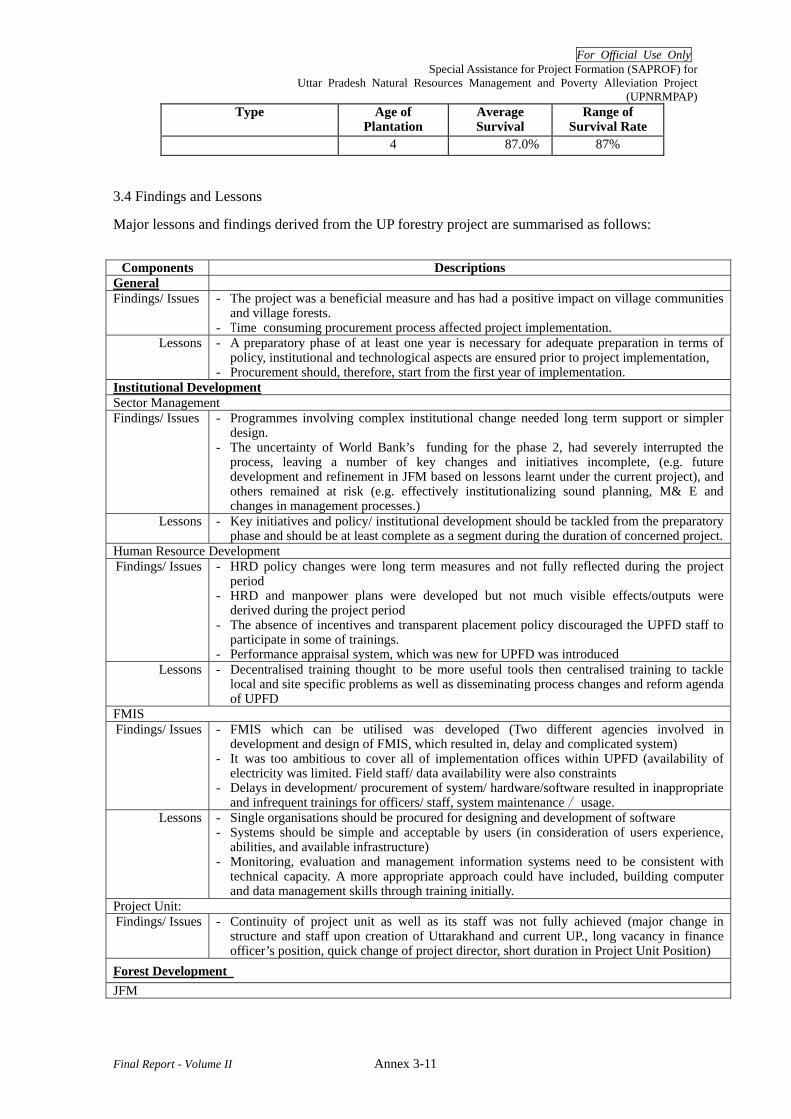
For Official Use Only Special Assistance for Project Formation (SAPROF) for
Uttar Pradesh Natural Resources Management and Poverty Alleviation Project (UPNRMPAP)
Final Report - Volume II Annex 3-11
Type Age of Plantation
Average Survival
Range of Survival Rate
4 87.0% 87%
3.4 Findings and Lessons
Major lessons and findings derived from the UP forestry project are summarised as follows:
Components Descriptions General Findings/ Issues - The project was a beneficial measure and has had a positive impact on village communities
and village forests. - Time consuming procurement process affected project implementation.
Lessons - A preparatory phase of at least one year is necessary for adequate preparation in terms of policy, institutional and technological aspects are ensured prior to project implementation,
- Procurement should, therefore, start from the first year of implementation. Institutional Development Sector Management Findings/ Issues - Programmes involving complex institutional change needed long term support or simpler
design. - The uncertainty of World Bank’s funding for the phase 2, had severely interrupted the
process, leaving a number of key changes and initiatives incomplete, (e.g. future development and refinement in JFM based on lessons learnt under the current project), and others remained at risk (e.g. effectively institutionalizing sound planning, M& E and changes in management processes.)
Lessons - Key initiatives and policy/ institutional development should be tackled from the preparatory phase and should be at least complete as a segment during the duration of concerned project.
Human Resource Development Findings/ Issues - HRD policy changes were long term measures and not fully reflected during the project
period - HRD and manpower plans were developed but not much visible effects/outputs were
derived during the project period - The absence of incentives and transparent placement policy discouraged the UPFD staff to
participate in some of trainings. - Performance appraisal system, which was new for UPFD was introduced
Lessons - Decentralised training thought to be more useful tools then centralised training to tackle local and site specific problems as well as disseminating process changes and reform agenda of UPFD
FMIS Findings/ Issues - FMIS which can be utilised was developed (Two different agencies involved in
development and design of FMIS, which resulted in, delay and complicated system) - It was too ambitious to cover all of implementation offices within UPFD (availability of
electricity was limited. Field staff/ data availability were also constraints - Delays in development/ procurement of system/ hardware/software resulted in inappropriate
and infrequent trainings for officers/ staff, system maintenance / usage. Lessons - Single organisations should be procured for designing and development of software
- Systems should be simple and acceptable by users (in consideration of users experience, abilities, and available infrastructure)
- Monitoring, evaluation and management information systems need to be consistent with technical capacity. A more appropriate approach could have included, building computer and data management skills through training initially.
Project Unit: Findings/ Issues - Continuity of project unit as well as its staff was not fully achieved (major change in
structure and staff upon creation of Uttarakhand and current UP., long vacancy in finance officer’s position, quick change of project director, short duration in Project Unit Position)
Forest Development JFM

For Official Use Only Special Assistance for Project Formation (SAPROF) for
Uttar Pradesh Natural Resources Management and Poverty Alleviation Project (UPNRMPAP)
Final Report - Volume II Annex 3-12
Components Descriptions Findings/ Issues - NGO support for capacity building and training only started in the middle of project period
after the suggestions made by relevant consultancy work. - UPFD staff who received training related to JFM was frequently transferred and their
experiences were not fully utilised. - Release of fund was not timely available which hinder the progress of the work - Delay in notification of new and revised MOU had impeded the progress of the work - Concepts, aims and benefits of JFM were not fully understand and shared among field level
stakeholders (FD frontline staff, community members) - One of the constraints in sustaining this programme was timely release of funds to
VFCs/VPs. Each VFC had a Bank Account in which funds for implementation of various works, as per micro plan are transferred.
Lessons - capacity development as well as preparatory work (such as community organising and participatory planning) should be conducted from the first year of the project
- Utilisation of supporting NGOs should be considered from the initial years of JFM activities - Training of VFC (JFMC) members for self sustainable management of VFC should be
included - A well designed communication strategy in the project could have improved the impact of
the participatory management activities, avoided controversy over modifications of rules for Gram Panchayats and JFM
- Sufficiently intensive training inputs are required to adequately contribute to developing the managerial capacity of VFCs and villagers.
- Village Development Funds (VDFs) would be useful in sustaining VFCs in future. However, the villagers would need sustained motivational and operational guidance for increasing the corpus and its judicious and sustainable use.
- Withdrawal of financial support to community institutions should be planned and phased based on their institutional capacity and the establishment of sufficient return from forests and other assets to sustain the system.
Assisted Natural Regeneration Findings/ Issues - SAL ANR, though harvesting was permitted by GO, deviation from the working plans were
not approved timely, created financial difficulties - ANR in mixed deciduous forest was aimed in JFM approach, however areas newly taken for
this purpose was limited due to financial limitations of the project - JFM approach was not applied for Sal ANR -
Lessons - Benefit sharing mechanism should be clearly defined and implemented when applying JFM approach
Industrial Plantation Findings/ Issues - targets could not fully achieved due to lack of suitable sites, and high quality planting
materials Lessons - Species which are fast growing and has potential markets should be also adopted for
industrial plantation - Target areas should be determined based on availability of sites, planting materials and
demands for the concerned species. Forest Protection Lessons - Quantification of impacts of the project activities is required
- Further active participation of various stakeholders is essential Strip Plantation Findings/ Issues - Felling of matured strip plantation was not possible due to i) the felling ban ordered by the
supreme court, ii) working plans of several forest divisions were not approved. These hindered the original objective of the strip plantation which aimed to introduce cost-effective replanting based on people’s participation with benefit sharing arrangements.
Lessons - Mechanisms for regular budgetary provision, harvesting, and benefit sharing should be developed for sustainability of the strip plantation.
Urban Forestry Findings/ Issues - It was first time for UPFD to work with NGOs in large scale
- NGOs were not always fully aware or had interest in tree planting which also resulted in unsatisfactory results
- Sustainability of the component and people’s participation were less emphasised. - The aim of this component was to establish financial arrangements through new methods so
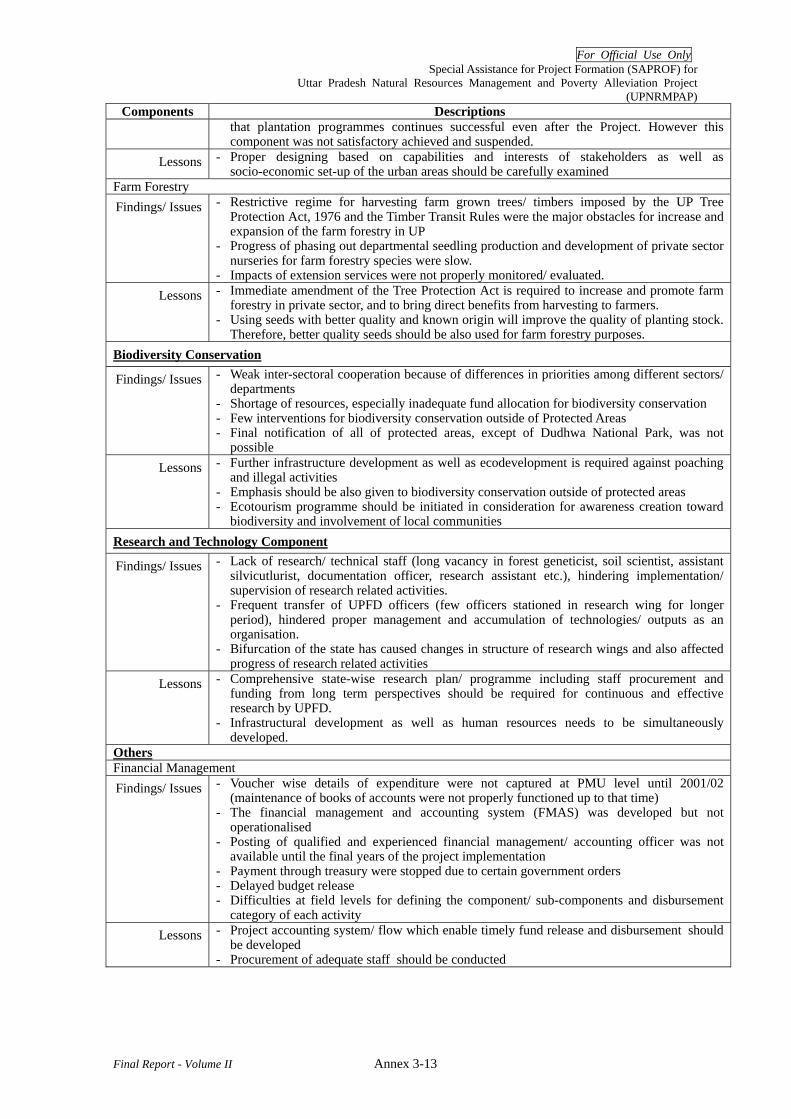
For Official Use Only Special Assistance for Project Formation (SAPROF) for
Uttar Pradesh Natural Resources Management and Poverty Alleviation Project (UPNRMPAP)
Final Report - Volume II Annex 3-13
Components Descriptions that plantation programmes continues successful even after the Project. However this component was not satisfactory achieved and suspended.
Lessons - Proper designing based on capabilities and interests of stakeholders as well as socio-economic set-up of the urban areas should be carefully examined
Farm Forestry Findings/ Issues - Restrictive regime for harvesting farm grown trees/ timbers imposed by the UP Tree
Protection Act, 1976 and the Timber Transit Rules were the major obstacles for increase and expansion of the farm forestry in UP
- Progress of phasing out departmental seedling production and development of private sector nurseries for farm forestry species were slow.
- Impacts of extension services were not properly monitored/ evaluated. Lessons - Immediate amendment of the Tree Protection Act is required to increase and promote farm
forestry in private sector, and to bring direct benefits from harvesting to farmers. - Using seeds with better quality and known origin will improve the quality of planting stock.
Therefore, better quality seeds should be also used for farm forestry purposes. Biodiversity Conservation
Findings/ Issues - Weak inter-sectoral cooperation because of differences in priorities among different sectors/ departments
- Shortage of resources, especially inadequate fund allocation for biodiversity conservation - Few interventions for biodiversity conservation outside of Protected Areas - Final notification of all of protected areas, except of Dudhwa National Park, was not
possible Lessons - Further infrastructure development as well as ecodevelopment is required against poaching
and illegal activities - Emphasis should be also given to biodiversity conservation outside of protected areas - Ecotourism programme should be initiated in consideration for awareness creation toward
biodiversity and involvement of local communities Research and Technology Component
Findings/ Issues - Lack of research/ technical staff (long vacancy in forest geneticist, soil scientist, assistant silvicutlurist, documentation officer, research assistant etc.), hindering implementation/ supervision of research related activities.
- Frequent transfer of UPFD officers (few officers stationed in research wing for longer period), hindered proper management and accumulation of technologies/ outputs as an organisation.
- Bifurcation of the state has caused changes in structure of research wings and also affected progress of research related activities
Lessons - Comprehensive state-wise research plan/ programme including staff procurement and funding from long term perspectives should be required for continuous and effective research by UPFD.
- Infrastructural development as well as human resources needs to be simultaneously developed.
Others Financial Management Findings/ Issues - Voucher wise details of expenditure were not captured at PMU level until 2001/02
(maintenance of books of accounts were not properly functioned up to that time) - The financial management and accounting system (FMAS) was developed but not
operationalised - Posting of qualified and experienced financial management/ accounting officer was not
available until the final years of the project implementation - Payment through treasury were stopped due to certain government orders - Delayed budget release - Difficulties at field levels for defining the component/ sub-components and disbursement
category of each activity Lessons - Project accounting system/ flow which enable timely fund release and disbursement should
be developed - Procurement of adequate staff should be conducted
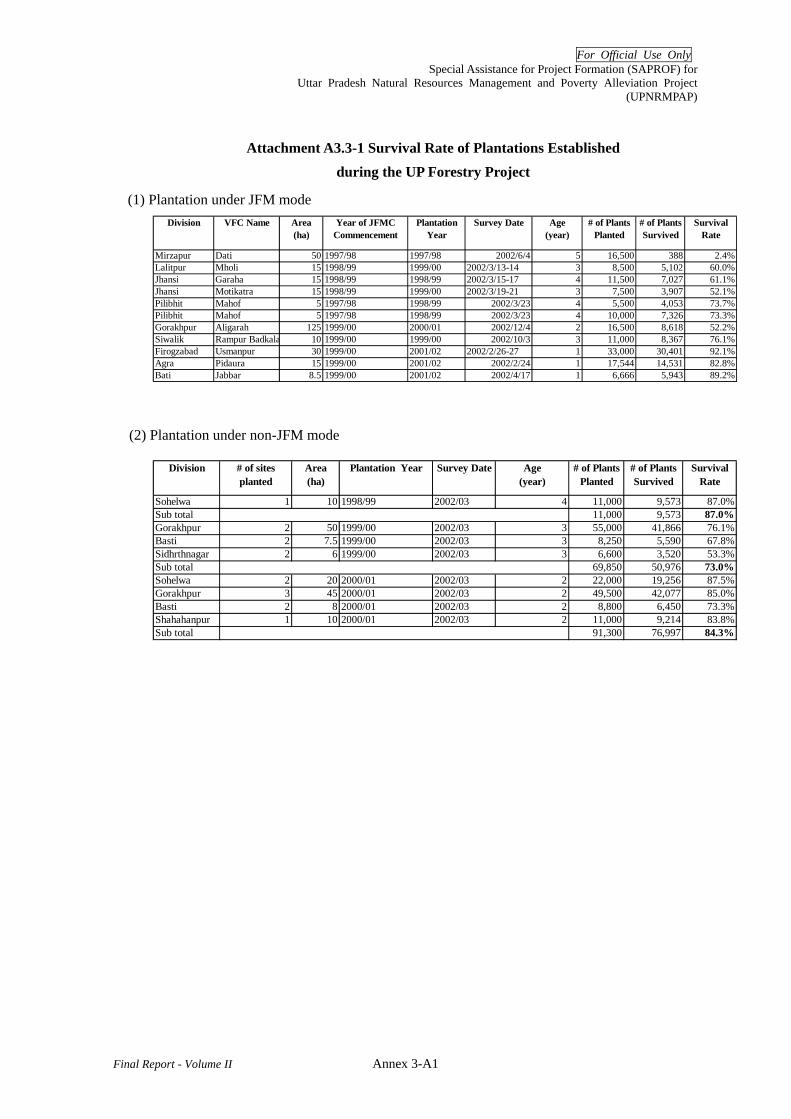
For Official Use Only Special Assistance for Project Formation (SAPROF) for
Uttar Pradesh Natural Resources Management and Poverty Alleviation Project (UPNRMPAP)
Final Report - Volume II Annex 3-A1
Attachment A3.3-1 Survival Rate of Plantations Established during the UP Forestry Project
(1) Plantation under JFM mode Division VFC Name Area
(ha)Year of JFMC
CommencementPlantation
YearSurvey Date Age
(year)# of Plants
Planted# of PlantsSurvived
SurvivalRate
Mirzapur Dati 50 1997/98 1997/98 2002/6/4 5 16,500 388 2.4%Lalitpur Mholi 15 1998/99 1999/00 2002/3/13-14 3 8,500 5,102 60.0%Jhansi Garaha 15 1998/99 1998/99 2002/3/15-17 4 11,500 7,027 61.1%Jhansi Motikatra 15 1998/99 1999/00 2002/3/19-21 3 7,500 3,907 52.1%Pilibhit Mahof 5 1997/98 1998/99 2002/3/23 4 5,500 4,053 73.7%Pilibhit Mahof 5 1997/98 1998/99 2002/3/23 4 10,000 7,326 73.3%Gorakhpur Aligarah 125 1999/00 2000/01 2002/12/4 2 16,500 8,618 52.2%Siwalik Rampur Badkala 10 1999/00 1999/00 2002/10/3 3 11,000 8,367 76.1%Firogzabad Usmanpur 30 1999/00 2001/02 2002/2/26-27 1 33,000 30,401 92.1%Agra Pidaura 15 1999/00 2001/02 2002/2/24 1 17,544 14,531 82.8%Bati Jabbar 8.5 1999/00 2001/02 2002/4/17 1 6,666 5,943 89.2%
(2) Plantation under non-JFM mode
Division # of sitesplanted
Area(ha)
Plantation Year Survey Date Age(year)
# of PlantsPlanted
# of PlantsSurvived
SurvivalRate
Sohelwa 1 10 1998/99 2002/03 4 11,000 9,573 87.0%Sub total 11,000 9,573 87.0%Gorakhpur 2 50 1999/00 2002/03 3 55,000 41,866 76.1%Basti 2 7.5 1999/00 2002/03 3 8,250 5,590 67.8%Sidhrthnagar 2 6 1999/00 2002/03 3 6,600 3,520 53.3%Sub total 69,850 50,976 73.0%Sohelwa 2 20 2000/01 2002/03 2 22,000 19,256 87.5%Gorakhpur 3 45 2000/01 2002/03 2 49,500 42,077 85.0%Basti 2 8 2000/01 2002/03 2 8,800 6,450 73.3%Shahahanpur 1 10 2000/01 2002/03 2 11,000 9,214 83.8%Sub total 91,300 76,997 84.3%

For Official Use Only Special Assistance for Project Formation (SAPROF) for
Uttar Pradesh Natural Resource Management and Poverty Alleviation Project (UPNRMPAP)
Final Report- Volume II
Special Assistance for Project Formation
for Uttar Pradesh Natural Resource Management and Poverty Alleviation Project
(UPNRMPAP)
Final Report
Volume II: ANNEXES
ANNEX-4 CONSULTATIVE MEETING
WITH STAKEHOLDERS

For Official Use Only Special Assistance for Project Formation (SAPROF) for
Uttar Pradesh Natural Resources Management and Poverty Alleviation Project (UPNRMPAP)
Final Report - Volume II Annex 4-1
ANNEX 4 CONSULTATIVE MEETING WITH STAKEHODERS
Agenda
Stakeholder Meeting for
Uttar Pradesh Natural Resource Management and
Poverty Alleviation Project (NRMPAP)
May 21, 2007 Venue: Gomti Hotel
6. Sapru Morg, Lucknow (Opposite of SSP Residence)
10:30 - 11:00 Registration 11:00-11:15 Plenary session
- Welcome by Uttar Pradesh Forest Department -, PCCF - Objectives and Expectations from the Stakeholder Meeting - Mr. Koyanagi,
Team Leader SAPROF 11:15-12:30 Plenary session
- Overview of SAPROF Study- SAPROF - NRMPAP: Outline of the Project by SAPROF team - Question and Discussion
12:30 - 14:15 Working Group Sessions - Group Sessions on following topics and issues relevant to NRMPAP
1. Forest Development and Management through JFM Approach 2. Livelihood and Income Generating Activities (IGAs) for the Forest
Dependant Communities 3. Monitoring systems for Project Management (Including preparation for presentations)
14:15 – 15:15 Lunch Break (Lunch to be provided at the venue) 15:15 – 16:45 Plenary Session
- Presentation by Working Groups and Group Discussions - Questions and Clarifications - Summarising Key Recommendations by Facilitator
16:45 – 17:00
- Ways forward - Mr. Koyanagi - Vote of thanks and Concluding Remarks - UPFD

For Official Use Only Special Assistance for Project Formation (SAPROF) for
Uttar Pradesh Natural Resources Management and Poverty Alleviation Project (UPNRMPAP)
Final Report - Volume II Annex 4-2
List of Participants of Consultative Meeting Sl.No Category Name and Organisation
1 University & Academic
Prof. H.P. Chauhry, Chandra Shekhar Azad University of Agriculture & Technology, Kanpur
2 Dr. L.M. Joshi 3 Dr. P. Chandra, Dean Dayal Upadhyay State Institute of Rural
Development 4 Dr. A.K. Srivastava, Directorate of Animal Husbandry 5 R.K. Prakash, Small Scale Industry Development Cooperative 6 Dr. B.C. Sikroria, Small Scale Industry Development Cooperative 7
Other Dept.
S. Gautam, Small Scale Industry Development Cooperative 8 Gulab Prasad, Gulab Prasad 9 Ahamed Ali, Ahamed Ali Pudrapur Gram Van Samiti
10
JFMCs
Ram Bharose, Ram Bharose Dhyanpur EDC 11 Dr. C.S. Vyas, Shahbhagi Shikshan Sansthan 12 Radhey Krishana, Samarpan Jan Kalyan Samiti 13 Dr. Shiraz A. Wajih, Gorakhpur Environmental Action Plan 14 Ajay Kr. Choubey, U.P. Banvasi Seva Santhan 15 Aftab Alam, Bhartiya Manav Samaz 16 Sunil Singh, Rahi Foundation 17 Ashok Saxena, Samagra VIkas Sewa Samiti 18 Rampati Tiwari, Sahbhagi Gramin VIkas Samiti 19 Dr. Jeetendra Chaturvedi, DEHAT 20 Dr. O.P. Singh, Krisharpit Sewa Ashram 21 Rajam Kaul, Patha Lol VIkas Samiti 22 Vasu Dev, Bundelkhand Sewa Sansthan 23 San Jay, Anthyodaya Sansthan 24 Raj Bhaiya, Pragilal VIdya Dham 25 Abhimanyu Singh, Sarvodaya Sewa Ashram 26 Kvit Gandhi, Oxfam 27 Dr. A.K. Sinha, Indian Insititute of Rural Development 28 Dr. V.P. Singh, Tarai Nature Conservation Society 29 Dr. S.N. Pandey, Tara(Technology and Action for Rural Advancement) 30 B.P. Pandey, Jan Kalyan Maha Samiti 31
NGOs
R.K. Mishra, Kashi Lok Sewa Santhan 32 B.K. Patnaik, PCCF 33 D.N.S. Suman, PCCF(Project) 34 V.M. Arora, CCF Project Formulation 35 V.K. Sinha, CCF Ecodevelopment 36 Atibal Singh, CF FDA 37 Suresk Chandra, CF HRD 38 Mamta Dubey, CF planning 39 Ramesh Pandey, DFO Katarniaghat 40
UP Forest Dept.
V.S. Pasad, DFO Sonebhadra 41 S. Koyanagi, JBIC SAPROF Team 42 S. Tsuji, JBIC SAPROF Team 43 V. Mehta, JBIC SAPROF Team 44 T. Ota, JBIC SAPROF Team 45 S. Bhardwaj, JBIC SAPROF Team 46 N. Horo, JBIC SAPROF Team 47
JBIC SAPOF Team
P. Choudhury, JBIC SAPROF Team Total No. of Participant: 47
For Official Use Only Special Assistance for Project Formation (SAPROF) for
Uttar Pradesh Natural Resources Management and Poverty Alleviation Project (UPNRMPAP)
Final Report - Volume II i
Special Assistance for Project Formation (SAPROF)
for
Uttar Pradesh Natural Resource Management and Poverty Alleviation Project (UPNRMPAP)
Final Report
Volume II: Annexes
ANNEX 4 CONSULTATIVE MEETING WITH STAKEHODERS
Table of Contents 1 Agenda ....................................................................................................................... Annex 4 -1 2 List of Participants ..................................................................................................... Annex 4 -2
For Official Use Only Special Assistance for Project Formation (SAPROF) for
Uttar Pradesh Natural Resource Management and Poverty Alleviation Project (UPNRMPAP)
Final Report- Volume II
Special Assistance for Project Formation
for Uttar Pradesh Natural Resource Management and Poverty Alleviation Project
(UPNRMPAP)
Final Report
Volume II: ANNEXES
ANNEX-5 NGO CASE STUDY
For Official Use Only Special Assistance for Project Formation (SAPROF) for
Uttar Pradesh Natural Resources Management and Poverty Alleviation Project (UPNRMPAP)
Final Report-Volume II i
Special Assistance for Project Formation (SAPROF)
for
Uttar Pradesh Natural Resource Management and Poverty Alleviation Project (UPNRMPAP)
Final Report
Volume II: Annexes
ANNEX 5 NGO CASE STUDY
Table of Contents 1 General Findings ............................................................................................................Annex5-1
1.1 Involvement in natural resource management (NRM) projects ..........................Annex5-1 1.2 NGO’s community entry .....................................................................................Annex5-1 1.3 NGO’s capability to realize participation within People’s Institutions (PIs) ......Annex5-2 1.4 Capacity building of People’s Institutions (PIs) and their sustainability ............Annex5-2 1.5 NGO’s ability to bring about appropriate systems and mechanisms within PIs .Annex5-2 1.6 NGO’s technical capabilities...............................................................................Annex5-3 1.7 Overall impact of NGO’s involvement ...............................................................Annex5-3
2. Recommendations and Implications to UP-NRMPAP...................................................Annex5-3 3. Background and Objectives of NGO Case Study...........................................................Annex5-5 4. Method of Case Study ....................................................................................................Annex5-6 5. Organisations and Areas Visited.....................................................................................Annex5-7 6 Case Studies ...................................................................................................................Annex5-7
6.1 Patha Kol Vikas Samiti (PKVS) in Chitrakoot district (Manikpur CD Block) ...Annex5-7 6.2 Sarvodaya Seva Ashram (SSA) in Chitrakoot district (Karwi CD Block)........Annex5-15 6.3 Nighasan-South Forest Range, North Kheri Forest Division............................Annex5-25 6.4 UP Banvasi Seva Sansthan (UPBSS) in Kheri district (Pallia CD Block) ........Annex5-31 6.5 Jan Kalyan Maha Samiti (JKMS) in Fatehpur district ......................................Annex5-35
Attachments Attachment A5.5-1 Itinerary of Field Visit for NGO Case Study .............................................Annex5-A1 Attachment A5.5-2 List of Persons Met....................................................................................Annex5-A2 Attachment A5.6-1 Socio-economic profile and resource status of villages visited .................Annex5-A5
For Official Use Only Special Assistance for Project Formation (SAPROF) for
Uttar Pradesh Natural Resources Management and Poverty Alleviation Project (UPNRMPAP)
Final Report - Volume II Annex5-1
ANNEX 5 NGO CASE STUDY
1 General Findings
In the five cases of community organisation processes studied, the general approach to People’s Institution (PI) formation and strategy for implementation of works faced challenges in operationalisation of their plans, mainly on two accounts: i) the hierarchical, exclusionary social structure that is found in rural areas, and its associated consequences; and ii) the capabilities and skill-base of NGOs. The case studies represent a range of project implementation and funding mechanisms; there was direct project implementation by the NGOs and by grassroots organisations through partnership with NGOs. Funding sources included government departments, the State Government (through various programmes and schemes), NABARD and international/national NGOs.
The following general findings were drawn from the case studies undertaken:
1.1 Involvement in Natural Resource Management (NRM) projects
(1) Scope for Participation
There has been little scope for the participation of NGOs in natural resource management (NRM) projects in Uttar Pradesh, and particularly so in the forestry sector; the WB-aided UP Forestry Project had envisaged little or no role for NGOs, and in some instances where they did associate, their involvement was restricted to peripheral activities such as awareness generation and organising meetings. As a result, there are few NGOs involved in NRM and forestry activities in the state.
(2) NGO’s Awareness over JFM
Despite the passage of the UP VFJM Rules in 1997 (revised in 2002) that encourages the involvement of NGOs in JFM, there is little awareness among NGOs toward JFM. Many NGOs are not aware of communities’ rights over forest resources granted by the Government to people in state-owned forest areas. Even in villages in the periphery of forests, people were unaware of JFM in spite of the intervention of NGOs. NGOs are expected to facilitate UPFD and community to work together, but the NGOs are not playing significant roles in JFM in UP so far.
1.2 NGO’s Community Entry
Community entry interventions that are generally favoured by the NGOs are awareness generation activities on issues of health and education. These activities have tended to attract people easily, as they are a common concern across all sections of society. Education and health interventions are not only effective entry point activities but also
For Official Use Only Special Assistance for Project Formation (SAPROF) for
Uttar Pradesh Natural Resources Management and Poverty Alleviation Project (UPNRMPAP)
Final Report - Volume II Annex5-2
useful means for reaching the most disadvantaged groups and households in the village. Folk songs and cultural activities were commonly used and favoured as means of entertainment and mobilization for gatherings.
In almost all cases (except the instance of the JFMC), the facilitating agency had a long-standing presence in the village before it initiated NRM activities. However, the core leader identification within the villages and development of such core leaders who will be the development agent within the community has not been undertaken systematically by the NGOs, which indicates the pre-maturity of NGOs in UP for community organizing.
1.3 NGO’s Capability to Realize Participation within People’s Institutions (PIs)
In all five cases, NGO’s efforts have been made at constitution of representative PIs, but it was found that meaningful participation of the marginalised groups, such as women, scheduled castes and other weaker sections within the communities was sorely lacking. Representation in decision-making committees ensured only their symbolic participation, and leadership remained concentrated in the hands of the already empowered.
1.4 Capacity Building of People’s Institutions (PIs) and Their Sustainability
The village-level representative groups were, in all cases, found to last only till the end of the project, after which they lapsed into dormancy. Although PIs are formed with the objective of empowerment and capacity building, it was found that the PIs were seldom given space or authority for independent decision-making and/or action by NGOs. It is also attributed partly to the inadequate training inputs.
1.5 NGO’s Ability to Bring about Appropriate Systems and Mechanisms within PIs
The systems and mechanisms for PI’s funds management, record-keeping, organizing meeting, etc. were not well-defined by NGOs. Although the JFMCs had well-defined systems and mechanisms stipulated in UP VFJM Rules in 1997 (revised in 2002), these were not followed in practice.
There was little or no information-sharing within PIs, particularly on aspects of financial management. Norms for beneficiary-selection, if specified by the NGO, were not followed. Equity in cost and benefit-sharing was not observed in any cases studied. While trade-offs were inevitable in trying to win the goodwill of the elite and serving the interests of the marginalised, these trade-offs resulted in the majority of the benefits going the way of the elite in the village. It was obvious that NGOs could not facilitate the realization of such a delicate balance.
The types of PIs that were found and studies included the following: Self-Help Groups, Seed Bank, Youth Groups, Water User Groups, Watershed Management Committee, Joint

For Official Use Only Special Assistance for Project Formation (SAPROF) for
Uttar Pradesh Natural Resources Management and Poverty Alleviation Project (UPNRMPAP)
Final Report - Volume II Annex5-3
Forest Management Committee, Village Resource Management Committee, and Site Implementation Committee. Various PIs have different objectives and dynamics. NGOs should be able to understand the differences and address the issues that are particular to the PI. However, our case study revealed that such profound understanding seemed to be lacking among the NGOs.
1.6 NGO’s Technical Capabilities
Capacities of NGOs to provide technical support for micro-enterprise development and civil engineering works to communities are extremely limited. On the whole, there was a general lack of technical expertise in NGOs which consists mostly of generalists rather tan specialists. NGOs should link with specialized organisations for works and development, such as market research, product design / development, business planning, surveying, structural designing, supervision of civil works, etc, but the appropriate link was not found in the case study.
1.7 Overall Impact of NGO’s Involvement
Overall, it may be stated that NGO intervention in villages has had a positive impact on communities to a certain extent in the areas of: i) development of community organisation; ii) progress of economic activities; and iii) increase in education opportunities. These, in turn, realized wider outreach. The recruitment of local residents as facilitators, as well as the policy of local residence of external facilitators was found to be effective and efficient in some cases. However, the impact of NGO’s involvement in the community development initiatives is limited to those areas mentioned above.
2. Recommendations and Implications to UP-NRMPAP
i) The involvement of NGOs is an effective strategy to reach out the marginalized community members, identify the direct and indirect beneficiaries, raise their awareness, build consensus among them, enhance their readiness for the Project, support them for better project management and implementation, improve the effectiveness of project interventions and realize greater impact of the Project.
ii) NGOs themselves need to be informed about JFM, EDC and UP-NRMPAP very well. The intensive orientation activities for the partner NGOs are inevitable.
iii) NGOs as a development agent should first understand the social and environmental factors of a target village to which it provide assistance. UP-NRMPAP should allocate sufficient time for community entry activities and rural appraisal of NGOs.
iv) An organisation having its roots in advocacy, activism and the rights-based

For Official Use Only Special Assistance for Project Formation (SAPROF) for
Uttar Pradesh Natural Resources Management and Poverty Alleviation Project (UPNRMPAP)
Final Report - Volume II Annex5-4
approach may also be brought into UP-NRMPAP when they wish. But there has to be a change in the role of the organisation without a corresponding change in its orientation, and the Project must support and monitor such changes carefully.
v) UP-NRMPAP should have a clear and standardized guidelines, manuals and handbooks indicating the process, approach and nature of support. This should help realize better PI’s constitution, solid norms, established systems, raising interest and awareness among group members, open membership, effective training, enhancement of capacities, resolve conflict, inter-departmental coordination at the grassroots level, selection of beneficiaries.
vi) NGO assistance in community organising should be initiated in early stages of the Project
vii) Capacity building of both NGO workers and PIs is essential for effective implementation of the project and sustenance of benefits. The development technical expertise within an NGO in accordance with the stages of community development is crucial for the success of UP-NRMPAP for the minimization dependence on external agencies.
viii) Working on health and education issues should be a part of livelihood security enhancement component of UP-NRMPAP for developing incentives/motivations of villagers to participate in the Project and reaching the most disadvantaged groups in the village community, and women in particular.
ix) UP-NRMPAP should work with both women and men in the community to avoid segregation and exclusion of the other segment/s.
x) While the advantages of having the Forester on board the JFMC/EDC need to be utilized, it is necessary for the NGOs to encourage the concerned official to facilitate participative planning, project management, implementation and decision-making in the JFMC/EDC.
xi) The capability of FD’s field officers to supervise the activities of NGO on PI formation and other community works to realize the expected outcomes may be limited. The filed officers should be trained, supported by consultants and assisted by manuals for the supervision of NGOs.
xii) Simple representation of marginalized and/or disadvantaged sections of the community is not sufficient to ensure their participation – appropriate supportive measures and interventions by the NGOs need to be introduced to allow and enable meaningful participation of the marginalized groups in decision-making and functional mechanisms.
xiii) Given the low levels of literacy in the area, the technical training modules under UP-NRMPAP need to be simple and designed to suit the requirements and

For Official Use Only Special Assistance for Project Formation (SAPROF) for
Uttar Pradesh Natural Resources Management and Poverty Alleviation Project (UPNRMPAP)
Final Report - Volume II Annex5-5
comprehension capabilities of the people’s representatives.
3. Background and Objectives of NGO Case Study
Since the decade of nineties, there has been an increasing emphasis on the establishment and strengthening of village-level people’s institutions (PIs) for the implementation of development programmes in India. The main objectives of doing so are: (i) increasing project efficiency (by reducing and/or transferring implementation costs to the community); (ii) increasing acceptability through involvement of local communities in decision-making; and (iii) ensuring sustainability of project-created assets through transfer of their ownership and management responsibility to PIs. These village-level organisations take various forms, their structures, functions and capabilities often being governed by the agency that facilitated their formation and development.
One of the prime necessities for the successful execution of a participatory natural resource management and poverty alleviation programme, such as UP-NRMPAP, is the establishment of robust PIs, which will not only be partners in project execution but also continue and sustain the process of development initiated during the duration of the project. There is a vast body of literature on the principles and factors that determine the robustness of village-level PIs, particularly those that are engaged in natural resource management. Evidence suggests that the functionality of PIs depends on the extent and adequacy of representation of different interest groups, including gender representation – and the mechanisms by which these associations deal with disputes.
NGOs are expected play critical roles in the establishment of robust PIs, ensuring the appropriate representations within PIs and mediate conflict among different interest groups within the community. The expectation was particularly high in the case of Uttar Pradesh because of its unique social features and historical background.
In Uttar Pradesh, caste and land rights are crucial factors which impact on political, social and economic relationships, and are the key to social, political and economic capital; groups such as dalits1, adivasis2, “backward castes” and others continue to be the most socially and economically vulnerable in UP as a result of lack of access to land ownership, meaningful political participation and free employment3. In such a complex society that
1 Dalit refers to people who are socially, religiously, economically and politically oppressed, deprived and exploited in India. The word “Dalit” is often used to describe a person who comes from any lower caste. 2 Adivasis (literally: first inhabitants), the indigenous/ tribal people of India. The Scheduled Tribes make up the Adivasis, whereas the Scheduled Castes are called the Dalits. 3 Estimates suggest that at least two thirds of the bonded labourers in India are dalits and that over half the dalit workforce are landless agricultural labourers. Sixty-six per cent of all women agricultural labourers are dalits earning between Rs.8-25 per day.
For Official Use Only Special Assistance for Project Formation (SAPROF) for
Uttar Pradesh Natural Resources Management and Poverty Alleviation Project (UPNRMPAP)
Final Report - Volume II Annex5-6
is found in UP, fragmented along caste and class differentials as well as gender, the process of community reorganisation for achievement of common goals (and project implementation) appears challenging.
With this background, the SAPROF team undertook an exercise to examine the community organizing processes facilitated by five different agencies in the State, in forest fringe villages in potential project areas. One agency among the five was in a non-project area and visited because of its reportedly exemplary work in community organisation in the context of NRM.
The specific objectives of the case studies were:
i) To understand the current situation of scheduled castes in forest fringe villages ii) To gain insights into the process of organizing socially fragmented communities
in forest fringe villages through an analysis of NGO initiatives in participatory development
iii) To identify suitable and specific strategies for community organizing and participatory forest management under the proposed UP-NRMPAP.
4. Method of Case Study
The method adopted for conduct of the NGO case studies and for review of the community organizing process consisted of the following:
i) Identification of NGOs involved in community organizing activities in forest fringe villages, and working on issues of natural resource management and community development
ii) Background research on the NGO, including review of available literature and discussion with key persons/ organisations in the NGO and development sector in UP
iii) Preparation of checklists for focus group discussions with NGO personnel and village community
iv) Discussion with NGO staff before and after the field visit (a brief meeting prior to the village visit and a detailed one afterwards)
v) Field visit to a village identified by the NGO to showcase its facilitation processes; in each village, three simultaneous focus group discussions (FGDs) were conducted. Each group consisted of about 10 participants, and the constitution of these groups was as follows: a. Group I – village Pradhan, President of VFC/JFMC/other village institutions,
and other village leaders (men’s group) b. Group II – members of SHGs (women), women PRI representatives, other

For Official Use Only Special Assistance for Project Formation (SAPROF) for
Uttar Pradesh Natural Resources Management and Poverty Alleviation Project (UPNRMPAP)
Final Report - Volume II Annex5-7
women members (women’s group) c. Group III – members of socially and economically marginalized communities
in the village (men’s group) Discussions in each FGD were facilitated by a SAPROF Team Member, and recorded by a rapporteur conversant with the local language and dialect/s.
An internal meeting of the team members was held at the end of the day to exchange notes and perspectives, draw conclusions and crystallize learnings. The field notes were used by the FGD Facilitators to prepare individual notes on areas and organisations visited, and form the basis of this report.
5. Organisations and Areas Visited
The organisations and areas visited for the purpose of this study are as follows:
Organisation Forest Division Patha Kol Vikas Samiti (village Bandhua) Chitrakoot Sarvodaya Seva Ashram (village Bhambor) Chitrakoot Forest Department (village Ori Purwa) North Kheri UP Banwasi Seva Sansthan (village Ramnagar) North Kheri Jan Kalyan Maha Samiti (village Shahnagar and Araihya) Fatehpur
The detailed schedule of the field visit are placed at Attachment A5.5-1. Attachment A5.5-2 provides details of persons met in the villages, at NGO offices and in the Forest Department.
6 Case Studies
6.1 Patha Kol Vikas Samiti (PKVS) in Chitrakoot District (Manikpur CD Block)
(1) Area Information and Problems Identified
One of the most backward regions in the state, the Patha region of Bundelkhand, is characterised by plateaus and undulating terrain, low rainfall, denuded forests and large livestock holdings. Agriculture is characterised by small landholdings, poor yields and low productivity. Every village, however, has a few big landowners (Dabang) who either rent out their land or get it worked by labourers. Free grazing is widely prevalent, with cattle and other livestock being allowed to graze without any restriction, on fallow fields and in forest areas.
The population in the Bundelkhand region consists of large numbers of tribal communities, especially in the Banda and Chitrakoot districts. Kols are the commonest tribal group found in the area, and are classified as a ‘Scheduled Caste’ in the state of UP. In the adjoining states of Madhya Pradesh, Chhattisgarh, Bihar and Rajasthan, the same community is notified as a ‘Scheduled Tribe’. The Kols have traditionally been highly dependent on forests, and cultivation is their primary occupation. However, the majority
For Official Use Only Special Assistance for Project Formation (SAPROF) for
Uttar Pradesh Natural Resources Management and Poverty Alleviation Project (UPNRMPAP)
Final Report - Volume II Annex5-8
of them were working as bonded labourers until about 10-15 years ago, for the feudal landlords. Although granted land pattas (title) by the government, they remained oblivious of this entitlement, their lands being under occupation of the powerful landlords who continued to exploit them, and reap the benefits in their names.
Welfare schemes aimed at the community often do not reach them because of the interests of the intermediaries and the Kols’ own lack of awareness, literacy and organisation. The feudal system of social hierarchies continues to be deeply entrenched in the region, and the Kols find themselves on the lower rungs of the society. Any attempt at resistance in the past used to be quickly and effectively suppressed by the powerful lobby. The women frequently face harassment at the hands of the powerful, and are subjected to obscenity and ill-treatment.
Attachment A5.6-1 provides an outline of the socio-economic situation and resource conditions in the village visited (Bandhua).
(2) PKVS – History and Background Information
PKVS came into existence as an NGO in the year 1991. The organisation was established in response to the urgent need for organisation of the Kol community in the region, for protection of their interests and realisation of their rights. As such, the roots of the organisation lie in advocacy and activism. The organisation works for the welfare of the Kol community in particular in the Bundelkhand region.
Since 1977-78, the Akhil Bharatiya Samaj Seva Sansthan (ABSSS), a local NGO, had been working in the region, in association with the Kol youth, on issues of community mobilization, social justice and political voice. In 1987, as leadership roles were being taken on by the local youth, a platform known as the Patha Kol Adhikar Manch (PKAM) was launched and a peaceful protest (rally) was organised in the district to demand basic amenities and land entitlements for Kols. This forum comprised about 100 local Kol youth (mostly men, but also some women), and the rally that they led consisted of over 10,000 individuals. This was the first instance when the strength of collective effort was felt and realised by the community. Thereafter, there have been many such developments.
In 1991, a collective decision to shift the focus from advocacy / activism to development and institution-building was reached, and thus the PKVS was born. It was registered under the Societies Registration Act, 1860. Members agreed that PKAM and PKVS would work in tandem, depending on the issue and the nature of intervention necessary.
PKVS started work on non-formal education and simultaneous community mobilization from the year 1992. As the core agenda was that of land entitlement, which would invite the wrath of the powerful landlords, the organisation deemed it necessary to ‘cover’ its
For Official Use Only Special Assistance for Project Formation (SAPROF) for
Uttar Pradesh Natural Resources Management and Poverty Alleviation Project (UPNRMPAP)
Final Report - Volume II Annex5-9
activities through adoption of a non-threatening intervention such as education. Centres for non-formal education (NFE) served as a ‘front’ or façade and an entry point activity in the villages where they worked (initially only 5 villages, but progressively increased to 25 by the year 2000). Thus, while education and functional literacy was emphasized during the meetings, there was a simultaneous attempt at community organisation and rights awareness.
The organisation has been expanding into other areas of work since the year 2000 and is currently operating in about 150 villages in 20 Gram Panchayats of Manikpur Block, Chitrakoot District. Apart from non-formal education, it has been involved in strengthening of Panchayat Raj Institutions (PRIs) and capacity building of PRI functionaries, for which it has received financial support from local foundations as Uttar Pradesh Voluntary Action Network (UPVAN) and Sahbhagi Shiksan Kendra (SSK), flood relief work with support from Church's Auxiliary for Social Action (CASA), and civil society strengthening as part of DFID-funded Poorest Areas Civil Society (PACS) programme. PKVS is well-networked, and receives support from Akhil Bharatiya Samaj Seva Sansthan (ABSSS), Adivasi Seva Sansthan-Manikpur and Panchayat Sandarbh Kendra-Banda, in addition to the support it receives from its sponsors.
(3) Strategy and Approach to Formation and Strengthening of People’s Institutions
The approach of PKVS to community organisation and group formation in the village visited (Bandhua) is of a ‘reactive’ nature4, i.e., it was formed in response to perceived and real threats, and in order to protect and realise members’ interests, land titles in this case. On the part of PKVS, selection of the village was based on the criteria of ‘maximum exploitation’; thus, villages that are most deprived are the ones that are given topmost priority in selection.
Within the village, it was a rather ad hoc process of group formation, with groups of men being formed early on in the process and women’s groups following much later. Between and among these groups in a village, there were neither linkages nor any information sharing.
As mentioned earlier, non-formal education centres were the starting point in the village selected. Religious hymns (kirtan), music and other such methods were employed to attract members of the community to the NFE centres. For over a year, members focused solely on literacy and educational issues, and other matters were not discussed; as trust
4 Groups form either reactively (to some threat to member’s interests) or proactively (toward some perceived opportunity for member’s interests). Reactive groups may form in response to government requirements or as options of last resort in the face of commercial competition (Altenburg and Meyer-Stamer, 1999; Schmitz, 2003). For many of these, the main collective interest is simply survival.
For Official Use Only Special Assistance for Project Formation (SAPROF) for
Uttar Pradesh Natural Resources Management and Poverty Alleviation Project (UPNRMPAP)
Final Report - Volume II Annex5-10
built and staff members gained the confidence of the community, burning issues were identified. These issues being basic to the livelihoods security of the people, engagement levels were high and community participation was spontaneous.
In the course of time, linkages were established with the village youth, and issues of rights, social justice and political participation discussed with them in small group meetings. Community gatherings were organised on occasions such as the Independence Day (August 15th) and Republic Day (January 26th), symbolic of their common quest for freedom and justice. Gradually, as awareness levels were raised, the issues became more broad-based and popular support was ensured.
Subsequently, health meetings were organised, with the hidden agenda of reading out the land revenue records, informing people of their land titles and raising awareness about issues of livelihoods, rights and justice. These activities continued for about two years (1992-93), after which development interventions were initiated (1994).
PKVS lays a lot of emphasis on identification and development of local leadership. This is a trait it shares in common with its parent organisation (ABSSS).
One of the other important elements of the strategy followed by PKVS was the identification of important stakeholders (viz., local media, bureaucracy, etc.) and seeking their support and co-operation for achievement of the group’s objectives.
(4) Structure, Functions and Systems of PIs
There are at least three kinds of people’s institutions that have been formed in the village visited (Bandhua), the formation of which has been facilitated by PKVS. These are:
- Nav Yuvak Mangal Dal (NYMD) - Kisan Vikas Samiti (KVS) - Durga Self Help Group (SHG)
The process of formation, structure, functions and other relevant details of the three types of PIs are discussed below.
i) Nav Yuvak Mangal Dal
NYMD was formed in the second year of PKVS association with the village. It consists of village youth (mostly men) who were interested and had participated in PKVS meetings. The primary purpose of the group was advocating for the basic rights (land entitlement, water and education facilities) of members of the Kol community.
Characteristically, the youth were organised after the process of rights-awareness through small meetings held with the community members. The fact that basic rights of Kols would not be realised without organisation and collective efforts was impressed upon the
For Official Use Only Special Assistance for Project Formation (SAPROF) for
Uttar Pradesh Natural Resources Management and Poverty Alleviation Project (UPNRMPAP)
Final Report - Volume II Annex5-11
youth. Later, a village meeting was organized, and the idea of formation of NYMD was floated. 35 youth (all men) enrolled in the group initially, and Mr. Mithai Lal was chosen as its President. Afterwards, 5 other members joined the group, taking its strength to 40.
Membership was based on interest and willingness to participate in group activities. There were no other criteria for enrolment. Keeping in tune with the organisational approach, the local leadership was groomed to perform additional tasks and take on more responsibilities, with the result that Mr. Mithai Lal is not only well-informed and keeps abreast of important developments, but also works as a volunteer with PKVS. It may be mentioned here that Mr. Mithai Lal is the ex-Pradhan of the village Panchayat (2000-05), and the spouse of the current Pradhan, Ms. Phaguni Devi.
One of the major achievements of the group was freedom from bonded labour and realisation of land entitlements for 18 households in the village. Having accomplished this objective, the group lacked other anchor activities to keep it functioning and alive. It undertook some voluntary works, i.e., construction of a well in 1995, and after dabbling in issues of provision of basic amenities such as drinking water, education facilities, etc., the group lapsed into inactivity and is no longer functioning.5
The purpose for which it was created, the group did not need any specific systems or mechanisms for planning, funds management and so forth. As a result, there was neither scope nor relevance of studying these aspects in the village. Likewise, the relevance of gender issues was neither perceived nor addressed by PKVS or the village community.
ii) Kisan Vikas Samiti
In 2002, a large-scale flood caused loss of life and property in Chitrakoot district. Church's Auxiliary for Social Action (CASA), a national NGO with a long history of support in relief operations, stepped in and with PKVS as a partner organisation, provided support to affected families in the forms of food and shelter. Consequently, CASA extended financial support to PKVS for livelihoods rehabilitation and reconstruction. As part of this support, a farmers’ group (Kisan Vikas Samiti) was formed in 2003, with the objective of promoting self-sufficiency among farmers. The group consisted of 11 members, who had paid membership fees of Rs 100 each. This restricted membership to the ‘upper crust’ – farmers who could afford to pay the fee (which may have been seen as beneficiary contribution, but the norms or basis for this were not clear).
5 This is not necessarily a negative turn of events. Institutions exist for a purpose and when the purpose of the institution is achieved then it may either discontinue or find another purpose in keeping with members’ interests. The latter often requires visionary leadership or expert facilitation from outside. In the case of NYMD, without any external facilitative support, the group was unable to see a reason for its existence and therefore become non-functional.

For Official Use Only Special Assistance for Project Formation (SAPROF) for
Uttar Pradesh Natural Resources Management and Poverty Alleviation Project (UPNRMPAP)
Final Report - Volume II Annex5-12
As initial support, a grant of Rs 10,000 was advanced to the group, to be used as a revolving fund to meet costs of agriculture inputs (seed, fertilizers, etc.). The fund was taken by members in the form of loan for agriculture purposes, to be returned with 25% interest per annum upon crop harvest. However the area has been rocked with recurrent droughts since the formation of the KVS, farmers have been unable to recover even their investments from agriculture, and the scope or possibility of the loans being returned to KVS appears remote. Nevertheless, members mentioned during our FGD that they intended to return the outstanding amount in small instalments in the future, should they be able to reap normal harvests.
It seemed from the FGD that decision-making in the KVS was essentially done by the facilitating agency (PKVS), based on its understanding and the objectives/ requirements of the supporting agency (CASA).
iii) Durga Self Help Group (SHG)
Formation
Formation of the Durga SHG happened two years ago (2005). The group comprised 11 members – all women – from the Kol community. It was understood that the members come from the most deprived families in the village. Formation of the group was facilitated by Ms. Kamla Devi, the Extension Worker/ Community Organiser from PKVS, who visited individual households to meet the women and explain the purpose and need for formation of an SHG. She then convened a general meeting with women to explain the purpose, procedure of formation, the requirements and benefits of SHG in detail. Since the NGO already had a base in the village (had been working there for over 10 years) and trust of the community was not an issue, women were easily convinced for the formation of an SHG, and there was no opposition from the men to the participation of women in meetings or the formation of SHG and savings. The cultural activities that were on-going (folk songs, etc.) further helped in creating a conducive environment for meeting and information exchange. The Community Organiser was ably supported by the village leadership (Mr. and Mrs. Lal) in the process of group formation.
Objective
Members of the group were quite clear of the purpose of the SHG and the reason for their association. In their perception and understanding, the group was formed to initiate internal saving, apply collective efforts to access and benefit from government schemes (perhaps SGSY), start income generating activities, and obtain small loans from a bank in emergencies (such as illness or household needs) through in-group lending.
Integration and inter-linkages

For Official Use Only Special Assistance for Project Formation (SAPROF) for
Uttar Pradesh Natural Resources Management and Poverty Alleviation Project (UPNRMPAP)
Final Report - Volume II Annex5-13
The FGD participants were not aware of the presence or operation of other groups in the village, and were not even able to recognize the names when mentioned (NYMD and KVS) – this is indicative of the level of their isolation from other development activities in the village. However, as the Gram Pradhan was also a member of the group, therefore there was an unintended link that existed between the SHG and the Panchayat.
Leadership
The Gram Pradhan of the Panchayat, Ms. Phaguni Devi, was a member of the group (but she was not present in the FGD, being away from the village on the day of the visit). Ms. Phaguni Devi is also the President of the SHG, and Ms. Ramrati is its Secretary.
Funds management
The group had a bank account, where group savings were being deposited till the group was functioning. The account was operated jointly by the President and Secretary (signatures of both were required). Decisions regarding use of funds were collectively taken, including the decision to lend to members. However, there were powerful influences in this collective decision making too, with the word of the Gram Pradhan carrying more weight. It came to light that within a year after formation of the group, there was an outbreak of diarrhea/dysentery in the village. The Gram Pradhan Ms. Phaguni Devi called a meeting of the group and asked them to lend her the group savings (Rs 2,500) for community service, to be returned by her later from the Panchayat fund. The money was used for the purchase of diesel for running a tractor to ferry the patients to a nearby hospital.
Group accounts and other records were maintained by the Community Organiser from PKVS (Ms. Kamla Devi).
Challenges and conflicts
As a result of the group savings being used up for community service, the group had no money left in its account when Ms. Rajrani (a member) sought a loan of Rs 500 for her daughter’s ailment (dysentery), who she later lost. Disillusioned and disheartened, she felt betrayed by the group, and therefore wanted to withdraw her savings and membership from the group. In a subsequent meeting, the savings were equally distributed among the members, and the group disbanded (11 months after its formation).
(5) Strengths and weaknesses of PKVS and its approach to community organisation
The major strengths of PKVS were identified as the following:
- Community mobilization and awareness generation on rights of Kols - Well-networked, with support from various peer groups and donor agencies (i.e.,

For Official Use Only Special Assistance for Project Formation (SAPROF) for
Uttar Pradesh Natural Resources Management and Poverty Alleviation Project (UPNRMPAP)
Final Report - Volume II Annex5-14
Oxfam, Aastha, ABSSS, PRIA, etc.), both in terms of funding as well as capacity building
- Working with local people on issues of local importance and relevance, and developing local leadership
- High levels of acceptance in the rural community
The perceived and observed weaknesses of PKVS in the context of its work in village Bandhua were identified as the following:
i) The NGO could not address appropriately the social and/or gender issues within the community – the hierarchies and strata/segmentation that exists in an apparently homogenous village community was neither recognized nor acknowledged.
ii) Collective decision-making was found to be lacking, with low levels of awareness on institution and development interventions undertaken in the village.
iii) Exclusive male and female groups were formed, with formation of the latter being very late in the process (2 years ago), without any mechanism for their interaction and coordination. The groups functioned in isolation of the others, drawing no support from each other nor learning from each other.
iv) Facilitative support, especially for the SHG, was found to be falling short of the expected role of the NGO. The NGO should have stepped in, played a more proactive role, and facilitated informed decision-making in the group on at least three occasions: firstly, when a decision was taken to lend group savings to the Gram Pradhan (e.g., it could have been explained to the group that it was prudent to retain part of the savings for emergencies of the kind that later arose); secondly, when Ms. Rajrani was in need of funds for her daughter’s treatment, the members could either have come together to lend her additional support even though there were no savings with the group, or arranged the money from other sources on an emergency basis; and thirdly, when the group decided to disband, PKVS could have mediated, explained to members that the incident was a learning and that there was a need to grow and move on after the setback. Instead, the setback caused the group to regress and disintegrate. It is believed that the SHG did not receive adequate attention or support from the organisation.
(6) Conclusions and Learning
The following conclusions and learnings are drawn from the PKVS case study and village visit:
i) While the village is located in the fringe of Wildlife Sanctuary, the NGO failed to address the issue of natural resource management. The JFM or EDC was not
For Official Use Only Special Assistance for Project Formation (SAPROF) for
Uttar Pradesh Natural Resources Management and Poverty Alleviation Project (UPNRMPAP)
Final Report - Volume II Annex5-15
known to the NGO, and no PIs which were supported by the NGO dealt with the issues of forest management, wildlife conservation or natural resource development. An NGO as a development agent should first understand the social and environmental factors of a target village to which it provide assistance.
ii) As a change agent, PKVS should work with the existing leaders, and at the same time build capacities of others in the community to take on leadership roles, and equally spread the resources available (whether it is information, training support, or representation in the village institution).
iii) An organisation having its roots in advocacy, activism and the rights-based approach may explored and entered new arenas, and take on development interventions in varied sectors, i.e., health, education and relief works. But there has to be a change in the role of the organisation without a corresponding change in its orientation.
iv) The fact that all the groups formed by the organisation are non-functional now is indicative of a problem in the process, approach and/or nature of facilitative support provided by the organisation. It is surmised that the following should be met for realization of better sustainability: better constitution, solid norms, established systems, raising interest and awareness among group members, open membership, enhancement of capacities, adequate facilitative support, ability to reconcile or resolve conflict, existence of anchor activities, clear vision, etc.
v) For the execution of development interventions, there is a need for the proactive formation of groups, based on strategically identified collective interests, which results in increasing the long term prospects of the group and its constituents.
6.2 Sarvodaya Seva Ashram (SSA) in Chitrakoot District (Karwi CD Block)
(1) Area Information and Problems Identified
SSA works in the Bundelkhand region of UP and adjoining MP. The area is similar to that
described in Section 5.1 (1) above. The problems and key issues in Bundelkhand region identified by SSA include the following:
Food insecurity Undulating, barren and rocky terrain Deforestation and lack of availability of fodder Lack of employment opportunities and resultant migration Most of the SC, ST and OBC families are poor and BPL (75% BPL), with marginal
landholdings, low productivity, soil erosion or water logging, etc. Drought and drought-like situation for 3 consecutive years Underdeveloped agriculture and limited sources of irrigation

For Official Use Only Special Assistance for Project Formation (SAPROF) for
Uttar Pradesh Natural Resources Management and Poverty Alleviation Project (UPNRMPAP)
Final Report - Volume II Annex5-16
Low literacy rates (<50% in the region; near zero literacy among the elderly and middle-aged)
Malnutrition among children High mortality rates
In addition, the team has identified the following problems in the area:
Caste-based discrimination Lack of capital and heavy dependence on money lenders (Brahmins in this case) even
for meeting the costs of basic agriculture inputs such as seed and fertilizers Absence of vocational skills
Attachment A5.6-1 provides an outline of the socio-economic situation and resource conditions in the village visited (Bhambor).
(2) SSA – History and Background Information
Sarvodaya Sewa Ashram was established in Year 1950 as part of Mr. Vinoba Bhave’s “Sarvodaya” movement, to promote the concepts of Gram Swaraj (rural independence in terms of self reliance and self-management), Bhoo-daan (donation of land to the landless), and Sarvodaya (holistic development). SSA’s initial growth was linked with the national concerns of the time – alleviation of suffering, safeguarding human rights, enhancing the socio-economic status of rural communities, particularly the poor, weak and women. SSA was formally registered in 1960 under the Societies Registration Act, 1860. Through the fervent and joint efforts of SSA and associated individuals, approximately 5,000 acres of land was distributed among the landless families in Banda district (Chitrakoot was formerly part of Banda district). In 1992/93, ‘water’ was recognized as a major issue, and subsequently interventions were taken up in the area of water conservation & harvesting and natural resource management. From 1996 onwards, the focus has also included ‘mother’, and activities and interventions in the area of health have been taken up.
The vision, mission and objectives of SSA are as follows:
Vision
“Establishment of a society in which every individual regardless of caste, creed and religion can live a life of self reliance free from poverty and fear”
Mission
“Providing opportunity and alternatives for upliftment of disadvantaged and marginalized group including women and children through improved health, information and food security to enable them to enter the mainstream of development.”
SSA has two modes of project implementation: it works either through Operating Partners
For Official Use Only Special Assistance for Project Formation (SAPROF) for
Uttar Pradesh Natural Resources Management and Poverty Alleviation Project (UPNRMPAP)
Final Report - Volume II Annex5-17
(OP), which are usually grassroots civil society organisations (CSOs) or community-based organisations (CBOs), or it implements works directly. SSA has 9 OPs; its activities through them are spread in 97 villages, and direct involvement is in 40 villages (30 in Mau Block of Chitrakoot and 10 in Baberu Block of Banda districts). Since 1993, the organisation is part of the Bundelkhand Rural Development Action Network (BARDAN), which is an association of 20 institutions working in the Bundelkhand region. It has received funding support from large-scale national NGOs as FORRAD (Foundation for Rural Recovery and Development) and Catholic Relief Services (CRS), among others.
The two main programmes being implemented by SSA include DFID’s PACS and CRS’ Watershed Development Programme (WDP) being implemented in 18 villages spread across 5 districts in UP and Madhya Pradesh. The programme focuses on poverty reduction through enhanced agricultural productivity and promotion of micro-credit.
(3) Strategy and Approach to Formation and Strengthening of PIs
The emphasis of SSA is on capacity building and empowerment, at the level of the OP and the village-level resource persons identified in the process of project implementation. The focus is on working with the poorest of the poor, through their organisation and simultaneous sensitization of the powerful. The ‘poorest’ are identified on the basis of their ownership of capital, food consumption, and access to or ownership of community assets. A baseline survey is also conducted after initial rapport building, and a report compiled for each village.
Maternal and child health through education and awareness raisin are generally the entry point activities that SSA and its OP resort to after a decision is taken to start work in a given village. The approach of the organisation upon starting work in a new village is ‘pehle seva, baadmein sandesh’ (‘service first, then message’ in English). As such, during the first year, hamlet- and habitation-level meetings are held with women and important messages conveyed. Discussions are held on issues that are of a common nature and considered non-controversial6, in an attempt to find common ground to bring all segments of the community on a single platform. During these interactions, any existing groups in the village (e.g., farmers’ groups) are also identified and built upon or supported/ strengthened.
(4) Structure, Functions and Systems of PIs
WDP was implemented in village Bhambor through Grameen Parampara Vikas Samiti
6 Controversial issues are avoided, and a message conveyed that these need to be addressed by the community itself.

For Official Use Only Special Assistance for Project Formation (SAPROF) for
Uttar Pradesh Natural Resources Management and Poverty Alleviation Project (UPNRMPAP)
Final Report - Volume II Annex5-18
(GPVS), an Operating Partner of SSA. The programme was started in 2002, and came to a premature end in 2006 because of a funds crunch, as a result of which many of the institutional interventions did not receive sustained support. There are at least four kinds of people’s institutions that have been formed and/or facilitated in the village visited (Bhambor). These are:
- One Watershed Management Committee (WMC) – at the watershed level - One Water Users Group (WUG) – for commonly held assets established under
the project - Three Self Help Groups (SHG) – for savings, microcredit and income
generating activities - One Seed Bank – group of farmers
The process of formation, structure, functions and other relevant details of the different types of PIs are discussed below.
i) Watershed Management Committee (WMC)
The WMC is spread across the Makar Nala micro-watershed within the catchment of Yamuna River, covering two villages – Bhambor and Makari. Construction of a small bridge across the river Mandakini (connecting Bhambor and Makari) was taken up as an entry point activity in this village, based on a decision taken in a village meeting7. The community members were quite enthusiastic about this activity and had contributed voluntary labour in its completion. However, the bridge has breached and been washed away by a flush flood a few years ago.
Formation
With a view to increase community participation in project planning and implementation, it was decided that a WMC would be formed in the village/s at the start of project activities. Thus, a meeting of the Gram Panchayat (covering both the project villages) was convened (in 2002), and 21 persons representing both the villages were elected as members of the WMC. The Gram Pradhan, head of the GP, was appointed/elected as the WMC Chairperson. Representation of other caste groups was ensured by election of a Brahmin as the Treasurer and an SC member as the Secretary. In order to meet the numbers requirement (having a certain percentage of women as members of the WMC), 6 women were named as members of the WMC.
Objective and roles of WMC
The primary objective of formation of the WMC was to increase community involvement
7 However, it was surmised based on observation and discussions that the major beneficiaries of this activity were a group of Brahmin farmers who had landholdings in both villages.

For Official Use Only Special Assistance for Project Formation (SAPROF) for
Uttar Pradesh Natural Resources Management and Poverty Alleviation Project (UPNRMPAP)
Final Report - Volume II Annex5-19
in project planning and implementation, so that the responsibility for assets created would be transferred to it on project closure, thus increasing chances of sustainability of benefits therefrom. Its role was to assist the NGO in identification of appropriate locations for the construction of SWC structures, and to mobilize the community to participate in meetings called by the NGO. However, the initial planning of all SWC works was done jointly by CRS and SSA, and community participation (restricted to the Gram Pradhan & a few elite in the village) was restricted to decisions such as location of wells and prioritisation of activities to be undertaken. The OP (GPVS) too had no role in the planning process.
Integration & interlinkages
The WMC was linked with the GP in the sense that they had a common leadership. There were no other linkages observed between the WMC and other village institutions.
Leadership and decision-making
The Gram Pradhan was also the WMC Chairperson and is believed to have played a prominent role in decision-making on all aspects of the WMC activities. Low literacy and awareness levels among other office bearers and WMC members, coupled with a subordinate social and economic status, meant that their participation in decisions of the committee was only of a symbolic nature. It was learnt that meetings of the WMC were not held regularly, and minutes books or proceedings register were not available for review.
Funds management
Although funds for the watershed works were under the management and control of the OP (GPVS in this case), a separate bank account for the WMC was opened, with the Secretary and the Treasurer being joint signatories. A balance of Rs 2,000 was currently held in the account. It seemed that the main source of this fund was the ‘beneficiary contribution’ received from farmers on whose fields land leveling activities were carried out. For every 100 sq ft of area leveled, the farmer was expected to deposit Rs. 2 with GPVS; this was used to meet the cost of transportation of grain/oil (payment for works carried out was made in kind) received from the donor agency (CRS), and the remainder was deposited in the WMC account. So far, the fund has never been utilized.
Challenges and conflicts
One of the major challenges faced by the organisation was that of striking a balance between serving the interests of the marginalized and gaining the goodwill of the elite. Certain trade-offs were inevitable in this regard, considering that a long-term relationship needed to be established with the village community. Thus, the location of wells, for example, was on the farm of the elite in the village, even though the water from it may be

For Official Use Only Special Assistance for Project Formation (SAPROF) for
Uttar Pradesh Natural Resources Management and Poverty Alleviation Project (UPNRMPAP)
Final Report - Volume II Annex5-20
used on adjoining marginal farmlands. It is expected that certain arrangements for long-term continuance of benefits to the adjoining farmers would have been made.
ii) Water Users Group (WUG)
Formation and leadership
After identification of the site for construction of the first of six wells to be dug in the village, a Water Users Group consisting of 11 farmers with lands adjoining the well was formed, with the owner of the land on whose farm the well was to be dug being elected President of the WUG. All the members of the group belonged to SC and OBC communities, but it was learnt that the President was economically well-off and held considerable political clout.
Objective
The WUG was formed with the primary purpose of irrigation management, and for maintenance of a common asset (well and pump set) that was created under the project.
Integration & interlinkages
Despite being part of the same village and having been formed under the same programme (WDP), the WUG and WMC shared no organisational linkages.
Funds and asset management
In addition to the cost of construction of well, Rs 86,000 was incurred in purchase and installation of the pump set. These costs were borne by the project, and payments made by the implementing agency.
A total of 16 bighas of land (approximately 4 ha) receives irrigation water from the well. For operation of the pump and irrigation of fields (e.g., deciding on the water sharing mechanism and sequencing of fields) the primary responsibility lay with the President of the WUG. It was agreed (probably decided by the implementing agency) that a fee of Rs. 25 per hour would be paid by members as contribution towards asset maintenance and operation. This was in addition to the cost of diesel for operation of the pump, and the charges were deposited with the WUG President.
Challenges and conflicts
Equity in cost and benefit-sharing is clearly an issue and a challenge in the group. Farmers whose fields were distant from the well incurred a higher cost of irrigation, and still received less water, whereas the farmer on whose land the well was situated needed lower inputs and was able to take up vegetable cultivation because of increased water availability. Further, the use of farmer contributions, the purpose thereof, or the manner in
For Official Use Only Special Assistance for Project Formation (SAPROF) for
Uttar Pradesh Natural Resources Management and Poverty Alleviation Project (UPNRMPAP)
Final Report - Volume II Annex5-21
which the decision for such contribution was taken was neither clear nor understood. How and where this fund was deposited, its accountability, transparency and other aspects of fund management remained fuzzy both to the users as well as the study team.
iii) Self Help Groups (SHGs)
Formation
Individual and small group discussions were followed by a village meeting wherein the purpose of SHG formation and its mechanism was explained to them by the Facilitator of OP (GPVS). Mandakini SHG was formed about 2-3 years ago, with 14 members (2 dropped out later). All members of the group belong to the SC community (Ramdasi caste) and were found to come from the relatively poor households. There are two other SHGs in the village – Maa Sherawali SHG and Bhuinya Baba SHG – these were constituted by the Block Development Office under SGSY scheme. FGD participants informed about the assistance and inspiration received from ‘Ambedkar Samooh’.8
Objective
Members were clear about the objective of the group and mentioned that the rationale behind formation of the group was to save money and initiate income generation activities.
Integration and inter-linkages
The SHG members were unaware of the WMC, WUG or other groups functioning in the village or facilitated by the NGO, although they knew that meetings of men were held in the village regarding the watershed activities. The FGD participants were better informed about other SHGs and their activities, although these were not formed by the NGO and little or no organisation-level interaction between them. However, some facilitative support and/or advice is also provided to the SHGs formed by the BDO.
Leadership and decision-making
Each SHG has a President and a Secretary who represent the group and are joint signatories for operation of the group’s bank account. However, members were emphatic that all decisions were taken collectively at group meetings; this was borne out by their knowledge of decisions taken and ability to recall reasons. It was also observed that grant of loan to any member is approved only after every member has agreed to it (consensus in decision-making). The relatively democratic decision-making mechanism was supported by the OP and NGO.
8 Further details of the Ambedkar Samooh were not available with the participants. It is possible that this is another SHG.
For Official Use Only Special Assistance for Project Formation (SAPROF) for
Uttar Pradesh Natural Resources Management and Poverty Alleviation Project (UPNRMPAP)
Final Report - Volume II Annex5-22
Funds management and income generation activities
Members meet on the 1st of every month and save Rs. 20 per month per person (the figure was suggested by Facilitator of OP and accepted by the group). The collected amount is usually handed over to trusted male members to be deposited in the SHG’s bank account in a local bank.
For withdrawals from the account, the office bearers visit the bank with either Facilitator or some male member. Decision on withdrawal and loaning is taken in monthly meetings on the basis of members’ expressed requirements. Records of financial transactions are entered in accounts books by the Facilitator.
Some members of Mandakini SHG have taken loans from the group for purchase of goats and enhancing incomes. Almost all group members have taken loan from the group on one occasion or another, and it was learnt that most of the loans had been taken for productive purposes as opposed to consumptive.
When two of the SHG members decided to drop out (in the initial stages), the total group savings (in bank, cash in hand and loan outstanding) were divided by the total number of members and share of the two leaving members was given to them.
Challenges and conflicts
Poor literacy among women has meant increased reliance external facilitators (mostly men) for book-keeping and maintaining minutes books. One of the other issues concerns financial integrity and is perhaps a conflict of principles that the implementing agency is faced with in linking SHGs with government schemes that can provide loans. It was learnt that one of the SHGs had received Rs 6,000 as a loan from the BDO (whereas Rs. 10,000 had been sanctioned for them); Mandakini SHG too had been sanctioned the same amount. However, as the total amount sanctioned could not be obtained by the SHG (part was retained by the provider), the implementing agency was reluctant to facilitate the linkage of this group with the BDO. This deprived the group of financial assistance and the possibility to further enhance their incomes, resulted in dissatisfaction among members and posed a dilemma for the implementing agency.
iv) Seed Bank
Formation
The Seed Bank (group) was formed in the year 2005, and consisted of 35 members (14 according to the organisation’s write-up) – formation of this group was part of WDP. Members of the group included all those who received the seed provided by the implementing agency; seed was distributed after a meeting in the village on a first-come
For Official Use Only Special Assistance for Project Formation (SAPROF) for
Uttar Pradesh Natural Resources Management and Poverty Alleviation Project (UPNRMPAP)
Final Report - Volume II Annex5-23
first-served basis.
Objective
The objective behind formation of the seed bank was to bring about an improvement in seed quality (white gram and paddy) through provision of a one-time seed input to start off the process, and sustain the same through a mechanism whereby the original input is not only replenished but also increased.
Integration and inter-linkages
Despite being part of the same village and having been formed under the same programme (WDP), the Seed Bank and WMC shared no organisational linkages.
Asset management
Seeds of white gram (a new crop) and paddy (improved crop variety) were supplied to 35 farmers in the dry and rainy seasons respectively. In the winter of 2005, white gram seed was distributed, with each farmer receiving 15 kg of seed, to be planted on one bigha of land (approximately 2,500 m2). It was agreed that upon crop harvest, each recipient farmer would return 1¼ times the seed quantity received (i.e., 18.75 kg). However, because of a poor harvest during that season, 6 farmers were unable to return any seed, and those who returned (29 farmers) managed only about 12 kg on an average. In the subsequent year (winter of 2006), 10 farmers including the 6 who had been unable to return any seed were provided seed support in the same quantity as before. It is expected that appropriate returns will be made this year (the crop was ready for harvest at the time of FGD).
Paddy seed was distributed among farmers during the rainy season of 2006, with each farmer being given 10 kg of seed for planting on one bigha of land. It was understood that this crop too was a failure and seed has not been returned. (Further details were not available).
Challenges and conflicts
Recurring drought and drought-like conditions have led to poor harvests, with the result that farmers were unable to return the seed as agreed. Although the concept of the seed bank was powerful and well-timed, it did not yield expected results.
(5) Strengths and Weaknesses of SSA and its OP (GPVS), and Their Approach to community Organizing
The major strengths and/or achievements of SSA/GPVS were identified as the following:
i) Deployment of a local facilitator who was familiar with the village and known as well as accepted by the community
For Official Use Only Special Assistance for Project Formation (SAPROF) for
Uttar Pradesh Natural Resources Management and Poverty Alleviation Project (UPNRMPAP)
Final Report - Volume II Annex5-24
ii) Expansion of cultivable and irrigated area in the village as a result of extensive watershed development activities (especially land leveling and farm bunding), and consequently a rise in agricultural production and productivity (fields of all farmers had been included for leveling and bunding activities)
iii) SHGs formed with women from SC community only, thus an attempt was being made to reach out to the more vulnerable families among the poor in the village.
iv) Women were aware of the watershed works (farm bunds, contours, etc.) that were undertaken for checking soil and water erosion, and were clear about the benefits from them. This is indicative of their involvement in the works, directly or indirectly.
v) Income augmentation activities, such as animal husbandry had been initiated by some members of the SHG, using the loan received from bank linkage (from block administration)
vi) Existing SHGs in the village, formed under the SGSY, were provided capacity building and facilitative support by the implementing agency.
The perceived and observed weaknesses of SSA/GPVS in the context of its work in village Bhambor were identified as the following:
i) The watershed / water resource development works undertaken involved engineering and technical designs / work supervision. Either SSA or GPVS did not have such technical expertise, which result in inappropriate construction of some facilities.
ii) Little or no participation of the community in planning the project interventions and related activities
iii) Participation in decision making was generally restricted to and dominated by the economically and socially powerful members of the village community; leadership and the power resulting from it remained concentrated with the existing leaders. Members of the SC community and women either did not attend WMC meetings, or did not participate in the discussions. In the case of the Seed Bank it was found that local decision-making was in fact completely absent.
iv) Use and management of funds for watershed works was not transferred to the WMC, and information on financial matters was not shared with the community, leading to low levels of awareness and ownership among members of the WMC.
v) Lack of women community workers – the SHG activities with women’s groups were being facilitated by Raja Baba, a male worker
vi) Low levels of awareness among SHG members regarding financial transactions, and lack of familiarity with minutes of meetings (which were written by the Facilitator)

For Official Use Only Special Assistance for Project Formation (SAPROF) for
Uttar Pradesh Natural Resources Management and Poverty Alleviation Project (UPNRMPAP)
Final Report - Volume II Annex5-25
(6) Conclusions and Learning
The following conclusions and learnings are drawn from the SSA/GPVS case study and village visit:
i) A support NGO or CBO should have technical expertise within the organisation and/or network and fund by which they can bring the experts to a project.
ii) The two broadly recognized approaches in the current development thinking being ‘rights-based’ and ‘asset-based’; many agencies are trying to integrate the two, with the asset-based approach being used to generate and sustain community interest and the right-based approach favoured for attaining long-term benefits through collective action, in terms of entitlements, policy changes and the like.
iii) The approach and programme design should be one of building capacities and empowering CSOs and CBOs to minimize dependence on external agencies without fostering dependence on them and effectively defeating the purpose.
iv) An agency should ensure adequate representation of women and marginalized sections of society through structural mechanisms, but this is only the first step and needs to be reinforced by functional mechanisms which enable the marginalized groups to participate in decision-making and are truly empowering.
v) Given the low levels of literacy in the area, and the fact that adult learning is more effective when based on principles of experiential learning, the technical training modules need to be simple and designed to suit the requirements and comprehension capabilities of the people’s representatives.
vi) While a trade-off between physical progress and equity seems inevitable as well as necessary, it is believed that the balance between the two needs to be carefully considered and realized.
6.3 Nighasan-South Forest Range, North Kheri Forest Division9
The UP Forest Department has been implementing the Joint Forest Management Programme since the 1990s, with the start of the WB-supported UP Forestry Project in 1997. The process of community organisation adopted by the UPFD was studied in village Ori-Purwa in North Kheri Forest Division (Kheri-Lakhimpur district), which has an award-winning JFMC supported by the UPFD and is known to desplay one of the bests example of JFM initiative in UP.
9 This NGO Case Study examined one Forest Range of UP Forest Department to compare the differences in approaches with NGOs. This PI was not supported by an NGO but UPFD only.
For Official Use Only Special Assistance for Project Formation (SAPROF) for
Uttar Pradesh Natural Resources Management and Poverty Alleviation Project (UPNRMPAP)
Final Report - Volume II Annex5-26
(1) Area Information and Problems Identified
The North Kheri Forest Division is part of the Bhabar-Terai Belt and has a relatively good forest cover. The area visited falls in the Kheri-Lakhimpur district. Among the problems identified in the area by the FD are the following:
High levels of illiteracy Poor infrastructure development – paucity of roads, schools, health facilities,
electricity supply, drainage and so forth High levels of unemployment and underemployment Low agricultural productivity and poor irrigation facilities Dependence on forests for meeting fuelwood and fodder requirements (in excess of
the resource capacity) Frequent forest fires
(2) JFM in Ori Purwa – History and Background Information
JFM activities were initiated in village Ori Purwa in the year 1999 under the WB-supported UP Forestry Project, which continued for a couple of years, after which activities were resumed under the NAP through the FDA mechanism.
During the WB-project, services of an NGO (Terai Nature Conservation Society) were engaged for community mobilization and some peripheral activities such as awareness generation.
(3) Strategy and Approach to Formation and Strengthening of People’s Institutions
The approach adopted by the Forest Range was the one specified by the project guidelines. Thus, a VFC was formed in Ori Purwa in 1999 under the guideline of UP Forestry Project, which is the UPVFJM Rules 1997 revised in 2002, and the VFC was re-constituted as a JFMC under the NAP in 2002.
Entry point activities were a major factor in drawing people’s interest in the project, as were employment opportunities provided through plantation activities. The longer-term interest of the community in forest protection and management was tapped through the benefit-sharing norms specified in the UP VFJM Rules (1997), which grant all usufruct benefits to the community and a proportion of the returns (30%) obtained from final timber harvest.
(4) Structure, Functions and Systems of PIs
Formation
The process of JFMC formation involved selection and election of representatives from all social categories in a village meeting called for the purpose by the FD official (Range

For Official Use Only Special Assistance for Project Formation (SAPROF) for
Uttar Pradesh Natural Resources Management and Poverty Alleviation Project (UPNRMPAP)
Final Report - Volume II Annex5-27
Officer). A MoU was signed between the VFC and the FD. After reconstitution under the NAP, the JFMC has been registered with the Conservator of Forests.
Based on the interview with concerned Ranger Officer, Forester, Forest Guard, there were not many activities to establish social preparedness of the village for VFC or community organizing. The village consensus on weather or not to participate in JFM was made during only one village assembly meetings without other groundwork, and VFC formation was pursued by a couple of VFC leaders and forest officers.
In principle, the JFMC members ought to be the forest dependents within a particular community to serve the purpose of JFM. However, the identification of forest dependents within the community never took place during the VFC/JFMC formation in Ori Purwa. In fact, many VFC/JFMC leaders are non-forest dependents and economically wealthier persons within the village. During the WB-funded project, an NGO was engaged in the community organizing. Based on the interview with the NGO representative during the case study, the roles and accomplishment of the NGO was unclear.
The VFC consisted of 7 members, including the local Forest Guard as a member secretary of VFC; there were no women representatives in the VFC.
The JFMC consisted of 17 members, including the local Forester as an ex-officio member and the Member-Secretary of the JFMC member secretary and 4 women members. In terms of social composition, the JFMC has 8 SC, 5 OBC and 3 Brahmin members.
Entry point activities undertaken in the village included the following:
Construction of an unpaved (kuchha) road of 4.6 km length Organisation of an Eye Camp (examination of eyes and distribution of spectacles to
the needy) – was attended by 203 persons Construction of a pond for SWC in the forest area Installation of a tin shed at the primary school in the village
Objective & role of JFMC
The objective of formation of the VFC/JFMC was to organise the village community to participate in the JFM programme, and support the UPFD in protection and regeneration of the degraded forest patches adjoining the village. The committee was/is expected to organise labour for plantation activities, ensure that the planted trees are protected from grazing and human interference, and provide support/take initiative in extinguishing any forest fires that maybe caused.
Further, the JFMC is responsible for the equitable distribution of benefits accruing from works undertaken, identify beneficiaries for distribution of specific assets/inputs provided, and manage all aspects of community organisation. It was reported that the community

For Official Use Only Special Assistance for Project Formation (SAPROF) for
Uttar Pradesh Natural Resources Management and Poverty Alleviation Project (UPNRMPAP)
Final Report - Volume II Annex5-28
has voluntarily reduced their livestock holdings by replacing low milk-yielding animals with those of superior breeds.
Integration and inter-linkages
The JFMC is a member of the Division-level Forest Development Agency, which is a federation of all JFMCs in the Division. However, this federation is only an official network, with no real linkages among institutions.
Funds, resources and asset management
The JFMC has a separate bank account, with the President and Member-Secretary being its joint signatories. The pass books (record of transactions) of the account, as well as other documents are in the custody of the Forester.
In the case of Ori-Purwa village, the micro-plan was prepared only by the Forester and JFMC Chairperson. The case study team of JBIC SAPROF reviewed carefully the micro-plan and found out that the plan was general without critical, scientific, quantitative and detailed information. The plan did not have concrete plan for natural resource management and development in the village by the JFMC.
The detailed site development plan was prepared by the Forester in his journal. The journal was prepared only by the Forester, and no other JFMC members knew the existence of such journal and site-specific plan. The site-specific plan developed by the Forester only had a sketch map of the plantation areas without appropriate maps with accurate scale and coordinates. The journal also did not have a detailed plantation design. The journal had budget plan without any explanation of the basis of such cost estimate. The budget plan was not shared with JFMC leaders and members.
There are no definite systems for the protection and management of the forest resources which the community has access to and/or derives benefits from. In the event of forest fires (reportedly 2-3 every year), all the villagers rush to the forest to put out the fire and prevent further damage to the trees. Following the protection accorded to the area, there has been a luxuriant growth of grass at plantation sites – this has been auctioned and sale proceeds from it have been used by the JFMC for development works in the village.
As part of the entry point activities, 7 sewing machines were procured by the FD for the village, to be given to groups of women (one machine for 5 women). However, women were not consulted at either the planning or the distribution stage – all decisions regarding beneficiary selection, beneficiary contribution, the operational aspects and training were taken by the men (the Chairperson and couple of others). Expectedly, the planned benefits did not materialize. Some irregularities also came to light in the use and distribution of the sewing machines. All the machines that could be accounted for remain unutilized at
For Official Use Only Special Assistance for Project Formation (SAPROF) for
Uttar Pradesh Natural Resources Management and Poverty Alleviation Project (UPNRMPAP)
Final Report - Volume II Annex5-29
present because of inadequate follow-up and support for training.
The project activities undertaken by the UPFD were able to generate a lot of interest and enthusiasm in the community, with the result that there was significant spontaneous contribution of labour inputs in the construction/expansion of the school building and construction of a tin shed for the same.
Challenges and conflicts
Since the VFC/JFMC was formed for a project-specific purpose for specific projects (WB-funded project and NAP through FDA), it has remained active only as long as the project activities were ongoing. Thereafter, the PI lapsed into dormancy. As the purpose of JFM is to ensure community participation on a sustained natural resource management (i.e., not limit it to the project duration only), it is critical to identify ways and means of keeping the JFMC functional and active beyond the project periods.
Issues of equity in cost and benefit-sharing remain unaddressed, with all households, irrespective of their economic status, making equal contribution to the VDF and completion of EPA. Differential contribution norms cannot be imposed on the community, but if these arrangements are worked out in consultation with them, then they may be more participation among the forest dependents acceptable and possible to implement.
(5) Strengths and Weaknesses of UPFD (North Kheri Forest Division) and its Approach to Community Organisation
The major strengths and/or achievements of UPFD (North Kheri Forest Division) in the context of implementation of JFM as seen in Ori Purwa were identified as the following:
i) The PI had legal sanction and received institutional support from the UPFD ii) Except the sawing machine, selected EPAs (road improvement, health camp,
pond construction and school building improvement) were based on the common needs of the community and were appreciated by public.
iii) As the programme is centred around a sizable ‘common use resource’ of a renewable nature, it is possible for the benefits from the project interventions to continue in the long-term, provided appropriate institutional and benefit-sharing arrangements are in place.
iv) Being a naturally regenerating resource, there is little need for large recurring costs.
The perceived and observed weaknesses of UPFD (North Kheri Forest Division) in the context of its work in village Ori Purwa were identified as the following:
i) The PI formation. Planning and project management were dominated by the forest officers and handful village leaders. No mechanism for project

For Official Use Only Special Assistance for Project Formation (SAPROF) for
Uttar Pradesh Natural Resources Management and Poverty Alleviation Project (UPNRMPAP)
Final Report - Volume II Annex5-30
sustainability. ii) There was little or no participation of women and marginalized groups in
community decision-making, to the extent that even those decisions concerning women are taken by men.
iii) Little or no capacity building of the JFMC; one exposure trip was organised, but the areas visited were very different in terms of their resource and socio-economic conditions.
iv) Little or no awareness among members of the JFMC about the benefit-sharing mechanisms, or the policy and institutional mechanisms.
v) There was no income generation component in the project. The sawing machine could have a part of IGAs, but the machines are not utilized at all. Due to the absence of IGAs, the VFC/JFMC has no financial means to continue their forest management and development activities after the project.
(6) Conclusions and Learning
The following conclusions and learnings are drawn from the UPFD/JFM case study and village (Ori Purwa) visit:
i) Authority and responsibility vested in the JFMC remains centred on the Forester. This seems natural given that he comes from a position of power; however, it restricts the growth and capability enhancement of the JFMC Executive Members and the institution as a whole. While the advantages of having the Forester on board the JFMC need to be utilized, it is necessary for the concerned official to facilitate participative planning, project management, implementation and decision-making in the JFMC.
ii) The capability of FD’s field officers to supervise the activities of NGO on PI formation and other community works to realize the expected outcomes may be limited. The filed officers should be trained and assisted by manuals as well as experts for the supervision of NGOs.
iii) The JFM programme has a strong legal and institutional framework that lends itself well to people’s participation in resource management; however, its utility and effectiveness depend on the manner in which the programme gets implemented. Thus, the capacities of agencies engaged in project implementation need to be carefully assessed and developed for optimizing benefits from the programme.
iv) Simple representation of marginalized and/or disadvantaged sections of the community is not sufficient to ensure their participation – appropriate supportive measures and interventions need to be introduced to allow and enable meaningful participation of the marginalized groups in JFMC decision-making

For Official Use Only Special Assistance for Project Formation (SAPROF) for
Uttar Pradesh Natural Resources Management and Poverty Alleviation Project (UPNRMPAP)
Final Report - Volume II Annex5-31
6.4 UP Banvasi Seva Sansthan (UPBSS) in Kheri District (Pallia CD Block)
(1) Area information and problems identified
The area is adjacent to a National Park, surrounded by well-conserved natural Sal forest. The village has moderately dense to open and scrub forests, the terrain is mostly flat but with hilly areas. It was inhabited by tribes and other backward communities. The overall level of development in the area is low, with poor infrastructural development.
The main problems identified in the area are:
i) Poor infrastructure development, remoteness of villages and undulating terrain ii) High levels of illiteracy and low levels of awareness iii) Small and marginal landholdings; crop damage by wild herbivores iv) Restricted access to forest areas and fear of harassment/exploitation by the forest
officials v) High levels of poverty and indebtedness vi) Cross-border trafficking of women and children
(2) UPBSS – History and Background Information
UPBSS is a voluntary organisation registered under the Societies Registration Act, 1860; it came into existence in the year 1980 and was formally registered in 1983. The organisation founder-members were inspired by the philosophy, teachings and life values followed and propounded by Mr. Mahatma Gandhi and Mr. Thakkar Bapa, and the primary purpose of the organisation was to serve the tribes and accelerate the pace of development activities in its area of operation. The organisation has been under the aegis of renowned and well-respected social workers and reformers of the country, i.e., Mr. Smt Pramila Srivastava10 and Mr. Shamim A Siddiqi. The organisation received Foreign Contribution Receipt Act (FCRA) Certificate in the year 1998. UPBSS has been receiving funds from abroad and international organisations as Unicef.
The goal and objectives of the organisation are as follows:
“Social, cultural, educational and economic development of scheduled caste, scheduled tribe and other backward communities along with the destitute and disabled, and mainstream them to bring them at par with the other communities and empower them to occupy a place of equal status in society and secure their constitutional and fundamental rights.” (Translated from Hindi version, UPBSSS Annual Report 2005-06)
The major programmes and activities of the organisation during recent years have
10 Member – State Social Welfare Advisory Board
For Official Use Only Special Assistance for Project Formation (SAPROF) for
Uttar Pradesh Natural Resources Management and Poverty Alleviation Project (UPNRMPAP)
Final Report - Volume II Annex5-32
included the following:
i) Residential school for tribal girls for secondary education ii) Condensed course for women/ junior high school girls iii) Crèche for children (in the 0-5 year age group) of working mothers (usually
labourers) iv) Formation of self help groups, their strengthening and support for IGAs v) Short-stay home for women in distress vi) Cross-border (Nepal) anti-trafficking network vii) Testing of groundwater for arsenic contamination (supported by UNICEF)
The organisation is working in 6 blocks of Lakhimpur-Kheri district, and its target population consists of the Tharu tribe, SC and other deprived communities. It is affiliated and/or networked with organisations such as the Bharatiya Adimjati Sevak Sangh, Manav Seva Sansthan, Central Social Welfare Board, NABARD, and Ministry of Tribal Affairs, GoI.
The organisation employs over 100 personnel; this includes 97 full-time and 5 part-time paid staff, 8 full-time and 12 part-time volunteers.
(3) Strategy and Approach to Formation and Strengthening of People’s Institutions
The organisation starts work with women in its target villages. First contact is made with women, and meetings are held with key persons in village, followed by a meeting with the Gram Pradhan, a general meeting at the Panchayat level, and then village-level meetings.
In the village visited, it was observed that the first intervention of UPBSSS usually starts with a crèche for the children of working mothers. This enabled high acceptance of the organisation in the village, especially among the women. As part of the crèche programme, two Bal Sevikas (women in-charge of the crèche) were stationed in the village and interacting with women from poor households on a regular basis.
In the course of a year or more, the developmental and poverty-related issues in the village were identified and their causes established. Subsequently, the Bal Sevikas (known and accepted members by then) explained to women the concept and importance of savings and credit through self help groups with 20 women members. Gradually, there has been spawning of more SHGs, and near-saturation levels have been reached within a year, covering 80% of all households in the village.
After formation of the SHG, support is provided in maintaining records and accounts. Linkage with the bank is facilitated for accessing credit for IGAs as decided by the group. The organisation also organises training in entrepreneurship development, skill building

For Official Use Only Special Assistance for Project Formation (SAPROF) for
Uttar Pradesh Natural Resources Management and Poverty Alleviation Project (UPNRMPAP)
Final Report - Volume II Annex5-33
and up gradation, and liaisons with agencies such as the Khadi and Village Industries Commission (KVIC) of the Government of India for supply of raw material and marketing of finished products.
(4) Structure, Functions and Systems of PIs
There are three SHGs formed by UPBSS in village Ramnagar where the case study team visited. These are face-to-face affinity groups comprising 20 members each, including three office-bearers, i.e., President, Secretary and Treasurer, who are nominated by the group members. The office-bearers have well-defined roles and responsibilities, including maintenance of records. In groups that do not have literate members, the Bal Sevika assists with record-keeping and maintenance of accounts.
Decision-making in groups is based on consensus. Bank account is operated by the President and Treasurer, who are the joint signatories of the account. The groups have a set of written by-laws, and members were found to be well-versed with the contents of the by-laws.
Members initially took small loans from the group for mainly consumptive purposes, but gradually the reasons for borrowing have shifted to productive purposes.
(5) Strengths and Weaknesses of UPBSS and its Approach to Community Organisation
The major strengths and/or achievements of UPBSS in the context of its work in village Ramnagar were identified as the following:
i) Working with the marginalized section (women and destitute) of disadvantaged communities in remote areas and making a significant contribution to their empowerment; the organisation has been able to reach the most deprived households in poorest areas and its activities have resulted in sustained flow of benefits to the target communities.
ii) The organisation has tapped strengths and resources of organisations with complementary skills and capacities through liaisoning and networking with them – this has enhanced effectiveness of its interventions and provided the target groups with greater benefits.
iii) The savings and credit programme through SHGs and the bank linkages has been established and enabled “assetless” and marginal households to come out of the poverty trap and escape exploitation at the hands of moneylenders, who have not been seen in the village now for a long time according to the FGD participants.
iv) Economic empowerment of women has brought in its wake increased respect and dignity for women both in their families and the society. Women are still not consulted on political matters, but economic decisions in the household are taken

For Official Use Only Special Assistance for Project Formation (SAPROF) for
Uttar Pradesh Natural Resources Management and Poverty Alleviation Project (UPNRMPAP)
Final Report - Volume II Annex5-34
in consultation with women. v) The crèche programme is used as an effective entry point activity and enables
NGO facilitators to interact with the most marginalized households (where women are engaged in labour work and families have no social support mechanisms) – this makes identification of the most disadvantaged households easy and simultaneously establishes rapport with the women who leave their children at the crèche when they go to work.
The perceived and observed weaknesses of UPBSS in the context of its work in village Ramnagar were identified as the following:
i) The organisation is focused on savings and credit and IGAs but has not undertaken any resource assessment for identification of potential IGAs and opportunities for income enhancement. Although located at the periphery of the Protected Areas (Dudhwa National Part), and with the presence of an EDC in the village, there has been no attempt to identify forest-based livelihood improvement options or establish any links with the forest department/ Dudhwa National Park authorities for initiating NR-based micro-enterprises.
ii) It was felt that in working with women and children, the organisation has inadvertently marginalised the men in the village, who seemed less aware of the NGO interventions and activities.
iii) The SHG programme has strengthened and stabilized over the years, and it appears that there is scope for clustering/ federating and making significant inroads in addressing social issues and economic causes. Unfortunately, little or no effort has been made in this direction, and the organisation has remained focused on lateral expansion of its activities.
iv) It appeared that the organisation lack technical expertise in IGA, such as marketing research, business planning, product development, business management and marketing. The organisation started as an education-oriented NGO to provide education and shelter to women and children and shifted its focus to SHG formation / strengthening and IGAs. This shift is not accompanied with technical development in the new support areas.
(6) Conclusions and Learning
The following conclusions and learnings are drawn from the UPBSS case study and village (Ramnagar) visit:
i) Working on health and education issues serves can be a good and effective entry point activity for reaching the most disadvantaged groups in the village community, and women in particular because it is the pressing needs of poor

For Official Use Only Special Assistance for Project Formation (SAPROF) for
Uttar Pradesh Natural Resources Management and Poverty Alleviation Project (UPNRMPAP)
Final Report - Volume II Annex5-35
communities in UP. ii) The ‘SHG saturation approach’ is useful in effectively reaching a large majority
of the village population; while the method does not result in any immediate change, the results are encouraging and likely to sustain even in the absence of external facilitation
iii) Working with any single segment of the population – whether women or men – is not desirable as it leads to segregation and exclusion of the other segment/s.
iv) The development technical expertise within an NGO in accordance with the stages of community development is crucial for the scale-up and evolution of an organisation.
6.5 Jan Kalyan Maha Samiti (JKMS) in Fatehpur District11
(1) Area information and problems identified
Fatehpur is among the most backward districts in the state and holds a record of sorts in having high crime rates. The terrain is undulating and ravinous, in addition to a large proportion of soils being affected by sodicity. As a result, there is high soil erosion, large proportion of uncultivable wastelands and poor soil productivity. Forest cover in the district is low. The main problems identified in the area are:
Ravines, gullies and other forms of problems associated with the terrain/ geography Sodic soils (Usar lands) Low water tables and poor groundwater recharge Poor employment opportunity in the area, with members from more than 50% of the
families having to migrate for at least 5–6 months in a year; women from SC communities also migrate to neighbouring villages on a weekly-basis
(2) JKMS – History and Background Information
JKMS was established in the year 1988; it is registered under the Societies Registration Act, 1860 and has it head office at Fatehpur. The organisation works especially with the marginalised and weaker sections of the society (Dalits or untouchables), with the goal of establishing a ‘self-reliant society’.
JKMS is a social, voluntary organisation committed to the sustainable and holistic development of society. The founder-members of the organisation believe that the most marginalised, weak and destitute across all religions and sects need to be supported through participatory processes of community organisation. The stated vision of the organisation is that of “equality and sustainable development of the community.”
For Official Use Only Special Assistance for Project Formation (SAPROF) for
Uttar Pradesh Natural Resources Management and Poverty Alleviation Project (UPNRMPAP)
Final Report - Volume II Annex5-36
Mission: “To achieve the goal of a self-reliant society with people’s participation and assistance from the government and other support agencies.”
The organisation works on issues of livelihoods, land development, soil and water management, education, health, and so forth. The stated objectives of the organisation include: women’s empowerment, community health and education, livelihoods improvement and protection of human rights. JKMS has worked in the following districts of the state: Fatehpur, Allahabad, Kaushambi, Raibarelli, Kanpur, Jalaun, Varanasi, Banda and Chitrakoot, and has received funding support from UPBSN, DRDA, Mahila Kalyan Nigam, NPSS, CARE, UPSACS, SIFPSA, TCI Foundation, etc. JKMS received FCRA certification in the year 2000.
The major programmes and activities of the organisation during recent years have included the following:
Sodic Lands Reclamation Project funded by the World Bank (Fatehpur) Swashakti Project (Fatehpur) Diversified Agriculture Support Project by the World Bank (Jalaun) Rachna Programme (Fatehpur) SGSY Project (Fatehpur and Kaushambi) Swayam Siddha Project (Raibarelli) PACS Project by the DfID (Fatehpur) Ravines Stabilisation Project funded by EU (Fatehpur) Family Planning and Community Health Programme (Fatehpur) Microinsurance Project (self-initiated, all project areas) Promotion of organic agriculture (self-initiated, all project areas)
(3) Strategy and Approach to Formation and Strengthening of People’s institutions
JKMS’ strategy and approach to formation of PIs has varied across Projects, and evolved over time. Formation of three kinds of PIs was reviewed and/or discussed during the visit: Village Resource Management Committee (VRMC), Site Implementation Committee (SIC) & Water Users’ Group (WUG), and Self-Help Group (SHG). While SHGs are common across many projects, VRMCs were formed/ reconstituted under the EU-supported Ravines Stabilisation Project and SIC/ WUGs were formed under the WB-supported UP Sodic Lands Reclamation Project. In addition, JKMS has also developed and promoted the concept of “Kisan Vidyalaya” (farmer schools), aimed at peer-to-peer education through developing resource persons among farmers and providing
11 Evan though Fatehpur is not included in the project areas of UP-NRMPAP, the case study was undertaken because of the logistical reasons. Even though the office of JKMS is located at Fatehpur, its operation areas cover UP-NRMPAP project areas as Chitrakoot and Allahabad.

For Official Use Only Special Assistance for Project Formation (SAPROF) for
Uttar Pradesh Natural Resources Management and Poverty Alleviation Project (UPNRMPAP)
Final Report - Volume II Annex5-37
them some organisational support. The process of community organising for NRM-based projects is outlined in the following paragraphs.
Process of community organising
The organisation starts with preparation of a broad baseline after preliminary selection of a village. Subsequently, meetings are held with key persons and opinion leaders in the village to inform them about the project details and the processes to be adopted. After a few days of this activity, a general village meeting is organised, wherein all participants are briefed about the project, its requirements, expected benefits, outcomes and so forth. Details of the project components are shared with the community in the same meeting. Wall paintings are also used for information dissemination in the initial stages of village entry.
After the community’s expression of willingness to participate in the project, a detailed baseline is conducted, which captures socio-economic and resource details necessary for project microplanning. In the initial stages of work in the village, a group of 7-8 workers from the NGO is stationed there, which constantly interacts with the community in small and large group meetings. Using PRA exercises, games and other means of engaging the community, a complete picture of the village is finalized. Emphasis is on social and resource mapping, which form the backbone of the microplanning process. The microplanning process is proactively facilitated by NGO workers in the village.
(4) Structure, Functions and Systems of PIs
The constitution, function and systems of the NRM-PIs facilitated by JKMS (VRMC and SIC/ WUG12) are described in the following sections.
i) Village Resource Management Committee (VRMC)
VRMCs were formed in accordance with the guidelines developed by the UP Land Development Corporation under the Ravines Stabilisation Project funded by EU.
Constitution and membership
The PI for implementation of the project had a General Body (GB) and an Executive Body, the latter being known as the VRMC. The GB comprised all farmers who formed the beneficiary group and were affected by the problem of ravinous lands. Members of the GB would elect a President from among themselves for a one-year term with 2/3rd majority.
The VRMC (Executive Body) comprised 13 members, including at least 6 women,
12 It appeared that the process of formation of SHGs was not significantly different from that of other organisations visited, and hence is not described here.

For Official Use Only Special Assistance for Project Formation (SAPROF) for
Uttar Pradesh Natural Resources Management and Poverty Alleviation Project (UPNRMPAP)
Final Report - Volume II Annex5-38
selected by consensus from among the GB members at an annual convention; its term was for three years. On the day of formation of the VRMC, it was ensured that residents from all the hamlets in the village/GP participated in the meeting. Constitution of the VRMC was as follows:
President (selected from among the project beneficiaries) One Ward Members (from the G.P.)
a. General Category Member (Male/Female) One b. SC/ST Member (Male/Female) One
Women Representatives a. General Category
- Large Farmer household One - Small/Marginal Farmer household One - Landless household One
b. SC/ST Category - Large/Small/Marginal Farmer household One - Landless household Two
Large Farmer from General Category One Landless One General Farmer who has agroforestry with agriculture One Secretary (selected from among the project beneficiaries) One
In addition, each concerned department (Horticulture, Agriculture, Livestock and Forest) would nominate one representative member to VRMC, but such members would not have any voting rights. VRMC is registered under the Societies Registration Act, 1860.
Funds Management
VRMC was supposed to have a bank account in a scheduled commercial/ nationalised bank, which was to be operated jointly with the signatures of the VRMC President, Secretary and the Project Manager from the District Unit of the Project. All funds for project implementation works, as per the agreed budget, were deposited in the account of the VRMC. Withdrawal of funds from the bank was possible only when accompanied with a resolution to the effect passed by VRMC. The President and Secretary were responsible for book-keeping and accounts. Books of accounts were required to be audited by Chartered Accountants on a yearly basis.
As part of the Project design, each VRMC was supposed to receive Rs 120,000 towards asset management and for use as a ‘revolving fund’ after closure of the project. However, this did not materialize as the pre-requisites stipulated for VRMCs to receive the grant were not adequately met.
Records and Registers
Each VRMC would maintain its record of decisions and accounts, for which it would provided with a set of documents and registers:
- Membership Register
For Official Use Only Special Assistance for Project Formation (SAPROF) for
Uttar Pradesh Natural Resources Management and Poverty Alleviation Project (UPNRMPAP)
Final Report - Volume II Annex5-39
- Proceedings Register - Notifications Register - Correspondence Register - Stock Register - Income-Expenditure Register
In addition to the above-mentioned registers, VRMC was also responsible for maintaining the following documents and records:
- Record of attendance of persons engaged for project works on a daily-wage basis - Measurement Book - Vouchers of all expenses incurred and Receipts Book
Coordination and communication
The Project involved four different departments related with the issue of rural livelihoods, i.e., Horticulture, Agriculture, Livestock and Forests, and funds for different components were channelized through the respective departments. For inter-departmental coordination and better integration of interventions at the grassroots, coordination committees at the state and district level were formed and operationalised.
The district-level coordination committee was chaired by the concerned District Magistrate, with representatives from concerned departments and relevant agencies as members. Members included, in addition to the four departmental representatives, Health officials in government services, NGO representatives, Gram Pradhan from Project villages (GPs), and one representative from each VRMC. Monthly meetings of the DLCC were held for review and monitoring project progress.
At the village-level, the VRMC GB and VRMC had monthly and fortnightly meetings respectively. Date-wise calendars for the meetings were prepared and circulated to all stakeholders in advance by the NGO partner.
ii) Site Implementation Committee (SIC) and Water Users Groups (WUG)
Site Implementation Committee (SIC) is the village-level PI formed under the UP Sodic Lands Reclamation Project funded by the World Bank.
Constitution and membership
The SIC comprises all farmers with lands affected by the sodicity problem, and who are the potential project beneficiaries. The SIC has no Executive Committee; it has a Secretary who is an officer of the rank of Assistant Manager from the UP Land Development Corporation. Associated NGO Worker in the area is the Facilitator of the Committee. Two farmers (one male and one female, known as Mitra Kisan and Mahila Mitra Kisan) are selected from among the village community and groomed as potential

For Official Use Only Special Assistance for Project Formation (SAPROF) for
Uttar Pradesh Natural Resources Management and Poverty Alleviation Project (UPNRMPAP)
Final Report - Volume II Annex5-40
resource persons. The SIC is responsible for the management and maintenance of all assets created under the project.
The implementation unit for all activities in the project is the Water Users’ Group. One WUG is constituted for every 25 bighas of land (6.3 ha), and consists of farmers who are the owners of land within the demarcated 25 bighas. After area demarcation and formation of WUG, members decide the location of the well-based on terrain conditions and other considerations in a participatory manner. Members select two office-bearers (Chairperson and Secretary) from among themselves.
Funds and asset management
The funds management system in the Project is highly decentralised, with funds flowing down to the lowest PI unit (WUG) for execution of works.
There are three levels of operation in the project – farmer, WUG and village. Reclamation of sodic lands is done through establishment of proper drainage systems; this consists of field drains (to be constructed by the farmer), link drains (to be constructed by the WUG) and a main drain (constructed by the Drainage Section of Irrigation Department). For works to be implemented by the WUG (link drains and bore wells), the funds are provided directly in the WUG account, operated jointly by the Chairperson and Secretary of the concerned WUG. Books of account as required are also maintained by the WUG office bearers.
The SIC does not receive any grant from the project but generates its resources from the village. It receives beneficiary contribution in the form of seed, deposited by the farmers after crop harvest. This is sold or used on the lines of a grain bank by the SIC. The SIC is responsible for maintenance of physical assets created under the project, with the contributions it receives from beneficiary farmers. The Main drain, which is constructed by the Irrigation Department, continues to be maintained by it even after completion of the project.
(5) Strengths of JKMS and its Approach to Community Organisation
The major strengths and/or achievements of JKMS in the context of its work in village Shahnagar were identified as the following:
i) When JKMS assistance was sought under the Ravines Stabilisation Project, VRMCs had already been formed and most project works (especially plantation activities) executed. As a result, the organisation had to reconstitute the VRMC in accordance with the guidelines provided by the Project authorities. Although the task was challenging, it achieved this objective effectively and managed to sustain the momentum by bringing the village under another project umbrella.
For Official Use Only Special Assistance for Project Formation (SAPROF) for
Uttar Pradesh Natural Resources Management and Poverty Alleviation Project (UPNRMPAP)
Final Report - Volume II Annex5-41
ii) High levels of awareness and people’s participation were generated (about 70 – 80 individuals used to participate in VRMC meetings every month, including a large number of women), as a result, people can still recall details of beneficiary selection process and agenda of the meetings (the project ended in 2005). It was remarkable that women (from across the social spectrum) too participated in the discussions and felt empowered to state their differences of opinion.
iii) The institutional design is robust and the systems provide space for participation of all segments of the community; there appears to be equity in cost and benefit-sharing in principle.
The perceived and observed weaknesses of JKMS in the context of its work in village Shahnagar were identified as the following:
i) The VRMC is a registered organisation, yet it does not have any bank account. After closure of the project, and because the expected grant did not come through, it was felt unnecessary for the VRMC to open a bank account.
ii) A large portion of VRMC or the NGO workers appeared to be inadequately equipped technically and managerially and ill informed about the project management and implementation. There has been little or no attempt at planned capacity building of either the VRMC or the NGO workers (perhaps there was no provision for it in the Project)
iii) Improved quality seeds distributed among 3 farmers (at the cost of the project) in the village have not been further distributed among other farmers, although the original farmers continue to use and reap benefits from them. JKMS, as a facilitating agency, should have intervened and ensured that seed from crop harvest is distributed among other farmers in the village.
iv) Women in the meeting were particularly dissatisfied with the fact that they had had no opportunity to participate in exposure visits undertaken by the NGO at project cost; women’s exposure visits need to be planned such that they can travel together in teams of 2-3/exclusively women groups.
(6) Conclusions and Learning
The following conclusions and learnings are drawn from the JKMS case study and village (Shahnagar) visit:
i) NGO assistance in community organising should be initiated in early stages of the project
ii) Inter-departmental coordination at the grassroots (village level) may be facilitated by NGOs, with proper planning and effective communication
iii) Capacity building of both NGO workers and PIs is essential for effective

For Official Use Only Special Assistance for Project Formation (SAPROF) for
Uttar Pradesh Natural Resources Management and Poverty Alleviation Project (UPNRMPAP)
Final Report - Volume II Annex5-42
implementation of the project and sustenance of benefits iv) Training and exposure visits for women should be planned such that they can
travel together in groups v) NGOs can facilitate selection of beneficiaries in a just and equitable manner, but
this needs to be appropriately followed up for the benefits to percolate to all sections as planned.
vi) Continuity of the NGO in project villages (under other programmes/projects) is desirable for continued support, capacity building and development of the village.

For Official Use Only Special Assistance for Project Formation (SAPROF) for
Uttar Pradesh Natural Resources Management and Poverty Alleviation Project (UPNRMPAP)
Final Report - Volume II Annex5-A1
Attachment A5.5-1 Itinerary of Field Visit for NGO Case Study
Date Particulars March 19th (Monday)
5:00 p.m. Departure Lucknow 10:00 p.m. Arrival Allahabad (238 km from Lucknow) Night halt at Allahabad
March 20th (Tuesday)
7:00 a.m. Departure Allahabad 11:00 a.m. Arrival Manikpur Meeting at office of Path Kol Vikas Samiti Proceed for village Bandhua (12 km from Manikpur) 1:00 p.m. Arrival Bandhua 1:00 – 4:00 p.m. Focus Group Discussions (FGDs) at Bandhua 4:00 p.m. Depart for Karwi Night halt at Karwi
March 21st (Wednesday)
8:30 a.m. Departure Karwi FRH 9:00 a.m. Meeting with staff of Sarvodaya Seva Ashram Proceed for village Bhambor (12 km from Karwi) 10:00 a.m. Arrival Bhambor 10 a.m.-2:00 p.m. Focus Group Discussions (FGDs) at Bhambor 2:00 p.m. Departure Chitrakoot 8:00 p.m. Arrival Lucknow Night halt at Lucknow
March 22nd (Thursday)
7:30 a.m. Departure Lucknow 10:30 a.m. Arrival Lakhimpur, proceed to Nighasan (50 km from Lakhimpur) Meeting at office of Range Forest Officer, South Nighasan (Mr A K Singh) Proceed for village Ori-Purva (15 km from Nighasan) 1:00 p.m. Arrival Ori-Purva 1:00 – 4:00 p.m. Focus Group Discussions (FGDs) at Ori-Purva 4:00 p.m. Depart for Lakhimpur Night halt at Lakhimpur
March 23rd (Friday)
7:00 a.m. Departure Lakhimpur FRH 9:00 a.m. Meeting with staff of UP Banvasi Seva Sansthan 9:30 a.m. Proceed for village Ramnagar (12 km from Paliya) 10:30 a.m. Arrival Ramnagar 10:30a.m.-1:30 p.m. Focus Group Discussions (FGDs) at Ramnagar 1:30-2:30 p.m. Lunch 2:30-4:30 p.m. Further discussion/s 4:30 p.m. Departure Lakhimpur-Khiri 10:00 p.m. Arrival Lucknow
May 12-13 (Saturday- Sunday)
4:00 p.m. Departure Lucknow 9:00 p.m. Arrival Fatehpur May13 9:00 a.m.-12 p.m. Meeting with Sh B P Pandey, Jan Kalyan Maha Samiti; 2:00 p.m. Arrival Shahnagar village; meeting with VRMC, key persons and women 4:30 p.m. Arrival Araihya village; meeting with SHGs – departure Fatehpur 7:00 p.m. Departure Fatehpur 1:00 a.m. Arrival Lucknow (May 14)
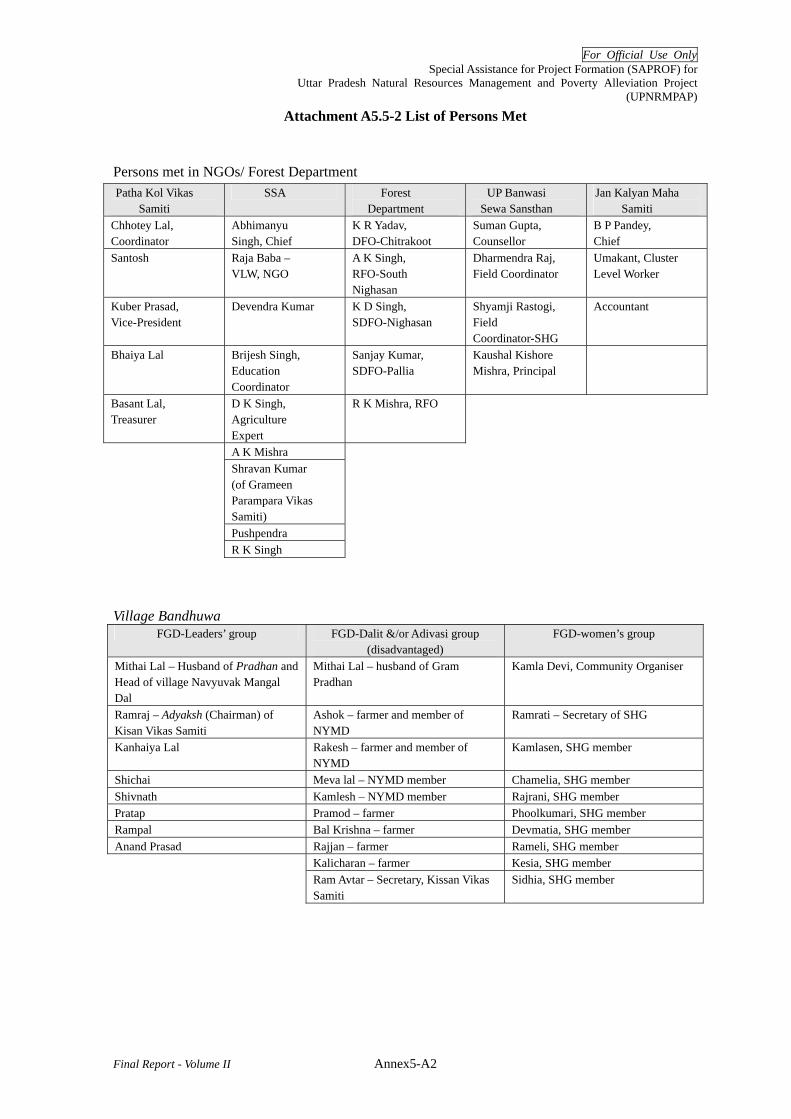
For Official Use Only Special Assistance for Project Formation (SAPROF) for
Uttar Pradesh Natural Resources Management and Poverty Alleviation Project (UPNRMPAP)
Final Report - Volume II Annex5-A2
Attachment A5.5-2 List of Persons Met
Persons met in NGOs/ Forest Department Patha Kol Vikas
Samiti SSA Forest
Department UP Banwasi
Sewa Sansthan Jan Kalyan Maha
Samiti Chhotey Lal, Coordinator
Abhimanyu Singh, Chief
K R Yadav, DFO-Chitrakoot
Suman Gupta, Counsellor
B P Pandey, Chief
Santosh Raja Baba – VLW, NGO
A K Singh, RFO-South Nighasan
Dharmendra Raj, Field Coordinator
Umakant, Cluster Level Worker
Kuber Prasad, Vice-President
Devendra Kumar K D Singh, SDFO-Nighasan
Shyamji Rastogi, Field Coordinator-SHG
Accountant
Bhaiya Lal Brijesh Singh, Education Coordinator
Sanjay Kumar, SDFO-Pallia
Kaushal Kishore Mishra, Principal
Basant Lal, Treasurer
D K Singh, Agriculture Expert
R K Mishra, RFO
A K Mishra Shravan Kumar
(of Grameen Parampara Vikas Samiti)
Pushpendra R K Singh
Village Bandhuwa FGD-Leaders’ group FGD-Dalit &/or Adivasi group
(disadvantaged) FGD-women’s group
Mithai Lal – Husband of Pradhan and Head of village Navyuvak Mangal Dal
Mithai Lal – husband of Gram Pradhan
Kamla Devi, Community Organiser
Ramraj – Adyaksh (Chairman) of Kisan Vikas Samiti
Ashok – farmer and member of NYMD
Ramrati – Secretary of SHG
Kanhaiya Lal Rakesh – farmer and member of NYMD
Kamlasen, SHG member
Shichai Meva lal – NYMD member Chamelia, SHG member Shivnath Kamlesh – NYMD member Rajrani, SHG member Pratap Pramod – farmer Phoolkumari, SHG member Rampal Bal Krishna – farmer Devmatia, SHG member Anand Prasad Rajjan – farmer Rameli, SHG member
Kalicharan – farmer Kesia, SHG member Ram Avtar – Secretary, Kissan Vikas Samiti
Sidhia, SHG member
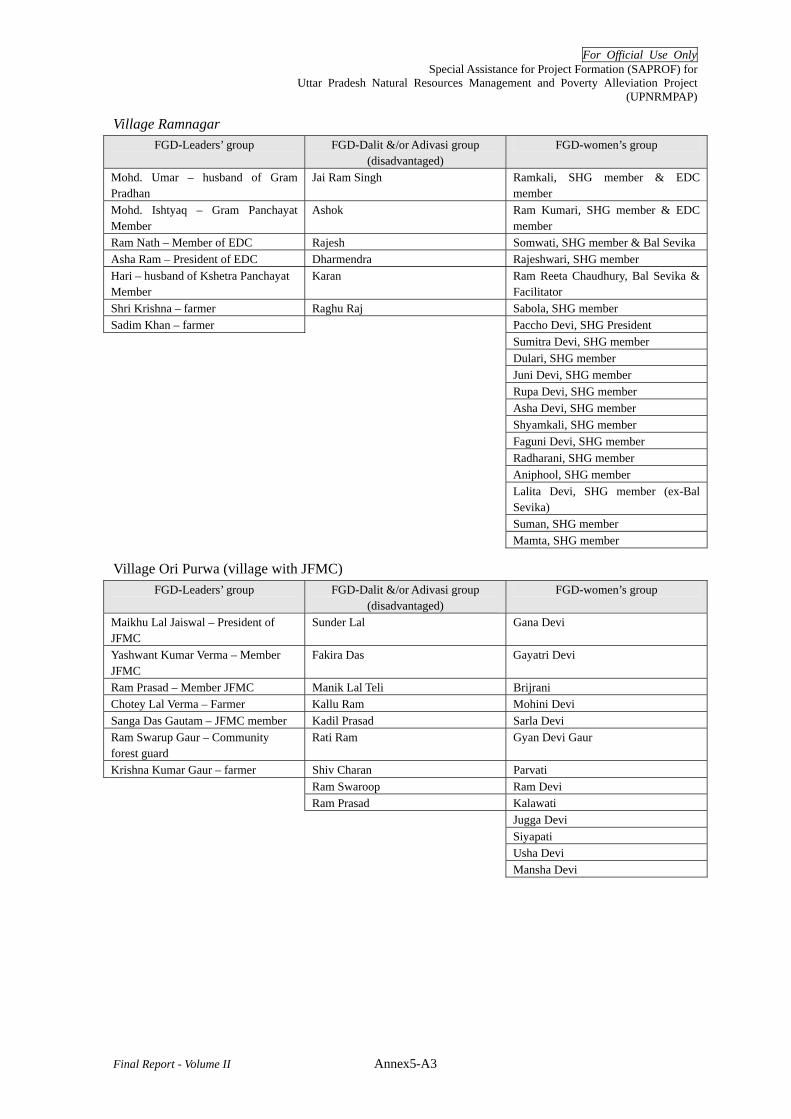
For Official Use Only Special Assistance for Project Formation (SAPROF) for
Uttar Pradesh Natural Resources Management and Poverty Alleviation Project (UPNRMPAP)
Final Report - Volume II Annex5-A3
Village Ramnagar FGD-Leaders’ group FGD-Dalit &/or Adivasi group
(disadvantaged) FGD-women’s group
Mohd. Umar – husband of Gram Pradhan
Jai Ram Singh Ramkali, SHG member & EDC member
Mohd. Ishtyaq – Gram Panchayat Member
Ashok Ram Kumari, SHG member & EDC member
Ram Nath – Member of EDC Rajesh Somwati, SHG member & Bal SevikaAsha Ram – President of EDC Dharmendra Rajeshwari, SHG member Hari – husband of Kshetra Panchayat Member
Karan Ram Reeta Chaudhury, Bal Sevika & Facilitator
Shri Krishna – farmer Raghu Raj Sabola, SHG member Sadim Khan – farmer Paccho Devi, SHG President
Sumitra Devi, SHG member Dulari, SHG member Juni Devi, SHG member Rupa Devi, SHG member Asha Devi, SHG member Shyamkali, SHG member Faguni Devi, SHG member Radharani, SHG member Aniphool, SHG member Lalita Devi, SHG member (ex-Bal Sevika) Suman, SHG member
Mamta, SHG member
Village Ori Purwa (village with JFMC) FGD-Leaders’ group FGD-Dalit &/or Adivasi group
(disadvantaged) FGD-women’s group
Maikhu Lal Jaiswal – President of JFMC
Sunder Lal Gana Devi
Yashwant Kumar Verma – Member JFMC
Fakira Das Gayatri Devi
Ram Prasad – Member JFMC Manik Lal Teli Brijrani Chotey Lal Verma – Farmer Kallu Ram Mohini Devi Sanga Das Gautam – JFMC member Kadil Prasad Sarla Devi Ram Swarup Gaur – Community forest guard
Rati Ram Gyan Devi Gaur
Krishna Kumar Gaur – farmer Shiv Charan Parvati Ram Swaroop Ram Devi Ram Prasad Kalawati
Jugga Devi Siyapati Usha Devi
Mansha Devi

For Official Use Only Special Assistance for Project Formation (SAPROF) for
Uttar Pradesh Natural Resources Management and Poverty Alleviation Project (UPNRMPAP)
Final Report - Volume II Annex5-A4
Village Bhambhor FGD-Leaders’ group FGD-Dalit &/or Adivasi group
(disadvantaged) FGD-women’s group
Triveni Prasad, Chairman – Watershed Committee
Mohan Lal – Member WUG Nathia, SHG member
Kunj Bihari Bhawani – farmer Saraswati, SHG member Shiv Gulam Puni – farmer Yashoda, SHG member Ram Snehi Ram Bahadur – farmer and also
village vendor Muratia, SHG member
Mohan Lal Ram Bhajan – Chunni, SHG member Shiv Milan Shiv Bhajan – Secretary WMC and
GP Member Dulari, SHG member
Baboo Lal – Office Bearer of Seed Bank
Laxmi Prasad – Member WUG Shailkumari, SHG member
Shiv Mohan – Office Bearer of Seed Bank
Rajwati, SHG member
Gauri Phoolkumari, SHG member Ram Milan
Raja Baba (joined later)
Village Shahnagar FGD-VRMC (Mixed group)
Men Women Mushtaq Ali – President VRMC Barida Begum – Member VRMC Munasad Ali – Member VRMC Kishwari Begum – Member VRMC Ishtiaq Ahmed – farmer Ansarun Begum Hashmatullah – Member VRMC Dhrupati – Member VRMC Majhar Ali – village resident Mohmana Begum – village resident Akila Begum – village resident
Village Adhaiya
FGD-SHGs (women’s groups) Abda Begum Baby Begum Zeenat Fatma Pinki Devi Chomda Begum Nasreen Fatma Farheen Waqar Fatma Nishat Fatma Ganga Devi Shivani Sama Parveen Shaheen Fatma Shahida Begum Ummatun Nisha Khatiya Begum Shamiun Nisha Shanti Devi Manni Baby Khaman Ratania MustikaBegum Rajra Begum Nakil Begum
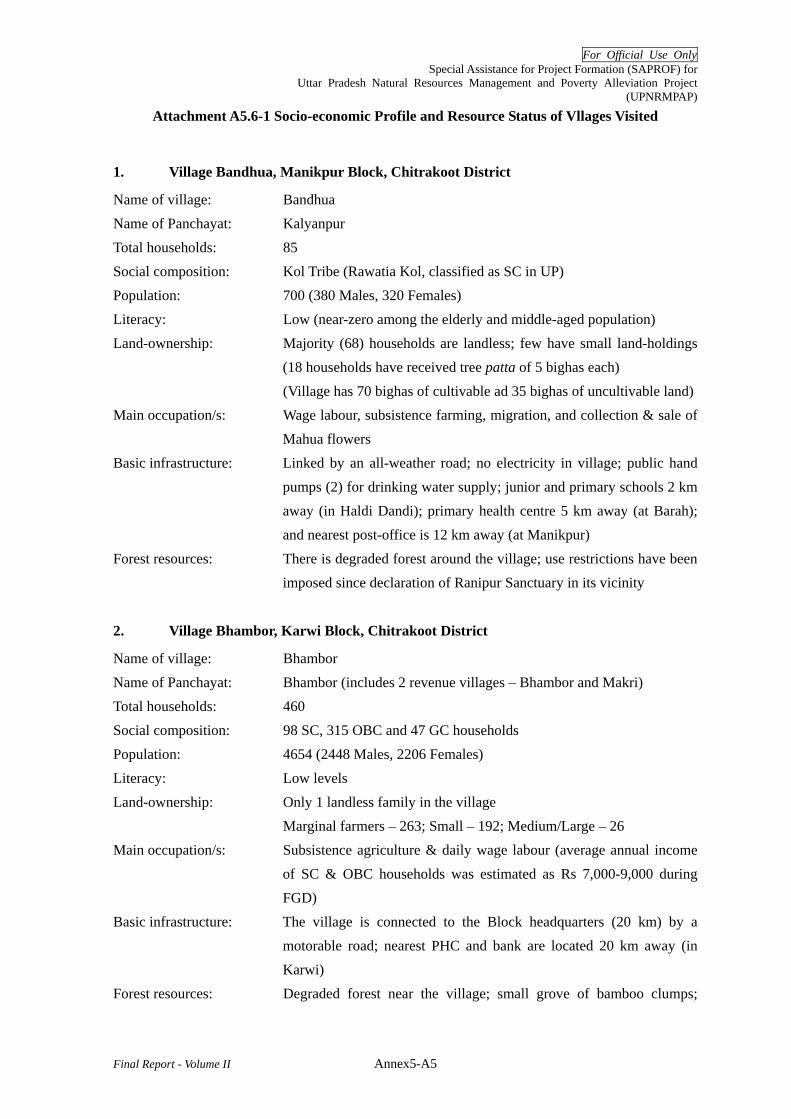
For Official Use Only Special Assistance for Project Formation (SAPROF) for
Uttar Pradesh Natural Resources Management and Poverty Alleviation Project (UPNRMPAP)
Final Report - Volume II Annex5-A5
Attachment A5.6-1 Socio-economic Profile and Resource Status of Vllages Visited
1. Village Bandhua, Manikpur Block, Chitrakoot District
Name of village: Bandhua Name of Panchayat: Kalyanpur Total households: 85 Social composition: Kol Tribe (Rawatia Kol, classified as SC in UP) Population: 700 (380 Males, 320 Females) Literacy: Low (near-zero among the elderly and middle-aged population) Land-ownership: Majority (68) households are landless; few have small land-holdings
(18 households have received tree patta of 5 bighas each) (Village has 70 bighas of cultivable ad 35 bighas of uncultivable land) Main occupation/s: Wage labour, subsistence farming, migration, and collection & sale of
Mahua flowers Basic infrastructure: Linked by an all-weather road; no electricity in village; public hand
pumps (2) for drinking water supply; junior and primary schools 2 km away (in Haldi Dandi); primary health centre 5 km away (at Barah); and nearest post-office is 12 km away (at Manikpur)
Forest resources: There is degraded forest around the village; use restrictions have been imposed since declaration of Ranipur Sanctuary in its vicinity
2. Village Bhambor, Karwi Block, Chitrakoot District
Name of village: Bhambor Name of Panchayat: Bhambor (includes 2 revenue villages – Bhambor and Makri) Total households: 460 Social composition: 98 SC, 315 OBC and 47 GC households Population: 4654 (2448 Males, 2206 Females) Literacy: Low levels Land-ownership: Only 1 landless family in the village Marginal farmers – 263; Small – 192; Medium/Large – 26 Main occupation/s: Subsistence agriculture & daily wage labour (average annual income
of SC & OBC households was estimated as Rs 7,000-9,000 during FGD)
Basic infrastructure: The village is connected to the Block headquarters (20 km) by a motorable road; nearest PHC and bank are located 20 km away (in Karwi)
Forest resources: Degraded forest near the village; small grove of bamboo clumps;
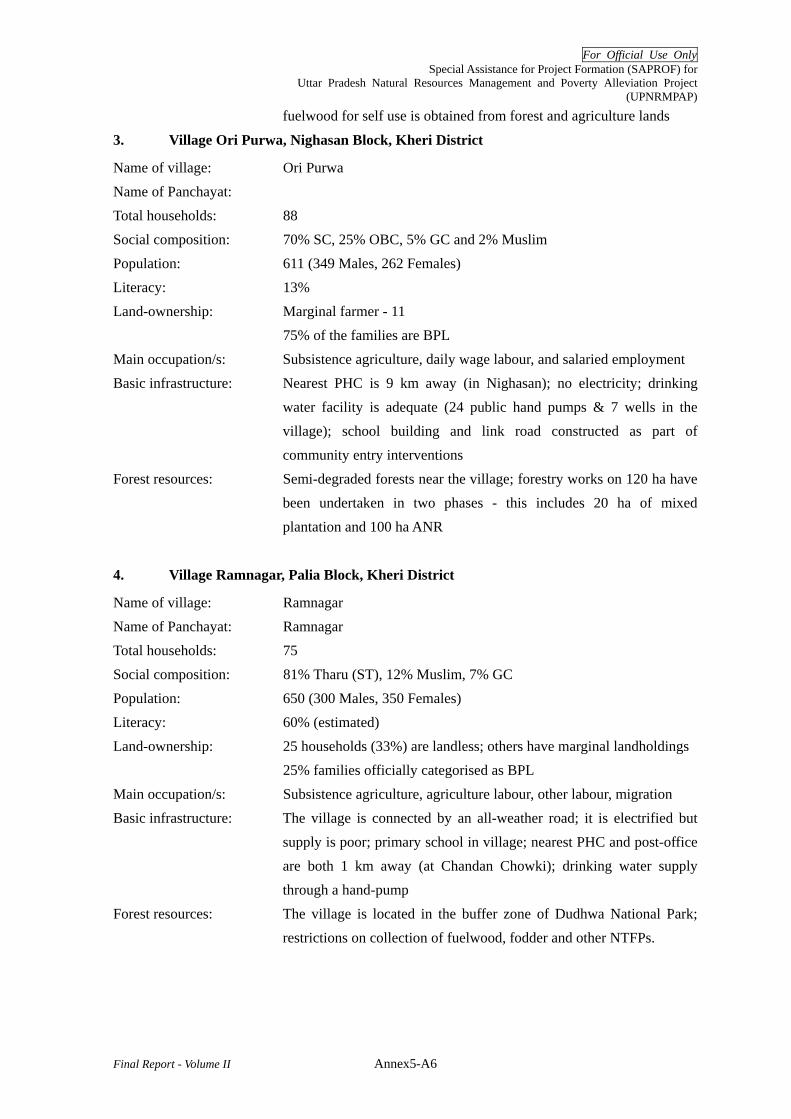
For Official Use Only Special Assistance for Project Formation (SAPROF) for
Uttar Pradesh Natural Resources Management and Poverty Alleviation Project (UPNRMPAP)
Final Report - Volume II Annex5-A6
fuelwood for self use is obtained from forest and agriculture lands
3. Village Ori Purwa, Nighasan Block, Kheri District
Name of village: Ori Purwa Name of Panchayat: Total households: 88 Social composition: 70% SC, 25% OBC, 5% GC and 2% Muslim Population: 611 (349 Males, 262 Females) Literacy: 13% Land-ownership: Marginal farmer - 11 75% of the families are BPL Main occupation/s: Subsistence agriculture, daily wage labour, and salaried employment Basic infrastructure: Nearest PHC is 9 km away (in Nighasan); no electricity; drinking
water facility is adequate (24 public hand pumps & 7 wells in the village); school building and link road constructed as part of community entry interventions
Forest resources: Semi-degraded forests near the village; forestry works on 120 ha have been undertaken in two phases - this includes 20 ha of mixed plantation and 100 ha ANR
4. Village Ramnagar, Palia Block, Kheri District
Name of village: Ramnagar Name of Panchayat: Ramnagar Total households: 75 Social composition: 81% Tharu (ST), 12% Muslim, 7% GC Population: 650 (300 Males, 350 Females) Literacy: 60% (estimated) Land-ownership: 25 households (33%) are landless; others have marginal landholdings 25% families officially categorised as BPL Main occupation/s: Subsistence agriculture, agriculture labour, other labour, migration Basic infrastructure: The village is connected by an all-weather road; it is electrified but
supply is poor; primary school in village; nearest PHC and post-office are both 1 km away (at Chandan Chowki); drinking water supply through a hand-pump
Forest resources: The village is located in the buffer zone of Dudhwa National Park; restrictions on collection of fuelwood, fodder and other NTFPs.

For Official Use Only Special Assistance for Project Formation (SAPROF) for
Uttar Pradesh Natural Resources Management and Poverty Alleviation Project (UPNRMPAP)
Final Report - Volume II Annex5-A7
5. Village Shahnagar, Dhata Block, Fatehpur District
Name of village: Shahnagar Name of Panchayat: Shahnagar Total households: 235 Social composition: 26% SC, 49% OBC, 25% GC Land ownership: Size of landholdings varies – from pattas and 2-3 bighas per farmer to
25 or more bighas per farmer; total cultivable land in the Shahnagar Gram Panchayat is 1,450 bighas (300 irrigated), and uncultivable land is 250 bighas.
Main occupation/s: Subsistence agriculture, agriculture labour, daily wage labour Basic infrastructure: The village has a primary school and an Anganwadi for children (1-6
years); there are 5 public hand pumps for drinking water supply; there is no electricity supply in the village except in Oraha hamlet;
Forest resources: Plantation along the river Yamuna (flowing near the village) was raised (100 ha or more)
Number of households by social group: Hamlet Social groups
Oraha Shahnagar Bilaha Mouhidinpur Total
SC 18 16 25 2 61Chamar 10 20 30Dhobi 5 2 7Kori 10 10Mehtar or Bhangi 3 4 7Pasi 5 2 7OBC 29 24 25 37 115Ansari or Julaha (Muslim) 9 9Bhujauwa 1 1Fakir or Shah (Muslim) 2 7 9Kevat or Mallah 7 7Lohar 3 3Mansuri or Behna (Muslim) 5 5Nai 1 1Pal 15 3 35 53Patel or Kurmi 25 2 27GC 15 40 3 1 59Pathan (Muslim) 15 40 55Pandit 3 1 4Total 62 80 53 40 235
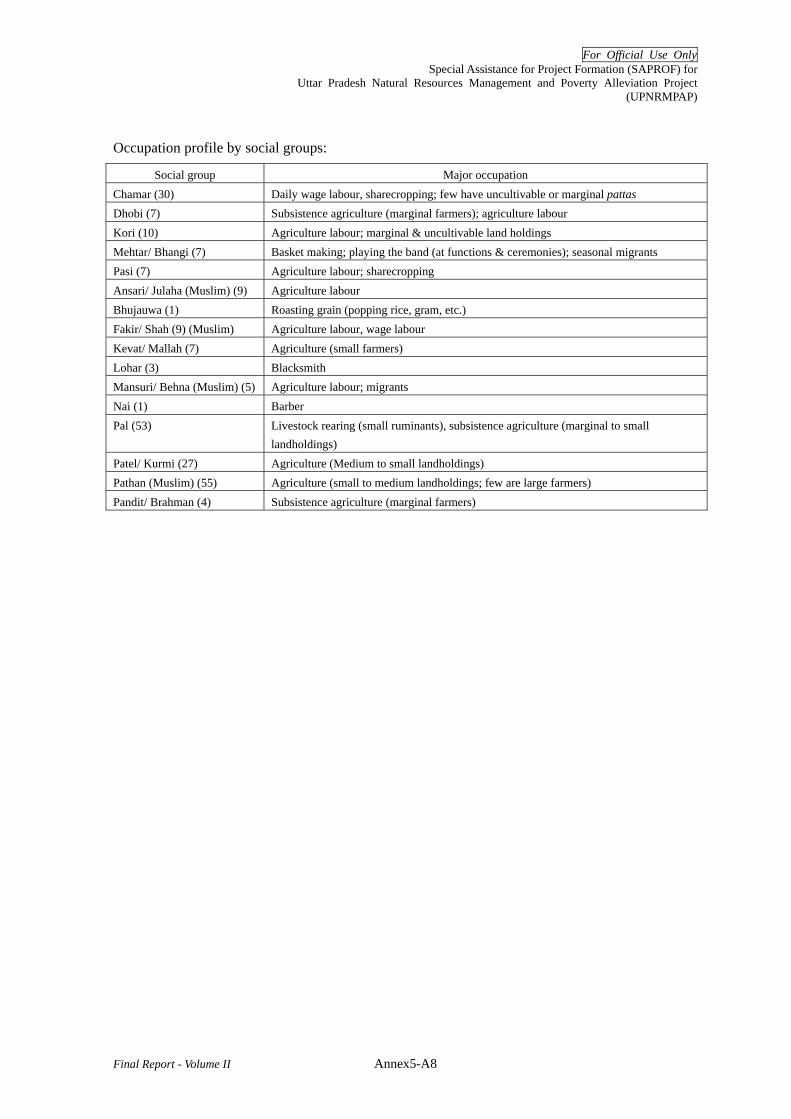
For Official Use Only Special Assistance for Project Formation (SAPROF) for
Uttar Pradesh Natural Resources Management and Poverty Alleviation Project (UPNRMPAP)
Final Report - Volume II Annex5-A8
Occupation profile by social groups:
Social group Major occupation Chamar (30) Daily wage labour, sharecropping; few have uncultivable or marginal pattas Dhobi (7) Subsistence agriculture (marginal farmers); agriculture labour Kori (10) Agriculture labour; marginal & uncultivable land holdings Mehtar/ Bhangi (7) Basket making; playing the band (at functions & ceremonies); seasonal migrants Pasi (7) Agriculture labour; sharecropping Ansari/ Julaha (Muslim) (9) Agriculture labour Bhujauwa (1) Roasting grain (popping rice, gram, etc.) Fakir/ Shah (9) (Muslim) Agriculture labour, wage labour Kevat/ Mallah (7) Agriculture (small farmers) Lohar (3) Blacksmith Mansuri/ Behna (Muslim) (5) Agriculture labour; migrants Nai (1) Barber Pal (53) Livestock rearing (small ruminants), subsistence agriculture (marginal to small
landholdings) Patel/ Kurmi (27) Agriculture (Medium to small landholdings) Pathan (Muslim) (55) Agriculture (small to medium landholdings; few are large farmers) Pandit/ Brahman (4) Subsistence agriculture (marginal farmers)
For Official Use Only Special Assistance for Project Formation (SAPROF) for
Uttar Pradesh Natural Resource Management and Poverty Alleviation Project (UPNRMPAP)
Final Report- Volume II
Special Assistance for Project Formation
for Uttar Pradesh Natural Resource Management and Poverty Alleviation Project
(UPNRMPAP)
Final Report
Volume II: ANNEXES
ANNEX-6 RESULT OF HOUSEHOLD SURVEY
For Official Use Only Special Assistance for Project Formation (SAPROF) for
Uttar Pradesh Natural Resources Management and Poverty Alleviation Project (UPNRMPAP)
Final Report-Volume II i
Special Assistance for Project Formation (SAPROF)
for
Uttar Pradesh Natural Resource Management and Poverty Alleviation Project (UPNRMPAP)
Final Report
Volume II: Annexes
ANNEX 6 HOUSEHOLD SURVEY
Table of Contents 1. Conclusions and Recommendations........................................................................... Annex 6 -1 2. Introduction ................................................................................................................ Annex 6 -1 3. Survey Methodology .................................................................................................. Annex 6 -2
3.1 Questionnaire .................................................................................................. Annex 6 -2 3.2 Sample village selection.................................................................................. Annex 6 -2 3.3 Sampling of Survey Household....................................................................... Annex 6 -3 3.4 Field testing of questionnaire .......................................................................... Annex 6 -3 3.5 Interview Survey ............................................................................................. Annex 6 -4 3.6 Data Compilation and Analysis....................................................................... Annex 6 -4 3.7 Timeframe ....................................................................................................... Annex 6 -4
4. Survey Result ............................................................................................................. Annex 6 -5 4.1 Profile of Sample Village ................................................................................ Annex 6 -5 4.2 Profile of Sample Household .......................................................................... Annex 6 -6 4.3 Primary Occupation .......................................................................................Annex 6 -11 4.4 Productive Asset............................................................................................ Annex 6 -12 4.5 Household Income ........................................................................................ Annex 6 -18 4.6 Savings and Debts ......................................................................................... Annex 6 -25
Attachments Attachment A6 3-1 Household Survey Questionnaire ............................................................Annex 6 -A1

For Official Use Only Special Assistance for Project Formation (SAPROF) for
Uttar Pradesh Natural Resources Management and Poverty Alleviation Project (UPNRMPAP)
Final Report - Volume II Annex 6-1
ANNEX 6 HOUSEHOLD SURVEY
1. Conclusions and Recommendations
While the number of samples was limited due to the restricted resources and time during JBIC SAPROF and not statistically accurate, the result of household survey suggests a number of tendencies about typical households in the likely project areas. Even though it is inconclusive, the survey result indicated that the households below poverty line (BPL) depends their household income on the sales of forest products.
The survey also indicated that the households in the villages with good forests depends their livelihood on the sales of forest products more than the households in the villages without good forests.
Since UPNRMPAP will focus on the augmentation of forest resources and enhancement of productivities of forest products, in addition to the promotion of marketing of forest products, the Project would contribute to the economic empowerment of households in the villages with good forests and BPL families.
This suggests, further, that the augmentation of forest resources and introduction of better forest management through UPNRMPAP would have positive impact on the better protection of good forests and poverty alleviation.
While the project intervention to the forestry-related activities are critical as discussed above, UPNRMPAP should promote the agriculture and other economic activities such as dairy, sale of livestock and poultry, trading and vending and skill-based work through its IGA components.
2. Introduction
During JBIC SAPROF, a household survey was carried out in selected sample villages in likely project areas to gather quantitative data of typical households in typical forest-fringe villages in UP. The data was deemed necessary for the project formation of UPNRMPAP. The household survey was executed with the following objectives:
• To collect quantitative data on household account of selected sample household • To develop basis for the calculation of incremental benefit to the beneficiary
households • To derive indicators for impact assessment
The survey was conducted in the months of March, April and May, 2007.
The survey was outsourced to a local contractor, and SAPROF Team provided the guideline and questionnaire to collect village level information. The survey team consisted of one Household Survey Specialist (15 man-day), two Supervisors (40 man-day) and number of surveyor / enumerators (80 man-day). All surveyors had previous experience of undertaking similar works.

For Official Use Only Special Assistance for Project Formation (SAPROF) for
Uttar Pradesh Natural Resources Management and Poverty Alleviation Project (UPNRMPAP)
Final Report - Volume II Annex 6-2
3. Survey Methodology
The household survey was undertaken by the following the activities:
a. Development of survey guideline and questionnaire (English and Hindi) b. Selection of sample villages and making necessary arrangements with concerned FD
officials c. Sampling of survey household d. Procurement of contractor e. Orientation for contractor f. Field testing of questionnaire g. Profiling of sample villages h. Face-to-face, individual structured interview using the questionnaire i. Checking, cleaning and editing of filled questionnaire sheets j. Entry of data k. Checking and validation of data l. Analysis and interpretation
3.1 Questionnaire
The questionnaire was developed by the SAPROF Team to cover the following items:
a. Profile of respondents and household members b. Social status / category of household c. Supplemental poverty indicators d. Productive assets held by the household e. Saving and debts f. Income from agriculture and household consumption g. Income from unprocessed forest produces and household consumption h. Income from processed forest produces and household consumption i. Income from labour works j. Income from other sources
Through the discussion with the survey contractor, the survey questionnaire was finalized in English then translated into Hindi for the actual use. The final questionnaire is given in Attachment A6.3-1.
It is important to note that the questions included in the questionnaire were limited to those which have direct relation with the calculation of IRR and project activities. The questionnaire is not comprehensive but rather purpose-specific.
3.2 Sample Village Selection
Eight villages/hamlets were selected from four (4) types shown in the table below:
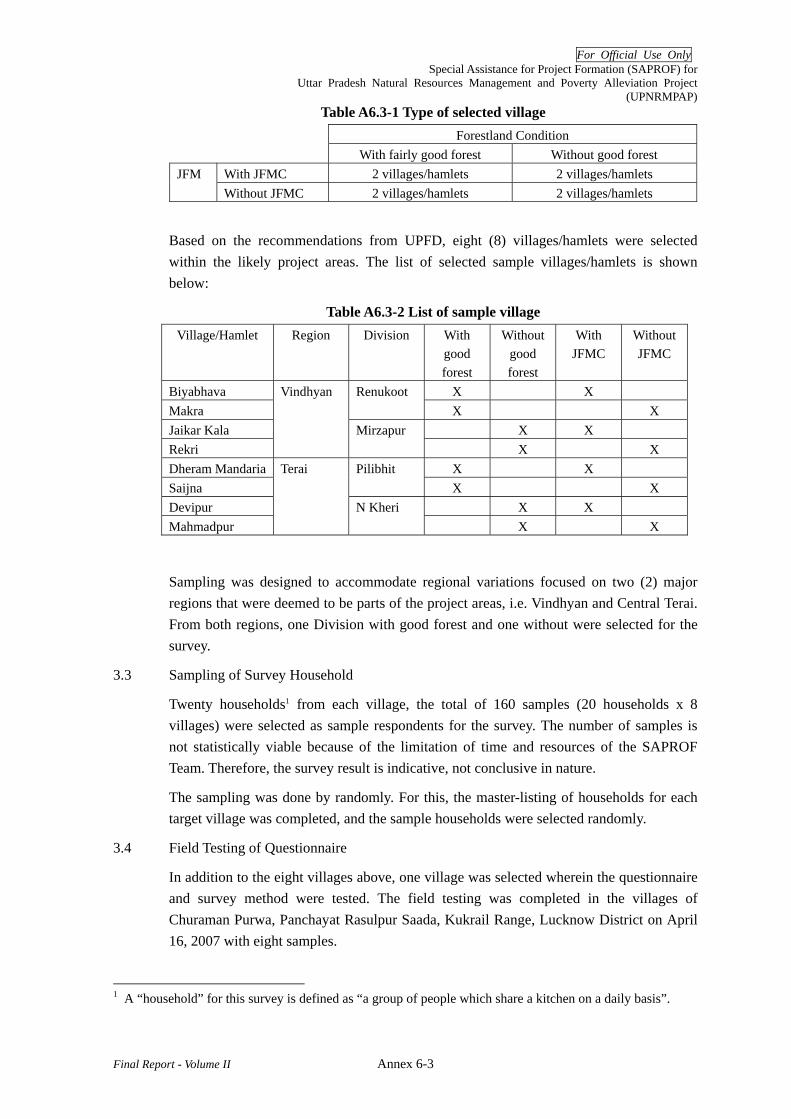
For Official Use Only Special Assistance for Project Formation (SAPROF) for
Uttar Pradesh Natural Resources Management and Poverty Alleviation Project (UPNRMPAP)
Final Report - Volume II Annex 6-3
Table A6.3-1 Type of selected village Forestland Condition With fairly good forest Without good forest
With JFMC 2 villages/hamlets 2 villages/hamlets JFM Without JFMC 2 villages/hamlets 2 villages/hamlets
Based on the recommendations from UPFD, eight (8) villages/hamlets were selected within the likely project areas. The list of selected sample villages/hamlets is shown below:
Table A6.3-2 List of sample village Village/Hamlet Region Division With
good forest
Without good forest
With JFMC
Without JFMC
Biyabhava Vindhyan Renukoot X X Makra X X Jaikar Kala Mirzapur X X Rekri X X Dheram Mandaria Terai Pilibhit X X Saijna X X Devipur N Kheri X X Mahmadpur X X
Sampling was designed to accommodate regional variations focused on two (2) major regions that were deemed to be parts of the project areas, i.e. Vindhyan and Central Terai. From both regions, one Division with good forest and one without were selected for the survey.
3.3 Sampling of Survey Household
Twenty households1 from each village, the total of 160 samples (20 households x 8 villages) were selected as sample respondents for the survey. The number of samples is not statistically viable because of the limitation of time and resources of the SAPROF Team. Therefore, the survey result is indicative, not conclusive in nature.
The sampling was done by randomly. For this, the master-listing of households for each target village was completed, and the sample households were selected randomly.
3.4 Field Testing of Questionnaire
In addition to the eight villages above, one village was selected wherein the questionnaire and survey method were tested. The field testing was completed in the villages of Churaman Purwa, Panchayat Rasulpur Saada, Kukrail Range, Lucknow District on April 16, 2007 with eight samples.
1 A “household” for this survey is defined as “a group of people which share a kitchen on a daily basis”.

For Official Use Only Special Assistance for Project Formation (SAPROF) for
Uttar Pradesh Natural Resources Management and Poverty Alleviation Project (UPNRMPAP)
Final Report - Volume II Annex 6-4
3.5 Interview Survey
The face-to-face, individual interview survey was undertaken by experienced enumerators of the survey contractor under the supervision of Supervisors and Specialist. The respondents were a member of the sample household who knew about the household the best. In order to secure the viability of survey result and process, the data collected by the enumerators were validated by the supervisor randomly in a spot-basis. The interview was done in the local language (Hindi), and one interview lasted approximately one and a half hours. The final survey result was validated by the SAPROF Team.
3.6 Data Compilation and Analysis
The collected data was compiled by the operators in a computer for analysis. The cleaning of errors was regularly done until the completion of data encoding and compilation. The compiled data was analyzed by the SAPROF Team using different formula.
3.7 Timeframe
One and a half month between the second week of April, 2007 and the end May, 2007 was the period of contract with the survey contractor. After the contract period, the SAPOROF Team analysed the data and completed the survey report. The overall schedule for the survey is shown in the figure below:
Table A6.3-3 Time frame of survey Month April May June Week 1 2 3 4 1 2 3 4 1 2 3 4
Inception meeting Target village selection
==
Arrangements with concerned PRIs
= ==
Field testing = Finalization of questionnaire
==
Selection of sample household
===
Interview survey === === Verification = = Data entry === === Verification with SAPROF Team
===
Data analysis === === === Report writing ===

For Official Use Only Special Assistance for Project Formation (SAPROF) for
Uttar Pradesh Natural Resources Management and Poverty Alleviation Project (UPNRMPAP)
Final Report - Volume II Annex 6-5
4. Survey Result
4.1 Profile of Sample Village
Apart from the individual interview survey, the basic information of the sample villages was collected. The profile of sample villages is summarised in the table below:
Table A6 4-1 Profile of sample villages Region Vindhyan Region Central-Terai Village Biyabhav
a Makra Jaiker
Kala Rekari Dheram
MandriaSaijana Devipur Mahamad
pur Hamlets 1 8 3 1 5 2 1 3 Panchayat Kuldmari Sindoor
(Makra) Jaiker Kala
Rekari Dheram Mandria
Saijana Mauthi Kheda
Bhudwara
Block Myorpur Myorpur Lalganj Rajgarh Marori Marori Mahomadi Bakeganj District Sonbhadra Sonbhadra Mirzapur Mirzapur Pilibhit Pilibhit Kheri Kheri Household 105 415 120 681 569 186 105 635Population (Total)
800 2,000 750 5,000 3,389 1,116 735 4,480
Population (Male)
430 1,100 400 2,800 1,776 599 385 2,295
Population (Female)
370 900 350 2,200 1,613 517 350 2,185
Cultivable land (ha)
105 50 113 1,000 1,400 178 153 606
Irrigated (ha)
5 10 100 998 1,350 178 153 590
Rainfed (ha)
100 40 13 2 50 0 0 5
Orchard (ha)
0 0 0 0 0 0 0 11
Uncultivable (ha)
2 5 13 19 100 2 0 55
Panchayat land (ha)
0 4 0 65 5 0 0 0
Reserved forest (ha)
250 120 450 113 1,175 16,175 1,462 1,275
Protected forest (ha)
13 0 0 0 0 0 25
Grazing land in forest (ha)
150 100 0 95 0 0 0 0
Encroached land (ha)
0 7 0 0 2 2 0 0
Irrigation source
Creek Creek+ pump, shallow tube well
Canal+ pump
Canal+ pond
Canal+ pond
Canal+ pond
Canal+ pond
Canal+ pond
Drinking Water
HP -2, Well-10
HP-20, Well-15,
HP-12, Well-6
HP-27, Well-40
HP HP HP HP-35 , Well-30
School Primary -1
Primary-2, Jr. HS (for boy)-1
None Primary-1, Jr. HS (for boy)-1
Primary-1
Primary-1, Jr. HS (for boy)-1
None Primary-1, Jr. HS (for boy)-1

For Official Use Only Special Assistance for Project Formation (SAPROF) for
Uttar Pradesh Natural Resources Management and Poverty Alleviation Project (UPNRMPAP)
Final Report - Volume II Annex 6-6
Region Vindhyan Region Central-Terai Village Biyabhav
a Makra Jaiker
Kala Rekari Dheram
MandriaSaijana Devipur Mahamad
pur Health Centres
None PHC-1 None Child care center-1
None None None None
Road Mud All weather
All weather
All weather
All weather
All weather
Mud All weather
Electricity None Partially Partially Partially Mostly Mostly None Mostly Presence of NGO
None None None None None None None None
SHG None None None None None None None 2Area planted by JFMC (ha)
50 N.A. 75 N.A. 100 N.A. 85 N.A.
4.2 Profile of Sample Household
(1) Cast Composition
For each category, 40 households were covered as shown in the table below:
Table A6.4-2 Number of sample household JFMC Without JFMC Total
Good Forest 40 40 80 Degraded Forest 40 40 80
Total 80 80 160
Of the 160 sample households, the caste categories are summarised in the table below:
Table A6.4-3 Caste-category of Sample Household Village Scheduled
Tribe (ST) Scheduled Caste (SC)
Other Backward
Caste (OBC)
General Total
Biyabhava 1 13 6 0 20Makra 0 10 9 1 20Jaikar Kala 0 17 2 1 20Rekri 0 8 12 0 20Dheram Mandaria 0 9 10 1 20Saijna 0 9 10 1 20Devipur 0 20 0 0 20Mahmadpur 0 10 10 0 20
Total 1 96 59 4 160% 1% 60% 37% 3% 100%
While the State average ratio of Scheduled Caste (SC) is 21.1%, 60% of sample households belong to SC category, which indicates the high concentration of SC in those sample villages. Further, the ratio of SC households among the sample respondents at the villages with JFMC is higher than the average. This indicates that the JFM villages

For Official Use Only Special Assistance for Project Formation (SAPROF) for
Uttar Pradesh Natural Resources Management and Poverty Alleviation Project (UPNRMPAP)
Final Report - Volume II Annex 6-7
generally have high percentages of SC population in those two regions (Vindhyan and Central Terai).
Table A6.4-4 Further Analysis of Caste-category of Sample Household Village Scheduled
Tribe (ST) Scheduled Caste (SC)
Other Backward
Caste (OBC)
General Total
1 59 18 2 80Villages with JFMC 1% 74% 23% 3% 100%
0 37 41 2 80Villages without JFMC 0% 46% 51% 3% 100%
There was no significant difference in the caste compositions among the sample households between the villages with good forest and without.
(2) Religion
Of the 160 sample households, the religious categories are summarised in the table below:
Table A6.4-5 Religious-category of Sample Household Village Hindu Muslim Sikh Total
Biyabhava 19 1 0 20Makra 20 0 0 20Jaikar Kala 20 0 0 20Rekri 20 0 0 20Dheram Mandaria 17 2 1 20Saijna 20 0 0 20Devipur 20 0 0 20Mahmadpur 13 7 0 20
Total 149 10 1 160% 93% 6% 1% 100%
It appeared that in Central-Terai region, more Muslim and Sikh households exists compare with the Vindyan region.
(3) Economic Status
In India, each household is given a “ration card” to identify its economic status under the Public Distribution System for purchase of essential commodities from government-licensed depots at subsidised rates. The explanation of each “ration card” is summarised in the table below:
Table A6.4-6 Ration Card Card Description
Yellow card A card given to a household categorised as a scheduled caste, scheduled tribe, religious minority whose economic status is above poverty line (APL).
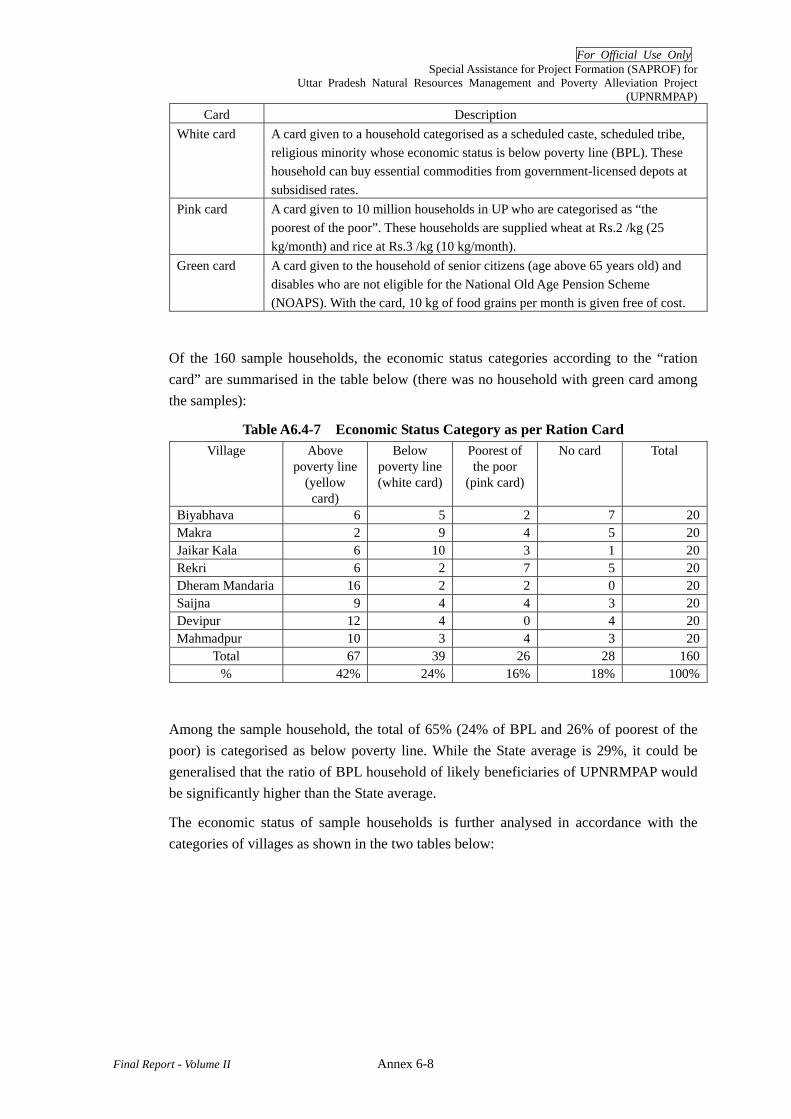
For Official Use Only Special Assistance for Project Formation (SAPROF) for
Uttar Pradesh Natural Resources Management and Poverty Alleviation Project (UPNRMPAP)
Final Report - Volume II Annex 6-8
Card Description White card A card given to a household categorised as a scheduled caste, scheduled tribe,
religious minority whose economic status is below poverty line (BPL). These household can buy essential commodities from government-licensed depots at subsidised rates.
Pink card A card given to 10 million households in UP who are categorised as “the poorest of the poor”. These households are supplied wheat at Rs.2 /kg (25 kg/month) and rice at Rs.3 /kg (10 kg/month).
Green card A card given to the household of senior citizens (age above 65 years old) and disables who are not eligible for the National Old Age Pension Scheme (NOAPS). With the card, 10 kg of food grains per month is given free of cost.
Of the 160 sample households, the economic status categories according to the “ration card” are summarised in the table below (there was no household with green card among the samples):
Table A6.4-7 Economic Status Category as per Ration Card Village Above
poverty line (yellow card)
Below poverty line (white card)
Poorest of the poor
(pink card)
No card Total
Biyabhava 6 5 2 7 20Makra 2 9 4 5 20Jaikar Kala 6 10 3 1 20Rekri 6 2 7 5 20Dheram Mandaria 16 2 2 0 20Saijna 9 4 4 3 20Devipur 12 4 0 4 20Mahmadpur 10 3 4 3 20
Total 67 39 26 28 160% 42% 24% 16% 18% 100%
Among the sample household, the total of 65% (24% of BPL and 26% of poorest of the poor) is categorised as below poverty line. While the State average is 29%, it could be generalised that the ratio of BPL household of likely beneficiaries of UPNRMPAP would be significantly higher than the State average.
The economic status of sample households is further analysed in accordance with the categories of villages as shown in the two tables below:
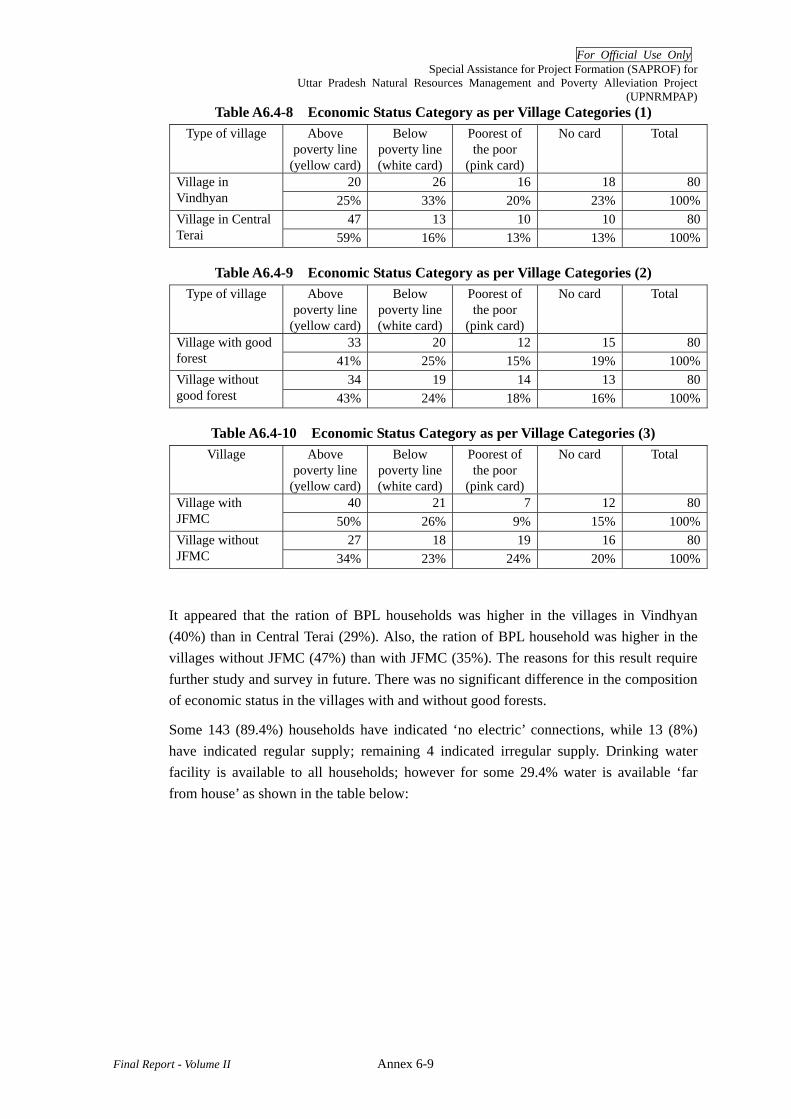
For Official Use Only Special Assistance for Project Formation (SAPROF) for
Uttar Pradesh Natural Resources Management and Poverty Alleviation Project (UPNRMPAP)
Final Report - Volume II Annex 6-9
Table A6.4-8 Economic Status Category as per Village Categories (1) Type of village Above
poverty line (yellow card)
Below poverty line (white card)
Poorest of the poor
(pink card)
No card Total
20 26 16 18 80Village in Vindhyan 25% 33% 20% 23% 100%
47 13 10 10 80Village in Central Terai 59% 16% 13% 13% 100%
Table A6.4-9 Economic Status Category as per Village Categories (2) Type of village Above
poverty line (yellow card)
Below poverty line (white card)
Poorest of the poor
(pink card)
No card Total
33 20 12 15 80Village with good forest 41% 25% 15% 19% 100%
34 19 14 13 80Village without good forest 43% 24% 18% 16% 100%
Table A6.4-10 Economic Status Category as per Village Categories (3) Village Above
poverty line (yellow card)
Below poverty line (white card)
Poorest of the poor
(pink card)
No card Total
40 21 7 12 80Village with JFMC 50% 26% 9% 15% 100%
27 18 19 16 80Village without JFMC 34% 23% 24% 20% 100%
It appeared that the ration of BPL households was higher in the villages in Vindhyan (40%) than in Central Terai (29%). Also, the ration of BPL household was higher in the villages without JFMC (47%) than with JFMC (35%). The reasons for this result require further study and survey in future. There was no significant difference in the composition of economic status in the villages with and without good forests.
Some 143 (89.4%) households have indicated ‘no electric’ connections, while 13 (8%) have indicated regular supply; remaining 4 indicated irregular supply. Drinking water facility is available to all households; however for some 29.4% water is available ‘far from house’ as shown in the table below:

For Official Use Only Special Assistance for Project Formation (SAPROF) for
Uttar Pradesh Natural Resources Management and Poverty Alleviation Project (UPNRMPAP)
Final Report - Volume II Annex 6-10
Table A6.4-11 Drinking Water Facility Drinking water facility Inside house Near house Far from house Total Biyabhava 1 6 13 20Makra 1 11 8 20Jaikar Kala 1 9 10 20Rekri 0 14 6 20
Sub-total (Vindyan) 3 40 37 80Dheram Mandaria 17 2 1 20Saijna 17 2 1 20Devipur 5 7 8 20Mahmadpur 15 5 0 20
Sub-total (Terai) 54 16 10 80Total 57 56 47 160
The villages where respondents have reported availability of drinking water facility far from house are the mostly villages in Vindyan region (Biyabhava, Makra, Jaikar Kala and Rekri) as shown in the table above. This indicates that the issue of clean water is a serious matter in Vindyan region.
(4) Household Members
The number of household members varies from one to eighteen with average family size as 6.4 (State average: 6.4, National average 5.3). The following table summarises the information of household sizes (number of household members) of sample respondents:
Table A6.4-12 Size of Household / Number of Household Members Village Average size Maximum Minimum Average
number of male
Average number of
female Biyabhava 6.1 10 4 3.3 2.8Makra 5.7 9 1 2.9 2.8Jaikar Kala 6.7 10 2 3.5 3.2Rekri 5.5 10 2 3.3 2.2Dheram Mandaria 7.4 18 4 4.1 3.3Saijna 6.6 13 3 3.6 3.0Devipur 6.0 9 2 3.3 2.7Mahmadpur 6.0 13 2 3.4 2.6
Total 6.4 18 1 3.5 2.9
The literacy information about the household members of sample households is summarised in the table below:

For Official Use Only Special Assistance for Project Formation (SAPROF) for
Uttar Pradesh Natural Resources Management and Poverty Alleviation Project (UPNRMPAP)
Final Report - Volume II Annex 6-11
Table A6.4-13 Literacy of Household Members above 6 Year Old Village Literate with formal
schooling Literate without formal
schooling Illiterate
Biyabhava 49% 0% 51%Makra 51% 0% 49%Jaikar Kala 63% 2% 35%Rekri 70% 0% 30%Dheram Mandaria 64% 2% 34%Saijna 60% 1% 39%Devipur 36% 3% 60%Mahmadpur 55% 2% 43%
Average 56% 1% 43%
The literacy rate (57%) of household members of the sample households is almost the same as the state average literacy rate is 56.3% (2001 Census). National average literacy rate is 64.8%. The analysis revealed that there is no significant difference on the literacy rate in terns of regional differences, village with /without good forest or village with/ without JFMC.
A slight correlation is observed between the literacy rate and economic status (the ration card), but it is inconclusive and weak.
4.3 Primary Occupation
Primary occupation of the household heads (breadwinner) was analyzed. Table below details the distribution of households by type of occupation.
Table A6.4-14 Primary Occupation of Household Head (breadwinner) Occupation Type Number of HH Head Percent
Farming 78 48.8% Wage Earner 54 33.8% Service 9 5.6% Small Business 5 3.1% Vendors 2 1.3% Animal Husbandry/ Dairy 1 0.6% Others 11 6.9%
Total 160 100.0%
Most of household heads has primary occupation as ‘farming’ (48.8%) or ‘wage earners’ (33.8%). Those practicing agriculture are either subsistence or traditional farmers, barring few those has mechanized farming. Similar situation is for wage earners that are largely semi-skilled or un-skilled labours. The households falling in ‘others’ category are home based worker and retired persons.

For Official Use Only Special Assistance for Project Formation (SAPROF) for
Uttar Pradesh Natural Resources Management and Poverty Alleviation Project (UPNRMPAP)
Final Report - Volume II Annex 6-12
4.4 Productive Asset
(1) Land Holding
Out of the total 160 sample households, 76 households (47.5%) occupy (own, rent-in and rent-out) more than 2 ha of agricultural land (cultivable land, orchards and fallow land), while 17 households (10.6%) do not have any agriculture land and make their living by wage labourer or pension as shown in the table below:
Table A6.4-15 Agriculture Land Holding Status Village More than 2
ha 1 ha – 2 ha Less than 1
ha No
agriculture land
Total
Biyabhava 4 10 5 1 20Makra 8 6 4 2 20Jaikar Kala 5 5 7 3 20Rekri 10 6 3 1 20Sub-total (Vindyan) 27 27 19 7 80
Dheram Mandaria 14 1 2 3 20Saijna 15 1 2 2 20Devipur 8 5 6 1 20Mahmadpur 12 1 3 4 20
Sub-total (Terai) 49 8 13 10 80Total 76 35 32 17 160
It appeared that more households occupy larger agriculture land in Central-Terai region than in Vindyan region. Further analysis revealed that the more households in the villages without JFMC occupy larger agriculture land as shown in the table below:
Table A6.4-16 Agriculture Land Holding Status per Type of Village Village More than 2
ha 1 ha – 2 ha Less than 1
ha No
agriculture land
Total
31 21 20 8 80Village with JFMC 39% 26% 25% 10% 100%
45 14 12 9 80Village without JFMC 56% 18% 15% 11% 100%
In terms of economic status, more households belong to the category of household BPL in the villages with JFMC. The finding on the sizes of agriculture land holding seemed to contradict with the previous finding. Further study is required for the rationale behind this.
(2) Crop Land
When focused on crop land (irrigated and rainfed) for privately-owned and cultivated, there is a significant difference between the Vindyan and Terai regions as shown in the table below:
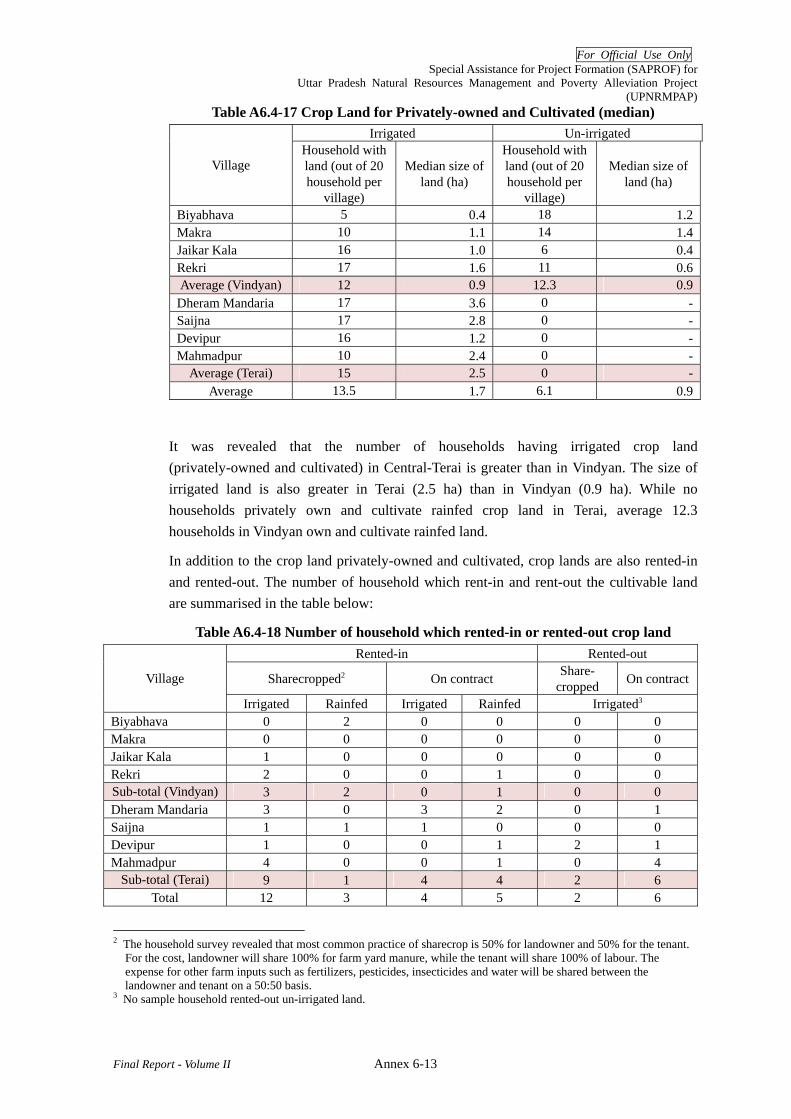
For Official Use Only Special Assistance for Project Formation (SAPROF) for
Uttar Pradesh Natural Resources Management and Poverty Alleviation Project (UPNRMPAP)
Final Report - Volume II Annex 6-13
Table A6.4-17 Crop Land for Privately-owned and Cultivated (median) Irrigated Un-irrigated
Village Household with land (out of 20 household per
village)
Median size of land (ha)
Household with land (out of 20 household per
village)
Median size of land (ha)
Biyabhava 5 0.4 18 1.2Makra 10 1.1 14 1.4Jaikar Kala 16 1.0 6 0.4Rekri 17 1.6 11 0.6Average (Vindyan) 12 0.9 12.3 0.9
Dheram Mandaria 17 3.6 0 -Saijna 17 2.8 0 -Devipur 16 1.2 0 -Mahmadpur 10 2.4 0 -
Average (Terai) 15 2.5 0 -Average 13.5 1.7 6.1 0.9
It was revealed that the number of households having irrigated crop land (privately-owned and cultivated) in Central-Terai is greater than in Vindyan. The size of irrigated land is also greater in Terai (2.5 ha) than in Vindyan (0.9 ha). While no households privately own and cultivate rainfed crop land in Terai, average 12.3 households in Vindyan own and cultivate rainfed land.
In addition to the crop land privately-owned and cultivated, crop lands are also rented-in and rented-out. The number of household which rent-in and rent-out the cultivable land are summarised in the table below:
Table A6.4-18 Number of household which rented-in or rented-out crop land Rented-in Rented-out
Sharecropped2 On contract Share- cropped On contractVillage
Irrigated Rainfed Irrigated Rainfed Irrigated3 Biyabhava 0 2 0 0 0 0 Makra 0 0 0 0 0 0 Jaikar Kala 1 0 0 0 0 0 Rekri 2 0 0 1 0 0 Sub-total (Vindyan) 3 2 0 1 0 0 Dheram Mandaria 3 0 3 2 0 1 Saijna 1 1 1 0 0 0 Devipur 1 0 0 1 2 1 Mahmadpur 4 0 0 1 0 4
Sub-total (Terai) 9 1 4 4 2 6 Total 12 3 4 5 2 6
2 The household survey revealed that most common practice of sharecrop is 50% for landowner and 50% for the tenant.
For the cost, landowner will share 100% for farm yard manure, while the tenant will share 100% of labour. The expense for other farm inputs such as fertilizers, pesticides, insecticides and water will be shared between the landowner and tenant on a 50:50 basis.
3 No sample household rented-out un-irrigated land.
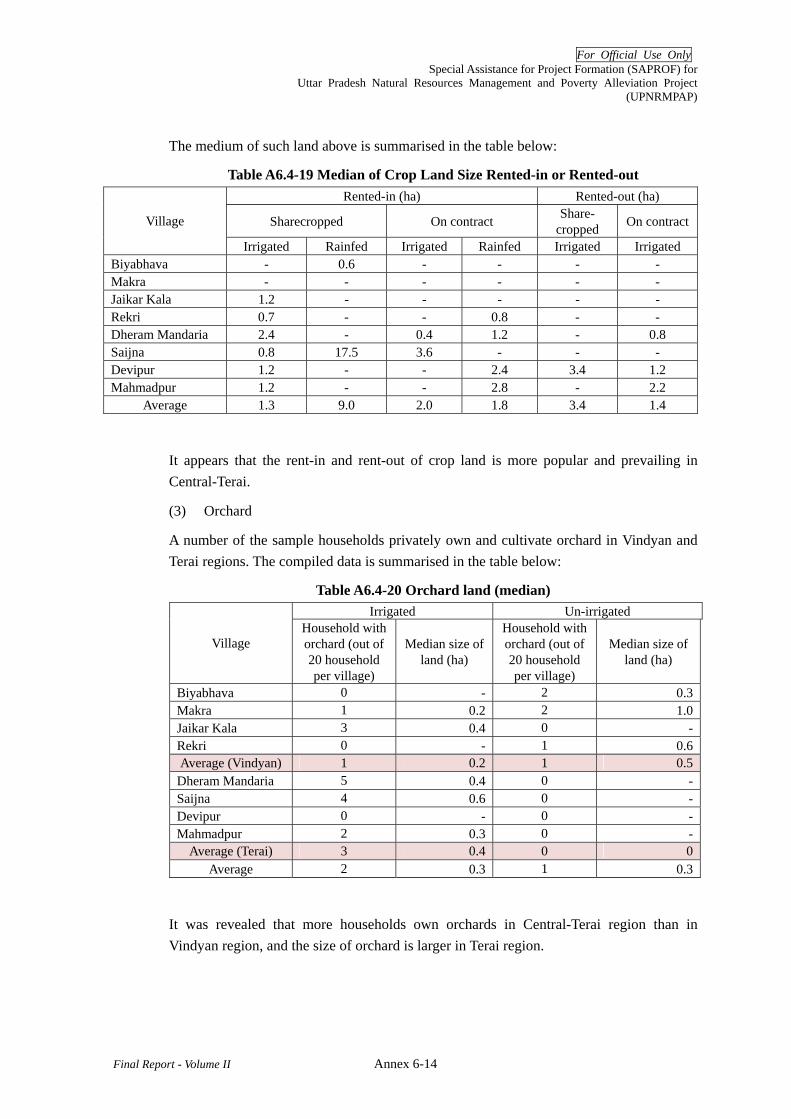
For Official Use Only Special Assistance for Project Formation (SAPROF) for
Uttar Pradesh Natural Resources Management and Poverty Alleviation Project (UPNRMPAP)
Final Report - Volume II Annex 6-14
The medium of such land above is summarised in the table below:
Table A6.4-19 Median of Crop Land Size Rented-in or Rented-out Rented-in (ha) Rented-out (ha)
Sharecropped On contract Share- cropped On contractVillage
Irrigated Rainfed Irrigated Rainfed Irrigated Irrigated Biyabhava - 0.6 - - - - Makra - - - - - - Jaikar Kala 1.2 - - - - - Rekri 0.7 - - 0.8 - - Dheram Mandaria 2.4 - 0.4 1.2 - 0.8 Saijna 0.8 17.5 3.6 - - - Devipur 1.2 - - 2.4 3.4 1.2 Mahmadpur 1.2 - - 2.8 - 2.2
Average 1.3 9.0 2.0 1.8 3.4 1.4
It appears that the rent-in and rent-out of crop land is more popular and prevailing in Central-Terai.
(3) Orchard
A number of the sample households privately own and cultivate orchard in Vindyan and Terai regions. The compiled data is summarised in the table below:
Table A6.4-20 Orchard land (median) Irrigated Un-irrigated
Village Household with orchard (out of 20 household per village)
Median size of land (ha)
Household with orchard (out of 20 household per village)
Median size of land (ha)
Biyabhava 0 - 2 0.3Makra 1 0.2 2 1.0Jaikar Kala 3 0.4 0 -Rekri 0 - 1 0.6Average (Vindyan) 1 0.2 1 0.5
Dheram Mandaria 5 0.4 0 -Saijna 4 0.6 0 -Devipur 0 - 0 -Mahmadpur 2 0.3 0 -
Average (Terai) 3 0.4 0 0Average 2 0.3 1 0.3
It was revealed that more households own orchards in Central-Terai region than in Vindyan region, and the size of orchard is larger in Terai region.

For Official Use Only Special Assistance for Project Formation (SAPROF) for
Uttar Pradesh Natural Resources Management and Poverty Alleviation Project (UPNRMPAP)
Final Report - Volume II Annex 6-15
(4) Source of irrigation water
The major sources of irrigation water for the sample households are summarised in the table below:
Table A6.4-21 Source of irrigation water Village Dug well Bore well Lift Canal
Own Others Own Others irrigation irrigation Biyabhava 1 0 0 0 4 0 Makra 0 1 3 1 5 1 Jaikar Kala 1 0 0 1 3 13 Rekri 2 0 2 0 3 15 Sub-total (Vindyan) 4 1 5 2 15 29 Dheram Mandaria 0 0 10 9 4 0 Saijna 0 0 8 6 0 11 Devipur 0 0 5 15 0 0 Mahmadpur 0 0 7 12 0 1
Sub-total (Terai) 0 0 30 42 4 12 Total 4 1 35 44 19 41
Note: Some sample households use more than one source of water.
It appeared that a bore well is a popular source of irrigation in Central-Terai, while it is rare in Vindyan. The households in Vindyan have to secure their agricultural water from the canal irrigation when exists. If there is no irrigation canal system in the village, lift irrigation from a river is an option.
(5) Agriculture Tools and Equipments
The following table summarises the number of household having key agricultural tools and equipments:
Table A6.4-22 Agricultural tool and equipments Agricultural tool/equipment Number of household Percent Bullock cart 7 4.4% Treadle/ Pedal Pump 1 0.6% Thresher 10 6.3% Diesel Pump Set/ Motor 21 13.1% Tractor 5 3.1% Cultivator 1 0.6% None 115 71.9%
Total 160 100.0%
About 72% sample households do not possess key agricultural tools or equipments. Tractor is possessed by 5 households, of which four are from the village of Rekri and Dheram Mandaria. Diesel driven pump sets are mainly available in the village of Dheram Mandaria, Devipur and Mahmadpur, all of which belong to Central-Terai region. Thresher is available with households in the village of Jaikar Kala, Rekri and Dheram Mandaria.
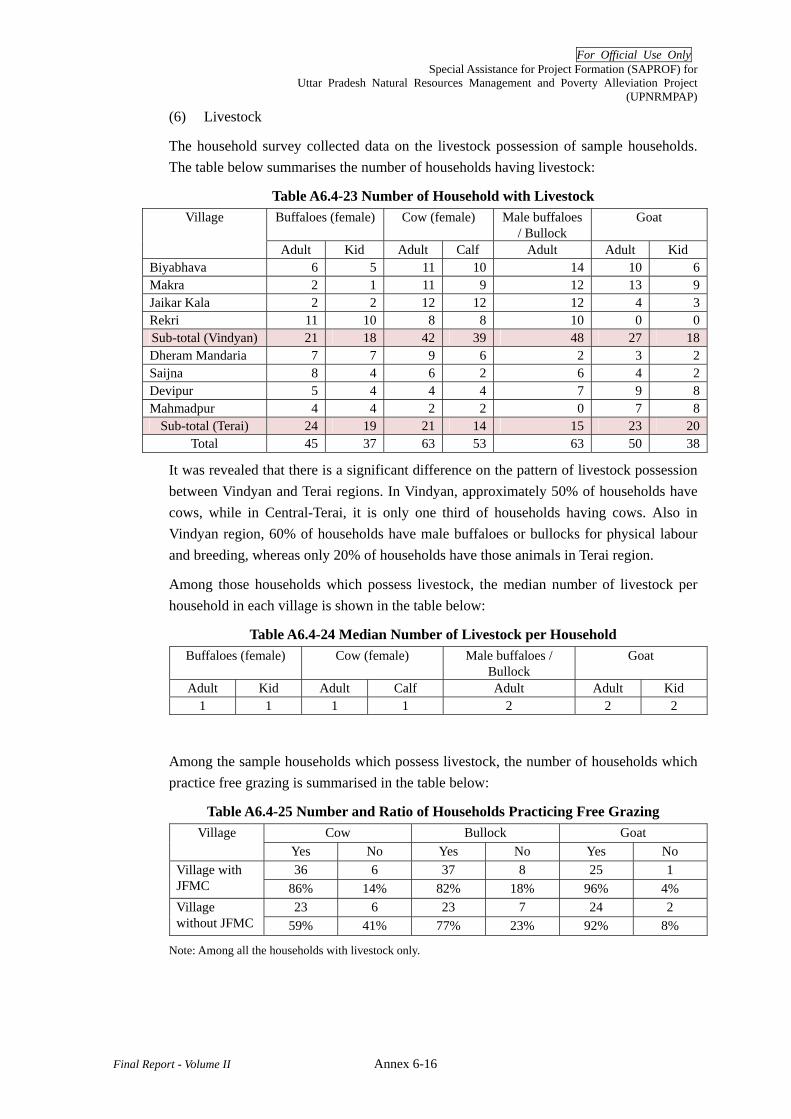
For Official Use Only Special Assistance for Project Formation (SAPROF) for
Uttar Pradesh Natural Resources Management and Poverty Alleviation Project (UPNRMPAP)
Final Report - Volume II Annex 6-16
(6) Livestock
The household survey collected data on the livestock possession of sample households. The table below summarises the number of households having livestock:
Table A6.4-23 Number of Household with Livestock Village Buffaloes (female) Cow (female) Male buffaloes
/ Bullock Goat
Adult Kid Adult Calf Adult Adult Kid Biyabhava 6 5 11 10 14 10 6Makra 2 1 11 9 12 13 9Jaikar Kala 2 2 12 12 12 4 3Rekri 11 10 8 8 10 0 0Sub-total (Vindyan) 21 18 42 39 48 27 18Dheram Mandaria 7 7 9 6 2 3 2Saijna 8 4 6 2 6 4 2Devipur 5 4 4 4 7 9 8Mahmadpur 4 4 2 2 0 7 8
Sub-total (Terai) 24 19 21 14 15 23 20Total 45 37 63 53 63 50 38
It was revealed that there is a significant difference on the pattern of livestock possession between Vindyan and Terai regions. In Vindyan, approximately 50% of households have cows, while in Central-Terai, it is only one third of households having cows. Also in Vindyan region, 60% of households have male buffaloes or bullocks for physical labour and breeding, whereas only 20% of households have those animals in Terai region.
Among those households which possess livestock, the median number of livestock per household in each village is shown in the table below:
Table A6.4-24 Median Number of Livestock per Household Buffaloes (female) Cow (female) Male buffaloes /
Bullock Goat
Adult Kid Adult Calf Adult Adult Kid 1 1 1 1 2 2 2
Among the sample households which possess livestock, the number of households which practice free grazing is summarised in the table below:
Table A6.4-25 Number and Ratio of Households Practicing Free Grazing Village Cow Bullock Goat
Yes No Yes No Yes No 36 6 37 8 25 1 Village with
JFMC 86% 14% 82% 18% 96% 4% 23 6 23 7 24 2 Village
without JFMC 59% 41% 77% 23% 92% 8%
Note: Among all the households with livestock only.

For Official Use Only Special Assistance for Project Formation (SAPROF) for
Uttar Pradesh Natural Resources Management and Poverty Alleviation Project (UPNRMPAP)
Final Report - Volume II Annex 6-17
It revealed that the free grazing is slightly more popular among the households in the villages with JFMC than without JFMC.
Table A6.4-26 Number and Ratio of Households per Type of Grazing Land Village Forest Agriculture fallow land
48 39 Village with JFMC 55% 45% 28 33 Village without JFMC
46% 54%
Note: Most households graze their animals in both forests and agriculture land.
It revealed that the more households practice their free grazing in forests in the villages with JFMC than in villages without JFMC. Though it is inconclusive, the JFM program may not have created a significant impact on the control of free grazing in UP.
(7) Willingness to Plant Trees
On being asked if the respondents are interested in planting more trees, some 90 (56.3%) have indicted their willingness. Following table depicts the trees that respondents have indicated their willingness to plant at farmland or homestead.
Table A6.4-27 Preferred Trees to be Planted Farmland Homestead land Name of
tree Willing respondents
Number of tree
Willing respondents
Number of tree
Total number of trees
Neelgiri 31 3,396 4 50 3,446Sagoun 9 695 2 10 705Sheesham 4 535 3 25 560Aam 26 272 10 52 324Mahua 4 45 3 13 58Kathal 1 25 3 19 44Neembu 1 10 6 22 32Amrood 0 0 1 5 5Badaam 1 5 0 0 5Neem 1 1 2 3 4Bakaina 0 0 1 2 2Pakar 0 0 2 2 2
There was no significant difference between the households in the villages with JFMC and without JFMC in terms of the number of households willing to plant more trees.

For Official Use Only Special Assistance for Project Formation (SAPROF) for
Uttar Pradesh Natural Resources Management and Poverty Alleviation Project (UPNRMPAP)
Final Report - Volume II Annex 6-18
4.5 Household Income
(1) Overall Household Income
During the household survey, the total income of household was estimated based on the profit of the sales of agriculture products, unprocessed forest products, processed forest products, wage labour and other income. The summary is given in the table below:
Table A6.4-28 Overall Household Income
(Unit: Rs.) Village Total Agriculture Unprocessed
forest product
Processed forest
product
Wage labour
Other income
Biyabhava 19,268 -45 6,428 40 6,500 6,345Makra 11,491 -984 7,552 841 7,484 7,034Jaikar Kala 15,238 443 86 0 7,121 3,841Rekri 8,328 -988 90 0 2,787 11,380Average (Vindyan) 14,676 -197 2,201 13 5,469 7,189Dheram Mandaria 21,927 - 208 291 9,851 4,888Saijna 13,269 482 2,571 0 7,695 5,304Devipur 16,052 -917 80 0 4,507 4,658Mahmadpur 19,560 947 0 0 10,607 8,006Average (Terai) 14,795 171 715 73 8,165 5,714Total 14,735 -13 1,458 43 6,817 6,451
Further analysis on the overall household income is shown in the tables below:
Table A6.4-29 Further Analysis of Overall Household Income (1) (Unit: Rs.)
Village Total Agriculture Unprocessed forest
product
Processed forest
product
Wage labour Other income
17,271 -250 3,515 220 7,275 6,511Village with good forest 100% -1% 20% 1% 42% 38%
14,013 -21 739 73 6,864 6,353Village without good forest 100% 0% 5% 1% 49% 45%
Table A6.4-30 Further Analysis of Overall Household Income (2) (Unit: Rs.)
Village Total Agriculture Unprocessed forest
product
Processed forest
product
Wage labour Other income
14,676 -197 2,201 13 5,469 7,189Village with JFMC 100% -1% 15% 0% 37% 49%
14,795 171 715 73 8,165 5,714Village without JFMC 100% 1% 5% 0% 55% 39%
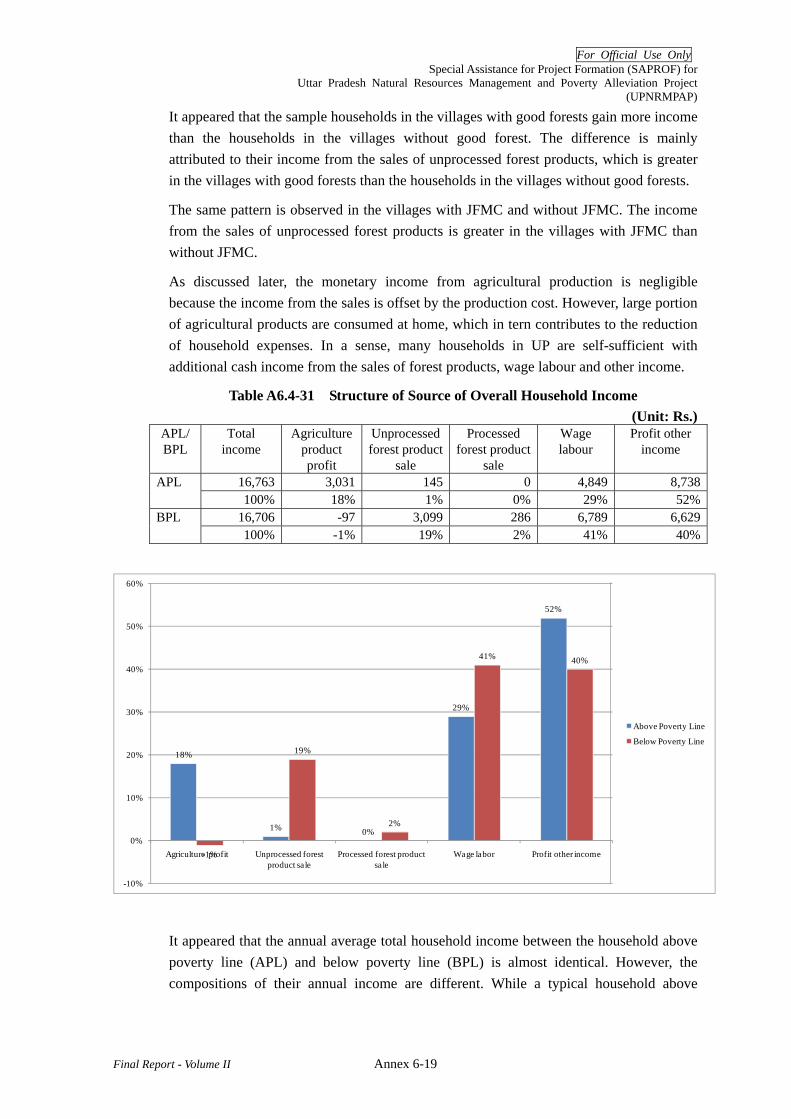
For Official Use Only Special Assistance for Project Formation (SAPROF) for
Uttar Pradesh Natural Resources Management and Poverty Alleviation Project (UPNRMPAP)
Final Report - Volume II Annex 6-19
It appeared that the sample households in the villages with good forests gain more income than the households in the villages without good forest. The difference is mainly attributed to their income from the sales of unprocessed forest products, which is greater in the villages with good forests than the households in the villages without good forests.
The same pattern is observed in the villages with JFMC and without JFMC. The income from the sales of unprocessed forest products is greater in the villages with JFMC than without JFMC.
As discussed later, the monetary income from agricultural production is negligible because the income from the sales is offset by the production cost. However, large portion of agricultural products are consumed at home, which in tern contributes to the reduction of household expenses. In a sense, many households in UP are self-sufficient with additional cash income from the sales of forest products, wage labour and other income.
Table A6.4-31 Structure of Source of Overall Household Income (Unit: Rs.)
APL/ BPL
Total income
Agriculture product profit
Unprocessed forest product
sale
Processed forest product
sale
Wage labour
Profit other income
APL 16,763 3,031 145 0 4,849 8,738 100% 18% 1% 0% 29% 52%BPL 16,706 -97 3,099 286 6,789 6,629 100% -1% 19% 2% 41% 40%
18%
1% 0%
29%
52%
-1%
19%
2%
41% 40%
-10%
0%
10%
20%
30%
40%
50%
60%
Agriculture profit Unprocessed forest product sale
Processed forest product sale
Wage labor Profit other income
Above Poverty Line
Below Poverty Line
It appeared that the annual average total household income between the household above poverty line (APL) and below poverty line (BPL) is almost identical. However, the compositions of their annual income are different. While a typical household above
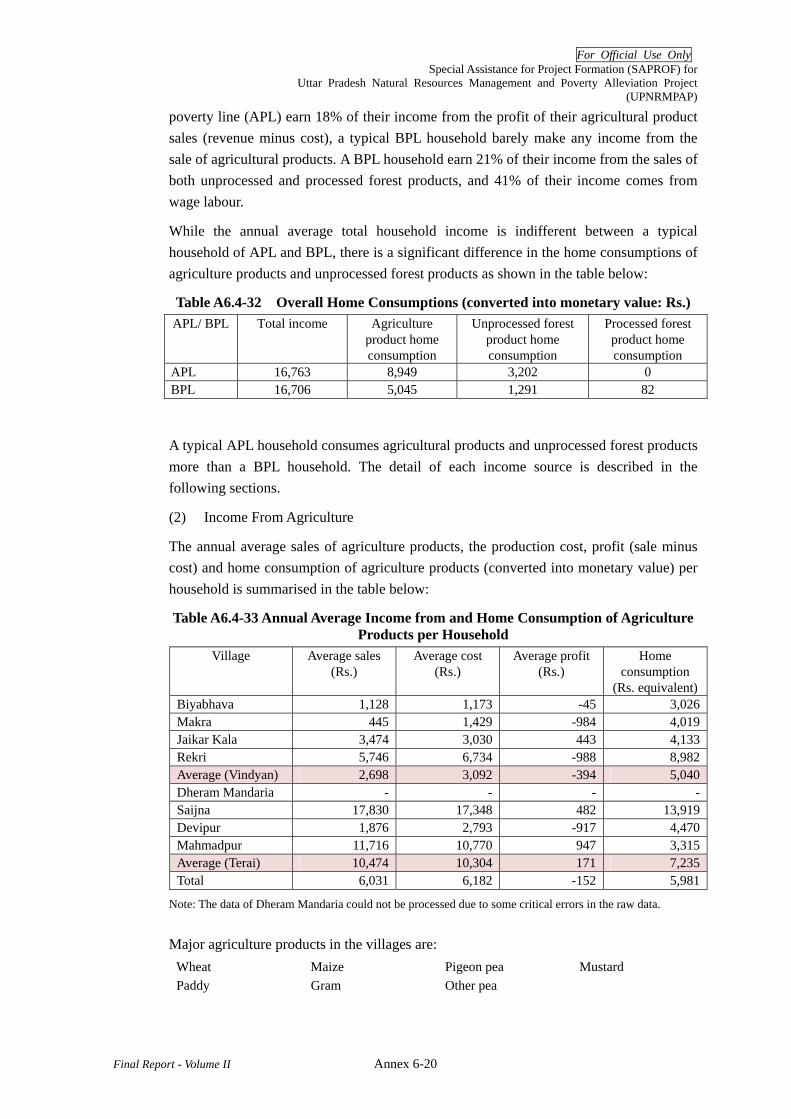
For Official Use Only Special Assistance for Project Formation (SAPROF) for
Uttar Pradesh Natural Resources Management and Poverty Alleviation Project (UPNRMPAP)
Final Report - Volume II Annex 6-20
poverty line (APL) earn 18% of their income from the profit of their agricultural product sales (revenue minus cost), a typical BPL household barely make any income from the sale of agricultural products. A BPL household earn 21% of their income from the sales of both unprocessed and processed forest products, and 41% of their income comes from wage labour.
While the annual average total household income is indifferent between a typical household of APL and BPL, there is a significant difference in the home consumptions of agriculture products and unprocessed forest products as shown in the table below:
Table A6.4-32 Overall Home Consumptions (converted into monetary value: Rs.) APL/ BPL Total income Agriculture
product home consumption
Unprocessed forest product home consumption
Processed forest product home consumption
APL 16,763 8,949 3,202 0 BPL 16,706 5,045 1,291 82
A typical APL household consumes agricultural products and unprocessed forest products more than a BPL household. The detail of each income source is described in the following sections.
(2) Income From Agriculture
The annual average sales of agriculture products, the production cost, profit (sale minus cost) and home consumption of agriculture products (converted into monetary value) per household is summarised in the table below:
Table A6.4-33 Annual Average Income from and Home Consumption of Agriculture Products per Household
Village Average sales (Rs.)
Average cost (Rs.)
Average profit (Rs.)
Home consumption
(Rs. equivalent)Biyabhava 1,128 1,173 -45 3,026Makra 445 1,429 -984 4,019Jaikar Kala 3,474 3,030 443 4,133Rekri 5,746 6,734 -988 8,982Average (Vindyan) 2,698 3,092 -394 5,040Dheram Mandaria - - - -Saijna 17,830 17,348 482 13,919Devipur 1,876 2,793 -917 4,470Mahmadpur 11,716 10,770 947 3,315Average (Terai) 10,474 10,304 171 7,235Total 6,031 6,182 -152 5,981
Note: The data of Dheram Mandaria could not be processed due to some critical errors in the raw data.
Major agriculture products in the villages are: Wheat Maize Pigeon pea Mustard Paddy Gram Other pea
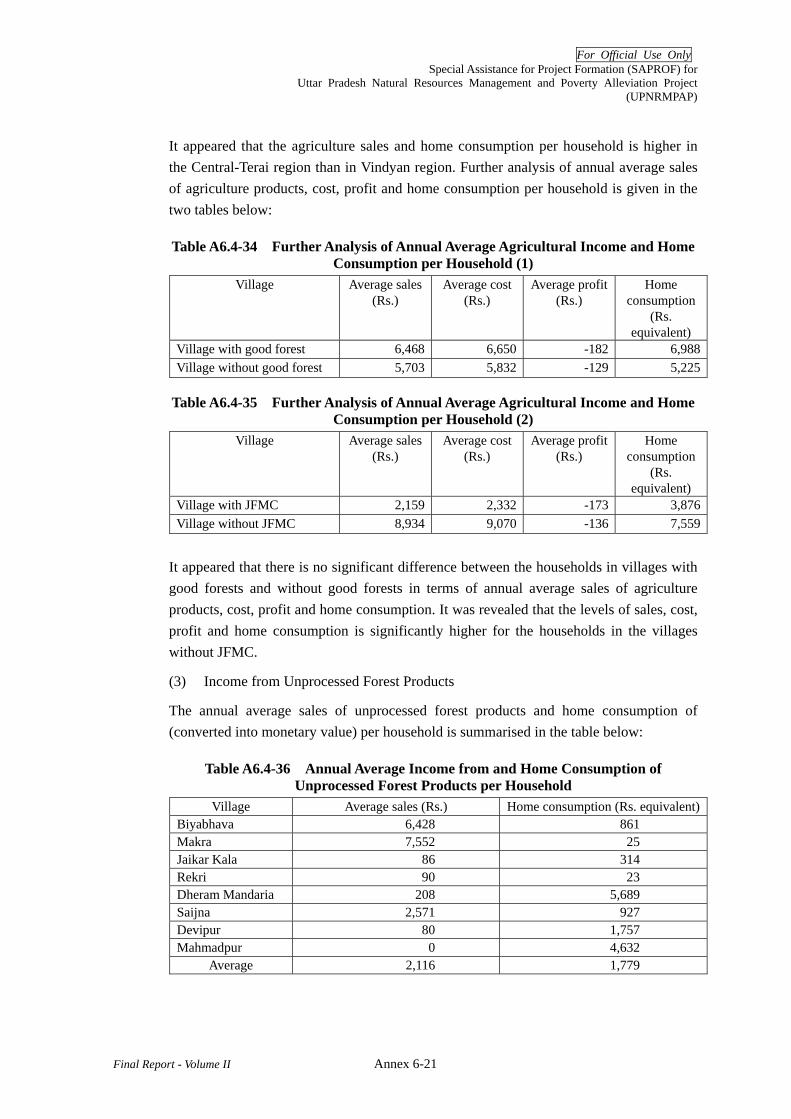
For Official Use Only Special Assistance for Project Formation (SAPROF) for
Uttar Pradesh Natural Resources Management and Poverty Alleviation Project (UPNRMPAP)
Final Report - Volume II Annex 6-21
It appeared that the agriculture sales and home consumption per household is higher in the Central-Terai region than in Vindyan region. Further analysis of annual average sales of agriculture products, cost, profit and home consumption per household is given in the two tables below:
Table A6.4-34 Further Analysis of Annual Average Agricultural Income and Home Consumption per Household (1)
Village Average sales (Rs.)
Average cost (Rs.)
Average profit (Rs.)
Home consumption
(Rs. equivalent)
Village with good forest 6,468 6,650 -182 6,988Village without good forest 5,703 5,832 -129 5,225
Table A6.4-35 Further Analysis of Annual Average Agricultural Income and Home Consumption per Household (2)
Village Average sales (Rs.)
Average cost (Rs.)
Average profit (Rs.)
Home consumption
(Rs. equivalent)
Village with JFMC 2,159 2,332 -173 3,876Village without JFMC 8,934 9,070 -136 7,559
It appeared that there is no significant difference between the households in villages with good forests and without good forests in terms of annual average sales of agriculture products, cost, profit and home consumption. It was revealed that the levels of sales, cost, profit and home consumption is significantly higher for the households in the villages without JFMC.
(3) Income from Unprocessed Forest Products
The annual average sales of unprocessed forest products and home consumption of (converted into monetary value) per household is summarised in the table below:
Table A6.4-36 Annual Average Income from and Home Consumption of Unprocessed Forest Products per Household
Village Average sales (Rs.) Home consumption (Rs. equivalent)Biyabhava 6,428 861 Makra 7,552 25 Jaikar Kala 86 314 Rekri 90 23 Dheram Mandaria 208 5,689 Saijna 2,571 927 Devipur 80 1,757 Mahmadpur 0 4,632
Average 2,116 1,779

For Official Use Only Special Assistance for Project Formation (SAPROF) for
Uttar Pradesh Natural Resources Management and Poverty Alleviation Project (UPNRMPAP)
Final Report - Volume II Annex 6-22
Major unprocessed products in the villages are: Fire wood Fodder / Thatch grass Leaves of Palash tree Small berries Tendu leaves Bamboo Buchanania Lanzan Indian wood apple Mahua flower Fruits of Aonla Mushrooms Syzigium cumini
Further analysis of annual average sales of unprocessed forest products and home consumption per household is given in the two tables below:
Table A6.4-37 Further Analysis of Annual Average Income from and Home Consumption of Unprocessed Forest Products per Household (1) Village Average sales (Rs.) Home consumption
(Rs. equivalent) Village with good forest 4,190 1,876Village without good forest 64 1,682
Table A6.4-38 Further Analysis of Annual Average Income from and Home Consumption of Unprocessed Forest Products per Household (2) Village Average sales (Rs.) Home consumption
(Rs. equivalent) Village with JFMC 1,701 2,155Village without JFMC 2,553 1,402
It appeared that the annual average sales and home consumption of unprocessed forest products per households are greater in the villages with good forests. In the case of households in the villages with and without JFMC, the annual average sale is greater in the villages without JFMC, and home consumption is higher in the villages with JFMC.
(4) Income from Processed Forest Products
The annual average sales and home consumption (converted into monetary value) of processed forest products per household is summarised in the table below:
Table A6.4-39 Annual Average Income from and Home Consumption of Processed Forest Products per Household
Village Average sales (Rs.) Home consumption (Rs. equivalent)Biyabhava 40 27 Makra 841 310 Jaikar Kala 0 0 Rekri 0 0 Dheram Mandaria 291 1 Saijna 0 0 Devipur 0 0 Mahmadpur 0 0
Average 147 42

For Official Use Only Special Assistance for Project Formation (SAPROF) for
Uttar Pradesh Natural Resources Management and Poverty Alleviation Project (UPNRMPAP)
Final Report - Volume II Annex 6-23
Major processed forest products in the villages are: Alcoholic beverage Laata Fruit preserve Pickles
It appeared that processed forest products are sold or consumed at home to only a small extends.
(5) Income from Wage Labour
The annual average household income from wage labour is summarised in the table below:
Table A6.4-40 Annual Average Household Income from Wage Labour Village Men Women Children
(below 16 years old)
Total
Biyabhava 5,244 606 650 6,500 Makra 6,735 627 122 7,484 Jaikar Kala 5,409 1,701 11 7,121 Rekri 2,019 768 0 2,787 Average (Vindyan) 4,852 926 196 5,974 Dheram Mandaria 3,838 1,020 30 4,888 Saijna 4,804 320 180 5,304 Devipur 4,358 300 0 4,658 Mahmadpur 7,506 500 0 8,006 Average (Terai) 5,127 535 53 5,715
Average 4,990 731 125 5,845
Major source of income from labour are: Physical work at public works Rickshaw driving Cooking / catering Agriculture labourer Work at factories / mills Beedi (local cigar) making House construction / painting Carpet weaving
Major employers are: Gram Panchayat Building owners Rickshaw owners Landlord Fellow farmers Factory / mill owners Various departments Contractors
Further analysis of annual average household income from labour is given in the two tables below:
Table A6.4-41 Further Analysis of Annual Average Household Income from Labour (1) Village Men Women Children Total
Village with good forest 5,155 643 246 6,044Village without good forest 4,823 817 3 5,643
Table A6.4-42 Further Analysis of Annual Average Household Income from Labour (2) Village Men Women Children Total
Village with JFMC 4,712 907 173 5,792Village without JFMC 5,266 554 76 5,895
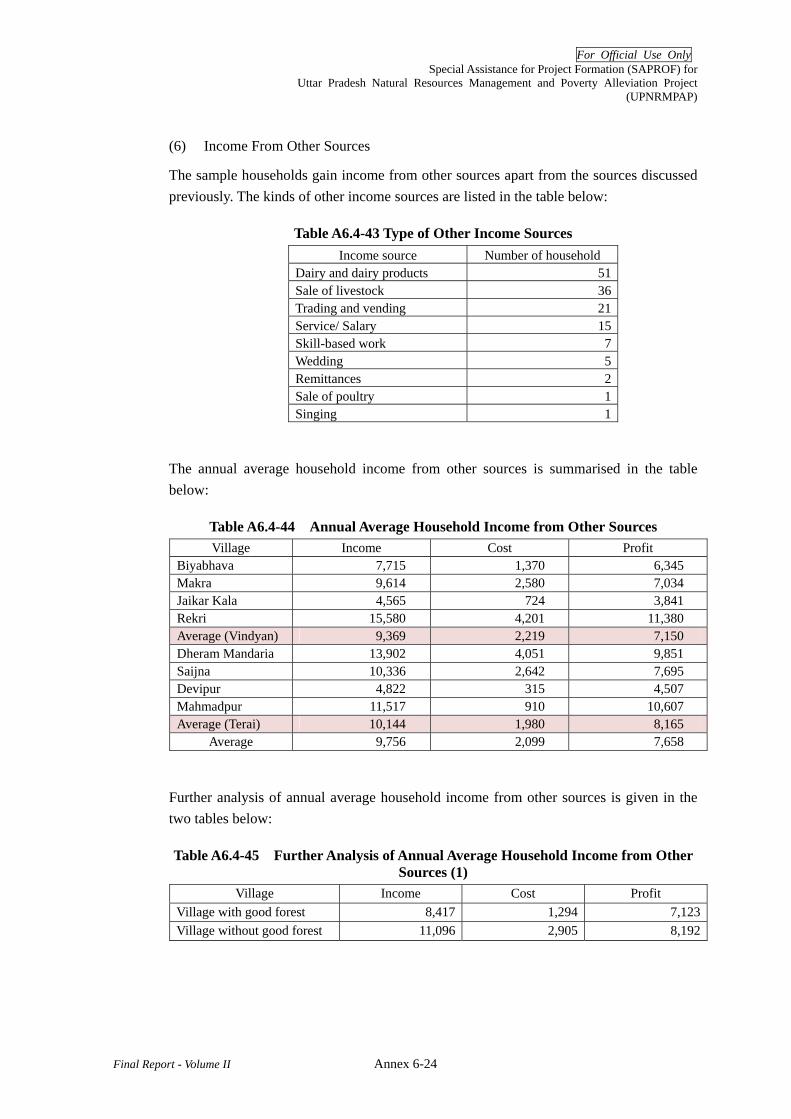
For Official Use Only Special Assistance for Project Formation (SAPROF) for
Uttar Pradesh Natural Resources Management and Poverty Alleviation Project (UPNRMPAP)
Final Report - Volume II Annex 6-24
(6) Income From Other Sources
The sample households gain income from other sources apart from the sources discussed previously. The kinds of other income sources are listed in the table below:
Table A6.4-43 Type of Other Income Sources Income source Number of household
Dairy and dairy products 51 Sale of livestock 36 Trading and vending 21 Service/ Salary 15 Skill-based work 7 Wedding 5 Remittances 2 Sale of poultry 1 Singing 1
The annual average household income from other sources is summarised in the table below:
Table A6.4-44 Annual Average Household Income from Other Sources Village Income Cost Profit
Biyabhava 7,715 1,370 6,345 Makra 9,614 2,580 7,034 Jaikar Kala 4,565 724 3,841 Rekri 15,580 4,201 11,380 Average (Vindyan) 9,369 2,219 7,150 Dheram Mandaria 13,902 4,051 9,851 Saijna 10,336 2,642 7,695 Devipur 4,822 315 4,507 Mahmadpur 11,517 910 10,607 Average (Terai) 10,144 1,980 8,165
Average 9,756 2,099 7,658
Further analysis of annual average household income from other sources is given in the two tables below:
Table A6.4-45 Further Analysis of Annual Average Household Income from Other Sources (1)
Village Income Cost Profit Village with good forest 8,417 1,294 7,123Village without good forest 11,096 2,905 8,192
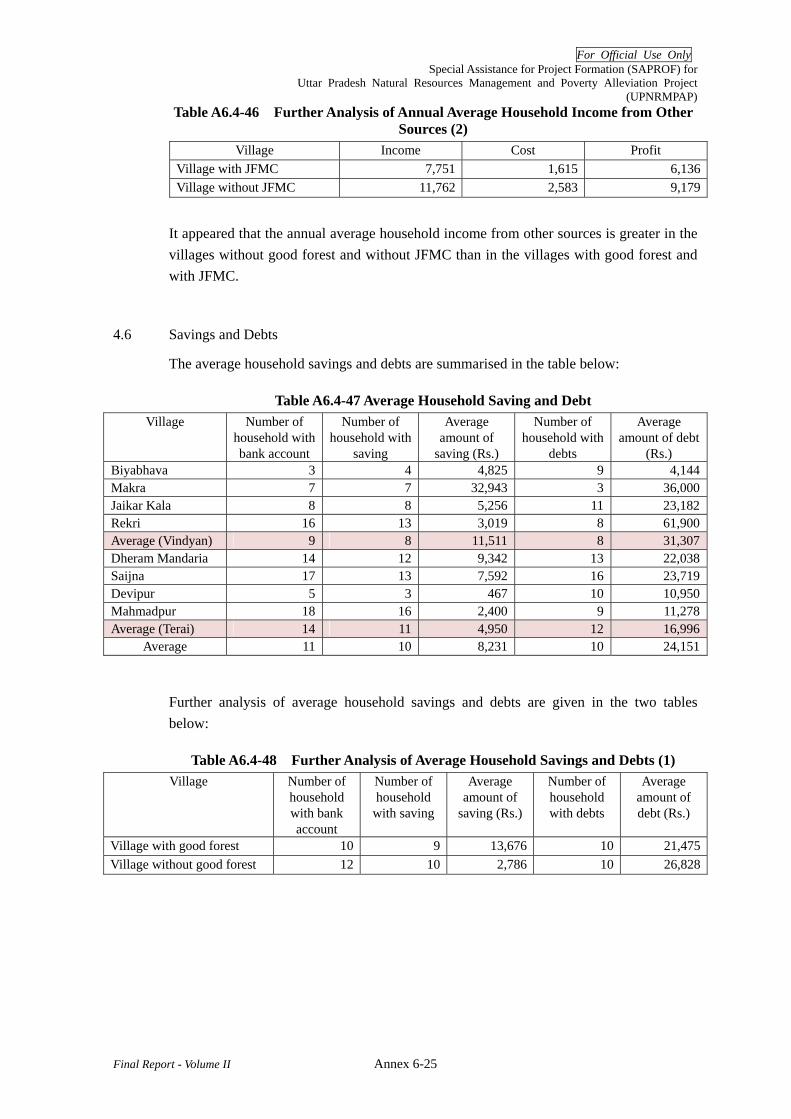
For Official Use Only Special Assistance for Project Formation (SAPROF) for
Uttar Pradesh Natural Resources Management and Poverty Alleviation Project (UPNRMPAP)
Final Report - Volume II Annex 6-25
Table A6.4-46 Further Analysis of Annual Average Household Income from Other Sources (2)
Village Income Cost Profit Village with JFMC 7,751 1,615 6,136Village without JFMC 11,762 2,583 9,179
It appeared that the annual average household income from other sources is greater in the villages without good forest and without JFMC than in the villages with good forest and with JFMC.
4.6 Savings and Debts
The average household savings and debts are summarised in the table below:
Table A6.4-47 Average Household Saving and Debt Village Number of
household with bank account
Number of household with
saving
Average amount of
saving (Rs.)
Number of household with
debts
Average amount of debt
(Rs.) Biyabhava 3 4 4,825 9 4,144Makra 7 7 32,943 3 36,000Jaikar Kala 8 8 5,256 11 23,182Rekri 16 13 3,019 8 61,900Average (Vindyan) 9 8 11,511 8 31,307Dheram Mandaria 14 12 9,342 13 22,038Saijna 17 13 7,592 16 23,719Devipur 5 3 467 10 10,950Mahmadpur 18 16 2,400 9 11,278Average (Terai) 14 11 4,950 12 16,996
Average 11 10 8,231 10 24,151
Further analysis of average household savings and debts are given in the two tables below:
Table A6.4-48 Further Analysis of Average Household Savings and Debts (1) Village Number of
household with bank account
Number of household
with saving
Average amount of
saving (Rs.)
Number of household with debts
Average amount of debt (Rs.)
Village with good forest 10 9 13,676 10 21,475Village without good forest 12 10 2,786 10 26,828
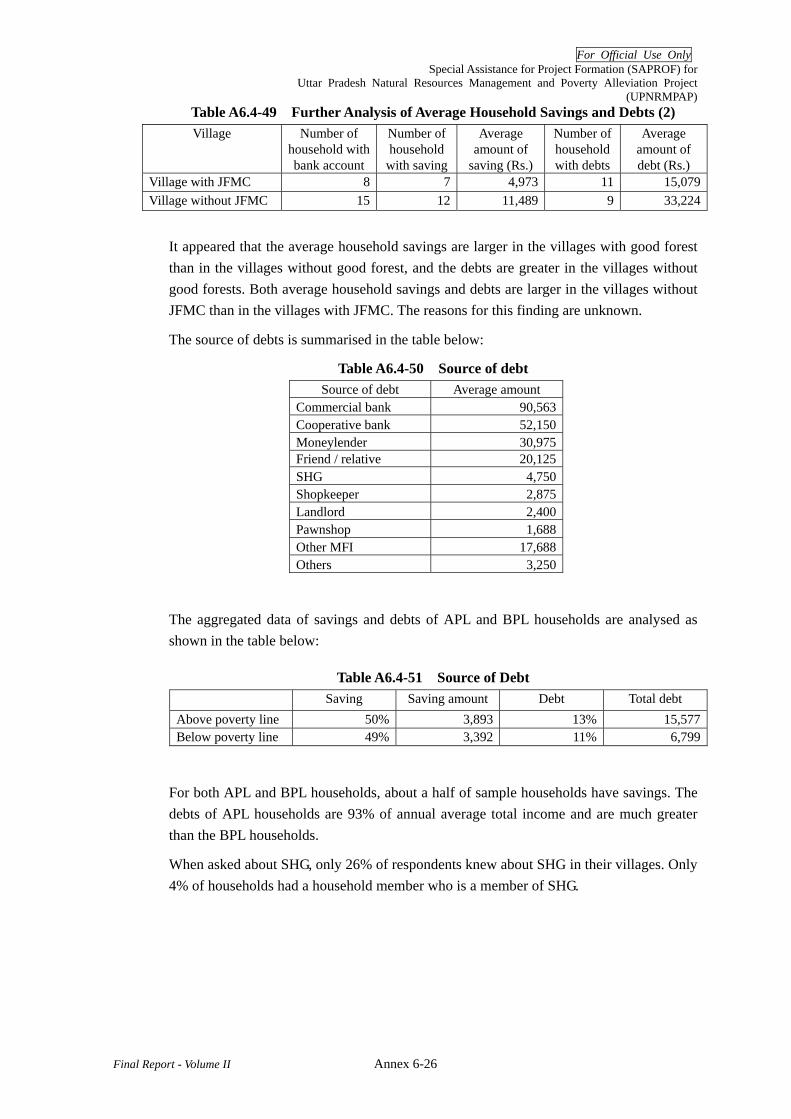
For Official Use Only Special Assistance for Project Formation (SAPROF) for
Uttar Pradesh Natural Resources Management and Poverty Alleviation Project (UPNRMPAP)
Final Report - Volume II Annex 6-26
Table A6.4-49 Further Analysis of Average Household Savings and Debts (2) Village Number of
household with bank account
Number of household
with saving
Average amount of
saving (Rs.)
Number of household with debts
Average amount of debt (Rs.)
Village with JFMC 8 7 4,973 11 15,079Village without JFMC 15 12 11,489 9 33,224
It appeared that the average household savings are larger in the villages with good forest than in the villages without good forest, and the debts are greater in the villages without good forests. Both average household savings and debts are larger in the villages without JFMC than in the villages with JFMC. The reasons for this finding are unknown.
The source of debts is summarised in the table below:
Table A6.4-50 Source of debt Source of debt Average amount
Commercial bank 90,563 Cooperative bank 52,150 Moneylender 30,975 Friend / relative 20,125 SHG 4,750 Shopkeeper 2,875 Landlord 2,400 Pawnshop 1,688 Other MFI 17,688 Others 3,250
The aggregated data of savings and debts of APL and BPL households are analysed as shown in the table below:
Table A6.4-51 Source of Debt Saving Saving amount Debt Total debt
Above poverty line 50% 3,893 13% 15,577 Below poverty line 49% 3,392 11% 6,799
For both APL and BPL households, about a half of sample households have savings. The debts of APL households are 93% of annual average total income and are much greater than the BPL households.
When asked about SHG, only 26% of respondents knew about SHG in their villages. Only 4% of households had a household member who is a member of SHG.

For Official Use Only Special Assistance for Project Formation (SAPROF) for
Uttar Pradesh Natural Resources Management and Poverty Alleviation Project (UPNRMPAP)
Final Report - Volume II Annex 6-A1
Attachment A6.3-1 Household Survey Questionnaire
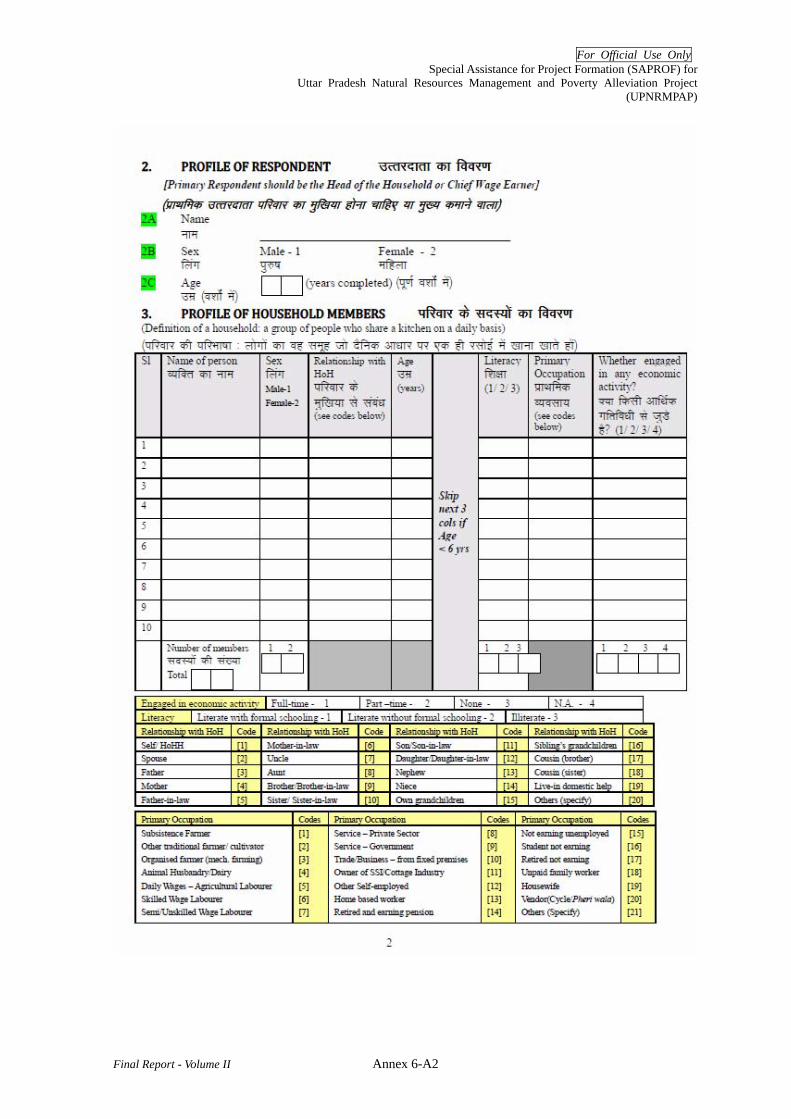
For Official Use Only Special Assistance for Project Formation (SAPROF) for
Uttar Pradesh Natural Resources Management and Poverty Alleviation Project (UPNRMPAP)
Final Report - Volume II Annex 6-A2

For Official Use Only Special Assistance for Project Formation (SAPROF) for
Uttar Pradesh Natural Resources Management and Poverty Alleviation Project (UPNRMPAP)
Final Report - Volume II Annex 6-A3
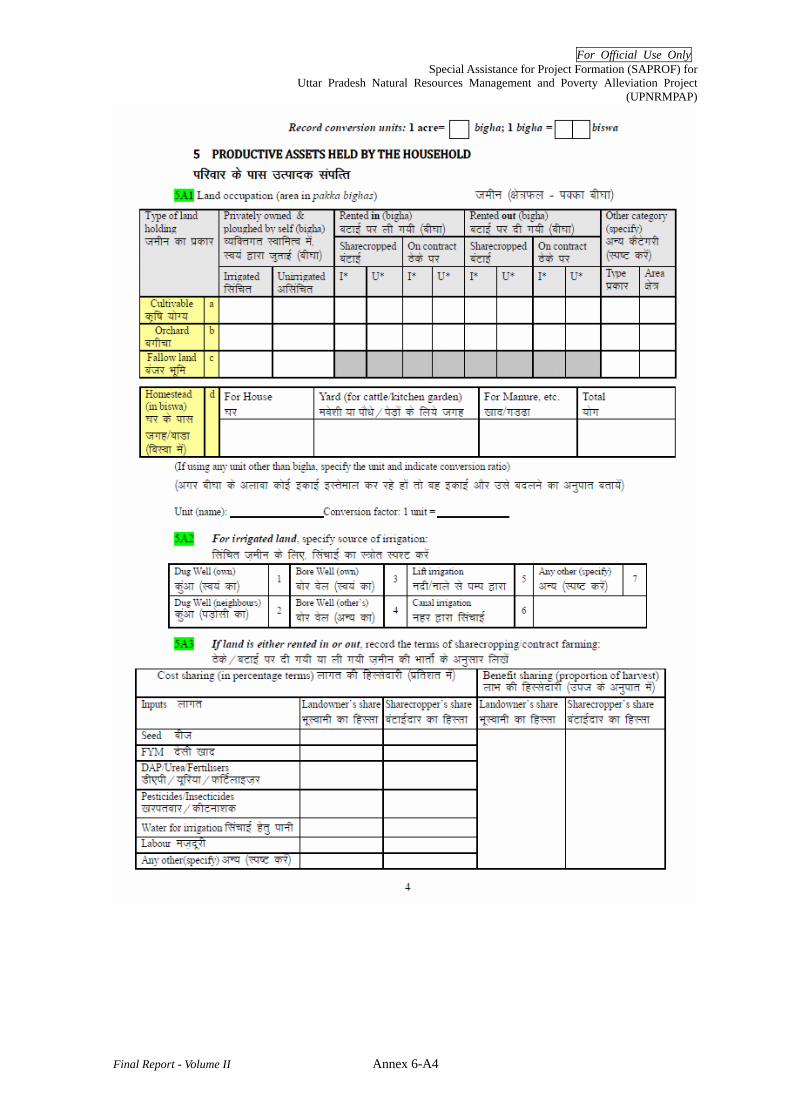
For Official Use Only Special Assistance for Project Formation (SAPROF) for
Uttar Pradesh Natural Resources Management and Poverty Alleviation Project (UPNRMPAP)
Final Report - Volume II Annex 6-A4

For Official Use Only Special Assistance for Project Formation (SAPROF) for
Uttar Pradesh Natural Resources Management and Poverty Alleviation Project (UPNRMPAP)
Final Report - Volume II Annex 6-A5
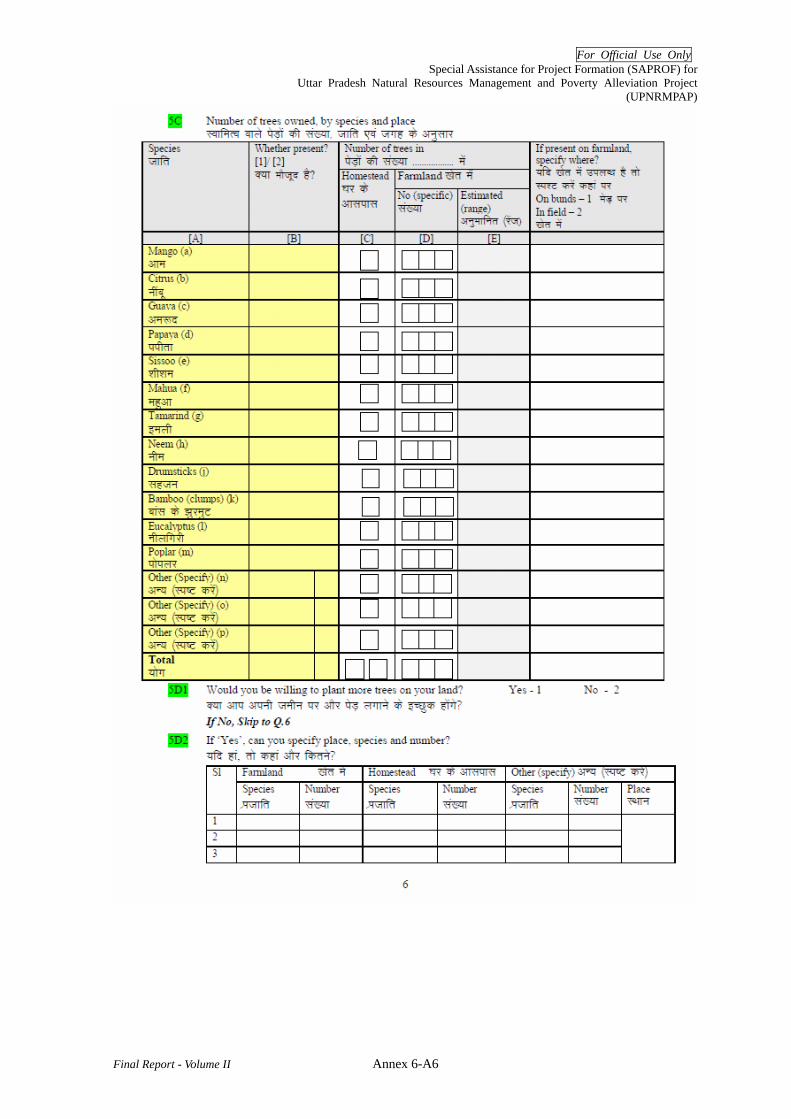
For Official Use Only Special Assistance for Project Formation (SAPROF) for
Uttar Pradesh Natural Resources Management and Poverty Alleviation Project (UPNRMPAP)
Final Report - Volume II Annex 6-A6

For Official Use Only Special Assistance for Project Formation (SAPROF) for
Uttar Pradesh Natural Resources Management and Poverty Alleviation Project (UPNRMPAP)
Final Report - Volume II Annex 6-A7

For Official U
se only Special A
ssistance for Project Formation (SA
PRO
F) for U
ttar Pradesh Natural R
esources Managem
ent and Poverty Alleviation Project
(UPN
RM
PAP)
Final Report-Volume II A
nnex 6-A8

For Official U
se only Special A
ssistance for Project Formation (SA
PRO
F) for U
ttar Pradesh Natural R
esources Managem
ent and Poverty Alleviation Project
(UPN
RM
PAP)
Final Report-Volume II A
nnex 6-A9
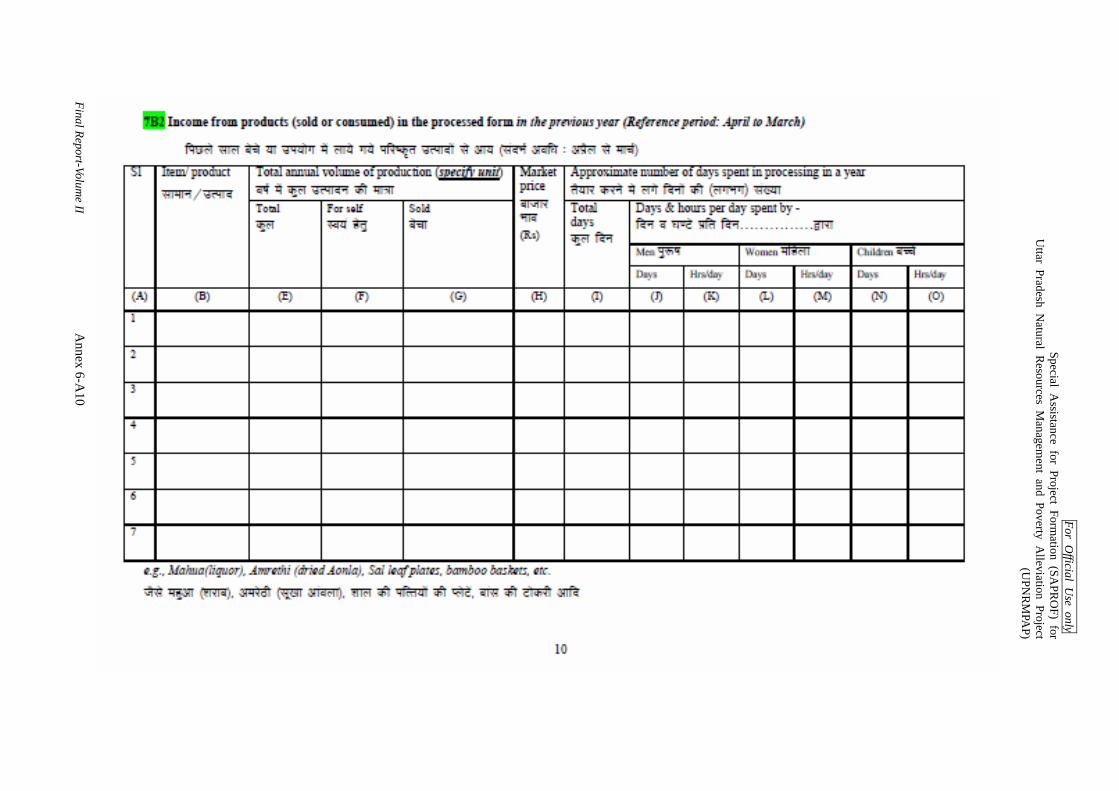
For Official U
se only Special A
ssistance for Project Formation (SA
PRO
F) for U
ttar Pradesh Natural R
esources Managem
ent and Poverty Alleviation Project
(UPN
RM
PAP)
Final Report-Volume II A
nnex 6-A10

For Official U
se only Special A
ssistance for Project Formation (SA
PRO
F) for U
ttar Pradesh Natural R
esources Managem
ent and Poverty Alleviation Project
(UPN
RM
PAP)
Final Report-Volume II A
nnex 6-A11
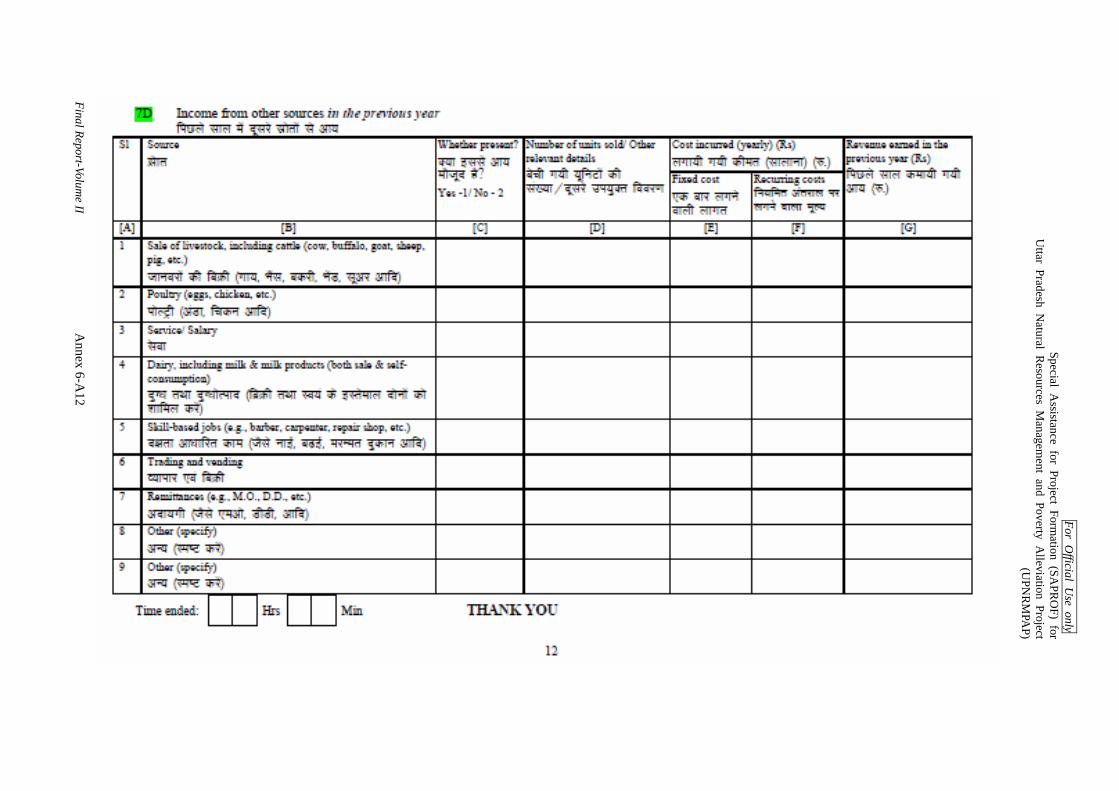
For Official U
se only Special A
ssistance for Project Formation (SA
PRO
F) for U
ttar Pradesh Natural R
esources Managem
ent and Poverty Alleviation Project
(UPN
RM
PAP)
Final Report-Volume II A
nnex 6-A12

For Official Use Only Special Assistance for Project Formation (SAPROF) for
Uttar Pradesh Natural Resource Management and Poverty Alleviation Project (UPNRMPAP)
Final Report- Volume II
Special Assistance for Project Formation
for Uttar Pradesh Natural Resource Management and Poverty Alleviation Project
(UPNRMPAP)
Final Report
Volume II: ANNEXES
ANNEX-7 REPORT ON EXPOSURE TRIP
For Official Use Only Special Assistance for Project Formation (SAPROF) for
Uttar Pradesh Natural Resources Management and Poverty Alleviation Project (UPNRMPAP)
Final Report-Volume II i
Special Assistance for Project Formation (SAPROF)
for
Uttar Pradesh Natural Resource Management and Poverty Alleviation Project (UPNRMPAP)
Final Report
Volume II: Annexes
ANNEX 7 REPORT ON EXPOSURE TRIP
Table of Contents 1. Tamil Nadu Exposure Trip - A Report........................................................................ Annex 7 -2
1.1 Background ..................................................................................................... Annex 7 -2 1.2 Overview of Tamil Nadu Afforestation Project............................................... Annex 7 -2
2. Villages Visited by the UPFD Officials...................................................................... Annex 7 -7 2.1 Veeraragavapuram........................................................................................... Annex 7 -7 2.2 Salamanatham ................................................................................................. Annex 7 -9 2.3 Chinnakunnathur ............................................................................................Annex 7 -11 2.4 Fathima Nagar Tap Village............................................................................ Annex 7 -13 2.5 Vasigoundanur Tap Village............................................................................ Annex 7 -15
3. Perceptions of the Officers Who Visited the Tap Areas ........................................... Annex 7 -18

For Official Use Only Special Assistance for Project Formation (SAPROF) for
Uttar Pradesh Natural Resources Management and Poverty Alleviation Project (UPNRMPAP)
Final Report - Volume II Annex 7-1
ANNEX 7 REPORT ON EXPOSURE TRIP
TAMILNADU EXPOSURE TRIP
FROM
07.05.07 TO 11.5.07
A REPORT
U.P. FOREST DEPARTMENT
For Official Use Only Special Assistance for Project Formation (SAPROF) for
Uttar Pradesh Natural Resources Management and Poverty Alleviation Project (UPNRMPAP)
Final Report - Volume II Annex 7-2
ANNEX 7 REPORT ON EXPOSURE TRIP
1 Tamil Nadu Exposure Trip - A Report
1.1 Background
Uttar Pradesh Forest Department has submitted a project for resource management and poverty alleviation for JBIC funding. After examining the project, the JBIC sanctioned SAPROF for streamlining and reformulating the project components. In the course of SAPROF the JBIC suggested that some officers of the UPFD go to Tamil Nadu to see the implementation of the Tamil Nadu project and gain from the experience for better implementation of the project in U.P. when and if it comes.
The UPFD and the Govt of U.P. agreed to this suggestion and five officers from UPFD visited various project sites in Tamil Nadu. These officers were:-
Mr D.N.S. Suman, P.C.C.F. Projects. Mr V.K.Sinha, C.C.F. Ecodevelopment. Mr V.M. Arora, C.C.F Projects. Mrs Mamta.S. Dubey, C.F. Planning. Mr Atibal Singh, C.C.F. F.D.A.
Mr TSUJI the Co- Team Leader of SAPROF Team accompanied the officers from UPFD.
1.2 Overview of Tamil Nadu Afforestation Project.
Tamil Nadu is situated on the east coast of India. Total Geographical area of the state is 130,058sq km. Total notified forest area is 22877 sq km. Thus 17.59% of the geographical area in the state is under forests. Open and scrub area is 11,605 km2. As per the 2003 Report of FSI total forest and tree cover is 21.25%.
The forest area is under tremendous biotic pressure and is in an advanced state of degradation. Factors responsible for degradation are listed below:-
- Large human and cattle population. - Poverty among the forest ecosystem community. - Developmental activities do not reach these villages. - Lack of awareness among forest ecosystem communities.
- Authoritarian approach of the forest department * - Grazing. - Forest fires.
Following figures of annual removal of various products from the forests are enough to

For Official Use Only Special Assistance for Project Formation (SAPROF) for
Uttar Pradesh Natural Resources Management and Poverty Alleviation Project (UPNRMPAP)
Final Report - Volume II Annex 7-3
illustrate the pressure on this very vital ecosystem.
- 0.7 Million tones of fuelwood. - 0.125 Million tones of fodder and green manure. - 10,000cu m of small timber. - Over one lakh people involved in hard wood removal.
The Tamil Nadu forest department recognized the dependence of forest communities on this resource as legitimate and opted for a management approach that takes into account the needs of the local communities and actively involves them in management related decisions. The Tamil Nadu Afforestation Project is a result of the department’s understanding of close linkages that exist between resource depletion and poverty.
This project has following salient features:-
- It is based on the principle of JFM. - It adopts watershed development approach. - The project aims at reducing the level of poverty among the forest dependent
communities. - Working on the philosophy of “Care and Share”, securing the co-operation of
local communities in protecting and developing the forests. - Co-operating with other development departments for holistic development of
the project villages.
The project is funded by the JBIC and is being implemented in two phases. First phase was from 1997-98 to 2004-2005. Second phase has started in 2005.
1.2.1 Phase-1.
(1) Project outlay for the first phase
- Funding agency is JBIC. - Project cost was Rs 499 crore at base cost. - The interest rate on the loan was 2.1% per annum. - Repayment to start after 10 years from the commencement of the project. - Period of repayment is 20 years. - Total Expenditure was Rs 688 crore of which state contributed 205 crore rupees
and the JBIC contributed Rs 408 crores.
(2) Objectives of Phase-1
- To launch massive tree plantation Programme in the state of TN. - To bring about balanced ecological up gradation and & meet, to the lent

For Official Use Only Special Assistance for Project Formation (SAPROF) for
Uttar Pradesh Natural Resources Management and Poverty Alleviation Project (UPNRMPAP)
Final Report - Volume II Annex 7-4
possible; the requirements of local people. - Improve productivity of forests. - Motivate People to adopt tree growing culture. - Provide employment opportunities in rural areas. - Enhance capability of KD.
(3) Components-
I. Local Biodiversity conservation
a) Lower zone 90 ha/ Village) b) Middle zone (80 ha /village) c) Upper zone (80 ha./village) d) Buffer zone (village) e) Greening of community lands f) Tribal life support g) Incentive for local tree cultivation.
II Managing Forest Resources
a) Conservation programmes b) Water Augmentation c) Sand dune stabilization d) Shelterbelt plantations e) Production programmes f) Timber growing stock improvement g) Teak canal bank programmes
III Conserving Species
a) Wetlands conservation b) Dry evergreen forest conservation c) Consolidation of forests.
IV Expanding human capacity to conserve biodiversity
a) GIS b) Forestry extension c) Training (Domestic/Abroad) d) NGO participation
V Forest Development
VI Silvicultural Intervention
a) Natural Regeneration b) Gap planting

For Official Use Only Special Assistance for Project Formation (SAPROF) for
Uttar Pradesh Natural Resources Management and Poverty Alleviation Project (UPNRMPAP)
Final Report - Volume II Annex 7-5
c) In-situ soil & moisture conservation d) Fire Protection e) Social Fencing
VII Village Development
- Building village level institutions and micro – planning
a) Rehabilitation of forest dependents b) Self Help Groups c) Poverty alleviation d) Community development e) Outreach towards multi-sectoral linkage
VIII Water Development a) Arresting flooding & erosion b) Downstream water harvesting c) Artificial recharge by induced percolation d) Uplifting ground water table level e) Rejuvenating agriculture
(Benefit sharing)
a) Non timber Forest produce goes to VFC members. b) 100% rights to VFC’s over NTFP c) 90% of benefits to VFC for Timber, Bamboo & poles. d) VFCs decide benefit sharing.
IX Geomatics centre: This was established for database management and recourse inventory at a cost of - 279.91 lakhs.
X HRD - Adequate provision for training. a) Research – Experiments were carried out on project related issues. b) Production of QPM – Seed production areas. c) Research related to bio fertilizers d) Research on agro forestry models e) Identifying native fodder spp. To support animal husbandry activities. f) Post harvesting technology NTFP. g) Research on Biodiversity pollinators, seed dispersers of forest recovery
including inventorisation and monitoring XI Research on medicinal plants for rural women & child health care
a) Research on water conservation, b) Socio economic research

For Official Use Only Special Assistance for Project Formation (SAPROF) for
Uttar Pradesh Natural Resources Management and Poverty Alleviation Project (UPNRMPAP)
Final Report - Volume II Annex 7-6
X Forestry Extension (29 centres were build under TAP)
XI Inter Sectoral Linkage a) Realised the importance of Inter Sectoral Linkages for overall development b) Line department contribution:- Rs. 4130.30 lakh (between 1997-2004 (7
years), and 2011.49 lakh (between 2005-06) c) 1113 village have received the benefits out of 1502 TAP villages.)
(3) Achievements-
a) Afforestation – 4.80 lakh ha. b) Water harvesting-Structures
- Check dams – 23454 - Percolation ponds – 2201 (Storage capacity – 817.53 mil cft).
c) Village Forest Councils – 1357 d) Self Help Groups – 3891 e) Micro credit given – Rs. 51.31 crores. f) Persons benefited – 1,16,254 g) Amt on community development - Rs. 22.49 crore h) Man days generated – 609.87 lakh
1.2.2 Phase II (2005-06 to 2012-13)
(1) Project Outlay a) Externally aided project b) Funding Agency – JBIC Tokyo c) Rs. 567.42 crores (at base cost) d) Interest commences – After 10 years e) Period of repayment – 30 years f) JBIC loan – Rs. 409.08 crores g) State Funding – Rs. 158.34 crores
(2) Objectives of phase II a) Ecological restoration of forests b) Livelihood improvement of the project village through JFM c) Poverty reduction in the project villages.
(3) Project Components a) Afforestation (IWDP & ITDP) b) Improvement in infrastructure for field staff. c) Supporting activities for forest management GIS, Forestry Extension, HRD
Research, Monitoring & Evaluation

For Official Use Only Special Assistance for Project Formation (SAPROF) for
Uttar Pradesh Natural Resources Management and Poverty Alleviation Project (UPNRMPAP)
Final Report - Volume II Annex 7-7
d) Buffer zone activities IWDP & ITDP
2 Village Visited by the UPFD Officials.
2.1 Veeraragavapuram
(1) Village Profile
1. Name of the Range : Forest Station Range 2. Name of the TAP village : VEERARAGAVAPURAM 3. Name of the Panchayat : Thimma Poobalapuram 4. Year of TAP implementation : 2000-2001 5. Project Area : Pulikundram RF 6. Name of the Watershed : Kosasthalai 4C2C4b3 7. Name of Taluka : Uthukottai 8. Name of the District : Tiruvallur 9. Total No. of households : 78 (January 2000) 10. Total Population : 320(M:140, F:117, C:62 as on January 2000)
(2) Structure of Village Forest Council
1. Date of VFC Formation : 14.3.2000 2. No. of VFC members : 156 (Male 78, Female 78) 3. No. of EC members : 12 (Male 8 Female 4) 4. Name of VFC President : Thiru C. Hari 5. Banking details :414724037 / Indian Bank, Thiruvallur 6. Balance amount as on 30.4.07 : Rs. 10,154/- 7. Registration of the VFC :VFC is a legal body. Registered under Society act.
Village Forest Council was formed in this village by enrolling one male and female member from each household living in the village collecting a nominal fee as membership fee (Rs.1/- for SC/ST and Rs. 2/- for others)
(3) Alternative Income Generation Activities
Rearing milch animals, (Traditional), was the main income generation activity, people volunteered. In the selected village, 3 Women Self Help Groups were formed by the Forest Department. Loan from the VFC fund were given to these 3 WSHG exclusively for rearing milch animals.

For Official Use Only Special Assistance for Project Formation (SAPROF) for
Uttar Pradesh Natural Resources Management and Poverty Alleviation Project (UPNRMPAP)
Final Report - Volume II Annex 7-8
(4) Details of Women Self-Help Groups Formed by Forest Department:
No.
Name of the WSHG
Total members
Date of formation
Group activity Bank account no. Amount Amount covered
1 Alli WSHG
15 1.8.2000 Rearing milch animal
Indian Overseas Bank,4814 Pennalurpettai
60,000 31,500
2 Roja WSHG
15 1.8.2000 Rearing milch animal
Indian Overseas Bank,4816 Pennalurpettai
60,000 27,400
3 Naval WSHG
15 1.8.2000 Rearing milch animal
Indian Overseas Bank,4815 Pennalurpettai
60,000 32,500
Total 180,000 91,400
(5) Buffer Zone Activities Carried Out in the Last Three Years:
Buffer zone activity comprises of (i) community asset creation – fulfilling their basic needs and (ii) making avenue for forest dependents to carry out income generation activities through training and micro credit system.
(6) Community Asset Creation:
Sl. No. Year Name of the work Expenditure
In Rs. Benefits /
Beneficiaries 1 2000-01 Construction of Bus Shelter 40,000 78 families 2 2001-02 Construction of T.V. Room 47,571 50 families 3 2002-03 Maintenance of Threshing floor 22,000 Entire village Total 109,571
(7) Income Generation Activities:
Sl. No. Activities Loan given (Rs.)
Beneficiaries Tvl.
2003-04 1 Milch cow 5,000 Vijaya 2 “ 10,000 Puji 3 “ 5,000 Amulu 4 “ 5,000 Venkatesan 5 “ 5,000 Raji 6 “ 4,000 Muniamal 7 “ 1,000 Vengatammal
Total 35,000
Sl. No. Activities Loan given (Rs.)
Beneficiaries Tvl.
2004-05 1 Milch cow 5,000 Rajini 2 “ 5,000 Lakshmi 3 “ 5,000 Sensamal 4 “ 5,000 Nagamal 5 “ 5,000 Semala 6 “ 5,000 Regeswari 7 “ 2,000 Aungama 8 “ 2,000 Samboornam 9 “ 1,000 Lakshmi Total 35,000

For Official Use Only Special Assistance for Project Formation (SAPROF) for
Uttar Pradesh Natural Resources Management and Poverty Alleviation Project (UPNRMPAP)
Final Report - Volume II Annex 7-9
(8) Watershed Development Works:
i) Afforestation work during 2000-2001 = 300 Ha.
Sl. No. Zone Total Extent in Ha. No. of Seedlings planted
1 Lower Zone 90 Ha. @ 500/ha 45,000 2 Middle Zone 80 Ha. @ 300 ha 24,000 3 Upper Zone 80 Ha. @ 100/ha 8,000 4 Water Augmentation 50Ha. @ 500/ha 25,000
Total 300 Ha. 102,000
Composition of species: Naval (Sysgzium cumini), Nelli (Emblica officianalis), Neermaruthu (Terminalia arjuna), Illuppai (Bassia latifolia), Vila, Kattukalla, Arsan, etc.
= Total 102,000
2.2 Salamanatham
(1) Village Profiles
The details and data of the Salamanatham TAP village is as follows:
i) District : Vellore ii) Division : Vellore iii) Range : Vellore iv) Assembly constituency : Arcot v) Parliamentary constituency : Vandavasi vi) Name of Reserve Forest : Kaniyambadi vii) Name of Village : Salamanatham viii) Name of Village Panchayat : Salamanatham ix) Revenue Village : Salamanatham x) Taluka : Vellore xi) Union : Kaniyambadi xii) Total No. of house holds : 275 xiii) Total No. of population : 1127 ivx) Total member enrolled in village: 524 OC: 426, SC: 98 Forest Council F: 216 M:210 F: 54 M: 44 vx) Name of NGO
- Mr. Rajan Alberd, CFRI, Vellore - Mr. Elango, CURD, Vellore. (Centre for Urban and Rural Development) - Mr. C.Srinivasan, Exnora Green Gross, Vellore
vix) Name of VFC President : Thiru P. Ramesh Babu
For Official Use Only Special Assistance for Project Formation (SAPROF) for
Uttar Pradesh Natural Resources Management and Poverty Alleviation Project (UPNRMPAP)
Final Report - Volume II Annex 7-10
(2) Income Generation Activities a) Vermicasting promotion through : One large unit at Salamanatham, Self Help
Group maintaining by EXNORA GREEN GROSS and the Self Help Groups & CFRI.
b) Vermi compost : c) Vermiculture : d) Poultry : e) Cane baskets : f) Paper bags : g) Broomstick : f) Biogas Plants :
(3) Buffer Zone Activities :
a) Supply of furniture to the elementary school. b) Loan for Milch cows, Vegetable shops etc c) Providing submergible pump set to the bore well at Salamanatham. d) Construction of compound wall to the elementary school at Salamanatham. e) Free supply of coconut, badam and mango seedlings to the village people. f) Fixing of windows & doors to the elementary school. g) Supply of vessels to the Noon meal centre. h) Pipeline extension to the colony for the supply of drinking water. i) 2 Nos. of street lights. j) Supply of 2 tailoring machines to SHG.
(4) Self Help Group
There are 5 Self Help Groups in Salamanatham Tap Village as follows:
a) THENNAI SELF HELP GROUPS b) ALAMARAM SELF HELP GROUPS c) MALLIGAI SELF HELP GROUPS d) POOVARASU SELF HELP GROUPS e) ROJA SELF HELP GROUPS
All the above groups underwent grading – Done by DRDA, Women Development Corporation, NABARD & CANARA BANK.
The first 4 Self Help Groups received Rs. 100,000/- Individually & last Self Help Groups for Rs. 25,000/- As a loan from Canara Bank in 2005/06
For Official Use Only Special Assistance for Project Formation (SAPROF) for
Uttar Pradesh Natural Resources Management and Poverty Alleviation Project (UPNRMPAP)
Final Report - Volume II Annex 7-11
(5) Village Socio – Economic Details during the project
No. of House : 69 Total Population : 264 Community : BC -1, MBC-68 Available amenities : School :Primary School Drinking water : Overhead Tank,Bore Well Electricity Available Transport facility : TwoTimes per day Public Telephone : Available Road facility : Available No. and Category of live stock: Sheep -19, Cow-30, Bullock-06, Buffalo-22 Land holding : 75% Families possess land for cultivation Land use : 52% Well Irrigation
48% land use for growing rain fed crops Degree of pressure on : Fuel; 97%, Fodder; 70% GML; 40% Project Area Resources : NTFP Collection
2.3 Chinnakunnathur
(1) Details of Project Area
Name of the Village : Chinnakunnathur Name of Range : IFF Range, Uthangarai District : Krishnagiri Taluka : Uthangarai Union : Uthangarai Revenue : Upparrapatti Panchayat : Upparrapatti Location & Name of the RF : Sundamalai RF, Area 289 Ha. Topography : Hillock Slope & Condition of the Forest : Dry scrub thorny jungle Total Plantation Area : 250 ha. Crown Density : .6
(2) Details of Planting Area
a) Nursery – - Size of Poly Bags : 16 x 30 x 300 – 9900 Azospirillum- 6gms/Bag
30 x 45 x 400 – 6600 Phosphobacteria - 6gms/Bag - Vermicosting -35 gms/Bag - Rhizobium - 6 gms/Bag - VAM -15 gms/Bag
For Official Use Only Special Assistance for Project Formation (SAPROF) for
Uttar Pradesh Natural Resources Management and Poverty Alleviation Project (UPNRMPAP)
Final Report - Volume II Annex 7-12
- Neem cake -10 gms/Bag - Poultry manure application- 250gms/Pit
b) Planting Site : - Lower Zone – 150 ha. - Upper Zone – 100 ha. - Lower Zone : 45 cm 3 -60 / ha. 9,000 No. 150 ha.
c) Pits - 60 cm3 -40/Ha. – 6,000 Nos.
TOTAL Pit - 100/ha.-15,000Nos. Rs. 207,265/-
(3) Buffer Zone Activity Target
a) Community Development 33% : Rs. 68,397/- (Thrashing Floor Formed) b) Income Generation Activity 67% : Rs. 1,38.867/- (Individual Loan Given)
(4) Details of Planting Area – Upper Zone
Upper Zone : 100 ha. Prorate : Rs. 1036/- Per ha. Allotted Fund : Rs. 103,600/- Afforestation works 31% : Pungan, Usil, Seetha, Vembu Seed Sowing : Rs. 32,116/- Soil & Moisture Conservation (69%):71,484/- Percolation pond constructed
(5) Details of Planting Area – Lower Zone
Area : 160 ha. Prorate : Rs. 9,365/- Per ha. Allotted Fund : Rs. 1404,750 Afforestation works
Nursery & Planting (32%) : Rs. 449,520/- Soil & Moisture Conservation (68%) : Rs. 955,230/-
Three percolation pond constructed Species Planted : Nelli, Uuppai, Vembu, Aaya, Pungan, Naval, Puliyan, Bamboo,
Neermathi Protection : Social Fencing
(6) Details of Village Forest Council
Existence of Village Forest Council : 03.02.2006 Registration No. : 65 / 2006 Name of the President : N. Subramani Number of the Executive Members : 11

For Official Use Only Special Assistance for Project Formation (SAPROF) for
Uttar Pradesh Natural Resources Management and Poverty Alleviation Project (UPNRMPAP)
Final Report - Volume II Annex 7-13
Name of the Sub Groups : 1. Manoranjani Forest Women SHG 2. Santhanam Forest Women SHG 3. Sanjeevi Forest Women SHG Special Activity carried out by VFC: 40 Tribal Youths were trained by 3 Resource
persons of Village Forest Council Chinnakunnathur during 2007-05-16
(7) Details of Alternative Income General Activities
Incense stick : 40 Families Basket From Lantana sticks : 6 Families Mats of coconut leaves : 7 Families Sericulture : 1 Family
(8) Skill Development Training
46 SHG members were undergone Entrepreneur Development Training
(9) Social Security Scheme
No of Beneficiaries : 46 Families Claims occurred up to date : 1 (Rs. 30,000/-) Paid
(10) Details of Community Mobilization
Health : Medical camp on Allopathic Siddha & Homeopathy : Eye Camp
Festival Celebration : Pongal Festival Celebration
2.4 Fathima Nagar Tap Village
(1) Village Profile:-
Panchayat- Thenkarai Kottai Union- Morappur Taluka- Pappireddipattii District- Dharmapuri Latitude- 120 00’ 874’’ Longitude- 780 23’ 310’’ Population : Families- 165 Male- 322 Female- 299 (Note: Out of 165, 158 SC Families converted christens.)
For Official Use Only Special Assistance for Project Formation (SAPROF) for
Uttar Pradesh Natural Resources Management and Poverty Alleviation Project (UPNRMPAP)
Final Report - Volume II Annex 7-14
Profession : Agriculture - 72 Families Govt. employee - 4 Nos. Business - 7 Nos. Milk animals rearing - 8 Nos. Christian sister - 1 No. Agri- Labourers - 73 Families. VFC members: Male - 140 Female - 162 Forest dependent : 100% dependent - Nil Partial dependent - 60 Families Type of dependency: Grazing goats, sheep, stray cattle, fire wood collection, GML
collection etc; Resources of the Village :
- Land with irrigation facilities - 56.40 Acre - Dry Land with rain fed cultivation - 9.75 Acre
(Average Annual Income : Rs.6,000/-)
- Cattle :Goats - 181 Sheeps - 90 Cow - 101 - Protected water - High School - Tar & Cement Road - Electricity
(2) Area of the Project :
250 ha (Lower Zone 150 ha & UZ 100 ha) Reserve Forest : Kavaramatai R.F. 2,875.08 ha Type of Forest: Sathan dry thorny Forest (5AC3) Water shed No. : PC2 d3
(3) Soil & Moisture Conservation Works:
Percolation Pond constructed : 4 Nos. Water Storing capacity : 611,000 ft3.
(4) Buffer Zone Work:
i) Community Developmental Works: 1. High School compound wall 49.60 Rm. ii) Individual Income Generation Activities:

For Official Use Only Special Assistance for Project Formation (SAPROF) for
Uttar Pradesh Natural Resources Management and Poverty Alleviation Project (UPNRMPAP)
Final Report - Volume II Annex 7-15
iii) Seed money (Loan) given to the following Vana Mandrams ( Forest SHG) 1. Fathima Vana Magalir Mandram - Rs. 23,000- 2. Karmel Vana Magalir Mandram - Rs. 23,000- 3. Velankanni Vana Magalir Mandram - Rs. 23,000- 4. Annai Periyanayagi Vana Magalir Maneram - Rs. 23,000- 5. Annai Terasa Vana Magalir Mandram - Rs. 23,000- 6. Golfin Angal Vana Mandram - Rs. 23,000-
(5) Activities carried out:
- Tailoring - Backery - Milch animal rearing - Coconut Bussiness - Wire bags knitting - Agricultural based works - Musical instruments
(6) Financial implications:
- Afforestation Works:- a. Planting Rs. 1,604,000- b. Soil & Moisture Const. Works Rs. 992,000-
- Buffer Zone Works:- a. Community Developmental Works Rs. 66,000- b. Individual Income Generation Activities Rs. 140,000-
- Total Amount Spent in First Year : Rs. 2802,500- - Total Man days generated : 25,000 Nos-
(7) Benefit Sharing : 850 Tamarind trees may yield 5,000 Kgs. Will fetch
Rs. 10,000/- annual revenue roughty.
2.5 Vasigoundanur Tap Village
(1) Village Profile:-
- Panchayat - B. Pallipatti, - Union - Pappireddupatti - Taluk - Pappireddipattii - District - Dharmapuri - Latitude - 110 58’ 746’’ - Longitude - 780 16’ 883’’
For Official Use Only Special Assistance for Project Formation (SAPROF) for
Uttar Pradesh Natural Resources Management and Poverty Alleviation Project (UPNRMPAP)
Final Report - Volume II Annex 7-16
- Population : Families- 315 Male- 1,392 Female- 962 (Note: Out of 315, 255 Families were MBC) - Profession :Agriculture - 145 Families Govt. employee - 20 Nos. Business - 6 Nos. Milk animals rearing - 100 Nos. Agri- Labourers - 100 Families. - VFC members Male - 145 Female - 157 - EC Member Male - 8 Female - 6 - Forest dependent 100% dependent - Nil Partial dependent - 75 Families - Type of dependency: Grazing goats, sheep’s, stray cattle, fire wood collection,
GML collection etc; - Resources of the Village :
- Land with irrigation facilities - 150.00 Acre - Dry Land with rain fed cultivation - 347.00 Acre Average Annual Income - Rs.5,000/- -Cattle :Goats - 300 Sheeps - 350 Cow - 225 - Protected water - Elementary School - Tar & Cement Road - Electricity - Ration shop - Milk society
(2) Area of the Project : 250 ha (Lower Zone 150 ha & UZ 100 ha)
(3) Reserve Forest : Kavaramatai R.F. 2,875.08 ha
Type of Forest: Sathan dry thorny Forest (5AC3)
(4) Water shed. : Ponnaiyar water shed
For Official Use Only Special Assistance for Project Formation (SAPROF) for
Uttar Pradesh Natural Resources Management and Poverty Alleviation Project (UPNRMPAP)
Final Report - Volume II Annex 7-17
(5) Afforestation Works:
(i) Planting Works:
(ii) Soil & Moisture Conservation Works: - Percolation Pond constructed : 2 Nos. - Water Storing capacity cspccted : 10,00,000 Cft.
(6) Buffer Zone Work: i) Community Developmental Works: VFC Hall- Proposed ii) Individual Income Generation Activities: iii) Seed money (Loan) given to Vana Mandrams ( Forest SHG) – 5 Nos.
(7) Activities Carried Out: - Tailoring - Milch animal rearing - Coconut Business - Wire bags knitting - Agricultural based works
(8) Financial Implications: Proposed i) Afforestation Works:-
a. Planting Rs. 1,700,000- b. Soil & Moisture Const. Works Rs. 1,000,000-
ii) Buffer Zone Works:- a. Community Developmental Works Rs. 66,000- b. Individual Income Generation Activities Rs. 140,000-
iii) Total Amount Spent in First Year : Rs. 2,900,000- iv) Total Man days generated : 25,000 No- v) Benefit Sharing:1,000 Stunted Tamarind trees may yield 1,000 Kg. Will fetch
Rs. 2,000/- annual revenue roughly.
SI. N0. Species Nos. 1. Syzigium cumin 13,500 2. Emblica officinalis 9,000 3. Terminalia bellerica 6,300 4. Holoptelia integrifolia 5,300 5. Feronia eldphantum 4,500 6. Terminalia arjuma 3,600 7. Bassia latifolia 3,300 8. Zizyphus jujube 2,000 9. Acgle marmelos 1,900
10. Sapindus emarginatus 1,600 11. Ficus spp, 1,500 12. Carissa macrophylla 1,500 13. Dendrocalamus strictus 1,000
Total Nos. 55,000
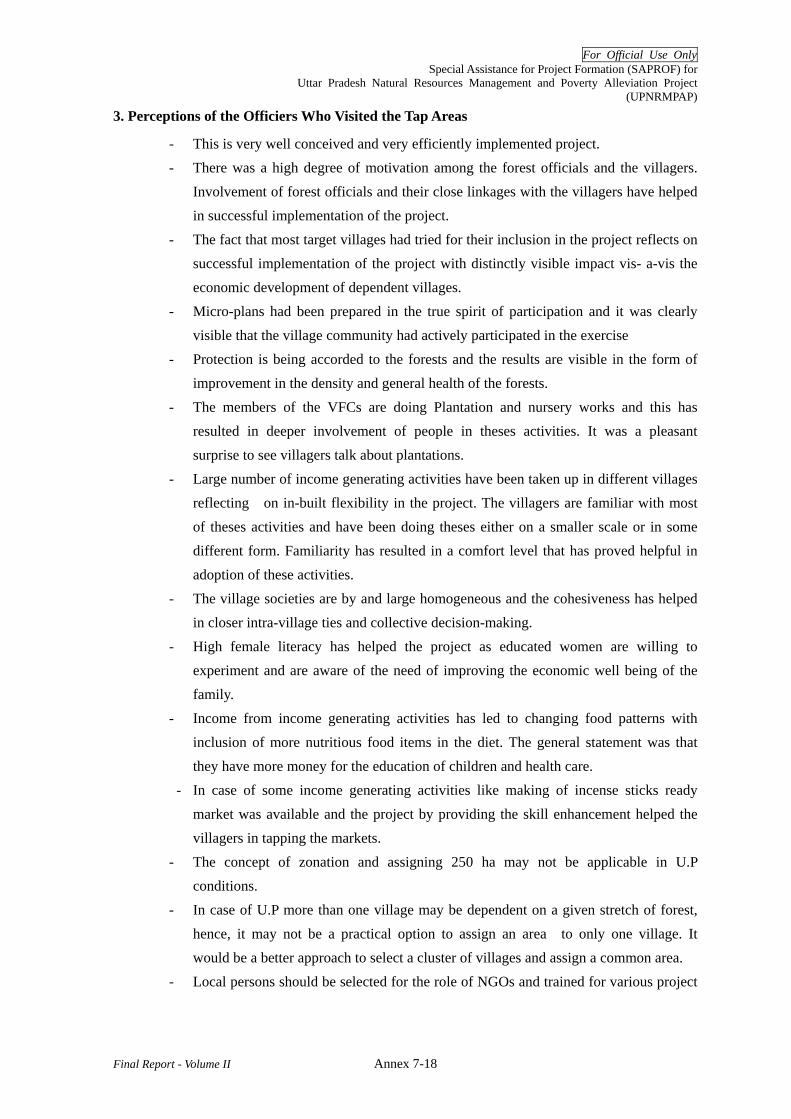
For Official Use Only Special Assistance for Project Formation (SAPROF) for
Uttar Pradesh Natural Resources Management and Poverty Alleviation Project (UPNRMPAP)
Final Report - Volume II Annex 7-18
3. Perceptions of the Officiers Who Visited the Tap Areas
- This is very well conceived and very efficiently implemented project. - There was a high degree of motivation among the forest officials and the villagers.
Involvement of forest officials and their close linkages with the villagers have helped in successful implementation of the project.
- The fact that most target villages had tried for their inclusion in the project reflects on successful implementation of the project with distinctly visible impact vis- a-vis the economic development of dependent villages.
- Micro-plans had been prepared in the true spirit of participation and it was clearly visible that the village community had actively participated in the exercise
- Protection is being accorded to the forests and the results are visible in the form of improvement in the density and general health of the forests.
- The members of the VFCs are doing Plantation and nursery works and this has resulted in deeper involvement of people in theses activities. It was a pleasant surprise to see villagers talk about plantations.
- Large number of income generating activities have been taken up in different villages reflecting on in-built flexibility in the project. The villagers are familiar with most of theses activities and have been doing theses either on a smaller scale or in some different form. Familiarity has resulted in a comfort level that has proved helpful in adoption of these activities.
- The village societies are by and large homogeneous and the cohesiveness has helped in closer intra-village ties and collective decision-making.
- High female literacy has helped the project as educated women are willing to experiment and are aware of the need of improving the economic well being of the family.
- Income from income generating activities has led to changing food patterns with inclusion of more nutritious food items in the diet. The general statement was that they have more money for the education of children and health care.
- In case of some income generating activities like making of incense sticks ready market was available and the project by providing the skill enhancement helped the villagers in tapping the markets.
- The concept of zonation and assigning 250 ha may not be applicable in U.P conditions.
- In case of U.P more than one village may be dependent on a given stretch of forest, hence, it may not be a practical option to assign an area to only one village. It would be a better approach to select a cluster of villages and assign a common area.
- Local persons should be selected for the role of NGOs and trained for various project
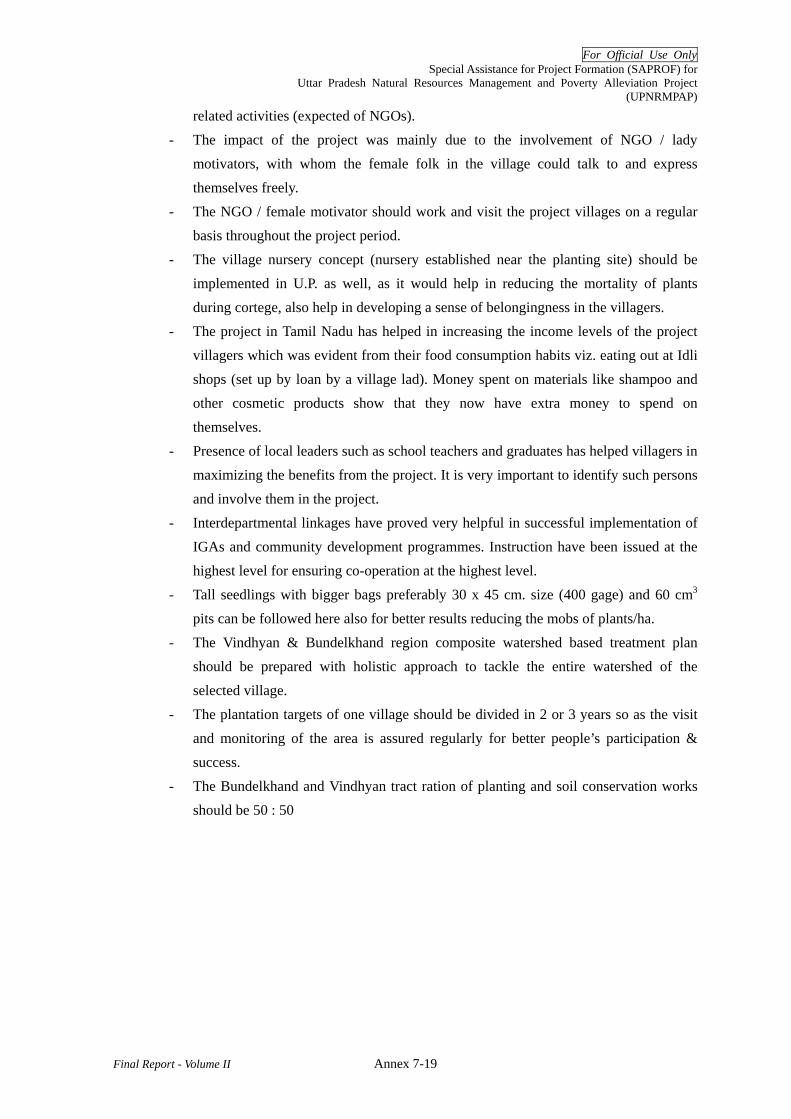
For Official Use Only Special Assistance for Project Formation (SAPROF) for
Uttar Pradesh Natural Resources Management and Poverty Alleviation Project (UPNRMPAP)
Final Report - Volume II Annex 7-19
related activities (expected of NGOs). - The impact of the project was mainly due to the involvement of NGO / lady
motivators, with whom the female folk in the village could talk to and express themselves freely.
- The NGO / female motivator should work and visit the project villages on a regular basis throughout the project period.
- The village nursery concept (nursery established near the planting site) should be implemented in U.P. as well, as it would help in reducing the mortality of plants during cortege, also help in developing a sense of belongingness in the villagers.
- The project in Tamil Nadu has helped in increasing the income levels of the project villagers which was evident from their food consumption habits viz. eating out at Idli shops (set up by loan by a village lad). Money spent on materials like shampoo and other cosmetic products show that they now have extra money to spend on themselves.
- Presence of local leaders such as school teachers and graduates has helped villagers in maximizing the benefits from the project. It is very important to identify such persons and involve them in the project.
- Interdepartmental linkages have proved very helpful in successful implementation of IGAs and community development programmes. Instruction have been issued at the highest level for ensuring co-operation at the highest level.
- Tall seedlings with bigger bags preferably 30 x 45 cm. size (400 gage) and 60 cm3 pits can be followed here also for better results reducing the mobs of plants/ha.
- The Vindhyan & Bundelkhand region composite watershed based treatment plan should be prepared with holistic approach to tackle the entire watershed of the selected village.
- The plantation targets of one village should be divided in 2 or 3 years so as the visit and monitoring of the area is assured regularly for better people’s participation & success.
- The Bundelkhand and Vindhyan tract ration of planting and soil conservation works should be 50 : 50

For Official Use Only Special Assistance for Project Formation (SAPROF) for
Uttar Pradesh Natural Resource Management and Poverty Alleviation Project (UPNRMPAP)
Final Report- Volume II
Special Assistance for Project Formation
for Uttar Pradesh Natural Resource Management and Poverty Alleviation Project
(UPNRMPAP)
Final Report
Volume II: ANNEXES
ANNEX-8 STUDY ON INSTITUTIONAL
ARRANGEMENT
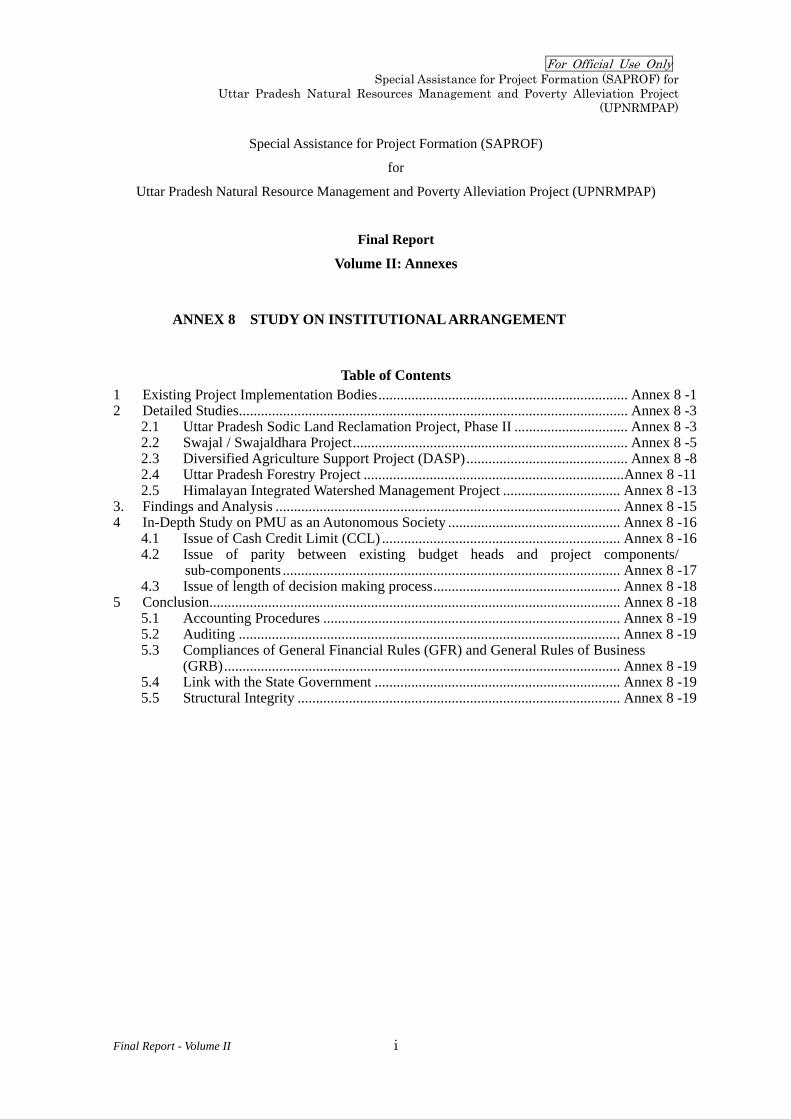
For Official Use Only Special Assistance for Project Formation (SAPROF) for
Uttar Pradesh Natural Resources Management and Poverty Alleviation Project (UPNRMPAP)
Final Report - Volume II i
Special Assistance for Project Formation (SAPROF)
for
Uttar Pradesh Natural Resource Management and Poverty Alleviation Project (UPNRMPAP)
Final Report
Volume II: Annexes
ANNEX 8 STUDY ON INSTITUTIONAL ARRANGEMENT
Table of Contents 1 Existing Project Implementation Bodies.................................................................... Annex 8 -1 2 Detailed Studies.......................................................................................................... Annex 8 -3
2.1 Uttar Pradesh Sodic Land Reclamation Project, Phase II ............................... Annex 8 -3 2.2 Swajal / Swajaldhara Project........................................................................... Annex 8 -5 2.3 Diversified Agriculture Support Project (DASP)............................................ Annex 8 -8 2.4 Uttar Pradesh Forestry Project .......................................................................Annex 8 -11 2.5 Himalayan Integrated Watershed Management Project ................................ Annex 8 -13
3. Findings and Analysis .............................................................................................. Annex 8 -15 4 In-Depth Study on PMU as an Autonomous Society ............................................... Annex 8 -16
4.1 Issue of Cash Credit Limit (CCL) ................................................................. Annex 8 -16 4.2 Issue of parity between existing budget heads and project components/
sub-components ............................................................................................ Annex 8 -17 4.3 Issue of length of decision making process................................................... Annex 8 -18
5 Conclusion................................................................................................................ Annex 8 -18 5.1 Accounting Procedures ................................................................................. Annex 8 -19 5.2 Auditing ........................................................................................................ Annex 8 -19 5.3 Compliances of General Financial Rules (GFR) and General Rules of Business (GRB)............................................................................................................ Annex 8 -19 5.4 Link with the State Government ................................................................... Annex 8 -19 5.5 Structural Integrity ........................................................................................ Annex 8 -19
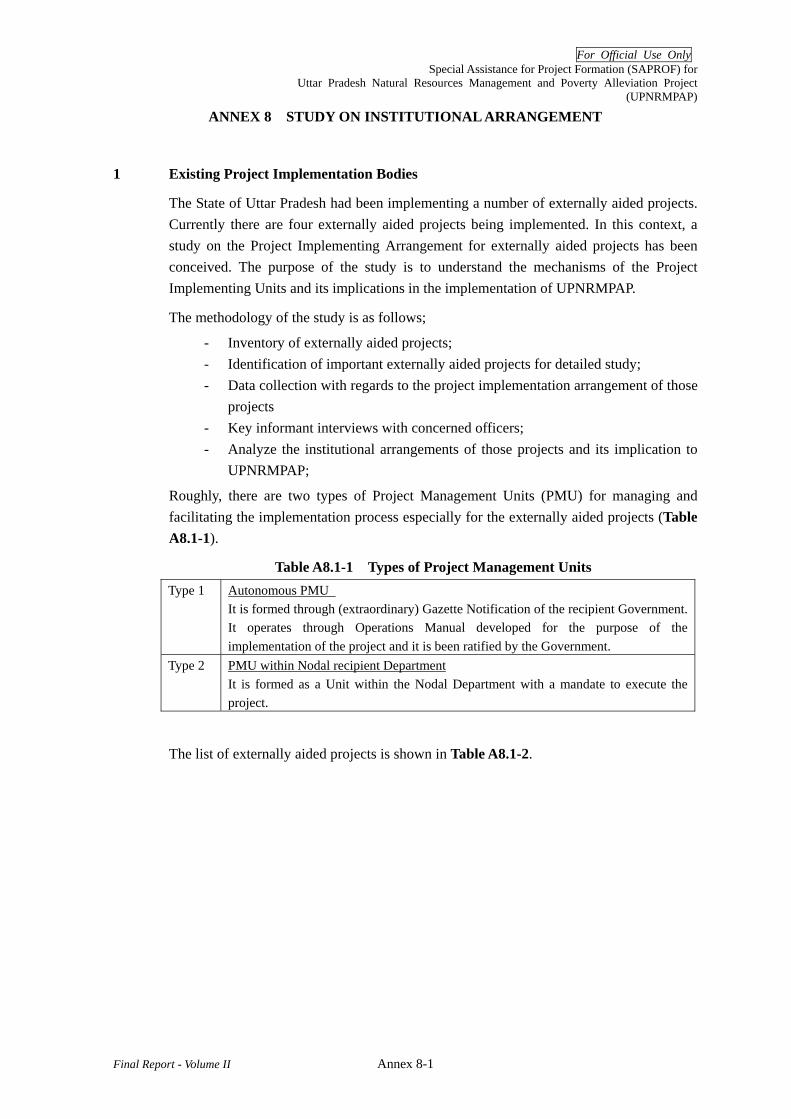
For Official Use Only Special Assistance for Project Formation (SAPROF) for
Uttar Pradesh Natural Resources Management and Poverty Alleviation Project (UPNRMPAP)
Final Report - Volume II Annex 8-1
ANNEX 8 STUDY ON INSTITUTIONAL ARRANGEMENT
1 Existing Project Implementation Bodies
The State of Uttar Pradesh had been implementing a number of externally aided projects. Currently there are four externally aided projects being implemented. In this context, a study on the Project Implementing Arrangement for externally aided projects has been conceived. The purpose of the study is to understand the mechanisms of the Project Implementing Units and its implications in the implementation of UPNRMPAP.
The methodology of the study is as follows;
- Inventory of externally aided projects; - Identification of important externally aided projects for detailed study; - Data collection with regards to the project implementation arrangement of those
projects - Key informant interviews with concerned officers; - Analyze the institutional arrangements of those projects and its implication to
UPNRMPAP;
Roughly, there are two types of Project Management Units (PMU) for managing and facilitating the implementation process especially for the externally aided projects (Table A8.1-1).
Table A8.1-1 Types of Project Management Units Type 1 Autonomous PMU
It is formed through (extraordinary) Gazette Notification of the recipient Government. It operates through Operations Manual developed for the purpose of the implementation of the project and it is been ratified by the Government.
Type 2 PMU within Nodal recipient Department It is formed as a Unit within the Nodal Department with a mandate to execute the project.
The list of externally aided projects is shown in Table A8.1-2.

For Official Use Only Special Assistance for Project Formation (SAPROF) for
Uttar Pradesh Natural Resources Management and Poverty Alleviation Project (UPNRMPAP)
Final Report - Volume II Annex 8-2
Table A8.1-2 List of Externally Aided Projects
Project Implementing Agency Donor Name of PMU Type of PMU
ON-GOING 1 UP Sodic Land
Reclamation Project, Phase II
Uttar Pradesh Bhumi Sudhar Nigam
World Bank
Uttar Pradesh Bhumi Sudhar Nigam
Autonomous Corporation registered under Section 25 of Company Act 1956
2 UP Water Sector Restructuring Project
Irrigation Department
World Bank
Project Activity Core Team (PACT)
Lies within the department specifically implementing this project
3 UP State Roads Project Phase I
Public Works Department
World Bank
SRP-II Implementation Unit
Lies within the department specifically implementing this project
4 UP Health Systems Development Project
Medical & Public Health Department
World Bank
Project Management Unit
Autonomous agency registered under Society registration act of 1860
6 SWAJALDHARA Project
Rural Development
World Bank
State Water Supply & Sanitation Mission (SWM)
Autonomous agency registered under Society registration act of 1860
COMPLETED 7 UP Sodic Land
Reclamation Project, Phase I
Uttar Pradesh Bhumi Sudhar Nigam
World Bank
Uttar Pradesh Bhumi Sudhar Nigam
Autonomous Corporation registered under Section 25 of Company Act 1956
8 SWAJAL Project Rural Development
World Bank
Project Management Unit
Autonomous agency registered under Society registration act of 1860
9 Diversified Agricultural Support Programme (DASP)
Agriculture Department
World Bank
Project Coordination Unit
Lies within within Office of Agricultural Production Commissioner (APC) specifically implementing this project
10 Uttar Pradesh Forestry Project
Forest Department
World Bank
Project Unit Lies within the department specifically implementing this project
11 Himalayan Integrated Watershed Management Project
Watershed Management Directorate of Hill Development Department
World Bank
No PMU initially, then Unified Command
Lies within the department specifically implementing this project
For the detailed study on the existing and previous project implementation arrangement for externally-aided projects in UP, the projects below were considered to be most relevant to UPNRMPAP and selected among all the projects listed the table above:
1. Uttar Pradesh Sodic Land Reclamation Project Phase I / II 2. Swajaldhahara / Swajal Project 3. Diversified Agricultural Support Programme (DASP) 4. Uttar Pradesh Forestry Project 5. Himalayan Integrated Watershed Development Project (Shiwalik Project)

For Official Use Only Special Assistance for Project Formation (SAPROF) for
Uttar Pradesh Natural Resources Management and Poverty Alleviation Project (UPNRMPAP)
Final Report - Volume II Annex 8-3
2 Detailed Studies
The chosen projects have been studied in depth mainly to understand the institutional arrangements that guided the implementation process.
2.1 Uttar Pradesh Sodic Land Reclamation Project, Phase II
The State has been implementing reclamation of sodic lands through World Bank assisted Uttar Pradesh Sodic Land Reclamation Project (UPSLRP) since 1993. The duration of Phase II project is 1999–2007.
The objective of the project is to reclaim sustainably the sodic lands and further prevention sodicity in the selected project districts which will contribute poverty alleviation. The project is being implemented in the 17 districts of Uttar Pradesh namely Aligarh , Auriya, Azamgarh, Allahabad , Bullandshar, Etah, Etawah, Fatehpur, Hardoi, Hathras, Jaunpur, Kanpur , Mainpuri, Pratapgarh, Raebarely, Sultanpur and Unnao. The total financial outlay of this project is Rs. 12,965.1 million out of which World Bank has contributed Rs. 8,568.4 million.
The target set for the project is as follows;
- Land reclamation and On-farm development in 150,000 ha; - Drainage line rehabilitation of 7,000 km; - 720 km of access road and Construction of 1,252 Panchayat Building
During the Phase I of the project, an area of 68,414 ha of sodic land had been reclaimed. In the on-going Phase II, 126,780 ha of sodic land have been treated so far. In the on-going Phase-II programme, 126,780 ha has so far been treated.
This project has been designed and developed on experiences gained through execution of several projects operated earlier, with an aim to develop a replicable model. Therefore project design allowed changes based on implementation experiences and farmers participation. Considering the importance of retaining the flexible nature of the project, it has been decided to implement this project through UP Bhumi Sudhar Nigam, a Government owned corporation. The autonomous agency then could easily amend and improve implementation procedures as per the requirement of the project. In the Phase II, certain noticeable changes have been made in implementation such as;
- Cost sharing by participating farmers; - Privatization of services; - Quality control through external agencies.
Project Implementing Unit
The Uttar Pradesh Sodic Land Reclamation Project (UPSLRP) has been implemented through Uttar Pradesh Bhumi Sudhar Nigam. The Nigam has been formed to implement this project as an autonomous agency and registered under Section 25 of Company Act of 1956. Section 25 of Company Act provides the not-for-profit status. The major difference between not-for-profit society mode and Section 25 of company Act is that the former can
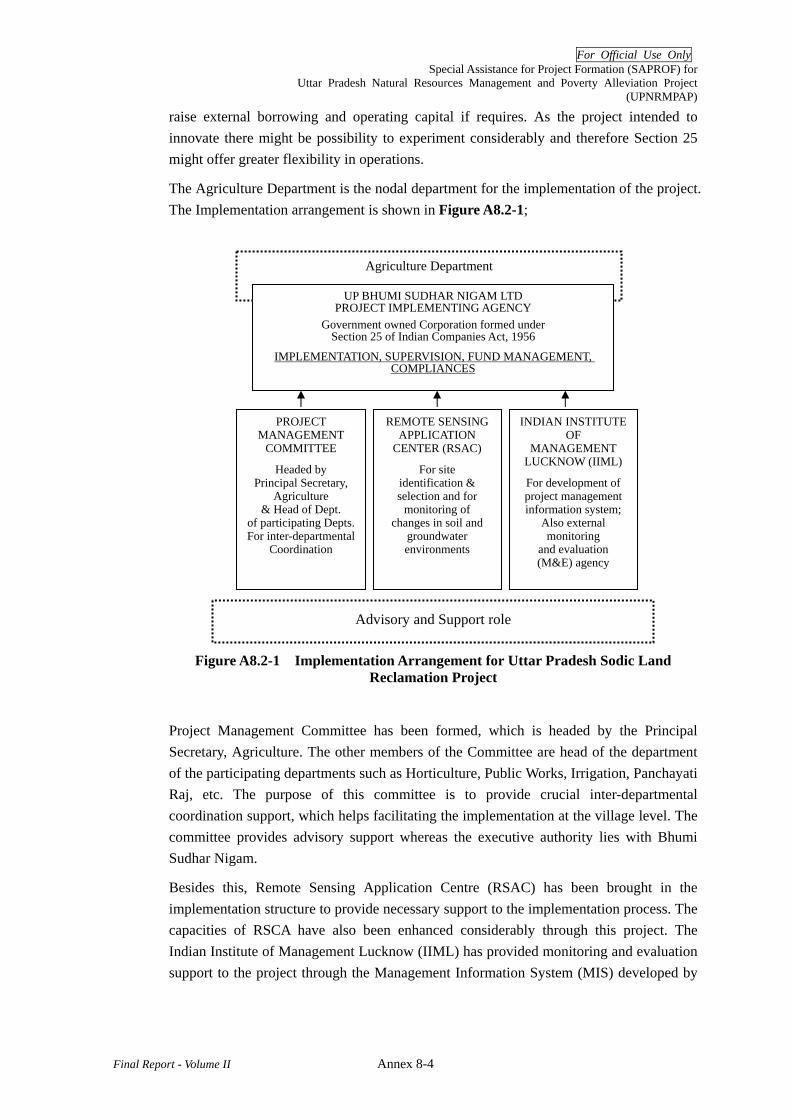
For Official Use Only Special Assistance for Project Formation (SAPROF) for
Uttar Pradesh Natural Resources Management and Poverty Alleviation Project (UPNRMPAP)
Final Report - Volume II Annex 8-4
raise external borrowing and operating capital if requires. As the project intended to innovate there might be possibility to experiment considerably and therefore Section 25 might offer greater flexibility in operations.
The Agriculture Department is the nodal department for the implementation of the project. The Implementation arrangement is shown in Figure A8.2-1;
Figure A8.2-1 Implementation Arrangement for Uttar Pradesh Sodic Land
Reclamation Project
Project Management Committee has been formed, which is headed by the Principal Secretary, Agriculture. The other members of the Committee are head of the department of the participating departments such as Horticulture, Public Works, Irrigation, Panchayati Raj, etc. The purpose of this committee is to provide crucial inter-departmental coordination support, which helps facilitating the implementation at the village level. The committee provides advisory support whereas the executive authority lies with Bhumi Sudhar Nigam.
Besides this, Remote Sensing Application Centre (RSAC) has been brought in the implementation structure to provide necessary support to the implementation process. The capacities of RSCA have also been enhanced considerably through this project. The Indian Institute of Management Lucknow (IIML) has provided monitoring and evaluation support to the project through the Management Information System (MIS) developed by
Agriculture Department
UP BHUMI SUDHAR NIGAM LTDPROJECT IMPLEMENTING AGENCY
Government owned Corporation formed under Section 25 of Indian Companies Act, 1956
IMPLEMENTATION, SUPERVISION, FUND MANAGEMENT, COMPLIANCES
PROJECT MANAGEMENT
COMMITTEE
Headed by Principal Secretary,
Agriculture & Head of Dept.
of participating Depts. For inter-departmental
Coordination
REMOTE SENSING APPLICATION
CENTER (RSAC)
For site identification & selection and for
monitoring of changes in soil and
groundwater environments
INDIAN INSTITUTE OF
MANAGEMENT LUCKNOW (IIML)
For development of project management information system;
Also external monitoring
and evaluation (M&E) agency
Advisory and Support role

For Official Use Only Special Assistance for Project Formation (SAPROF) for
Uttar Pradesh Natural Resources Management and Poverty Alleviation Project (UPNRMPAP)
Final Report - Volume II Annex 8-5
IIML through the project. Being one of premier management institute of the country the inputs would actually helped the project immensely.
The project has been implemented through a hierarchy where a state-level unit coordinates the overall activities and the district-level units (extension offices of Bhumi Sudhar Nigam) coordinate and facilitate the village-level implementation. Krishi Vigyan Kendra of Indian Council of Agriculture Research, local NGOs and Regional Institute of Rural Development have been involved as support agencies to facilitate the implementation process both at district as well as village level. Implementation flow is shown in Figure A8.2-2.
Figure A8.2-2 Implementation Flow of Uttar Pradesh Sodic Land Reclamation
Project
The prominent features of PMU are as follows;
- The Implementation Agency (UPBSN Ltd.) is autonomous in nature by the provision of Section 25 of Indian Company Act, 1956;
- Section 25 of Company Act signifies ‘not-for-profit’ status; - Registered under Company Act provides larger financial independence in terms
of raising external borrowing/ operating capital etc., if required; - Though formed to implement World Bank Project, being autonomous it is now
implementing other programmes as well e.g., Swa-shakti, Ravine Project etc.
2.2 Swajal / Swajaldhara Project
The Government of Uttar Pradesh with World Bank assistance had implemented an integrated rural water supply and environmental sanitation project in 1,000 villages in 19 districts of the State, twelve districts of which were located at the Kumaon and Garhwal hills (now in Uttarakhand) and seven districts were at the Bundelkhand region. The project duration was six years between 1996 and 2002. The total cost of the project was US$ 71 million ( Rs. 3007.6 million), of which the share of World Bank was 84%, State Government 5% and the community 11%.
The main objectives of the project are to:
- Assist the GoUP to identify and implement an appropriate policy framework to
UP BHUMI SUDHAR NIGAM LTD
UP BSN LTD: DISTRICT LEVEL OFFICE
STE IMPLEMNTATION
COMMITTEE
WATER USERS’ GROUP
State
District
Village
Support agencies
Regional Institute of Rural
Development
NGO
Krishi Vigyan Kendra

For Official Use Only Special Assistance for Project Formation (SAPROF) for
Uttar Pradesh Natural Resources Management and Poverty Alleviation Project (UPNRMPAP)
Final Report - Volume II Annex 8-6
promote long term sustainability of the Rural Water Supply and Environmental Sanitation sector;
- Deliver sustainable health and hygiene benefits to the rural population through improvements in water supply and environmental sanitation;
- Improve rural incomes through time savings and income earning opportunities for women;
- Test alternatives to the current supply driven service delivery mechanism; and - Promote sanitation and gender awareness.
The target villages were being selected on the basis of criteria (such as demand, need, technical factors etc). There were four stages or batches with 90, 260, 325 and 325 villages covered respectively. The project cycle of each batch has three distinct phases: pre-planning, planning and implementation. The length of the project cycle is around 33 months with each batch overlapping one another.
The Project was a major innovative experiment in community participation, community procurement and partial capital cost recovery in water supply systems. Short-listed NGOs (Support Organisations) assisted village communities in planning and construction of their schemes. Communities were expected to share about 10% in the capital cost and 100% of O & M cost for the water supply systems. Subsidy up to Rs. 2,250 was given in constructing individual sanitation facilities, such as household sanitary latrines.
Project Implementing Unit
The Project Management Unit (PMU) was located at Lucknow and was registered under the Society Registration Act. The PMU has been formed under the Rural Development Department of Government of Uttar Pradesh with the following members such as;
- Chairperson – Agricultural Production Commissioner - Vice- Chairperson – Principal Secretary, Rural Development - A full-time Director at Lucknow.
There were two District Project Management Units (DPMUs) to facilitate project management and operations in the Bundelkhand Region. In every project village, a Village Water and Sanitation Committee is formed and functions as a sub-committee of the Gram Panchayat and is responsible for the projects planning, implementation, operation and maintenance at the community level.
The Project Implementation mechanism is shown in Figure A8.2-3.

For Official Use Only Special Assistance for Project Formation (SAPROF) for
Uttar Pradesh Natural Resources Management and Poverty Alleviation Project (UPNRMPAP)
Final Report - Volume II Annex 8-7
Figure A8.2-3 Implementation Arrangement of Swajal Project
The project has been implemented successfully, and the factor attributed to the success among other reasons was the PMU being autonomous in nature, which has provided leadership effectively in implementation.
The institutional mechanism of this project has been widely recognized, and the Central Government of India has adopted a similar project implementing arrangement for the flagship programme called “Swajaldhara”. The PMU has been converted to State Water Supply & Sanitation Mission (SWM) for the implementation of Swajaldhara programme. SWM after completion of World Bank project has been successfully implementing Swajaldhara programme, providing post-project sustainability. SWM is currently implementing Swajaldhara programme in 54 districts. The structure of SWM is shown in Figure A8.2-4.
Project holder- Nodal Department: Rural Development Department
State level PROJECT MANAGEMENT UNIT (PMU)
Autonomous Society Responsibilities:
Implementation, Supervision, Fund Management, Compliances
District level DISTRICT PROJECT MANAGEMENT UNIT (DPMU)
Responsibilities: Facilitation to project management & operations
NGOs
Responsibilities: Support towards community mobilization
Village level VILLAGE WATER &
SANITATION COMMITTEE (VWSC)
Responsibilities: Planning, Implementation, O&M

For Official Use Only Special Assistance for Project Formation (SAPROF) for
Uttar Pradesh Natural Resources Management and Poverty Alleviation Project (UPNRMPAP)
Final Report - Volume II Annex 8-8
Figure A8.2-4 Structure of State Water Supply and Sanitation Mission
The prominent features of this institutional arrangement are as follows;
- PMU and now WSM being registered under Society Registration Act 1860 provides autonomy in terms of overall functioning (planning, execution, fund management, procurement, human resource planning etc.);
- PMU being autonomous the transformation from PMU to WSM becomes relatively easier and smooth;
- SWM independently approaches Donors for funding as SWM has recently been developing proposals;
2.3 Diversified Agriculture Support Project (DASP)
The Diversified Agriculture Support Project (DASP) was implemented by the Agriculture Department between 1998/99 and 2003/04 with financial assistance from the World Bank. The major objective of this intervention was to increase agricultural productivity through support for diversified agricultural production systems, promoting private sector development and strengthening rural infrastructure. The project had been implemented in 6,128 villages of 32 districts in UP. The total outlay of the project was US$130 million.
The project aimed to:
- Integrate project investments with policies and legislative/regulatory framework that facilitates rationalization of public and private sector roles in the diversification process;
- Strengthen the delivery mechanism of agricultural services to exploit market-led opportunities for growth in horticulture, livestock and sericulture production and agro-processing in order to alleviate poverty and support environmentally sustainable development;
The Structure of State Water Supply & Sanitation Mission Registered Society
APEX COMMITTEE
Chair: Chief Secretary, GoUP
Highest Decision Making Body
EXECUTIVE COMMITTEE Chair: Principal Secretary, Rural Development, GoUP
Highest Implementing Body
DISTRICT WS COMMITTEE Chair: CEO, ZILLA PANCHAYAT
VILLAGE WS COMMITTEE Chair: SAPPANCH, GRAM PANCHAYAT

For Official Use Only Special Assistance for Project Formation (SAPROF) for
Uttar Pradesh Natural Resources Management and Poverty Alleviation Project (UPNRMPAP)
Final Report - Volume II Annex 8-9
- Create conducive environment for greater private investment in this sector; - Support the expansion and rehabilitation of rural infrastructure, and foster
Panchayat Raj institutions, NGOs, and beneficiary participation for devolution of responsibility for sustainable management of rural assets.
The components of the project were as follows (% below signifies the volume of outlay in each component);
- Technology development (11%); - Demand-driven technology dissemination system (24%); - Rural infrastructure development (42%); - Public-private partnerships (3%); - Project management and capacity for policy analysis (10%)
The achievement of the intervention is as follows;
Institutional Aspects
- From commodity-driven approach to production systems approach; - From supply-driven to demand-driven extension programmes; - More explicit focus to link farmers to financial institutions; - 17,906 Self Help Groups formed of small and marginal farmers. More than Rs.
210 millions saving had been mobilized in the groups. Group members had inter-loaning of more than Rs. 370 million for different income generating activities.
Productivity Aspects
- Increase in crop productivity (10%), milk productivity (25%) and cropping intensity (between 169% and 203%);
- Successful para-veterinarian scheme – 1,300 trained para-veterinarian providing door-to-door animal husbandry services;
- Significant diversification of area out of cereals into vegetables and other higher value crops
Rural Infrastructure Aspects
- 114 rural markets have been constructed. - 2,728 km of rural roads have been improved.
The Project Management Unit
A Project Coordination Unit (PCU) was established within the Agriculture Production Commissioner’s office. Secretary Coordination was headed the PCU and was supported by the Technical Coordinator and various Technical Experts. The PCU’s role is to manage the project activities and liaison with various stakeholders. The respective line departments were involved as Project Implementation Units for implementing the project activities.
At district level for managing the project activities, the District Project Coordinators (DPCs) were responsible. The implementation of activities at the village level had been

For Official Use Only Special Assistance for Project Formation (SAPROF) for
Uttar Pradesh Natural Resources Management and Poverty Alleviation Project (UPNRMPAP)
Final Report - Volume II Annex 8-10
carried out by an agency called “Agriculture Technology Management Agency (ATMA)”, specifically formed for the implementation of the projects. Unlike the state-level PCU, ATMA had been registered as an autonomous society (Figure A8.2-5).
Figure A8.2-5 Implementation Arrangement of Diversified Agriculture Support Project
The Phase II of this project has been proposed to World Bank. It would cover all 70 districts in the State (32 phase I districts from the first UPDASP, and 38 new phase II districts). The duration of the proposed Phase II will be of 5 years with the outlay of US$ 175 million. The objectives of the Phase II would broadly be similar to that of Phase I but greater emphasis will be given to enhance market opportunities and market access for farmers, fishers and livestock producers.
Distinguishing features of the PMU are as follows;
- State level Implementing Agency (PCU) lies within Government but district level implementation done through autonomous agency i.e., ATMA registered as Society under Society Registration Act;
- Inter-department coordination being key to the success of this project, the PCU created within APC’s office;
- ATMA has been formed to decentralize the process of planning and implementation at the district level;
Nodal Department: Agriculture Department, GoUP
State level PROJECT COORDINATION UNIT (PCU)
IMPLEMENTATION, SUPERVISION, FUND MANAGEMENT,
COMPLIANCES
State levelPROJECT IMPLEMENTATION UNIT (PIU)
Full-time Nodal Officer of each Participating Line Department
e.g., Agriculture, Horticulture, Animal Husbandry, Food Processing, Fishery, Dairy
TECHNICAL SUPPORT
District levelDISTRICT PROJECT COORDINATOR
District level AGRICULTURE TECNOLOGY MANAGEMENT AGENCY
(ATMA) Registered Society
Governing Body – Chair: District Collector/ Magistrate Management Committee (Executive Body) – Chair: Chief
Development Officer PLANNING, IMPLEMENTATION, FUND DISBURSEMENT,
MONITORING
Village levelBeneficiary Farmers (Farmer Field School approach)

For Official Use Only Special Assistance for Project Formation (SAPROF) for
Uttar Pradesh Natural Resources Management and Poverty Alleviation Project (UPNRMPAP)
Final Report - Volume II Annex 8-11
- After the completion of the project, the PCU will cease to function but ATMA will continue functioning and can implement projects independently. It can also provide core support of decentralized participatory capacity building support to various programmes.
2.4 Uttar Pradesh Forestry Project
UP Forestry Project had started on 1998 and continued up to 2003. It was funded by the World Bank. The goal of the project was to assist with the implementation of GoUP strategy for development of the forestry sector in Uttar Pradesh. The specific objectives of the project were as follows;
- To introduce necessary changes in the process and to develop human resources for the planning, implementation and monitoring of the strategy;
- To ensure that management processes and the structure and resources of UPFD are appropriate to its role as model public sector agency in the forestry sector;
- To assist with the prioritization of various types of land through improved planning at a macro scale;
- To increase both forest cover and productivity through development of participatory processes of management and use of forest resources, taking special account of the interests of disadvantaged groups;
- To adapt and improve existing technologies and to provide technical and management advice;
- To assist with the privatization of forest produces through improving incentives for forest management and the cultivation of trees; and
- To promote the conservation of biodiversity.
The Project had four major activities such as
- Institutional development; - Forest development; - Research & Technology; and - Biodiversity conservation
The project implementation set up was as shown in Figure A8.2-6:
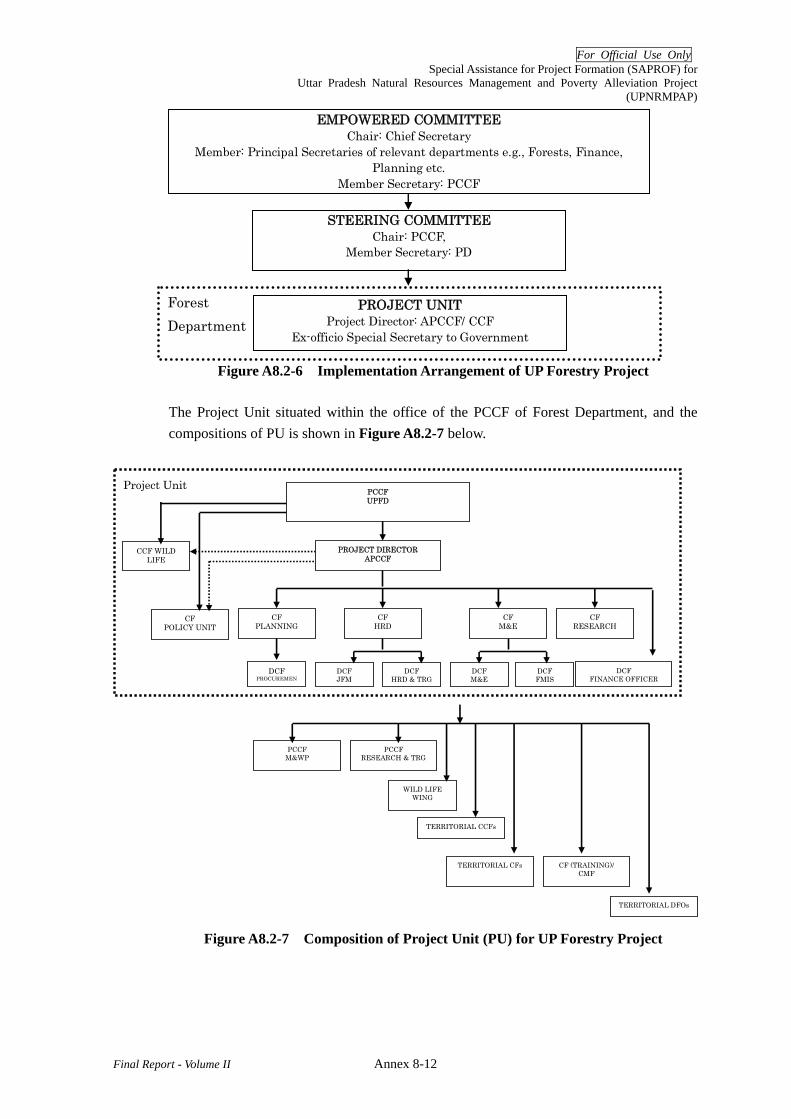
For Official Use Only Special Assistance for Project Formation (SAPROF) for
Uttar Pradesh Natural Resources Management and Poverty Alleviation Project (UPNRMPAP)
Final Report - Volume II Annex 8-12
Figure A8.2-6 Implementation Arrangement of UP Forestry Project
The Project Unit situated within the office of the PCCF of Forest Department, and the compositions of PU is shown in Figure A8.2-7 below.
Figure A8.2-7 Composition of Project Unit (PU) for UP Forestry Project
Project Unit
PCCF M&WP
PCCF RESEARCH & TRG
WILD LIFE WING
TERRITORIAL CCFs
TERRITORIAL CFs CF (TRAINING)/ CMF
TERRITORIAL DFOs
PCCF UPFD
PROJECT DIRECTOR APCCF
CCF WILD LIFE
CF POLICY UNIT
CF PLANNING
CF HRD
CF M&E
DCF FINANCE OFFICER
DCF FMIS
DCF M&E
DCF HRD & TRG
DCF JFM
DCF PROCUREMEN
CF RESEARCH
EMPOWERED COMMITTEE Chair: Chief Secretary
Member: Principal Secretaries of relevant departments e.g., Forests, Finance, Planning etc.
Member Secretary: PCCF
PROJECT UNIT Project Director: APCCF/ CCF
Ex-officio Special Secretary to Government
Forest Department
STEERING COMMITTEE Chair: PCCF,
Member Secretary: PD

For Official Use Only Special Assistance for Project Formation (SAPROF) for
Uttar Pradesh Natural Resources Management and Poverty Alleviation Project (UPNRMPAP)
Final Report - Volume II Annex 8-13
The distinguishing features of the Project Management Unit, which is in this case known as Project Unit, are as follows;
Project Unit, which was made specifically for the implementation of the UP Forestry project was situated within the Forest Department, particularly within the Office of the PCCF, UP;
The Uttar Pradesh Forestry Project dealt with process change, which contributed to (i) change in the role of UPFD; (ii) change in management systems; and (iii) human resource development. Project Unit being within Forest Department had in fact facilitated these processes effectively;
2.5 Himalayan Integrated Watershed Management Project
Himalayan IWMP had started in 1983/84 and last till the end of 1992 in the hills of Uttar Pradesh. It was implemented by the Watershed Management Directorate of Hill Development Department of Government of Uttar Pradesh (undivided UP at that time) with the financial assistance from the World Bank (The Watershed Management Directorate of Hill Development Department remained in Uttarkhand after the separation. There is no such department in UP today). The loan from the Bank was of US$ 30.2 million, and the project areas spread over the following areas e.g., Nayar Watershed (part of district Pauri, Chamoli) and Panar Watershed (part of district Almora & Pithoragarh) covering an area of 2,867 km2. The entire project was consisted of 75 micro watersheds.
In the hills, about 70% of the population was engaged in agriculture which is the most dominant source of livelihood. The land holdings were small and scattered. Agriculture was basically rainfed and subsistent in nature. The soils were fragile in nature with steep slopes and highly prone to soil erosion during monsoon season. Rural infrastructure facilities were inadequate to meet the requirement of rural communities. Under this situation, for enhancing productivity and provide food security to these rainfed areas, comprehensive watershed development approach to conserve soil and water resources and improve the dry land crops was deemed as one of the most viable solutions.
The IWMP was implemented by the Watershed Management Directorate without a separate project management unit, where the nodal recipient department was Hill Development Department. Initially, there were 6 departments involved in the project as Project Implementing Agency (PIA) e.g., Forest, Agriculture, Horticulture, Animal Husbandry, Soil Conservation and Minor Irrigation (Figure A8.2-8). The Watershed Management Directorate allocated funds to the PIA departments for the implementation, and the responsibilities of monitoring rested with the Directorate.
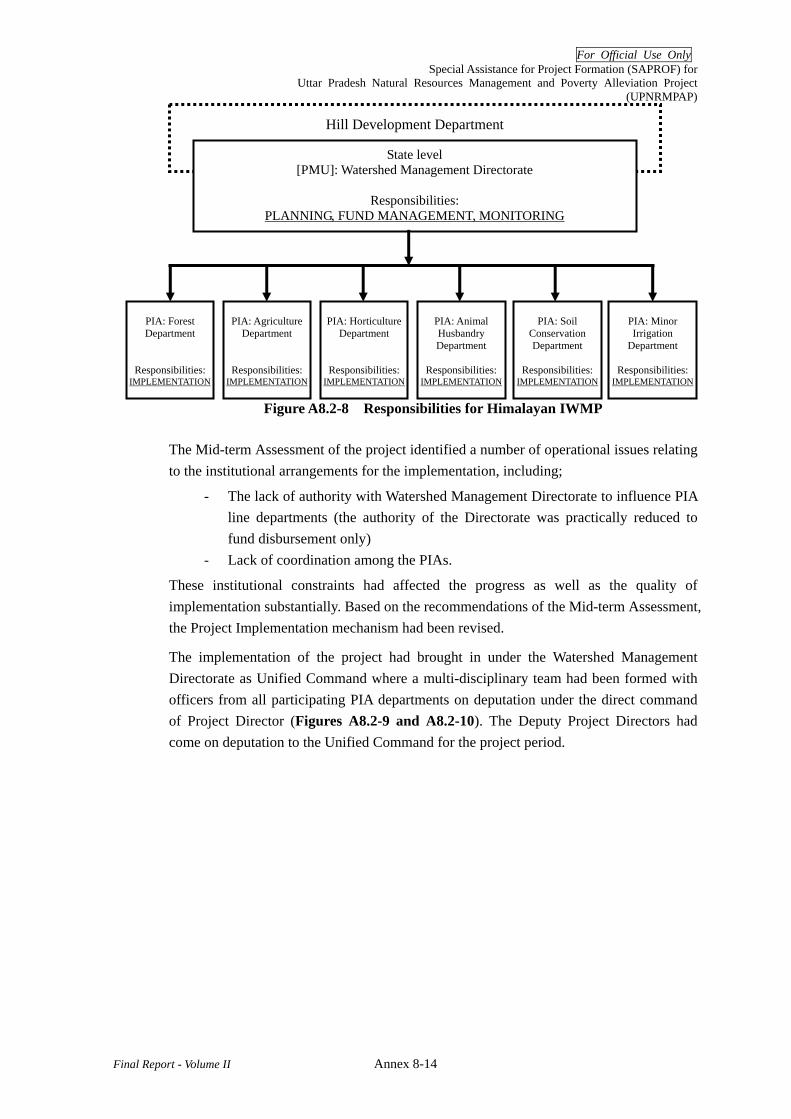
For Official Use Only Special Assistance for Project Formation (SAPROF) for
Uttar Pradesh Natural Resources Management and Poverty Alleviation Project (UPNRMPAP)
Final Report - Volume II Annex 8-14
Figure A8.2-8 Responsibilities for Himalayan IWMP
The Mid-term Assessment of the project identified a number of operational issues relating to the institutional arrangements for the implementation, including;
- The lack of authority with Watershed Management Directorate to influence PIA line departments (the authority of the Directorate was practically reduced to fund disbursement only)
- Lack of coordination among the PIAs.
These institutional constraints had affected the progress as well as the quality of implementation substantially. Based on the recommendations of the Mid-term Assessment, the Project Implementation mechanism had been revised.
The implementation of the project had brought in under the Watershed Management Directorate as Unified Command where a multi-disciplinary team had been formed with officers from all participating PIA departments on deputation under the direct command of Project Director (Figures A8.2-9 and A8.2-10). The Deputy Project Directors had come on deputation to the Unified Command for the project period.
Hill Development Department
State level [PMU]: Watershed Management Directorate
Responsibilities:
PLANNING, FUND MANAGEMENT, MONITORING
PIA: Forest Department
Responsibilities: IMPLEMENTATION
PIA: Agriculture
Department
Responsibilities: IMPLEMENTATION
PIA: Horticulture
Department
Responsibilities:IMPLEMENTATION
PIA: Animal Husbandry Department
Responsibilities:
IMPLEMENTATION
PIA: Soil
Conservation Department
Responsibilities:
IMPLEMENTATION
PIA: Minor Irrigation
Department
Responsibilities:IMPLEMENTATION
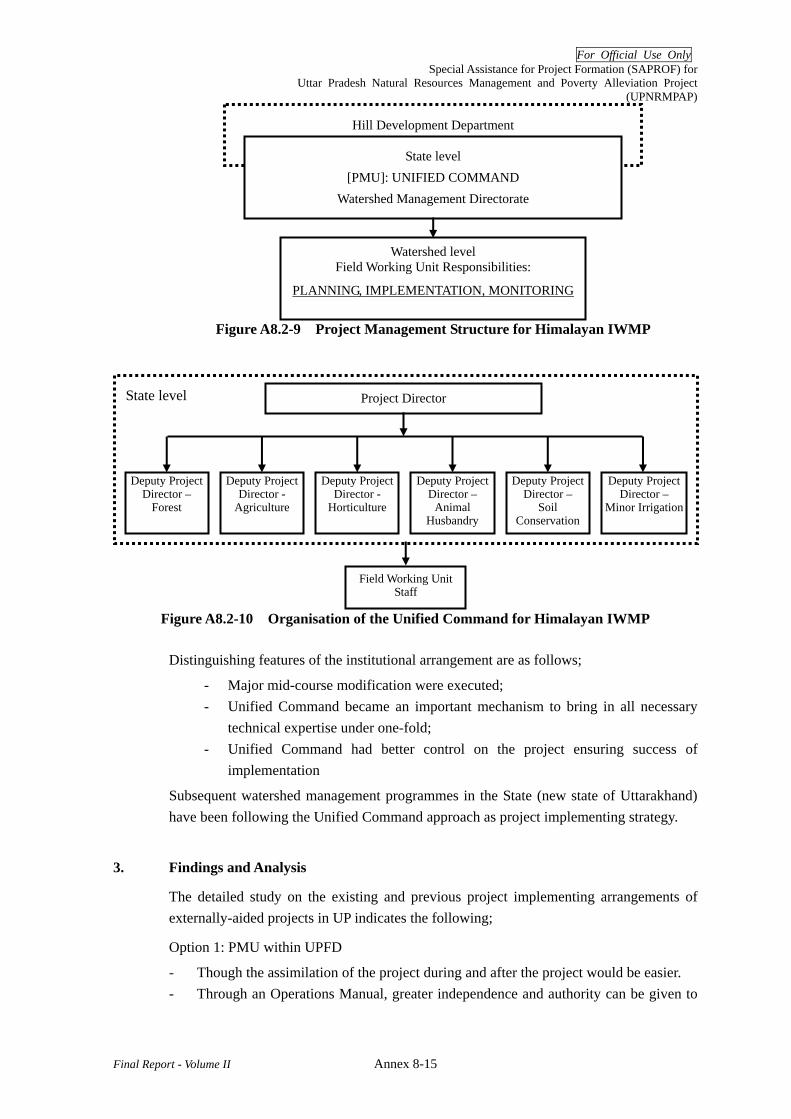
For Official Use Only Special Assistance for Project Formation (SAPROF) for
Uttar Pradesh Natural Resources Management and Poverty Alleviation Project (UPNRMPAP)
Final Report - Volume II Annex 8-15
Figure A8.2-9 Project Management Structure for Himalayan IWMP
Figure A8.2-10 Organisation of the Unified Command for Himalayan IWMP
Distinguishing features of the institutional arrangement are as follows;
- Major mid-course modification were executed; - Unified Command became an important mechanism to bring in all necessary
technical expertise under one-fold; - Unified Command had better control on the project ensuring success of
implementation
Subsequent watershed management programmes in the State (new state of Uttarakhand) have been following the Unified Command approach as project implementing strategy.
3. Findings and Analysis
The detailed study on the existing and previous project implementing arrangements of externally-aided projects in UP indicates the following;
Option 1: PMU within UPFD
- Though the assimilation of the project during and after the project would be easier. - Through an Operations Manual, greater independence and authority can be given to
Hill Development Department
State level [PMU]: UNIFIED COMMAND
Watershed Management Directorate
Watershed level Field Working Unit Responsibilities:
PLANNING, IMPLEMENTATION, MONITORING
State level Project Director
Deputy Project Director –
Forest
Deputy Project Director -
Agriculture
Deputy Project Director -
Horticulture
Deputy Project Director –
Animal Husbandry
Deputy Project Director –
Soil Conservation
Deputy Project Director –
Minor Irrigation
Field Working Unit Staff
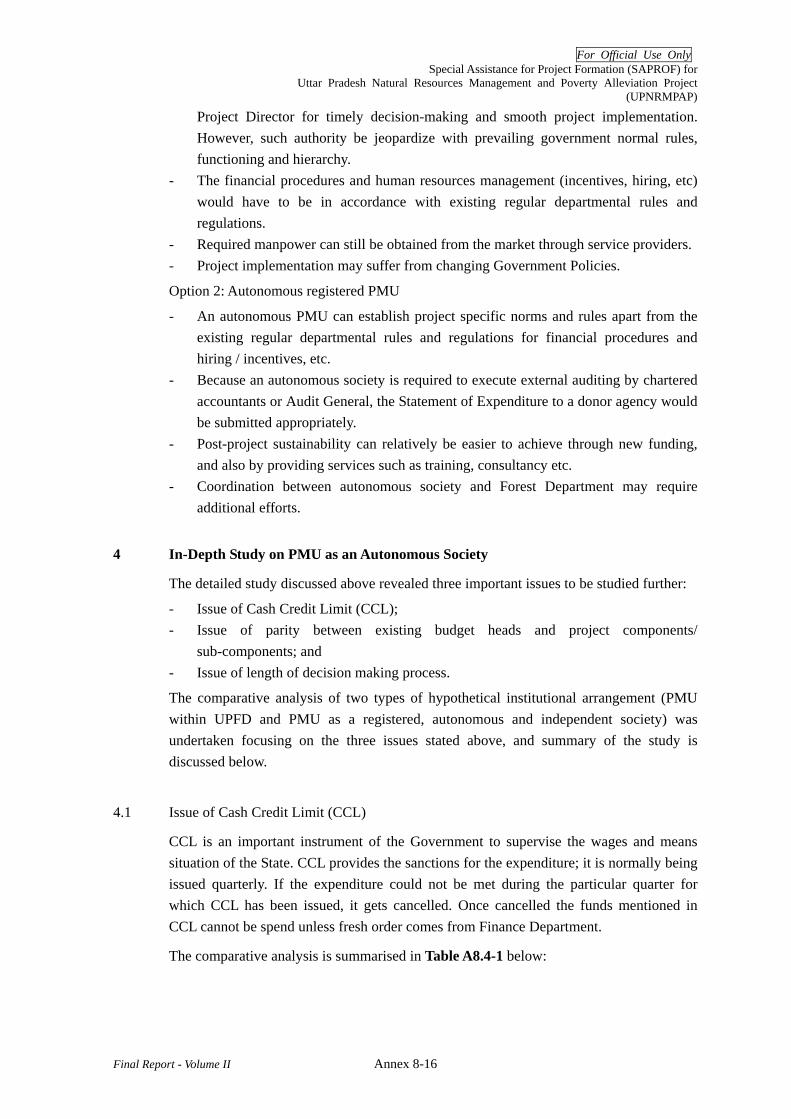
For Official Use Only Special Assistance for Project Formation (SAPROF) for
Uttar Pradesh Natural Resources Management and Poverty Alleviation Project (UPNRMPAP)
Final Report - Volume II Annex 8-16
Project Director for timely decision-making and smooth project implementation. However, such authority be jeopardize with prevailing government normal rules, functioning and hierarchy.
- The financial procedures and human resources management (incentives, hiring, etc) would have to be in accordance with existing regular departmental rules and regulations.
- Required manpower can still be obtained from the market through service providers. - Project implementation may suffer from changing Government Policies.
Option 2: Autonomous registered PMU
- An autonomous PMU can establish project specific norms and rules apart from the existing regular departmental rules and regulations for financial procedures and hiring / incentives, etc.
- Because an autonomous society is required to execute external auditing by chartered accountants or Audit General, the Statement of Expenditure to a donor agency would be submitted appropriately.
- Post-project sustainability can relatively be easier to achieve through new funding, and also by providing services such as training, consultancy etc.
- Coordination between autonomous society and Forest Department may require additional efforts.
4 In-Depth Study on PMU as an Autonomous Society
The detailed study discussed above revealed three important issues to be studied further:
- Issue of Cash Credit Limit (CCL); - Issue of parity between existing budget heads and project components/
sub-components; and - Issue of length of decision making process.
The comparative analysis of two types of hypothetical institutional arrangement (PMU within UPFD and PMU as a registered, autonomous and independent society) was undertaken focusing on the three issues stated above, and summary of the study is discussed below.
4.1 Issue of Cash Credit Limit (CCL)
CCL is an important instrument of the Government to supervise the wages and means situation of the State. CCL provides the sanctions for the expenditure; it is normally being issued quarterly. If the expenditure could not be met during the particular quarter for which CCL has been issued, it gets cancelled. Once cancelled the funds mentioned in CCL cannot be spend unless fresh order comes from Finance Department.
The comparative analysis is summarised in Table A8.4-1 below:
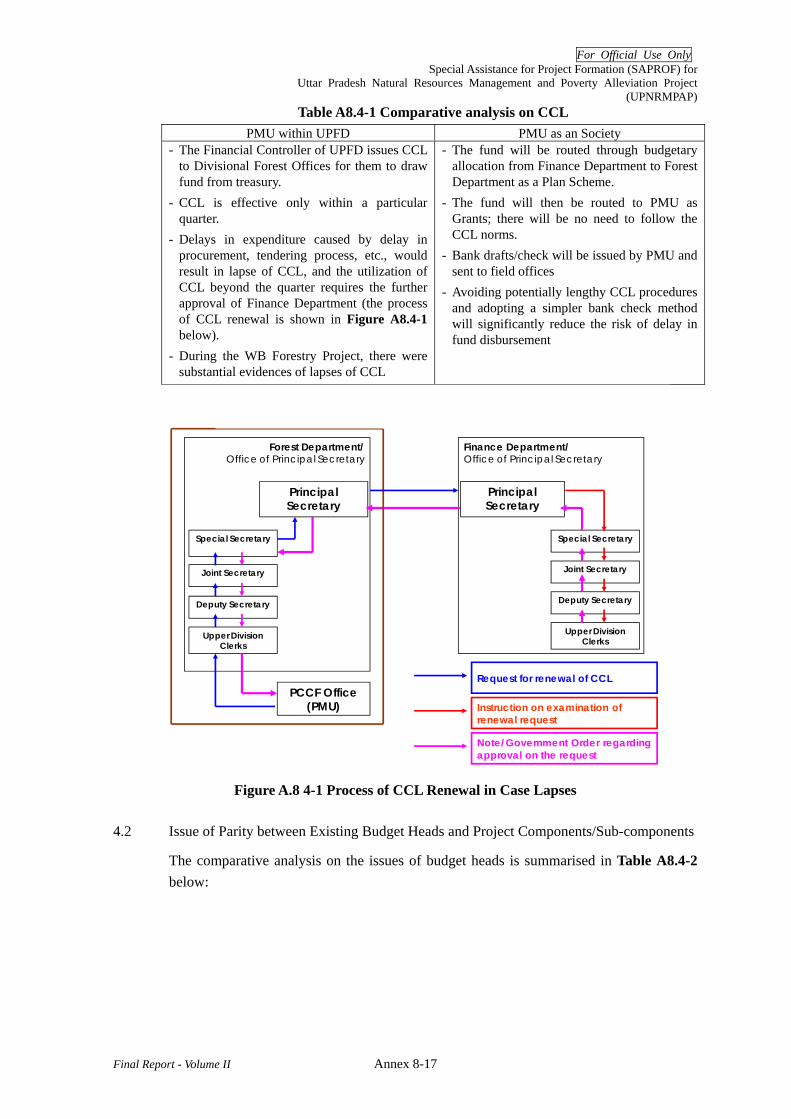
For Official Use Only Special Assistance for Project Formation (SAPROF) for
Uttar Pradesh Natural Resources Management and Poverty Alleviation Project (UPNRMPAP)
Final Report - Volume II Annex 8-17
Table A8.4-1 Comparative analysis on CCL PMU within UPFD PMU as an Society
- The Financial Controller of UPFD issues CCL to Divisional Forest Offices for them to draw fund from treasury.
- CCL is effective only within a particular quarter.
- Delays in expenditure caused by delay in procurement, tendering process, etc., would result in lapse of CCL, and the utilization of CCL beyond the quarter requires the further approval of Finance Department (the process of CCL renewal is shown in Figure A8.4-1 below).
- During the WB Forestry Project, there were substantial evidences of lapses of CCL
- The fund will be routed through budgetary allocation from Finance Department to Forest Department as a Plan Scheme.
- The fund will then be routed to PMU as Grants; there will be no need to follow the CCL norms.
- Bank drafts/check will be issued by PMU and sent to field offices
- Avoiding potentially lengthy CCL procedures and adopting a simpler bank check method will significantly reduce the risk of delay in fund disbursement
Forest Department/Office of Principal Secretary
Process of CCL Renewal in Case of Lapses
PCCF Office(PMU)
Upper Division Clerks
Joint Secretary
Special Secretary
Principal Secretary
Finance Department/ Office of Principal Secretary
Principal Secretary
Upper Division Clerks
Deputy Secretary
Special Secretary
Request for renewal of CCL
Note/Government Order regarding approval on the request
Instruction on examination of renewal request
Deputy Secretary
Joint Secretary
Figure A.8 4-1 Process of CCL Renewal in Case Lapses
4.2 Issue of Parity between Existing Budget Heads and Project Components/Sub-components
The comparative analysis on the issues of budget heads is summarised in Table A8.4-2 below:

For Official Use Only Special Assistance for Project Formation (SAPROF) for
Uttar Pradesh Natural Resources Management and Poverty Alleviation Project (UPNRMPAP)
Final Report - Volume II Annex 8-18
Table A8.4-2 Comparative analysis on synchronization of budget heads PMU within UPFD PMU as an Society
- In case of externally funded projects, Government budget heads/ sub-heads need to be synchronized with the Project components for smooth reimbursement claims
- Request for “Schedule of New Demand (SND)” to Finance Department is needed for the synchronization
- In UP Forestry Project, there are only 8 Budget Heads of WB, which needed to be adjusted with 47 Budget Heads of the Government. This synchronization of budget heads/sub-heads resulted in extensive confusion and complexity in financial management.
- Grants from Forest Department to PMU will come under only one Government Budget Head, “No. 20 Grants/ Assistance”;
- Without SND, PMU can create its own Budget Heads, in accordance with the Project Components,
- which facilitates smooth reimbursement from Donor;
- which eliminates the confusion caused by synchronization;
- which promotes transparency at an expenditure level
4.3 Issue of Length of Decision Making Process
The comparative analysis on the issues of length of decision making process is summarised in Table A8.4-3 below:
Table A8.4-3 Comparative analysis on length of decision making process PMU within UPFD PMU as an Society
- For decisions related to important matters on budget/ finance, certain tenders or policy, the decisions by Principal Secretary are required, which would result in delays since communication between PCCF and PS must go through upper clerks, Deputy Secretary, Joint Secretary and Special Secretary.
- During WB Forestry Project, Project Director was designated as Special Secretary, and the delays had been reduced to a certain extend.
- Decision making will be taken by the Governing Body of PMU, in which Principal Secretary, PCCF and Director Project will sit together and decide at once without routing through the bureaucratic hierarchy.
- The faster decision making by a Society is discernible in the functioning of the State Water and Sanitation Mission funded by WB
5 Conclusion
Considering the nature of the funding (reimbursable mode) and the activities to be performed, it is advisable to have the Type 2 PMU, which will be autonomous at the state level and will be merged with Forest Department at the Division level onwards.
The PMU can govern itself with its own by-laws and internal policies impartial of existing departmental administration rules and regulations. Although PMU is an autonomous Society, the field-level project execution will be done by a special unit created within the Forest Department (DMU and FMU) in order to avoid any jurisdictional and work charge conflicts. The Forest Department and autonomous PMU will enter into an agreement to vest the project management responsibilities to PMU.
There are a number of key managerial features in order to make the institutional arrangement effective and to function within the framework of government systems.

For Official Use Only Special Assistance for Project Formation (SAPROF) for
Uttar Pradesh Natural Resources Management and Poverty Alleviation Project (UPNRMPAP)
Final Report - Volume II Annex 8-19
5.1 Accounting Procedures
In this Institutional design, the fund from the Forest Department will be given to PMU as grants and then the PMU will provide the fund to DMU/DFO. In terms of fund flow, the fund will go from the Government to the society and then again to the Government. It is important to have necessary parity on accounting procedure at each level. DMU will follow the Forest Accounting Rules of Government of Uttar Pradesh, thus it is suggested that PMU should follow the Forest Accounting Rules for the accounting purposes.
The fund from PMU will go to a designated schedule bank account at DMU in a form of bank cheques or bank draft to avoid the problems of CCL.
5.2 Auditing
It will be carried out by the Auditor General (AG) because the grant to Society is from the consolidated fund of GoI. According to the Society Registration Act, a society is required to have annual audit by a chartered account or Auditor General.
5.3 Compliances of General Financial Rules (GFR) and General Rules of Business (GRB)
In order to have smooth compliances of General Financial Rules (GFR) and General Rules of Business (GRB) of Government of Uttar Pradesh, it is suggested to have a set of finance officers from the Uttar Pradesh Finance Service (UPFS) cadre who are familiar with GFR and GRB. It would also facilitate better coordination with the Finance Department for the project implementation.
5.4 Link with the State Government
It is important for PMU to have constant linkage with the State Government, and therefore it is suggested to designate one Deputy Project Director as Special Secretary of Forest Department at the State Government. This innovation had also been adopted by the completed Uttar Pradesh Forestry Project previously and found to be useful. Also, the meeting of Governing Body of PMU should be called as necessary so that the Principal Secretary of Forest at the State Government, PCCF of Forest Department and Project Director can sit together and make important decisions at once without routing through the regular communication protocol and time-consuming hierarchical steps.
5.5 Structural Integrity
The creation of PMU is only for the implementation of UPNRMPAP and is not the creation of dual administrative structure within the forestry sector in UP. The existing charges and authorities of UPFD will remain intact regardless of the creation of PMU. For instance, in case the function of PMU ceases, the assets and infrastructure of PMU created through the Projects will be transferred to UPFD through the provision in its bylaws. This will ensure the organisational integrity of PMU with UPFD.
For Official Use Only Special Assistance for Project Formation (SAPROF) for
Uttar Pradesh Natural Resource Management and Poverty Alleviation Project (UPNRMPAP)
Final Report- Volume II
Special Assistance for Project Formation
for Uttar Pradesh Natural Resource Management and Poverty Alleviation Project
(UPNRMPAP)
Final Report
Volume II: ANNEXES
ANNEX-9 RAPID TRAINING NEEDS ANALYSIS
(TNA)
For Official Use Only Special Assistance for Project Formation (SAPROF) for
Uttar Pradesh Natural Resources Management and Poverty Alleviation Project (UPNRMPAP)
Final Report - Volume II i
Special Assistance for Project Formation (SAPROF)
for
Uttar Pradesh Natural Resource Management and Poverty Alleviation Project (UPNRMPAP)
Final Report
Volume II: Annexes
ANNEX 9 RAPID TRAINING NEEDS ANALYSIS (TNA)
Table of Contents 1. Introduction ................................................................................................................. Annex 9-1
1.1 Purpose of the TNA.......................................................................................... Annex 9-1 1.2 Methodology .................................................................................................... Annex 9-1
2 Findings....................................................................................................................... Annex 9-4 2.1 Profiles of Sample Respondents....................................................................... Annex 9-4 2.2 Trainings received ............................................................................................ Annex 9-4 2.3 Major findings from interview survey ............................................................. Annex 9-5
3 Conclusion and Suggested Training Modules ............................................................. Annex 9-9
Attachments Attachment A9.2-1 Profile of Sample Respondents (JFM Member Secretary) ..................Annex 9 -A 1 Attachment A9.2-2 Profile of sample respondents (Divisional Forest Officers).................Annex 9 -A 4 Attachment A9.2-3 TNA result of sample respondents (JFMC member secretary Forest Divisions)...... .............................................................................................................Annex 9 -A 5 Attachment A9.2-4 TNA result of sample respondents (JFM member secretary WL Division) .............. .............................................................................................................Annex 9 -A 7 Attachment A9.2-5 TNA result of sample respondents (Control) .....................................Annex 9 -A 10 Attachment A9.2-6 TNA result of sample respondents (Divisional Forest Officers)........Annex 9 -A 12

For Official Use Only Special Assistance for Project Formation (SAPROF) for
Uttar Pradesh Natural Resources Management and Poverty Alleviation Project (UPNRMPAP)
Final Report - Volume II Annex 9-1
ANNEX 9 RAPID TRAINING NEEDS ANALYSIS (TNA)
1. Introduction
1.1 Purpose of the TNA
As part of the SAPROF for UPNRMPAP, a rapid TNA was undertaken to evaluate the general needs and strengths of UPFD staff members posted in divisions likely to be parts of proposed UPNRMPAP when implemented. The evaluation would contribute to an appropriate design for the strengthening of project staff. The objectives of rapid TNA are:
1. To address the necessary knowledge and skills of officers for the implementation UPNRMPAP,
2. To understand the present levels of knowledge and skills of officers, 3. To assess the gap between the 1) and 2), and 4. To propose specific strategies to fill the gap.
1.2 Methodology
The rapid TNA was conducted through the following steps:
• Sample selection • Questionnaire development • Profiling of sample respondents • Individual semi-structured Interviews • Compilation of interview results and analysis
1.2.1 Sample Selection
Sample respondents for the rapid TNA were among the member secretaries of JFMCs or EDCs (Foresters and Forest Guards) and Divisional Forest Officers (DFOs) at the Forest and Wildlife divisions. Among the potential project divisions, a total of 12 divisions were selected because they are most likely to be selected as project areas for UPNRMPAP.
Within the selected 12 divisions, sample respondents were selected based on the recommendations of DFOs. The table below summarises the selected sample respondents:

For Official Use Only Special Assistance for Project Formation (SAPROF) for
Uttar Pradesh Natural Resources Management and Poverty Alleviation Project (UPNRMPAP)
Final Report - Volume II Annex 9-2
Table A9.1-1 Sample Respondents for Rapid TNA
Division Number of targeted DFOs No. of Forester / Forest Guard Mirzapur - 2 Kashi Wildlife 1 2 Sonbhadra 1 3 Obra 1 3 Renukoot 1 3 North Kheri 1 4 South Kheri 1 5 Dudwa Wildlife - 4 Pilibhit - 3 Bharaich 1 3 Katarniaghat Wildlife 1 3 Shravasti 1 3
Total 9 38
In case of Member Secretaries of JFMCs, 29 officers interviewed were member secretaries of JFMCs or EDCs (21 were from Forest Divisions and 8 from Wildlife Divisions), while 9 were selected as control (not involved in JFM or EDC).
1.2.2 Questionnaire Development
In order to develop appropriate questionnaire, the following points were identified as key areas because those areas are the most critical fields of expertise required for the implementation of UPNRMPAP.
• Joint Forest Management • Poverty Alleviation • Micro-Planning • Women Empowerment • Soil and Water Conservation • Non-Wood Forest Products • Nursery Management • Plantation Management • Agro-forestry • Wild Life Management • Human Resource Development (only for DFOs) • Monitoring (only for DFOs)
With respect to the above key areas, a set of questionnaires were developed to address following basic questions:
Regarding required skill/knowledge for the implementation of UPNRMPAP:

For Official Use Only Special Assistance for Project Formation (SAPROF) for
Uttar Pradesh Natural Resources Management and Poverty Alleviation Project (UPNRMPAP)
Final Report - Volume II Annex 9-3
• What you will do for implementation of UPNRMPAP in particular, and forest management/ JFM in general
• What you must know for implementation of UPNRMPAP in particular, and forest management/ JFM in general
Existing skill/ knowledge:
• What you have been doing, in particular forest management/ JFM in general • What you know and what you can do, in particular forest management/ JFM in
general
1.2.3 Individual Structured Interview
The face-to-face individual interviews to the sample respondents were carried out by a two-member team comprising the Capacity Building Specialist of SAPROF team and the Conservator of Forests Human Resources Development, UPFD. The interviews followed the following semi-structured question:
1. Have you ever done ……………….? 2. If yes, when did you do it? 2’. If no, have you at least learned it? 3. How often/how many times? 3’. If yes, when and how did you learn it?
4. Please describe in detail your experiences on it 4’. Please describe what you learned. 5. How was the result of your work on it? Please describe your self-evaluation of the result and its basis.
5’.Please self-evaluate your level of knowledge/skill on it.
The sample respondents were extremely cooperative to the survey, and the average duration of each interview was between 1 to 1 ½ hours.
1.2.4 Compilation of Interview Results and Analysis
Based on the answers of sample respondents towards questions in each key area discussed previously, the TNA team consisting of two-member recorded the key points of the answers of sample respondents and evaluated the level of present skills and knowledge of interviewees using the rating method. The scale of rating is shown below:
• Rate 4: Excellent knowledge/skills for the implementation of the project • Rate 3: Adequate level of knowledge and skills • Rate 2: Certain level of knowledge and skills, but needs improvement • Rate 1: Would have difficulties in implementation with present knowledge/skills
Based on the recorded contents of interview results and rating, the areas of weaknesses and strengths were identified accordingly.

For Official Use Only Special Assistance for Project Formation (SAPROF) for
Uttar Pradesh Natural Resources Management and Poverty Alleviation Project (UPNRMPAP)
Final Report - Volume II Annex 9-4
2 Findings
2.1 Profiles of Sample Respondents
Profiles of sample respondents are given in Attachments A9.2-1 and A9.2-2 of this Annex and summarised in the table below:
Table A9.2-1 Age of sample Respondents
25-40 Years Old 40-50 Years Old 50-60 Years Old Total Member Secretaries 6 16 16 38 DFOs 2 6 1 9
Table A9.2-2 Years of experience of sample respondents
1 - 10 Years 10-20 Years 20-30 Years More Total Member Secretaries 5 7 19 7 38 DFOs 0 6 3 0 9
2.2 Trainings Received
The details of training received by the sample respondents are summarised in
Attachment A9.2-1 and 2 and highlighted below:
Table A9.2-3 Training of JFM Member Secretaries Interviewed
Course / Subject Officers Trained Remarks
Deputy Ranger (3 officers) Forester Foundation 3 Every respondents received training when ForestersRefresher Course 1 Duration of training was 2 months. JFM, FDA, Micro-Plan 1 Nursery, Illegal Felling 1 Foresters (27 officers) Forester Foundation Course 12 1 officer received training 9 years after recruitment
as Forester. 1 officer has not yet received the training
Forester Refresher Course 5 2 month course for promoted staff. 9 of them have not yet received the training.
Forest Guard Foundation Course 14 Received training when working when FG JFM 5 1 week training Nursery Management 1 3 day training Fire Management 4 2-3 day training Exposure visit 1 8 day visit to a development project. WL Protection and Conservation 2 Duration of training was 1 week. Wild Life, Use of Rifle 1 For promoted staff. 1 week. Forest Guards (8 staff) Forest Guard Foundation Training
7 3 FGs received the training 8 to 12 years after appointment as FG. 1 has not received the training
ANR 2 Duration of training was 2 days JFM related 2 Duration of training was 2 days and 5 days Clone Nursery 1 Duration of training was 3 days Wild Life, Use of Rifle 2 Short term training

For Official Use Only Special Assistance for Project Formation (SAPROF) for
Uttar Pradesh Natural Resources Management and Poverty Alleviation Project (UPNRMPAP)
Final Report - Volume II Annex 9-5
Table A9.2-4 Training of DFOs Interviewed Subject Finding
Compulsory training for IFS and UPFS officers
All 9 DFOs have participated in 2-year training.
JFM, Participatory Approaches, Micro-Planning and related subjects.
1 DFO attended short term courses. 3 DFOs participated in exposure visits during WB-funded projects
Wildlife Management 2 DFOs Biodiversity Conservation, Organised Wildlife Crime, Strategy to prevent crime
1 DFO
Hi-tech Nursery 1 DFO Soil & Water Conservation, Watershed Management
1 DFO attended short term courses. 2 DFOs participated in the training during WB-funded projects.
Sustainable Development 1 DFO Change Management 1 DFO Advanced Management Course 1 DFO Discrimination against SC and ST 1 DFO Others 3 DFOs participated in short courses
2.3 Major Findings from Interview Survey
The following tables summarise the major findings of interview survey conducted during
the rapid TNA, and details are given in Attachments A9.2-3, 4, 5 and 6.
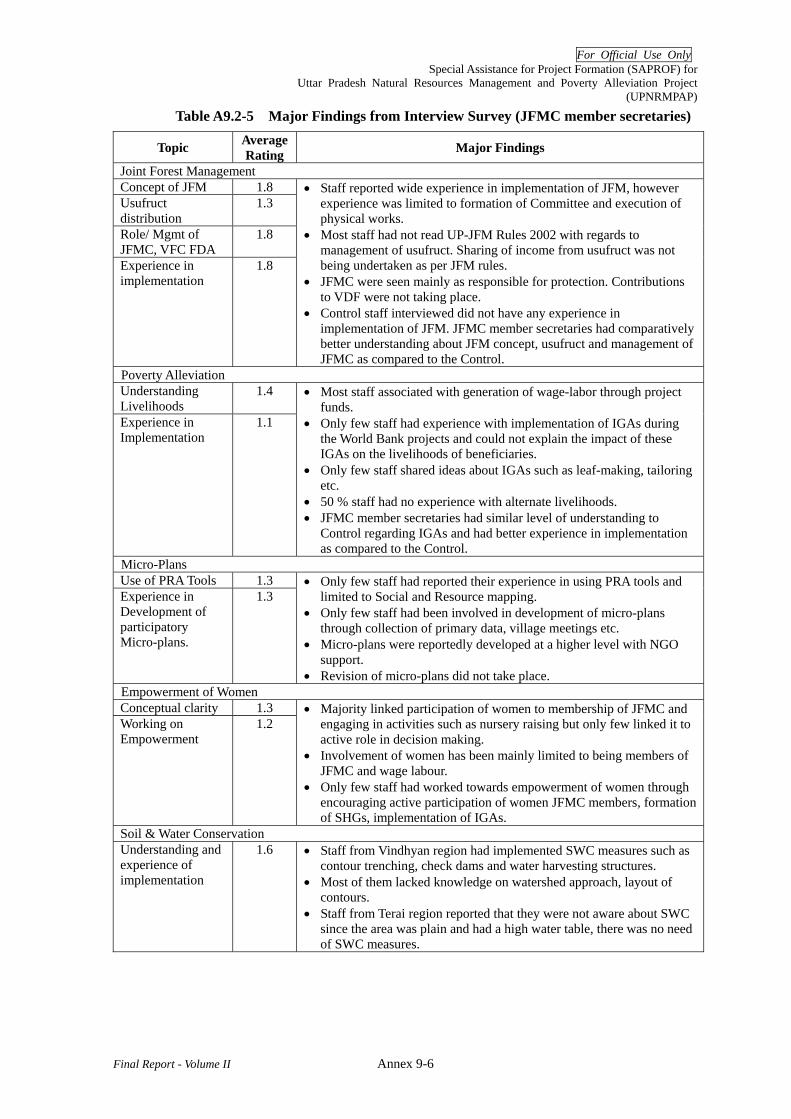
For Official Use Only Special Assistance for Project Formation (SAPROF) for
Uttar Pradesh Natural Resources Management and Poverty Alleviation Project (UPNRMPAP)
Final Report - Volume II Annex 9-6
Table A9.2-5 Major Findings from Interview Survey (JFMC member secretaries)
Topic Average Rating Major Findings
Joint Forest Management Concept of JFM 1.8 Usufruct distribution
1.3
Role/ Mgmt of JFMC, VFC FDA
1.8
Experience in implementation
1.8
• Staff reported wide experience in implementation of JFM, however experience was limited to formation of Committee and execution of physical works.
• Most staff had not read UP-JFM Rules 2002 with regards to management of usufruct. Sharing of income from usufruct was not being undertaken as per JFM rules.
• JFMC were seen mainly as responsible for protection. Contributions to VDF were not taking place.
• Control staff interviewed did not have any experience in implementation of JFM. JFMC member secretaries had comparatively better understanding about JFM concept, usufruct and management of JFMC as compared to the Control.
Poverty Alleviation Understanding Livelihoods
1.4
Experience in Implementation
1.1
• Most staff associated with generation of wage-labor through project funds.
• Only few staff had experience with implementation of IGAs during the World Bank projects and could not explain the impact of these IGAs on the livelihoods of beneficiaries.
• Only few staff shared ideas about IGAs such as leaf-making, tailoring etc.
• 50 % staff had no experience with alternate livelihoods. • JFMC member secretaries had similar level of understanding to
Control regarding IGAs and had better experience in implementation as compared to the Control.
Micro-Plans Use of PRA Tools 1.3 Experience in Development of participatory Micro-plans.
1.3 • Only few staff had reported their experience in using PRA tools and
limited to Social and Resource mapping. • Only few staff had been involved in development of micro-plans
through collection of primary data, village meetings etc. • Micro-plans were reportedly developed at a higher level with NGO
support. • Revision of micro-plans did not take place.
Empowerment of Women Conceptual clarity 1.3 Working on Empowerment
1.2 • Majority linked participation of women to membership of JFMC and
engaging in activities such as nursery raising but only few linked it to active role in decision making.
• Involvement of women has been mainly limited to being members of JFMC and wage labour.
• Only few staff had worked towards empowerment of women through encouraging active participation of women JFMC members, formation of SHGs, implementation of IGAs.
Soil & Water Conservation Understanding and experience of implementation
1.6 • Staff from Vindhyan region had implemented SWC measures such as contour trenching, check dams and water harvesting structures.
• Most of them lacked knowledge on watershed approach, layout of contours.
• Staff from Terai region reported that they were not aware about SWC since the area was plain and had a high water table, there was no need of SWC measures.
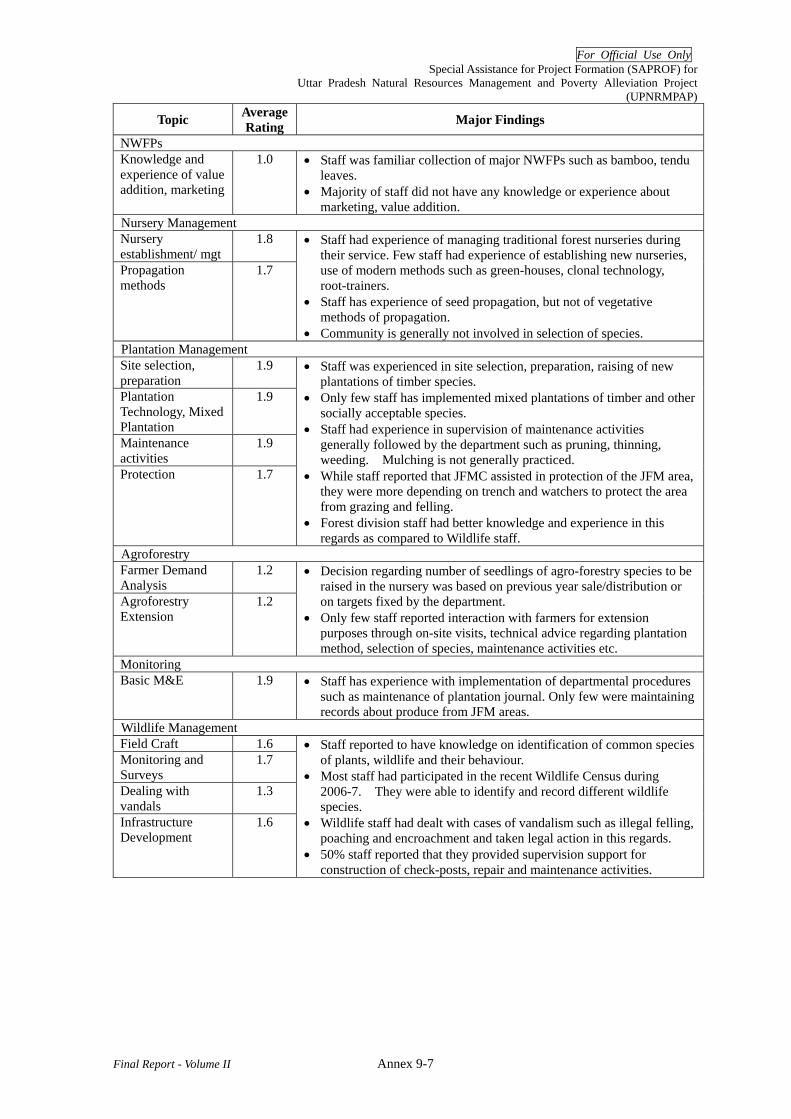
For Official Use Only Special Assistance for Project Formation (SAPROF) for
Uttar Pradesh Natural Resources Management and Poverty Alleviation Project (UPNRMPAP)
Final Report - Volume II Annex 9-7
Topic Average Rating Major Findings
NWFPs Knowledge and experience of value addition, marketing
1.0 • Staff was familiar collection of major NWFPs such as bamboo, tendu leaves.
• Majority of staff did not have any knowledge or experience about marketing, value addition.
Nursery Management Nursery establishment/ mgt
1.8
Propagation methods
1.7
• Staff had experience of managing traditional forest nurseries during their service. Few staff had experience of establishing new nurseries, use of modern methods such as green-houses, clonal technology, root-trainers.
• Staff has experience of seed propagation, but not of vegetative methods of propagation.
• Community is generally not involved in selection of species. Plantation Management Site selection, preparation
1.9
Plantation Technology, Mixed Plantation
1.9
Maintenance activities
1.9
Protection 1.7
• Staff was experienced in site selection, preparation, raising of new plantations of timber species.
• Only few staff has implemented mixed plantations of timber and other socially acceptable species.
• Staff had experience in supervision of maintenance activities generally followed by the department such as pruning, thinning, weeding. Mulching is not generally practiced.
• While staff reported that JFMC assisted in protection of the JFM area, they were more depending on trench and watchers to protect the area from grazing and felling.
• Forest division staff had better knowledge and experience in this regards as compared to Wildlife staff.
Agroforestry Farmer Demand Analysis
1.2
Agroforestry Extension
1.2
• Decision regarding number of seedlings of agro-forestry species to be raised in the nursery was based on previous year sale/distribution or on targets fixed by the department.
• Only few staff reported interaction with farmers for extension purposes through on-site visits, technical advice regarding plantation method, selection of species, maintenance activities etc.
Monitoring Basic M&E 1.9 • Staff has experience with implementation of departmental procedures
such as maintenance of plantation journal. Only few were maintaining records about produce from JFM areas.
Wildlife Management Field Craft 1.6 Monitoring and Surveys
1.7
Dealing with vandals
1.3
Infrastructure Development
1.6
• Staff reported to have knowledge on identification of common species of plants, wildlife and their behaviour.
• Most staff had participated in the recent Wildlife Census during 2006-7. They were able to identify and record different wildlife species.
• Wildlife staff had dealt with cases of vandalism such as illegal felling, poaching and encroachment and taken legal action in this regards.
• 50% staff reported that they provided supervision support for construction of check-posts, repair and maintenance activities.
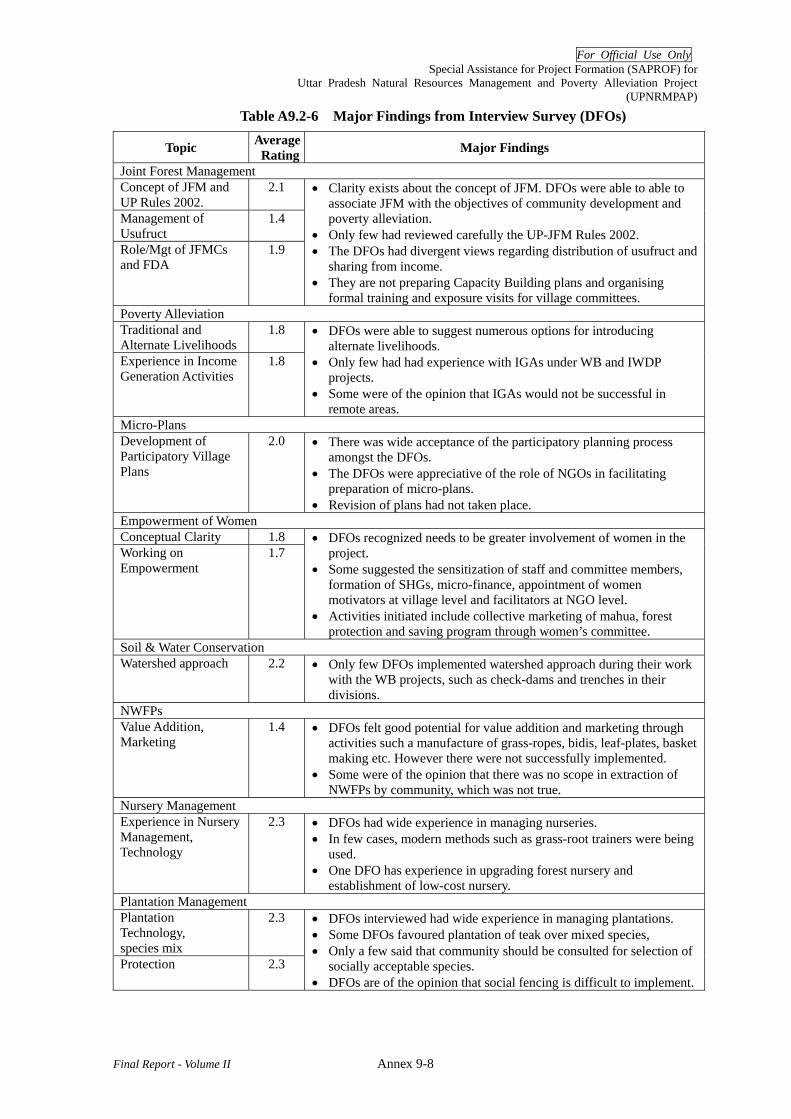
For Official Use Only Special Assistance for Project Formation (SAPROF) for
Uttar Pradesh Natural Resources Management and Poverty Alleviation Project (UPNRMPAP)
Final Report - Volume II Annex 9-8
Table A9.2-6 Major Findings from Interview Survey (DFOs)
Topic Average Rating Major Findings
Joint Forest Management Concept of JFM and UP Rules 2002.
2.1
Management of Usufruct
1.4
Role/Mgt of JFMCs and FDA
1.9
• Clarity exists about the concept of JFM. DFOs were able to able to associate JFM with the objectives of community development and poverty alleviation.
• Only few had reviewed carefully the UP-JFM Rules 2002. • The DFOs had divergent views regarding distribution of usufruct and
sharing from income. • They are not preparing Capacity Building plans and organising
formal training and exposure visits for village committees. Poverty Alleviation Traditional and Alternate Livelihoods
1.8
Experience in Income Generation Activities
1.8
• DFOs were able to suggest numerous options for introducing alternate livelihoods.
• Only few had had experience with IGAs under WB and IWDP projects.
• Some were of the opinion that IGAs would not be successful in remote areas.
Micro-Plans Development of Participatory Village Plans
2.0 • There was wide acceptance of the participatory planning process amongst the DFOs.
• The DFOs were appreciative of the role of NGOs in facilitating preparation of micro-plans.
• Revision of plans had not taken place. Empowerment of Women Conceptual Clarity 1.8 Working on Empowerment
1.7 • DFOs recognized needs to be greater involvement of women in the
project. • Some suggested the sensitization of staff and committee members,
formation of SHGs, micro-finance, appointment of women motivators at village level and facilitators at NGO level.
• Activities initiated include collective marketing of mahua, forest protection and saving program through women’s committee.
Soil & Water Conservation Watershed approach 2.2 • Only few DFOs implemented watershed approach during their work
with the WB projects, such as check-dams and trenches in their divisions.
NWFPs Value Addition, Marketing
1.4 • DFOs felt good potential for value addition and marketing through activities such a manufacture of grass-ropes, bidis, leaf-plates, basket making etc. However there were not successfully implemented.
• Some were of the opinion that there was no scope in extraction of NWFPs by community, which was not true.
Nursery Management Experience in Nursery Management, Technology
2.3 • DFOs had wide experience in managing nurseries. • In few cases, modern methods such as grass-root trainers were being
used. • One DFO has experience in upgrading forest nursery and
establishment of low-cost nursery. Plantation Management Plantation Technology, species mix
2.3
Protection 2.3
• DFOs interviewed had wide experience in managing plantations. • Some DFOs favoured plantation of teak over mixed species, • Only a few said that community should be consulted for selection of
socially acceptable species. • DFOs are of the opinion that social fencing is difficult to implement.

For Official Use Only Special Assistance for Project Formation (SAPROF) for
Uttar Pradesh Natural Resources Management and Poverty Alleviation Project (UPNRMPAP)
Final Report - Volume II Annex 9-9
Topic Average Rating Major Findings
Agro-Forestry Farmer Demand Analysis, Agro-Forestry Extension
1.4 • Farmer Demand Analysis is not undertaken.
Wildlife Management Management, Monitoring, Surveys
2.1
Tourism and Interpretation
1.7
Infrastructure Development
2.4
• DFOs reported that annual surveys of wildlife are carried out using standard procedures.
• Only few DFOs had experience in managing visitors to tourist locations within their divisions.
• DFOs are responsible for development, maintenance of infrastructure (offices, quarters etc.)
Human Resources Development Planning and Organising HRD Events
2.0 • DFOs organized meetings and trainings at Divisional level as per need.
• Staff were usually not trained by DFOs but sent to FTI-Kanpur or FGTC for training.
• Issues such as low pay, delay in promotions were addressed as the most important obstacles for HR development.
Monitoring Physical and Financial 2.2 • Physical and financial monitoring had been undertaken as per
Departmental procedures. • DFOs were familiar with indicators such as change in forest cover,
increase in income etc. • Introduction of GPS for determining geo-coordinates of forest
boundaries were executed in a few cases.
3 Conclusion and Suggested Training Modules
Based on the findings from the rapid TNA, it was concluded that the officers’ present levels of knowledge and skills are inadequate for the effective implementation of UP-NRMPAP in general. A strong and systematic capacity building component should be included in UP-NRMPAP.
During the interview survey, large amount of information regarding the weaknesses of officers was gathered. A number of key statements and suggestions were brought up. Based on the information, the SAPROF team identified specific training needs and suggested training subjects to be covered by UP-NRMPAP as summarised in the tables below, and these conclusions and suggestions were incorporated into one of the major project components “Strengthening of Project Implementation Bodies” as discussed in
Part III Section 3.2.3 of this report:

For Official Use Only Special Assistance for Project Formation (SAPROF) for
Uttar Pradesh Natural Resources Management and Poverty Alleviation Project (UPNRMPAP)
Final Report - Volume II Annex 9-10
Table A9.3-1 Training Needs and Modules for JFMC/EDC Member Secretaries Topic Training Needs Suggested Training Modules Joint Forest Management
Understanding concept of JFM project, approach, objectives, stakeholders and project implementation. Understanding of UP-JFM Rules 2002 and their implementation. Strengthening of JFMC/ VFC/ EDC/ FDA.
• Refresher Course on JFM – Concept & its Implementation.
• Learning from WB Project and NAP. • Application of UP-JFM Rules 2002 • Capacity Building of CBOs • Exposure Visits to Successful Projects
Poverty Alleviation
Understanding of Traditional and Alternate Livelihoods. Planning and Implementation of IGAs.
• Sustainable Livelihoods • IGAs: Identification, Planning, Beneficiary
Selection, Preparation of Proposal, Micro-Finance, Marketing
Micro-Plans Participatory approach, processes, PRA tools Development,/ Revision of Micro-Plans
• Participatory Processes • PRA and Micro-Planning
Empower- ment of Women
Incorporation of gender aspect in project implementation. Gender Sensitization. Women Empowerment through JFM.
• Gender Sensitization • Women Empowerment through JFM Projects • Exposure visit to successful Projects.
Soil & Water Conservation
Implementation of ‘Ridge to Valley’ approach. Low Cost Technology. Layout and Design of SWC measures, Water Harvesting Structures.
• Layout and Design of SWC measures, Water Harvesting Structures.
• Watershed Development • Exposure visits to successful Watershed
Projects. NWFPs Traditional use, processing, traditional
markets and economics of common NWFPs. Collective marketing, Value addition and Processing for NWFPs. Development of Business Plans, Legal aspects.
• Value Addition and Business Planning for NWFPs.
• Exposure visits to projects where Value Addition / Marketing of NWFPs is being implemented.
Nursery Management
Modern Nursery Technology and Management. Vegetative Propagation of Horticulture species.
• Modern Nursery Technology and Management.
• Vegetative propagation methods.
Plantation Management
Development of Mixed Plantations Community participation in plantation management.
• Development of Mixed Plantations • Community participation in plantation
management. Agro- Forestry
Farmer Demand Analysis Agro-Forestry Extension
• Farmer Demand Analysis • Agro-Forestry Extension
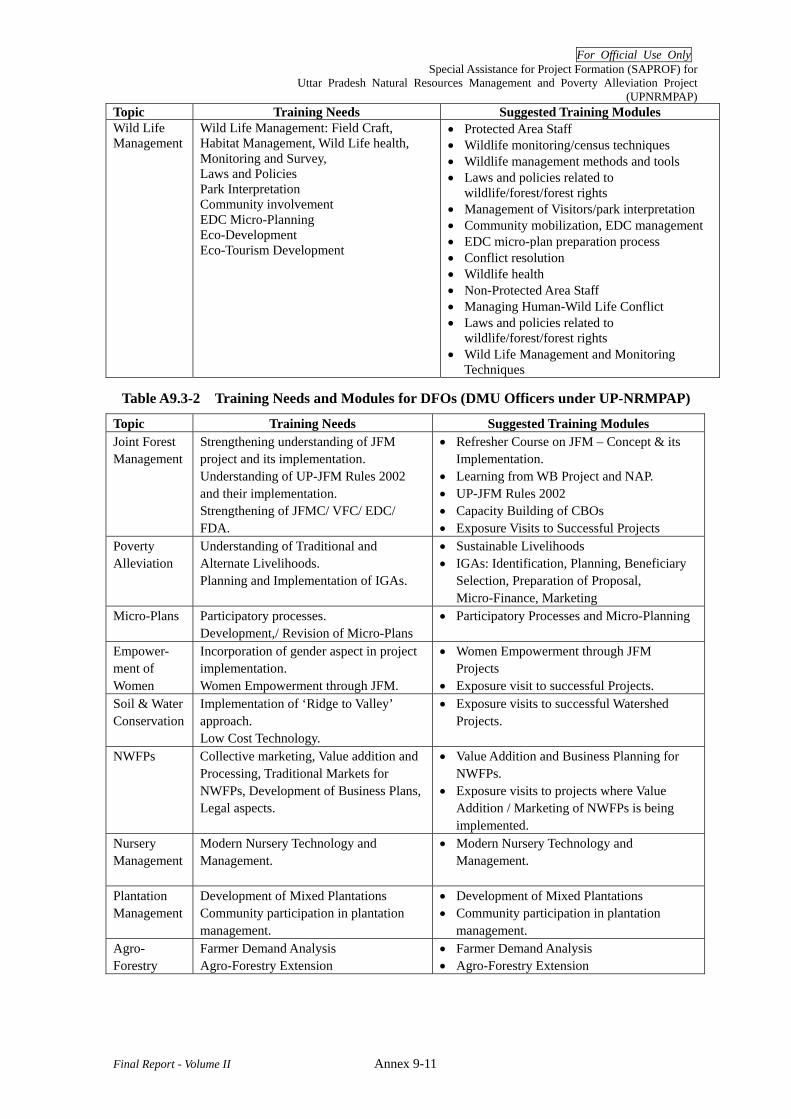
For Official Use Only Special Assistance for Project Formation (SAPROF) for
Uttar Pradesh Natural Resources Management and Poverty Alleviation Project (UPNRMPAP)
Final Report - Volume II Annex 9-11
Topic Training Needs Suggested Training Modules Wild Life Management
Wild Life Management: Field Craft, Habitat Management, Wild Life health, Monitoring and Survey, Laws and Policies Park Interpretation Community involvement EDC Micro-Planning Eco-Development Eco-Tourism Development
• Protected Area Staff • Wildlife monitoring/census techniques • Wildlife management methods and tools • Laws and policies related to
wildlife/forest/forest rights • Management of Visitors/park interpretation • Community mobilization, EDC management • EDC micro-plan preparation process • Conflict resolution • Wildlife health • Non-Protected Area Staff • Managing Human-Wild Life Conflict • Laws and policies related to
wildlife/forest/forest rights • Wild Life Management and Monitoring
Techniques
Table A9.3-2 Training Needs and Modules for DFOs (DMU Officers under UP-NRMPAP)
Topic Training Needs Suggested Training Modules Joint Forest Management
Strengthening understanding of JFM project and its implementation. Understanding of UP-JFM Rules 2002 and their implementation. Strengthening of JFMC/ VFC/ EDC/ FDA.
• Refresher Course on JFM – Concept & its Implementation.
• Learning from WB Project and NAP. • UP-JFM Rules 2002 • Capacity Building of CBOs • Exposure Visits to Successful Projects
Poverty Alleviation
Understanding of Traditional and Alternate Livelihoods. Planning and Implementation of IGAs.
• Sustainable Livelihoods • IGAs: Identification, Planning, Beneficiary
Selection, Preparation of Proposal, Micro-Finance, Marketing
Micro-Plans Participatory processes. Development,/ Revision of Micro-Plans
• Participatory Processes and Micro-Planning
Empower- ment of Women
Incorporation of gender aspect in project implementation. Women Empowerment through JFM.
• Women Empowerment through JFM Projects
• Exposure visit to successful Projects. Soil & Water Conservation
Implementation of ‘Ridge to Valley’ approach. Low Cost Technology.
• Exposure visits to successful Watershed Projects.
NWFPs Collective marketing, Value addition and Processing, Traditional Markets for NWFPs, Development of Business Plans, Legal aspects.
• Value Addition and Business Planning for NWFPs.
• Exposure visits to projects where Value Addition / Marketing of NWFPs is being implemented.
Nursery Management
Modern Nursery Technology and Management.
• Modern Nursery Technology and Management.
Plantation Management
Development of Mixed Plantations Community participation in plantation management.
• Development of Mixed Plantations • Community participation in plantation
management. Agro- Forestry
Farmer Demand Analysis Agro-Forestry Extension
• Farmer Demand Analysis • Agro-Forestry Extension

For Official Use Only Special Assistance for Project Formation (SAPROF) for
Uttar Pradesh Natural Resources Management and Poverty Alleviation Project (UPNRMPAP)
Final Report - Volume II Annex 9-12
Topic Training Needs Suggested Training Modules Wildlife Management
Wild Life Management: Field Craft, Habitat Management, Wild Life health, Monitoring and Survey, Laws and Policies Community involvement Eco-Development Eco-Tourism Development
• Emerging trends in Bio-diversity Management
• Policy issues, laws related to wildlife / bio-diversity Management
• Forest Rights issues • Eco-Development • Development of management plans and
annual operational plans (for PAs) • Eco-Development / Promotion
HRD Assessment of Training Needs and Development of Training Calendar at Divisional Level. Organisation Behaviour and Organisation Development
• Capacity Building Planning and Implementation
• Organisation Behaviour and Organisation Development
Monitoring Monitoring of Implementation, Processes and Impacts. Development of Indicators. MIS and GIS
• Management Information Systems • Geographic Information System • Monitoring of Impacts

For Official U
se Only
Special Assistance for Project Form
ation (SAPR
OF) for
Uttar Pradesh N
atural Resources M
anagement and Poverty A
lleviation Project(U
PNR
MPA
P)
Final Report - Volume II
Annex 9-A
1
Attachment A9.2-1 Profile of Sample Respondents (JFM Member Secretary)
Name of Staff Division Age Designation Year of Joining Dept
Year of Promotion to present Cadre Formal Training Received
Siya Ram Tiwari
Mirzapur 47 Forest Guard
n.a 2002 2002 – 6 month FG Foundation Course, Mirzapur.
Surya Deo Pandey
Obra 53 Forester (Promoted)
1977 2002 1982 – 1 year FG Foundation Course. 1999 – 1 week Trg on JFM at FTI-Haldwani
Vijay Shankar Yadav
Obra 54 Forester (Promoted)
1978 2002 1980 – 6 month FG Foundation Course. 2001 – Trg on JFM at Haldwani
Amar Nath Sonbhadara 50+ Forester (Promoted)
n.a 2001 1992 – FG Foundation Course. 2002 – 2 month Refresher Trg for Foresters at FTI, Kanpur.
Krishna Murari Pandey
Sonbhadara 50+ Forester (Promoted)
n.a 2007 1980 – 1 year FG Foundation Course. 1999 – 3 day Trg on JFM at Kanpur. 2002 – 1 day Trg on Fire Management at Mirzapur. 2003 – 4 day Trg on JFM at Haldwani.
Durga Prasad Dubey
Renukoot 40+ Forester 1993 - 1996 – 12-month Forester Foundation Course, FTI-Kanpur 2007 – 14 day Refresher Course at FTI Kanpur.
Ram Vilas Katihal
Renukoot 40+ Forester 1992 - 1995 – 1 year Foundation Course at Kanpur. Short Trg on JFM at Haldwani
Ashok Singh Bharaich 45 Forest Guard
1995 as FG - 2003 – 6 month FG Foundation Course, FGTI Mau. 2004 – 1 day Trg on ANR at FTI-Haldwani
Ram Anuj Mishra
Bharaich 60 Forest Guard
1964 as Enumerator
1980 – 1 year FG Foundation Course, Gorakhpur. 1999 – 2 day Trg on ANR at FTI Haldwani.
Durga Prasad Singh
Shravasti 57 Forester (Promoted)
1971 as Jamadar 2002 1986 – 6 month FG Foundation Course, Gorakhpur. 3 day Nursery Trg at Haldwani, 1 day Fire Mgt. Lakhanpur
Banwari Lal Shravasti 52 Forester (Promoted)
1982 as FG 2002 1990 – 1 year FG Foundation Course, Gorakhpur.
Ram Keval Shukla
Shravasti 52 Forester (Promoted)
1984 as FG 2005 1991 – 11 month FG Foundation Course, FGTC Mau.
Ram Bahadur Kaushal
South Kheri 51 Dy. Ranger 1979 as Forester 1995 1979 – 6 month Forester Foundation Course, FTI Haldwani 1984 – 15 days Trg on Nursery, Illegal Felling, FTI Kanpur 2003 – 15 days Trg on Micro-planning, FTI Kanpur 2003 – 1 week Trg on FDA at Divisional level
Devendra Kumar Bajpai
South Kheri 53 Forester 1985 Promotion due 1986 – 12 month Forester Foundation Course, FTI Kanpur

For Official U
se Only
Special Assistance for Project Form
ation (SAPR
OF) for
Uttar Pradesh N
atural Resources M
anagement and Poverty A
lleviation Project(U
PNR
MPA
P)
Final Report - Volume II
Annex 9-A
2
Name of Staff Division Age Designation Year of Joining Dept
Year of Promotion to present Cadre Formal Training Received
Shobnath Verma
South Kheri 55 Forester (Promoted)
1973 as FG 2002 1979 – 6 month FG Foundation Course, Gorakhpur
Irfaan Hussain
North Kheri 42 Forester (Regularised)
1986 (Daily Wages)
2001 as Forester 2001 – 6 month Forester Foundation Course, FTI Kanpur 2-3 day Refresher Courses on Fire Protection, Law, FTI Kanpur
Rakesh Babu Verma
North Kheri 42 Forester 1985 - 1988 – 11 month Forester Foundation Course, FTI Haldwani
Vishwanath Shukla
North Kheri 52 Forester (Regularised)
1978 (at Barrier) 2002 2004 – 6 month Forester Foundation Course, FTI Kanpur 2006 – 1 day Trg on Fire Protection, FGTC Pratapgarh
Ram Bahadur Pilibhit 42 Forest Guard
1986 - 1998 – 6 month FG Foundation Course, FGTC Meerut 2003 – 5 day JFM related Trg, FTI Kanpur 2004 – 3 day Trg on Clonal Nursery, FTI Haldwani
Siya Ram Pilibhit 42 Forest Guard
1993 - 1994 – 11 month FG Foundation Course, FCTC Meerut 1999 – 2 day JFM related Trg, FTI Haldwani
Mohammad Ayub
Pilibhit 39 Forester 1999 - 2000 – 8 day Exposure visit to Corbett. 2004 – 6 month Forester Foundation Course, FTI Kanpur.
Ravi Kumar Dubey
Kashi WL 29 Forester 2000 as replacement for father killed by Naxalites
2000 No Training received.
Ram Naresh Singh
Kashi WL 54 Forester (Promoted)
1983 2001 1980 – 1 year FG Foundation Course.
Radhey Shyam
Katarniaghat WL
42 Forester 2003 - 2006 – 6-month Forester Foundation Course, FTI-Kanpur
Gaya Prasad Mishra
Katarniaghat WL
53 Forester (Promoted)
1973 as FG 2002 1979 – 6 month FG Foundation Course, FGTI Mirzapur 2002 – 5 day Trg on Protection and Conservation of Wildlife, FTI Haldwani
Promod Srivastava
Katarniaghat WL
36 Forester 1997 - 2002 – 6-month Forester Foundation Course, FTI-Kanpur
Satrohan Lal Dudhwa WL 53 Forester (Promoted)
1977 as FG 2001 1977 – 5 month WL Foundation course, Lakhimpur & Salukapur 2005 – 2 month Forester Refresher Training, FTI Kanpur
Shreenath Tripathi
Dudhwa WL 58 Forester (Promoted)
1969 as FG 2001 1972 – 6 month WL Foundation Course, Mirzapur. 1974 – 2 week WL Trg (Rifle), Mirzapur. 2001 – 2 month Forester Refresher Training, FTI Kanpur.
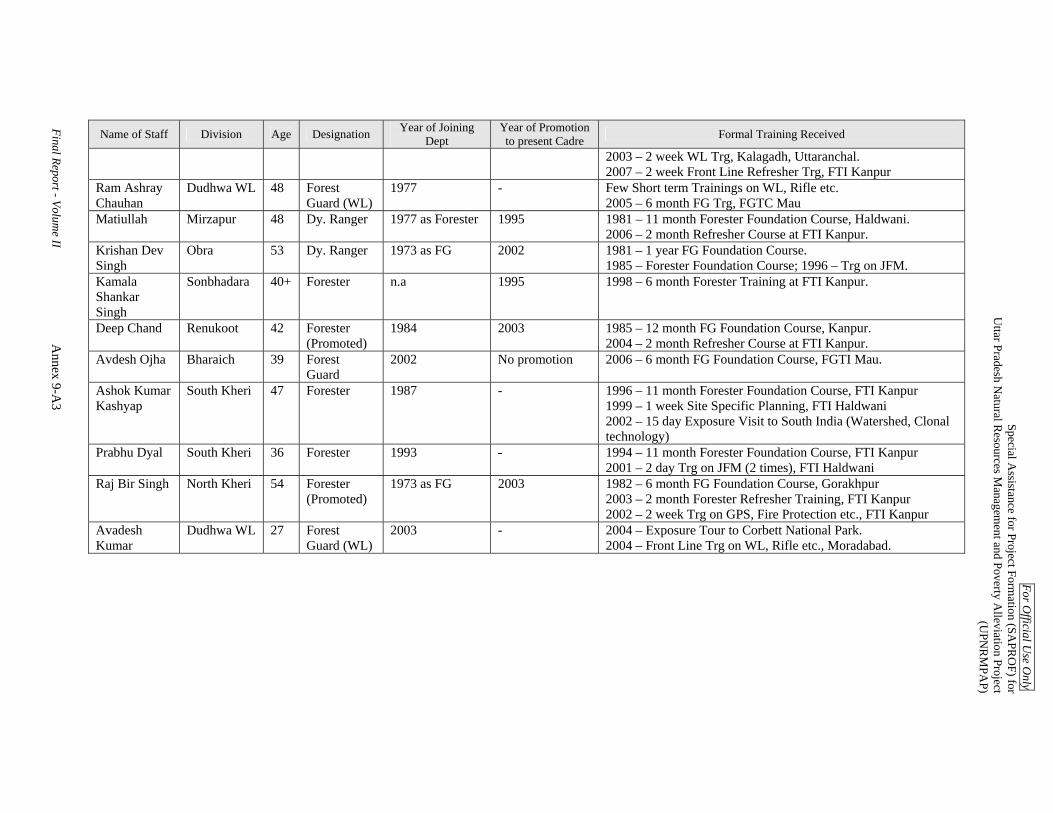
For Official U
se Only
Special Assistance for Project Form
ation (SAPR
OF) for
Uttar Pradesh N
atural Resources M
anagement and Poverty A
lleviation Project(U
PNR
MPA
P)
Final Report - Volume II
Annex 9-A
3
Name of Staff Division Age Designation Year of Joining Dept
Year of Promotion to present Cadre Formal Training Received
2003 – 2 week WL Trg, Kalagadh, Uttaranchal. 2007 – 2 week Front Line Refresher Trg, FTI Kanpur
Ram Ashray Chauhan
Dudhwa WL 48 Forest Guard (WL)
1977 - Few Short term Trainings on WL, Rifle etc. 2005 – 6 month FG Trg, FGTC Mau
Matiullah Mirzapur 48 Dy. Ranger 1977 as Forester 1995 1981 – 11 month Forester Foundation Course, Haldwani. 2006 – 2 month Refresher Course at FTI Kanpur.
Krishan Dev Singh
Obra 53 Dy. Ranger 1973 as FG 2002 1981 – 1 year FG Foundation Course. 1985 – Forester Foundation Course; 1996 – Trg on JFM.
Kamala Shankar Singh
Sonbhadara 40+ Forester n.a 1995 1998 – 6 month Forester Training at FTI Kanpur.
Deep Chand Renukoot 42 Forester (Promoted)
1984 2003 1985 – 12 month FG Foundation Course, Kanpur. 2004 – 2 month Refresher Course at FTI Kanpur.
Avdesh Ojha Bharaich 39 Forest Guard
2002 No promotion 2006 – 6 month FG Foundation Course, FGTI Mau.
Ashok Kumar Kashyap
South Kheri 47 Forester 1987 - 1996 – 11 month Forester Foundation Course, FTI Kanpur 1999 – 1 week Site Specific Planning, FTI Haldwani 2002 – 15 day Exposure Visit to South India (Watershed, Clonal technology)
Prabhu Dyal South Kheri 36 Forester 1993 - 1994 – 11 month Forester Foundation Course, FTI Kanpur 2001 – 2 day Trg on JFM (2 times), FTI Haldwani
Raj Bir Singh North Kheri 54 Forester (Promoted)
1973 as FG 2003 1982 – 6 month FG Foundation Course, Gorakhpur 2003 – 2 month Forester Refresher Training, FTI Kanpur 2002 – 2 week Trg on GPS, Fire Protection etc., FTI Kanpur
Avadesh Kumar
Dudhwa WL 27 Forest Guard (WL)
2003 - 2004 – Exposure Tour to Corbett National Park. 2004 – Front Line Trg on WL, Rifle etc., Moradabad.

For Official U
se Only
Special Assistance for Project Form
ation (SAPR
OF) for
Uttar Pradesh N
atural Resources M
anagement and Poverty A
lleviation Project(U
PNR
MPA
P)
Final Report - Volume II
Annex 9-A
4
Attachment A9.2-2 Profile of Sample Respondents (Divisional Forest Officers)
Name of DFO
Division Age Year of Joining
Department Formal Training Received
A.K.Shrivastav - IFS Kashi WL 45 1989 2007 – Wild Life Management Training at FTI, Kanpur. Ashok Mishra - PFS Obra 49 1985 No training received. Has been involved in Eco-Development Project at Corbett WL.V.S.Prasad - IFS Sonbhadara 46 1988 2001 – 1 month Training on High Tech Nursery under World Food Programme at
New Zealand and Australia. 2006 – 1 week programme on ‘Atrocities on Sc & ST’ at Hyderabad. Short Trg on 12” plantation at FTI, Kanpur.
K.S.Gusia IFS Renukoot 49 1984 2006 – Short term course at FTI-Kanpur. Ramesh K Pandey IFS Katarniaghat
WL 37 1996 2000 – exposure to participator approaches, PRA and micro-planning, ender, JFM
during work with IWDP, Haldwani. 2005 – ‘Bio-Diversity Conservation – Strategy to Prevent Crime’ at Admn Trg Inst, Bhopal. 2003 – ‘Change Management’ at FTI, Jaipur. 2004 – ‘Organised Wild-life Crime’ at ATI, Bhopal.
Ashok Prasad Sinha IFS Bharaich 39 1996 2000 – exposure to participator approaches, PRA and micro-planning, ender, JFM during work with IWDP, Ramnagar. 2007 – 3 week Advanced Management Course at IGNFA, Dehradun. Short 1-2 day trainings at FTI, Kanpur.
Promod Kumar Singh PFS Shravasti 49 1985 2000-2005 – Training on Participatory Management, Training of Trainers, Watershed Management with World Bank Project, Dehradun.
A.L.Yadav PFS South Kheri 56 1983 Sustainable Development, IIM Bangalore Soil and Water Conservation, SWCRTI – Dehradun Wild Life Management, WWI – Dehradun; Gauhati.
K.K.Singh IFS North Kheri 42 1992 1996 – 1 week Trg on Joint Forest Management, ATI Nainital 2002 –1 week Trg on Forest Management, XIMB Bhubaneshwar. 2006 – 1 week Trg on Peoples Participation, Corbett.

For Official U
se Only
Special Assistance for Project Form
ation (SAPR
OF) for
Uttar Pradesh N
atural Resources M
anagement and Poverty A
lleviation Project(U
PNR
MPA
P)
Final Report - Volume II
Annex 9-A
5
Attachment A9.2-3 TNA Result of Sample Respondents (JFMC member secretary Forest Divisions) Required R1 R5 R7 R9 R10 R12 R13 R18 R19 R20 R21 R22 R23 R24 R25 R27 R28 R29 R36 R37 R38 Present
Concept of JFM 3 1 1 2 1 2 2 2 2 2 2 2 2 2 2 2 3 2 2 2 2 2 1.9 1.1
Of the 21 staff, 17 associated JFM with protection of the Forest, while 1 associated JFMwith community development and poverty alleviation. Remaining 3 were unclear aboutJFM having recently taken charge. Overall conceptual understanding of JFM amongMember Secretaries is not sufficient to enable them to facilitate the project.
UsufructDistribution 3 1 1 2 1 2 1 1 1 1 1 1 1 1 1 2 3 2 1 1 1 2 1.3 1.7
Most staff have not read UP-JFM Rules 2002 with regards to management of usufruct.Sharing of income from usufruct is not being undertaken as per JFM rules. Staffinterviewed responded that the community was free to harvest fodder and collect fire-woodfrom the JFM area without paying any charge to the VDF. Harvesting of other usufruct isnot being monitored.
Role/Mgt ofJFMC, VFC, FDA 3 2 2 2 2 2 2 2 2 2 2 2 1 2 2 2 3 2 2 2 2 2 2.0 1.0
Staff reported that JFMCs are meeting regularly. JFMC are seen mainly as responsible forprotection. Contributions to VDF are not taking place. Training for Committee members isimparted during meetings, but exposure visits and formal training events are notundertaken.
Experience inImplementation 3 2 2 3 2 2 2 2 2 2 2 2 2 2 2 2 3 2 2 2 2 2 2.1 0.9
All staff interviewed have been involved in implementation of JFM in either WB Project orNAP. Few staff have experience with both. Implementation seems to have been limited toformation of Committee and execution of physical works.
UnderstandingLivelihoods 3 1 1 2 1 2 2 1 1 1 2 1 1 1 1 2 2 1 1 2 1 2 1.4 1.6
8 staff interviewed shared ideas about IGAs such as leaf-making, tailoring etc. Howeverthese have not been developed into action plans.. 8 staff associated poverty alleviation withgeneration of wage-labor through project funding.
Experience inImplementation 3 1 1 1 1 2 1 1 1 1 1 1 1 1 1 1 2 1 1 1 1 1 1.1 1.9
While 5 staff have had experience with implementation of IGAs such as leaf-making andtailoring during the World Bank project, they could not explain the impact of these IGAson the livelihoods of the beneficiaries. The remaining 16 have had no experience withalternate livelihoods for poverty alleviation.
Use of PRA Tools 3 1 1 1 1 1 2 1 1 1 1 1 1 2 1 1 2 1 1 2 1 2 1.2 1.85 of the staff have reported use of PRA tools such as Social and Resource mapping duringthe planning process. The remaining staff have not used PRA nor have they receivedtraining on use of PRA.
Experience inDevelopment ofparticipatoryMicro-Plans.
3 1 1 2 1 2 2 2 1 2 1 1 1 1 1 1 2 1 1 2 1 2 1.4 1.6
8 staff have been involved in development of micro-plans through collection of primarydata, village meetings etc. 13 have no experience in this regards. Micro-plans werereportedly developed at higher level with NGO support. Revision of micro-plans has nottaken place.
Conceptual clarity 3 1 1 1 1 2 2 1 1 1 1 2 1 1 2 1 2 2 1 2 1 1 1.3 1.7Majority of staff see participation of women as limited to membership of JFMC andengaging in activities such as nursery raising. Only few of the staff felt that womenmembers should have an active role in decision making at JFMC meetings.
Working onEmpowerment 3 1 1 1 1 2 1 1 1 1 1 1 1 1 2 1 2 2 1 1 1 1 1.2 1.8
Involvement of women has been mainly limited to participation in JFMC and wage labor.Only 4 staff have worked towards empowerment of women through encouraging activeparticipation of women JFMC members, formation of SHGs and implementation of IGAsfor women.
Soil andWaterConserv-ation
Understandingand experience ofImplementation.
3 1 2 2 2 2 2 2 1 1 1 2 1 2 2 2 2 1 1 1 1 2 1.6 1.4
Staff from south-eastern divisions were familiar with and have implemented SWCmeasures such as contour trenching, small check dams and water harvesting structures.However they lacked knowledge about watershed approach, layout of contours etc. Stafffrom Terai divisions reported that they were not aware about SWC since the area was plainand had a high water table, there was no need of SWC measures.
Non-woodForestProduce
Knowledge andExperience ofvalue addition,marketing
3 1 1 1 1 1 1 1 1 1 1 1 1 1 1 1 1 1 1 1 1 1 1.0 2.0
While staff were familiar collection and marketing of NWFPs such as bamboo and tenduleaves, only few of them mentioned the potential of value addition of products such ashoney and gum. Majority of staff did not have any knowledge or experience aboutmarketing, value addition of NWFPs. Most staff reported limited availability of NWFPS intheir project areas due to which such activities could not be implemented.
NurseryEstablishment/Mgt
3 2 2 2 2 2 1 2 2 2 2 2 2 3 3 2 2 2 2 2 1 1 2.0 1.0Majority of staff have had responsibility of managing traditional forest nurseries duringtheir tenure with the department. Few staff have experience of establishing new nurseries,use of modern methods such as green-houses, clonal technology, root-trainers.
Propagationmethods 3 1 2 2 2 2 2 2 1 1 1 2 1 3 3 2 2 2 2 2 1 1 1.8 1.2
Most staff have experience of seed propagation of common forest species, but do not haveexperience of vegetative methods of propagation such as grafting, budding, layering and hi-tech methods like cloning.
WomenEmpower-ment
NurseryManage-ment
Micro-Planning
Findings
JFM
PovertyAlleviation
RatingTopic Specific area Gap

For Official U
se Only
Special Assistance for Project Form
ation (SAPR
OF) for
Uttar Pradesh N
atural Resources M
anagement and Poverty A
lleviation Project(U
PNR
MPA
P)
Final Report - Volume II
Annex 9-A
6
Required R1 R5 R7 R9 R10 R12 R13 R18 R19 R20 R21 R22 R23 R24 R25 R27 R28 R29 R36 R37 R38 Present
Site selection,preparation 3 2 2 2 1 2 2 2 2 1 2 2 2 3 3 2 2 2 2 2 2 2 2.0 1.0
Most staff have experience in site selection and preparation. They were able to explain thecriteria used for selection and the activities carried out under site preparation prior toplantation.
PlantationTechnology,Mixed Plantation
3 2 2 2 1 2 2 2 2 1 2 2 2 3 3 2 2 2 2 2 2 2 2.0 1.0
19 staff of the 21 interviewed have had experience in raising of new plantations of timberspecies such as teak, and were able to relate the various activities involved. 2 staff haveexperience with mixed plantations of timber and other species such as bamboo, fruit, fodderand medicinal trees. Most staff informed that community was not involved in selection ofspecies.
Maintenanceactivities 3 2 2 2 1 2 2 2 1 2 2 2 2 3 3 2 2 2 2 2 2 2 2.0 1.0 Staff reported experience in supervision of maintenance activities generally followed by the
department such as pruning, thinning, weeding. Mulching is not generally practiced.
Protection 3 1 2 2 1 2 2 2 2 1 1 1 1 3 3 2 2 2 2 2 2 2 1.8 1.2
Staff have experience in supervision of activities such as controlled burning to preventforest fires, use of pesticides against termites. While staff report that JFMC assists inprotection of the JFM area, they are more dependant on Cattle Protection Trench &Watchers to protect the area from grazing and felling.
Farmer DemandAnalysis 3 1 1 1 1 2 1 1 1 1 1 1 1 2 2 2 1 1 1 2 1 1 1.2 1.8
Staff reported that sale / free distribution of seedlings from FD nursery as per demand andavailability is commonly practiced in all divisions. However only few staff have beendirectly involved in this activity. Decision regarding number of seedlings of agro-forestryspecies to be raised in the nursery is based on previous years sale/distribution or on targetsfixed by the department.
AgroforestryExtension 3 1 1 1 1 1 1 1 1 1 1 1 1 1 1 1 1 1 1 2 2 1 1.1 1.9
Only 2 staff have reported interaction with farmers for extension purposes through on-sitevisits, technical advice regarding plantation method, selection of species, maintenanceactivities etc. The remaining do not have any knowledge and experience of agro-forestryextension.
Monitor-ing Basic M & E 3 2 2 2 2 2 2 2 2 1 2 2 1 2 2 2 3 2 2 2 2 2 2.0 1.0
Most staff have experience with implementation of departmental procedures such asmaintenance of plantation journal. Few are also maintaining records about produce fromJFM areas.
Field Craft 3 1 2 1 1 1 1 1 1 1 1 2 1 2 2 2 2 2 2 2 2 2 1.5 1.5 11 staff have reported to have knowledge of field craft such as identification of commonspecies of plants and wild-life, behavior of common wild-life species.
Monitoring andSurveys 3 1 2 1 1 1 1 1 2 1 2 2 2 2 2 2 2 2 2 2 2 2 1.7 1.3 14 staff interviewed reported to have participated in the recent Wild Life Census during
2006-7. They were able to identify and record different wild-life species.
Dealing withvandals 3 1 1 1 1 1 1 1 1 1 1 1 1 1 1 1 2 1 1 2 2 2 1.2 1.8 4 staff have reported to have dealt with cases of vandalism such as illegal felling, poaching,
encroachment and have taken legal action in this regards.
InfrastructureDevelopment 3 1 2 2 1 1 1 2 1 1 2 2 2 3 3 2 2 1 1 1 1 2 1.6 1.4
2 staff reported that they provided supervision support for construction of office buildingsand quarters. 9 staff have supervised construction of all weather roads, culverts, forestcheck-posts and have been responsible for repair and maintenance activities. 10 staffreported that they had no experience of construction and maintenance activities.
AVERAGE 3.00 1.3 1.5 1.6 1.2 1.7 1.6 1.5 1.4 1.2 1.4 1.6 1.3 1.9 2.0 1.7 2.1 1.6 1.5 1.8 1.5 1.7 1.6 1.4 Rating scales: 4: Excellent knowledge/skills for the implementation of the project3: Adequate level of knowledge and skills2: Certain level of knowledge and skills, but needs improvement1: Would have difficulties in implementation with present knowledge/skills
Wild LifeManage-ment
Findings
PlantationManage-ment
Agro-Forestry
RatingTopic Specific area Gap

For Official U
se Only
Special Assistance for Project Form
ation (SAPR
OF) for
Uttar Pradesh N
atural Resources M
anagement and Poverty A
lleviation Project(U
PNR
MPA
P)
Final Report - Volume II
Annex 9-A
7
Attachment A9.2-4 TNA result of sample respondents (JFM member secretary WL Division)
Required R3 R4 R14 R15 R16 R32 R33 R34 Present
Concept of JFM 3 1 2 2 2 1 2 3 2 1.9 1.1Of the 8 WL staff interviewed, 4 were Member Secretaries of VFCs and 4 of EDCs. Of the 4 JFMstaff, 2 associated JFM with community development and poverty alleviation, while 1 associatedJFM with protection of the Forest. In case of the 4 Eco-Developme
UsufructDistribution 3 1 1 1 2 1 2 2 2 1.5 1.5
Most staff have not read UP-JFM Rules 2002 with regards to management of usufruct. Sharing ofincome from usufruct is not being undertaken as per JFM rules. Staff responded that thecommunity was free to harvest fodder and collect fire-wood from the JFM
Role/Mgt ofJFMC, VFC,FDA
3 1 1 2 2 1 2 3 2 1.8 1.3Staff reported that VFCs and EDCs are meeting regularly. Committees are seen mainly asresponsible for protection. Contributions to VDF are not taking place. Training for Committeemembers is imparted during meetings, but exposure visits and formal train
Experience inImplementation 3 1 2 2 2 2 2 3 2 2.0 1.0
Of the 8 WL staff interviewed, 4 were Member Secretaries of VFCs and 4 of EDCs. 4 staff havetaken charge of the projects mid-way and hence do not have experience of the start-up phase.Project implementation seems to have been limited to formation of Co
UnderstandingLivelihoods 3 1 2 1 1 1 2 2 2 1.5 1.5
Staff implementing Eco-Development project were able suggest IGAs such as leaf-making,tailoring, aqua-culture, poultry, piggery etc. In case of staff implementing VFCs, except for 1 therest associated poverty alleviation with generation of wage-labor th
Experience inImplementation 3 1 1 1 1 1 1 2 2 1.3 1.8
Staff implementing the Eco-Development project have had experience with utilization of revolvingfund for implementation of IGAs such as leaf-making, tailoring, aquaculture, piggery. Howeverthey were unclear as to the sustainability and the impact of th
Use of PRATools 3 1 1 1 2 1 2 2 2 1.5 1.5
Staff implementing Eco-Development had accompanied the planning teams and reported use ofPRA tools such as Social and Resource mapping during the planning process. The staffimplementing the VFC were not able to explain the purpose and use of common PRA
Experience inDevelopment ofparticipatoryMicro-Plans.
3 1 1 1 2 1 1 2 2 1.4 1.6None of the staff interviewed were directly responsible for development of micro-plans. 5 of thestaff had accompanied the planning teams and hence were involved in collection of primary data,village meetings etc. Revision of micro-plans has not taken p
Conceptualclarity 3 1 1 2 1 1 2 2 2 1.5 1.5
Staff implementing Eco-Development project were aware about the need to strengthen role ofwomen in decision making, formation of SHGs and to enable them to benefit from IGAs. In case ofVFC staff, participation of women is limited to membership of JFMC a
Working onEmpowerment 3 1 1 1 2 1 1 2 1 1.3 1.8
Involvement of women has been mainly limited to participation in committee meetings and wagelabor. In 2 cases, staff working with EDCs have reported working towards empowerment of womenthrough encouraging active participation of women JFMC members, impl
Comments on Present level of Knowledge & Experience in JFM context
JFM
PovertyAllev-iation
Micro-Planning
Topic Specific AreaRating
Gap
WomenEmpower-ment
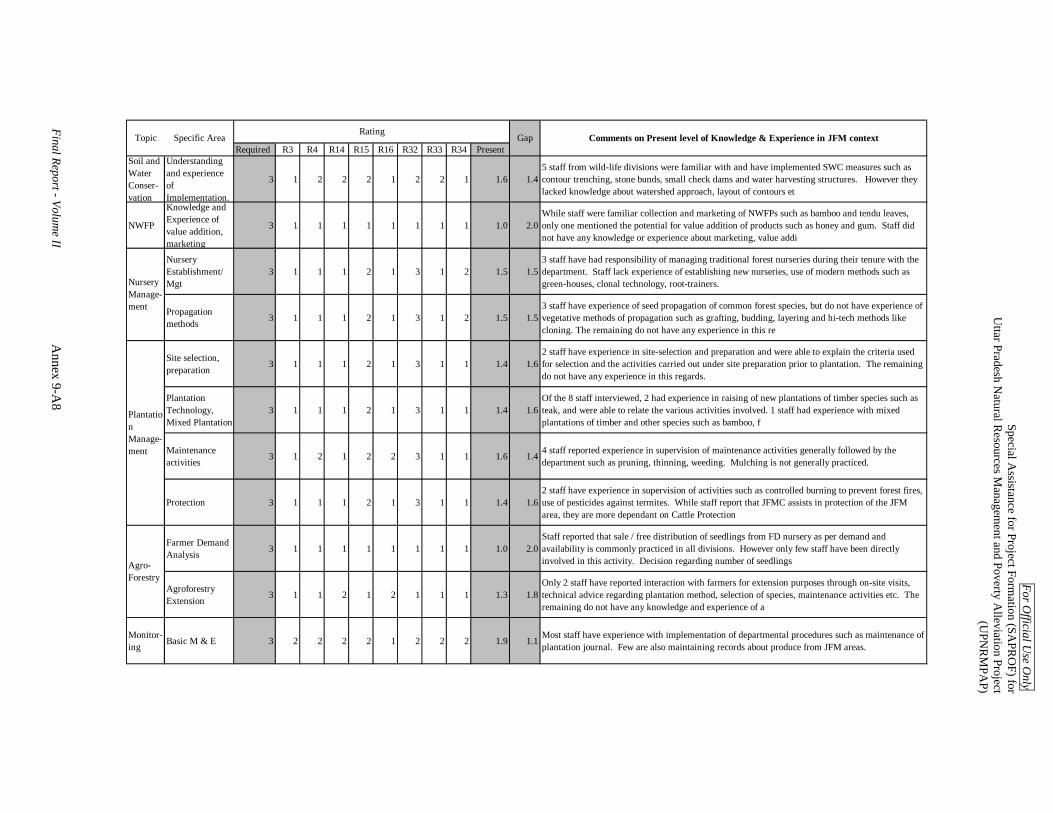
For Official U
se Only
Special Assistance for Project Form
ation (SAPR
OF) for
Uttar Pradesh N
atural Resources M
anagement and Poverty A
lleviation Project(U
PNR
MPA
P)
Final Report - Volume II
Annex 9-A
8
Required R3 R4 R14 R15 R16 R32 R33 R34 PresentSoil andWaterConser-vation
Understandingand experienceofImplementation.
3 1 2 2 2 1 2 2 1 1.6 1.45 staff from wild-life divisions were familiar with and have implemented SWC measures such ascontour trenching, stone bunds, small check dams and water harvesting structures. However theylacked knowledge about watershed approach, layout of contours et
NWFP
Knowledge andExperience ofvalue addition,marketing
3 1 1 1 1 1 1 1 1 1.0 2.0While staff were familiar collection and marketing of NWFPs such as bamboo and tendu leaves,only one mentioned the potential for value addition of products such as honey and gum. Staff didnot have any knowledge or experience about marketing, value addi
NurseryEstablishment/Mgt
3 1 1 1 2 1 3 1 2 1.5 1.53 staff have had responsibility of managing traditional forest nurseries during their tenure with thedepartment. Staff lack experience of establishing new nurseries, use of modern methods such asgreen-houses, clonal technology, root-trainers.
Propagationmethods 3 1 1 1 2 1 3 1 2 1.5 1.5
3 staff have experience of seed propagation of common forest species, but do not have experience ofvegetative methods of propagation such as grafting, budding, layering and hi-tech methods likecloning. The remaining do not have any experience in this re
Site selection,preparation 3 1 1 1 2 1 3 1 1 1.4 1.6
2 staff have experience in site-selection and preparation and were able to explain the criteria usedfor selection and the activities carried out under site preparation prior to plantation. The remainingdo not have any experience in this regards.
PlantationTechnology,Mixed Plantation
3 1 1 1 2 1 3 1 1 1.4 1.6Of the 8 staff interviewed, 2 had experience in raising of new plantations of timber species such asteak, and were able to relate the various activities involved. 1 staff had experience with mixedplantations of timber and other species such as bamboo, f
Maintenanceactivities 3 1 2 1 2 2 3 1 1 1.6 1.4 4 staff reported experience in supervision of maintenance activities generally followed by the
department such as pruning, thinning, weeding. Mulching is not generally practiced.
Protection 3 1 1 1 2 1 3 1 1 1.4 1.62 staff have experience in supervision of activities such as controlled burning to prevent forest fires,use of pesticides against termites. While staff report that JFMC assists in protection of the JFMarea, they are more dependant on Cattle Protection
Farmer DemandAnalysis 3 1 1 1 1 1 1 1 1 1.0 2.0
Staff reported that sale / free distribution of seedlings from FD nursery as per demand andavailability is commonly practiced in all divisions. However only few staff have been directlyinvolved in this activity. Decision regarding number of seedlings
AgroforestryExtension 3 1 1 2 1 2 1 1 1 1.3 1.8
Only 2 staff have reported interaction with farmers for extension purposes through on-site visits,technical advice regarding plantation method, selection of species, maintenance activities etc. Theremaining do not have any knowledge and experience of a
Monitor-ing Basic M & E 3 2 2 2 2 1 2 2 2 1.9 1.1 Most staff have experience with implementation of departmental procedures such as maintenance of
plantation journal. Few are also maintaining records about produce from JFM areas.
Comments on Present level of Knowledge & Experience in JFM context
Agro-Forestry
Topic Specific AreaRating
Gap
NurseryManage-ment
PlantationManage-ment

For Official U
se Only
Special Assistance for Project Form
ation (SAPR
OF) for
Uttar Pradesh N
atural Resources M
anagement and Poverty A
lleviation Project(U
PNR
MPA
P)
Final Report - Volume II
Annex 9-A
9
Required R3 R4 R14 R15 R16 R32 R33 R34 Present
Field Craft 3 1 1 2 2 1 3 3 2 1.9 1.1 5 staff have reported to have knowledge of field craft such as identification of common species ofplants and wild-life, behavior of common wild-life species.
Monitoring andSurveys 3 1 1 2 2 2 3 3 2 2.0 1.0 6 staff interviewed reported to have participated in the recent Wild Life Census during 2006-7.
They were able to identify and record different wild-life species.
Dealing withvandals 3 1 1 2 1 1 3 2 2 1.6 1.4 4 staff have reported to have dealt with cases of vandalism such as illegal felling, poaching,
encroachment and have taken legal action in this regards.
InfrastructureDevelopment 3 1 1 1 1 1 3 2 2 1.5 1.5
1 staff reported that he had provided supervision support for construction of office buildings andquarters. 2 staff have supervised construction of all weather roads, culverts, forest check-posts andhave been responsible for repair and maintenance activ
AVERAGE 3 1.0 1.2 1.4 1.7 1.2 2.2 1.8 1.6 1.5 1.5Rating scales: 4: Excellent knowledge/skills for the implementation of the project3: Adequate level of knowledge and skills2: Certain level of knowledge and skills, but needs improvement1: Would have difficulties in implementation with present knowledge/skills
Comments on Present level of Knowledge & Experience in JFM contextTopic Specific AreaRating
Gap
WildLifeManage-ment

For Official U
se Only
Special Assistance for Project Form
ation (SAPR
OF) for
Uttar Pradesh N
atural Resources M
anagement and Poverty A
lleviation Project(U
PNR
MPA
P)
Final Report - Volume II
Annex 9-A
10
Attachment A9.2-5 TNA Result of Sample Respondents (Control)
Required R2 R6 R8 R11 R17 R26 R30 R31 R35 Present
Concept of JFM 3 1 1 1 2 2 2 2 2 1 1.6 1.4 None of the staff interviewed associated JFM with community development and poverty alleviation. 5 associated JFMwith protection of the Forest. Remaining 4 did not have any concept of JFM.
UsufructDistribution 3 1 1 1 1 1 1 1 1 1 1.0 2.0
None of the staff interviewed have read UP-JFM Rules 2002 with regards to management of usufruct. While few of thestaff were aware that the community was permitted to harvest grass and fuel-wood, they were not aware about themechanism to manage this nor were they aware about distribution of other types of usufruct from JFM area.
Role/Mgt of JFMC,VFC, FDA 3 2 1 1 1 1 2 2 2 2 1.6 1.4
5 staff saw main role of JFMC as being responsible for protection of JFM area, providing labor and supervision ofEntry Point Activities. They are not aware about need or methods of capacity building of Committees. Remainingstaff informed that they did not have any knowledge of the subject.
Experience inImplementation 3 1 1 1 1 1 1 1 1 1 1.0 2.0 None of staff interviewed have been involved in implementation of JFM.
UnderstandingLivelihoods 3 1 1 2 2 1 2 2 1 2 1.6 1.4 5 of the staff interviewed shared ideas about IGAs such as leaf-making, tailoring etc. Remaining 6 staff associated
poverty alleviation with generation of wage-labor through project funding.
Experience inImplementation 3 1 1 1 1 1 1 1 1 1 1.0 2.0 None of staff interviewed have been involved in implementation of IGAs for poverty alleviation.
Use of PRA Tools 3 2 1 1 1 1 2 2 2 1 1.4 1.6 4 of the staff reported accompanying planners during village visits for PRA and were aware about tools such as Socialand Resource mapping. The remaining staff do not have any knowledge regarding the subject.
Experience inDevelopment ofparticipatoryMicro-Plans.
3 2 1 1 1 1 1 1 2 1 1.2 1.82 staff have been involved in development of micro-plans through collection of primary data, village meetings etc.Micro-plans were reportedly developed at higher level with NGO support. Revision of micro-plans has not takenplace.
Conceptual clarity 3 1 1 1 1 1 2 2 1 1 1.2 1.8Majority of staff see participation of women as limited to membership of JFMC and engaging in activities such asnursery raising. Only 2 of the staff felt that women members should have an active role in decision making at JFMCmeetings.
Working onEmpowerment 3 1 1 1 1 1 1 1 1 1 1.0 2.0 None of the staff interviewed had implemented any activities towards empowerment of women.
Soil andWaterConser-vation
Understanding andexperience ofImplementation.
3 2 2 1 2 2 2 2 1 1 1.7 1.3
Staff have implemented SWC measures such as contour trenching, small check dams and water harvesting structures.However they lacked knowledge about watershed approach, layout of contours etc. Staff from Terai divisions reportedthat they were not aware about SWC since the area was plain and had a high water table, there was no need of SWCmeasures.
NWFP
Knowledge andExperience ofvalue addition,marketing
3 1 1 1 1 1 1 1 1 1 1.0 2.0While staff were familiar collection and marketing of NWFPs such as bamboo and tendu leaves, they did not have anyknowledge or experience about marketing, value addition of NWFPs. Most staff reported limited availability ofNWFPS in their project areas due to which such activities could not be implemented.
WomenEmpower-ment
Micro-Planning
Topic FindingsSpecific areaRating Gap
JFM
PovertyAllev-iation

For Official U
se Only
Special Assistance for Project Form
ation (SAPR
OF) for
Uttar Pradesh N
atural Resources M
anagement and Poverty A
lleviation Project(U
PNR
MPA
P)
Final Report - Volume II
Annex 9-A
11
Required R2 R6 R8 R11 R17 R26 R30 R31 R35 Present
NurseryEstablishment/Mgt
3 2 1 2 1 2 1 2 2 1 1.6 1.4Majority of staff have had responsibility of managing traditional forest nurseries during their tenure with thedepartment. They do not have experience of establishing new nurseries, use of modern methods such as green-houses,clonal technology, root-trainers.
Propagationmethods 3 2 1 2 2 2 2 2 2 1 1.8 1.2 Most staff have experience of seed propagation of common forest species, but do not have experience of vegetative
methods of propagation such as grafting, budding, layering and hi-tech methods like cloning.
Site selection,preparation 3 2 2 2 2 2 2 2 3 1 2.0 1.0 Most staff have experience in site selection and preparation. They were able to explain the criteria used for selection
and the activities carried out under site preparation prior to plantation.
PlantationTechnology, MixedPlantation
3 2 2 2 2 2 2 2 3 1 2.0 1.0
8 of the 9 staff interviewed have had experience in raising of new plantations of timber species such as teak, and wereable to relate the various activities involved. 1 staff has experience with mixed plantations of timber and other speciessuch as bamboo, fruit, fodder and medicinal trees. Most staff informed that community was not involved in selectionof species.
Maintenanceactivities 3 2 2 2 2 2 2 2 3 1 2.0 1.0 Staff reported experience in supervision of maintenance activities generally followed by the department such as
pruning, thinning, weeding. Mulching is not generally practiced.
Protection 3 2 1 2 2 2 2 2 3 1 1.9 1.1Staff have experience in supervision of activities such as controlled burning to prevent forest fires, use of pesticidesagainst termites. They are Since these are non-JFM areas, they are dependant on Cattle Protection Trench & Watchersto protect the area from grazing and felling.
Farmer DemandAnalysis 3 1 1 1 2 1 1 2 2 1 1.3 1.7
Staff reported that sale / free distribution of seedlings from FD nursery as per demand and availability is commonlypracticed in all divisions. However only few staff have been directly involved in this activity. Decision regardingnumber of seedlings of agro-forestry species to be raised in the nursery is based on previous years sale/distribution oron targets fixed by the department.
AgroforestryExtension 3 1 1 1 1 1 2 2 2 1 1.3 1.7
3 staff have reported interaction with farmers for extension purposes through on-site visits, technical advice regardingplantation method, selection of species, maintenance activities etc. The remaining do not have any knowledge andexperience of agro-forestry extension.
Monitor-ing Basic M & E 3 2 2 2 2 2 2 2 2 1 1.9 1.1 Most staff have experience with implementation of departmental procedures such as maintenance of plantation journal.
Field Craft 3 2 2 1 1 1 2 1 2 2 1.6 1.4 5 staff have reported to have knowledge of field craft such as identification of common species of plants and wild-life,behavior of common wild-life species.
Monitoring andSurveys 3 2 2 1 2 1 1 1 2 2 1.6 1.4 5 staff interviewed reported to have participated in the recent Wild Life Census during 2006-7. They were able to
identify and record different wild-life species.
Dealing withvandals 3 2 1 1 1 1 2 1 2 1 1.3 1.7 3 staff have reported to have dealt with cases of vandalism such as illegal felling, poaching, encroachment and have
taken legal action in this regards.
InfrastructureDevelopment 3 2 1 2 2 1 3 1 2 1 1.7 1.3
1 staff reported that he had provided supervision support for construction of office buildings and quarters. 4 staff havesupervised construction of all weather roads, culverts, forest check-posts and have been responsible for repair andmaintenance activities. 4 staff reported that they had no experience of construction and maintenance activities.
AVERAGE 3 1.6 1.3 1.4 1.5 1.4 1.7 1.6 1.8 1.2 1.5 1.5Rating scales: 4: Excellent knowledge/skills for the implementation of the project3: Adequate level of knowledge and skills2: Certain level of knowledge and skills, but needs improvement1: Would have difficulties in implementation with present knowledge/skills
WildLifeManage-ment
Agro-Forestry
NurseryManage-ment
PlantationManage-ment
Topic FindingsSpecific areaRating Gap

For Official U
se Only
Special Assistance for Project Form
ation (SAPR
OF) for
Uttar Pradesh N
atural Resources M
anagement and Poverty A
lleviation Project(U
PNR
MPA
P)
Final Report - Volume II
Annex 9-A
12
Attachment A9.2-6 TNA Result of Sample Respondents (Divisional Forest Officers)
Required R1 R2 R3 R4 R5 R6 R7 R8 R9 Present
Concept of JFM 3 2 2 2 2 3 2 2 2 2 2.1 0.9 The DFOs were clear about the concept of JFM and were able to able to associate the project with the objectives ofcommunity development and poverty alleviation. Only few of the DFOs have studied the UP-JFM Rules 2002.
Management ofUsufruct 3 2 1 1 1 2 1 2 1 2 1.4 1.6
The DFOs had divergent views regarding distribution of usufruct and sharing from income. However the generalopinion expressed was that the State Government should prepare guidelines for implementation of the JFM Rules atproject level. In case of JFM in RF areas, some DFOs were of the view that these would have to be declared VillageForest by the Government before the Rules could be applied. There was also no clarity regarding distribution ofrevenue from Tendu leaves which is presently being sold by the FD to the Forest Corporation.
Role/Mgt of JFM andFDA 3 2 2 1 2 2 2 2 2 2 1.9 1.1
The DFOs reported that they are organising regular meetings of the FDA. Training for FDA and JFMC Committeemembers were imparted during initial years and is now covered during meetings as per need. However, they are notpreparing Capacity Building plans and organising formal training and exposure visits for village committees.
Traditional andAlternate Livelihoods 3 2 1 2 1 2 2 2 2 2 1.8 1.2
Of the 9 DFOs interviewed, 7 suggested numerous options for alternate livelihoods such as plantation of productivetrees, formation of SHGs, imparting training and providing micro-finance for setting up leaf-making units, groceryshop, cycle repair unit etc. However, they were not able to explain how to operationalise these. Some were of theopinion that IGAs would not be successful in remote areas.
Experience in IncomeGeneration Activities 3 1 1 3 1 3 1 2 2 2 1.8 1.2
Some of the DFOs have had experience in introduction of grain-banks and IGAs such as leaf-making, grocery shop,piggery under WB and IWDP projects. However these could not be followed-up by them due to subsequent transfer outof the area.
Micro-Planning
Development ofParticipatory VillagePlans
3 2 1 2 2 3 2 2 2 2 2.0 1.0
There was wide acceptance of the participatory planning process amongst the DFOs interviewed. The DFOs involvedin implementation of the WB and IWDP projects were appreciative of the role of NGOs in facilitating preparation ofmicro-plans. They suggested that NGOs should be involved in the NAP as well. Revision of plans has not taken placeand plans need to be re-visited.
Conceptual Clarity 3 2 1 3 1 2 1 2 2 2 1.8 1.2
Most DFOs interviewed were of the view that there needs to be greater involvement of women in project activities.Some of the suggestions in this regards were sensitization of project staff and committee members, formation of SHGs,micro-finance, appointment of women motivators at village level and facilitators at NGO level. Three of the DFOs didnot have any suggestions in this regards.
Working onEmpowerment 3 1 1 3 1 2 2 2 2 1 1.7 1.3
Some of the activities initiated by DFOs are; collective marketing of mahua (Dinari village, Sonbhadra division),Forest protection and saving program through women's committee (Balai village, Bharaich division), Exposure visit towomen's project at Corbett. Only few of the DFOs have experience in this regards.
SWC Watershed Approach 3 1 2 2 2 3 2 2 3 3 2.2 0.8 Few DFOs have implemented watershed approach during their work with IWDP. Except for one DFO, all haveimplemented SWC works such as check-dams, trenches, gully-plugs, water harvesting structures in their divisions.
NWFP Value Addition,Marketing 3 1 1 1 1 2 1 2 3 1 1.4 1.6
While most DFOs felt that there was good potential for value addition and marketing through activities such amanufacture of grass-ropes, bidis, leaf-plates, basket making etc., some were of the opinion that there was no scope inRF areas as extraction of NTFPs by community was not permitted. In one instance, the DFO have implementedactivities such as collective marketing of mahua.
Rating Gap Findings
WomenEmpower-ment
JFM
PovertyAlleviat-ion
Topic Specific Area
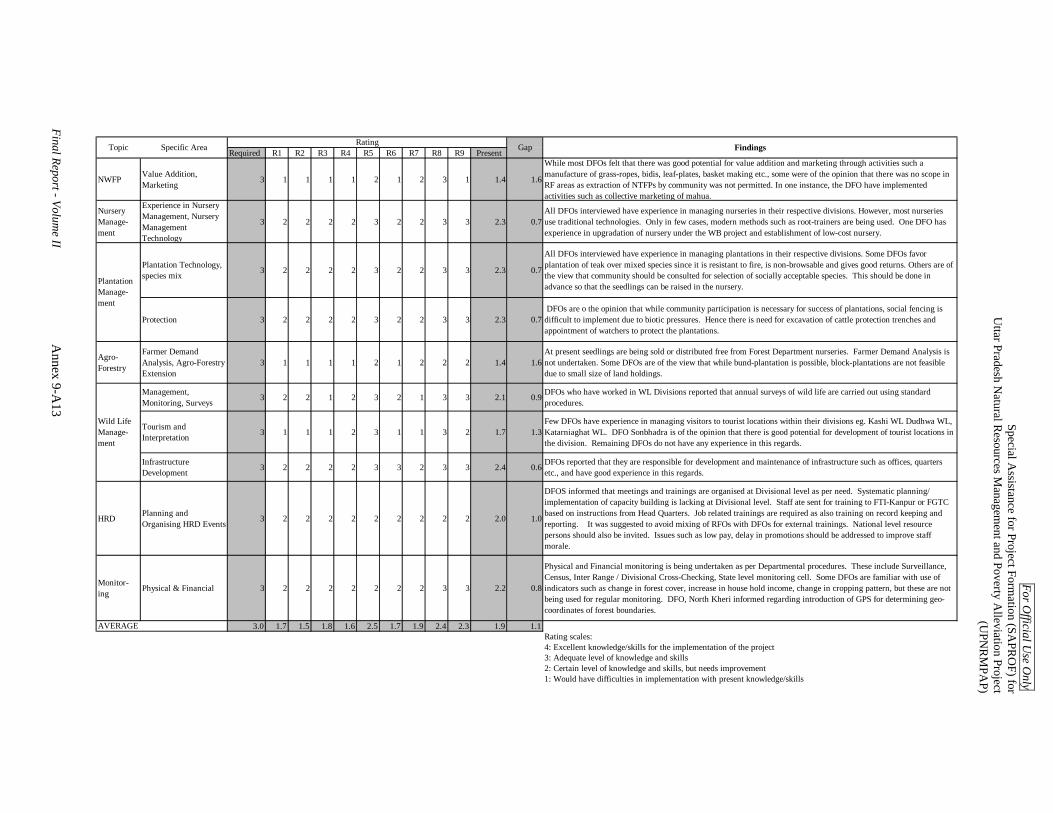
For Official U
se Only
Special Assistance for Project Form
ation (SAPR
OF) for
Uttar Pradesh N
atural Resources M
anagement and Poverty A
lleviation Project(U
PNR
MPA
P)
Final Report - Volume II
Annex 9-A
13
Required R1 R2 R3 R4 R5 R6 R7 R8 R9 Present
NWFP Value Addition,Marketing 3 1 1 1 1 2 1 2 3 1 1.4 1.6
While most DFOs felt that there was good potential for value addition and marketing through activities such amanufacture of grass-ropes, bidis, leaf-plates, basket making etc., some were of the opinion that there was no scope inRF areas as extraction of NTFPs by community was not permitted. In one instance, the DFO have implementedactivities such as collective marketing of mahua.
NurseryManage-ment
Experience in NurseryManagement, NurseryManagementTechnology
3 2 2 2 2 3 2 2 3 3 2.3 0.7All DFOs interviewed have experience in managing nurseries in their respective divisions. However, most nurseriesuse traditional technologies. Only in few cases, modern methods such as root-trainers are being used. One DFO hasexperience in upgradation of nursery under the WB project and establishment of low-cost nursery.
Plantation Technology,species mix 3 2 2 2 2 3 2 2 3 3 2.3 0.7
All DFOs interviewed have experience in managing plantations in their respective divisions. Some DFOs favorplantation of teak over mixed species since it is resistant to fire, is non-browsable and gives good returns. Others are ofthe view that community should be consulted for selection of socially acceptable species. This should be done inadvance so that the seedlings can be raised in the nursery.
Protection 3 2 2 2 2 3 2 2 3 3 2.3 0.7 DFOs are o the opinion that while community participation is necessary for success of plantations, social fencing isdifficult to implement due to biotic pressures. Hence there is need for excavation of cattle protection trenches andappointment of watchers to protect the plantations.
Agro-Forestry
Farmer DemandAnalysis, Agro-ForestryExtension
3 1 1 1 1 2 1 2 2 2 1.4 1.6At present seedlings are being sold or distributed free from Forest Department nurseries. Farmer Demand Analysis isnot undertaken. Some DFOs are of the view that while bund-plantation is possible, block-plantations are not feasibledue to small size of land holdings.
Management,Monitoring, Surveys 3 2 2 1 2 3 2 1 3 3 2.1 0.9 DFOs who have worked in WL Divisions reported that annual surveys of wild life are carried out using standard
procedures.
Tourism andInterpretation 3 1 1 1 2 3 1 1 3 2 1.7 1.3
Few DFOs have experience in managing visitors to tourist locations within their divisions eg. Kashi WL Dudhwa WL,Katarniaghat WL. DFO Sonbhadra is of the opinion that there is good potential for development of tourist locations inthe division. Remaining DFOs do not have any experience in this regards.
InfrastructureDevelopment 3 2 2 2 2 3 3 2 3 3 2.4 0.6 DFOs reported that they are responsible for development and maintenance of infrastructure such as offices, quarters
etc., and have good experience in this regards.
HRD Planning andOrganising HRD Events 3 2 2 2 2 2 2 2 2 2 2.0 1.0
DFOS informed that meetings and trainings are organised at Divisional level as per need. Systematic planning/implementation of capacity building is lacking at Divisional level. Staff ate sent for training to FTI-Kanpur or FGTCbased on instructions from Head Quarters. Job related trainings are required as also training on record keeping andreporting. It was suggested to avoid mixing of RFOs with DFOs for external trainings. National level resourcepersons should also be invited. Issues such as low pay, delay in promotions should be addressed to improve staffmorale.
Monitor-ing Physical & Financial 3 2 2 2 2 2 2 2 3 3 2.2 0.8
Physical and Financial monitoring is being undertaken as per Departmental procedures. These include Surveillance,Census, Inter Range / Divisional Cross-Checking, State level monitoring cell. Some DFOs are familiar with use ofindicators such as change in forest cover, increase in house hold income, change in cropping pattern, but these are notbeing used for regular monitoring. DFO, North Kheri informed regarding introduction of GPS for determining geo-coordinates of forest boundaries.
3.0 1.7 1.5 1.8 1.6 2.5 1.7 1.9 2.4 2.3 1.9 1.1Rating scales: 4: Excellent knowledge/skills for the implementation of the project3: Adequate level of knowledge and skills2: Certain level of knowledge and skills, but needs improvement1: Would have difficulties in implementation with present knowledge/skills
Rating Gap
AVERAGE
Findings
Wild LifeManage-ment
PlantationManage-ment
Topic Specific Area

For Official Use Only Special Assistance for Project Formation (SAPROF) for
Uttar Pradesh Natural Resource Management and Poverty Alleviation Project (UPNRMPAP)
Final Report- Volume II
Special Assistance for Project Formation
for Uttar Pradesh Natural Resource Management and Poverty Alleviation Project
(UPNRMPAP)
Final Report
Volume II: ANNEXES
ANNEX-10 DIVISION WISE WORK QUANTITY
AND
METHODOLOGY OF BENEFIT VALUATION

For Official Use Only Special Assistance for Project Formation (SAPROF) for
Uttar Pradesh Natural Resources Management and Poverty Alleviation Project (UPNRMPAP)
Final Report - Volume II i
Special Assistance for Project Formation (SAPROF)
for
Uttar Pradesh Natural Resource Management and Poverty Alleviation Project (UPNRMPAP)
Final Report
Volume II: Annexes
ANNEX 10 DIVISION-WISE WORK QUANTITY AND METHODOLOGY OF BENEFIT VALUATION
Table of Contents
Annex 10-1 Division-wise Work Quantity 1. Division-wise Work Quantity................................................................................... Annex 10-1 Annex 10-2 Methodology of Benefit Valuation 1. Forestry Production ................................................................................................... Annex 10-6 2. Prevention of Soil Erosion by Increase of Vegetative Cover ...................................Annex 10-11 3. CO2 Sequestration .................................................................................................. Annex 10-12 4. Fire Damage ............................................................................................................ Annex 10-14 5. Income Generating Activities (IGA) ....................................................................... Annex 10-14
5.1 Project life .................................................................................................... Annex 10-14 5.2 Number of micro-enterprises ....................................................................... Annex 10-14 5.3 Forest-based IGA ......................................................................................... Annex 10-15 5.4 Natural resource-based IGA......................................................................... Annex 10-15 5.5 Non-natural resource-based IGA ................................................................. Annex 10-16 5.6 Economic benefit of IGA ............................................................................. Annex 10-16
6. Ecotourism .............................................................................................................. Annex 10-17
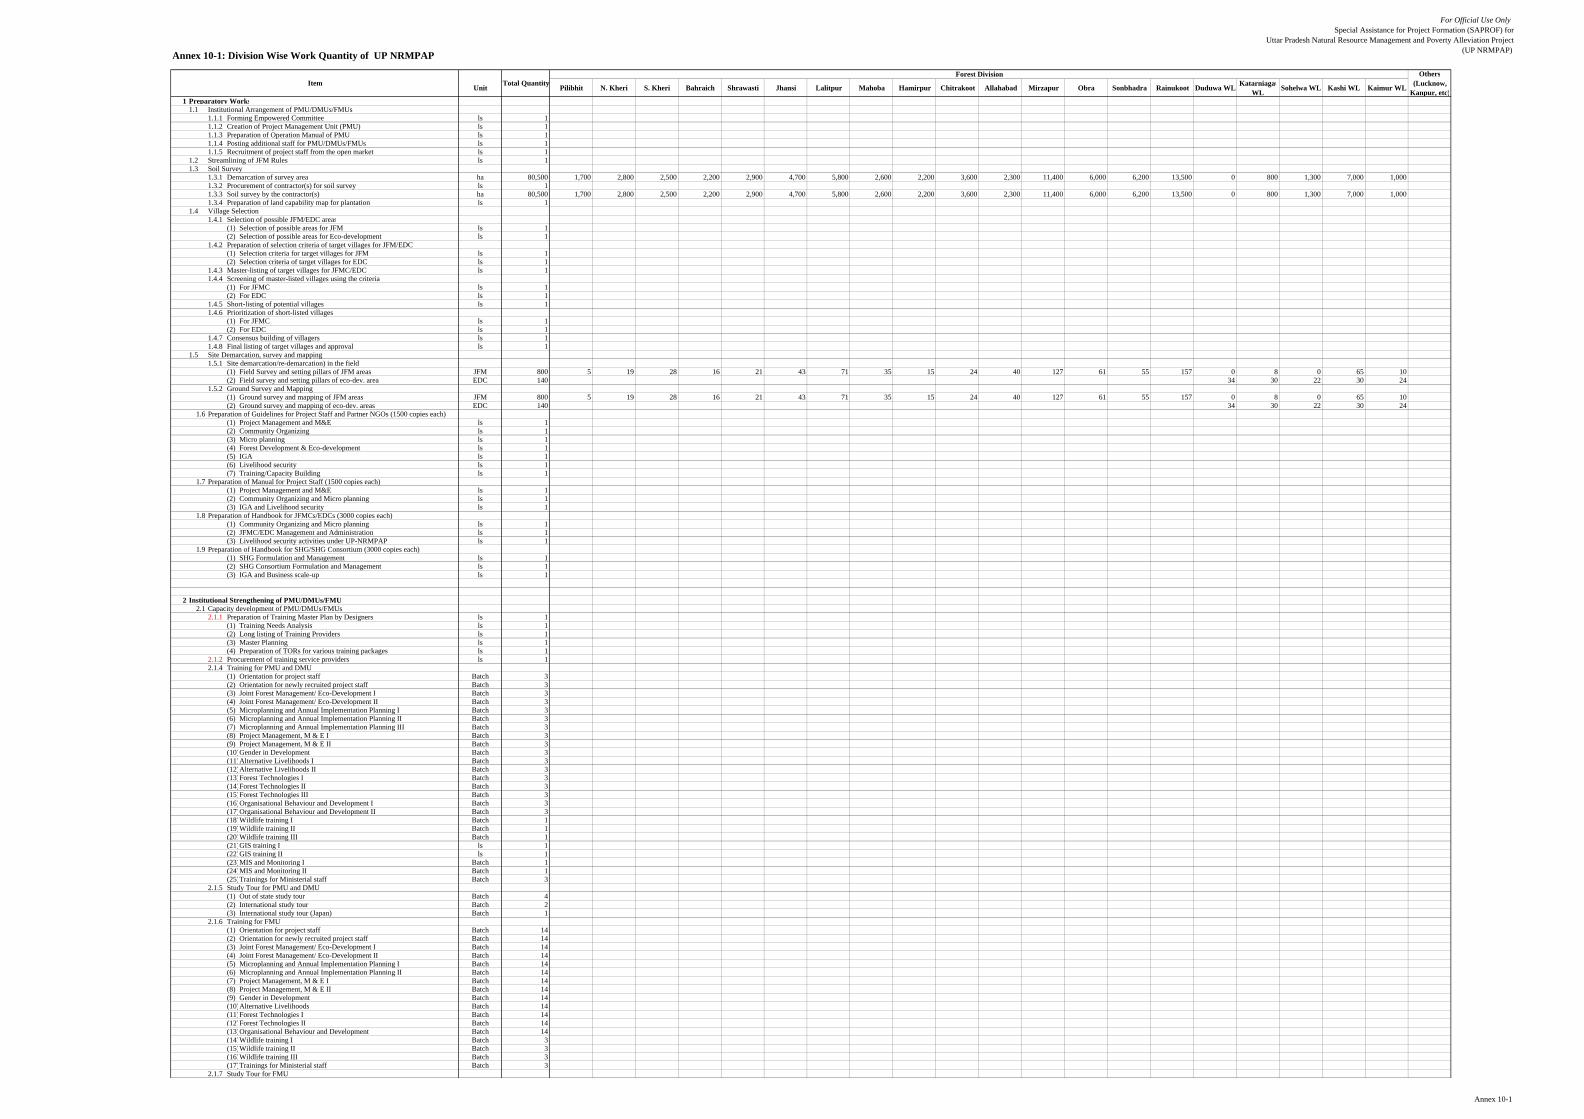
For Official Use OnlySpecial Assistance for Project Formation (SAPROF) for
Uttar Pradesh Natural Resource Management and Poverty Alleviation Project(UP NRMPAP)Annex 10-1: Division Wise Work Quantity of UP NRMPAP
Unit Pilibhit N. Kheri S. Kheri Bahraich Shrawasti Jhansi Lalitpur Mahoba Hamirpur Chitrakoot Allahabad Mirzapur Obra Sonbhadra Rainukoot Duduwa WL KatarniagatWL Sohelwa WL Kashi WL Kaimur WL
1 Preparatory Works1.1 Institutional Arrangement of PMU/DMUs/FMUs
1.1.1 Forming Empowered Committee ls 11.1.2 Creation of Project Management Unit (PMU) ls 11.1.3 Preparation of Operation Manual of PMU ls 11.1.4 Posting additional staff for PMU/DMUs/FMUs ls 11.1.5 Recruitment of project staff from the open market ls 1
1.2 Streamlining of JFM Rules ls 11.3 Soil Survey
1.3.1 Demarcation of survey area ha 80,500 1,700 2,800 2,500 2,200 2,900 4,700 5,800 2,600 2,200 3,600 2,300 11,400 6,000 6,200 13,500 0 800 1,300 7,000 1,0001.3.2 Procurement of contractor(s) for soil survey ls 11.3.3 Soil survey by the contractor(s) ha 80,500 1,700 2,800 2,500 2,200 2,900 4,700 5,800 2,600 2,200 3,600 2,300 11,400 6,000 6,200 13,500 0 800 1,300 7,000 1,0001.3.4 Preparation of land capability map for plantation ls 1
1.4 Village Selection1.4.1 Selection of possible JFM/EDC areas
(1) Selection of possible areas for JFM ls 1(2) Selection of possible areas for Eco-development ls 1
1.4.2 Preparation of selection criteria of target villages for JFM/EDC (1) Selection criteria for target villages for JFM ls 1(2) Selection criteria of target villages for EDC ls 1
1.4.3 Master-listing of target villages for JFMC/EDC ls 11.4.4 Screening of master-listed villages using the criteria
(1) For JFMC ls 1(2) For EDC ls 1
1.4.5 Short-listing of potential villages ls 11.4.6 Prioritization of short-listed villages
(1) For JFMC ls 1(2) For EDC ls 1
1.4.7 Consensus building of villagers ls 11.4.8 Final listing of target villages and approval ls 1
1.5 Site Demarcation, survey and mapping 1.5.1 Site demarcation/re-demarcation) in the field
(1) Field Survey and setting pillars of JFM areas JFM 800 5 19 28 16 21 43 71 35 15 24 40 127 61 55 157 0 8 0 65 10(2) Field survey and setting pillars of eco-dev. area EDC 140 34 30 22 30 24
1.5.2 Ground Survey and Mapping(1) Ground survey and mapping of JFM areas JFM 800 5 19 28 16 21 43 71 35 15 24 40 127 61 55 157 0 8 0 65 10(2) Ground survey and mapping of eco-dev. areas EDC 140 34 30 22 30 24
1.6 Preparation of Guidelines for Project Staff and Partner NGOs (1500 copies each)(1) Project Management and M&E ls 1(2) Community Organizing ls 1(3) Micro planning ls 1(4) Forest Development & Eco-development ls 1(5) IGA ls 1(6) Livelihood security ls 1(7) Training/Capacity Building ls 1
1.7 Preparation of Manual for Project Staff (1500 copies each)(1) Project Management and M&E ls 1(2) Community Organizing and Micro planning ls 1(3) IGA and Livelihood security ls 1
1.8 Preparation of Handbook for JFMCs/EDCs (3000 copies each)(1) Community Organizing and Micro planning ls 1(2) JFMC/EDC Management and Administration ls 1(3) Livelihood security activities under UP-NRMPAP ls 1
1.9 Preparation of Handbook for SHG/SHG Consortium (3000 copies each)(1) SHG Formulation and Management ls 1(2) SHG Consortium Formulation and Management ls 1(3) IGA and Business scale-up ls 1
2 Institutional Strengthening of PMU/DMUs/FMU2.1 Capacity development of PMU/DMUs/FMUs
2.1.1 Preparation of Training Master Plan by Designers ls 1(1) Training Needs Analysis ls 1(2) Long listing of Training Providers ls 1(3) Master Planning ls 1(4) Preparation of TORs for various training packages ls 1
2.1.2 Procurement of training service providers ls 12.1.4 Training for PMU and DMU
(1) Orientation for project staff Batch 3(2) Orientation for newly recruited project staff Batch 3(3) Joint Forest Management/ Eco-Development I Batch 3(4) Joint Forest Management/ Eco-Development II Batch 3(5) Microplanning and Annual Implementation Planning I Batch 3(6) Microplanning and Annual Implementation Planning II Batch 3(7) Microplanning and Annual Implementation Planning III Batch 3(8) Project Management, M & E I Batch 3(9) Project Management, M & E II Batch 3(10)Gender in Development Batch 3(11)Alternative Livelihoods I Batch 3(12)Alternative Livelihoods II Batch 3(13)Forest Technologies I Batch 3(14)Forest Technologies II Batch 3(15)Forest Technologies III Batch 3(16)Organisational Behaviour and Development I Batch 3(17)Organisational Behaviour and Development II Batch 3(18)Wildlife training I Batch 1(19)Wildlife training II Batch 1(20)Wildlife training III Batch 1(21)GIS training I ls 1(22)GIS training II ls 1(23)MIS and Monitoring I Batch 1(24)MIS and Monitoring II Batch 1(25)Trainings for Ministerial staff Batch 3
2.1.5 Study Tour for PMU and DMU(1) Out of state study tour Batch 4(2) International study tour Batch 2(3) International study tour (Japan) Batch 1
2.1.6 Training for FMU(1) Orientation for project staff Batch 14(2) Orientation for newly recruited project staff Batch 14(3) Joint Forest Management/ Eco-Development I Batch 14(4) Joint Forest Management/ Eco-Development II Batch 14(5) Microplanning and Annual Implementation Planning I Batch 14(6) Microplanning and Annual Implementation Planning II Batch 14(7) Project Management, M & E I Batch 14(8) Project Management, M & E II Batch 14(9) Gender in Development Batch 14(10)Alternative Livelihoods Batch 14(11)Forest Technologies I Batch 14(12)Forest Technologies II Batch 14(13)Organisational Behaviour and Development Batch 14(14)Wildlife training I Batch 3(15)Wildlife training II Batch 3(16)Wildlife training III Batch 3(17)Trainings for Ministerial staff Batch 3
2.1.7 Study Tour for FMU
Item Total QuantityOthers
(Lucknow,Kanpur, etc)
Forest Division
Annex 10-1
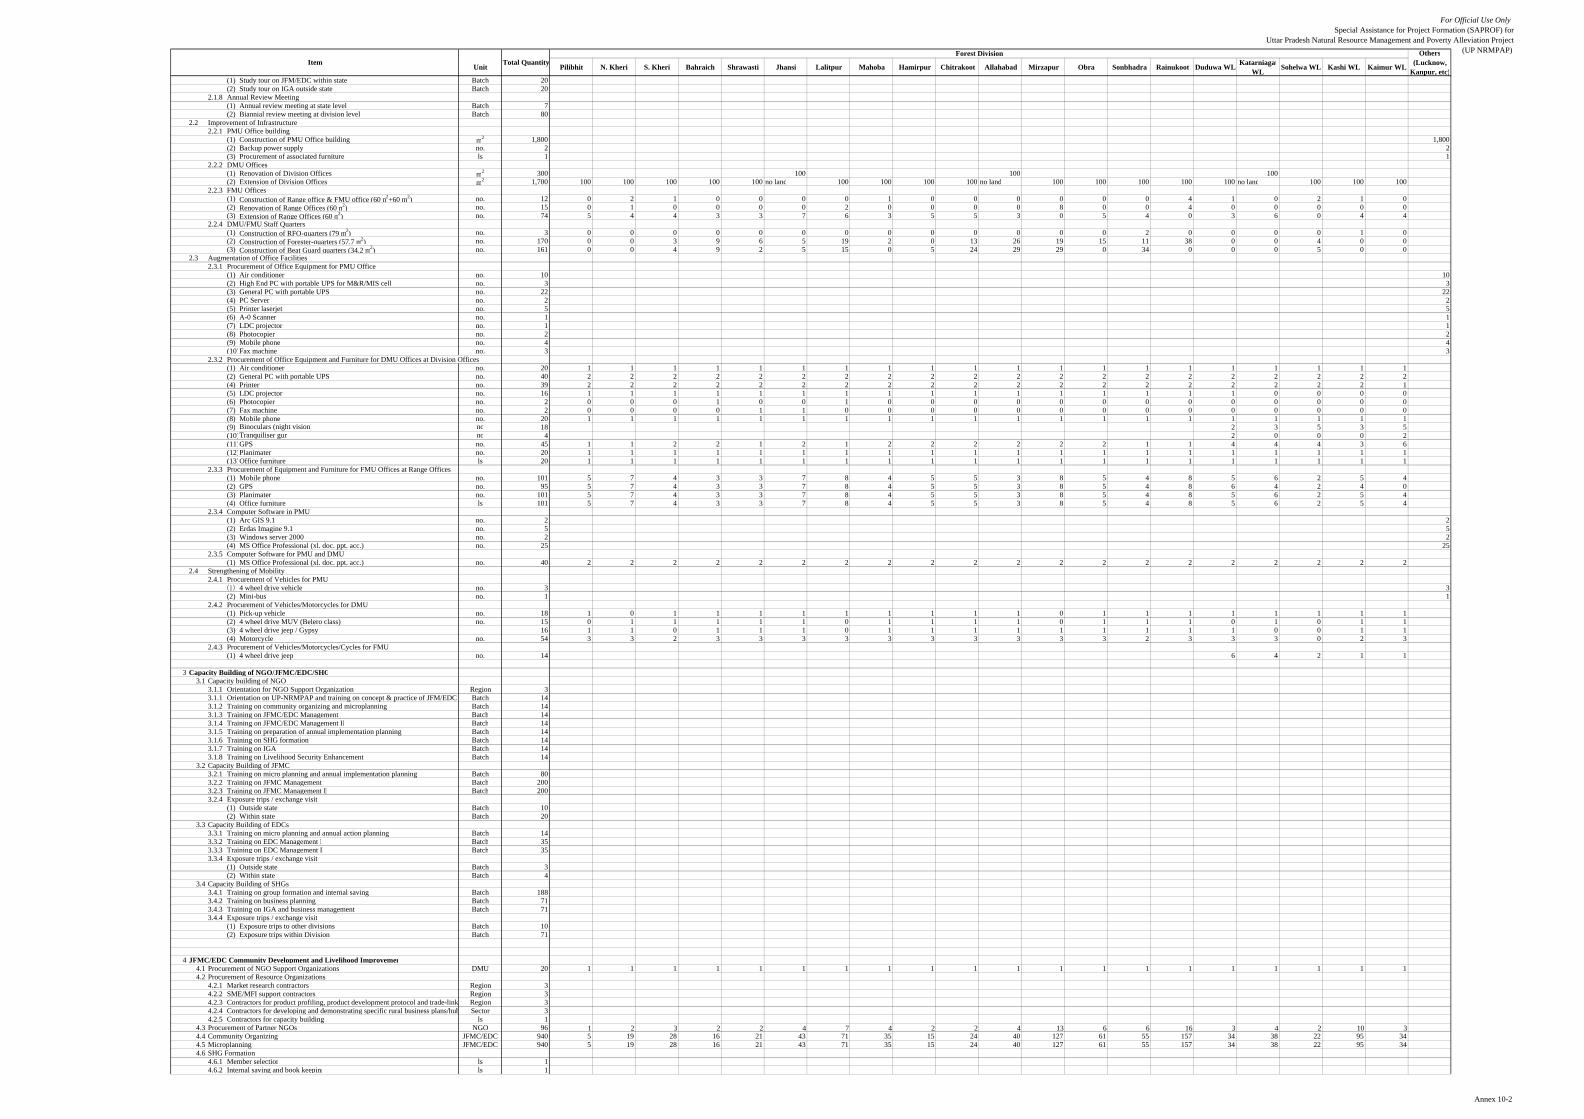
For Official Use OnlySpecial Assistance for Project Formation (SAPROF) for
Uttar Pradesh Natural Resource Management and Poverty Alleviation Project(UP NRMPAP)
Unit Pilibhit N. Kheri S. Kheri Bahraich Shrawasti Jhansi Lalitpur Mahoba Hamirpur Chitrakoot Allahabad Mirzapur Obra Sonbhadra Rainukoot Duduwa WL KatarniagatWL Sohelwa WL Kashi WL Kaimur WLItem Total Quantity
Others(Lucknow,
Kanpur, etc)
Forest Division
(1) Study tour on JFM/EDC within state Batch 20(2) Study tour on IGA outside state Batch 20
2.1.8 Annual Review Meeting(1) Annual review meeting at state level Batch 7(2) Biannial review meeting at division level Batch 80
2.2 Improvement of Infrastructure2.2.1 PMU Office building
(1) Construction of PMU Office building m2 1,800 1,800(2) Backup power supply no. 2 2(3) Procurement of associated furniture ls 1 1
2.2.2 DMU Offices(1) Renovation of Division Offices m2 300 100 100 100(2) Extension of Division Offices m2 1,700 100 100 100 100 100 no land 100 100 100 100 no land 100 100 100 100 100 no land 100 100 100
2.2.3 FMU Offices(1) Construction of Range office & FMU office (60 m2+60 m2) no. 12 0 2 1 0 0 0 0 1 0 0 0 0 0 0 4 1 0 2 1 0(2) Renovation of Range Offices (60 m2) no. 15 0 1 0 0 0 0 2 0 0 0 0 8 0 0 4 0 0 0 0 0(3) Extension of Range Offices (60 m2) no. 74 5 4 4 3 3 7 6 3 5 5 3 0 5 4 0 3 6 0 4 4
2.2.4 DMU/FMU Staff Quarters(1) Construction of RFO-quarters (79 m2) no. 3 0 0 0 0 0 0 0 0 0 0 0 0 0 2 0 0 0 0 1 0(2) Construction of Forester-quarters (57.7 m2) no. 170 0 0 3 9 6 5 19 2 0 13 26 19 15 11 38 0 0 4 0 0(3) Construction of Beat Guard quarters (34.2 m2) no. 161 0 0 4 9 2 5 15 0 5 24 29 29 0 34 0 0 0 5 0 0
2.3 Augmentation of Office Facilities2.3.1 Procurement of Office Equipment for PMU Office
(1) Air conditioner no. 10 10(2) High End PC with portable UPS for M&R/MIS cell no. 3 3(3) General PC with portable UPS no. 22 22(4) PC Server no. 2 2(5) Printer laserjet no. 5 5(6) A-0 Scanner no. 1 1(7) LDC projector no. 1 1(8) Photocopier no. 2 2(9) Mobile phone no. 4 4(10)Fax machine no. 3 3
2.3.2 Procurement of Office Equipment and Furniture for DMU Offices at Division Offices(1) Air conditioner no. 20 1 1 1 1 1 1 1 1 1 1 1 1 1 1 1 1 1 1 1 1(2) General PC with portable UPS no. 40 2 2 2 2 2 2 2 2 2 2 2 2 2 2 2 2 2 2 2 2(4) Printer no. 39 2 2 2 2 2 2 2 2 2 2 2 2 2 2 2 2 2 2 2 1(5) LDC projector no. 16 1 1 1 1 1 1 1 1 1 1 1 1 1 1 1 1 0 0 0 0(6) Photocopier no. 2 0 0 0 1 0 0 1 0 0 0 0 0 0 0 0 0 0 0 0 0(7) Fax machine no. 2 0 0 0 0 1 1 0 0 0 0 0 0 0 0 0 0 0 0 0 0(8) Mobile phone no. 20 1 1 1 1 1 1 1 1 1 1 1 1 1 1 1 1 1 1 1 1(9) Binoculars (night vision) no 18 2 3 5 3 5(10)Tranquiliser gun no 4 2 0 0 0 2(11)GPS no. 45 1 1 2 2 1 2 1 2 2 2 2 2 2 1 1 4 4 4 3 6(12)Planimater no. 20 1 1 1 1 1 1 1 1 1 1 1 1 1 1 1 1 1 1 1 1(13)Office furniture ls 20 1 1 1 1 1 1 1 1 1 1 1 1 1 1 1 1 1 1 1 1
2.3.3 Procurement of Equipment and Furniture for FMU Offices at Range Offices(1) Mobile phone no. 101 5 7 4 3 3 7 8 4 5 5 3 8 5 4 8 5 6 2 5 4(2) GPS no. 95 5 7 4 3 3 7 8 4 5 5 3 8 5 4 8 6 4 2 4 0(3) Planimater no. 101 5 7 4 3 3 7 8 4 5 5 3 8 5 4 8 5 6 2 5 4(4) Office furniture ls 101 5 7 4 3 3 7 8 4 5 5 3 8 5 4 8 5 6 2 5 4
2.3.4 Computer Software in PMU(1) Arc GIS 9.1 no. 2 2(2) Erdas Imagine 9.1 no. 5 5(3) Windows server 2000 no. 2 2(4) MS Office Professional (xl. doc. ppt. acc.) no. 25 25
2.3.5 Computer Software for PMU and DMU(1) MS Office Professional (xl. doc. ppt. acc.) no. 40 2 2 2 2 2 2 2 2 2 2 2 2 2 2 2 2 2 2 2 2
2.4 Strengthening of Mobility2.4.1 Procurement of Vehicles for PMU
(1) 4 wheel drive vehicle no. 3 3(2) Mini-bus no. 1 1
2.4.2 Procurement of Vehicles/Motorcycles for DMU (1) Pick-up vehicle no. 18 1 0 1 1 1 1 1 1 1 1 1 0 1 1 1 1 1 1 1 1(2) 4 wheel drive MUV (Belero class) no. 15 0 1 1 1 1 1 0 1 1 1 1 0 1 1 1 0 1 0 1 1(3) 4 wheel drive jeep / Gypsy 16 1 1 0 1 1 1 0 1 1 1 1 1 1 1 1 1 0 0 1 1(4) Motorcycle no. 54 3 3 2 3 3 3 3 3 3 3 3 3 3 2 3 3 3 0 2 3
2.4.3 Procurement of Vehicles/Motorcycles/Cycles for FMU(1) 4 wheel drive jeep no. 14 6 4 2 1 1
3 Capacity Building of NGO/JFMC/EDC/SHG3.1 Capacity building of NGO
3.1.1 Orientation for NGO Support Organization Region 33.1.1 Orientation on UP-NRMPAP and training on concept & practice of JFM/EDC Batch 143.1.2 Training on community organizing and microplanning Batch 143.1.3 Training on JFMC/EDC Management I Batch 143.1.4 Training on JFMC/EDC Management II Batch 143.1.5 Training on preparation of annual implementation planning Batch 143.1.6 Training on SHG formation Batch 143.1.7 Training on IGA Batch 143.1.8 Training on Livelihood Security Enhancement Batch 14
3.2 Capacity Building of JFMC3.2.1 Training on micro planning and annual implementation planning Batch 803.2.2 Training on JFMC Management I Batch 2003.2.3 Training on JFMC Management II Batch 2003.2.4 Exposure trips / exchange visit
(1) Outside state Batch 10(2) Within state Batch 20
3.3 Capacity Building of EDCs3.3.1 Training on micro planning and annual action planning Batch 143.3.2 Training on EDC Management I Batch 353.3.3 Training on EDC Management II Batch 353.3.4 Exposure trips / exchange visit
(1) Outside state Batch 3(2) Within state Batch 4
3.4 Capacity Building of SHGs3.4.1 Training on group formation and internal saving Batch 1883.4.2 Training on business planning Batch 713.4.3 Training on IGA and business management Batch 713.4.4 Exposure trips / exchange visit
(1) Exposure trips to other divisions Batch 10(2) Exposure trips within Division Batch 71
4 JFMC/EDC Community Development and Livelihood Improvemen4.1 Procurement of NGO Support Organizations DMU 20 1 1 1 1 1 1 1 1 1 1 1 1 1 1 1 1 1 1 1 14.2 Procurement of Resource Organizations
4.2.1 Market research contractors Region 34.2.2 SME/MFI support contractors Region 34.2.3 Contractors for product profiling, product development protocol and trade-link Region 34.2.4 Contractors for developing and demonstrating specific rural business plans/hub Sector 34.2.5 Contractors for capacity building ls 1
4.3 Procurement of Partner NGOs NGO 96 1 2 3 2 2 4 7 4 2 2 4 13 6 6 16 3 4 2 10 34.4 Community Organizing JFMC/EDC 940 5 19 28 16 21 43 71 35 15 24 40 127 61 55 157 34 38 22 95 344.5 Microplanning JFMC/EDC 940 5 19 28 16 21 43 71 35 15 24 40 127 61 55 157 34 38 22 95 344.6 SHG Formation
4.6.1 Member selection ls 14.6.2 Internal saving and book keeping ls 1
Annex 10-2
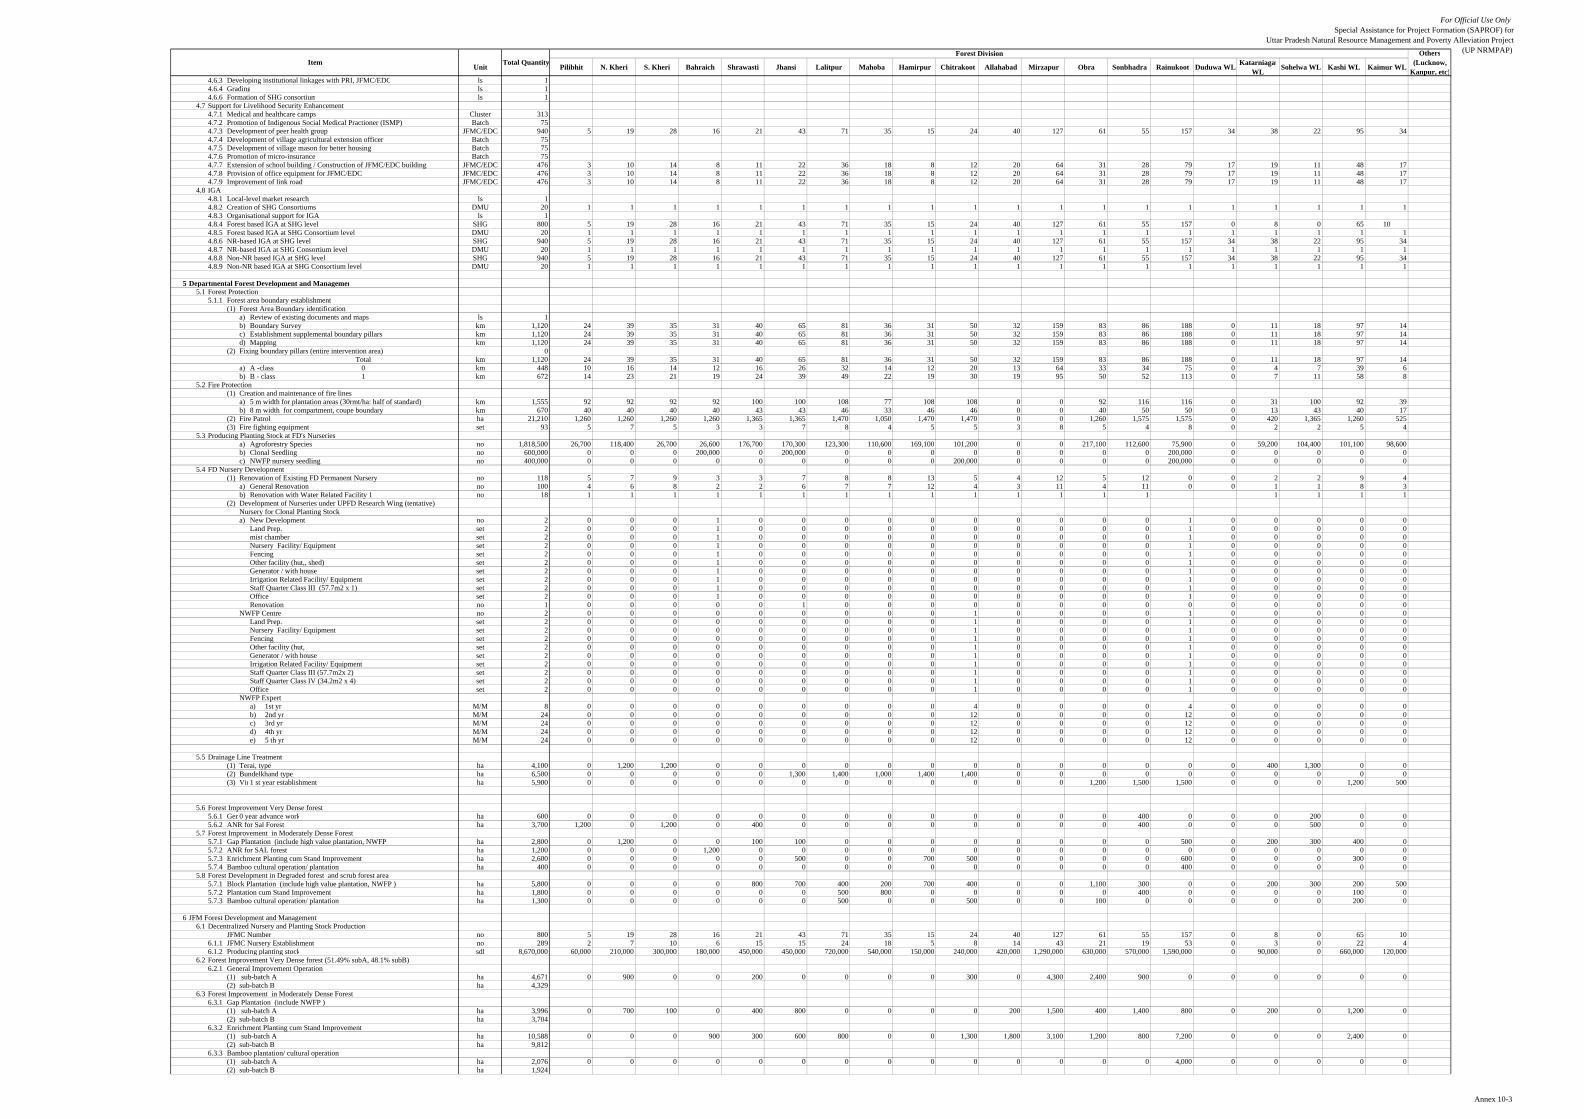
For Official Use OnlySpecial Assistance for Project Formation (SAPROF) for
Uttar Pradesh Natural Resource Management and Poverty Alleviation Project(UP NRMPAP)
Unit Pilibhit N. Kheri S. Kheri Bahraich Shrawasti Jhansi Lalitpur Mahoba Hamirpur Chitrakoot Allahabad Mirzapur Obra Sonbhadra Rainukoot Duduwa WL KatarniagatWL Sohelwa WL Kashi WL Kaimur WLItem Total Quantity
Others(Lucknow,
Kanpur, etc)
Forest Division
4.6.3 Developing institutional linkages with PRI, JFMC/EDC ls 14.6.4 Grading ls 14.6.6 Formation of SHG consortium ls 1
4.7 Support for Livelihood Security Enhancement4.7.1 Medical and healthcare camps Cluster 3134.7.2 Promotion of Indigenous Social Medical Practioner (ISMP) Batch 754.7.3 Development of peer health group JFMC/EDC 940 5 19 28 16 21 43 71 35 15 24 40 127 61 55 157 34 38 22 95 344.7.4 Development of village agricultural extension officer Batch 754.7.5 Development of village mason for better housing Batch 754.7.6 Promotion of micro-insurance Batch 754.7.7 Extension of school building / Construction of JFMC/EDC building JFMC/EDC 476 3 10 14 8 11 22 36 18 8 12 20 64 31 28 79 17 19 11 48 174.7.8 Provision of office equipment for JFMC/EDC JFMC/EDC 476 3 10 14 8 11 22 36 18 8 12 20 64 31 28 79 17 19 11 48 174.7.9 Improvement of link road JFMC/EDC 476 3 10 14 8 11 22 36 18 8 12 20 64 31 28 79 17 19 11 48 17
4.8 IGA4.8.1 Local-level market research ls 14.8.2 Creation of SHG Consortiums DMU 20 1 1 1 1 1 1 1 1 1 1 1 1 1 1 1 1 1 1 1 14.8.3 Organisational support for IGA ls 14.8.4 Forest based IGA at SHG level SHG 800 5 19 28 16 21 43 71 35 15 24 40 127 61 55 157 0 8 0 65 104.8.5 Forest based IGA at SHG Consortium level DMU 20 1 1 1 1 1 1 1 1 1 1 1 1 1 1 1 1 1 1 1 14.8.6 NR-based IGA at SHG level SHG 940 5 19 28 16 21 43 71 35 15 24 40 127 61 55 157 34 38 22 95 344.8.7 NR-based IGA at SHG Consortium level DMU 20 1 1 1 1 1 1 1 1 1 1 1 1 1 1 1 1 1 1 1 14.8.8 Non-NR based IGA at SHG level SHG 940 5 19 28 16 21 43 71 35 15 24 40 127 61 55 157 34 38 22 95 344.8.9 Non-NR based IGA at SHG Consortium level DMU 20 1 1 1 1 1 1 1 1 1 1 1 1 1 1 1 1 1 1 1 1
5 Departmental Forest Development and Managemen5.1 Forest Protection
5.1.1 Forest area boundary establishment(1) Forest Area Boundary identification
a) Review of existing documents and maps ls 1b) Boundary Survey km 1,120 24 39 35 31 40 65 81 36 31 50 32 159 83 86 188 0 11 18 97 14c) Establishment supplemental boundary pillars km 1,120 24 39 35 31 40 65 81 36 31 50 32 159 83 86 188 0 11 18 97 14d) Mapping km 1,120 24 39 35 31 40 65 81 36 31 50 32 159 83 86 188 0 11 18 97 14
(2) Fixing boundary pillars (entire intervention area) 0Total km 1,120 24 39 35 31 40 65 81 36 31 50 32 159 83 86 188 0 11 18 97 14
a) A -class 0 km 448 10 16 14 12 16 26 32 14 12 20 13 64 33 34 75 0 4 7 39 6b) B - class 1 km 672 14 23 21 19 24 39 49 22 19 30 19 95 50 52 113 0 7 11 58 8
5.2 Fire Protection(1) Creation and maintenance of fire lines
a) 5 m width for plantation areas (30rmt/ha: half of standard) km 1,555 92 92 92 92 100 100 108 77 108 108 0 0 92 116 116 0 31 100 92 39b) 8 m width for compartment, coupe boundary km 670 40 40 40 40 43 43 46 33 46 46 0 0 40 50 50 0 13 43 40 17
(2) Fire Patrol ha 21,210 1,260 1,260 1,260 1,260 1,365 1,365 1,470 1,050 1,470 1,470 0 0 1,260 1,575 1,575 0 420 1,365 1,260 525(3) Fire fighting equipment set 93 5 7 5 3 3 7 8 4 5 5 3 8 5 4 8 0 2 2 5 4
5.3 Producing Planting Stock at FD's Nurseriesa) Agroforestry Species no 1,818,500 26,700 118,400 26,700 26,600 176,700 170,300 123,300 110,600 169,100 101,200 0 0 217,100 112,600 75,900 0 59,200 104,400 101,100 98,600b) Clonal Seedling no 600,000 0 0 0 200,000 0 200,000 0 0 0 0 0 0 0 0 200,000 0 0 0 0 0c) NWFP nursery seedling no 400,000 0 0 0 0 0 0 0 0 0 200,000 0 0 0 0 200,000 0 0 0 0 0
5.4 FD Nursery Development(1) Renovation of Existing FD Permanent Nursery no 118 5 7 9 3 3 7 8 8 13 5 4 12 5 12 0 0 2 2 9 4
a) General Renovation no 100 4 6 8 2 2 6 7 7 12 4 3 11 4 11 0 0 1 1 8 3b) Renovation with Water Related Facility 1 no 18 1 1 1 1 1 1 1 1 1 1 1 1 1 1 1 1 1 1
(2) Development of Nurseries under UPFD Research Wing (tentative)Nursery for Clonal Planting Stocka) New Development no 2 0 0 0 1 0 0 0 0 0 0 0 0 0 0 1 0 0 0 0 0
Land Prep. set 2 0 0 0 1 0 0 0 0 0 0 0 0 0 0 1 0 0 0 0 0mist chamber set 2 0 0 0 1 0 0 0 0 0 0 0 0 0 0 1 0 0 0 0 0Nursery Facility/ Equipment set 2 0 0 0 1 0 0 0 0 0 0 0 0 0 0 1 0 0 0 0 0Fencing set 2 0 0 0 1 0 0 0 0 0 0 0 0 0 0 1 0 0 0 0 0Other facility (hut,, shed) set 2 0 0 0 1 0 0 0 0 0 0 0 0 0 0 1 0 0 0 0 0Generator / with house set 2 0 0 0 1 0 0 0 0 0 0 0 0 0 0 1 0 0 0 0 0Irrigation Related Facility/ Equipment set 2 0 0 0 1 0 0 0 0 0 0 0 0 0 0 1 0 0 0 0 0Staff Quarter Class III (57.7m2 x 1) set 2 0 0 0 1 0 0 0 0 0 0 0 0 0 0 1 0 0 0 0 0Office set 2 0 0 0 1 0 0 0 0 0 0 0 0 0 0 1 0 0 0 0 0Renovation no 1 0 0 0 0 0 1 0 0 0 0 0 0 0 0 0 0 0 0 0 0
NWFP Centre no 2 0 0 0 0 0 0 0 0 0 1 0 0 0 0 1 0 0 0 0 0Land Prep. set 2 0 0 0 0 0 0 0 0 0 1 0 0 0 0 1 0 0 0 0 0Nursery Facility/ Equipment set 2 0 0 0 0 0 0 0 0 0 1 0 0 0 0 1 0 0 0 0 0Fencing set 2 0 0 0 0 0 0 0 0 0 1 0 0 0 0 1 0 0 0 0 0Other facility (hut, set 2 0 0 0 0 0 0 0 0 0 1 0 0 0 0 1 0 0 0 0 0Generator / with house set 2 0 0 0 0 0 0 0 0 0 1 0 0 0 0 1 0 0 0 0 0Irrigation Related Facility/ Equipment set 2 0 0 0 0 0 0 0 0 0 1 0 0 0 0 1 0 0 0 0 0Staff Quarter Class III (57.7m2x 2) set 2 0 0 0 0 0 0 0 0 0 1 0 0 0 0 1 0 0 0 0 0Staff Quarter Class IV (34.2m2 x 4) set 2 0 0 0 0 0 0 0 0 0 1 0 0 0 0 1 0 0 0 0 0Office set 2 0 0 0 0 0 0 0 0 0 1 0 0 0 0 1 0 0 0 0 0
NWFP Experta) 1st yr M/M 8 0 0 0 0 0 0 0 0 0 4 0 0 0 0 4 0 0 0 0 0b) 2nd yr M/M 24 0 0 0 0 0 0 0 0 0 12 0 0 0 0 12 0 0 0 0 0c) 3rd yr M/M 24 0 0 0 0 0 0 0 0 0 12 0 0 0 0 12 0 0 0 0 0d) 4th yr M/M 24 0 0 0 0 0 0 0 0 0 12 0 0 0 0 12 0 0 0 0 0e) 5 th yr M/M 24 0 0 0 0 0 0 0 0 0 12 0 0 0 0 12 0 0 0 0 0
5.5 Drainage Line Treatment (1) Terai, type ha 4,100 0 1,200 1,200 0 0 0 0 0 0 0 0 0 0 0 0 0 400 1,300 0 0(2) Bundelkhand type ha 6,500 0 0 0 0 0 1,300 1,400 1,000 1,400 1,400 0 0 0 0 0 0 0 0 0 0(3) Vin1 st year establishment ha 5,900 0 0 0 0 0 0 0 0 0 0 0 0 1,200 1,500 1,500 0 0 0 1,200 500
5.6 Forest Improvement Very Dense forest5.6.1 Gen0 year advance work ha 600 0 0 0 0 0 0 0 0 0 0 0 0 0 400 0 0 0 200 0 05.6.2 ANR for Sal Forest ha 3,700 1,200 0 1,200 0 400 0 0 0 0 0 0 0 0 400 0 0 0 500 0 0
5.7 Forest Improvement in Moderately Dense Forest 5.7.1 Gap Plantation (include high value plantation, NWFP ) ha 2,800 0 1,200 0 0 100 100 0 0 0 0 0 0 0 0 500 0 200 300 400 05.7.2 ANR for SAL forest ha 1,200 0 0 0 1,200 0 0 0 0 0 0 0 0 0 0 0 0 0 0 0 05.7.3 Enrichment Planting cum Stand Improvement ha 2,600 0 0 0 0 0 500 0 0 700 500 0 0 0 0 600 0 0 0 300 05.7.4 Bamboo cultural operation/ plantation ha 400 0 0 0 0 0 0 0 0 0 0 0 0 0 0 400 0 0 0 0 0
5.8 Forest Development in Degraded forest and scrub forest area5.7.1 Block Plantation (include high value plantation, NWFP ) ha 5,800 0 0 0 0 800 700 400 200 700 400 0 0 1,100 300 0 0 200 300 200 5005.7.2 Plantation cum Stand Improvement ha 1,800 0 0 0 0 0 0 500 800 0 0 0 0 0 400 0 0 0 0 100 05.7.3 Bamboo cultural operation/ plantation ha 1,300 0 0 0 0 0 0 500 0 0 500 0 0 100 0 0 0 0 0 200 0
6 JFM Forest Development and Management 6.1 Decentralized Nursery and Planting Stock Production
JFMC Number no 800 5 19 28 16 21 43 71 35 15 24 40 127 61 55 157 0 8 0 65 106.1.1 JFMC Nursery Establishment no 289 2 7 10 6 15 15 24 18 5 8 14 43 21 19 53 0 3 0 22 46.1.2 Producing planting stock sdl 8,670,000 60,000 210,000 300,000 180,000 450,000 450,000 720,000 540,000 150,000 240,000 420,000 1,290,000 630,000 570,000 1,590,000 0 90,000 0 660,000 120,000
6.2 Forest Improvement Very Dense forest (51.49% subA, 48.1% subB)6.2.1 General Improvement Operation
(1) sub-batch A ha 4,671 0 900 0 0 200 0 0 0 0 300 0 4,300 2,400 900 0 0 0 0 0 0(2) sub-batch B ha 4,329
6.3 Forest Improvement in Moderately Dense Forest 6.3.1 Gap Plantation (include NWFP )
(1) sub-batch A ha 3,996 0 700 100 0 400 800 0 0 0 0 200 1,500 400 1,400 800 0 200 0 1,200 0(2) sub-batch B ha 3,704
6.3.2 Enrichment Planting cum Stand Improvement (1) sub-batch A ha 10,588 0 0 0 900 300 600 800 0 0 1,300 1,800 3,100 1,200 800 7,200 0 0 0 2,400 0(2) sub-batch B ha 9,812
6.3.3 Bamboo plantation/ cultural operation(1) sub-batch A ha 2,076 0 0 0 0 0 0 0 0 0 0 0 0 0 0 4,000 0 0 0 0 0(2) sub-batch B ha 1,924
Annex 10-3

For Official Use OnlySpecial Assistance for Project Formation (SAPROF) for
Uttar Pradesh Natural Resource Management and Poverty Alleviation Project(UP NRMPAP)
Unit Pilibhit N. Kheri S. Kheri Bahraich Shrawasti Jhansi Lalitpur Mahoba Hamirpur Chitrakoot Allahabad Mirzapur Obra Sonbhadra Rainukoot Duduwa WL KatarniagatWL Sohelwa WL Kashi WL Kaimur WLItem Total Quantity
Others(Lucknow,
Kanpur, etc)
Forest Division
6.4 Forest Development in Degraded forest and scrub forest area6.4.1 Block Plantation (include NWFP )
(1) sub-batch A ha 5,398 500 0 1,200 100 700 1,600 1,600 0 500 0 300 1,300 500 400 0 0 200 0 1,000 500(2) sub-batch B ha 5,002
6.4.2 Plantation cum Stand Improvement(1) sub-batch A ha 2,284 0 0 0 0 0 400 600 1,600 300 200 0 0 0 800 0 0 0 0 500 0(2) sub-batch B ha 2,116
6.4.3 Bamboo plantation/ cultural operation(1) sub-batch A ha 2,284 0 0 0 0 0 0 1,400 0 0 400 0 1,200 300 400 0 0 0 0 700 0(2) sub-batch B ha 2,116
6.5 Drainage Line Treatment (1) Terai, type ha 1,650 0 800 650 0 0 0 0 0 0 0 0 0 0 0 0 0 200 0 0 0(2) Bundelkhand type ha 6,200 0 0 0 0 0 1,700 2,200 800 400 1,100 0 0 0 0 0 0 0 0 0 0(3) Vindhyan type ha 20,750 0 0 0 0 0 0 0 0 0 0 1,150 5,700 2,400 2,350 6,000 0 0 0 2,900 250
6.6 Fire Protection6.6.1 Fire Patrol ha 63,315 525 1,680 1,365 1,050 1,680 3,570 4,620 1,680 840 2,310 2,415 11,970 5,040 4,935 12,600 0 420 0 6,090 5256.6.2 Creation and maintenance of fire lines
a) 5 m width for plantation areas (30rmt/ha: half of standard) km 4,645 39 123 100 77 123 262 339 123 62 169 177 878 370 362 924 0 31 0 447 39b) 8 m width for compartment, coupe boundary km 1,990 17 53 43 33 53 112 145 53 26 73 76 376 158 155 396 0 13 0 191 17
7 Wildlife Conservation and Managemen7.1 Management of protected areas (for 7 PAs for 5 yrs)
7.1.1 Soil and water conservation(1) Check dams (concrete) no 8 0 0 0 0 8(2) Gully plugs (brushwood) no 120 0 60 20 15 25(3) Gully plugs (Gabion) no 12 0 0 0 0 12
7.1.2 Protection(1) Boundary marking using pillars km 325 100 60 60 20 85(2) Check post with guard's room no 20 6 2 5 1 6(3) Watch towers 0
a) RCC structure type no 5 0 0 0 0 5b) Angler type no 6 3 2 1 0 0
7.2 Ecotourism development ( 4 sites, 5 years)7.2.1 Cottages (2rooms with toilet, water, electricity supply, 121 m2). no. 9 2 3 4 0 07.2.2 Interpretation centre and souvenir shop (140 km2) no. 3 0 1 1 1 07.2.3 Camping tents (15x15x8.5ft) no. 16 3 5 4 4 07.2.4 Eatery (140 m2) no. 4 1 1 1 1 07.2.5 Promotional brochures copy 40,000 10,000 10,000 10,000 10,000 07.2.6 Nature trail km 20 4 6 5 5 0
7.3 Biodiversity Hotspots outside PA (2 sites, for 5 years)7.3.1 Preparation of management plan for the reserve site 2 1 17.3.2 ANR (mixed species) ha 125 75 507.3.3 Watch tower (concrete) no 1 1 07.3.4 Water holes no 9 4 57.3.5 Check dam (concrete) no 3 0 37.3.6 JFM program (as given in the section on JFM) JFMC 8 5 3
7.4 EDC fuelwood / fodder community plantation ha 700 0 0 0 0 0 0 0 0 0 0 0 0 0 0 0 170 150 110 150 120
8 Survey and Research8.1 Survey and Research for Forest Development and Management
8.1.1 Seed Tree Improvement and Mass Production(1) Survey and Selection of Plus Trees of Important Forest Trees (Project Target area only)
a) New no 3,600 600 0 0 600 0 600 0 0 0 600 0 0 0 0 600 0 0 0 600 0b) Old Maintenance no 3,660 610 0 0 610 0 610 0 0 0 610 0 0 0 0 610 0 0 0 610 0
(2) Establishment and improvement of seedling seed orchard (project target area only )CSOa) newly established 6 0 0 0 2 0 2 0 0 0 0 0 0 0 0 2 0 0 0 0 0b) Old Maintenance ha 4 0 0 0 1 0 1 0 0 0 0 0 0 0 0 1 0 0 0 0 0SSOa) newly established ha 1 0.0 0.0 0.0 0.5 0.0 0.5 0.0 0.0 0.0 0.0 0.0 0.0 0.0 0.0 0.5 0.0 0.0 0.0 0.0 0.0b) Old Maintenance ha 16 0 0 0 5 0 5 0 0 0 0 0 0 0 0 5 0 0 0 0 0
(3) Establishment of Seed Production Area (project target area only or consider under departm 0a) new ha 6 1 0 0 1 0 1 0 0 0 1 0 0 0 0 1 0 0 0 1 0b) old maintenance ha 30 5 0 0 5 0 5 0 0 0 5 0 0 0 0 5 0 0 0 5 0
8.1.2 Plantation (forest) establishment improvement(1) Work-norm/Schedule of Rate Survey for major forestry operations ls 1(2) Development of treatment/ plantation models for JFMC interventions. ls 1
8.1.3 NTFP Development and Utilization(1) Development of NWFP plantation models (mixed species, including medi ls 1
8.1.4 SMC Work Improvement(1) Work-norm/Schedule of Rate Survey for major SMC works ls 1(2) Quantification of soil water conservation and water harvesting functions ls 1
8.1.5 Sampling survey of standing stock at various forest type/ plantation and ages (i plots 82 2 3 3 2 3 5 6 3 2 4 2 11 6 6 14 0 1 1 7 18.2 Research on Biodiversity Conservation
8.2.1 Area Identification and Feasibility Study of Hotspots(1) Area identification and boundary survey sq km 65 25 40(2) Feasibility Study of the identified site site 2 1 1(3) Boundary marking km 17 7 10
8.2.2 Study of the socio-economic linkages of wildlife conservation ls 18.2.3 Feasibility study of potential ecotourism sites ls 1
8.3 Study and Research for Livelihood Improvement8.3.1 As Required ls 1
8.4 AR-CDM(1) Phase I 0
a) Land Eligibility ls 1(2) Phase II
a) Project Boundary Survey no 32b) Socio-economic Survey no 32c) Natural Environment Survey (including Stratification) no 32d) Baseline Biomass Survey (biomass, litter/ dead trees, soil carbon, analy no 32e) Biomass Survey in Existing Plantation (biomass, litter/ dead trees, soil no 6
(3) Phase II 0a) Project GHG Emission Survey no 16b) Leakage Survey no 16
9 Communication and Publication9.1 Children's Forest cities 6 6
9.1.1 1st year (Noida 40schools, Lucknow, Kanpur, Agra, etc. 10 schools x 4 cities) schools 50 509.1.2 2nd year schools 150 1509.1.3 3 rd year schools 150 1509.1.4 4 th year schools 150 1509.1.5 5 th year schools 150 150
9.2 Website development ls 19.3 Public information drive ls 19.4 Publication
9.4.1 Newsletter Quarter 289.4.2 Review Report Year 89.4.3 Brochure Time 29.4.4 Leaflet Time 2
10 Monitoring and Evaluation10.1 Preparation of Project M&E Manual ls 110.2 Establishment of Project Management Information System ls 110.3 Establishment of Project Database ls 110.4 Progress Monitoring and Analyses ls 110.5 Evaluation of Project Impact ls 1
10.5.1Surveys for Physical Impact of the Project
Annex 10-4
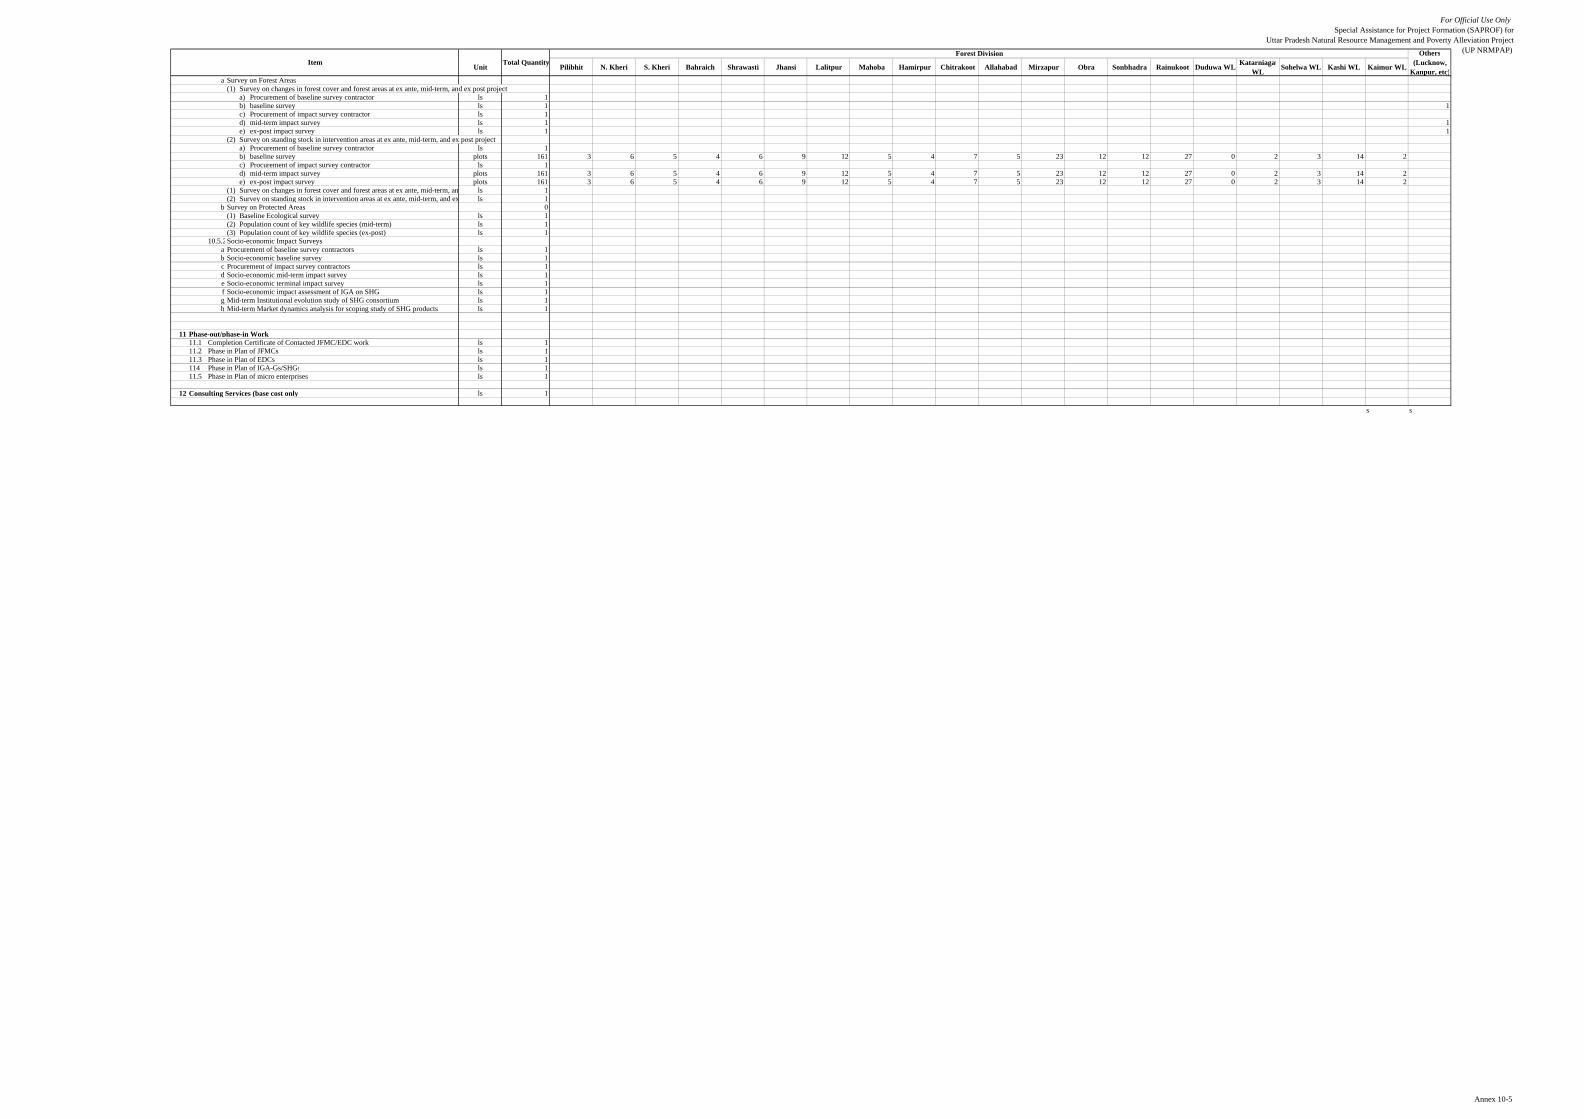
For Official Use OnlySpecial Assistance for Project Formation (SAPROF) for
Uttar Pradesh Natural Resource Management and Poverty Alleviation Project(UP NRMPAP)
Unit Pilibhit N. Kheri S. Kheri Bahraich Shrawasti Jhansi Lalitpur Mahoba Hamirpur Chitrakoot Allahabad Mirzapur Obra Sonbhadra Rainukoot Duduwa WL KatarniagatWL Sohelwa WL Kashi WL Kaimur WLItem Total Quantity
Others(Lucknow,
Kanpur, etc)
Forest Division
a Survey on Forest Areas(1) Survey on changes in forest cover and forest areas at ex ante, mid-term, and ex post project
a) Procurement of baseline survey contractor ls 1b) baseline survey ls 1 1c) Procurement of impact survey contractor ls 1d) mid-term impact survey ls 1 1e) ex-post impact survey ls 1 1
(2) Survey on standing stock in intervention areas at ex ante, mid-term, and ex post projecta) Procurement of baseline survey contractor ls 1b) baseline survey plots 161 3 6 5 4 6 9 12 5 4 7 5 23 12 12 27 0 2 3 14 2c) Procurement of impact survey contractor ls 1d) mid-term impact survey plots 161 3 6 5 4 6 9 12 5 4 7 5 23 12 12 27 0 2 3 14 2e) ex-post impact survey plots 161 3 6 5 4 6 9 12 5 4 7 5 23 12 12 27 0 2 3 14 2
(1) Survey on changes in forest cover and forest areas at ex ante, mid-term, an ls 1(2) Survey on standing stock in intervention areas at ex ante, mid-term, and ex ls 1
b Survey on Protected Areas 0(1) Baseline Ecological survey ls 1(2) Population count of key wildlife species (mid-term) ls 1(3) Population count of key wildlife species (ex-post) ls 1
10.5.2Socio-economic Impact Surveysa Procurement of baseline survey contractors ls 1b Socio-economic baseline survey ls 1c Procurement of impact survey contractors ls 1d Socio-economic mid-term impact survey ls 1e Socio-economic terminal impact survey ls 1f Socio-economic impact assessment of IGA on SHG ls 1g Mid-term Institutional evolution study of SHG consortium ls 1h Mid-term Market dynamics analysis for scoping study of SHG products ls 1
11 Phase-out/phase-in Works11.1 Completion Certificate of Contacted JFMC/EDC work ls 111.2 Phase in Plan of JFMCs ls 111.3 Phase in Plan of EDCs ls 1114 Phase in Plan of IGA-Gs/SHGs ls 111.5 Phase in Plan of micro enterprises ls 1
12 Consulting Services (base cost only) ls 1
s s
Annex 10-5

For Official Use Only Special Assistance for Project Formation (SAPROF) for
Uttar Pradesh Natural Resources Management and Poverty Alleviation Project (UPNRMPAP)
Final Report - Volume II Annex 10-6
ANNEX 10-2 METHODOLOGY OF BENEFIT VALUATION
Methodologies for valuing the selected benefits for the Project are explained below.
1 Forestry Production
Under the forest management component, various types of tree would be planted. The economic benefit will be estimated by (1 ) Timber Production , (2) Fuelwood Production, and (3) Non Timber Forest Products (NTFP) including bamboo and grass/fodder.
(1) Timber Production
The economic benefit will be estimated by the stumpage value of the planted trees and areas to be valued are set as follows.
Assumptions Benefit Calculation Teak (Tectona grandis)
Year Total Yield
Number of Stem
Stumpage Value
Harvested Timber Volume
Harvested Smallwood Branch
Volume
Thinning Timber Volume
Thinning Smallwood Branch
Volume
Harvested Value
(m3/ha) (#/ha) (Rs/ha) (m3/ha) (m3/ha) (m3/ha) (m3/ha) (Rs/ha) 2 0.00 1,100.00 0 0.00 0.00 0 6 8 717 94,048 0.00 3.28 38,814 11 14 382 160,479 0.00 4.23 50,010 16 17 237 205,264 0.00 4.23 50,010 21 21 166 252,288 0.25 4.29 53,742 26 23 125 270,949 0.82 3.53 51,503 31 22 100 260,499 1.32 2.14 41,053 36 24 86 282,145 1.58 1.58 37,321 41 26 74 308,270 1.64 1.07 32,096 46 29 67 341,112 1.58 0.76 27,617 51 31.34 61 370,968 25.85 3.41 1.51 0.57 370,968
Note: 1) Density, Yield and Volume are derived from yield tables (Reference: Growth and Yield Statistics of Common Indian Timber Species Volume II, 1972)
2) Harvested Value calculated based on UPFC selling price and harvesting cost 3) Year 51 is year assumed for final harvesting, but value was not included in the benefit valuation for the Project 4)Total area of 5,235ha is assumed as an area benefited from the above activity
Assumptions Benefit Calculation Sal (Shorea robusta)
Year Total Yield
Number of Stem
Stumpage Value
Harvested Timber Volume
Harvested Smallwood
Branch Volume
Thinning Timber Volume
Thinning Smallwood
Branch Volume
Harvested Value
(m3/ha) (#/ha) (Rs/ha) (m3/ha) (m3/ha) (m3/ha) (m3/ha) (Rs/ha) 2 0.00 1,100.00 0 0.00 0.00 0 6 4 722 26,643 0.00 0.16 1,066 11 9 514 59,681 0.00 0.63 4,263 16 13 435 90,587 0.00 1.26 8,526 21 19 378 126,822 0.00 2.21 14,920 26 24 331 163,057 0.00 3.00 20,249 31 30 297 205,686 0.16 3.94 27,709 36 36 272 246,184 0.47 4.73 35,169 41 42 248 283,485 0.95 5.36 42,629 46 47 226 320,786 1.58 5.68 49,024 51 47.45 226 320,786 1.58 5.68 49,024
Note: 1) Density, Yield and Volume are derived from yield tables (Reference: Growth and Yield Statistics of Common Indian Timber Species Volume II, 1972)
2) Harvested Value calculated based on UPFC selling price and harvesting cost 3) Year 51 is year assumed for final harvesting, but value was not included in the benefit valuation for the Project 4) Total area of 2,190ha is assumed as an area benefited from the above activity
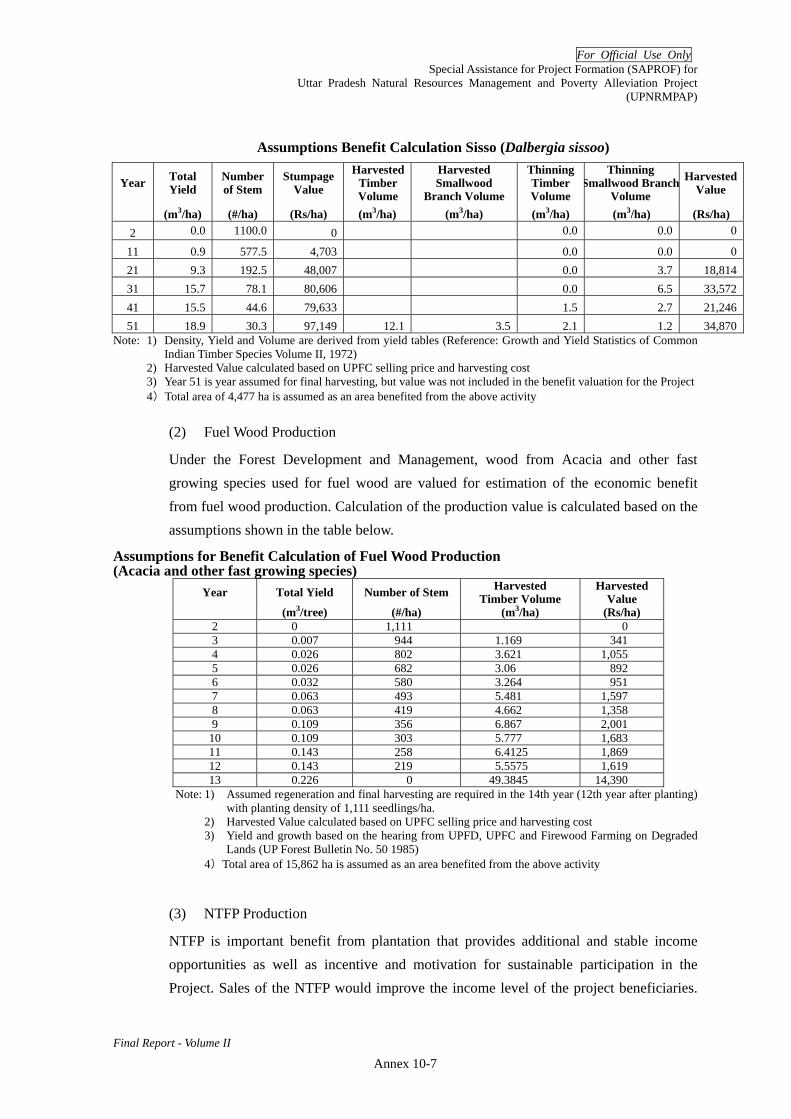
For Official Use Only Special Assistance for Project Formation (SAPROF) for
Uttar Pradesh Natural Resources Management and Poverty Alleviation Project (UPNRMPAP)
Final Report - Volume II Annex 10-7
Assumptions Benefit Calculation Sisso (Dalbergia sissoo)
Year Total Yield
Number of Stem
Stumpage Value
Harvested Timber Volume
Harvested Smallwood
Branch Volume
Thinning Timber Volume
Thinning Smallwood Branch
Volume
Harvested Value
(m3/ha) (#/ha) (Rs/ha) (m3/ha) (m3/ha) (m3/ha) (m3/ha) (Rs/ha) 2 0.0 1100.0 0 0.0 0.0 0
11 0.9 577.5 4,703 0.0 0.0 021 9.3 192.5 48,007 0.0 3.7 18,81431 15.7 78.1 80,606 0.0 6.5 33,57241 15.5 44.6 79,633 1.5 2.7 21,24651 18.9 30.3 97,149 12.1 3.5 2.1 1.2 34,870
Note: 1) Density, Yield and Volume are derived from yield tables (Reference: Growth and Yield Statistics of Common Indian Timber Species Volume II, 1972)
2) Harvested Value calculated based on UPFC selling price and harvesting cost 3) Year 51 is year assumed for final harvesting, but value was not included in the benefit valuation for the Project 4) Total area of 4,477 ha is assumed as an area benefited from the above activity
(2) Fuel Wood Production
Under the Forest Development and Management, wood from Acacia and other fast growing species used for fuel wood are valued for estimation of the economic benefit from fuel wood production. Calculation of the production value is calculated based on the assumptions shown in the table below.
Assumptions for Benefit Calculation of Fuel Wood Production (Acacia and other fast growing species)
Year Total Yield Number of Stem Harvested Timber Volume
Harvested Value
(m3/tree) (#/ha) (m3/ha) (Rs/ha) 2 0 1,111 0 3 0.007 944 1.169 341 4 0.026 802 3.621 1,055 5 0.026 682 3.06 892 6 0.032 580 3.264 951 7 0.063 493 5.481 1,597 8 0.063 419 4.662 1,358 9 0.109 356 6.867 2,001
10 0.109 303 5.777 1,683 11 0.143 258 6.4125 1,869 12 0.143 219 5.5575 1,619 13 0.226 0 49.3845 14,390
Note: 1) Assumed regeneration and final harvesting are required in the 14th year (12th year after planting) with planting density of 1,111 seedlings/ha.
2) Harvested Value calculated based on UPFC selling price and harvesting cost 3) Yield and growth based on the hearing from UPFD, UPFC and Firewood Farming on Degraded
Lands (UP Forest Bulletin No. 50 1985) 4) Total area of 15,862 ha is assumed as an area benefited from the above activity
(3) NTFP Production
NTFP is important benefit from plantation that provides additional and stable income opportunities as well as incentive and motivation for sustainable participation in the Project. Sales of the NTFP would improve the income level of the project beneficiaries.
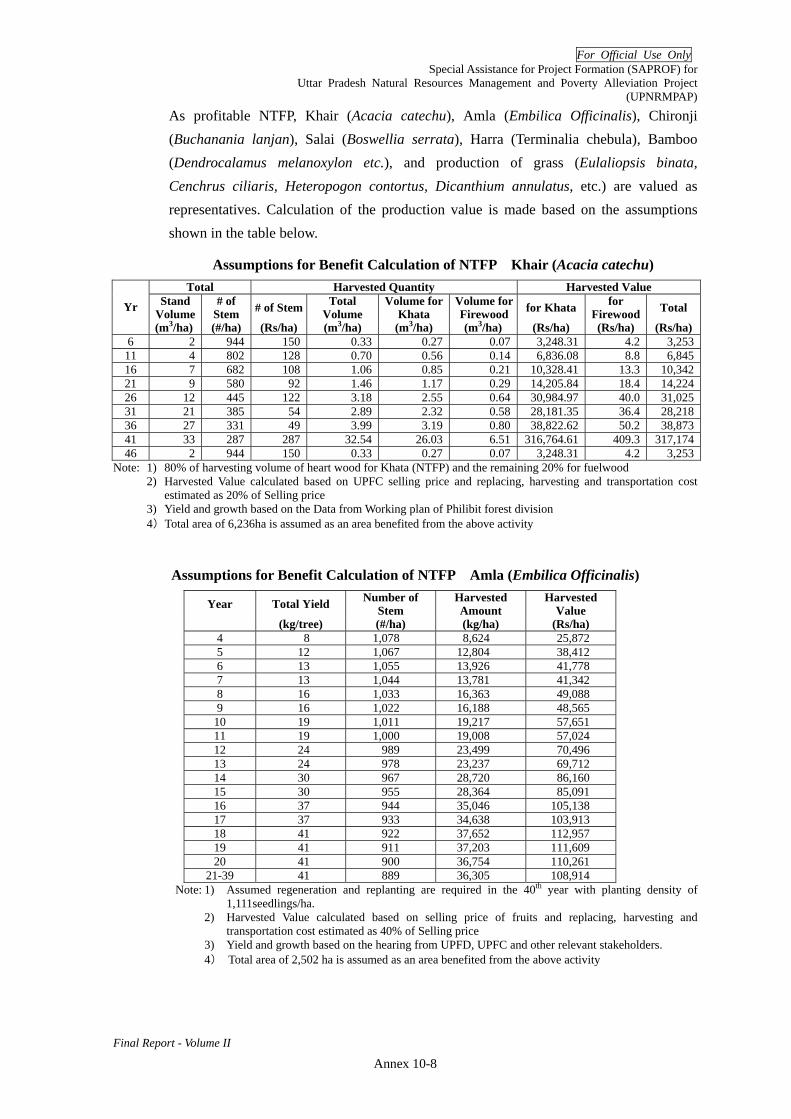
For Official Use Only Special Assistance for Project Formation (SAPROF) for
Uttar Pradesh Natural Resources Management and Poverty Alleviation Project (UPNRMPAP)
Final Report - Volume II Annex 10-8
As profitable NTFP, Khair (Acacia catechu), Amla (Embilica Officinalis), Chironji (Buchanania lanjan), Salai (Boswellia serrata), Harra (Terminalia chebula), Bamboo (Dendrocalamus melanoxylon etc.), and production of grass (Eulaliopsis binata, Cenchrus ciliaris, Heteropogon contortus, Dicanthium annulatus, etc.) are valued as representatives. Calculation of the production value is made based on the assumptions shown in the table below.
Assumptions for Benefit Calculation of NTFP Khair (Acacia catechu) Total Harvested Quantity Harvested Value
Stand Volume
# of Stem # of Stem Total
Volume Volume for
Khata Volume for Firewood for Khata for
Firewood Total Yr
(m3/ha) (#/ha) (Rs/ha) (m3/ha) (m3/ha) (m3/ha) (Rs/ha) (Rs/ha) (Rs/ha)6 2 944 150 0.33 0.27 0.07 3,248.31 4.2 3,253 11 4 802 128 0.70 0.56 0.14 6,836.08 8.8 6,845 16 7 682 108 1.06 0.85 0.21 10,328.41 13.3 10,342 21 9 580 92 1.46 1.17 0.29 14,205.84 18.4 14,224 26 12 445 122 3.18 2.55 0.64 30,984.97 40.0 31,025 31 21 385 54 2.89 2.32 0.58 28,181.35 36.4 28,218 36 27 331 49 3.99 3.19 0.80 38,822.62 50.2 38,873 41 33 287 287 32.54 26.03 6.51 316,764.61 409.3 317,174 46 2 944 150 0.33 0.27 0.07 3,248.31 4.2 3,253
Note: 1) 80% of harvesting volume of heart wood for Khata (NTFP) and the remaining 20% for fuelwood 2) Harvested Value calculated based on UPFC selling price and replacing, harvesting and transportation cost
estimated as 20% of Selling price 3) Yield and growth based on the Data from Working plan of Philibit forest division 4) Total area of 6,236ha is assumed as an area benefited from the above activity
Assumptions for Benefit Calculation of NTFP Amla (Embilica Officinalis)
Year Total Yield Number of Stem
Harvested Amount
Harvested Value
(kg/tree) (#/ha) (kg/ha) (Rs/ha) 4 8 1,078 8,624 25,872 5 12 1,067 12,804 38,412 6 13 1,055 13,926 41,778 7 13 1,044 13,781 41,342 8 16 1,033 16,363 49,088 9 16 1,022 16,188 48,565
10 19 1,011 19,217 57,651 11 19 1,000 19,008 57,024 12 24 989 23,499 70,496 13 24 978 23,237 69,712 14 30 967 28,720 86,160 15 30 955 28,364 85,091 16 37 944 35,046 105,138 17 37 933 34,638 103,913 18 41 922 37,652 112,957 19 41 911 37,203 111,609 20 41 900 36,754 110,261
21-39 41 889 36,305 108,914 Note: 1) Assumed regeneration and replanting are required in the 40th year with planting density of
1,111seedlings/ha. 2) Harvested Value calculated based on selling price of fruits and replacing, harvesting and
transportation cost estimated as 40% of Selling price 3) Yield and growth based on the hearing from UPFD, UPFC and other relevant stakeholders. 4) Total area of 2,502 ha is assumed as an area benefited from the above activity

For Official Use Only Special Assistance for Project Formation (SAPROF) for
Uttar Pradesh Natural Resources Management and Poverty Alleviation Project (UPNRMPAP)
Final Report - Volume II Annex 10-9
Assumptions for Benefit Calculation of NTFP Chironji (Buchanania lanjan) Year Total Yield Number of
Stem Harvested Amount
Harvested Value
(kg/tree) (#/ha) (kg/ha) (Rs/ha) 15 1.00 778 778 46,680 16 1.02 755 770 46,206 17 1.04 733 762 45,739 18 1.06 711 754 45,220 19 1.08 689 744 44,647 20 1.10 667 734 44,022 21 1.12 644 721 43,277 22 1.14 622 709 42,545 23 1.16 600 696 41,760 24 1.18 578 682 40,922 25 1.20 556 667 40,032 26 1.22 533 650 39,016 27 1.24 511 634 38,018 28 1.26 489 616 36,968 29 1.28 467 598 35,866 30 1.30 444 577 34,632 31 1.32 422 557 33,422 32 1.34 400 536 32,160 33 1.36 378 514 30,845 34 1.38 356 491 29,477 35 1.40 333 466 27,972 36 1.42 311 442 26,497 37 1.44 289 416 24,970 38 1.46 267 390 23,389 39 1.48 244 361 21,667
40-50 1.50 244 366 21,960 Note: 1) Assumed regeneration and replanting are required in the 50th year with planting density of
1,111seedlings/ha. 2) Harvested Value calculated based on selling price of fruits and replacing, harvesting and
transportation cost estimated as 40% of Selling price 3) Yield and growth based on the hearing from UPFD, UPFC and other relevant stakeholders. 4) Total area of 2,502 ha is assumed as an area benefited from the above activity
Assumptions for Benefit Calculation of NTFP Salai (Boswellia serrata)
Year Total Yield Number of Stem
Harvested Amount
Harvested Value
(kg/tree) (#/ha) (kg/ha) (Rs/ha) 10 0.19 533 101 1,519 11 0.22 519 115 1,720 12 0.25 506 128 1,913 13 0.28 493 140 2,093 14 0.31 480 151 2,261 15 0.35 466 161 2,412 16 0.38 453 170 2,555 17 0.41 440 179 2,686 18 0.44 426 187 2,799 19 0.47 413 194 2,905 20 0.50 400 200 3,000 21 0.53 386 205 3,074 22 0.56 373 210 3,144 23 0.59 360 213 3,202 24 0.62 346 216 3,239 25 0.66 333 218 3,272 26 0.69 320 220 3,293 27 0.72 306 219 3,291 28 0.75 293 219 3,287 29 0.78 280 218 3,276 30 0.81 266 216 3,236
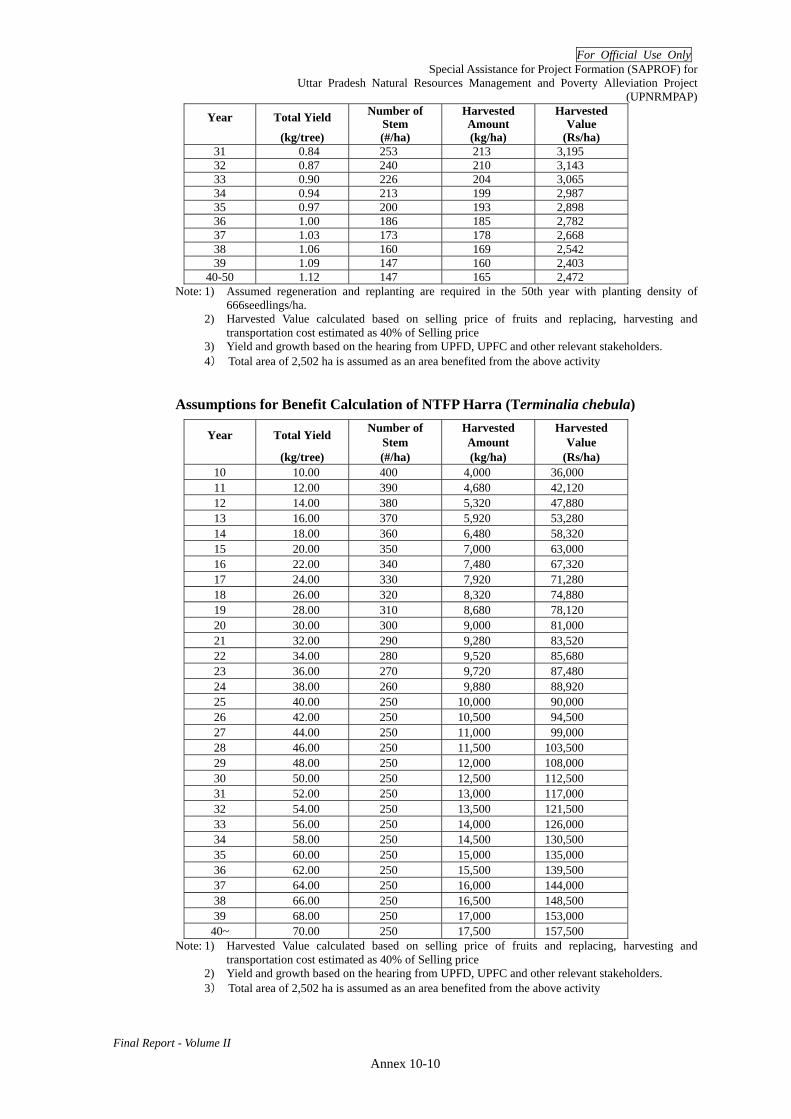
For Official Use Only Special Assistance for Project Formation (SAPROF) for
Uttar Pradesh Natural Resources Management and Poverty Alleviation Project (UPNRMPAP)
Final Report - Volume II Annex 10-10
Year Total Yield Number of Stem
Harvested Amount
Harvested Value
(kg/tree) (#/ha) (kg/ha) (Rs/ha) 31 0.84 253 213 3,195 32 0.87 240 210 3,143 33 0.90 226 204 3,065 34 0.94 213 199 2,987 35 0.97 200 193 2,898 36 1.00 186 185 2,782 37 1.03 173 178 2,668 38 1.06 160 169 2,542 39 1.09 147 160 2,403
40-50 1.12 147 165 2,472 Note: 1) Assumed regeneration and replanting are required in the 50th year with planting density of
666seedlings/ha. 2) Harvested Value calculated based on selling price of fruits and replacing, harvesting and
transportation cost estimated as 40% of Selling price 3) Yield and growth based on the hearing from UPFD, UPFC and other relevant stakeholders. 4) Total area of 2,502 ha is assumed as an area benefited from the above activity
Assumptions for Benefit Calculation of NTFP Harra (Terminalia chebula)
Year Total Yield Number of Stem
Harvested Amount
Harvested Value
(kg/tree) (#/ha) (kg/ha) (Rs/ha) 10 10.00 400 4,000 36,000 11 12.00 390 4,680 42,120 12 14.00 380 5,320 47,880 13 16.00 370 5,920 53,280 14 18.00 360 6,480 58,320 15 20.00 350 7,000 63,000 16 22.00 340 7,480 67,320 17 24.00 330 7,920 71,280 18 26.00 320 8,320 74,880 19 28.00 310 8,680 78,120 20 30.00 300 9,000 81,000 21 32.00 290 9,280 83,520 22 34.00 280 9,520 85,680 23 36.00 270 9,720 87,480 24 38.00 260 9,880 88,920 25 40.00 250 10,000 90,000 26 42.00 250 10,500 94,500 27 44.00 250 11,000 99,000 28 46.00 250 11,500 103,500 29 48.00 250 12,000 108,000 30 50.00 250 12,500 112,500 31 52.00 250 13,000 117,000 32 54.00 250 13,500 121,500 33 56.00 250 14,000 126,000 34 58.00 250 14,500 130,500 35 60.00 250 15,000 135,000 36 62.00 250 15,500 139,500 37 64.00 250 16,000 144,000 38 66.00 250 16,500 148,500 39 68.00 250 17,000 153,000
40~ 70.00 250 17,500 157,500 Note: 1) Harvested Value calculated based on selling price of fruits and replacing, harvesting and
transportation cost estimated as 40% of Selling price 2) Yield and growth based on the hearing from UPFD, UPFC and other relevant stakeholders. 3) Total area of 2,502 ha is assumed as an area benefited from the above activity
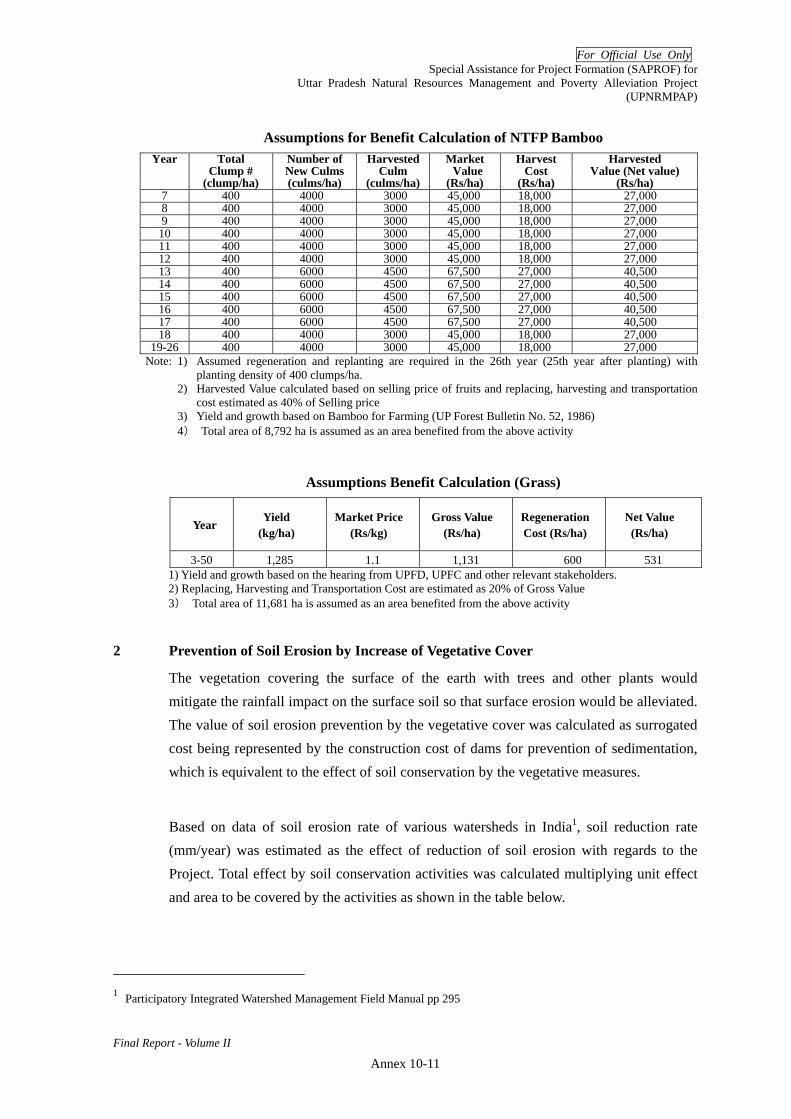
For Official Use Only Special Assistance for Project Formation (SAPROF) for
Uttar Pradesh Natural Resources Management and Poverty Alleviation Project (UPNRMPAP)
Final Report - Volume II Annex 10-11
Assumptions for Benefit Calculation of NTFP Bamboo Year Total Number of Harvested Market Harvest Harvested
Clump # New Culms Culm Value Cost Value (Net value) (clump/ha) (culms/ha) (culms/ha) (Rs/ha) (Rs/ha) (Rs/ha)
7 400 4000 3000 45,000 18,000 27,000 8 400 4000 3000 45,000 18,000 27,000 9 400 4000 3000 45,000 18,000 27,000 10 400 4000 3000 45,000 18,000 27,000 11 400 4000 3000 45,000 18,000 27,000 12 400 4000 3000 45,000 18,000 27,000 13 400 6000 4500 67,500 27,000 40,500 14 400 6000 4500 67,500 27,000 40,500 15 400 6000 4500 67,500 27,000 40,500 16 400 6000 4500 67,500 27,000 40,500 17 400 6000 4500 67,500 27,000 40,500 18 400 4000 3000 45,000 18,000 27,000
19-26 400 4000 3000 45,000 18,000 27,000 Note: 1) Assumed regeneration and replanting are required in the 26th year (25th year after planting) with
planting density of 400 clumps/ha. 2) Harvested Value calculated based on selling price of fruits and replacing, harvesting and transportation
cost estimated as 40% of Selling price 3) Yield and growth based on Bamboo for Farming (UP Forest Bulletin No. 52, 1986) 4) Total area of 8,792 ha is assumed as an area benefited from the above activity
Assumptions Benefit Calculation (Grass)
Year Yield
(kg/ha) Market Price
(Rs/kg) Gross Value
(Rs/ha) Regeneration Cost (Rs/ha)
Net Value (Rs/ha)
3-50 1,285 1.1 1,131 600 531 1) Yield and growth based on the hearing from UPFD, UPFC and other relevant stakeholders. 2) Replacing, Harvesting and Transportation Cost are estimated as 20% of Gross Value 3) Total area of 11,681 ha is assumed as an area benefited from the above activity
2 Prevention of Soil Erosion by Increase of Vegetative Cover
The vegetation covering the surface of the earth with trees and other plants would mitigate the rainfall impact on the surface soil so that surface erosion would be alleviated. The value of soil erosion prevention by the vegetative cover was calculated as surrogated cost being represented by the construction cost of dams for prevention of sedimentation, which is equivalent to the effect of soil conservation by the vegetative measures.
Based on data of soil erosion rate of various watersheds in India1, soil reduction rate (mm/year) was estimated as the effect of reduction of soil erosion with regards to the Project. Total effect by soil conservation activities was calculated multiplying unit effect and area to be covered by the activities as shown in the table below.
1 Participatory Integrated Watershed Management Field Manual pp 295

For Official Use Only Special Assistance for Project Formation (SAPROF) for
Uttar Pradesh Natural Resources Management and Poverty Alleviation Project (UPNRMPAP)
Final Report - Volume II Annex 10-12
Estimation of total volume of soil conservation
Reforestation Area
(ha) Reduction Rate
(mm/year) Total Volume (MCM)
General Improvement, ANR 14,500 0.33 0.05 Gap Plantation 10,500 0.50 0.05 Enrichment cum Stand Improvement 23,000 0.50 0.12 Bamboo M. Dense 4,400 0.50 0.02 Block Plantation 16,200 0.67 0.11 Plantation cum Stand Improvement 6,200 0.67 0.04 Bamboo Open 5,700 0.67 0.04
Total 80,500 0.24 Source: SAPROF Team
Construction cost of check dam was estimated by using the data in the Sabo plan in the Philippines2.
Estimation of economic benefit of soil conservation Total
Volume (MCM)
Design Annual Sedimentation
Volume (MCM)
RequiredNo. of Sabo
Dam
Unit Cost (Rs million)
Total Construction Cost
(Rs. million) General Improvement, ANR
0.05 0.45 0.11 132.6 14.6
Gap Plantation 0.05 0.45 0.12 132.6 15.9 Enrichment cum Stand Improvement
0.12 0.45 0.26 132.6 34.5
Bamboo M. Dense 0.02 0.45 0.05 132.6 6.6 Block Plantation 0.11 0.45 0.24 132.6 31.8 Plantation cum Stand Improvement
0.04 0.45 0.09 132.6 11.9
Bamboo Open 0.04 0.45 0.08 132.6 10.6 Total 0.24 126.0 Source: SAPROF Team
Based on the total construction cost of the check dams (Rs. 126.0million), annual benefit of the soil conservation was estimated at Rs17.03 million/year, which consists of annual depreciation of the check dam at Rs. 16.86 million/year and annual O&M cost of the Sabo dam at Rs.0.17 million/year, under the assumption of the 20-year depreciation period.
3 CO2 Sequestration
Regarding the carbon sequestration, increased volume of carbon sequestration by growing of the forest stand is valued as CER (Certified Emissions Reductions) based on the price applied by Word Bank3. Calculation of the production value is estimated based on the assumptions shown in the table below.
2 The feasibility study on the flood control project for the lower Cagayan river in the Republic of Philippines, JICA 2002 3 The World Bank price US$ 4 per t CO2-e (until 2017) Cited at “State and trends of the regulated A/R market”, Side

For Official Use Only Special Assistance for Project Formation (SAPROF) for
Uttar Pradesh Natural Resources Management and Poverty Alleviation Project (UPNRMPAP)
Final Report - Volume II Annex 10-13
Assumptions for Benefit Calculation of Carbon Sequestration Annual Biomass
Increment (MAI)
Artificial Loss
Net Increment in Biomass
Carbon Contents
Annual Carbon
Sequestration
Annual CO2 Sequestration
Estimated CER Price
Net ValuePlanted
Year
(ton dm /ha) (ton dm /ha) (ton dm/ha) (ton-C
/ton dm) (ton-C/ha) (ton-CO2/ha) (Rs./ton- CO2)
(Rs/ha)
1 1.03 1.0 0.50 0.52 1.89 159.12 301 2 1.03 1.0 0.50 0.52 1.89 159.12 301 3 1.03 1.0 0.50 0.52 1.89 159.12 301 4 1.03 1.0 0.50 0.52 1.89 159.12 301 5 1.03 3.0 -2.0 0.50 (1.01) -3.69 159.12 -587 6 1.03 1.0 0.50 0.52 1.89 159.12 301 7 1.03 1.0 0.50 0.52 1.89 159.12 301 8 1.03 1.0 0.50 0.52 1.89 159.12 301 9 1.03 1.0 0.50 0.52 1.89 159.12 301
10 1.03 2.0 -1.0 0.50 (0.50) -1.85 159.12 -294 11 1.03 1.0 0.50 0.52 1.89 159.12 301 12 1.03 1.0 0.50 0.52 1.89 159.12 301 13 1.03 1.0 0.50 0.52 1.89 159.12 301 14 1.03 1.0 0.50 0.52 1.89 159.12 301 15 1.03 2.3 -1.2 0.50 (0.61) -2.25 159.12 -358 16 1.03 1.0 0.50 0.52 1.89 159.12 301 17 1.03 1.0 0.50 0.52 1.89 159.12 301 18 1.03 1.0 0.50 0.52 1.89 159.12 301 19 1.03 1.0 0.50 0.52 1.89 159.12 301 20 1.03 2.9 -1.9 0.50 (0.95) -3.48 159.12 -553 21 1.03 1.0 0.50 0.52 1.89 159.12 301 22 1.03 1.0 0.50 0.52 1.89 159.12 301 23 1.03 1.0 0.50 0.52 1.89 159.12 301 24 1.03 1.0 0.50 0.52 1.89 159.12 301 25 1.03 3.0 -2.0 0.50 (1.01) -3.69 159.12 -587 26 1.03 1.0 0.50 0.52 1.89 159.12 301 27 1.03 1.0 0.50 0.52 1.89 159.12 301 28 1.03 1.0 0.50 0.52 1.89 159.12 301 29 1.03 1.0 0.50 0.52 1.89 159.12 301 30 1.03 4.0 -3.0 0.50 (1.49) -5.47 159.12 -871 31 1.03 1.0 0.50 0.52 1.89 159.12 301 32 1.03 1.0 0.50 0.52 1.89 159.12 301 33 1.03 1.0 0.50 0.52 1.89 159.12 301 34 1.03 1.0 0.50 0.52 1.89 159.12 301 35 1.03 3.4 -2.3 0.50 (1.17) -4.28 159.12 -681 36 1.03 1.0 0.50 0.52 1.89 159.12 301 37 1.03 1.0 0.50 0.52 1.89 159.12 301 38 1.03 1.0 0.50 0.52 1.89 159.12 301 39 1.03 1.0 0.50 0.52 1.89 159.12 301 40 1.03 3.7 -2.7 0.50 (1.35) -4.94 159.12 -786 41 1.03 1.0 0.50 0.52 1.89 159.12 301 42 1.03 1.0 0.50 0.52 1.89 159.12 301 43 1.03 1.0 0.50 0.52 1.89 159.12 301 44 1.03 1.0 0.50 0.52 1.89 159.12 301 45 1.03 4.0 -3.0 0.50 (1.49) -5.46 159.12 -868 46 1.03 1.0 0.50 0.52 1.89 159.12 301 47 1.03 1.0 0.50 0.52 1.89 159.12 301 48 1.03 1.0 0.50 0.52 1.89 159.12 301 49 1.03 1.0 0.50 0.52 1.89 159.12 301 50 1.03 4.0 -3.0 0.50 (1.49) -5.46 159.12 -868
Total 9.56 5,575 Note: 1) CER Price are converted from 4 (US$/ton-CO2) of estimated price by Point Carbon to 3.6 ($/ton-CO2) with
Event on Developments on Afforestation and Reforestation in the Kyoto Protocol, Carbon Expo at Cologne, 03 May 2007, Till Neeff , Eco Securities Group Inc

For Official Use Only Special Assistance for Project Formation (SAPROF) for
Uttar Pradesh Natural Resources Management and Poverty Alleviation Project (UPNRMPAP)
Final Report - Volume II Annex 10-14
consideration the risk of AR-CDM and transaction cost for CDM process. 2) Basic data of annual biomass increment and artificial loss are derived from yield tables for teak (Tectona
grandis), sal (Shorea robusta) and sisso (Dalbergia sissoo) (Reference: Growth and Yield Statistics of Common Indian Timber Species Volume II, 1972)
3) Conversion of green weight into dry weight was based on data obtain from “Firewood Farming on Degraded Lands (UP Forest Bulletin No. 50 1985)”
4) Exchange rate: US$1=44.2 Rs 5) dm: Dry Matter 6) Total area of 11,847 ha is assumed as an area benefited from the above activity
4 Fire Damage
By constructing fire break line, reduction of damage from the forest fire can be expected, that is also an important benefit of the project. This benefit can be estimated by the reduction of damage from the forest fire. More precisely, the value is calculated by the following equation.
- Benefit of forest fire reduction = Area (ha) to be protected from the forest fire x Value of forest per ha
- value of forest = estimated value of wood production of representative species.
The based on the information on the recent fire damage of project area, 500 ha is estimated as area to be protected from the forest fire, and assumptions for benefit calculation of Khair (Acacia catechu) is applied as representative species for estimating value of wood production
5 Income Generating Activities (IGA)
For the estimation of economic benefit of IGAs under UP-NRMPAP, the following assumptions were made:
5.1 Project Life
Unlike forestry-related components and sub-components, the project life of IGA component should be short based on the prevailing notion of the business life. It was assumed that the life of IGAs is 20 years.
5.2 Number of micro-enterprises
Based on the implementing schedule, the number of micro-enterprises established and operated by SHGs and SHG consortiums are assumed as shown in the table below:
Year No. of enterprises (SHG level) No. of enterprises (SHG Consortium) Year 1 0 0 Year 2 0 0 Year 3 0 0 Year 4 945 ((275 JFMCs+40 EDCs) x 3) 7 (Round (945 / 140)) Year 5 1,950 ((945+285 JFMCs+50 EDCs) x 3) 14 (Round (1,950 / 140))Year 6 2,820 ((1,950+240 JFNCs+50EDCs) x 3) 20 Year 7 2,820 20 Year 8 2,820 20 Year 9 2,820 20 Year 10 2,820 20

For Official Use Only Special Assistance for Project Formation (SAPROF) for
Uttar Pradesh Natural Resources Management and Poverty Alleviation Project (UPNRMPAP)
Final Report - Volume II Annex 10-15
Year 11 2,820 20 Year 12 2,820 20 Year 13 2,820 20 Year 14 2,820 20 Year 15 2,820 20 Year 16 2,820 20 Year 17 2,820 20 Year 18 2,820 20 Year 19 2,820 20 Year 20 2,820 20 Year 21 2,820 20 Year 22 2,820 20 Year 23 1,875 13 Year 24 870 6
5.3 Forest-based IGA
The Mahua oil production was taken as a sample IGA for forest-based IGA. At the SHG level, collection and primary processing (cleaning) of Mahua seeds will be done. At the SHG consortium level, the oil extraction will be done. The basis for the economic benefit estimation is shown in the tables below:
At a SHG level Sales price (cleaned
Mahua seed)
Quantity / persons / day
Persons to be involved
Working day per month
Production month per
year
Annual production per SHG
Annual sale / SHG
Rs./kg kg person day month kg Rs. 12 6 3 25 4 1,800 21,600
At a SHG consortium level Buying price
of Mahua seeds from
SHGs
Oil to be esxtracted from 1 kg
Real buying price
Seles price (Mahua oil)
Value added for Mahua
oil exptraction
Annual production
per consortium
Annual value added / Consortium
Rs./kg litter Rs./litter Rs./litter Rs./litter litter Rs. 12 0.22 54.5 56 1.5 253,800 369,164
5.4 Natural Resource-based IGA
The pickled Mango production was taken as a sample IGA for natural resource-based IGA. At the SHG level, collection and primary processing (peering and dicing) of Mango will be done. At the SHG consortium level, the pickling and packaging will be done. The basis for the economic benefit estimation is shown in the tables below:
At a SHG level Sales price (processed
Mango)
Quantity / persons / day
Persons to be involved
Working day per month
Production month per
year
Annual production per SHG
Annual sale / SHG
Rs./kg kg person day month kg Rs. 70 3 3 25 3 675 47,250

For Official Use Only Special Assistance for Project Formation (SAPROF) for
Uttar Pradesh Natural Resources Management and Poverty Alleviation Project (UPNRMPAP)
Final Report - Volume II Annex 10-16
At a SHG consortium level Buying price of processed Mango from
SHGs
Seles price (pickled Mango)
Value added for pickled
Mango
Loss of raw material
during the process
Annual production volume per consortium
Annual value added / Consortium
Rs./kg Rs./kg Rs./kg % kg Rs. 70 80 10 50% 47,588 475,875
5.5 Non-natural Resource-based IGA
The Agarbati (Indian traditional incents) making was taken as a sample IGA for non-natural resource-based IGA. At the SHG level, incent stick making will be done. At the SHG consortium level, the packaging and marketing will be done. The basis for the economic benefit estimation is shown in the tables below:
At a SHG level Sales price (Agarbati
stick)
Quantity / persons / day
Persons to be involved
Working day per month
Production month per
year
After rejects
Annual production per SHG
Annual sale / SHG
Rs./20 sticks stick person day month % stick Rs.
4 400 4 15 9 70% 7,560 30,240
At a SHG consortium level Buying price of Agarbati sticks from
SHGs
Seles price (packaged Agarbati)
Value added for packaged
Agarbati After reject
Annual production volume per consortium
Annual value added / Consortium
Rs./20 sticks Rs./20 sticks Rs./kg % kg Rs. 4 4.3 0.3 90% 959,364 287,809
5.6 Economic Benefit of IGA
Based on the basis of economic benefit explained above and estimated total numbers of SHGs and SHG consortium, annual economic benefit from IGA component of UP-NRMPAP was estimated. The result of estimate is summarised in the table below:
Year SHG Total Sale Consortium Total Value Added IGA Economic Benefit TotalYear 1 0 0 0 Year 2 0 0 0 Year 3 0 0 0 Year 4 93,640,050 5,997,803 99,637,853 Year 5 193,225,500 12,376,420 205,601,920 Year 6 279,433,800 17,898,207 297,332,007 Year 7 279,433,800 17,898,207 297,332,007 Year 8 279,433,800 17,898,207 297,332,007 Year 9 279,433,800 17,898,207 297,332,007 Year 10 279,433,800 17,898,207 297,332,007 Year 11 279,433,800 17,898,207 297,332,007 Year 12 279,433,800 17,898,207 297,332,007 Year 13 279,433,800 17,898,207 297,332,007 Year 14 279,433,800 17,898,207 297,332,007 Year 15 279,433,800 17,898,207 297,332,007 Year 16 279,433,800 17,898,207 297,332,007 Year 17 279,433,800 17,898,207 297,332,007 Year 18 279,433,800 17,898,207 297,332,007 Year 19 279,433,800 17,898,207 297,332,007 Year 20 279,433,800 17,898,207 297,332,007

For Official Use Only Special Assistance for Project Formation (SAPROF) for
Uttar Pradesh Natural Resources Management and Poverty Alleviation Project (UPNRMPAP)
Final Report - Volume II Annex 10-17
Year SHG Total Sale Consortium Total Value Added IGA Economic Benefit TotalYear 21 279,433,800 17,898,207 297,332,007 Year 22 279,433,800 17,898,207 297,332,007 Year 23 185,793,750 11,900,403 197,694,153 Year 24 86,208,300 5,521,787 91,730,087
6 Ecotourism
For the estimation of the economic benefit of ecotourism, following assumptions were made:
a) 4 eco-lodges would be constructed under Project, from the second year of the project and complete construction by fifth year.
b) In each location of eco-lodge, camp sites with 15 tents per site will be constructed.
c) Each eco-lodge would accommodate 10 people, and the occupancy rate would be 70% during the weekends through the year. Each guest will pay 100 Rs/night for lodging.
d) The annual occupancy rate of camp site would be 60%, and tent tariff of 50 Rs/night would be applied.
c) Initially, additional 3,000 visitors would visit the ecotourism sites. From six year of the project, the number of the additional visitors would start growing at 3% per year.
d) Each visitor would pay entrance fee (Rs. 10), purchase of souvenir (Rs. 800), average travel cost (Rs.800) to contribute to the economy, which would be the economic benefit generated from Project.

For Official Use Only Special Assistance for Project Formation (SAPROF) for
Uttar Pradesh Natural Resource Management and Poverty Alleviation Project (UPNRMPAP)
Final Report- Volume II
Special Assistance for Project Formation
for Uttar Pradesh Natural Resource Management and Poverty Alleviation Project
(UPNRMPAP)
Final Report
Volume II: ANNEXES
ANNEX-11 SATELLITE IMAGE ANALYSIS

For Official Use Only Special Assistance for Project Formation (SAPROF) for
Uttar Pradesh Natural Resources Management and Poverty Alleviation Project (UPNRMPAP)
Final Report - Volume II i
Special Assistance for Project Formation (SAPROF)
for
Uttar Pradesh Natural Resource Management and Poverty Alleviation Project (UPNRMPAP)
Final Report
Volume II: Annexes
ANNEX 11 SATELLITE IMAGE ANALYSIS
Table of Contents 1 Purpose.......................................................................................................................Annex 11-1 2 Used Data ...................................................................................................................Annex 11-1 3 Source of Procurement ...............................................................................................Annex 11-1 4 Land Use / Land Cover Class.....................................................................................Annex 11-2 5 Methodology and Analysis.........................................................................................Annex 11-2
5.1 Geo-referencing...............................................................................................Annex 11-2 5.2 Image Classification........................................................................................Annex 11-3 5.3 GIS Database Creation ....................................................................................Annex 11-3 5.4 GIS Analysis....................................................................................................Annex 11-4
6 Result..........................................................................................................................Annex 11-4 7 Discussion ..................................................................................................................Annex 11-5
7.1 Forest Area ......................................................................................................Annex 11-5 7.2 Forest Cover Area ...........................................................................................Annex 11-6 7.3 Utilization for Project Area Selection .............................................................Annex 11-7
Attachments Attachment A11.6-1 List of Outputs Derived from the Remote Sensing Analysis .............Annex 11-A1 Attachment A11.6-2 Land Use/ Land Cover Classification of UP (Total Area)..................Annex 11-A2 Attachment A11.6-3 Land Use/ Land Cover Classification of UP (Forest Area)................Annex 11-A3 Attachment A11.6-4 Land Use/ Land Cover Classification of UP (Outside of Forest Area)Annex 11-A4 Attachment A11.6-5 Land Use/ Land Cover Map of UP .................................................. Annex 11-A5 Attachment A11.7-1 Comparison of Division-wise Forest Area.......................................... Annex 11-A6

For Official Use Only Special Assistance for Project Formation (SAPROF) for
Uttar Pradesh Natural Resources Management and Poverty Alleviation Project (UPNRMPAP)
Final Report - Volume II
Annex 11-1
ANNEX 11 SATELLITE IMAGE ANALYSIS
1 Purpose
During the SAPROF study, remote sensing analysis was carried out, i) to have first hand information about land use pattern and vegetative cover in the state of Uttar Pradesh, and ii) to contribute for identification and assessment of the present land use in general and forest land in particular for better planning of UPNRMPAP.
The land use/ land cover map (data) derived from satellite images, along with other GIS data sets was used for area analysis with respect to the respective boundaries (forest boundary, forest division boundary, district boundary, and watershed boundary).
2 Used Data
The input data used for creation of geospatial database are as given below.
(1) Satellite Images - IRS 1C/ 1D / P6 LISS III scenes from 2000 to 2006 (November – February) were used. Details of the specification of the satellite image are given below. The entire state of Uttar Pradesh is covered in 32 satellite scenes. Sensor characteristics of the satellite are given below.
(2) Watershed Boundary: Derived from Watershed Atlas of All India Soil and Land Use Survey, Department of Agriculture and Cooperation, Government of India.
(3) 1:250,000 and 1:50,000 topographical maps: (4) Forest boundary/ division information: Collected from maps and other relevant
information from Working Plan Circle Office, UPFD. (5) District Boundaries: Derived from guide map based on Survey of India topographical
maps.
3 Source of Procurement
Due to lack of feasible GIS database in UPFD, GIS and satellite based database was procured from RMSI Pvt. Ltd, for the analysis by the SAPROF Study Team.
Satellite Sensor Spectral Bands Spatial Resolution (m) Swath (km)
IRS – 1C LISS III 3 Bands (520-860 nm) 23.5 141
IRS – 1D LISS III 3 Bands (520-860 nm) 23.5 141
IRS – P6 LISS III 3 Bands (520-860 nm) 23.5 141
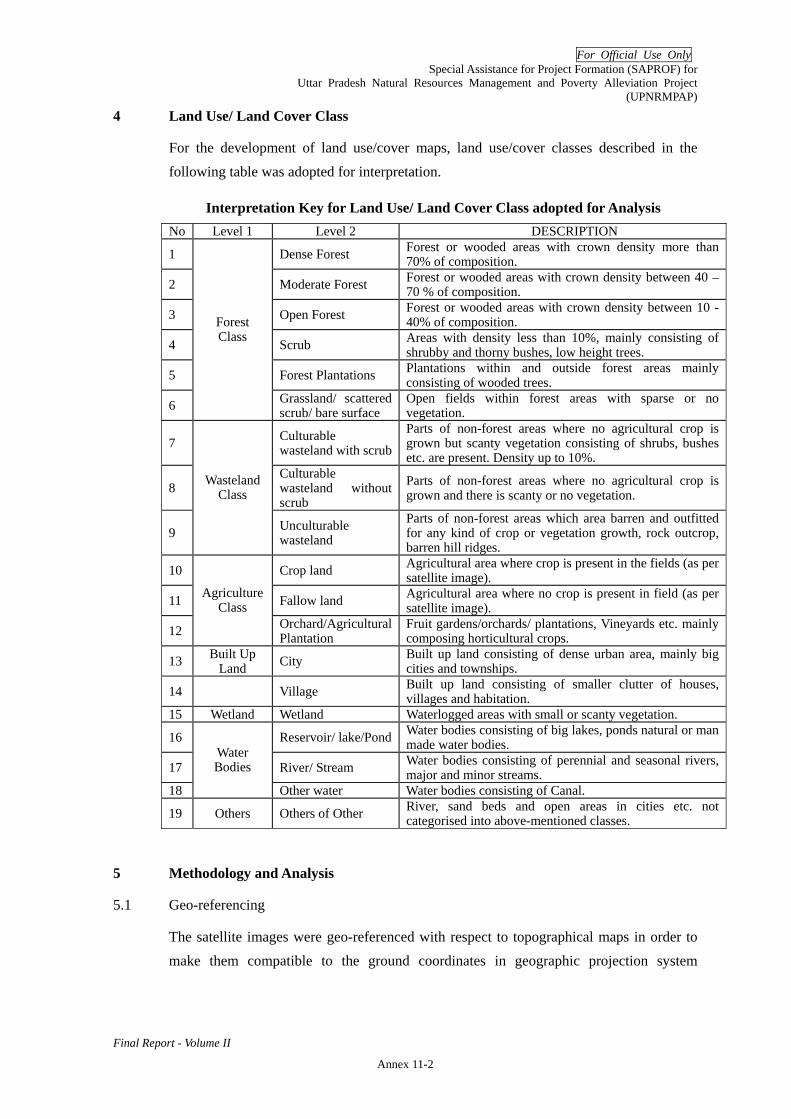
For Official Use Only Special Assistance for Project Formation (SAPROF) for
Uttar Pradesh Natural Resources Management and Poverty Alleviation Project (UPNRMPAP)
Final Report - Volume II
Annex 11-2
4 Land Use/ Land Cover Class
For the development of land use/cover maps, land use/cover classes described in the following table was adopted for interpretation.
Interpretation Key for Land Use/ Land Cover Class adopted for Analysis No Level 1 Level 2 DESCRIPTION
1 Dense Forest Forest or wooded areas with crown density more than 70% of composition.
2 Moderate Forest Forest or wooded areas with crown density between 40 – 70 % of composition.
3 Open Forest Forest or wooded areas with crown density between 10 - 40% of composition.
4 Scrub Areas with density less than 10%, mainly consisting of shrubby and thorny bushes, low height trees.
5 Forest Plantations Plantations within and outside forest areas mainly consisting of wooded trees.
6
Forest Class
Grassland/ scattered scrub/ bare surface
Open fields within forest areas with sparse or no vegetation.
7 Culturable wasteland with scrub
Parts of non-forest areas where no agricultural crop is grown but scanty vegetation consisting of shrubs, bushes etc. are present. Density up to 10%.
8 Culturable wasteland without scrub
Parts of non-forest areas where no agricultural crop is grown and there is scanty or no vegetation.
9
Wasteland Class
Unculturable wasteland
Parts of non-forest areas which area barren and outfitted for any kind of crop or vegetation growth, rock outcrop, barren hill ridges.
10 Crop land Agricultural area where crop is present in the fields (as per satellite image).
11 Fallow land Agricultural area where no crop is present in field (as per satellite image).
12
Agriculture Class
Orchard/Agricultural Plantation
Fruit gardens/orchards/ plantations, Vineyards etc. mainly composing horticultural crops.
13 Built Up Land City Built up land consisting of dense urban area, mainly big
cities and townships.
14 Village Built up land consisting of smaller clutter of houses, villages and habitation.
15 Wetland Wetland Waterlogged areas with small or scanty vegetation.
16 Reservoir/ lake/Pond Water bodies consisting of big lakes, ponds natural or man made water bodies.
17 River/ Stream Water bodies consisting of perennial and seasonal rivers, major and minor streams.
18
Water Bodies
Other water Water bodies consisting of Canal.
19 Others Others of Other River, sand beds and open areas in cities etc. not categorised into above-mentioned classes.
5 Methodology and Analysis
5.1 Geo-referencing
The satellite images were geo-referenced with respect to topographical maps in order to make them compatible to the ground coordinates in geographic projection system

For Official Use Only Special Assistance for Project Formation (SAPROF) for
Uttar Pradesh Natural Resources Management and Poverty Alleviation Project (UPNRMPAP)
Final Report - Volume II
Annex 11-3
(latitude/longitude). The images were then re-projected to Universal Transverse Mercator (UTM) Projection. The details of the projection system are given below:
5.2 Image Classification
- Satellite images are composed of pixels that capture reflectance of ground features denoted in terms of Digital Numbers (DN value), which represents the corresponding land feature or group of features within the area. Using image classification technique, the satellite data is converted into thematic information based on the user’s knowledge about the ground area and spectral reflectance.
- The geo-referenced satellite images were classified using supervised classification along with knowledge based classification inputs in ERDAS Imagine 9.1 software.
- Since multi-dated satellite images were used (varying between February to November over five years of time period); the differences in the reflectance of vegetation types during leaves off season was overcome by referring to the overlap areas representing vegetation condition in leaves on season.
- To create a seamless data close to reality, Normalized Difference Vegetation Index1 (NDVI) was utilized for differentiation of land use types, density based forest classification and for identifying a suitable threshold value based on the difference in vegetation reflectance between two seasons. The difference was applied to the vegetation areas of the respective image of leaves off-season.
- Edge matching for land use classes was performed on all individual scenes and the final layers were then mosaicked to derive a composite land use layer for the entire state of UP.
- No ground truths were conducted to validate the interpretation keys for land use/ land cover classification. Instead, verification through secondary data was conducted when such data were available.
5.3 GIS Database Creation
(1) Watershed Boundary
Watershed boundary layer was created by digitizing boundaries of basin, catchment, sub-catchment and watershed from the watershed atlas. Each digitized polygon was
1 NDVI is a ratio between two electromagnetic wavelengths (near infrared - red)/(near infrared + red).
Projection Spheroid Datum Zone Unit
UTM WGS 84 WGS 84 44N Meters
For Official Use Only Special Assistance for Project Formation (SAPROF) for
Uttar Pradesh Natural Resources Management and Poverty Alleviation Project (UPNRMPAP)
Final Report - Volume II
Annex 11-4
checked for dangle, pseudo nodes, sliver polygons, etc. In each digitized polygon, attributes were added according to naming convention given in the atlas.
(2) Forest Boundary
The legal forest boundaries were collected from the working plan circle office of UPFD for the entire state. The forest boundaries were manually drawn on tracing sheets, captured from maps of different scales. The tracing sheets were the scanned, geo-referenced and digitized in GIS environment. Digitization was carried out in AUTODESK MAP 2006 software and converted to shape file.
(3) Forest Division Boundary
The forest division boundary layer was created using data obtained from the working plan circle office of UPFD. The maps were on different scales and boundaries were drawn manually on tracing sheets. These tracing sheets were scanned and digitized to create polygon boundary file. Respective Forest division names were added to the attribute table of the boundary file.
5.4 GIS Analysis
After compilation of all the data layers, area analysis was performed in GIS environment. Distribution of area under different land use/ land cover classes as per different administrative boundaries was calculated using in-built functionalities of GIS and image processing software. District, forest division and watershed wise land use statistics were generated for the entire state. This spatial analysis was carried out using ESRI ARCVIEW GIS software. The land use statistics were also derived for areas within legal forest boundaries and outside forest boundaries for respective forest division, district, and watershed.
6 Result
A list of outputs derived from the remote sensing analysis is provided in Attachment A11.6-1.
The total geographical area of UP derived from GIS database using available boundary maps was 24.183 million ha. The summary of areas identified for each of land use/ land cover class is indicated in the following table.
Details of identified forest division-wise land use/ land cover area are described in
Attachment A11.6-2 for total area, Attachment A11.6-3 for forest area, and Attachment A11.6-4 for outside of forest area. Attachment A11.6-5 is state-wise land use/ land cover map based on identified areas.
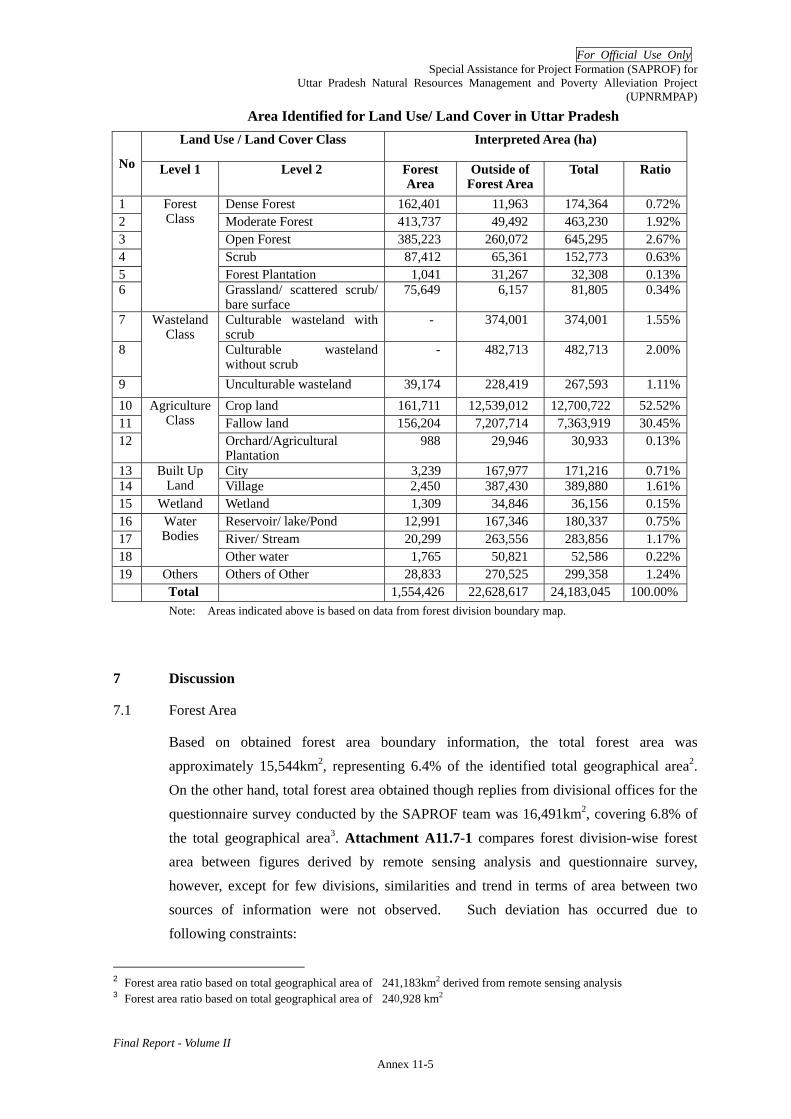
For Official Use Only Special Assistance for Project Formation (SAPROF) for
Uttar Pradesh Natural Resources Management and Poverty Alleviation Project (UPNRMPAP)
Final Report - Volume II
Annex 11-5
Area Identified for Land Use/ Land Cover in Uttar Pradesh Land Use / Land Cover Class
Interpreted Area (ha)
No Level 1 Level 2 Forest Area
Outside of Forest Area
Total Ratio
1 Dense Forest 162,401 11,963 174,364 0.72%2 Moderate Forest 413,737 49,492 463,230 1.92%3 Open Forest 385,223 260,072 645,295 2.67%4 Scrub 87,412 65,361 152,773 0.63%5 Forest Plantation 1,041 31,267 32,308 0.13%6
Forest Class
Grassland/ scattered scrub/ bare surface
75,649 6,157 81,805 0.34%
7 Culturable wasteland with scrub
- 374,001 374,001 1.55%
8 Culturable wasteland without scrub
- 482,713 482,713 2.00%
9
Wasteland Class
Unculturable wasteland 39,174 228,419 267,593 1.11%10 Crop land 161,711 12,539,012 12,700,722 52.52%11 Fallow land 156,204 7,207,714 7,363,919 30.45%12
Agriculture Class
Orchard/Agricultural Plantation
988 29,946 30,933 0.13%
13 City 3,239 167,977 171,216 0.71%14
Built Up Land Village 2,450 387,430 389,880 1.61%
15 Wetland Wetland 1,309 34,846 36,156 0.15%16 Reservoir/ lake/Pond 12,991 167,346 180,337 0.75%17 River/ Stream 20,299 263,556 283,856 1.17%18
Water Bodies
Other water 1,765 50,821 52,586 0.22%19 Others Others of Other 28,833 270,525 299,358 1.24% Total 1,554,426 22,628,617 24,183,045 100.00%
Note: Areas indicated above is based on data from forest division boundary map.
7 Discussion
7.1 Forest Area
Based on obtained forest area boundary information, the total forest area was approximately 15,544km2, representing 6.4% of the identified total geographical area2. On the other hand, total forest area obtained though replies from divisional offices for the questionnaire survey conducted by the SAPROF team was 16,491km2, covering 6.8% of
the total geographical area3. Attachment A11.7-1 compares forest division-wise forest area between figures derived by remote sensing analysis and questionnaire survey, however, except for few divisions, similarities and trend in terms of area between two sources of information were not observed. Such deviation has occurred due to following constraints:
2 Forest area ratio based on total geographical area of 241,183km2 derived from remote sensing analysis 3 Forest area ratio based on total geographical area of 240,928 km2
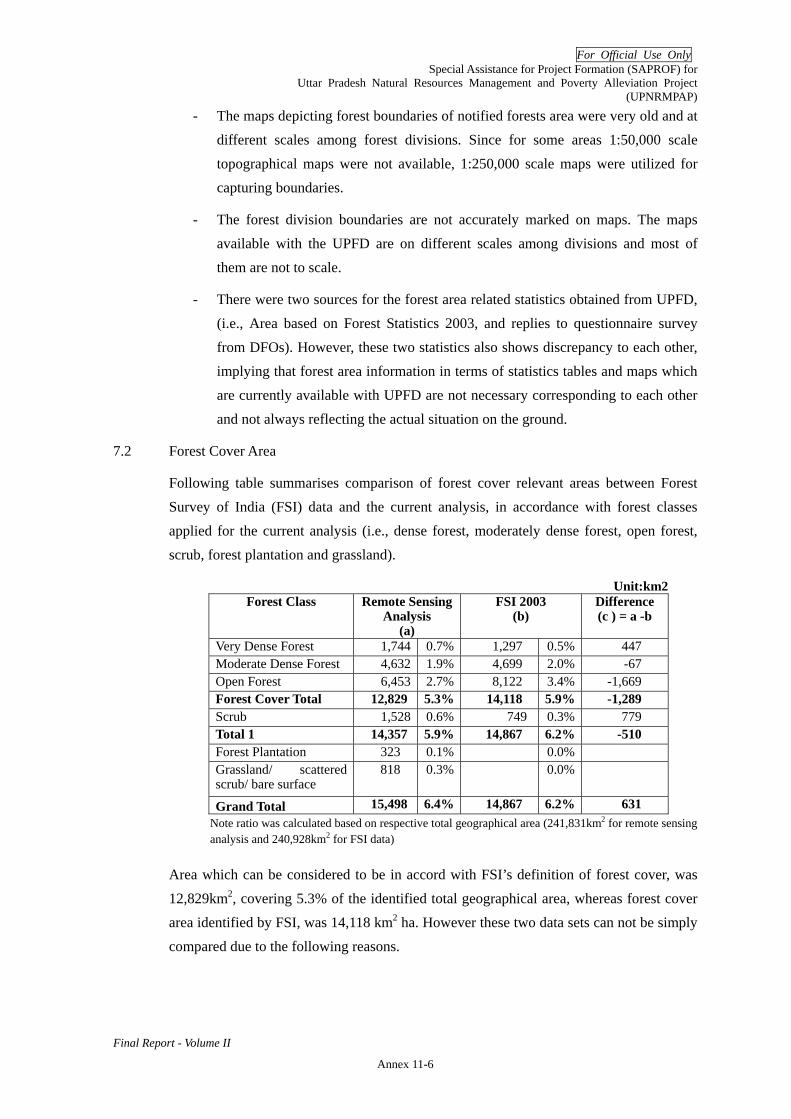
For Official Use Only Special Assistance for Project Formation (SAPROF) for
Uttar Pradesh Natural Resources Management and Poverty Alleviation Project (UPNRMPAP)
Final Report - Volume II
Annex 11-6
- The maps depicting forest boundaries of notified forests area were very old and at different scales among forest divisions. Since for some areas 1:50,000 scale topographical maps were not available, 1:250,000 scale maps were utilized for capturing boundaries.
- The forest division boundaries are not accurately marked on maps. The maps available with the UPFD are on different scales among divisions and most of them are not to scale.
- There were two sources for the forest area related statistics obtained from UPFD, (i.e., Area based on Forest Statistics 2003, and replies to questionnaire survey from DFOs). However, these two statistics also shows discrepancy to each other, implying that forest area information in terms of statistics tables and maps which are currently available with UPFD are not necessary corresponding to each other and not always reflecting the actual situation on the ground.
7.2 Forest Cover Area
Following table summarises comparison of forest cover relevant areas between Forest Survey of India (FSI) data and the current analysis, in accordance with forest classes applied for the current analysis (i.e., dense forest, moderately dense forest, open forest, scrub, forest plantation and grassland).
Unit:km2 Forest Class Remote Sensing
Analysis (a)
FSI 2003 (b)
Difference (c ) = a -b
Very Dense Forest 1,744 0.7% 1,297 0.5% 447 Moderate Dense Forest 4,632 1.9% 4,699 2.0% -67 Open Forest 6,453 2.7% 8,122 3.4% -1,669 Forest Cover Total 12,829 5.3% 14,118 5.9% -1,289 Scrub 1,528 0.6% 749 0.3% 779 Total 1 14,357 5.9% 14,867 6.2% -510 Forest Plantation 323 0.1% 0.0% Grassland/ scattered scrub/ bare surface
818 0.3% 0.0%
Grand Total 15,498 6.4% 14,867 6.2% 631 Note ratio was calculated based on respective total geographical area (241,831km2 for remote sensing analysis and 240,928km2 for FSI data)
Area which can be considered to be in accord with FSI’s definition of forest cover, was 12,829km2, covering 5.3% of the identified total geographical area, whereas forest cover area identified by FSI, was 14,118 km2 ha. However these two data sets can not be simply compared due to the following reasons.

For Official Use Only Special Assistance for Project Formation (SAPROF) for
Uttar Pradesh Natural Resources Management and Poverty Alleviation Project (UPNRMPAP)
Final Report - Volume II
Annex 11-7
- Two datasets (FSI and current analysis) use the same source of satellite images (IRS LISS III sensor). However, since there are differences in methods for analysis and no ground-truth was conducted for the current analysis, accuracy and precision of the satellite image interpretation were limited in the current analysis.
- The latest forest cover statistics of FSI was based on 2002 data, and the data created during SAPROF study was based on combination of satellite images of the vintage of year 2000 to 2006.
In spite of such constraints, following patterns can be implied descriptively.
- If areas identified for “scrub” and “forest plantation” are included as part of forest cover, two data sets somewhat comes to close figure of 14,357 km2 and 14,867km2, respectively, in terms of absolute value of areas at state level. However, there is no similarities and no significant trends can be observed at district level data.
- There seems to be similarities for proportions of very dense forest areas and moderately dense forest areas between two data sets.
7.3 Utilization for Project Area Selection
Due to above mentioned constraints in terms of data sources and methodologies applied, it was not fully possible to correlate the result with existing similar kinds of data/ information. Therefore, utilization of the interpretation results obtained from the current analysis was somewhat limited. However, the output served to identify distributions and locations of forest areas, at the state level, which provided base information upon consideration of the Project area selection during the SAPROF Study.
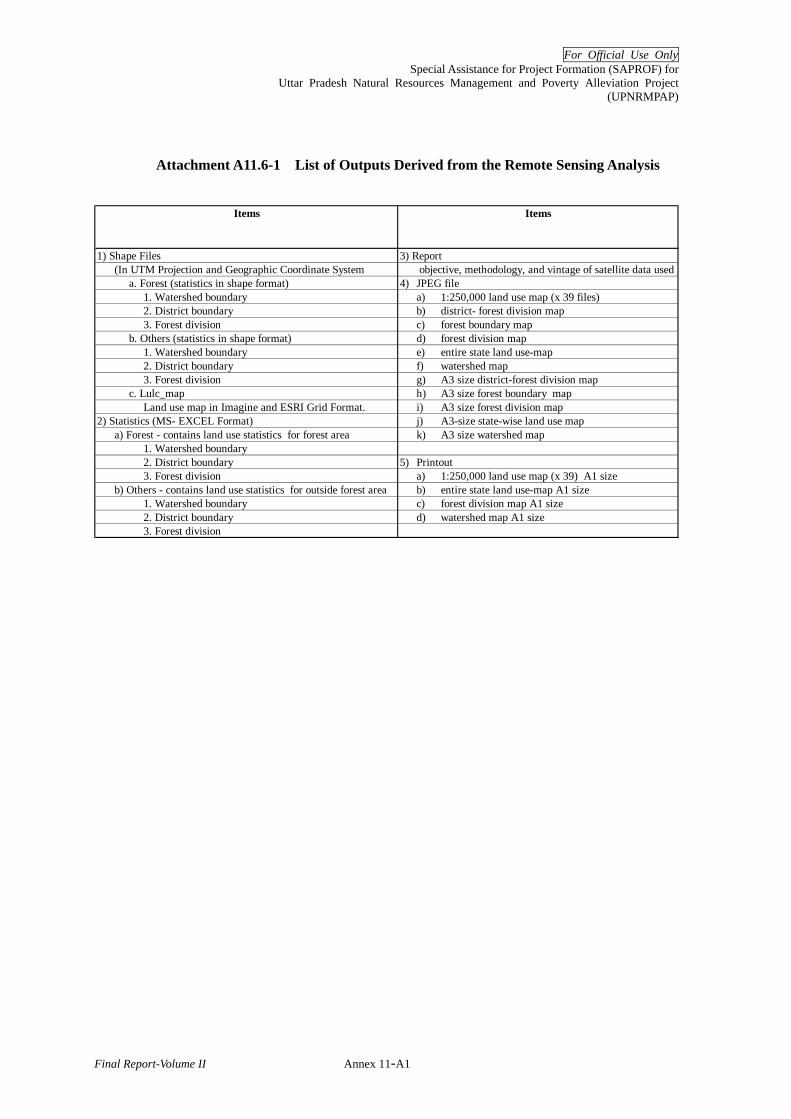
For Official Use Only Special Assistance for Project Formation (SAPROF) for
Uttar Pradesh Natural Resources Management and Poverty Alleviation Project (UPNRMPAP)
Final Report-Volume II Annex 11-A1
Attachment A11.6-1 List of Outputs Derived from the Remote Sensing Analysis
1) Shape Files 3) Report(In UTM Projection and Geographic Coordinate System objective, methodology, and vintage of satellite data used
a. Forest (statistics in shape format) 4) JPEG file1. Watershed boundary a) 1:250,000 land use map (x 39 files) 2. District boundary b) district- forest division map3. Forest division c) forest boundary map
b. Others (statistics in shape format) d) forest division map1. Watershed boundary e) entire state land use-map2. District boundary f) watershed map3. Forest division g) A3 size district-forest division map
c. Lulc_map h) A3 size forest boundary map Land use map in Imagine and ESRI Grid Format. i) A3 size forest division map
2) Statistics (MS- EXCEL Format) j) A3-size state-wise land use map a) Forest - contains land use statistics for forest area k) A3 size watershed map
1. Watershed boundary 2. District boundary 5) Printout3. Forest division a) 1:250,000 land use map (x 39) A1 size
b) Others - contains land use statistics for outside forest area b) entire state land use-map A1 size1. Watershed boundary c) forest division map A1 size2. District boundary d) watershed map A1 size3. Forest division
Items Items

For Official U
se Only
Special Assistance for Project Form
ation (SAPR
OF) for
Uttar Pradesh N
atural Resources M
anagement and Poverty A
lleviation Project(U
PNR
MPA
P)
Final Report-Volume II
Annex 11-A
2
LAND USE Total unit: ha
City Village Cropland Fallow land Orchard Dense forest Moderatedense Open forest Scrub Forest
plannation Grassland Culturablew/ scrub
Culturablew/o scrub Un-culturable Wetland Resevoir River Canal Others of
other Total - Outside
Forest
Agra 427,727 6,348 4,053 141,084 221,646 - 2 168 28,063 4,524 1,933 1 6,368 6 6,716 - 1,131 5,402 277 - 427,722 Aligarh 360,358 3,077 5,961 260,440 66,986 - - - 208 3,703 295 5 1,546 13,275 - 306 1,361 1,595 1,519 84 360,360 Etah 442,055 1,287 8,119 292,558 90,892 596 522 279 1,500 599 4,266 130 13,287 15,540 37 626 2,569 3,059 2,379 3,812 442,054 Ferozabad 234,028 1,944 1,715 93,606 99,677 - 91 199 5,995 52 - - 878 12,515 12,715 - 1,494 2,083 1,065 - 234,028 Mahamayanagar 184,609 801 3,883 101,624 74,964 - - - 2,426 - - - - 2 - - 330 281 300 - 184,610 Mainpuri 254,986 851 4,164 134,045 84,584 34 14 9 45 1,883 - 210 8,599 16,670 - 432 405 1,268 1,773 - 254,986 Mathura 352,839 1,896 4,731 217,020 103,058 - 1 - - 665 1,146 61 51 11,737 526 209 2,000 4,116 1,823 3,799 352,836 Allahabad 516,352 1,681 11,100 230,964 199,953 3,093 - 1,217 5,438 5,013 - 7,628 6,117 23,078 2,125 1,168 3,598 7,162 774 6,235 516,344 Fatehpur 411,957 1,190 6,437 230,183 121,482 2 3 352 50 2,674 - - 3,268 9,758 22,672 80 467 3,901 1,044 8,393 411,958 Kaushambi 211,071 5,280 4,599 99,519 83,422 512 - 28 164 124 1,941 - 3,656 426 29 330 165 4,418 - 6,468 211,081 Pratapgarh 368,203 941 7,336 177,692 155,349 11 - - 7,361 9 - - 2,873 1 4,266 2,676 2,271 3,408 709 3,299 368,201 Azamgarh 385,385 1,546 9,136 203,514 148,712 - 2 - 2,258 1,812 - - 4,693 - 1 461 3,137 4,265 187 5,660 385,385 Ballia 309,221 2,237 6,532 199,235 62,535 - - - 324 2,013 - - 17,511 1 184 183 2,426 6,690 10 9,340 309,221 Mau 196,768 2,542 5,286 122,917 48,995 - 3 - 465 378 202 - 6,830 - 547 200 3,113 1,714 - 3,576 196,767 Badaun 515,443 928 7,963 345,679 130,043 1 6 - 1,894 2,569 - - 10,794 2,728 - 449 681 5,853 - 5,860 515,448 Bareilly 413,473 4,101 8,054 248,741 136,915 - - 168 2,496 1,430 73 - 2 5,111 - 390 853 4,631 508 - 413,474 Pilibhit 78,856 - 4 9,678 2,424 - 35,151 9,957 15,109 1,892 - 1,421 0 - - 3 491 1,860 864 0 78,854 Pilibhit SF 278,329 987 3,827 188,308 54,634 - 2,224 989 5,816 85 - 18 11,046 2,105 - 172 2,904 3,570 1,648 - 278,332 Shahjahanpur 459,776 1,499 6,784 261,478 165,820 - 5,176 315 4,869 29 - 9 330 4,893 - 33 738 6,020 1,783 0 459,774 Ambedkarnagar 224,300 895 4,107 126,713 75,107 - 2 - 2,625 1,312 6 - 4,444 0 0 450 2,060 5,384 325 869 224,300 Barabanki 441,747 1,835 7,407 289,052 101,082 - 6 - 3,906 32 2,369 5 11,120 7,425 755 395 752 5,098 2,214 8,292 441,745 Faizabad 225,406 1,925 3,755 147,245 46,770 - - - 5,885 106 - 2 2,079 1,324 110 7 2,451 4,973 583 8,192 225,406 Sultanpur 442,969 1,266 9,334 246,947 158,625 - 6 - 3,822 7,551 - 0 1,774 3,073 345 318 2,339 2,587 1,212 3,771 442,971 Baharaich 407,944 1,424 8,035 268,863 57,399 - 16 10,557 8,997 19 - 3,597 1,750 16,756 52 900 1,005 6,480 950 21,142 407,940 Gonda 672,401 1,820 7,569 423,390 190,093 - 2,926 3,269 20,177 289 63 8 6,462 1,770 - 3,429 3,371 5,729 288 1,752 672,404 Saravasti 213,685 184 2,891 113,514 68,254 - 9,702 1,440 7,245 43 - 1 2,569 2,489 - 510 378 2,829 560 1,079 213,688 Basti 381,380 1,148 6,074 218,074 120,129 853 4 211 2,706 453 - - 4,446 1,410 29 5,656 4,359 9,139 451 6,237 381,379 Deoria 257,797 1,977 6,407 184,440 44,213 - 4 - 119 1,704 - - 2,455 11,617 111 323 565 2,140 - 1,722 257,797 Gorakhpur 314,486 6,731 9,730 190,467 58,161 - - 6,406 2,625 108 - 0 2,289 11,326 - 1,496 4,326 5,054 11 15,759 314,488 Padrauna 274,347 960 6,409 198,795 44,118 - 3 45 2,235 785 - - 6,064 2 - 280 1,122 4,262 1,067 8,197 274,345 Siddharthnagar 355,310 370 4,648 200,150 120,070 - 3 155 3,861 9 - 3 3,769 11,114 - 1,353 4,453 4,619 348 385 355,308 Banda 457,886 1,217 4,482 105,087 261,062 2 2 6,275 1 35 - 383 3,818 10,063 53,689 501 965 5,131 41 5,130 457,883 Chitrakoot 269,659 619 3,325 108,775 86,671 84 - 16,887 11,466 15 - 3,443 77 11,682 17,272 28 2,739 3,993 379 2,198 269,653 Hamirpur 470,217 930 3,240 181,101 238,308 - - 6,829 11,543 801 82 73 15,438 12 3,956 36 3,367 4,215 225 67 470,223 Jhansi 504,044 4,461 4,082 225,431 130,844 - - 10,331 16,386 4,457 - 609 48,104 23,545 22,336 - 6,866 5,686 797 105 504,038 Lalitpur 497,378 869 2,744 179,127 169,511 - - 6,914 49,298 6,258 - 1,116 14,857 14,259 31,008 - 18,281 3,135 - - 497,377 Mahoba 238,656 670 1,730 109,248 96,124 - - 3,632 7,606 244 - 123 6,288 3,986 1,670 - 6,535 720 74 - 238,651 Orai 463,073 1,461 3,698 165,633 213,947 - - 3,857 24,989 442 305 881 14 23,395 16,656 207 612 5,635 1,308 31 463,072 Etawah 429,059 2,643 2,887 161,656 152,405 - - - 28,217 569 213 6,949 11,354 33,680 20,527 182 1,296 4,254 1,752 473 429,057 Farrukhabad 421,676 1,904 6,988 244,429 96,859 0 - - 5,538 834 - - 30,474 19,763 3,956 367 424 3,783 433 5,924 421,677 Kanpur Rural 319,649 461 1,819 141,295 121,923 - - 45 7,390 827 - 5 21,978 18,466 2,194 - 806 1,944 481 15 319,650 Kanpur Urban 296,846 11,277 3,114 113,201 146,999 - - 58 1,000 - 419 0 4,439 5,750 1,556 40 355 4,155 395 4,089 296,845 Awadh/Lucknow 253,991 14,551 4,643 135,835 71,570 16,691 1,187 - 3,172 273 535 - 2,032 - - 711 364 1,480 950 - 253,993 Hardoi 592,239 1,201 6,477 290,609 258,395 1,459 0 - 4,000 6,406 91 - 139 2,775 12,709 1,299 688 4,401 1,544 50 592,241 North Kheri 265,724 763 4,099 124,375 58,936 - 1,559 4,126 22,005 - - 4,067 114 5,122 8,378 1,170 1,291 7,778 409 21,530 265,723 Rae bareilly 453,970 3,123 8,430 274,031 132,422 331 105 90 4,226 1,476 1,551 63 4,248 11,570 288 1,857 1,245 2,957 1,443 4,512 453,967 Sitapur 572,971 2,552 11,301 371,527 153,040 4,154 161 29 5,482 1,758 361 - 1,138 5,845 520 243 1,191 4,287 2,177 7,206 572,970 South Kheri 413,675 1,790 5,893 240,628 107,744 1 20,045 154 12,404 91 - 34 56 3,686 9,748 23 1,152 3,193 1,247 5,788 413,678 Varanasi 143,262 5,849 3,904 50,430 77,851 - 2 81 1,269 - - - 370 311 1,052 214 253 1,677 - - 143,262 Bulandshahr 347,275 1,834 7,863 251,794 50,717 - - 559 5,932 529 7,626 243 3,435 10,778 - 259 928 1,951 2,028 795 347,270 Gautam Buddha Nagar 120,514 7,728 2,485 65,981 33,513 - - 440 - 1,157 347 - - 6,351 - 44 529 1,467 471 - 120,512 Ghaziabad 254,537 12,127 5,635 160,044 52,988 705 - 3 2,523 392 1,008 - 4,303 5 - 78 698 1,668 1,633 10,728 254,536 Meerut 365,248 7,587 9,911 238,803 82,873 56 - 299 641 2,444 2,457 49 7,332 538 - - 1,093 6,587 1,607 2,967 365,245 Bijnore Social Forestry 426,864 1,361 6,831 342,258 33,093 - 0 14,302 2,176 301 295 3 3,871 4,896 1,344 44 2,394 6,415 1,465 5,816 426,863 Jyotebaphulenagar 260,440 962 5,535 183,933 46,312 154 102 7 274 6,684 - 41 3,755 3,437 - 31 346 5,422 193 3,256 260,443 Moradabad 332,551 2,897 8,058 245,833 53,351 - 87 8 61 444 - - - 16,130 - 341 814 2,736 - 1,788 332,548 Nazibabad 52,287 - 24 7,396 666 - - 25,232 15,307 408 - 41 - 235 - - 2 1,390 195 1,392 52,287 Rampur 241,101 677 3,965 177,320 42,641 - 121 127 4,399 1,223 423 30 - 5,524 - 607 446 3,595 - - 241,100 Muzzafarnagar 436,116 3,292 11,774 302,382 82,399 - 19 231 1 1,730 1,608 1 13,054 3,423 865 25 1,280 6,910 1,182 5,941 436,117 Saharanpur 320,876 2,658 8,453 252,197 50,236 - 5 95 15 - 10 9 - - - - 472 3,971 1,037 1,714 320,872 Shevalik 56,792 9 540 17,029 6,389 - 8,084 14,683 5,304 611 861 246 - - - - 5 805 73 2,155 56,792 Bhadohi 99,879 749 955 74,654 17,273 - 0 59 105 - - - 73 2,601 3 688 662 1,190 - 866 99,877 Ghazipur 334,802 1,699 7,125 156,305 142,644 - 4 - 560 2,507 - - 9,552 1,688 665 837 529 5,457 117 5,112 334,801 Jaunpur 407,671 1,338 10,294 165,285 211,632 - 1 3 4,620 - - - 152 3 1 532 1,550 2,934 118 9,211 407,672 Mirzapur 395,918 1,233 5,378 122,108 147,084 7 0 21,625 28,340 6,679 - 18,410 5,743 12,876 3,117 553 11,105 8,800 257 2,601 395,918 Obra 166,525 1,107 365 16,522 32,299 - 41 40,974 40,660 9,284 - 10,386 1,541 2,117 913 80 411 4,188 0 5,640 166,526 Rainukot 283,697 2,036 664 29,158 53,545 - 78 103,235 18,109 2,836 - 2,231 1,239 1,422 113 142 35,900 2,152 1 30,834 283,695 Sonbhadra 138,991 365 1,010 16,662 41,611 - 62 4,945 32,838 24,102 - 8,420 1,541 4,555 - 83 2,044 500 257 1 138,997 Unnao 463,596 2,107 9,569 237,236 188,568 2,160 10 4 72 6,420 1,824 - 2,489 155 137 1,087 689 3,512 1,656 5,901 463,595 Sub-Total 23,182,863 167,775 375,337 12,451,252 7,080,558 30,906 87,541 321,897 526,610 134,102 32,308 70,955 370,084 456,797 265,888 35,140 167,641 269,664 50,614 287,759 23,182,827 Dudhwa WLD 88,002 1 216 6,197 5,995 - 39,013 21,349 11,501 1 - 1,907 - - 170 14 49 992 22 575 88,000 Katarniaghat WLD 51,560 32 137 6,429 2,970 - - 11,165 26,877 0 - 327 - - - 10 973 2,082 113 448 51,562 Kaimur WLD 209,369 83 1,000 37,042 60,412 27 55 44,594 32,533 2,864 - 5,744 1,006 13,543 1,309 97 2,172 2,872 29 3,992 209,374 Kashi WLD 253,316 2,367 3,998 68,814 94,364 - 427 26,093 25,562 13,838 - 2,821 887 2,049 227 385 3,813 4,324 450 2,894 253,315 Sohagibarwa WLD 329,102 959 9,148 128,279 116,566 - 80 24,517 22,212 1,960 - 48 2,024 10,323 - 510 4,683 3,265 1,359 3,172 329,105 Sohelwa WLD 68,868 - 45 2,711 3,053 - 47,249 13,614 - 7 - 3 - - - - 1,005 657 - 518 68,862 Sub-Total 1,000,218 3,441 14,543 249,471 283,361 27 86,823 141,332 118,685 18,671 - 10,850 3,917 25,915 1,705 1,016 12,696 14,192 1,972 11,600 1,000,216
24,183,080 171,216 389,880 12,700,722 7,363,919 30,933 174,364 463,230 645,295 152,773 32,308 81,805 374,001 482,713 267,593 36,156 180,337 283,856 52,586 299,358 24,183,043
Gonda WL
Grand Total
Saharanpur
Varanasi
Dudhwa NP
Lucknow WL
Kanpur
Lucknow
Meerut
Moradabad
Faizabad
Gonda
Gorakhpur
Jhansi
Agra
Allahabad
Azamgarh
Bareilly
Division Circle GeographicalArea
Builtup Land Agriculture Forest Classes Wasteland Water bodies
Attachment A11.6-2 Land Use/ Land Cover Classification of UP (Total Area)

For Official U
se Only
Special Assistance for Project Form
ation (SAPR
OF) for
Uttar Pradesh N
atural Resources M
anagement and Poverty A
lleviation Project(U
PNR
MPA
P)
Final Report-Volume II
Annex 11-A
3
LAND USE: Inside Forest Area unit: ha
City Village Cropland Fallowland Orchard DenseForest
Moderatedense forest Open forest Scrub Forest
Plantation
Grassland/scattered scrub/
Bare surface
Culturable w/scrub
Culturablew/o scrub
Un-culturable Reservoir River Canal
Agra 10 1 1,168 1,209 - 1 - 15,607 4,524 2 1 - - 892 - 173 202 - - 23,791 Aligarh - - 80 5 - - - - 0 - 5 - - - - - 0 - 2 92 Etah - - 77 106 - - - 6 1 - - - - - - 15 0 - 2 208 Ferozabad 2 1 1,142 707 - - - 2,822 52 - - - - 3,761 - 5 124 - - 8,616 Mahamayanagar - - 11 5 - - - 87 - - - - - - - - - - - 103 Mainpuri - 6 46 35 - - - - 275 - 210 - - - 70 0 - - - 642 Mathura - - 150 254 - 0 - - 317 23 61 - - 16 - 3 36 10 1 872 Allahabad 3 45 973 378 12 - 7 467 1,915 - 7,628 - - 27 40 31 - 14 - 11,541 Fatehpur - - 9 4 - - 12 - 270 - - - - - - - 3 - 2 299 Kaushambi - - - - - - - - - - - - - - - - - - - - Pratapgarh - - 8 6 - - - 61 9 - - - - - - 1 - - 1 85 Azamgarh - - - - - - - - - - - - - - - - - - - - Ballia - - - - - - - - - - - - - - - - - - - - Mau - - - - - - - - - - - - - - - - - - - - Badaun - 8 2,350 897 - - - - 1,852 - - - - - - 3 182 - 566 5,858 Bareilly - - - - - - - - - - - - - - - - - - - - Pilibhit - 4 9,677 2,424 - 35,151 9,957 15,109 1,892 - 1,421 - - - 3 491 1,860 864 0 78,852 Pilibhit SF - 0 893 216 - 187 59 1,752 21 - 18 - - - 0 21 27 8 - 3,201 Shahjahanpur 0 4 2,472 576 - 3,805 18 2,188 0 - 9 - - - - 6 - 65 - 9,144 Ambedkarnagar - - - - - - - - - - - - - - - - - - - - Barabanki - 8 491 348 - - - 753 23 - 4 - - 46 - 0 17 7 2 1,699 Faizabad - - 104 31 - - - 397 - - 2 - - - - - 0 - 1 535 Sultanpur - - 170 118 - - - 691 118 - 0 - - 0 - - 37 - 2 1,137 Baharaich 1 26 1,319 858 - 6 9,721 1,611 19 - 116 - - - 0 1 56 11 84 13,830 Gonda 1 16 4,817 1,560 - 53 59 14,025 140 - 8 - - - 9 62 246 34 3 21,033 Saravasti - 7 717 1,114 - 9,538 599 4,031 43 - 1 - - - - - 34 - 0 16,084 Basti 3 5 1,807 896 416 0 - 785 17 - - - - - 18 32 253 - - 4,233 Deoria - - - - - - - - - - - - - - - - - - - - Gorakhpur 84 50 365 170 - - 5,695 307 - - 0 - - - - 6 6 - 159 6,841 Padrauna - - 1 3 - - - 2 1 - - - - - - 3 1 - 7 18 Siddharthnagar - 3 2,155 980 - - - 106 9 - 3 - - - 5 15 183 - - 3,459 Banda - 13 493 2,675 - - 1,670 - 35 - 380 - - 1,133 - 3 36 - 4 6,442 Chitrakoot 4 91 5,769 4,640 8 - 15,296 6,489 14 - 3,442 - - 11,610 - 271 55 7 - 47,696 Hamirpur - 28 7,547 4,940 - - 5,227 5,561 801 72 73 - - 85 - 68 172 11 28 24,613 Jhansi - 53 2,009 414 - - 4,894 3,112 3,047 - 609 - - 960 - 35 432 19 5 15,588 Lalitpur - 48 3,010 1,289 - - 5,036 29,538 6,258 - 1,116 - - 4,098 - 265 191 - - 50,847 Mahoba 7 20 2,675 503 - - 1,752 2,750 244 - 123 - - 321 - 88 - - - 8,482 Orai - 8 2,082 1,126 - - 2,965 8,475 13 - 881 - - 1,638 - 1 82 - - 17,271 Etawah 10 44 5,351 2,863 - - - 11,534 568 - 6,949 - - 11,593 2 16 1,897 - 7 40,833 Farrukhabad - - 16 2 - - - 145 - - - - - - - - - - - 163 Kanpur Rural - - 9 92 - - 2 195 176 - 5 - - 0 - - - - - 479 Kanpur Urban 9 - 15 3 - - - 48 - - 0 - - - - 2 - - - 76 Awadh/Lucknow 512 300 9,399 4,913 544 627 - 824 38 - - - - - 62 26 15 38 - 17,296 Hardoi - - 74 42 - - - 205 - - - - - - - - - 0 - 321 North Kheri 72 43 7,686 2,875 - 326 1,663 12,284 - - 1,610 - - 528 404 322 1,748 30 2,446 32,037 Rae bareilly - - 0 0 - - - - - - - - - - - - - - - 1 Sitapur - 9 338 338 - - - 563 17 - - - - - - - 29 - - 1,294 South Kheri 1 18 5,087 2,853 - 17,796 - 6,527 42 - 34 - - 88 1 40 95 187 14 32,782 Varanasi - - - - - - - - - - - - - - - - - - - - Bulandshahr - 1 621 161 - - - 141 243 99 240 - - - - 1 4 13 6 1,531 Gautam Buddha Nagar - - - - - - - - - - - - - - - - - - - - Ghaziabad - - - - - - - - - - - - - - - - - - - - Meerut - 1 408 350 - - 6 393 497 - 49 - - - - - 186 - 77 1,966 Bijnore Social Forestry - 9 2,016 188 - - 12,057 1,496 153 - 3 - - 247 - 41 192 1 562 16,966 Jyotebaphulenagar - - 756 428 - - - - 3,050 - 41 - - - - - 505 - 295 5,076 Moradabad - - - - - - - - - - - - - - - - - - - - Nazibabad - 13 4,928 580 - - 21,880 12,309 408 - 34 - - - - 2 1,058 143 1,098 42,452 Rampur 0 3 585 38 - - 1 3,862 - 10 30 - - - - - - - - 4,529 Muzzafarnagar - 2 345 59 - - - - - - 1 - - 1 - - 2 - 0 410 Saharanpur - 4 97 16 - - 0 1 - - - - - - - 4 2 0 2 125 Shevalik - 38 2,432 1,392 - 8,068 14,584 5,228 611 835 245 - - - - - 515 22 687 34,658 Bhadohi - - - - - - - - - - - - - - - - - - - - Ghazipur - - - - - - - - - - - - - - - - - - - - Jaunpur - - - - - - - - - - - - - - - - - - - - Mirzapur 4 54 7,357 17,294 7 0 19,435 23,085 6,678 - 18,410 - - - 334 741 442 - - 93,843 Obra 651 236 13,149 25,829 - 37 40,938 39,971 9,284 - 10,386 - - 901 66 324 1,986 0 3,346 147,104 Rainukot 1,826 295 14,539 28,624 - 48 98,249 16,941 2,836 - 2,231 - - 99 64 2,847 1,613 0 17,013 187,223 Sonbhadra 5 108 1,427 3,445 - 57 4,846 31,563 24,020 - 8,420 - - - 40 508 254 8 - 74,700 Unnao - 0 58 8 - - - - - - - - - - - - 1 - - 67 Sub-Total 3,204 1,621 131,278 120,884 986 75,700 276,629 284,045 70,531 1,041 64,800 - - 38,045 1,116 6,472 14,779 1,490 26,420 1,119,040 Dudhwa WLD 1 216 6,196 5,995 - 39,007 21,344 11,499 1 - 1,905 - - 170 14 49 992 22 575 87,985 Katarniaghat WLD 32 137 6,412 2,966 - - 11,165 26,849 - - 327 - - - 10 973 2,081 113 447 51,510 Kaimur WLD 3 139 7,989 15,222 1 21 43,516 22,084 2,864 - 5,744 - - 886 18 1,093 807 - 12 100,398 Kashi WLD - 53 3,168 5,398 - 426 25,572 25,013 13,737 - 2,821 - - 74 27 2,840 427 32 28 79,616 Sohagibarwa WLD - 239 3,957 2,688 - - 21,900 15,733 273 - 48 - - - 125 559 556 108 833 47,018 Sohelwa WLD - 45 2,711 3,052 - 47,247 13,613 - 7 - 3 - - - - 1,005 657 - 518 68,858 Sub-Total 35 829 30,433 35,321 1 86,702 137,109 101,178 16,881 - 10,849 - - 1,129 193 6,519 5,520 275 2,413 435,386
3,239 2,450 161,711 156,204 988 162,401 413,737 385,223 87,412 1,041 75,649 - - 39,174 1,309 12,991 20,299 1,765 28,833 1,554,426 Grand Total
Dudhwa NP
Lucknow WL
Gonda WL
Saharanpur
Varanasi
Division Circle
Kanpur
Lucknow
Meerut
Moradabad
Faizabad
Gonda
Gorakhpur
Jhansi
Agra
Allahabad
Azamgarh
Bareilly
Forest ClassesBuiltup Land Agriculture Wasteland Water bodies
Wetland Others ofother
Total InsideForest
Attachment A11.6-3 Land Use/ Land Cover Classification of UP (Forest Area)
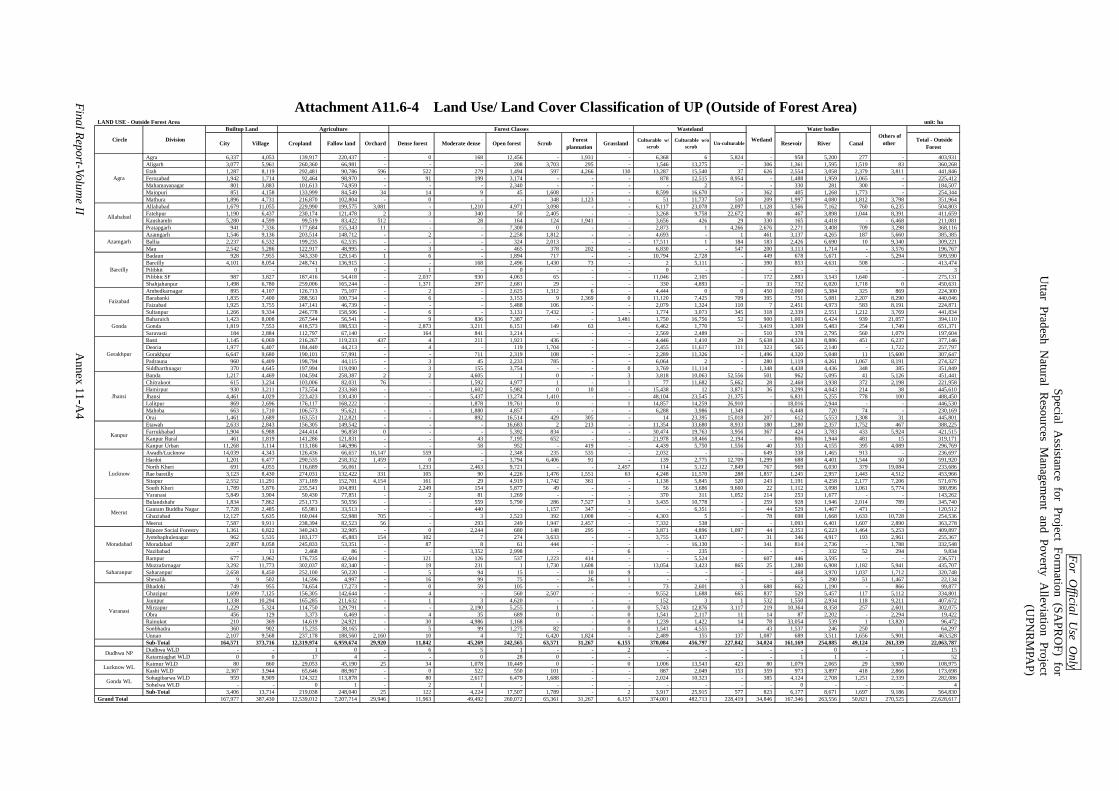
For Official U
se Only
Special Assistance for Project Form
ation (SAPR
OF) for
Uttar Pradesh N
atural Resources M
anagement and Poverty A
lleviation Project(U
PNR
MPA
P)
Final Report-Volume II
Annex 11-A
4
LAND USE - Outside Forest Area unit: ha
City Village Cropland Fallow land Orchard Dense forest Moderate dense Open forest Scrub Forestplannation Grassland Culturable w/
scrub Culturable w/o
scrub Un-culturable Resevoir River Canal Total - Outside
Forest
Agra 6,337 4,053 139,917 220,437 - 0 168 12,456 - 1,931 - 6,368 6 5,824 - 958 5,200 277 - 403,931 Aligarh 3,077 5,961 260,360 66,981 - - - 208 3,703 295 - 1,546 13,275 - 306 1,361 1,595 1,519 83 360,268 Etah 1,287 8,119 292,481 90,786 596 522 279 1,494 597 4,266 130 13,287 15,540 37 626 2,554 3,058 2,379 3,811 441,846 Ferozabad 1,942 1,714 92,464 98,970 - 91 199 3,174 - - - 878 12,515 8,954 - 1,488 1,959 1,065 - 225,412 Mahamayanagar 801 3,883 101,613 74,959 - - - 2,340 - - - - 2 - - 330 281 300 - 184,507 Mainpuri 851 4,158 133,999 84,549 34 14 9 45 1,608 - - 8,599 16,670 - 362 405 1,268 1,773 - 254,344 Mathura 1,896 4,731 216,870 102,804 - 0 - - 348 1,123 - 51 11,737 510 209 1,997 4,080 1,812 3,798 351,964 Allahabad 1,679 11,055 229,990 199,575 3,081 - 1,210 4,971 3,098 - - 6,117 23,078 2,097 1,128 3,566 7,162 760 6,235 504,803 Fatehpur 1,190 6,437 230,174 121,478 2 3 340 50 2,405 - - 3,268 9,758 22,672 80 467 3,898 1,044 8,391 411,659 Kaushambi 5,280 4,599 99,519 83,422 512 - 28 164 124 1,941 - 3,656 426 29 330 165 4,418 - 6,468 211,081 Pratapgarh 941 7,336 177,684 155,343 11 - - 7,300 0 - - 2,873 1 4,266 2,676 2,271 3,408 709 3,298 368,116 Azamgarh 1,546 9,136 203,514 148,712 - 2 - 2,258 1,812 - - 4,693 - 1 461 3,137 4,265 187 5,660 385,385 Ballia 2,237 6,532 199,235 62,535 - - - 324 2,013 - - 17,511 1 184 183 2,426 6,690 10 9,340 309,221 Mau 2,542 5,286 122,917 48,995 - 3 - 465 378 202 - 6,830 - 547 200 3,113 1,714 - 3,576 196,767 Badaun 928 7,955 343,330 129,145 1 6 - 1,894 717 - - 10,794 2,728 - 449 678 5,671 - 5,294 509,590 Bareilly 4,101 8,054 248,741 136,915 - - 168 2,496 1,430 73 - 2 5,111 - 390 853 4,631 508 - 413,474 Pilibhit - - 1 0 - 1 - 0 - - - 0 - - - - - - - 3 Pilibhit SF 987 3,827 187,416 54,418 - 2,037 930 4,063 65 - - 11,046 2,105 - 172 2,883 3,543 1,640 - 275,131 Shahjahanpur 1,498 6,780 259,006 165,244 - 1,371 297 2,681 29 - - 330 4,893 - 33 732 6,020 1,718 0 450,631 Ambedkarnagar 895 4,107 126,713 75,107 - 2 - 2,625 1,312 6 - 4,444 0 0 450 2,060 5,384 325 869 224,300 Barabanki 1,835 7,400 288,561 100,734 - 6 - 3,153 9 2,369 0 11,120 7,425 709 395 751 5,081 2,207 8,290 440,046 Faizabad 1,925 3,755 147,141 46,739 - - - 5,488 106 - - 2,079 1,324 110 7 2,451 4,973 583 8,191 224,871 Sultanpur 1,266 9,334 246,778 158,506 - 6 - 3,131 7,432 - - 1,774 3,073 345 318 2,339 2,551 1,212 3,769 441,834 Baharaich 1,423 8,008 267,544 56,541 - 9 836 7,387 - - 3,481 1,750 16,756 52 900 1,003 6,424 939 21,057 394,110 Gonda 1,819 7,553 418,573 188,533 - 2,873 3,211 6,151 149 63 - 6,462 1,770 - 3,419 3,309 5,483 254 1,749 651,371 Saravasti 184 2,884 112,797 67,140 - 164 841 3,214 - - - 2,569 2,489 - 510 378 2,795 560 1,079 197,604 Basti 1,145 6,069 216,267 119,233 437 4 211 1,921 436 - - 4,446 1,410 29 5,638 4,328 8,886 451 6,237 377,146 Deoria 1,977 6,407 184,440 44,213 - 4 - 119 1,704 - - 2,455 11,617 111 323 565 2,140 - 1,722 257,797 Gorakhpur 6,647 9,680 190,101 57,991 - - 711 2,319 108 - - 2,289 11,326 - 1,496 4,320 5,048 11 15,600 307,647 Padrauna 960 6,409 198,794 44,115 - 3 45 2,233 785 - - 6,064 2 - 280 1,119 4,261 1,067 8,191 274,327 Siddharthnagar 370 4,645 197,994 119,090 - 3 155 3,754 - - 0 3,769 11,114 - 1,348 4,438 4,436 348 385 351,849 Banda 1,217 4,469 104,594 258,387 2 2 4,605 1 0 - 3 3,818 10,063 52,556 501 962 5,095 41 5,126 451,441 Chitrakoot 615 3,234 103,006 82,031 76 - 1,592 4,977 1 - 1 77 11,682 5,662 28 2,468 3,938 372 2,198 221,958 Hamirpur 930 3,211 173,554 233,368 - - 1,602 5,982 0 10 - 15,438 12 3,871 36 3,299 4,043 214 38 445,610 Jhansi 4,461 4,029 223,423 130,430 - - 5,437 13,274 1,410 - - 48,104 23,545 21,375 - 6,831 5,255 778 100 488,450 Lalitpur 869 2,696 176,117 168,222 - - 1,878 19,761 0 - 1 14,857 14,259 26,910 - 18,016 2,944 - - 446,530 Mahoba 663 1,710 106,573 95,621 - - 1,880 4,857 - - - 6,288 3,986 1,349 - 6,448 720 74 - 230,169 Orai 1,461 3,689 163,551 212,821 - - 892 16,514 429 305 - 14 23,395 15,018 207 612 5,553 1,308 31 445,801 Etawah 2,633 2,843 156,305 149,542 - - - 16,683 2 213 - 11,354 33,680 8,933 180 1,280 2,357 1,752 467 388,225 Farrukhabad 1,904 6,988 244,414 96,858 0 - - 5,392 834 - - 30,474 19,763 3,956 367 424 3,783 433 5,924 421,515 Kanpur Rural 461 1,819 141,286 121,831 - - 43 7,195 652 - - 21,978 18,466 2,194 - 806 1,944 481 15 319,171 Kanpur Urban 11,268 3,114 113,186 146,996 - - 58 952 - 419 - 4,439 5,750 1,556 40 353 4,155 395 4,089 296,769 Awadh/Lucknow 14,039 4,343 126,436 66,657 16,147 559 - 2,348 235 535 - 2,032 - - 649 338 1,465 913 - 236,697 Hardoi 1,201 6,477 290,535 258,352 1,459 0 - 3,794 6,406 91 - 139 2,775 12,709 1,299 688 4,401 1,544 50 591,920 North Kheri 691 4,055 116,689 56,061 - 1,233 2,463 9,721 - - 2,457 114 5,122 7,849 767 969 6,030 379 19,084 233,686 Rae bareilly 3,123 8,430 274,031 132,422 331 105 90 4,226 1,476 1,551 63 4,248 11,570 288 1,857 1,245 2,957 1,443 4,512 453,966 Sitapur 2,552 11,291 371,189 152,701 4,154 161 29 4,919 1,742 361 - 1,138 5,845 520 243 1,191 4,258 2,177 7,206 571,676 South Kheri 1,789 5,876 235,541 104,891 1 2,249 154 5,877 49 - - 56 3,686 9,660 22 1,112 3,098 1,061 5,774 380,896 Varanasi 5,849 3,904 50,430 77,851 - 2 81 1,269 - - - 370 311 1,052 214 253 1,677 - - 143,262 Bulandshahr 1,834 7,862 251,173 50,556 - - 559 5,790 286 7,527 3 3,435 10,778 - 259 928 1,946 2,014 789 345,740 Gautam Buddha Nagar 7,728 2,485 65,981 33,513 - - 440 - 1,157 347 - - 6,351 - 44 529 1,467 471 - 120,512 Ghaziabad 12,127 5,635 160,044 52,988 705 - 3 2,523 392 1,008 - 4,303 5 - 78 698 1,668 1,633 10,728 254,536 Meerut 7,587 9,911 238,394 82,523 56 - 293 249 1,947 2,457 - 7,332 538 - - 1,093 6,401 1,607 2,890 363,278 Bijnore Social Forestry 1,361 6,822 340,243 32,905 - 0 2,244 680 148 295 - 3,871 4,896 1,097 44 2,353 6,223 1,464 5,253 409,897 Jyotebaphulenagar 962 5,535 183,177 45,883 154 102 7 274 3,633 - - 3,755 3,437 - 31 346 4,917 193 2,961 255,367 Moradabad 2,897 8,058 245,833 53,351 - 87 8 61 444 - - - 16,130 - 341 814 2,736 - 1,788 332,548 Nazibabad - 11 2,468 86 - - 3,352 2,998 - - 6 - 235 - - - 332 52 294 9,834 Rampur 677 3,962 176,735 42,604 - 121 126 537 1,223 414 - - 5,524 - 607 446 3,595 - - 236,571 Muzzafarnagar 3,292 11,773 302,037 82,340 - 19 231 1 1,730 1,608 - 13,054 3,423 865 25 1,280 6,908 1,182 5,941 435,707 Saharanpur 2,658 8,450 252,100 50,220 - 5 94 15 - 10 9 - - - - 468 3,970 1,037 1,712 320,748 Shevalik 9 502 14,596 4,997 - 16 99 75 - 26 1 - - - - 5 290 51 1,467 22,134 Bhadohi 749 955 74,654 17,273 - 0 59 105 - - - 73 2,601 3 688 662 1,190 - 866 99,877 Ghazipur 1,699 7,125 156,305 142,644 - 4 - 560 2,507 - - 9,552 1,688 665 837 529 5,457 117 5,112 334,801 Jaunpur 1,338 10,294 165,285 211,632 - 1 3 4,620 - - - 152 3 1 532 1,550 2,934 118 9,211 407,672 Mirzapur 1,229 5,324 114,750 129,791 - - 2,190 5,255 1 - 0 5,743 12,876 3,117 219 10,364 8,358 257 2,601 302,075 Obra 456 129 3,373 6,469 - 4 35 689 0 - 0 1,541 2,117 11 14 87 2,202 - 2,294 19,422 Rainukot 210 369 14,619 24,921 - 30 4,986 1,168 - - 0 1,239 1,422 14 78 33,054 539 1 13,820 96,472 Sonbhadra 360 902 15,235 38,165 - 5 99 1,275 82 - 0 1,541 4,555 - 43 1,537 246 250 1 64,297 Unnao 2,107 9,568 237,178 188,560 2,160 10 4 72 6,420 1,824 - 2,489 155 137 1,087 689 3,511 1,656 5,901 463,528 Sub-Total 164,571 373,716 12,319,974 6,959,674 29,920 11,842 45,269 242,565 63,571 31,267 6,155 370,084 456,797 227,842 34,024 161,169 254,885 49,124 261,339 22,063,787 Dudhwa WLD - - 1 0 - 6 5 1 - - 2 - - - - - 0 - - 15 Katarniaghat WLD 0 0 17 4 - - 0 28 0 - - - - - - 1 1 - 1 52 Kaimur WLD 80 860 29,053 45,190 25 34 1,078 10,449 0 - 0 1,006 13,543 423 80 1,079 2,065 29 3,980 108,975 Kashi WLD 2,367 3,944 65,646 88,967 - 0 522 550 101 - - 887 2,049 153 359 973 3,897 418 2,866 173,698 Sohagibarwa WLD 959 8,909 124,322 113,878 - 80 2,617 6,479 1,688 - - 2,024 10,323 - 385 4,124 2,708 1,251 2,339 282,086 Sohelwa WLD - - 0 1 - 2 1 - - - - - - - - 0 - - - 4 Sub-Total 3,406 13,714 219,038 248,040 25 122 4,224 17,507 1,789 - 2 3,917 25,915 577 823 6,177 8,671 1,697 9,186 564,830
167,977 387,430 12,539,012 7,207,714 29,946 11,963 49,492 260,072 65,361 31,267 6,157 374,001 482,713 228,419 34,846 167,346 263,556 50,821 270,525 22,628,617
Dudhwa NP
Lucknow WL
Gonda WL
Grand Total
Meerut
Moradabad
Saharanpur
Varanasi
Gorakhpur
Jhansi
Kanpur
Lucknow
Circle
Agra
Allahabad
Azamgarh
Bareilly
Faizabad
Gonda
Division Wetland Others ofother
Builtup Land Agriculture Forest Classes Wasteland Water bodies
Attachment A11.6-4 Land Use/ Land Cover Classification of UP (Outside of Forest Area)

For Official U
se Only
Special Assistance for Project Form
ation (SAPR
OF) for
Uttar Pradesh N
atural Resources M
anagement and Poverty A
lleviation Project(U
PNR
MPA
P)
Final Report-Volume II
Annex 11-A
5
Attachment A11.6-5 Land Use/ Land Cover Map of UP

For Official Use Only Special Assistance for Project Formation (SAPROF) for
Uttar Pradesh Natural Resources Management and Poverty Alleviation Project (UPNRMPAP)
Final Report-Volume II Annex 11-A6
Attachment A11.7-1 Comparison of Division-wise Forest Area
Agra 23,791 20,685 3,106 Awadh 17,296 9,951 7,345 Aligarh (SF) 92 2,926 (2,834) Hardoi (SF) 321 9,307 (8,986) Etah (SF) 208 2,948 (2,740) North Kheri 32,037 43,508 (11,471) Firozabad (SF) 8,616 8,491 125 Raiberally (SF) 1 4,857 (4,856) Mahamaya Nagar (SF) 103 2,514 (2,411) Sitapur (SF) 1,294 4,989 (3,695) Mainpuri (SF) 642 1,883 (1,241) South Kheri 32,782 42,511 (9,729) Mathura (SF) 872 2,011 (1,139) Unnao (SF) - 16,670 (16,670) Allahabad (SF) 11,541 21,507 (9,966) Bulandshar (SF) 1,531 8,006 (6,475) Fathepur (SF) 299 6,409 (6,110) Gautam Buddh
Nagar (SF)- 2,045 (2,045)
Kaushambi (SF) - 343 (343) Gaziabad (SF) - 1,748 (1,748) Pratapgarh (SF) 85 441 (356) Meerut (SF) 1,966 2,707 (741) Azamgarh (SF) - 273 (273) Bijnore (SF) 16,966 13,420 3,546 Ballia (SF) - 4,793 (4,793) J.P. Nagar (SF) 5,076 12,005 (6,929) Mau (SF) - 853 (853) Moradabad (SF) - 1,421 (1,421) Badhau (SF) 5,858 7,881 (2,023) Nazibabad 42,452 34,407 8,045 Bareilly (SF) - 224 (224) Rampur (SF) 4,529 7,331 (2,802) Pilibhit 78,852 71,281 7,571 Muzzafar Nagar (SF) 410 15,122 (14,712) Pilibhit (SF) 3,201 1,125 2,076 Sahranpur (SF) 125 336 (211) Shajahan Pur (SF) 9,144 10,152 (1,009) Shevalik 34,658 33,326 1,332 Amdekar Nagar (SF) - 432 (432) Badohi (SF) - 130 (130) Barabanki (SF) 1,699 11,400 (9,701) Ghazipur (SF) - 364 (364) Faizabad (SF) 535 2,058 (1,523) Jaunpur (SF) - 8,718 (8,718) Sultanpur (SF) 1,137 2,687 (1,550) Mirzapur 93,843 94,524 (681) Bahraich 13,830 12,064 1,766 Obra 147,104 108,541 38,563 Gonda 21,033 20,353 680 Rainukoot 187,223 142,049 45,174 Shrawasti 16,084 17,231 (1,147) Sonbhadra 74,700 55,084 19,616 Basti (SF) 4,233 5,406 (1,173) Varanasi (SF) 67 70 (3) Deoria (SF) - 0 - Territorial Total 1,119,040 1,208,341 (89,301) Gorakhpur 6,841 15,802 (8,961) Dudhwa 87,985 88,369 (384) Pandrauna (SF) 18 381 (363) Katarniaghat 51,510 54,920 (3,410) Siddhart Nagar (SF) 3,459 3,556 (97) Kashi 47,018 77,400 (30,382) Banda 6,442 6,040 402 Kaimur 68,858 84,265 (15,407) Chitrakoot 47,696 49,080 (1,384) Sohelwa 100,398 69,381 31,017 Hamirpur 24,613 23,640 973 Sohagibarwa WLD 79,616 40,889 38,727 Jhansi 15,588 33,414 (17,826) Endagered Species
Program0 -
Lallitpur (SF) 50,847 74,403 (23,556) National Chambal 25,574 (25,574) Mahoba 8,482 16,372 (7,890) Kampur Zoo 0 - Orai (SF) 17,271 27,095 (9,824) Wildlife Total 435,386 440,798 (5,412) Etawa 40,833 28,930 11,903 Grand Total 1,554,426 1,649,139 (94,713) Farokabad (SF) 163 3,332 (3,169) Kanpur (SF) 479 6,916 (6,437) Knapur Dehat 76 7,862 (7,786)
Questionnairebased
Forest Area (b)
Lucknow WL
Difference(c ) =a -b
Circle Division Remote SensingAnalysis basedForest Area (a)
Gonda WL
Remote SensingAnalysis basedForest Area (a)
Questionnairebased
Forest Area (b)
Saharanpur
Varanasi
Dudhwa NP
Kanpur
Lucknow
Meerut
Moradabad
Faizabad
Gonda
Gorakhpur
Jhansi
Circle Division
Agra
Allahabad
Azamgarh
Bareilly
Difference(c ) =a -b

For Official Use Only Special Assistance for Project Formation (SAPROF) for
Uttar Pradesh Natural Resource Management and Poverty Alleviation Project (UPNRMPAP)
Final Report- Volume II
Special Assistance for Project Formation
for Uttar Pradesh Natural Resource Management and Poverty Alleviation Project
(UPNRMPAP)
Final Report
Volume II: ANNEXES
ANNEX-12 AR-CDM IN INDIA

For Official Use Only Special Assistance for Project Formation (SAPROF) for
Uttar Pradesh Natural Resources Management and Poverty Alleviation Project (UPNRMPAP)
Final Report - Volume II i
Special Assistance for Project Formation (SAPROF)
for
Uttar Pradesh Natural Resource Management and Poverty Alleviation Project (UPNRMPAP)
Final Report
Volume II: Annexes
ANNEX 12 AR-CDM IN INDIA
Table of Contents 1. Introduction ............................................................................................................... Annex 12-1
1.1 Kyoto Protocol ............................................................................................. Annex 12-1 2 Key Points of AR - CDM .......................................................................................... Annex 12-9 3. CDM Administration............................................................................................... Annex 12-13
3.1 CDM Administration in UNFCCC............................................................... Annex 12-13 3.2 CDM Administration in India ...................................................................... Annex 12-13 3.3 Indian National CDM Authority .................................................................. Annex 12-15 3.4 Carbon Storage and Forest Conservation in India........................................ Annex 12-17 3.5 Analysis on Possibility of AR - CDM in India............................................. Annex 12-18
4 SAPROF Observations............................................................................................ Annex 12-19

For Official Use Only Special Assistance for Project Formation (SAPROF) for
Uttar Pradesh Natural Resources Management and Poverty Alleviation Project (UPNRMPAP)
Final Report - Volume II Annex12-1
Annex 12 AR-CDM IN INDIA
1. Introduction
The earth’s climate has been changing continuously over several million years but has become a matter for concern in the last two centuries, which have witnessed a significant increase in global warming. It has been recognized by the international scientific community that ‘global warming’ can lead to change in climate in an unprecedented manner, which will have an adverse effect on the sustainability of our civilization.
1.1 Kyoto Protocol
The United Nation Framework Convention on Climate Change (UNFCCC) was adopted at the Rio Earth Summit in 1992. The UNFCCC was the first major initiative for international cooperation in the area of Greenhouse Gas (GHG) mitigation. It is an intergovernmental agreement to stabilize greenhouse gases in the atmosphere, at a level that would prevent adverse changes to the climate. The UNFCCC has been ratified by 186 countries.
The UNFCCC and the subsequent Conferences of Parties (COPs) raised the level of concern about stabilizing greenhouse gas concentrations in the atmosphere so as to avoid climate induced calamities. The Kyoto Protocol (KP) adopted at the Third Conference of Parties (CoP3), under the UNFCCC, allows developed countries to make use of “flexibility mechanisms” in meeting their GHG1 emission reduction commitments. The flexibility mechanisms consist of: (ET) Emissions Trading, (JI) Joint Implementation and the (CDM) Clean Development Mechanism.
Article 12 of the KP defines the purpose of CDM as, “assist Parties not included in Annex I in achieving sustainable development and in contributing to the ultimate objective of the Convention, and to assist Parties included in Annex I in achieving compliance with their quantified emission limitation and reduction commitments…” (UNFCCC). The innovative mechanisms under the protocol are designed to help Annex-I parties (developed countries) reduce the cost of meeting their emissions targets by achieving and acquiring GHG reductions at a lower price in other countries and, at the same time encourage GHG abatement initiatives worldwide.
With the Kyoto Protocol coming into force on February 2005 it has become a legal mandate, on the countries that ratified the Protocol, to meet their emission reduction targets in the commitment period 2008-12. The Annex 1 countries can invest in JI/CDM projects as well as host JI projects, and non-Annex 1 countries can host CDM projects.
1 The GHGs which are covered under Kyoto protocol are carbon dioxide, methane, nitrous oxide, hydro fluorocarbons,
per fluorocarbon and sulphur hexafluoride.
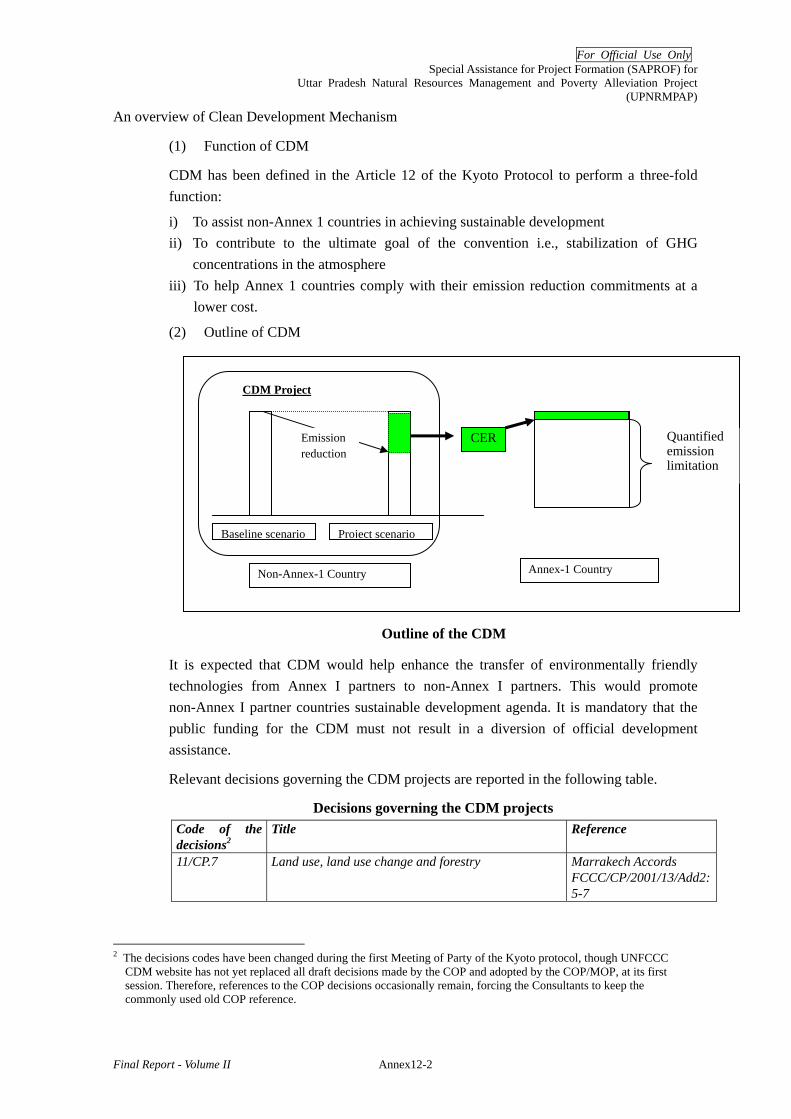
For Official Use Only Special Assistance for Project Formation (SAPROF) for
Uttar Pradesh Natural Resources Management and Poverty Alleviation Project (UPNRMPAP)
Final Report - Volume II Annex12-2
An overview of Clean Development Mechanism
(1) Function of CDM
CDM has been defined in the Article 12 of the Kyoto Protocol to perform a three-fold function:
i) To assist non-Annex 1 countries in achieving sustainable development ii) To contribute to the ultimate goal of the convention i.e., stabilization of GHG
concentrations in the atmosphere iii) To help Annex 1 countries comply with their emission reduction commitments at a
lower cost.
(2) Outline of CDM
It is expected that CDM would help enhance the transfer of environmentally friendly technologies from Annex I partners to non-Annex I partners. This would promote non-Annex I partner countries sustainable development agenda. It is mandatory that the public funding for the CDM must not result in a diversion of official development assistance.
Relevant decisions governing the CDM projects are reported in the following table.
Decisions governing the CDM projects Code of the decisions2
Title Reference
11/CP.7 Land use, land use change and forestry Marrakech Accords FCCC/CP/2001/13/Add2:5-7
2 The decisions codes have been changed during the first Meeting of Party of the Kyoto protocol, though UNFCCC
CDM website has not yet replaced all draft decisions made by the COP and adopted by the COP/MOP, at its first session. Therefore, references to the COP decisions occasionally remain, forcing the Consultants to keep the commonly used old COP reference.
Baseline scenario Project scenario
Emission reduction
Non-Annex-1 Country
CER Quantified
emission limitation
Annex-1 Country
CDM Project
Outline of the CDM
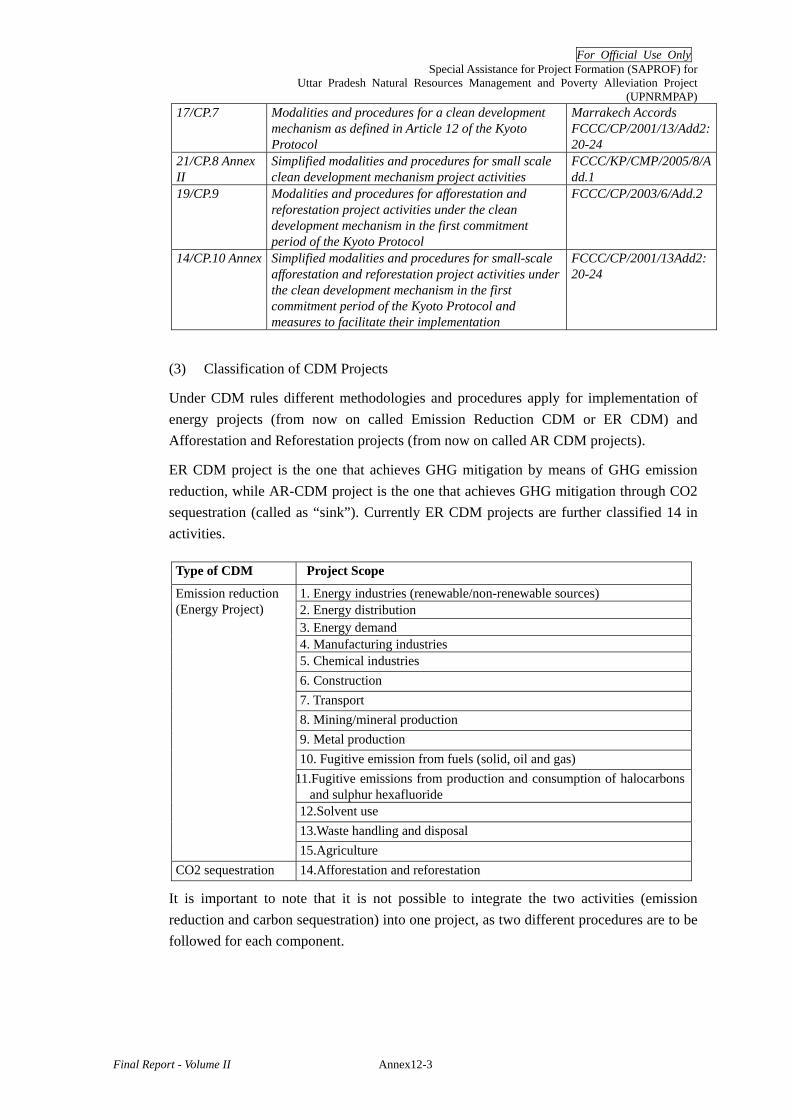
For Official Use Only Special Assistance for Project Formation (SAPROF) for
Uttar Pradesh Natural Resources Management and Poverty Alleviation Project (UPNRMPAP)
Final Report - Volume II Annex12-3
17/CP.7 Modalities and procedures for a clean development mechanism as defined in Article 12 of the Kyoto Protocol
Marrakech Accords FCCC/CP/2001/13/Add2:20-24
21/CP.8 Annex II
Simplified modalities and procedures for small scale clean development mechanism project activities
FCCC/KP/CMP/2005/8/Add.1
19/CP.9 Modalities and procedures for afforestation and reforestation project activities under the clean development mechanism in the first commitment period of the Kyoto Protocol
FCCC/CP/2003/6/Add.2
14/CP.10 Annex Simplified modalities and procedures for small-scale afforestation and reforestation project activities under the clean development mechanism in the first commitment period of the Kyoto Protocol and measures to facilitate their implementation
FCCC/CP/2001/13Add2:20-24
(3) Classification of CDM Projects
Under CDM rules different methodologies and procedures apply for implementation of energy projects (from now on called Emission Reduction CDM or ER CDM) and Afforestation and Reforestation projects (from now on called AR CDM projects).
ER CDM project is the one that achieves GHG mitigation by means of GHG emission reduction, while AR-CDM project is the one that achieves GHG mitigation through CO2 sequestration (called as “sink”). Currently ER CDM projects are further classified 14 in activities.
Type of CDM Project Scope
1. Energy industries (renewable/non-renewable sources) 2. Energy distribution 3. Energy demand 4. Manufacturing industries 5. Chemical industries 6. Construction 7. Transport 8. Mining/mineral production 9. Metal production 10. Fugitive emission from fuels (solid, oil and gas)
11.Fugitive emissions from production and consumption of halocarbons and sulphur hexafluoride
12.Solvent use 13.Waste handling and disposal
Emission reduction (Energy Project)
15.Agriculture CO2 sequestration 14.Afforestation and reforestation
It is important to note that it is not possible to integrate the two activities (emission reduction and carbon sequestration) into one project, as two different procedures are to be followed for each component.

For Official Use Only Special Assistance for Project Formation (SAPROF) for
Uttar Pradesh Natural Resources Management and Poverty Alleviation Project (UPNRMPAP)
Final Report - Volume II Annex12-4
(4) Project Eligibility under CDM
CDM projects must result in real and measurable GHG mitigation benefits and should be additional to any benefit that would occur in the absence of the project activity. To establish additionality, project emissions must be compared to the emissions of a reasonable reference case, identified as the baseline.
The proposed projects that address the additionality and sustainable development criteria will be acceptable under the CDM. The criteria of additionality refer to the project activities as well as the financial additionality.
- Additionality of the project activities - The project should lead to real, measurable and long term GHG mitigation and should be additional to any that would occur in the absence of the project activity (para. 43 Dec 17/CP7). To establish this additionality, the project emissions must be compared to the emissions of a reasonable reference case, identified as the baseline (see Box 1 below).
- Financial Additionality: If a CDM project is implemented through public funding from Parties in Annex I, the project participants will have to demonstrate that the funds do not result in the diversion of official development assistance (Appendix B, par. 2 (f) Dec 17/CP7)
Box 1 - Baseline definition
The baseline for a proposed project activity under the CDM is the scenario that reasonably represents the sum of the changes in carbon stocks in the carbon pools within the project boundary (in case of afforestation and reforestation projects) or anthropogenic emissions by sources of greenhouse (in case of energy projects) that would have occurred in the absence of the proposed project activity. (Sources: Decision 19/CP9 and para. 43 Dec. 17/CP7)
(5) Certified Emissions Reductions and Crediting period
Carbon credit issued by a CDM project is called Certified Emission Reduction (CER): one CER corresponds to one metric tonne of CO2 equivalent which has not been emitted or that has been absorbed from the atmosphere as a result of project activities. The quantity of credits possible to generate by a CDM project is given by the amount of GHG emission reduced (or CO2 removed by the atmosphere in case of AR CDM projects) as a result of project activities minus increased emissions due to project activities within the project boundaries, with which baseline and leakage should be subtracted.
Amounts of CERs are therefore given by the following equation:
Cantrop = Cactual – (B+ LK)
Where:
Cantrop = Net Anthropogenic GHG removals by sinks/GHG emission by sources due to the project
activities which are equivalent to the CERs issued by the project
For Official Use Only Special Assistance for Project Formation (SAPROF) for
Uttar Pradesh Natural Resources Management and Poverty Alleviation Project (UPNRMPAP)
Final Report - Volume II Annex12-5
Cactual = Actual Net GHG removals by sinks/GHG emission by sources are the sum of carbon removals
by sinks or emissions reductions by sources within the project boundary, minus the increase in
emission of the GHGs measured in CO2 equivalents by the sources that are increased as a result
of the implementation of the CDM within the project boundary.
B = Baseline represents the most likely scenario of the project sites without the project (see Box 1).
LK = Leakage is defined as the net change of anthropogenic emissions by sources of greenhouse gases
which occurs outside the project boundary, and which is measurable and attributable to the CDM
project activity. For AR CDM project only negative leakage should be included in the project
carbon accounting. Negative leakages are considered as the increase in GHG emissions by
sources, which occurs outside the boundary of a CDM project activity due to the project activity
itself. Leakage could be generated, inter-alia, by the shifting of pre-project activities outside the
project boundaries, which lead to increase of emissions of GHG; by the increase of deforestation
elsewhere due to the project activities or by the increase of fossil fuel emissions due to project
activities.
The project will generate CER for a determined period which is called “crediting period”. In the case of ER CDM the participants can select a crediting period for a proposed project activity from one of the following agreed alternative approaches:
- Renewable crediting period: A maximum of 7 years which may be renewed at most two times (up to a maximum of 21 years) provided that, for each renewal, a designated operational entity determines and informs the Executive Board that the original project baseline is still valid or has been updated taking account of new data where applicable; or
- Fixed crediting period for a maximum of 10 years with no option of renewal.
The crediting period for emission reduction of a CDM project can only start after the date of registration of the project activity as a CDM.
In the case of AR CDM project the crediting period begins at the start of the afforestation or reforestation project activities. Like ER CDM projects there are two options for the AR crediting period can be considered:
- Renewable crediting period: A maximum of 20 years which may be renewed two times (up to a maximum of 60 years), provided a DOE confirms that the baseline is still valid or has been properly updated taking into account new data.
- Fixed crediting period: A maximum of 30 years.
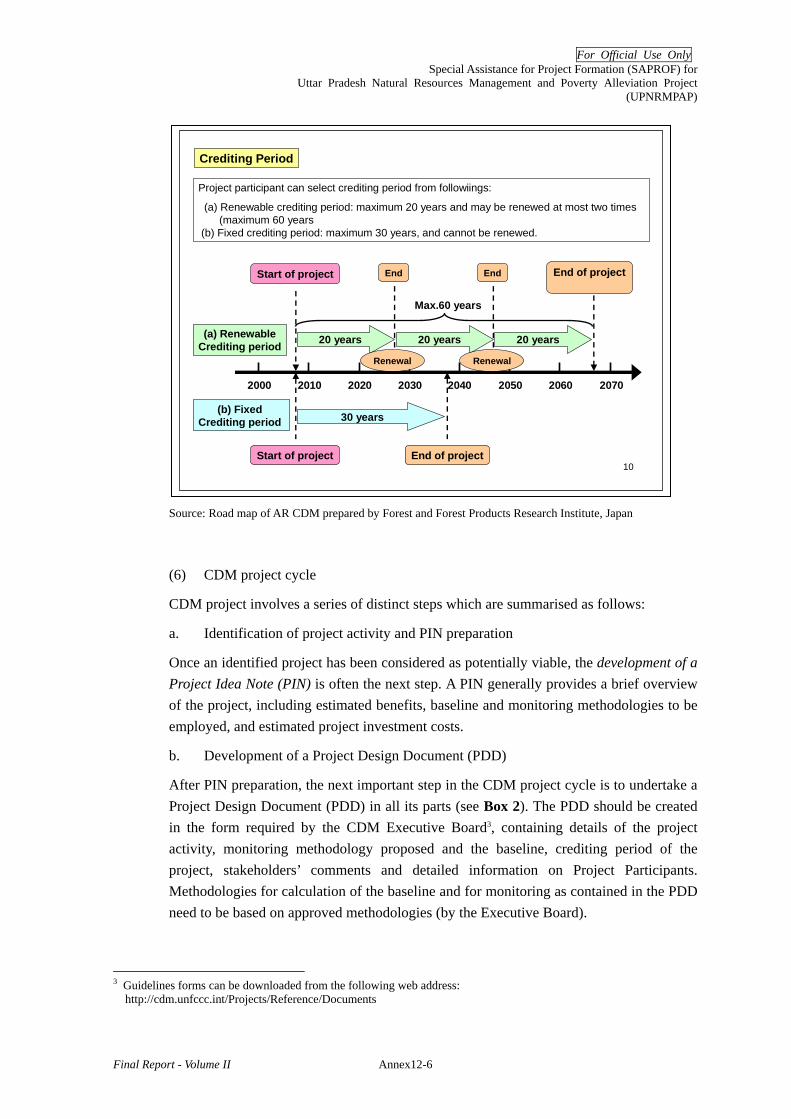
For Official Use Only Special Assistance for Project Formation (SAPROF) for
Uttar Pradesh Natural Resources Management and Poverty Alleviation Project (UPNRMPAP)
Final Report - Volume II Annex12-6
Source: Road map of AR CDM prepared by Forest and Forest Products Research Institute, Japan
(6) CDM project cycle
CDM project involves a series of distinct steps which are summarised as follows:
a. Identification of project activity and PIN preparation
Once an identified project has been considered as potentially viable, the development of a Project Idea Note (PIN) is often the next step. A PIN generally provides a brief overview of the project, including estimated benefits, baseline and monitoring methodologies to be employed, and estimated project investment costs.
b. Development of a Project Design Document (PDD)
After PIN preparation, the next important step in the CDM project cycle is to undertake a Project Design Document (PDD) in all its parts (see Box 2). The PDD should be created in the form required by the CDM Executive Board3, containing details of the project activity, monitoring methodology proposed and the baseline, crediting period of the project, stakeholders’ comments and detailed information on Project Participants. Methodologies for calculation of the baseline and for monitoring as contained in the PDD need to be based on approved methodologies (by the Executive Board).
3 Guidelines forms can be downloaded from the following web address:
http://cdm.unfccc.int/Projects/Reference/Documents
10
Crediting Period
Project participant can select crediting period from followiings:
(a) Renewable crediting period: maximum 20 years and may be renewed at most two times(maximum 60 years
(b) Fixed crediting period: maximum 30 years, and cannot be renewed.
2040 2050 20602030202020102000 2070
Start of project
Max.60 years
(a) RenewableCrediting period
(b) Fixed Crediting period
End of project
End of project
Start of project End End
30 years
20 years 20 years 20 years
Renewal Renewal

For Official Use Only Special Assistance for Project Formation (SAPROF) for
Uttar Pradesh Natural Resources Management and Poverty Alleviation Project (UPNRMPAP)
Final Report - Volume II Annex12-7
Box 2– PDD contents PDD for AR CDM projects
A. General description of the proposed project activity B. Duration of the project activity /crediting period C. Application of an approved baseline and monitoring methodology D. Estimation of ex ante net anthropogenic GHG removals by sinks E. Monitoring plan F. Environmental impacts of the proposed project G. Socio-economic impacts of the proposed project H. Stakeholder comments Annex 1. Contact information on project participants Annex 2. Information regarding public funding Annex 3. Baseline information Annex 4. Monitoring plan
c. Baseline and monitoring methodology
In case it is not possible to apply any of the approved methodologies, project participants are required to submit to the EB a new methodology for approval. This methodology will be presented to a Designated Operational Entity (DOE) selected by the project participants, which will forward it, together with a draft PDD to the EB for approval. The EB will review such methodologies on the basis of criteria established by the Kyoto protocol within four months from the submission of the methodologies. Once methodologies are approved the project participants can access the CDM cycle for project registration.
d. Approval of involved Parties
The Parties involved in the project will, through their Designated National Authority (DNA), present a letter of voluntary participation to the project. In addition, the host country will have to confirm and certify that the proposed project does assist to achieve country’s sustainable development objectives. Present procedures established by the Government of India for project approvals are described in details below.
e. PDD Validation
The DOE chosen by the project participants will review the PDD, invite feedbacks from NGOs and local communities, and decide whether or not it should be validated.
f. Registration of the project as a CDM Project with the CDM Executive Board;
Based on successful validation, the DOE will forward it to the Executive Board for formal registration and, unless a project participant or at least three executive board members request a review of the project, its registration will be deemed final after eight weeks.
g. Project Monitoring
During the implementation phase project participants are responsible for collecting the necessary data required to accurately quantify benefits achieved by the project. This data
For Official Use Only Special Assistance for Project Formation (SAPROF) for
Uttar Pradesh Natural Resources Management and Poverty Alleviation Project (UPNRMPAP)
Final Report - Volume II Annex12-8
collection and project performance monitoring must be undertaken in accordance with the monitoring plan as specified in the PDD. Project participants must prepare monitoring reports and submit them to a DOE on a regular basis according to the approved monitoring plan.
h. Periodic review and Verification
Verification is performed by a DOE, which confirms that emissions reductions claimed in the monitoring report (described above) have in fact occurred. Except in the case of small-scale projects, the DOE contracted to verify project emission reductions must be a different one than that which originally validated the project. Note that initial verification and certification of an afforestation or reforestation project activity under the CDM may be undertaken at a time selected by the project participants. Thereafter, verification and certification shall be carried out every five years until the end of the crediting period.
i. Certification to the CDM Executive Board
Once satisfied that all the verification requirements have been met, the DOE will complete a Certification Report for submission to the EB, which constitutes the request for issuance of CERs.
j. Issuance of CERs by the CDM Executive Board for the Verification period.
Upon the receipt of the Certification report, the EB will issue CERs within 15 days unless a review is required. CERs are deposited into the accounts of project participants as specified in the PDD, with participants being the official owners of CERs.
(7) Sustainable Development Indicators
It is the prerogative of the host Party to confirm whether a CDM project activity assists it in achieving sustainable development. The CDM projects should also be oriented towards improving the quality of life of the poor from the environmental standpoint.
As sustainable development criteria, India has identified the following aspects that should be considered while designing CDM project activity in the country:
a) Social well being: The CDM project activity should lead to alleviation of poverty by generating additional employment, removal of social disparities and contribution to provision of basic amenities to people leading to improvement in quality of life of people.
b) Economic well being: The CDM project activity should bring in additional investment consistent with the needs of the people.
c) Environmental well being: This should include a discussion of impact of the project activity on resource sustainability and resource degradation, if any, due to proposed activity; bio-diversity friendliness; impact on human health; reduction of levels of pollution in general;
d) Technological well being: The CDM project activity should lead to transfer of environmentally safe and sound technologies that are comparable to best practices in

For Official Use Only Special Assistance for Project Formation (SAPROF) for
Uttar Pradesh Natural Resources Management and Poverty Alleviation Project (UPNRMPAP)
Final Report - Volume II Annex12-9
order to assist in upgrading the technological base. Transfer of technology can be within the country as well from other developing countries.
2 Key Points of AR - CDM
In addition to initiatives in energy, transport and other sectors, Land Use, Land-Use Change and Forestry (LULUCF) is an important aspect of CDM. The Kyoto protocol admitted that CO2 removals by sinks due to sinks such as forest are included in the targets in order to achieve the reduction targets for the first Commitment Period. Different categories of projects in the forestry sector such as afforestation, reforestation and avoided deforestation projects were considered initially under the CDM.
Deforestation, forest, crop and grassland management projects do not qualify under the CDM at present though they may be included in a subsequent commitment period (beyond the year 2012). The role of land use and forestry projects in the CDM beyond 2012 would be decided as part of the negotiations on the second commitment period.
Afforestation and reforestation were determined to become subjects of the mechanism in Conference of Parties (COP) at Bonn. The decision was made to include afforestation and reforestation (AR) for the first commitment period (2008-2012) with a cap of 1% of the developed country’s 1990 level for each year of the first commitment period. In COP 9 held in December 2003, implementation rules for sink CDM as afforestation and reforestation were decided.
An Afforestation/reforestation (AR) CDM project is a project which aims at reducing GHG through the plantation of trees that absorb and stock carbon dioxide from the atmosphere. Such a project could include various activities, e.g. a mix of agroforestry, small plantings of commercial-grade timber species, etc.
(1) Definition of Forest
Host country needs to determine definitions of forest for AR CDM within the criteria below. , and Forest, according to the Indian national definition, is defined by the following three parameters:
- Minimum tree cover: 10~30% - Minimum forest area: 0.05 ~ 1 ha - Minimum tree height (at maturity in situ): 2~5 m
A forest may consist either of closed forest formations where trees of various stories and undergrowth cover a high proportion of the ground or of open forest. Young natural stands and all plantations which have yet to reach a crown density of 30 % or tree height of 5 m are included under forest, as are areas normally forming part of the forest area which result temporarily un-stocked as a result of human interventions such as harvesting or natural causes, but which are expected to revert to forest.
For Official Use Only Special Assistance for Project Formation (SAPROF) for
Uttar Pradesh Natural Resources Management and Poverty Alleviation Project (UPNRMPAP)
Final Report - Volume II Annex12-10
(2) Definition of Afforestation and Reforestation
Afforestation/Reforestation terms are defined in the following way4:
Afforestation is “the direct human-induced conversion of land that has not been forested, for a period of at least 50 years, to forested land through planting, seeding and/or the human-induced promotion of natural seed sources”.
Reforestation is “the direct human-induced conversion of non-forested land to forested land through planting, seeding and/or the human-induced promotion of natural seed sources, on land that was forested but that has been converted to non-forested land” For the first commitment period (2008-2012), reforestation is limited to lands that did not have forest cover since 31 December 1989.
(3) Eligibility of AR CDM
Given the above-mentioned definitions, AR CDM activities are eligible in the case of meeting the following conditions:
Additionality criteria: Additionality implies that only activities that lead to an increase of carbon removals from the atmosphere in respect to what would happen without the project intervention (baseline scenario) are eligible. The additionality of a project is related to the typology of project activity, and linked also to the socio-economic environment of the project thus being strictly connected to the site chosen for such activities. For example: if the project takes place in a land where there is another afforestation plan on-going or planned, the project scenario would be the same as the baseline scenario, thus not additional. Therefore spatial information on the planned and financed afforestation project should be collected and taken into consideration in the site selection to exclude the areas already included in other reforestation projects, as well as those areas that would evolve into forest without human intervention.
Not forested for the last 50 years at least for afforestation:
Not forested since 1990 for reforestation: In order to verify the eligibility of a certain site, he project proponents should provide evidence that identified sites were not forested since 1990.
(4) Temporary Credits for AR CDM
CERs issued by ER projects are permanent while CERs originated by AR CDM projects are temporary due to the temporary nature and reversibility of the carbon contained in terrestrial ecosystems, which is vulnerable to natural disturbances such as pest outbreaks, wildfires and diseases, and anthropogenic practices such as harvesting and land management. Therefore, while preparing the Project Design Document (PDD) of an AR CDM project activity, the participants should select between two CER types: temporary CERs or long-term CERs. These are defined as follows:
4 Paras 1(a),(b) and (c) Dec 11/CP7.
For Official Use Only Special Assistance for Project Formation (SAPROF) for
Uttar Pradesh Natural Resources Management and Poverty Alleviation Project (UPNRMPAP)
Final Report - Volume II Annex12-11
- Temporary CER (tCER): being a CER issued for an AR CDM project activity, which expires at the end of the commitment period following the one during which it was issued. For example, if 100 tons of tCERs are issued in the first commitment period, it will expire at the end of the second commitment period (e.g. after 5 years).
- Long – term CER (lCER): being a CER issued for an AR CDM project activity which expires at the end of the crediting period of the AR CDM project activity for which it was issued.
Box 3 – tCERs or lCERs? tCERs last for just five years at which time they can be reissued (if verification has occurred) or the Annex I country must replace them. When a tCER expires after a crediting period is over (after which, CDM regulation on that tCER will cease), the developer is then free to harvest the trees if so desired. Fees for issuing tCERs will likely be changed every five years, which could significantly rise the cost of this option. At the end of the crediting period, all tCERs will expire. In contrast lCERs last for the entire length of the crediting period, but must be replaced either as soon as verification shows the carbon stock has decreased or if no verification has occurred for over a period of five years. For low risk lCER, the price will approach that of energy CER credit (Dutschke M. 2004). At the end of the crediting period all lCERs will also expire. lCERs are more desirable for the project developer as they will possess a higher value. Yet a purchaser will not invest in lCERs for a project in which there is a significant risk – in this situation, the five-year obligation of tCERs is preferable. Additionally, if the price of CERs is expected to increase over time, a project developer may want to sell tCERs in the hope of receiving greater payment for future tCERs Source: Winrock & BioCarbon Fund, 2005

For Official Use Only Special Assistance for Project Formation (SAPROF) for
Uttar Pradesh Natural Resources Management and Poverty Alleviation Project (UPNRMPAP)
Final Report - Volume II Annex12-12
12
Issuance of tCER/lCER
tCR and lCER shall be issued through the process of monitoring, verification, and certification of GHG removal.Project participants can decide the timing of the first verification.Verification shall be conducted every 5 years after the first verification.
!st Verification/Certification
2nd Verification/Certification
(5 years after the 1st)
3rd Verification/Certification
(5 years after the 2nd)
+ tCER
GH
G r
em
ova
lT
on-C
O2)
+ tCER + tCER
ProjectStart
+ lCER
+ lCER- lCER
GH
G r
em
ova
lTo-C
O2)
ProjectStart
!st Verification/Certification
2nd Verification/Certification
(5 years after the 1st)
3rd Verification/Certification
(5 years after the 2nd)
1st commitment period 1st commitment period 1st commitment period
Source: Road Map for AR CDM prepared by Forestry and Forest Products Research Institute, Japan
(5) Source of Carbon Credits
To measure carbon credits generated by the AR CDM project it is a pre-requisite to account for all changes in the following carbon pools: above-ground biomass, below-ground biomass, litter, dead wood, and soil organic carbon. The proposal may choose not to account for a given pool, if transparent and verifiable information is provided that the pool does not constitute a source.
(6) Small Scale AR CDM
Large scale CDM projects are likely to become more attractive than small-scale projects since they will generate large quantities of CERs at lower transaction costs per unit of EC. Besides normal scale CDM projects, the Conference of Parties had defined further rules to facilitate small scale CDM projects with high social benefits mainly to by reducing the registration costs and by requiring simplified PDD and methodologies for baseline and monitoring.
Regarding the small scale AR CDM project, particular rules have been have been defined. Among others, the key rules applicable are:
- GHG removal shall be less than 8,000 ton-CO2/year.
- The project shall be developed by low-income communities and individuals as determined by the host party.
tCER
lCER

For Official Use Only Special Assistance for Project Formation (SAPROF) for
Uttar Pradesh Natural Resources Management and Poverty Alleviation Project (UPNRMPAP)
Final Report - Volume II Annex12-13
- Simplified procedures and rules is applicable to reduce transaction costs compared to normal scale AR CDM:
- Simplified PDD can be applied; - Simplified baseline and monitoring methodology can be applied;
- It is possible to bundle several projects into one for process of validation, verification, certification and monitoring.
- Participation of poor people in the project is necessary. Definition of poor can be decided by host country.
3. CDM Administration
3.1 CDM Administration in UNFCCC
The CDM is supervised by the Executive Board, which itself operates under the authority of the Parties and it is based at the Secretariat of the United Nation Framework Convention on Climate Change (UNFCCC) in Bonn, Germany. The Executive Board accredits independent organisations – known as Designated Operational Entities (DOE) – that will validate proposed CDM projects, verify the resulting emission reductions, and certify those emission reductions as CERs. These operational entities will typically be private companies such as auditing and accounting firms, consulting companies and law firms capable of conducting credible and independent assessments of emission reductions5. Another key task of the EB is the maintenance of a CDM registry, which will issue new CERs, manage an account for CERs levied for adaptation and administration expenses, and maintain a CER account for each non-Annex I Party hosting a CDM project.
3.2 CDM Administration in India
(1) State of CDM Activities in India
India ratified the Kyoto Protocol on the 26th of August 2002 but being part non-Annex I countries, has no emission reduction commitments under the Kyoto Protocol. On the other hand India can host CDM project in order to meet its sustainable development goals and to attract foreign investments for technology transfer for reducing GHG emissions as well as for increasing carbon sequestration. According to UNFCCC, nearly 149 million CERs to be delivered from registered projects, China emerges as the major provider of CERs (43.28% percent), with India and Brazil a distant second (14% and 11%, respectively). Note that, while China generates the largest volume of CERs by far, it has only one fifth (85) as many projects as India (243). Details of number of registered projects and estimated average annual CERs from registered projects is detailed in the following Table.
5 DOEs accredited by the EB are being listed on the UNFCCC CDM website (http://cdm.unfccc.int/DOE/list).
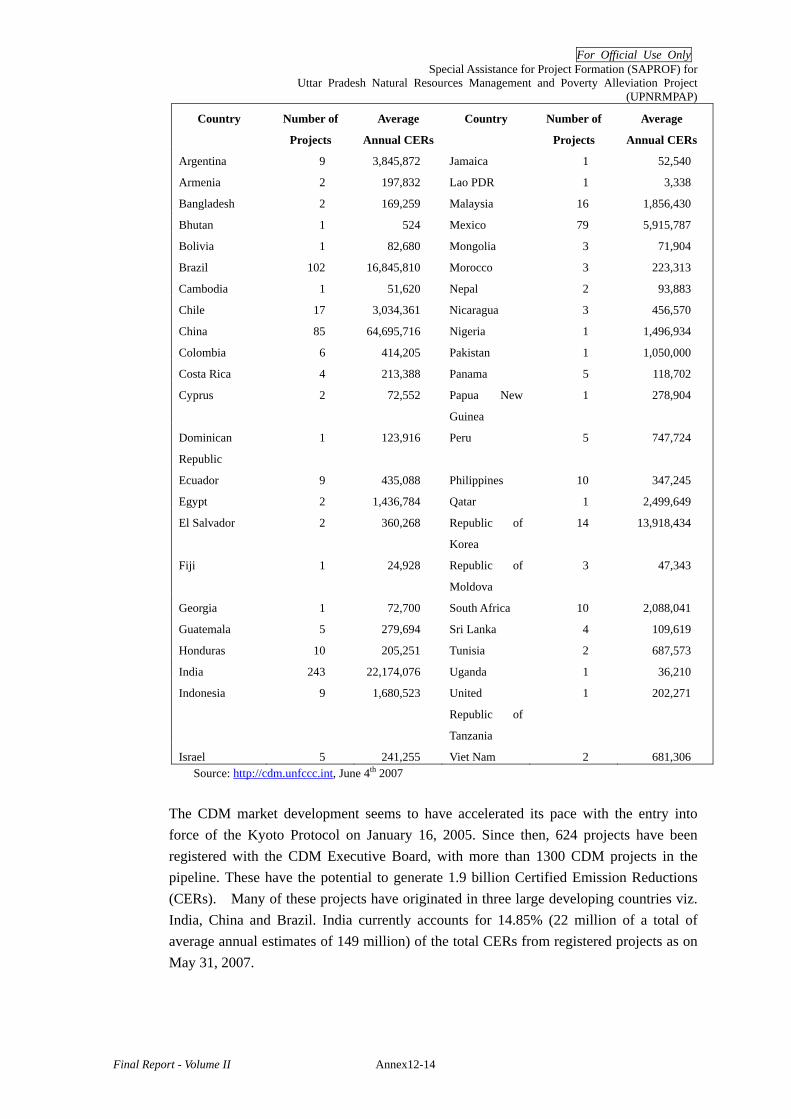
For Official Use Only Special Assistance for Project Formation (SAPROF) for
Uttar Pradesh Natural Resources Management and Poverty Alleviation Project (UPNRMPAP)
Final Report - Volume II Annex12-14
Country Number of
Projects
Average
Annual CERs
Country Number of
Projects
Average
Annual CERs
Argentina 9 3,845,872 Jamaica 1 52,540
Armenia 2 197,832 Lao PDR 1 3,338
Bangladesh 2 169,259 Malaysia 16 1,856,430
Bhutan 1 524 Mexico 79 5,915,787
Bolivia 1 82,680 Mongolia 3 71,904
Brazil 102 16,845,810 Morocco 3 223,313
Cambodia 1 51,620 Nepal 2 93,883
Chile 17 3,034,361 Nicaragua 3 456,570
China 85 64,695,716 Nigeria 1 1,496,934
Colombia 6 414,205 Pakistan 1 1,050,000
Costa Rica 4 213,388 Panama 5 118,702
Cyprus 2 72,552 Papua New
Guinea
1 278,904
Dominican
Republic
1 123,916 Peru 5 747,724
Ecuador 9 435,088 Philippines 10 347,245
Egypt 2 1,436,784 Qatar 1 2,499,649
El Salvador 2 360,268 Republic of
Korea
14 13,918,434
Fiji 1 24,928 Republic of
Moldova
3 47,343
Georgia 1 72,700 South Africa 10 2,088,041
Guatemala 5 279,694 Sri Lanka 4 109,619
Honduras 10 205,251 Tunisia 2 687,573
India 243 22,174,076 Uganda 1 36,210
Indonesia 9 1,680,523 United
Republic of
Tanzania
1 202,271
Israel 5 241,255 Viet Nam 2 681,306 Source: http://cdm.unfccc.int, June 4th 2007
The CDM market development seems to have accelerated its pace with the entry into force of the Kyoto Protocol on January 16, 2005. Since then, 624 projects have been registered with the CDM Executive Board, with more than 1300 CDM projects in the pipeline. These have the potential to generate 1.9 billion Certified Emission Reductions (CERs). Many of these projects have originated in three large developing countries viz. India, China and Brazil. India currently accounts for 14.85% (22 million of a total of average annual estimates of 149 million) of the total CERs from registered projects as on May 31, 2007.
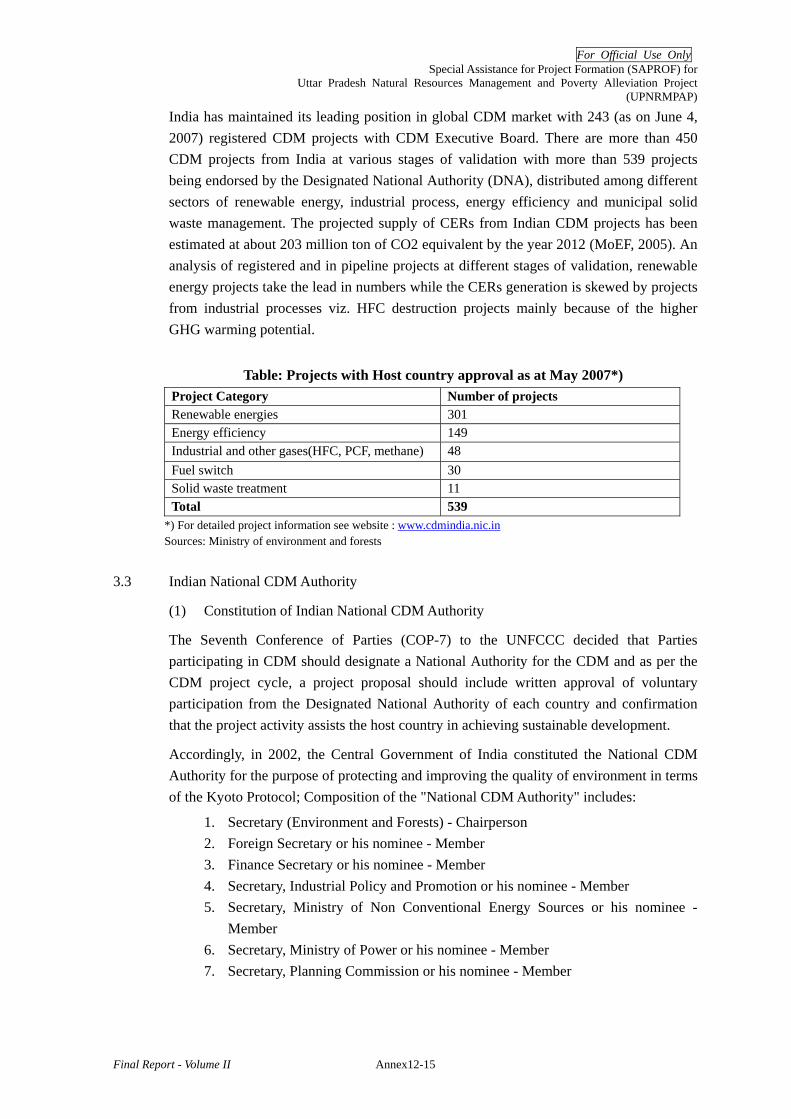
For Official Use Only Special Assistance for Project Formation (SAPROF) for
Uttar Pradesh Natural Resources Management and Poverty Alleviation Project (UPNRMPAP)
Final Report - Volume II Annex12-15
India has maintained its leading position in global CDM market with 243 (as on June 4, 2007) registered CDM projects with CDM Executive Board. There are more than 450 CDM projects from India at various stages of validation with more than 539 projects being endorsed by the Designated National Authority (DNA), distributed among different sectors of renewable energy, industrial process, energy efficiency and municipal solid waste management. The projected supply of CERs from Indian CDM projects has been estimated at about 203 million ton of CO2 equivalent by the year 2012 (MoEF, 2005). An analysis of registered and in pipeline projects at different stages of validation, renewable energy projects take the lead in numbers while the CERs generation is skewed by projects from industrial processes viz. HFC destruction projects mainly because of the higher GHG warming potential.
Table: Projects with Host country approval as at May 2007*) Project Category Number of projects Renewable energies 301 Energy efficiency 149 Industrial and other gases(HFC, PCF, methane) 48 Fuel switch 30 Solid waste treatment 11 Total 539
*) For detailed project information see website : www.cdmindia.nic.in Sources: Ministry of environment and forests
3.3 Indian National CDM Authority
(1) Constitution of Indian National CDM Authority
The Seventh Conference of Parties (COP-7) to the UNFCCC decided that Parties participating in CDM should designate a National Authority for the CDM and as per the CDM project cycle, a project proposal should include written approval of voluntary participation from the Designated National Authority of each country and confirmation that the project activity assists the host country in achieving sustainable development.
Accordingly, in 2002, the Central Government of India constituted the National CDM Authority for the purpose of protecting and improving the quality of environment in terms of the Kyoto Protocol; Composition of the "National CDM Authority" includes:
1. Secretary (Environment and Forests) - Chairperson 2. Foreign Secretary or his nominee - Member 3. Finance Secretary or his nominee - Member 4. Secretary, Industrial Policy and Promotion or his nominee - Member 5. Secretary, Ministry of Non Conventional Energy Sources or his nominee -
Member 6. Secretary, Ministry of Power or his nominee - Member 7. Secretary, Planning Commission or his nominee - Member

For Official Use Only Special Assistance for Project Formation (SAPROF) for
Uttar Pradesh Natural Resources Management and Poverty Alleviation Project (UPNRMPAP)
Final Report - Volume II Annex12-16
8. Joint Secretary (Climate Change), Ministry of Environment and Forests - Member
9. Director (Climate Change), Ministry of Environment and Forests - Member/ Secretary
The National CDM Authority receives projects for evaluation and approval as per guidelines and general criteria laid down in the relevant rules and modalities pertaining to CDM, by the Executive Board from time to time.
(2) Roles and Responsibilities of National CDM Authority6:
i) As part of the evaluation process of CDM projects includes an assessment of the probability of eventual successful implementation of CDM projects and evaluation of the extent to which projects meet the sustainable development objectives
ii) The Authority ensures that in the event of project proposals competing for same source of investment, projects with higher sustainable development are accorded higher priority.
iii) The Authority undertakes financial review of project proposals to ensure that the project proposals do not involve diversion of official development assistance in accordance with modalities and procedures for CDM
iv) The Authority carries out activities to ensure that the project developers have reliable information relating to all aspects of CDM which include creating databases on organisations designated for carrying out activities like validation of CDM project proposals and monitoring and verification of project activities, and to collect, compile and publish technical and statistical data relating to CDM initiatives in India.
v) The Member-Secretary of the National CDM Authority is responsible for day-to-day activities of the Authority including constituting committees or sub-groups to coordinate and examine the proposals or to get detailed examination of the project proposals.
The National CDM Authority has the powers to:
i) invite officials and experts from Government, financial institutions, consultancy organisations, non-governmental organisations, civil society, legal profession, industry and commerce, as it may deem necessary for technical and professional inputs and may co-opt other members depending upon need;
ii) interact with concerned authorities, institutions, individual stakeholders for matters relating to CDM;
iii) take up any environmental issues pertaining to CDM or sustainable development projects as may be referred to it by the Central Government; and
iv) recommend guidelines to the Central Government for consideration of projects and principles to be followed for according host country approval.
6 Extracted from http://cdmindia.nic.in/cdm_india.htm
For Official Use Only Special Assistance for Project Formation (SAPROF) for
Uttar Pradesh Natural Resources Management and Poverty Alleviation Project (UPNRMPAP)
Final Report - Volume II Annex12-17
3.4 Carbon Storage and Forest Conservation in India
India has developed and implemented policies and programs to combat deforestation and has participated in international efforts to reduce deforestation at global level. The country India has a strong policy framework for forest conservation and protection.
Forest (Conservation) Act, 1980 (FCA, 1980), National Forest Policy (1988), Indian Wildlife Protection Act (1972), Indian Forest Act (1927), Biodiversity Act (2002), National Environment Policy (2006) are some of the important legislation and policy pronouncement supporting governments commitment on protection and conservation.
Under the framework of the National Forest Policy (1988), mechanism of Joint Forest Management, facilitating greater participation of local communities has promoted regeneration and reforestation of about 15 million ha of forest land. This is in addition to the government initiated afforestation programme since 1980’s. The cumulative area of forest plantation from 1980 to 2005 is about 34 million ha with an average annual rate of 1.3 million ha. The recorded forest area of the country at the time of independence (1947), was reported to be about 40 million ha being about 12.20% of the total geographic area of India (Central Statistical Organisation). Presently, the recorded forest area is 77.47 million ha (State of Forest Report , 2003).
The latest reports (2001 and 2003) of the remote sensing based State of Forest Report (India) indicate increase in forest cover of the country. The forest cover, which was 64.08 million ha as per the 1987 report (based on 1981-83 satellite data), has increased to 67.83 million ha as per 2003 estimates constituting 20.64% of the geographic area. Including the tree cover (forest patches of less than one hectare) of 9.99 million ha (3.04%), the total area under forest and tree cover is estimated at 23.68% of the total geographical area.
The above estimates are also supported by the Global Forest Resources Assessment (2005) of FAO. As per the assessment India, along with China, are amongst the few developing countries which have positive trends reflecting net positive change in forest area during 1990s. As per recent study by Indian Institute of Science, Bangalore, (2006) the forest cover is likely to register an increase during the period 2006-2030, and projected to reach 72.19 million ha (22%) by 2030 under the current trend scenario. These estimates are based on the analysis of forest cover, afforestation and reforestation, and other conservation measures,
The growing stock of the country in 1980 was estimated to be 4,196 million m3. The net annual increment was estimated at 52 million m3
or 1.24 % of the growing stock (State of Forest Report, 1991). In 1995, the growing stock was estimated at 4,740 million m3 with an average standing volume of 74.42 m3
/ha. The total annual increment of growing stock was estimated at 87.62 million m3 (Forest Survey of India,1995). The growing stock of the country in 2003 as estimated by FSI is 6,414 million m3 which includes 4,782 million m3
of growing stock within forest area and 1,632 million m3 as trees outside forest areas.
Considering the trends of increased forest and tree cover, the Indian Institute of Science projects an increase in carbon stocks from 8.79 Gt-CO2 in 2005 to 9.75 Gt-CO2 in 2030.
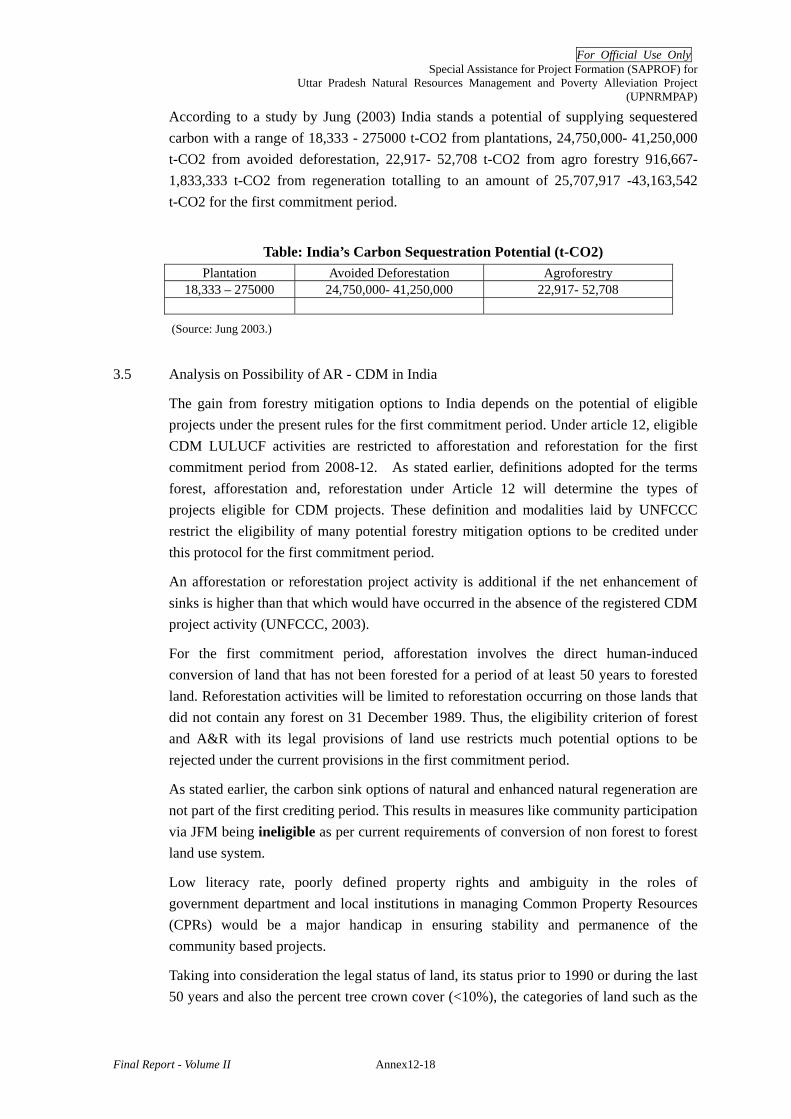
For Official Use Only Special Assistance for Project Formation (SAPROF) for
Uttar Pradesh Natural Resources Management and Poverty Alleviation Project (UPNRMPAP)
Final Report - Volume II Annex12-18
According to a study by Jung (2003) India stands a potential of supplying sequestered carbon with a range of 18,333 - 275000 t-CO2 from plantations, 24,750,000- 41,250,000 t-CO2 from avoided deforestation, 22,917- 52,708 t-CO2 from agro forestry 916,667- 1,833,333 t-CO2 from regeneration totalling to an amount of 25,707,917 -43,163,542 t-CO2 for the first commitment period.
Table: India’s Carbon Sequestration Potential (t-CO2) Plantation Avoided Deforestation Agroforestry
18,333 – 275000 24,750,000- 41,250,000 22,917- 52,708
(Source: Jung 2003.)
3.5 Analysis on Possibility of AR - CDM in India
The gain from forestry mitigation options to India depends on the potential of eligible projects under the present rules for the first commitment period. Under article 12, eligible CDM LULUCF activities are restricted to afforestation and reforestation for the first commitment period from 2008-12. As stated earlier, definitions adopted for the terms forest, afforestation and, reforestation under Article 12 will determine the types of projects eligible for CDM projects. These definition and modalities laid by UNFCCC restrict the eligibility of many potential forestry mitigation options to be credited under this protocol for the first commitment period.
An afforestation or reforestation project activity is additional if the net enhancement of sinks is higher than that which would have occurred in the absence of the registered CDM project activity (UNFCCC, 2003).
For the first commitment period, afforestation involves the direct human-induced conversion of land that has not been forested for a period of at least 50 years to forested land. Reforestation activities will be limited to reforestation occurring on those lands that did not contain any forest on 31 December 1989. Thus, the eligibility criterion of forest and A&R with its legal provisions of land use restricts much potential options to be rejected under the current provisions in the first commitment period.
As stated earlier, the carbon sink options of natural and enhanced natural regeneration are not part of the first crediting period. This results in measures like community participation via JFM being ineligible as per current requirements of conversion of non forest to forest land use system.
Low literacy rate, poorly defined property rights and ambiguity in the roles of government department and local institutions in managing Common Property Resources (CPRs) would be a major handicap in ensuring stability and permanence of the community based projects.
Taking into consideration the legal status of land, its status prior to 1990 or during the last 50 years and also the percent tree crown cover (<10%), the categories of land such as the

For Official Use Only Special Assistance for Project Formation (SAPROF) for
Uttar Pradesh Natural Resources Management and Poverty Alleviation Project (UPNRMPAP)
Final Report - Volume II Annex12-19
wastelands, farmlands, fallow land, revenue or Panchayat land and land not classified as forest prior to 1990 or during the last 50 years are likely to become eligible for project activities under CDM.
The eligible agro forestry7 and farm forestry option are constrained by the financial additionality criterion as planting trees on farm land not only enhances agricultural productivity but also provides additional monetary benefits to the farmers than their current land use systems. It would be difficult to prove additionality of these projects by demonstrating institutional additionality to the existing barriers of policy, infrastructure, lack of technical assistance and lack of initial investment by the farmers. This is because the as government policies and programs favour free distribution of seedlings; subsidised financing facilities from banking institutions like NABARD for agro/farm forestry.
The state of forestry related milieu discussed above implies that the existing government policies, programs and approaches not necessarily convenient for the country to apply AR CDM activities in light of the procedural requirements of the Executive Board.
4 SAPROF Observations
As is evident from the Table in Section 3.2, the projects that have been endorsed are under Emission Reduction. There are no projects that have been considered under AR-CDM. This is possibly reflection progressive policies that has been giving greater emphasis on ‘Greening India’ programme with the involvement of all the stakeholders where adequate flow of benefits to the communities is being ensured. The factors necessary for implementing such projects like availability of eligible land, technology for producing improved planting material and other technical know-how, trained manpower, and suitable climatic conditions and institutional arrangements are quite favourable. This makes it difficult for the AR-CDM project developers to prove the additionality to qualify for CDM project. These policies and national afforestation targets also seem to restrict the use of CDM funding by setting high baseline, for business as usual scenario, resulting in reducing carbon benefits generated by AR projects.
The practical options available for India under AR CDM rules and procedures for first commitment period are plantation on non-forest wastelands and farm forestry. These options are constrained by procedural issues of baseline, permanence and leakage of
7 Bio Carbon Fund (BCF) The World Bank has mobilized a new fund to demonstrate projects that sequester or conserve carbon in forest and agro-ecosystems. The objective of setting up this Fund is to deliver cost-effective emission reductions, while promoting biodiversity conservation and poverty alleviation. The Fund will provide carbon finance for projects that sequester or conserve greenhouse gases in forests, agro- and other ecosystems. The Fund started operations in May 2004 and has a total capital of $53.8 million. In May 2007, the Bio-Carbon Fund (BCF) agreed on an Emission Reduction Purchase Agreement (ERPA) which will help enable small and marginal farmers in Orissa and Andhra Pradesh to earn additional revenues through carbon credits by afforesting their severely degraded lands. For the period 2008-2017, BCF will purchase up to 646,000 tonnes of CO2 equivalent from the farmers through the newly established agroforestry plantations on 3500 hectares degraded private lands in Andhra Pradesh and Orissa.

For Official Use Only Special Assistance for Project Formation (SAPROF) for
Uttar Pradesh Natural Resources Management and Poverty Alleviation Project (UPNRMPAP)
Final Report - Volume II Annex12-20
forest carbon due to domestic environmental policies, CPR issues, and socio-economic condition of forest dependent people and institutional dynamics of local governing bodies. A new beginning seems to have been made by the recently (May 2007) approved World Bank financed project titled India - Carbon Financing for Improved Rural Livelihoods Project. The proposed AR-CDM aims to mobilise resource poor farmers to raise plantations of tree species with high rates of carbon removal in their private lands. The project would help demonstrate technical and methodological approaches related to a carbon sequestration.

For Official Use Only Special Assistance for Project Formation (SAPROF) for
Uttar Pradesh Natural Resources Management and Poverty Alleviation Project (UPNRMPAP)
Final Report - Volume II Annex12-21
Bibliography Brown, K. and Corbera, E. (2003), Exploring equity and sustainable development in the new carbon economy. Climate Policy, 3 (Supplement 1), S41-S56.
Bonnie, R., M. Carey, et al. (2002). Protecting terrestrial ecosystems and the climate through a global carbon market." Philosophical Transactions. Series A, Mathematical, Physical, And Engineering Sciences, 360(1797), 1853-1873.
Bernoux Martial, Vincent Eschenbrenner, Carlos C. Cerri Jerry M. Melillo Christian Feller (2002). Viewpoint: LUCF-based CDM: too much ado for . . .a small carbon market. Climate Policy 2: 379–385
Bhadwal, S. and Singh, Roma. (2002). Carbon sequestration estimates for forestry options under different land-use scenarios in India.. Current Science, 83(11), 1380-1386
Bhattacharya, T., Pal, D.K., Mandal, C. and Velayutham M. (2000). Organic carbon stock in Indian soils and their geographical distribution. Current Science 79 (5), 651-660.
Brown, S., Sathaye, J., Cannell, M. and Kauppi, P. (1996), ‘Management of forests for mitigation of greenhouse gas emissions’, in R. Watson, M. Zinyowera and R. Moss (eds.), Climate Change 1995: Contribution of Working Group II to the Second Assessment Report of the Intergovernmental Panel on Climate Change, Cambridge University Press.
Brown, S., Masera, O. and Sathaye, J. (2000), ‘Project-based activities’, in R. Watson, I. Noble, B. Bolin, N.
Ravindranath, D. Verardo and D. Dokken (eds.), Land Use, Land-Use
Change, and Forestry, A special report of the Intergovernmental Panel on Climate Change, Cambridge University Press, 377 pp.
Castro, R., F. Tattenbach, et al. (2000). The Costa Rican experience with market instruments to mitigate climate change and conserve biodiversity. Environmental Monitoring and Assessment, 61(1), 75-92.
Chhabra Abha, Palria S. and Dadhwal V.K. (2002). Biomass and Bioenergy 22(3), 187-194.
Chhabra Abha and Dadhwal V.K. (2004). Assessment of Major Pools and Fluxes of Carbon in Indian Forests. Climatic Change 64 (3), 341-360
Chambers, R., Saxena, N. C. and Shah, T. (1989). To the Hands of the Poor: Water and Trees. Oxford University Press and IBH, New Delhi and Intermediate Technology, London, UK, 273 pp.
Chatrvedi, A. N. (1994). Sequestration of atmospheric carbon for India’s forests. Ambio, 23
Chee, Y. E. (2004). An ecological perspective on the valuation of ecosystem services. Biological Conservation, 120(4), 549-565.
Chomitz, K.M. (2002). Baseline, Leakage and Measurement Issues: How do Forestry and Energy Projects Compare? Climate Policy, 2, 35-49.
Co Stanza, R., R. d'Arge, Et Al. (1998). The Value Of The World's Ecosystem Services And Natural Capital. Ecological Economics ,25(1), 3-15.
Chopra Kanchan, Bhattacharya B B and Kumar Pushpam (2002). Contribution of forestry sector to gross domestic product (GDP) in India.Institute of Economic Growth. Report submitted to Ministry of Environment and Forests, Government of India
Dadhwal, V.K., Shukla, N., Vora, A.B. (1997). A review and estimate of litter fall carbon flux in India. Indian Forester, 45-52.
FAO (1993) Forest Statistics, Today And Tomorrow, 1945-1993…. 2010.Food and Agriculture Organisation FAO, Rome.
FAO (1995). Forest Resource Assessment (1990). FAO paper no 124 FAO Rome.
FSI. (2001). State of Forest Report 2001. Forest Survey of India, Ministry of Environment and Forests, Dehra Dun.
Geevan C P (2004), National Environmental Policy Ascendance of Economic Factors. Economic and Political Weekly 39(43), 4686-4689

For Official Use Only Special Assistance for Project Formation (SAPROF) for
Uttar Pradesh Natural Resources Management and Poverty Alleviation Project (UPNRMPAP)
Final Report - Volume II Annex12-22
Gundimeda, H.S. (2003). Carbon Budget of the Indian Forest Ecosystem. Climatic Change 56 (3), 291-319.
Gundimeda H.S. (2000). Estimates of biomass in Indian forests. Biomass and Bioenergy 19(4), 245-258.
Gundimada S.H (2004a). Carbon Sequestration in Forests: Potential and Incremental Costs. Indian and Global Climate Change Oxford University Press 2004.
Gundimeda, H.S. (2004 b), How sustainable is the sustainable development objective of CDM in developing countries like India? Forest policy and economics, 6, 329-343
Gundimeda H.S (2004c) Carbon Sequestration In Forests: Potential And Incremental costs 66-193 Perspective on economics and policy from a developing country India and global climate change Oxford university press 2004
Gupta, R. K., Rao, D. L. N. (1994). Potential of wastelands for sequestering carbon by reforestation. Current science 66 (5), 378-380.
Hill I, Shield, H (1998). Incentives for Joint Forest Management in India. Technical Analytical methods and case studies. Paper no 394 World Bank.
Houghton, J.T., Jenkins, G.J., Ephramus, J.J. Eds. (1990). Climate change: the IPCC Scientific Assessment Final Report of Working Groups 1. Cambridge University Press,NewYork
Hua, N. (2002). Value theory for measuring value of forest resources. Journal of Beijing Forestry University 24(1), 69-73.
Huston, M. A. and Marland, G. (2003). Carbon management and biodiversity. Journal Of Environmental Management, 67(1), 77-86.
Indu K. Murthy, Murali, K.S., Hegde G.T., Bhat P.R. and Ravindranath N.H. (2002). Research Indu K. Murthy, Murali, K.S., Hegde G.T., Bhat P.R. and Ravindranath N.H. (2002). Research Article, A comparative analysis of regeneration in natural forests and joint forest management plantations in Uttara Kannada district, Western Ghats. Current Science, 83 (11), 1358-1364.
Jeeva V., Hooda N. and Singsit S., (2003). Clean development mechanism and forestry sector: Challenge, opportunities and issues. Indian Forester, 129 (7): 826-839.
Jong Ben H.J.De, Tipper Richard, Montoya-Gomez Guillermo 2000. Analysis .An economic analysis of the potential for carbon sequestration by forests: evidence from southern Mexico. Ecological Economics, 33, 313-327
Jung, Martina (2003). The Role of Forestry Sinks in the CDM - Analysing the Effects of Policy Decisions on the Carbon Market HWWA Discussion Paper 241 Hamburg Institute of International Economics (HWWA). Hamburg, Germany
Kadekodi ,Gopal K., Ravindranath N.H. (1997). Macro-economic analysis of forestry options on carbon sequestration in India. Ecological Economics, 23 (3), 201-223
Kapoor, R. P. (1992). In: The Ministry of Agriculture, Land Use Statistics. Government of India, New Delhi.
Kumar.S. (2002). Does Participation in Common Pool Resource Management Help the Poor? A Social Cost–Benefit Analysis of Joint Forest Management in Jharkhand, India. World Development 30 (5), 763-782.
Lal, A. K. and Singh, P.P. (2003). Economic worth of carbon stored in aboveground biomass of India's forests. Indian Forester, 129(7), 874-880.
Lal, M and Singh Roma. (2000). Carbon sequestration potential of Indian forests. Environment Monitoring and Assessment, 60(3), 315-327
Lal .R (2004), Soil Carbon Sequestration in India. Climatic Change 65 (3), 277-296
Makundi, W.J., Sathaye, J. and Masera O (1996), Carbon emissions and sequestration in forests: summary of case studies from seven developing countries. Climatic Change, 33.
Niles, J.O., Brown, S., Pretty, J., Ball, A., Fay, J., (2001). Potential carbon mitigation and income in developing countries from changes in use and management of agricultural and forest lands, Center for Environment and Society Occasional Paper 2001-04, University of Essex.
Noble, I., Scholes, R. (2000). Sinks and the Kyoto Protocol. Climate Policy (1), 5–25.
Pandey, D.N. (2000), Viewpoint: Carbon sequestration in Agro forestry systems. Climatic Policy, 2,367-377

For Official Use Only Special Assistance for Project Formation (SAPROF) for
Uttar Pradesh Natural Resources Management and Poverty Alleviation Project (UPNRMPAP)
Final Report - Volume II Annex12-23
Pandey, D.N. (2002). Global climate change and carbon management in multifunctional forests. Current Science, 83(5), 593-602.
Patel V.J., A New Strategy For Increased Biomass Through High Density Energy Plantation. Jivrajbhai Patel Agro forestry Center Surendrabag Kardej, Gujarat .
Planning Commission (2001), Report Of The Task Force On Greening India For Livelihood Security And Sustainable Development. Planning Commission, Government Of India
Poffenberger, M., Ravindranath, N.H., Pandey, D.N., Murthy, I.K., Bist, R., Jain, D., (2001). Communities and Climate Change: The Clean Development Mechanism and Village-based Forest Restoration in Central India: A Case Study from Harda Forest Division. Community Forestry International, Inc., Santa Barbara, CA.
Poffenberger, M., D’Silva, E., Ravindranath, N.H., Pingle, U., Murthy, I.K., Tuttle, A., (2002). The Clean Development Mechanism and Village based Forest Restoration: A Case Study from Adilabad District, Andhra Pradesh, India. Community Forestry International, Inc., Santa Barbara, CA.
Prasad, R., Pandey, D.N., Kotwal, P.C., (2000). Trees Outside Forests in India: A National Assessment. Indian Institute of Forest Management, Bhopal, India.
Rai, S.N., Chakrabarti, S.K., (2001). Demand and supply of fuel wood and timber in India. Indian Forester, 127, 263–279.
Ravindranath, N. H., Somasekhar B. S., and Gadgil, M: (1996).'Carbon flows in Indian forest. Climatic Change, 35 (3), 297-320.
Ravindranath N.H. and Somashekhar B.S. (1995), Potential and economics of forestry options for carbon sequestration in India. Biomass and Bioenergy 8(5), 323-336.
Ravindranath N.H.and Sukumar R. (1998) Climate Change and Tropical Forests in India. Climatic Change 39 (2-3), 563-581.
Ravindranath, N. H., Sudha, P. and Sandhya Rao, (2001). Forestry for Sustainable Biomass Production and Carbon Sequestration in India. Mitigation and Adaptation Strategies for Global Change, 6, 233-256.
Ravindranath, N.H. and Hall, D. O. (1995). Biomass, Energy and Environment- A developing country perspective from India, Oxford University Press, Oxford.
Sathaye, J. and Ravindranath, N. H (1998). Climate Change Mitigation in the Energy and Forestry Sectors of Developing Countries, Annual Review of Energy and Environment, 23, 387- 437.
Sathaye, J., Makundi, W., Andrasko, R., Boer, R., Ravindranath, N., Sudha, P., Rao, S., Lasco, R., Pulhin, E., Masera, O., Ceron, A., Ordonez, J., Deying, X., Zhang, X., Zuomin, S., (2001). Carbon mitigation potential and costs of forestry options in Brazil, China, India, Indonesia, Mexico, The Philippines and Tanzania. Mitigation and Adaptation Strategies for Global Change 6,185–211.
Saxena, A., Jha, M. N., Rawat, J K (2003). Forests as carbon sink –Indian scenario. Indian Forester, 129 (7), 807-814.
Schlamadinger, B. and Karjalainen, T. et al.: (2000), ‘Afforestation, reforestation and deforestation activities’, in R.T. Watson et al. (eds.), Land Use, Land-use Change, and Forestry, A Special Report of the Intergovernmental Panel on Climate Change. Cambridge University Press. 377 pp.
Smith, J., Scherr, S. (2001). Capturing the value of forest carbon for local livelihoods. CIFOR and Forest Trends, CIFOR, Bogor.
Smith, J. and S.J. Scherr (2002) Forest Carbon and Local Livelihoods; An Assessment of Opportunities and policy Recommendations. Bogor: CIFOR.
Smith J. and Scherr Sara J. (2003) Capturing the Value of Forest Carbon for Local Livelihoods World Development, 31 (12), 2143–2160
Subak, Susan, (2002). Forest certification eligibility as a screen for CDM sinks projects, Climate Policy, 2 (4), 335-351
TERI (The Energy Research Institute)(1998), India National Report on Asia Least-Cost Greenhouse Gas Abatement Strategy (ALGAS), New Delhi: TERI.
Tietenberg, T., Environmental and Natural Resource Economics. Harper Collins Publishers, New York.Woodwell, G.M.,(1993). Forests: What in the world are they for? In: Ramakrishna, K., Woodwell, G.M. Eds. World Forests for the Future: Their Use and Conservation. Yale University Press, New Haven, CT, pp.
For Official Use Only Special Assistance for Project Formation (SAPROF) for
Uttar Pradesh Natural Resources Management and Poverty Alleviation Project (UPNRMPAP)
Final Report - Volume II Annex12-24
1-20.
Trexler, M.C. and Haugen, C. (1994). Keeping it green: tropical forestry opportunities for mitigating climate change. World Resource Institute, Washington DC.
UNFCCC, 2001, Uniform Reporting Format: Activities Implemented Jointly underthePilotPhase,SIFCarbonSequestrationProjecthttp://unfccc.int/program/coop/aij/aijact01/chlusa-01-01.html
UNFCCC, 2003, Land Use, Land-use change and Forestry: Definitions and Modalities for Including Afforestation and Reforestation Activities under Article 12 of the Kyoto Protocol in the First Commitment Period: Draft ConsolidatedText,FCCC/SBSTA/2003/4, http://unfccc.int/resource/docs/2003/sbsta/04.pdf
Verma, Madhu (2000). Economic Valuation of Forests of Himachal Pradesh. Report submitted to International Institute of Environment and Development, London U.K. on Economic component of Himachal Pradesh Forestry Sector Review carried out with the technical assistance of IIED and financial assistance of DFID.
Vrolijck, C., Grubb, M. (2000). Quantifying Kyoto: How will COP6 decisions affect the market? Report of a workshop organized by the RIIA, UK
Walsh, M. J. (1999). Maximizing financial support for biodiversity in the emerging Kyoto protocol markets. The Science of The Total Environment, 240(1-3), 145-156.
Yamagata, Y., Alexandrov, G. (2001). Global Potential of carbon sinks under the Kyoto Protocol. In: Matsuno, T., Kida, H. (Eds.), Present and Future of Modeling Global Environmental Change: Toward Integrated Modeling. Terrapub, Japan.
TERI 2002. Defining and Integrated Strategy for India, a document for discussion, debate and action.
TERI 2005. Discussion paper submitted to MoEF for the Seminar of Governmental Experts at SBSTA/SBI 14, May 2005 India’s energy scenario based on results from the MARKAL model.
Ministry of Non-conventional Energy Sources, Government of India, Annual Report, 2005.
NSS 2005, CDM Implementation in India: The National Strategy Study.
Houghton, 2003: “Revised estimates of the annual net flux of carbon to the atmosphere from changes in land use and land management 1850-2000”. Tellus 55B: 378-390.
India Report: Regional Workshop on Forests and Climate Change: Preparing for Decisions on Land Use & Forestry at COP9 16 – 17 October 2003, Traders Hotel, Manila, Philippines
Aukland, L, Moura, CP, Bass, S & Carr, R 2002, Laying the Foundations for Clean Development:Preparing the Land Use Sector. A Quick Guide to the Clean Development Mechanism, IIED, London.
Cacho, OJ, Hean, RL & Wise, RM 2003, 'Carbon Accounting Methods and Reforestation Incentives', the Australian Journal of Agricultural and Resource Economics, vol. 47, no. 2, pp. 153-79.

For Official Use Only Special Assistance for Project Formation (SAPROF) for
Uttar Pradesh Natural Resource Management and Poverty Alleviation Project (UPNRMPAP)
Final Report- Volume II
Special Assistance for Project Formation
for Uttar Pradesh Natural Resource Management and Poverty Alleviation Project
(UPNRMPAP)
Final Report
Volume II: ANNEXES
ANNEX-13 DRAFT PROJECT STATUS REPORT
(PSR)
For Official Use Only Special Assistance for Project Formation (SAPROF) for
Uttar Pradesh Natural Resources Management and Poverty Alleviation Project (UPNRMPAP)
Final Report - Volume II i
Special Assistance for Project Formation (SAPROF)
for
Uttar Pradesh Natural Resource Management and Poverty Alleviation Project (UPNRMPAP)
Final Report
Volume II: Annexes
Annex 13 PROJECT STATUS REPORT (PSR)
Table of Contents 1. Project Description (Relevance)................................................................................ Annex13- 1
1.1 Project Objective............................................................................................ Annex13- 1 1.2 Necessity and Priority of the Project.............................................................. Annex13- 1 1.3 Rationale of the Project Design...................................................................... Annex13- 2
2 Project Implementation (Efficiency) .......................................................................... Annex13-4 2.1 Project Scope.................................................................................................. Annex13- 4 2.2 Implementation Schedule............................................................................... Annex13- 7 2.3 Project Cost .................................................................................................... Annex13- 8 2.4 Organisations for Implementation................................................................ Annex13- 10 2.5 Precautions ....................................................................................................Annex13- 11 2.6 Photographs of Output of the project (P/R and PCR): Attachment...............Annex13- 11
3. Benefit Derived from the Project (Effectiveness) ................................................... Annex13- 12 3.1 Operational and physical condition of each facility developed/supplied by the
project. ......................................................................................................... Annex13- 12 3.2 Precautions ................................................................................................... Annex13- 12 3.3 Environmental and Social Impacts............................................................... Annex13- 12 3.4 Quantative and Qualitative Data of Monitoring Indicators.......................... Annex13- 13 3.5 Operation Indicator and Effect Indicator...................................................... Annex13- 14 3.6 Monitoring Plan for the Indicators ............................................................... Annex13- 14 3.7 Achievement of the Project Objective ......................................................... Annex13- 14
4 Operation and Maintenance (O&M) (Sustainability).............................................. Annex13- 15 4.1 O&M and Management................................................................................ Annex13- 15 4.2 O&M Cost and Budgets ............................................................................... Annex13- 15
5 Evaluation ............................................................................................................... Annex13- 16 5.1 JBIC and Borrower/Executing Agency Performance................................... Annex13- 16 5.2 Overall evaluation ........................................................................................ Annex13- 16 5.3 Lessons Learnt and Recommendations ........................................................ Annex13- 16
Attachments Attachment A13-1 Location Map........................................................................................Annex 13-A1 Attachment A13-2 Consulting Services Terms of Reference ..............................................Annex 13-A2 Attachment A13-3 Implementation Schedule .....................................................................Annex 13-A4 Attachment A13-4 Organisation Chart for Implementation ..............................................Annex 13-A14 Attachment A13-5 Procurement and Implementation Method..........................................Annex 13-A15 Attachment A13-7 Supporting Data for Computing FIRR................................................Annex 13-A21
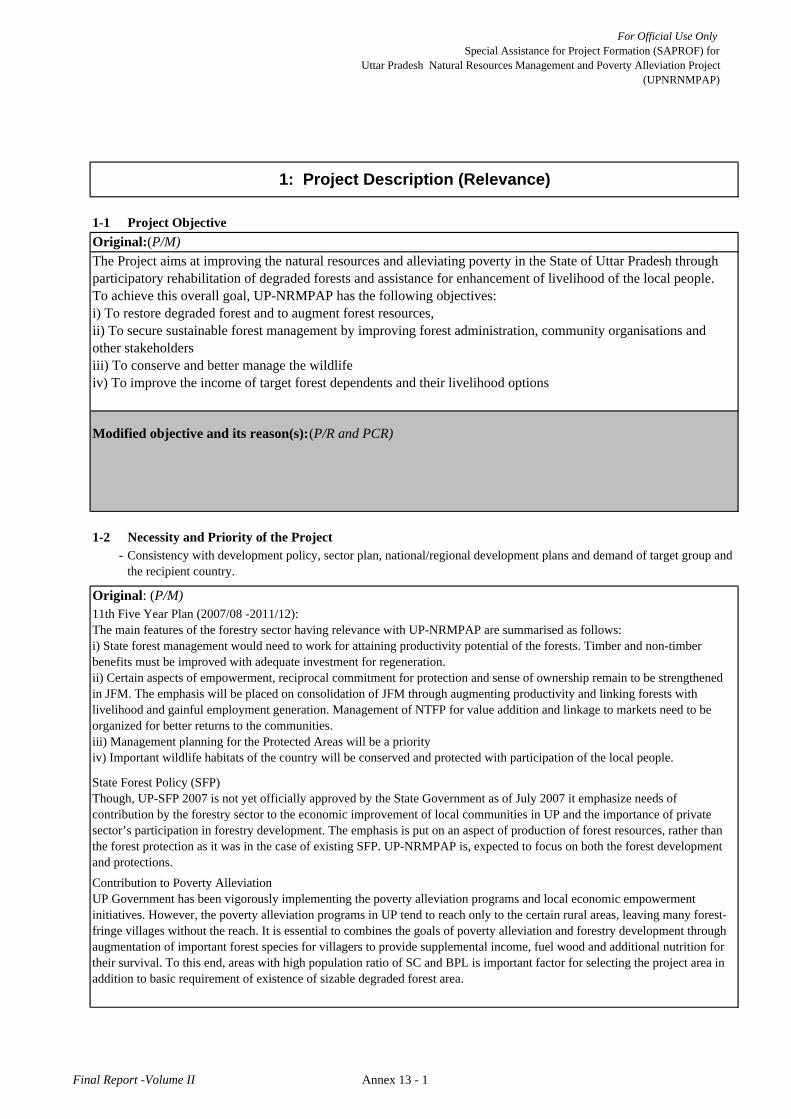
For Official Use OnlySpecial Assistance for Project Formation (SAPROF) for
Uttar Pradesh Natural Resources Management and Poverty Alleviation Project(UPNRNMPAP)
L/A No. #REF!PSR prepared on #REF!
1-1 Project ObjectiveOriginal:(P/M)
Modified objective and its reason(s):(P/R and PCR)
1-2 Necessity and Priority of the Project-
Original: (P/M)
1: Project Description (Relevance)
11th Five Year Plan (2007/08 -2011/12):The main features of the forestry sector having relevance with UP-NRMPAP are summarised as follows:i) State forest management would need to work for attaining productivity potential of the forests. Timber and non-timberbenefits must be improved with adequate investment for regeneration.ii) Certain aspects of empowerment, reciprocal commitment for protection and sense of ownership remain to be strengthenedin JFM. The emphasis will be placed on consolidation of JFM through augmenting productivity and linking forests withlivelihood and gainful employment generation. Management of NTFP for value addition and linkage to markets need to beorganized for better returns to the communities.iii) Management planning for the Protected Areas will be a priorityiv) Important wildlife habitats of the country will be conserved and protected with participation of the local people.
Consistency with development policy, sector plan, national/regional development plans and demand of target group andthe recipient country.
Contribution to Poverty AlleviationUP Government has been vigorously implementing the poverty alleviation programs and local economic empowermentinitiatives. However, the poverty alleviation programs in UP tend to reach only to the certain rural areas, leaving many forest-fringe villages without the reach. It is essential to combines the goals of poverty alleviation and forestry development throughaugmentation of important forest species for villagers to provide supplemental income, fuel wood and additional nutrition fortheir survival. To this end, areas with high population ratio of SC and BPL is important factor for selecting the project area inaddition to basic requirement of existence of sizable degraded forest area.
The Project aims at improving the natural resources and alleviating poverty in the State of Uttar Pradesh throughparticipatory rehabilitation of degraded forests and assistance for enhancement of livelihood of the local people.To achieve this overall goal, UP-NRMPAP has the following objectives:i) To restore degraded forest and to augment forest resources,ii) To secure sustainable forest management by improving forest administration, community organisations andother stakeholdersiii) To conserve and better manage the wildlifeiv) To improve the income of target forest dependents and their livelihood options
Annex 1
State Forest Policy (SFP)Though, UP-SFP 2007 is not yet officially approved by the State Government as of July 2007 it emphasize needs ofcontribution by the forestry sector to the economic improvement of local communities in UP and the importance of privatesector’s participation in forestry development. The emphasis is put on an aspect of production of forest resources, rather thanthe forest protection as it was in the case of existing SFP. UP-NRMPAP is, expected to focus on both the forest developmentand protections.
Final Report -Volume II Annex 13 - 1

For Official Use OnlySpecial Assistance for Project Formation (SAPROF) for
Uttar Pradesh Natural Resources Management and Poverty Alleviation Project(UPNRNMPAP)
Attachment(s):Actual: (P/R,PCR)
Attachment(s):required only when they are revised.
1-3 Rationale of the Project Design-
Original: (P/M)
Timing, scale, technology of the project
The timing: The Project will be 8 years of duration starting from 2008/9 to 2015/16, in cosideration of capacities ofstakholders and time required to conduct activities in sustainable manners. The Project will be divided into i) preparatorystage, ii) implementation stage, and iii) consolidating stage.Preparatory Stage:The preparatory works of the Project starts from the first year and continued up to 4th year. Long period is dedicated for topreparation to maximize impacts of the project intervention as well time required organizing and consolidating JFMCs andEDCs. The preparatory work includes PMU/DMU/FMU establishment, recruitment of additional staff for the Project, selectionof possible areas, and procurement of the Project consultant, preparation of necessary manuals, guidelines and handbooks.Furthermore selection of target villages for JFMCs, and EDCs, site demarcation/ ground surveys/ mapping would be conductedand specific intervention sites will be identified in three batches: These work are divided into multiple batches in considerationof implementation capacity of UPFD as well as that of JFMCs/EDCs.Implementation Stage:Supporting components such as institutional strengthening of PMU/DMU/FMUs, capacity building activities for JFMCs and EDConsolidating Stage:From the seventh year, the work would focus mainly on the maintenance of work completed during the forgoing years.In the final year, the Phase-out and Phase-in work will be undertaken for the smooth transition of the project into a regular institu
Site: The project area covers 109 ranges within 20 forest divisions, which are located in three different regions of the state (i.e.Terai, Vindhyan, and Bundelkhand). Forest area in these project targeted forest divisions sums up to approximately11,699km2 , which accounts for 71% of the total forest area in the State. Project area is forest concentrated regions of thestate, where forest dependency and degradation are relatively higher than other regions of the State. In addition, there aretrends of high ratio of BPL and SC in the regions, resulting in higher frequency of poverty by forest dependent communities.The project areas is of the priority area for both improving degraded forest resources and alleviating poverty of surroundingcommunities. Therefore, it is reasonable to select the regions as the project area.
Scale : To achieve project objectives and contribute to achieve the overall goal described in 1-1, project will be implementedin following scales: i) Total of 805km2 of forest area will be directly intervened by the Project. Of the total projectintervention area, 603km2 will be implemented by JFMC, ii) 800 JFMCs (existing and newly established), 140 EDCs (existingand newly established) will be targeted during the Project duration.
Fund Allocation:During the Tenth Five Year Plan (2002/03 – 2006/07), UPFD has spend approximately Rs.4.9 billion for various planschemes. Though not yet finalized as of July 2007, the State Government would allocate more budget to the forestry sectorunder the Eleventh Five Year Plan (2007/8 – 20011/12), which already include UP-NRMPAP as an externally-aided project. .
Complemental Effect on Outputs and Achievements of World Bank-funded Forestry Project:The World Bank (WB) supported three major forestry projects since the 1980s. Those projects were ended at the early 2000sand contributed to promotion of eco-development committees and also introduced the concept of JFM. UP-NRMPAP willcomplement the achievements of WB-funded projects. UP-NRMPAP will focus on the landless communities and providelivelihood alternatives to them; it will stress the restoration of appropriate environment and ecosystem by the re-generation ofdegraded forestlands and conservation of wildlife; it will make significant investment on the capacity building of UPFD,community organisations, NGOs and other stakeholders for sustainable development;
Final Report -Volume II Annex 13 - 2

For Official Use OnlySpecial Assistance for Project Formation (SAPROF) for
Uttar Pradesh Natural Resources Management and Poverty Alleviation Project(UPNRNMPAP)
Actual: (P/R,PCR)
Technology : UPFD and forestry sector of the State already possess necessary forestry technology to implement the Project.These existing technologies will be fully utilized in consideration of implementers' capacities and sustainability after theproject. In addition, simple, user friendly MIS system will be developed to ensure integrity of information/records andcontribute to project management efficiency.
These quantities are determined in consideration of land/ resource availability and capacities/ work loads of field level UPFDstaff and JFMC members.- The average direct intervention areas for JFMCs will be approximately 80 ha /JFMC, which deemed to be manageable sizefor a single JFMCs.- 109 ranges and 758 beats (under the range) will be involved in the project as the frontline of UPFD, in average, each rangeneed to supervise approximately 9 JFMCs/EDCs, and each beat need to cover approximately 1 JFMCs/EDCs. These arereasonable number for each of range/beat without affecting other duties of such front line offices and avoiding excessiverecruitment of staff only for the Project activities.
Final Report -Volume II Annex 13 - 3
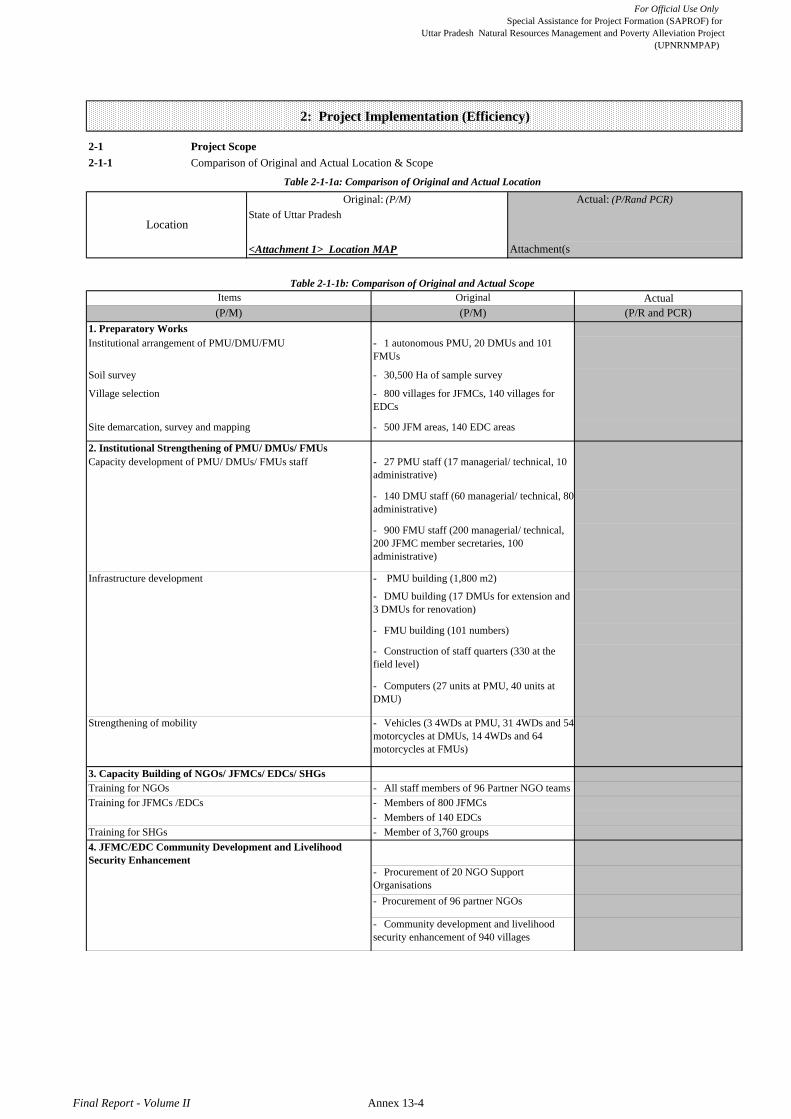
For Official Use OnlySpecial Assistance for Project Formation (SAPROF) for
Uttar Pradesh Natural Resources Management and Poverty Alleviation Project(UPNRNMPAP)
L/A No.
2-1 Project Scope2-1-1 Comparison of Original and Actual Location & Scope
<Attachment 1> Location MAP Attachment(s
OriginalItems
Training for SHGs - Member of 3,760 groups- Members of 140 EDCs
- All staff members of 96 Partner NGO teams- Members of 800 JFMCs
- Procurement of 96 partner NGOs
- Community development and livelihoodsecurity enhancement of 940 villages
=Info!F2
2: Project Implementation (Efficiency)
Table 2-1-1b: Comparison of Original and Actual Scope
(P/R and PCR)
- Procurement of 20 NGO SupportOrganisations
State of Uttar Pradesh
Training for NGOs
4. JFMC/EDC Community Development and LivelihoodSecurity Enhancement
(P/M)(P/M)Actual
Table 2-1-1a: Comparison of Original and Actual Location
Actual: (P/Rand PCR)Original: (P/M)
Strengthening of mobility
1. Preparatory Works
Location
3. Capacity Building of NGOs/ JFMCs/ EDCs/ SHGs
Training for JFMCs /EDCs
- Computers (27 units at PMU, 40 units atDMU)
Village selection - 800 villages for JFMCs, 140 villages forEDCs
Site demarcation, survey and mapping - 500 JFM areas, 140 EDC areas
Infrastructure development
- Vehicles (3 4WDs at PMU, 31 4WDs and 54motorcycles at DMUs, 14 4WDs and 64motorcycles at FMUs)
- 27 PMU staff (17 managerial/ technical, 10administrative)
Institutional arrangement of PMU/DMU/FMU - 1 autonomous PMU, 20 DMUs and 101FMUs
Soil survey - 30,500 Ha of sample survey
- PMU building (1,800 m2)
- 140 DMU staff (60 managerial/ technical, 80administrative)
- DMU building (17 DMUs for extension and3 DMUs for renovation)
- FMU building (101 numbers)
- 900 FMU staff (200 managerial/ technical,200 JFMC member secretaries, 100administrative)
- Construction of staff quarters (330 at thefield level)
2. Institutional Strengthening of PMU/ DMUs/ FMUsCapacity development of PMU/ DMUs/ FMUs staff
Final Report - Volume II Annex 13-4

For Official Use OnlySpecial Assistance for Project Formation (SAPROF) for
Uttar Pradesh Natural Resources Management and Poverty Alleviation Project(UPNRNMPAP)
- 140 new EDCs
- 700 Ha of fuel wood / fodder communityplantation
- 1 National Park (Dudhuwa), 6 WLSanctuaries
- Moderately dense forest area (40-70%):32,100ha- Open, barren forest area (-40%): 19,200ha
- Eco-tourism (4 sites)
- Vegetative enrichment of 2 biodiversity hotspots
- Support for 940 village animators
- Support for 800 forest-based micro-enterprises/SHGs
- Support for 940 natural resource -basedmicro-enterprises/SHGs
- Support for 940 non-natural resource-basedmicro-enterprises/SHGs- Support for 20 SHG consortiums
7. Wildlife Conservation & Management
- SWC works (8 check dams, 132 gullyplugging)
- Boundary marking (325 km), check posts,watch towers
- Drainage line treatment (28,600ha)
6. JFM Forest Area Development & Management- Total JFM intervention area: 60,300 ha
- Very dense forest area (70%-): 9,000ha
5. Departmental Forest Area Development & Management- Total intervention area: 20,200 ha
- Fire line establishment (6,635km)
- Renovation of permanent nursery (118 units)
- Establishment of clonal planting stock nursery(2 units)
- Establishment of NWFP Research Centre (2units)
- Drainage line treatment (16,500ha)
- Fire line establishment (2,225km)- Fire fighting equipment (93 sets)
- JFM nursery establishment (289 units)
- Very dense forest area (70%-): 4,300ha
- Moderately dense forest area (40-70%):7,000ha
- Open, barren forest area (-40%): 8,900ha
- Fixing forest boundary pillars (1,120km)
Final Report - Volume II Annex 13-5

For Official Use OnlySpecial Assistance for Project Formation (SAPROF) for
Uttar Pradesh Natural Resources Management and Poverty Alleviation Project(UPNRNMPAP)
Survey on AR-CDM
- Project boundary Survey
- Socio-economic/ Natural EnvironmentSurvey
- National consultant: 162 man-month
Progress monitoring
MIS and GIS
- Monthly, quarterly and annually
- 1 units each
- All the JFMCs/EDCs
- International consultant: 100 man-month12. Consulting Services
10. Monitoring and Evaluation
11. Phase Out / Phase In Works
Socio-economic survey - Socio-economic baseline survey andperiodical socio-economic impact assessment(70 villages with 70,000 sample household +30 control villages with 30,000 households)
Publication
9. Communication and Publication
- 40 schools x 5 citiesChildren’s forest
- 2,000 copies of newsletter per quarter
- Survey and selection of 3,600 new candidateplus tree, maintenance of 3,660 old candidateplus tree
- Establishment/improvement of seedlingorchard (27 ha)
- Establishment/improvement of seedproduction area (36 ha)
- Standing stock sample survey (82 plots)
- Project GHG emission Survey
- Entire project intervention area (satelliteimage analysis)
- Sample survey on standing stock (161 plots)
- Entire target PAs and fringe areas (inventoryof fauna and flora)
- 3,000 copies of leaflets- 1,000 copies of brochures- 200 copies of annual report per year
Survey on physical impact of Project
8. Survey and ResearchSurvey and research for forest development and management
Survey and research for wildlife conservation and management - Survey and study of hotspot (2 sites)
- Land Eligibility of Project Area (approx.53,000ha)
- Biomass Surveys (Baseline, ExistingPlantations)
Note:<Attachment 2> Consulting Service Terms of Reference
Final Report - Volume II Annex 13-6

For Official Use OnlySpecial Assistance for Project Formation (SAPROF) for
Uttar Pradesh Natural Resources Management and Poverty Alleviation Project(UPNRNMPAP)
2-1-2 Reason(s) for the modification if there have been any.(P/R and PCR)
2-2 Implementation Schedule2-2-1 Comparison of Original and Actual Schedule
(P/M)
2-2-2 Reasons for any changes of the schedule, and their effects on the project.(P/R and PCR)
ActualOriginal
JFMC/EDC Community Development and Livelihood
March 2008
Monitoring and Evaluation Year 1 to Year 8 (2008/09 - 2015/16)
(P/M) (P/R and PCR)
* Project Completion was defined as completion of afforstation and disbursements.Please state not only the most updated schedule but also other past revisions chronologically.(for example, defined as the expiration of the 1-year defect liability period after the hand-over of all materials, equipment and facilities at the time of L/A).
Year 1 to Year 8 (2008/09 - 2015/16)
Project Consultant Year 1 to Year 4 (2008/09 - 2011/12)Year 8 ~ (2015/16~)
Year 1 to Year 7 (2008/09 - 2014/15)
Phase-out/phase-in Works
Description
Wildlife Conservation and ManagementSurvey and Research
Year 2 to Year 8 (2009/08 - 2015/16)Year 3 to Year 8 (2010/11 - 2015/16)Year 2 to Year 8 (2009/08 - 2015/16)
Items
JFM Forest Development and Management
L/A Signing
Year 1 to Year 8 (2008/09 - 2015/16)
Year 1 to Year 4 (2008/09 - 2011/12)Selection of Consultant TBA after L/A Signing
Year 2 to Year 8 (2009/08 - 2015/16)Year 2 to Year 6 (2009/08 - 2013/14)
Table 2-2-1: Comparison of Original and Actual Schedule
Departmental Forest Development and Management
Preparatory WorksInstitutional Strengthening of PMU/DMUs/FMUsCapacity Building of NGO/JFMC/EDC/SHG
Cause and effect Corrective Action
Communication and Publication
Project Completion Date* End of March, 2016Attachment3: Detailed Implementation Schedule
Final Report - Volume II Annex 13-7
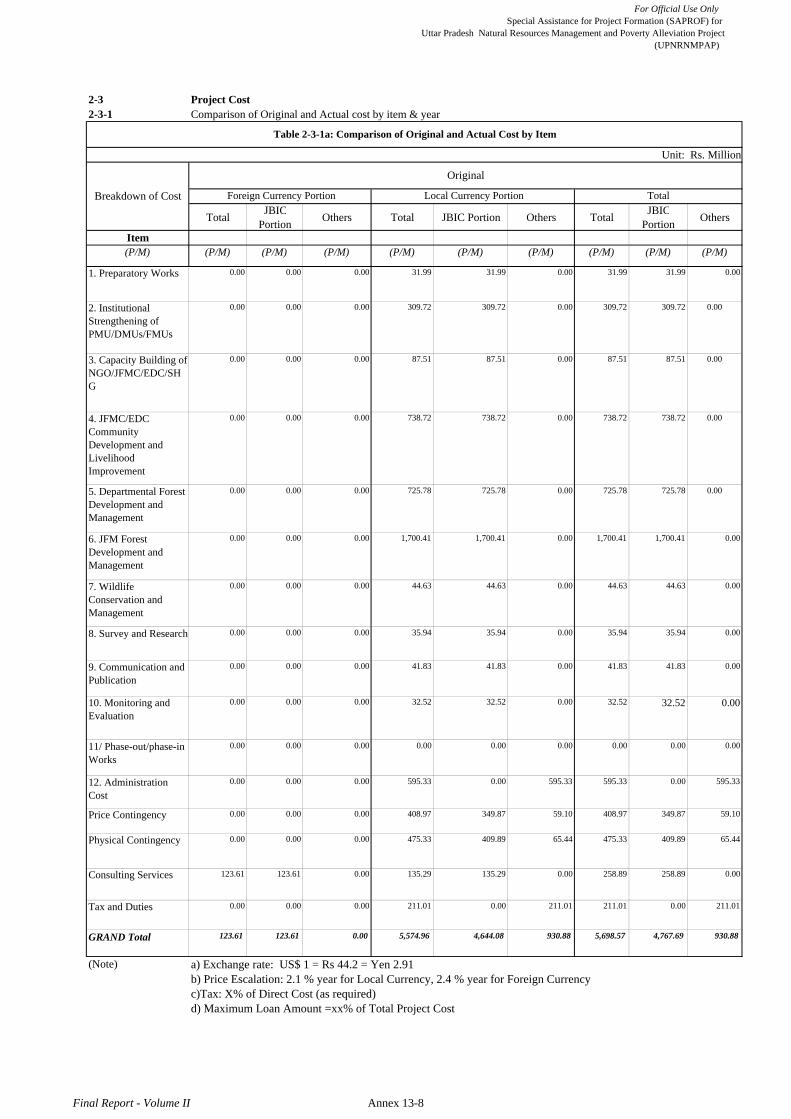
For Official Use OnlySpecial Assistance for Project Formation (SAPROF) for
Uttar Pradesh Natural Resources Management and Poverty Alleviation Project(UPNRNMPAP)
2-3 Project Cost2-3-1 Comparison of Original and Actual cost by item & year
Unit: Rs. Million
Total JBICPortion Others Total JBIC Portion Others Total JBIC
Portion Others
Item(P/M) (P/M) (P/M) (P/M) (P/M) (P/M) (P/M) (P/M) (P/M) (P/M)
1. Preparatory Works 0.00 0.00 0.00 31.99 31.99 0.00 31.99 31.99 0.00
2. InstitutionalStrengthening ofPMU/DMUs/FMUs
0.00 0.00 0.00 309.72 309.72 0.00 309.72 309.72 0.00
3. Capacity Building ofNGO/JFMC/EDC/SHG
0.00 0.00 0.00 87.51 87.51 0.00 87.51 87.51 0.00
4. JFMC/EDCCommunityDevelopment andLivelihoodImprovement
0.00 0.00 0.00 738.72 738.72 0.00 738.72 738.72 0.00
5. Departmental ForestDevelopment andManagement
0.00 0.00 0.00 725.78 725.78 0.00 725.78 725.78 0.00
6. JFM ForestDevelopment andManagement
0.00 0.00 0.00 1,700.41 1,700.41 0.00 1,700.41 1,700.41 0.00
7. WildlifeConservation andManagement
0.00 0.00 0.00 44.63 44.63 0.00 44.63 44.63 0.00
8. Survey and Research 0.00 0.00 0.00 35.94 35.94 0.00 35.94 35.94 0.00
9. Communication andPublication
0.00 0.00 0.00 41.83 41.83 0.00 41.83 41.83 0.00
10. Monitoring andEvaluation
0.00 0.00 0.00 32.52 32.52 0.00 32.52 32.52 0.00
11/ Phase-out/phase-inWorks
0.00 0.00 0.00 0.00 0.00 0.00 0.00 0.00 0.00
12. AdministrationCost
0.00 0.00 0.00 595.33 0.00 595.33 595.33 0.00 595.33
Price Contingency 0.00 0.00 0.00 408.97 349.87 59.10 408.97 349.87 59.10
Physical Contingency 0.00 0.00 0.00 475.33 409.89 65.44 475.33 409.89 65.44
Consulting Services 123.61 123.61 0.00 135.29 135.29 0.00 258.89 258.89 0.00
Tax and Duties 0.00 0.00 0.00 211.01 0.00 211.01 211.01 0.00 211.01
GRAND Total 123.61 123.61 0.00 5,574.96 4,644.08 930.88 5,698.57 4,767.69 930.88
(Note) a) Exchange rate: US$ 1 = Rs 44.2 = Yen 2.91b) Price Escalation: 2.1 % year for Local Currency, 2.4 % year for Foreign Currencyc)Tax: X% of Direct Cost (as required)d) Maximum Loan Amount =xx% of Total Project Cost
Original
Foreign Currency Portion Local Currency Portion Total
Table 2-3-1a: Comparison of Original and Actual Cost by Item
Breakdown of Cost
Final Report - Volume II Annex 13-8
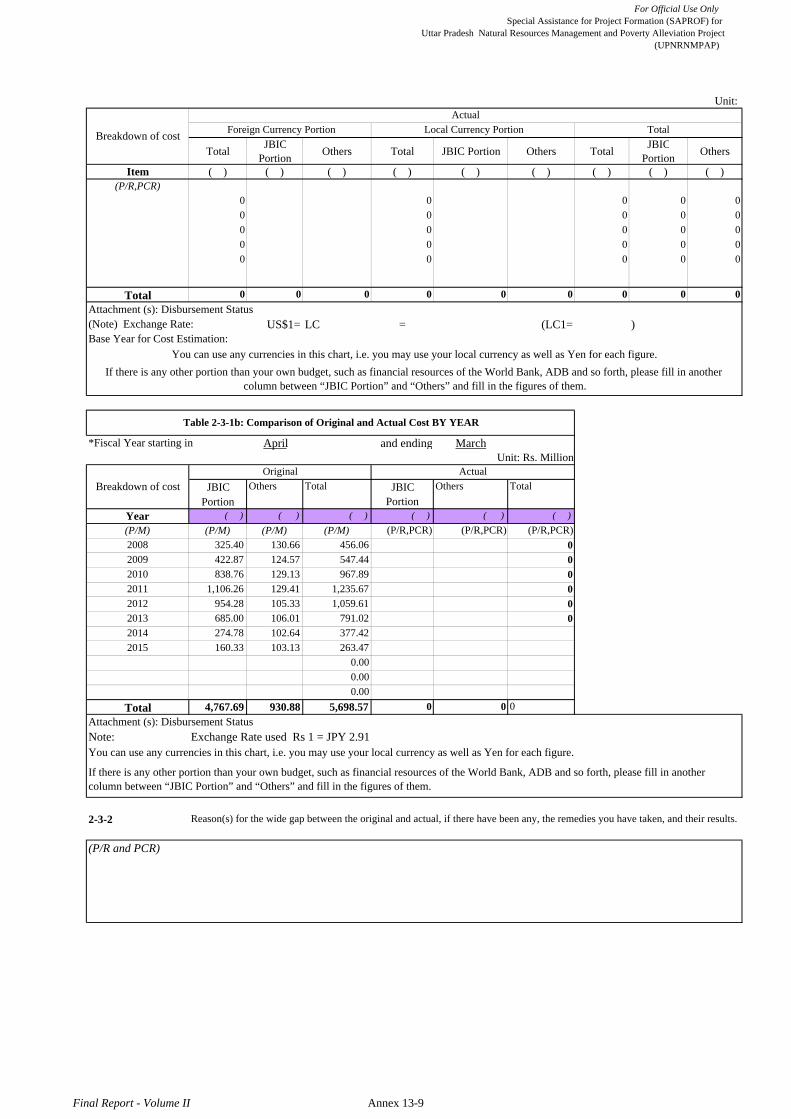
For Official Use OnlySpecial Assistance for Project Formation (SAPROF) for
Uttar Pradesh Natural Resources Management and Poverty Alleviation Project(UPNRNMPAP)
Unit:
Total JBICPortion Others Total JBIC Portion Others Total JBIC
Portion Others
Item ( ) ( ) ( ) ( ) ( ) ( ) ( ) ( ) ( )(P/R,PCR)
0 0 0 0 00 0 0 0 00 0 0 0 00 0 0 0 00 0 0 0 0
Total 0 0 0 0 0 0 0 0 0Attachment (s): Disbursement Status (Note) Exchange Rate: US$1= LC = (LC1= )Base Year for Cost Estimation:
*Fiscal Year starting in April and ending MarchUnit: Rs. Million
JBIC JBICPortion Portion
Year ( ) ( ) ( ) ( ) ( ) ( )(P/M) (P/M) (P/M) (P/M) (P/R,PCR) (P/R,PCR) (P/R,PCR)2008 325.40 130.66 456.06 02009 422.87 124.57 547.44 02010 838.76 129.13 967.89 02011 1,106.26 129.41 1,235.67 02012 954.28 105.33 1,059.61 02013 685.00 106.01 791.02 02014 274.78 102.64 377.422015 160.33 103.13 263.47
0.000.000.00
Total 4,767.69 930.88 5,698.57 0 0 0Attachment (s): Disbursement StatusNote: Exchange Rate used Rs 1 = JPY 2.91
2-3-2
(P/R and PCR)
Breakdown of cost
You can use any currencies in this chart, i.e. you may use your local currency as well as Yen for each figure.
If there is any other portion than your own budget, such as financial resources of the World Bank, ADB and so forth, please fill in anothercolumn between “JBIC Portion” and “Others” and fill in the figures of them.
TotalOriginal
Others Total Others
Table 2-3-1b: Comparison of Original and Actual Cost BY YEAR
Breakdown of cost TotalLocal Currency PortionForeign Currency PortionActual
You can use any currencies in this chart, i.e. you may use your local currency as well as Yen for each figure.If there is any other portion than your own budget, such as financial resources of the World Bank, ADB and so forth, please fill in another
column between “JBIC Portion” and “Others” and fill in the figures of them.
Actual
Reason(s) for the wide gap between the original and actual, if there have been any, the remedies you have taken, and their results.
Final Report - Volume II Annex 13-9
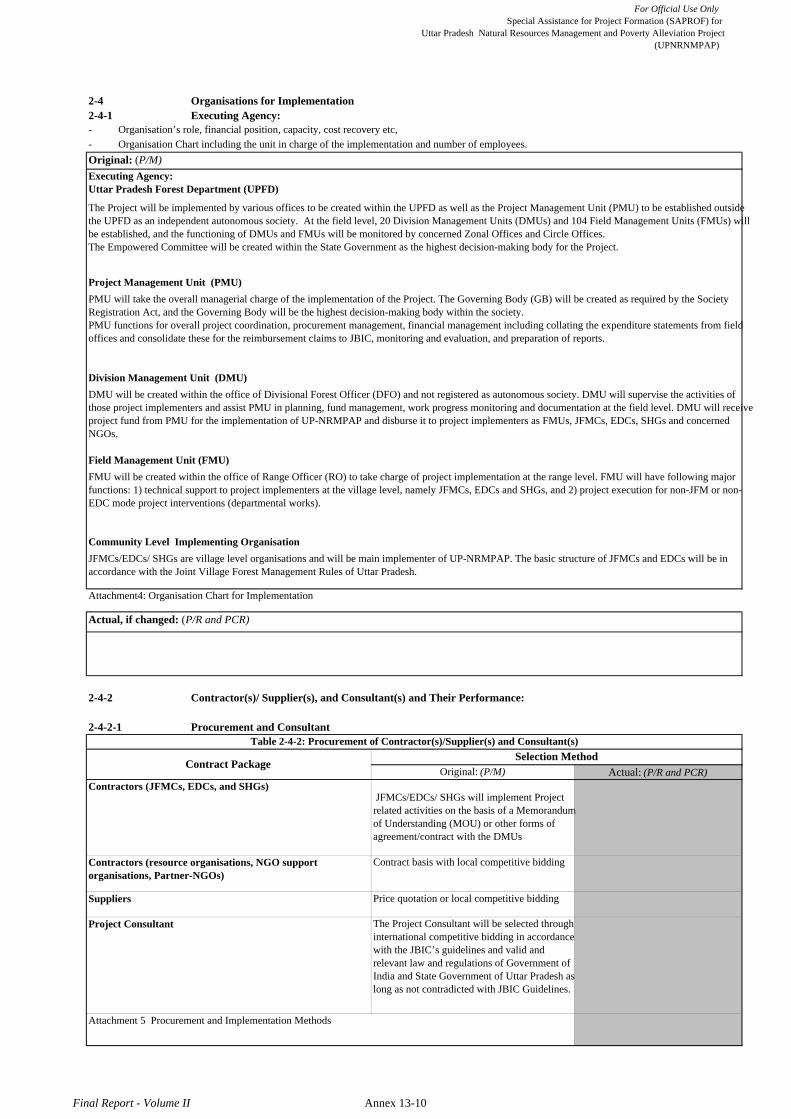
For Official Use OnlySpecial Assistance for Project Formation (SAPROF) for
Uttar Pradesh Natural Resources Management and Poverty Alleviation Project(UPNRNMPAP)
2-4 Organisations for Implementation2-4-1 Executing Agency: - Organisation’s role, financial position, capacity, cost recovery etc,- Organisation Chart including the unit in charge of the implementation and number of employees.Original: (P/M)
Actual, if changed: (P/R and PCR)
2-4-2 Contractor(s)/ Supplier(s), and Consultant(s) and Their Performance:
2-4-2-1 Procurement and Consultant
Attachment 5 Procurement and Implementation Methods
Project Consultant
Selection MethodActual: (P/R and PCR)
The Project will be implemented by various offices to be created within the UPFD as well as the Project Management Unit (PMU) to be established outsidethe UPFD as an independent autonomous society. At the field level, 20 Division Management Units (DMUs) and 104 Field Management Units (FMUs) willbe established, and the functioning of DMUs and FMUs will be monitored by concerned Zonal Offices and Circle Offices.The Empowered Committee will be created within the State Government as the highest decision-making body for the Project.
Community Level Implementing Organisation
Executing Agency:Uttar Pradesh Forest Department (UPFD)
Table 2-4-2: Procurement of Contractor(s)/Supplier(s) and Consultant(s)
Contract PackageOriginal: (P/M)
Contract basis with local competitive bidding
Price quotation or local competitive bidding
Contractors (resource organisations, NGO supportorganisations, Partner-NGOs)
Suppliers
The Project Consultant will be selected throughinternational competitive bidding in accordancewith the JBIC’s guidelines and valid andrelevant law and regulations of Government ofIndia and State Government of Uttar Pradesh aslong as not contradicted with JBIC Guidelines.
Contractors (JFMCs, EDCs, and SHGs) JFMCs/EDCs/ SHGs will implement Projectrelated activities on the basis of a Memorandumof Understanding (MOU) or other forms ofagreement/contract with the DMUs
JFMCs/EDCs/ SHGs are village level organisations and will be main implementer of UP-NRMPAP. The basic structure of JFMCs and EDCs will be inaccordance with the Joint Village Forest Management Rules of Uttar Pradesh.
Attachment4: Organisation Chart for Implementation
PMU will take the overall managerial charge of the implementation of the Project. The Governing Body (GB) will be created as required by the SocietyRegistration Act, and the Governing Body will be the highest decision-making body within the society.PMU functions for overall project coordination, procurement management, financial management including collating the expenditure statements from fieldoffices and consolidate these for the reimbursement claims to JBIC, monitoring and evaluation, and preparation of reports.
Project Management Unit (PMU)
Division Management Unit (DMU)DMU will be created within the office of Divisional Forest Officer (DFO) and not registered as autonomous society. DMU will supervise the activities ofthose project implementers and assist PMU in planning, fund management, work progress monitoring and documentation at the field level. DMU will receiveproject fund from PMU for the implementation of UP-NRMPAP and disburse it to project implementers as FMUs, JFMCs, EDCs, SHGs and concernedNGOs.
Field Management Unit (FMU)FMU will be created within the office of Range Officer (RO) to take charge of project implementation at the range level. FMU will have following majorfunctions: 1) technical support to project implementers at the village level, namely JFMCs, EDCs and SHGs, and 2) project execution for non-JFM or non-EDC mode project interventions (departmental works).
Final Report - Volume II Annex 13-10
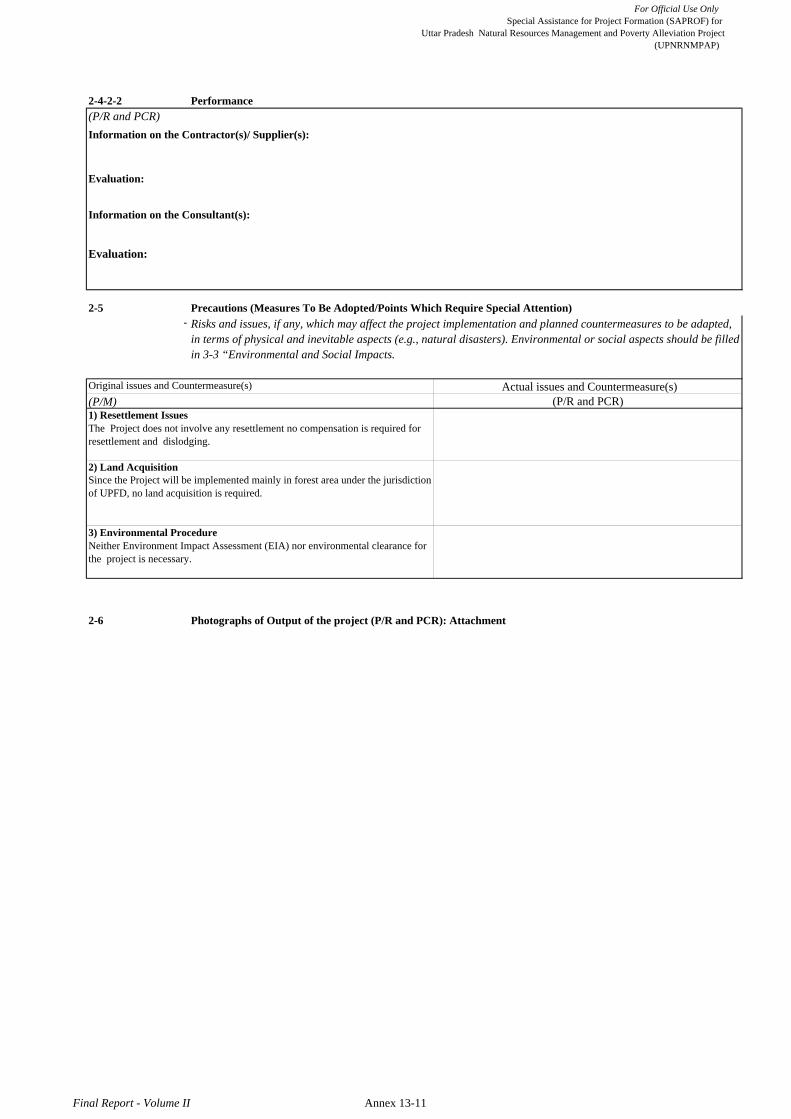
For Official Use OnlySpecial Assistance for Project Formation (SAPROF) for
Uttar Pradesh Natural Resources Management and Poverty Alleviation Project(UPNRNMPAP)
2-4-2-2 Performance(P/R and PCR)Information on the Contractor(s)/ Supplier(s):
Evaluation:
Information on the Consultant(s):
Evaluation:
2-5 Precautions (Measures To Be Adopted/Points Which Require Special Attention) -
2-6 Photographs of Output of the project (P/R and PCR): Attachment
Actual issues and Countermeasure(s)Original issues and Countermeasure(s)
3) Environmental ProcedureNeither Environment Impact Assessment (EIA) nor environmental clearance forthe project is necessary.
Risks and issues, if any, which may affect the project implementation and planned countermeasures to be adapted,in terms of physical and inevitable aspects (e.g., natural disasters). Environmental or social aspects should be filledin 3-3 “Environmental and Social Impacts.
(P/M) (P/R and PCR)1) Resettlement IssuesThe Project does not involve any resettlement no compensation is required forresettlement and dislodging.
2) Land AcquisitionSince the Project will be implemented mainly in forest area under the jurisdictionof UPFD, no land acquisition is required.
Final Report - Volume II Annex 13-11
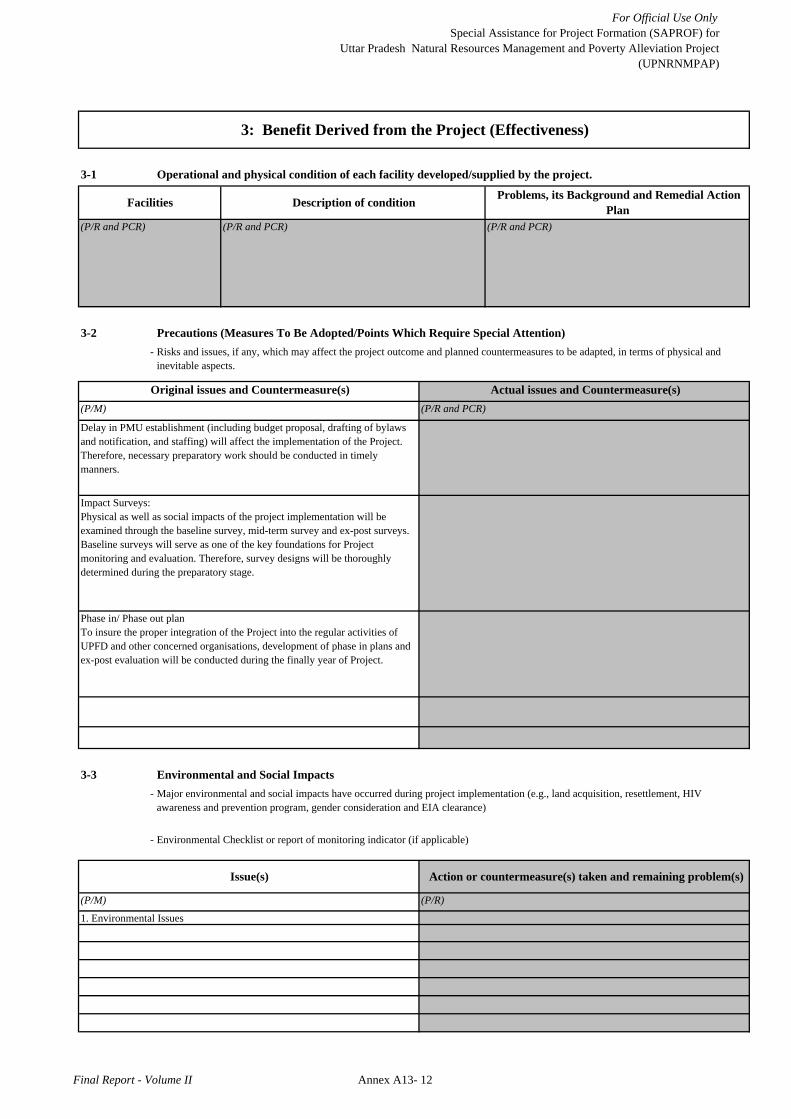
For Official Use OnlySpecial Assistance for Project Formation (SAPROF) for
Uttar Pradesh Natural Resources Management and Poverty Alleviation Project(UPNRNMPAP)
L/A No.PSR prepared on
3-1 Operational and physical condition of each facility developed/supplied by the project.
3-2 Precautions (Measures To Be Adopted/Points Which Require Special Attention) -
3-3 Environmental and Social Impacts-
-
Action or countermeasure(s) taken and remaining problem(s)
(P/M)
Environmental Checklist or report of monitoring indicator (if applicable)
(P/R)
#REF!
(P/R and PCR) (P/R and PCR)
Issue(s)
3: Benefit Derived from the Project (Effectiveness)
Problems, its Background and Remedial ActionPlan
Phase in/ Phase out planTo insure the proper integration of the Project into the regular activities ofUPFD and other concerned organisations, development of phase in plans andex-post evaluation will be conducted during the finally year of Project.
Facilities Description of condition
(P/R and PCR)
Impact Surveys:Physical as well as social impacts of the project implementation will beexamined through the baseline survey, mid-term survey and ex-post surveys.Baseline surveys will serve as one of the key foundations for Projectmonitoring and evaluation. Therefore, survey designs will be thoroughlydetermined during the preparatory stage.
Delay in PMU establishment (including budget proposal, drafting of bylawsand notification, and staffing) will affect the implementation of the Project.Therefore, necessary preparatory work should be conducted in timelymanners.
(P/R and PCR)
Original issues and Countermeasure(s)
1. Environmental Issues
Major environmental and social impacts have occurred during project implementation (e.g., land acquisition, resettlement, HIVawareness and prevention program, gender consideration and EIA clearance)
Risks and issues, if any, which may affect the project outcome and planned countermeasures to be adapted, in terms of physical andinevitable aspects.
(P/M)
Actual issues and Countermeasure(s)
Final Report - Volume II Annex A13- 12

For Official Use OnlySpecial Assistance for Project Formation (SAPROF) for
Uttar Pradesh Natural Resources Management and Poverty Alleviation Project(UPNRNMPAP)
3-4 Quantative and Qualitative Data of Monitoring Indicators- Operation and Effect Indicator, EIRR and/or FIRR
- Supporting data for computing EIRR and/or FIRR
EIRR Original: (P/M) Actual: (PCR)EIRR:15.42 % %
Cost: Project cost (excluding Tax) and O&M cost - Cost:- Benefit:
Project Life: 50 Years - Project Life:
FIRR
Attachment 6: Supporting data for computing EIRR Attachment(s): Supporting data for computing EIRR
Benefit:increase in- stumpage value for timber ,- fuel wood production- NTFP production- fodder/ grass production- fire damage prevention- carbon sequestration- soil conservation- sales from IGA- income from ecotourism
Final Report - Volume II Annex A13- 13
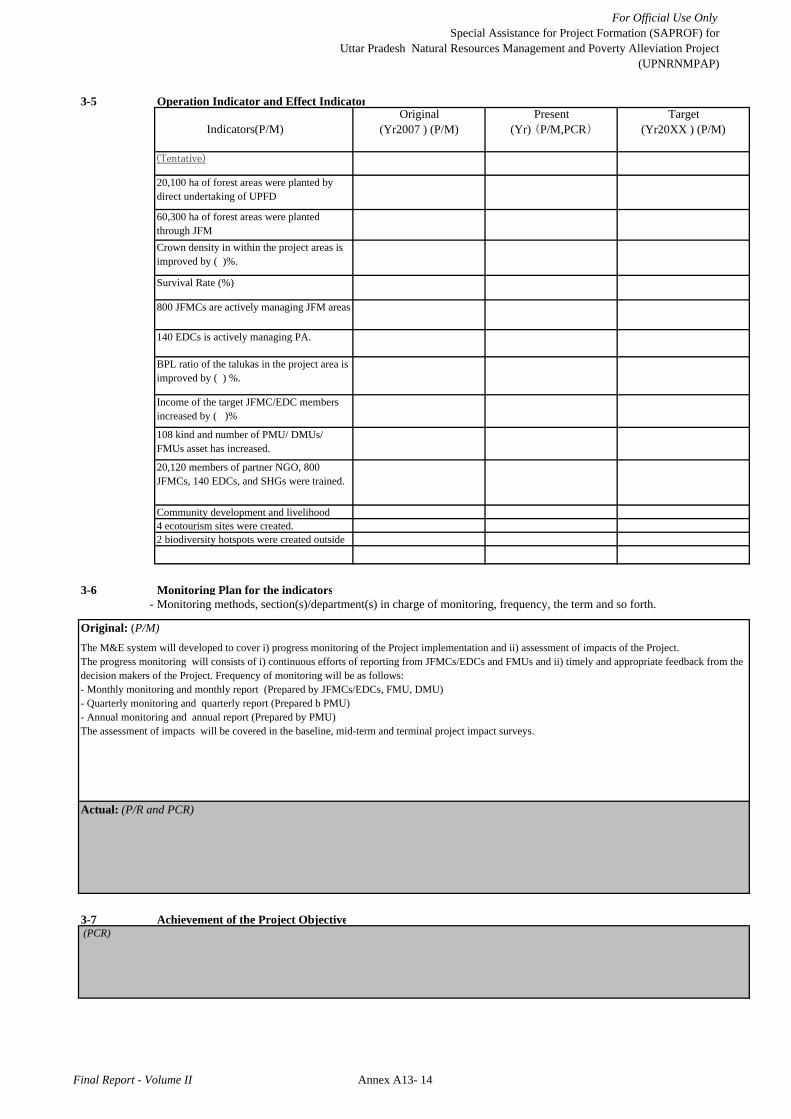
For Official Use OnlySpecial Assistance for Project Formation (SAPROF) for
Uttar Pradesh Natural Resources Management and Poverty Alleviation Project(UPNRNMPAP)
3-5 Operation Indicator and Effect Indicator
3-6 Monitoring Plan for the indicators- Monitoring methods, section(s)/department(s) in charge of monitoring, frequency, the term and so forth.
Original: (P/M)
Actual: (P/R and PCR)
3-7 Achievement of the Project Objective (PCR)
Target(Yr20XX ) (P/M)
Present(Yr) (P/M,PCR) Indicators(P/M)
Original(Yr2007 ) (P/M)
The M&E system will developed to cover i) progress monitoring of the Project implementation and ii) assessment of impacts of the Project.The progress monitoring will consists of i) continuous efforts of reporting from JFMCs/EDCs and FMUs and ii) timely and appropriate feedback from thedecision makers of the Project. Frequency of monitoring will be as follows:- Monthly monitoring and monthly report (Prepared by JFMCs/EDCs, FMU, DMU)- Quarterly monitoring and quarterly report (Prepared b PMU)- Annual monitoring and annual report (Prepared by PMU)The assessment of impacts will be covered in the baseline, mid-term and terminal project impact surveys.
(Tentative)
Community development and livelihood4 ecotourism sites were created.2 biodiversity hotspots were created outside
BPL ratio of the talukas in the project area isimproved by ( ) %.
Income of the target JFMC/EDC membersincreased by ( )%
108 kind and number of PMU/ DMUs/FMUs asset has increased.
20,120 members of partner NGO, 800JFMCs, 140 EDCs, and SHGs were trained.
Crown density in within the project areas isimproved by ( )%.
Survival Rate (%)
800 JFMCs are actively managing JFM areas
140 EDCs is actively managing PA.
20,100 ha of forest areas were planted bydirect undertaking of UPFD
60,300 ha of forest areas were plantedthrough JFM
Final Report - Volume II Annex A13- 14

For Official Use OnlySpecial Assistance for Project Formation (SAPROF) for
Uttar Pradesh Natural Resources Management and Poverty Alleviation Project(UPNRNMPAP)
L/A No.PSR prepared on
4-1 O&M and Management-
-
Original: (P/M)
Actual: (PCR)
4-2 O&M Cost and Budget-
(PCR)
Concerned officers as well as offices of UPFD will be responsible for O&M and management of established plantation and other outputs developed duringthe Project implementation. To functionalize O&M and management after the completion of the Project, i) integration of PMU and DMUs to ForestDevelopment Agencies (FDAs), ii) integration of PMU's functions with the State Coordination Committee of the National Afforestation Programme, will beplanned to result in integration of the Project implementation setup into the regular functions of UPFD. In addition, sufficient budget and number of staffwill be allocated.
4: Operation and Maintenance (O&M) (Sustainability)
#REF!
Organisation chart of O&M
Operational and maintenance system (structure and the number ,qualification and skill of staff or other conditions necessary to maintainthe outputs and benefits of the project soundly, such as manuals, facilities and equipment for maintenance, and spare
The actual annual O&M cost, as well as the annual O&M budget.
Final Report - Volume II Annex 13 -15
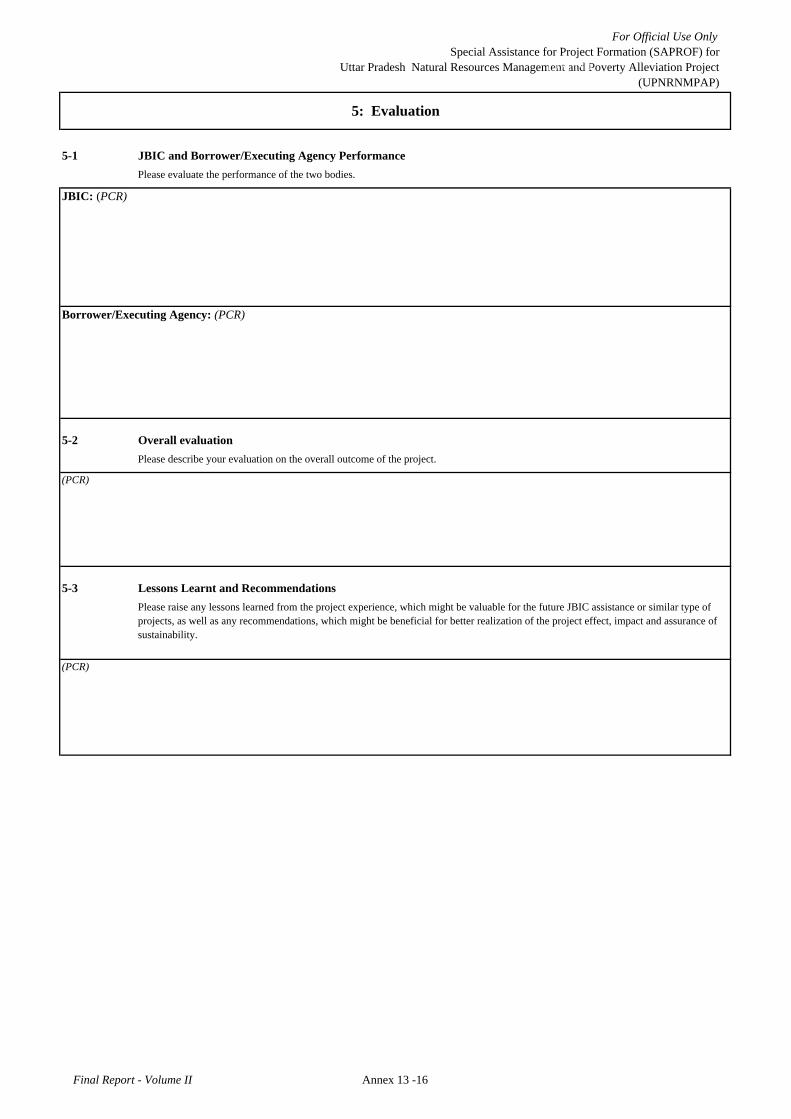
For Official Use OnlySpecial Assistance for Project Formation (SAPROF) for
Uttar Pradesh Natural Resources Management and Poverty Alleviation Project(UPNRNMPAP)
L/A No.PSR prepared on
5-1 JBIC and Borrower/Executing Agency Performance
JBIC: (PCR)
Borrower/Executing Agency: (PCR)
5-2 Overall evaluation
(PCR)
5-3 Lessons Learnt and Recommendations
(PCR)
Please evaluate the performance of the two bodies.
Please describe your evaluation on the overall outcome of the project.
Please raise any lessons learned from the project experience, which might be valuable for the future JBIC assistance or similar type ofprojects, as well as any recommendations, which might be beneficial for better realization of the project effect, impact and assurance ofsustainability.
5: Evaluation
#REF!
Final Report - Volume II Annex 13 -16

For Official U
se Only
Special Assistance for Project Form
ation (SAPR
OF) for
Uttar Pradesh N
atural Resources M
anagement and Poverty A
lleviation Project(U
PNR
MPA
P)
Final Report - Volume II
Annex 13-A
1
Attachment A13. -1 Location Map
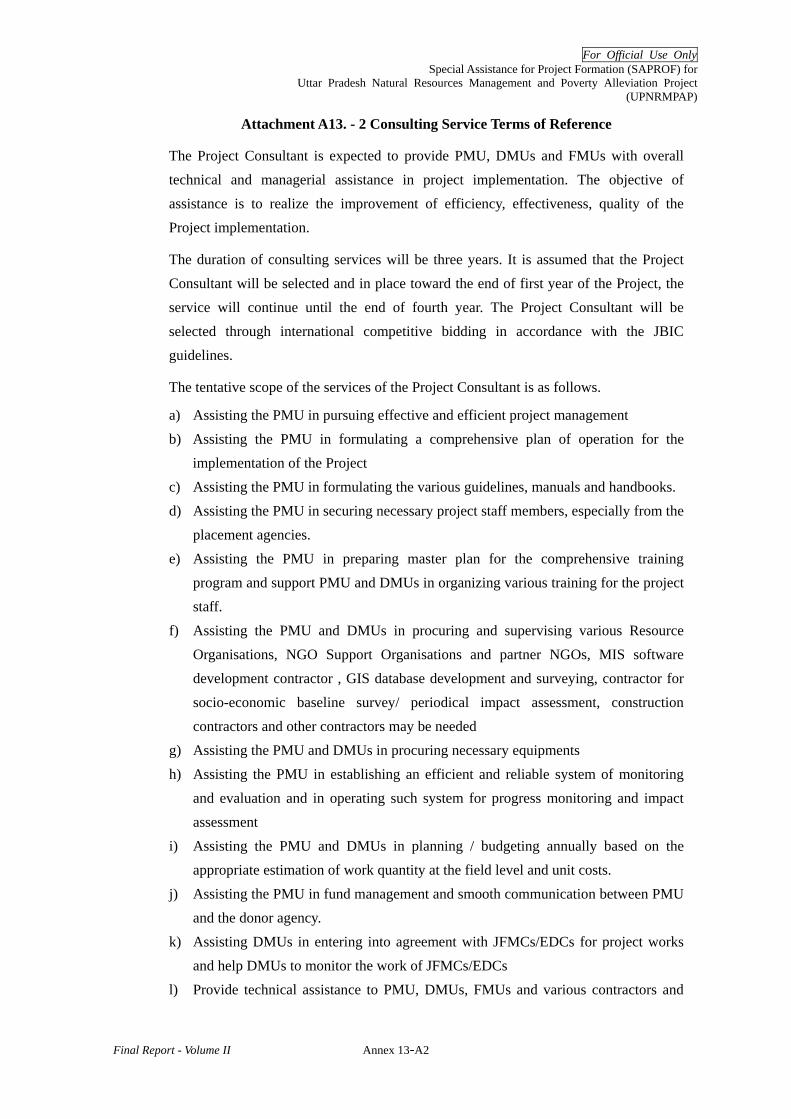
For Official Use Only Special Assistance for Project Formation (SAPROF) for
Uttar Pradesh Natural Resources Management and Poverty Alleviation Project (UPNRMPAP)
Final Report - Volume II Annex 13-A2
Attachment A13. - 2 Consulting Service Terms of Reference
The Project Consultant is expected to provide PMU, DMUs and FMUs with overall technical and managerial assistance in project implementation. The objective of assistance is to realize the improvement of efficiency, effectiveness, quality of the Project implementation.
The duration of consulting services will be three years. It is assumed that the Project Consultant will be selected and in place toward the end of first year of the Project, the service will continue until the end of fourth year. The Project Consultant will be selected through international competitive bidding in accordance with the JBIC guidelines.
The tentative scope of the services of the Project Consultant is as follows.
a) Assisting the PMU in pursuing effective and efficient project management b) Assisting the PMU in formulating a comprehensive plan of operation for the
implementation of the Project c) Assisting the PMU in formulating the various guidelines, manuals and handbooks. d) Assisting the PMU in securing necessary project staff members, especially from the
placement agencies. e) Assisting the PMU in preparing master plan for the comprehensive training
program and support PMU and DMUs in organizing various training for the project staff.
f) Assisting the PMU and DMUs in procuring and supervising various Resource Organisations, NGO Support Organisations and partner NGOs, MIS software development contractor , GIS database development and surveying, contractor for socio-economic baseline survey/ periodical impact assessment, construction contractors and other contractors may be needed
g) Assisting the PMU and DMUs in procuring necessary equipments h) Assisting the PMU in establishing an efficient and reliable system of monitoring
and evaluation and in operating such system for progress monitoring and impact assessment
i) Assisting the PMU and DMUs in planning / budgeting annually based on the appropriate estimation of work quantity at the field level and unit costs.
j) Assisting the PMU in fund management and smooth communication between PMU and the donor agency.
k) Assisting DMUs in entering into agreement with JFMCs/EDCs for project works and help DMUs to monitor the work of JFMCs/EDCs
l) Provide technical assistance to PMU, DMUs, FMUs and various contractors and
For Official Use Only Special Assistance for Project Formation (SAPROF) for
Uttar Pradesh Natural Resources Management and Poverty Alleviation Project (UPNRMPAP)
Final Report - Volume II Annex 13-A3
NGOs in the execution of their works in preparatory works, capacity development, community organizing, micro-planning/annual implementation planning, work quantity estimation, NWFP development, IGA/micro-enterprise development, wildlife conservation and management and phase-out/phase-in works
m) Reviewing, analyzing and recommending improvements in existing related policies and guidelines.
n) Assist the Forest Department to ensure the sustainability of the Project

For Official Use Only Special Assistance for Project Formation (SAPROF) for
Uttar Pradesh Natural Resources Management and Poverty Alleviation Project (UPNRMPAP)
Final Report - Volume II Annex 13-A4
Att
achm
ent I
II.3
.47
Impl
men
tatio
n Sc
hedu
le o
f Pro
ject
Wor
k 2008/09
2009/10
2010/11
2011/12
2012/13
2013/14
2014/15
2015/16
2016/17
45
67
89
1011
121
23
45
67
89
1011
121
23
45
67
89
1011
121
23
45
67
89
1011
121
23
45
67
89
1011
121
23
45
67
89
1011
121
23
45
67
89
1011
121
23
45
67
89
1011
121
23
45
67
89
1011
121
23
Loa
n A
gree
men
t effe
ctiv
ePr
ojec
t Per
iod
Proc
urem
ent o
f Pro
ject
Con
sulta
nt1
Prep
arat
ory
Wor
ks1.
1In
stitu
tiona
l Arr
ange
men
t of P
MU
/DM
Us/
FMU
sal
l
1.1.
1Fo
rmin
g Em
pow
ered
Com
mitt
ee1s
t gro
up
1.1.
2C
reat
ion
of P
roje
ct M
anag
emen
t Uni
t (PM
U)
2nd
grou
p
1.1.
3Pr
epar
atio
n of
Ope
ratio
n M
anua
l of P
MU
3rd
grou
p
1.1.
4Po
stin
g ad
ditio
nal s
taff
for P
MU
/DM
Us/
FMU
s1.
1.5
Rec
ruitm
ent o
f pro
ject
staf
f fro
m th
e op
en m
arke
t1.
2St
ream
linin
g of
JFM
Rul
es1.
3So
il Su
rvey
1.3.
1D
emar
catio
n of
surv
ey a
rea
1.3.
2Pr
ocur
emen
t of c
ontra
ctor
(s) f
or so
il su
rvey
1.3.
3So
il su
rvey
by
the
cont
ract
or(s
)1.
3.4
Prep
arat
ion
of la
nd c
apab
ility
map
for p
lant
atio
n1.
4V
illag
e Se
lect
ion
1.4.
1Se
lect
ion
of p
ossib
le JF
M/E
DC
are
as1.
4.2
Prep
arat
ion
of se
lect
ion
crite
ria o
f tar
get v
illag
es fo
r JFM
/ED
C
1.4.
2M
aste
r-lis
ting
of ta
rget
vill
ages
for J
FMC
/ED
C1.
4.3
Scre
enin
g of
mas
ter-
liste
d vi
llage
s usin
g th
e cr
iteria
1.4.
4Sh
ort-l
istin
g of
pot
entia
l vill
ages
1.4.
5Pr
iorit
izat
ion
of sh
ort-l
isted
vill
ages
1.4.
6C
onse
nsus
bui
ldin
g of
vill
ager
s1.
4.7
Fina
l list
ing
of ta
rget
vill
ages
and
app
rova
l1.
5Si
te D
emar
catio
n, su
rvey
and
map
ping
1.
5.1
Site
dem
arca
tion/
re-d
emar
catio
n) in
the
field
(1)F
ield
Sur
vey
and
setti
ng p
illar
s of J
FM a
reas
(2)F
ield
surv
ey a
nd se
tting
pill
ars o
f eco
-dev
. are
a1.
5.2
Gro
und
Surv
ey a
nd M
appi
ng(1
)Gro
und
surv
ey a
nd m
appi
ng o
f JFM
are
as(2
)Gro
und
surv
ey a
nd m
appi
ng o
f eco
-dev
. are
as1.
6Pr
epar
atio
n of
Gui
delin
es fo
r Pro
ject
Sta
ff an
d Pa
rtner
NG
Os (
1500
cop
ies e
ach)
(1)P
roje
ct M
anag
emen
t and
M&
E(2
)Com
mun
ity O
rgan
izin
g(3
)Mic
ro p
lann
ing
(4)F
ores
t Dev
elop
men
t & E
co-d
evel
opm
ent
(5)I
GA
(6)L
ivel
ihoo
d se
curit
y(7
)Tra
inin
g/C
apac
ity B
uild
ing
1.7
Prep
arat
ion
of M
anua
l for
Pro
ject
Sta
ff (1
500
copi
es e
ach)
(1)P
roje
ct M
anag
emen
t and
M&
E(2
)Com
mun
ity O
rgan
izin
g an
d M
icro
pla
nnin
g(3
)IG
A a
nd L
ivel
ihoo
d se
curit
y1.
8Pr
epar
atio
n of
Han
dboo
k fo
r JFM
Cs/
EDC
s (30
00 c
opie
s eac
h)(1
)Com
mun
ity O
rgan
izin
g an
d M
icro
pla
nnin
g(2
)JFM
C/E
DC
Man
agem
ent a
nd A
dmin
istra
tion
(3)L
ivel
ihoo
d se
curit
y ac
tiviti
es u
nder
UP-
NR
MPA
P1.
9Pr
epar
atio
n of
Han
dboo
k fo
r SH
G/S
HG
Con
sorti
um (3
000
copi
es e
ach)
(1)S
HG
For
mul
atio
n an
d M
anag
emen
t(2
)SH
G C
onso
rtium
For
mul
atio
n an
d M
anag
emen
t(3
)IG
A a
nd B
usin
ess s
cale
-up
Atta
chm
ent A
13-3
Impl
emen
tatio
n Sc
hedu
le o
f Pro
ject
Wor
ks

For Official Use Only Special Assistance for Project Formation (SAPROF) for
Uttar Pradesh Natural Resources Management and Poverty Alleviation Project (UPNRMPAP)
Final Report - Volume II Annex 13-A5
Att
achm
ent I
II.3
.47
Impl
men
tatio
n Sc
hedu
le o
f Pro
ject
Wor
k 2008/09
2009/10
2010/11
2011/12
2012/13
2013/14
2014/15
2015/16
2016/17
45
67
89
1011
121
23
45
67
89
1011
121
23
45
67
89
1011
121
23
45
67
89
1011
121
23
45
67
89
1011
121
23
45
67
89
1011
121
23
45
67
89
1011
121
23
45
67
89
1011
121
23
45
67
89
1011
121
23
Loa
n A
gree
men
t effe
ctiv
ePr
ojec
t Per
iod
Proc
urem
ent o
f Pro
ject
Con
sulta
nt1
Prep
arat
ory
Wor
ks1.
1In
stitu
tiona
l Arr
ange
men
t of P
MU
/DM
Us/
FMU
sal
l
1.1.
1Fo
rmin
g Em
pow
ered
Com
mitt
ee1s
t gro
up
1.1.
2C
reat
ion
of P
roje
ct M
anag
emen
t Uni
t (PM
U)
2nd
grou
p
1.1.
3Pr
epar
atio
n of
Ope
ratio
n M
anua
l of P
MU
3rd
grou
p
1.1.
4Po
stin
g ad
ditio
nal s
taff
for P
MU
/DM
Us/
FMU
s1.
1.5
Rec
ruitm
ent o
f pro
ject
staf
f fro
m th
e op
en m
arke
t1.
2St
ream
linin
g of
JFM
Rul
es1.
3So
il Su
rvey
1.3.
1D
emar
catio
n of
surv
ey a
rea
1.3.
2Pr
ocur
emen
t of c
ontra
ctor
(s) f
or so
il su
rvey
1.3.
3So
il su
rvey
by
the
cont
ract
or(s
)1.
3.4
Prep
arat
ion
of la
nd c
apab
ility
map
for p
lant
atio
n1.
4V
illag
e Se
lect
ion
1.4.
1Se
lect
ion
of p
ossib
le JF
M/E
DC
are
as1.
4.2
Prep
arat
ion
of se
lect
ion
crite
ria o
f tar
get v
illag
es fo
r JFM
/ED
C
1.4.
2M
aste
r-lis
ting
of ta
rget
vill
ages
for J
FMC
/ED
C1.
4.3
Scre
enin
g of
mas
ter-
liste
d vi
llage
s usin
g th
e cr
iteria
1.4.
4Sh
ort-l
istin
g of
pot
entia
l vill
ages
1.4.
5Pr
iorit
izat
ion
of sh
ort-l
isted
vill
ages
1.4.
6C
onse
nsus
bui
ldin
g of
vill
ager
s1.
4.7
Fina
l list
ing
of ta
rget
vill
ages
and
app
rova
l1.
5Si
te D
emar
catio
n, su
rvey
and
map
ping
1.
5.1
Site
dem
arca
tion/
re-d
emar
catio
n) in
the
field
(1)F
ield
Sur
vey
and
setti
ng p
illar
s of J
FM a
reas
(2)F
ield
surv
ey a
nd se
tting
pill
ars o
f eco
-dev
. are
a1.
5.2
Gro
und
Surv
ey a
nd M
appi
ng(1
)Gro
und
surv
ey a
nd m
appi
ng o
f JFM
are
as(2
)Gro
und
surv
ey a
nd m
appi
ng o
f eco
-dev
. are
as1.
6Pr
epar
atio
n of
Gui
delin
es fo
r Pro
ject
Sta
ff an
d Pa
rtner
NG
Os (
1500
cop
ies e
ach)
(1)P
roje
ct M
anag
emen
t and
M&
E(2
)Com
mun
ity O
rgan
izin
g(3
)Mic
ro p
lann
ing
(4)F
ores
t Dev
elop
men
t & E
co-d
evel
opm
ent
(5)I
GA
(6)L
ivel
ihoo
d se
curit
y(7
)Tra
inin
g/C
apac
ity B
uild
ing
1.7
Prep
arat
ion
of M
anua
l for
Pro
ject
Sta
ff (1
500
copi
es e
ach)
(1)P
roje
ct M
anag
emen
t and
M&
E(2
)Com
mun
ity O
rgan
izin
g an
d M
icro
pla
nnin
g(3
)IG
A a
nd L
ivel
ihoo
d se
curit
y1.
8Pr
epar
atio
n of
Han
dboo
k fo
r JFM
Cs/
EDC
s (30
00 c
opie
s eac
h)(1
)Com
mun
ity O
rgan
izin
g an
d M
icro
pla
nnin
g(2
)JFM
C/E
DC
Man
agem
ent a
nd A
dmin
istra
tion
(3)L
ivel
ihoo
d se
curit
y ac
tiviti
es u
nder
UP-
NR
MPA
P1.
9Pr
epar
atio
n of
Han
dboo
k fo
r SH
G/S
HG
Con
sorti
um (3
000
copi
es e
ach)
(1)S
HG
For
mul
atio
n an
d M
anag
emen
t(2
)SH
G C
onso
rtium
For
mul
atio
n an
d M
anag
emen
t(3
)IG
A a
nd B
usin
ess s
cale
-up
Atta
chm
ent A
13-3
Impl
emen
tatio
n Sc
hedu
le o
f Pro
ject
Wor
ks
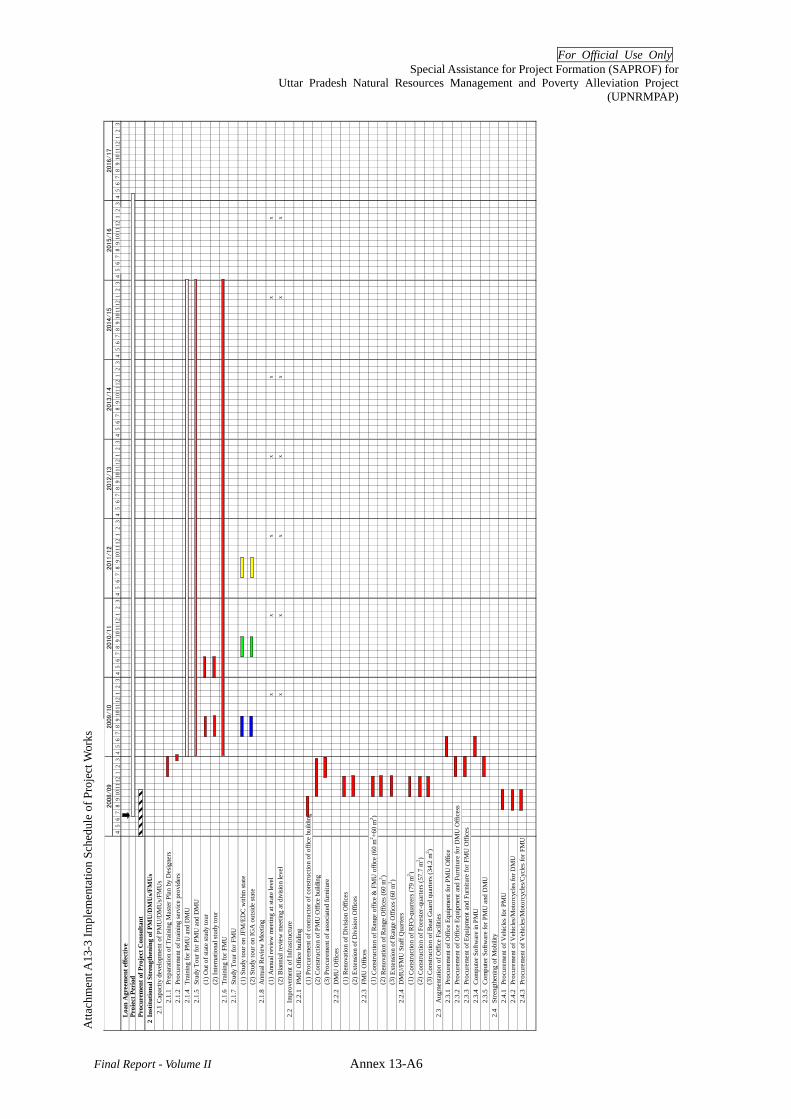
For Official Use Only Special Assistance for Project Formation (SAPROF) for
Uttar Pradesh Natural Resources Management and Poverty Alleviation Project (UPNRMPAP)
Final Report - Volume II Annex 13-A6
Atta
chm
ent I
II.3
.47
Impl
men
tatio
n Sc
hedu
le o
f Pro
ject
Wor
k 2008/09
2009/10
2010/11
2011/12
2012/13
2013/14
2014/15
2015/16
2016/17
45
67
89
1011
121
23
45
67
89
1011
121
23
45
67
89
1011
121
23
45
67
89
1011
121
23
45
67
89
1011
121
23
45
67
89
1011
121
23
45
67
89
1011
121
23
45
67
89
1011
121
23
45
67
89
1011
121
23
Loan
Agr
eem
ent e
ffect
ive
Proj
ect P
erio
dPr
ocur
emen
t of P
roje
ct C
onsu
ltant
2In
stitu
tiona
l Str
engt
heni
ng o
f PM
U/D
MU
s/FM
Us
2.1
Cap
acity
dev
elop
men
t of P
MU
/DM
Us/
FMU
s2.
1.1
Prep
arat
ion
of T
rain
ing
Mas
ter P
lan
by D
esig
ners
2.1.
2Pr
ocur
emen
t of t
rain
ing
serv
ice
prov
ider
s2.
1.4
Trai
ning
for P
MU
and
DM
U2.
1.5
Stud
y To
ur fo
r PM
U a
nd D
MU
(1)O
ut o
f sta
te st
udy
tour
(2)I
nter
natio
nal s
tudy
tour
2.1.
6Tr
aini
ng fo
r FM
U2.
1.7
Stud
y To
ur fo
r FM
U(1
)Stu
dy to
ur o
n JF
M/E
DC
with
in st
ate
(2)S
tudy
tour
on
IGA
out
side
stat
e2.
1.8
Ann
ual R
evie
w M
eetin
g(1
)Ann
ual r
evie
w m
eetin
g at
stat
e le
vel
xx
xx
xx
x
(2)B
iann
ial r
evie
w m
eetin
g at
div
ision
leve
lx
xx
xx
xx
2.2
Impr
ovem
ent o
f Inf
rast
ruct
ure
2.2.
1PM
U O
ffice
bui
ldin
g(1
)Pro
cure
men
t of c
ontra
ctor
of c
onst
ruct
ion
of o
ffice
bui
ldin
g(2
)Con
stru
ctio
n of
PM
U O
ffice
bui
ldin
g(3
)Pro
cure
men
t of a
ssoc
iate
d fu
rnitu
re2.
2.2
DM
U O
ffice
s(1
)Ren
ovat
ion
of D
ivisi
on O
ffice
s(2
)Ext
ensio
n of
Div
ision
Offi
ces
2.2.
3FM
U O
ffice
s(1
) Con
stru
ctio
n of
Ran
ge o
ffice
& F
MU
offi
ce (6
0 m
2 +60
m2 )
(2) R
enov
atio
n of
Ran
ge O
ffice
s (60
m2 )
(3) E
xten
sion
of R
ange
Offi
ces (
60 m
2 )2.
2.4
DM
U/F
MU
Sta
ff Q
uarte
rs(1
) Con
stru
ctio
n of
RFO
- qua
rters
(79
m2 )
(2) C
onst
ruct
ion
of F
ores
ter-
quar
ters
(57.
7 m
2 )(3
) Con
stru
ctio
n of
Bea
t Gua
rd q
uarte
rs (3
4.2
m2 )
2.3
Aug
men
tatio
n of
Offi
ce F
acili
ties
2.3.
1Pr
ocur
emen
t of O
ffice
Equ
ipm
ent f
or P
MU
Offi
ce2.
3.2
Proc
urem
ent o
f Offi
ce E
quip
men
t and
Fur
nitu
re fo
r DM
U O
ffice
ss2.
3.3
Proc
urem
ent o
f Equ
ipm
ent a
nd F
urni
ture
for F
MU
Offi
ces
2.3.
4C
ompu
ter S
oftw
are
in P
MU
2.3.
5C
ompu
ter S
oftw
are
for P
MU
and
DM
U2.
4St
reng
then
ing
of M
obili
ty2.
4.1
Proc
urem
ent o
f Veh
icle
s fo
r PM
U
2.4.
2Pr
ocur
emen
t of V
ehic
les/
Mot
orcy
cles
for D
MU
2.
4.3
Proc
urem
ent o
f Veh
icle
s/M
otor
cycl
es/C
ycle
s for
FM
U
Atta
chm
ent A
13-3
Impl
emen
tatio
n Sc
hedu
le o
f Pro
ject
Wor
ks

For Official Use Only Special Assistance for Project Formation (SAPROF) for
Uttar Pradesh Natural Resources Management and Poverty Alleviation Project (UPNRMPAP)
Final Report - Volume II Annex 13-A7
Att
achm
ent I
II.3
.47
Impl
men
tatio
n Sc
hedu
le o
f Pro
ject
Wor
k 2008/09
2009/10
2010/11
2011/12
2012/13
2013/14
2014/15
2015/16
2016/17
45
67
89
1011
121
23
45
67
89
1011
121
23
45
67
89
1011
121
23
45
67
89
1011
121
23
45
67
89
1011
121
23
45
67
89
1011
121
23
45
67
89
1011
121
23
45
67
89
1011
121
23
45
67
89
1011
121
23
Loa
n A
gree
men
t effe
ctiv
ePr
ojec
t Per
iod
Proc
urem
ent o
f Pro
ject
Con
sulta
nt3
Cap
acity
Bui
ldin
g of
NG
O/J
FMC
/ED
C/S
HG
3.1
Cap
acity
bui
ldin
g of
NG
O3.
1.1
Orie
ntat
ion
for N
GO
Sup
port
Org
aniz
atio
n3.
1.1
Orie
ntat
ion
on U
P-N
RM
PAP
and
train
ing
on c
once
pt &
pra
ctic
e of
JFM
/ED
C3.
1.2
Trai
ning
on
com
mun
ity o
rgan
izin
g an
d m
icro
plan
ning
3.1.
3Tr
aini
ng o
n JF
MC
/ED
C M
anag
emen
t I3.
1.4
Trai
ning
on
JFM
C/E
DC
Man
agem
ent I
I3.
1.5
Trai
ning
on
prep
arat
ion
of a
nnua
l im
plem
enta
tion
plan
ning
3.
1.6
Trai
ning
on
SHG
form
atio
n3.
1.7
Trai
ning
on
IGA
3.1.
8Tr
aini
ng o
n Li
velih
ood
Secu
rity
Enha
ncem
ent
3.2
Cap
acity
Bui
ldin
g of
JFM
C3.
2.1
Trai
ning
on
mic
ro p
lann
ing
and
annu
al im
plem
enta
tion
plan
ning
3.2.
2Tr
aini
ng o
n JF
MC
Man
agem
ent I
3.2.
3Tr
aini
ng o
n JF
MC
Man
agem
ent I
I3.
2.4
Expo
sure
trip
s / e
xcha
nge
visit
(1)O
utsid
e st
ate
(2)W
ithin
stat
e
3.3
Cap
acity
Bui
ldin
g of
ED
Cs
3.3.
1Tr
aini
ng o
n m
icro
pla
nnin
g an
d an
nual
act
ion
plan
ning
3.3.
2Tr
aini
ng o
n ED
C M
anag
emen
t I3.
3.3
Trai
ning
on
EDC
Man
agem
ent I
I3.
3.4
Expo
sure
trip
s / e
xcha
nge
visit
(1)O
utsid
e st
ate
(2)W
ithin
stat
e
3.4
Cap
acity
Bui
ldin
g of
SH
Gs
3.4.
1Tr
aini
ng o
n gr
oup
form
atio
n an
d in
tern
al sa
ving
3.4.
2Tr
aini
ng o
n bu
sines
s pla
nnin
g3.
4.3
Trai
ning
on
IGA
and
bus
ines
s man
agem
ent
3.4.
4Ex
posu
re tr
ips /
exc
hang
e vi
sit(1
)Exp
osur
e tri
ps to
oth
er d
ivisi
ons
(2)E
xpos
ure
trips
with
in D
ivisi
on
Atta
chm
ent A
13-3
Impl
emen
tatio
n Sc
hedu
le o
f Pro
ject
Wor
ks
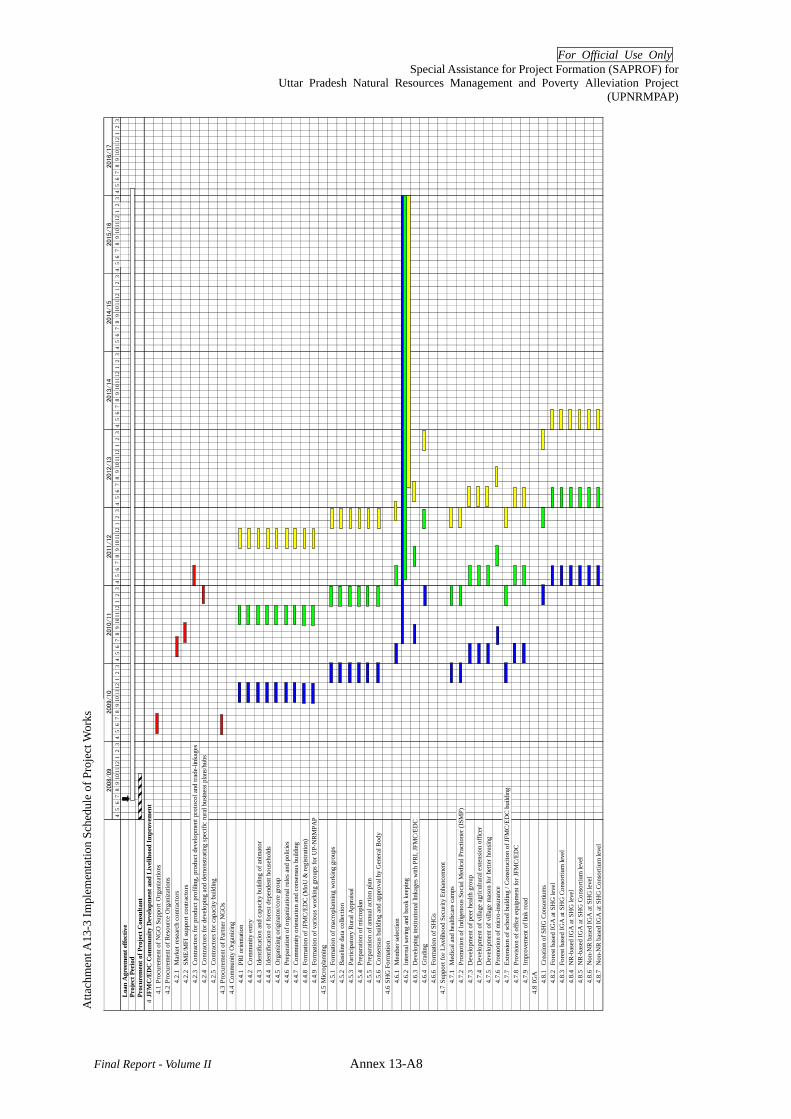
For Official Use Only Special Assistance for Project Formation (SAPROF) for
Uttar Pradesh Natural Resources Management and Poverty Alleviation Project (UPNRMPAP)
Final Report - Volume II Annex 13-A8
Atta
chm
ent I
II.3
.47
Impl
men
tatio
n Sc
hedu
le o
f Pro
ject
Wor
k 2008/09
2009/10
2010/11
2011/12
2012/13
2013/14
2014/15
2015/16
2016/17
45
67
89
1011
121
23
45
67
89
1011
121
23
45
67
89
1011
121
23
45
67
89
1011
121
23
45
67
89
1011
121
23
45
67
89
1011
121
23
45
67
89
1011
121
23
45
67
89
1011
121
23
45
67
89
1011
121
23
Loa
n A
gree
men
t effe
ctiv
ePr
o jec
t Per
iod
Proc
urem
ent o
f Pro
ject
Con
sulta
nt4
JFM
C/E
DC
Com
mun
ity D
evel
opm
ent a
nd L
ivel
ihoo
d Im
prov
emen
t4.
1Pr
ocur
emen
t of N
GO
Sup
port
Org
aniz
atio
ns4.
2Pr
ocur
emen
t of R
esou
rce
Org
aniz
atio
ns4.
2.1
Mar
ket r
esea
rch
cont
ract
ors
4.2.
2SM
E/M
FI su
ppor
t con
tract
ors
4.2.
3Co
ntra
ctor
s for
pro
duct
pro
filin
g, p
rodu
ct d
evel
opm
ent p
roto
col a
nd tr
ade-
linka
ges
4.2.
4Co
ntra
ctor
s for
dev
elop
ing
and
dem
onst
ratin
g sp
ecifi
c ru
ral b
usin
ess p
lans
/hub
s4.
2.5
Cont
ract
ors f
or c
apac
ity b
uild
ing
4.3
Proc
urem
ent o
f Par
tner
NG
Os
4.4
Com
mun
ity O
rgan
izin
g4.
4.1
PRI o
rient
atio
n4.
4.2
Com
mun
ity e
ntry
4.4.
3Id
entif
icat
ion
and
capa
city
bui
ldin
g of
ani
mat
or4.
4.4
Iden
tific
atio
n of
fore
st d
epen
dent
hou
seho
lds
4.4.
5O
rgan
izin
g or
igin
ator
/cor
e gr
oup
4.4.
6Pr
epar
atio
n of
org
aniz
atio
nal r
ules
and
pol
icie
s4.
4.7
Com
mun
ity o
rient
atio
n an
d co
nsen
sus b
uild
ing
4.4.
8Fo
rmat
ion
of JF
MC
/ED
C (M
oU &
regi
stra
tion)
4.4.
9Fo
rmat
ion
of v
ario
us w
orki
ng g
roup
s for
UP-
NRM
PAP
4.5
Mic
ropl
anni
ng4.
5.1
Form
atio
n of
mac
ropl
anni
ng w
orki
ng g
roup
s4.
5.2
Base
line
data
col
lect
ion
4.5.
3Pa
rtici
pato
ry R
ural
App
raisa
l4.
5.4
Prep
arat
ion
of m
icro
plan
4.5.
5Pr
epar
atio
n of
ann
ual a
ctio
n pl
an4.
5.6
Cons
ensu
s bui
ldin
g an
d ap
prov
al b
y G
ener
al B
ody
4.6
SHG
For
mat
ion
4.6.
1M
embe
r sel
ectio
n4.
6.2
Inte
rnal
savi
ng a
nd b
ook
keep
ing
4.6.
3D
evel
opin
g in
stitu
tiona
l lin
kage
s with
PR
I, JF
MC
/ED
C
4.6.
4G
radi
ng4.
6.6
Form
atio
n of
SH
Gs
4.7
Supp
ort f
or L
ivel
ihoo
d Se
curit
y En
hanc
emen
t4.
7.1
Med
ical
and
hea
lthca
re c
amps
4.7.
2Pr
omot
ion
of In
dige
nous
Soc
ial M
edic
al P
ract
ione
r (IS
MP)
4.7.
3D
evel
opm
ent o
f pee
r hea
lth g
roup
4.7.
4D
evel
opm
ent o
f vill
age
agric
ultu
ral e
xten
sion
offic
er4.
7.5
Dev
elop
men
t of v
illag
e m
ason
for b
ette
r hou
sing
4.7.
6Pr
omot
ion
of m
icro
-insu
ranc
e4.
7.7
Exte
nsio
n of
scho
ol b
uild
ing
/ Con
stru
cito
n of
JFM
C/E
DC
build
ing
4.7.
8Pr
ovisi
on o
f offi
ce e
quip
men
t for
JFM
C/E
DC
4.7.
9Im
prov
emen
t of l
ink
road
4.8
IGA
4.8.
1Cr
eatio
n of
SH
G C
onso
rtium
s4.
8.2
Fore
st b
ased
IGA
at S
HG
leve
l4.
8.3
Fore
st b
ased
IGA
at S
HG
Con
sorti
um le
vel
4.8.
4N
R-b
ased
IGA
at S
HG
leve
l4.
8.5
NR
-bas
ed IG
A a
t SH
G C
onso
rtium
leve
l4.
8.6
Non
-NR
bas
ed IG
A a
t SH
G le
vel
4.8.
7N
on-N
R b
ased
IGA
at S
HG
Con
sorti
um le
vel
Atta
chm
ent A
13-3
Impl
emen
tatio
n Sc
hedu
le o
f Pro
ject
Wor
ks

For Official Use Only Special Assistance for Project Formation (SAPROF) for
Uttar Pradesh Natural Resources Management and Poverty Alleviation Project (UPNRMPAP)
Final Report - Volume II Annex 13-A9
Att
achm
ent I
II.3
.47
Impl
men
tatio
n Sc
hedu
le o
f Pro
ject
Wor
k 20
08/09
2009/10
2010/1
12011/12
2012/13
2013/14
2014/15
2015/16
2016/1
74
56
78
910
1112
12
34
56
78
910
1112
12
34
56
78
910
1112
12
34
56
78
910
1112
12
34
56
78
910
1112
12
34
56
78
910
1112
12
34
56
78
910
1112
12
34
56
78
910
1112
12
34
56
78
910
1112
12
3L
oan
Agr
eem
ent e
ffect
ive
Proj
ect P
erio
dPr
ocur
emen
t of P
roje
ct C
onsu
ltant
5D
epar
tmen
tal F
ores
t Dev
elop
men
t and
Man
agem
ent
5.1
Fore
st A
rea
Bou
ndar
y Es
tabl
ishm
ent
5.1.
1Fo
rest
Are
a B
ound
ary
iden
tific
atio
na)
Rev
iew
of e
xisit
ng d
ocum
ents
and
map
s b)
Bou
ndar
y Su
rvey
c)Es
tabl
ishem
ent s
uppl
emen
tal b
ound
ary
pilla
rsd)
Map
ping
5.1.
2Fi
bou
ndar
y pi
llars
(mai
nly
proj
ect i
nter
vent
ion
area
)5.
2Fi
re P
rote
ctio
n5.
2.1
Cre
atio
n an
d m
aint
enan
ce o
f fire
line
s(1
)est
ablis
hmen
t(2
)mai
nten
ance
5.
2.2
Fire
Pat
rol
5.2.
3Fi
re fi
ghtin
g eq
uipm
ent
5.3
FD N
urse
ry D
evel
opm
ent
5.3.
1R
enov
atio
n of
Exi
stin
g FD
Per
man
ent N
urse
rya)
Ren
ovat
ion
of th
e N
urse
ryb)
Prod
ucin
g pl
antin
g st
ock
5.3.
2D
evel
opm
ent o
f Nur
serie
s und
er U
PFD
Res
earc
h W
ing
(tent
ativ
e)(1
)Nur
sery
for C
lona
l Pla
ntin
g St
ock
a)Es
tabl
ishm
ent o
f nur
sery
and
ass
ocia
ted
faci
litie
s- C
onst
ruct
ion/
reno
vatio
n of
fice
and
staf
f qua
rter
- Con
stur
ctio
n of
the
faci
litie
s rel
atin
g to
the
nurs
ery
- Nur
sery
bed
dev
elop
men
tb)
Ope
ratio
n an
d Pr
oduc
ing
plan
ting
stoc
k(2
)NW
FP C
ente
ra)
Esta
blish
men
t of n
urse
ry a
nd a
ssoc
iate
d fa
cilit
ies
- Con
stru
ctio
n/re
nova
tion
offic
e an
d st
aff q
uarte
r- C
onst
urct
ion
of th
e fa
cilit
ies r
elat
ing
to th
e nu
rser
y- N
urse
ry b
ed d
evel
opm
ent
b)R
ecru
itmen
t of N
WFP
Exp
erts
c)O
pera
tion
of th
e C
ente
r5.
4D
rain
age
Line
Tre
atm
ent
(1)T
erai
, typ
e(2
)Bun
delk
and
type
(3)V
indh
yan
type
a)1
st y
ear e
stab
lishm
ent
b)2
nd y
ear m
aint
enan
ce5.
5Fo
rest
Impr
ovem
ent V
ery
Den
se fo
rest
(1)A
dvan
ce w
ork
(2)P
lant
atio
n an
d m
aint
enan
ce5.
6Fo
rest
Impr
ovem
ent
in M
oder
atel
y D
ense
For
est
(1)A
dvan
ce w
ork
(2)P
lant
atio
n an
d m
aint
enan
ce5.
7Fo
rest
Dev
elop
men
t in
Deg
rade
d fo
rest
and
scru
b fo
rest
are
a(1
)Adv
ance
wor
k(2
)Pla
ntat
ion
and
mai
nten
ance
Atta
chm
ent A
13-3
Impl
emen
tatio
n Sc
hedu
le o
f Pro
ject
Wor
ks

For Official Use Only Special Assistance for Project Formation (SAPROF) for
Uttar Pradesh Natural Resources Management and Poverty Alleviation Project (UPNRMPAP)
Final Report - Volume II Annex 13-A10
Att
achm
ent I
II.3
.47
Impl
men
tatio
n Sc
hedu
le o
f Pro
ject
Wor
k 2008/09
2009/10
2010/11
2011/12
2012/13
2013/14
2014/15
2015/16
2016/17
45
67
89
1011
121
23
45
67
89
1011
121
23
45
67
89
1011
121
23
45
67
89
1011
121
23
45
67
89
1011
121
23
45
67
89
1011
121
23
45
67
89
1011
121
23
45
67
89
1011
121
23
45
67
89
1011
121
23
Loa
n A
gree
men
t effe
ctiv
ePr
o jec
t Per
iod
Proc
urem
ent o
f Pro
ject
Con
sulta
nt6
JFM
For
est D
evel
opm
ent a
nd M
anag
emen
t 6.
1D
ecen
traliz
ed N
urse
ry a
nd P
lant
ing
Stoc
k Pr
oduc
tion
6.1.
1JF
MC
Nur
sery
Est
ablis
hmen
t6.
1.2
Prod
ucin
g pl
antin
g st
ock
6.2
Fore
st Im
prov
emen
t Ver
y D
ense
fore
st(1
)Adv
ance
wor
k(2
)Ope
ratio
n an
d pl
anta
tion
6.3
Fore
st Im
prov
emen
t in
Mod
erat
ely
Den
se F
ores
t (1
)Adv
ance
wor
k(2
)Ope
ratio
n an
d pl
anta
tion
6.4
Fore
st D
evel
opm
ent i
n D
egra
ded
fore
st a
nd sc
rub
fore
st a
rea
(1)A
dvan
ce w
ork
(2)P
lant
atio
n an
d m
aint
enan
ce6.
5D
rain
age
Line
Tre
atm
ent
(1)T
erai
, typ
e(2
)Bun
delk
and
type
(3)V
indh
yan
type
a)1s
t yr
b)2n
d ye
r6.
6Fi
re P
rote
ctio
n6.
6.1
Fire
Pat
rol
6.6.
2C
reat
ion
and
mai
nten
ance
of f
ire li
nes
a)es
tabl
ishm
ent
b)m
aint
enan
ce
7W
ildlif
e C
onse
rvat
ion
and
Man
agem
ent
7.1
Man
agem
ent o
f pro
tect
ed a
reas
(for
7 P
As f
or 5
yrs
)7.
1.1
Soil
and
wat
er c
onse
rvat
ion
(1) C
heck
dam
s (co
ncre
te)
(2)
Gul
ly p
lugs
(bru
shw
ood)
(3)
Gul
ly p
lugs
(Gab
ion)
7.1.
2Pr
otec
tion
(1) B
ound
ary
mar
king
usin
g pi
llars
(2) C
heck
pos
t with
gua
rd's
room
(3) W
atch
tow
ers
a) R
CC
stru
ctur
e ty
peb)
Ang
ler t
ype
7.2
Ecot
ouris
m d
evel
opm
ent (
4 si
tes,
5 y
ears
)7.
2.1
Cot
tage
s (2r
oom
s with
toile
t, w
ater
, ele
ctric
ity su
pply
, 121
m2 ).
7.2.
2In
terp
reta
tion
cent
re a
nd so
uven
ir sh
op (1
40 k
m2 )
7.2.
3C
ampi
ng te
nts (
15x1
5x8.
5ft)
7.2.
4Ea
tery
(140
m2 )
7.2.
5Pr
omot
iona
l bro
chur
es7.
2.6
Nat
ure
trail
7.3
Bio
dive
rsity
Hot
spot
s out
side
PA (2
site
s, fo
r 5 y
ears
)7.
3.1
Prep
arat
ion
of m
anag
emen
t pla
n fo
r the
rese
rve
7.3.
2A
NR
(mix
ed sp
ecie
s)(1
)Adv
ance
wor
k(2
)Pla
ntat
ion
and
oper
atio
n7.
3.3
Wat
ch to
wer
(con
cret
e)7.
3.4
Wat
er h
oles
7.3.
5C
heck
dam
(con
cret
e)7.
3.6
JFM
pro
gram
(as g
iven
in th
e se
ctio
n on
JFM
)7.
4ED
C fu
elw
ood
/ fod
der c
omm
unity
pla
ntat
ion
5(1
)Adv
ance
wor
k(2
)Dev
eopm
ent a
nd o
pera
tion
Atta
chm
ent A
13-3
Impl
emen
tatio
n Sc
hedu
le o
f Pro
ject
Wor
ks

For Official Use Only Special Assistance for Project Formation (SAPROF) for
Uttar Pradesh Natural Resources Management and Poverty Alleviation Project (UPNRMPAP)
Final Report - Volume II Annex 13-A11
Atta
chm
ent I
II.3
.47
Impl
men
tatio
n Sc
hedu
le o
f Pro
ject
Wor
k 2008/09
2009/10
2010/11
2011/12
2012/13
2013/14
2014/15
2015/16
2016/17
45
67
89
1011
121
23
45
67
89
1011
121
23
45
67
89
1011
121
23
45
67
89
1011
121
23
45
67
89
1011
121
23
45
67
89
1011
121
23
45
67
89
1011
121
23
45
67
89
1011
121
23
45
67
89
1011
121
23
Loa
n A
gree
men
t effe
ctiv
ePr
ojec
t Per
iod
Proc
urem
ent o
f Pro
ject
Con
sulta
nt8
Surv
ey a
nd R
esea
rch
8.1
Surv
ey a
nd R
esea
rch
for F
ores
t Dev
elop
men
t and
Man
agem
ent
8.1.
1Se
ed T
ree
Impr
ovem
ent a
nd M
ass P
rodu
ctio
n(1
)Sur
vey
and
Sele
ctio
n of
Plu
s Tre
es o
f Im
porta
nt F
ores
t Tre
es (P
roje
ct T
arge
t are
a on
ly)
a) N
ew E
stab
lishm
ent
b) M
aint
enan
ce (i
nclu
ding
exi
stin
g)-
mai
nten
ance
2nd
yr
-m
aint
enan
ce 3
rd y
r-
mai
nten
ance
4th
yr
-m
aint
enan
ce 5
th y
r(2
)Est
ablis
hmen
t and
impr
ovem
ent o
f see
dlin
g se
ed o
rcha
rd (p
roje
ct ta
rget
are
a on
ly )
CSO
a) n
ewly
est
ablis
hed
-0
year
-Se
edlin
g-
Ope
ratio
n &
mai
nten
ance
b) O
ld M
aint
enan
ceSS
Oa)
new
ly e
stab
lishe
d-
0 ye
ar-
Seed
ling
-O
pera
tion
& m
aint
enan
ceb)
Old
Mai
nten
ance
(3)E
stab
lishm
ent o
f See
d Pr
oduc
tion
Are
a (p
roje
ct ta
rget
are
a on
ly )
a) n
ew
b) o
ld m
aint
enan
ce8.
1.2
Plan
tatio
n (fo
rest
) est
ablis
hmen
t im
prov
emen
t(1
)Wor
k-no
rm/S
ched
ule
of R
ate
Surv
ey f
or m
ajor
fore
stry
ope
ratio
ns(2
)Dev
elop
men
t of t
reat
men
t/ pl
anat
ion
mod
els f
or JF
MC
inte
rven
tions
.8.
1.3
NTF
P D
evel
opm
ent a
nd U
tiliz
atio
n(1
)Dev
elop
men
t of
NW
FP p
lant
atio
n m
odel
s (m
ixed
spec
ies,
incl
udin
g m
edic
inal
pla
nts)
8.1.
4SM
C W
ork
Impr
ovem
ent
(1)W
ork-
norm
/Sch
edul
e of
Rat
e Su
rvey
for
maj
or S
MC
wor
ks(2
)Qua
ntifi
catio
n of
soil
wat
er c
onse
rvat
ion
and
wat
er h
arve
stin
g fu
nctio
ns8.
1.5
Sam
plin
g su
rvey
of s
tand
ing
stoc
k at
var
ious
fore
st ty
pe/ p
lana
tion
and
ages
(in
pro
ject
are
a)8.
2R
esea
rch
on B
iodi
vers
ity C
onse
rvat
ion
8.2.
1A
rea
Iden
tific
atio
n an
d Fe
asib
ility
Stu
dy o
f Hot
spot
s(1
) Are
a id
entif
icat
ioin
and
bou
ndar
y su
rvey
(2) F
easib
ility
Stu
dy o
f the
iden
tifie
d sit
es(3
) Bou
ndar
y m
arki
ng8.
2.2
Stud
y of
the
soci
o-ec
onom
ic li
nkag
es o
f wild
life
cons
erva
tion
8.2.
3Fe
asib
ility
stud
y of
pot
entia
l eco
tour
ism si
tes
8.3
Stud
y an
d R
esea
rch
for L
ivel
ihoo
d Im
prov
emen
t8.
3.1
As R
equi
red
8.4
AR
-CD
M8.
4.1
Phas
e I
(1)L
and
Elig
ibili
ty8.
4.2
Phas
e II
(1)P
roje
ct B
ound
ary
Surv
ey (
500h
a/ u
nit)
(2)S
ocio
-eco
nom
ic S
urve
y(3
)Nat
ural
Env
ironm
ent S
urve
y (4
)Bas
elin
e B
iom
ass S
urve
y (b
iom
ass,
litte
r/ de
ad tr
ees,
soil
carb
on, a
naly
sis)
(5)B
iom
ass S
urve
y in
Exi
stin
g Pl
anta
tion
(bio
mas
s, lit
ter/
dead
tree
s, so
il ca
rbon
, ana
lysis
) 8.
4.3
Phas
e II
(1)P
roje
ct G
HG
Em
issio
n S
urve
y(2
)Lea
kage
Sur
vey
Atta
chm
ent A
13-3
Impl
emen
tatio
n Sc
hedu
le o
f Pro
ject
Wor
ks

For Official Use Only Special Assistance for Project Formation (SAPROF) for
Uttar Pradesh Natural Resources Management and Poverty Alleviation Project (UPNRMPAP)
Final Report - Volume II Annex 13-A12
Att
achm
ent I
II.3
.47
Impl
men
tatio
n Sc
hedu
le o
f Pro
ject
Wor
k 2008/09
2009/10
2010/11
2011/12
2012/13
2013/14
2014/15
2015/16
2016/17
45
67
89
1011
121
23
45
67
89
1011
121
23
45
67
89
1011
121
23
45
67
89
1011
121
23
45
67
89
1011
121
23
45
67
89
1011
121
23
45
67
89
1011
121
23
45
67
89
1011
121
23
45
67
89
1011
121
23
Loa
n A
gree
men
t effe
ctiv
ePr
ojec
t Per
iod
Proc
urem
ent o
f Pro
ject
Con
sulta
nt1
Prep
arat
ory
Wor
ks1.
1In
stitu
tiona
l Arr
ange
men
t of P
MU
/DM
Us/
FMU
sal
l
1.1.
1Fo
rmin
g Em
pow
ered
Com
mitt
ee1s
t gro
up
1.1.
2C
reat
ion
of P
roje
ct M
anag
emen
t Uni
t (PM
U)
2nd
grou
p
1.1.
3Pr
epar
atio
n of
Ope
ratio
n M
anua
l of P
MU
3rd
grou
p
1.1.
4Po
stin
g ad
ditio
nal s
taff
for P
MU
/DM
Us/
FMU
s1.
1.5
Rec
ruitm
ent o
f pro
ject
staf
f fro
m th
e op
en m
arke
t1.
2St
ream
linin
g of
JFM
Rul
es1.
3So
il Su
rvey
1.3.
1D
emar
catio
n of
surv
ey a
rea
1.3.
2Pr
ocur
emen
t of c
ontra
ctor
(s) f
or so
il su
rvey
1.3.
3So
il su
rvey
by
the
cont
ract
or(s
)1.
3.4
Prep
arat
ion
of la
nd c
apab
ility
map
for p
lant
atio
n1.
4V
illag
e Se
lect
ion
1.4.
1Se
lect
ion
of p
ossib
le JF
M/E
DC
are
as1.
4.2
Prep
arat
ion
of se
lect
ion
crite
ria o
f tar
get v
illag
es fo
r JFM
/ED
C
1.4.
2M
aste
r-lis
ting
of ta
rget
vill
ages
for J
FMC
/ED
C1.
4.3
Scre
enin
g of
mas
ter-
liste
d vi
llage
s usin
g th
e cr
iteria
1.4.
4Sh
ort-l
istin
g of
pot
entia
l vill
ages
1.4.
5Pr
iorit
izat
ion
of sh
ort-l
isted
vill
ages
1.4.
6C
onse
nsus
bui
ldin
g of
vill
ager
s1.
4.7
Fina
l list
ing
of ta
rget
vill
ages
and
app
rova
l1.
5Si
te D
emar
catio
n, su
rvey
and
map
ping
1.
5.1
Site
dem
arca
tion/
re-d
emar
catio
n) in
the
field
(1)F
ield
Sur
vey
and
setti
ng p
illar
s of J
FM a
reas
(2)F
ield
surv
ey a
nd se
tting
pill
ars o
f eco
-dev
. are
a1.
5.2
Gro
und
Surv
ey a
nd M
appi
ng(1
)Gro
und
surv
ey a
nd m
appi
ng o
f JFM
are
as(2
)Gro
und
surv
ey a
nd m
appi
ng o
f eco
-dev
. are
as1.
6Pr
epar
atio
n of
Gui
delin
es fo
r Pro
ject
Sta
ff an
d Pa
rtner
NG
Os (
1500
cop
ies e
ach)
(1)P
roje
ct M
anag
emen
t and
M&
E(2
)Com
mun
ity O
rgan
izin
g(3
)Mic
ro p
lann
ing
(4)F
ores
t Dev
elop
men
t & E
co-d
evel
opm
ent
(5)I
GA
(6)L
ivel
ihoo
d se
curit
y(7
)Tra
inin
g/C
apac
ity B
uild
ing
1.7
Prep
arat
ion
of M
anua
l for
Pro
ject
Sta
ff (1
500
copi
es e
ach)
(1)P
roje
ct M
anag
emen
t and
M&
E(2
)Com
mun
ity O
rgan
izin
g an
d M
icro
pla
nnin
g(3
)IG
A a
nd L
ivel
ihoo
d se
curit
y1.
8Pr
epar
atio
n of
Han
dboo
k fo
r JFM
Cs/
EDC
s (30
00 c
opie
s eac
h)(1
)Com
mun
ity O
rgan
izin
g an
d M
icro
pla
nnin
g(2
)JFM
C/E
DC
Man
agem
ent a
nd A
dmin
istra
tion
(3)L
ivel
ihoo
d se
curit
y ac
tiviti
es u
nder
UP-
NR
MPA
P1.
9Pr
epar
atio
n of
Han
dboo
k fo
r SH
G/S
HG
Con
sorti
um (3
000
copi
es e
ach)
(1)S
HG
For
mul
atio
n an
d M
anag
emen
t(2
)SH
G C
onso
rtium
For
mul
atio
n an
d M
anag
emen
t(3
)IG
A a
nd B
usin
ess s
cale
-up
Atta
chm
ent A
13-3
Impl
emen
tatio
n Sc
hedu
le o
f Pro
ject
Wor
ks

For Official Use Only Special Assistance for Project Formation (SAPROF) for
Uttar Pradesh Natural Resources Management and Poverty Alleviation Project (UPNRMPAP)
Final Report - Volume II Annex 13-A13
Att
achm
ent I
II.3
.47
Impl
men
tatio
n Sc
hedu
le o
f Pro
ject
Wor
k 2008/09
2009/10
2010/11
2011/12
2012/13
2013/14
2014/15
2015/16
2016/17
45
67
89
1011
121
23
45
67
89
1011
121
23
45
67
89
1011
121
23
45
67
89
1011
121
23
45
67
89
1011
121
23
45
67
89
1011
121
23
45
67
89
1011
121
23
45
67
89
1011
121
23
45
67
89
1011
121
23
Loan
Agr
eem
ent e
ffect
ive
Pro j
ect P
erio
dPr
ocur
emen
t of P
roje
ct C
onsu
ltant
9C
omm
unic
atio
n an
d Pu
blic
atio
n9.
1Ch
ildre
n's F
ores
t9.
2W
ebsit
e de
velo
pmen
t9.
3Pu
blic
info
rmat
ion
driv
e9.
4Pu
blic
atio
n9.
4.1
New
slette
r9.
4.2
Rev
iew
Rep
ort
9.4.
3B
roch
ure
9.4.
4Le
afle
t
10M
onito
ring
and
Eva
luat
ion
10.1
Prep
arat
ion
of P
roje
ct M
&E
Man
ual
10.2
Esta
blish
men
t of P
roje
ct M
anag
emen
t Inf
orm
atio
n Sy
stem
10.3
Esta
blish
men
t of P
roje
ct D
atab
ase
10.4
Prog
ress
Mon
itorin
g an
d A
naly
ses
10.5
Eval
uatio
n of
Pro
ject
Impa
ct
10.5
.1Su
rvey
s for
Phy
sical
Impa
ct o
f the
Pro
ject
a.Su
rvey
on
Fore
st A
reas
(1)S
urve
y on
cha
nges
in fo
rest
cov
er a
nd fo
rest
are
as a
t ex
ante
, mid
-term
, and
ex
post
pro
ject
a) P
rocu
rem
ent o
f bas
elin
e su
rvey
con
tract
orb)
bas
elin
e su
rvey
c) P
rocu
rem
ent o
f im
pact
surv
ey c
ontra
ctor
d) m
id-te
rm im
pact
surv
eye)
ex-
post
impa
ct su
rvey
(2)S
urve
y on
stan
ding
stoc
k in
inte
rven
tion
area
s at e
x an
te, m
id-te
rm, a
nd e
x po
st p
roje
cta)
Pro
cure
men
t of b
asel
ine
surv
ey c
ontra
ctor
b) b
asel
ine
surv
eyc)
Pro
cure
men
t of i
mpa
ct su
rvey
con
tract
ord)
mid
-term
impa
ct su
rvey
e) e
x-po
st im
pact
surv
eyb.
Surv
ey o
n Pr
otec
ted
Are
as(1
)Bas
elin
e Ec
olog
ical
surv
ey
(2)P
opul
atio
n co
unt o
f key
wild
life
spec
ies (
mid
-term
)(3
)Pop
ulat
ion
coun
t of k
ey w
ildlif
e sp
ecie
s (ex
-pos
t)10
.5.2
Soci
o-ec
onom
ic Im
pact
Sur
veys
a.Pr
ocur
emen
t of b
asel
ine
surv
ey c
ontra
ctor
sb.
Soci
o-ec
onom
ic b
asel
ine
surv
eyc.
Proc
urem
ent o
f im
pact
surv
ey c
ontra
ctor
sd.
Soci
o-ec
onom
ic m
id-te
rm im
pact
surv
eye.
Soci
o-ec
onom
ic te
rmin
al im
pact
surv
eyf.
Soci
o-ec
onom
ic im
pact
ass
essm
ent o
f IG
A o
n SH
Gg.
Mid
-term
Inst
itutio
nal e
volu
tion
stud
y of
SH
G c
onso
rtium
h.M
id-te
rm M
arke
t dyn
amic
s ana
lysis
for s
copi
ng st
udy
of S
HG
pro
duct
s
11Ph
ase-
out/p
hase
-in W
orks
11.1
Com
plet
ion
Certi
ficat
e of
Con
tanc
ted
JFM
C/ED
C w
ork
11.2
Phas
e in
Pla
n of
JFM
Cs
11.3
Phas
e in
Pla
n of
ED
Cs11
.4Ph
ase
in P
lan
of IG
A-G
s/SH
Gs
11.5
Phas
e in
Pla
n of
mic
ro e
nter
prise
s
12C
onsu
lting
Ser
vice
s
13Pr
ojec
t Man
agem
ent
Atta
chm
ent A
13-3
Impl
emen
tatio
n Sc
hedu
le o
f Pro
ject
Wor
ks

For Official Use Only Special Assistance for Project Formation (SAPROF) for
Uttar Pradesh Natural Resources Management and Poverty Alleviation Project (UPNRMPAP)
Final Report-Volume II Annex 13-A14
Attachment A13 - 4 Organization Chart for Implementation
Project Management Unit (PMU) (autonomous registered society)
As grants Executive Body Project Director/CEO: APCCF/ CCF
Governing Body Chairperson: PS, Forests
Vice Chairperson: PCCF-UPFD Member Secretary: Project Director
Empowered Committee Chairperson: Chief Secretary
Finance Department
Forest Department
Through Budgetary allocation
Division Management Unit (within DFO office)
Zonal Office [CCF]
Circle Office [CF]
District Level Project Advisory Committee
Oversight responsibility
Project Consultant
NGO Support Organization
Field Management Unit(within RO office)
Partner NGOs
Implementing Organizations
JFMC EDC
SHG
Fund
Advice
Resource Organization

For Official Use OnlySpecial Assistance for Project Formation (SAPROF) for
Uttar Pradesh Natural Resource Managment and Poverty Alleviation Project (UPNRMPAP)
Attachment A13-5 Proponent/Owner, Executer/Contractor and Procurement/ Implementation Methods
1 Preparatory Works1.1 Institutional Arrangement of PMU/DMUs/FMUs
1.1.1 Forming Empowered Committee1.1.2 Creation of Project Management Unit (PMU)1.1.3 Preparation of Operation Manual of PMU1.1.4 Posting additional staff for PMU/DMUs/FMUs1.1.5 Recruitment of project staff from the open market
1.2 Streamlining of JFM Rules UPFD UPFD/ Consultant Direct Undertaking
1.3 Soil Survey1.3.1 Demarcation of survey area1.3.2 Procurement of contractor(s) for soil survey1.3.3 Soil survey by the contractor(s)1.3.4 Preparation of land capability map for plantation
1.4 Village Selection1.4.1 Selection of possible JFM/EDC areas
(1) Selection of possible areas for JFM(2) Selection of possible areas for Eco-development
1.4.2 Preparation of selection criteria of target villages for JFM/EDC (1) Selection criteria for target villages for JFM(2) Selection criteria of target villages for EDC
1.4.2 Master-listing of target villages for JFMC/EDC1.4.3 Screening of master-listed villages using the criteria
(1) For JFMC(2) For EDC
1.4.4 Short-listing of potential villages1.4.5 Prioritization of short-listed villages
(1) For JFMC(2) For EDC
1.4.6 Consensus building of villagers1.4.7 Final listing of target villages and approval
1.5 Site Demarcation, survey and mapping 1.5.1 Site demarcation/re-demarcation) in the field
(1) Field Survey and setting pillars of JFM areas(2) Field survey and setting pillars of eco-dev. area
1.5.2 Ground Survey and Mapping(1) Ground survey and mapping of JFM areas(2) Ground survey and mapping of eco-dev. areas
1.6 Preparation of Guidelines for Project Staff and Partner NGOs (1500 copies each)(1) Project Management and M&E(2) Community Organizing(3) Micro planning(4) Forest Development & Eco-development(5) IGA(6) Livelihood security(7) Training/Capacity Building
1.7 Preparation of Manual for Project Staff (1500 copies each)(1) Project Management and M&E(2) Community Organizing and Micro planning(3) IGA and Livelihood security
1.8 Preparation of Handbook for JFMCs/EDCs (3000 copies each)(1) Community Organizing and Micro planning(2) JFMC/EDC Management and Administration(3) Livelihood security activities under UP-NRMPAP
1.9 Preparation of Handbook for SHG/SHG Consortium (3000 copies each)(1) SHG Formulation and Management(2) SHG Consortium Formulation and Management(3) IGA and Business scale-up
2 Institutional Strengthening of PMU/DMUs/FMUs2.1 Capacity development of PMU/DMUs/FMUs
2.1.1 Preparation of Training Master Plan by DesignersPMU,DMU,External ExpertConsultant
Direct Undertaking/Individual Contract
(1) Training Needs Analysis External Expert,Contractor
Local Bidding/Individual Contract
(2) Long listing of Training Providers(3) Master Planning(4) Preparation of TORs for various training packages
2.1.2 Procurement of training service providers2.1.4 Training for PMU and DMU
(1) Orientation for project staff(2) Orientation for newly recruited project staff(3) Joint Forest Management/ Eco-Development I(4) Joint Forest Management/ Eco-Development II(5) Microplanning and Annual Implementation Planning I(6) Microplanning and Annual Implementation Planning II(7) Microplanning and Annual Implementation Planning III(8) Project Management, M & E I(9) Project Management, M & E II
PMU,DMU,External ExpertConsultant
Direct Undertaking/Individual Contract
Method
Local Bidding/ PriceQuotation
PMU, DMU, FMU/Contractor
Item Proponent/Owner
Executer/Contractor
UPFD Staff/
PMU/ Consultant/External Expert
Direct Undertaking/
PMU
Direct Undertaking/ Individual Contract
PMU/DMU FMU, JFMC&EDC/Contractor
Direct Undertaking/Local Bidding
UPFDUPFD Direct Undertaking
PMU/DMU DMU/FMU/JFMC/EDC Direct Undertaking
PMU
PMU
Final Report - Volume II Annex 13 -A15

For Official Use OnlySpecial Assistance for Project Formation (SAPROF) for
Uttar Pradesh Natural Resource Managment and Poverty Alleviation Project (UPNRMPAP)
MethodItem Proponent/Owner
Executer/Contractor
(10)Gender in Development(11)Alternative Livelihoods I(12)Alternative Livelihoods II(13)Forest Technologies I(14)Forest Technologies II(15)Forest Technologies III(16)Organisational Behavior and Development I(17)Organisational Behavior and Development II(18)Wildlife training I(19)Wildlife training II(20)Wildlife training III(21)GIS training I(22)GIS training II
(23)MIS and Monitoring I
(24)MIS and Monitoring II(25)Trainings for Ministerial staff
2.1.5 Study Tour for PMU and DMU(1) Out of state study tour(2) International study tour
2.1.6 Training for FMU(1) Orientation for project staff(2) Orientation for newly recruited project staff(3) Joint Forest Management/ Eco-Development I(4) Joint Forest Management/ Eco-Development II(5) Microplanning and Annual Implementation Planning I(6) Microplanning and Annual Implementation Planning II(7) Project Management, M & E I(8) Project Management, M & E II(9) Gender in Development(10)Alternative Livelihoods(11)Forest Technologies I(12)Forest Technologies II(13)Organisational Behavior and Development(14)Wildlife training I(15)Wildlife training II(16)Wildlife training III(17)Trainings for Ministerial staff
2.1.7 Study Tour for FMU(1) Study tour on JFM/EDC within state(2) Study tour on IGA outside state
2.1.8 Annual Review Meeting(1) Annual review meeting at state level(2) Biannial review meeting at division level PMU/ DMU/FMU
2.2 Improvement of Infrastructure2.2.1 PMU Office building
(1) Construction of PMU Office building(2) Back-up power supply(3) Procurement of associated furniture
2.2.2 DMU Offices(1) Renovation of Division Offices(2) Extension of Division Offices
2.2.3 FMU Offices(1) Construction of Range office & FMU office (60 m2+60 m2)(2) Renovation of Range Offices (60 m2)(3) Extension of Range Offices (60 m2)
2.2.4 DMU/FMU Staff Quarters(1) Construction of RFO-quarters (79 m2)(2) Construction of Forester-quarters (57.7 m2)(3) Construction of Beat Guard quarters (34.2 m2)
2.3 Augmentation of Office Facilities2.3.1 Procurement of Office Equipment for PMU Office PMU2.3.2 Procurement of Office Equipment and Furniture for DMU Offices at Division Offices DMU2.3.3 Procurement of Equipment and Furniture for FMU Offices at Rance Offices FMU2.3.4 Computer Software in PMU PMU2.3.5 Computer Software for PMU and DMU PMU/DMU
2.4 Strengthening of Mobility2.4.1 Procurement of Vehicles for PMU
(1) 4 wheel drive vehicle(2) Mini-bus
2.4.2 Procurement of Vehicles/Motorcycles for DMU DMU2.4.3 Procurement of Vehicles/Motorcycles/Cycles for FMU FMU
3 Capacity Building of NGO/JFMC/EDC/SHG
3.1 Capacity building of NGO PMU PMU /Consultant Direct Undertaking
3.2 Capacity Building of JFMC3.2.1 Training on micro planning and annual implementation planning3.2.2 Training on JFMC Management I3.2.3 Training on JFMC Management II3.2.4 Exposure trips / exchange visit DMU/FMU/JFMC Direct Undertaking
UPFD Staff/External Expert
Direct Undertaking/Individual Contract
DMU//FMU/JFMC/NGOs
External Expert
Price Quotation
PMU
Dealer
(Local bidding)/Direct Undertaking
Local biddingContractorPMU/DMU/FMU
PMU/DMU
PMU
PMU/DMU
PMU/DMU/FMU
Individual Contract
PMU
PMU/DMU Staff Direct Undertaking
Direct Undertaking/Individual Contract
FMU Staff
PMU/ DMU
UPFD Staff/External Expert
PMU/ Consultant Direct Undertaking
Final Report - Volume II Annex 13 -A16
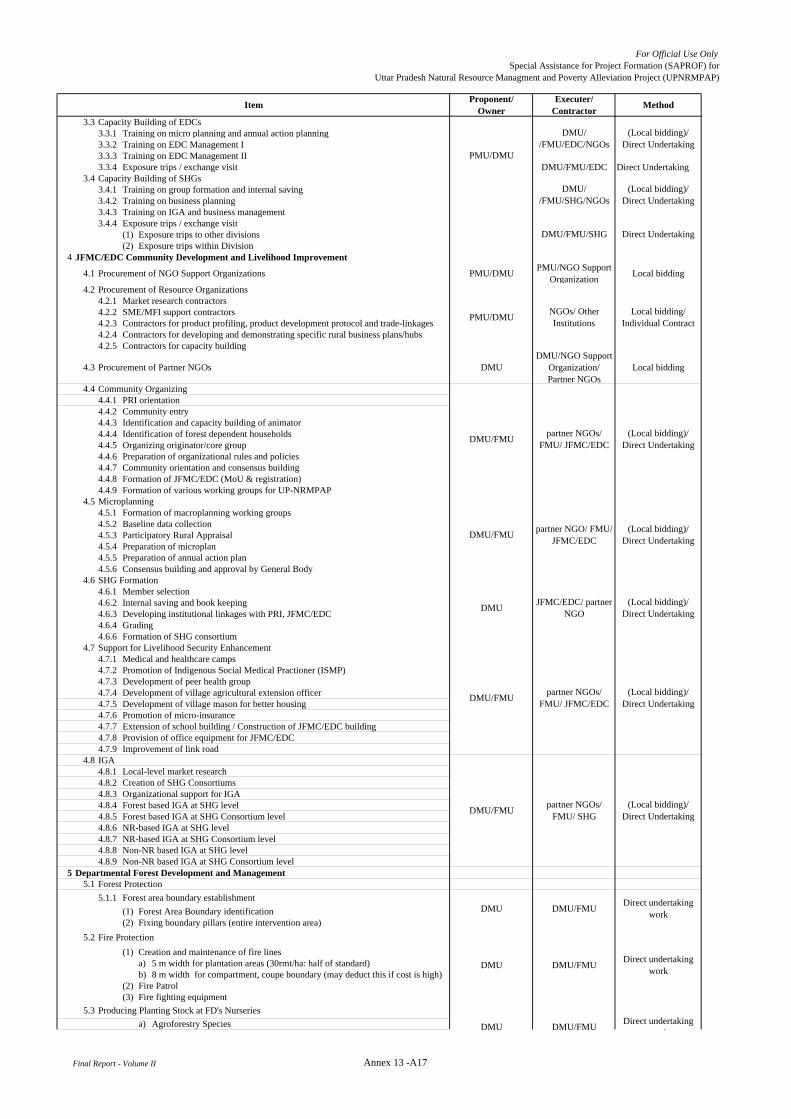
For Official Use OnlySpecial Assistance for Project Formation (SAPROF) for
Uttar Pradesh Natural Resource Managment and Poverty Alleviation Project (UPNRMPAP)
MethodItem Proponent/Owner
Executer/Contractor
3.3 Capacity Building of EDCs3.3.1 Training on micro planning and annual action planning3.3.2 Training on EDC Management I3.3.3 Training on EDC Management II3.3.4 Exposure trips / exchange visit DMU/FMU/EDC Direct Undertaking
3.4 Capacity Building of SHGs3.4.1 Training on group formation and internal saving3.4.2 Training on business planning3.4.3 Training on IGA and business management3.4.4 Exposure trips / exchange visit
(1) Exposure trips to other divisions(2) Exposure trips within Division
4 JFMC/EDC Community Development and Livelihood Improvement
4.1 Procurement of NGO Support Organizations PMU/DMU PMU/NGO SupportOrganization Local bidding
4.2 Procurement of Resource Organizations4.2.1 Market research contractors4.2.2 SME/MFI support contractors4.2.3 Contractors for product profiling, product development protocol and trade-linkages4.2.4 Contractors for developing and demonstrating specific rural business plans/hubs4.2.5 Contractors for capacity building
4.3 Procurement of Partner NGOs DMUDMU/NGO Support
Organization/Partner NGOs
Local bidding
4.4 Community Organizing4.4.1 PRI orientation4.4.2 Community entry4.4.3 Identification and capacity building of animator4.4.4 Identification of forest dependent households4.4.5 Organizing originator/core group4.4.6 Preparation of organizational rules and policies4.4.7 Community orientation and consensus building4.4.8 Formation of JFMC/EDC (MoU & registration)4.4.9 Formation of various working groups for UP-NRMPAP
4.5 Microplanning4.5.1 Formation of macroplanning working groups4.5.2 Baseline data collection4.5.3 Participatory Rural Appraisal4.5.4 Preparation of microplan4.5.5 Preparation of annual action plan4.5.6 Consensus building and approval by General Body
4.6 SHG Formation4.6.1 Member selection4.6.2 Internal saving and book keeping4.6.3 Developing institutional linkages with PRI, JFMC/EDC 4.6.4 Grading4.6.6 Formation of SHG consortium
4.7 Support for Livelihood Security Enhancement4.7.1 Medical and healthcare camps4.7.2 Promotion of Indigenous Social Medical Practioner (ISMP)4.7.3 Development of peer health group4.7.4 Development of village agricultural extension officer4.7.5 Development of village mason for better housing4.7.6 Promotion of micro-insurance4.7.7 Extension of school building / Construction of JFMC/EDC building4.7.8 Provision of office equipment for JFMC/EDC4.7.9 Improvement of link road
4.8 IGA4.8.1 Local-level market research4.8.2 Creation of SHG Consortiums4.8.3 Organizational support for IGA4.8.4 Forest based IGA at SHG level4.8.5 Forest based IGA at SHG Consortium level4.8.6 NR-based IGA at SHG level4.8.7 NR-based IGA at SHG Consortium level4.8.8 Non-NR based IGA at SHG level4.8.9 Non-NR based IGA at SHG Consortium level
5 Departmental Forest Development and Management5.1 Forest Protection
5.1.1 Forest area boundary establishment(1) Forest Area Boundary identification(2) Fixing boundary pillars (entire intervention area)
5.2 Fire Protection(1) Creation and maintenance of fire lines
a) 5 m width for plantation areas (30rmt/ha: half of standard)b) 8 m width for compartment, coupe boundary (may deduct this if cost is high)
(2) Fire Patrol(3) Fire fighting equipment
5.3 Producing Planting Stock at FD's Nurseriesa) Agroforestry Species
(Local bidding)/Direct Undertaking
(Local bidding)/Direct Undertaking
DMU/FMU/SHG Direct Undertaking
(Local bidding)/Direct Undertaking
Direct undertakingk
DMU DMU/FMU
DMU JFMC/EDC/ partnerNGO
(Local bidding)/Direct Undertaking
DMU/FMU partner NGO/ FMU/JFMC/EDC
DMU/FMU partner NGOs/FMU/ JFMC/EDC
DMU//FMU/EDC/NGOs
PMU/DMU NGOs/ OtherInstitutions
Direct undertakingwork
DMU DMU/FMU Direct undertakingwork
DMU DMU/FMU
DMU/FMU partner NGOs/FMU/ SHG
(Local bidding)/Direct Undertaking
DMU/FMU partner NGOs/FMU/ JFMC/EDC
(Local bidding)/Direct Undertaking
Local bidding/Individual Contract
PMU/DMU
DMU//FMU/SHG/NGOs
(Local bidding)/Direct Undertaking
Final Report - Volume II Annex 13 -A17
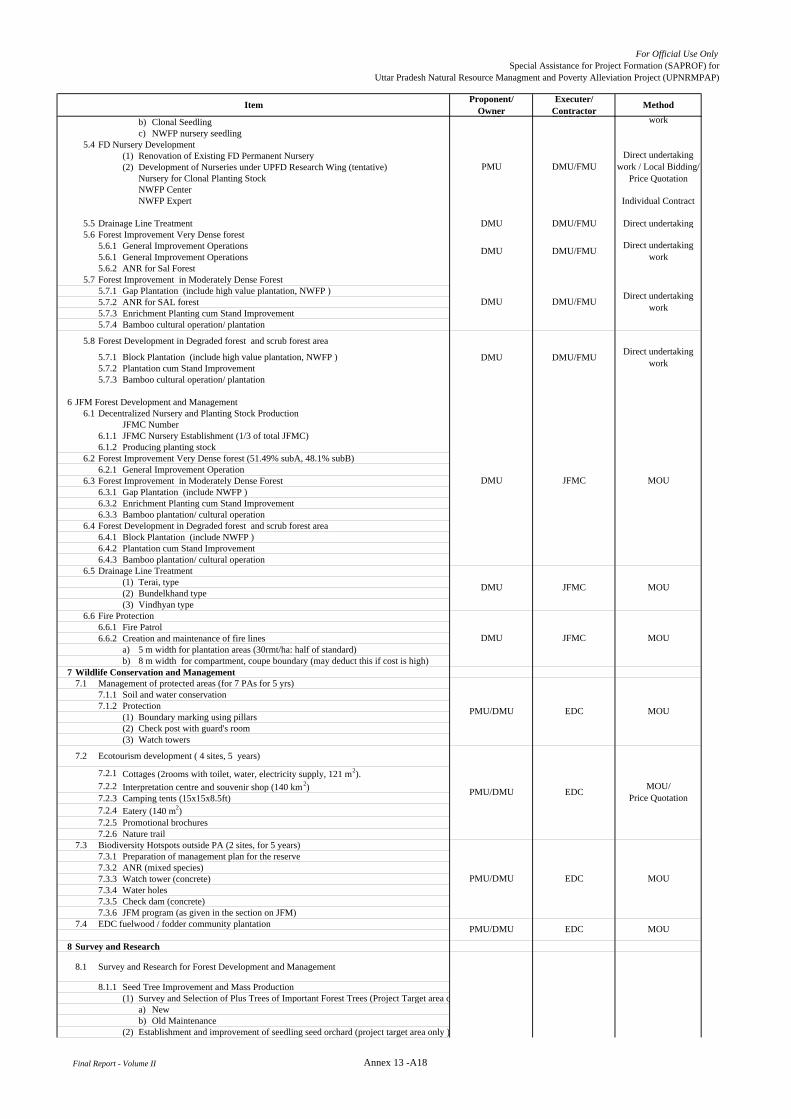
For Official Use OnlySpecial Assistance for Project Formation (SAPROF) for
Uttar Pradesh Natural Resource Managment and Poverty Alleviation Project (UPNRMPAP)
MethodItem Proponent/Owner
Executer/Contractor
b) Clonal Seedlingc) NWFP nursery seedling
5.4 FD Nursery Development(1) Renovation of Existing FD Permanent Nursery(2) Development of Nurseries under UPFD Research Wing (tentative)
Nursery for Clonal Planting StockNWFP CenterNWFP Expert Individual Contract
5.5 Drainage Line Treatment DMU DMU/FMU Direct undertaking5.6 Forest Improvement Very Dense forest
5.6.1 General Improvement Operations 5.6.1 General Improvement Operations 5.6.2 ANR for Sal Forest
5.7 Forest Improvement in Moderately Dense Forest 5.7.1 Gap Plantation (include high value plantation, NWFP )5.7.2 ANR for SAL forest5.7.3 Enrichment Planting cum Stand Improvement 5.7.4 Bamboo cultural operation/ plantation
5.8 Forest Development in Degraded forest and scrub forest area
5.7.1 Block Plantation (include high value plantation, NWFP )5.7.2 Plantation cum Stand Improvement5.7.3 Bamboo cultural operation/ plantation
6 JFM Forest Development and Management 6.1 Decentralized Nursery and Planting Stock Production
JFMC Number6.1.1 JFMC Nursery Establishment (1/3 of total JFMC)6.1.2 Producing planting stock
6.2 Forest Improvement Very Dense forest (51.49% subA, 48.1% subB)6.2.1 General Improvement Operation
6.3 Forest Improvement in Moderately Dense Forest 6.3.1 Gap Plantation (include NWFP )6.3.2 Enrichment Planting cum Stand Improvement 6.3.3 Bamboo plantation/ cultural operation
6.4 Forest Development in Degraded forest and scrub forest area6.4.1 Block Plantation (include NWFP )6.4.2 Plantation cum Stand Improvement6.4.3 Bamboo plantation/ cultural operation
6.5 Drainage Line Treatment (1) Terai, type(2) Bundelkhand type(3) Vindhyan type
6.6 Fire Protection6.6.1 Fire Patrol6.6.2 Creation and maintenance of fire lines
a) 5 m width for plantation areas (30rmt/ha: half of standard)b) 8 m width for compartment, coupe boundary (may deduct this if cost is high)
7 Wildlife Conservation and Management7.1 Management of protected areas (for 7 PAs for 5 yrs)
7.1.1 Soil and water conservation7.1.2 Protection
(1) Boundary marking using pillars(2) Check post with guard's room(3) Watch towers
7.2 Ecotourism development ( 4 sites, 5 years)
7.2.1 Cottages (2rooms with toilet, water, electricity supply, 121 m2).7.2.2 Interpretation centre and souvenir shop (140 km2)7.2.3 Camping tents (15x15x8.5ft)7.2.4 Eatery (140 m2)7.2.5 Promotional brochures7.2.6 Nature trail
7.3 Biodiversity Hotspots outside PA (2 sites, for 5 years)7.3.1 Preparation of management plan for the reserve7.3.2 ANR (mixed species)7.3.3 Watch tower (concrete)7.3.4 Water holes7.3.5 Check dam (concrete)7.3.6 JFM program (as given in the section on JFM)
7.4 EDC fuelwood / fodder community plantation
8 Survey and Research
8.1 Survey and Research for Forest Development and Management
8.1.1 Seed Tree Improvement and Mass Production(1) Survey and Selection of Plus Trees of Important Forest Trees (Project Target area o
a) Newb) Old Maintenance
(2) Establishment and improvement of seedling seed orchard (project target area only )
Direct undertakingwork / Local Bidding/
Price Quotation
work
DMU/FMU
DMU DMU/FMU
PMU
PMU/DMU EDC MOU
PMU/DMU EDC MOU
PMU/DMU EDC MOU/Price Quotation
PMU/DMU EDC MOU
DMU JFMC MOU
MOUJFMCDMU
DMU JFMC MOU
Direct undertakingworkDMU/FMUDMU
DMU DMU/FMU Direct undertakingwork
DMU DMU/FMU Direct undertakingwork
Final Report - Volume II Annex 13 -A18
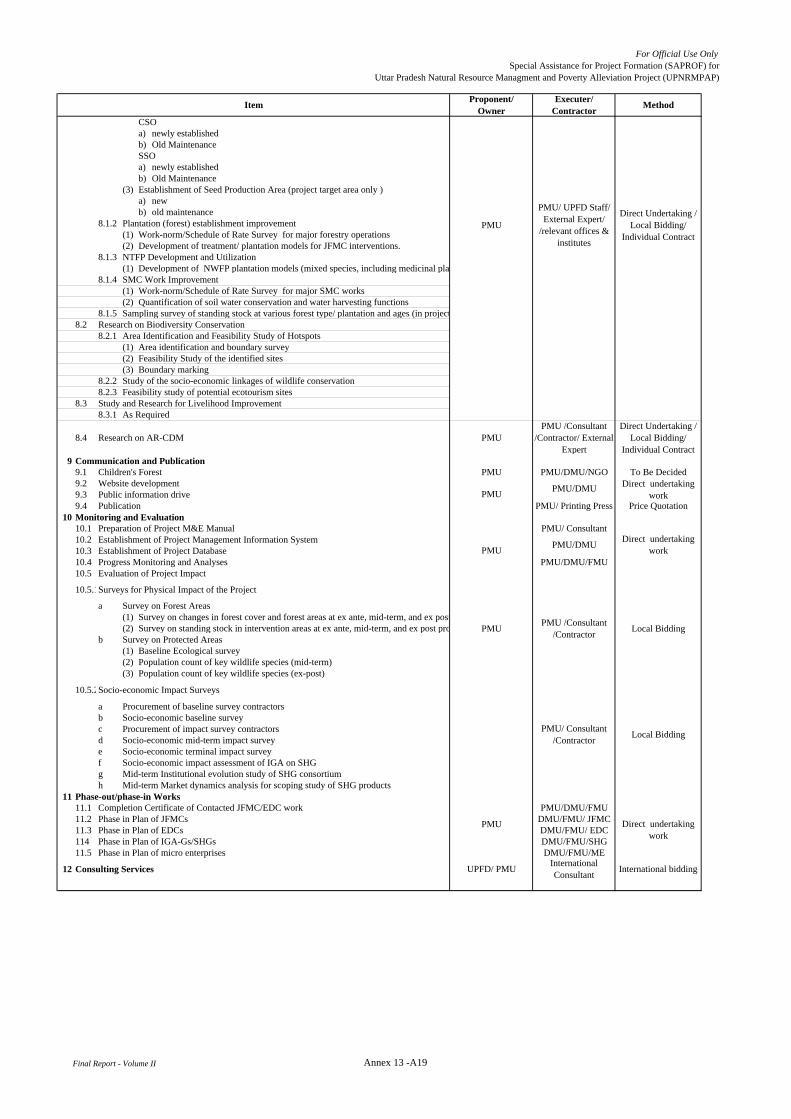
For Official Use OnlySpecial Assistance for Project Formation (SAPROF) for
Uttar Pradesh Natural Resource Managment and Poverty Alleviation Project (UPNRMPAP)
MethodItem Proponent/Owner
Executer/Contractor
CSOa) newly establishedb) Old MaintenanceSSOa) newly establishedb) Old Maintenance
(3) Establishment of Seed Production Area (project target area only )a) new b) old maintenance
8.1.2 Plantation (forest) establishment improvement(1) Work-norm/Schedule of Rate Survey for major forestry operations(2) Development of treatment/ plantation models for JFMC interventions.
8.1.3 NTFP Development and Utilization(1) Development of NWFP plantation models (mixed species, including medicinal pla
8.1.4 SMC Work Improvement(1) Work-norm/Schedule of Rate Survey for major SMC works(2) Quantification of soil water conservation and water harvesting functions
8.1.5 Sampling survey of standing stock at various forest type/ plantation and ages (in project8.2 Research on Biodiversity Conservation
8.2.1 Area Identification and Feasibility Study of Hotspots(1) Area identification and boundary survey(2) Feasibility Study of the identified sites(3) Boundary marking
8.2.2 Study of the socio-economic linkages of wildlife conservation8.2.3 Feasibility study of potential ecotourism sites
8.3 Study and Research for Livelihood Improvement8.3.1 As Required
8.4 Research on AR-CDM PMUPMU /Consultant
/Contractor/ ExternalExpert
Direct Undertaking /Local Bidding/
Individual Contract9 Communication and Publication
9.1 Children's Forest PMU PMU/DMU/NGO To Be Decided9.2 Website development9.3 Public information drive9.4 Publication PMU/ Printing Press Price Quotation
10 Monitoring and Evaluation10.1 Preparation of Project M&E Manual PMU/ Consultant10.2 Establishment of Project Management Information System10.3 Establishment of Project Database10.4 Progress Monitoring and Analyses PMU/DMU/FMU10.5 Evaluation of Project Impact
10.5.1Surveys for Physical Impact of the Project
a Survey on Forest Areas(1) Survey on changes in forest cover and forest areas at ex ante, mid-term, and ex post(2) Survey on standing stock in intervention areas at ex ante, mid-term, and ex post pro
b Survey on Protected Areas(1) Baseline Ecological survey (2) Population count of key wildlife species (mid-term)(3) Population count of key wildlife species (ex-post)
10.5.2Socio-economic Impact Surveys
a Procurement of baseline survey contractorsb Socio-economic baseline surveyc Procurement of impact survey contractorsd Socio-economic mid-term impact surveye Socio-economic terminal impact surveyf Socio-economic impact assessment of IGA on SHGg Mid-term Institutional evolution study of SHG consortiumh Mid-term Market dynamics analysis for scoping study of SHG products
11 Phase-out/phase-in Works11.1 Completion Certificate of Contacted JFMC/EDC work PMU/DMU/FMU11.2 Phase in Plan of JFMCs DMU/FMU/ JFMC11.3 Phase in Plan of EDCs DMU/FMU/ EDC114 Phase in Plan of IGA-Gs/SHGs DMU/FMU/SHG11.5 Phase in Plan of micro enterprises DMU/FMU/ME
12 Consulting Services UPFD/ PMU InternationalConsultant International bidding
Direct undertakingwork
PMU/DMUPMU
PMUDirect undertaking
workPMU/DMU
Direct undertakingwork
PMU PMU /Consultant/Contractor Local Bidding
PMU/ Consultant/Contractor Local Bidding
PMU
PMU
PMU/ UPFD Staff/External Expert/
/relevant offices &institutes
Direct Undertaking /Local Bidding/
Individual Contract
Final Report - Volume II Annex 13 -A19
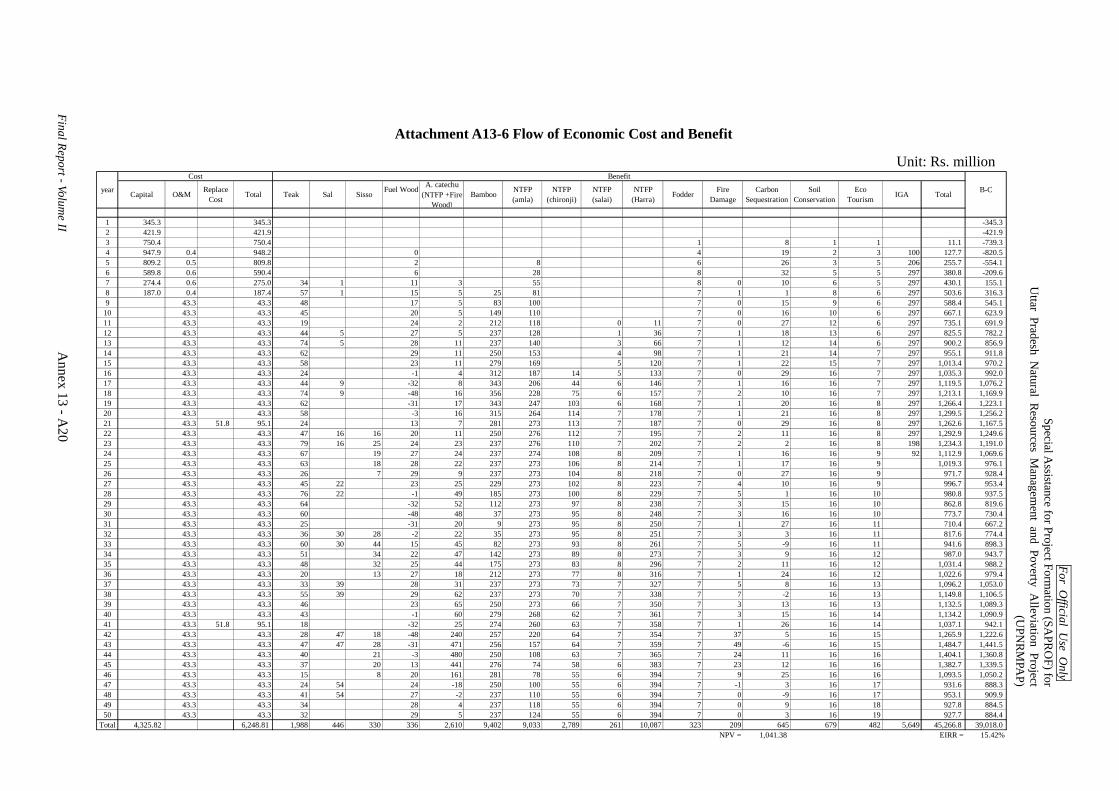
For Official U
se Only
Special Assistance for Project Form
ation (SAPR
OF) for
Uttar Pradesh N
atural Resources M
anagement and Poverty A
lleviation Project(U
PNR
MPA
P)
Final Report - Volume II
Annex 13 - A
20
Cost Benefit
Capital O&M ReplaceCost Total Teak Sal Sisso Fuel Wood A. catechu
(NTFP +FireWood)
Bamboo NTFP(amla)
NTFP(chironji)
NTFP(salai)
NTFP(Harra) Fodder Fire
DamageCarbon
SequestrationSoil
ConservationEco
Tourism IGA Total
1 345.3 345.3 -345.32 421.9 421.9 -421.93 750.4 750.4 1 8 1 1 11.1 -739.34 947.9 0.4 948.2 0 4 19 2 3 100 127.7 -820.55 809.2 0.5 809.8 2 8 6 26 3 5 206 255.7 -554.16 589.8 0.6 590.4 6 28 8 32 5 5 297 380.8 -209.67 274.4 0.6 275.0 34 1 11 3 55 8 0 10 6 5 297 430.1 155.18 187.0 0.4 187.4 57 1 15 5 25 81 7 1 1 8 6 297 503.6 316.39 43.3 43.3 48 17 5 83 100 7 0 15 9 6 297 588.4 545.1
10 43.3 43.3 45 20 5 149 110 7 0 16 10 6 297 667.1 623.911 43.3 43.3 19 24 2 212 118 0 11 7 0 27 12 6 297 735.1 691.912 43.3 43.3 44 5 27 5 237 128 1 36 7 1 18 13 6 297 825.5 782.213 43.3 43.3 74 5 28 11 237 140 3 66 7 1 12 14 6 297 900.2 856.914 43.3 43.3 62 29 11 250 153 4 98 7 1 21 14 7 297 955.1 911.815 43.3 43.3 58 23 11 279 169 5 120 7 1 22 15 7 297 1,013.4 970.216 43.3 43.3 24 -1 4 312 187 14 5 133 7 0 29 16 7 297 1,035.3 992.017 43.3 43.3 44 9 -32 8 343 206 44 6 146 7 1 16 16 7 297 1,119.5 1,076.218 43.3 43.3 74 9 -48 16 356 228 75 6 157 7 2 10 16 7 297 1,213.1 1,169.919 43.3 43.3 62 -31 17 343 247 103 6 168 7 1 20 16 8 297 1,266.4 1,223.120 43.3 43.3 58 -3 16 315 264 114 7 178 7 1 21 16 8 297 1,299.5 1,256.221 43.3 51.8 95.1 24 13 7 281 273 113 7 187 7 0 29 16 8 297 1,262.6 1,167.522 43.3 43.3 47 16 16 20 11 250 276 112 7 195 7 2 11 16 8 297 1,292.9 1,249.623 43.3 43.3 79 16 25 24 23 237 276 110 7 202 7 2 2 16 8 198 1,234.3 1,191.024 43.3 43.3 67 19 27 24 237 274 108 8 209 7 1 16 16 9 92 1,112.9 1,069.625 43.3 43.3 63 18 28 22 237 273 106 8 214 7 1 17 16 9 1,019.3 976.126 43.3 43.3 26 7 29 9 237 273 104 8 218 7 0 27 16 9 971.7 928.427 43.3 43.3 45 22 23 25 229 273 102 8 223 7 4 10 16 9 996.7 953.428 43.3 43.3 76 22 -1 49 185 273 100 8 229 7 5 1 16 10 980.8 937.529 43.3 43.3 64 -32 52 112 273 97 8 238 7 3 15 16 10 862.8 819.630 43.3 43.3 60 -48 48 37 273 95 8 248 7 3 16 16 10 773.7 730.431 43.3 43.3 25 -31 20 9 273 95 8 250 7 1 27 16 11 710.4 667.232 43.3 43.3 36 30 28 -2 22 35 273 95 8 251 7 3 3 16 11 817.6 774.433 43.3 43.3 60 30 44 15 45 82 273 93 8 261 7 5 -9 16 11 941.6 898.334 43.3 43.3 51 34 22 47 142 273 89 8 273 7 3 9 16 12 987.0 943.735 43.3 43.3 48 32 25 44 175 273 83 8 296 7 2 11 16 12 1,031.4 988.236 43.3 43.3 20 13 27 18 212 273 77 8 316 7 1 24 16 12 1,022.6 979.437 43.3 43.3 33 39 28 31 237 273 73 7 327 7 5 8 16 13 1,096.2 1,053.038 43.3 43.3 55 39 29 62 237 273 70 7 338 7 7 -2 16 13 1,149.8 1,106.539 43.3 43.3 46 23 65 250 273 66 7 350 7 3 13 16 13 1,132.5 1,089.340 43.3 43.3 43 -1 60 279 268 62 7 361 7 3 15 16 14 1,134.2 1,090.941 43.3 51.8 95.1 18 -32 25 274 260 63 7 358 7 1 26 16 14 1,037.1 942.142 43.3 43.3 28 47 18 -48 240 257 220 64 7 354 7 37 5 16 15 1,265.9 1,222.643 43.3 43.3 47 47 28 -31 471 256 157 64 7 359 7 49 -6 16 15 1,484.7 1,441.544 43.3 43.3 40 21 -3 480 250 108 63 7 365 7 24 11 16 16 1,404.1 1,360.845 43.3 43.3 37 20 13 441 276 74 58 6 383 7 23 12 16 16 1,382.7 1,339.546 43.3 43.3 15 8 20 161 281 78 55 6 394 7 9 25 16 16 1,093.5 1,050.247 43.3 43.3 24 54 24 -18 250 100 55 6 394 7 -1 3 16 17 931.6 888.348 43.3 43.3 41 54 27 -2 237 110 55 6 394 7 0 -9 16 17 953.1 909.949 43.3 43.3 34 28 4 237 118 55 6 394 7 0 9 16 18 927.8 884.550 43.3 43.3 32 29 5 237 124 55 6 394 7 0 3 16 19 927.7 884.4
Total 4,325.82 6,248.81 1,988 446 330 336 2,610 9,402 9,033 2,789 261 10,087 323 209 645 679 482 5,649 45,266.8 39,018.0NPV = 1,041.38 EIRR = 15.42%
B-Cyear
Attachment A13-6 Flow of Economic Cost and Benefit
Unit: Rs. million