Embed Size (px)
Citation preview
The purpose of the meeting is:
To consider adoption of the 2014/15 Budget and the revised Council Plan 2013-2017 in accordance with the written Notice from the Mayor and
Section 84 of the Local Government Act 1989, as attached
To be read in conjunction with the Agenda of 24 June 2014 PRESENT: Councillor Scott Rossetti (Mayor) Councillor Malcolm Hole Councillor Patrick McIvor Councillor Bob Wenger Councillor Carolyn Crossley Councillor Darren McCubbin Councillor Peter Cleary Councillor Emilie Davine IN ATTENDANCE: David Morcom, Chief Executive Officer Liz Collins, General Manager Governance Glenys Butler, General Manager Liveability Chris Hastie, General Manager Built & Natural Environment John Websdale, General Manager Development Vanessa Ebsworth, Manager Organisation Development APOLOGIES: Councillor John Duncan
Special Council Meeting Minutes

SPECIAL MEETING OF COUNCIL – 24 JUNE 2014
AGENDA & TABLE OF CONTENTS
ITEM PAGE NUMBER
A PROCEDURAL
A1 STATEMENT OF ACKNOWLEDGEMENT AND PRAYER
A2 APOLOGIES
Councillor John Duncan
A3 DECLARATION OF CONFLICT/S OF INTEREST
Nil
B OFFICERS’ REPORT
B1 CHIEF EXECUTIVE OFFICER
ITEM B1.1 REVISED COUNCIL PLAN 2013-17
B2 GENERAL MANAGER GOVERNANCE
ITEM B2.1 2014/15 DRAFT BUDGET, RATES, FEES AND CHARGES
Minutes - Special Council Meeting of 24 June 2014 2
2 June 2014 To The Chief Executive Officer WELLINGTON SHIRE COUNCIL
CALL OF A SPECIAL MEETING OF COUNCIL ON TUESDAY 24 JUNE 2014
By this notice, l call a special meeting of the Wellington Shire Council to be held on Tuesday 24 June 2014 at 6pm at the Port of Sale Civic Centre. The business to be transacted is:
To consider adoption of the 2014/15 Budget and the revised Council Plan 2013-2017
ATTACHMENT
Minutes - Special Council Meeting of 24 June 2014 3
ITEM B1.1 REVISED COUNCIL PLAN 2013-17
DIVISION: CEO’s OFFICE
ACTION OFFICER: MANAGER BUSINESS IMPROVEMENT
DATE: 24 JUNE 2014
IMPACTS
Financial Communication Legislative Council Policy
Council Plan
Resources & Staff
Community Environmental Consultation Risk Management
OBJECTIVE For Council to adopt the revised Council Plan 2013-17 as attached. BACKGROUND In accordance with Section 125 of the Local Government Act 1989, every Council must prepare a Council Plan that includes:
The strategic objectives of Council
Strategies for achieving the objectives for at least the next 4 years
Strategic indicators for monitoring the achievement of the objectives
A Strategic Resource Plan
Any other matters as prescribed by regulation. Council released the draft revised Council Plan 2013-17 to the public seeking submissions. There were no submissions received in relation to the draft revised Council Plan 2013-17 and this was noted by Council at the meeting on 3 June 2014.
OPTIONS Following consideration of the attached revised Council Plan 2013-17, Council can resolve to either: 1. Adopt the revised Council Plan 2013-17; or 2. Amend the revised Council Plan 2013-17 prior to adoption. PROPOSAL That Council adopt the revised Council Plan 2013-17. CONFLICT OF INTEREST No staff and/or contractors involved in the compilation of this report have declared a Conflict of Interest.
Minutes - Special Council Meeting of 24 June 2014 4
FINANCIAL IMPACT The revised Council Plan 2013-17 incorporates a summary of budget provisions in its Strategic Resource Plan section. The strategies incorporated in the revised Council Plan 2013-17 will have varying degrees of financial impact over the short and longer term. Fullest understanding of the revised Council Plan 2013-17 will be gained by reading it in conjunction with Council’s 2014/15 financial year Budget. COMMUNICATION IMPACT The Council Plan communicates Council’s strategic direction to the community. The Council Plan can also be used by Council to communicate its vision and direction to other tiers of government, organisations, government agencies and funding bodies. LEGISLATIVE IMPACT Section 125 of the Local Government Act 1989 requires Council to at least once in each financial year review the adopted Council Plan and make any adjustments it considers necessary. Details of the changes to the Council Plan 2013-17 are required to be advised to the Minister within 30 days of making the adjustments. The Council will comply with the of the Local Government Act 1989 by adopting the revised Council Plan 2013-17. COUNCIL POLICY IMPACT The revised Council Plan 2013-17 has been prepared generally in the context of existing Council policies, but may lead to their revision or the development of new policies as a result of implementation of the initiatives contained in it. COUNCIL PLAN IMPACT The Council Plan Strategic Objective 1.0 Governance states: “To ensure governance and leadership through democratic processes, engaging with our
community, ensuring legislative compliance and conducting our affairs openly and with integrity, reflecting the highest level of good management and governance.”
The revised Council Plan 2013- 17 has been developed in accordance with this strategic objective. RESOURCES AND STAFF IMPACT The strategies contained within the revised Council Plan 2013-17 will generally be implemented within the existing resources of the Council. The Strategic Resource Plan component of this revised Council Plan 2013-17 outlines the financial and staff resources provided for its implementation.
Minutes - Special Council Meeting of 24 June 2014 5
COMMUNITY IMPACT The attached revised Council Plan 2013-17 has been prepared in light of the Wellington 2030 Vision. It is intended to set out for the community the objectives, initiatives and strategies that the Council considers are needed to implement its Vision on behalf of the community over the next four years. CONSULTATION IMPACT In accordance with S125(9) of the Local Government Act 1989 Council placed the revised Council Plan 2013-17 in the public domain for comment. Advertisements were placed in local newspapers to seek community submissions on the draft revised Council Plan 2013-17 and copies of the Plan were available for inspection at all Council Customer Service Centres and Libraries. No written submissions were received in regard to the revised Council Plan 2013-17. PUBLIC QUESTIONS AND COMMENTS FROM THE GALLERY ______________________________________________________________________________
RECOMMENDATION That Council adopt the revised Council Plan 2013-17 as attached. COUNCILLOR CROSSLEY/COUNCILLOR McIVOR That Council adopt the revised Council Plan 2013-17 as attached.
CARRIED
Minutes - Special Council Meeting of 24 June 2014 6
PlanC
ounc
il2013-17
Minutes - Special Council Meeting of 24 June 2014 7
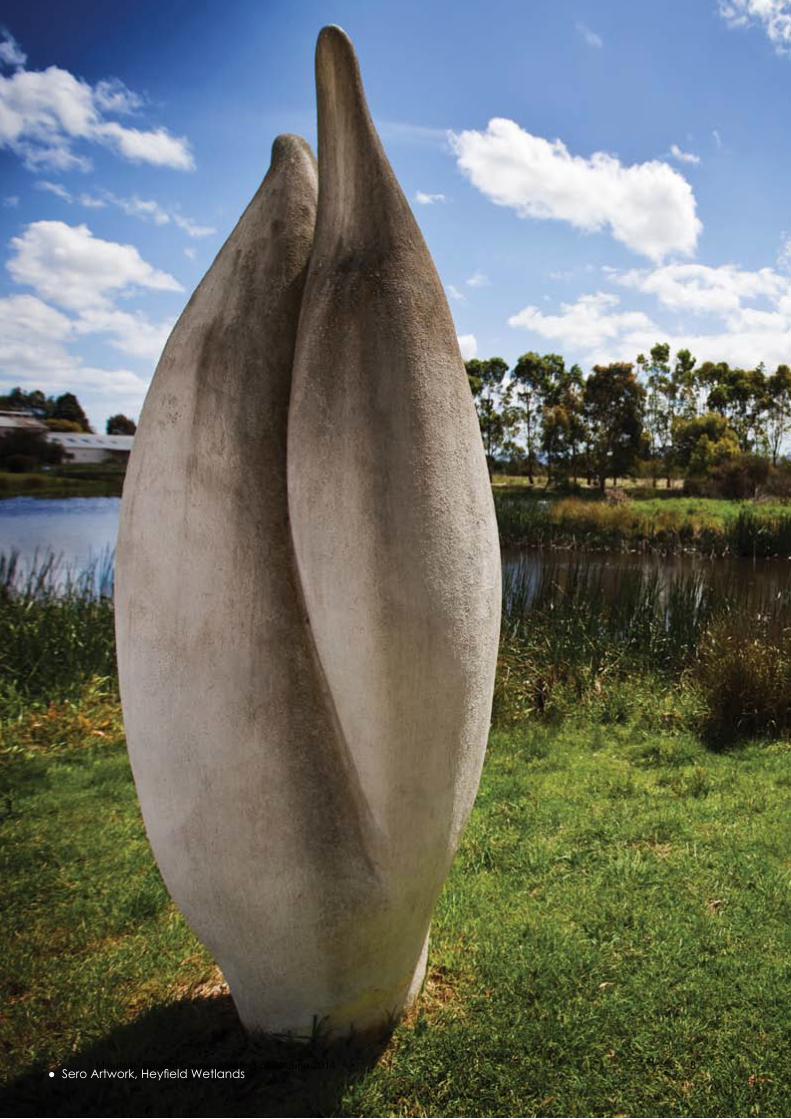
● Sero Artwork, Heyfield WetlandsMinutes - Special Council Meeting of 24 June 2014 8

People want to live in Wellington Shire because of its liveability, environment
and vibrant economy
Our Vision
Message from the Mayor 4 About Wellington Shire 5Delivering our Plan 6Our Integrated Planning Framework 7Theme 1 Leadership and Engagement 8Theme 2 Organisational 10Theme 3 Natural Environment 12Theme 4 Infrastructure 14Theme 5 Land Use Planning 16Theme 6 Economy 18Theme 7 Community Wellbeing 20Resourcing our Plan 22Human Resources 23Staff Profile 24Financial Resources 25Comprehensive Income Statement 26Balance Sheet 27Statement of Changes in Equity 28Statement of Cash Flows 30Statement of Capital Works 31Statement of Human Resources 32Other Information 33
Contents
Minutes - Special Council Meeting of 24 June 2014 9

I am pleased to commend to you the Wellington Shire Council 2013-17 Council Plan.
This document identifies key themes and strategies which Council will pursue in conjunction with the community over the next 4 years.
Wellington Shire Council is proud of its commitment to community engagement, which guides the way in which we deliver over 100 services to, advocate on behalf of, and provide leadership for, our community.
Our shared long term community vision, Wellington 2030, underpins everything Council does. That vision, prepared with the community, provides the foundations for this, our Council Plan, which identifies how Council will work in partnership with our community over the next 4 years as we work towards our vision for the future.
Message from the Mayor
Cr. Peter Cleary
Cr. Emilie Davine
Cr. Malcolm Hole
Cr. Patrick McIvor
Cr. Carolyn Crossley
Cr. John Duncan
Cr. Darren McCubbin
Cr. Bob Wenger
Cr. Scott RossettiMayor
Deputy Mayor
4 | Council Plan 2013-17
Minutes - Special Council Meeting of 24 June 2014 10

About Wellington Shire
Wellington Shire lies at the heart of Gippsland and is Victoria’s third largest municipality with a total area of approximately 11,000 square kilometres.
Wellington reaches from the rugged beauty of the high country to one of the longest beaches in the world; we have a bounty of unique wilderness, historical attractions and a wide range of recreational and leisure activities available.
More than 40,000 residents live in Wellington Shire, spread across more than thirty diverse and distinct communities, including the larger towns of Sale, Maffra, Heyfield, Rosedale, Stratford and Yarram.
Our economy is diverse, including agriculture and primary industries, oil and gas, forestry, manufacturing, government, defence, education, construction, retail, tourism and professional services.
Yarram
Gormandale
Rosedale
Heyfield
Dargo
Licola
Maffra
Stratford
SALE
Briagolong
Seaspray
Loch Sport
Port Albert
Victoria
Minutes - Special Council Meeting of 24 June 2014 11
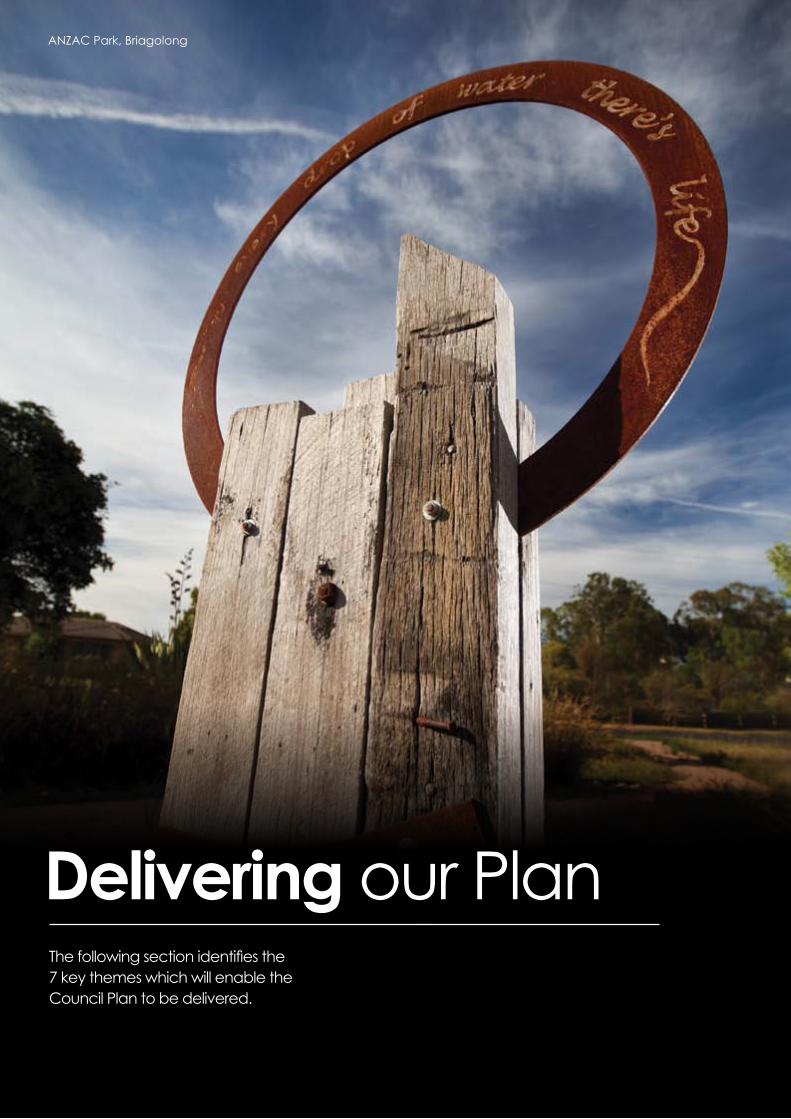
Delivering our PlanThe following section identifies the 7 key themes which will enable the Council Plan to be delivered.
ANZAC Park, Briagolong
Minutes - Special Council Meeting of 24 June 2014 12
ANNUAL SERVICE PLANS
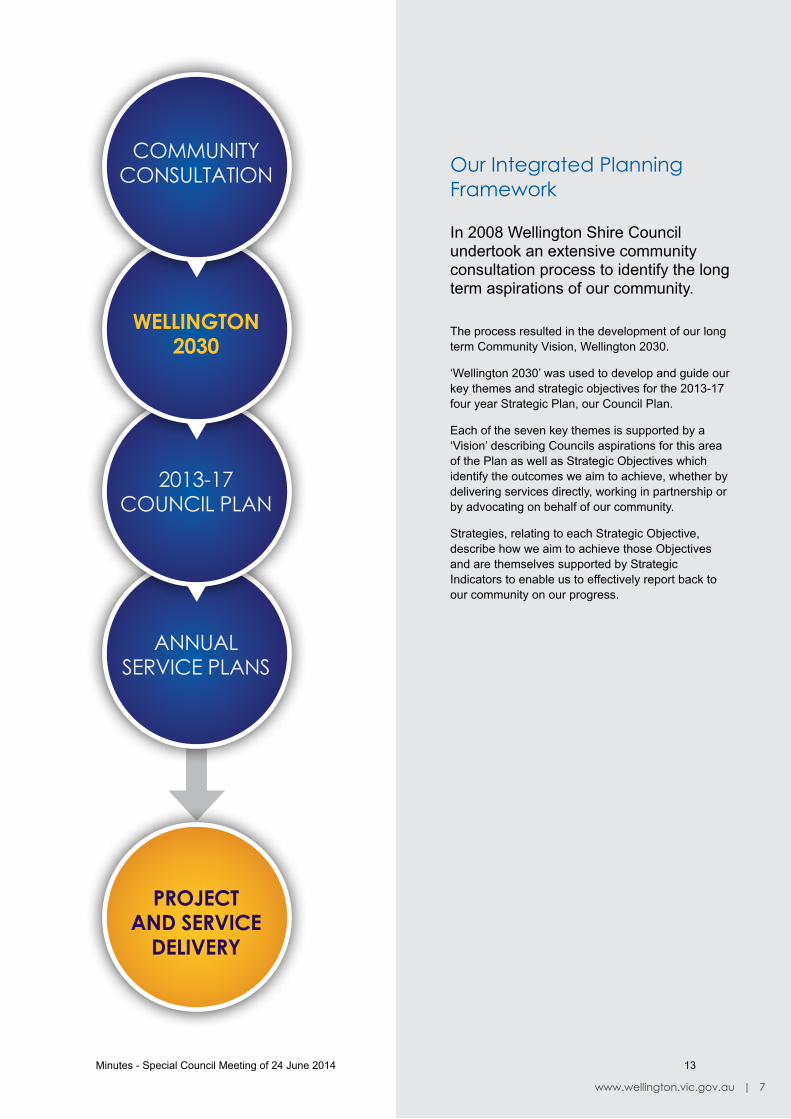
In 2008 Wellington Shire Council undertook an extensive community consultation process to identify the long term aspirations of our community.
The process resulted in the development of our long term Community Vision, Wellington 2030.
‘Wellington 2030’ was used to develop and guide our key themes and strategic objectives for the 2013-17 four year Strategic Plan, our Council Plan.
Each of the seven key themes is supported by a ‘Vision’ describing Councils aspirations for this area of the Plan as well as Strategic Objectives which identify the outcomes we aim to achieve, whether by delivering services directly, working in partnership or by advocating on behalf of our community.
Strategies, relating to each Strategic Objective, describe how we aim to achieve those Objectives and are themselves supported by Strategic Indicators to enable us to effectively report back to our community on our progress.
Our Integrated Planning Framework
2013-17 COUNCIL PLAN
WellIngTon 2030
PRojeCT anD SeRvICe
DelIveRy
COMMUNITy CONSULTATION
www.wellington.vic.gov.au | 7
Minutes - Special Council Meeting of 24 June 2014 13
Strategies
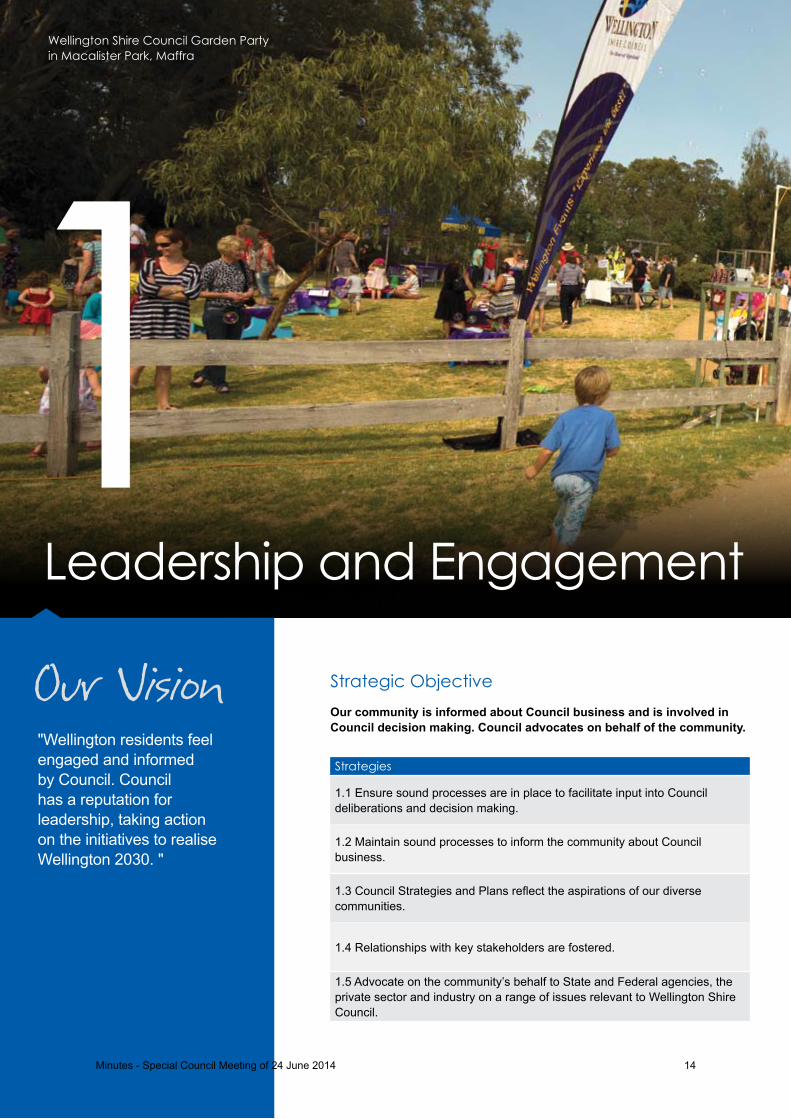
1.1 Ensure sound processes are in place to facilitate input into Council deliberations and decision making.
1.2 Maintain sound processes to inform the community about Council business.
1.3 Council Strategies and Plans reflect the aspirations of our diverse communities.
1.4 Relationships with key stakeholders are fostered.
1.5 Advocate on the community’s behalf to State and Federal agencies, the private sector and industry on a range of issues relevant to Wellington Shire Council.
Leadership and Engagement
1Strategic Objective Our community is informed about Council business and is involved in Council decision making. Council advocates on behalf of the community.
Our Vision
Wellington Shire Council Garden Party in Macalister Park, Maffra
"Wellington residents feel engaged and informed by Council. Council has a reputation for leadership, taking action on the initiatives to realise Wellington 2030. "
Minutes - Special Council Meeting of 24 June 2014 14
Leadership and Engagement
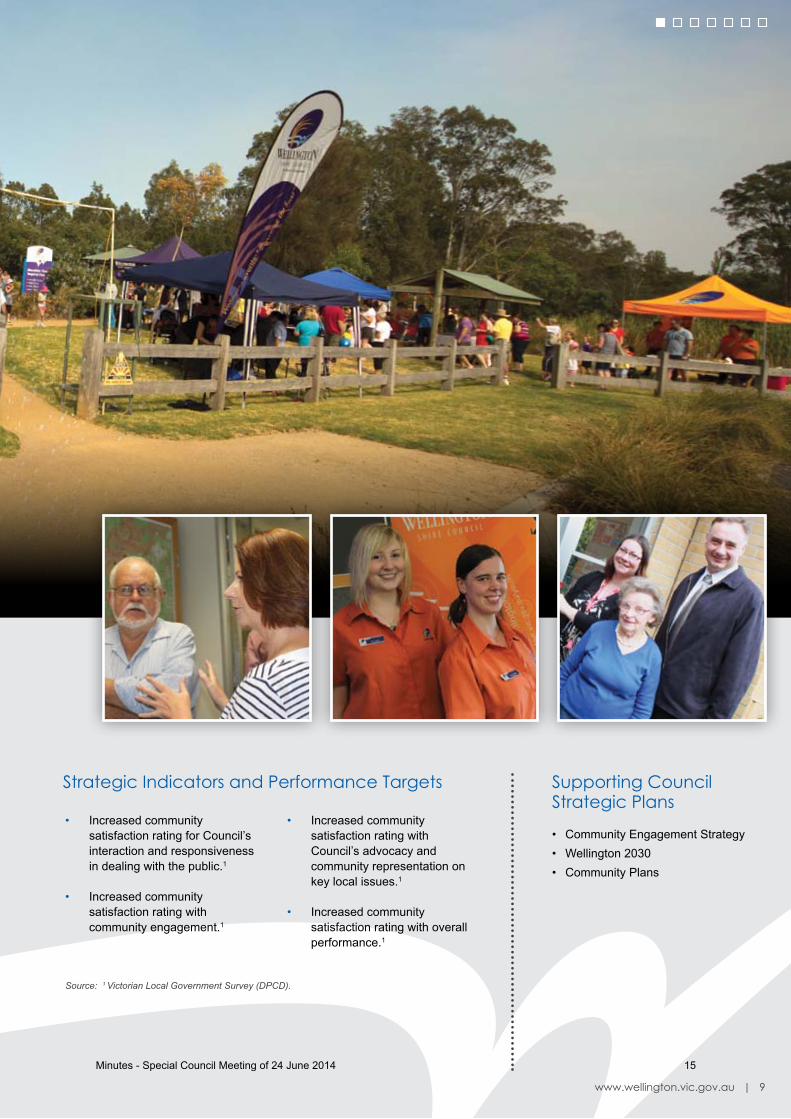
• Increased community satisfaction rating for Council’s interaction and responsiveness in dealing with the public.1
• Increased community satisfaction rating with community engagement.1
• Increased community satisfaction rating with Council’s advocacy and community representation on key local issues.1
• Increased community satisfaction rating with overall performance.1
Strategic Indicators and Performance Targets Supporting Council Strategic Plans
Source: 1 Victorian Local Government Survey (DPCD).
• Community Engagement Strategy• Wellington 2030• Community Plans
www.wellington.vic.gov.au | 9
Minutes - Special Council Meeting of 24 June 2014 15
Strategies
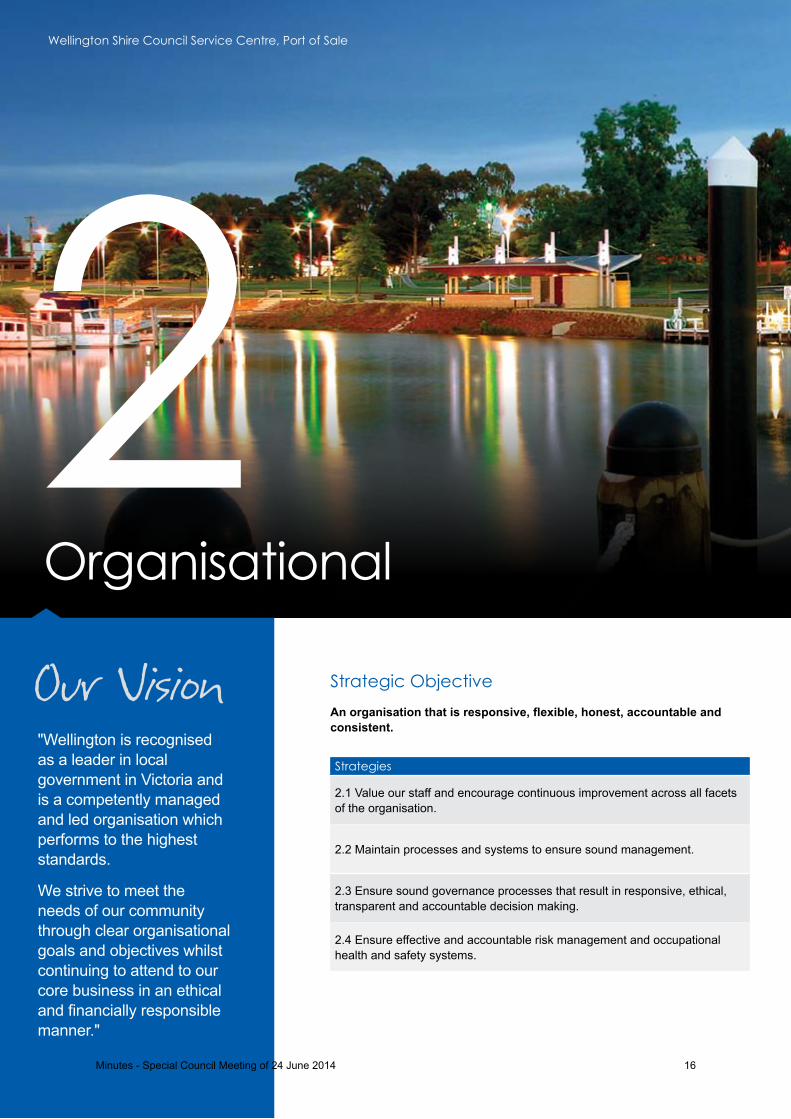
2.1 Value our staff and encourage continuous improvement across all facets of the organisation.
2.2 Maintain processes and systems to ensure sound management.
2.3 Ensure sound governance processes that result in responsive, ethical, transparent and accountable decision making.
2.4 Ensure effective and accountable risk management and occupational health and safety systems.
Organisational
2Strategic Objective An organisation that is responsive, flexible, honest, accountable and consistent.
Our Vision
Wellington Shire Council Service Centre, Port of Sale
"Wellington is recognised as a leader in local government in Victoria and is a competently managed and led organisation which performs to the highest standards.
We strive to meet the needs of our community through clear organisational goals and objectives whilst continuing to attend to our core business in an ethical and financially responsible manner."
Minutes - Special Council Meeting of 24 June 2014 16
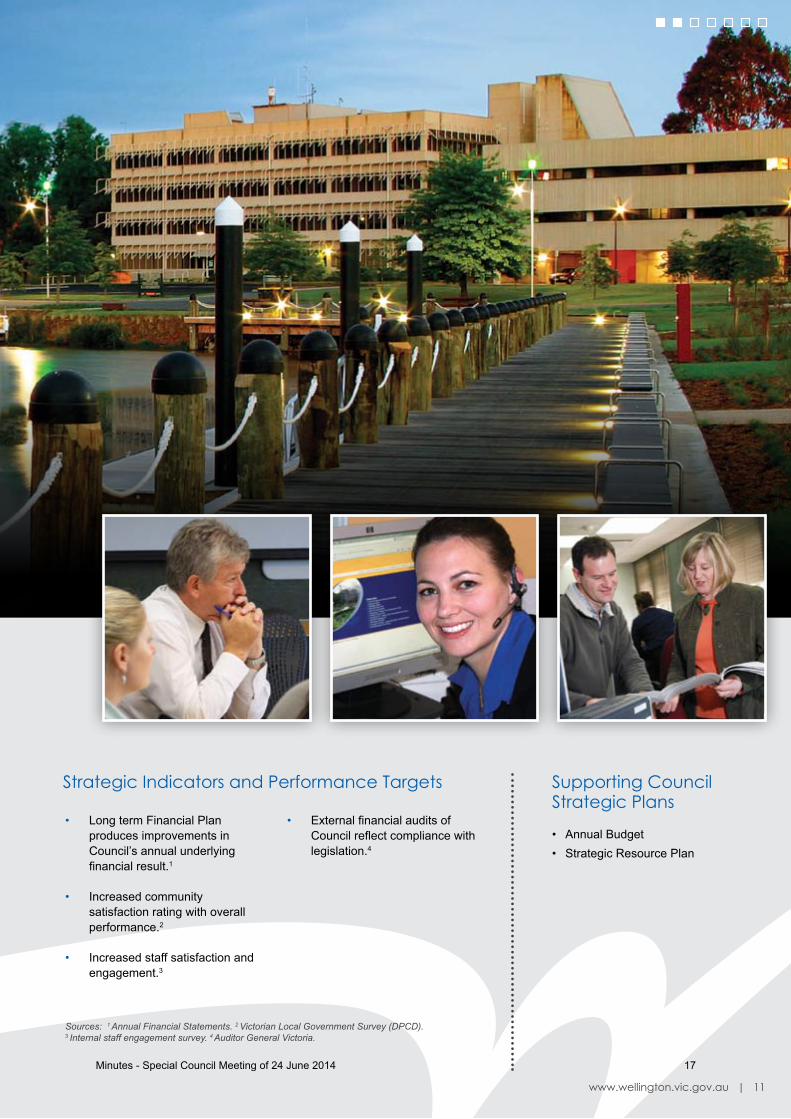
Organisational
• Long term Financial Plan produces improvements in Council’s annual underlying financial result.1
• Increased community satisfaction rating with overall performance.2
• Increased staff satisfaction and engagement.3
• External financial audits of Council reflect compliance with legislation.4
Strategic Indicators and Performance Targets Supporting Council Strategic Plans
Sources: 1 Annual Financial Statements. 2 Victorian Local Government Survey (DPCD). 3 Internal staff engagement survey. 4 Auditor General Victoria.
• Annual Budget• Strategic Resource Plan
www.wellington.vic.gov.au | 11
Minutes - Special Council Meeting of 24 June 2014 17

Strategies3.1 Strive for a sustainable balance between the use of Wellington Shire’s natural resources, biodiversity and the need to protect them for future generations.
3.2 Demonstrate leadership in efficient energy use, waste and water management.
3.3 Support a coordinated and diverse approach to developing a sustainable environment through partnerships.
3.4 Ensure Wellington Shire’s natural environment is responsibly managed.
3.5 Increase community resilience and ability to contribute to sustainable living through engagement and education.
Natural Environment
3Strategic Objective A community focused on sustainable living and the future protection of Wellington’s Natural Environment.
Our Vision
Ninety Mile Beach
"Wellington has clean air and healthy rivers, streams and lakes. The native flora and fauna are plentiful and diverse.
Our public land is protected and well managed. Water supplies are secure and abundant."
Minutes - Special Council Meeting of 24 June 2014 18
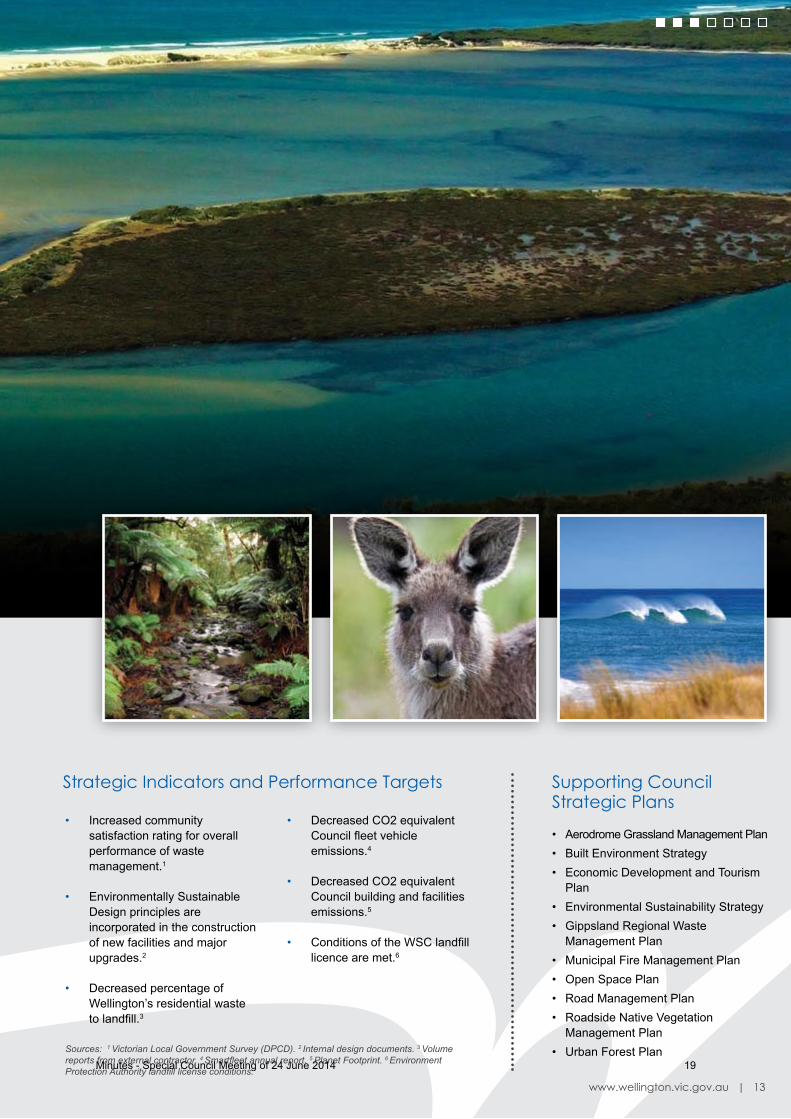
Natural Environment
• Increased community satisfaction rating for overall performance of waste management.1
• Environmentally Sustainable Design principles are incorporated in the construction of new facilities and major upgrades.2
• Decreased percentage of Wellington’s residential waste to landfill.3
• Decreased CO2 equivalent Council fleet vehicle emissions.4
• Decreased CO2 equivalent Council building and facilities emissions.5
• Conditions of the WSC landfill licence are met.6
Strategic Indicators and Performance Targets Supporting Council Strategic Plans
Sources: 1 Victorian Local Government Survey (DPCD). 2 Internal design documents. 3 Volume reports from external contractor. 4 Smartfleet annual report. 5 Planet Footprint. 6 Environment Protection Authority landfill license conditions.
• Aerodrome Grassland Management Plan • Built Environment Strategy • Economic Development and Tourism
Plan • Environmental Sustainability Strategy • Gippsland Regional Waste
Management Plan• Municipal Fire Management Plan• Open Space Plan• Road Management Plan• Roadside Native Vegetation
Management Plan• Urban Forest Plan
www.wellington.vic.gov.au | 13
Minutes - Special Council Meeting of 24 June 2014 19
Strategies
4.1 Undertake service delivery planning to provide community assets in response to identified needs.
4.2 Ensure assets are managed, maintained and renewed to meet service needs.
4.3 Manage Council community facilities planning to ensure that outputs are based on identified community needs.
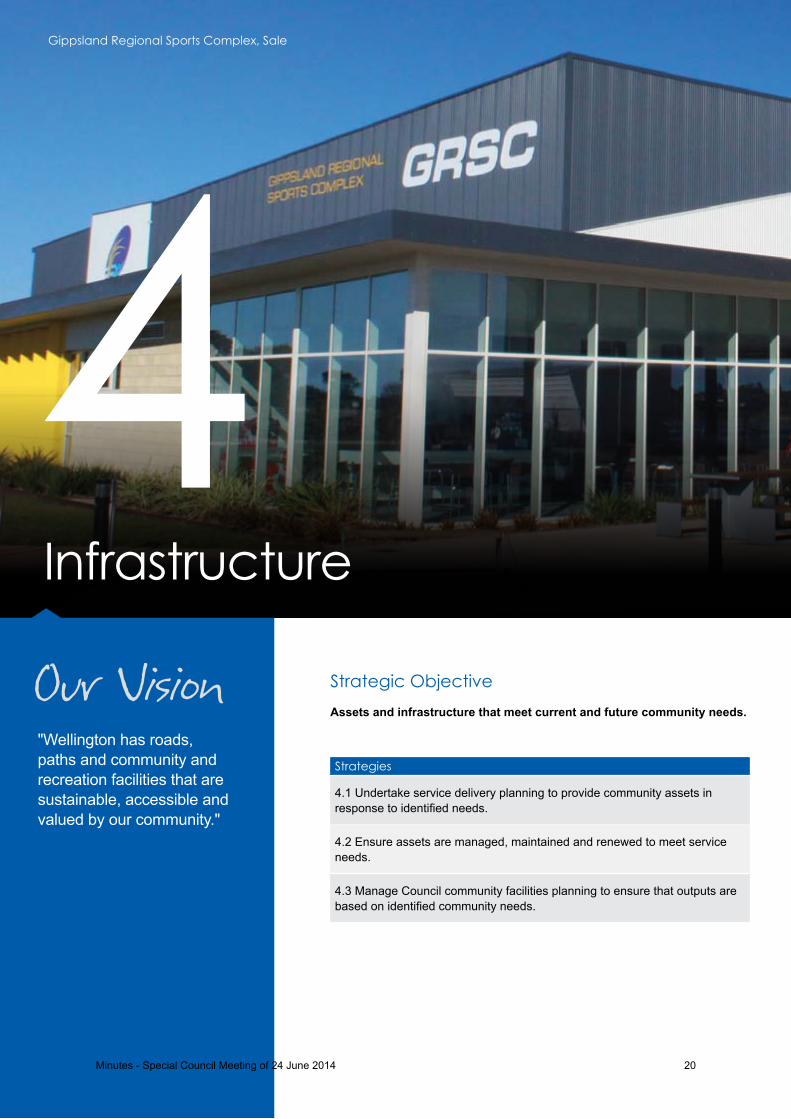
Infrastructure
4Strategic Objective Assets and infrastructure that meet current and future community needs.
Our Vision
Gippsland Regional Sports Complex, Sale
"Wellington has roads, paths and community and recreation facilities that are sustainable, accessible and valued by our community."
Minutes - Special Council Meeting of 24 June 2014 20
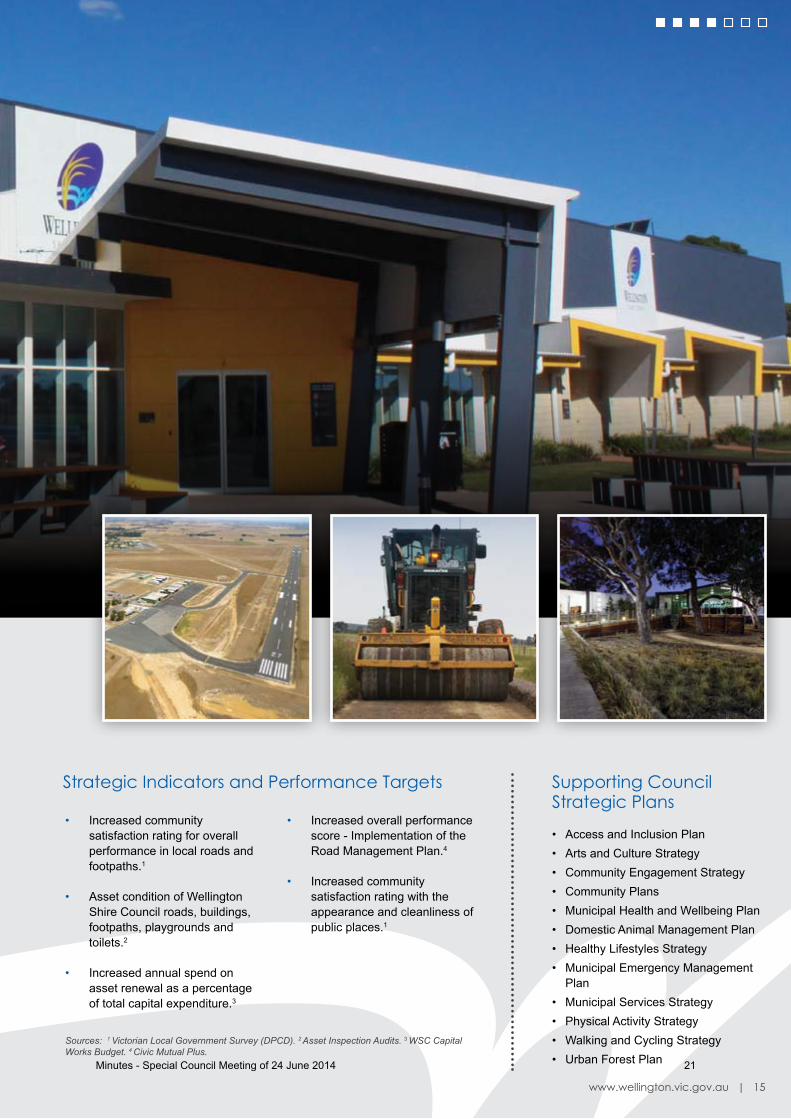
Infrastructure
• Increased community satisfaction rating for overall performance in local roads and footpaths.1
• Asset condition of Wellington Shire Council roads, buildings, footpaths, playgrounds and toilets.2
• Increased annual spend on asset renewal as a percentage of total capital expenditure.3
• Increased overall performance score - Implementation of the Road Management Plan.4
• Increased community satisfaction rating with the appearance and cleanliness of public places.1
Strategic Indicators and Performance Targets Supporting Council Strategic Plans
Sources: 1 Victorian Local Government Survey (DPCD). 2 Asset Inspection Audits. 3 WSC Capital Works Budget. 4 Civic Mutual Plus.
• Access and Inclusion Plan • Arts and Culture Strategy • Community Engagement Strategy • Community Plans • Municipal Health and Wellbeing Plan • Domestic Animal Management Plan • Healthy Lifestyles Strategy • Municipal Emergency Management
Plan• Municipal Services Strategy• Physical Activity Strategy • Walking and Cycling Strategy• Urban Forest Plan
www.wellington.vic.gov.au | 15
Minutes - Special Council Meeting of 24 June 2014 21
Strategies
5.1 Ensure Land Use Policies and Plans utilise an integrated approach to guide appropriate land use and development.
5.2 Provide user friendly, accessible planning information and efficient planning processes.
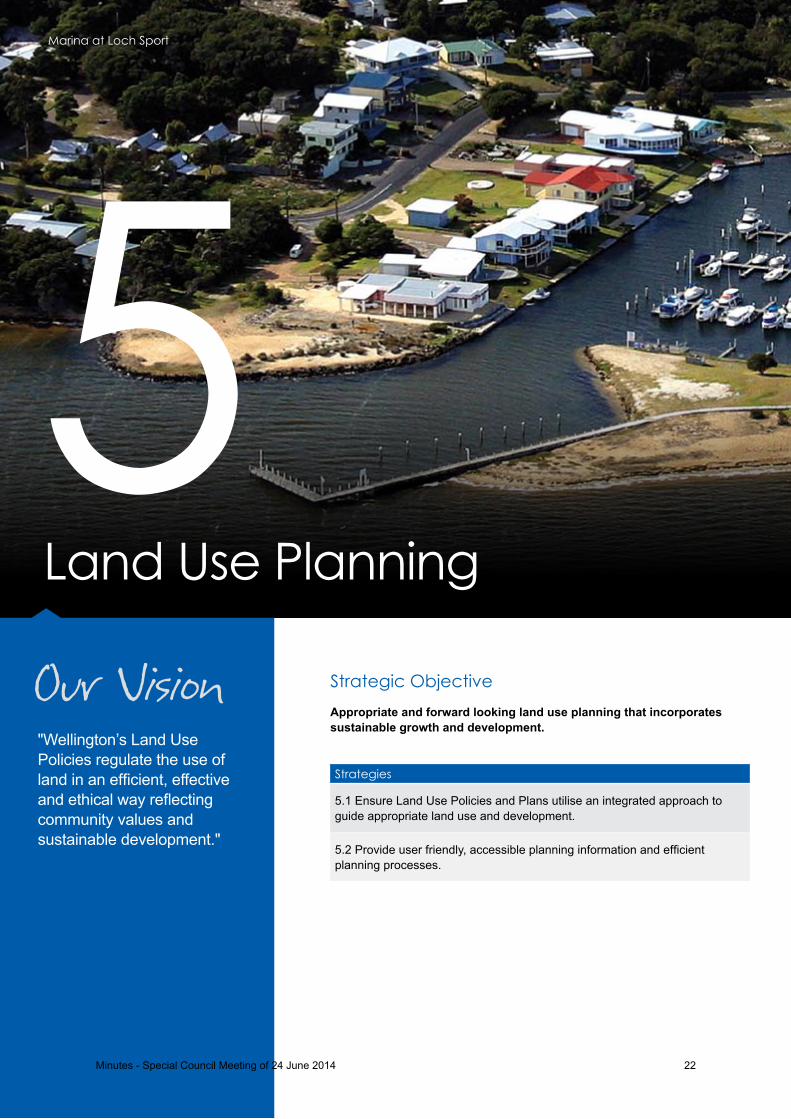
Land Use Planning
5Strategic Objective Appropriate and forward looking land use planning that incorporates sustainable growth and development.
Our Vision
Marina at Loch Sport
"Wellington’s Land Use Policies regulate the use of land in an efficient, effective and ethical way reflecting community values and sustainable development."
Minutes - Special Council Meeting of 24 June 2014 22
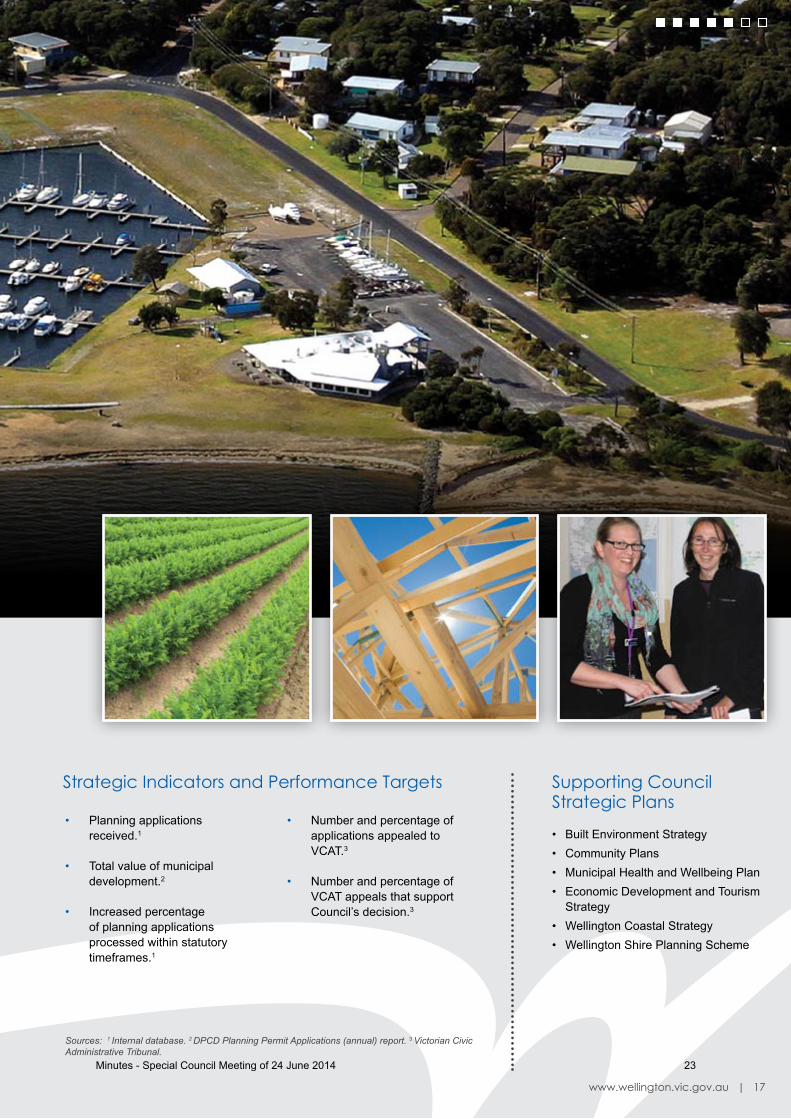
Land Use Planning
• Planning applications received.1
• Total value of municipal development.2
• Increased percentage of planning applications processed within statutory timeframes.1
• Number and percentage of applications appealed to VCAT.3
• Number and percentage of VCAT appeals that support Council’s decision.3
Strategic Indicators and Performance Targets Supporting Council Strategic Plans
Sources: 1 Internal database. 2 DPCD Planning Permit Applications (annual) report. 3 Victorian Civic Administrative Tribunal.
• Built Environment Strategy• Community Plans• Municipal Health and Wellbeing Plan• Economic Development and Tourism
Strategy• Wellington Coastal Strategy• Wellington Shire Planning Scheme
www.wellington.vic.gov.au | 17
Minutes - Special Council Meeting of 24 June 2014 23

Strategies
6.1 Support business growth to align with the competitive strengths of the region.
6.2 Encourage infrastructure planning and delivery to support economic growth.
6.3 Attract new investment, lifestyle growth and visitors by developing and supporting Wellington Shire’s regional identity.
Economy
6Strategic Objective Supported business growth and employment, lifestyle opportunities and a vibrant tourism sector.
Our Vision
Friesian cattle grazing
"Wellington has a diverse and vibrant economy. Existing industries are supported and strengthened and we actively support new business opportunities. Our economy generates wealth which remains in the region to provide employment for our people."
Minutes - Special Council Meeting of 24 June 2014 24
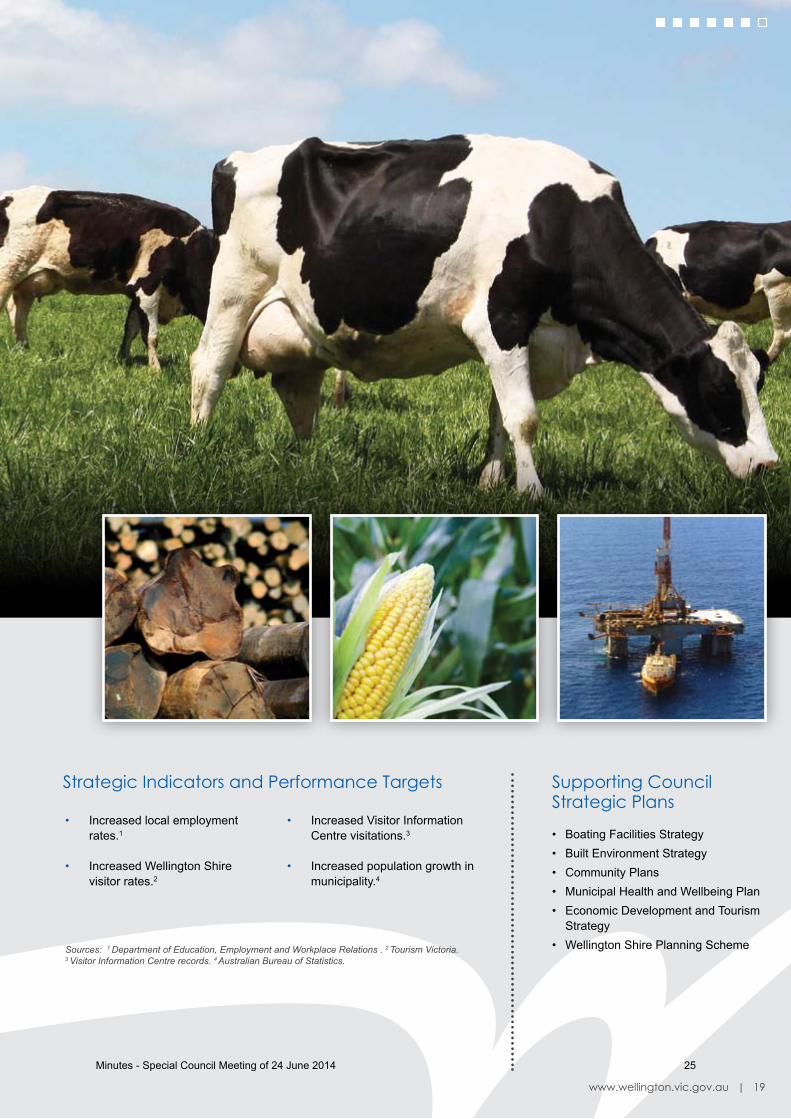
• Increased local employment rates.1
• Increased Wellington Shire visitor rates.2
• Increased Visitor Information Centre visitations.3
• Increased population growth in municipality.4
Strategic Indicators and Performance Targets Supporting Council Strategic Plans
Sources: 1 Department of Education, Employment and Workplace Relations . 2 Tourism Victoria. 3 Visitor Information Centre records. 4 Australian Bureau of Statistics.
• Boating Facilities Strategy• Built Environment Strategy• Community Plans• Municipal Health and Wellbeing Plan• Economic Development and Tourism
Strategy• Wellington Shire Planning Scheme
www.wellington.vic.gov.au | 19
Minutes - Special Council Meeting of 24 June 2014 25
Strategies
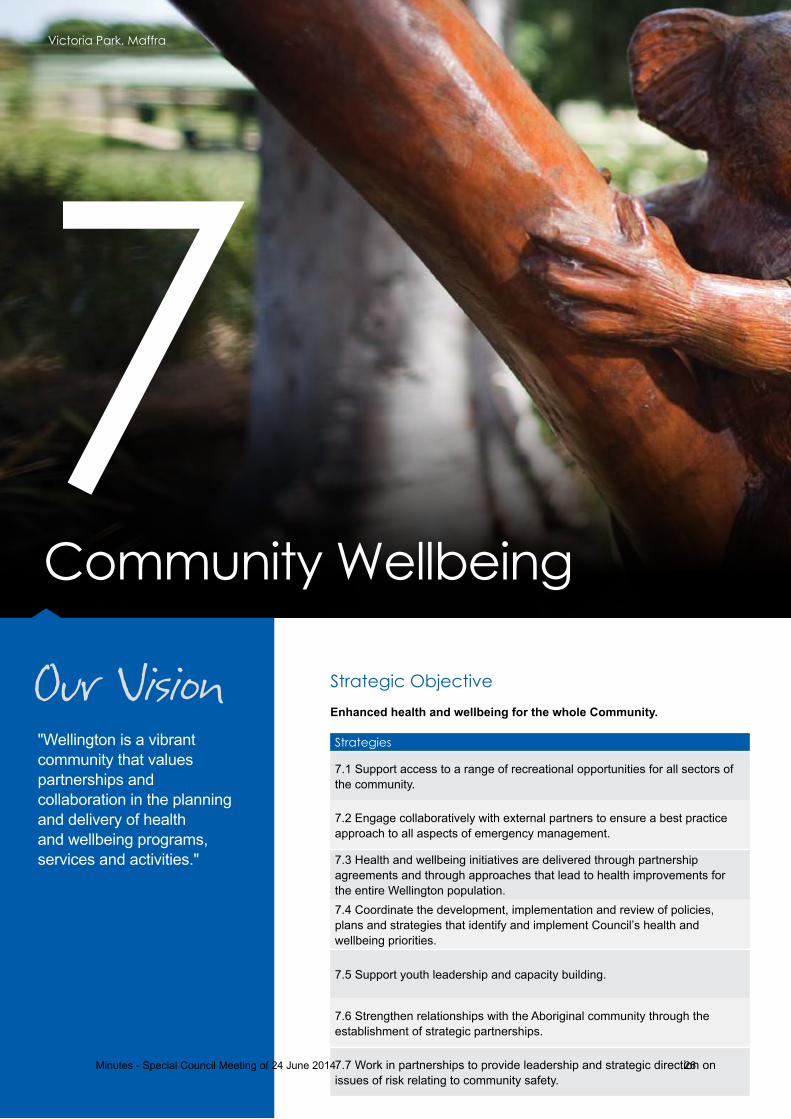
7.1 Support access to a range of recreational opportunities for all sectors of the community.
7.2 Engage collaboratively with external partners to ensure a best practice approach to all aspects of emergency management.
7.3 Health and wellbeing initiatives are delivered through partnership agreements and through approaches that lead to health improvements for the entire Wellington population.7.4 Coordinate the development, implementation and review of policies, plans and strategies that identify and implement Council’s health and wellbeing priorities.
7.5 Support youth leadership and capacity building.
7.6 Strengthen relationships with the Aboriginal community through the establishment of strategic partnerships.
7.7 Work in partnerships to provide leadership and strategic direction on issues of risk relating to community safety.
Community Wellbeing
7Strategic Objective Enhanced health and wellbeing for the whole Community.
Our Vision
Victoria Park, Maffra
"Wellington is a vibrant community that values partnerships and collaboration in the planning and delivery of health and wellbeing programs, services and activities."
Minutes - Special Council Meeting of 24 June 2014 26

Community Wellbeing
• Increased opportunity for people to access footpaths and bikeways, tracks and trails.1
• Increased community satisfaction rating for overall performance of recreational facilities.2
• Enhanced overall Municipal Emergency Management Planning performance.3
• Support provided to volunteers/community groups via grants and development opportunities.4
• Rates of access and participation in a range of arts and cultural activities.5
• Local creative endeavours are supported through grant allocations and other initiatives.6
Strategic Indicators and Performance Targets Supporting Council Strategic Plans
Sources: 1 Number of kilometres of increased footpaths and bikeways, tracks and trails. 2 Victorian Local Government Survey (DPCD). 3 Municipal Emergency Management Planning annual committee survey. 4 Internal Grants and Community Development database. 5 Community Indicators Victoria. 6 Internal Grants and Community Development database.
• Access and Inclusion Plan• Arts and Culture Strategy• Community Engagement Strategy• Community Plans• Municipal Health and Wellbeing Plan• Domestic Animal Management Plan• Healthy Lifestyles Strategy• Municipal Emergency Management
Plan• Municipal Services Strategy• Physical Activity Strategy• Walking and Cycling Strategy
www.wellington.vic.gov.au | 21
Minutes - Special Council Meeting of 24 June 2014 27

Resourcing our PlanThe following section contains the financial resources required to turn the Council Plan into reality.
Minutes - Special Council Meeting of 24 June 2014 28
Council recognises the crucial contribution of our workforce to Wellington Shire Council’s diverse operations and is committed to recruiting, developing and retaining staff with a wide range of skills and qualifications.
There are a number of staff resource challenges that the Council face now and into the future. Issues such as an ageing workforce, highlight the importance of succession planning to ensure that Council is equipped to manage loss of quality skills, knowledge and experience through staff retirements and exits. Other challenges to Council are the attraction and recruitment of specialists such as Engineers, Town Planners and Environmental Health Officers. National research affirms that the supply of these professionals is continually unable to match the demand in both private and public sectors. Council will continue to manage these types of challenges through effective workforce planning.Overall, Council continues to attract quality applicants for advertised positions across Business units.Council staff numbers are expected to remain static, with only minor changes as a result of externally funded positions for specific projects, coming to an end over the four year period. The Council Plan 2013-17 reflects the focus on sustainability for Council services through creating a translation for staff from their work plans to the Council strategic objectives.Council’s workforce plan predicts minimal change in staff levels in the 2014-15 budget. Furthermore, as part of Council’s responsibility to ensure the long term financial sustainability of the shire, proposed or vacant positions are subject to a thorough justification process at the executive level prior to any recruitment actions. Council’s objective is one of consolidation and strategic alignment rather than staff growth with the exception of the possibility that State or Federal Government may fund particular positions according to the need of Government policy direction. Maintaining service delivery and continued succession planning will continue to remain key considerations.Some of the actions to address our short and longer term workforce challenges include:
• Participation in strategic alliances with other businesses, education institutions and other government organisations to explore innovative measures that promote Local Government careers and attract future employees
• Implementing and continuing to offer flexible work options for staff
• Continued development of a succession planning program
• Becoming an employer of choice through support programs such as learning and development
Budgeted staff numbers are shown on page 37.
Human Resources
www.wellington.vic.gov.au | 23
Minutes - Special Council Meeting of 24 June 2014 29

228
Permanent
37
Permanent Part-Time
Wellington Shire Council
Staff Profile
Staff Numbers during the 2014/15 Budget PeriodEquivalent Full Time Staff (EFT)
Equivalent Full Time Employees
2014/15 2015/16 2016/17 2017/18
282 281 280 280
282
Equivalent Full Time
17Casual
24 | Council Plan 2013-17
Minutes - Special Council Meeting of 24 June 2014 30
Financial Plan 2014-2018This plan provides a forecast of the Council’s financial performance over the next four years to 30 June 2018, based on a number of assumptions - the key ones being set out below. Readers may find it useful to read this plan in conjunction with Council’s annual budget for 2014/15.
Key Assumptions:CPI is assumed to be at 3% for each of the next four years.
External Grants Funding over the next four years will range from 20% to 25% of total revenue. This funding will be used to fund both capital and operating expenditure and can be non-recurrent (i.e. the grant is not expected to be received again during the 2014/15-2017/18 period) or recurrent (i.e. the funding will continue over the four year period). Non-recurrent capital grants are one off confirmed funding for capital projects, whereas recurrent capital grants are related to Roads to Recovery funding which will continue to be provided. Recurrent operating grants are forecast to increase by between 1.0% and 3.0%.
The 2014/15 Federal Budget handed down in May 2014 indicated that the Australian Government intends to "pause" indexation for the next 3 years on the national pool of Financial Assistance Grants provided to local governments via the Victoria Grants Commission. Council's indicative allocation for 2014/15 is $12.12 million, a minor decrease from 2013/14 allocations. No increase has been included for the years 2014/15 to 2016/17.
Fees and Charges will contribute approximately 8.6% of the Council’s total revenue in 2014/15 and will increase in line with CPI over the next 4 years, where pricing is controlled by the Council rather than set by legislation.
Employee Costs are projected to rise by between 5.6% and 6% in accordance with the current Enterprise Bargaining Agreement and allowing for annual movement between banding levels. Staff numbers will generally remain static over the four year period, with minor reductions occurring due to the finalisation of funding for 2.4 EFT positions.
The number and type of services provided by the Council is expected to remain static over the next four years.
Contract Payments, Materials and Services costs are driven by a number of external factors including prevailing economic conditions (such as fuel prices), industry specific issues and CPI. Excluding the impact associated with the completion in 2014/15 of a number of major operating projects, such as the Wellington Coast Subdivision Strategy voluntary assistance program and the Energy Efficient Street Lighting program, these costs are forecast to increase by between 3% and 5.0% per annum.
The requirement for biennial property revaluations, cyclical asset revaluations and condition reporting of the Council’s assets will result in additional net costs during the period 2014-2018, which have been factored into the plan.
Rating StrategiesRates and charges currently account for approximately 63.4% of the Council’s total revenue, and help to fund the services that we provide to our ratepayers and residents. This Council has limited opportunity to increase revenue from other internal sources such as fees and charges, and this factor, coupled with the need to maintain a reasonable level of expenditure on renewing and maintaining an ageing infrastructure, will exert pressure on the level of rates required to achieve a robust capital program over the next four years and beyond.
Income from all rates and charges will increase by 3.6% in 2014/15, while increased income from general rates alone will rise by 3.8%. The Waste Infrastructure charge will remain at $32, while the Garbage charge will increase to $171. The EPA Levy Charge will also remain at $14.92 for each property that receives a garbage service. An increase of 4% in general rates income has been projected in subsequent years, while charges will reflect an increase aligned to CPI. In line with statutory requirements, Council has revalued all rateable properties as at 1 January 2014, with these values to be used from 1 July 2014.
It should be noted, however, that as Council responds to the pressures of an ageing population on local economy and the delivery of appropriate infrastructure, there may be an impact on future rating estimates.
Borrowing StrategiesThe Council’s Long Term Financial Plan has been reviewed and this has resulted in an update of our strategy for future borrowing. All borrowings identified in this strategic resource plan are consistent with this strategy.
New borrowings have been forecast for all years from 2014/15 to 2017/18, to fund major capital works such as the development of the Sale Livestock Exchange, Gippsland Regional Sports Complex Stage 2, future street and drainage schemes and other major capital initiatives. At the end of the four year financial period, total debt is forecast to be $14.03 million - well within State Government prudential ratios.
Capital Works StrategiesCouncil has reviewed its ten year Capital Works program and will continue to refine this to ensure alignment with Asset Management Plan objectives and strategies. All projects are evaluated on a case by case basis, taking into account public safety, community need, legislative requirements and availability of funding, both internal and external. Essential to Council achieving its Asset Management Plan objectives over the next four years is the continuation of the Roads to Recovery funding initiative of $8.8 million, along with $1.0 million remaining from the Country Roads & Bridges funding initiative of $4.0 million.
Financial Resources
www.wellington.vic.gov.au | 25
Minutes - Special Council Meeting of 24 June 2014 31
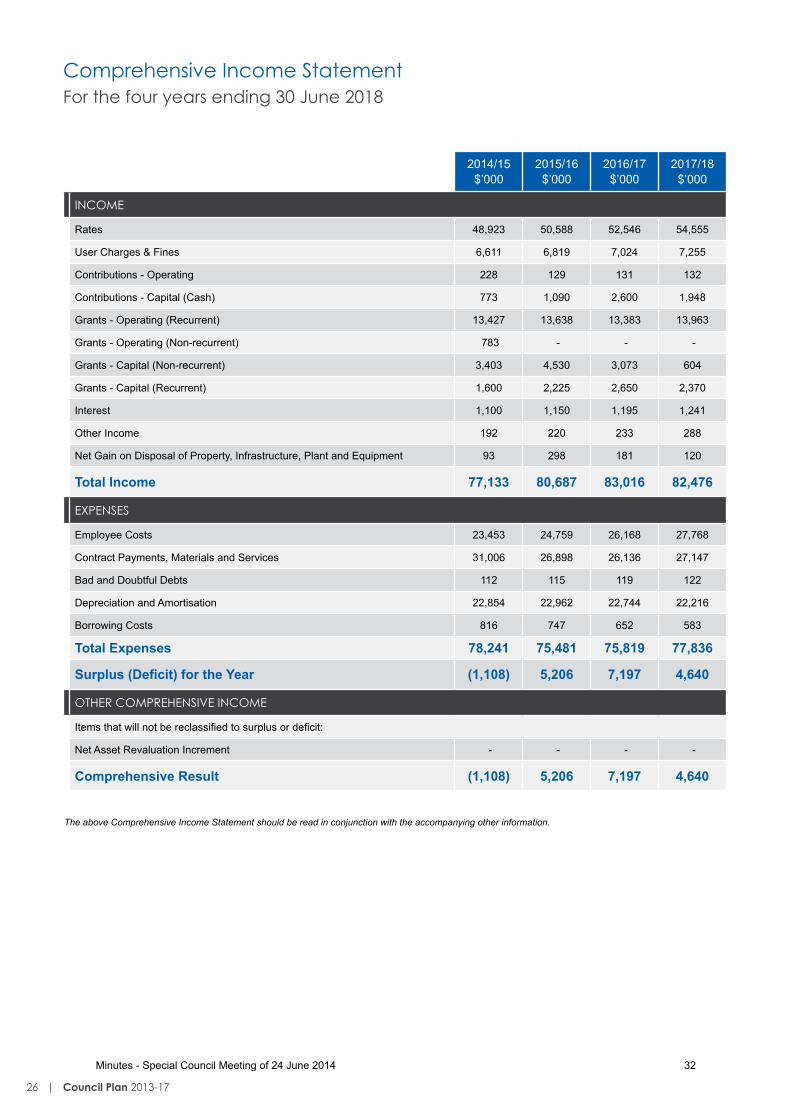
Comprehensive Income StatementFor the four years ending 30 June 2018
2014/15 $’000
2015/16 $’000
2016/17 $’000
2017/18 $’000
INCOME
Rates 48,923 50,588 52,546 54,555
User Charges & Fines 6,611 6,819 7,024 7,255
Contributions - Operating 228 129 131 132
Contributions - Capital (Cash) 773 1,090 2,600 1,948
Grants - Operating (Recurrent) 13,427 13,638 13,383 13,963
Grants - Operating (Non-recurrent) 783 - - -
Grants - Capital (Non-recurrent) 3,403 4,530 3,073 604
Grants - Capital (Recurrent) 1,600 2,225 2,650 2,370
Interest 1,100 1,150 1,195 1,241
Other Income 192 220 233 288
Net Gain on Disposal of Property, Infrastructure, Plant and Equipment 93 298 181 120
Total Income 77,133 80,687 83,016 82,476
ExPENSES
Employee Costs 23,453 24,759 26,168 27,768
Contract Payments, Materials and Services 31,006 26,898 26,136 27,147
Bad and Doubtful Debts 112 115 119 122
Depreciation and Amortisation 22,854 22,962 22,744 22,216
Borrowing Costs 816 747 652 583
Total Expenses 78,241 75,481 75,819 77,836
Surplus (Deficit) for the Year (1,108) 5,206 7,197 4,640
OTHER COMPREHENSIVE INCOME
Items that will not be reclassified to surplus or deficit:
Net Asset Revaluation Increment - - - -
Comprehensive Result (1,108) 5,206 7,197 4,640
The above Comprehensive Income Statement should be read in conjunction with the accompanying other information.
26 | Council Plan 2013-17
Minutes - Special Council Meeting of 24 June 2014 32

The above Balance Sheet should be read in conjunction with the accompanying other information.
Balance SheetFor the four years ending 30 June 2018
2015 $’000
2016 $’000
2017 $’000
2018 $’000
ASSETSCURRENT ASSETS
Cash and Cash Equivalents 23,316 21,706 24,470 26,138
Trade and Other Receivables 4,147 4,263 4,416 4,710
Other Assets 292 292 292 292
Total Current Assets 27,755 26,261 29,178 31,140
NON-CURRENT ASSETS
Trade and Other receivables 873 1,276 2,280 3,428
Property, Infrastructure, Plant and Equipment 868,587 873,861 877,615 880,130
Intangible Assets 631 763 491 221
Total Non-Current Assets 870,091 875,900 880,386 883,779
Total Assets 897,846 902,161 909,564 914,919
LIABILITIESCURRENT LIABILITIES
Trade and Other Payables 5,475 4,775 4,651 4,833
Trust Funds and Deposits 600 600 600 600
Provisions 5,627 5,910 6,215 6,562
Interest-Bearing Borrowings 3,197 1,802 1,305 3,973
Total Current Liabilities 14,899 13,087 12,771 15,968
NON-CURRENT LIABILITIES
Provisions 1,910 1,934 1,960 1,990
Interest-Bearing Borrowings 11,180 12,077 12,573 10,061
Total Non-Current Liabilities 13,090 14,011 14,533 12,051
Total Liabilities 27,989 27,098 27,304 28,019
Net Assets 869,857 875,063 882,260 886,900
EqUITyEqUITy
Accumulated Surplus 268,961 275,331 282,049 287,357
Asset Revaluation Reserve 595,903 595,903 595,903 595,903
Other Reserves 4,993 3,829 4,308 3,640
Total Equity 869,857 875,063 882,260 886,900
www.wellington.vic.gov.au | 27
Minutes - Special Council Meeting of 24 June 2014 33
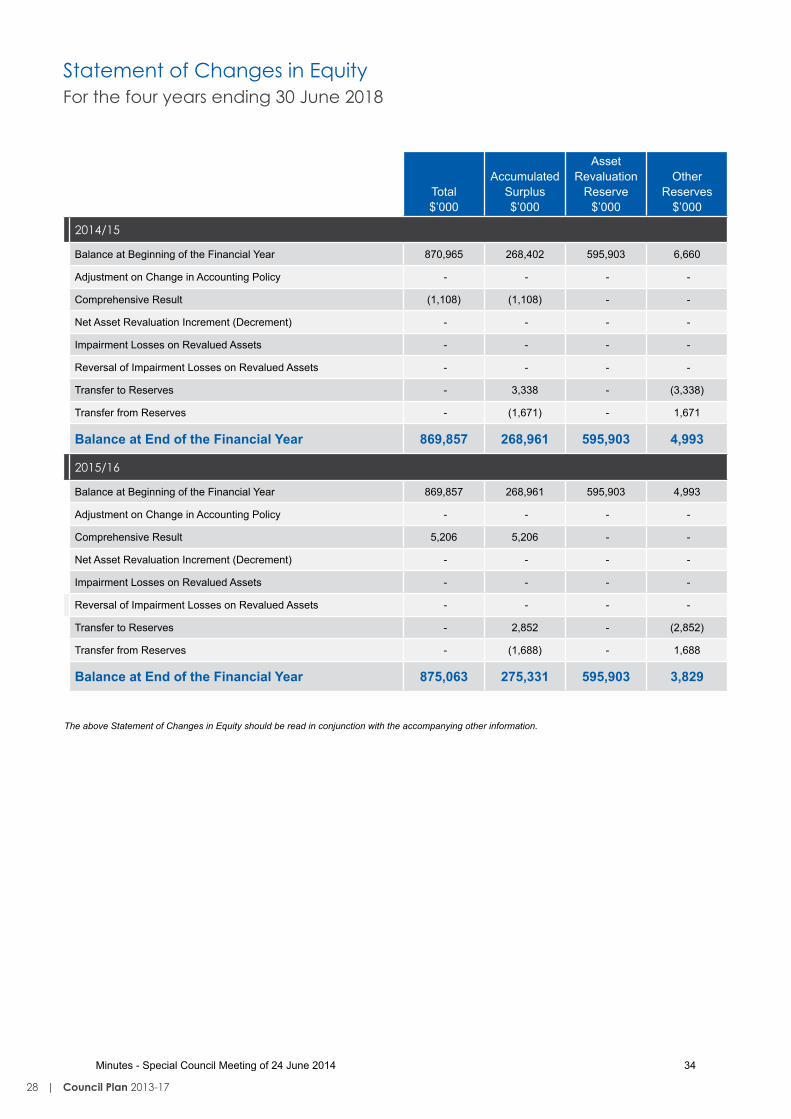
Statement of Changes in EquityFor the four years ending 30 June 2018
Total $’000
Accumulated Surplus $’000
Asset Revaluation
Reserve $’000
Other Reserves
$’000
2014/15
Balance at Beginning of the Financial Year 870,965 268,402 595,903 6,660
Adjustment on Change in Accounting Policy - - - -
Comprehensive Result (1,108) (1,108) - -
Net Asset Revaluation Increment (Decrement) - - - -
Impairment Losses on Revalued Assets - - - -
Reversal of Impairment Losses on Revalued Assets - - - -
Transfer to Reserves - 3,338 - (3,338)
Transfer from Reserves - (1,671) - 1,671
Balance at End of the Financial Year 869,857 268,961 595,903 4,993
2015/16
Balance at Beginning of the Financial Year 869,857 268,961 595,903 4,993
Adjustment on Change in Accounting Policy - - - -
Comprehensive Result 5,206 5,206 - -
Net Asset Revaluation Increment (Decrement) - - - -
Impairment Losses on Revalued Assets - - - -
Reversal of Impairment Losses on Revalued Assets - - - -
Transfer to Reserves - 2,852 - (2,852)
Transfer from Reserves - (1,688) - 1,688
Balance at End of the Financial Year 875,063 275,331 595,903 3,829
The above Statement of Changes in Equity should be read in conjunction with the accompanying other information.
28 | Council Plan 2013-17
Minutes - Special Council Meeting of 24 June 2014 34
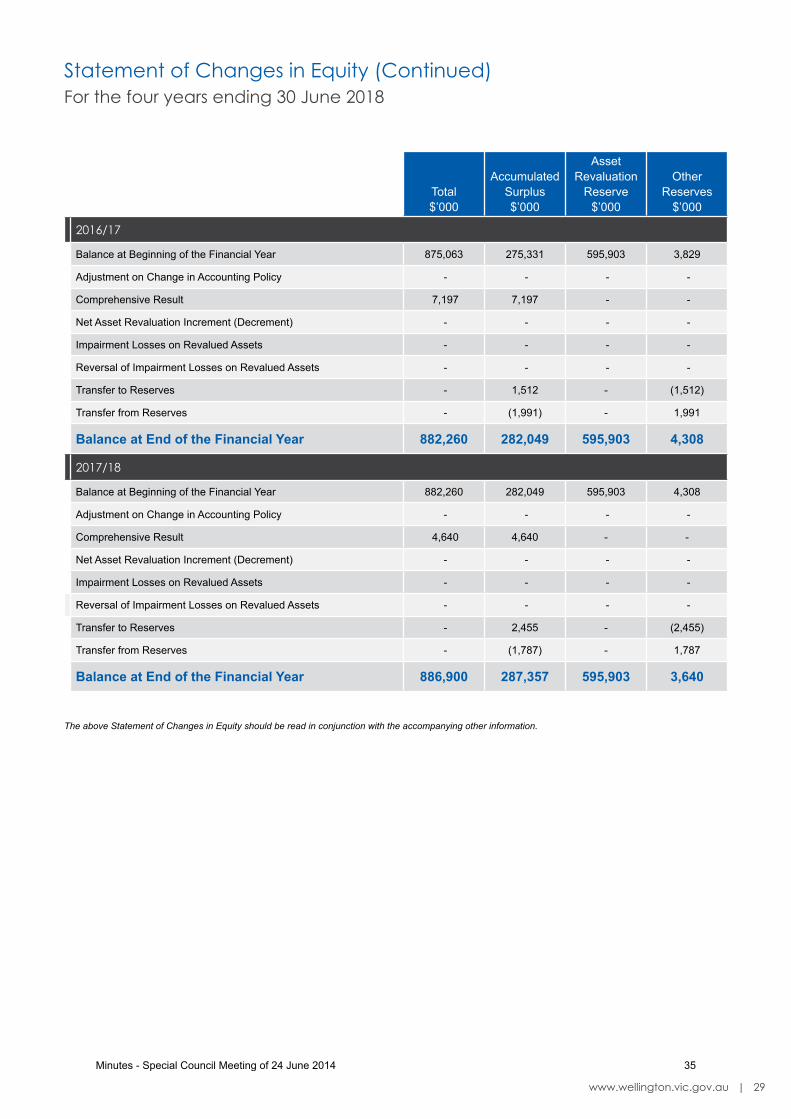
Statement of Changes in Equity (Continued)For the four years ending 30 June 2018
Total $’000
Accumulated Surplus $’000
Asset Revaluation
Reserve $’000
Other Reserves
$’000
2016/17
Balance at Beginning of the Financial Year 875,063 275,331 595,903 3,829
Adjustment on Change in Accounting Policy - - - -
Comprehensive Result 7,197 7,197 - -
Net Asset Revaluation Increment (Decrement) - - - -
Impairment Losses on Revalued Assets - - - -
Reversal of Impairment Losses on Revalued Assets - - - -
Transfer to Reserves - 1,512 - (1,512)
Transfer from Reserves - (1,991) - 1,991
Balance at End of the Financial Year 882,260 282,049 595,903 4,308
2017/18
Balance at Beginning of the Financial Year 882,260 282,049 595,903 4,308
Adjustment on Change in Accounting Policy - - - -
Comprehensive Result 4,640 4,640 - -
Net Asset Revaluation Increment (Decrement) - - - -
Impairment Losses on Revalued Assets - - - -
Reversal of Impairment Losses on Revalued Assets - - - -
Transfer to Reserves - 2,455 - (2,455)
Transfer from Reserves - (1,787) - 1,787
Balance at End of the Financial Year 886,900 287,357 595,903 3,640
The above Statement of Changes in Equity should be read in conjunction with the accompanying other information.
www.wellington.vic.gov.au | 29
Minutes - Special Council Meeting of 24 June 2014 35
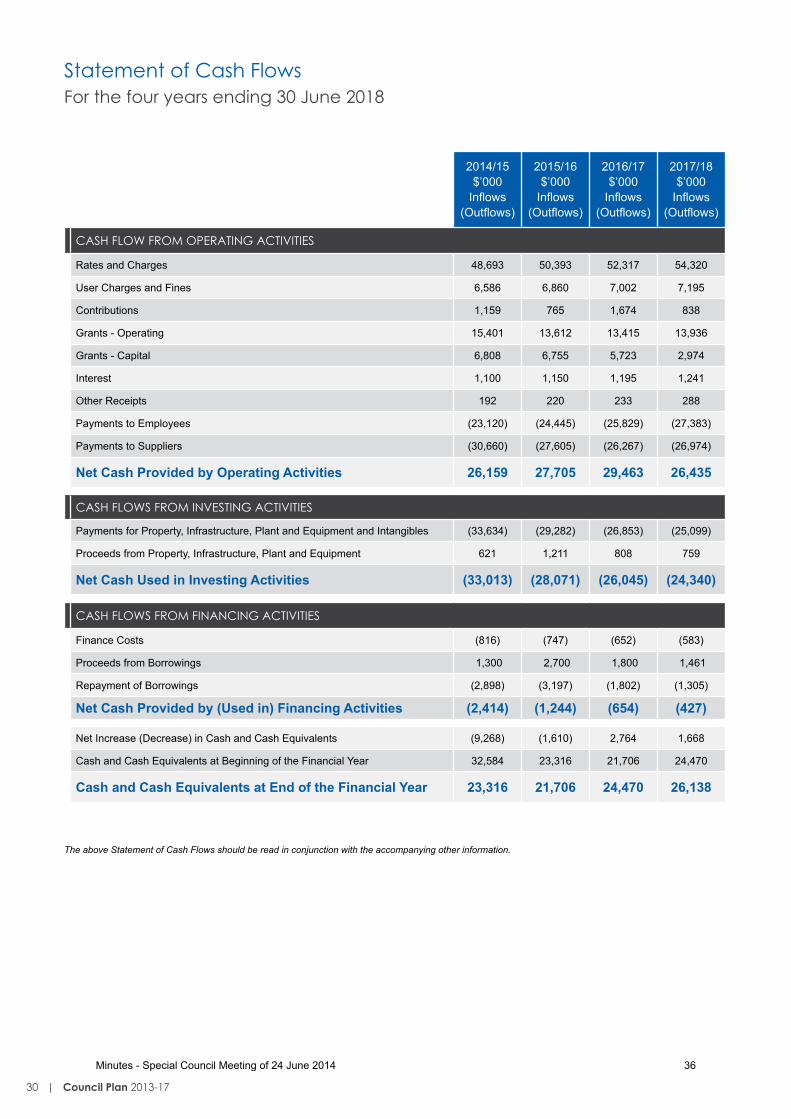
Statement of Cash FlowsFor the four years ending 30 June 2018
2014/15 $’000
Inflows (Outflows)
2015/16 $’000
Inflows (Outflows)
2016/17 $’000
Inflows (Outflows)
2017/18 $’000
Inflows (Outflows)
CASH FLOW FROM OPERATING ACTIVITIES
Rates and Charges 48,693 50,393 52,317 54,320
User Charges and Fines 6,586 6,860 7,002 7,195
Contributions 1,159 765 1,674 838
Grants - Operating 15,401 13,612 13,415 13,936
Grants - Capital 6,808 6,755 5,723 2,974
Interest 1,100 1,150 1,195 1,241
Other Receipts 192 220 233 288
Payments to Employees (23,120) (24,445) (25,829) (27,383)
Payments to Suppliers (30,660) (27,605) (26,267) (26,974)
Net Cash Provided by Operating Activities 26,159 27,705 29,463 26,435
CASH FLOWS FROM INVESTING ACTIVITIES
Payments for Property, Infrastructure, Plant and Equipment and Intangibles (33,634) (29,282) (26,853) (25,099)
Proceeds from Property, Infrastructure, Plant and Equipment 621 1,211 808 759
Net Cash Used in Investing Activities (33,013) (28,071) (26,045) (24,340)
CASH FLOWS FROM FINANCING ACTIVITIES
Finance Costs (816) (747) (652) (583)
Proceeds from Borrowings 1,300 2,700 1,800 1,461
Repayment of Borrowings (2,898) (3,197) (1,802) (1,305)
Net Cash Provided by (Used in) Financing Activities (2,414) (1,244) (654) (427)
Net Increase (Decrease) in Cash and Cash Equivalents (9,268) (1,610) 2,764 1,668
Cash and Cash Equivalents at Beginning of the Financial Year 32,584 23,316 21,706 24,470
Cash and Cash Equivalents at End of the Financial Year 23,316 21,706 24,470 26,138
The above Statement of Cash Flows should be read in conjunction with the accompanying other information.
30 | Council Plan 2013-17
Minutes - Special Council Meeting of 24 June 2014 36
The above Statement of Capital Works should be read in conjunction with the accompanying other information.
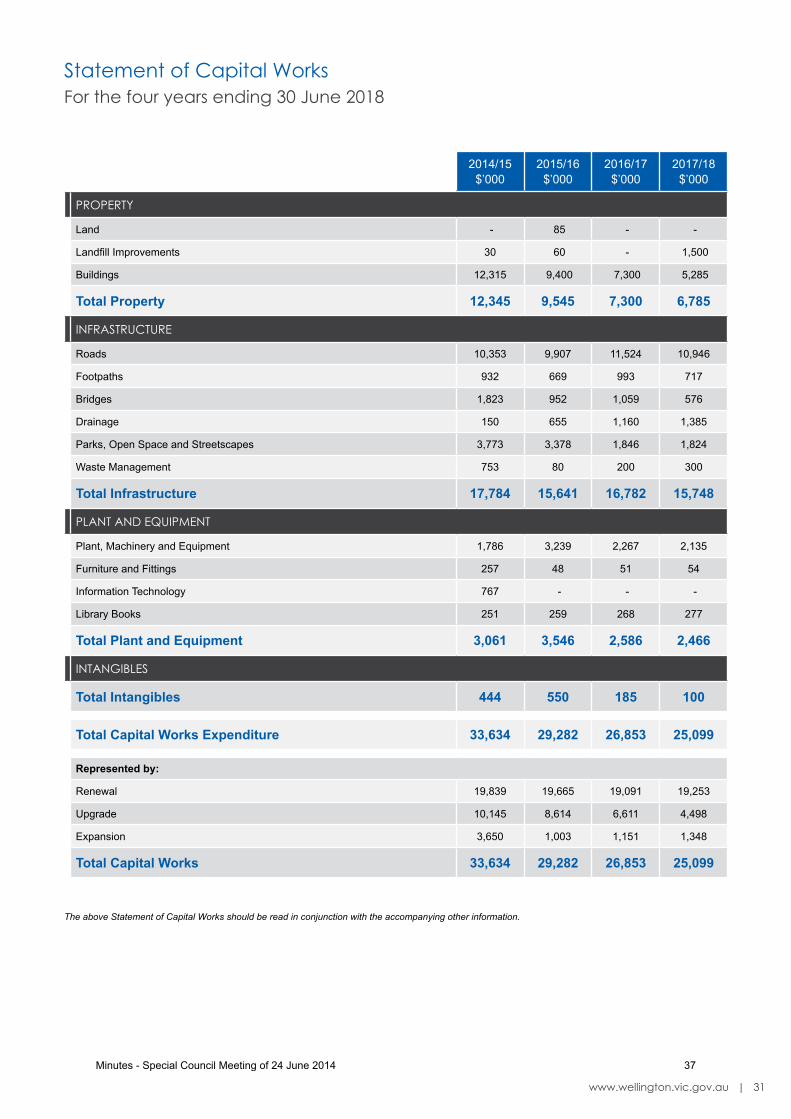
Statement of Capital WorksFor the four years ending 30 June 2018
2014/15 $’000
2015/16 $’000
2016/17 $’000
2017/18 $’000
PROPERTy
Land - 85 - -
Landfill Improvements 30 60 - 1,500
Buildings 12,315 9,400 7,300 5,285
Total Property 12,345 9,545 7,300 6,785
INFRASTRUCTURE
Roads 10,353 9,907 11,524 10,946
Footpaths 932 669 993 717
Bridges 1,823 952 1,059 576
Drainage 150 655 1,160 1,385
Parks, Open Space and Streetscapes 3,773 3,378 1,846 1,824
Waste Management 753 80 200 300
Total Infrastructure 17,784 15,641 16,782 15,748
PLANT AND EqUIPMENT
Plant, Machinery and Equipment 1,786 3,239 2,267 2,135
Furniture and Fittings 257 48 51 54
Information Technology 767 - - -
Library Books 251 259 268 277
Total Plant and Equipment 3,061 3,546 2,586 2,466
INTANGIBLES
Total Intangibles 444 550 185 100
Total Capital Works Expenditure 33,634 29,282 26,853 25,099
Represented by:
Renewal 19,839 19,665 19,091 19,253
Upgrade 10,145 8,614 6,611 4,498
Expansion 3,650 1,003 1,151 1,348
Total Capital Works 33,634 29,282 26,853 25,099
www.wellington.vic.gov.au | 31
Minutes - Special Council Meeting of 24 June 2014 37
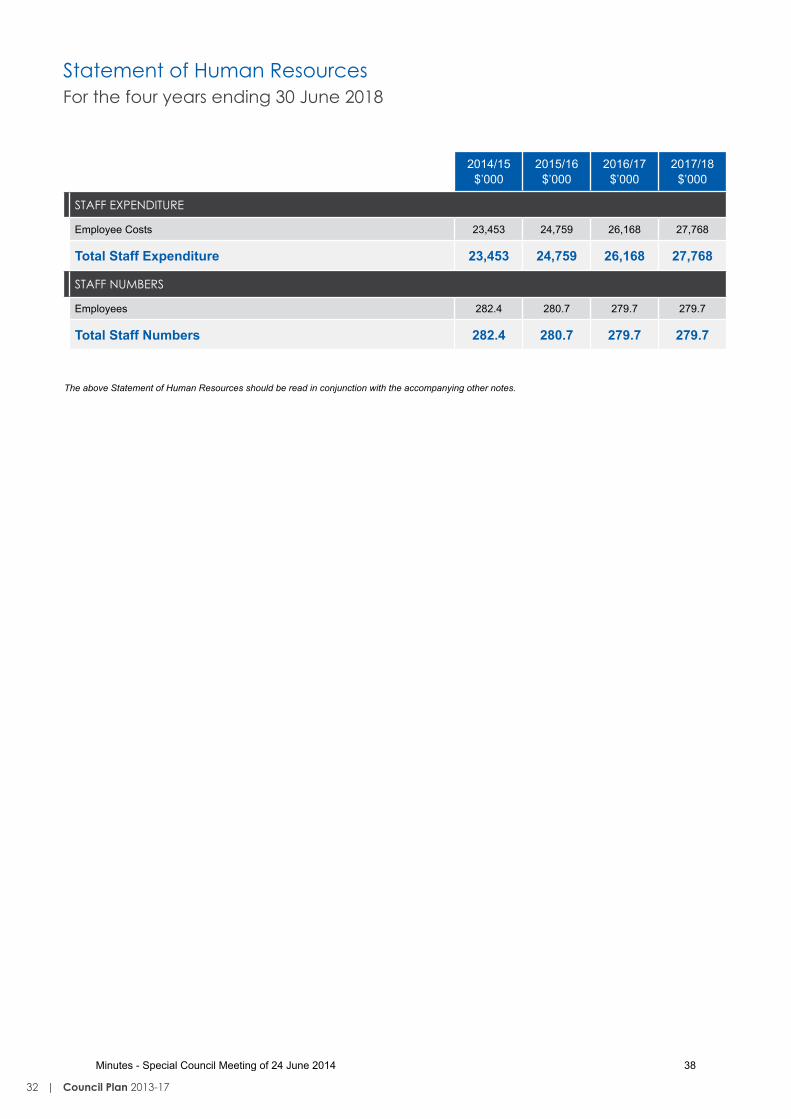
Statement of Human ResourcesFor the four years ending 30 June 2018
2014/15 $’000
2015/16 $’000
2016/17 $’000
2017/18 $’000
STAFF ExPENDITURE
Employee Costs 23,453 24,759 26,168 27,768
Total Staff Expenditure 23,453 24,759 26,168 27,768
STAFF NUMBERS
Employees 282.4 280.7 279.7 279.7
Total Staff Numbers 282.4 280.7 279.7 279.7
The above Statement of Human Resources should be read in conjunction with the accompanying other notes.
32 | Council Plan 2013-17
Minutes - Special Council Meeting of 24 June 2014 38
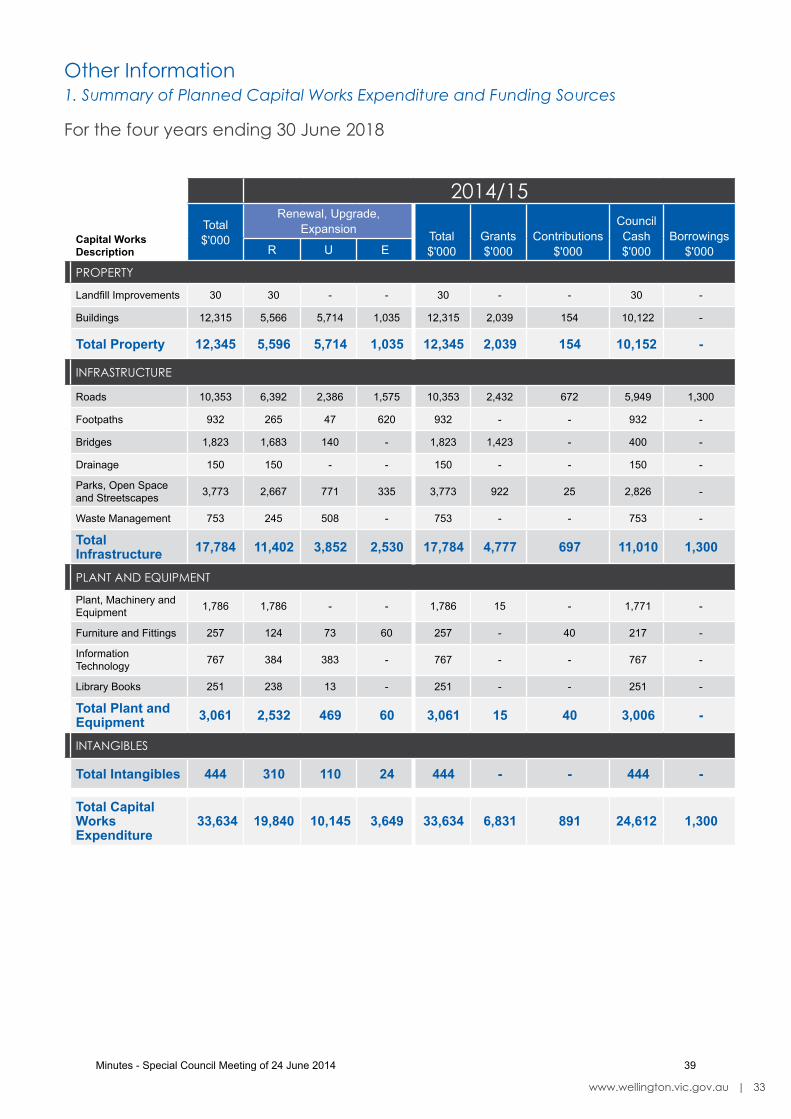
Other Information1. Summary of Planned Capital Works Expenditure and Funding Sources
For the four years ending 30 June 2018
2014/15
Capital Works Description
Total $'000
Renewal, Upgrade, Expansion Total
$'000Grants $'000
Contributions $'000
Council Cash $'000
Borrowings $'000R U E
PROPERTy
Landfill Improvements 30 30 - - 30 - - 30 -
Buildings 12,315 5,566 5,714 1,035 12,315 2,039 154 10,122 -
Total Property 12,345 5,596 5,714 1,035 12,345 2,039 154 10,152 -
INFRASTRUCTURE
Roads 10,353 6,392 2,386 1,575 10,353 2,432 672 5,949 1,300
Footpaths 932 265 47 620 932 - - 932 -
Bridges 1,823 1,683 140 - 1,823 1,423 - 400 -
Drainage 150 150 - - 150 - - 150 -
Parks, Open Space and Streetscapes 3,773 2,667 771 335 3,773 922 25 2,826 -
Waste Management 753 245 508 - 753 - - 753 -
Total Infrastructure 17,784 11,402 3,852 2,530 17,784 4,777 697 11,010 1,300
PLANT AND EqUIPMENT
Plant, Machinery and Equipment 1,786 1,786 - - 1,786 15 - 1,771 -
Furniture and Fittings 257 124 73 60 257 - 40 217 -
Information Technology 767 384 383 - 767 - - 767 -
Library Books 251 238 13 - 251 - - 251 -
Total Plant and Equipment 3,061 2,532 469 60 3,061 15 40 3,006 -
INTANGIBLES
Total Intangibles 444 310 110 24 444 - - 444 -
Total Capital Works Expenditure
33,634 19,840 10,145 3,649 33,634 6,831 891 24,612 1,300
www.wellington.vic.gov.au | 33
Minutes - Special Council Meeting of 24 June 2014 39
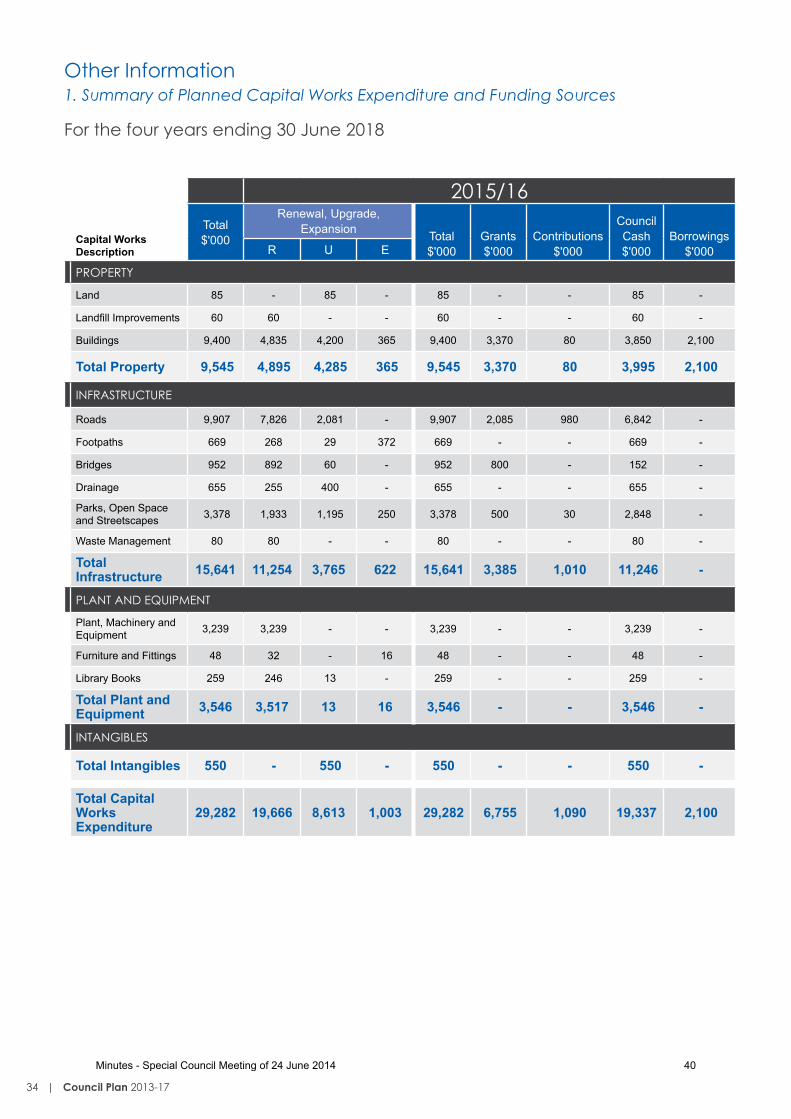
Other Information1. Summary of Planned Capital Works Expenditure and Funding Sources
For the four years ending 30 June 2018
2015/16
Capital Works Description
Total $'000
Renewal, Upgrade, Expansion Total
$'000Grants $'000
Contributions $'000
Council Cash $'000
Borrowings $'000R U E
PROPERTy
Land 85 - 85 - 85 - - 85 -
Landfill Improvements 60 60 - - 60 - - 60 -
Buildings 9,400 4,835 4,200 365 9,400 3,370 80 3,850 2,100
Total Property 9,545 4,895 4,285 365 9,545 3,370 80 3,995 2,100
INFRASTRUCTURE
Roads 9,907 7,826 2,081 - 9,907 2,085 980 6,842 -
Footpaths 669 268 29 372 669 - - 669 -
Bridges 952 892 60 - 952 800 - 152 -
Drainage 655 255 400 - 655 - - 655 -
Parks, Open Space and Streetscapes 3,378 1,933 1,195 250 3,378 500 30 2,848 -
Waste Management 80 80 - - 80 - - 80 -
Total Infrastructure 15,641 11,254 3,765 622 15,641 3,385 1,010 11,246 -
PLANT AND EqUIPMENT
Plant, Machinery and Equipment 3,239 3,239 - - 3,239 - - 3,239 -
Furniture and Fittings 48 32 - 16 48 - - 48 -
Library Books 259 246 13 - 259 - - 259 -
Total Plant and Equipment 3,546 3,517 13 16 3,546 - - 3,546 -
INTANGIBLES
Total Intangibles 550 - 550 - 550 - - 550 -
Total Capital Works Expenditure
29,282 19,666 8,613 1,003 29,282 6,755 1,090 19,337 2,100
34 | Council Plan 2013-17
Minutes - Special Council Meeting of 24 June 2014 40
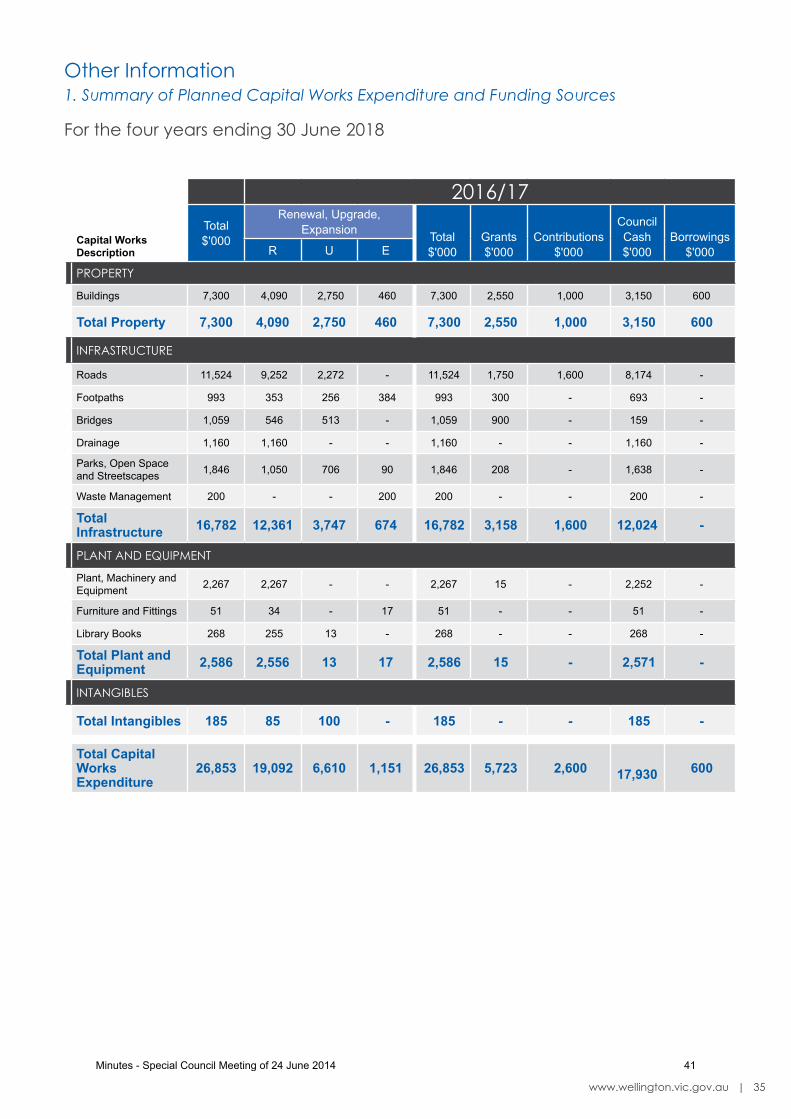
Other Information1. Summary of Planned Capital Works Expenditure and Funding Sources
For the four years ending 30 June 2018
2016/17
Capital Works Description
Total $'000
Renewal, Upgrade, Expansion Total
$'000Grants $'000
Contributions $'000
Council Cash $'000
Borrowings $'000R U E
PROPERTy
Buildings 7,300 4,090 2,750 460 7,300 2,550 1,000 3,150 600
Total Property 7,300 4,090 2,750 460 7,300 2,550 1,000 3,150 600
INFRASTRUCTURE
Roads 11,524 9,252 2,272 - 11,524 1,750 1,600 8,174 -
Footpaths 993 353 256 384 993 300 - 693 -
Bridges 1,059 546 513 - 1,059 900 - 159 -
Drainage 1,160 1,160 - - 1,160 - - 1,160 -
Parks, Open Space and Streetscapes 1,846 1,050 706 90 1,846 208 - 1,638 -
Waste Management 200 - - 200 200 - - 200 -
Total Infrastructure 16,782 12,361 3,747 674 16,782 3,158 1,600 12,024 -
PLANT AND EqUIPMENT
Plant, Machinery and Equipment 2,267 2,267 - - 2,267 15 - 2,252 -
Furniture and Fittings 51 34 - 17 51 - - 51 -
Library Books 268 255 13 - 268 - - 268 -
Total Plant and Equipment 2,586 2,556 13 17 2,586 15 - 2,571 -
INTANGIBLES
Total Intangibles 185 85 100 - 185 - - 185 -
Total Capital Works Expenditure
26,853 19,092 6,610 1,151 26,853 5,723 2,600 17,930 600
www.wellington.vic.gov.au | 35
Minutes - Special Council Meeting of 24 June 2014 41
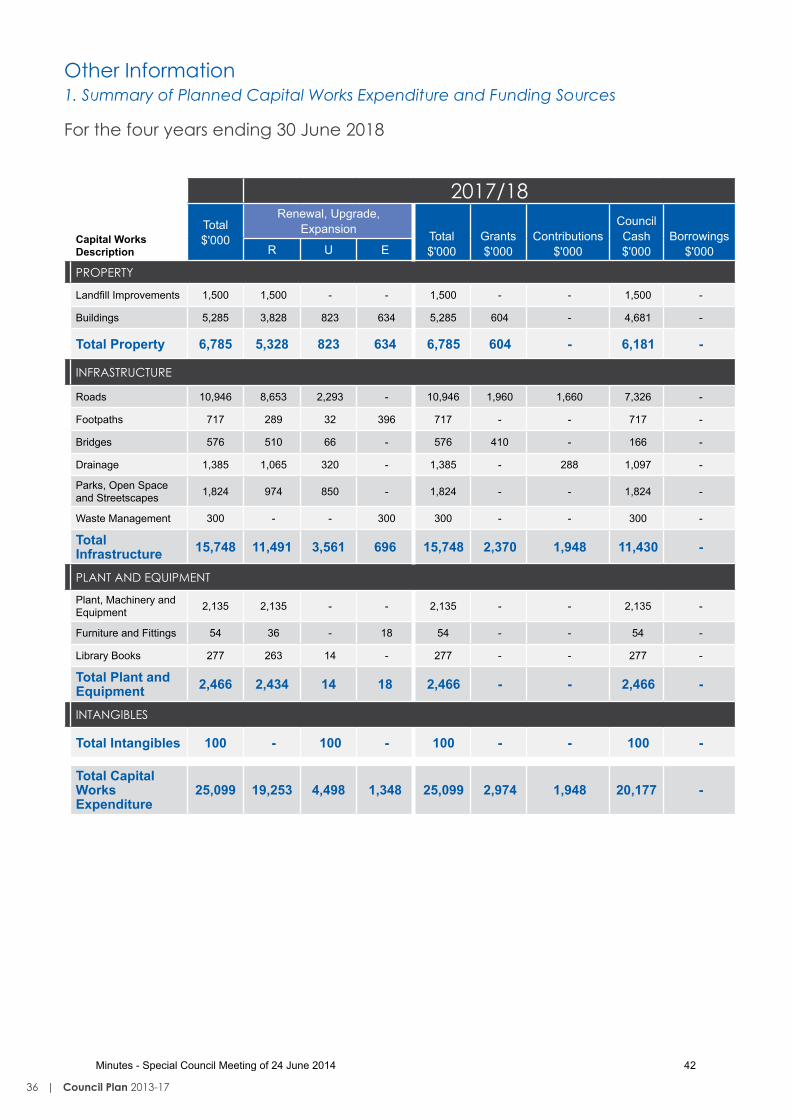
Other Information1. Summary of Planned Capital Works Expenditure and Funding Sources
For the four years ending 30 June 2018
2017/18
Capital Works Description
Total $'000
Renewal, Upgrade, Expansion Total
$'000Grants $'000
Contributions $'000
Council Cash $'000
Borrowings $'000R U E
PROPERTy
Landfill Improvements 1,500 1,500 - - 1,500 - - 1,500 -
Buildings 5,285 3,828 823 634 5,285 604 - 4,681 -
Total Property 6,785 5,328 823 634 6,785 604 - 6,181 -
INFRASTRUCTURE
Roads 10,946 8,653 2,293 - 10,946 1,960 1,660 7,326 -
Footpaths 717 289 32 396 717 - - 717 -
Bridges 576 510 66 - 576 410 - 166 -
Drainage 1,385 1,065 320 - 1,385 - 288 1,097 -
Parks, Open Space and Streetscapes 1,824 974 850 - 1,824 - - 1,824 -
Waste Management 300 - - 300 300 - - 300 -
Total Infrastructure 15,748 11,491 3,561 696 15,748 2,370 1,948 11,430 -
PLANT AND EqUIPMENT
Plant, Machinery and Equipment 2,135 2,135 - - 2,135 - - 2,135 -
Furniture and Fittings 54 36 - 18 54 - - 54 -
Library Books 277 263 14 - 277 - - 277 -
Total Plant and Equipment 2,466 2,434 14 18 2,466 - - 2,466 -
INTANGIBLES
Total Intangibles 100 - 100 - 100 - - 100 -
Total Capital Works Expenditure
25,099 19,253 4,498 1,348 25,099 2,974 1,948 20,177 -
36 | Council Plan 2013-17
Minutes - Special Council Meeting of 24 June 2014 42
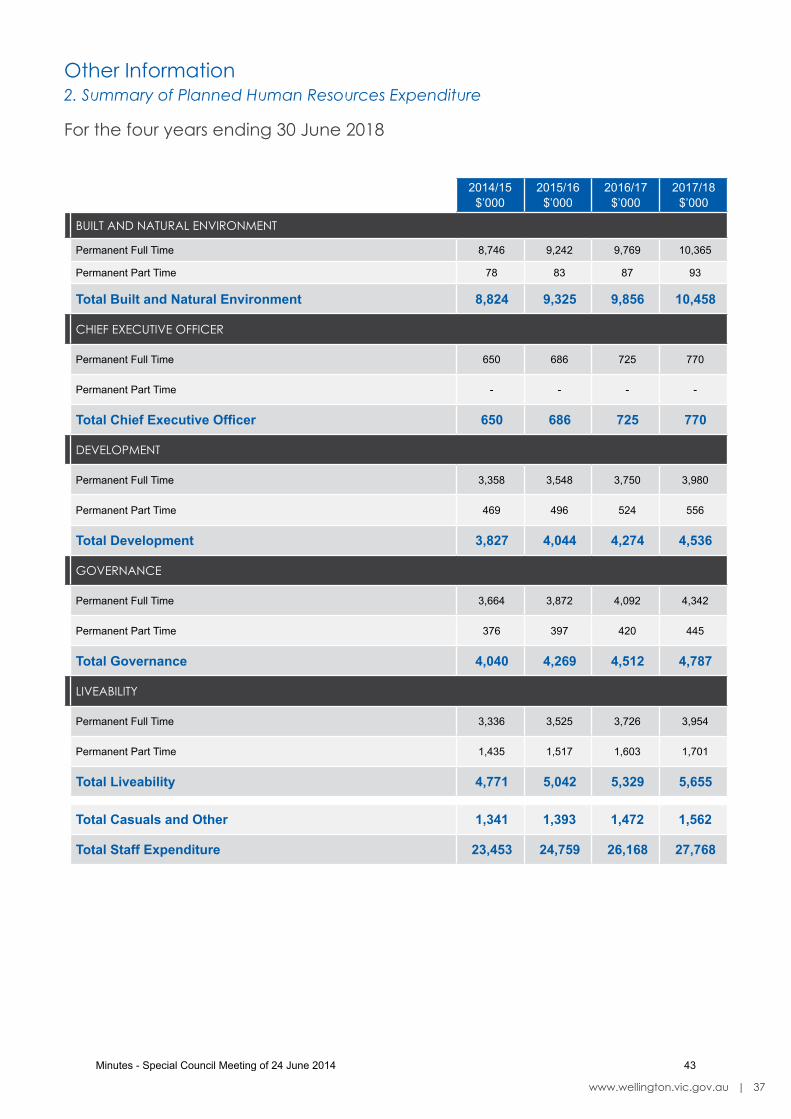
Other Information2. Summary of Planned Human Resources Expenditure
For the four years ending 30 June 2018
2014/15 $’000
2015/16 $’000
2016/17 $’000
2017/18 $’000
BUILT AND NATURAL ENVIRONMENT
Permanent Full Time 8,746 9,242 9,769 10,365
Permanent Part Time 78 83 87 93
Total Built and Natural Environment 8,824 9,325 9,856 10,458
CHIEF ExECUTIVE OFFICER
Permanent Full Time 650 686 725 770
Permanent Part Time - - - -
Total Chief Executive Officer 650 686 725 770
DEVELOPMENT
Permanent Full Time 3,358 3,548 3,750 3,980
Permanent Part Time 469 496 524 556
Total Development 3,827 4,044 4,274 4,536
GOVERNANCE
Permanent Full Time 3,664 3,872 4,092 4,342
Permanent Part Time 376 397 420 445
Total Governance 4,040 4,269 4,512 4,787
LIVEABILITy
Permanent Full Time 3,336 3,525 3,726 3,954
Permanent Part Time 1,435 1,517 1,603 1,701
Total Liveability 4,771 5,042 5,329 5,655
Total Casuals and Other 1,341 1,393 1,472 1,562
Total Staff Expenditure 23,453 24,759 26,168 27,768
www.wellington.vic.gov.au | 37
Minutes - Special Council Meeting of 24 June 2014 43

Other Information (Continued)2. Summary of Planned Human Resources Expenditure
For the four years ending 30 June 2018
2014/15 FTE
2015/16 FTE
2016/17 FTE
2017/18 FTE
BUILT AND NATURAL ENVIRONMENT
Permanent Full Time 112.0 112.0 112.0 112.0
Permanent Part Time 1.2 1.2 1.2 1.2
Total Built and Natural Environment 113.2 113.2 113.2 113.2
CHIEF ExECUTIVE OFFICER
Permanent Full Time 5.0 5.0 5.0 5.0
Permanent Part Time - - - -
Total Chief Executive Officer 5.0 5.0 5.0 5.0
DEVELOPMENT
Permanent Full Time 33.0 33.0 33.0 33.0
Permanent Part Time 7.4 7.4 7.4 7.4
Total Development 40.4 40.4 40.4 40.4
GOVERNANCE
Permanent Full Time 39.0 39.0 39.0 39.0
Permanent Part Time 5.5 5.5 5.5 5.5
Total Governance 44.5 44.5 44.5 44.5
LIVEABILITy
Permanent Full Time 39.0 39.0 38.0 38.0
Permanent Part Time 23.0 21.6 21.6 21.6
Total Liveability 62.0 60.6 59.6 59.6
Total Casuals and Other 17.3 17.0 17.0 17.0
Total Staff Numbers 282.4 280.7 279.7 279.7
38 | Council Plan 2013-17
Minutes - Special Council Meeting of 24 June 2014 44
Port of Sale Civic Centre 70 Foster Street (PO Box 506) Sale Victoria 3850 Tel 1300 366 244 Fax 03 5142 3499 Yarram Service Centre 156 Grant Street, Yarram Victoria 3971 Tel 03 5182 5100
Web www.wellington.vic.gov.au Email [email protected]
Back / Cover Image: Sale MallMinutes - Special Council Meeting of 24 June 2014 45
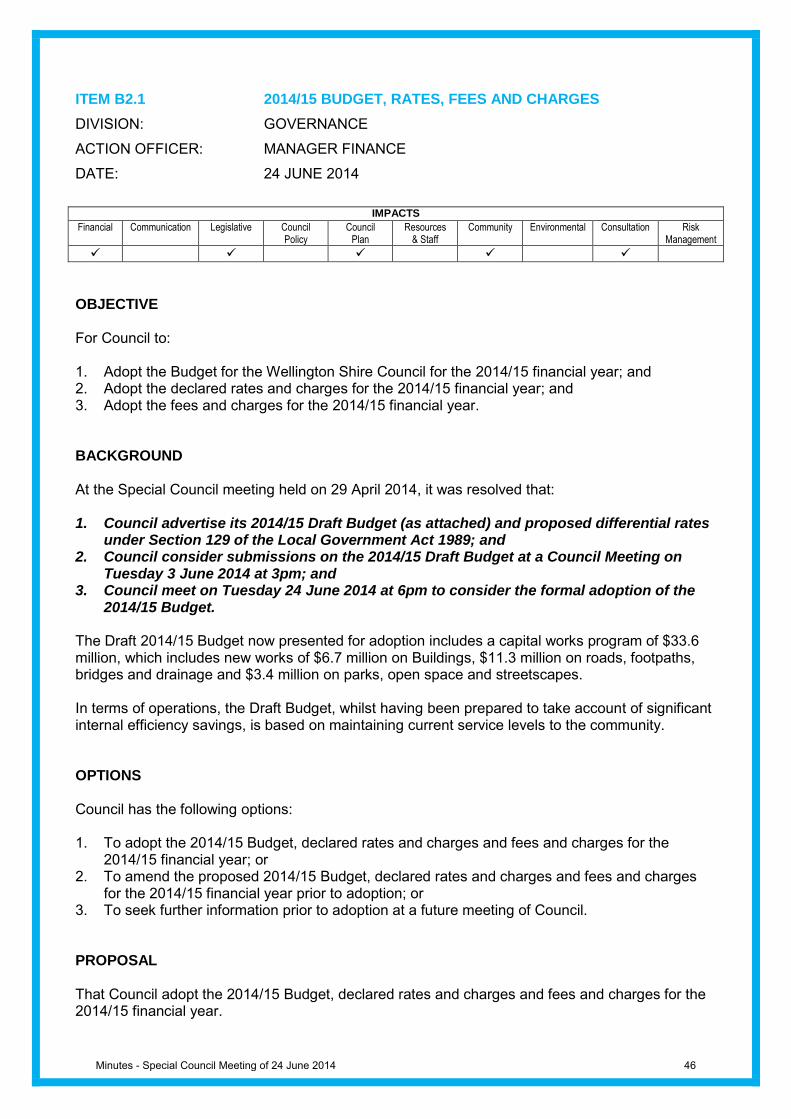
ITEM B2.1 2014/15 BUDGET, RATES, FEES AND CHARGES
DIVISION: GOVERNANCE
ACTION OFFICER: MANAGER FINANCE
DATE: 24 JUNE 2014
IMPACTS
Financial Communication Legislative Council Policy
Council Plan
Resources & Staff
Community Environmental Consultation Risk Management
OBJECTIVE For Council to: 1. Adopt the Budget for the Wellington Shire Council for the 2014/15 financial year; and 2. Adopt the declared rates and charges for the 2014/15 financial year; and 3. Adopt the fees and charges for the 2014/15 financial year. BACKGROUND At the Special Council meeting held on 29 April 2014, it was resolved that: 1. Council advertise its 2014/15 Draft Budget (as attached) and proposed differential rates
under Section 129 of the Local Government Act 1989; and 2. Council consider submissions on the 2014/15 Draft Budget at a Council Meeting on
Tuesday 3 June 2014 at 3pm; and 3. Council meet on Tuesday 24 June 2014 at 6pm to consider the formal adoption of the
2014/15 Budget. The Draft 2014/15 Budget now presented for adoption includes a capital works program of $33.6 million, which includes new works of $6.7 million on Buildings, $11.3 million on roads, footpaths, bridges and drainage and $3.4 million on parks, open space and streetscapes. In terms of operations, the Draft Budget, whilst having been prepared to take account of significant internal efficiency savings, is based on maintaining current service levels to the community. OPTIONS Council has the following options: 1. To adopt the 2014/15 Budget, declared rates and charges and fees and charges for the
2014/15 financial year; or 2. To amend the proposed 2014/15 Budget, declared rates and charges and fees and charges
for the 2014/15 financial year prior to adoption; or 3. To seek further information prior to adoption at a future meeting of Council. PROPOSAL That Council adopt the 2014/15 Budget, declared rates and charges and fees and charges for the 2014/15 financial year.
Minutes - Special Council Meeting of 24 June 2014 46
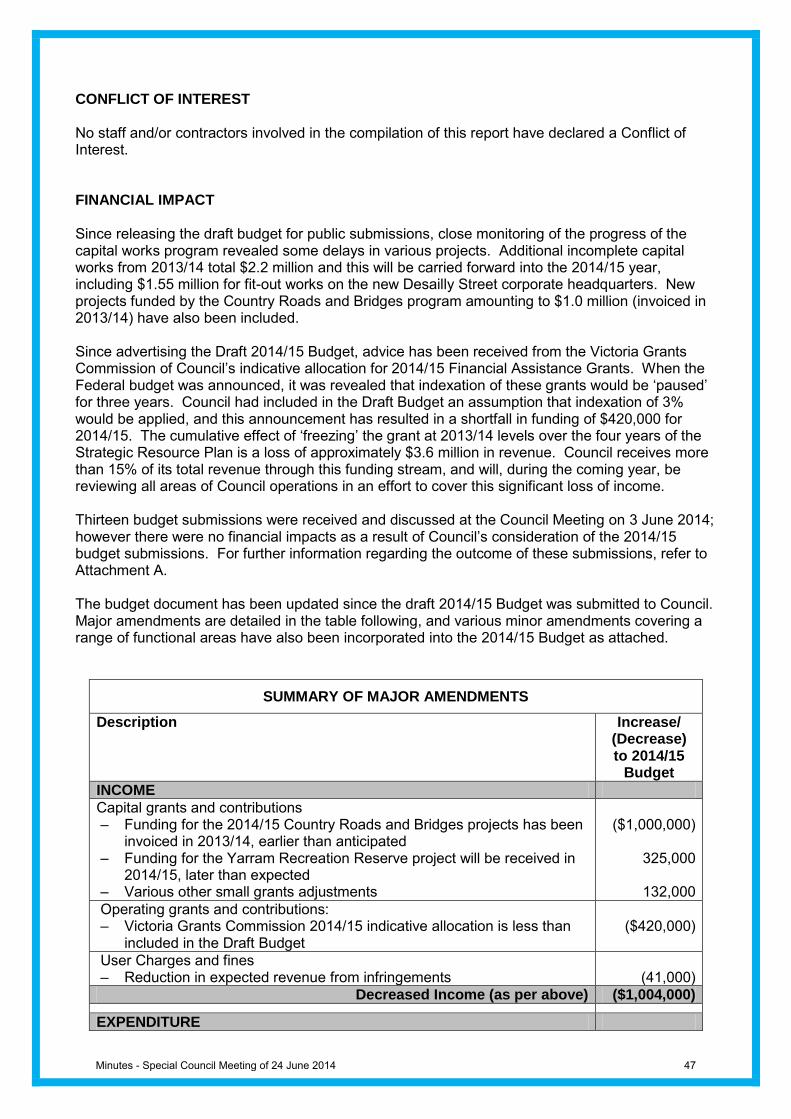
CONFLICT OF INTEREST No staff and/or contractors involved in the compilation of this report have declared a Conflict of Interest. FINANCIAL IMPACT Since releasing the draft budget for public submissions, close monitoring of the progress of the capital works program revealed some delays in various projects. Additional incomplete capital works from 2013/14 total $2.2 million and this will be carried forward into the 2014/15 year, including $1.55 million for fit-out works on the new Desailly Street corporate headquarters. New projects funded by the Country Roads and Bridges program amounting to $1.0 million (invoiced in 2013/14) have also been included. Since advertising the Draft 2014/15 Budget, advice has been received from the Victoria Grants Commission of Council’s indicative allocation for 2014/15 Financial Assistance Grants. When the Federal budget was announced, it was revealed that indexation of these grants would be ‘paused’ for three years. Council had included in the Draft Budget an assumption that indexation of 3% would be applied, and this announcement has resulted in a shortfall in funding of $420,000 for 2014/15. The cumulative effect of ‘freezing’ the grant at 2013/14 levels over the four years of the Strategic Resource Plan is a loss of approximately $3.6 million in revenue. Council receives more than 15% of its total revenue through this funding stream, and will, during the coming year, be reviewing all areas of Council operations in an effort to cover this significant loss of income. Thirteen budget submissions were received and discussed at the Council Meeting on 3 June 2014; however there were no financial impacts as a result of Council’s consideration of the 2014/15 budget submissions. For further information regarding the outcome of these submissions, refer to Attachment A. The budget document has been updated since the draft 2014/15 Budget was submitted to Council. Major amendments are detailed in the table following, and various minor amendments covering a range of functional areas have also been incorporated into the 2014/15 Budget as attached.
SUMMARY OF MAJOR AMENDMENTS
Description Increase/ (Decrease) to 2014/15
Budget
INCOME
Capital grants and contributions – Funding for the 2014/15 Country Roads and Bridges projects has been
invoiced in 2013/14, earlier than anticipated – Funding for the Yarram Recreation Reserve project will be received in
2014/15, later than expected – Various other small grants adjustments
($1,000,000)
325,000
132,000
Operating grants and contributions: – Victoria Grants Commission 2014/15 indicative allocation is less than
included in the Draft Budget
($420,000)
User Charges and fines – Reduction in expected revenue from infringements
(41,000)
Decreased Income (as per above) ($1,004,000)
EXPENDITURE
Minutes - Special Council Meeting of 24 June 2014 47
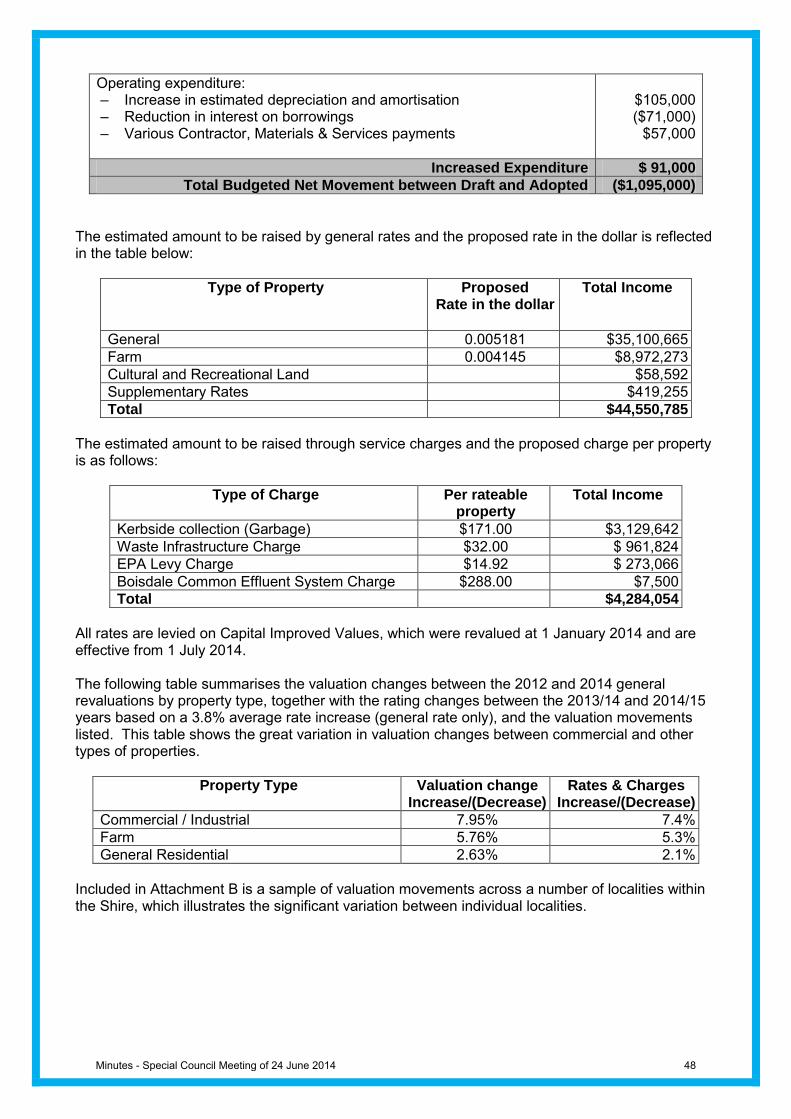
Operating expenditure: – Increase in estimated depreciation and amortisation – Reduction in interest on borrowings – Various Contractor, Materials & Services payments
$105,000 ($71,000)
$57,000
Increased Expenditure $ 91,000
Total Budgeted Net Movement between Draft and Adopted ($1,095,000)
The estimated amount to be raised by general rates and the proposed rate in the dollar is reflected in the table below:
Type of Property Proposed Rate in the dollar
Total Income
General 0.005181 $35,100,665
Farm 0.004145 $8,972,273
Cultural and Recreational Land $58,592
Supplementary Rates $419,255
Total $44,550,785
The estimated amount to be raised through service charges and the proposed charge per property is as follows:
Type of Charge Per rateable property
Total Income
Kerbside collection (Garbage) $171.00 $3,129,642
Waste Infrastructure Charge $32.00 $ 961,824
EPA Levy Charge $14.92 $ 273,066
Boisdale Common Effluent System Charge $288.00 $7,500
Total $4,284,054
All rates are levied on Capital Improved Values, which were revalued at 1 January 2014 and are effective from 1 July 2014. The following table summarises the valuation changes between the 2012 and 2014 general revaluations by property type, together with the rating changes between the 2013/14 and 2014/15 years based on a 3.8% average rate increase (general rate only), and the valuation movements listed. This table shows the great variation in valuation changes between commercial and other types of properties.
Property Type Valuation change Increase/(Decrease)
Rates & Charges Increase/(Decrease)
Commercial / Industrial 7.95% 7.4%
Farm 5.76% 5.3%
General Residential 2.63% 2.1%
Included in Attachment B is a sample of valuation movements across a number of localities within the Shire, which illustrates the significant variation between individual localities.
Minutes - Special Council Meeting of 24 June 2014 48

LEGISLATIVE IMPACT Council is required to advertise its intention to prepare a proposed Budget and give notice of declaration of rates and charges in accordance with Section 129 of the Local Government Act 1989. Section 223 of the Local Government Act 1989 requires Council to provide a 28 day submission period. Once adopted, the Budget must be submitted to the Minister by 31 August 2014. COUNCIL PLAN IMPACT The revised 2013-17 Council Plan includes in our organisational vision that ‘We strive to meet the needs of our community through clear organisational goals and objectives whilst continuing to attend to our core business in an ethical and financially responsible manner.’ Council is committed to maintaining a high standard of financial responsibility, and ensuring the long term financial sustainability of the organisation. This budget demonstrates prudent debt management and a strong focus on maintaining Council’s assets to ensure that they are fit for purpose and can continue to deliver services well into the future. COMMUNITY IMPACT The 2014/15 Budget reflects the financial impact of the services provided by Council to the community, and as such will impact on the community through enhanced services especially in infrastructure construction, maintenance, recreation programs and facilities, and strengthening community participation. CONSULTATION IMPACT Submissions on the 2014/15 Draft Budget were invited from individuals or organisations and these were presented to Council at a Council meeting held on Tuesday 3 June 2014. This provided the opportunity for ratepayers or residents to put forward their views on the content of the 2014/15 Draft Budget, and make suggestions for future inclusions. PUBLIC QUESTIONS AND COMMENTS FROM THE GALLERY
Minutes - Special Council Meeting of 24 June 2014 49
_________________________________________________________________________
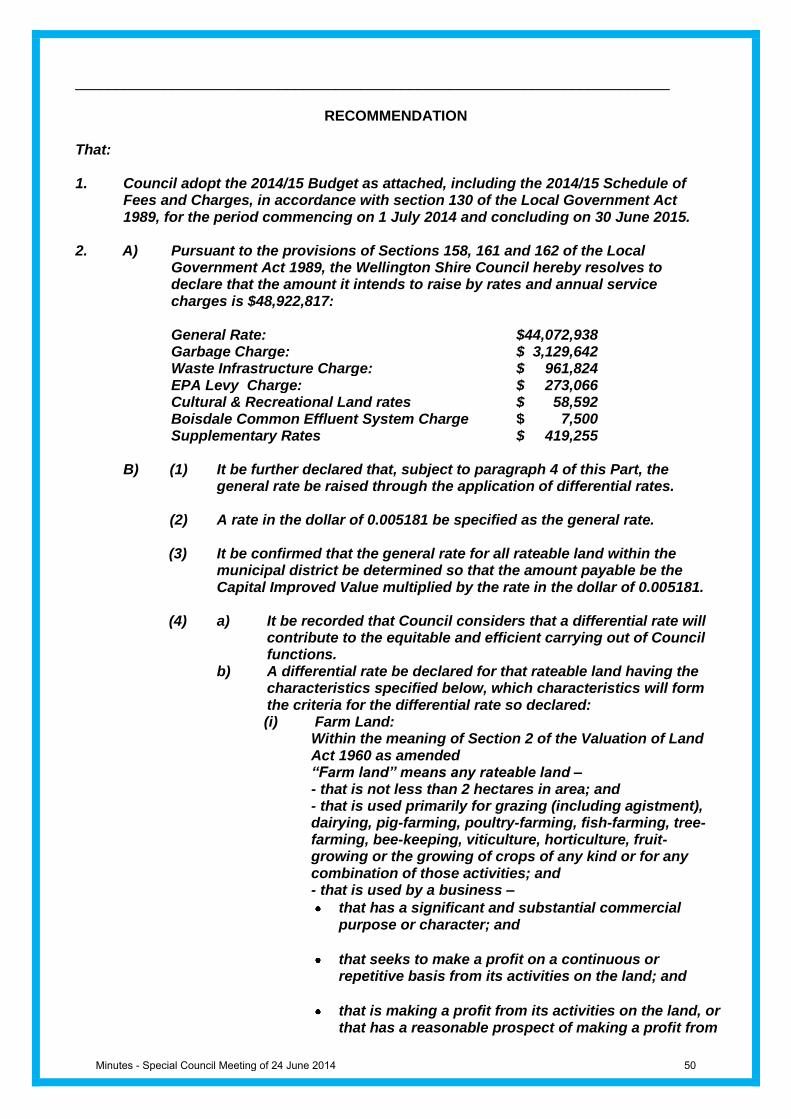
RECOMMENDATION That: 1. Council adopt the 2014/15 Budget as attached, including the 2014/15 Schedule of
Fees and Charges, in accordance with section 130 of the Local Government Act 1989, for the period commencing on 1 July 2014 and concluding on 30 June 2015.
2. A) Pursuant to the provisions of Sections 158, 161 and 162 of the Local
Government Act 1989, the Wellington Shire Council hereby resolves to declare that the amount it intends to raise by rates and annual service charges is $48,922,817:
General Rate: $44,072,938 Garbage Charge: $ 3,129,642 Waste Infrastructure Charge: $ 961,824 EPA Levy Charge: $ 273,066 Cultural & Recreational Land rates $ 58,592 Boisdale Common Effluent System Charge $ 7,500 Supplementary Rates $ 419,255
B) (1) It be further declared that, subject to paragraph 4 of this Part, the
general rate be raised through the application of differential rates.
(2) A rate in the dollar of 0.005181 be specified as the general rate. (3) It be confirmed that the general rate for all rateable land within the
municipal district be determined so that the amount payable be the Capital Improved Value multiplied by the rate in the dollar of 0.005181.
(4) a) It be recorded that Council considers that a differential rate will
contribute to the equitable and efficient carrying out of Council functions.
b) A differential rate be declared for that rateable land having the characteristics specified below, which characteristics will form the criteria for the differential rate so declared: (i) Farm Land:
Within the meaning of Section 2 of the Valuation of Land Act 1960 as amended “Farm land” means any rateable land – - that is not less than 2 hectares in area; and - that is used primarily for grazing (including agistment), dairying, pig-farming, poultry-farming, fish-farming, tree-farming, bee-keeping, viticulture, horticulture, fruit-growing or the growing of crops of any kind or for any combination of those activities; and - that is used by a business –
that has a significant and substantial commercial purpose or character; and
that seeks to make a profit on a continuous or repetitive basis from its activities on the land; and
that is making a profit from its activities on the land, or that has a reasonable prospect of making a profit from
Minutes - Special Council Meeting of 24 June 2014 50
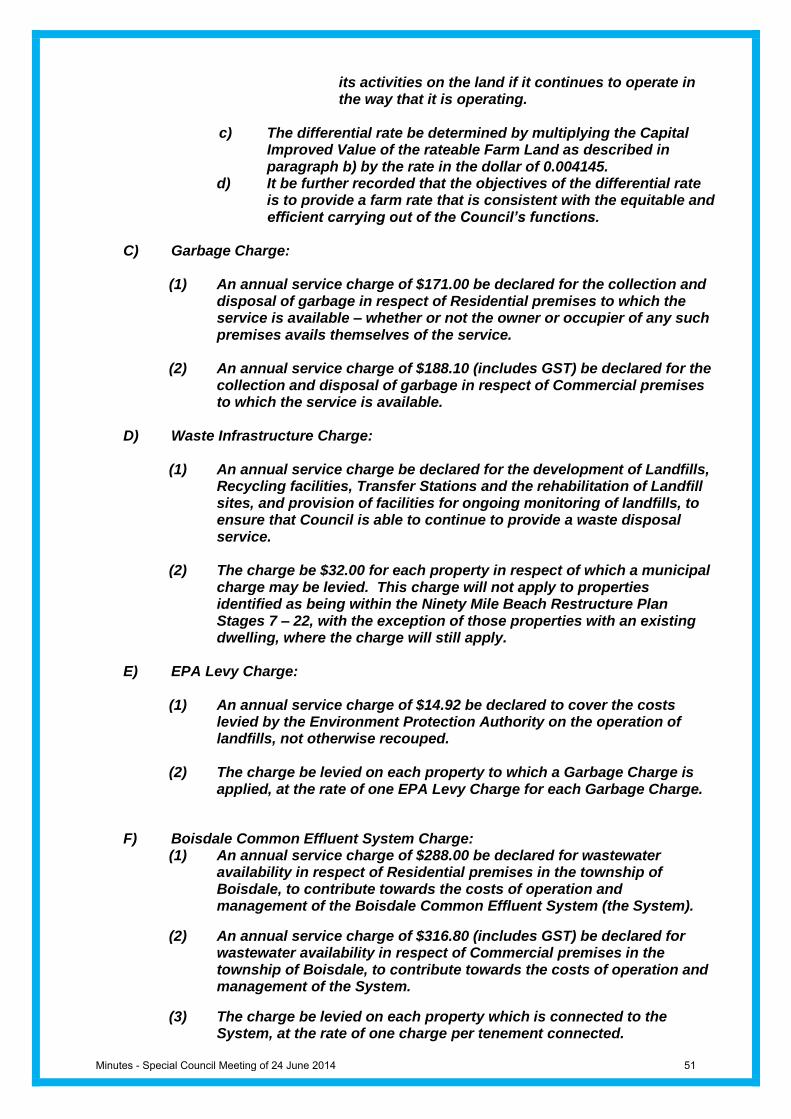
its activities on the land if it continues to operate in the way that it is operating.
c) The differential rate be determined by multiplying the Capital
Improved Value of the rateable Farm Land as described in paragraph b) by the rate in the dollar of 0.004145.
d) It be further recorded that the objectives of the differential rate is to provide a farm rate that is consistent with the equitable and efficient carrying out of the Council’s functions.
C) Garbage Charge:
(1) An annual service charge of $171.00 be declared for the collection and disposal of garbage in respect of Residential premises to which the service is available – whether or not the owner or occupier of any such premises avails themselves of the service.
(2) An annual service charge of $188.10 (includes GST) be declared for the
collection and disposal of garbage in respect of Commercial premises to which the service is available.
D) Waste Infrastructure Charge:
(1) An annual service charge be declared for the development of Landfills, Recycling facilities, Transfer Stations and the rehabilitation of Landfill sites, and provision of facilities for ongoing monitoring of landfills, to ensure that Council is able to continue to provide a waste disposal service.
(2) The charge be $32.00 for each property in respect of which a municipal
charge may be levied. This charge will not apply to properties identified as being within the Ninety Mile Beach Restructure Plan Stages 7 – 22, with the exception of those properties with an existing dwelling, where the charge will still apply.
E) EPA Levy Charge:
(1) An annual service charge of $14.92 be declared to cover the costs levied by the Environment Protection Authority on the operation of landfills, not otherwise recouped.
(2) The charge be levied on each property to which a Garbage Charge is
applied, at the rate of one EPA Levy Charge for each Garbage Charge.
F) Boisdale Common Effluent System Charge: (1) An annual service charge of $288.00 be declared for wastewater
availability in respect of Residential premises in the township of Boisdale, to contribute towards the costs of operation and management of the Boisdale Common Effluent System (the System).
(2) An annual service charge of $316.80 (includes GST) be declared for wastewater availability in respect of Commercial premises in the township of Boisdale, to contribute towards the costs of operation and management of the System.
(3) The charge be levied on each property which is connected to the System, at the rate of one charge per tenement connected.
Minutes - Special Council Meeting of 24 June 2014 51
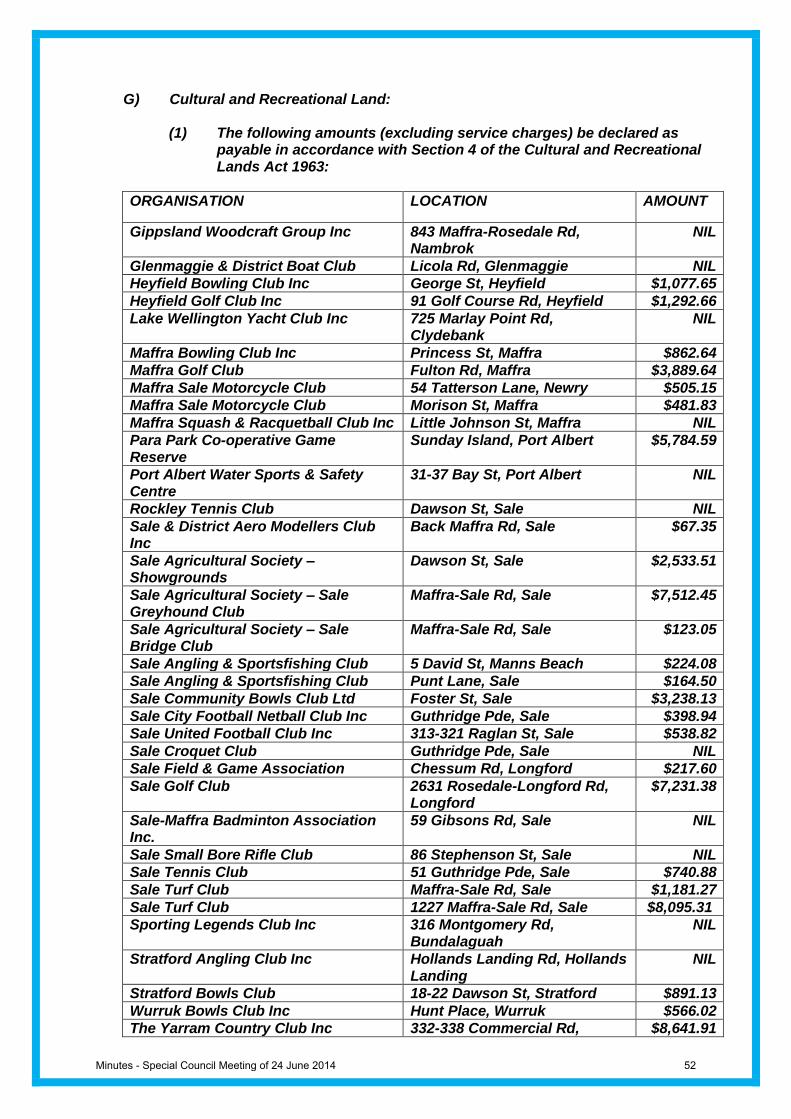
G) Cultural and Recreational Land:
(1) The following amounts (excluding service charges) be declared as payable in accordance with Section 4 of the Cultural and Recreational Lands Act 1963:
ORGANISATION LOCATION AMOUNT
Gippsland Woodcraft Group Inc 843 Maffra-Rosedale Rd, Nambrok
NIL
Glenmaggie & District Boat Club Licola Rd, Glenmaggie NIL
Heyfield Bowling Club Inc George St, Heyfield $1,077.65
Heyfield Golf Club Inc 91 Golf Course Rd, Heyfield $1,292.66
Lake Wellington Yacht Club Inc 725 Marlay Point Rd, Clydebank
NIL
Maffra Bowling Club Inc Princess St, Maffra $862.64
Maffra Golf Club Fulton Rd, Maffra $3,889.64
Maffra Sale Motorcycle Club 54 Tatterson Lane, Newry $505.15
Maffra Sale Motorcycle Club Morison St, Maffra $481.83
Maffra Squash & Racquetball Club Inc Little Johnson St, Maffra NIL
Para Park Co-operative Game Reserve
Sunday Island, Port Albert $5,784.59
Port Albert Water Sports & Safety Centre
31-37 Bay St, Port Albert NIL
Rockley Tennis Club Dawson St, Sale NIL
Sale & District Aero Modellers Club Inc
Back Maffra Rd, Sale $67.35
Sale Agricultural Society – Showgrounds
Dawson St, Sale $2,533.51
Sale Agricultural Society – Sale Greyhound Club
Maffra-Sale Rd, Sale $7,512.45
Sale Agricultural Society – Sale Bridge Club
Maffra-Sale Rd, Sale $123.05
Sale Angling & Sportsfishing Club 5 David St, Manns Beach $224.08
Sale Angling & Sportsfishing Club Punt Lane, Sale $164.50
Sale Community Bowls Club Ltd Foster St, Sale $3,238.13
Sale City Football Netball Club Inc Guthridge Pde, Sale $398.94
Sale United Football Club Inc 313-321 Raglan St, Sale $538.82
Sale Croquet Club Guthridge Pde, Sale NIL
Sale Field & Game Association Chessum Rd, Longford $217.60
Sale Golf Club 2631 Rosedale-Longford Rd, Longford
$7,231.38
Sale-Maffra Badminton Association Inc.
59 Gibsons Rd, Sale NIL
Sale Small Bore Rifle Club 86 Stephenson St, Sale NIL
Sale Tennis Club 51 Guthridge Pde, Sale $740.88
Sale Turf Club Maffra-Sale Rd, Sale $1,181.27
Sale Turf Club 1227 Maffra-Sale Rd, Sale $8,095.31
Sporting Legends Club Inc 316 Montgomery Rd, Bundalaguah
NIL
Stratford Angling Club Inc Hollands Landing Rd, Hollands Landing
NIL
Stratford Bowls Club 18-22 Dawson St, Stratford $891.13
Wurruk Bowls Club Inc Hunt Place, Wurruk $566.02
The Yarram Country Club Inc 332-338 Commercial Rd, $8,641.91
Minutes - Special Council Meeting of 24 June 2014 52
Yarram
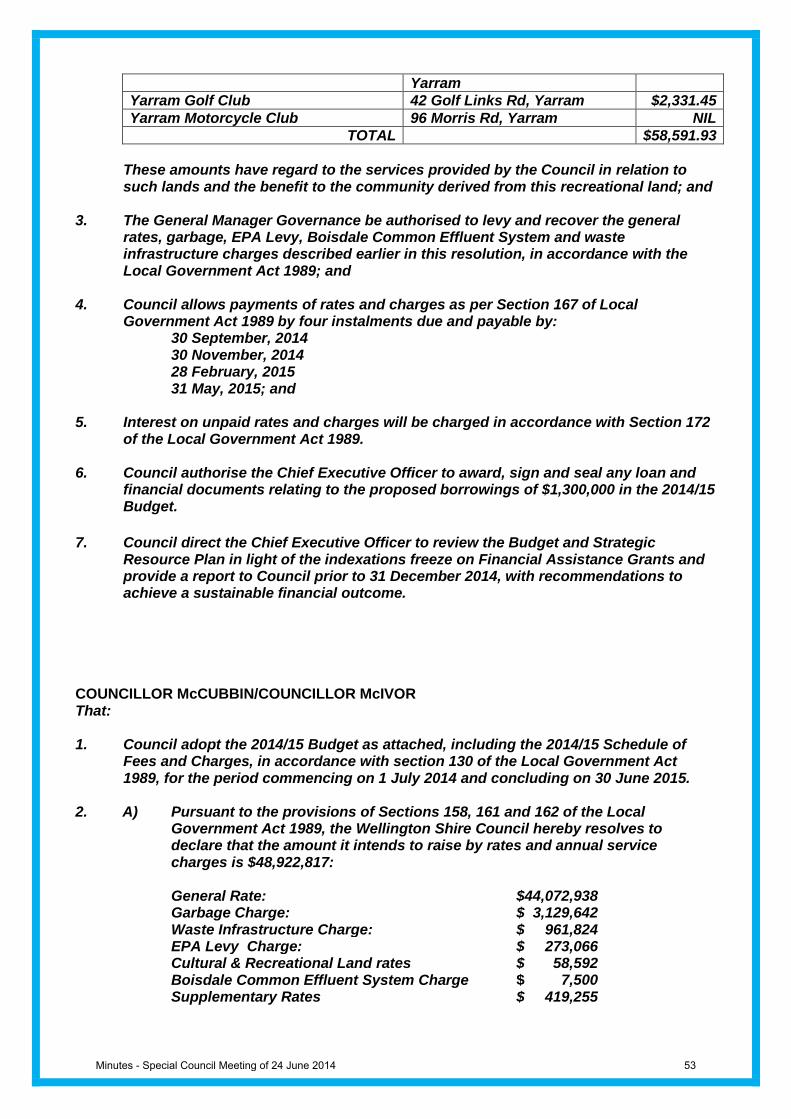
Yarram Golf Club 42 Golf Links Rd, Yarram $2,331.45
Yarram Motorcycle Club 96 Morris Rd, Yarram NIL
TOTAL $58,591.93
These amounts have regard to the services provided by the Council in relation to such lands and the benefit to the community derived from this recreational land; and
3. The General Manager Governance be authorised to levy and recover the general
rates, garbage, EPA Levy, Boisdale Common Effluent System and waste infrastructure charges described earlier in this resolution, in accordance with the Local Government Act 1989; and
4. Council allows payments of rates and charges as per Section 167 of Local
Government Act 1989 by four instalments due and payable by: 30 September, 2014
30 November, 2014 28 February, 2015 31 May, 2015; and 5. Interest on unpaid rates and charges will be charged in accordance with Section 172
of the Local Government Act 1989. 6. Council authorise the Chief Executive Officer to award, sign and seal any loan and
financial documents relating to the proposed borrowings of $1,300,000 in the 2014/15 Budget.
7. Council direct the Chief Executive Officer to review the Budget and Strategic Resource Plan in light of the indexations freeze on Financial Assistance Grants and provide a report to Council prior to 31 December 2014, with recommendations to achieve a sustainable financial outcome.
COUNCILLOR McCUBBIN/COUNCILLOR McIVOR That: 1. Council adopt the 2014/15 Budget as attached, including the 2014/15 Schedule of
Fees and Charges, in accordance with section 130 of the Local Government Act 1989, for the period commencing on 1 July 2014 and concluding on 30 June 2015.
2. A) Pursuant to the provisions of Sections 158, 161 and 162 of the Local
Government Act 1989, the Wellington Shire Council hereby resolves to declare that the amount it intends to raise by rates and annual service charges is $48,922,817:
General Rate: $44,072,938 Garbage Charge: $ 3,129,642 Waste Infrastructure Charge: $ 961,824 EPA Levy Charge: $ 273,066 Cultural & Recreational Land rates $ 58,592 Boisdale Common Effluent System Charge $ 7,500 Supplementary Rates $ 419,255
Minutes - Special Council Meeting of 24 June 2014 53
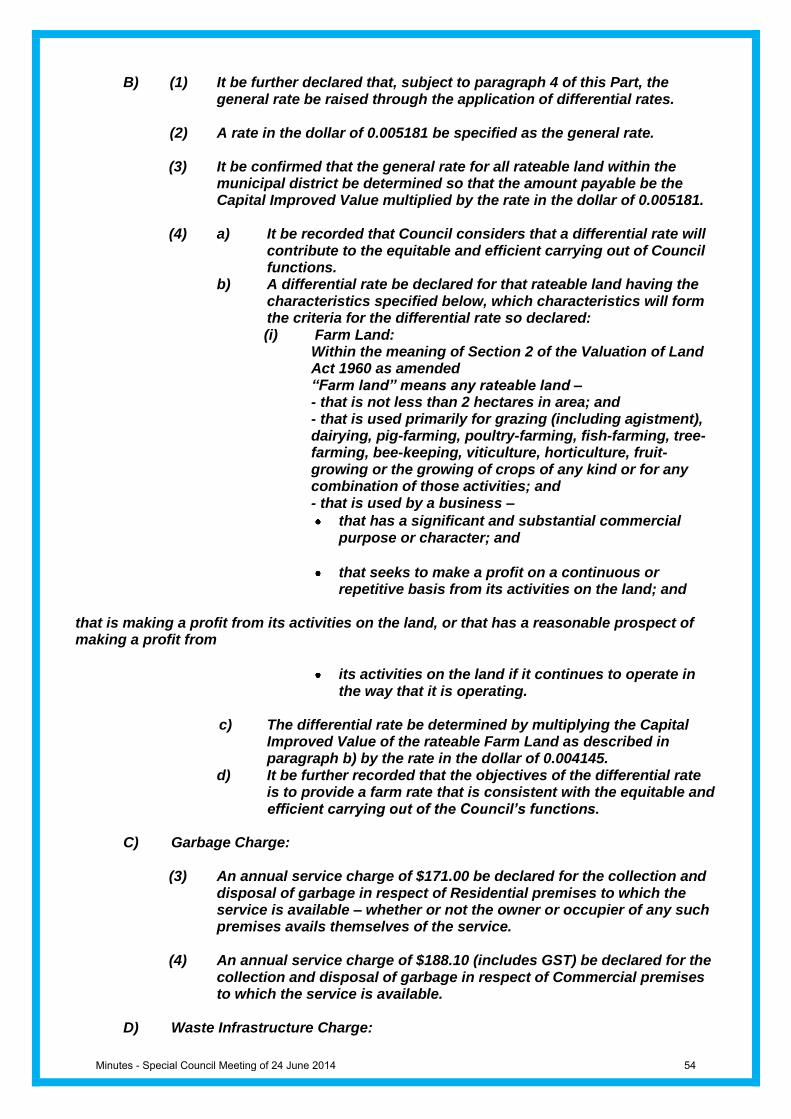
B) (1) It be further declared that, subject to paragraph 4 of this Part, the general rate be raised through the application of differential rates.
(2) A rate in the dollar of 0.005181 be specified as the general rate. (3) It be confirmed that the general rate for all rateable land within the
municipal district be determined so that the amount payable be the Capital Improved Value multiplied by the rate in the dollar of 0.005181.
(4) a) It be recorded that Council considers that a differential rate will
contribute to the equitable and efficient carrying out of Council functions.
b) A differential rate be declared for that rateable land having the characteristics specified below, which characteristics will form the criteria for the differential rate so declared: (i) Farm Land:
Within the meaning of Section 2 of the Valuation of Land Act 1960 as amended “Farm land” means any rateable land – - that is not less than 2 hectares in area; and - that is used primarily for grazing (including agistment), dairying, pig-farming, poultry-farming, fish-farming, tree-farming, bee-keeping, viticulture, horticulture, fruit-growing or the growing of crops of any kind or for any combination of those activities; and - that is used by a business –
that has a significant and substantial commercial purpose or character; and
that seeks to make a profit on a continuous or repetitive basis from its activities on the land; and
that is making a profit from its activities on the land, or that has a reasonable prospect of making a profit from
its activities on the land if it continues to operate in the way that it is operating.
c) The differential rate be determined by multiplying the Capital
Improved Value of the rateable Farm Land as described in paragraph b) by the rate in the dollar of 0.004145.
d) It be further recorded that the objectives of the differential rate is to provide a farm rate that is consistent with the equitable and efficient carrying out of the Council’s functions.
C) Garbage Charge:
(3) An annual service charge of $171.00 be declared for the collection and disposal of garbage in respect of Residential premises to which the service is available – whether or not the owner or occupier of any such premises avails themselves of the service.
(4) An annual service charge of $188.10 (includes GST) be declared for the
collection and disposal of garbage in respect of Commercial premises to which the service is available.
D) Waste Infrastructure Charge:
Minutes - Special Council Meeting of 24 June 2014 54
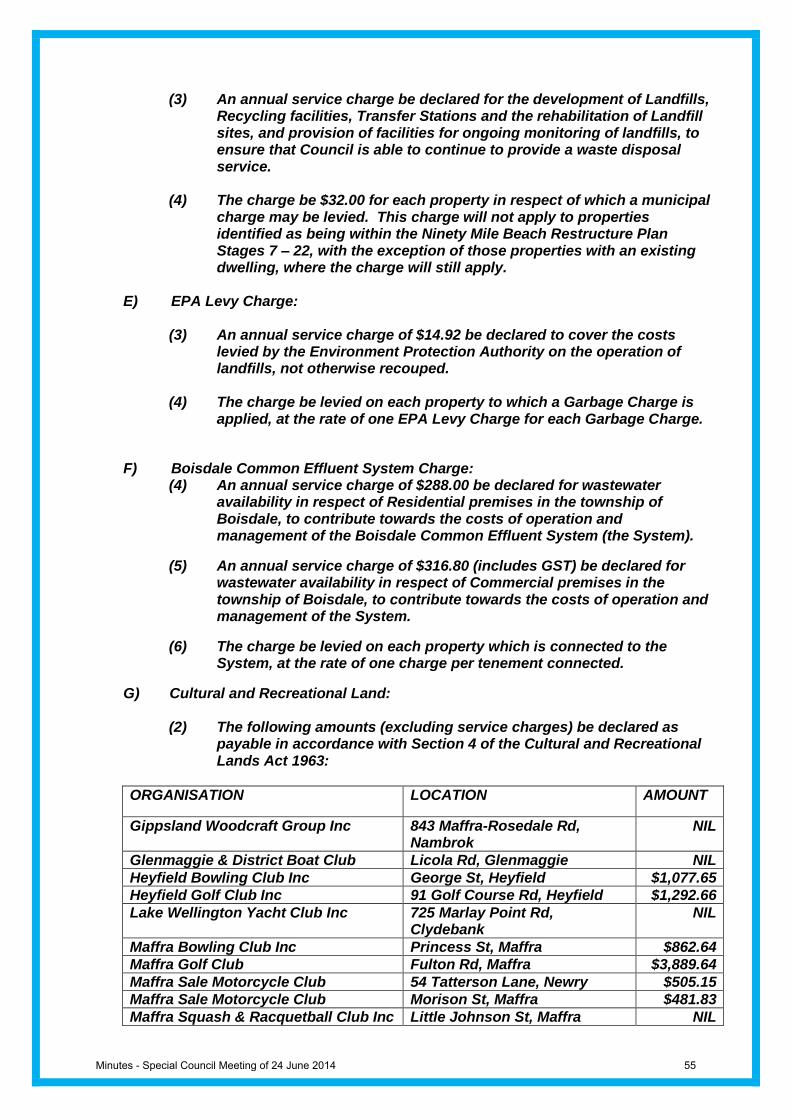
(3) An annual service charge be declared for the development of Landfills,
Recycling facilities, Transfer Stations and the rehabilitation of Landfill sites, and provision of facilities for ongoing monitoring of landfills, to ensure that Council is able to continue to provide a waste disposal service.
(4) The charge be $32.00 for each property in respect of which a municipal
charge may be levied. This charge will not apply to properties identified as being within the Ninety Mile Beach Restructure Plan Stages 7 – 22, with the exception of those properties with an existing dwelling, where the charge will still apply.
E) EPA Levy Charge:
(3) An annual service charge of $14.92 be declared to cover the costs levied by the Environment Protection Authority on the operation of landfills, not otherwise recouped.
(4) The charge be levied on each property to which a Garbage Charge is
applied, at the rate of one EPA Levy Charge for each Garbage Charge.
F) Boisdale Common Effluent System Charge: (4) An annual service charge of $288.00 be declared for wastewater
availability in respect of Residential premises in the township of Boisdale, to contribute towards the costs of operation and management of the Boisdale Common Effluent System (the System).
(5) An annual service charge of $316.80 (includes GST) be declared for wastewater availability in respect of Commercial premises in the township of Boisdale, to contribute towards the costs of operation and management of the System.
(6) The charge be levied on each property which is connected to the System, at the rate of one charge per tenement connected.
G) Cultural and Recreational Land:
(2) The following amounts (excluding service charges) be declared as payable in accordance with Section 4 of the Cultural and Recreational Lands Act 1963:
ORGANISATION LOCATION AMOUNT
Gippsland Woodcraft Group Inc 843 Maffra-Rosedale Rd, Nambrok
NIL
Glenmaggie & District Boat Club Licola Rd, Glenmaggie NIL
Heyfield Bowling Club Inc George St, Heyfield $1,077.65
Heyfield Golf Club Inc 91 Golf Course Rd, Heyfield $1,292.66
Lake Wellington Yacht Club Inc 725 Marlay Point Rd, Clydebank
NIL
Maffra Bowling Club Inc Princess St, Maffra $862.64
Maffra Golf Club Fulton Rd, Maffra $3,889.64
Maffra Sale Motorcycle Club 54 Tatterson Lane, Newry $505.15
Maffra Sale Motorcycle Club Morison St, Maffra $481.83
Maffra Squash & Racquetball Club Inc Little Johnson St, Maffra NIL
Minutes - Special Council Meeting of 24 June 2014 55
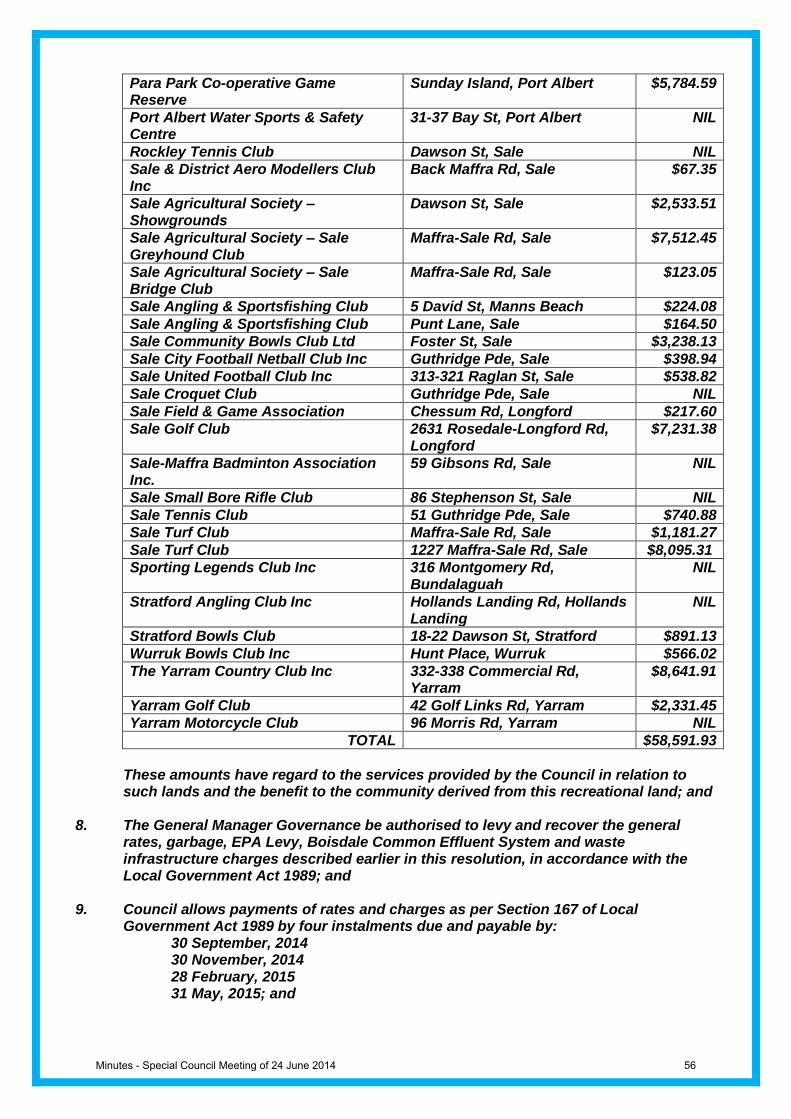
Para Park Co-operative Game Reserve
Sunday Island, Port Albert $5,784.59
Port Albert Water Sports & Safety Centre
31-37 Bay St, Port Albert NIL
Rockley Tennis Club Dawson St, Sale NIL
Sale & District Aero Modellers Club Inc
Back Maffra Rd, Sale $67.35
Sale Agricultural Society – Showgrounds
Dawson St, Sale $2,533.51
Sale Agricultural Society – Sale Greyhound Club
Maffra-Sale Rd, Sale $7,512.45
Sale Agricultural Society – Sale Bridge Club
Maffra-Sale Rd, Sale $123.05
Sale Angling & Sportsfishing Club 5 David St, Manns Beach $224.08
Sale Angling & Sportsfishing Club Punt Lane, Sale $164.50
Sale Community Bowls Club Ltd Foster St, Sale $3,238.13
Sale City Football Netball Club Inc Guthridge Pde, Sale $398.94
Sale United Football Club Inc 313-321 Raglan St, Sale $538.82
Sale Croquet Club Guthridge Pde, Sale NIL
Sale Field & Game Association Chessum Rd, Longford $217.60
Sale Golf Club 2631 Rosedale-Longford Rd, Longford
$7,231.38
Sale-Maffra Badminton Association Inc.
59 Gibsons Rd, Sale NIL
Sale Small Bore Rifle Club 86 Stephenson St, Sale NIL
Sale Tennis Club 51 Guthridge Pde, Sale $740.88
Sale Turf Club Maffra-Sale Rd, Sale $1,181.27
Sale Turf Club 1227 Maffra-Sale Rd, Sale $8,095.31
Sporting Legends Club Inc 316 Montgomery Rd, Bundalaguah
NIL
Stratford Angling Club Inc Hollands Landing Rd, Hollands Landing
NIL
Stratford Bowls Club 18-22 Dawson St, Stratford $891.13
Wurruk Bowls Club Inc Hunt Place, Wurruk $566.02
The Yarram Country Club Inc 332-338 Commercial Rd, Yarram
$8,641.91
Yarram Golf Club 42 Golf Links Rd, Yarram $2,331.45
Yarram Motorcycle Club 96 Morris Rd, Yarram NIL
TOTAL $58,591.93
These amounts have regard to the services provided by the Council in relation to such lands and the benefit to the community derived from this recreational land; and
8. The General Manager Governance be authorised to levy and recover the general
rates, garbage, EPA Levy, Boisdale Common Effluent System and waste infrastructure charges described earlier in this resolution, in accordance with the Local Government Act 1989; and
9. Council allows payments of rates and charges as per Section 167 of Local
Government Act 1989 by four instalments due and payable by: 30 September, 2014
30 November, 2014 28 February, 2015 31 May, 2015; and
Minutes - Special Council Meeting of 24 June 2014 56
10. Interest on unpaid rates and charges will be charged in accordance with Section 172 of the Local Government Act 1989.
11. Council authorise the Chief Executive Officer to award, sign and seal any loan and
financial documents relating to the proposed borrowings of $1,300,000 in the 2014/15 Budget.
12. Council direct the Chief Executive Officer to review the Budget and Strategic Resource Plan in light of the indexations freeze on Financial Assistance Grants and provide a report to Council prior to 31 December 2014, with recommendations to achieve a sustainable financial outcome.
CARRIED Meeting declared closed at 6.21pm.
Minutes - Special Council Meeting of 24 June 2014 57
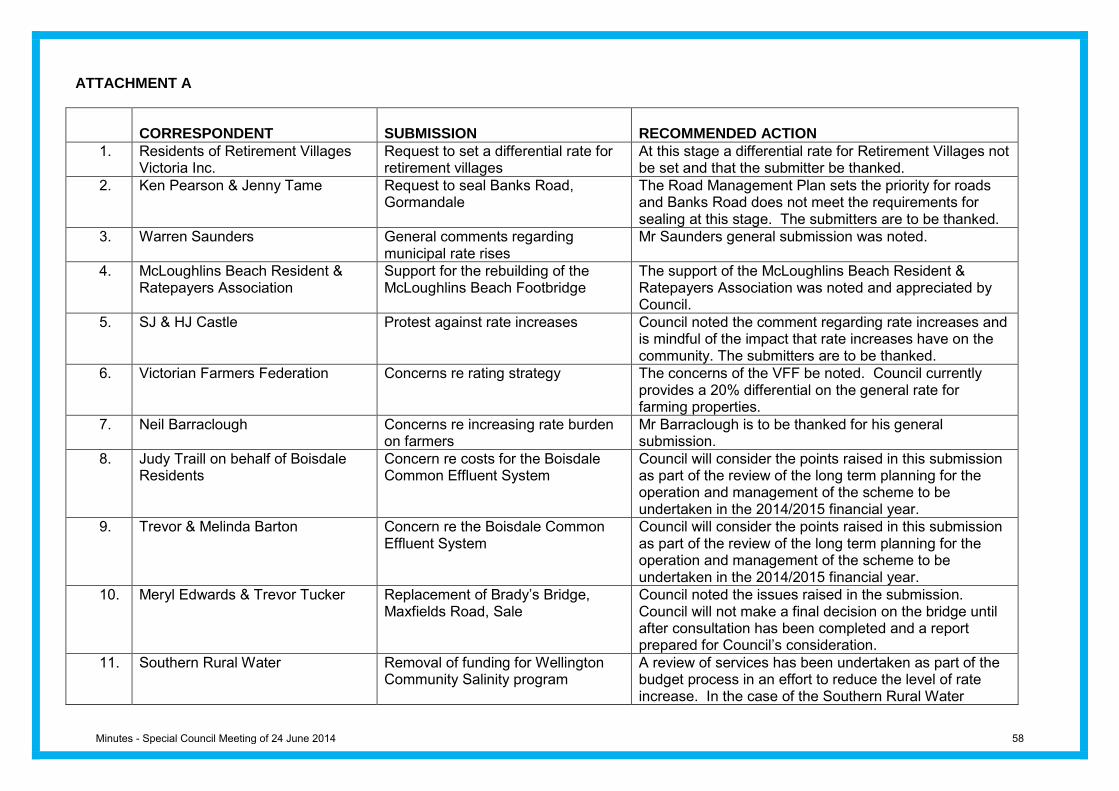
ATTACHMENT A
CORRESPONDENT
SUBMISSION
RECOMMENDED ACTION
1. Residents of Retirement Villages Victoria Inc.
Request to set a differential rate for retirement villages
At this stage a differential rate for Retirement Villages not be set and that the submitter be thanked.
2. Ken Pearson & Jenny Tame Request to seal Banks Road, Gormandale
The Road Management Plan sets the priority for roads and Banks Road does not meet the requirements for sealing at this stage. The submitters are to be thanked.
3. Warren Saunders General comments regarding municipal rate rises
Mr Saunders general submission was noted.
4. McLoughlins Beach Resident & Ratepayers Association
Support for the rebuilding of the McLoughlins Beach Footbridge
The support of the McLoughlins Beach Resident & Ratepayers Association was noted and appreciated by Council.
5. SJ & HJ Castle Protest against rate increases Council noted the comment regarding rate increases and is mindful of the impact that rate increases have on the community. The submitters are to be thanked.
6. Victorian Farmers Federation Concerns re rating strategy The concerns of the VFF be noted. Council currently provides a 20% differential on the general rate for farming properties.
7. Neil Barraclough Concerns re increasing rate burden on farmers
Mr Barraclough is to be thanked for his general submission.
8. Judy Traill on behalf of Boisdale Residents
Concern re costs for the Boisdale Common Effluent System
Council will consider the points raised in this submission as part of the review of the long term planning for the operation and management of the scheme to be undertaken in the 2014/2015 financial year.
9. Trevor & Melinda Barton Concern re the Boisdale Common Effluent System
Council will consider the points raised in this submission as part of the review of the long term planning for the operation and management of the scheme to be undertaken in the 2014/2015 financial year.
10. Meryl Edwards & Trevor Tucker Replacement of Brady’s Bridge, Maxfields Road, Sale
Council noted the issues raised in the submission. Council will not make a final decision on the bridge until after consultation has been completed and a report prepared for Council’s consideration.
11. Southern Rural Water Removal of funding for Wellington Community Salinity program
A review of services has been undertaken as part of the budget process in an effort to reduce the level of rate increase. In the case of the Southern Rural Water
Minutes - Special Council Meeting of 24 June 2014 58

CORRESPONDENT
SUBMISSION
RECOMMENDED ACTION
Salinity Management Program Council’s contribution was on a voluntary basis, and as such Council will not be contributing to the program in 2014/15.
12. Gippsland Plains Rail Trail CoM Request for maintenance funding on the Gippsland Plains Rail Trail within Wellington Shire
Council will request further information from the Rail Trail CoM in relation to the cost of maintaining the trail. At this stage there will not be any additional allocation made in the 2014/15 budget.
13. Sale Neighbourhood House Inc. Request for Council assistance to seal front and rear car parks
Council considered the request, but at this stage are unable to accommodate it in the 2014/15 budget.
Minutes - Special Council Meeting of 24 June 2014 59
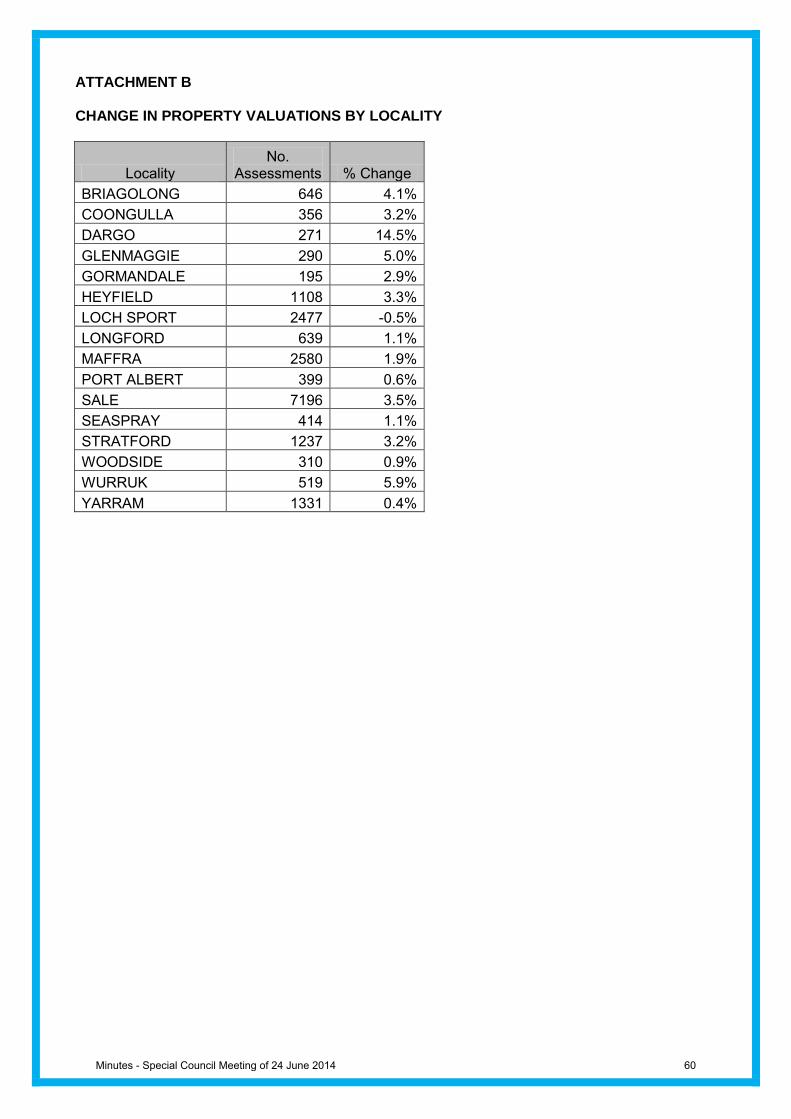
ATTACHMENT B CHANGE IN PROPERTY VALUATIONS BY LOCALITY
Locality No.
Assessments % Change
BRIAGOLONG 646 4.1%
COONGULLA 356 3.2%
DARGO 271 14.5%
GLENMAGGIE 290 5.0%
GORMANDALE 195 2.9%
HEYFIELD 1108 3.3%
LOCH SPORT 2477 -0.5%
LONGFORD 639 1.1%
MAFFRA 2580 1.9%
PORT ALBERT 399 0.6%
SALE 7196 3.5%
SEASPRAY 414 1.1%
STRATFORD 1237 3.2%
WOODSIDE 310 0.9%
WURRUK 519 5.9%
YARRAM 1331 0.4%
Minutes - Special Council Meeting of 24 June 2014 60
WELLINGTON SHIRE COUNCIL
2014/15 Budget
24 June 2014
This Budget document has been prepared with reference to The Institute of Chartered
Accountants “Victorian City Council Model Budget 2014/2015” a best practice guide for
reporting local government budgets in Victoria.
Minutes - Special Council Meeting of 24 June 2014 61
2014/15 Budget - Wellington Shire Council
Contents Page
Mayor’s introduction 3
1. Chief Executive Officer’s summary 4
2. Budget overview 9
3. Activities, initiatives and key strategic activities 13
Budget analysis
4. Analysis of operating budget 27
5. Analysis of budgeted cash position 35
6. Analysis of capital budget 38
7. Analysis of budgeted financial position 44
Long term strategies
8. Strategic resource plan and key financial indicators 47
9. Rating information 52
10. Borrowing strategy 56
11. Infrastructure information 58
Appendices
A Budgeted statements 63
B Rates and Charges 70
C Capital works program 73
D Schedule of Fees & Charges 80
2Minutes - Special Council Meeting of 24 June 2014 62
2014/15 Budget - Wellington Shire Council
Mayor’s introduction
Following many months of considered deliberations and debate Wellington Shire Council is proud to
present the 2014/15 Budget.
As with all Councils, we find that we must continually do more, with less. This year, we have continued in
our efforts to deliver residents, ratepayers and others with a stake in Wellington’s future, with a budget
which has sound foundations in financial discipline.
Since advertising the Draft 2014/15 Budget, advice has been received from the Victoria Grants Commission
of Council’s indicative allocation for 2014/15 Financial Assistance Grants. When the 2014/15 Federal
budget was announced, it was revealed that indexation of these grants would be ‘paused’ for three years.
Council had included in the Draft Budget an assumption that indexation of 3% would be applied, and this
announcement has resulted in a shortfall in funding of $420,000 for 2014/15. The cumulative effect of
‘freezing’ the grant at 2013/14 levels over the four years of the Strategic Resource Plan is a loss of
approximately $3.6 million in revenue. Council receives more than 15% of its total revenue through this
funding stream, and will, during the coming year, be reviewing all areas of Council operations in an effort to
cover this significant loss of income.
Recognising that our financial and human resources are limited, the scheduling of works to meet the
community’s expectations is one where we aim to strike a balance between desire and necessity.
In the 2014/15 Budget we have identified a series of works to improve community liveability and access to
services. These works include:
$2.5 million on the commencement of the Port of Sale Cultural Hub & Desailly Street Corporate
Headquarters projects
$1.35 million on the redevelopment of Heyfield Gordon Street Recreation Reserve Clubroom
$2.0 million on the completion of the Yarram Recreation Reserve Clubroom project
$750,000 on the renewal of McLoughlins Beach Footbridge
$645,000 on the annual footpaths and shared paths program
$550,000 on the widening of Rosedale Flynns Creek Road & Rail Crossing Approach Improvements
$250,000 for the redevelopment of Heyfield George Street parking
$100,000 for renewal of Stratford Memorial Park
$40,000 for replacement of the Queen Street Kindergarten roof
We will deliver a broad range of services including our annual immunisation program, library loans, animal
registrations, development of planning schemes, construction of walking paths and trails, inspections of
food premises and septic systems.
Our natural environment will benefit through a number of open space projects which will make a significant
contribution to the liveability of our local community. Included in the budget are $3.77 million for open space
projects including $2.53 million on streetscapes, $803,000 on parks and reserves, $260,000 on
playgrounds,$105,000 on foreshore redevelopment, $35,000 for theme planting of major trees and $45,000
for urban furniture renewal.
An increase in general rate income of only 3.8% is proposed in order that we achieve these objectives.
This year the Wellington Shire Council has made provision for $1.3 million in borrowings to support the
upgrade of the Princes Highway and Cobains Road Intersection which has been deferred from 2013/14.
Over the course of the year net borrowings will decrease by $1.6 million to a total of $14.4 million, which
remains well within the State Government prudential limits.
I commend the 2014/15 Budget to you as one I believe has the capacity to make tangible improvements to
our Shire through the delivery of this year's annual program.
Cr Scott Rossetti
Mayor
3Minutes - Special Council Meeting of 24 June 2014 63
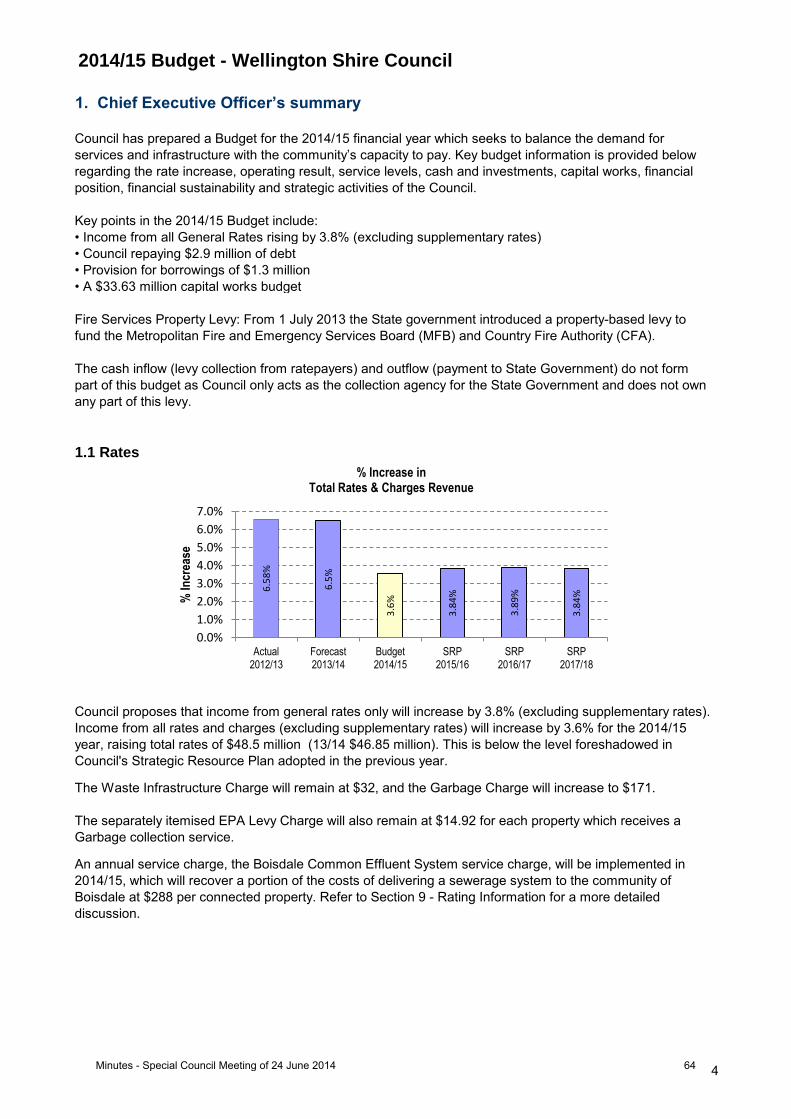
2014/15 Budget - Wellington Shire Council
1. Chief Executive Officer’s summary
Council has prepared a Budget for the 2014/15 financial year which seeks to balance the demand for
services and infrastructure with the community’s capacity to pay. Key budget information is provided below
regarding the rate increase, operating result, service levels, cash and investments, capital works, financial
position, financial sustainability and strategic activities of the Council.
Key points in the 2014/15 Budget include:
• Income from all General Rates rising by 3.8% (excluding supplementary rates)
• Council repaying $2.9 million of debt
• Provision for borrowings of $1.3 million
• A $33.63 million capital works budget
Fire Services Property Levy: From 1 July 2013 the State government introduced a property-based levy to
fund the Metropolitan Fire and Emergency Services Board (MFB) and Country Fire Authority (CFA).
The cash inflow (levy collection from ratepayers) and outflow (payment to State Government) do not form
part of this budget as Council only acts as the collection agency for the State Government and does not own
any part of this levy.
1.1 Rates
Council proposes that income from general rates only will increase by 3.8% (excluding supplementary rates).
Income from all rates and charges (excluding supplementary rates) will increase by 3.6% for the 2014/15
year, raising total rates of $48.5 million (13/14 $46.85 million). This is below the level foreshadowed in
Council's Strategic Resource Plan adopted in the previous year.
The Waste Infrastructure Charge will remain at $32, and the Garbage Charge will increase to $171.
The separately itemised EPA Levy Charge will also remain at $14.92 for each property which receives a
Garbage collection service.
An annual service charge, the Boisdale Common Effluent System service charge, will be implemented in
2014/15, which will recover a portion of the costs of delivering a sewerage system to the community of
Boisdale at $288 per connected property. Refer to Section 9 - Rating Information for a more detailed
discussion.
6.5
8%
6.5
%
3.6
%
3.8
4%
3.8
9%
3.8
4%
0.0%
1.0%
2.0%
3.0%
4.0%
5.0%
6.0%
7.0%
Actual 2012/13
Forecast 2013/14
Budget 2014/15
SRP 2015/16
SRP 2016/17
SRP 2017/18
% In
crea
se
% Increase in Total Rates & Charges Revenue
4Minutes - Special Council Meeting of 24 June 2014 64
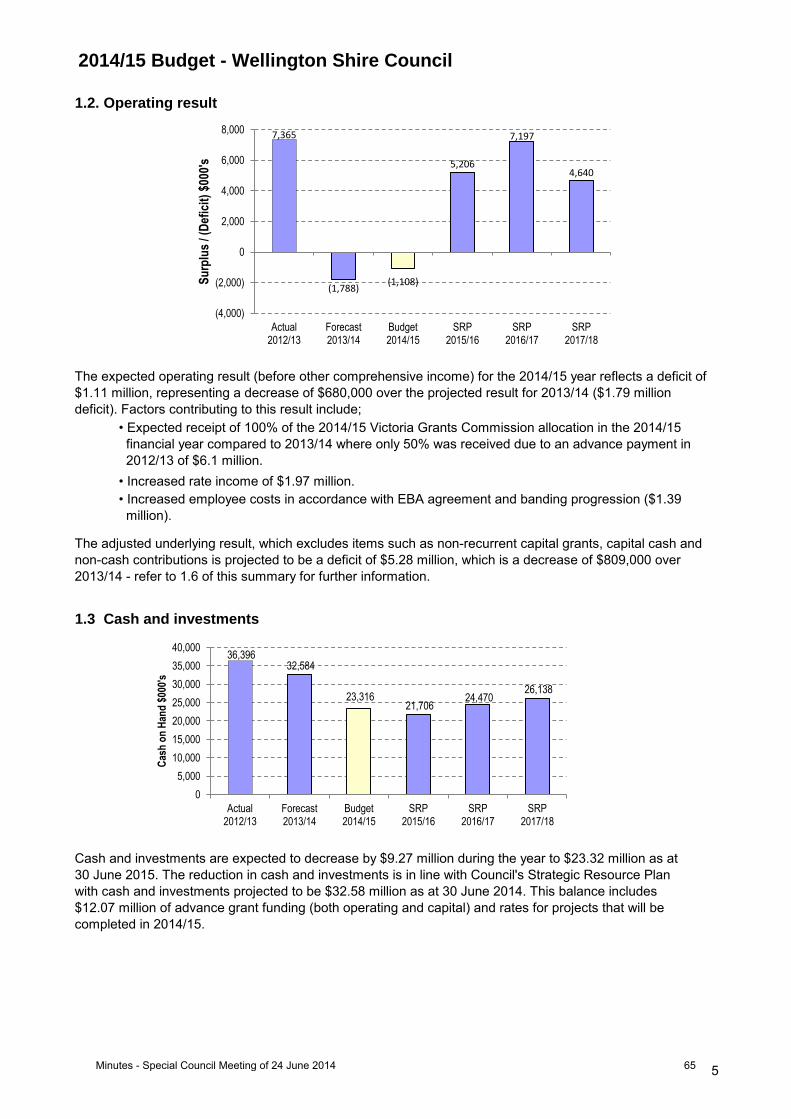
2014/15 Budget - Wellington Shire Council
1.2. Operating result
The expected operating result (before other comprehensive income) for the 2014/15 year reflects a deficit of
$1.11 million, representing a decrease of $680,000 over the projected result for 2013/14 ($1.79 million
deficit). Factors contributing to this result include;
• Expected receipt of 100% of the 2014/15 Victoria Grants Commission allocation in the 2014/15
financial year compared to 2013/14 where only 50% was received due to an advance payment in
2012/13 of $6.1 million.
• Increased rate income of $1.97 million.
• Increased employee costs in accordance with EBA agreement and banding progression ($1.39
million).
The adjusted underlying result, which excludes items such as non-recurrent capital grants, capital cash and
non-cash contributions is projected to be a deficit of $5.28 million, which is a decrease of $809,000 over
2013/14 - refer to 1.6 of this summary for further information.
1.3 Cash and investments
Cash and investments are expected to decrease by $9.27 million during the year to $23.32 million as at
30 June 2015. The reduction in cash and investments is in line with Council's Strategic Resource Plan
with cash and investments projected to be $32.58 million as at 30 June 2014. This balance includes
$12.07 million of advance grant funding (both operating and capital) and rates for projects that will be
completed in 2014/15.
7,365
(1,788) (1,108)
5,206
7,197
4,640
(4,000)
(2,000)
0
2,000
4,000
6,000
8,000
Actual 2012/13
Forecast 2013/14
Budget 2014/15
SRP 2015/16
SRP 2016/17
SRP 2017/18
Su
rplu
s / (
Def
icit
) $0
00's
36,396 32,584
23,316 21,706
24,470 26,138
0
5,000
10,000
15,000
20,000
25,000
30,000
35,000
40,000
Actual 2012/13
Forecast 2013/14
Budget 2014/15
SRP 2015/16
SRP 2016/17
SRP 2017/18
Cas
h o
n H
and
$00
0's
5Minutes - Special Council Meeting of 24 June 2014 65
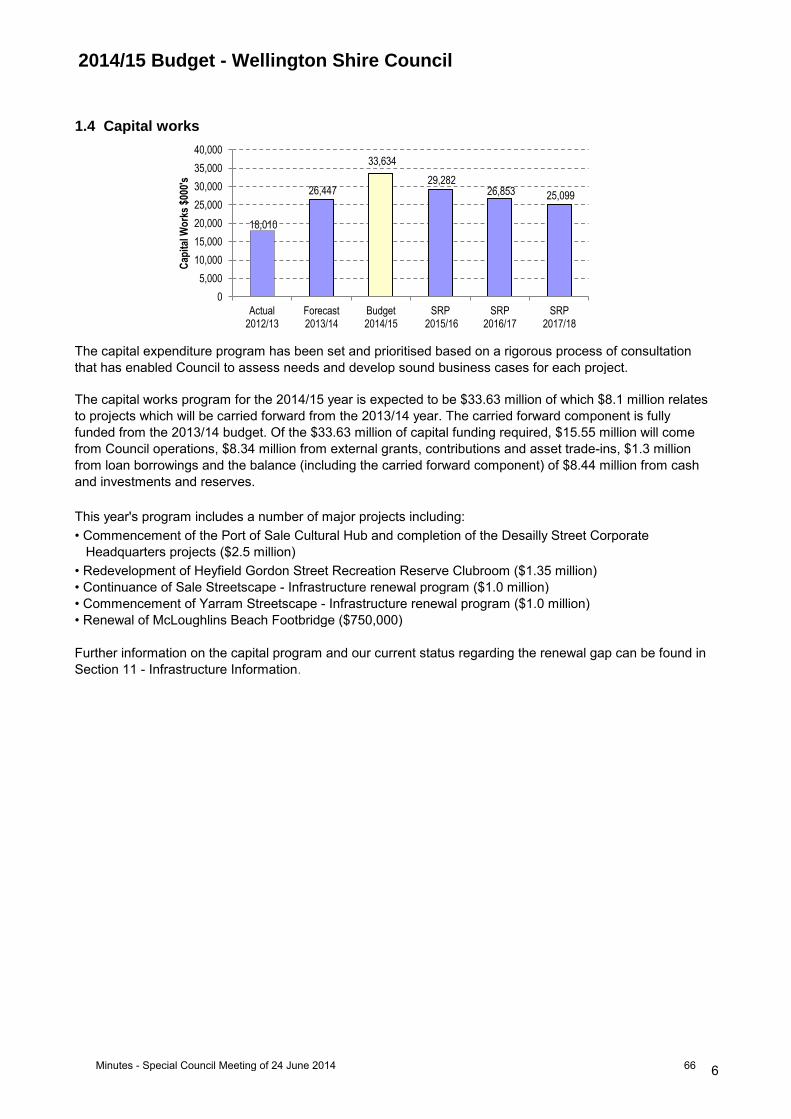
2014/15 Budget - Wellington Shire Council
1.4 Capital works
The capital expenditure program has been set and prioritised based on a rigorous process of consultation
that has enabled Council to assess needs and develop sound business cases for each project.
The capital works program for the 2014/15 year is expected to be $33.63 million of which $8.1 million relates
to projects which will be carried forward from the 2013/14 year. The carried forward component is fully
funded from the 2013/14 budget. Of the $33.63 million of capital funding required, $15.55 million will come
from Council operations, $8.34 million from external grants, contributions and asset trade-ins, $1.3 million
from loan borrowings and the balance (including the carried forward component) of $8.44 million from cash
and investments and reserves.
This year's program includes a number of major projects including:
• Commencement of the Port of Sale Cultural Hub and completion of the Desailly Street Corporate
Headquarters projects ($2.5 million)
• Redevelopment of Heyfield Gordon Street Recreation Reserve Clubroom ($1.35 million)
• Continuance of Sale Streetscape - Infrastructure renewal program ($1.0 million)
• Commencement of Yarram Streetscape - Infrastructure renewal program ($1.0 million)
• Renewal of McLoughlins Beach Footbridge ($750,000)
Further information on the capital program and our current status regarding the renewal gap can be found in
Section 11 - Infrastructure Information.
18,010
26,447
33,634
29,282 26,853 25,099
0
5,000
10,000
15,000
20,000
25,000
30,000
35,000
40,000
Actual 2012/13
Forecast 2013/14
Budget 2014/15
SRP 2015/16
SRP 2016/17
SRP 2017/18
Cap
ital
Wo
rks
$000
's
6Minutes - Special Council Meeting of 24 June 2014 66
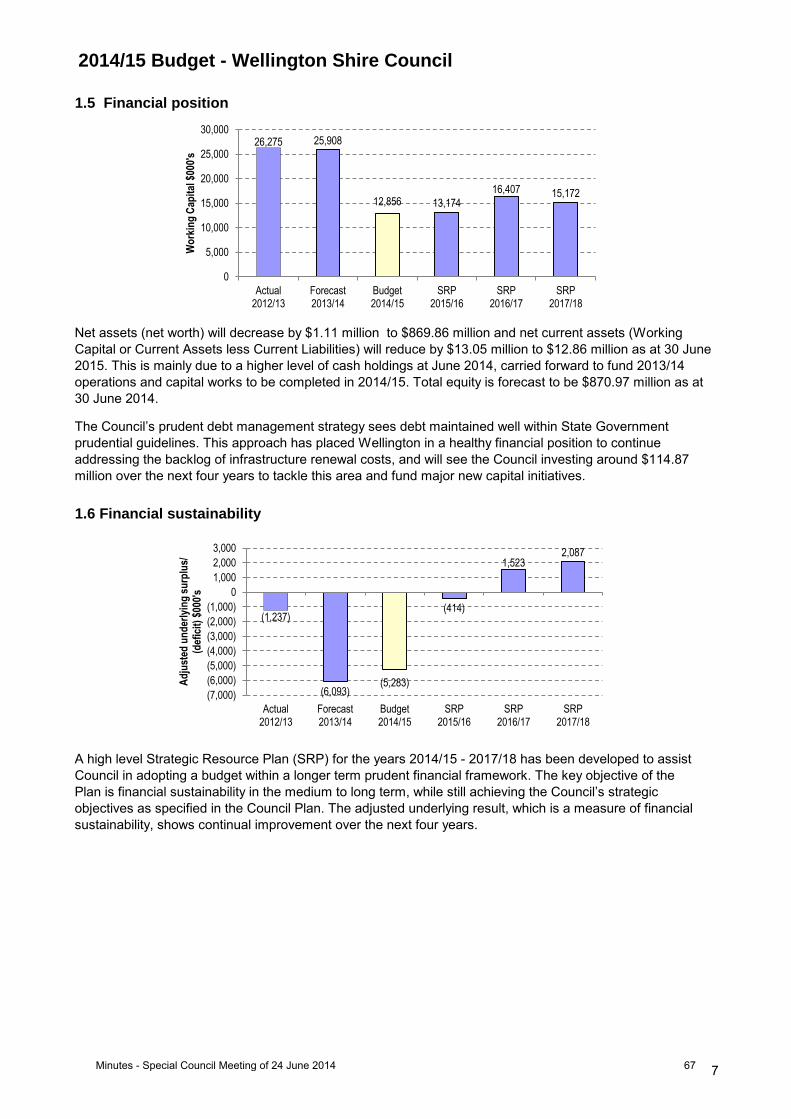
2014/15 Budget - Wellington Shire Council
1.5 Financial position
Net assets (net worth) will decrease by $1.11 million to $869.86 million and net current assets (Working
Capital or Current Assets less Current Liabilities) will reduce by $13.05 million to $12.86 million as at 30 June
2015. This is mainly due to a higher level of cash holdings at June 2014, carried forward to fund 2013/14
operations and capital works to be completed in 2014/15. Total equity is forecast to be $870.97 million as at
30 June 2014.
The Council’s prudent debt management strategy sees debt maintained well within State Government
prudential guidelines. This approach has placed Wellington in a healthy financial position to continue
addressing the backlog of infrastructure renewal costs, and will see the Council investing around $114.87
million over the next four years to tackle this area and fund major new capital initiatives.
1.6 Financial sustainability
A high level Strategic Resource Plan (SRP) for the years 2014/15 - 2017/18 has been developed to assist
Council in adopting a budget within a longer term prudent financial framework. The key objective of the
Plan is financial sustainability in the medium to long term, while still achieving the Council’s strategic
objectives as specified in the Council Plan. The adjusted underlying result, which is a measure of financial
sustainability, shows continual improvement over the next four years.
26,275 25,908
12,856 13,174
16,407 15,172
0
5,000
10,000
15,000
20,000
25,000
30,000
Actual 2012/13
Forecast 2013/14
Budget 2014/15
SRP 2015/16
SRP 2016/17
SRP 2017/18
Wo
rkin
g C
apit
al $
000'
s
(1,237)
(6,093) (5,283)
(414)
1,523 2,087
(7,000)
(6,000)
(5,000)
(4,000)
(3,000)
(2,000)
(1,000)
0
1,000
2,000
3,000
Actual 2012/13
Forecast 2013/14
Budget 2014/15
SRP 2015/16
SRP 2016/17
SRP 2017/18
Ad
just
ed u
nd
erly
ing
su
rplu
s/
(def
icit
) $0
00's
7Minutes - Special Council Meeting of 24 June 2014 67
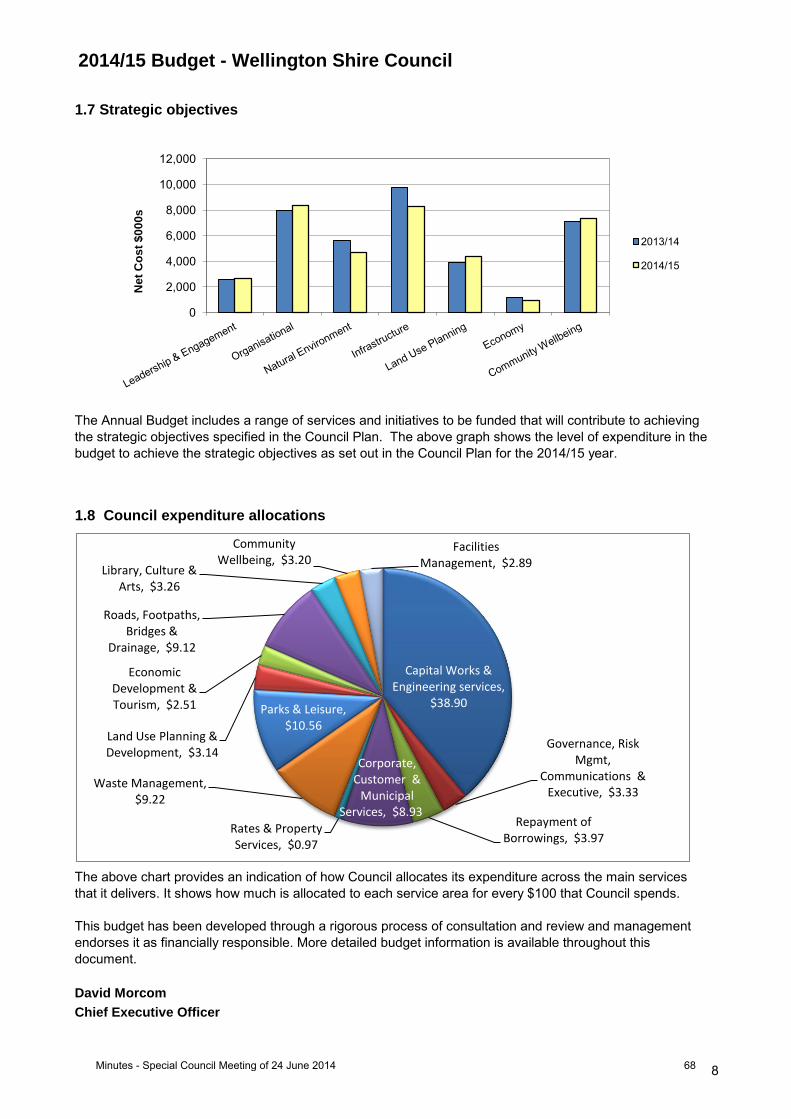
2014/15 Budget - Wellington Shire Council
1.7 Strategic objectives
The Annual Budget includes a range of services and initiatives to be funded that will contribute to achieving
the strategic objectives specified in the Council Plan. The above graph shows the level of expenditure in the
budget to achieve the strategic objectives as set out in the Council Plan for the 2014/15 year.
1.8 Council expenditure allocations
The above chart provides an indication of how Council allocates its expenditure across the main services
that it delivers. It shows how much is allocated to each service area for every $100 that Council spends.
This budget has been developed through a rigorous process of consultation and review and management
endorses it as financially responsible. More detailed budget information is available throughout this
document.
David Morcom
Chief Executive Officer
0
2,000
4,000
6,000
8,000
10,000
12,000
Ne
t C
os
t $
00
0s
2013/14
2014/15
Capital Works & Engineering services,
$38.90
Governance, Risk Mgmt,
Communications & Executive, $3.33
Repayment of Borrowings, $3.97
Corporate, Customer &
Municipal Services, $8.93
Rates & Property Services, $0.97
Waste Management, $9.22
Parks & Leisure, $10.56
Land Use Planning & Development, $3.14
Economic Development & Tourism, $2.51
Roads, Footpaths, Bridges &
Drainage, $9.12
Library, Culture & Arts, $3.26
Community Wellbeing, $3.20
Facilities Management, $2.89
8Minutes - Special Council Meeting of 24 June 2014 68
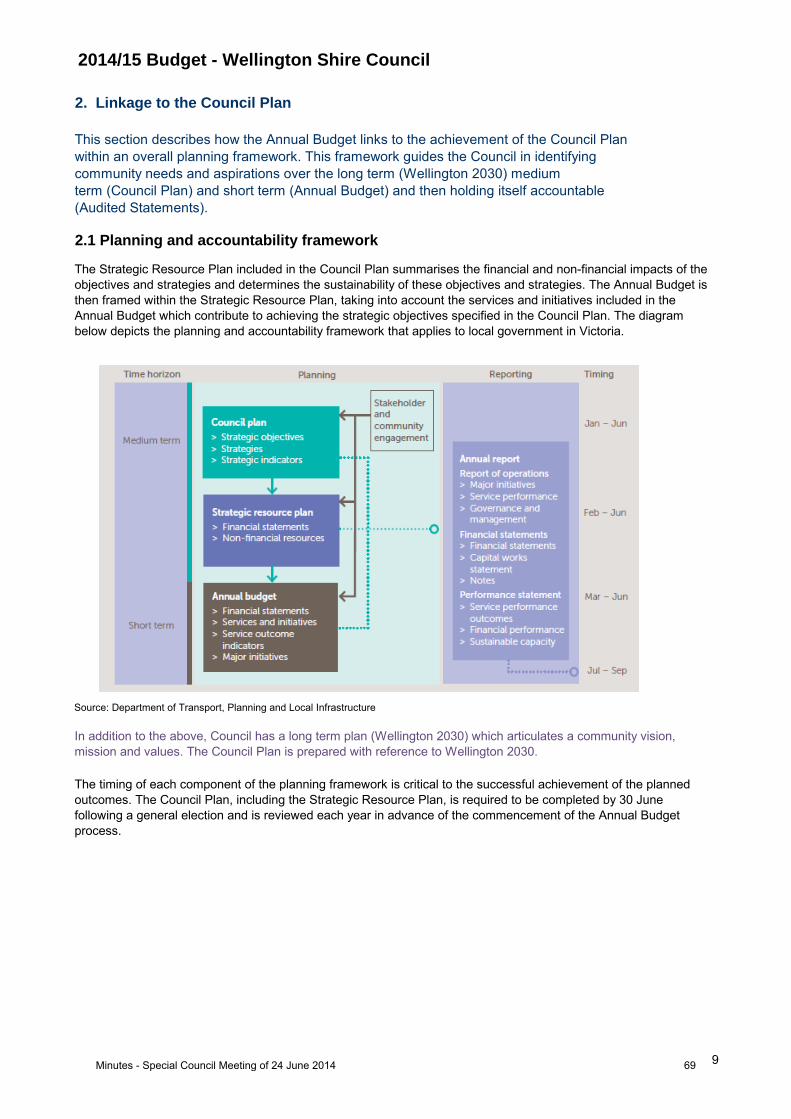
2014/15 Budget - Wellington Shire Council
2. Linkage to the Council Plan
Source: Department of Transport, Planning and Local Infrastructure
In addition to the above, Council has a long term plan (Wellington 2030) which articulates a community vision,
mission and values. The Council Plan is prepared with reference to Wellington 2030.
This section describes how the Annual Budget links to the achievement of the Council Plan
within an overall planning framework. This framework guides the Council in identifying
community needs and aspirations over the long term (Wellington 2030) medium
term (Council Plan) and short term (Annual Budget) and then holding itself accountable
(Audited Statements).
2.1 Planning and accountability framework
The Strategic Resource Plan included in the Council Plan summarises the financial and non-financial impacts of the
objectives and strategies and determines the sustainability of these objectives and strategies. The Annual Budget is
then framed within the Strategic Resource Plan, taking into account the services and initiatives included in the
Annual Budget which contribute to achieving the strategic objectives specified in the Council Plan. The diagram
below depicts the planning and accountability framework that applies to local government in Victoria.
The timing of each component of the planning framework is critical to the successful achievement of the planned
outcomes. The Council Plan, including the Strategic Resource Plan, is required to be completed by 30 June
following a general election and is reviewed each year in advance of the commencement of the Annual Budget
process.
9Minutes - Special Council Meeting of 24 June 2014 69

2014/15 Budget - Wellington Shire Council
2.2 Budget Processes
Budget process Timing
1 Officers update Council's long term financial projections Dec/Jan
2 Officers prepare operating and capital budgets Dec-Mar
3 Council considers draft budget at informal briefings Mar
4 Proposed budget submitted to Council for approval Apr
5 Public notice advising intention to adopt budget Apr
6 Budget available for public inspection & comment Apr/May
7 Submissions period closes (28 days) May
8 Submissions considered by Council May
9 Budget presented to Council for adoption Jun
10 Copy of adopted budget submitted to the Minister (due by 31 August) Jun
11 Revised budget where a material change has arisen Sep-Jun
This section lists the budget processes to be undertaken in order to adopt the Budget in accordance
with the Local Government Act 1989 (the Act) and Local Government (Planning and Reporting)
Regulations 2014 (the Regulations).
Under the Act, Council is required to prepare and adopt an annual budget for each financial year. The budget is
required to include certain information about the rates and charges that Council intends to levy as well as a range of
other information required by the Regulations which support the Act.
The 2014/15 budget, which is included in this report, is for the year 1 July 2014 to 30 June 2015 and is
prepared in accordance with the Act and Regulations. The budget includes financial statements being a budgeted
Comprehensive Income Statement, Balance Sheet, Statement of Changes in Equity, Statement of Cash Flows and
Statement of Capital Works. These statements have been prepared for the year ended 30 June 2015 in
accordance with the Act and Regulations, and consistent with the annual financial statements which are prepared
in accordance with Australian Accounting Standards. The budget also includes information about the rates and
charges to be levied, the capital works program to be undertaken, the human resources required, and other
financial information, which Council requires in order to make an informed decision about the adoption of the
budget.
The final step is for Council to adopt the budget after receiving and considering any submissions from
interested parties. The budget is required to be adopted and a copy submitted to the Minister by
31 August each year. The key dates for the budget process are summarised below:
In advance of preparing the budget, Officers firstly review and update Council's long term financial projections.
Financial projections for at least four years are ultimately included in Council's Strategic Resource Plan, which is
the key medium-term financial plan produced by Council on a rolling basis. The preparation of the budget, within
this broader context, begins with Officers preparing the operating and capital components of the annual budget
during January and February. A draft consolidated budget is then prepared and various iterations are considered by
Council at informal briefings during March and April. A ‘proposed’ budget is prepared in accordance with the Act
and submitted to Council in April for approval ‘in principle’. Council is then required to give ‘public notice’ that it
intends to ‘adopt’ the budget. It must give 28 days notice of its intention to adopt the proposed budget and make the
budget available for inspection at its offices and on its web site. A person has a right to make a submission on any
proposal contained in the budget and any submission must be considered before adoption of the budget by Council.
10Minutes - Special Council Meeting of 24 June 2014 70
2014/15 Budget - Wellington Shire Council
As well as external influences, there are also a number of internal influences which are expected to have a
significant impact on the preparation of the 2014/15 Budget. These matters have arisen from events occurring in
the 2013/14 year resulting in variances between the forecast actual and budgeted results for that year and matters
expected to arise in the 2014/15 year. These matters are set out below:
• A desire to reduce the rate rise below that planned in the SRP adopted in the prior year drove the
implementation of some operational efficiencies, resulting in significant reduction to expenditure in
order to support a rate income increase of 3.8%, without impacting key service delivery, including
the following:
- A review of depot operations and discontinuance of a number of vacant positions during the
year, resulting in a reduction of 6.4 EFT;
- Reduced contractor/consultant costs, particularly in strategic planning;
- Reduced expenditure on corporate training and OH & S activities;
- Reduction in fleet numbers;
- Closure of Sale Transfer Station
• A major project to be completed in 2014/15 is the fit-out of the new Desailly Street Corporate
Headquarters, which then makes way for the redevelopment of the current office building into the
Port of Sale Cultural Hub (Art Gallery and Library). These two projects result in short-term
changes to both expenditure and income, and these impacts have been factored into the 2014/15
budget.
2.3.2 Internal Influences
• Consumer Price Index (CPI) increases on goods and services of 2.7% per annum through the
year to December quarter 2013 (ABS release 22 January 2014). Statewide CPI is forecast to be
2.5% for the 2014/15 year (Victorian Budget Papers 2013/14).
In preparing the 2014/15 budget, a number of external influences have been taken into consideration, because they
are likely to impact significantly on the services delivered by Council in the budget period. These include:
2.3 Budget Influences
• Increases of 10% (or $5.30 per tonne) in the levy payable per tonne to the State Government upon
disposal of waste into landfill resulting in estimated additional waste tipping costs of 50,000. The
levy has increased from $9 per tonne in 2008/09 to $51.30 per tonne in 2014/15 (570% increase in
6 years).
• The 2014/15 Federal Budget, handed down in May 2014, indicated that the Australian
Government intends to "pause" indexation on the national pool of financial assistance grants
provided to local government via the Victoria Grants Commission. Council's indicative allocation
for 2014/15 is $12.1 million, a decrease of $55,000 on the 2013/14 allocation.
2.3.1 External Influences
• Proposed 2014/15 borrowings of $1.3 million to fund the construction of the Princes
Highway/Cobains Rd Intersection project; these borrowings were initially proposed for 2013/14 and
have been deferred in line with project construction planning.
• Council's Enterprise Bargaining Agreement (EBA) expired in November 2013 and was
successfully renegotiated for a further three years.
• Anticipated receipt of capital works funding of $5.00 million for the works associated with roads
and bridges ($2.28m), the Heyfield Gordon Street Recreation Reserve Clubroom redevelopment
($629,000), Yarram Recreation Reserve - Clubrooms Refurbishment ($390,000), McLoughlins
Beach Footbridge Renewal ($500,000) and other projects.
• The Fire Services Property Levy (FSPL) will continue to be collected by Council on behalf of the
State Government with the introduction of the Fire Services Property Levy Act 2012 . The cash
inflow (levy collection from ratepayers) and outflow (payment to State government) do not form part
of this budget as Council acts as the collection agency for the State government and does not
own any part of this levy.
11Minutes - Special Council Meeting of 24 June 2014 71
2014/15 Budget - Wellington Shire Council
• Existing fees and charges to be increased in line with CPI or market levels;
• Grants to be based on confirmed funding levels;
• New revenue sources to be identified where possible;
• Contract labour to be minimised;
• The use of business cases to support:
• Increases in staffing levels without matching external funding;
• New initiatives or projects which are not cost neutral;
The budget includes consideration of a number of long term strategies and contextual information to assist Council
to prepare the Budget in a proper financial management context. These include a Strategic Resource Plan for
2014/15 to 2017/18 (section 8.), Rating Information (section 9.) and Other Long Term Strategies (section 10 and
11) including borrowings and infrastructure.
• Operating revenues and expenses arising from completed 2013/14 capital projects
to be included.
• Real savings in expenditure and increases in revenue identified in 2013/14 to be
preserved; and
2.4 Budget principles
In response to these significant influences, guidelines were prepared and distributed to all Council officers with
budget responsibilities. The guidelines set out the key budget principles upon which the officers were to prepare
their budgets. The principles included:
2.5 Long term strategies
• Service levels to be maintained, in general, at 2013/14 levels with the aim to use less
resources with an emphasis on innovation and efficiency;
12Minutes - Special Council Meeting of 24 June 2014 72
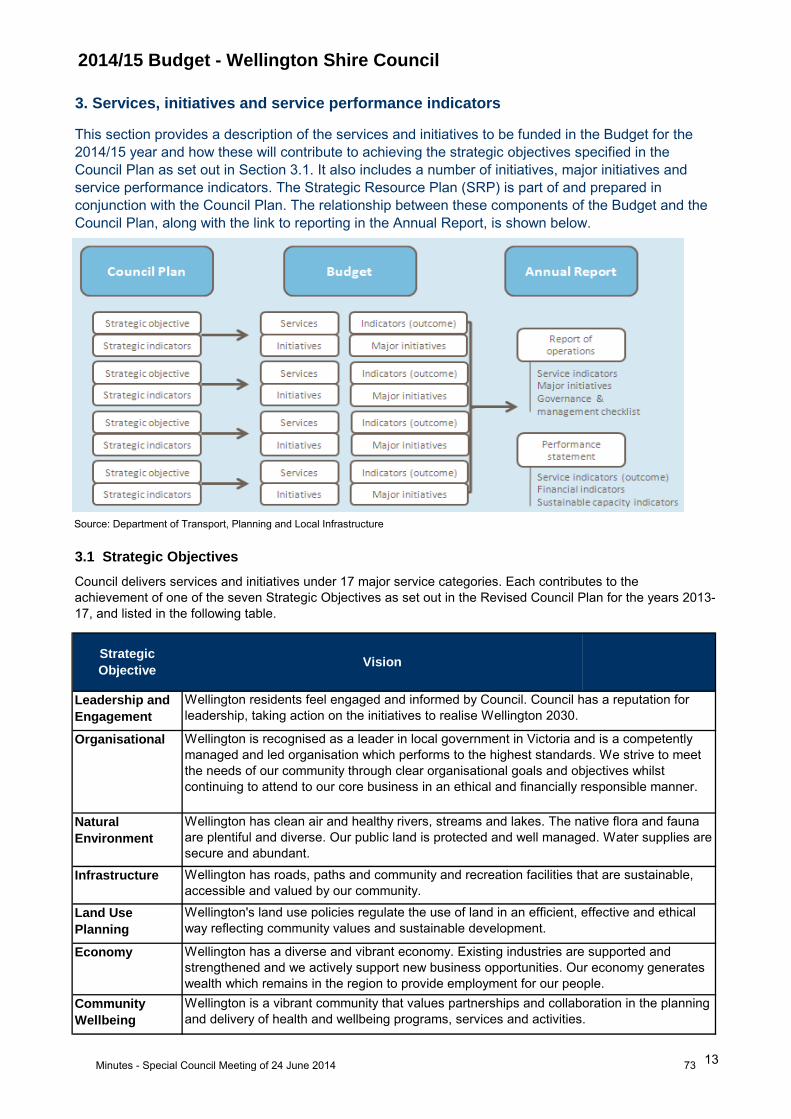
2014/15 Budget - Wellington Shire Council
3. Services, initiatives and service performance indicators
Leadership and
Engagement
Organisational
Natural
Environment
Infrastructure
Land Use
Planning
Economy
Community
Wellbeing
Wellington is a vibrant community that values partnerships and collaboration in the planning
and delivery of health and wellbeing programs, services and activities.
Wellington residents feel engaged and informed by Council. Council has a reputation for
leadership, taking action on the initiatives to realise Wellington 2030.
Wellington is recognised as a leader in local government in Victoria and is a competently
managed and led organisation which performs to the highest standards. We strive to meet
the needs of our community through clear organisational goals and objectives whilst
continuing to attend to our core business in an ethical and financially responsible manner.
Wellington has clean air and healthy rivers, streams and lakes. The native flora and fauna
are plentiful and diverse. Our public land is protected and well managed. Water supplies are
secure and abundant.
Wellington has roads, paths and community and recreation facilities that are sustainable,
accessible and valued by our community.
Wellington's land use policies regulate the use of land in an efficient, effective and ethical
way reflecting community values and sustainable development.
Wellington has a diverse and vibrant economy. Existing industries are supported and
strengthened and we actively support new business opportunities. Our economy generates
wealth which remains in the region to provide employment for our people.
This section provides a description of the services and initiatives to be funded in the Budget for the
2014/15 year and how these will contribute to achieving the strategic objectives specified in the
Council Plan as set out in Section 3.1. It also includes a number of initiatives, major initiatives and
service performance indicators. The Strategic Resource Plan (SRP) is part of and prepared in
conjunction with the Council Plan. The relationship between these components of the Budget and the
Council Plan, along with the link to reporting in the Annual Report, is shown below.
Source: Department of Transport, Planning and Local Infrastructure
3.1 Strategic Objectives
Council delivers services and initiatives under 17 major service categories. Each contributes to the
achievement of one of the seven Strategic Objectives as set out in the Revised Council Plan for the years 2013-
17, and listed in the following table.
Strategic
ObjectiveVision
13Minutes - Special Council Meeting of 24 June 2014 73
2014/15 Budget - Wellington Shire Council
Services
Expenditure
(Income)
Net Cost
$'000
2,211
-
2,211
427
-
427
Initiatives
2,638
Major Initiatives
1)
Service Indicator Performance Measure Computation
Governance Satisfaction
3.2 Strategic Objective 1: Leadership and Engagement
To achieve our objectives in this area, we will continue to plan for the present and future, and to lead and
advocate for outcomes that benefit the community. We aim to deliver an appropriate level of service and facility
that enables Council and staff to operate effectively. The services, major initiatives and service performance
indicators for each business area are described below.
Business area Description of services provided
Councillors, Chief
Executive and
Executive Team
This area of governance includes the Mayor, Councillors, Chief
Executive Officer and Executive Management Team and associated
support which cannot be easily attributed to the direct service
provision areas.
Media and Public
Relations
This area provides internal and external communication services and
support and branding initiatives for Council. The team also seeks to
identify trends in public opinion and ensure that Council adapts and
responds in a timely manner.
TOTAL LEADERSHIP AND ENGAGEMENT
Undertake a review of Wellington Matters, both in terms of timing and content as well as its
effectiveness as a communication agent.
Commence development of a Communications Strategy to
enhance the flow of information to and from the Wellington Shire
community.
Service Performance Outcome Indicators
Satisfaction with Council decisions
(Community satisfaction rating out of
100 with how Council has performed in
making decisions in the interest of the
community)
Community satisfaction rating out
of 100 with the performance of
Council in making decisions in
the interest of the community
14Minutes - Special Council Meeting of 24 June 2014 74
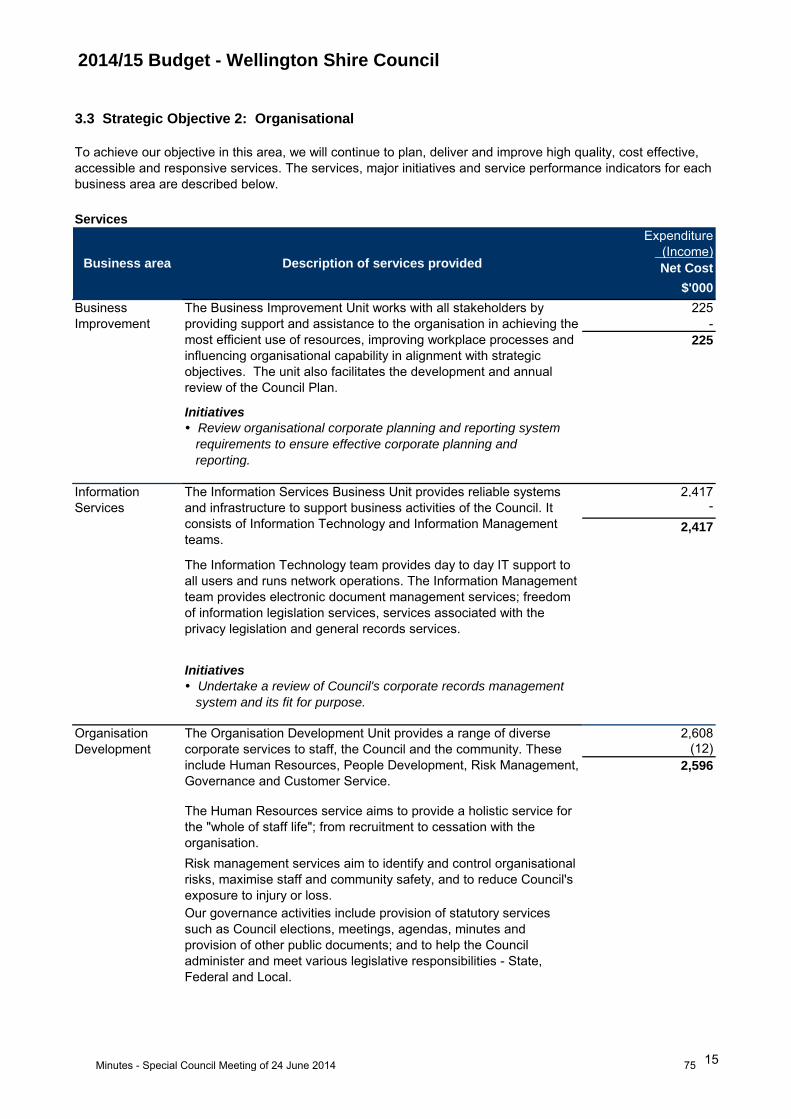
2014/15 Budget - Wellington Shire Council
Services
Expenditure
(Income)
Net Cost
$'000
225
-
225
Initiatives
2,417 -
2,417
Initiatives
2,608
(12)
2,596
Business
Improvement
The Business Improvement Unit works with all stakeholders by
providing support and assistance to the organisation in achieving the
most efficient use of resources, improving workplace processes and
influencing organisational capability in alignment with strategic
objectives. The unit also facilitates the development and annual
review of the Council Plan.
Information
Services
The Information Services Business Unit provides reliable systems
and infrastructure to support business activities of the Council. It
consists of Information Technology and Information Management
teams.
The Information Technology team provides day to day IT support to
all users and runs network operations. The Information Management
team provides electronic document management services; freedom
of information legislation services, services associated with the
privacy legislation and general records services.
Organisation
Development
The Organisation Development Unit provides a range of diverse
corporate services to staff, the Council and the community. These
include Human Resources, People Development, Risk Management,
Governance and Customer Service.
3.3 Strategic Objective 2: Organisational
To achieve our objective in this area, we will continue to plan, deliver and improve high quality, cost effective,
accessible and responsive services. The services, major initiatives and service performance indicators for each
business area are described below.
Business area Description of services provided
Review organisational corporate planning and reporting system
requirements to ensure effective corporate planning and
reporting.
Undertake a review of Council's corporate records management
system and its fit for purpose.
The Human Resources service aims to provide a holistic service for
the "whole of staff life"; from recruitment to cessation with the
organisation.
Risk management services aim to identify and control organisational
risks, maximise staff and community safety, and to reduce Council's
exposure to injury or loss.
Our governance activities include provision of statutory services
such as Council elections, meetings, agendas, minutes and
provision of other public documents; and to help the Council
administer and meet various legislative responsibilities - State,
Federal and Local.
15Minutes - Special Council Meeting of 24 June 2014 75
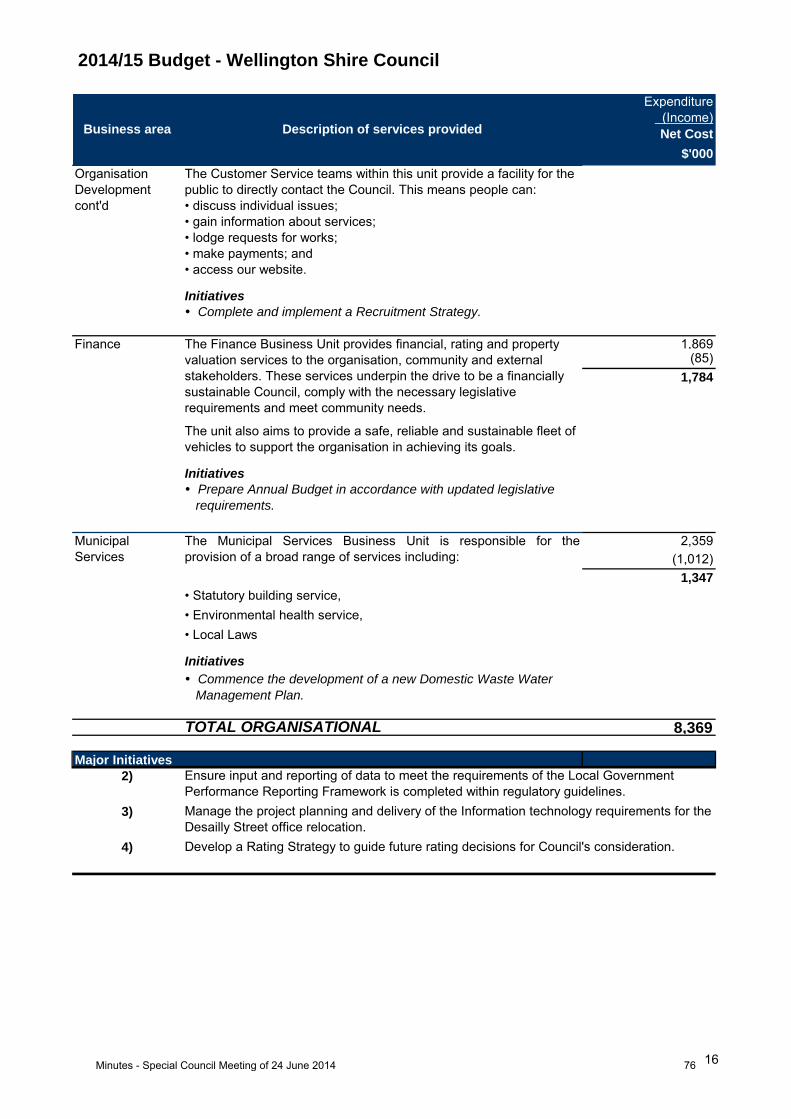
2014/15 Budget - Wellington Shire Council
Expenditure
(Income)
Net Cost
$'000
Initiatives
1,869(85)
1,784
Initiatives
2,359
(1,012)
1,347
Initiatives
8,369
Major Initiatives
2)
3)
4)
• lodge requests for works;
• make payments; and
• access our website.
Finance The Finance Business Unit provides financial, rating and property
valuation services to the organisation, community and external
stakeholders. These services underpin the drive to be a financially
sustainable Council, comply with the necessary legislative
requirements and meet community needs.
The Customer Service teams within this unit provide a facility for the
public to directly contact the Council. This means people can:
• discuss individual issues;
• gain information about services;
Complete and implement a Recruitment Strategy.
Business area Description of services provided
Organisation
Development
cont'd
The unit also aims to provide a safe, reliable and sustainable fleet of
vehicles to support the organisation in achieving its goals.
Municipal
Services
The Municipal Services Business Unit is responsible for the
provision of a broad range of services including:
• Statutory building service,
• Environmental health service,
• Local Laws
Prepare Annual Budget in accordance with updated legislative
requirements.
Commence the development of a new Domestic Waste Water
Management Plan.
TOTAL ORGANISATIONAL
Manage the project planning and delivery of the Information technology requirements for the
Desailly Street office relocation.
Develop a Rating Strategy to guide future rating decisions for Council's consideration.
Ensure input and reporting of data to meet the requirements of the Local Government
Performance Reporting Framework is completed within regulatory guidelines.
16Minutes - Special Council Meeting of 24 June 2014 76
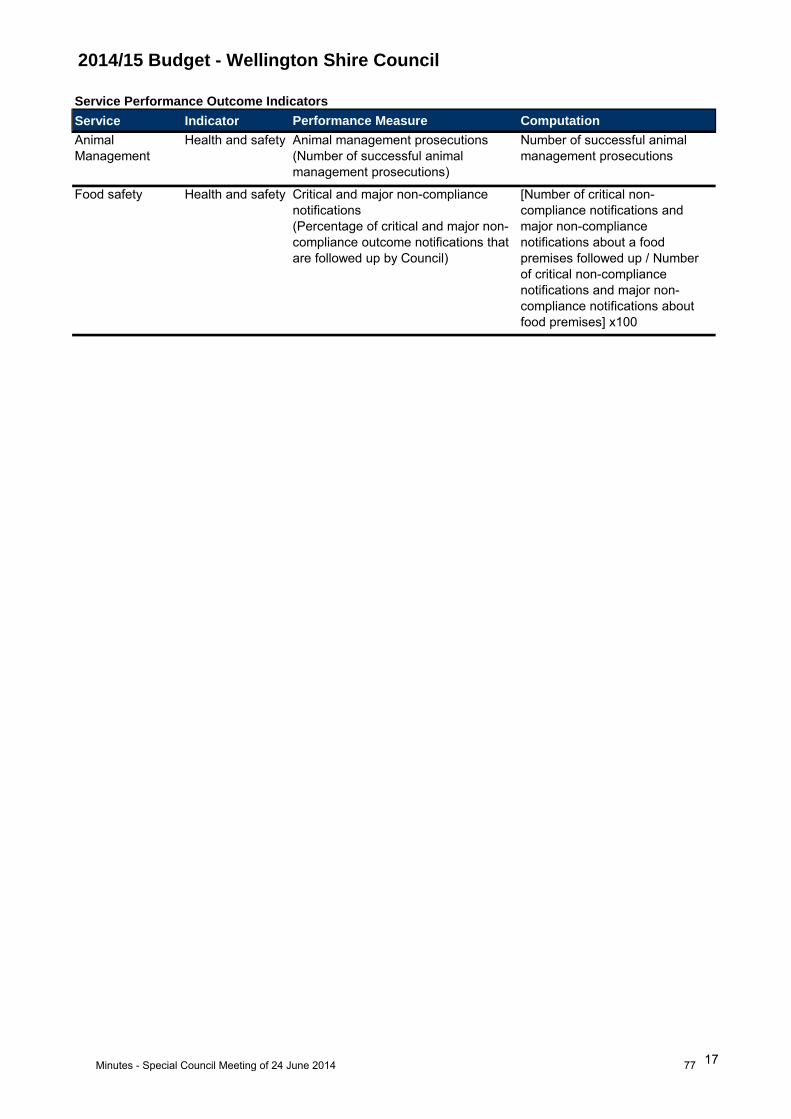
2014/15 Budget - Wellington Shire Council
Service Indicator Performance Measure Computation
Animal
Management
Health and safety
Food safety Health and safety
Service Performance Outcome Indicators
Animal management prosecutions
(Number of successful animal
management prosecutions)
Number of successful animal
management prosecutions
Critical and major non-compliance
notifications
(Percentage of critical and major non-
compliance outcome notifications that
are followed up by Council)
[Number of critical non-
compliance notifications and
major non-compliance
notifications about a food
premises followed up / Number
of critical non-compliance
notifications and major non-
compliance notifications about
food premises] x100
17Minutes - Special Council Meeting of 24 June 2014 77
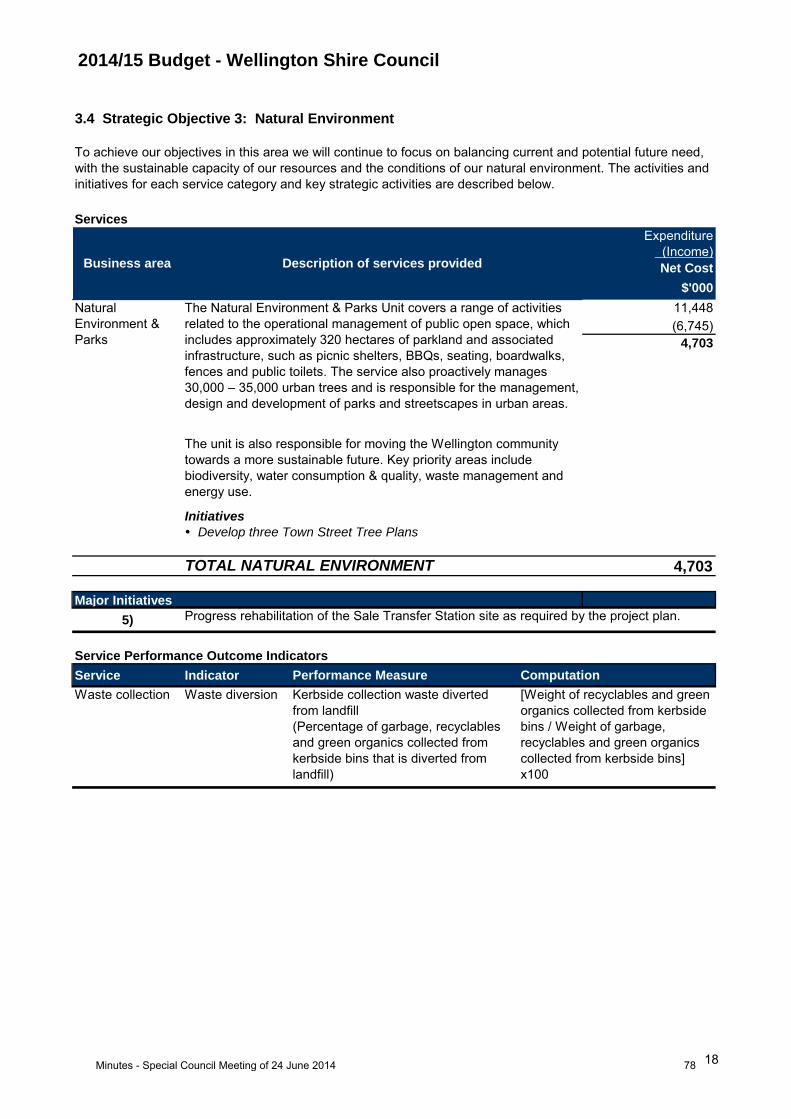
2014/15 Budget - Wellington Shire Council
Services
Expenditure
(Income)
Net Cost
$'000
11,448
(6,745)
4,703
Initiatives
4,703
Major Initiatives
5)
Service Indicator Performance Measure Computation
Waste collection Waste diversion
3.4 Strategic Objective 3: Natural Environment
To achieve our objectives in this area we will continue to focus on balancing current and potential future need,
with the sustainable capacity of our resources and the conditions of our natural environment. The activities and
initiatives for each service category and key strategic activities are described below.
Business area Description of services provided
Natural
Environment &
Parks
The Natural Environment & Parks Unit covers a range of activities
related to the operational management of public open space, which
includes approximately 320 hectares of parkland and associated
infrastructure, such as picnic shelters, BBQs, seating, boardwalks,
fences and public toilets. The service also proactively manages
30,000 – 35,000 urban trees and is responsible for the management,
design and development of parks and streetscapes in urban areas.
The unit is also responsible for moving the Wellington community
towards a more sustainable future. Key priority areas include
biodiversity, water consumption & quality, waste management and
energy use.
TOTAL NATURAL ENVIRONMENT
Service Performance Outcome Indicators
Kerbside collection waste diverted
from landfill
(Percentage of garbage, recyclables
and green organics collected from
kerbside bins that is diverted from
landfill)
[Weight of recyclables and green
organics collected from kerbside
bins / Weight of garbage,
recyclables and green organics
collected from kerbside bins]
x100
Develop three Town Street Tree Plans
Progress rehabilitation of the Sale Transfer Station site as required by the project plan.
18Minutes - Special Council Meeting of 24 June 2014 78
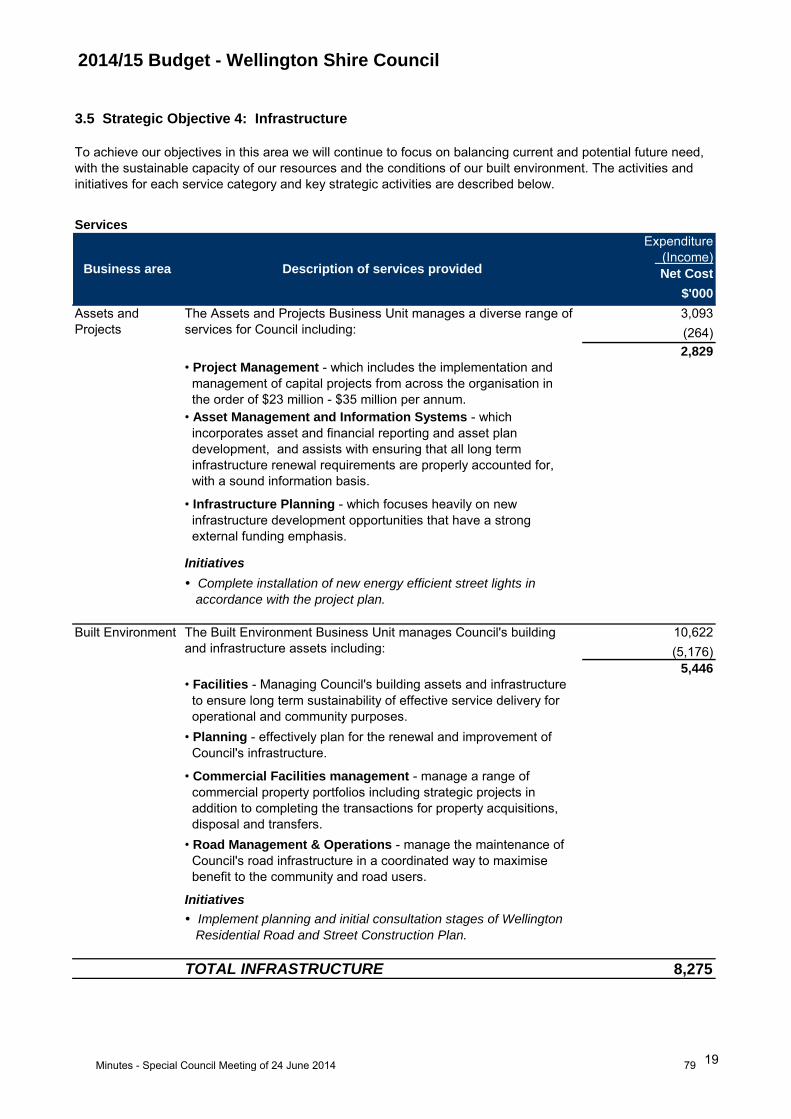
2014/15 Budget - Wellington Shire Council
Services
Expenditure
(Income)
Net Cost
$'000
3,093
(264)
2,829
Initiatives
10,622
(5,176)
5,446
Initiatives
8,275
To achieve our objectives in this area we will continue to focus on balancing current and potential future need,
with the sustainable capacity of our resources and the conditions of our built environment. The activities and
initiatives for each service category and key strategic activities are described below.
Business area Description of services provided
Assets and
Projects
The Assets and Projects Business Unit manages a diverse range of
services for Council including:
• Project Management - which includes the implementation and
management of capital projects from across the organisation in
the order of $23 million - $35 million per annum.
3.5 Strategic Objective 4: Infrastructure
• Commercial Facilities management - manage a range of
commercial property portfolios including strategic projects in
addition to completing the transactions for property acquisitions,
disposal and transfers.
• Road Management & Operations - manage the maintenance of
Council's road infrastructure in a coordinated way to maximise
benefit to the community and road users.
TOTAL INFRASTRUCTURE
• Asset Management and Information Systems - which
incorporates asset and financial reporting and asset plan
development, and assists with ensuring that all long term
infrastructure renewal requirements are properly accounted for,
with a sound information basis.
• Infrastructure Planning - which focuses heavily on new
infrastructure development opportunities that have a strong
external funding emphasis.
Built Environment The Built Environment Business Unit manages Council's building
and infrastructure assets including:
• Facilities - Managing Council's building assets and infrastructure
to ensure long term sustainability of effective service delivery for
operational and community purposes.
• Planning - effectively plan for the renewal and improvement of
Council's infrastructure.
Complete installation of new energy efficient street lights in
accordance with the project plan.
Implement planning and initial consultation stages of Wellington
Residential Road and Street Construction Plan.
19Minutes - Special Council Meeting of 24 June 2014 79
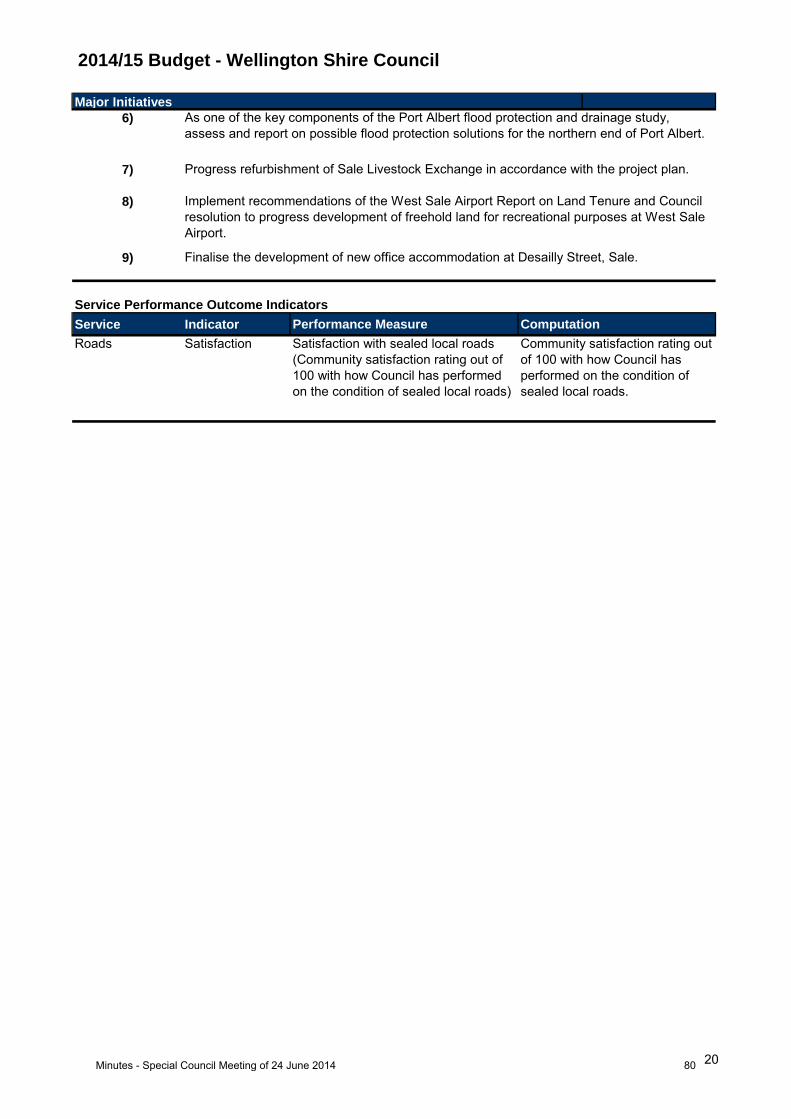
2014/15 Budget - Wellington Shire Council
Major Initiatives
6)
7)
8)
9)
Service Indicator Performance Measure Computation
Roads Satisfaction
Service Performance Outcome Indicators
Satisfaction with sealed local roads
(Community satisfaction rating out of
100 with how Council has performed
on the condition of sealed local roads)
Community satisfaction rating out
of 100 with how Council has
performed on the condition of
sealed local roads.
As one of the key components of the Port Albert flood protection and drainage study,
assess and report on possible flood protection solutions for the northern end of Port Albert.
Progress refurbishment of Sale Livestock Exchange in accordance with the project plan.
Implement recommendations of the West Sale Airport Report on Land Tenure and Council
resolution to progress development of freehold land for recreational purposes at West Sale
Airport.
Finalise the development of new office accommodation at Desailly Street, Sale.
20Minutes - Special Council Meeting of 24 June 2014 80
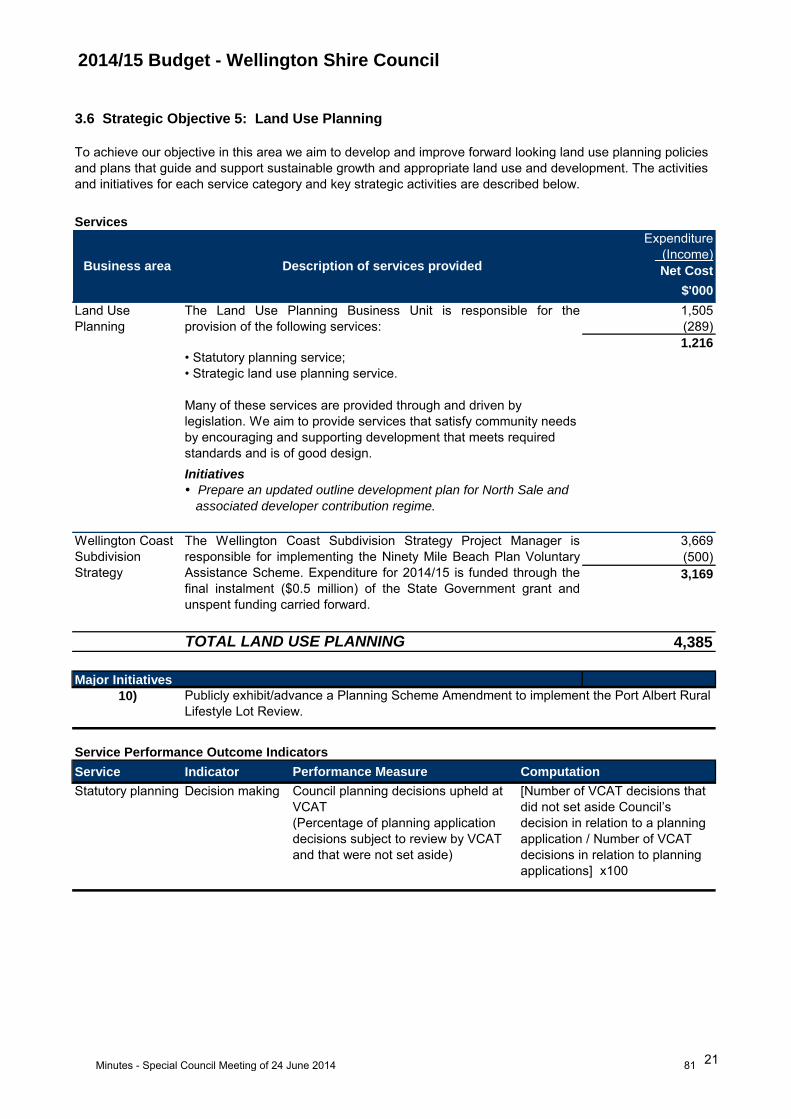
2014/15 Budget - Wellington Shire Council
Services
Expenditure
(Income)
Net Cost
$'000
1,505
(289)
1,216
Initiatives
3,669
(500)
3,169
4,385
Major Initiatives
10)
Service Indicator Performance Measure Computation
Statutory planning Decision making
• Statutory planning service;
• Strategic land use planning service.
Many of these services are provided through and driven by
legislation. We aim to provide services that satisfy community needs
by encouraging and supporting development that meets required
standards and is of good design.
Wellington Coast
Subdivision
Strategy
The Wellington Coast Subdivision Strategy Project Manager is
responsible for implementing the Ninety Mile Beach Plan Voluntary
Assistance Scheme. Expenditure for 2014/15 is funded through the
final instalment ($0.5 million) of the State Government grant and
unspent funding carried forward.
3.6 Strategic Objective 5: Land Use Planning
To achieve our objective in this area we aim to develop and improve forward looking land use planning policies
and plans that guide and support sustainable growth and appropriate land use and development. The activities
and initiatives for each service category and key strategic activities are described below.
Business area Description of services provided
Land Use
Planning
The Land Use Planning Business Unit is responsible for the
provision of the following services:
Prepare an updated outline development plan for North Sale and
associated developer contribution regime.
TOTAL LAND USE PLANNING
Service Performance Outcome Indicators
Council planning decisions upheld at
VCAT
(Percentage of planning application
decisions subject to review by VCAT
and that were not set aside)
[Number of VCAT decisions that
did not set aside Council’s
decision in relation to a planning
application / Number of VCAT
decisions in relation to planning
applications] x100
Publicly exhibit/advance a Planning Scheme Amendment to implement the Port Albert Rural
Lifestyle Lot Review.
21Minutes - Special Council Meeting of 24 June 2014 81
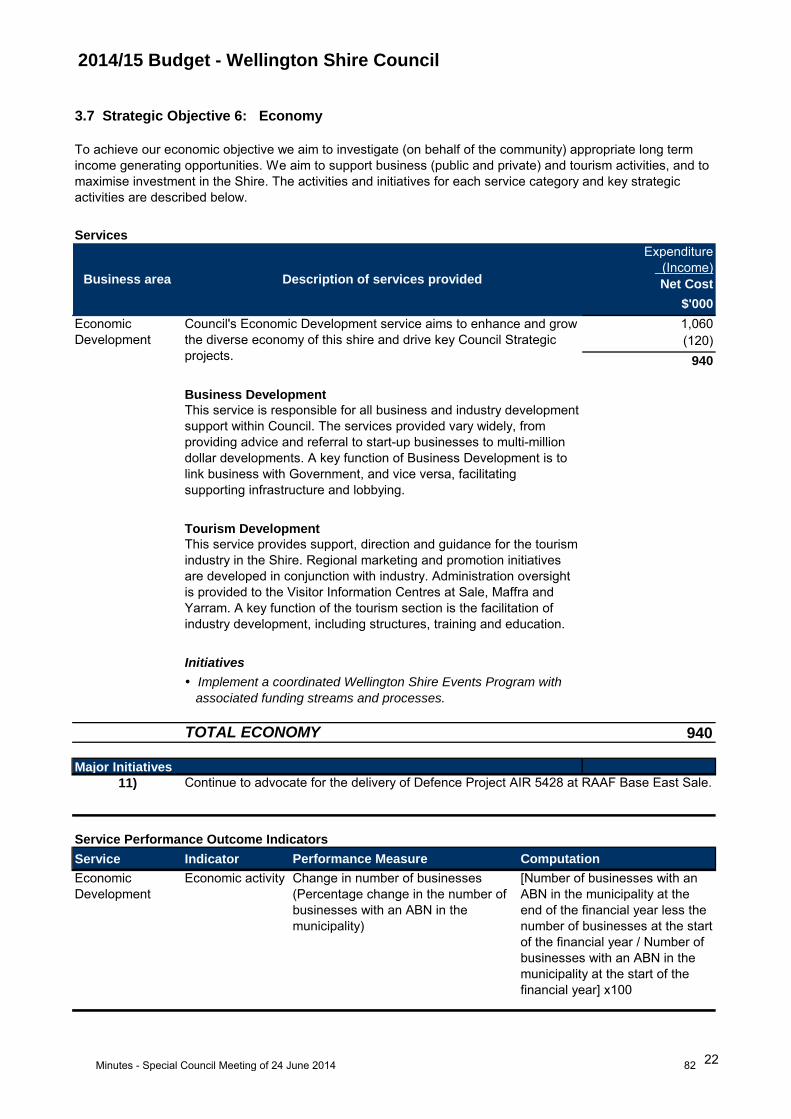
2014/15 Budget - Wellington Shire Council
Services
Expenditure
(Income)
Net Cost
$'000
1,060
(120)
940
Initiatives
940
Major Initiatives
11)
Service Indicator Performance Measure Computation
Economic
Development
Economic activity
Business area Description of services provided
Economic
Development
Council's Economic Development service aims to enhance and grow
the diverse economy of this shire and drive key Council Strategic
projects.
Business Development
This service is responsible for all business and industry development
support within Council. The services provided vary widely, from
providing advice and referral to start-up businesses to multi-million
dollar developments. A key function of Business Development is to
link business with Government, and vice versa, facilitating
supporting infrastructure and lobbying.
3.7 Strategic Objective 6: Economy
To achieve our economic objective we aim to investigate (on behalf of the community) appropriate long term
income generating opportunities. We aim to support business (public and private) and tourism activities, and to
maximise investment in the Shire. The activities and initiatives for each service category and key strategic
activities are described below.
Tourism Development
This service provides support, direction and guidance for the tourism
industry in the Shire. Regional marketing and promotion initiatives
are developed in conjunction with industry. Administration oversight
is provided to the Visitor Information Centres at Sale, Maffra and
Yarram. A key function of the tourism section is the facilitation of
industry development, including structures, training and education.
TOTAL ECONOMY
Service Performance Outcome Indicators
Change in number of businesses
(Percentage change in the number of
businesses with an ABN in the
municipality)
[Number of businesses with an
ABN in the municipality at the
end of the financial year less the
number of businesses at the start
of the financial year / Number of
businesses with an ABN in the
municipality at the start of the
financial year] x100
Implement a coordinated Wellington Shire Events Program with
associated funding streams and processes.
Continue to advocate for the delivery of Defence Project AIR 5428 at RAAF Base East Sale.
22Minutes - Special Council Meeting of 24 June 2014 82
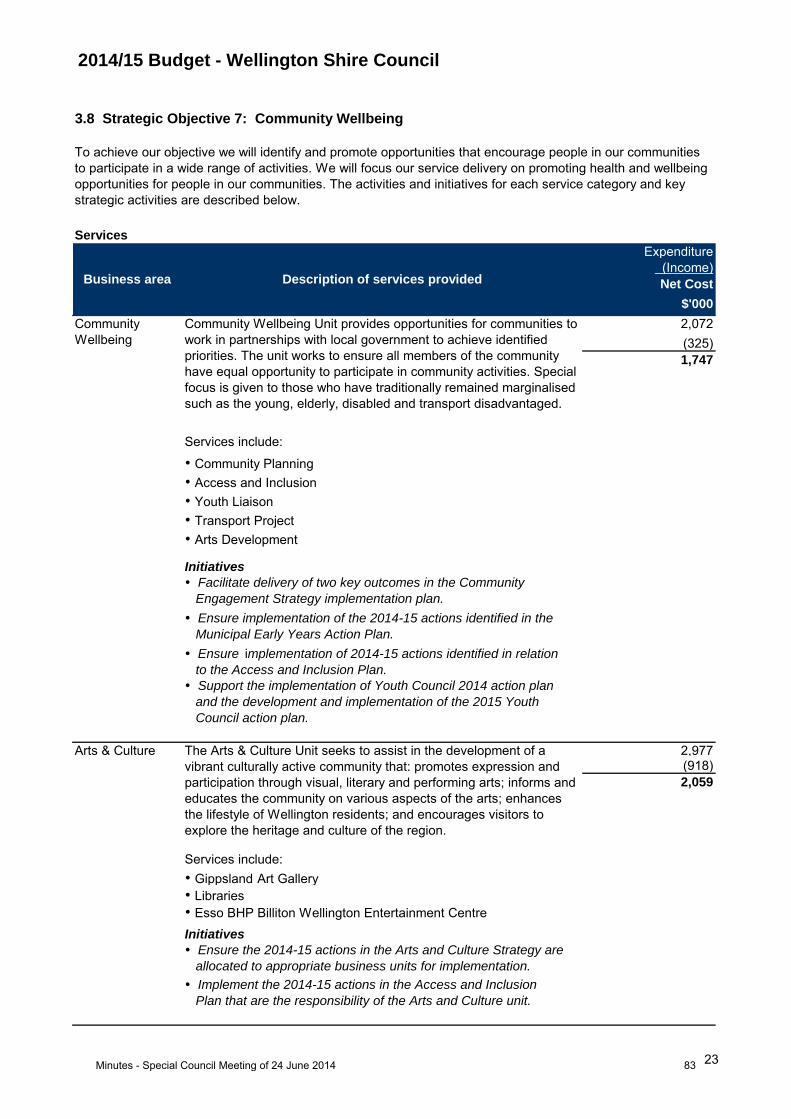
2014/15 Budget - Wellington Shire Council
Services
Expenditure
(Income)
Net Cost
$'000
2,072
(325)
1,747
Initiatives
2,977(918)
2,059
Initiatives
3.8 Strategic Objective 7: Community Wellbeing
To achieve our objective we will identify and promote opportunities that encourage people in our communities
to participate in a wide range of activities. We will focus our service delivery on promoting health and wellbeing
opportunities for people in our communities. The activities and initiatives for each service category and key
strategic activities are described below.
Business area Description of services provided
Community
Wellbeing
Community Wellbeing Unit provides opportunities for communities to
work in partnerships with local government to achieve identified
priorities. The unit works to ensure all members of the community
have equal opportunity to participate in community activities. Special
focus is given to those who have traditionally remained marginalised
such as the young, elderly, disabled and transport disadvantaged.
• Libraries
• Esso BHP Billiton Wellington Entertainment Centre
Services include:
• Community Planning
• Access and Inclusion
• Youth Liaison
• Transport Project
• Arts Development
Arts & Culture The Arts & Culture Unit seeks to assist in the development of a
vibrant culturally active community that: promotes expression and
participation through visual, literary and performing arts; informs and
educates the community on various aspects of the arts; enhances
the lifestyle of Wellington residents; and encourages visitors to
explore the heritage and culture of the region.
Services include:
• Gippsland Art Gallery
Implement the 2014-15 actions in the Access and Inclusion
Plan that are the responsibility of the Arts and Culture unit.
Ensure the 2014-15 actions in the Arts and Culture Strategy are
allocated to appropriate business units for implementation.
Ensure implementation of 2014-15 actions identified in relation
to the Access and Inclusion Plan.
Support the implementation of Youth Council 2014 action plan
and the development and implementation of the 2015 Youth
Council action plan.
Facilitate delivery of two key outcomes in the Community
Engagement Strategy implementation plan.
Ensure implementation of the 2014-15 actions identified in the
Municipal Early Years Action Plan.
23Minutes - Special Council Meeting of 24 June 2014 83
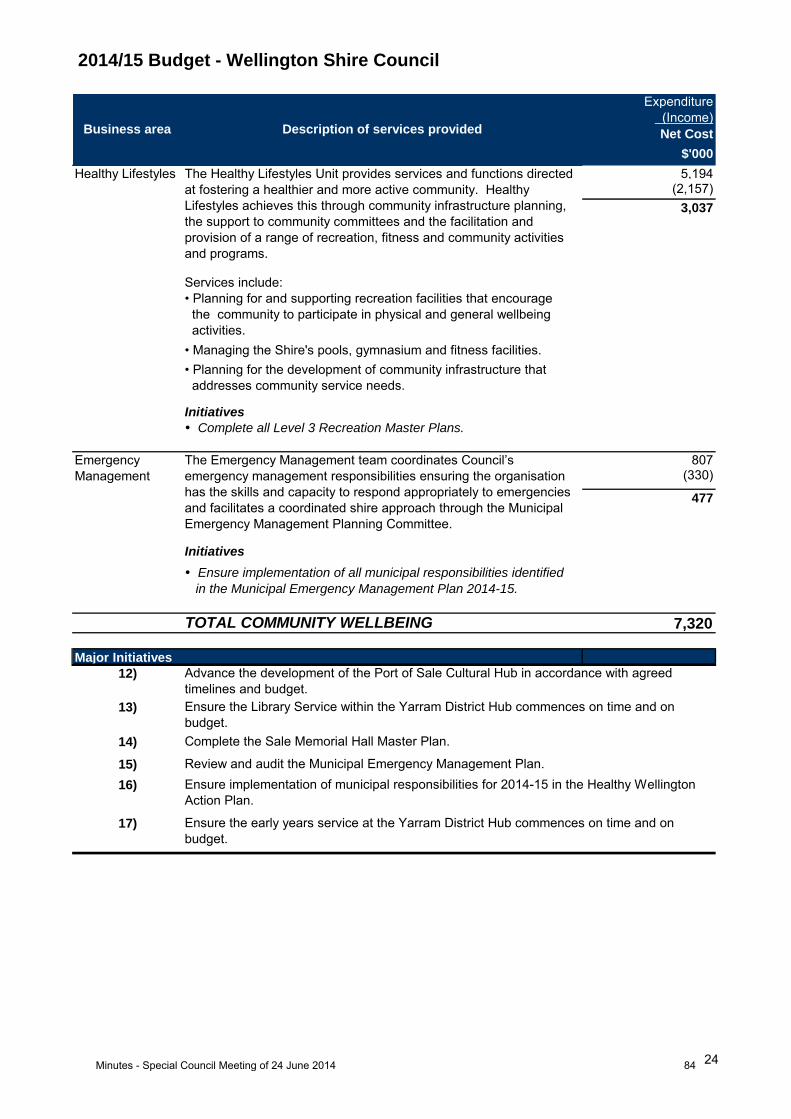
2014/15 Budget - Wellington Shire Council
Expenditure
(Income)
Net Cost
$'000
5,194(2,157)
3,037
Services include:
Initiatives
807(330)
477
Initiatives
7,320
Major Initiatives
12)
13)
14)
15)
16)
17)
Healthy Lifestyles The Healthy Lifestyles Unit provides services and functions directed
at fostering a healthier and more active community. Healthy
Lifestyles achieves this through community infrastructure planning,
the support to community committees and the facilitation and
provision of a range of recreation, fitness and community activities
and programs.
• Planning for and supporting recreation facilities that encourage
the community to participate in physical and general wellbeing
activities.
• Managing the Shire's pools, gymnasium and fitness facilities.
Business area Description of services provided
• Planning for the development of community infrastructure that
addresses community service needs.
Emergency
Management
The Emergency Management team coordinates Council’s
emergency management responsibilities ensuring the organisation
has the skills and capacity to respond appropriately to emergencies
and facilitates a coordinated shire approach through the Municipal
Emergency Management Planning Committee.
TOTAL COMMUNITY WELLBEING
Complete all Level 3 Recreation Master Plans.
Ensure implementation of all municipal responsibilities identified
in the Municipal Emergency Management Plan 2014-15.
Advance the development of the Port of Sale Cultural Hub in accordance with agreed
timelines and budget.
Ensure the Library Service within the Yarram District Hub commences on time and on
budget.
Complete the Sale Memorial Hall Master Plan.
Review and audit the Municipal Emergency Management Plan.
Ensure implementation of municipal responsibilities for 2014-15 in the Healthy Wellington
Action Plan.
Ensure the early years service at the Yarram District Hub commences on time and on
budget.
24Minutes - Special Council Meeting of 24 June 2014 84
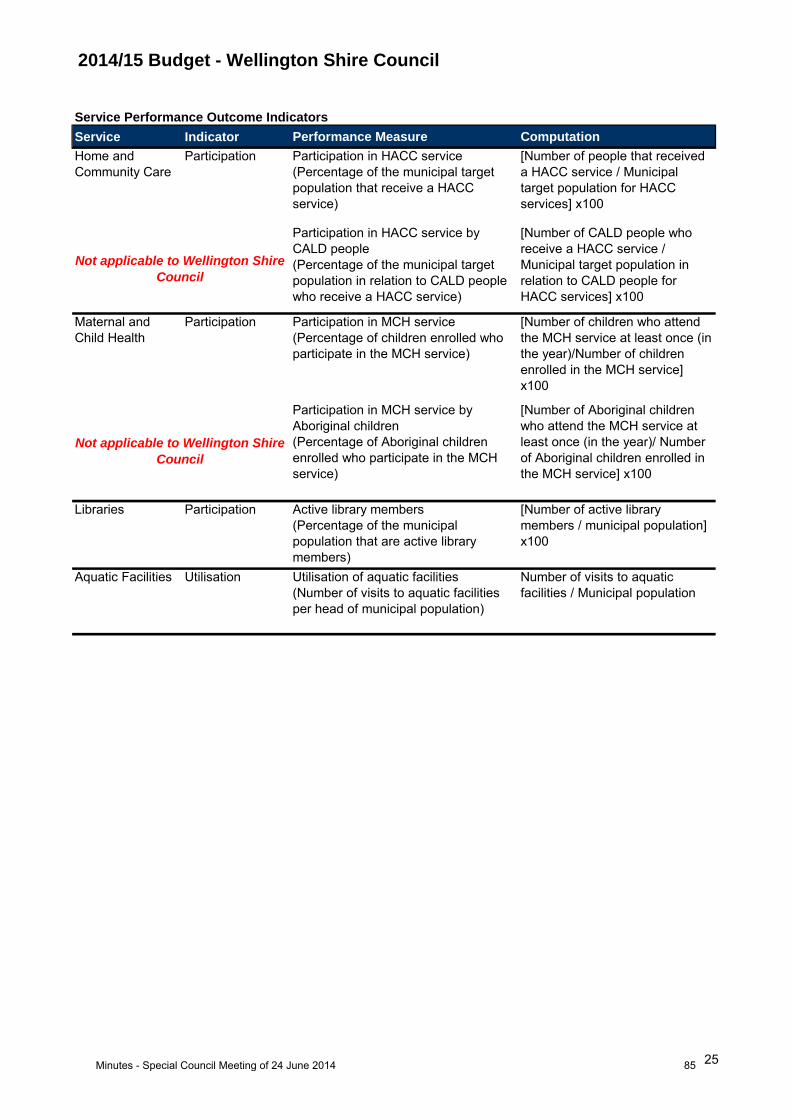
2014/15 Budget - Wellington Shire Council
Service Indicator Performance Measure Computation
Home and
Community Care
Participation
Maternal and
Child Health
Participation
Libraries Participation
Aquatic Facilities Utilisation
Service Performance Outcome Indicators
Participation in HACC service
(Percentage of the municipal target
population that receive a HACC
service)
[Number of people that received
a HACC service / Municipal
target population for HACC
services] x100
Participation in HACC service by
CALD people
(Percentage of the municipal target
population in relation to CALD people
who receive a HACC service)
[Number of CALD people who
receive a HACC service /
Municipal target population in
relation to CALD people for
HACC services] x100
Participation in MCH service
(Percentage of children enrolled who
participate in the MCH service)
[Number of children who attend
the MCH service at least once (in
the year)/Number of children
enrolled in the MCH service]
x100
Not applicable to Wellington Shire
Council
Participation in MCH service by
Aboriginal children
(Percentage of Aboriginal children
enrolled who participate in the MCH
service)
[Number of Aboriginal children
who attend the MCH service at
least once (in the year)/ Number
of Aboriginal children enrolled in
the MCH service] x100
Active library members
(Percentage of the municipal
population that are active library
members)
[Number of active library
members / municipal population]
x100
Utilisation of aquatic facilities
(Number of visits to aquatic facilities
per head of municipal population)
Number of visits to aquatic
facilities / Municipal population
Not applicable to Wellington Shire
Council
25Minutes - Special Council Meeting of 24 June 2014 85
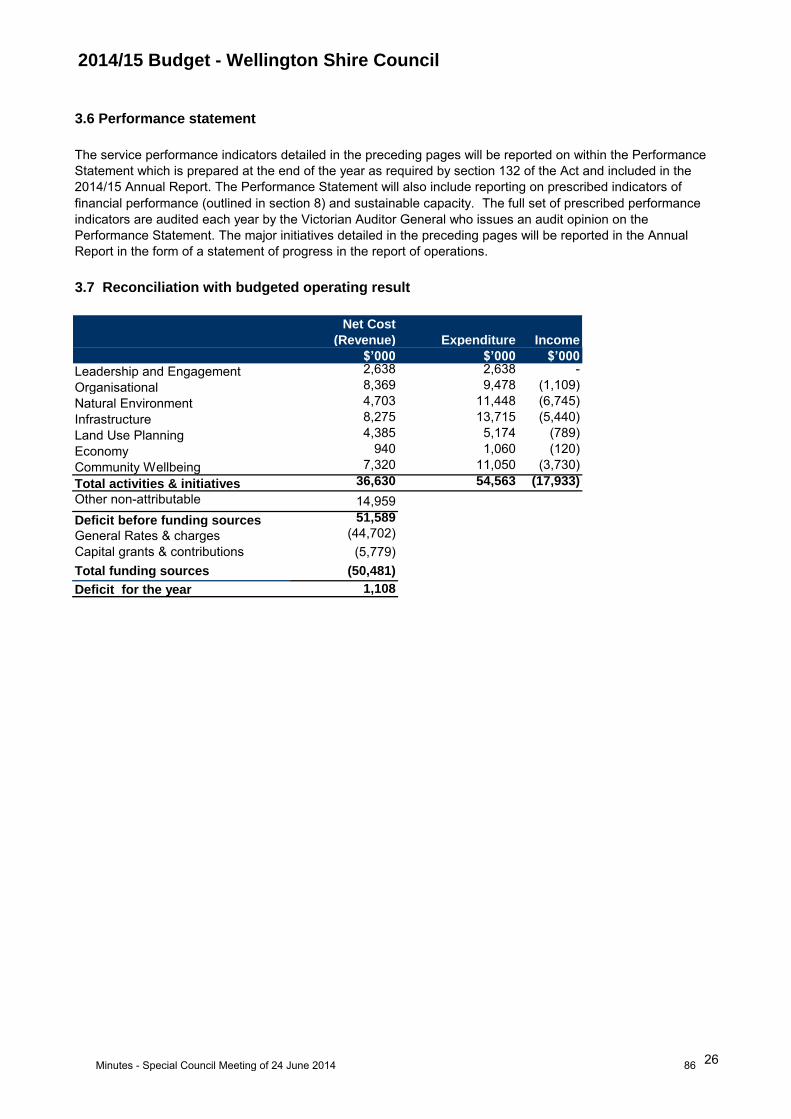
2014/15 Budget - Wellington Shire Council
Net Cost
(Revenue) Expenditure Income
$’000 $’000 $’0002,638 2,638 -
Organisational 8,369 9,478 (1,109)
4,703 11,448 (6,745)
Infrastructure 8,275 13,715 (5,440)
4,385 5,174 (789)
940 1,060 (120)
7,320 11,050 (3,730)
36,630 54,563 (17,933)
14,959
51,589
(44,702)
(5,779)
(50,481)
1,108
3.6 Performance statement
The service performance indicators detailed in the preceding pages will be reported on within the Performance
Statement which is prepared at the end of the year as required by section 132 of the Act and included in the
2014/15 Annual Report. The Performance Statement will also include reporting on prescribed indicators of
financial performance (outlined in section 8) and sustainable capacity. The full set of prescribed performance
indicators are audited each year by the Victorian Auditor General who issues an audit opinion on the
Performance Statement. The major initiatives detailed in the preceding pages will be reported in the Annual
Report in the form of a statement of progress in the report of operations.
3.7 Reconciliation with budgeted operating result
Leadership and Engagement
Natural Environment
Land Use Planning
Capital grants & contributions
Total funding sources
Deficit for the year
Economy
Community Wellbeing
Total activities & initiatives
Other non-attributable
Deficit before funding sources
General Rates & charges
26Minutes - Special Council Meeting of 24 June 2014 86
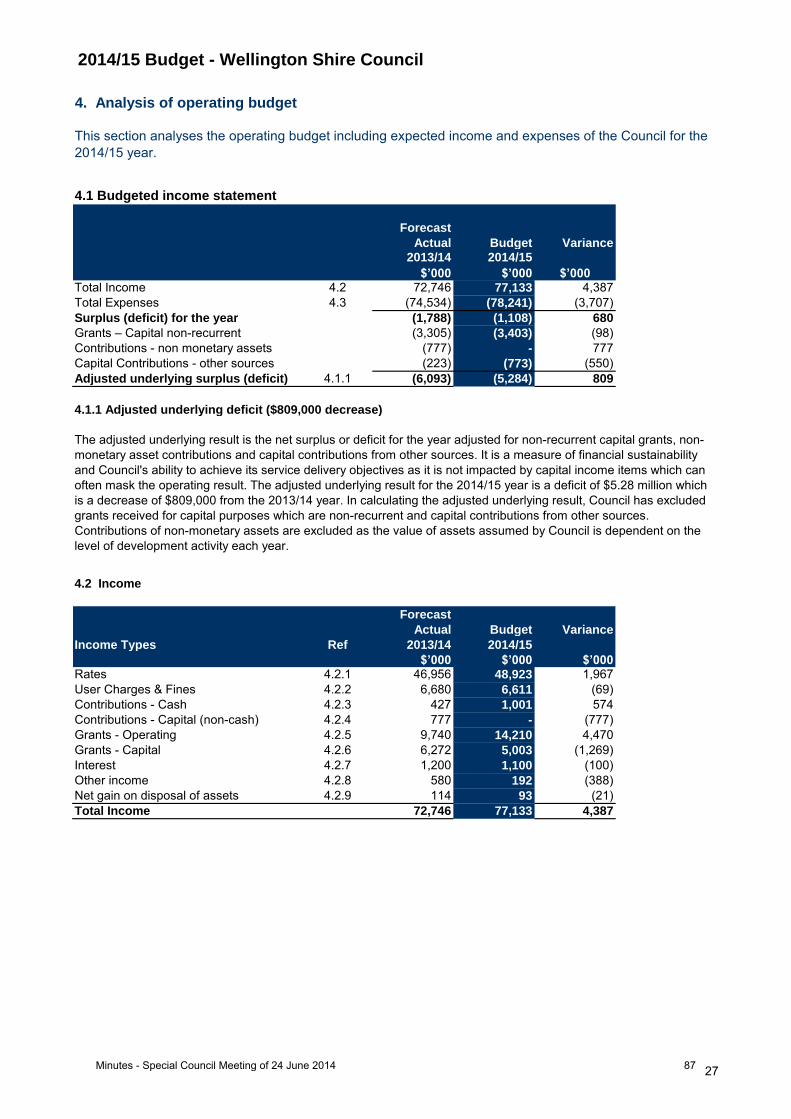
2014/15 Budget - Wellington Shire Council
4. Analysis of operating budget
4.1 Budgeted income statement
Forecast
Actual Budget Variance2013/14 2014/15
$’000 $’000 $’000Total Income 4.2 72,746 77,133 4,387
Total Expenses 4.3 (74,534) (78,241) (3,707)
Surplus (deficit) for the year (1,788) (1,108) 680
Grants – Capital non-recurrent (3,305) (3,403) (98)
Contributions - non monetary assets (777) - 777
Capital Contributions - other sources (223) (773) (550)
Adjusted underlying surplus (deficit) 4.1.1 (6,093) (5,284) 809
4.2 Income
Forecast
Actual Budget Variance
Income Types Ref 2013/14 2014/15
$’000 $’000 $’000Rates 4.2.1 46,956 48,923 1,967
User Charges & Fines 4.2.2 6,680 6,611 (69)
Contributions - Cash 4.2.3 427 1,001 574
Contributions - Capital (non-cash) 4.2.4 777 - (777)
Grants - Operating 4.2.5 9,740 14,210 4,470
Grants - Capital 4.2.6 6,272 5,003 (1,269)
Interest 4.2.7 1,200 1,100 (100)
Other income 4.2.8 580 192 (388)
Net gain on disposal of assets 4.2.9 114 93 (21)
Total Income 72,746 77,133 4,387
This section analyses the operating budget including expected income and expenses of the Council for the
2014/15 year.
The adjusted underlying result is the net surplus or deficit for the year adjusted for non-recurrent capital grants, non-
monetary asset contributions and capital contributions from other sources. It is a measure of financial sustainability
and Council's ability to achieve its service delivery objectives as it is not impacted by capital income items which can
often mask the operating result. The adjusted underlying result for the 2014/15 year is a deficit of $5.28 million which
is a decrease of $809,000 from the 2013/14 year. In calculating the adjusted underlying result, Council has excluded
grants received for capital purposes which are non-recurrent and capital contributions from other sources.
Contributions of non-monetary assets are excluded as the value of assets assumed by Council is dependent on the
level of development activity each year.
4.1.1 Adjusted underlying deficit ($809,000 decrease)
27Minutes - Special Council Meeting of 24 June 2014 87
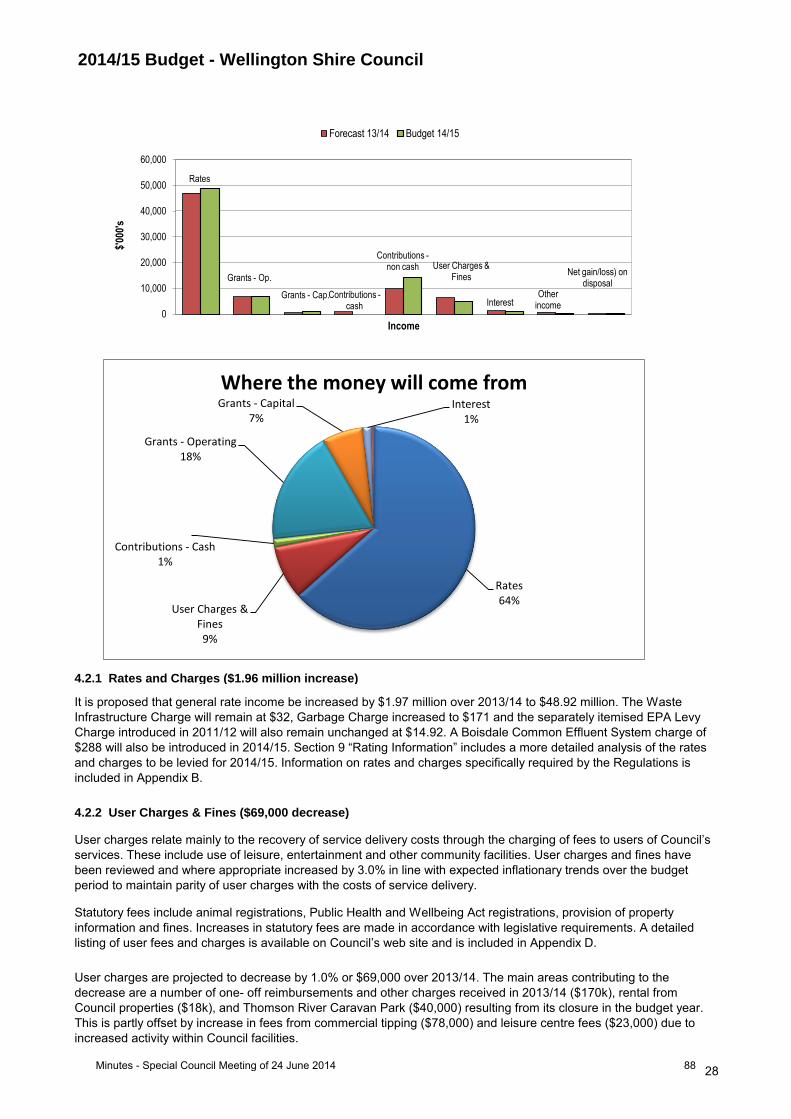
2014/15 Budget - Wellington Shire Council
User charges are projected to decrease by 1.0% or $69,000 over 2013/14. The main areas contributing to the
decrease are a number of one- off reimbursements and other charges received in 2013/14 ($170k), rental from
Council properties ($18k), and Thomson River Caravan Park ($40,000) resulting from its closure in the budget year.
This is partly offset by increase in fees from commercial tipping ($78,000) and leisure centre fees ($23,000) due to
increased activity within Council facilities.
4.2.2 User Charges & Fines ($69,000 decrease)
4.2.1 Rates and Charges ($1.96 million increase)
It is proposed that general rate income be increased by $1.97 million over 2013/14 to $48.92 million. The Waste
Infrastructure Charge will remain at $32, Garbage Charge increased to $171 and the separately itemised EPA Levy
Charge introduced in 2011/12 will also remain unchanged at $14.92. A Boisdale Common Effluent System charge of
$288 will also be introduced in 2014/15. Section 9 “Rating Information” includes a more detailed analysis of the rates
and charges to be levied for 2014/15. Information on rates and charges specifically required by the Regulations is
included in Appendix B.
Statutory fees include animal registrations, Public Health and Wellbeing Act registrations, provision of property
information and fines. Increases in statutory fees are made in accordance with legislative requirements. A detailed
listing of user fees and charges is available on Council’s web site and is included in Appendix D.
User charges relate mainly to the recovery of service delivery costs through the charging of fees to users of Council’s
services. These include use of leisure, entertainment and other community facilities. User charges and fines have
been reviewed and where appropriate increased by 3.0% in line with expected inflationary trends over the budget
period to maintain parity of user charges with the costs of service delivery.
Rates
Grants - Op.
Grants - Cap. Contributions
User Charges & Fines
Grants - Capital
Interest Net gain/(loss) on
disposal 0
10,000
20,000
30,000
40,000
50,000
60,000
$'000
Income
Forecast 13/14 Budget 14/15
Rates
Grants - Op.
Grants - Cap. Contributions - cash
Contributions - non cash
User Charges & Fines
Interest Other
income
Net gain/loss) on disposal
0
10,000
20,000
30,000
40,000
50,000
60,000
$'00
0's
Income
Forecast 13/14 Budget 14/15
Rates 64%
User Charges & Fines 9%
Contributions - Cash 1%
Grants - Operating
18%
Grants - Capital 7%
Interest 1%
Where the money will come from
28Minutes - Special Council Meeting of 24 June 2014 88
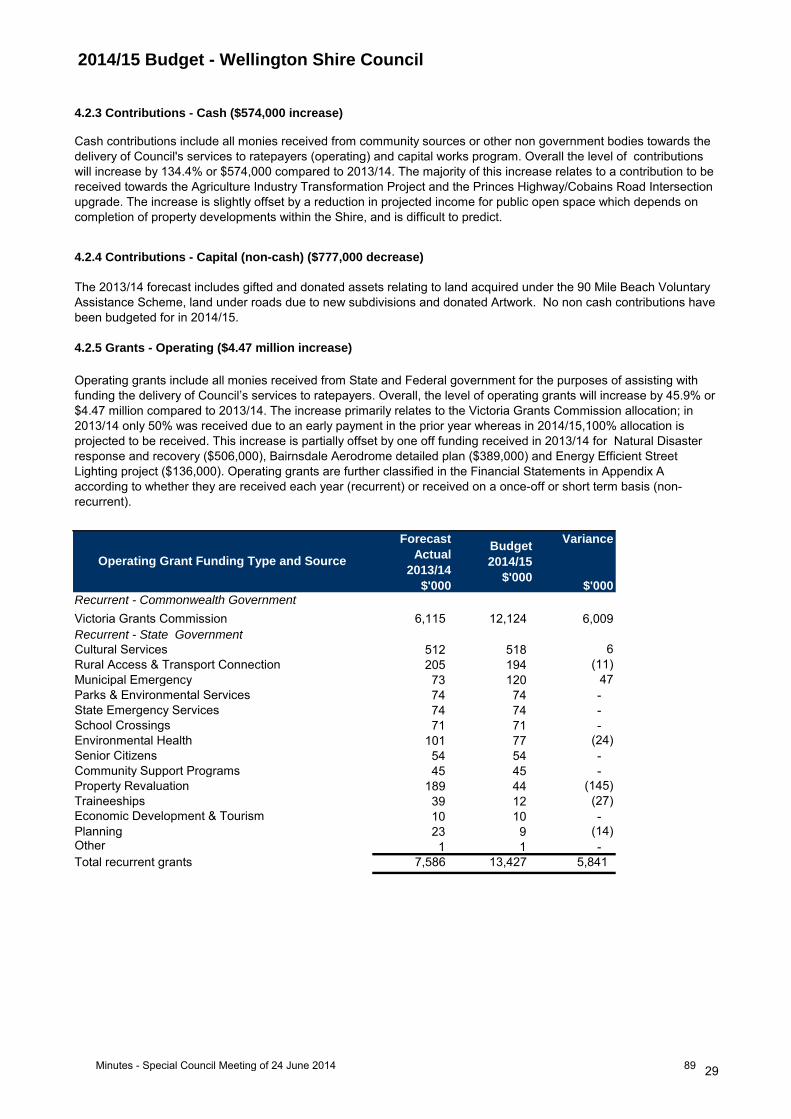
2014/15 Budget - Wellington Shire Council
Forecast
Actual
2013/14
$'000
Budget
2014/15
$'000
Variance
$'000Recurrent - Commonwealth Government
Victoria Grants Commission 6,115 12,124 6,009
Recurrent - State Government
Cultural Services 512 518 6
Rural Access & Transport Connection 205 194 (11)
Municipal Emergency 73 120 47
Parks & Environmental Services 74 74 -
State Emergency Services 74 74 -
School Crossings 71 71 -
Environmental Health 101 77 (24)
Senior Citizens 54 54 -
Community Support Programs 45 45 -
Property Revaluation 189 44 (145)
Traineeships 39 12 (27)
Economic Development & Tourism 10 10 -
Planning 23 9 (14)Other 1 1 -
Total recurrent grants 7,586 13,427 5,841
Operating Grant Funding Type and Source
4.2.5 Grants - Operating ($4.47 million increase)
4.2.3 Contributions - Cash ($574,000 increase)
Operating grants include all monies received from State and Federal government for the purposes of assisting with
funding the delivery of Council’s services to ratepayers. Overall, the level of operating grants will increase by 45.9% or
$4.47 million compared to 2013/14. The increase primarily relates to the Victoria Grants Commission allocation; in
2013/14 only 50% was received due to an early payment in the prior year whereas in 2014/15,100% allocation is
projected to be received. This increase is partially offset by one off funding received in 2013/14 for Natural Disaster
response and recovery ($506,000), Bairnsdale Aerodrome detailed plan ($389,000) and Energy Efficient Street
Lighting project ($136,000). Operating grants are further classified in the Financial Statements in Appendix A
according to whether they are received each year (recurrent) or received on a once-off or short term basis (non-
recurrent).
4.2.4 Contributions - Capital (non-cash) ($777,000 decrease)
The 2013/14 forecast includes gifted and donated assets relating to land acquired under the 90 Mile Beach Voluntary
Assistance Scheme, land under roads due to new subdivisions and donated Artwork. No non cash contributions have
been budgeted for in 2014/15.
Cash contributions include all monies received from community sources or other non government bodies towards the
delivery of Council's services to ratepayers (operating) and capital works program. Overall the level of contributions
will increase by 134.4% or $574,000 compared to 2013/14. The majority of this increase relates to a contribution to be
received towards the Agriculture Industry Transformation Project and the Princes Highway/Cobains Road Intersection
upgrade. The increase is slightly offset by a reduction in projected income for public open space which depends on
completion of property developments within the Shire, and is difficult to predict.
29Minutes - Special Council Meeting of 24 June 2014 89
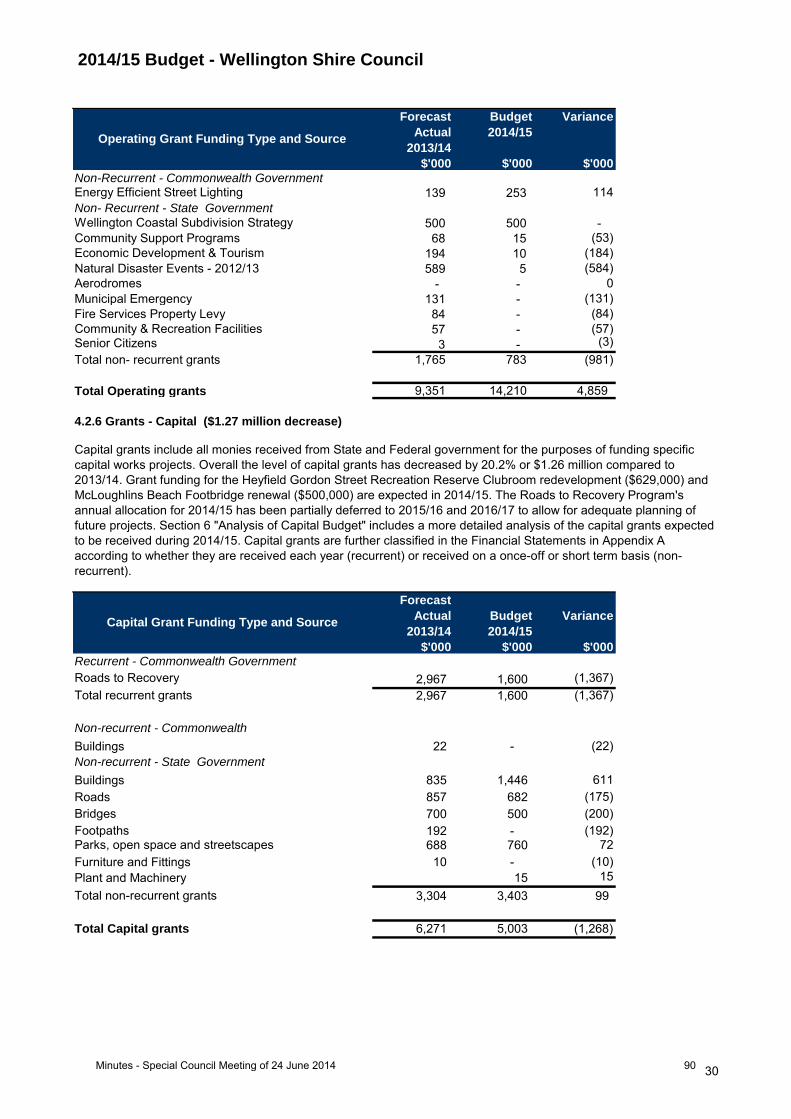
2014/15 Budget - Wellington Shire Council
Forecast
Actual
2013/14
$'000
Budget
2014/15
$'000
Variance
$'000
Non-Recurrent - Commonwealth Government Energy Efficient Street Lighting 139 253 114
Non- Recurrent - State Government
Wellington Coastal Subdivision Strategy 500 500 -
Community Support Programs 68 15 (53)
Economic Development & Tourism 194 10 (184)
Natural Disaster Events - 2012/13 589 5 (584)
Aerodromes - - 0
Municipal Emergency 131 - (131)
Fire Services Property Levy 84 - (84)
Community & Recreation Facilities 57 - (57)Senior Citizens 3 - (3)
Total non- recurrent grants 1,765 783 (981)
Total Operating grants 9,351 14,210 4,859
Forecast
Actual
2013/14
$'000
Budget
2014/15
$'000
Variance
$'000Recurrent - Commonwealth Government
Roads to Recovery 2,967 1,600 (1,367)
Total recurrent grants 2,967 1,600 (1,367)
Non-recurrent - Commonwealth
Government Buildings 22 - (22)
Non-recurrent - State Government
Buildings 835 1,446 611
Roads 857 682 (175)
Bridges 700 500 (200)
Footpaths 192 - (192)Parks, open space and streetscapes 688 760 72
Furniture and Fittings 10 - (10)
Plant and Machinery 15 15
Total non-recurrent grants 3,304 3,403 99
Total Capital grants 6,271 5,003 (1,268)
Operating Grant Funding Type and Source
Capital Grant Funding Type and Source
4.2.6 Grants - Capital ($1.27 million decrease)
Capital grants include all monies received from State and Federal government for the purposes of funding specific
capital works projects. Overall the level of capital grants has decreased by 20.2% or $1.26 million compared to
2013/14. Grant funding for the Heyfield Gordon Street Recreation Reserve Clubroom redevelopment ($629,000) and
McLoughlins Beach Footbridge renewal ($500,000) are expected in 2014/15. The Roads to Recovery Program's
annual allocation for 2014/15 has been partially deferred to 2015/16 and 2016/17 to allow for adequate planning of
future projects. Section 6 "Analysis of Capital Budget" includes a more detailed analysis of the capital grants expected
to be received during 2014/15. Capital grants are further classified in the Financial Statements in Appendix A
according to whether they are received each year (recurrent) or received on a once-off or short term basis (non-
recurrent).
30Minutes - Special Council Meeting of 24 June 2014 90

2014/15 Budget - Wellington Shire Council
Interest on investments is expected to decrease by $100,000 or 8.3% compared to the 2013/14 forecast. This is
mainly due to the increased budgeted expenditure during 2014/15, which will result in reduced funds being available
for investment during the year.
4.2.7 Interest ($100,000 decrease)
4.2.9 Net gain (Loss) on Disposal of Assets ($21,000 decrease)
Other income relates to a range of items such as interest on outstanding rates and charges, insurance recoveries and
other miscellaneous income items. Other income is forecast to decrease by 66.9% or $388,000 compared to 2013/14.
This is mainly due to a forecast reduction in interest on outstanding rates and charges ($79,700) and insurance
recoveries ($117,000).
Net gain from the sale of Council assets of $93,000 for 2014/15 relates mainly to the planned cyclical replacement of
part of the plant and vehicle fleet. This revenue item fluctuates from year to year, depending on the availability of
assets considered surplus to requirements or due for renewal.
4.2.8 Other income ($388,000 decrease)
31Minutes - Special Council Meeting of 24 June 2014 91
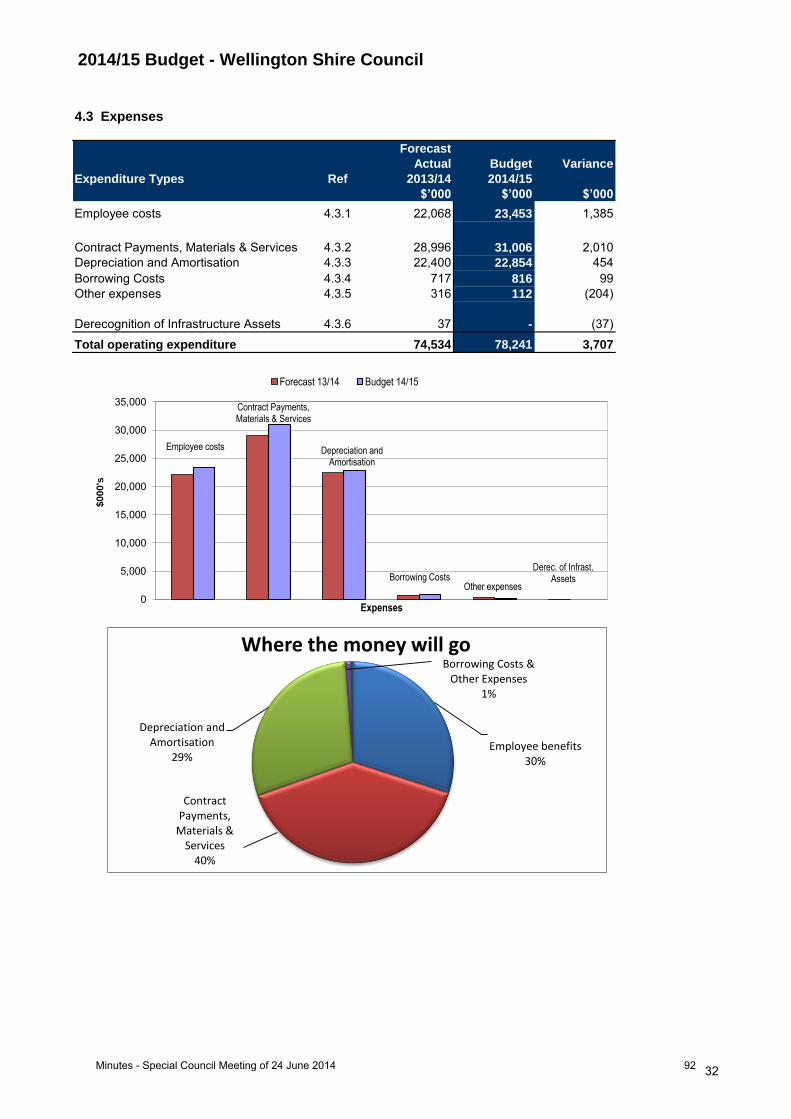
2014/15 Budget - Wellington Shire Council
Forecast
Actual Budget Variance
Expenditure Types Ref 2013/14 2014/15
$’000 $’000 $’000
Employee costs 4.3.1 22,068 23,453 1,385
Contract Payments, Materials & Services 4.3.2 28,996 31,006 2,010
Depreciation and Amortisation 4.3.3 22,400 22,854 454
Borrowing Costs 4.3.4 717 816 99
Other expenses 4.3.5 316 112 (204)
Derecognition of Infrastructure Assets 4.3.6 37 - (37)
Total operating expenditure 74,534 78,241 3,707
4.3 Expenses
Employee costs
Contract Payments, Materials & Services
Depreciation and Amortisation
Borrowing Costs Other expenses
Derec. of Infrast. Assets
0
5,000
10,000
15,000
20,000
25,000
30,000
35,000
$000's
Expenses
Forecast 13/14 Budget 14/15
Employee benefits 30%
Contract Payments,
Materials & Services
40%
Depreciation and Amortisation
29%
Borrowing Costs & Other Expenses
1%
Where the money will go
32Minutes - Special Council Meeting of 24 June 2014 92
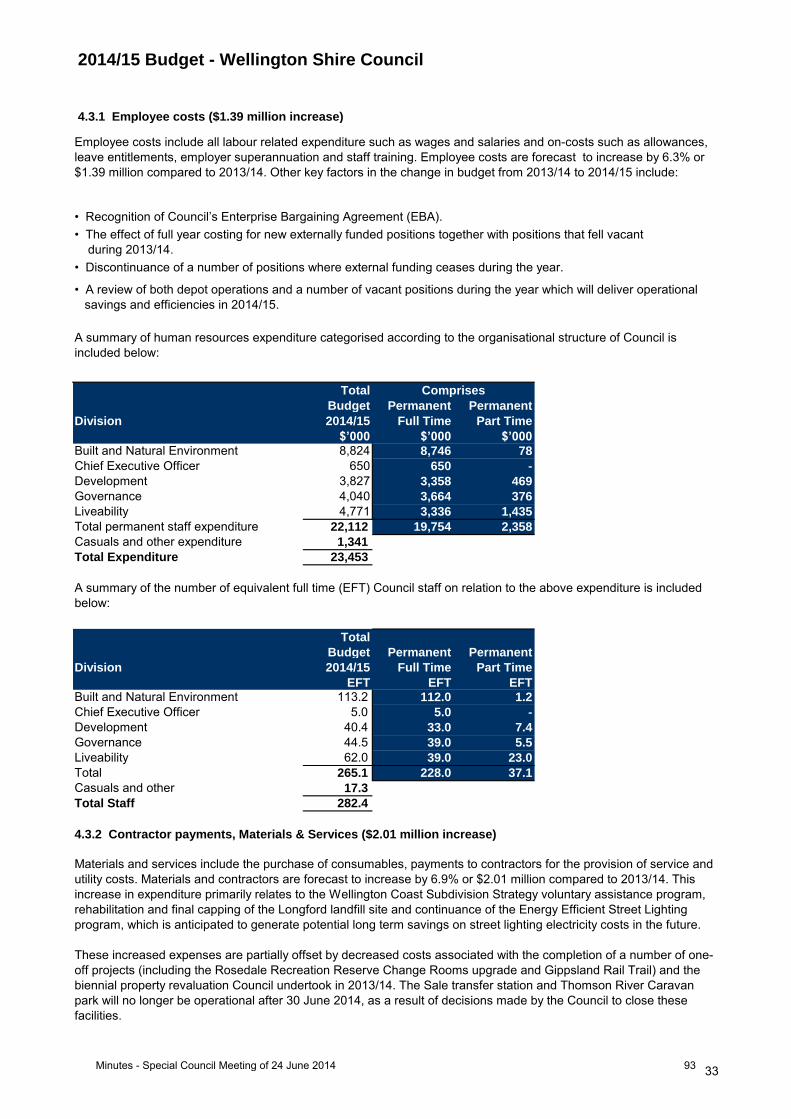
2014/15 Budget - Wellington Shire Council
Total
Budget Permanent Permanent
Division 2014/15 Full Time Part Time
$’000 $’000 $’000Built and Natural Environment 8,824 8,746 78
Chief Executive Officer 650 650 -
Development 3,827 3,358 469
Governance 4,040 3,664 376
Liveability 4,771 3,336 1,435
Total permanent staff expenditure 22,112 19,754 2,358
Casuals and other expenditure 1,341
Total Expenditure 23,453
Total
Budget Permanent Permanent
Division 2014/15 Full Time Part Time
EFT EFT EFTBuilt and Natural Environment 113.2 112.0 1.2
Chief Executive Officer 5.0 5.0 -
Development 40.4 33.0 7.4
Governance 44.5 39.0 5.5
Liveability 62.0 39.0 23.0
Total 265.1 228.0 37.1
Casuals and other 17.3
Total Staff 282.4
• Recognition of Council’s Enterprise Bargaining Agreement (EBA).
Employee costs include all labour related expenditure such as wages and salaries and on-costs such as allowances,
leave entitlements, employer superannuation and staff training. Employee costs are forecast to increase by 6.3% or
$1.39 million compared to 2013/14. Other key factors in the change in budget from 2013/14 to 2014/15 include:
4.3.1 Employee costs ($1.39 million increase)
• Discontinuance of a number of positions where external funding ceases during the year.
• A review of both depot operations and a number of vacant positions during the year which will deliver operational
savings and efficiencies in 2014/15.
• The effect of full year costing for new externally funded positions together with positions that fell vacant
during 2013/14.
A summary of human resources expenditure categorised according to the organisational structure of Council is
included below:
A summary of the number of equivalent full time (EFT) Council staff on relation to the above expenditure is included
below:
4.3.2 Contractor payments, Materials & Services ($2.01 million increase)
Materials and services include the purchase of consumables, payments to contractors for the provision of service and
utility costs. Materials and contractors are forecast to increase by 6.9% or $2.01 million compared to 2013/14. This
increase in expenditure primarily relates to the Wellington Coast Subdivision Strategy voluntary assistance program,
rehabilitation and final capping of the Longford landfill site and continuance of the Energy Efficient Street Lighting
program, which is anticipated to generate potential long term savings on street lighting electricity costs in the future.
These increased expenses are partially offset by decreased costs associated with the completion of a number of one-
off projects (including the Rosedale Recreation Reserve Change Rooms upgrade and Gippsland Rail Trail) and the
biennial property revaluation Council undertook in 2013/14. The Sale transfer station and Thomson River Caravan
park will no longer be operational after 30 June 2014, as a result of decisions made by the Council to close these
facilities.
Comprises
33Minutes - Special Council Meeting of 24 June 2014 93

2014/15 Budget - Wellington Shire Council
Depreciation relates to the usage of Council’s property, plant and equipment including infrastructure assets such as
roads and drains. The increase of $454,000 for 2014/15 is due mainly to the completion of the 2014/15 capital works
program and the full year effect of depreciation on the 2013/14 capital works program. Refer to Section 6 “Analysis of
Capital Budget” for a more detailed analysis of Council’s capital works program for the 2014/15 year.
4.3.3 Depreciation and Amortisation ($454,000 increase)
4.3.5 Other expenses ($204,000 decrease)
4.3.4 Borrowing Costs ($99,000 increase)
4.3.6 Derecognition of Infrastructure Assets ($37,000 decrease)
A decrease in other expenses relates to an assets written off adjustment and a one off compensation amount paid in
2013/14.
Finance costs relate to interest charged by financial institutions on funds borrowed. The increase in borrowing costs
results from the planned repayment of principal in accordance with loan agreements. Loan borrowings of $1.3 million
are planned in 2014/15.
The completion of the Road Management Plan review in 2013/14 has resulted in the derecognition of some road
assets (mainly bridges and drainage) as they are no longer council maintained.
34Minutes - Special Council Meeting of 24 June 2014 94
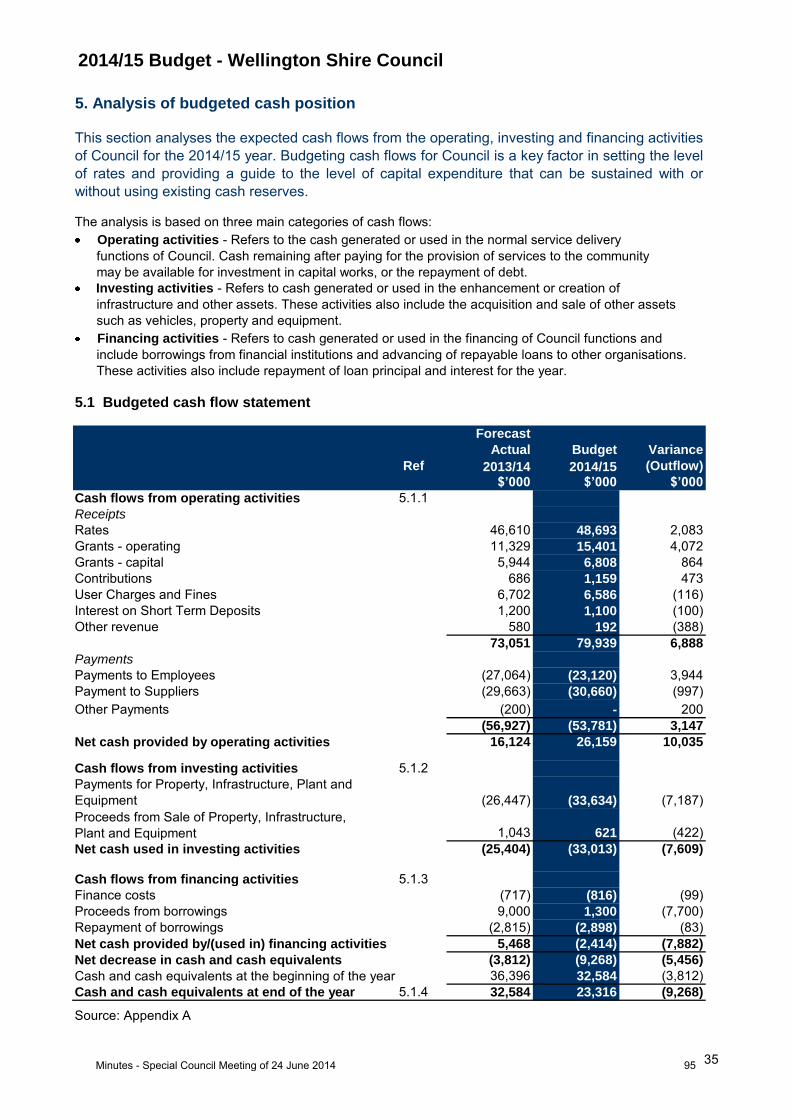
2014/15 Budget - Wellington Shire Council
5.1 Budgeted cash flow statement
Forecast
Actual Budget Variance
Ref 2013/14 2014/15 (Outflow)
$’000 $’000 $’000
Cash flows from operating activities 5.1.1
Receipts
Rates 46,610 48,693 2,083
Grants - operating 11,329 15,401 4,072
Grants - capital 5,944 6,808 864
Contributions 686 1,159 473
User Charges and Fines 6,702 6,586 (116)
Interest on Short Term Deposits 1,200 1,100 (100)
Other revenue 580 192 (388)
73,051 79,939 6,888
Payments
Payments to Employees (27,064) (23,120) 3,944
Payment to Suppliers (29,663) (30,660) (997)
Other Payments (200) - 200
(56,927) (53,781) 3,147
16,124 26,159 10,035
Cash flows from investing activities 5.1.2
Payments for Property, Infrastructure, Plant and
Equipment (26,447) (33,634) (7,187)
Proceeds from Sale of Property, Infrastructure,
Plant and Equipment 1,043 621 (422)
(25,404) (33,013) (7,609)
Cash flows from financing activities 5.1.3
Finance costs (717) (816) (99)
Proceeds from borrowings 9,000 1,300 (7,700)
Repayment of borrowings (2,815) (2,898) (83)
5,468 (2,414) (7,882)
(3,812) (9,268) (5,456)
36,396 32,584 (3,812)
Cash and cash equivalents at end of the year 5.1.4 32,584 23,316 (9,268)
Source: Appendix A
Net cash provided by operating activities
Net cash used in investing activities
5. Analysis of budgeted cash position
This section analyses the expected cash flows from the operating, investing and financing activities
of Council for the 2014/15 year. Budgeting cash flows for Council is a key factor in setting the level
of rates and providing a guide to the level of capital expenditure that can be sustained with or
without using existing cash reserves.
The analysis is based on three main categories of cash flows:
Operating activities - Refers to the cash generated or used in the normal service delivery
functions of Council. Cash remaining after paying for the provision of services to the community
may be available for investment in capital works, or the repayment of debt.
Investing activities - Refers to cash generated or used in the enhancement or creation of
infrastructure and other assets. These activities also include the acquisition and sale of other assets
such as vehicles, property and equipment.
Financing activities - Refers to cash generated or used in the financing of Council functions and
include borrowings from financial institutions and advancing of repayable loans to other organisations.
These activities also include repayment of loan principal and interest for the year.
Cash and cash equivalents at the beginning of the year
Net cash provided by/(used in) financing activities
Net decrease in cash and cash equivalents
35Minutes - Special Council Meeting of 24 June 2014 95

2014/15 Budget - Wellington Shire Council
Forecast
Actual Budget Variance
2013/14 2014/15
$’000 $’000 $’000Net surplus (deficit) for the year (1,788) (1,108) 680
Depreciation 22,400 22,854 454Gain on sale of assets (114) (93) 21Write off of assets 16 - (16)
Finance Costs 717 816 100
Non cash contributions (777) - 777 Derecognition of assets 37 - (37)
Net movement in current assets and liabilities (4,367) 3,689 8,05616,124 26,159 10,035
The $7.19 million increase in payments for property, infrastructure, plant and equipment represents
Council's continued commitment to the renewal of community assets and delivering improvements to
facilities in line with the Infrastructure Strategy as per Section 11. More detailed information on the 2014/15
capital program can be found in Appendix C.
5.1.2 Investing activities ($7.61 million increase)
The net cash flows from operating activities does not equal the surplus (deficit) for the year as the expected
revenues and expenses of the Council include non-cash items which have been excluded from the Cash
Flow Statement. The budgeted operating result is reconciled to budgeted cash flows available from
operating activities as set out in the following table.
5.1.3 Financing activities ($7.88 million decrease)
Overall, total cash and investments is forecast to decrease by $9.27 million to $23.32 million as at
30 June 2015, partly due to some 2013/14 projects that will be completed in 2014/15 as well as reflecting
Council’s strategy of using excess cash and investments to support renewal of ageing infrastructure assets
and service debt. The cash at the end of the year will be sufficient to meet Councils short term
commitments, cover required reserves and fund carried forward expenditure.
5.1.4 Cash and cash equivalents at end of the year ($9.27 million decrease)
The decrease in loan borrowings results from the $6 million required in 2013/14 to fund major capital
projects and $3.0 million to fund the unfunded superannuation liability. In 2014/15 $1.3 million is required to
fund the Princes Highway/Cobains Road Intersection upgrade (borrowings deferred from 2013/14) whilst
loan principal and interest repayments have also increased by $182,000. Refer to Section 10 Borrowing
Strategy for further details.
Cash flows available from operating activities
5.1.1 Operating activities ($10.04 million increase)
The increase in cash flows from operating activities is mainly due to expected payment of 100% of the
2014/15 Victoria Grants Commission allocation (compared to 50% received in 2013/14) and additional rates
and charges income of $2.08 million.
36Minutes - Special Council Meeting of 24 June 2014 96
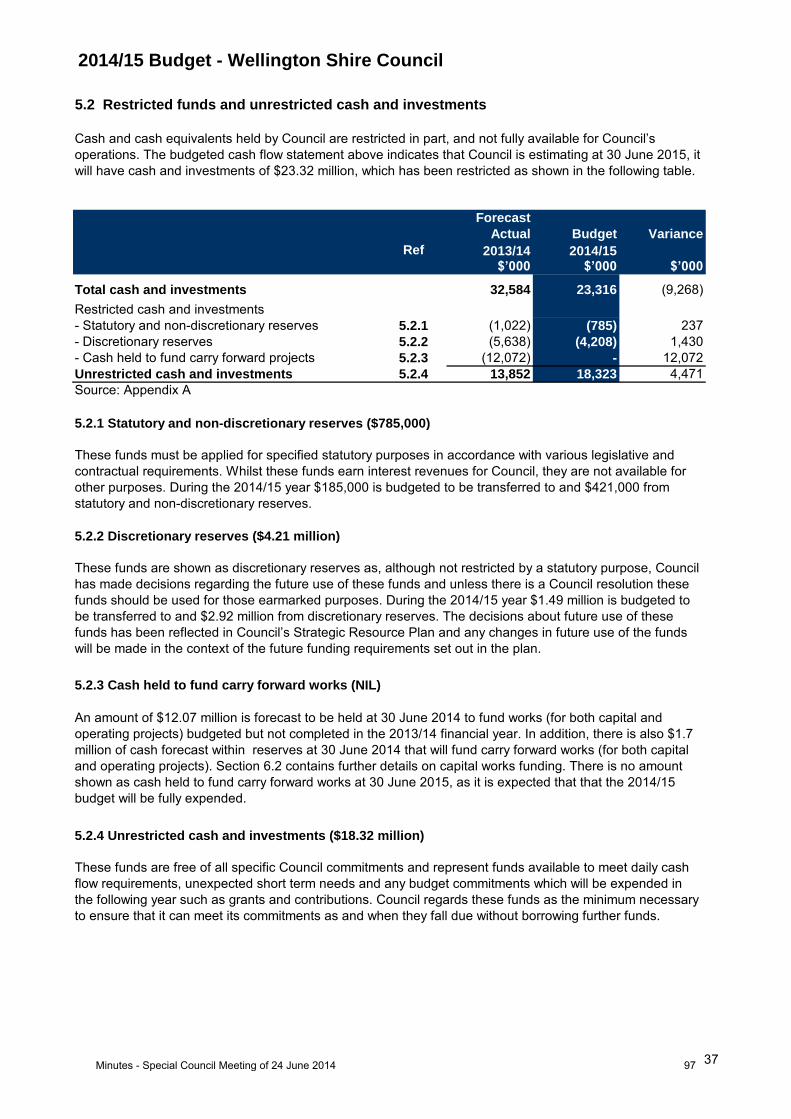
2014/15 Budget - Wellington Shire Council
Forecast
Actual Budget Variance
Ref 2013/14 2014/15$’000 $’000 $’000
Total cash and investments 32,584 23,316 (9,268)
Restricted cash and investments
- Statutory and non-discretionary reserves 5.2.1 (1,022) (785) 237
- Discretionary reserves 5.2.2 (5,638) (4,208) 1,430
- Cash held to fund carry forward projects 5.2.3 (12,072) - 12,072
Unrestricted cash and investments 5.2.4 13,852 18,323 4,471
Source: Appendix A
These funds must be applied for specified statutory purposes in accordance with various legislative and
contractual requirements. Whilst these funds earn interest revenues for Council, they are not available for
other purposes. During the 2014/15 year $185,000 is budgeted to be transferred to and $421,000 from
statutory and non-discretionary reserves.
5.2.1 Statutory and non-discretionary reserves ($785,000)
5.2 Restricted funds and unrestricted cash and investments
Cash and cash equivalents held by Council are restricted in part, and not fully available for Council’s
operations. The budgeted cash flow statement above indicates that Council is estimating at 30 June 2015, it
will have cash and investments of $23.32 million, which has been restricted as shown in the following table.
5.2.4 Unrestricted cash and investments ($18.32 million)
5.2.2 Discretionary reserves ($4.21 million)
An amount of $12.07 million is forecast to be held at 30 June 2014 to fund works (for both capital and
operating projects) budgeted but not completed in the 2013/14 financial year. In addition, there is also $1.7
million of cash forecast within reserves at 30 June 2014 that will fund carry forward works (for both capital
and operating projects). Section 6.2 contains further details on capital works funding. There is no amount
shown as cash held to fund carry forward works at 30 June 2015, as it is expected that that the 2014/15
budget will be fully expended.
5.2.3 Cash held to fund carry forward works (NIL)
These funds are shown as discretionary reserves as, although not restricted by a statutory purpose, Council
has made decisions regarding the future use of these funds and unless there is a Council resolution these
funds should be used for those earmarked purposes. During the 2014/15 year $1.49 million is budgeted to
be transferred to and $2.92 million from discretionary reserves. The decisions about future use of these
funds has been reflected in Council’s Strategic Resource Plan and any changes in future use of the funds
will be made in the context of the future funding requirements set out in the plan.
These funds are free of all specific Council commitments and represent funds available to meet daily cash
flow requirements, unexpected short term needs and any budget commitments which will be expended in
the following year such as grants and contributions. Council regards these funds as the minimum necessary
to ensure that it can meet its commitments as and when they fall due without borrowing further funds.
37Minutes - Special Council Meeting of 24 June 2014 97
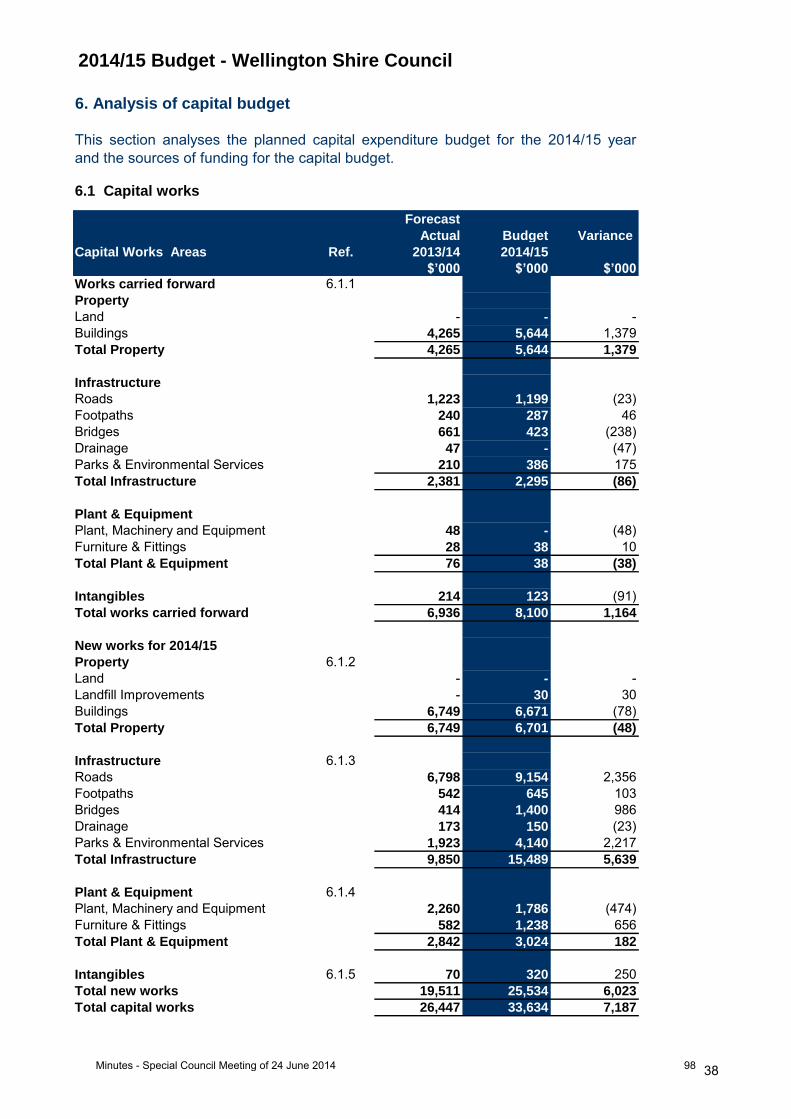
2014/15 Budget - Wellington Shire Council
Forecast
Actual Budget Variance
Capital Works Areas Ref. 2013/14 2014/15
$’000 $’000 $’000Works carried forward 6.1.1
Property
Land - - -
Buildings 4,265 5,644 1,379
Total Property 4,265 5,644 1,379
Infrastructure
Roads 1,223 1,199 (23)
Footpaths 240 287 46
Bridges 661 423 (238)
Drainage 47 - (47)
Parks & Environmental Services 210 386 175
Total Infrastructure 2,381 2,295 (86)
Plant & Equipment
Plant, Machinery and Equipment 48 - (48)
Furniture & Fittings 28 38 10
Total Plant & Equipment 76 38 (38)
Intangibles 214 123 (91)
Total works carried forward 6,936 8,100 1,164
New works for 2014/15
Property 6.1.2
Land - - -
Landfill Improvements - 30 30
Buildings 6,749 6,671 (78)
Total Property 6,749 6,701 (48)
Infrastructure 6.1.3
Roads 6,798 9,154 2,356
Footpaths 542 645 103
Bridges 414 1,400 986
Drainage 173 150 (23)
Parks & Environmental Services 1,923 4,140 2,217
Total Infrastructure 9,850 15,489 5,639
Plant & Equipment 6.1.4
Plant, Machinery and Equipment 2,260 1,786 (474)
Furniture & Fittings 582 1,238 656
Total Plant & Equipment 2,842 3,024 182
Intangibles 6.1.5 70 320 250
Total new works 19,511 25,534 6,023
Total capital works 26,447 33,634 7,187
6. Analysis of capital budget
6.1 Capital works
This section analyses the planned capital expenditure budget for the 2014/15 year
and the sources of funding for the capital budget.
38Minutes - Special Council Meeting of 24 June 2014 98
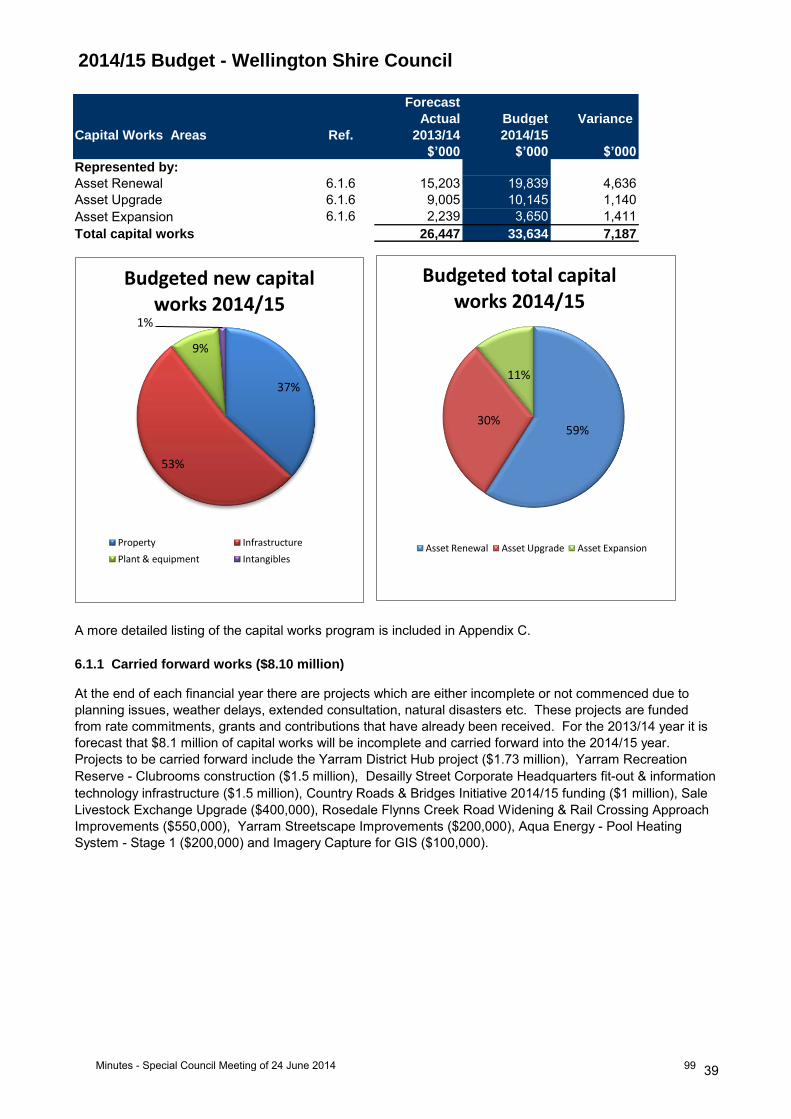
2014/15 Budget - Wellington Shire Council
Forecast
Actual Budget Variance
Capital Works Areas Ref. 2013/14 2014/15
$’000 $’000 $’000Represented by:
Asset Renewal 6.1.6 15,203 19,839 4,636
Asset Upgrade 6.1.6 9,005 10,145 1,140
Asset Expansion 6.1.6 2,239 3,650 1,411
Total capital works 26,447 33,634 7,187
A more detailed listing of the capital works program is included in Appendix C.
6.1.1 Carried forward works ($8.10 million)
At the end of each financial year there are projects which are either incomplete or not commenced due to
planning issues, weather delays, extended consultation, natural disasters etc. These projects are funded
from rate commitments, grants and contributions that have already been received. For the 2013/14 year it is
forecast that $8.1 million of capital works will be incomplete and carried forward into the 2014/15 year.
Projects to be carried forward include the Yarram District Hub project ($1.73 million), Yarram Recreation
Reserve - Clubrooms construction ($1.5 million), Desailly Street Corporate Headquarters fit-out & information
technology infrastructure ($1.5 million), Country Roads & Bridges Initiative 2014/15 funding ($1 million), Sale
Livestock Exchange Upgrade ($400,000), Rosedale Flynns Creek Road Widening & Rail Crossing Approach
Improvements ($550,000), Yarram Streetscape Improvements ($200,000), Aqua Energy - Pool Heating
System - Stage 1 ($200,000) and Imagery Capture for GIS ($100,000).
37%
53%
9%
1%
Budgeted new capital works 2014/15
Property Infrastructure
Plant & equipment Intangibles
59% 30%
11%
Budgeted total capital works 2014/15
Asset Renewal Asset Upgrade Asset Expansion
39Minutes - Special Council Meeting of 24 June 2014 99
2014/15 Budget - Wellington Shire Council
6.1.5 Intangibles ($320,000)
Plant and equipment includes major plant and equipment, computers and telecommunications, library books
and art works.
For the 2014/15 year, $3.02 million will be expended on plant, equipment and other projects. The most
significant projects include ongoing cyclical replacement of plant and vehicle fleet ($1.79 million), upgrade
and replacement of information technology for the Desailly Street Corporate Headquarters ($769,000) and
library material purchases ($251,000).
Infrastructure includes roads, bridges, footpath and cycleways, drainage, waste management, parks, open
space and streetscapes, off street car parks and other structures.
For the 2014/15 year, $11.20 million will be expended on road, bridge and footpath projects. The more
significant projects include the annual road reseals program ($3.55 million), Princes Highway/Cobains Road
Intersection upgrade ($2.47 million), federally funded Roads to Recovery projects ($1.60 million), unsealed
roads reconstruction program ($1.00 million), McLoughlins Beach Footbridge renewal ($750,000) and annual
footpath program ($645,000)
Drainage projects for 2014/15 include minor drainage networks renewal works ($150,000).
$4.14 million will be expended on parks, open space, streetscapes and waste management. The most
significant include the implementation of the fourth year of the Sale Streetscape improvements infrastructure
renewal program ($1.00 million), Yarram streetscape improvement ($800,000) and Heyfield George Street
parking redevelopment ($250,000), Loch Sport Skate Park ($140,000), playground renewal program
($120,000) and $753,000 to be expended on waste management projects.
6.1.2 Property ($6.70 million)
The property class comprises buildings and building improvements including community facilities, municipal
offices, recreation and leisure facilities.
For the 2014/15 year, $6.70 million will be expended on building and building improvements. The most
significant projects include the Port of Sale Cultural Hub & Desailly Street Corporate Headquarters ($2.5
million), Heyfield Gordon Street Recreation Reserve clubrooms redevelopment ($1.35 million), Sale Livestock
upgrade ($400,000), upgrades to Council's managed boating facilities($306,000), Aqua Energy Pool works
($280,000) and Sale Stephenson Park lighting upgrade ($265,000).
6.1.4 Plant and equipment ($3.02 million)
6.1.3 Infrastructure ($15.49 million)
For the 2014/15 year, $320,000 will be expended on corporate systems and applications and updates to
Council's mapping system.
40Minutes - Special Council Meeting of 24 June 2014 100
2014/15 Budget - Wellington Shire Council
6.1.6 Asset Renewal ($19.84 million), upgrade ($10.15 million) and expansion ($3.65 million)
The majority of renewal expenditure is related to infrastructure spending on roads, bridges, footpaths and
drainage ($8.49 million) and renewal of Council's plant and vehicle fleet ($1.79 million). Other capital items to
be renewed in 2014/15 include buildings ($5.57 million) and open space projects ($2.67 million).
Capital items to be upgraded in 2014/15 include $2.39 million in roads, $1.49 million on Port of Sale Cultural
Hub & Desailly Street Corporate Headquarters, Yarram District Hub ($1.05 million), $400,000 on the Sale
Livestock Exchange upgrade, $305,000 on upgrades to Council's managed boating facilities and $508,000 on
waste management projects.
Capital expansion projects include carried forward projects from 2013/14 - Princes Highway/Cobains Road
intersection upgrade ($1.58 million) and Yarram District Hub ($860,000).
41Minutes - Special Council Meeting of 24 June 2014 101
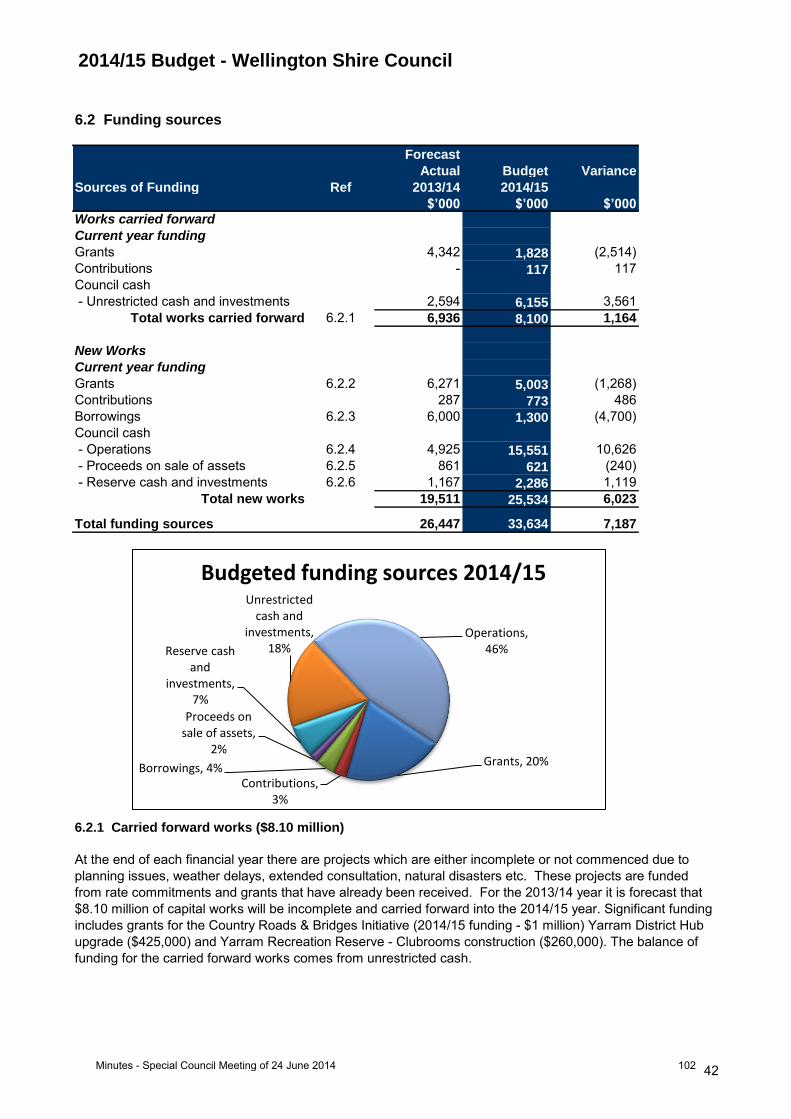
2014/15 Budget - Wellington Shire Council
6.2 Funding sources
Forecast
Actual Budget Variance
Sources of Funding Ref 2013/14 2014/15
$’000 $’000 $’000Works carried forward
Current year funding
Grants 4,342 1,828 (2,514)
Contributions - 117 117
Council cash
- Unrestricted cash and investments 2,594 6,155 3,561
Total works carried forward 6.2.1 6,936 8,100 1,164
New Works
Current year funding
Grants 6.2.2 6,271 5,003 (1,268)
Contributions 287 773 486
Borrowings 6.2.3 6,000 1,300 (4,700)
Council cash
- Operations 6.2.4 4,925 15,551 10,626
- Proceeds on sale of assets 6.2.5 861 621 (240)
- Reserve cash and investments 6.2.6 1,167 2,286 1,119
Total new works 19,511 25,534 6,023
Total funding sources 26,447 33,634 7,187
At the end of each financial year there are projects which are either incomplete or not commenced due to
planning issues, weather delays, extended consultation, natural disasters etc. These projects are funded
from rate commitments and grants that have already been received. For the 2013/14 year it is forecast that
$8.10 million of capital works will be incomplete and carried forward into the 2014/15 year. Significant funding
includes grants for the Country Roads & Bridges Initiative (2014/15 funding - $1 million) Yarram District Hub
upgrade ($425,000) and Yarram Recreation Reserve - Clubrooms construction ($260,000). The balance of
funding for the carried forward works comes from unrestricted cash.
6.2.1 Carried forward works ($8.10 million)
Grants, 20%
Contributions, 3%
Borrowings, 4%
Proceeds on sale of assets,
2%
Reserve cash and
investments, 7%
Unrestricted cash and
investments, 18%
Operations, 46%
Budgeted funding sources 2014/15
42Minutes - Special Council Meeting of 24 June 2014 102
2014/15 Budget - Wellington Shire Council
6.2.3 Borrowings ($1.3 million)
The loan borrowing of $1.3 million for the Princes Highway/Cobains Road intersection upgrade initially
planned for 2013/14 has now been deferred to 2014/15.
6.2.2 Grants ($5.00 million) and Contributions ($773,000)
Capital grants and contributions include all monies received from State, Federal and community sources for
the purposes of funding the capital works program.
Significant grants are budgeted to be received for the Roads to Recovery projects ($1.6 million), Heyfield
Gordon Street Recreation Reserve Clubroom redevelopment (629,000), Sale Streetscape Improvements -
Infrastructure renewal Program ($500,000), McLoughlins Beach Footbridge Renewal ($500,000), Yarram
Recreation Reserve - Clubrooms construction (final instalments - $390,000), upgrades to Council's managed
boating facilities (150,000) and Sale Stephensons Park lighting upgrade ($100,000).
Contributions are budgeted to be received for projects including Princes Highway/Cobains Road Intersection
upgrade ($671,000) and Heyfield Gordon Street Recreation Reserve Clubroom redevelopment ($50,000).
6.2.5 Council cash - proceeds from sale of assets ($621,000)
Proceeds from sale of assets includes trade-in of major plant ($488,000) and motor vehicles ($133,000) in
accordance with Council’s fleet and plant renewal policy.
6.2.4 Council cash - operations ($15.55 million)
During the year Council generates cash from its operating activities, which is used as a funding source for the
capital works program. It is forecast that $15.55 million will be generated from within operations to fund the
2014/15 capital works program.
6.2.6 Council cash - Reserve cash and investments ($2.28 million)
Council has adequate cash reserves, which it is currently using to fund its annual capital works program. For
2014/15 $2.28 million will be used to fund part of the new capital works program including waste infrastructure
projects ($783,000), plant renewal ($612,000), Desailly Street Corporate Headquarters ($400,000),
Woodside Beach Caravan Park fire services upgrade (175,000), Sale Motor Village electrical works
($117,000), Yarram Recreation Reserve - Clubrooms construction ($103,000), Wurruk Neighbourhood Park
BBQ Shelter ($50,000) and Loch Sport Skatepark ($45,000).
43Minutes - Special Council Meeting of 24 June 2014 103

2014/15 Budget - Wellington Shire Council
7.1 Budgeted balance sheet
Forecast
Actual Budget Variance
Ref 2014 2015
$’000 $’000 $’000
Assets
Current assets 7.1.1
Cash and Cash Equivalents 32,584 23,316 (9,268)
Trade and Other receivables 6,978 4,147 (2,831)
Other Assets 292 292 -
Total current assets 39,854 27,755 (12,099)
Non-current assets 7.1.1
Trade and Other receivables 1,051 873 (178)
Property, Infrastructure, Plant &
Equipment 858,482 868,587 10,105
Intangibles 485 631 146
Total non-current assets 860,018 870,091 10,073
Total assets 899,872 897,846 (2,026)
Liabilities
Current liabilities 7.1.2
Trade and Other Payables 5,122 5,475 (353)
Interest-Bearing Borrowings 2,898 3,197 (299)
Provisions 5,326 5,627 (301)
Trust funds and deposits 600 600 -
Total current liabilities 13,946 14,899 (953)
Non-current liabilities 7.1.2
Interest-Bearing Borrowings 13,077 11,180 1,897
Provisions 1,884 1,910 (26)
Total non-current liabilities 14,961 13,090 1,871
Total liabilities 28,907 27,989 918
Net assets 7.1.3 870,965 869,857 (1,108)
Equity 7.1.4
Accumulated surplus 268,402 268,961 559
Asset revaluation reserve 595,903 595,903 -
Other reserves 6,660 4,993 (1,667)
Total Equity 870,965 869,857 (1,108)
Source: Appendix A
7. Analysis of budgeted financial position
Cash and cash equivalents include cash and investments such as cash held in the bank and in petty cash
and the value of investments in deposits or other highly liquid investments with terms to maturity of three
months or less. These balances are projected to decrease by $9.27 million mainly to fund carried forward
capital works and operating projects.
This section analyses the movements in assets, liabilities and equity between 2013/14 and
2014/15. It also considers a number of key performance indicators.
7.1.1 Current Assets ($12.10 million decrease) and Non-Current Assets ($10.07 million increase)
Trade and other receivables are monies owed to Council by ratepayers and others. Both short term debtors
and long term debtors are not expected to change significantly in the budget.
44Minutes - Special Council Meeting of 24 June 2014 104
2014/15 Budget - Wellington Shire Council
Forecast
Actual Budget Variance
2014 2015
$’000 $’000 $’000
Current assets 39,854 27,755 (12,099)
Current liabilities (13,946) (14,899) 953
Working capital 25,908 12,856 (13,052)
Restricted cash and investment current
assets
- Statutory reserves (1,022) (785) 237
- Discretionary reserves (5,638) (4,208) 1,430
Unrestricted working capital* 19,248 7,863 (11,385)
Interest-bearing loans are borrowings of Council. New loan borrowings of $1.3 million are planned for
2014/15. Council will repay loan principal of $2.90 million over the year.
Working capital is the excess of current assets above current liabilities. This calculation recognises that
although Council has current assets, some of those assets are already committed to the future settlement of
liabilities in the following 12 months, and are therefore not available for discretionary spending.
Council has also committed further current assets to specific and restricted purposes, represented by
reserves, which may not yet be represented as current liabilities at 30 June.
* Unrestricted working capital may also be committed for the completion of carry forward projects
(operating and capital). Refer to table 6.2 for internal funding of capital works carried forward out of
unrestricted cash and investments.
7.1.3 Working Capital ($13.05 million decrease)
Other Assets includes items such as prepayments for expenses that Council has paid in advance of service
delivery.
Trade and other payables are those to whom Council owes money as at 30 June each year. These liabilities
are budgeted to increase from the 2013/14 forecast by $353,000.
Provisions include accrued long service leave, and annual leave owing to employees. These employee
entitlements are expected to increase in accordance with the Enterprise Bargaining Agreement.
7.1.2 Current Liabilities ($953,000 million increase) and Non-Current Liabilities ($1.87 million
decrease)
Property, infrastructure, plant and equipment is the largest component of Council’s worth and represents the
value of all the land, buildings, roads, vehicles, equipment, etc which has been built up by the Council over
many years. The increase in this balance is attributable to the net result of the capital works program ($33.63
million of new assets), depreciation of assets ($22.85 million) and the impact of asset sales ($528,000).
45Minutes - Special Council Meeting of 24 June 2014 105
2014/15 Budget - Wellington Shire Council
7.2 Key assumptions
During the year an amount of $1.67 million (net) is budgeted to be transferred from other reserves to
accumulated surplus. This reflects the usage of reserves to fund part of the capital works program. This is a
transfer between equity balances only and does not impact on the total balance of equity.
Proceeds from property sales will be transferred to reserve for funding future capital projects.
Repayment of loan principal to be $2.90 million.
Total capital expenditure to be $33.63 million.
There will be new loan borrowings of $1.3 million (see Section 10 - Borrowings for more
information).
In preparing the Budgeted Balance Sheet for the year ended 30 June 2015 it was necessary to make a
number of assumptions about assets, liabilities and equity balances. The key assumptions are as follows:
Sundry debtors and creditors to remain consistent with 2013/14 levels.
Employee entitlements to be increased by the Enterprise Bargaining outcome.
A total of 94.0% of total rates and charges raised will be collected in the 2014/15 year.
Other reserves are funds that Council wishes to separately identify as being set aside to meet a
specific purpose in the future and to which there is no existing liability. These amounts are
transferred from the Accumulated Surplus of the Council to be separately disclosed.
7.1.4 Equity ($1.11 million decrease)
Total equity always equals net assets and is made up of the following components:
Accumulated surplus which is the value of all net assets less Reserves that have accumulated over
time. The increase in accumulated surplus of $559,000 results directly from the deficit for the
year and movements in reserves.
Asset revaluation reserve which represents the difference between the previously recorded value
of assets and their current valuations.
46Minutes - Special Council Meeting of 24 June 2014 106
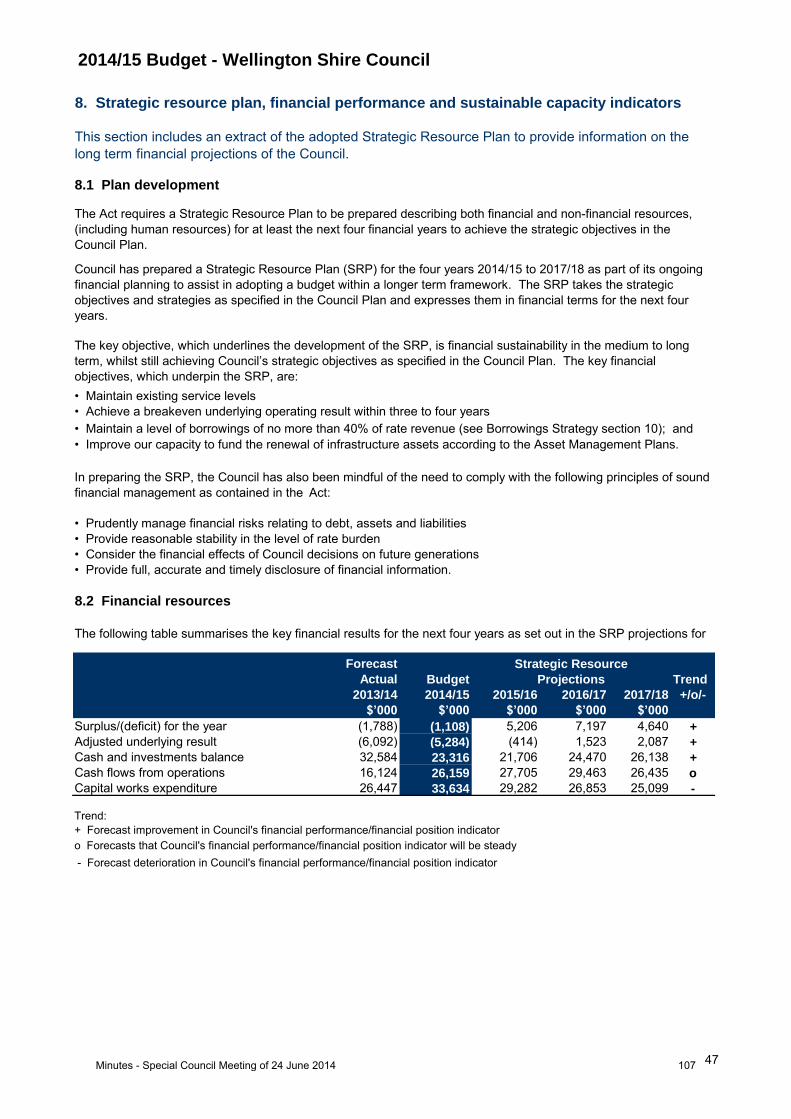
2014/15 Budget - Wellington Shire Council
Forecast
Actual
2013/14 2014/15 2015/16 2016/17 2017/18 +/o/-
$’000 $’000 $’000 $’000 $’000
(1,788) (1,108) 5,206 7,197 4,640 +
(6,092) (5,284) (414) 1,523 2,087 +
32,584 23,316 21,706 24,470 26,138 +
16,124 26,159 27,705 29,463 26,435 o
26,447 33,634 29,282 26,853 25,099 -Key to Forecast
Trend:
In preparing the SRP, the Council has also been mindful of the need to comply with the following principles of sound
financial management as contained in the Act:
• Prudently manage financial risks relating to debt, assets and liabilities
• Provide reasonable stability in the level of rate burden
• Consider the financial effects of Council decisions on future generations
• Provide full, accurate and timely disclosure of financial information.
8.2 Financial resources
The following table summarises the key financial results for the next four years as set out in the SRP projections for
Budget
Strategic Resource
TrendProjections
The key objective, which underlines the development of the SRP, is financial sustainability in the medium to long
term, whilst still achieving Council’s strategic objectives as specified in the Council Plan. The key financial
objectives, which underpin the SRP, are:
• Maintain existing service levels
+ Forecast improvement in Council's financial performance/financial position indicator
o Forecasts that Council's financial performance/financial position indicator will be steady
- Forecast deterioration in Council's financial performance/financial position indicator
• Achieve a breakeven underlying operating result within three to four years
• Maintain a level of borrowings of no more than 40% of rate revenue (see Borrowings Strategy section 10); and
• Improve our capacity to fund the renewal of infrastructure assets according to the Asset Management Plans.
Surplus/(deficit) for the year
Adjusted underlying result
Cash and investments balance
Cash flows from operations
Capital works expenditure
8. Strategic resource plan, financial performance and sustainable capacity indicators
This section includes an extract of the adopted Strategic Resource Plan to provide information on the
long term financial projections of the Council.
8.1 Plan development
The Act requires a Strategic Resource Plan to be prepared describing both financial and non-financial resources,
(including human resources) for at least the next four financial years to achieve the strategic objectives in the
Council Plan.
Council has prepared a Strategic Resource Plan (SRP) for the four years 2014/15 to 2017/18 as part of its ongoing
financial planning to assist in adopting a budget within a longer term framework. The SRP takes the strategic
objectives and strategies as specified in the Council Plan and expresses them in financial terms for the next four
years.
47Minutes - Special Council Meeting of 24 June 2014 107
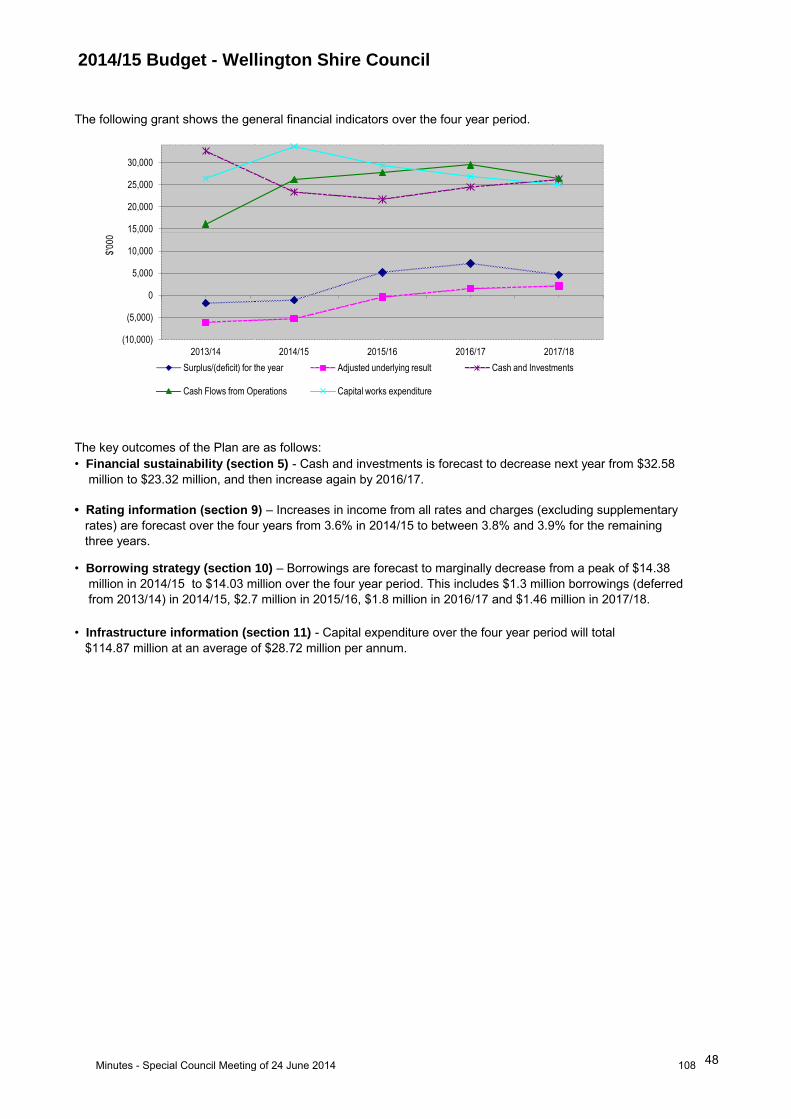
2014/15 Budget - Wellington Shire Council
• Borrowing strategy (section 10) – Borrowings are forecast to marginally decrease from a peak of $14.38
million in 2014/15 to $14.03 million over the four year period. This includes $1.3 million borrowings (deferred
from 2013/14) in 2014/15, $2.7 million in 2015/16, $1.8 million in 2016/17 and $1.46 million in 2017/18.
• Infrastructure information (section 11) - Capital expenditure over the four year period will total
$114.87 million at an average of $28.72 million per annum.
The following grant shows the general financial indicators over the four year period.
The key outcomes of the Plan are as follows:
• Financial sustainability (section 5) - Cash and investments is forecast to decrease next year from $32.58
million to $23.32 million, and then increase again by 2016/17.
• Rating information (section 9) – Increases in income from all rates and charges (excluding supplementary
rates) are forecast over the four years from 3.6% in 2014/15 to between 3.8% and 3.9% for the remaining
three years.
(10,000)
(5,000)
0
5,000
10,000
15,000
20,000
25,000
30,000
2013/14 2014/15 2015/16 2016/17 2017/18
$'00
0
Surplus/(deficit) for the year Adjusted underlying result Cash and Investments
Cash Flows from Operations Capital works expenditure
48Minutes - Special Council Meeting of 24 June 2014 108
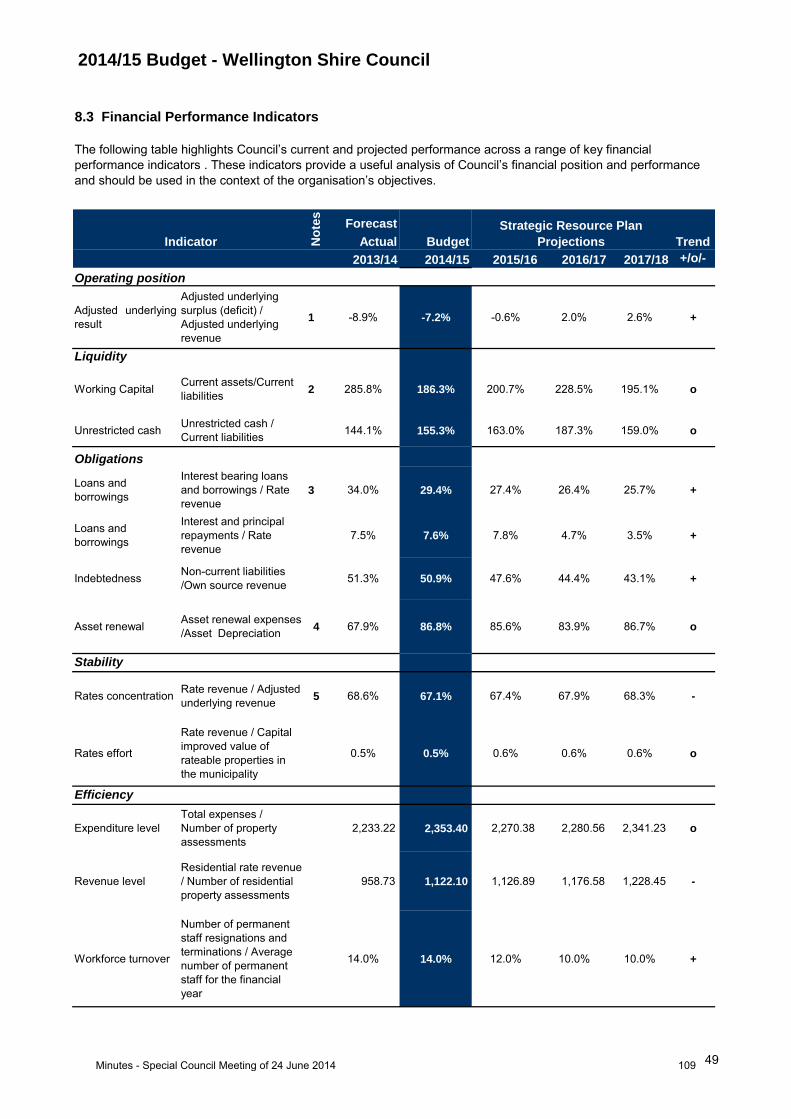
2014/15 Budget - Wellington Shire Council
Forecast
Actual
2013/14 2014/15 2015/16 2016/17 2017/18 +/o/-
Adjusted underlying
result
Adjusted underlying
surplus (deficit) /
Adjusted underlying
revenue
1 -8.9% -7.2% -0.6% 2.0% 2.6% +
Liquidity
Working CapitalCurrent assets/Current
liabilities2 285.8% 186.3% 200.7% 228.5% 195.1% o
Unrestricted cashUnrestricted cash /
Current liabilities144.1% 155.3% 163.0% 187.3% 159.0% o
Loans and
borrowings
Interest bearing loans
and borrowings / Rate
revenue
3 34.0% 29.4% 27.4% 26.4% 25.7% +
Loans and
borrowings
Interest and principal
repayments / Rate
revenue
7.5% 7.6% 7.8% 4.7% 3.5% +
IndebtednessNon-current liabilities
/Own source revenue51.3% 50.9% 47.6% 44.4% 43.1% +
Asset renewalAsset renewal expenses
/Asset Depreciation4 67.9% 86.8% 85.6% 83.9% 86.7% o
Stability
Rates concentrationRate revenue / Adjusted
underlying revenue5 68.6% 67.1% 67.4% 67.9% 68.3% -
Rates effort
Rate revenue / Capital
improved value of
rateable properties in
the municipality
0.5% 0.5% 0.6% 0.6% 0.6% o
Efficiency
Expenditure level
Total expenses /
Number of property
assessments
2,233.22 2,353.40 2,270.38 2,280.56 2,341.23 o
Revenue level
Residential rate revenue
/ Number of residential
property assessments
958.73 1,122.10 1,126.89 1,176.58 1,228.45 -
Workforce turnover
Number of permanent
staff resignations and
terminations / Average
number of permanent
staff for the financial
year
14.0% 14.0% 12.0% 10.0% 10.0% +
Indicator
8.3 Financial Performance Indicators
The following table highlights Council’s current and projected performance across a range of key financial
performance indicators . These indicators provide a useful analysis of Council’s financial position and performance
and should be used in the context of the organisation’s objectives.
No
tes
Budget
Strategic Resource Plan
Projections Trend
Operating position
Obligations
49Minutes - Special Council Meeting of 24 June 2014 109
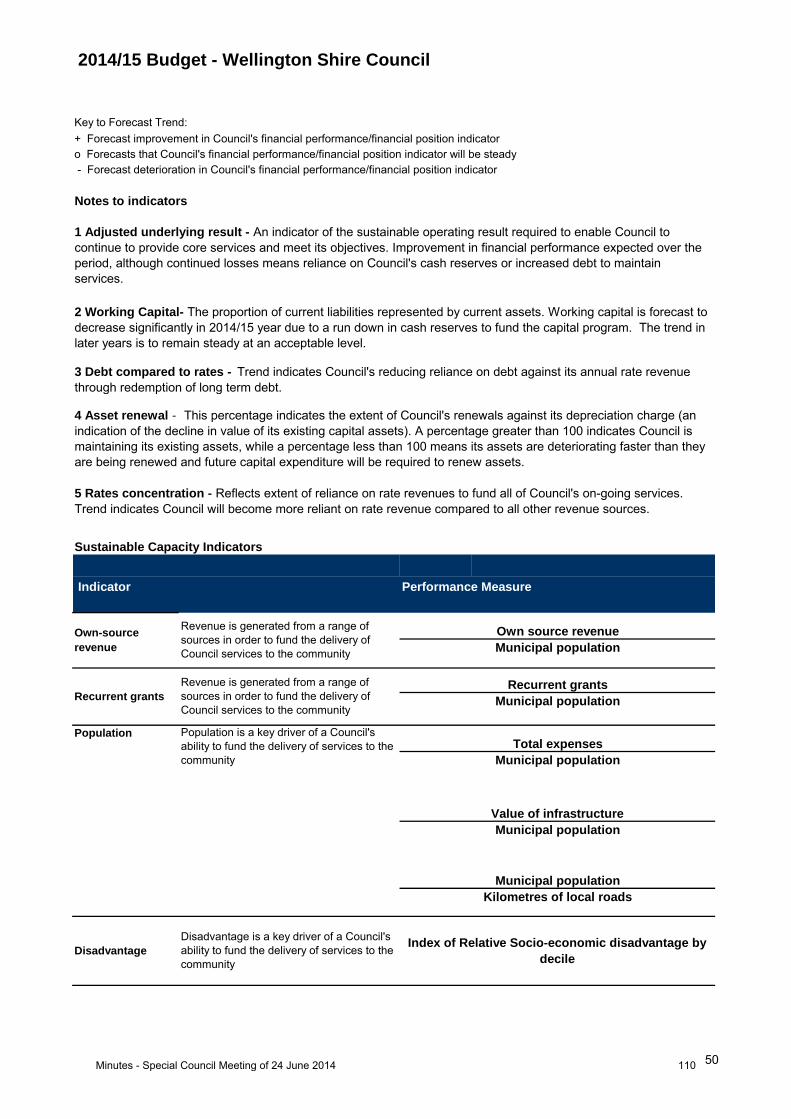
2014/15 Budget - Wellington Shire Council
Performance Measure Indicator
- Forecast deterioration in Council's financial performance/financial position indicator
Notes to indicators
1 Adjusted underlying result - An indicator of the sustainable operating result required to enable Council to
continue to provide core services and meet its objectives. Improvement in financial performance expected over the
period, although continued losses means reliance on Council's cash reserves or increased debt to maintain
services.
2 Working Capital- The proportion of current liabilities represented by current assets. Working capital is forecast to
decrease significantly in 2014/15 year due to a run down in cash reserves to fund the capital program. The trend in
later years is to remain steady at an acceptable level.
3 Debt compared to rates - Trend indicates Council's reducing reliance on debt against its annual rate revenue
through redemption of long term debt.
4 Asset renewal - This percentage indicates the extent of Council's renewals against its depreciation charge (an
indication of the decline in value of its existing capital assets). A percentage greater than 100 indicates Council is
maintaining its existing assets, while a percentage less than 100 means its assets are deteriorating faster than they
are being renewed and future capital expenditure will be required to renew assets.
5 Rates concentration - Reflects extent of reliance on rate revenues to fund all of Council's on-going services.
Trend indicates Council will become more reliant on rate revenue compared to all other revenue sources.
Sustainable Capacity Indicators
Own source revenue
Recurrent grants
Total expenses
Municipal population
Municipal population
Municipal population
Own-source
revenue
Revenue is generated from a range of
sources in order to fund the delivery of
Council services to the communityMunicipal population
Revenue is generated from a range of
sources in order to fund the delivery of
Council services to the community
Key to Forecast Trend:
+ Forecast improvement in Council's financial performance/financial position indicator
o Forecasts that Council's financial performance/financial position indicator will be steady
Recurrent grants Municipal population
Disadvantage
Disadvantage is a key driver of a Council's
ability to fund the delivery of services to the
community
Value of infrastructure
Kilometres of local roads
Index of Relative Socio-economic disadvantage by
decile
Population Population is a key driver of a Council's
ability to fund the delivery of services to the
community
50Minutes - Special Council Meeting of 24 June 2014 110
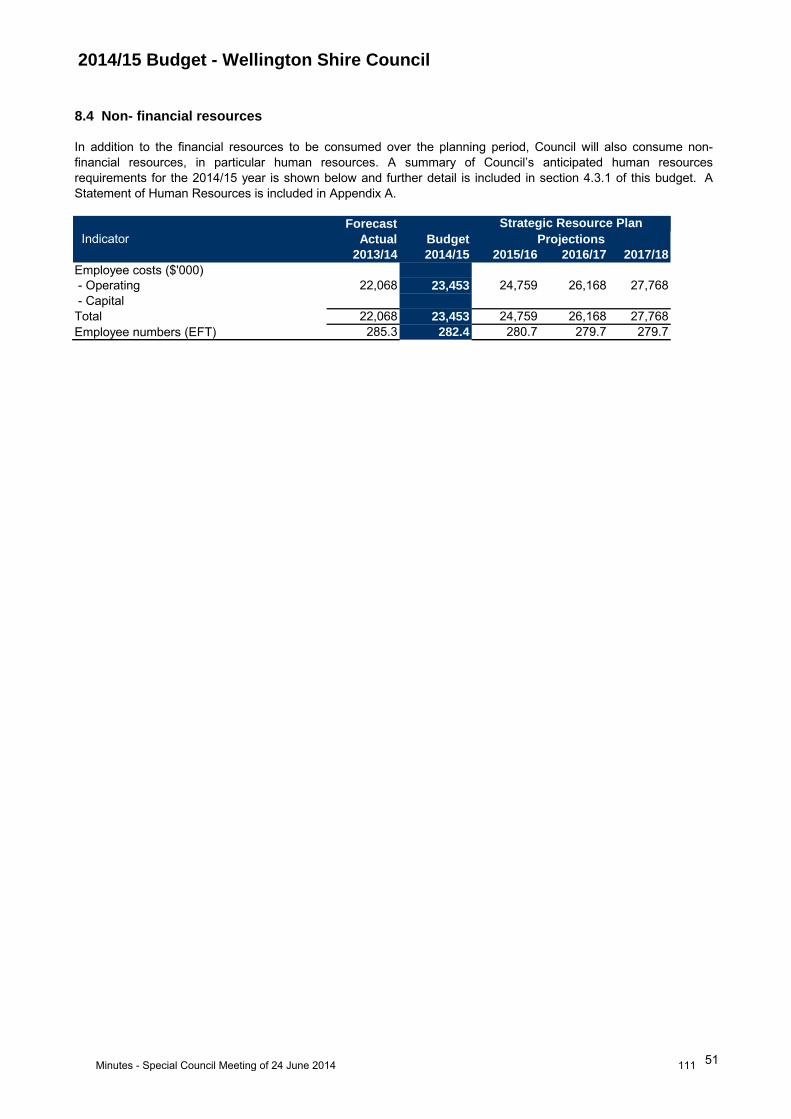
2014/15 Budget - Wellington Shire Council
Forecast
Indicator Actual
2013/14 2014/15 2015/16 2016/17 2017/18
- Operating 22,068 23,453 24,759 26,168 27,768
- Capital
Total 22,068 23,453 24,759 26,168 27,768
285.3 282.4 280.7 279.7 279.7 Employee numbers (EFT)
Employee costs ($'000)
Budget
Strategic Resource Plan
Projections
8.4 Non- financial resources
In addition to the financial resources to be consumed over the planning period, Council will also consume non-
financial resources, in particular human resources. A summary of Council’s anticipated human resources
requirements for the 2014/15 year is shown below and further detail is included in section 4.3.1 of this budget. A
Statement of Human Resources is included in Appendix A.
51Minutes - Special Council Meeting of 24 June 2014 111
2014/15 Budget - Wellington Shire Council
9. Rating Information
9.1 Strategy development
Waste Infrastructure Charge
The Waste Infrastructure Charge is applied to all properties, other than those identified as being within the
Ninety Mile Beach Restructure Plan Stages 7 - 22, with the exception of those properties with an existing
dwelling, where the charge will still apply.
The increasing cost of compliance with Environment Protection Authority (EPA) requirements in the provision of
waste infrastructure (landfills and transfer stations) has resulted in the need to maintain the Waste
Infrastructure Charge at $32, in order to be able to fund the next ten years capital works.
EPA Levy Charge
The cost to Council of EPA levies will increase in excess of 10% (per tonne of waste to landfill) in the coming
year, but Council has been able to maintain the charge to ratepayers at $14.92 per assessment, due to the
closure of the Sale Transfer Station, a saving of around $200,000 per year.
This separate cost is shown on Rates Notices in the interests of greater transparency. The cost of this levy is
influenced by two drivers - one is the volume of waste going into our landfill, and the second is the price per
tonne levied by the EPA. While we can do little regarding the price, we can certainly, as a community, make
greater efforts to recycle more, and reduce the volume of waste to landfill.
Boisdale Common Effluent System Charge
In 2014/15, an annual service charge for wastewater availability in the township of Boisdale will be
implemented, for all properties that are connected to the Boisdale Common Effluent System. This charge will
represent a contribution towards the costs of operation and management of the system.
The charge will be implemented gradually over a three year period, beginning with $288 in 2014/15. This will be
charged on the Annual Rates Notice, and will be paid in the same way as other Rates and Charges, over four
instalments.
This section considers the Council’s rating information including strategy development and
assumptions underlying the current year rate increase and rating structure.
In developing a Long Term Financial Plan, rates and charges must be considered as an important source of
revenue, accounting for 64.0% (excluding Special Charge Schemes) of the total revenue expected to be
received by Council in the 2014/15 year (2013/14 – 67.4%).
It is also necessary to balance the importance of rate revenue as a funding source with community sensitivity to
increases.
Consideration over this year’s rate increase presented a variety of challenges, as we reviewed services and the
ten year Capital works program. A strong desire to reduce the rate rise below that planned in the SRP adopted
in the prior year drove the identification and implementation of a number of operational efficiencies, resulting in
reduced expenditure without impact key services. This has enabled Council to deliver a general rate rise of only
3.8%.
9.2 Current year rate increase
52Minutes - Special Council Meeting of 24 June 2014 112

2014/15 Budget - Wellington Shire Council
Year
% % % % $’0002014/15 3.8 1.18 0.0 0.0 48,923
2015/16 4.0 3.0 0.0 0.0 50,588
2016/17 4.0 3.0 0.0 0.0 52,546
2017/18 4.0 3.0 0.0 0.0 54,555
2013/14 2014/15
Average Valuation $244,117 $249,970
General Rate in the dollar 0.005199 0.005181
General Rate $1,269.16 $1,295.09
Garbage Charge $169.00 $171.00
Waste Infrastructure Charge $32.00 $32.00
EPA Levy Charge 14.92 $14.92
Total Rates and Charges $1,485.08 $1,513.01
Increase $27.93
Increase % 1.9%
In order to maintain an affordable level of borrowings in accordance with our borrowing strategy (see section
10), and continue to deliver on agreed service levels, whilst still achieving the essential capital program of $33.6
million, general rates will increase by an effective 3.8% in 2014/15, and garbage charges will increase from
$169 to $171, raising a total of $48.7 million including an estimated $419,000 generated from supplementary
rates (excluding interest on overdue rates). On current year income, this represents a modest increase of only
4.4% overall (if supplementary rates, which are not predictable, are achieved).
General Rate
increase
Based upon the valuation of an improved residential property paying the General rate, the following table
illustrates the effect of the proposed changes to the rating system for the coming year on a property that attracts
all charges:
Garbage
Charge
increase
The following table sets out future proposed rate increases and total rates to be raised (excluding
supplementary rates, interest on overdue rates and special charge schemes), based on the forecast financial
position of Council as at 30 June 2014.
Waste
Infrastructure
Charge
increase
EPA Levy
Charge
increase
Total Rates
& Charges
Raised
It’s clear that looking forward for as long as ten years is absolutely necessary for the development of a rating
strategy that can deliver on community needs and priorities, and ‘smooth’ the increases so that there are no
huge, unexpected spikes in the annual rate rise.
Capital program
It is important to understand that we have a significant four year capital program ($114.9 million), and while we
have access to a certain level of external funding to accomplish this, grants often require us to match them
dollar for dollar, so much of the funding is through rates income. When looking at the next four years capital
expenditure (Appendix A), we can see that we plan to spend $33.6 million in 2014/15 and an average of $27.1
million in future years. It is more effective to increase the rates evenly over the next few years, rather than to
increase them in response to ‘balancing’ a single year’s budget – in a way, saving up for the big years, rather
than requiring a huge rate increase in year 4.
53Minutes - Special Council Meeting of 24 June 2014 113
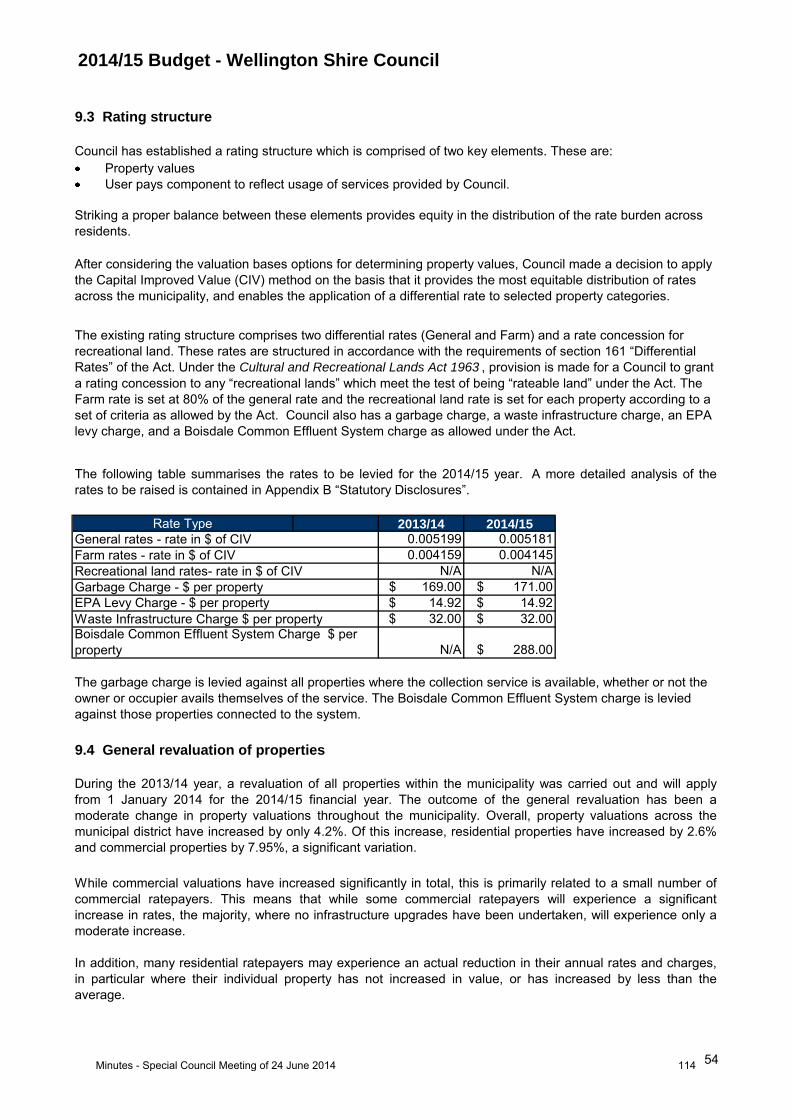
2014/15 Budget - Wellington Shire Council
Rate Type 2013/14 2014/150.005199 0.005181
0.004159 0.004145
N/A N/A
$ 169.00 $ 171.00
EPA Levy Charge - $ per property $ 14.92 $ 14.92
$ 32.00 $ 32.00
N/A $ 288.00
General rates - rate in $ of CIV
Property values
The following table summarises the rates to be levied for the 2014/15 year. A more detailed analysis of the
rates to be raised is contained in Appendix B “Statutory Disclosures”.
The existing rating structure comprises two differential rates (General and Farm) and a rate concession for
recreational land. These rates are structured in accordance with the requirements of section 161 “Differential
Rates” of the Act. Under the Cultural and Recreational Lands Act 1963 , provision is made for a Council to grant
a rating concession to any “recreational lands” which meet the test of being “rateable land” under the Act. The
Farm rate is set at 80% of the general rate and the recreational land rate is set for each property according to a
set of criteria as allowed by the Act. Council also has a garbage charge, a waste infrastructure charge, an EPA
levy charge, and a Boisdale Common Effluent System charge as allowed under the Act.
Farm rates - rate in $ of CIV
During the 2013/14 year, a revaluation of all properties within the municipality was carried out and will apply
from 1 January 2014 for the 2014/15 financial year. The outcome of the general revaluation has been a
moderate change in property valuations throughout the municipality. Overall, property valuations across the
municipal district have increased by only 4.2%. Of this increase, residential properties have increased by 2.6%
and commercial properties by 7.95%, a significant variation.
While commercial valuations have increased significantly in total, this is primarily related to a small number of
commercial ratepayers. This means that while some commercial ratepayers will experience a significant
increase in rates, the majority, where no infrastructure upgrades have been undertaken, will experience only a
moderate increase.
In addition, many residential ratepayers may experience an actual reduction in their annual rates and charges,
in particular where their individual property has not increased in value, or has increased by less than the
average.
Recreational land rates- rate in $ of CIV
9.4 General revaluation of properties
Boisdale Common Effluent System Charge $ per
property
Garbage Charge - $ per property
Waste Infrastructure Charge $ per property
The garbage charge is levied against all properties where the collection service is available, whether or not the
owner or occupier avails themselves of the service. The Boisdale Common Effluent System charge is levied
against those properties connected to the system.
After considering the valuation bases options for determining property values, Council made a decision to apply
the Capital Improved Value (CIV) method on the basis that it provides the most equitable distribution of rates
across the municipality, and enables the application of a differential rate to selected property categories.
9.3 Rating structure
User pays component to reflect usage of services provided by Council.
Striking a proper balance between these elements provides equity in the distribution of the rate burden across
residents.
Council has established a rating structure which is comprised of two key elements. These are:
54Minutes - Special Council Meeting of 24 June 2014 114
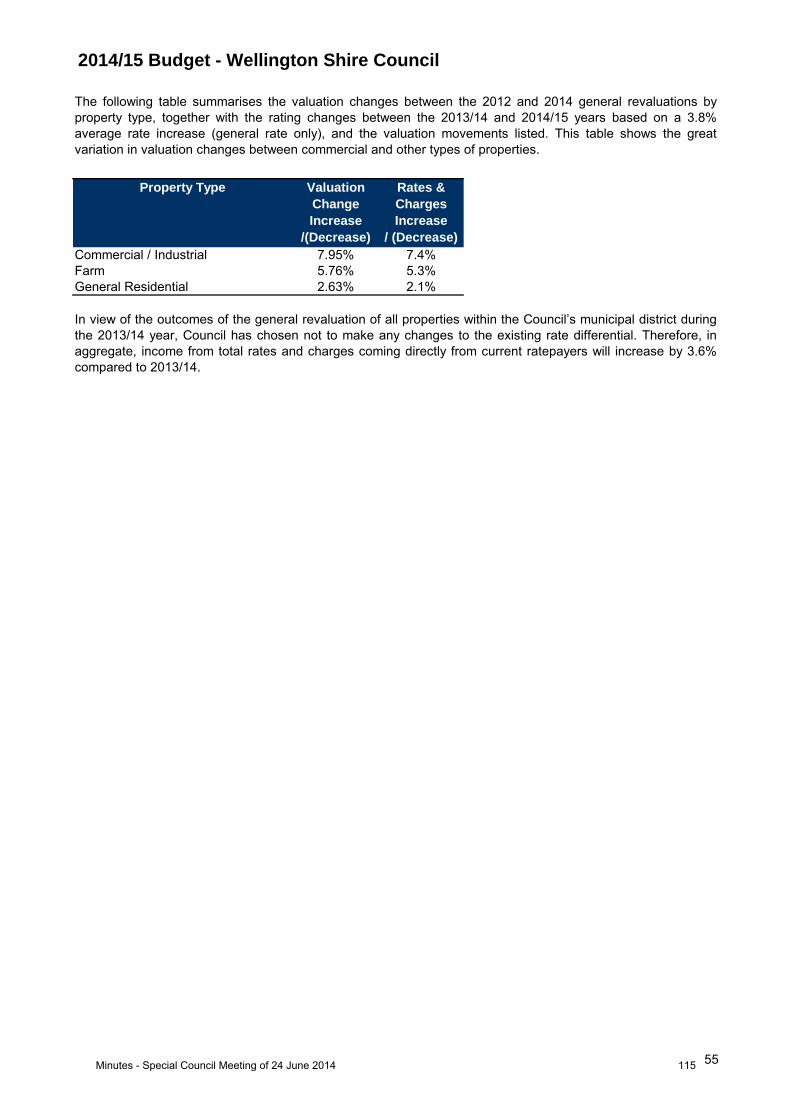
2014/15 Budget - Wellington Shire Council
Property Type Valuation
Change
Increase
/(Decrease)
Rates &
Charges
Increase
/ (Decrease)
Commercial / Industrial 7.95% 7.4%
Farm 5.76% 5.3%
General Residential 2.63% 2.1%
The following table summarises the valuation changes between the 2012 and 2014 general revaluations by
property type, together with the rating changes between the 2013/14 and 2014/15 years based on a 3.8%
average rate increase (general rate only), and the valuation movements listed. This table shows the great
variation in valuation changes between commercial and other types of properties.
In view of the outcomes of the general revaluation of all properties within the Council’s municipal district during
the 2013/14 year, Council has chosen not to make any changes to the existing rate differential. Therefore, in
aggregate, income from total rates and charges coming directly from current ratepayers will increase by 3.6%
compared to 2013/14.
55Minutes - Special Council Meeting of 24 June 2014 115

2014/15 Budget - Wellington Shire Council
Liquidity
CA/CL Ratio1
Debt Mgt
Debt/Rates
$’000 % % % %
2011/12 11,553 214 28.1 0.9 11.32
2012/13 9,789 241 22.2 1.0 11.53
2013/14 15,975 286 34.0 1.1 11.25
2014/15 14,377 186 34.0 0.9 10.68
TargetBetter than
110%
Less than 60% Less than 5% Less than 50%
Threshold < 60% > 150% > 10% > 150%
1
Prudential Guidelines
CA = Current Assets, CL = Current Liabilities
2. Borrowings will be used for non-recurrent capital works and unexpected major events.
10. Borrowing Strategy
Council remains well within the Victorian State Government's recommended prudential ratio limits as
reflected in the graph and table following. This enables Council to utilise borrowings as a logical source of
funds for major infrastructure projects, as well as allowing Council to access borrowings if needed
unexpectedly (e.g. natural disasters/emergencies).
10.1 Current Situation
Year
3. Borrowings are a valid mechanism for providing inter-generational equity. i.e. the generation that uses
the asset, pays for the asset.
Total
Borrowings
30 June
Debt Exp
Liabilities /
Realis Assets
1. Debt levels to be within Victorian State Government prudential ratio limits, and be below 40% of
annual rate revenue, (based on Council's Rating Strategy), maintaining spare capacity for future major
projects and unexpected events.
Debt Mgt
Serv Costs/
Revenue
Council has revised its Long Term Financial Plan, taking into consideration the need to plan carefully for
funding the renewal of infrastructure assets, and remain a financially sustainable organisation. From this
review the following borrowing strategy principles have been developed.
0
10,000
20,000
30,000
40,000
50,000
60,000
2012/13 2013/14 2014/15 2015/16 2016/17 2017/18
$00
0's
Financial Year
Total Debt to Rate Revenue
Total Debt Rates income State Government Prudential Ratio
56Minutes - Special Council Meeting of 24 June 2014 116
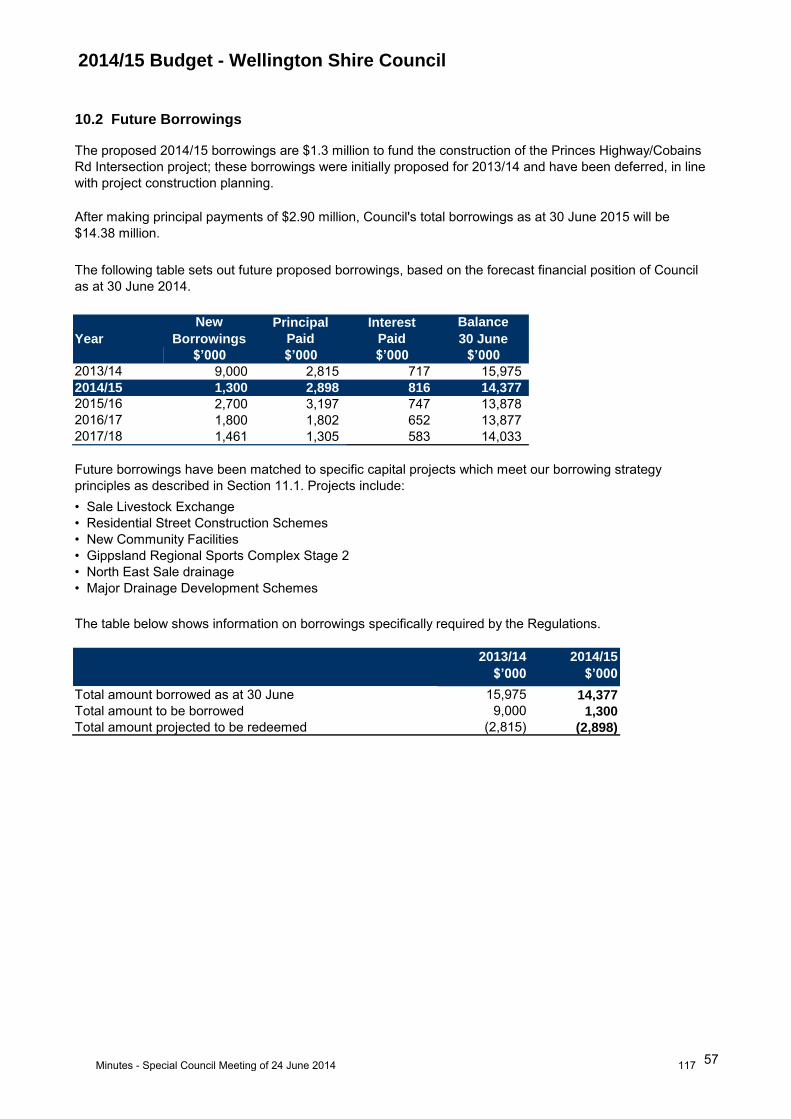
2014/15 Budget - Wellington Shire Council
Principal Interest
Paid Paid
$’000 $’000 $’000 $’000
2013/14 9,000 2,815 717 15,975
2014/15 1,300 2,898 816 14,377
2015/16 2,700 3,197 747 13,878
2016/17 1,800 1,802 652 13,877
2017/18 1,461 1,305 583 14,033
2013/14
$’000
2014/15
$’000
15,975 14,377
9,000 1,300
(2,815) (2,898)
The table below shows information on borrowings specifically required by the Regulations.
Total amount borrowed as at 30 June
Total amount to be borrowed
Total amount projected to be redeemed
• New Community Facilities
The proposed 2014/15 borrowings are $1.3 million to fund the construction of the Princes Highway/Cobains
Rd Intersection project; these borrowings were initially proposed for 2013/14 and have been deferred, in line
with project construction planning.
Year
• Residential Street Construction Schemes
New
Borrowings
• North East Sale drainage
Balance
30 June
10.2 Future Borrowings
• Major Drainage Development Schemes
• Gippsland Regional Sports Complex Stage 2
The following table sets out future proposed borrowings, based on the forecast financial position of Council
as at 30 June 2014.
• Sale Livestock Exchange
Future borrowings have been matched to specific capital projects which meet our borrowing strategy
principles as described in Section 11.1. Projects include:
After making principal payments of $2.90 million, Council's total borrowings as at 30 June 2015 will be
$14.38 million.
57Minutes - Special Council Meeting of 24 June 2014 117
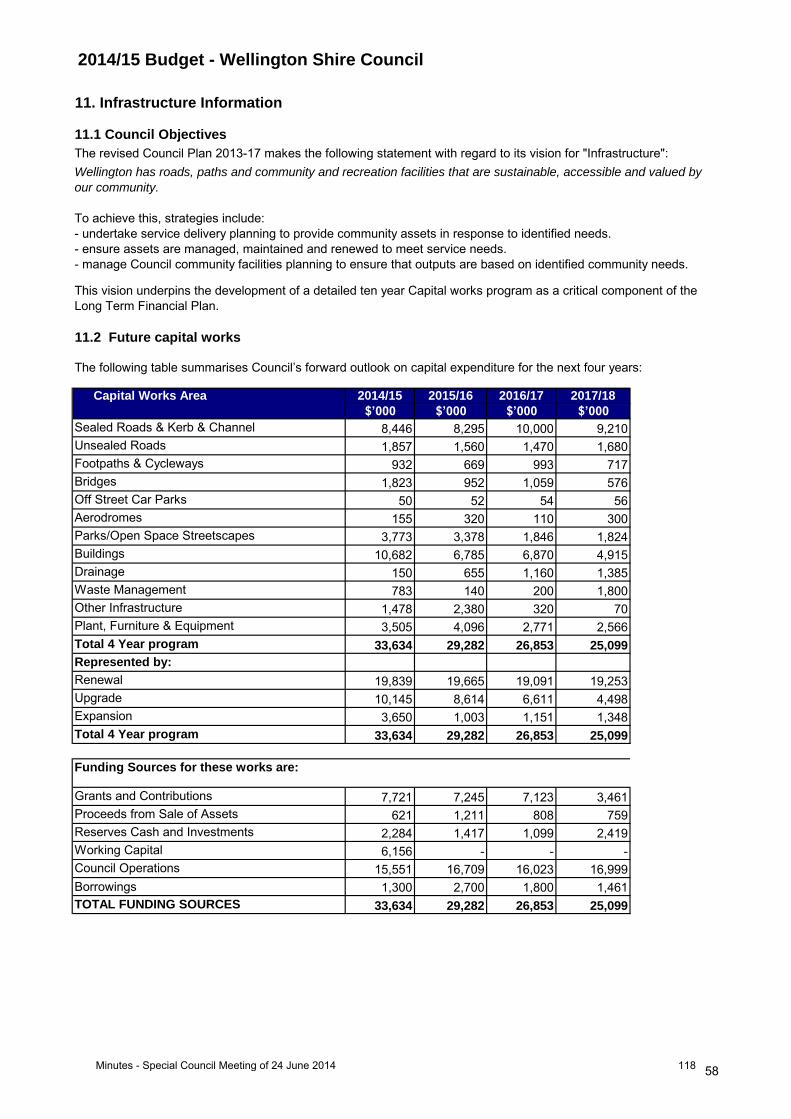
2014/15 Budget - Wellington Shire Council
Capital Works Area 2014/15 2015/16 2016/17 2017/18
$’000 $’000 $’000 $’000
8,446 8,295 10,000 9,210
1,857 1,560 1,470 1,680
932 669 993 717
1,823 952 1,059 576
50 52 54 56
155 320 110 300
3,773 3,378 1,846 1,824
10,682 6,785 6,870 4,915
150 655 1,160 1,385
783 140 200 1,800
1,478 2,380 320 70
3,505 4,096 2,771 2,566
33,634 29,282 26,853 25,099
19,839 19,665 19,091 19,253
10,145 8,614 6,611 4,498
3,650 1,003 1,151 1,348
33,634 29,282 26,853 25,099
7,721 7,245 7,123 3,461
621 1,211 808 759
2,284 1,417 1,099 2,419
6,156 - - -
15,551 16,709 16,023 16,999
Borrowings 1,300 2,700 1,800 1,461
33,634 29,282 26,853 25,099
Represented by:
Renewal
Proceeds from Sale of Assets
Reserves Cash and Investments
Grants and Contributions
Total 4 Year program
Expansion
Footpaths & Cycleways
Off Street Car Parks
Total 4 Year program
Aerodromes
Parks/Open Space Streetscapes
Waste Management
Other Infrastructure
Plant, Furniture & Equipment
Buildings
Drainage
Bridges
Unsealed Roads
11. Infrastructure Information
11.2 Future capital works
The following table summarises Council’s forward outlook on capital expenditure for the next four years:
11.1 Council Objectives
The revised Council Plan 2013-17 makes the following statement with regard to its vision for "Infrastructure":
Wellington has roads, paths and community and recreation facilities that are sustainable, accessible and valued by
our community.
To achieve this, strategies include:
- undertake service delivery planning to provide community assets in response to identified needs.
- ensure assets are managed, maintained and renewed to meet service needs.
- manage Council community facilities planning to ensure that outputs are based on identified community needs.
This vision underpins the development of a detailed ten year Capital works program as a critical component of the
Long Term Financial Plan.
Sealed Roads & Kerb & Channel
Upgrade
Funding Sources for these works are:
TOTAL FUNDING SOURCES
Working Capital
Council Operations
58Minutes - Special Council Meeting of 24 June 2014 118

2014/15 Budget - Wellington Shire Council
11.3 Key Capital Indicators
Forecast
Actual Budget Trend
2013/14 2014/15 2015/16 2016/17 2017/18 +/o/-
Capital expenditure/
Assessment $ 795 1,012 881 808 755 -
Capital outlays/Total cash
outflows % 34.4% 37.7% 36.0% 34.1% 31.7% -
Capital works/Rate
revenue % 56.3% 68.7% 57.9% 51.1% 46.0% -
Asset renewals/Total
depreciation * % 67.9% 86.8% 85.6% 83.9% 86.7% +
Strategic Resource Plan
Projections
Key to Forecast Trend:
- Forecast deterioration in Council's financial performance/financial position indicator
o Forecasts that Council's financial performance/financial position indicator will be steady
The following graph depicts how the capital works budget will be spent in the next four years. The increase in
budgets on renewal projects in 2014/15 is due to the Yarram Recreation Reserve Clubrooms construction (carry
forward works from 2013/14), Yarram Streetscapes improvements and the Desailly Street Corporate Headquarters.
The increase in budgets in upgrade projects in 2014/15 relate to the Desailly Street Corporate Headquarters. The
increase in budgets in expansion projects in 2014/15 is due to the Princes Highway/Cobains Road intersection
upgrade (carry forward works from 2013/14) and Yarram District Hub project.
Capital expenditure
The following table summarises Council’s current and projected capital works performance indicators:
+ Forecast improvement in Council's financial performance/financial position indicator
0
5,000
10,000
15,000
20,000
25,000
30,000
35,000
40,000
2012/13 2013/14 2014/15 2015/16 2016/17 2017/18
$'0
00
Expansion Upgrade Renewal
Capital Program
59Minutes - Special Council Meeting of 24 June 2014 119
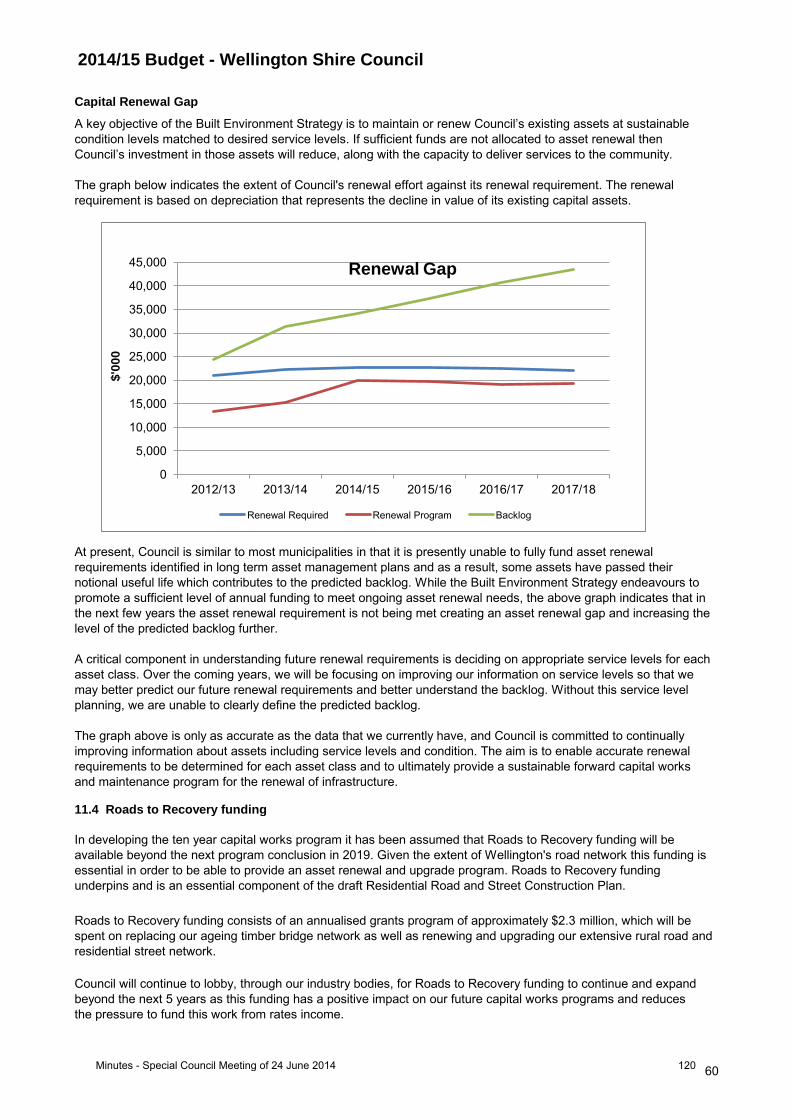
2014/15 Budget - Wellington Shire Council
A key objective of the Built Environment Strategy is to maintain or renew Council’s existing assets at sustainable
condition levels matched to desired service levels. If sufficient funds are not allocated to asset renewal then
Council’s investment in those assets will reduce, along with the capacity to deliver services to the community.
The graph below indicates the extent of Council's renewal effort against its renewal requirement. The renewal
requirement is based on depreciation that represents the decline in value of its existing capital assets.
Capital Renewal Gap
In developing the ten year capital works program it has been assumed that Roads to Recovery funding will be
available beyond the next program conclusion in 2019. Given the extent of Wellington's road network this funding is
essential in order to be able to provide an asset renewal and upgrade program. Roads to Recovery funding
underpins and is an essential component of the draft Residential Road and Street Construction Plan.
11.4 Roads to Recovery funding
At present, Council is similar to most municipalities in that it is presently unable to fully fund asset renewal
requirements identified in long term asset management plans and as a result, some assets have passed their
notional useful life which contributes to the predicted backlog. While the Built Environment Strategy endeavours to
promote a sufficient level of annual funding to meet ongoing asset renewal needs, the above graph indicates that in
the next few years the asset renewal requirement is not being met creating an asset renewal gap and increasing the
level of the predicted backlog further.
A critical component in understanding future renewal requirements is deciding on appropriate service levels for each
asset class. Over the coming years, we will be focusing on improving our information on service levels so that we
may better predict our future renewal requirements and better understand the backlog. Without this service level
planning, we are unable to clearly define the predicted backlog.
The graph above is only as accurate as the data that we currently have, and Council is committed to continually
improving information about assets including service levels and condition. The aim is to enable accurate renewal
requirements to be determined for each asset class and to ultimately provide a sustainable forward capital works
and maintenance program for the renewal of infrastructure.
Roads to Recovery funding consists of an annualised grants program of approximately $2.3 million, which will be
spent on replacing our ageing timber bridge network as well as renewing and upgrading our extensive rural road and
residential street network.
Council will continue to lobby, through our industry bodies, for Roads to Recovery funding to continue and expand
beyond the next 5 years as this funding has a positive impact on our future capital works programs and reduces
the pressure to fund this work from rates income.
0
5,000
10,000
15,000
20,000
25,000
30,000
35,000
40,000
45,000
2012/13 2013/14 2014/15 2015/16 2016/17 2017/18
$'0
00
Renewal Required Renewal Program Backlog
Renewal Gap
60Minutes - Special Council Meeting of 24 June 2014 120

2014/15 Budget - Wellington Shire Council
11.5 Country Roads & Bridges Funding
11.6 Timber Impacted Roads Funding
11.7 Waste Infrastructure Charge
• Additional resource recovery area at Kilmany Transfer Station ($210,000)
• Construction and sealing of the entrance road into Loch Sport Transfer Station ($100,000)
• Detailed capping design for Maffra Landfill ($35,000)
• Construction of a new cell at Rosedale ($30,000)
• Visual Screen and wind break using native vegetation at Kilmany Landfill ($18,000)
• 2013/14 carried forward project - Leachate treatment infrastructure at Kilmany Landfill ($230,000)
• 2013/14 carried forward project - Closure and rehabilitation of the Sale Transfer Station site ($195,000)
• 2013/14 carried forward project - Rehabilitation of the Longford Landfill ($985,000)
In 2014/15 the Council will apply the waste infrastructure charge towards the following projects:
8 transfer stations (Kilmany, Sale, Stratford, Dargo, Heyfield, Seaspray, Yarram and Loch Sport)
1 licensed site not operating (Longford)
1 unlicensed operating site (Rosedale)
The ten year Waste Management Plan, which is reviewed annually, clearly sets out the costs for establishing
recycling and transfer stations, rehabilitation of landfills and monitoring of existing and closed landfills. These costs
are currently being incurred by our community and should be paid for by this generation and not at the expense of
future ratepayers and residents.
The implications of the ten year Waste Management Plan, and the funding required for its implementation, are
considered in the Long Term Financial Plan. This has resulted in the continuation of the waste infrastructure charge
to provide for the identified costs. Since the introduction of this charge in 2005/06, costs of construction and
rehabilitation of landfills have escalated in line with increasing community and government expectations for landfill
infrastructure.
There are also a further 8 closed landfills under rehabilitation and after care.
2 licensed operational landfill sites (Kilmany and Maffra)
The Country Roads & Bridges funding is a 4 year program which commenced in 2011/12 and will provide up to $1.0
million per year to assist the Council in maintaining and restoring existing rural roads and bridges.
The Council has been successful in receiving the full allocation of $1.0 million per year for the past 3 years and has
received confirmation of the full allocation in 2014/15.
Since 2005 Council has upgraded a number of roads and bridges that support timber carting activity with a total
$2.8 million funding provided under the Timber Impacted Roads program.
Under the 2014/15 Timber Impacted Roads program, Council has applied for $182,000 towards a total project
expenditure of $212,000 for one project. Timber carting activities will result in Council bearing high maintenance
costs due to lack of funding for timber impacted roads.
Presently Council manages the following waste facilities:
Note - The Sale Transfer Station will cease operations effective 1 July 2014.
61Minutes - Special Council Meeting of 24 June 2014 121
2014/15 Budget - Wellington Shire Council
Appendices
Appendix Nature of information PageA Budgeted statements 63
B Rates and charges 70
C Capital works program 73
D Schedule of Fees and Charges 80
The following appendices include voluntary and statutory disclosures of information which provide
support for the analysis contained in sections 1 to 11 of this report.
This information has not been included in the main body of the budget report in the interests of clarity and
conciseness. Council has decided that whilst the budget report needs to focus on the important elements of
the budget and provide appropriate analysis, the detail upon which the annual budget is based should be
provided in the interests of open and transparent local government.
The contents of the appendices are summarised below:
62Minutes - Special Council Meeting of 24 June 2014 122
2014/15 Budget - Wellington Shire Council Appendix A
Budgeted Balance Sheet
Budgeted Statement of Cash Flows
Budgeted Statement of Capital Works
Budgeted Statement of Human Resources.
Budgeted Statement of Changes in Equity
Budgeted statements
This appendix presents information in regard to the Budgeted Financial Statements and Statement of
Human Resources. The budget information for the years 2014/15 to 2017/18 has been extracted from
the Strategic Resource Plan.
The appendix includes the following budgeted information:
Budgeted Comprehensive Income Statement
At the end of each financial year Council is required to include in the Financial Statements in the Annual Report a
comparison of actual income and expenditure compared with the income and expenditure in the financial
statements in the Budget.
63Minutes - Special Council Meeting of 24 June 2014 123
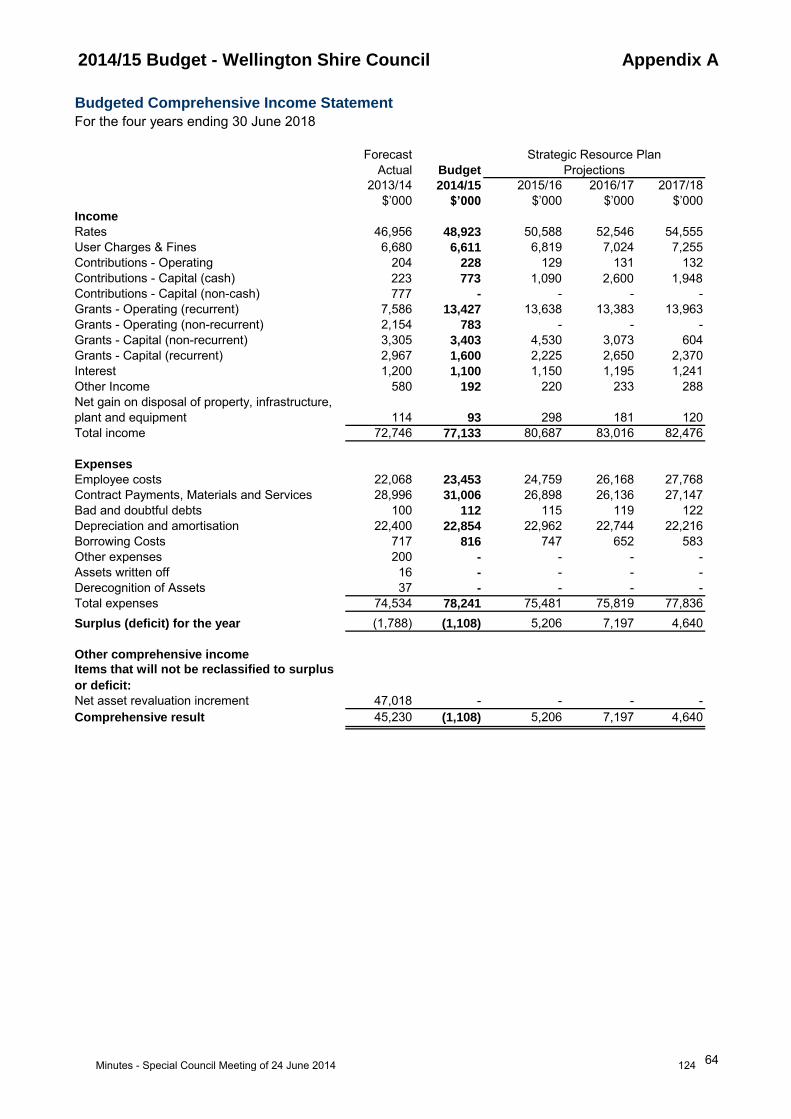
2014/15 Budget - Wellington Shire Council Appendix A
Budgeted Comprehensive Income Statement
For the four years ending 30 June 2018
2013/14 2014/15 2015/16 2016/17 2017/18
$’000 $’000 $’000 $’000 $’000
Income
Rates 46,956 48,923 50,588 52,546 54,555
User Charges & Fines 6,680 6,611 6,819 7,024 7,255
Contributions - Operating 204 228 129 131 132
Contributions - Capital (cash) 223 773 1,090 2,600 1,948
Contributions - Capital (non-cash) 777 - - - -
Grants - Operating (recurrent) 7,586 13,427 13,638 13,383 13,963
Grants - Operating (non-recurrent) 2,154 783 - - -
Grants - Capital (non-recurrent) 3,305 3,403 4,530 3,073 604
Grants - Capital (recurrent) 2,967 1,600 2,225 2,650 2,370
Interest 1,200 1,100 1,150 1,195 1,241
Other Income 580 192 220 233 288
Net gain on disposal of property, infrastructure,
plant and equipment 114 93 298 181 120
Total income 72,746 77,133 80,687 83,016 82,476
Expenses
Employee costs 22,068 23,453 24,759 26,168 27,768
Contract Payments, Materials and Services 28,996 31,006 26,898 26,136 27,147
Bad and doubtful debts 100 112 115 119 122
Depreciation and amortisation 22,400 22,854 22,962 22,744 22,216
Borrowing Costs 717 816 747 652 583
Other expenses 200 - - - -
Assets written off 16 - - - -
Derecognition of Assets 37 - - - -
Total expenses 74,534 78,241 75,481 75,819 77,836
Surplus (deficit) for the year (1,788) (1,108) 5,206 7,197 4,640
Other comprehensive income
Items that will not be reclassified to surplus
or deficit:
Net asset revaluation increment 47,018 - - - -
Comprehensive result 45,230 (1,108) 5,206 7,197 4,640
Forecast
Actual Budget
Strategic Resource Plan
Projections
64Minutes - Special Council Meeting of 24 June 2014 124
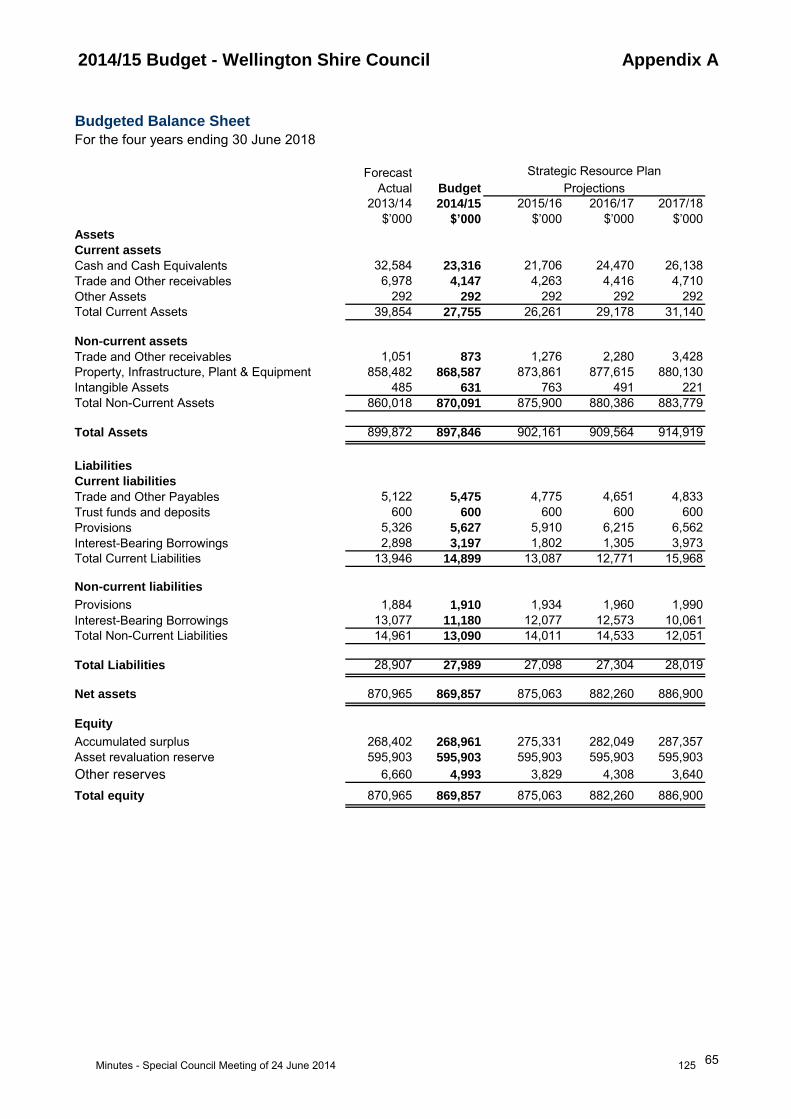
2014/15 Budget - Wellington Shire Council Appendix A
Budgeted Balance Sheet
For the four years ending 30 June 2018
2013/14 2014/15 2015/16 2016/17 2017/18
$’000 $’000 $’000 $’000 $’000
Assets
Current assets
Cash and Cash Equivalents 32,584 23,316 21,706 24,470 26,138
Trade and Other receivables 6,978 4,147 4,263 4,416 4,710
Other Assets 292 292 292 292 292
Total Current Assets 39,854 27,755 26,261 29,178 31,140
Non-current assets
Trade and Other receivables 1,051 873 1,276 2,280 3,428
Property, Infrastructure, Plant & Equipment 858,482 868,587 873,861 877,615 880,130
Intangible Assets 485 631 763 491 221
Total Non-Current Assets 860,018 870,091 875,900 880,386 883,779
Total Assets 899,872 897,846 902,161 909,564 914,919
Liabilities
Current liabilities
Trade and Other Payables 5,122 5,475 4,775 4,651 4,833
Trust funds and deposits 600 600 600 600 600
Provisions 5,326 5,627 5,910 6,215 6,562
Interest-Bearing Borrowings 2,898 3,197 1,802 1,305 3,973
Total Current Liabilities 13,946 14,899 13,087 12,771 15,968
Non-current liabilities
Provisions 1,884 1,910 1,934 1,960 1,990
Interest-Bearing Borrowings 13,077 11,180 12,077 12,573 10,061
Total Non-Current Liabilities 14,961 13,090 14,011 14,533 12,051
Total Liabilities 28,907 27,989 27,098 27,304 28,019
Net assets 870,965 869,857 875,063 882,260 886,900
Equity
Accumulated surplus 268,402 268,961 275,331 282,049 287,357
Asset revaluation reserve 595,903 595,903 595,903 595,903 595,903
Other reserves 6,660 4,993 3,829 4,308 3,640
Total equity 870,965 869,857 875,063 882,260 886,900
Projections
Strategic Resource PlanForecast
Actual Budget
65Minutes - Special Council Meeting of 24 June 2014 125
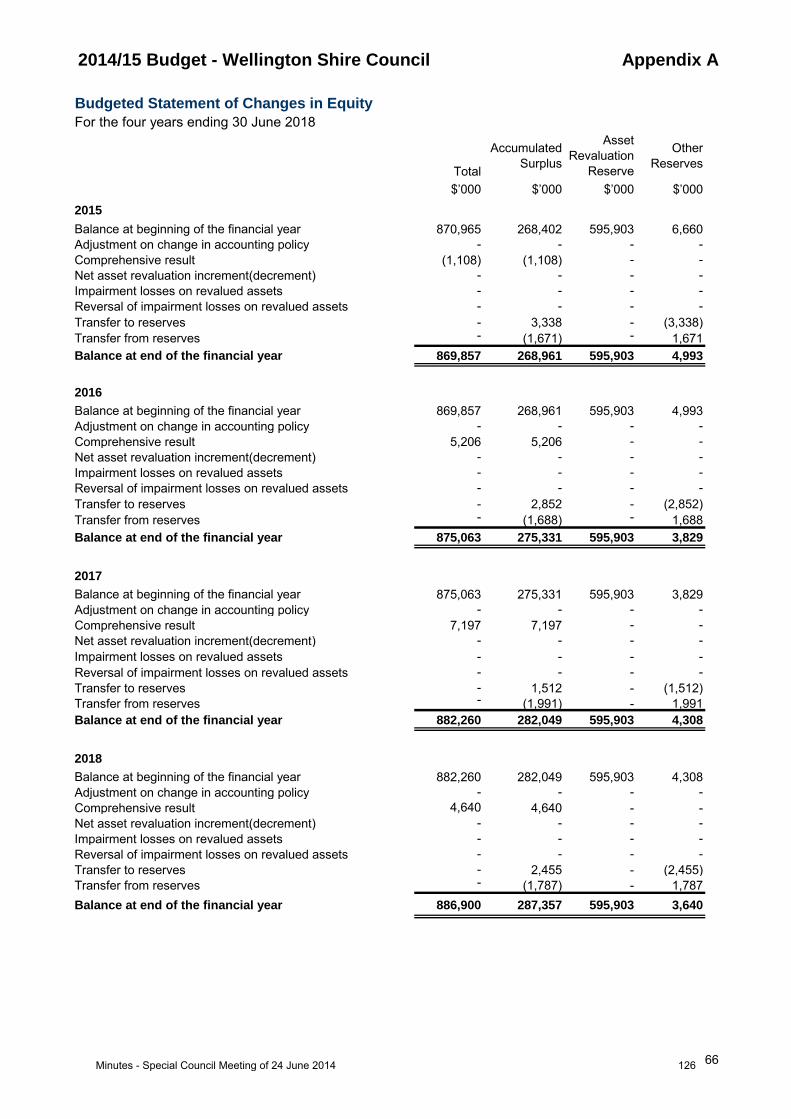
2014/15 Budget - Wellington Shire Council Appendix A
Budgeted Statement of Changes in Equity
For the four years ending 30 June 2018
Total
Accumulated
Surplus
Asset
Revaluation
Reserve
Other
Reserves
$’000 $’000 $’000 $’000
2015
Balance at beginning of the financial year 870,965 268,402 595,903 6,660
Adjustment on change in accounting policy - - - -
Comprehensive result (1,108) (1,108) - -
Net asset revaluation increment(decrement) - - - -
Impairment losses on revalued assets - - - -
Reversal of impairment losses on revalued assets - - - -
Transfer to reserves - 3,338 - (3,338)
Transfer from reserves - (1,671) - 1,671
Balance at end of the financial year 869,857 268,961 595,903 4,993
2016
Balance at beginning of the financial year 869,857 268,961 595,903 4,993
Adjustment on change in accounting policy - - - -
Comprehensive result 5,206 5,206 - -
Net asset revaluation increment(decrement) - - - -
Impairment losses on revalued assets - - - -
- - - -
Transfer to reserves - 2,852 - (2,852)
Transfer from reserves - (1,688) - 1,688
Balance at end of the financial year 875,063 275,331 595,903 3,829
2017
Balance at beginning of the financial year 875,063 275,331 595,903 3,829
Adjustment on change in accounting policy - - - -
Comprehensive result 7,197 7,197 - -
Net asset revaluation increment(decrement) - - - -
Impairment losses on revalued assets - - - -
- - - -
Transfer to reserves - 1,512 - (1,512)
Transfer from reserves - (1,991) - 1,991
Balance at end of the financial year 882,260 282,049 595,903 4,308
2018
Balance at beginning of the financial year 882,260 282,049 595,903 4,308
Adjustment on change in accounting policy - - - -
Comprehensive result 4,640 4,640 - -
Net asset revaluation increment(decrement) - - - -
Impairment losses on revalued assets - - - -
- - - -
Transfer to reserves - 2,455 - (2,455)
Transfer from reserves - (1,787) - 1,787
Balance at end of the financial year 886,900 287,357 595,903 3,640
Reversal of impairment losses on revalued assets
Reversal of impairment losses on revalued assets
Reversal of impairment losses on revalued assets
66Minutes - Special Council Meeting of 24 June 2014 126

2014/15 Budget - Wellington Shire Council Appendix A
Budgeted Cash Flow StatementFor the four years ending 30 June 2018
2013/14 2014/15 2015/16 2016/17 2017/18
$’000 $’000 $’000 $’000 $’000
Inflows Inflows Inflows Inflows Inflows
(Outflows) (Outflows) (Outflows) (Outflows) (Outflows)
Cash flows from operating activities
Receipts
Rates and Charges 46,610 48,693 50,393 52,317 54,320
User Charges and Fines 6,702 6,586 6,860 7,002 7,195
Contributions- cash 686 1,159 765 1,674 838
Grants - operating 11,329 15,401 13,612 13,415 13,936
Grants - capital 5,944 6,808 6,755 5,723 2,974
Interest 1,200 1,100 1,150 1,195 1,241
Other receipts 580 192 220 233 288
Payments to Employees (27,064) (23,120) (24,445) (25,829) (27,383)
Payments to Suppliers (29,663) (30,660) (27,605) (26,267) (26,974)
Other Payments (200) - - - -
Net cash provided by operating activities 16,124 26,159 27,705 29,463 26,435
Cash flows from investing activities
Payments for Property, Infrastructure, Plant and
Equipment & Intangibles (26,447) (33,634) (29,282) (26,853) (25,099)
Proceeds from Property, Infrastructure, Plant
and Equipment 1,043 621 1,211 808 759
Net cash used in investing activities (25,404) (33,013) (28,071) (26,045) (24,340)
Cash flows from financing activities
Finance costs (717) (816) (747) (652) (583)
Proceeds from borrowings 9,000 1,300 2,700 1,800 1,461
Repayment of borrowings (2,815) (2,898) (3,197) (1,802) (1,305)
Net cash provided by (used in) financing
activities 5,468 (2,414) (1,244) (654) (427)
Net increase (decrease) in cash & cash
Equivalents (3,812) (9,268) (1,610) 2,764 1,668
Cash & Cash Equivalents at beginning of the
financial year 36,396 32,584 23,316 21,706 24,470
Cash & cash Equivalents at end of the
financial year 32,584 23,316 21,706 24,470 26,138
Forecast
Actual Budget
Strategic Resource Plan
Projections
67Minutes - Special Council Meeting of 24 June 2014 127
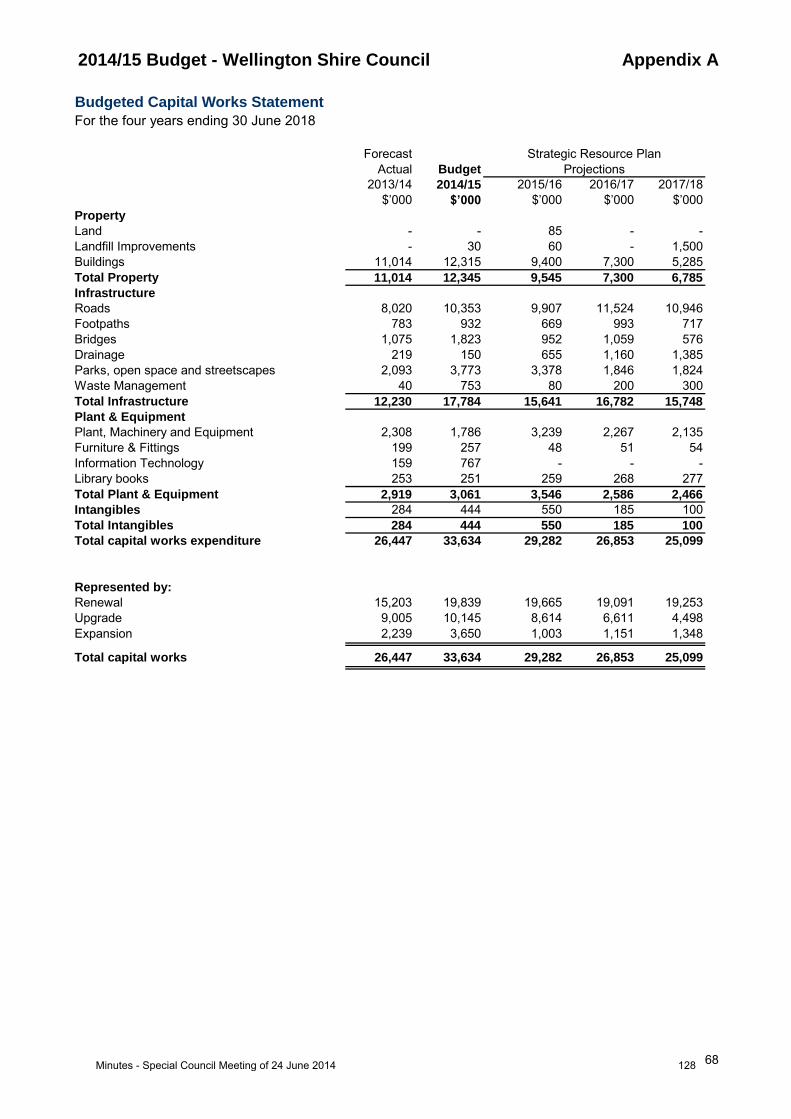
2014/15 Budget - Wellington Shire Council Appendix A
Budgeted Capital Works Statement
For the four years ending 30 June 2018
2013/14 2014/15 2015/16 2016/17 2017/18
$’000 $’000 $’000 $’000 $’000
Property
Land - - 85 - -
Landfill Improvements - 30 60 - 1,500
Buildings 11,014 12,315 9,400 7,300 5,285
Total Property 11,014 12,345 9,545 7,300 6,785
Infrastructure
Roads 8,020 10,353 9,907 11,524 10,946
Footpaths 783 932 669 993 717
Bridges 1,075 1,823 952 1,059 576
Drainage 219 150 655 1,160 1,385
Parks, open space and streetscapes 2,093 3,773 3,378 1,846 1,824
Waste Management 40 753 80 200 300
Total Infrastructure 12,230 17,784 15,641 16,782 15,748
Plant & Equipment
Plant, Machinery and Equipment 2,308 1,786 3,239 2,267 2,135
Furniture & Fittings 199 257 48 51 54
Information Technology 159 767 - - -
Library books 253 251 259 268 277
Total Plant & Equipment 2,919 3,061 3,546 2,586 2,466
Intangibles 284 444 550 185 100
Total Intangibles 284 444 550 185 100
Total capital works expenditure 26,447 33,634 29,282 26,853 25,099
Represented by:
Renewal 15,203 19,839 19,665 19,091 19,253
Upgrade 9,005 10,145 8,614 6,611 4,498
Expansion 2,239 3,650 1,003 1,151 1,348
Total capital works 26,447 33,634 29,282 26,853 25,099
Forecast
Actual Budget Projections
Strategic Resource Plan
68Minutes - Special Council Meeting of 24 June 2014 128
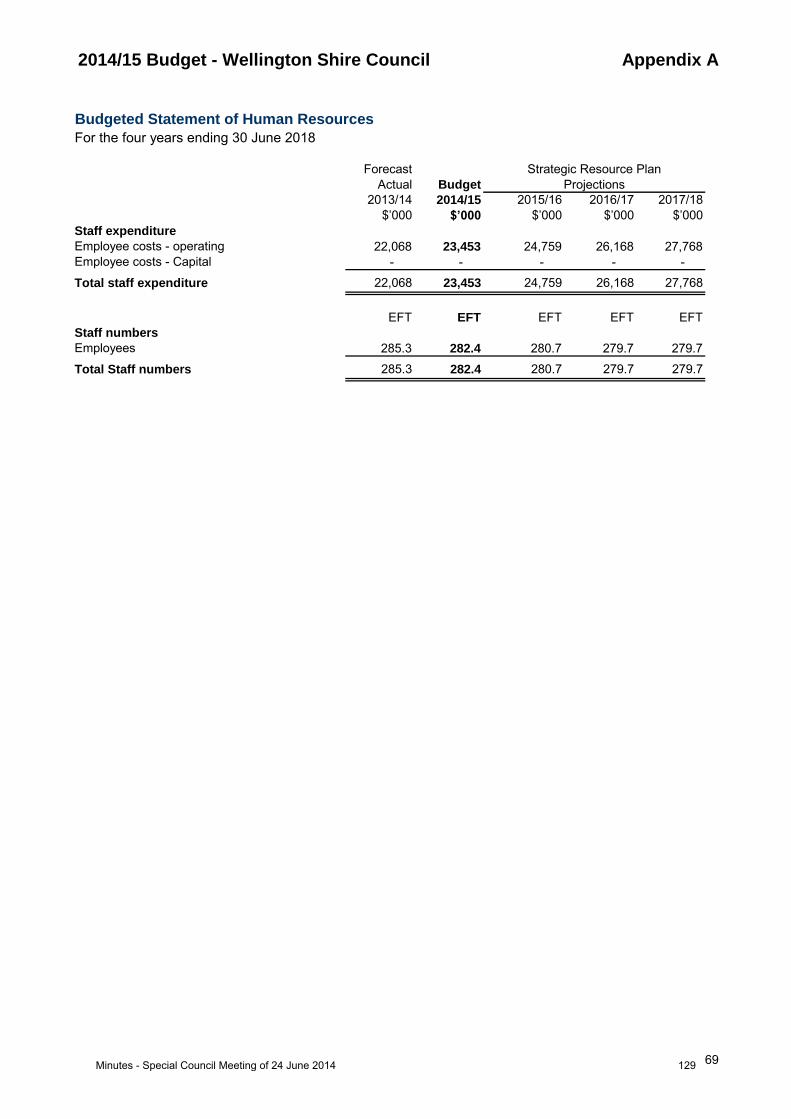
2014/15 Budget - Wellington Shire Council Appendix A
Budgeted Statement of Human Resources
For the four years ending 30 June 2018
2013/14 2014/15 2015/16 2016/17 2017/18
$’000 $’000 $’000 $’000 $’000
Staff expenditure
Employee costs - operating 22,068 23,453 24,759 26,168 27,768
Employee costs - Capital - - - - -
Total staff expenditure 22,068 23,453 24,759 26,168 27,768
EFT EFT EFT EFT EFT
Staff numbers
Employees 285.3 282.4 280.7 279.7 279.7
Total Staff numbers 285.3 282.4 280.7 279.7 279.7
Forecast
Actual Budget
Strategic Resource Plan
Projections
69Minutes - Special Council Meeting of 24 June 2014 129
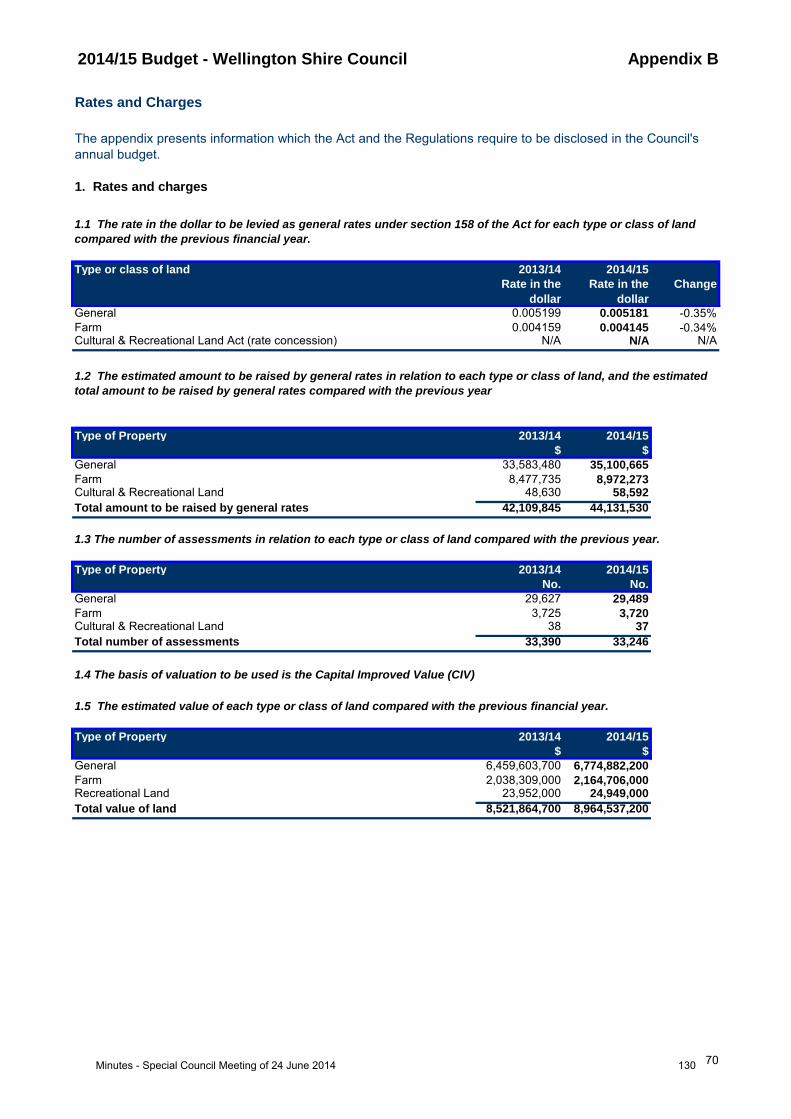
2014/15 Budget - Wellington Shire Council Appendix B
Rates and Charges
1. Rates and charges
Type or class of land 2013/14 2014/15
Rate in the
dollar
Rate in the
dollar
Change
General 0.005199 0.005181 -0.35%
Farm 0.004159 0.004145 -0.34%Cultural & Recreational Land Act (rate concession) N/A N/A N/A
Type of Property 2013/14 2014/15
$ $
General 33,583,480 35,100,665
Farm 8,477,735 8,972,273Cultural & Recreational Land 48,630 58,592
Total amount to be raised by general rates 42,109,845 44,131,530
1.3 The number of assessments in relation to each type or class of land compared with the previous year.
Type of Property 2013/14 2014/15
No. No.
General 29,627 29,489
Farm 3,725 3,720Cultural & Recreational Land 38 37
Total number of assessments 33,390 33,246
1.4 The basis of valuation to be used is the Capital Improved Value (CIV)
Type of Property 2013/14 2014/15
$ $
General 6,459,603,700 6,774,882,200
Farm 2,038,309,000 2,164,706,000Recreational Land 23,952,000 24,949,000
Total value of land 8,521,864,700 8,964,537,200
The appendix presents information which the Act and the Regulations require to be disclosed in the Council's
annual budget.
1.1 The rate in the dollar to be levied as general rates under section 158 of the Act for each type or class of land
compared with the previous financial year.
1.2 The estimated amount to be raised by general rates in relation to each type or class of land, and the estimated
total amount to be raised by general rates compared with the previous year
1.5 The estimated value of each type or class of land compared with the previous financial year.
70Minutes - Special Council Meeting of 24 June 2014 130
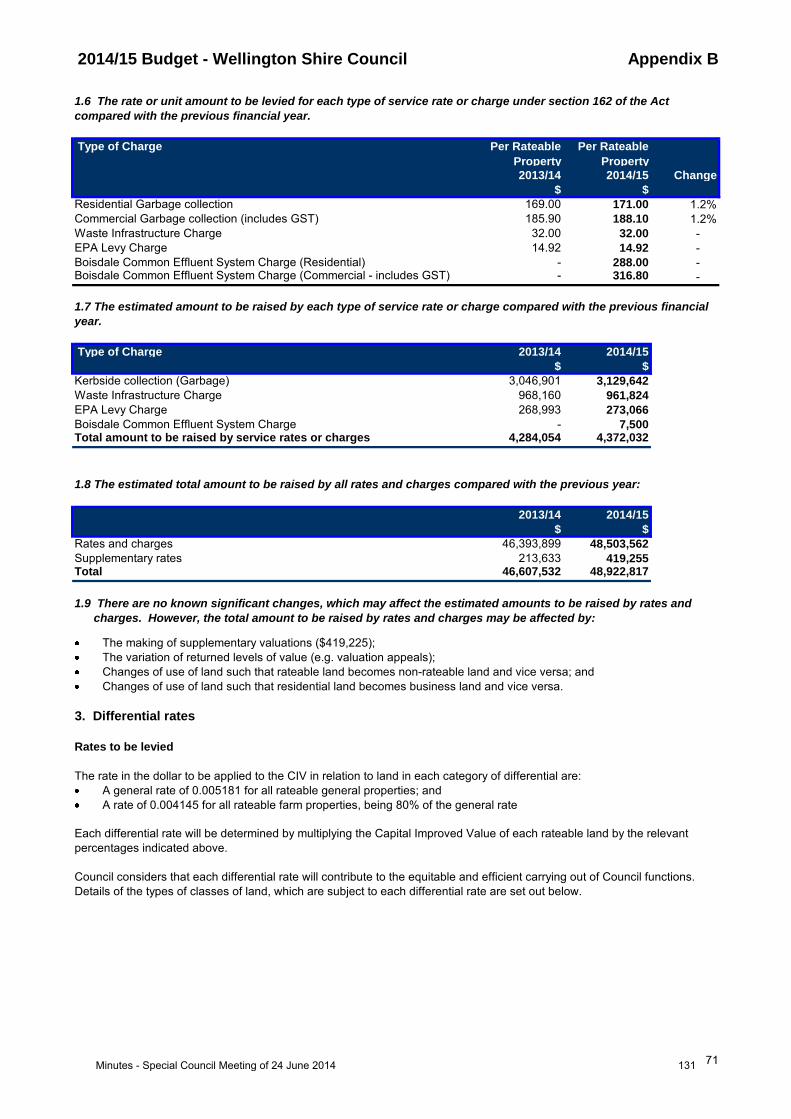
2014/15 Budget - Wellington Shire Council Appendix B
Type of Charge Per Rateable
Property
Per Rateable
Property
2013/14 2014/15 Change
$ $
Residential Garbage collection 169.00 171.00 1.2%
Commercial Garbage collection (includes GST) 185.90 188.10 1.2%
Waste Infrastructure Charge 32.00 32.00 -
EPA Levy Charge 14.92 14.92 -
Boisdale Common Effluent System Charge (Residential) - 288.00 - Boisdale Common Effluent System Charge (Commercial - includes GST) - 316.80 -
Type of Charge 2013/14 2014/15
$ $
Kerbside collection (Garbage) 3,046,901 3,129,642
Waste Infrastructure Charge 968,160 961,824
EPA Levy Charge 268,993 273,066
Boisdale Common Effluent System Charge - 7,500Total amount to be raised by service rates or charges 4,284,054 4,372,032
2013/14 2014/15
$ $
Rates and charges 46,393,899 48,503,562
Supplementary rates 213,633 419,255Total 46,607,532 48,922,817
3. Differential rates
Rates to be levied
1.8 The estimated total amount to be raised by all rates and charges compared with the previous year:
The making of supplementary valuations ($419,225);
A general rate of 0.005181 for all rateable general properties; and
The variation of returned levels of value (e.g. valuation appeals);
A rate of 0.004145 for all rateable farm properties, being 80% of the general rate
1.6 The rate or unit amount to be levied for each type of service rate or charge under section 162 of the Act
compared with the previous financial year.
1.7 The estimated amount to be raised by each type of service rate or charge compared with the previous financial
year.
1.9 There are no known significant changes, which may affect the estimated amounts to be raised by rates and
charges. However, the total amount to be raised by rates and charges may be affected by:
Each differential rate will be determined by multiplying the Capital Improved Value of each rateable land by the relevant
percentages indicated above.
Council considers that each differential rate will contribute to the equitable and efficient carrying out of Council functions.
Details of the types of classes of land, which are subject to each differential rate are set out below.
The rate in the dollar to be applied to the CIV in relation to land in each category of differential are:
Changes of use of land such that rateable land becomes non-rateable land and vice versa; and
Changes of use of land such that residential land becomes business land and vice versa.
71Minutes - Special Council Meeting of 24 June 2014 131
2014/15 Budget - Wellington Shire Council Appendix B
Farm Land
bee-keeping;
viticulture;
Recreational land
horticulture;
• not less than 2 hectares in area; and
that has significant and substantial commercial purpose or character; and
dairying;
grazing (including agistment);
fish-farming;
tree-farming;
pig-farming;
Farm land is any land, which is:
The amounts levied on recreational land have regard to the services provided by the Council in relation to such lands, and
the benefit to the community derived from such recreational lands.
Recreational land is any land, which is as defined in accordance with Section 4 of the Cultural & Recreational Lands Act
1963 :
• controlled by a non-profit organisation which exists for the purpose of providing or promoting culture or sporting recreation
facilities which is used for sporting, recreation or cultural purposes or which is used for agricultural showgrounds.
poultry-farming;
that seeks to make a profit on a continuous or repetitive basis from its activities on the land; and
that is making a profit from its activities on the land, or that has a reasonable prospect of making a
profit from its activities on the land if it continues to operate in the way that it is operating.
fruit-growing or the growing of crops of any kind or for any combination of these activities, and;
• is used by a business;
• is used primarily for:
72Minutes - Special Council Meeting of 24 June 2014 132

2014/15 Budget - Wellington Shire Council Appendix C
Capital Works Program
For the year ending 30 June 2015
· New works for 2014/15
· Works carried forward from the 2013/14 year
1. NEW WORKS FOR 2014/15 PROJECT
CAPITAL WORKS DESCRIPTION % % % COST Grants Contributions Cash Borrowings
R U E $'000 $'000 $'000 $'000 $'000
PROPERTYLANDFILL IMPROVEMENTS
Rosedale Landfill - New Tipping Area Construction 100 - - 30 - - 30 -
TOTAL LANDFILL IMPROVEMENTS 30 - - 30 -
BUILDINGS
West Sale Airport - Land Framework Implementation - 100 - 35 - - 35 -
West Sale Airport - Northern Boundary Fence Replacement 100 - - 85 - - 85 -
Maffra - Depot Office Alterations - 100 - 40 - - 40 -
Desailly Street - Corporate Headquarters Fit-out 50 50 - 2,000 - - 2,000 -
Desailly Street - Corporate Headquarters - Infrastructure 50 50 - 57 - - 57 -
Port of Sale Cultural Hub (Art Gallery & Library) 50 50 - 450 - - 450 -
Maffra - Queen St Kindergarten Roof Replacement 100 - - 40 - - 40 -
Yarram - Station Building Refurbishment 25 50 25 85 - - 85 -
EBBWEC - Energy Efficiencies Upgrade - 100 - 85 - - 85 -
Yarram District Hub Construction - 55 45 185 85 - 100 -
Annual Toilet Renewal Program 100 - - 200 - - 200 -
Aqua Energy - Pool heating & Air Handling Project Stage 2 25 75 - 90 - - 90 -
Heyfield - Toddlers Pool Return Line Replacement 100 - - 24 - - 24 -
Aqua Energy - Cafe Equipment Renewal 100 - - 24 - - 24 -
Aqua Energy - 50m Pool - Starting Blocks 20 80 - 122 - 10 112 -
Aqua Energy - Gym Soft Flooring - - 100 25 - - 25 -
Aqua Energy - Installation of Light Sensors - 100 - 19 - - 19 -
Yarram Recreation Reserve - Clubrooms Construction 100 - - 493 390 - 103 -
Sale - Stephenson Park Lighting Upgrade 100 - - 265 100 15 150 -
Heyfield - Gordon Street Recreation Reserve Clubroom Redevelopment - 100 - 1,350 629 50 671 -
Boating Infrastructure Action Plan Works - 100 - 306 150 - 156 -
Sale Motor Village Electrical Works 65 - 35 116 - - 116 -
This appendix presents a listing of the capital works projects that will be undertaken for the 2014/15 year. The capital works projects are grouped by class and include the following:
(Renewal, Upgrade, Expansion)
73Minutes - Special Council Meeting of 24 June 2014 133
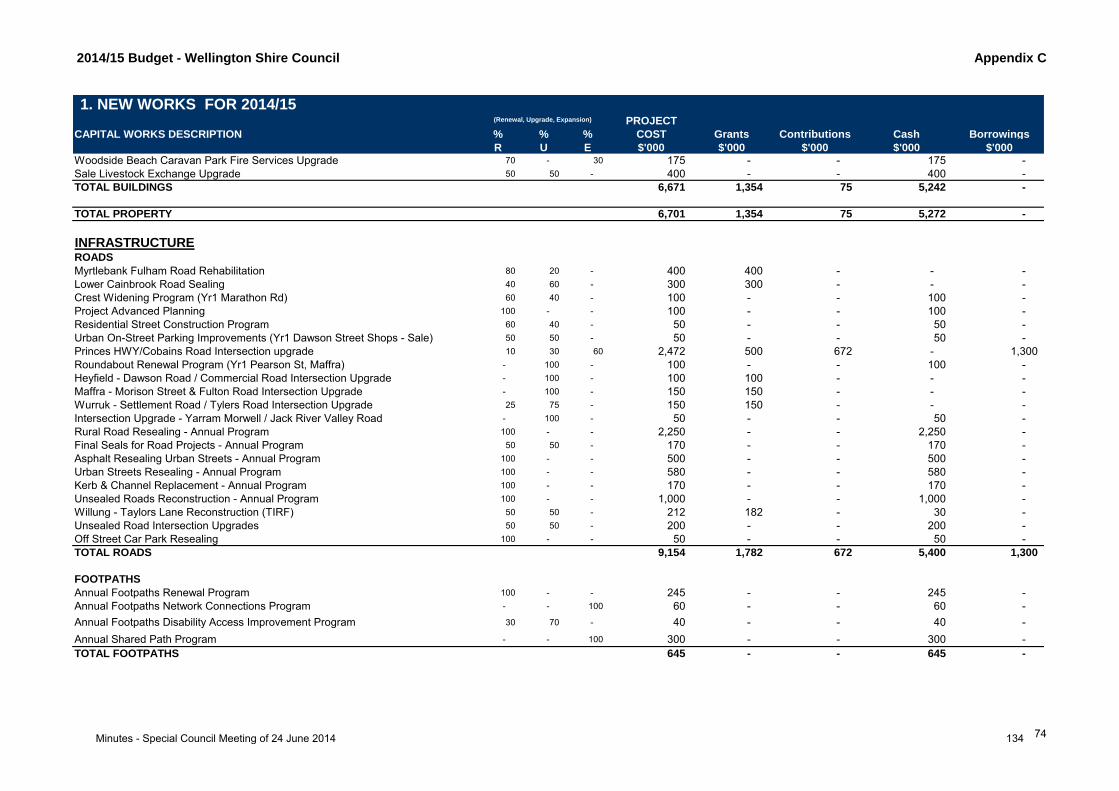
2014/15 Budget - Wellington Shire Council Appendix C
1. NEW WORKS FOR 2014/15 PROJECT
CAPITAL WORKS DESCRIPTION % % % COST Grants Contributions Cash Borrowings
R U E $'000 $'000 $'000 $'000 $'000
Woodside Beach Caravan Park Fire Services Upgrade 70 - 30 175 - - 175 -
Sale Livestock Exchange Upgrade 50 50 - 400 - - 400 -
TOTAL BUILDINGS 6,671 1,354 75 5,242 -
TOTAL PROPERTY 6,701 1,354 75 5,272 -
INFRASTRUCTUREROADS
Myrtlebank Fulham Road Rehabilitation 80 20 - 400 400 - - -
Lower Cainbrook Road Sealing 40 60 - 300 300 - - -
Crest Widening Program (Yr1 Marathon Rd) 60 40 - 100 - - 100 -
Project Advanced Planning 100 - - 100 - - 100 -
Residential Street Construction Program 60 40 - 50 - - 50 -
Urban On-Street Parking Improvements (Yr1 Dawson Street Shops - Sale) 50 50 - 50 - - 50 -
Princes HWY/Cobains Road Intersection upgrade 10 30 60 2,472 500 672 - 1,300
Roundabout Renewal Program (Yr1 Pearson St, Maffra) - 100 - 100 - - 100 -
Heyfield - Dawson Road / Commercial Road Intersection Upgrade - 100 - 100 100 - - -
Maffra - Morison Street & Fulton Road Intersection Upgrade - 100 - 150 150 - - -
Wurruk - Settlement Road / Tylers Road Intersection Upgrade 25 75 - 150 150 - - -
Intersection Upgrade - Yarram Morwell / Jack River Valley Road - 100 - 50 - - 50 -
Rural Road Resealing - Annual Program 100 - - 2,250 - - 2,250 -
Final Seals for Road Projects - Annual Program 50 50 - 170 - - 170 -
Asphalt Resealing Urban Streets - Annual Program 100 - - 500 - - 500 -
Urban Streets Resealing - Annual Program 100 - - 580 - - 580 -
Kerb & Channel Replacement - Annual Program 100 - - 170 - - 170 -
Unsealed Roads Reconstruction - Annual Program 100 - - 1,000 - - 1,000 -
Willung - Taylors Lane Reconstruction (TIRF) 50 50 - 212 182 - 30 -
Unsealed Road Intersection Upgrades 50 50 - 200 - - 200 -
Off Street Car Park Resealing 100 - - 50 - - 50 -
TOTAL ROADS 9,154 1,782 672 5,400 1,300
FOOTPATHS
Annual Footpaths Renewal Program 100 - - 245 - - 245 -
Annual Footpaths Network Connections Program - - 100 60 - - 60 -
Annual Footpaths Disability Access Improvement Program 30 70 - 40 - - 40 -
Annual Shared Path Program - - 100 300 - - 300 -
TOTAL FOOTPATHS 645 - - 645 -
(Renewal, Upgrade, Expansion)
74Minutes - Special Council Meeting of 24 June 2014 134
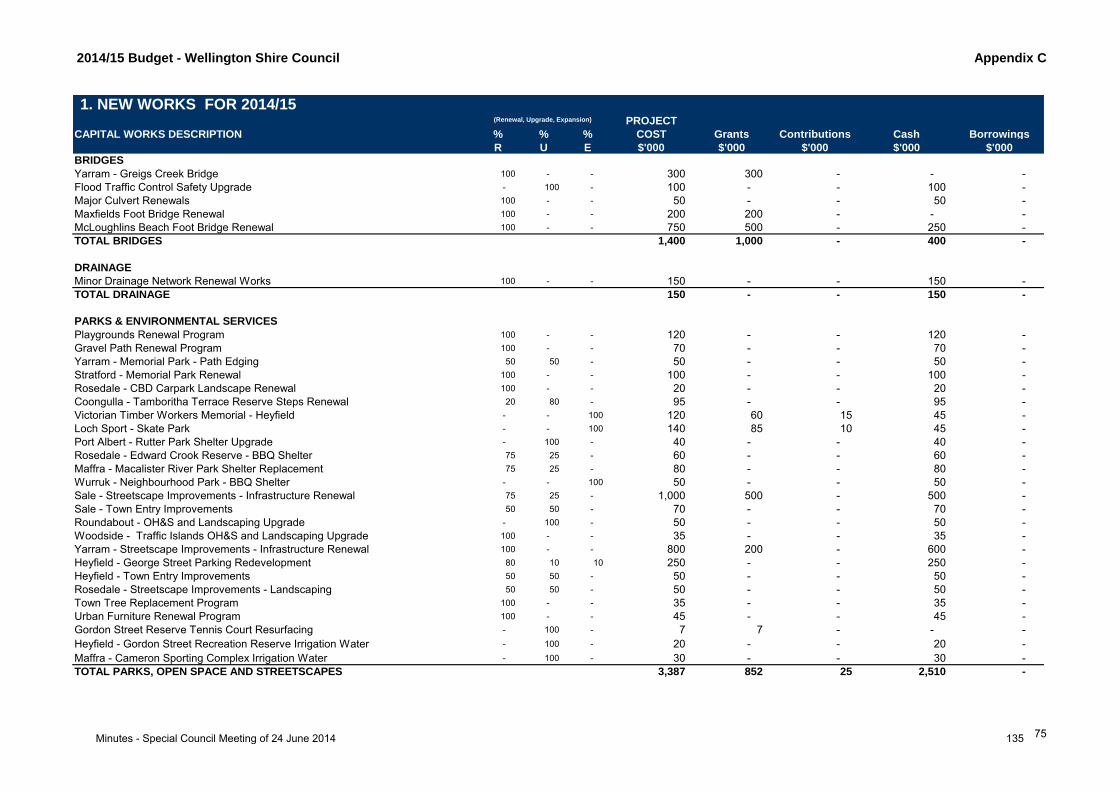
2014/15 Budget - Wellington Shire Council Appendix C
1. NEW WORKS FOR 2014/15 PROJECT
CAPITAL WORKS DESCRIPTION % % % COST Grants Contributions Cash Borrowings
R U E $'000 $'000 $'000 $'000 $'000 BRIDGES
Yarram - Greigs Creek Bridge 100 - - 300 300 - - -
Flood Traffic Control Safety Upgrade - 100 - 100 - - 100 -
Major Culvert Renewals 100 - - 50 - - 50 -
Maxfields Foot Bridge Renewal 100 - - 200 200 - - -
McLoughlins Beach Foot Bridge Renewal 100 - - 750 500 - 250 -
TOTAL BRIDGES 1,400 1,000 - 400 -
DRAINAGE
Minor Drainage Network Renewal Works 100 - - 150 - - 150 -
TOTAL DRAINAGE 150 - - 150 -
PARKS & ENVIRONMENTAL SERVICES
Playgrounds Renewal Program 100 - - 120 - - 120 -
Gravel Path Renewal Program 100 - - 70 - - 70 -
Yarram - Memorial Park - Path Edging 50 50 - 50 - - 50 -
Stratford - Memorial Park Renewal 100 - - 100 - - 100 -
Rosedale - CBD Carpark Landscape Renewal 100 - - 20 - - 20 -
Coongulla - Tamboritha Terrace Reserve Steps Renewal 20 80 - 95 - - 95 -
Victorian Timber Workers Memorial - Heyfield - - 100 120 60 15 45 -
Loch Sport - Skate Park - - 100 140 85 10 45 -
Port Albert - Rutter Park Shelter Upgrade - 100 - 40 - - 40 -
Rosedale - Edward Crook Reserve - BBQ Shelter 75 25 - 60 - - 60 -
Maffra - Macalister River Park Shelter Replacement 75 25 - 80 - - 80 -
Wurruk - Neighbourhood Park - BBQ Shelter - - 100 50 - - 50 -
Sale - Streetscape Improvements - Infrastructure Renewal 75 25 - 1,000 500 - 500 -
Sale - Town Entry Improvements 50 50 - 70 - - 70 -
Roundabout - OH&S and Landscaping Upgrade - 100 - 50 - - 50 -
Woodside - Traffic Islands OH&S and Landscaping Upgrade 100 - - 35 - - 35 -
Yarram - Streetscape Improvements - Infrastructure Renewal 100 - - 800 200 - 600 -
Heyfield - George Street Parking Redevelopment 80 10 10 250 - - 250 -
Heyfield - Town Entry Improvements 50 50 - 50 - - 50 -
Rosedale - Streetscape Improvements - Landscaping 50 50 - 50 - - 50 -
Town Tree Replacement Program 100 - - 35 - - 35 -
Urban Furniture Renewal Program 100 - - 45 - - 45 -
Gordon Street Reserve Tennis Court Resurfacing - 100 - 7 7 - - -
Heyfield - Gordon Street Recreation Reserve Irrigation Water - 100 - 20 - - 20 -
Maffra - Cameron Sporting Complex Irrigation Water - 100 - 30 - - 30 -
TOTAL PARKS, OPEN SPACE AND STREETSCAPES 3,387 852 25 2,510 -
(Renewal, Upgrade, Expansion)
75Minutes - Special Council Meeting of 24 June 2014 135
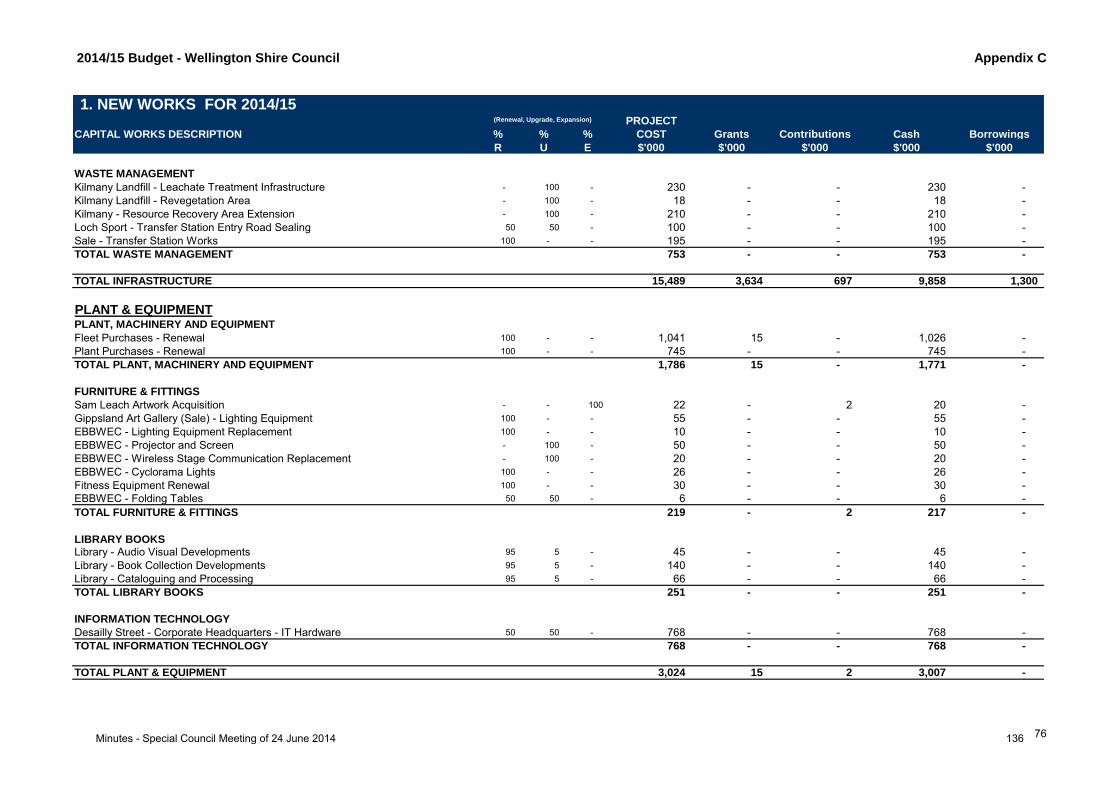
2014/15 Budget - Wellington Shire Council Appendix C
1. NEW WORKS FOR 2014/15 PROJECT
CAPITAL WORKS DESCRIPTION % % % COST Grants Contributions Cash Borrowings
R U E $'000 $'000 $'000 $'000 $'000
WASTE MANAGEMENT
Kilmany Landfill - Leachate Treatment Infrastructure - 100 - 230 - - 230 -
Kilmany Landfill - Revegetation Area - 100 - 18 - - 18 -
Kilmany - Resource Recovery Area Extension - 100 - 210 - - 210 -
Loch Sport - Transfer Station Entry Road Sealing 50 50 - 100 - - 100 -
Sale - Transfer Station Works 100 - - 195 - - 195 -
TOTAL WASTE MANAGEMENT 753 - - 753 -
TOTAL INFRASTRUCTURE 15,489 3,634 697 9,858 1,300
PLANT & EQUIPMENTPLANT, MACHINERY AND EQUIPMENT
Fleet Purchases - Renewal 100 - - 1,041 15 - 1,026 -
Plant Purchases - Renewal 100 - - 745 - - 745 -
TOTAL PLANT, MACHINERY AND EQUIPMENT 1,786 15 - 1,771 -
FURNITURE & FITTINGS
Sam Leach Artwork Acquisition - - 100 22 - 2 20 -
Gippsland Art Gallery (Sale) - Lighting Equipment 100 - - 55 - - 55 -
EBBWEC - Lighting Equipment Replacement 100 - - 10 - - 10 -
EBBWEC - Projector and Screen - 100 - 50 - - 50 -
EBBWEC - Wireless Stage Communication Replacement - 100 - 20 - - 20 -
EBBWEC - Cyclorama Lights 100 - - 26 - - 26 -
Fitness Equipment Renewal 100 - - 30 - - 30 -
EBBWEC - Folding Tables 50 50 - 6 - - 6 -
TOTAL FURNITURE & FITTINGS 219 - 2 217 -
LIBRARY BOOKS Library - Audio Visual Developments 95 5 - 45 - - 45 -
Library - Book Collection Developments 95 5 - 140 - - 140 -
Library - Cataloguing and Processing 95 5 - 66 - - 66 -
TOTAL LIBRARY BOOKS 251 - - 251 -
INFORMATION TECHNOLOGY
Desailly Street - Corporate Headquarters - IT Hardware 50 50 - 768 - - 768 -
TOTAL INFORMATION TECHNOLOGY 768 - - 768 -
TOTAL PLANT & EQUIPMENT 3,024 15 2 3,007 -
(Renewal, Upgrade, Expansion)
76Minutes - Special Council Meeting of 24 June 2014 136
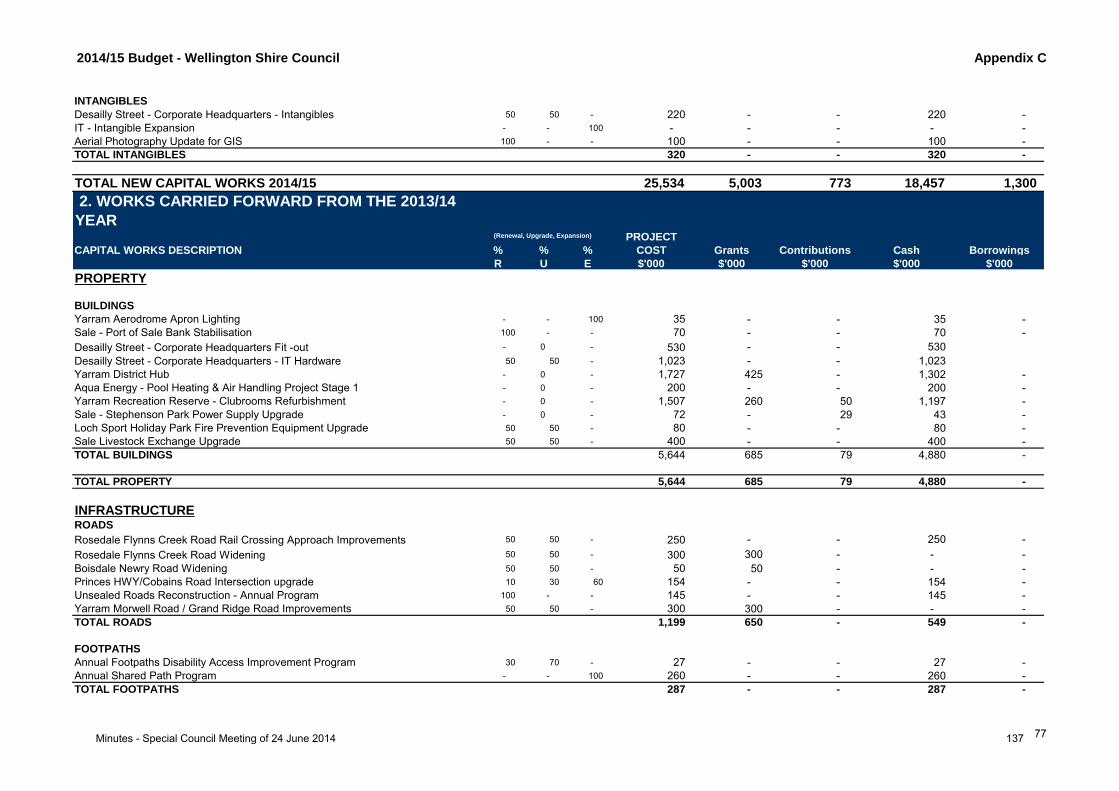
2014/15 Budget - Wellington Shire Council Appendix C
INTANGIBLES
Desailly Street - Corporate Headquarters - Intangibles 50 50 - 220 - - 220 -
IT - Intangible Expansion - - 100 - - - - -
Aerial Photography Update for GIS 100 - - 100 - - 100 -
TOTAL INTANGIBLES 320 - - 320 -
TOTAL NEW CAPITAL WORKS 2014/15 25,534 5,003 773 18,457 1,300
2. WORKS CARRIED FORWARD FROM THE 2013/14
YEAR PROJECT
CAPITAL WORKS DESCRIPTION % % % COST Grants Contributions Cash Borrowings
R U E $'000 $'000 $'000 $'000 $'000
PROPERTY
BUILDINGS
Yarram Aerodrome Apron Lighting - - 100 35 - - 35 -
Sale - Port of Sale Bank Stabilisation 100 - - 70 - - 70 -
Desailly Street - Corporate Headquarters Fit -out - 0 - 530 - - 530
Desailly Street - Corporate Headquarters - IT Hardware 50 50 - 1,023 - - 1,023
Yarram District Hub - 0 - 1,727 425 - 1,302 -
Aqua Energy - Pool Heating & Air Handling Project Stage 1 - 0 - 200 - - 200 -
Yarram Recreation Reserve - Clubrooms Refurbishment - 0 - 1,507 260 50 1,197 -
Sale - Stephenson Park Power Supply Upgrade - 0 - 72 - 29 43 -
Loch Sport Holiday Park Fire Prevention Equipment Upgrade 50 50 - 80 - - 80 -
Sale Livestock Exchange Upgrade 50 50 - 400 - - 400 -
TOTAL BUILDINGS 5,644 685 79 4,880 -
TOTAL PROPERTY 5,644 685 79 4,880 -
INFRASTRUCTUREROADS
Rosedale Flynns Creek Road Rail Crossing Approach Improvements 50 50 - 250 - - 250 -
Rosedale Flynns Creek Road Widening 50 50 - 300 300 - - -
Boisdale Newry Road Widening 50 50 - 50 50 - - -
Princes HWY/Cobains Road Intersection upgrade 10 30 60 154 - - 154 -
Unsealed Roads Reconstruction - Annual Program 100 - - 145 - - 145 -
Yarram Morwell Road / Grand Ridge Road Improvements 50 50 - 300 300 - - -
TOTAL ROADS 1,199 650 - 549 -
FOOTPATHS
Annual Footpaths Disability Access Improvement Program 30 70 - 27 - - 27 -
Annual Shared Path Program - - 100 260 - - 260 -
TOTAL FOOTPATHS 287 - - 287 -
(Renewal, Upgrade, Expansion)
77Minutes - Special Council Meeting of 24 June 2014 137
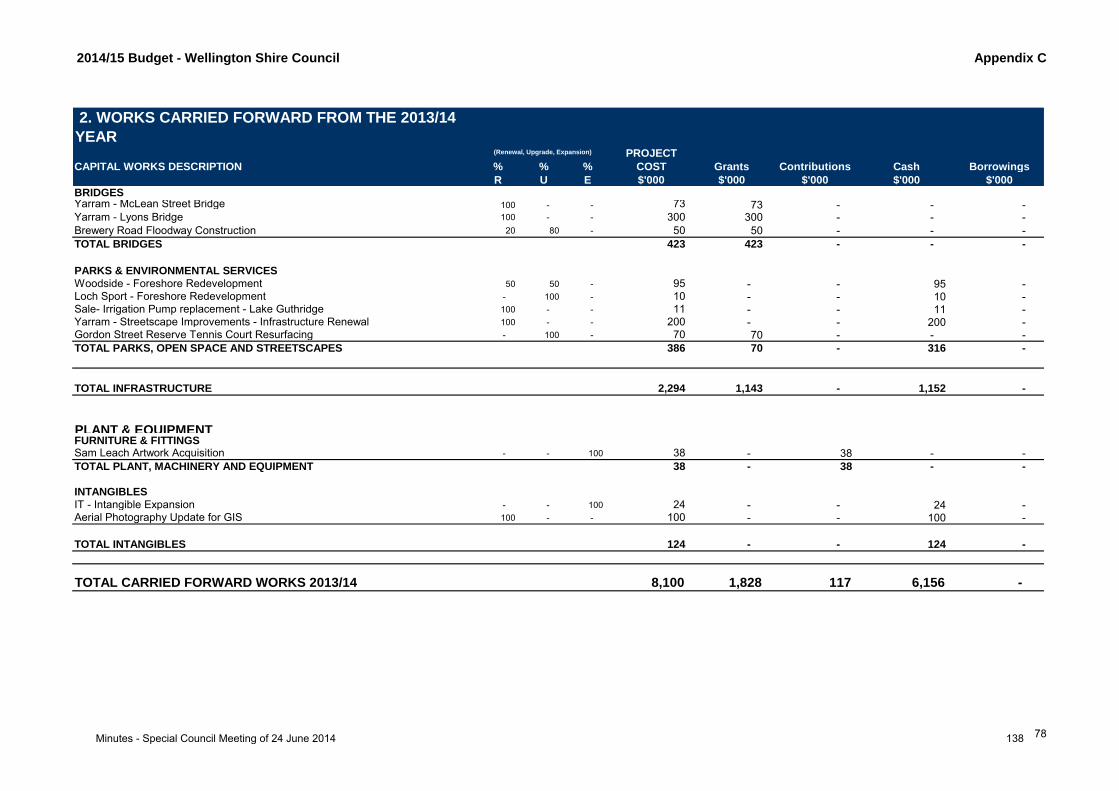
2014/15 Budget - Wellington Shire Council Appendix C
2. WORKS CARRIED FORWARD FROM THE 2013/14
YEAR PROJECT
CAPITAL WORKS DESCRIPTION % % % COST Grants Contributions Cash Borrowings
R U E $'000 $'000 $'000 $'000 $'000 BRIDGESYarram - McLean Street Bridge 100 - - 73 73 - - - Yarram - Lyons Bridge 100 - - 300 300 - - -
Brewery Road Floodway Construction 20 80 - 50 50 - - -
TOTAL BRIDGES 423 423 - - -
PARKS & ENVIRONMENTAL SERVICES
Woodside - Foreshore Redevelopment 50 50 - 95 - - 95 - Loch Sport - Foreshore Redevelopment - 100 - 10 - - 10 - Sale- Irrigation Pump replacement - Lake Guthridge 100 - - 11 - - 11 - Yarram - Streetscape Improvements - Infrastructure Renewal 100 - - 200 - - 200 - Gordon Street Reserve Tennis Court Resurfacing - 100 - 70 70 - - -
TOTAL PARKS, OPEN SPACE AND STREETSCAPES 386 70 - 316 -
TOTAL INFRASTRUCTURE 2,294 1,143 - 1,152 -
PLANT & EQUIPMENTFURNITURE & FITTINGSSam Leach Artwork Acquisition - - 100 38 - 38 - -
TOTAL PLANT, MACHINERY AND EQUIPMENT 38 - 38 - -
INTANGIBLES
IT - Intangible Expansion - - 100 24 - - 24 - Aerial Photography Update for GIS 100 - - 100 - - 100 -
TOTAL INTANGIBLES 124 - - 124 -
TOTAL CARRIED FORWARD WORKS 2013/14 8,100 1,828 117 6,156 -
(Renewal, Upgrade, Expansion)
78Minutes - Special Council Meeting of 24 June 2014 138
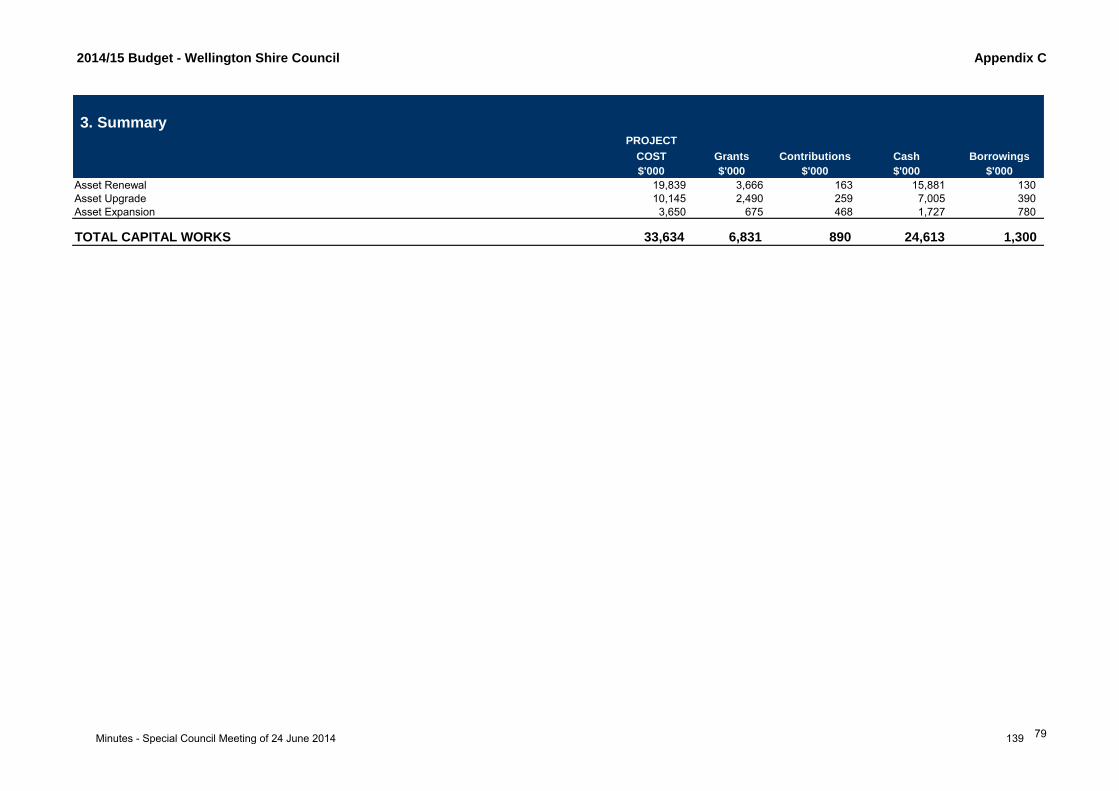
2014/15 Budget - Wellington Shire Council Appendix C
3. Summary PROJECT
COST Grants Contributions Cash Borrowings
$'000 $'000 $'000 $'000 $'000
Asset Renewal 19,839 3,666 163 15,881 130
Asset Upgrade 10,145 2,490 259 7,005 390
Asset Expansion 3,650 675 468 1,727 780
TOTAL CAPITAL WORKS 33,634 6,831 890 24,613 1,300
79Minutes - Special Council Meeting of 24 June 2014 139

C=COUNCIL SET L=LEGISLATION
WELLINGTON SHIRE COUNCIL
PROPOSED SCHEDULE OF FEES AND CHARGES AS AT 1 JULY 2014
GST INCLUSIVE
APPENDIX D
Service C/L GST
%
Fee 13/14 including Tax $ Proposed Fee 14/15
including Tax $
Effective Date
ART GALLERY
Art Gallery Life Drawing Classes (6 week course) C 10 165.00 170.00 01-Jul-14
Art Gallery Education – subscriptions
Primary Schools under 150 C 10 91.00 94.00 01-Jan-15
Primary Schools over 150 C 10 185.00 191.00 01-Jan-15
Secondary Schools C 10 197.00 203.00 01-Jan-15
Specialist Schools C 10 91.00 94.00 01-Jan-15
Kindergartens C 10 91.00 94.00 01-Jan-15
Tertiary Institutions C 10 308.00 318.00 01-Jan-15
Gecko Junior Memberships – First Child C 10 12.00 12.50 01-Jan-15
Gecko Junior Memberships – Each Additional Child C 10 8.00 8.50 01-Jan-15
ESSO BHP BILLITON WELLINGTON ENTERTAINMENT CENTRE
Main stage Hire Rates
Commercial Rate per day (Max 16 hours) C 10 1,210.00 1,250.00 01-Jul-14
Community Rate per day (Max 16 hours) C 10 720.00 745.00 01-Jul-14
Commercial per Week C 10 4,875.00 5,050.00 01-Jul-14
Community per Week C 10 3,190.00 3,300.00 01-Jul-14
Commercial Rate - Short hire (max 4 hours) C 10 785.00 810.00 01-Jul-14
Community Rate - Short hire (max 4 hours) C 10 460.00 475.00 01-Jul-14
Rehearsal Room & Meeting Room & Foyer Rate per day (Max 8 hours) C 10 195.00 265.00 01-Jul-14
Rehearsal Room & Meeting Room - Short hire (Max 4 hours) C 10 35.00 140.00 01-Jul-14
Ticket fees
Ticket fees per ticket - Commercial C 10 3.85 3.90 01-Jul-14
Ticket fees average per ticket - Community C 10 2.30 2.35 01-Jul-14
Complimentary Ticket Fee C 10 0.33 0.55 01-Jul-14
Credit Card fee - 4% of transaction value charged to the hirer. C 10 0.00 4% 01-Jul-14
Tech Labour
Tech Labour Charge Out per hour - Commercial C 10 43.00 45.00 01-Jul-14
Tech Labour Charge Out per hour - Community C 10 43.00 43.00 01-Jul-14
Labour Front of House
FOH Labour Charge out per hour - Commercial C 10 39.00 41.00 01-Jul-14
FOH Labour Charge out per hour - Community C 10 39.00 41.00 01-Jul-14
Equipment
Use of Grand Piano C 10 0.00 150.00 01-Jul-14
Piano Tune C 10 0.00 Cost Price 01-Jul-14
Consumables (charged at cost +15%) C 10 0.00 Cost price + 15% 01-Jul-14
LIBRARY
Photocopies A4 per page C 10 0.20 0.20 01-Nov-01
Photocopies A3 per page C 10 0.50 0.50 01-Nov-01
Printing from PC’s Colour A4 per page C 10 1.00 1.00 01-Jul-10
Printing from PC’s Colour A3 per page C 10 2.00 2.00 01-Jul-10
Printing from PC’s B&W A4 per page C 10 0.20 0.20 01-Nov-01
Microfilm Printing A4 per page C 10 0.20 0.20 01-Jul-10
Interlibrary loans- Search fee per book C 10 4.00 4.00 01-Jul-10
Interlibrary loans- Books per transfer C 10 18.50 18.50 01-Jul-13
Overdues per day after grace period expires C 10 0.15 0.15 01-Jul-10
National facsimile fees (1st page) C 10 4.00 4.00 01-Jul-13
National facsimile fees Additional Pages per page C 10 1.00 1.00 01-Jul-13
Overseas facsimile fees (1st page) C 10 8.00 8.00 01-Jul-13
Overseas facsimile fees Additional Pages per page C 10 2.00 2.00 01-Jul-13
Library Receiving Faxes per page C 10 1.00 1.00 01-Jul-13
Library Cloth Bags C 10 4.00 4.00 01-Jul-13
Mini-earphones C 10 1.00 1.00 01-Jul-14
Library Laminating A4 size C 10 3.50 4.00 01-Jul-14
Library Book Covering C 10 7.00 10.00 01-Jul-14
Library Binding Repairs (thin book approx 10 mins) C 10 9.90 10.00 01-Jul-14
Library Binding Repairs (thick book approx 15 mins) C 10 13.20 15.00 01-Jul-14
Replacement membership cards C 10 5.80 5.80 01-Jul-12
USB Drive 4 MB C 10 8.00 8.00 01-Jul-13
Lost Book or Audio-Visual item C 10 RRP RRP 01-Jul-13
80
Minutes - Special Council Meeting of 24 June 2014 140

C=COUNCIL SET L=LEGISLATION
WELLINGTON SHIRE COUNCIL
PROPOSED SCHEDULE OF FEES AND CHARGES AS AT 1 JULY 2014
GST INCLUSIVE
APPENDIX D
Service C/L GST
%
Fee 13/14 including Tax $ Proposed Fee 14/15
including Tax $
Effective Date
GIPPSLAND REGIONAL SPORTS COMPLEX
Indoor Courts
Court Hire (peak) per hour C 10 41.90 43.80 01-Jul-14
Court Hire (off peak) per hour C 10 30.90 32.30 01-Jul-14
Training/Casual Use - adult / entry fee C 10 5.30 5.50 01-Jul-14
Training/Casual Use - concession / entry fee C 10 2.70 2.80 01-Jul-14
Outdoor Courts
Outdoor Court with Lights - per hour (Capped at 6 Courts) C 10 8.70 9.20 01-Jul-14
Outdoor Court no Lights - per hour (Capped at 6 Courts) C 10 4.20 4.40 01-Jul-14
School Use C 10 2.80 2.90 01-Jul-14
Meeting/Club Rooms
Meeting Room - per hour C 10 3.50 3.80 01-Jul-14
Club Room (half) - per hour C 10 10.50 11.30 01-Jul-14
Club Room (full) - per hour C 10 21.00 22.60 01-Jul-14
Club Administration Office
Office Annual Hire Fee C 10 275.00 285.00 01-Jul-14
Team Match Fees - Competition run by W.S.C.
Indoor Soccer - per team C 10 52.00 55.00 01-Oct-14
Indoor Netball - per team C 10 52.00 55.00 01-Oct-14
Outdoor Netball - per team C 10 32.00 34.00 01-Oct-14
Training Session Passes
Training Casual Adult 10 Session Pass C 10 47.70 49.50 01-Jul-14
Training Casual Concession 10 Session Pass C 10 24.30 25.20 01-Jul-14
AQUA ENERGY
Concession Swim - health care card holders, DVA, Centrelink Pensioner concession, student
concession
Aquatics Casual Entry
Swimming pool hire - whole per hour C 10 128.00 132.00 01-Jul-14
Swimming pool lane hire - per hour C 10 39.00 40.20 01-Jul-14
Adult Swim C 10 5.60 5.80 01-Jul-14
Child Swim (4-15) C 10 3.90 3.90 01-Jul-13
Concession Swim C 10 4.30 4.70 01-Jul-14
School Group Swim (per student) C 10 3.20 3.20 01-Jan-14
School Group Swim - cost of instructor C 10 38.10 39.30 01-Jan-15
Family Swim (as listed on Medicare card) C 10 15.70 15.70 01-Jul-13
Swim, Sauna C 10 8.40 8.40 01-Jul-13
Swim, Sauna - Concession C 10 6.70 6.70 01-Jul-13
Learn to Swim Lessons
Swim lessons - per session C 11.30 11.70 01-Jul-14
Swim lesson direct debit - per fortnight C 19.20 19.80 01-Jul-14
Private 1:1 - Half Hour C 37.10 38.30 01-Jul-14
Holiday swim program C 56.60 58.30 01-Jul-14
Gym and Group Fitness Casual Entry
Group Exercise Classes - land & aqua adult C 10 12.60 13.00 01-Jul-14
Group Exercise Classes - land & aqua conc. C 10 10.00 10.40 01-Jul-14
Group Exercise Classes - land (schools) C 10 7.10 7.10 01-Jan-14
Teen Gym (classes or gym) C 10 8.20 8.50 01-Jul-14
School entry (gym) C 10 9.80 10.10 01-Jan-15
Living Longer Living Stronger sessions (gym/fitness classes) C 10 7.00 7.00 01-Jan-14
Gym - Adult C 10 18.20 18.80 01-Jul-14
Gym - Concession C 10 14.60 15.10 01-Jul-14
Multi Visit Passes
10 visit swim - adult C 10 50.10 52.20 01-Jul-14
10 visit swim - child C 10 35.00 35.10 01-Jul-14
10 visit swim - concession C 10 38.90 42.30 01-Jul-14
10 visit swim - family C 10 137.20 141.30 01-Jul-14
10 visit swim, sauna - adult C 10 76.00 76.00 01-Jul-13
10 visit swim, sauna - concession C 10 60.30 60.30 01-Jul-13
10 visit gym - adult C 10 168.90 169.20 01-Jul-14
10 visit gym - concession C 10 136.00 136.00 01-Jul-13
10 visit group exercise pass (land/aqua) - adult C 10 113.10 117.00 01-Jul-14
10 visit group exercise pass (land/aqua) - concession C 10 89.90 93.60 01-Jul-14
81
Minutes - Special Council Meeting of 24 June 2014 141

C=COUNCIL SET L=LEGISLATION
WELLINGTON SHIRE COUNCIL
PROPOSED SCHEDULE OF FEES AND CHARGES AS AT 1 JULY 2014
GST INCLUSIVE
APPENDIX D
Service C/L GST
%
Fee 13/14 including Tax $ Proposed Fee 14/15
including Tax $
Effective Date
AQUA ENERGY contDirect Debit Memberships
Joining Fee (direct debit membership) C 10 64.00 66.00 01-Jul-14
Membership card replacement fee C 10 7.70 8.00 01-Jul-14
Aquatic direct debit - adult - per fortnight C 10 14.40 14.40 01-Jul-13
Aquatic direct debit - concession - per fortnight C 10 10.80 10.80 01-Jul-13
Aquatic direct debit - child - per fortnight C 10 9.80 9.80 01-Jul-13
Aquatic direct debit - family - per fortnight C 10 23.70 23.70 01-Jul-13
Gold direct debit - adult - per fortnight C 10 33.00 34.70 01-Jul-14
Gold direct debit - concession - per fortnight C 10 26.30 27.70 01-Jul-14
Gold direct debit - family - per fortnight C 10 57.70 57.70 01-Jul-13
Corporate - adult C 10 29.90 31.20 01-Jul-14
Corporate - family C 10 49.60 52.00 01-Jul-14
Living Longer Living Stronger - direct debit - Fortnightly C 10 24.70 26.80 01-Jul-14
Term Memberships
Aquatic 3mth - adult C 10 165.00 165.00 01-Jul-13
Aquatic 3mth - concession C 10 145.00 145.00 01-Jul-13
Aquatic 3mth - child C 10 136.00 136.00 01-Jul-13
Aquatic 3mth - family C 10 215.00 215.00 01-Jul-13
Aquatic 6mth - adult C 10 239.00 239.00 01-Jul-13
Aquatic 6mth - concession C 10 206.00 206.00 01-Jul-13
Aquatic 6mth - child C 10 187.00 187.00 01-Jul-13
Aquatic 6mth - family C 10 340.00 345.00 01-Jul-14
Aquatic 12mth - concession C 10 322.00 334.00 01-Jul-14
Aquatic 12mth - child C 10 286.00 289.00 01-Jul-14
Aquatic 12mth - family C 10 587.00 623.00 01-Jul-14
Gold 3mth - adult C 10 299.00 299.00 01-Jul-13
Gold 3mth - concession C 10 263.00 263.00 01-Jul-13
Gold 3mth - family C 10 453.00 453.00 01-Jul-13
Gold 6mth - adult C 10 525.00 525.00 01-Jul-13
Gold 6mth - concession C 10 433.00 433.00 01-Jul-13
Gold 6mth - family C 10 805.00 816.00 01-Jul-14
Gold 12mth - adult C 10 937.00 966.00 01-Jul-14
Gold 12mth - concession C 10 762.00 786.00 01-Jul-14
Gold 12mth - family C 10 1,504.00 1,566.00 01-Jul-14
Living Longer Living Stronger - 6 month C 10 423.00 423.00 01-Jul-13
Living Longer Living Stronger - 12 month C 10 740.00 763.00 01-Jul-14
Corporate 12mth - adult C 10 843.00 876.00 01-Jul-14
Corporate 12mth - family C 10 1353.00 1416.00 01-Jul-14
Other
Crèche - members 1 child per session C 10 4.00 4.90 01-Jul-14
Crèche - non members 1 child per session C 10 7.40 8.20 01-Jul-14
Birthday Parties - Set Up Fee C 10 30.00 30.90 01-Jul-14
OUTDOOR POOLS
Single Admission (All Pools)
Adult C 10 5.60 5.80 01-Jul-14
Family C 10 15.70 15.70 01-Jul-13
Concession C 10 4.30 4.70 01-Jul-14
Child (4-15) C 10 3.90 3.90 01-Jul-13
Memberships/Season Passes (Sale, Maffra & Yarram) - 18 Weeks
Adult C 10 102.00 115.70 01-Jul-14
Family C 10 180.20 192.80 01-Jul-14
Concession C 10 81.40 92.80 01-Jul-14
Child (4-15) C 10 70.00 77.20 01-Jul-14
Memberships/Season Passes (Stratford, Heyfield, Rosedale) - 15 Weeks
Adult C 10 84.50 96.40 01-Jul-14
Family C 10 148.30 160.70 01-Jul-14
Concession C 10 68.00 77.30 01-Jul-14
Child (4-15) C 10 57.70 64.40 01-Jul-14
Groups
Schools (own instructor) C 10 3.00 3.20 01-Jul-14
Carnivals - per hour C 10 123.10 126.80 01-Jul-14
Additional lifeguard - per hour C 10 38.10 39.30 01-Jul-14
82
Minutes - Special Council Meeting of 24 June 2014 142
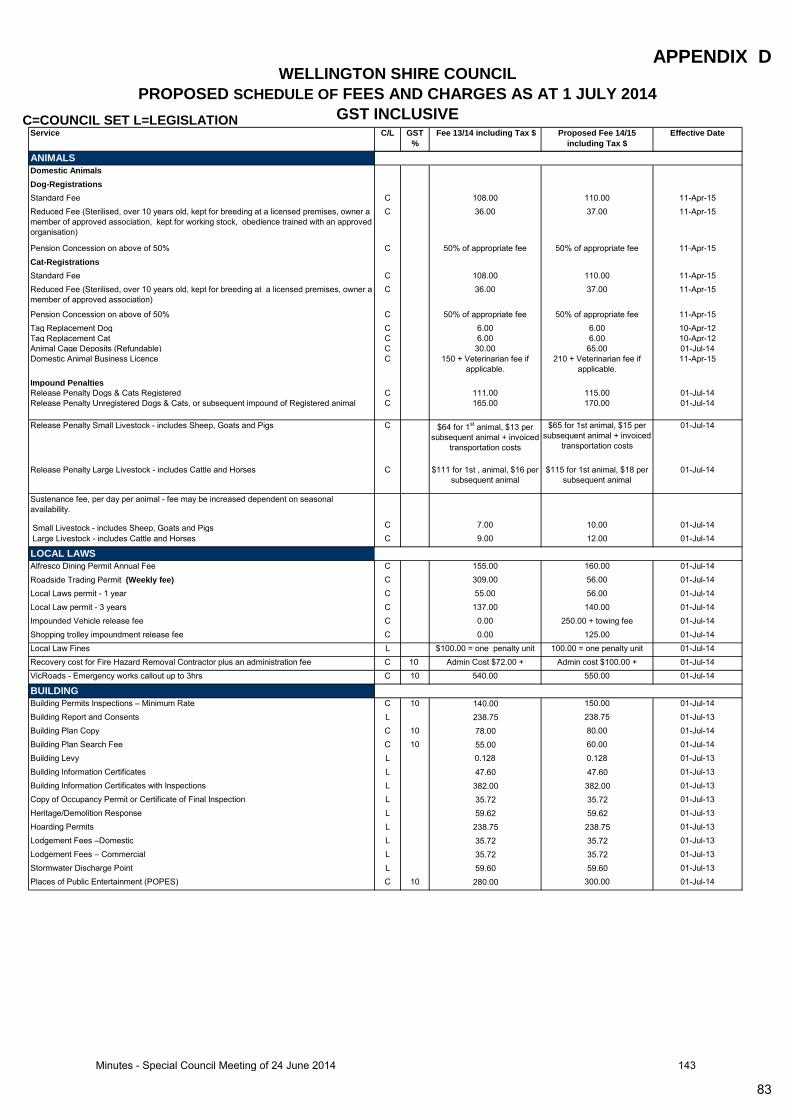
C=COUNCIL SET L=LEGISLATION
WELLINGTON SHIRE COUNCIL
PROPOSED SCHEDULE OF FEES AND CHARGES AS AT 1 JULY 2014
GST INCLUSIVE
APPENDIX D
Service C/L GST
%
Fee 13/14 including Tax $ Proposed Fee 14/15
including Tax $
Effective Date
ANIMALS
Domestic Animals
Dog-Registrations
Standard Fee C 108.00 110.00 11-Apr-15
Reduced Fee (Sterilised, over 10 years old, kept for breeding at a licensed premises, owner a
member of approved association, kept for working stock, obedience trained with an approved
organisation)
C 36.00 37.00 11-Apr-15
Pension Concession on above of 50% C 50% of appropriate fee 50% of appropriate fee 11-Apr-15
Cat-Registrations
Standard Fee C 108.00 110.00 11-Apr-15
Reduced Fee (Sterilised, over 10 years old, kept for breeding at a licensed premises, owner a
member of approved association)
C 36.00 37.00 11-Apr-15
Pension Concession on above of 50% C 50% of appropriate fee 50% of appropriate fee 11-Apr-15
Tag Replacement Dog C 6.00 6.00 10-Apr-12
Tag Replacement Cat C 6.00 6.00 10-Apr-12
Animal Cage Deposits (Refundable) C 30.00 65.00 01-Jul-14
Domestic Animal Business Licence C 150 + Veterinarian fee if
applicable.
210 + Veterinarian fee if
applicable.
11-Apr-15
Impound Penalties
Release Penalty Dogs & Cats Registered C 111.00 115.00 01-Jul-14
Release Penalty Unregistered Dogs & Cats, or subsequent impound of Registered animal C 165.00 170.00 01-Jul-14
Release Penalty Small Livestock - includes Sheep, Goats and Pigs C $64 for 1st animal, $13 per
subsequent animal + invoiced
transportation costs
$65 for 1st animal, $15 per
subsequent animal + invoiced
transportation costs
01-Jul-14
Release Penalty Large Livestock - includes Cattle and Horses C $111 for 1st , animal, $16 per
subsequent animal
$115 for 1st animal, $18 per
subsequent animal
01-Jul-14
Sustenance fee, per day per animal - fee may be increased dependent on seasonal
availability.
Small Livestock - includes Sheep, Goats and Pigs C 7.00 10.00 01-Jul-14
Large Livestock - includes Cattle and Horses C 9.00 12.00 01-Jul-14
LOCAL LAWS
Alfresco Dining Permit Annual Fee C 155.00 160.00 01-Jul-14
Roadside Trading Permit (Weekly fee) C 309.00 56.00 01-Jul-14
Local Laws permit - 1 year C 55.00 56.00 01-Jul-14
Local Law permit - 3 years C 137.00 140.00 01-Jul-14
Impounded Vehicle release fee C 0.00 250.00 + towing fee 01-Jul-14
Shopping trolley impoundment release fee C 0.00 125.00 01-Jul-14
Local Law Fines L $100.00 = one penalty unit 100.00 = one penalty unit 01-Jul-14
Recovery cost for Fire Hazard Removal Contractor plus an administration fee C 10 Admin Cost $72.00 +
contractor fees
Admin cost $100.00 +
contractor fees
01-Jul-14
VicRoads - Emergency works callout up to 3hrs C 10 540.00 550.00 01-Jul-14
BUILDING
Building Permits Inspections – Minimum Rate C 10 140.00 150.00 01-Jul-14
Building Report and Consents L 238.75 238.75 01-Jul-13
Building Plan Copy C 10 78.00 80.00 01-Jul-14
Building Plan Search Fee C 10 55.00 60.00 01-Jul-14
Building Levy L 0.128 0.128 01-Jul-13
Building Information Certificates L 47.60 47.60 01-Jul-13
Building Information Certificates with Inspections L 382.00 382.00 01-Jul-13
Copy of Occupancy Permit or Certificate of Final Inspection L 35.72 35.72 01-Jul-13
Heritage/Demolition Response L 59.62 59.62 01-Jul-13
Hoarding Permits L 238.75 238.75 01-Jul-13
Lodgement Fees –Domestic L 35.72 35.72 01-Jul-13
Lodgement Fees – Commercial L 35.72 35.72 01-Jul-13
Stormwater Discharge Point L 59.60 59.60 01-Jul-13
Places of Public Entertainment (POPES) C 10 280.00 300.00 01-Jul-14
83
Minutes - Special Council Meeting of 24 June 2014 143
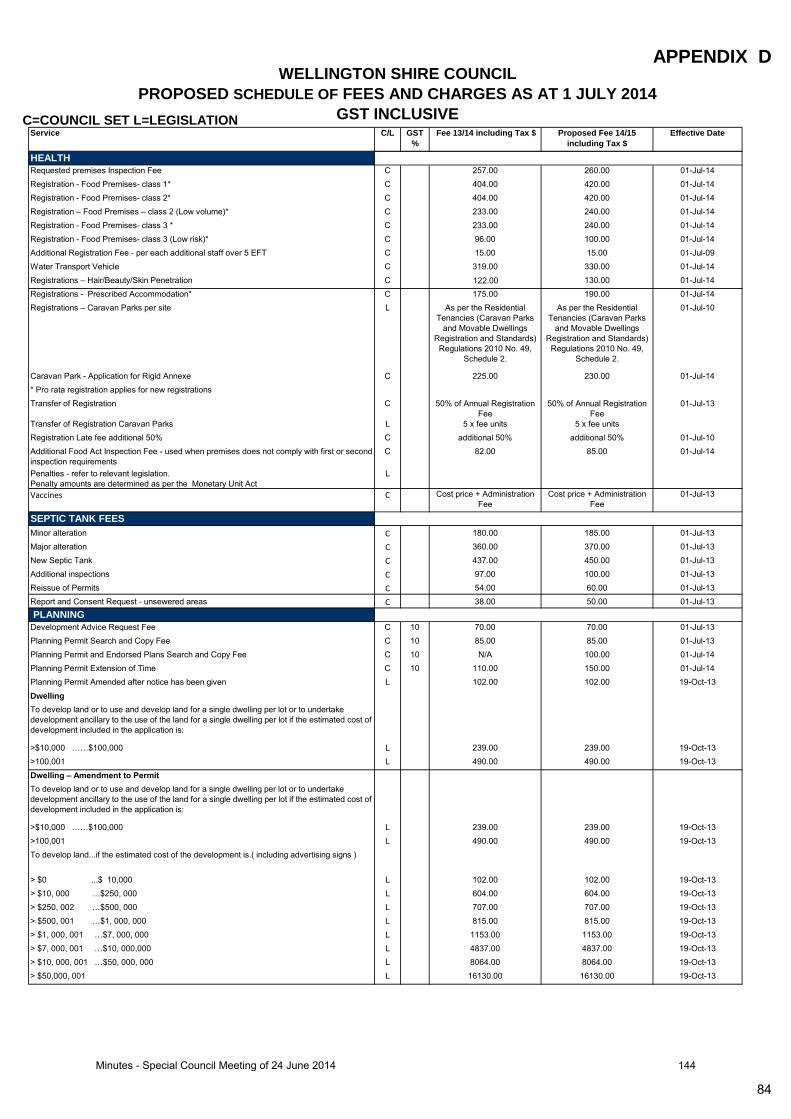
C=COUNCIL SET L=LEGISLATION
WELLINGTON SHIRE COUNCIL
PROPOSED SCHEDULE OF FEES AND CHARGES AS AT 1 JULY 2014
GST INCLUSIVE
APPENDIX D
Service C/L GST
%
Fee 13/14 including Tax $ Proposed Fee 14/15
including Tax $
Effective Date
HEALTH
Requested premises Inspection Fee C 257.00 260.00 01-Jul-14
Registration - Food Premises- class 1* C 404.00 420.00 01-Jul-14
Registration - Food Premises- class 2* C 404.00 420.00 01-Jul-14
Registration – Food Premises – class 2 (Low volume)* C 233.00 240.00 01-Jul-14
Registration - Food Premises- class 3 * C 233.00 240.00 01-Jul-14
Registration - Food Premises- class 3 (Low risk)* C 96.00 100.00 01-Jul-14
Additional Registration Fee - per each additional staff over 5 EFT C 15.00 15.00 01-Jul-09
Water Transport Vehicle C 319.00 330.00 01-Jul-14
Registrations – Hair/Beauty/Skin Penetration C 122.00 130.00 01-Jul-14
Registrations - Prescribed Accommodation* C 175.00 190.00 01-Jul-14
Registrations – Caravan Parks per site L As per the Residential
Tenancies (Caravan Parks
and Movable Dwellings
Registration and Standards)
Regulations 2010 No. 49,
Schedule 2.
As per the Residential
Tenancies (Caravan Parks
and Movable Dwellings
Registration and Standards)
Regulations 2010 No. 49,
Schedule 2.
01-Jul-10
Caravan Park - Application for Rigid Annexe C 225.00 230.00 01-Jul-14
* Pro rata registration applies for new registrations
Transfer of Registration C 50% of Annual Registration
Fee
50% of Annual Registration
Fee
01-Jul-13
Transfer of Registration Caravan Parks L 5 x fee units 5 x fee units
Registration Late fee additional 50% C additional 50% additional 50% 01-Jul-10
Additional Food Act Inspection Fee - used when premises does not comply with first or second
inspection requirements
C 82.00 85.00 01-Jul-14
Penalties - refer to relevant legislation.
Penalty amounts are determined as per the Monetary Unit Act
L
Vaccines C Cost price + Administration
Fee
Cost price + Administration
Fee
01-Jul-13
SEPTIC TANK FEES
Minor alteration C 180.00 185.00 01-Jul-13
Major alteration C 360.00 370.00 01-Jul-13
New Septic Tank C 437.00 450.00 01-Jul-13
Additional inspections C 97.00 100.00 01-Jul-13
Reissue of Permits C 54.00 60.00 01-Jul-13
Report and Consent Request - unsewered areas C 38.00 50.00 01-Jul-13
PLANNING
Development Advice Request Fee C 10 70.00 70.00 01-Jul-13
Planning Permit Search and Copy Fee C 10 85.00 85.00 01-Jul-13
Planning Permit and Endorsed Plans Search and Copy Fee C 10 N/A 100.00 01-Jul-14
Planning Permit Extension of Time C 10 110.00 150.00 01-Jul-14
Planning Permit Amended after notice has been given L 102.00 102.00 19-Oct-13
Dwelling
To develop land or to use and develop land for a single dwelling per lot or to undertake
development ancillary to the use of the land for a single dwelling per lot if the estimated cost of
development included in the application is:
>$10,000 ……$100,000 L 239.00 239.00 19-Oct-13
>100,001 L 490.00 490.00 19-Oct-13
Dwelling – Amendment to Permit
To develop land or to use and develop land for a single dwelling per lot or to undertake
development ancillary to the use of the land for a single dwelling per lot if the estimated cost of
development included in the application is:
>$10,000 ……$100,000 L 239.00 239.00 19-Oct-13
>100,001 L 490.00 490.00 19-Oct-13
To develop land...if the estimated cost of the development is.( including advertising signs )
> $0 ...$ 10,000 L 102.00 102.00 19-Oct-13
> $10, 000 …$250, 000 L 604.00 604.00 19-Oct-13
> $250, 002 …$500, 000 L 707.00 707.00 19-Oct-13
> $500, 001 …$1, 000, 000 L 815.00 815.00 19-Oct-13
> $1, 000, 001 …$7, 000, 000 L 1153.00 1153.00 19-Oct-13
> $7, 000, 001 …$10, 000,000 L 4837.00 4837.00 19-Oct-13
> $10, 000, 001 …$50, 000, 000 L 8064.00 8064.00 19-Oct-13
> $50,000, 001 L 16130.00 16130.00 19-Oct-13
84
Minutes - Special Council Meeting of 24 June 2014 144
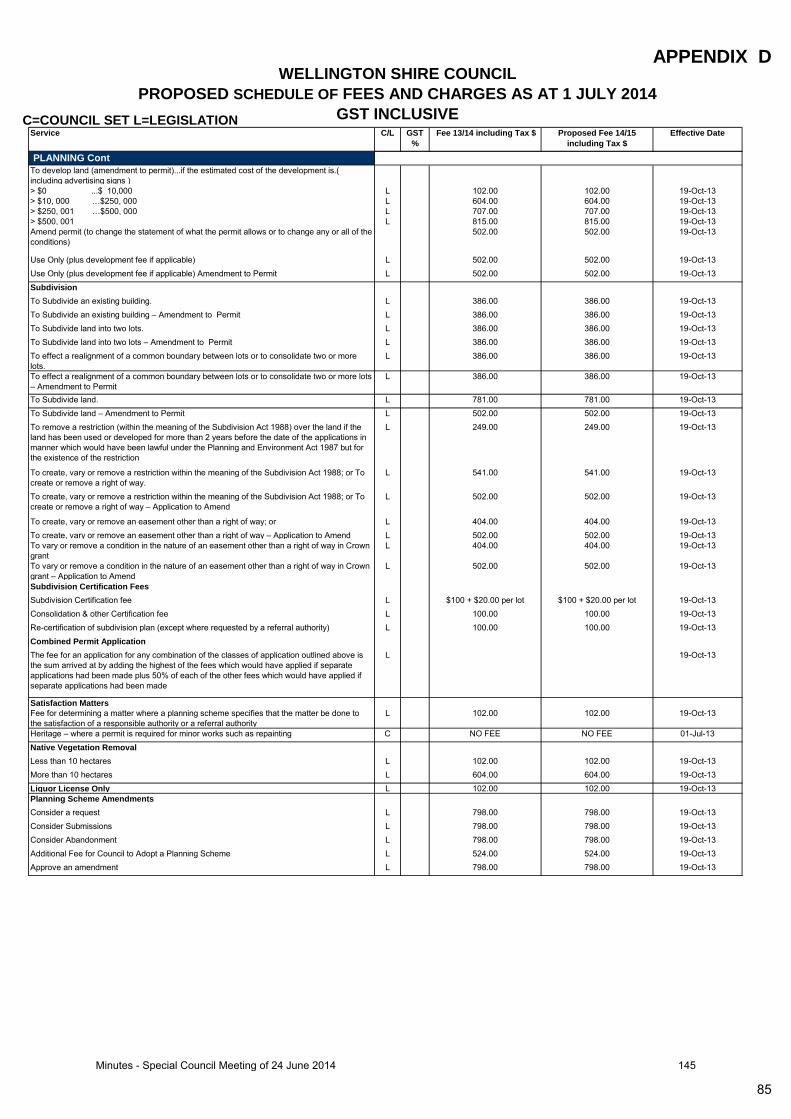
C=COUNCIL SET L=LEGISLATION
WELLINGTON SHIRE COUNCIL
PROPOSED SCHEDULE OF FEES AND CHARGES AS AT 1 JULY 2014
GST INCLUSIVE
APPENDIX D
Service C/L GST
%
Fee 13/14 including Tax $ Proposed Fee 14/15
including Tax $
Effective Date
PLANNING Cont
To develop land (amendment to permit)...if the estimated cost of the development is.(
including advertising signs )
> $0 ...$ 10,000 L 102.00 102.00 19-Oct-13
> $10, 000 …$250, 000 L 604.00 604.00 19-Oct-13
> $250, 001 …$500, 000 L 707.00 707.00 19-Oct-13
> $500, 001 L 815.00 815.00 19-Oct-13
Amend permit (to change the statement of what the permit allows or to change any or all of the
conditions)
502.00 502.00 19-Oct-13
Use Only (plus development fee if applicable) L 502.00 502.00 19-Oct-13
Use Only (plus development fee if applicable) Amendment to Permit L 502.00 502.00 19-Oct-13
Subdivision
To Subdivide an existing building. L 386.00 386.00 19-Oct-13
To Subdivide an existing building – Amendment to Permit L 386.00 386.00 19-Oct-13
To Subdivide land into two lots. L 386.00 386.00 19-Oct-13
To Subdivide land into two lots – Amendment to Permit L 386.00 386.00 19-Oct-13
To effect a realignment of a common boundary between lots or to consolidate two or more
lots.
L 386.00 386.00 19-Oct-13
To effect a realignment of a common boundary between lots or to consolidate two or more lots
– Amendment to Permit
L 386.00 386.00 19-Oct-13
To Subdivide land. L 781.00 781.00 19-Oct-13
To Subdivide land – Amendment to Permit L 502.00 502.00 19-Oct-13
To remove a restriction (within the meaning of the Subdivision Act 1988) over the land if the
land has been used or developed for more than 2 years before the date of the applications in
manner which would have been lawful under the Planning and Environment Act 1987 but for
the existence of the restriction
L 249.00 249.00 19-Oct-13
To create, vary or remove a restriction within the meaning of the Subdivision Act 1988; or To
create or remove a right of way.
L 541.00 541.00 19-Oct-13
To create, vary or remove a restriction within the meaning of the Subdivision Act 1988; or To
create or remove a right of way – Application to Amend
L 502.00 502.00 19-Oct-13
To create, vary or remove an easement other than a right of way; or L 404.00 404.00 19-Oct-13
To create, vary or remove an easement other than a right of way – Application to Amend L 502.00 502.00 19-Oct-13
To vary or remove a condition in the nature of an easement other than a right of way in Crown
grant
L 404.00 404.00 19-Oct-13
To vary or remove a condition in the nature of an easement other than a right of way in Crown
grant – Application to Amend
L 502.00 502.00 19-Oct-13
Subdivision Certification Fees
Subdivision Certification fee L $100 + $20.00 per lot $100 + $20.00 per lot 19-Oct-13
Consolidation & other Certification fee L 100.00 100.00 19-Oct-13
Re-certification of subdivision plan (except where requested by a referral authority) L 100.00 100.00 19-Oct-13
Combined Permit Application
The fee for an application for any combination of the classes of application outlined above is
the sum arrived at by adding the highest of the fees which would have applied if separate
applications had been made plus 50% of each of the other fees which would have applied if
separate applications had been made
L 19-Oct-13
Satisfaction Matters
Fee for determining a matter where a planning scheme specifies that the matter be done to
the satisfaction of a responsible authority or a referral authority
L 102.00 102.00 19-Oct-13
Heritage – where a permit is required for minor works such as repainting C NO FEE NO FEE 01-Jul-13
Native Vegetation Removal
Less than 10 hectares L 102.00 102.00 19-Oct-13
More than 10 hectares L 604.00 604.00 19-Oct-13
Liquor License Only L 102.00 102.00 19-Oct-13
Planning Scheme Amendments
Consider a request L 798.00 798.00 19-Oct-13
Consider Submissions L 798.00 798.00 19-Oct-13
Consider Abandonment L 798.00 798.00 19-Oct-13
Additional Fee for Council to Adopt a Planning Scheme L 524.00 524.00 19-Oct-13
Approve an amendment L 798.00 798.00 19-Oct-13
85
Minutes - Special Council Meeting of 24 June 2014 145

C=COUNCIL SET L=LEGISLATION
WELLINGTON SHIRE COUNCIL
PROPOSED SCHEDULE OF FEES AND CHARGES AS AT 1 JULY 2014
GST INCLUSIVE
APPENDIX D
Service C/L GST
%
Fee 13/14 including Tax $ Proposed Fee 14/15
including Tax $
Effective Date
FACILITY HIREGwen Webb Centre- Hire Charges
Gwen Webb Centre Hire- Full Day* C 10 47.00 49.00 01-Jul-14
Regular Hire (6 hours or less) C 10 28.00 29.00 01-Jul-14
Stephenson Park - Main Oval Hire Charges (Level 2)
Part or full day hire - (community groups) C 10 99.00 102.00 01-Jul-14
Part or full day hire - (schools casual hire) C 10 FREE FREE 01-Jul-13
Regular School Use - per season/per ground C 10 197.00 203.00 01-Jul-14
Commercial/Private- Full Day* C 10 332.00 342.00 01-Jul-14
Stephenson Park - Rotary Oval Hire Charges (Level 4)
Part or full day hire - (community groups) C 10 50.00 52.00 01-Jul-14
Part or full day hire - (schools casual hire) C 10 FREE FREE 01-Jul-13
Regular School Use - per season/per ground C 10 99.00 102.00 01-Jul-14
Commercial/Private- Full Day* C 10 110.00 114.00 01-Jul-14
Stephenson Park - Baseball Oval Hire Charges (Level 4) (Excludes Baseball Pitch)
Part or full day hire - (Community groups) C 10 50.00 52.00 01-Jul-14
Part or full day hire - (schools casual hire) C 10 FREE FREE 01-Jul-13
Regular School Use - per season/per ground C 10 99.00 102.00 01-Jul-14
Commercial/Private- Full Day* C 10 110.00 114.00 01-Jul-14
Stephenson Park - Baseball Pitch Hire Charges (Level 2) (Includes Baseball Oval) C 10 99.00 102.00 01-Jul-14
Stephenson Park Upstairs Function Room
Seasonal user group subsidised rate- Full Day* C 10 47.00 49.00 01-Jul-14
Non seasonal user Community Group - Full Day* C 10 197.00 203.00 01-Jul-14
Commercial/Private- Full Day* C 10 322.00 332.00 01-Jul-14
Sale Main Oval - Hire Charges (Level 2)
Part or full day hire - (Community groups) C 10 99.00 102.00 01-Jul-14
Part or full day hire - (schools casual hire) C 10 FREE FREE 01-Jul-13
Regular School Use - per season/per ground C 10 197.00 203.00 01-Jul-14
Commercial/Private- Full Day* C 10 332.00 342.00 01-Jul-14
Sale Velodrome - Hire Charges (Level 2)
Part or full day hire - (Community groups) C 10 99.00 102.00 01-Jul-14
Part or full day hire - (schools casual hire) C 10 FREE FREE 01-Jul-13
Regular School Use - per season/per ground C 10 197.00 203.00 01-Jul-14
Commercial/Private- Full Day* C 10 322.00 332.00 01-Jul-14
Sale Lions Park (Little Aths) - Hire Charges (Level 2)
Part or full day hire - (Community groups) C 10 99.00 102.00 01-Jul-14
Part or full day hire - (schools casual hire) C 10 FREE FREE 01-Jul-13
Regular School Use - per season/per ground C 10 197.00 203.00 01-Jul-14
Commercial/Private- Full Day* C 10 322.00 332.00 01-Jul-14
Stead Street Oval - Hire Charges (Level 4) (available Winter only)
Part or full day hire - (Community groups) C 10 50.00 52.00 01-Jul-14
Part or full day hire - (schools casual hire) C 10 FREE FREE 01-Jul-13
Regular School Use - per season/per ground C 10 99.00 102.00 01-Jul-14
Commercial/Private- Full Day* C 10 110.00 114.00 01-Jul-14
Wurruk Oval - Hire Charges (Level 3)
Part or full day hire - (Community groups) C 10 74.00 77.00 01-Jul-14
Part or full day hire - (schools casual hire) C 10 FREE FREE 01-Jul-13
Regular School Use - per season/per ground C 10 148.00 153.00 01-Jul-14
Commercial/Private- Full Day* C 10 220.00 227.00 01-Jul-14
Stratford Pine Lodge Hire Charges (Level 4) (Inc Oval in Winter only, Exc Tennis Courts)
Part or full day hire - (Community groups) C 10 50.00 52.00 01-Jul-14
Part or full day hire - (schools casual hire) C 10 FREE FREE 01-Jul-13
Regular School Use - per season/per ground C 10 99.00 102.00 01-Jul-14
Commercial/Private- Full Day* C 10 110.00 114.00 01-Jul-14
Pelican Room Yarram
Community Group - Full Day* C 10 47.00 Out of service 01-Jul-13
Commercial/Private- Full Day* C 10 200.00 Out of service 01-Jul-13
Yarram Swimming Club Rooms
Community Group - Full Day* C 10 47.00 Out of service 01-Jul-13
Commercial/Private- Full Day* C 10 200.00 Out of service 01-Jul-13
Light Usage Fee (rate per hour) (includes plug-in portable lighting) C 10 6.40 6.60 01-Jul-14
Notes
*Half day hire = 50% of scheduled full day fee
*Half day = 6 hours or less
Seasonal Hire includes use of toilets and rubbish disposal
Toilet cleaning charges to be added to Casual hire if applicable C 10 26.50 27.50 01-Jul-14
86
Minutes - Special Council Meeting of 24 June 2014 146
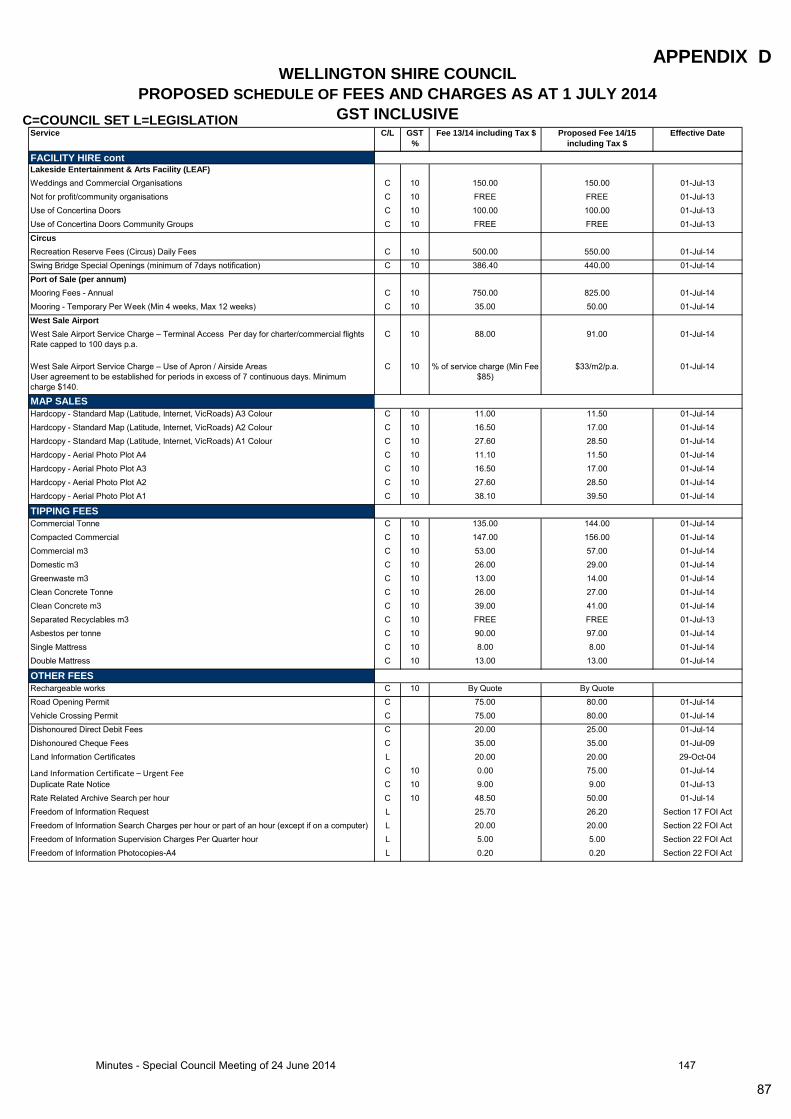
C=COUNCIL SET L=LEGISLATION
WELLINGTON SHIRE COUNCIL
PROPOSED SCHEDULE OF FEES AND CHARGES AS AT 1 JULY 2014
GST INCLUSIVE
APPENDIX D
Service C/L GST
%
Fee 13/14 including Tax $ Proposed Fee 14/15
including Tax $
Effective Date
FACILITY HIRE contLakeside Entertainment & Arts Facility (LEAF)
Weddings and Commercial Organisations C 10 150.00 150.00 01-Jul-13
Not for profit/community organisations C 10 FREE FREE 01-Jul-13
Use of Concertina Doors C 10 100.00 100.00 01-Jul-13
Use of Concertina Doors Community Groups C 10 FREE FREE 01-Jul-13
Circus
Recreation Reserve Fees (Circus) Daily Fees C 10 500.00 550.00 01-Jul-14
Swing Bridge Special Openings (minimum of 7days notification) C 10 386.40 440.00 01-Jul-14
Port of Sale (per annum)
Mooring Fees - Annual C 10 750.00 825.00 01-Jul-14
Mooring - Temporary Per Week (Min 4 weeks, Max 12 weeks) C 10 35.00 50.00 01-Jul-14
West Sale Airport
West Sale Airport Service Charge – Terminal Access Per day for charter/commercial flights
Rate capped to 100 days p.a.
C 10 88.00 91.00 01-Jul-14
West Sale Airport Service Charge – Use of Apron / Airside Areas
User agreement to be established for periods in excess of 7 continuous days. Minimum
charge $140.
C 10 % of service charge (Min Fee
$85)
$33/m2/p.a. 01-Jul-14
MAP SALES
Hardcopy - Standard Map (Latitude, Internet, VicRoads) A3 Colour C 10 11.00 11.50 01-Jul-14
Hardcopy - Standard Map (Latitude, Internet, VicRoads) A2 Colour C 10 16.50 17.00 01-Jul-14
Hardcopy - Standard Map (Latitude, Internet, VicRoads) A1 Colour C 10 27.60 28.50 01-Jul-14
Hardcopy - Aerial Photo Plot A4 C 10 11.10 11.50 01-Jul-14
Hardcopy - Aerial Photo Plot A3 C 10 16.50 17.00 01-Jul-14
Hardcopy - Aerial Photo Plot A2 C 10 27.60 28.50 01-Jul-14
Hardcopy - Aerial Photo Plot A1 C 10 38.10 39.50 01-Jul-14
TIPPING FEES
Commercial Tonne C 10 135.00 144.00 01-Jul-14
Compacted Commercial C 10 147.00 156.00 01-Jul-14
Commercial m3 C 10 53.00 57.00 01-Jul-14
Domestic m3 C 10 26.00 29.00 01-Jul-14
Greenwaste m3 C 10 13.00 14.00 01-Jul-14
Clean Concrete Tonne C 10 26.00 27.00 01-Jul-14
Clean Concrete m3 C 10 39.00 41.00 01-Jul-14
Separated Recyclables m3 C 10 FREE FREE 01-Jul-13
Asbestos per tonne C 10 90.00 97.00 01-Jul-14
Single Mattress C 10 8.00 8.00 01-Jul-14
Double Mattress C 10 13.00 13.00 01-Jul-14
OTHER FEES
Rechargeable works C 10 By Quote By Quote
Road Opening Permit C 75.00 80.00 01-Jul-14
Vehicle Crossing Permit C 75.00 80.00 01-Jul-14
Dishonoured Direct Debit Fees C 20.00 25.00 01-Jul-14
Dishonoured Cheque Fees C 35.00 35.00 01-Jul-09
Land Information Certificates L 20.00 20.00 29-Oct-04
Land Information Certificate – Urgent Fee C 10 0.00 75.00 01-Jul-14
Duplicate Rate Notice C 10 9.00 9.00 01-Jul-13
Rate Related Archive Search per hour C 10 48.50 50.00 01-Jul-14
Freedom of Information Request L 25.70 26.20 Section 17 FOI Act
Freedom of Information Search Charges per hour or part of an hour (except if on a computer) L 20.00 20.00 Section 22 FOI Act
Freedom of Information Supervision Charges Per Quarter hour L 5.00 5.00 Section 22 FOI Act
Freedom of Information Photocopies-A4 L 0.20 0.20 Section 22 FOI Act
87
Minutes - Special Council Meeting of 24 June 2014 147