Embed Size (px)
Citation preview

Special Education Cross-Subsidies FY 2017 1
Special Education Cross-Subsidies Fiscal Year 2017 Fiscal Year 2017 Report to the Legislature
As required by Minnesota Statutes, section 127.065
July 2018

Special Education Cross-Subsidies FY 2017 2
For more information, contact:
Minnesota Department of Education Tom Melcher, director, Division of School Finance 1500 Highway 36 West Roseville, MN 55113 (651) 582-8828 [email protected] education.mn.gov
Minnesota Department of Education Paul Ferrin, supervisor, Division of School Finance 1500 Highway 36 West Roseville, MN 55113 (651) 582-8864 [email protected] education.mn.gov
As requested by Minnesota Statutes, section 3.197: This report cost approximately $3825.08 to prepare, including staff time, printing and mailing expenses.
Upon request, this material will be made available in an alternative format such as large print, braille or audio recording. Printed on recycled paper.
Special Education Cross-Subsidies FY 2017 3
Contents
Special Education Cross-Subsidies Fiscal Year 2017 ...................................................................................................1
For more information, contact: ..............................................................................................................................2
Contents .................................................................................................................................................................3
Fiscal Year 2017 ......................................................................................................................................................4
Introduction ........................................................................................................................................................4
Legislative History ...............................................................................................................................................5
Table 1: State Total Special Education Cross-Subsidies, FY 2014-FY 2021 .........................................................6
Figure 1: Special Education Expenditures and Revenues ...................................................................................8
Figure 2: Special Education Cross-Subsidies .......................................................................................................9
Figure 3: Special Education Revenues ............................................................................................................. 10
Figure 4: Special Education Cross-Subsidy per ADM ....................................................................................... 11
District-by-District Cross-Subsidy Reports, FY 2017 ........................................................................................ 12
Table 2: Special Education Cross-Subsidies FY 2017 Final ............................................................................... 13
Appendix A .......................................................................................................................................................... 15
Definitions ....................................................................................................................................................... 15
Computation of Cross-Subsidies ...................................................................................................................... 16
Appendix B ........................................................................................................................................................... 17
Table 3: Special Education Cross-Subsidies – District Order ........................................................................... 17
Table 4: Special Education Cross-Subsidies – Per WADM Order (decreasing) ................................................ 29
Table 5: Special Education Cross-Subsidies – Charter Schools ........................................................................ 41
Appendix C ........................................................................................................................................................... 48
Special Education Cross-Subsidies Report, FY 2017 ........................................................................................ 48

Special Education Cross-Subsidies FY 2017 4
Fiscal Year 2017
Minnesota Statutes 2017, section 127A.065, states:
By March 30, the commissioner of education shall submit an annual report to the legislative committees having jurisdiction over kindergarten through grade 12 education on the amount each district is cross-subsidizing special education costs with general education revenue.
This report is notification to legislative committees based upon data compiled on July 17, 2018.
Introduction
Expenditures for special education programs provided by local education agencies, including school districts, charter schools, intermediate school districts and special education cooperatives, are funded with a combination of state categorical aids, federal categorical aids, third-party billing revenues and state and local general education revenues. The special education cross-subsidy measures the difference between special education expenditures and corresponding revenues.
Two cross-subsidy measures are used in this report:
• The “Gross Cross-Subsidy” is the difference between total special education expenditures and categorical special education revenues.
• The “Adjusted Net Cross-Subsidy” equals the gross cross-subsidy minus the amount of general education revenue attributable to special education students for time spent receiving special education services outside of the regular classroom for those who spend 60 percent or more of the school day outside of the regular classroom.
The gross cross-subsidy is the portion of special education expenditures not covered by categorical special education revenue. However, since special education students earn general education revenue in the same manner as other students, a portion of the general education revenue earned by these students is available to cover costs of the special education programs, without creating a shortfall in the general education program of the district. For purposes of this report, the adjusted net cross-subsidy includes the portion of general education revenue that reasonably follows the student to the special education program as revenue for special education, thereby reducing the amount of the cross-subsidy. When the term “cross-subsidy” is used in this report without further details, we are referring to the adjusted net cross-subsidy.
In calculating the adjusted net cross-subsidy, the portion of general education revenue designated as following the student to the special education program is limited to the instructional portion of the revenue earned by special education students served outside of the regular classroom for 60 percent or more of the school day, for the time these students spend receiving special education services outside of the regular classroom. This excludes the:
1. Non-instructional portion of general education revenue for all special education students.

Special Education Cross-Subsidies FY 2017 5
2. Instructional portion of general education revenue earned by special education students served primarily in the regular classroom for time spent both inside and outside of the regular classroom.
3. Instructional portion of general education revenue earned by students served primarily outside of the classroom for time spent in the regular classroom.
Detailed definitions of the terms used in this report are provided in Appendix A.
Legislative History
In 1998, (Laws 1998, Chapter 398, Article 6, Section 16), legislation was enacted requiring school district superintendents to annually report to the commissioner how much the district is cross-subsidizing the cost of special education programs with general education revenue. Since the Minnesota Department of Education (MDE) already collected all of the data needed to calculate special education cross-subsidies, from FY 1999 through FY 2006, MDE calculated the cross-subsidies on behalf of the superintendents and asked them to review the calculations before publication. However, since the cross-subsidy calculations were a technical task performed by MDE, the review by superintendents was widely viewed as an unnecessary step in the process and did not result in any significant changes to the reported cross-subsidies. To simplify the process and eliminate unnecessary paperwork, legislation was enacted in 2007, (Laws 2007, Chapter 146, Article 7, Section 1), making MDE, instead of the superintendents, directly responsible for the cross-subsidies report and making it a report to the Legislature.
Appendix A provides detailed definitions of the terms and methodology used in this report.

Special Education Cross-Subsidies FY 2017 6
Table 1: State Total Special Education Cross-Subsidies, FY 2014-FY 2021
Table 1 shows the calculation of the state total cross-subsidy for FY 2013 through FY 2021. Amounts shown for FY 2014-17 are based on actual data. Amounts shown for FY 2018-21 are estimates based on February 2018 forecast data.
State Total Special Education Cross-Subsidies, Year to Year Comparison FY 2014 - FY 2021 • Final FY 2017 Data ($ in Millions)
1. Special Education Expenditures: FY 2014 Final
FY 2015 Final
FY 2016 Final
FY 2017 Final
FY 2018 Estimate
FY 2019 Estimate
FY 2020 Estimate
FY 2021 Estimate
State excluding alternative delivery, full state payment for students with disabilities, home based travel, transition disabled, local collaborative time study and third party revenue expenditures (including fringe benefits and excluding transportation).
1,572.2 1,663.40 1,739.75 1,830.08 1,923.78 2,037.48 2,151.28 2,278.35
State transportation (excluding special transportation of non-disabled students).
185.4 201.5 213.9 234.2 253.0 273.3 294.3 318.0
Federal (including fringe benefits) 167.0 174.1 174.1 180.0 180.0 180.0 180.0 180.0
Subtotal, Special Education Expenditures 1,924.6 2,039.0 2,127.7 2,244.3 2,356.8 2,490.8 2,625.6 2,776.3
Change from Prior Year 96.1 114.4 88.7 116.6 112.5 134.0 134.8 150.7
Percent Change from Prior Year 5.3% 5.9% 4.4% 5.5% 5.0% 5.7% 5.4% 5.7%
2. Special Education Categorical Revenues: FY 2014 Final
FY 2015 Final
FY 2016 Final
FY 2017 Final
FY 2018 Estimate
FY 2019 Estimate
FY 2020 Estimate
FY 2021 Estimate
State - regular special education aid, includes transportation 915.3 966.1 970.5 1,030.9 1,092.8 1,165.7 1,240.4 1,316.7
State - excess cost aid 119.7 123.2 248.6 276.0 297.1 326.5 354.9 388.4
Adjust for Cap Growth 0.0 0.0 (33.4) (20.3) (20.8) (19.4) (21.4) (19.7)
Adjust for Hold Harmless 0.0 0.0 4.87 6.6 10.9 8.3 7.3 6.9
Adjust for Alternative Delivery (15.4) (15.7) (25.1) (25.5) (36.2) (38.1) (40.0) (42.0)
Adjust for Spec Trans for Non-disabled Students (13.8) (21.7) (28.3) (31.4) (33.9) (36.7) (39.5) (42.8)
Special Education Cross-Subsidies FY 2017 7
2. Special Education Categorical Revenues: FY 2014 Final
FY 2015 Final
FY 2016 Final
FY 2017 Final
FY 2018 Estimate
FY 2019 Estimate
FY 2020 Estimate
FY 2021 Estimate
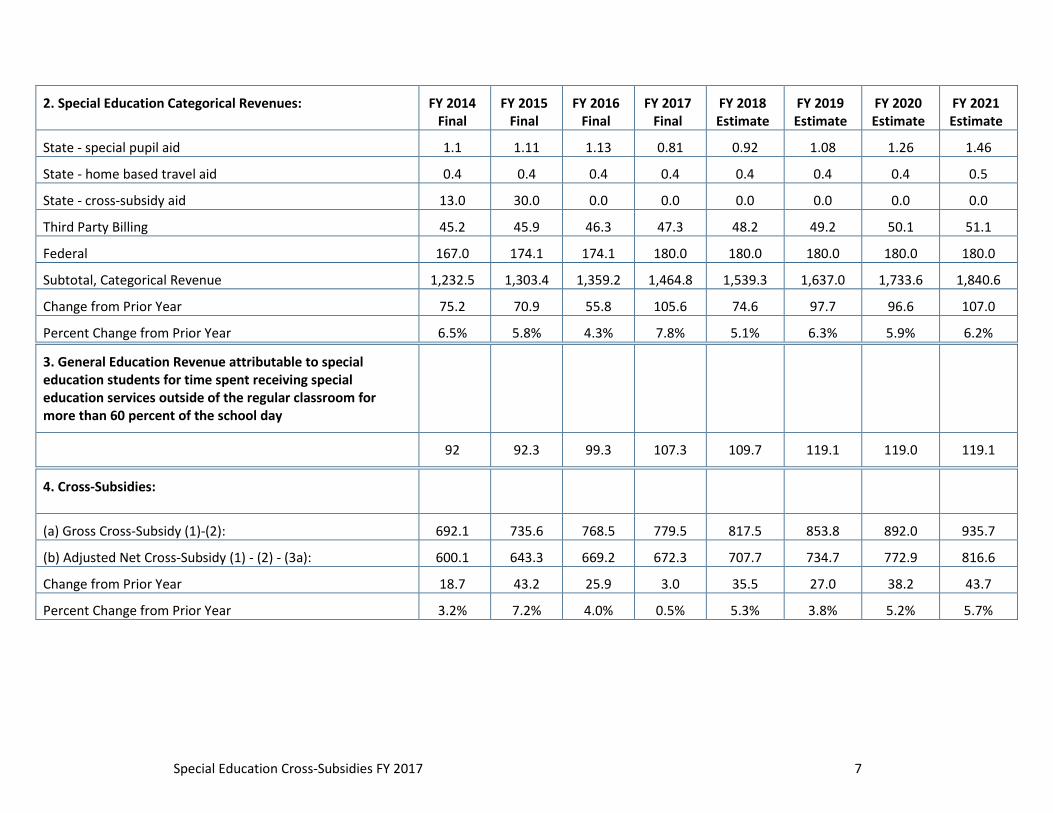
State - special pupil aid 1.1 1.11 1.13 0.81 0.92 1.08 1.26 1.46
State - home based travel aid 0.4 0.4 0.4 0.4 0.4 0.4 0.4 0.5
State - cross-subsidy aid 13.0 30.0 0.0 0.0 0.0 0.0 0.0 0.0
Third Party Billing 45.2 45.9 46.3 47.3 48.2 49.2 50.1 51.1
Federal 167.0 174.1 174.1 180.0 180.0 180.0 180.0 180.0
Subtotal, Categorical Revenue 1,232.5 1,303.4 1,359.2 1,464.8 1,539.3 1,637.0 1,733.6 1,840.6
Change from Prior Year 75.2 70.9 55.8 105.6 74.6 97.7 96.6 107.0
Percent Change from Prior Year 6.5% 5.8% 4.3% 7.8% 5.1% 6.3% 5.9% 6.2%
3. General Education Revenue attributable to special education students for time spent receiving special education services outside of the regular classroom for more than 60 percent of the school day
FY 2014 Final
FY 2015 Final
FY 2016 Final
FY 2017 Final
FY 2018 Estimate
FY 2019 Estimate
FY 2020 Estimate
FY 2021 Estimate
total 92 92.3 99.3 107.3 109.7 119.1 119.0 119.1
4. Cross-Subsidies: FY 2014 Final
FY 2015 Final
FY 2016 Final
FY 2017 Final
FY 2018 Estimate
FY 2019 Estimate
FY 2020 Estimate
FY 2021 Estimate
(a) Gross Cross-Subsidy (1)-(2): 692.1 735.6 768.5 779.5 817.5 853.8 892.0 935.7
(b) Adjusted Net Cross-Subsidy (1) - (2) - (3a): 600.1 643.3 669.2 672.3 707.7 734.7 772.9 816.6
Change from Prior Year 18.7 43.2 25.9 3.0 35.5 27.0 38.2 43.7
Percent Change from Prior Year 3.2% 7.2% 4.0% 0.5% 5.3% 3.8% 5.2% 5.7%

Special Education Cross-Subsidies FY 2017 8
Figure 1: Special Education Expenditures and Revenues
Figure 1 shows the trends from FY 2003 – FY 2017 and projections through FY 2021 for special education revenues and expenditures. Special Education expenditures increased steadily over this period, from $1.210 billion in FY 2003 to $2.244 billion in FY 2017, and are projected to continue to increase up to $2.776 billion by FY 2021. Special education revenues increased at a slower rate than expenditures between FY 2003 and FY 2007, increasing the gap between expenditures and revenues.
As a result of legislation enacted in 2007, revenues increased sharply in FY 2008, with slower revenue growth in FY 2009. Due to federal stimulus funds, revenues continued to increase in FY 2010 and carryover in FY 2011 but fell back to a slower rate of growth in FY 2012 and FY 2013 compared to FY 2009. Overall, expenditures are projected to increase 129 percent over the 18-year period, while revenues are projected to increase by 135 percent.

Special Education Cross-Subsidies FY 2017 9
Figure 2: Special Education Cross-Subsidies
Figure 2 shows the gap between special education expenditures and revenues, generally referred to as the special education cross-subsidy. Amounts are shown in current dollars (not adjusted for inflation), and in FY 2021 dollars (adjusted for inflation using Consumer Price Index).
The adjusted net cross-subsidy grew at an accelerating rate between FY 2003 and FY 2007, reaching $572 million in FY 2007. As a result of the 2007 legislation, the cross-subsidy decreased to $484 million in FY 2008 but began to grow again in FY 2009 to $529 million. Due to federal stimulus funds in FY 2010 and carryover in FY 2011, the cross-subsidy dropped below the FY 2008 level in FY 2010 to $451 million and rose slightly in FY 2011 to $455 million. Expiration of federal stimulus funding created a large increase in the cross subsidy in FY 2012. The implementation of the new special education funding formula in FY 2016 has slowed but not eliminated the growth of the cross subsidy. It is projected to reach $817 million in FY 2021.

Special Education Cross-Subsidies FY 2017 10
Figure 3: Special Education Revenues
Figure 3 provides another perspective on the cross-subsidy by showing the percentage of special education expenditures covered by state and federal funding formulas from FY 2003 through FY 2021. Between FY 2003 and FY 2007, the state/federal funded portion of special education expenditures declined gradually from 69.0 percent to 61.8 percent. The increase enacted in 2007 raised the state/federal funded portion of special education expenditures to 69.1 percent in FY 2008. Due to federal stimulus funds in FY 2010 and carry over in FY 2011, it rose to 73.3 percent in FY 2010 and to 73.9 percent in FY 2011. With the expiration of federal stimulus funding after FY 2011, the state/federal funded portion of special education expenditures declined sharply to 66.7 percent in FY 2012. Funding increases exceeded expenditure growth in FY 2013 and FY 2014, increasing the state/federal funded portion to 68.8 percent in FY 2014. For FY 2015 and later, the state/federal funded portion of special education expenditures is expected to increase slightly to 70.6 percent by FY 2021, due to increases enacted in state special education funding in 2013. Since FY 2012, the portion of special education expenditures funded with state aid has gradually increased, while the portion funded with federal aid has gradually decreased.
Special Education Cross-Subsidies FY 2017 11
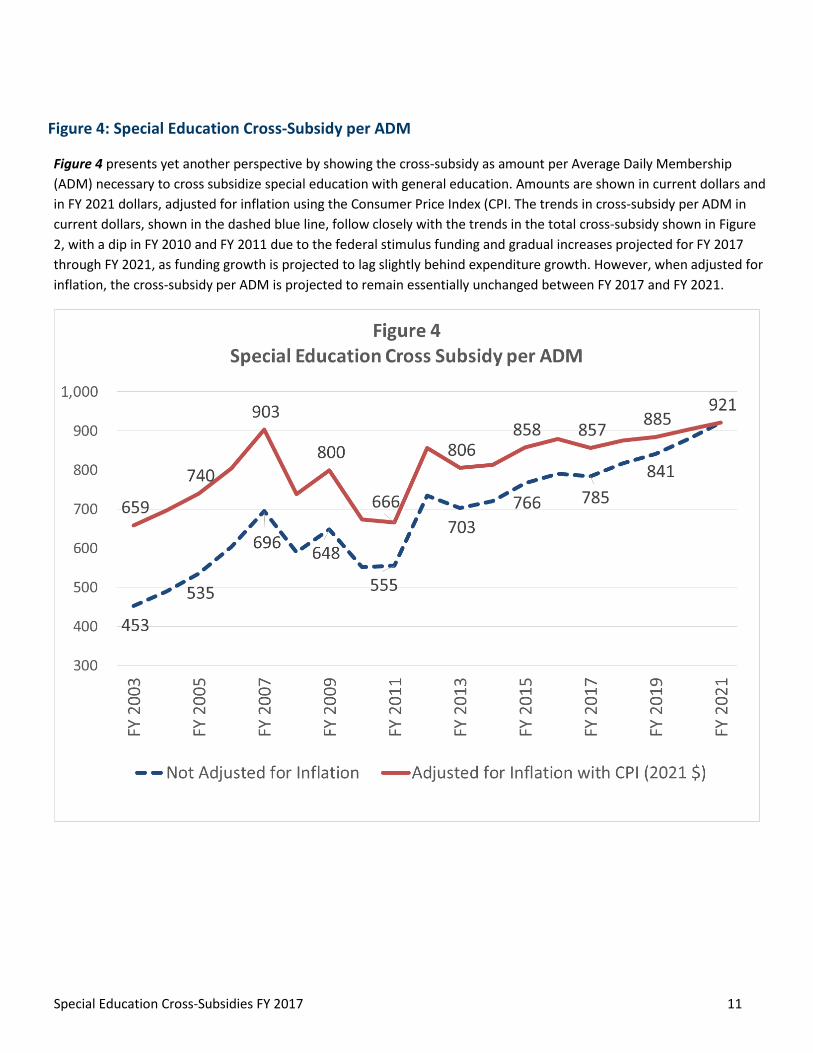
Figure 4: Special Education Cross-Subsidy per ADM
Figure 4 presents yet another perspective by showing the cross-subsidy as amount per Average Daily Membership (ADM) necessary to cross subsidize special education with general education. Amounts are shown in current dollars and in FY 2021 dollars, adjusted for inflation using the Consumer Price Index (CPI. The trends in cross-subsidy per ADM in current dollars, shown in the dashed blue line, follow closely with the trends in the total cross-subsidy shown in Figure 2, with a dip in FY 2010 and FY 2011 due to the federal stimulus funding and gradual increases projected for FY 2017 through FY 2021, as funding growth is projected to lag slightly behind expenditure growth. However, when adjusted for inflation, the cross-subsidy per ADM is projected to remain essentially unchanged between FY 2017 and FY 2021.

Special Education Cross-Subsidies FY 2017 12
District-by-District Cross-Subsidy Reports, FY 2017
Appendix B includes reports showing a summary of district-by-district cross-subsidy calculations for FY 2017, sorted in school district number order and by the adjusted net cross-subsidy per adjusted weighted pupil unit.
Because some of the data used in the statewide cross-subsidy reports is not available at the school district level (e.g., federal special education revenues and expenditures), the district-by-district reports were completed using a simpler methodology that provides a close approximation of the cross-subsidies, but is not as comprehensive as the statewide calculations. More specifically, the district-by-district tables:
1. Are limited to state-funded special education expenditures and revenues, excluding federally funded expenditures and revenues.
2. Reflect net adjustments for these transactions in the state special education aid paid to the resident and serving districts, with the advent of the system of state aid adjustments for students served outside the resident district in FY 2007.
Table 2 provides a comparison of average cross-subsidies for FY 2017 by school district strata, based on the district-by-district and charter school reports included in Appendix B (Tables 4, 5 and 6): State totals are lower than the amounts shown in Table 1 due to the differences in methodology outlined above. The average adjusted net cross-subsidies per pupil unit are between $640 and $905 per pupil unit for all groups of districts except for the smallest non-metro districts, which have an average cross-subsidy of $603 per pupil unit, and the Minneapolis and St. Paul districts, which have an average cross-subsidy of $1,220 per pupil unit. In contrast, the average cross-subsidy of charter schools was $95 per pupil unit. Charter schools were added to this report due to recent legislation changes that required serving LEAs to cover 10 percent of the unreimbursed special education costs (Minn. Stat. § 127A.47, subd. 7 (c)).
Note: The total adjusted net cross-subsidy reported in Table 2 is $707,888,718 which is greater than the actual total cross-subsidy reported in Table 1 (page 6). This is due to placed students. Tuition Billing moves the general education revenue from the resident district to the serving district when students are placed for special education services. The loss of general education revenue to the resident district is not counted when calculating the state total cross-subsidy in Table 1 because it covers general education costs for placed special education students and not special education costs. However, it was included in the calculation of the cross-subsidy for Tables 2-6 because the reduction is part of the special education funding formula and affects the amount of special education aid paid to the resident district. Since the general education revenue is moved as part of the tuition adjustment which is tied to each LEA’s net aid it was determined to leave the amount in the individual cross-subsidy report and note the difference between the totals in Tables 1 and 2.

Special Education Cross-Subsidies FY 2017 13
Table 2: Special Education Cross-Subsidies FY 2017 Final
District (A) Adjusted
PU
(B) Special Education
Expenditure
(C) Categorical
Revenue
(D) Gross Cross-Subsidy (B-C)
(E) Adjusted General
Education Revenue for Special Education
(F) Adjusted Net Cross-
Subsidy (D-E)
(G) Per
WADM
Totals 934,686 1,917,310,562 1,102,151,023 815,159,540 107,270,822 707,888,718 757.35
By Stratum (A) Adjusted
PU
(B) Sped EducExpenditure
(C ) Categorical Revenue
(D) Gross CrossSubsidy (B-C)
(E ) Adj. Gen Rev for SpEd (F) Adj Net CrossSubsidy (D-E)
(G) PerWADM
Minneapolis and St. Paul 77,932 227,019,005 113,792,019 113,226,986 18,173,463 95,053,523 1,219.69
Other Metro, Inner 97,379 202,159,768 99,810,904 102,348,864 14,264,495 88,084,369 904.56
Other Metro, Outer 296,239 604,159,083 334,208,389 269,950,694 33,663,475 236,287,219 797.62
NonMet > = 2K 206,641 431,531,807 248,263,374 183,268,434 24,004,207 159,264,226 770.73
NonMet 1K-2K 104,128 178,379,607 103,648,407 74,731,200 8,132,774 66,598,426 639.58
NonMet < 1K 94,785 151,827,912 87,781,469 64,046,443 6,908,724 57,137,718 602.82
District Totals 877,104 1,795,077,182 987,504,562 807,572,620 105,147,138 702,425,481 800.85
Charter Schools 57,583 122,233,381 114,646,461 7,586,920 2,123,683 5,463,237 94.88
Special Education Cross-Subsidies FY 2017 14
Table three in Appendix B displays the amount that each district cross-subsidizes special education costs with general revenue sorted by district number order. Column D displays the calculation of each district’s gross cross-subsidy. Column F displays the calculation of each districts adjusted net cross-subsidy. Column G displays the amount of each districts adjusted net cross-subsidy per adjusted weighted pupil unit.
Table four in Appendix B displays the amount that each district cross-subsidizes special education costs with general education revenue sorted by the adjusted net cross-subsidy per Adjusted Weighted Pupil Unit (WADM).
Table five in Appendix B displays the amount that each charter school cross-subsidizes special education costs with general revenue sorted by charter school number order. Column D displays the calculation of each charter’s gross cross-subsidy. Column F displays the calculation of each charter’s adjusted net cross-subsidy. Column G displays the amount of each charter’s adjusted net cross-subsidy per adjusted weighted pupil unit.
Detailed individual district cross-subsidies reports may be found on the MDE website by selecting Data Center > Data Reports and Analytics > School Finance Reports: Minnesota Funding Reports (MFR). We are unable to provide a detailed individual charter school cross-subsidy report due to the current program calculation was not designed to include them in creating the reports. A line-by-line description of the data sources used in this detailed cross-subsidies report is provided in Appendix C.

Special Education Cross-Subsidies FY 2017 15
Appendix A Definitions
Special Education Expenditures
Special education expenditures were defined to include all special education expenditures reported for state funding purposes, plus fringe benefits for special education staff funded with state aids (fringe benefits are not included in the state funding base).
Special Note: Two cost categories have been funded through the special education funding formulas that do not provide services to special education students as stipulated in their Individualized Educational Programs (IEPs). The first is Alternative Delivery of Specialized Instructional Services (ADSIS) and is designed to provide prevention services as an alternative to special education and other compensatory programs. This program began in 1991 and until recently, represented an insignificant amount of special education expenditures and aids. The second is transportation services provided to students who are homeless, need transportation to care and treatment programs and students who do not have IEPs but qualify for special transportation under Section 504 of the Federal Rehabilitation Act of 1973. These transportation expenditures are reported under the Uniform Financial and Reporting System (UFARS) Finance code 728. Expenditures and aids attributable to these two cost categories were included in previous cross-subsidy reports but are excluded from this report to provide a more precise calculation of special education cross-subsidies. Further, it was determined that although expenditures for serving children receiving early childhood special education services had been included in the cross-subsidy analysis, the general education revenue attributable to these children was not accounted for in previous cross-subsidy reports. To provide comparable cross-subsidy calculations for FY 2003 – 2021, adjustments were made to exclude ADSIS and Finance 728 transportation revenues and expenditures and to include general education revenue attributable to early childhood special education for prior years going back to FY 2003. Recomputed cross-subsidies for these earlier years are shown in Table 6.
Expenditures for special education transportation were taken from UFARS; all other special education expenditures were taken from year-end special education SEDRA reports and transition disabled SEDRA reports. State total computations presented in Table 1 include total federal expenditures on a statewide basis only.
Special Education Categorical Revenues
Special education categorical revenues were defined to include state special education aid (including excess cost, special pupil and home-based travel), and third party billing revenue. State total computations presented in Table 1 include total federal aid on a statewide basis only. Federal aids were excluded in the district-by-district analysis presented in Tables 3, 4 and 5 because of uncertainty in the allocation of federal aids among districts participating in cooperatives and the fact that some federal fiscal hosts spend and receive federal funds directly without allocating to districts and charter schools
General Education Revenue Attributable to Special Education Students
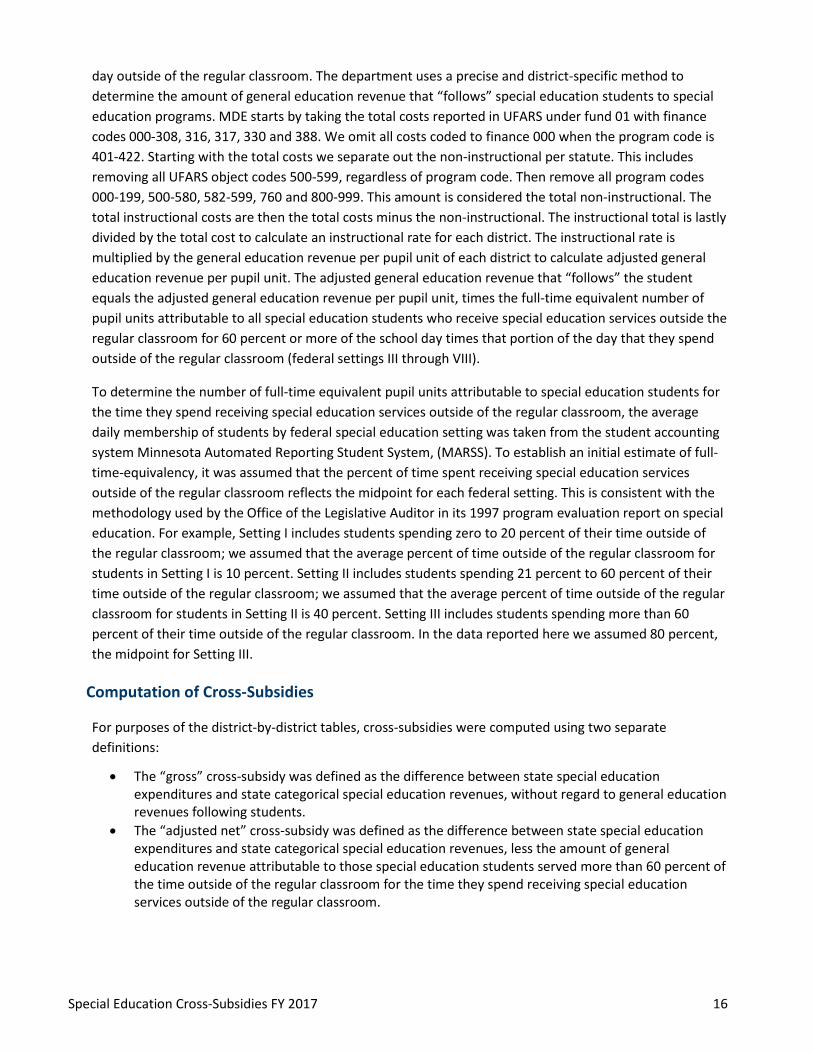
General education revenue attributable to special education students for time spent receiving special education services outside of the regular classroom for those who spend 60 percent or more of the school
Special Education Cross-Subsidies FY 2017 16
day outside of the regular classroom. The department uses a precise and district-specific method to determine the amount of general education revenue that “follows” special education students to special education programs. MDE starts by taking the total costs reported in UFARS under fund 01 with finance codes 000-308, 316, 317, 330 and 388. We omit all costs coded to finance 000 when the program code is 401-422. Starting with the total costs we separate out the non-instructional per statute. This includes removing all UFARS object codes 500-599, regardless of program code. Then remove all program codes 000-199, 500-580, 582-599, 760 and 800-999. This amount is considered the total non-instructional. The total instructional costs are then the total costs minus the non-instructional. The instructional total is lastly divided by the total cost to calculate an instructional rate for each district. The instructional rate is multiplied by the general education revenue per pupil unit of each district to calculate adjusted general education revenue per pupil unit. The adjusted general education revenue that “follows” the student equals the adjusted general education revenue per pupil unit, times the full-time equivalent number of pupil units attributable to all special education students who receive special education services outside the regular classroom for 60 percent or more of the school day times that portion of the day that they spend outside of the regular classroom (federal settings III through VIII).
To determine the number of full-time equivalent pupil units attributable to special education students for the time they spend receiving special education services outside of the regular classroom, the average daily membership of students by federal special education setting was taken from the student accounting system Minnesota Automated Reporting Student System, (MARSS). To establish an initial estimate of full-time-equivalency, it was assumed that the percent of time spent receiving special education services outside of the regular classroom reflects the midpoint for each federal setting. This is consistent with the methodology used by the Office of the Legislative Auditor in its 1997 program evaluation report on special education. For example, Setting I includes students spending zero to 20 percent of their time outside of the regular classroom; we assumed that the average percent of time outside of the regular classroom for students in Setting I is 10 percent. Setting II includes students spending 21 percent to 60 percent of their time outside of the regular classroom; we assumed that the average percent of time outside of the regular classroom for students in Setting II is 40 percent. Setting III includes students spending more than 60 percent of their time outside of the regular classroom. In the data reported here we assumed 80 percent, the midpoint for Setting III.
Computation of Cross-Subsidies
For purposes of the district-by-district tables, cross-subsidies were computed using two separate definitions:
• The “gross” cross-subsidy was defined as the difference between state special educationexpenditures and state categorical special education revenues, without regard to general educationrevenues following students.
• The “adjusted net” cross-subsidy was defined as the difference between state special educationexpenditures and state categorical special education revenues, less the amount of generaleducation revenue attributable to those special education students served more than 60 percent ofthe time outside of the regular classroom for the time they spend receiving special educationservices outside of the regular classroom.

Special Education Cross-Subsidies FY 2017 17
Appendix B
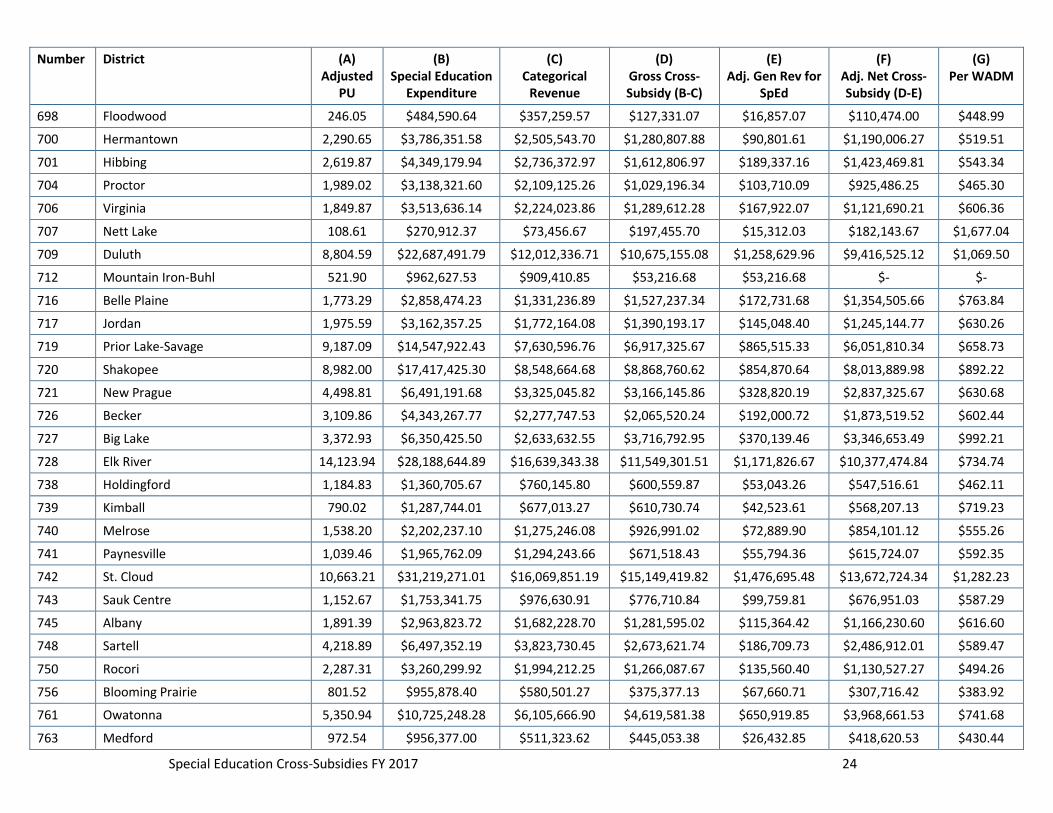
Table 3: Special Education Cross-Subsidies – District Order
Number District (A) Adjusted
PU
(B) Special Education
Expenditure
(C) Categorical
Revenue
(D) Gross Cross-Subsidy (B-C)
(E) Adj. Gen Rev for
SpEd
(F) Adj. Net Cross-Subsidy (D-E)
(G) Per WADM
1 Aitkin 1,281.06 $2,217,644.42 $1,154,273.29 $1,063,371.13 $65,132.32 $998,238.81 $779.23
1 Minneapolis 38,283.11 $121,041,505.07 $54,665,693.86 $66,375,811.21 $11,048,799.32 $55,327,011.89 $1,445.21
2 Hill City 294.95 $621,684.00 $377,225.21 $244,458.79 $26,724.92 $217,733.87 $738.21
4 McGregor 500.38 $821,919.51 $415,122.15 $406,797.36 $34,655.95 $372,141.41 $743.72
6 South St. Paul 3,835.94 $6,958,505.63 $3,604,618.03 $3,353,887.60 $488,641.74 $2,865,245.86 $746.95
11 Anoka-Hennepin 41,870.37 $95,182,316.35 $55,864,412.45 $39,317,903.90 $5,848,219.42 $33,469,684.48 $799.36
12 Centennial 7,121.52 $17,989,014.10 $12,483,210.19 $5,505,803.91 $685,330.21 $4,820,473.70 $676.89
13 Columbia Heights 3,659.33 $7,643,984.96 $2,529,453.92 $5,114,531.04 $954,954.89 $4,159,576.15 $1,136.70
14 Fridley 3,389.89 $7,887,273.36 $5,288,254.40 $2,599,018.96 $528,977.00 $2,070,041.96 $610.65
15 St. Francis 4,947.52 $11,263,356.44 $7,282,990.74 $3,980,365.70 $443,054.50 $3,537,311.20 $714.97
16 Spring Lake Park 6,242.27 $8,203,222.16 $3,526,857.80 $4,676,364.36 $694,324.71 $3,982,039.65 $637.92
22 Detroit Lakes 3,283.42 $6,609,731.17 $4,570,119.84 $2,039,611.33 $417,591.07 $1,622,020.26 $494.00
23 Frazee-Vergas 966.84 $1,870,335.20 $1,108,337.20 $761,998.00 $54,173.11 $707,824.89 $732.10
25 Pine Point 60.34 $173,788.03 $109,061.12 $64,726.91 $- $64,726.91 $1,072.70
31 Bemidji 5,512.28 $13,803,799.57 $8,693,781.78 $5,110,017.79 $940,806.51 $4,169,211.28 $756.35
32 Blackduck 664.62 $1,645,966.63 $1,072,117.20 $573,849.43 $25,096.04 $548,753.39 $825.66
36 Kelliher 276.58 $650,904.30 $396,111.34 $254,792.96 $10,295.49 $244,497.47 $884.00
38 Red Lake 1,586.11 $3,764,496.31 $1,694,866.88 $2,069,629.43 $336,917.08 $1,732,712.35 $1,092.43
47 Sauk Rapids 4,783.32 $8,645,986.80 $5,627,170.16 $3,018,816.64 $439,880.40 $2,578,936.24 $539.15
51 Foley 2,103.25 $3,424,150.65 $2,287,290.06 $1,136,860.59 $95,516.02 $1,041,344.57 $495.11
75 St. Clair 723.97 $668,596.57 $576,215.51 $92,381.06 $20,145.66 $72,235.40 $99.78
77 Mankato 9,226.16 $18,050,589.10 $11,062,400.67 $6,988,188.43 $1,218,318.97 $5,769,869.46 $625.38
81 Comfrey 168.02 $329,990.83 $211,990.01 $118,000.82 $6,601.22 $111,399.60 $663.01
84 Sleepy Eye 623.49 $914,672.92 $471,060.29 $443,612.63 $61,431.54 $382,181.09 $612.97

Special Education Cross-Subsidies FY 2017 18
Number District (A) Adjusted
PU
(B) Special Education
Expenditure
(C) Categorical
Revenue
(D) Gross Cross-Subsidy (B-C)
(E) Adj. Gen Rev for
SpEd
(F) Adj. Net Cross-Subsidy (D-E)
(G) Per WADM
85 Springfield 627.00 $729,424.88 $332,351.55 $397,073.33 $31,796.83 $365,276.50 $582.58
88 New Ulm 2,341.91 $5,219,471.25 $2,632,456.52 $2,587,014.73 $261,756.13 $2,325,258.60 $992.89
91 Barnum 832.90 $1,393,876.63 $931,483.16 $462,393.47 $36,517.64 $425,875.83 $511.32
93 Carlton 510.20 $864,394.17 $468,152.19 $396,241.98 $32,630.89 $363,611.09 $712.68
94 Cloquet 2,930.45 $5,517,243.15 $3,336,756.27 $2,180,486.88 $347,811.76 $1,832,675.12 $625.39
95 Cromwell 371.22 $431,814.52 $285,706.07 $146,108.45 $14,025.83 $132,082.62 $355.81
97 Moose Lake 705.37 $1,213,180.67 $806,315.01 $406,865.66 $26,962.85 $379,902.81 $538.59
99 Esko 1,312.46 $1,254,555.15 $800,608.17 $453,946.98 $44,485.21 $409,461.77 $311.98
100 Wrenshall 372.49 $512,125.22 $306,241.06 $205,884.16 $4,813.65 $201,070.51 $539.80
108 Central 1,106.48 $1,638,170.11 $515,381.16 $1,122,788.95 $77,653.00 $1,045,135.95 $944.56
110 Waconia 4,258.35 $7,883,895.52 $4,074,573.28 $3,809,322.24 $262,437.51 $3,546,884.73 $832.92
111 Watertown-Mayer 1,741.83 $3,083,790.42 $1,643,483.79 $1,440,306.63 $155,554.40 $1,284,752.23 $737.59
112 Eastern Carver County 10,427.73 $18,056,157.54 $9,771,997.08 $8,284,160.46 $804,902.51 $7,479,257.95 $717.25
113 Walker-Akeley 802.49 $1,739,041.78 $1,061,074.63 $677,967.15 $54,935.19 $623,031.96 $776.37
115 Cass Lake 1,262.49 $3,620,579.74 $2,117,572.58 $1,503,007.16 $277,584.49 $1,225,422.67 $970.64
116 Pillager 1,137.80 $1,977,233.62 $1,262,431.68 $714,801.94 $97,006.97 $617,794.97 $542.97
118 Northland Community 347.93 $1,133,796.72 $636,314.75 $497,481.97 $84,457.95 $413,024.02 $1,187.09
129 Montevideo 1,658.79 $2,946,301.11 $1,789,147.17 $1,157,153.94 $124,872.74 $1,032,281.20 $622.31
138 North Branch 3,263.62 $6,361,463.77 $3,559,035.84 $2,802,427.93 $266,033.87 $2,536,394.06 $777.17
139 Rush City 944.04 $1,432,108.47 $568,190.15 $863,918.32 $50,211.29 $813,707.03 $861.94
146 Barnesville 918.59 $1,091,859.47 $556,293.78 $535,565.69 $48,475.11 $487,090.58 $530.26
150 Hawley 1,085.54 $1,144,541.97 $603,423.20 $541,118.77 $62,921.36 $478,197.41 $440.52
152 Moorhead 7,104.85 $16,337,169.20 $10,256,448.72 $6,080,720.48 $948,224.48 $5,132,496.00 $722.39
162 Bagley 1,123.77 $1,912,016.81 $1,219,562.05 $692,454.76 $131,474.30 $560,980.46 $499.20
166 Cook County 513.64 $1,023,246.44 $395,354.51 $627,891.93 $68,922.86 $558,969.07 $1,088.25
173 Mountain Lake 537.43 $725,954.54 $400,160.18 $325,794.36 $44,660.64 $281,133.72 $523.11
177 Windom 1,159.25 $2,307,216.20 $1,481,569.39 $825,646.81 $89,141.98 $736,504.83 $635.33
181 Brainerd 7,118.85 $19,863,077.94 $12,888,597.82 $6,974,480.12 $1,146,622.69 $5,827,857.43 $818.65

Special Education Cross-Subsidies FY 2017 19
Number District (A) Adjusted
PU
(B) Special Education
Expenditure
(C) Categorical
Revenue
(D) Gross Cross-Subsidy (B-C)
(E) Adj. Gen Rev for
SpEd
(F) Adj. Net Cross-Subsidy (D-E)
(G) Per WADM
182 Crosby-Ironton 1,153.96 $2,964,400.79 $1,630,630.45 $1,333,770.34 $121,313.33 $1,212,457.01 $1,050.69
186 Pequot Lakes 1,828.43 $2,354,360.21 $1,369,527.32 $984,832.89 $119,466.99 $865,365.90 $473.28
191 Burnsville 9,931.97 $24,504,893.50 $13,294,472.91 $11,210,420.59 $1,344,843.12 $9,865,577.47 $993.32
192 Farmington 7,798.29 $11,984,748.59 $5,283,594.64 $6,701,153.95 $579,959.55 $6,121,194.40 $784.94
194 Lakeville 12,027.15 $25,410,719.82 $12,798,737.21 $12,611,982.61 $1,357,606.89 $11,254,375.72 $935.75
195 Randolph 709.80 $784,396.39 $405,203.16 $379,193.23 $24,894.20 $354,299.03 $499.15
196 Rosemount-Apple Valley-Eagan 30,493.93 $71,069,327.14 $42,675,181.14 $28,394,146.00 $3,853,870.83 $24,540,275.17 $804.76
197 West St. Paul-Mendota Heights 5,430.14 $12,105,974.62 $7,139,999.70 $4,965,974.92 $911,514.52 $4,054,460.40 $746.66
199 Inver Grove Heights 3,965.72 $7,583,511.56 $3,564,154.58 $4,019,356.98 $442,081.57 $3,577,275.41 $902.05
200 Hastings 4,869.41 $9,947,177.63 $4,991,028.41 $4,956,149.22 $537,077.63 $4,419,071.59 $907.52
203 Hayfield 763.09 $1,284,119.60 $646,442.84 $637,676.76 $104,066.57 $533,610.19 $699.28
204 Kasson-Mantorville 2,310.75 $2,207,083.74 $1,000,552.53 $1,206,531.21 $154,874.40 $1,051,656.81 $455.11
206 Alexandria 4,474.67 $10,011,498.51 $5,939,974.17 $4,071,524.34 $618,644.84 $3,452,879.50 $771.65
213 Osakis 896.25 $1,323,828.79 $941,498.10 $382,330.69 $46,175.39 $336,155.30 $375.07
227 Chatfield 983.04 $859,970.36 $463,819.71 $396,150.65 $22,759.15 $373,391.50 $379.83
229 Lanesboro 383.04 $465,577.34 $384,047.20 $81,530.14 $11,888.66 $69,641.48 $181.81
238 Mabel-Canton 273.65 $303,139.31 $166,347.86 $136,791.45 $12,930.68 $123,860.77 $452.62
239 Rushford-Peterson 723.35 $773,815.20 $408,884.72 $364,930.48 $29,328.90 $335,601.58 $463.95
241 Albert Lea 3,728.36 $10,689,479.02 $6,801,980.99 $3,887,498.03 $588,777.45 $3,298,720.58 $884.76
242 Alden 530.77 $813,589.63 $528,530.16 $285,059.47 $63,215.76 $221,843.71 $417.97
252 Cannon Falls 1,248.39 $1,841,561.44 $934,148.38 $907,413.06 $78,783.82 $828,629.24 $663.76
253 Goodhue 726.36 $605,626.33 $234,476.83 $371,149.50 $22,457.57 $348,691.93 $480.05
255 Pine Island 1,390.91 $1,518,661.60 $776,127.83 $742,533.77 $77,801.19 $664,732.58 $477.91
256 Red Wing 2,950.90 $6,987,953.34 $3,592,191.43 $3,395,761.91 $395,970.22 $2,999,791.69 $1,016.57
261 Ashby 295.65 $285,187.31 $194,349.41 $90,837.90 $5,580.32 $85,257.58 $288.37
264 Herman-Norcross 122.20 $177,527.05 $80,042.40 $97,484.65 $10,519.01 $86,965.64 $711.67
270 Hopkins 7,429.09 $14,004,860.85 $7,094,043.15 $6,910,817.70 $745,028.22 $6,165,789.48 $829.95
271 Bloomington 11,388.72 $28,358,831.09 $17,006,528.56 $11,352,302.53 $1,876,749.24 $9,475,553.29 $832.01

Special Education Cross-Subsidies FY 2017 20
Number District (A) Adjusted
PU
(B) Special Education
Expenditure
(C) Categorical
Revenue
(D) Gross Cross-Subsidy (B-C)
(E) Adj. Gen Rev for
SpEd
(F) Adj. Net Cross-Subsidy (D-E)
(G) Per WADM
272 Eden Prairie 9,829.18 $19,209,077.69 $10,985,374.99 $8,223,702.70 $1,004,662.94 $7,219,039.76 $734.45
273 Edina 9,294.37 $16,959,030.36 $9,678,612.43 $7,280,417.93 $530,034.63 $6,750,383.30 $726.29
276 Minnetonka 11,465.47 $16,784,726.38 $10,813,263.92 $5,971,462.46 $694,690.99 $5,276,771.47 $460.23
277 Westonka 2,543.88 $4,537,594.12 $2,118,227.57 $2,419,366.55 $263,901.39 $2,155,465.16 $847.31
278 Orono 3,090.78 $4,374,708.64 $2,595,523.84 $1,779,184.80 $134,135.26 $1,645,049.54 $532.24
279 Osseo 22,568.59 $48,751,354.86 $22,276,939.22 $26,474,415.64 $3,901,845.94 $22,572,569.70 $1,000.18
280 Richfield 4,743.49 $10,995,359.38 $5,142,892.02 $5,852,467.36 $930,904.93 $4,921,562.43 $1,037.54
281 Robbinsdale 13,569.12 $28,653,327.81 $10,223,336.88 $18,429,990.93 $2,349,040.67 $16,080,950.26 $1,185.11
282 St. Anthony-New Brighton 2,021.04 $2,554,260.06 $1,178,095.00 $1,376,165.06 $105,010.23 $1,271,154.83 $628.96
283 St. Louis Park 5,082.66 $9,331,707.76 $4,635,623.57 $4,696,084.19 $533,656.14 $4,162,428.05 $818.95
284 Wayzata 12,383.45 $17,997,877.45 $8,107,571.67 $9,890,305.78 $734,715.03 $9,155,590.75 $739.34
286 Brooklyn Center 2,657.96 $3,839,845.73 $1,184,100.77 $2,655,744.96 $453,885.79 $2,201,859.17 $828.40
294 Houston 2,213.56 $2,491,000.65 $1,892,081.21 $598,919.44 $82,606.50 $516,312.94 $233.25
297 Spring Grove 386.91 $481,521.46 $220,379.60 $261,141.86 $25,649.79 $235,492.07 $608.65
299 Caledonia 732.62 $1,217,096.88 $572,621.50 $644,475.38 $52,721.99 $591,753.39 $807.72
300 La Crescent-Hokah 1,259.13 $2,897,050.51 $1,629,670.15 $1,267,380.36 $90,249.61 $1,177,130.75 $934.88
306 Laporte 315.61 $565,990.06 $391,291.75 $174,698.31 $19,563.64 $155,134.67 $491.54
308 Nevis 664.26 $735,199.29 $463,777.96 $271,421.33 $37,407.91 $234,013.42 $352.29
309 Park Rapids 1,733.50 $2,940,465.20 $1,488,257.01 $1,452,208.19 $109,826.18 $1,342,382.01 $774.38
314 Braham 791.92 $1,071,393.60 $490,638.28 $580,755.32 $43,508.91 $537,246.41 $678.41
316 Greenway 1,138.89 $4,130,132.08 $2,744,722.22 $1,385,409.86 $120,726.72 $1,264,683.14 $1,110.45
317 Deer River 985.19 $3,244,069.85 $2,165,617.32 $1,078,452.53 $169,304.07 $909,148.46 $922.82
318 Grand Rapids 4,328.78 $8,798,512.78 $5,076,444.14 $3,722,068.64 $654,968.44 $3,067,100.20 $708.54
319 Nashwauk-Keewatin 661.55 $1,444,791.17 $993,427.77 $451,363.40 $35,927.65 $415,435.75 $627.97
323 Franconia 33.86 $- $(16,154.11) $16,154.11 $- $16,154.11 $477.09
330 Heron Lake-Okabena 316.39 $509,802.46 $348,923.37 $160,879.09 $45,202.01 $115,677.08 $365.62
332 Mora 1,846.13 $2,919,898.89 $1,622,790.15 $1,297,108.74 $212,001.94 $1,085,106.80 $587.77
333 Ogilvie 530.89 $777,393.76 $394,720.85 $382,672.91 $66,300.26 $316,372.65 $595.93

Special Education Cross-Subsidies FY 2017 21
Number District (A) Adjusted
PU
(B) Special Education
Expenditure
(C) Categorical
Revenue
(D) Gross Cross-Subsidy (B-C)
(E) Adj. Gen Rev for
SpEd
(F) Adj. Net Cross-Subsidy (D-E)
(G) Per WADM
345 New London-Spicer 1,616.80 $2,924,964.92 $1,959,653.17 $965,311.75 $69,801.34 $895,510.41 $553.88
347 Willmar 4,520.31 $9,371,192.75 $6,226,224.55 $3,144,968.20 $403,919.73 $2,741,048.47 $606.39
356 Lancaster 163.72 $290,798.45 $164,115.55 $126,682.90 $19,658.60 $107,024.30 $653.70
361 International Falls 1,244.34 $1,410,935.05 $864,432.53 $546,502.52 $74,222.48 $472,280.04 $379.54
362 Littlefork-Big Falls 384.61 $597,969.85 $442,892.87 $155,076.98 $37,100.73 $117,976.25 $306.74
363 South Koochiching 296.84 $530,574.18 $418,935.00 $111,639.18 $39,087.42 $72,551.76 $244.41
378 Dawson 593.66 $1,168,729.64 $684,537.28 $484,192.36 $72,899.58 $411,292.78 $692.81
381 Lake Superior 1,506.42 $2,698,207.99 $1,460,058.25 $1,238,149.74 $80,710.14 $1,157,439.60 $768.34
390 Lake of the Woods 491.83 $919,426.01 $528,950.26 $390,475.75 $20,267.26 $370,208.49 $752.72
391 Cleveland 545.83 $294,316.43 $217,174.35 $77,142.08 $11,577.36 $65,564.72 $120.12
402 Hendricks 123.22 $212,815.41 $171,106.97 $41,708.44 $9,900.18 $31,808.26 $258.14
403 Ivanhoe 152.57 $188,944.05 $52,604.55 $136,339.50 $17,518.94 $118,820.56 $778.79
404 Lake Benton 214.44 $284,319.31 $208,451.50 $75,867.81 $19,757.94 $56,109.87 $261.66
413 Marshall 2,693.64 $5,114,926.86 $3,240,548.16 $1,874,378.70 $235,542.22 $1,638,836.48 $608.41
414 Minneota 503.34 $583,336.58 $457,505.68 $125,830.90 $15,871.92 $109,958.98 $218.46
415 Lynd 199.69 $257,816.29 $166,964.77 $90,851.52 $8,964.12 $81,887.40 $410.07
423 Hutchinson 3,129.02 $6,177,163.29 $3,601,878.84 $2,575,284.45 $251,441.46 $2,323,842.99 $742.67
424 Lester Prairie 472.17 $471,136.86 $199,282.60 $271,854.26 $18,891.12 $252,963.14 $535.75
432 Mahnomen 672.18 $1,096,752.01 $272,114.56 $824,637.45 $38,867.49 $785,769.96 $1,168.99
435 Waubun 684.87 $1,270,859.58 $719,242.84 $551,616.74 $69,652.80 $481,963.94 $703.73
441 Marshall County Central 417.33 $627,647.06 $404,247.66 $223,399.40 $15,199.67 $208,199.73 $498.89
447 Grygla 169.20 $282,781.91 $253,369.32 $29,412.59 $5,643.56 $23,769.03 $140.48
458 Truman 228.95 $336,272.81 $78,639.13 $257,633.68 $17,322.70 $240,310.98 $1,049.62
463 Eden Valley 1,045.57 $1,442,938.11 $842,511.03 $600,427.08 $78,095.14 $522,331.94 $499.57
465 Litchfield 1,703.81 $3,308,203.45 $1,825,698.66 $1,482,504.79 $135,734.97 $1,346,769.82 $790.45
466 Dassel-Cokato 2,467.45 $3,570,619.54 $2,204,247.09 $1,366,372.45 $186,518.69 $1,179,853.76 $478.17
473 Isle 494.67 $769,624.86 $429,185.85 $340,439.01 $44,265.18 $296,173.83 $598.73
477 Princeton 3,497.77 $5,746,354.34 $3,221,765.40 $2,524,588.94 $309,353.81 $2,215,235.13 $633.33

Special Education Cross-Subsidies FY 2017 22
Number District (A) Adjusted
PU
(B) Special Education
Expenditure
(C) Categorical
Revenue
(D) Gross Cross-Subsidy (B-C)
(E) Adj. Gen Rev for
SpEd
(F) Adj. Net Cross-Subsidy (D-E)
(G) Per WADM
480 Onamia 644.96 $2,435,212.07 $1,668,229.25 $766,982.82 $179,357.44 $587,625.38 $911.10
482 Little Falls 2,664.54 $5,018,000.45 $2,949,237.17 $2,068,763.28 $282,816.19 $1,785,947.09 $670.26
484 Pierz 1,297.87 $1,903,514.05 $1,211,183.84 $692,330.21 $79,372.95 $612,957.26 $472.28
485 Royalton 1,005.88 $1,299,916.64 $663,100.80 $636,815.84 $82,925.80 $553,890.04 $550.65
486 Swanville 322.00 $423,826.26 $280,324.44 $143,501.82 $12,048.62 $131,453.20 $408.24
487 Upsala 395.67 $419,354.97 $216,385.98 $202,968.99 $50,481.17 $152,487.82 $385.39
492 Austin 5,291.80 $11,103,666.93 $6,598,664.97 $4,505,001.96 $988,353.27 $3,516,648.69 $664.55
495 Grand Meadow 480.06 $560,797.72 $529,732.84 $31,064.88 $31,064.88 $- $-
497 Lyle 321.28 $522,763.51 $351,023.67 $171,739.84 $42,326.40 $129,413.44 $402.81
499 Leroy 302.80 $515,130.71 $442,295.45 $72,835.26 $17,697.42 $55,137.84 $182.09
500 Southland 484.71 $951,892.66 $648,297.26 $303,595.40 $41,874.99 $261,720.41 $539.95
505 Fulda 348.97 $832,115.00 $474,778.33 $357,336.67 $20,722.43 $336,614.24 $964.59
507 Nicollet 410.89 $543,864.52 $285,756.00 $258,108.52 $13,773.38 $244,335.14 $594.65
508 St. Peter 2,301.53 $4,159,018.40 $2,221,705.80 $1,937,312.60 $360,867.26 $1,576,445.34 $684.96
511 Adrian 615.99 $799,909.68 $499,869.48 $300,040.20 $15,221.74 $284,818.46 $462.38
514 Ellsworth 164.03 $313,807.90 $178,803.20 $135,004.70 $12,100.67 $122,904.03 $749.28
518 Worthington 3,570.76 $6,009,685.83 $3,699,269.07 $2,310,416.76 $302,218.61 $2,008,198.15 $562.40
531 Byron 2,204.58 $2,562,619.76 $1,387,803.39 $1,174,816.37 $153,474.61 $1,021,341.76 $463.28
533 Dover-Eyota 1,229.78 $1,314,168.10 $853,892.04 $460,276.06 $30,454.20 $429,821.86 $349.51
534 Stewartville 2,255.06 $3,283,659.21 $1,877,338.29 $1,406,320.92 $150,024.17 $1,256,296.75 $557.10
535 Rochester 18,653.18 $44,793,373.63 $25,921,472.82 $18,871,900.81 $2,857,502.22 $16,014,398.59 $858.53
542 Battle Lake 498.78 $518,561.15 $218,074.70 $300,486.45 $10,021.54 $290,464.91 $582.35
544 Fergus Falls 3,072.88 $3,327,290.35 $1,519,991.06 $1,807,299.29 $212,251.85 $1,595,047.44 $519.07
545 Henning 437.02 $607,864.48 $252,359.72 $355,504.76 $42,543.76 $312,961.00 $716.13
547 Parkers Prairie 613.50 $1,089,132.71 $696,430.23 $392,702.48 $55,358.63 $337,343.85 $549.87
548 Pelican Rapids 958.58 $1,085,740.40 $535,220.93 $550,519.47 $32,710.60 $517,808.87 $540.18
549 Perham 1,578.68 $2,569,561.29 $1,469,135.36 $1,100,425.93 $179,929.63 $920,496.30 $583.08
550 Underwood 623.14 $583,926.69 $384,096.80 $199,829.89 $8,468.33 $191,361.56 $307.09

Special Education Cross-Subsidies FY 2017 23
Number District (A) Adjusted
PU
(B) Special Education
Expenditure
(C) Categorical
Revenue
(D) Gross Cross-Subsidy (B-C)
(E) Adj. Gen Rev for
SpEd
(F) Adj. Net Cross-Subsidy (D-E)
(G) Per WADM
553 New York Mills 801.41 $1,100,081.40 $617,239.95 $482,841.45 $30,813.65 $452,027.80 $564.04
561 Goodridge 230.98 $513,459.25 $331,240.85 $182,218.40 $8,391.15 $173,827.25 $752.56
564 Thief River Falls 2,207.82 $2,874,440.64 $1,644,200.70 $1,230,239.94 $110,041.22 $1,120,198.72 $507.38
577 Willow River 484.13 $739,914.09 $461,468.94 $278,445.15 $15,745.02 $262,700.13 $542.62
578 Pine City 1,794.11 $4,318,706.42 $3,239,538.71 $1,079,167.71 $135,831.60 $943,336.11 $525.80
581 Edgerton 428.62 $578,904.49 $485,790.69 $93,113.80 $25,605.88 $67,507.92 $157.50
592 Climax 230.80 $317,624.56 $246,685.15 $70,939.41 $5,608.55 $65,330.86 $283.06
593 Crookston 1,310.68 $2,519,800.79 $1,498,497.52 $1,021,303.27 $98,573.04 $922,730.23 $704.01
595 East Grand Forks 2,027.33 $2,882,407.54 $1,865,501.61 $1,016,905.93 $80,528.07 $936,377.86 $461.88
599 Fertile-Beltrami 503.38 $729,142.43 $448,149.01 $280,993.42 $12,402.57 $268,590.85 $533.57
600 Fisher 302.46 $418,519.57 $338,379.89 $80,139.68 $12,360.14 $67,779.54 $224.09
601 Fosston 713.14 $1,188,766.00 $722,465.18 $466,300.82 $34,309.47 $431,991.35 $605.76
621 Mounds View 12,350.88 $28,433,537.92 $20,183,329.39 $8,250,208.53 $1,496,796.26 $6,753,412.27 $546.80
622 North St. Paul-Maplewood Oakdale 11,521.80 $28,367,446.80 $15,443,078.05 $12,924,368.75 $2,726,262.35 $10,198,106.40 $885.11
623 Roseville 8,307.45 $19,138,284.54 $9,269,789.38 $9,868,495.16 $1,149,211.15 $8,719,284.01 $1,049.57
624 White Bear Lake 9,135.85 $21,540,788.32 $10,102,470.05 $11,438,318.27 $1,177,123.61 $10,261,194.66 $1,123.18
625 St. Paul 39,649.12 $105,977,499.51 $59,126,325.16 $46,851,174.35 $7,124,663.37 $39,726,510.98 $1,001.95
630 Red Lake Falls 388.22 $516,194.39 $366,343.64 $149,850.75 $28,808.23 $121,042.52 $311.79
635 Milroy 53.15 $46,831.96 $(7,653.26) $54,485.22 $- $54,485.22 $1,025.12
640 Wabasso 423.56 $414,558.67 $224,491.55 $190,067.12 $26,322.13 $163,744.99 $386.59
656 Faribault 4,177.47 $9,719,379.96 $5,714,065.95 $4,005,314.01 $741,750.95 $3,263,563.06 $781.23
659 Northfield 4,392.27 $8,816,789.25 $4,771,235.63 $4,045,553.62 $400,434.55 $3,645,119.07 $829.89
671 Hills-Beaver Creek 403.00 $584,793.81 $288,472.68 $296,321.13 $12,322.46 $283,998.67 $704.71
676 Badger 264.32 $306,033.05 $193,038.98 $112,994.07 $12,446.89 $100,547.18 $380.40
682 Roseau 1,255.95 $1,779,519.67 $1,132,614.52 $646,905.15 $42,619.19 $604,285.96 $481.14
690 Warroad 1,082.62 $1,836,152.79 $1,214,786.83 $621,365.96 $57,433.21 $563,932.75 $520.90
695 Chisholm 818.93 $1,613,025.64 $700,154.93 $912,870.71 $68,299.20 $844,571.51 $1,031.31
696 Ely 626.77 $856,627.32 $651,535.70 $205,091.62 $32,467.35 $172,624.27 $275.42
Special Education Cross-Subsidies FY 2017 24
Number District (A) Adjusted
PU
(B) Special Education
Expenditure
(C) Categorical
Revenue
(D) Gross Cross-Subsidy (B-C)
(E) Adj. Gen Rev for
SpEd
(F) Adj. Net Cross-Subsidy (D-E)
(G) Per WADM
698 Floodwood 246.05 $484,590.64 $357,259.57 $127,331.07 $16,857.07 $110,474.00 $448.99
700 Hermantown 2,290.65 $3,786,351.58 $2,505,543.70 $1,280,807.88 $90,801.61 $1,190,006.27 $519.51
701 Hibbing 2,619.87 $4,349,179.94 $2,736,372.97 $1,612,806.97 $189,337.16 $1,423,469.81 $543.34
704 Proctor 1,989.02 $3,138,321.60 $2,109,125.26 $1,029,196.34 $103,710.09 $925,486.25 $465.30
706 Virginia 1,849.87 $3,513,636.14 $2,224,023.86 $1,289,612.28 $167,922.07 $1,121,690.21 $606.36
707 Nett Lake 108.61 $270,912.37 $73,456.67 $197,455.70 $15,312.03 $182,143.67 $1,677.04
709 Duluth 8,804.59 $22,687,491.79 $12,012,336.71 $10,675,155.08 $1,258,629.96 $9,416,525.12 $1,069.50
712 Mountain Iron-Buhl 521.90 $962,627.53 $909,410.85 $53,216.68 $53,216.68 $- $-
716 Belle Plaine 1,773.29 $2,858,474.23 $1,331,236.89 $1,527,237.34 $172,731.68 $1,354,505.66 $763.84
717 Jordan 1,975.59 $3,162,357.25 $1,772,164.08 $1,390,193.17 $145,048.40 $1,245,144.77 $630.26
719 Prior Lake-Savage 9,187.09 $14,547,922.43 $7,630,596.76 $6,917,325.67 $865,515.33 $6,051,810.34 $658.73
720 Shakopee 8,982.00 $17,417,425.30 $8,548,664.68 $8,868,760.62 $854,870.64 $8,013,889.98 $892.22
721 New Prague 4,498.81 $6,491,191.68 $3,325,045.82 $3,166,145.86 $328,820.19 $2,837,325.67 $630.68
726 Becker 3,109.86 $4,343,267.77 $2,277,747.53 $2,065,520.24 $192,000.72 $1,873,519.52 $602.44
727 Big Lake 3,372.93 $6,350,425.50 $2,633,632.55 $3,716,792.95 $370,139.46 $3,346,653.49 $992.21
728 Elk River 14,123.94 $28,188,644.89 $16,639,343.38 $11,549,301.51 $1,171,826.67 $10,377,474.84 $734.74
738 Holdingford 1,184.83 $1,360,705.67 $760,145.80 $600,559.87 $53,043.26 $547,516.61 $462.11
739 Kimball 790.02 $1,287,744.01 $677,013.27 $610,730.74 $42,523.61 $568,207.13 $719.23
740 Melrose 1,538.20 $2,202,237.10 $1,275,246.08 $926,991.02 $72,889.90 $854,101.12 $555.26
741 Paynesville 1,039.46 $1,965,762.09 $1,294,243.66 $671,518.43 $55,794.36 $615,724.07 $592.35
742 St. Cloud 10,663.21 $31,219,271.01 $16,069,851.19 $15,149,419.82 $1,476,695.48 $13,672,724.34 $1,282.23
743 Sauk Centre 1,152.67 $1,753,341.75 $976,630.91 $776,710.84 $99,759.81 $676,951.03 $587.29
745 Albany 1,891.39 $2,963,823.72 $1,682,228.70 $1,281,595.02 $115,364.42 $1,166,230.60 $616.60
748 Sartell 4,218.89 $6,497,352.19 $3,823,730.45 $2,673,621.74 $186,709.73 $2,486,912.01 $589.47
750 Rocori 2,287.31 $3,260,299.92 $1,994,212.25 $1,266,087.67 $135,560.40 $1,130,527.27 $494.26
756 Blooming Prairie 801.52 $955,878.40 $580,501.27 $375,377.13 $67,660.71 $307,716.42 $383.92
761 Owatonna 5,350.94 $10,725,248.28 $6,105,666.90 $4,619,581.38 $650,919.85 $3,968,661.53 $741.68
763 Medford 972.54 $956,377.00 $511,323.62 $445,053.38 $26,432.85 $418,620.53 $430.44

Special Education Cross-Subsidies FY 2017 25
Number District (A) Adjusted
PU
(B) Special Education
Expenditure
(C) Categorical
Revenue
(D) Gross Cross-Subsidy (B-C)
(E) Adj. Gen Rev for
SpEd
(F) Adj. Net Cross-Subsidy (D-E)
(G) Per WADM
768 Hancock 378.05 $411,247.09 $227,623.99 $183,623.10 $21,299.29 $162,323.81 $429.37
771 Chokio-Alberta 178.21 $272,784.97 $143,124.18 $129,660.79 $20,375.48 $109,285.31 $613.24
775 Kerkhoven-Murdock-Sunburg 756.49 $1,242,246.55 $760,602.70 $481,643.85 $66,774.69 $414,869.16 $548.41
777 Benson 905.01 $1,847,622.11 $1,263,043.96 $584,578.15 $80,799.31 $503,778.84 $556.66
786 Bertha-Hewitt 493.53 $847,486.80 $549,706.64 $297,780.16 $43,295.08 $254,485.08 $515.64
787 Browerville 400.79 $767,632.93 $552,523.53 $215,109.40 $27,054.09 $188,055.31 $469.21
801 Browns Valley 148.25 $272,716.53 $190,430.96 $82,285.57 $5,923.71 $76,361.86 $515.09
803 Wheaton 441.14 $773,590.59 $481,607.56 $291,983.03 $27,974.77 $264,008.26 $598.47
811 Wabasha-Kellogg 609.66 $1,180,901.45 $586,202.21 $594,699.24 $55,939.40 $538,759.84 $883.71
813 Lake City 1,374.87 $1,662,753.91 $1,068,209.60 $594,544.31 $72,367.59 $522,176.72 $379.80
815 Prinsburg 2.44 $335,615.21 $300,564.51 $35,050.70 $1,210.53 $33,840.17 $13,868.92
818 Verndale 591.80 $880,226.90 $675,598.10 $204,628.80 $28,630.37 $175,998.43 $297.40
820 Sebeka 560.70 $994,408.84 $436,864.30 $557,544.54 $44,024.24 $513,520.30 $915.86
821 Menahga 1,066.82 $1,479,743.34 $842,930.27 $636,813.07 $31,702.41 $605,110.66 $567.21
829 Waseca 2,089.55 $4,132,597.50 $3,171,621.11 $960,976.39 $180,302.87 $780,673.52 $373.61
831 Forest Lake 6,911.03 $13,677,130.42 $7,850,509.57 $5,826,620.85 $771,570.87 $5,055,049.98 $731.45
832 Mahtomedi 3,578.20 $6,029,967.47 $2,600,682.60 $3,429,284.87 $184,555.76 $3,244,729.11 $906.80
833 South Washington County 19,826.22 $41,607,179.77 $22,687,261.15 $18,919,918.62 $2,386,349.72 $16,533,568.90 $833.92
834 Stillwater 9,282.13 $18,697,357.59 $8,725,490.88 $9,971,866.71 $1,014,519.80 $8,957,346.91 $965.01
836 Butterfield 228.39 $399,569.74 $218,354.15 $181,215.59 $23,287.81 $157,927.78 $691.48
837 Madelia 599.33 $1,191,310.54 $726,802.42 $464,508.12 $82,776.99 $381,731.13 $636.93
840 St. James 1,112.45 $1,836,640.17 $1,010,558.45 $826,081.72 $91,735.11 $734,346.61 $660.12
846 Breckenridge 722.09 $1,107,083.25 $738,657.32 $368,425.93 $36,356.81 $332,069.12 $459.87
850 Rothsay 314.02 $201,557.35 $118,923.60 $82,633.75 $10,110.70 $72,523.05 $230.95
852 Campbell-Tintah 157.40 $218,881.08 $120,860.89 $98,020.19 $16,175.20 $81,844.99 $519.98
857 Lewiston 818.29 $1,115,282.62 $720,986.55 $394,296.07 $46,239.96 $348,056.11 $425.35
858 St. Charles 1,057.33 $1,094,286.94 $570,222.04 $524,064.90 $53,394.96 $470,669.94 $445.15
861 Winona 3,306.57 $10,816,078.32 $6,252,553.15 $4,563,525.17 $512,133.57 $4,051,391.60 $1,225.26

Special Education Cross-Subsidies FY 2017 26
Number District (A) Adjusted
PU
(B) Special Education
Expenditure
(C) Categorical
Revenue
(D) Gross Cross-Subsidy (B-C)
(E) Adj. Gen Rev for
SpEd
(F) Adj. Net Cross-Subsidy (D-E)
(G) Per WADM
876 Annandale 1,982.64 $3,375,055.47 $1,876,716.28 $1,498,339.19 $169,708.64 $1,328,630.55 $670.13
877 Buffalo-Hanover-Montrose 6,343.27 $12,727,052.32 $6,611,895.23 $6,115,157.09 $623,185.49 $5,491,971.60 $865.80
879 Delano 2,749.91 $4,268,757.32 $2,326,691.70 $1,942,065.62 $173,163.35 $1,768,902.27 $643.26
881 Maple Lake 952.03 $1,858,936.42 $852,972.72 $1,005,963.70 $113,531.49 $892,432.21 $937.40
882 Monticello 4,443.97 $7,337,571.04 $3,272,193.58 $4,065,377.46 $429,701.89 $3,635,675.57 $818.11
883 Rockford 1,827.59 $2,553,238.32 $1,475,897.42 $1,077,340.90 $124,842.81 $952,498.09 $521.18
885 St. Michael-Albertville 6,783.23 $6,789,027.03 $2,759,528.97 $4,029,498.06 $377,265.10 $3,652,232.96 $538.42
891 Canby 589.98 $650,097.23 $404,637.75 $245,459.48 $40,931.99 $204,527.49 $346.67
911 Cambridge-Isanti 5,398.00 $10,403,798.46 $5,346,011.71 $5,057,786.75 $663,149.24 $4,394,637.51 $814.12
912 Milaca 1,986.86 $4,422,438.91 $2,099,262.96 $2,323,175.95 $246,476.14 $2,076,699.81 $1,045.22
914 Ulen-Hitterdal 332.19 $362,966.17 $242,490.50 $120,475.67 $19,855.42 $100,620.25 $302.90
2071 Lake Crystal-Wellcome 965.10 $1,637,515.42 $967,432.17 $670,083.25 $85,880.63 $584,202.62 $605.33
2125 Triton 1,269.42 $1,467,204.11 $617,694.46 $849,509.65 $89,297.20 $760,212.45 $598.87
2134 United South Central 775.36 $1,772,267.15 $801,000.91 $971,266.24 $111,972.70 $859,293.54 $1,108.25
2135 Maple River 1,049.02 $1,916,013.49 $1,547,914.76 $368,098.73 $95,954.52 $272,144.21 $259.43
2137 Kingsland 638.49 $1,176,435.50 $420,881.17 $755,554.33 $65,209.08 $690,345.25 $1,081.22
2142 St. Louis County 2,068.27 $4,532,260.17 $2,451,135.34 $2,081,124.83 $157,998.25 $1,923,126.58 $929.82
2143 Waterville-Elysian-Morris 840.68 $1,516,534.90 $915,068.33 $601,466.57 $72,176.63 $529,289.94 $629.60
2144 Chisago Lakes 3,676.58 $8,727,276.59 $4,960,785.77 $3,766,490.82 $331,037.14 $3,435,453.68 $934.42
2149 Minnewaska 1,274.16 $5,134,331.37 $4,167,088.38 $967,242.99 $125,080.03 $842,162.96 $660.96
2154 Eveleth-Gilbert 1,028.56 $1,349,807.82 $794,180.13 $555,627.69 $39,846.96 $515,780.73 $501.46
2155 Wadena-Deer Creek 1,099.42 $1,937,105.21 $743,595.61 $1,193,509.60 $140,430.53 $1,053,079.07 $957.85
2159 Buffalo Lake-Hector 584.09 $896,783.70 $340,796.39 $555,987.31 $61,401.19 $494,586.12 $846.76
2164 Dilworth-Glyndon-Felton 1,770.62 $2,353,152.38 $1,507,640.03 $845,512.35 $76,616.38 $768,895.97 $434.25
2165 Hinckley-Finlayson 1,016.45 $2,154,545.36 $878,526.58 $1,276,018.78 $105,787.84 $1,170,230.94 $1,151.29
2167 Lakeview 709.76 $923,967.43 $572,115.84 $351,851.59 $38,811.97 $313,039.62 $441.05
2168 N.R.H.E.G. 999.78 $1,459,414.43 $955,453.87 $503,960.56 $98,355.66 $405,604.90 $405.69
2169 Murray County 798.69 $1,266,666.29 $775,572.39 $491,093.90 $46,732.86 $444,361.04 $556.36

Special Education Cross-Subsidies FY 2017 27
Number District (A) Adjusted
PU
(B) Special Education
Expenditure
(C) Categorical
Revenue
(D) Gross Cross-Subsidy (B-C)
(E) Adj. Gen Rev for
SpEd
(F) Adj. Net Cross-Subsidy (D-E)
(G) Per WADM
2170 Staples-Motley 1,256.26 $2,815,627.61 $1,436,339.23 $1,379,288.38 $172,143.00 $1,207,145.38 $960.90
2171 Kittson Central 280.82 $463,239.10 $248,774.14 $214,464.96 $4,882.74 $209,582.22 $746.32
2172 Kenyon-Wanamingo 907.69 $1,404,130.70 $808,952.66 $595,178.04 $67,497.51 $527,680.53 $581.34
2174 Pine River-Backus 1,006.27 $1,803,288.95 $1,056,350.21 $746,938.74 $120,901.66 $626,037.08 $622.14
2176 Warren-Alvarado-Oslo 484.30 $772,986.91 $385,742.37 $387,244.54 $40,812.77 $346,431.77 $715.32
2180 M A C C R A Y 754.11 $1,168,497.49 $605,603.61 $562,893.88 $61,180.09 $501,713.79 $665.31
2184 Luverne 1,365.98 $2,636,533.09 $1,543,107.28 $1,093,425.81 $94,592.17 $998,833.64 $731.22
2190 Yellow Medicine East 809.91 $2,093,869.56 $1,093,305.24 $1,000,564.32 $105,042.20 $895,522.12 $1,105.71
2198 Fillmore Central 680.21 $1,035,225.13 $604,255.43 $430,969.70 $26,989.01 $403,980.69 $593.91
2215 Norman County East 304.39 $545,974.06 $259,611.02 $286,363.04 $14,469.90 $271,893.14 $893.24
2310 Sibley East 1,283.29 $1,845,234.53 $867,175.84 $978,058.69 $88,756.83 $889,301.86 $692.99
2311 Clearbrook-Gonvick 462.50 $816,078.51 $433,281.51 $382,797.00 $36,006.78 $346,790.22 $749.82
2342 West Central Area 783.50 $1,041,938.38 $481,418.19 $560,520.19 $47,265.34 $513,254.85 $655.08
2358 Tri-County 206.38 $382,336.64 $157,456.72 $224,879.92 $9,238.17 $215,641.75 $1,044.88
2364 Belgrade-Brooten-Elrosa 672.10 $1,035,714.61 $516,906.03 $518,808.58 $41,035.84 $477,772.74 $710.87
2365 G.F.W. 804.04 $1,618,489.10 $711,815.43 $906,673.67 $76,966.64 $829,707.03 $1,031.92
2396 A.C.G.C. 893.27 $1,605,345.91 $897,664.20 $707,681.71 $73,569.57 $634,112.14 $709.88
2397 Lesueur-Henderson 1,113.69 $1,775,708.40 $1,002,654.82 $773,053.58 $99,335.46 $673,718.12 $604.94
2448 Martin County West 814.88 $1,210,209.42 $697,181.12 $513,028.30 $33,881.35 $479,146.95 $588.00
2527 Norman County West 280.60 $534,748.11 $334,860.04 $199,888.07 $41,449.45 $158,438.62 $564.64
2534 Bird Island-Olivia-Lake Lillian 745.91 $964,680.13 $378,970.00 $585,710.13 $51,090.82 $534,619.31 $716.73
2536 Granada Huntley-East Chain 269.75 $267,487.38 $78,185.58 $189,301.80 $19,449.86 $169,851.94 $629.66
2580 East Central 782.85 $1,502,374.25 $641,736.95 $860,637.30 $108,140.12 $752,497.18 $961.23
2609 Win-E-Mac 459.90 $776,159.47 $410,591.98 $365,567.49 $18,032.59 $347,534.90 $755.67
2683 Greenbush-Middle River 413.64 $852,953.14 $381,338.83 $471,614.31 $16,243.99 $455,370.32 $1,100.89
2687 Howard Lake-Waverly-Winsted 1,279.57 $2,301,934.58 $1,273,344.54 $1,028,590.04 $97,337.83 $931,252.21 $727.79
2689 Pipestone-Jasper 1,232.98 $2,504,293.70 $1,522,513.29 $981,780.41 $121,409.68 $860,370.73 $697.80
2711 Mesabi East 1,033.41 $2,159,412.48 $1,336,695.72 $822,716.76 $115,177.62 $707,539.14 $684.66

Special Education Cross-Subsidies FY 2017 28
Number District (A) Adjusted
PU
(B) Special Education
Expenditure
(C) Categorical
Revenue
(D) Gross Cross-Subsidy (B-C)
(E) Adj. Gen Rev for
SpEd
(F) Adj. Net Cross-Subsidy (D-E)
(G) Per WADM
2752 Fairmont Area 1,881.20 $3,031,508.04 $1,445,898.15 $1,585,609.89 $150,595.03 $1,435,014.86 $762.82
2753 Long Prairie-Grey Eagle 984.71 $1,501,509.51 $585,270.04 $916,239.47 $67,548.51 $848,690.96 $861.87
2754 Cedar Mountain 515.67 $1,325,163.01 $946,706.15 $378,456.86 $43,949.88 $334,506.98 $648.68
2759 Eagle Valley 228.71 $171,555.99 $(83,274.92) $254,830.91 $18,000.61 $236,830.30 $1,035.50
2769 Morris Area 1,105.36 $1,936,055.09 $1,260,047.33 $676,007.76 $73,428.10 $602,579.66 $545.14
2805 Zumbrota-Mazeppa 1,295.73 $1,891,340.76 $1,065,202.30 $826,138.46 $73,107.05 $753,031.41 $581.16
2835 Janesville-Waldorf-Pemberton 692.89 $1,241,347.26 $1,043,456.27 $197,890.99 $45,532.16 $152,358.83 $219.89
2853 Lac Qui Parle Valley 821.29 $1,828,616.98 $1,025,841.82 $802,775.16 $74,255.01 $728,520.15 $887.04
2854 Ada-Borup 587.83 $919,599.06 $485,424.53 $434,174.53 $51,440.50 $382,734.03 $651.10
2856 Stephen-Argyle Central 321.18 $688,256.69 $350,241.39 $338,015.30 $8,516.89 $329,498.41 $1,025.90
2859 Glencoe-Silver Lake 1,732.76 $3,532,604.78 $1,776,327.32 $1,756,277.46 $152,636.27 $1,603,641.19 $925.48
2860 Blue Earth Area 1,247.59 $1,758,362.96 $766,502.49 $991,860.47 $107,656.18 $884,204.29 $708.73
2884 Red Rock Central 464.92 $423,155.86 $249,991.47 $173,164.39 $43,727.20 $129,437.19 $278.41
2886 Glenville-Emmons 354.22 $679,265.37 $310,282.30 $368,983.07 $19,177.80 $349,805.27 $987.54
2888 Clinton-Graceville-Beardsley 379.36 $535,962.31 $414,763.98 $121,198.33 $31,514.02 $89,684.31 $236.41
2889 Lake Park Audubon 760.82 $829,871.24 $379,880.46 $449,990.78 $32,715.77 $417,275.01 $548.45
2890 Renville County West 556.89 $1,133,455.45 $559,049.01 $574,406.44 $52,752.46 $521,653.98 $936.73
2895 Jackson County Central 1,311.06 $2,237,743.68 $1,236,212.96 $1,001,530.72 $120,515.97 $881,014.75 $671.99
2897 Redwood Area 1,197.84 $2,091,262.59 $1,077,755.84 $1,013,506.75 $128,526.07 $884,980.68 $738.81
2898 Westbrook-Walnut Grove 432.68 $691,754.13 $307,474.46 $384,279.67 $52,644.17 $331,635.50 $766.47
2899 Plainview-Elgin-Millville 1,590.88 $1,957,508.43 $1,123,683.25 $833,825.18 $40,479.57 $793,345.61 $498.68
2902 RTR 605.45 $954,072.69 $502,719.19 $451,353.50 $15,991.71 $435,361.79 $719.07
2903 Ortonville 534.33 $1,109,163.69 $644,817.47 $464,346.22 $71,238.79 $393,107.43 $735.70
2904 Tracy 803.22 $1,369,922.61 $578,874.45 $791,048.16 $74,454.45 $716,593.71 $892.15
2905 Tri-City United 2,067.02 $3,347,331.92 $1,423,960.18 $1,923,371.74 $249,344.02 $1,674,027.72 $809.87
2906 Red Lake County Central 415.05 $687,180.55 $419,366.91 $267,813.64 $8,269.95 $259,543.69 $625.33
2907 Round Lake-Brewster 315.85 $164,444.99 $(122,921.15) $287,366.14 $19,183.35 $268,182.79 $849.08
2908 Brandon-Evansville 498.09 $480,328.79 $196,979.02 $283,349.77 $31,629.14 $251,720.63 $505.37
Special Education Cross-Subsidies FY 2017 29
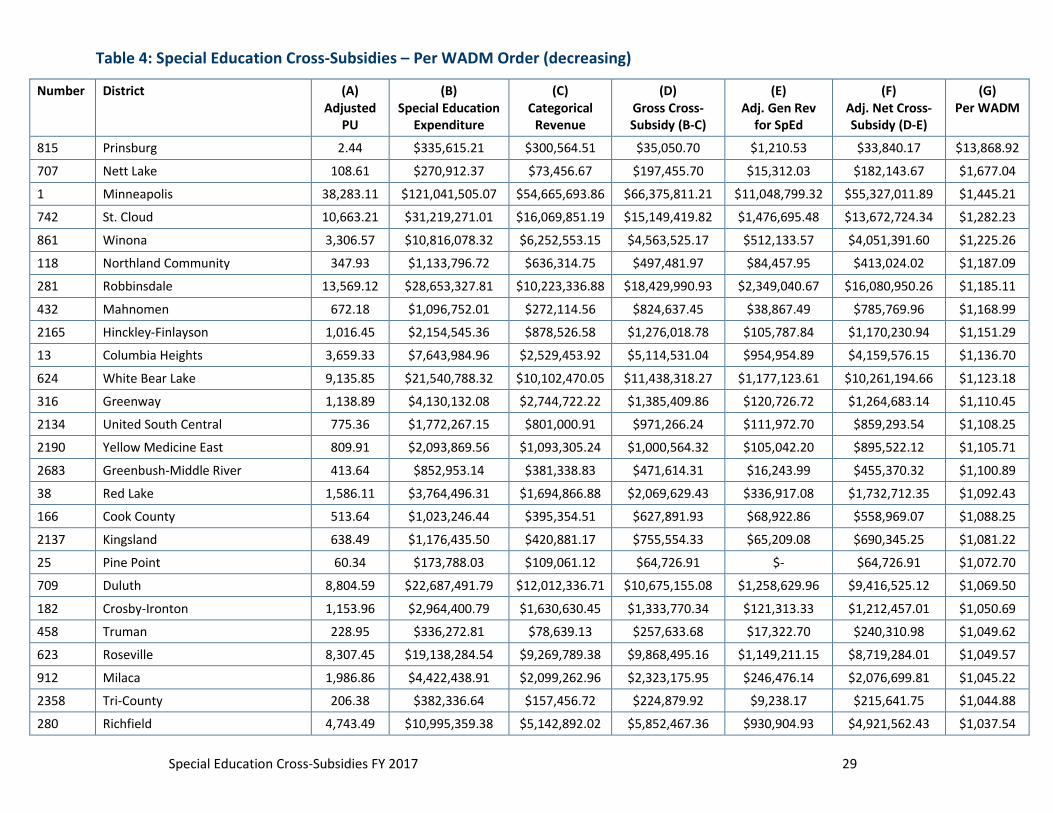
Table 4: Special Education Cross-Subsidies – Per WADM Order (decreasing)
Number District (A) Adjusted
PU
(B) Special Education
Expenditure
(C) Categorical
Revenue
(D) Gross Cross-Subsidy (B-C)
(E) Adj. Gen Rev
for SpEd
(F) Adj. Net Cross-Subsidy (D-E)
(G) Per WADM
815 Prinsburg 2.44 $335,615.21 $300,564.51 $35,050.70 $1,210.53 $33,840.17 $13,868.92
707 Nett Lake 108.61 $270,912.37 $73,456.67 $197,455.70 $15,312.03 $182,143.67 $1,677.04
1 Minneapolis 38,283.11 $121,041,505.07 $54,665,693.86 $66,375,811.21 $11,048,799.32 $55,327,011.89 $1,445.21
742 St. Cloud 10,663.21 $31,219,271.01 $16,069,851.19 $15,149,419.82 $1,476,695.48 $13,672,724.34 $1,282.23
861 Winona 3,306.57 $10,816,078.32 $6,252,553.15 $4,563,525.17 $512,133.57 $4,051,391.60 $1,225.26
118 Northland Community 347.93 $1,133,796.72 $636,314.75 $497,481.97 $84,457.95 $413,024.02 $1,187.09
281 Robbinsdale 13,569.12 $28,653,327.81 $10,223,336.88 $18,429,990.93 $2,349,040.67 $16,080,950.26 $1,185.11
432 Mahnomen 672.18 $1,096,752.01 $272,114.56 $824,637.45 $38,867.49 $785,769.96 $1,168.99
2165 Hinckley-Finlayson 1,016.45 $2,154,545.36 $878,526.58 $1,276,018.78 $105,787.84 $1,170,230.94 $1,151.29
13 Columbia Heights 3,659.33 $7,643,984.96 $2,529,453.92 $5,114,531.04 $954,954.89 $4,159,576.15 $1,136.70
624 White Bear Lake 9,135.85 $21,540,788.32 $10,102,470.05 $11,438,318.27 $1,177,123.61 $10,261,194.66 $1,123.18
316 Greenway 1,138.89 $4,130,132.08 $2,744,722.22 $1,385,409.86 $120,726.72 $1,264,683.14 $1,110.45
2134 United South Central 775.36 $1,772,267.15 $801,000.91 $971,266.24 $111,972.70 $859,293.54 $1,108.25
2190 Yellow Medicine East 809.91 $2,093,869.56 $1,093,305.24 $1,000,564.32 $105,042.20 $895,522.12 $1,105.71
2683 Greenbush-Middle River 413.64 $852,953.14 $381,338.83 $471,614.31 $16,243.99 $455,370.32 $1,100.89
38 Red Lake 1,586.11 $3,764,496.31 $1,694,866.88 $2,069,629.43 $336,917.08 $1,732,712.35 $1,092.43
166 Cook County 513.64 $1,023,246.44 $395,354.51 $627,891.93 $68,922.86 $558,969.07 $1,088.25
2137 Kingsland 638.49 $1,176,435.50 $420,881.17 $755,554.33 $65,209.08 $690,345.25 $1,081.22
25 Pine Point 60.34 $173,788.03 $109,061.12 $64,726.91 $- $64,726.91 $1,072.70
709 Duluth 8,804.59 $22,687,491.79 $12,012,336.71 $10,675,155.08 $1,258,629.96 $9,416,525.12 $1,069.50
182 Crosby-Ironton 1,153.96 $2,964,400.79 $1,630,630.45 $1,333,770.34 $121,313.33 $1,212,457.01 $1,050.69
458 Truman 228.95 $336,272.81 $78,639.13 $257,633.68 $17,322.70 $240,310.98 $1,049.62
623 Roseville 8,307.45 $19,138,284.54 $9,269,789.38 $9,868,495.16 $1,149,211.15 $8,719,284.01 $1,049.57
912 Milaca 1,986.86 $4,422,438.91 $2,099,262.96 $2,323,175.95 $246,476.14 $2,076,699.81 $1,045.22
2358 Tri-County 206.38 $382,336.64 $157,456.72 $224,879.92 $9,238.17 $215,641.75 $1,044.88
280 Richfield 4,743.49 $10,995,359.38 $5,142,892.02 $5,852,467.36 $930,904.93 $4,921,562.43 $1,037.54

Special Education Cross-Subsidies FY 2017 30
Number District (A) Adjusted
PU
(B) Special Education
Expenditure
(C) Categorical
Revenue
(D) Gross Cross-Subsidy (B-C)
(E) Adj. Gen Rev
for SpEd
(F) Adj. Net Cross-Subsidy (D-E)
(G) Per WADM
2759 Eagle Valley 228.71 $171,555.99 $(83,274.92) $254,830.91 $18,000.61 $236,830.30 $1,035.50
2365 G.F.W. 804.04 $1,618,489.10 $711,815.43 $906,673.67 $76,966.64 $829,707.03 $1,031.92
695 Chisholm 818.93 $1,613,025.64 $700,154.93 $912,870.71 $68,299.20 $844,571.51 $1,031.31
2856 Stephen-Argyle Central 321.18 $688,256.69 $350,241.39 $338,015.30 $8,516.89 $329,498.41 $1,025.90
635 Milroy 53.15 $46,831.96 $(7,653.26) $54,485.22 $- $54,485.22 $1,025.12
256 Red Wing 2,950.90 $6,987,953.34 $3,592,191.43 $3,395,761.91 $395,970.22 $2,999,791.69 $1,016.57
625 St. Paul 39,649.12 $105,977,499.51 $59,126,325.16 $46,851,174.35 $7,124,663.37 $39,726,510.98 $1,001.95
279 Osseo 22,568.59 $48,751,354.86 $22,276,939.22 $26,474,415.64 $3,901,845.94 $22,572,569.70 $1,000.18
191 Burnsville 9,931.97 $24,504,893.50 $13,294,472.91 $11,210,420.59 $1,344,843.12 $9,865,577.47 $993.32
88 New Ulm 2,341.91 $5,219,471.25 $2,632,456.52 $2,587,014.73 $261,756.13 $2,325,258.60 $992.89
727 Big Lake 3,372.93 $6,350,425.50 $2,633,632.55 $3,716,792.95 $370,139.46 $3,346,653.49 $992.21
2886 Glenville-Emmons 354.22 $679,265.37 $310,282.30 $368,983.07 $19,177.80 $349,805.27 $987.54
115 Cass Lake 1,262.49 $3,620,579.74 $2,117,572.58 $1,503,007.16 $277,584.49 $1,225,422.67 $970.64
834 Stillwater 9,282.13 $18,697,357.59 $8,725,490.88 $9,971,866.71 $1,014,519.80 $8,957,346.91 $965.01
505 Fulda 348.97 $832,115.00 $474,778.33 $357,336.67 $20,722.43 $336,614.24 $964.59
2580 East Central 782.85 $1,502,374.25 $641,736.95 $860,637.30 $108,140.12 $752,497.18 $961.23
2170 Staples-Motley 1,256.26 $2,815,627.61 $1,436,339.23 $1,379,288.38 $172,143.00 $1,207,145.38 $960.90
2155 Wadena-Deer Creek 1,099.42 $1,937,105.21 $743,595.61 $1,193,509.60 $140,430.53 $1,053,079.07 $957.85
108 Central 1,106.48 $1,638,170.11 $515,381.16 $1,122,788.95 $77,653.00 $1,045,135.95 $944.56
881 Maple Lake 952.03 $1,858,936.42 $852,972.72 $1,005,963.70 $113,531.49 $892,432.21 $937.40
2890 Renville County West 556.89 $1,133,455.45 $559,049.01 $574,406.44 $52,752.46 $521,653.98 $936.73
194 Lakeville 12,027.15 $25,410,719.82 $12,798,737.21 $12,611,982.61 $1,357,606.89 $11,254,375.72 $935.75
300 La Crescent-Hokah 1,259.13 $2,897,050.51 $1,629,670.15 $1,267,380.36 $90,249.61 $1,177,130.75 $934.88
2144 Chisago Lakes 3,676.58 $8,727,276.59 $4,960,785.77 $3,766,490.82 $331,037.14 $3,435,453.68 $934.42
2142 St. Louis County 2,068.27 $4,532,260.17 $2,451,135.34 $2,081,124.83 $157,998.25 $1,923,126.58 $929.82
2859 Glencoe-Silver Lake 1,732.76 $3,532,604.78 $1,776,327.32 $1,756,277.46 $152,636.27 $1,603,641.19 $925.48
317 Deer River 985.19 $3,244,069.85 $2,165,617.32 $1,078,452.53 $169,304.07 $909,148.46 $922.82
820 Sebeka 560.70 $994,408.84 $436,864.30 $557,544.54 $44,024.24 $513,520.30 $915.86
Special Education Cross-Subsidies FY 2017 31
Number District (A) Adjusted
PU
(B) Special Education
Expenditure
(C) Categorical
Revenue
(D) Gross Cross-Subsidy (B-C)
(E) Adj. Gen Rev
for SpEd
(F) Adj. Net Cross-Subsidy (D-E)
(G) Per WADM
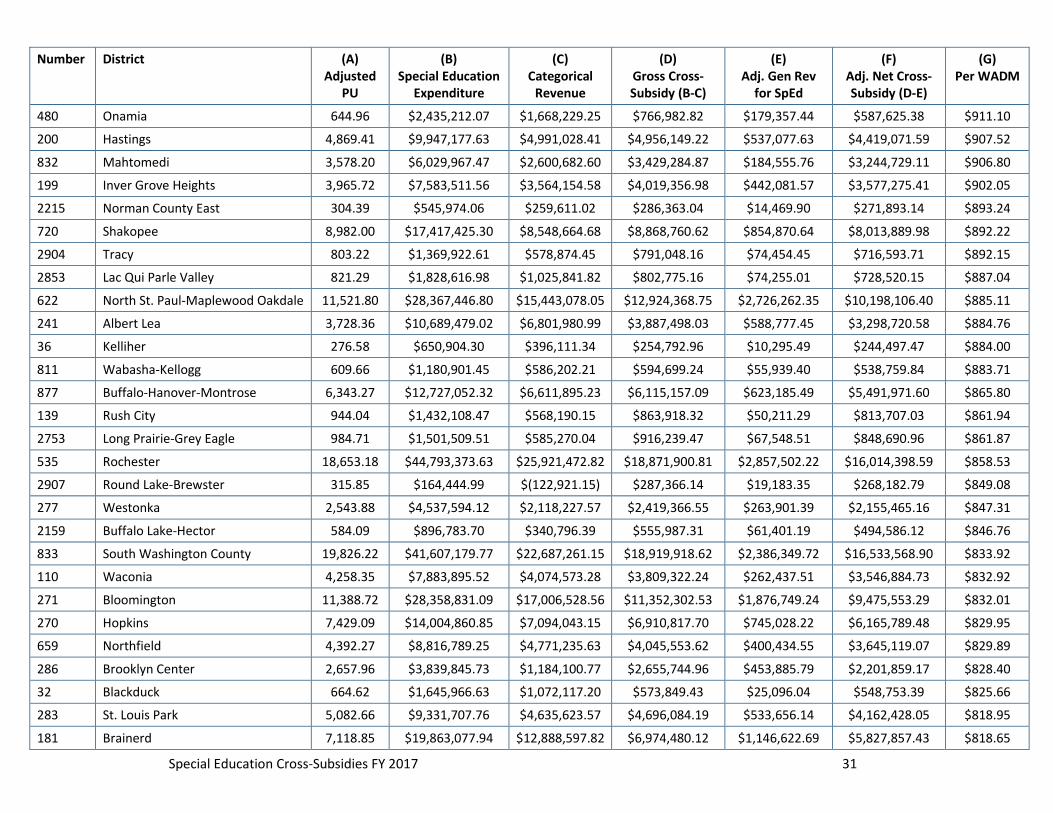
480 Onamia 644.96 $2,435,212.07 $1,668,229.25 $766,982.82 $179,357.44 $587,625.38 $911.10
200 Hastings 4,869.41 $9,947,177.63 $4,991,028.41 $4,956,149.22 $537,077.63 $4,419,071.59 $907.52
832 Mahtomedi 3,578.20 $6,029,967.47 $2,600,682.60 $3,429,284.87 $184,555.76 $3,244,729.11 $906.80
199 Inver Grove Heights 3,965.72 $7,583,511.56 $3,564,154.58 $4,019,356.98 $442,081.57 $3,577,275.41 $902.05
2215 Norman County East 304.39 $545,974.06 $259,611.02 $286,363.04 $14,469.90 $271,893.14 $893.24
720 Shakopee 8,982.00 $17,417,425.30 $8,548,664.68 $8,868,760.62 $854,870.64 $8,013,889.98 $892.22
2904 Tracy 803.22 $1,369,922.61 $578,874.45 $791,048.16 $74,454.45 $716,593.71 $892.15
2853 Lac Qui Parle Valley 821.29 $1,828,616.98 $1,025,841.82 $802,775.16 $74,255.01 $728,520.15 $887.04
622 North St. Paul-Maplewood Oakdale 11,521.80 $28,367,446.80 $15,443,078.05 $12,924,368.75 $2,726,262.35 $10,198,106.40 $885.11
241 Albert Lea 3,728.36 $10,689,479.02 $6,801,980.99 $3,887,498.03 $588,777.45 $3,298,720.58 $884.76
36 Kelliher 276.58 $650,904.30 $396,111.34 $254,792.96 $10,295.49 $244,497.47 $884.00
811 Wabasha-Kellogg 609.66 $1,180,901.45 $586,202.21 $594,699.24 $55,939.40 $538,759.84 $883.71
877 Buffalo-Hanover-Montrose 6,343.27 $12,727,052.32 $6,611,895.23 $6,115,157.09 $623,185.49 $5,491,971.60 $865.80
139 Rush City 944.04 $1,432,108.47 $568,190.15 $863,918.32 $50,211.29 $813,707.03 $861.94
2753 Long Prairie-Grey Eagle 984.71 $1,501,509.51 $585,270.04 $916,239.47 $67,548.51 $848,690.96 $861.87
535 Rochester 18,653.18 $44,793,373.63 $25,921,472.82 $18,871,900.81 $2,857,502.22 $16,014,398.59 $858.53
2907 Round Lake-Brewster 315.85 $164,444.99 $(122,921.15) $287,366.14 $19,183.35 $268,182.79 $849.08
277 Westonka 2,543.88 $4,537,594.12 $2,118,227.57 $2,419,366.55 $263,901.39 $2,155,465.16 $847.31
2159 Buffalo Lake-Hector 584.09 $896,783.70 $340,796.39 $555,987.31 $61,401.19 $494,586.12 $846.76
833 South Washington County 19,826.22 $41,607,179.77 $22,687,261.15 $18,919,918.62 $2,386,349.72 $16,533,568.90 $833.92
110 Waconia 4,258.35 $7,883,895.52 $4,074,573.28 $3,809,322.24 $262,437.51 $3,546,884.73 $832.92
271 Bloomington 11,388.72 $28,358,831.09 $17,006,528.56 $11,352,302.53 $1,876,749.24 $9,475,553.29 $832.01
270 Hopkins 7,429.09 $14,004,860.85 $7,094,043.15 $6,910,817.70 $745,028.22 $6,165,789.48 $829.95
659 Northfield 4,392.27 $8,816,789.25 $4,771,235.63 $4,045,553.62 $400,434.55 $3,645,119.07 $829.89
286 Brooklyn Center 2,657.96 $3,839,845.73 $1,184,100.77 $2,655,744.96 $453,885.79 $2,201,859.17 $828.40
32 Blackduck 664.62 $1,645,966.63 $1,072,117.20 $573,849.43 $25,096.04 $548,753.39 $825.66
283 St. Louis Park 5,082.66 $9,331,707.76 $4,635,623.57 $4,696,084.19 $533,656.14 $4,162,428.05 $818.95
181 Brainerd 7,118.85 $19,863,077.94 $12,888,597.82 $6,974,480.12 $1,146,622.69 $5,827,857.43 $818.65

Special Education Cross-Subsidies FY 2017 32
Number District (A) Adjusted
PU
(B) Special Education
Expenditure
(C) Categorical
Revenue
(D) Gross Cross-Subsidy (B-C)
(E) Adj. Gen Rev
for SpEd
(F) Adj. Net Cross-Subsidy (D-E)
(G) Per WADM
882 Monticello 4,443.97 $7,337,571.04 $3,272,193.58 $4,065,377.46 $429,701.89 $3,635,675.57 $818.11
911 Cambridge-Isanti 5,398.00 $10,403,798.46 $5,346,011.71 $5,057,786.75 $663,149.24 $4,394,637.51 $814.12
2905 Tri-City United 2,067.02 $3,347,331.92 $1,423,960.18 $1,923,371.74 $249,344.02 $1,674,027.72 $809.87
299 Caledonia 732.62 $1,217,096.88 $572,621.50 $644,475.38 $52,721.99 $591,753.39 $807.72
196 Rosemount-Apple Valley-Eagan 30,493.93 $71,069,327.14 $42,675,181.14 $28,394,146.00 $3,853,870.83 $24,540,275.17 $804.76
11 Anoka-Hennepin 41,870.37 $95,182,316.35 $55,864,412.45 $39,317,903.90 $5,848,219.42 $33,469,684.48 $799.36
465 Litchfield 1,703.81 $3,308,203.45 $1,825,698.66 $1,482,504.79 $135,734.97 $1,346,769.82 $790.45
192 Farmington 7,798.29 $11,984,748.59 $5,283,594.64 $6,701,153.95 $579,959.55 $6,121,194.40 $784.94
656 Faribault 4,177.47 $9,719,379.96 $5,714,065.95 $4,005,314.01 $741,750.95 $3,263,563.06 $781.23
1 Aitkin 1,281.06 $2,217,644.42 $1,154,273.29 $1,063,371.13 $65,132.32 $998,238.81 $779.23
403 Ivanhoe 152.57 $188,944.05 $52,604.55 $136,339.50 $17,518.94 $118,820.56 $778.79
138 North Branch 3,263.62 $6,361,463.77 $3,559,035.84 $2,802,427.93 $266,033.87 $2,536,394.06 $777.17
113 Walker-Akeley 802.49 $1,739,041.78 $1,061,074.63 $677,967.15 $54,935.19 $623,031.96 $776.37
309 Park Rapids 1,733.50 $2,940,465.20 $1,488,257.01 $1,452,208.19 $109,826.18 $1,342,382.01 $774.38
206 Alexandria 4,474.67 $10,011,498.51 $5,939,974.17 $4,071,524.34 $618,644.84 $3,452,879.50 $771.65
381 Lake Superior 1,506.42 $2,698,207.99 $1,460,058.25 $1,238,149.74 $80,710.14 $1,157,439.60 $768.34
2898 Westbrook-Walnut Grove 432.68 $691,754.13 $307,474.46 $384,279.67 $52,644.17 $331,635.50 $766.47
716 Belle Plaine 1,773.29 $2,858,474.23 $1,331,236.89 $1,527,237.34 $172,731.68 $1,354,505.66 $763.84
2752 Fairmont Area 1,881.20 $3,031,508.04 $1,445,898.15 $1,585,609.89 $150,595.03 $1,435,014.86 $762.82
31 Bemidji 5,512.28 $13,803,799.57 $8,693,781.78 $5,110,017.79 $940,806.51 $4,169,211.28 $756.35
2609 Win-E-Mac 459.90 $776,159.47 $410,591.98 $365,567.49 $18,032.59 $347,534.90 $755.67
390 Lake of the Woods 491.83 $919,426.01 $528,950.26 $390,475.75 $20,267.26 $370,208.49 $752.72
561 Goodridge 230.98 $513,459.25 $331,240.85 $182,218.40 $8,391.15 $173,827.25 $752.56
2311 Clearbrook-Gonvick 462.50 $816,078.51 $433,281.51 $382,797.00 $36,006.78 $346,790.22 $749.82
514 Ellsworth 164.03 $313,807.90 $178,803.20 $135,004.70 $12,100.67 $122,904.03 $749.28
6 South St. Paul 3,835.94 $6,958,505.63 $3,604,618.03 $3,353,887.60 $488,641.74 $2,865,245.86 $746.95
197 West St. Paul-Mendota Heights 5,430.14 $12,105,974.62 $7,139,999.70 $4,965,974.92 $911,514.52 $4,054,460.40 $746.66
2171 Kittson Central 280.82 $463,239.10 $248,774.14 $214,464.96 $4,882.74 $209,582.22 $746.32
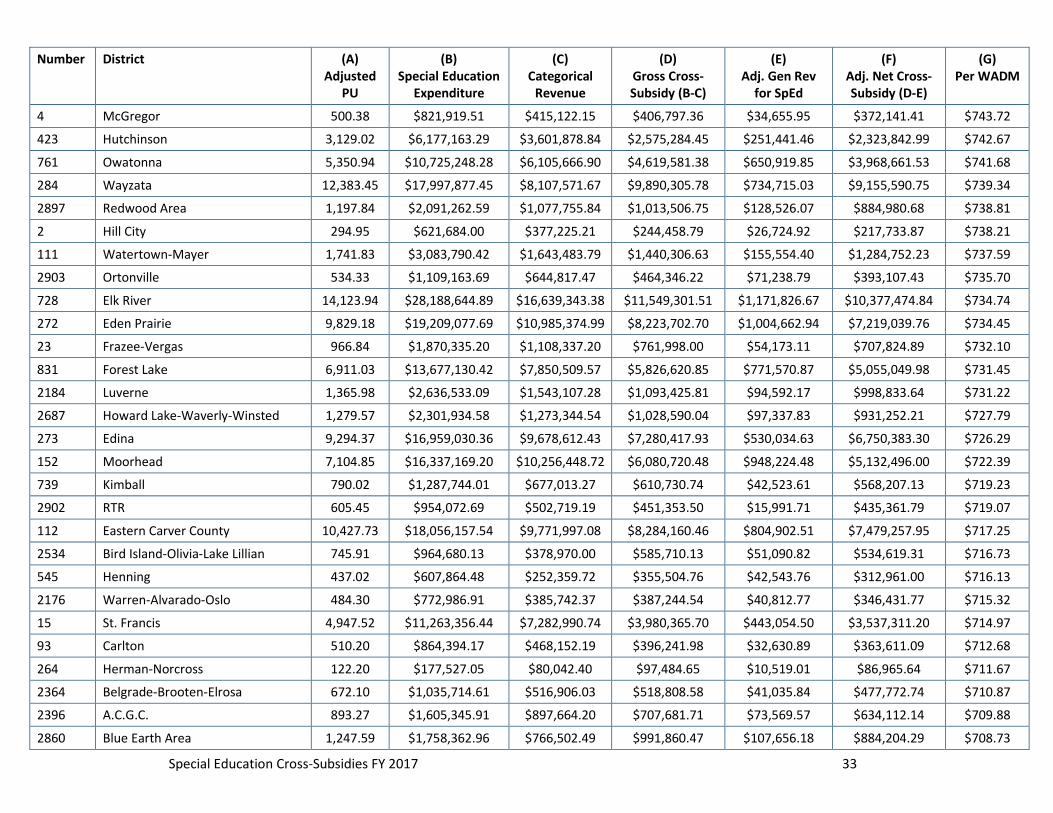
Special Education Cross-Subsidies FY 2017 33
Number District (A) Adjusted
PU
(B) Special Education
Expenditure
(C) Categorical
Revenue
(D) Gross Cross-Subsidy (B-C)
(E) Adj. Gen Rev
for SpEd
(F) Adj. Net Cross-Subsidy (D-E)
(G) Per WADM
4 McGregor 500.38 $821,919.51 $415,122.15 $406,797.36 $34,655.95 $372,141.41 $743.72
423 Hutchinson 3,129.02 $6,177,163.29 $3,601,878.84 $2,575,284.45 $251,441.46 $2,323,842.99 $742.67
761 Owatonna 5,350.94 $10,725,248.28 $6,105,666.90 $4,619,581.38 $650,919.85 $3,968,661.53 $741.68
284 Wayzata 12,383.45 $17,997,877.45 $8,107,571.67 $9,890,305.78 $734,715.03 $9,155,590.75 $739.34
2897 Redwood Area 1,197.84 $2,091,262.59 $1,077,755.84 $1,013,506.75 $128,526.07 $884,980.68 $738.81
2 Hill City 294.95 $621,684.00 $377,225.21 $244,458.79 $26,724.92 $217,733.87 $738.21
111 Watertown-Mayer 1,741.83 $3,083,790.42 $1,643,483.79 $1,440,306.63 $155,554.40 $1,284,752.23 $737.59
2903 Ortonville 534.33 $1,109,163.69 $644,817.47 $464,346.22 $71,238.79 $393,107.43 $735.70
728 Elk River 14,123.94 $28,188,644.89 $16,639,343.38 $11,549,301.51 $1,171,826.67 $10,377,474.84 $734.74
272 Eden Prairie 9,829.18 $19,209,077.69 $10,985,374.99 $8,223,702.70 $1,004,662.94 $7,219,039.76 $734.45
23 Frazee-Vergas 966.84 $1,870,335.20 $1,108,337.20 $761,998.00 $54,173.11 $707,824.89 $732.10
831 Forest Lake 6,911.03 $13,677,130.42 $7,850,509.57 $5,826,620.85 $771,570.87 $5,055,049.98 $731.45
2184 Luverne 1,365.98 $2,636,533.09 $1,543,107.28 $1,093,425.81 $94,592.17 $998,833.64 $731.22
2687 Howard Lake-Waverly-Winsted 1,279.57 $2,301,934.58 $1,273,344.54 $1,028,590.04 $97,337.83 $931,252.21 $727.79
273 Edina 9,294.37 $16,959,030.36 $9,678,612.43 $7,280,417.93 $530,034.63 $6,750,383.30 $726.29
152 Moorhead 7,104.85 $16,337,169.20 $10,256,448.72 $6,080,720.48 $948,224.48 $5,132,496.00 $722.39
739 Kimball 790.02 $1,287,744.01 $677,013.27 $610,730.74 $42,523.61 $568,207.13 $719.23
2902 RTR 605.45 $954,072.69 $502,719.19 $451,353.50 $15,991.71 $435,361.79 $719.07
112 Eastern Carver County 10,427.73 $18,056,157.54 $9,771,997.08 $8,284,160.46 $804,902.51 $7,479,257.95 $717.25
2534 Bird Island-Olivia-Lake Lillian 745.91 $964,680.13 $378,970.00 $585,710.13 $51,090.82 $534,619.31 $716.73
545 Henning 437.02 $607,864.48 $252,359.72 $355,504.76 $42,543.76 $312,961.00 $716.13
2176 Warren-Alvarado-Oslo 484.30 $772,986.91 $385,742.37 $387,244.54 $40,812.77 $346,431.77 $715.32
15 St. Francis 4,947.52 $11,263,356.44 $7,282,990.74 $3,980,365.70 $443,054.50 $3,537,311.20 $714.97
93 Carlton 510.20 $864,394.17 $468,152.19 $396,241.98 $32,630.89 $363,611.09 $712.68
264 Herman-Norcross 122.20 $177,527.05 $80,042.40 $97,484.65 $10,519.01 $86,965.64 $711.67
2364 Belgrade-Brooten-Elrosa 672.10 $1,035,714.61 $516,906.03 $518,808.58 $41,035.84 $477,772.74 $710.87
2396 A.C.G.C. 893.27 $1,605,345.91 $897,664.20 $707,681.71 $73,569.57 $634,112.14 $709.88
2860 Blue Earth Area 1,247.59 $1,758,362.96 $766,502.49 $991,860.47 $107,656.18 $884,204.29 $708.73

Special Education Cross-Subsidies FY 2017 34
Number District (A) Adjusted
PU
(B) Special Education
Expenditure
(C) Categorical
Revenue
(D) Gross Cross-Subsidy (B-C)
(E) Adj. Gen Rev
for SpEd
(F) Adj. Net Cross-Subsidy (D-E)
(G) Per WADM
318 Grand Rapids 4,328.78 $8,798,512.78 $5,076,444.14 $3,722,068.64 $654,968.44 $3,067,100.20 $708.54
671 Hills-Beaver Creek 403.00 $584,793.81 $288,472.68 $296,321.13 $12,322.46 $283,998.67 $704.71
593 Crookston 1,310.68 $2,519,800.79 $1,498,497.52 $1,021,303.27 $98,573.04 $922,730.23 $704.01
435 Waubun 684.87 $1,270,859.58 $719,242.84 $551,616.74 $69,652.80 $481,963.94 $703.73
203 Hayfield 763.09 $1,284,119.60 $646,442.84 $637,676.76 $104,066.57 $533,610.19 $699.28
2689 Pipestone-Jasper 1,232.98 $2,504,293.70 $1,522,513.29 $981,780.41 $121,409.68 $860,370.73 $697.80
2310 Sibley East 1,283.29 $1,845,234.53 $867,175.84 $978,058.69 $88,756.83 $889,301.86 $692.99
378 Dawson 593.66 $1,168,729.64 $684,537.28 $484,192.36 $72,899.58 $411,292.78 $692.81
836 Butterfield 228.39 $399,569.74 $218,354.15 $181,215.59 $23,287.81 $157,927.78 $691.48
508 St. Peter 2,301.53 $4,159,018.40 $2,221,705.80 $1,937,312.60 $360,867.26 $1,576,445.34 $684.96
2711 Mesabi East 1,033.41 $2,159,412.48 $1,336,695.72 $822,716.76 $115,177.62 $707,539.14 $684.66
314 Braham 791.92 $1,071,393.60 $490,638.28 $580,755.32 $43,508.91 $537,246.41 $678.41
12 Centennial 7,121.52 $17,989,014.10 $12,483,210.19 $5,505,803.91 $685,330.21 $4,820,473.70 $676.89
2895 Jackson County Central 1,311.06 $2,237,743.68 $1,236,212.96 $1,001,530.72 $120,515.97 $881,014.75 $671.99
482 Little Falls 2,664.54 $5,018,000.45 $2,949,237.17 $2,068,763.28 $282,816.19 $1,785,947.09 $670.26
876 Annandale 1,982.64 $3,375,055.47 $1,876,716.28 $1,498,339.19 $169,708.64 $1,328,630.55 $670.13
2180 M A C C R A Y 754.11 $1,168,497.49 $605,603.61 $562,893.88 $61,180.09 $501,713.79 $665.31
492 Austin 5,291.80 $11,103,666.93 $6,598,664.97 $4,505,001.96 $988,353.27 $3,516,648.69 $664.55
252 Cannon Falls 1,248.39 $1,841,561.44 $934,148.38 $907,413.06 $78,783.82 $828,629.24 $663.76
81 Comfrey 168.02 $329,990.83 $211,990.01 $118,000.82 $6,601.22 $111,399.60 $663.01
2149 Minnewaska 1,274.16 $5,134,331.37 $4,167,088.38 $967,242.99 $125,080.03 $842,162.96 $660.96
840 St. James 1,112.45 $1,836,640.17 $1,010,558.45 $826,081.72 $91,735.11 $734,346.61 $660.12
719 Prior Lake-Savage 9,187.09 $14,547,922.43 $7,630,596.76 $6,917,325.67 $865,515.33 $6,051,810.34 $658.73
2342 West Central Area 783.50 $1,041,938.38 $481,418.19 $560,520.19 $47,265.34 $513,254.85 $655.08
356 Lancaster 163.72 $290,798.45 $164,115.55 $126,682.90 $19,658.60 $107,024.30 $653.70
2854 Ada-Borup 587.83 $919,599.06 $485,424.53 $434,174.53 $51,440.50 $382,734.03 $651.10
2754 Cedar Mountain 515.67 $1,325,163.01 $946,706.15 $378,456.86 $43,949.88 $334,506.98 $648.68
879 Delano 2,749.91 $4,268,757.32 $2,326,691.70 $1,942,065.62 $173,163.35 $1,768,902.27 $643.26
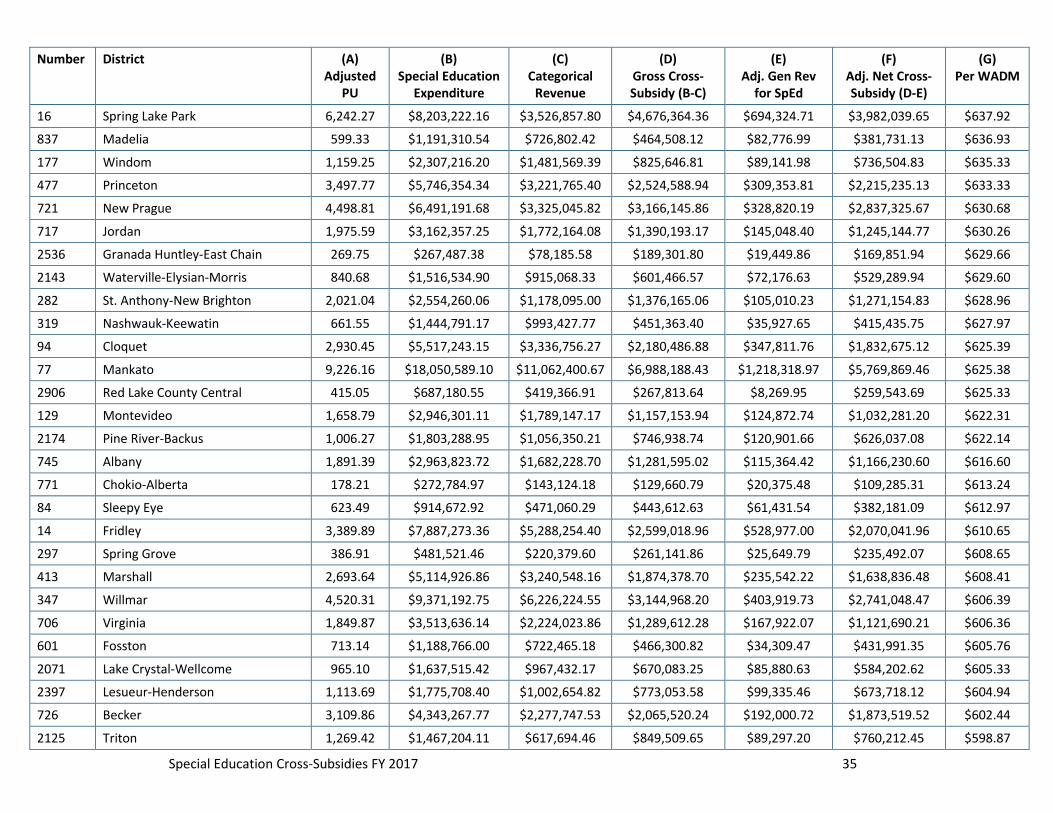
Special Education Cross-Subsidies FY 2017 35
Number District (A) Adjusted
PU
(B) Special Education
Expenditure
(C) Categorical
Revenue
(D) Gross Cross-Subsidy (B-C)
(E) Adj. Gen Rev
for SpEd
(F) Adj. Net Cross-Subsidy (D-E)
(G) Per WADM
16 Spring Lake Park 6,242.27 $8,203,222.16 $3,526,857.80 $4,676,364.36 $694,324.71 $3,982,039.65 $637.92
837 Madelia 599.33 $1,191,310.54 $726,802.42 $464,508.12 $82,776.99 $381,731.13 $636.93
177 Windom 1,159.25 $2,307,216.20 $1,481,569.39 $825,646.81 $89,141.98 $736,504.83 $635.33
477 Princeton 3,497.77 $5,746,354.34 $3,221,765.40 $2,524,588.94 $309,353.81 $2,215,235.13 $633.33
721 New Prague 4,498.81 $6,491,191.68 $3,325,045.82 $3,166,145.86 $328,820.19 $2,837,325.67 $630.68
717 Jordan 1,975.59 $3,162,357.25 $1,772,164.08 $1,390,193.17 $145,048.40 $1,245,144.77 $630.26
2536 Granada Huntley-East Chain 269.75 $267,487.38 $78,185.58 $189,301.80 $19,449.86 $169,851.94 $629.66
2143 Waterville-Elysian-Morris 840.68 $1,516,534.90 $915,068.33 $601,466.57 $72,176.63 $529,289.94 $629.60
282 St. Anthony-New Brighton 2,021.04 $2,554,260.06 $1,178,095.00 $1,376,165.06 $105,010.23 $1,271,154.83 $628.96
319 Nashwauk-Keewatin 661.55 $1,444,791.17 $993,427.77 $451,363.40 $35,927.65 $415,435.75 $627.97
94 Cloquet 2,930.45 $5,517,243.15 $3,336,756.27 $2,180,486.88 $347,811.76 $1,832,675.12 $625.39
77 Mankato 9,226.16 $18,050,589.10 $11,062,400.67 $6,988,188.43 $1,218,318.97 $5,769,869.46 $625.38
2906 Red Lake County Central 415.05 $687,180.55 $419,366.91 $267,813.64 $8,269.95 $259,543.69 $625.33
129 Montevideo 1,658.79 $2,946,301.11 $1,789,147.17 $1,157,153.94 $124,872.74 $1,032,281.20 $622.31
2174 Pine River-Backus 1,006.27 $1,803,288.95 $1,056,350.21 $746,938.74 $120,901.66 $626,037.08 $622.14
745 Albany 1,891.39 $2,963,823.72 $1,682,228.70 $1,281,595.02 $115,364.42 $1,166,230.60 $616.60
771 Chokio-Alberta 178.21 $272,784.97 $143,124.18 $129,660.79 $20,375.48 $109,285.31 $613.24
84 Sleepy Eye 623.49 $914,672.92 $471,060.29 $443,612.63 $61,431.54 $382,181.09 $612.97
14 Fridley 3,389.89 $7,887,273.36 $5,288,254.40 $2,599,018.96 $528,977.00 $2,070,041.96 $610.65
297 Spring Grove 386.91 $481,521.46 $220,379.60 $261,141.86 $25,649.79 $235,492.07 $608.65
413 Marshall 2,693.64 $5,114,926.86 $3,240,548.16 $1,874,378.70 $235,542.22 $1,638,836.48 $608.41
347 Willmar 4,520.31 $9,371,192.75 $6,226,224.55 $3,144,968.20 $403,919.73 $2,741,048.47 $606.39
706 Virginia 1,849.87 $3,513,636.14 $2,224,023.86 $1,289,612.28 $167,922.07 $1,121,690.21 $606.36
601 Fosston 713.14 $1,188,766.00 $722,465.18 $466,300.82 $34,309.47 $431,991.35 $605.76
2071 Lake Crystal-Wellcome 965.10 $1,637,515.42 $967,432.17 $670,083.25 $85,880.63 $584,202.62 $605.33
2397 Lesueur-Henderson 1,113.69 $1,775,708.40 $1,002,654.82 $773,053.58 $99,335.46 $673,718.12 $604.94
726 Becker 3,109.86 $4,343,267.77 $2,277,747.53 $2,065,520.24 $192,000.72 $1,873,519.52 $602.44
2125 Triton 1,269.42 $1,467,204.11 $617,694.46 $849,509.65 $89,297.20 $760,212.45 $598.87

Special Education Cross-Subsidies FY 2017 36
Number District (A) Adjusted
PU
(B) Special Education
Expenditure
(C) Categorical
Revenue
(D) Gross Cross-Subsidy (B-C)
(E) Adj. Gen Rev
for SpEd
(F) Adj. Net Cross-Subsidy (D-E)
(G) Per WADM
473 Isle 494.67 $769,624.86 $429,185.85 $340,439.01 $44,265.18 $296,173.83 $598.73
803 Wheaton 441.14 $773,590.59 $481,607.56 $291,983.03 $27,974.77 $264,008.26 $598.47
333 Ogilvie 530.89 $777,393.76 $394,720.85 $382,672.91 $66,300.26 $316,372.65 $595.93
507 Nicollet 410.89 $543,864.52 $285,756.00 $258,108.52 $13,773.38 $244,335.14 $594.65
2198 Fillmore Central 680.21 $1,035,225.13 $604,255.43 $430,969.70 $26,989.01 $403,980.69 $593.91
741 Paynesville 1,039.46 $1,965,762.09 $1,294,243.66 $671,518.43 $55,794.36 $615,724.07 $592.35
748 Sartell 4,218.89 $6,497,352.19 $3,823,730.45 $2,673,621.74 $186,709.73 $2,486,912.01 $589.47
2448 Martin County West 814.88 $1,210,209.42 $697,181.12 $513,028.30 $33,881.35 $479,146.95 $588.00
332 Mora 1,846.13 $2,919,898.89 $1,622,790.15 $1,297,108.74 $212,001.94 $1,085,106.80 $587.77
743 Sauk Centre 1,152.67 $1,753,341.75 $976,630.91 $776,710.84 $99,759.81 $676,951.03 $587.29
549 Perham 1,578.68 $2,569,561.29 $1,469,135.36 $1,100,425.93 $179,929.63 $920,496.30 $583.08
85 Springfield 627.00 $729,424.88 $332,351.55 $397,073.33 $31,796.83 $365,276.50 $582.58
542 Battle Lake 498.78 $518,561.15 $218,074.70 $300,486.45 $10,021.54 $290,464.91 $582.35
2172 Kenyon-Wanamingo 907.69 $1,404,130.70 $808,952.66 $595,178.04 $67,497.51 $527,680.53 $581.34
2805 Zumbrota-Mazeppa 1,295.73 $1,891,340.76 $1,065,202.30 $826,138.46 $73,107.05 $753,031.41 $581.16
821 Menahga 1,066.82 $1,479,743.34 $842,930.27 $636,813.07 $31,702.41 $605,110.66 $567.21
2527 Norman County West 280.60 $534,748.11 $334,860.04 $199,888.07 $41,449.45 $158,438.62 $564.64
553 New York Mills 801.41 $1,100,081.40 $617,239.95 $482,841.45 $30,813.65 $452,027.80 $564.04
518 Worthington 3,570.76 $6,009,685.83 $3,699,269.07 $2,310,416.76 $302,218.61 $2,008,198.15 $562.40
534 Stewartville 2,255.06 $3,283,659.21 $1,877,338.29 $1,406,320.92 $150,024.17 $1,256,296.75 $557.10
777 Benson 905.01 $1,847,622.11 $1,263,043.96 $584,578.15 $80,799.31 $503,778.84 $556.66
2169 Murray County 798.69 $1,266,666.29 $775,572.39 $491,093.90 $46,732.86 $444,361.04 $556.36
740 Melrose 1,538.20 $2,202,237.10 $1,275,246.08 $926,991.02 $72,889.90 $854,101.12 $555.26
345 New London-Spicer 1,616.80 $2,924,964.92 $1,959,653.17 $965,311.75 $69,801.34 $895,510.41 $553.88
485 Royalton 1,005.88 $1,299,916.64 $663,100.80 $636,815.84 $82,925.80 $553,890.04 $550.65
547 Parkers Prairie 613.50 $1,089,132.71 $696,430.23 $392,702.48 $55,358.63 $337,343.85 $549.87
2889 Lake Park Audubon 760.82 $829,871.24 $379,880.46 $449,990.78 $32,715.77 $417,275.01 $548.45
775 Kerkhoven-Murdock-Sunburg 756.49 $1,242,246.55 $760,602.70 $481,643.85 $66,774.69 $414,869.16 $548.41
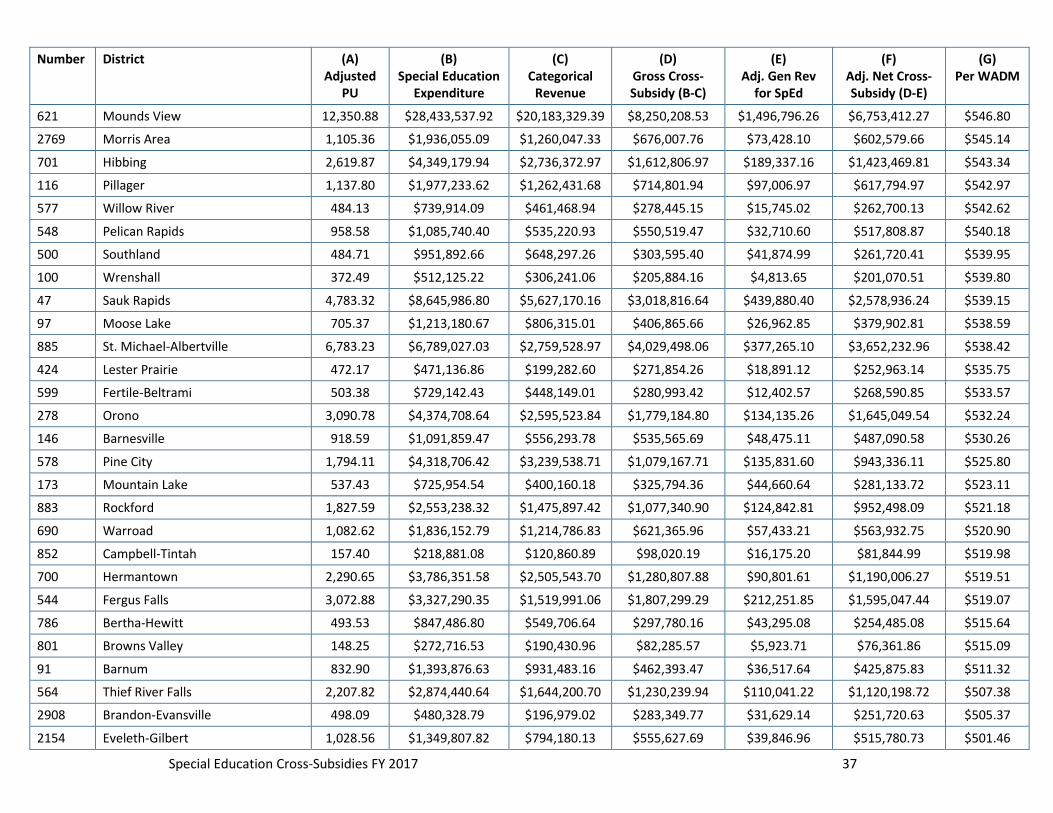
Special Education Cross-Subsidies FY 2017 37
Number District (A) Adjusted
PU
(B) Special Education
Expenditure
(C) Categorical
Revenue
(D) Gross Cross-Subsidy (B-C)
(E) Adj. Gen Rev
for SpEd
(F) Adj. Net Cross-Subsidy (D-E)
(G) Per WADM
621 Mounds View 12,350.88 $28,433,537.92 $20,183,329.39 $8,250,208.53 $1,496,796.26 $6,753,412.27 $546.80
2769 Morris Area 1,105.36 $1,936,055.09 $1,260,047.33 $676,007.76 $73,428.10 $602,579.66 $545.14
701 Hibbing 2,619.87 $4,349,179.94 $2,736,372.97 $1,612,806.97 $189,337.16 $1,423,469.81 $543.34
116 Pillager 1,137.80 $1,977,233.62 $1,262,431.68 $714,801.94 $97,006.97 $617,794.97 $542.97
577 Willow River 484.13 $739,914.09 $461,468.94 $278,445.15 $15,745.02 $262,700.13 $542.62
548 Pelican Rapids 958.58 $1,085,740.40 $535,220.93 $550,519.47 $32,710.60 $517,808.87 $540.18
500 Southland 484.71 $951,892.66 $648,297.26 $303,595.40 $41,874.99 $261,720.41 $539.95
100 Wrenshall 372.49 $512,125.22 $306,241.06 $205,884.16 $4,813.65 $201,070.51 $539.80
47 Sauk Rapids 4,783.32 $8,645,986.80 $5,627,170.16 $3,018,816.64 $439,880.40 $2,578,936.24 $539.15
97 Moose Lake 705.37 $1,213,180.67 $806,315.01 $406,865.66 $26,962.85 $379,902.81 $538.59
885 St. Michael-Albertville 6,783.23 $6,789,027.03 $2,759,528.97 $4,029,498.06 $377,265.10 $3,652,232.96 $538.42
424 Lester Prairie 472.17 $471,136.86 $199,282.60 $271,854.26 $18,891.12 $252,963.14 $535.75
599 Fertile-Beltrami 503.38 $729,142.43 $448,149.01 $280,993.42 $12,402.57 $268,590.85 $533.57
278 Orono 3,090.78 $4,374,708.64 $2,595,523.84 $1,779,184.80 $134,135.26 $1,645,049.54 $532.24
146 Barnesville 918.59 $1,091,859.47 $556,293.78 $535,565.69 $48,475.11 $487,090.58 $530.26
578 Pine City 1,794.11 $4,318,706.42 $3,239,538.71 $1,079,167.71 $135,831.60 $943,336.11 $525.80
173 Mountain Lake 537.43 $725,954.54 $400,160.18 $325,794.36 $44,660.64 $281,133.72 $523.11
883 Rockford 1,827.59 $2,553,238.32 $1,475,897.42 $1,077,340.90 $124,842.81 $952,498.09 $521.18
690 Warroad 1,082.62 $1,836,152.79 $1,214,786.83 $621,365.96 $57,433.21 $563,932.75 $520.90
852 Campbell-Tintah 157.40 $218,881.08 $120,860.89 $98,020.19 $16,175.20 $81,844.99 $519.98
700 Hermantown 2,290.65 $3,786,351.58 $2,505,543.70 $1,280,807.88 $90,801.61 $1,190,006.27 $519.51
544 Fergus Falls 3,072.88 $3,327,290.35 $1,519,991.06 $1,807,299.29 $212,251.85 $1,595,047.44 $519.07
786 Bertha-Hewitt 493.53 $847,486.80 $549,706.64 $297,780.16 $43,295.08 $254,485.08 $515.64
801 Browns Valley 148.25 $272,716.53 $190,430.96 $82,285.57 $5,923.71 $76,361.86 $515.09
91 Barnum 832.90 $1,393,876.63 $931,483.16 $462,393.47 $36,517.64 $425,875.83 $511.32
564 Thief River Falls 2,207.82 $2,874,440.64 $1,644,200.70 $1,230,239.94 $110,041.22 $1,120,198.72 $507.38
2908 Brandon-Evansville 498.09 $480,328.79 $196,979.02 $283,349.77 $31,629.14 $251,720.63 $505.37
2154 Eveleth-Gilbert 1,028.56 $1,349,807.82 $794,180.13 $555,627.69 $39,846.96 $515,780.73 $501.46
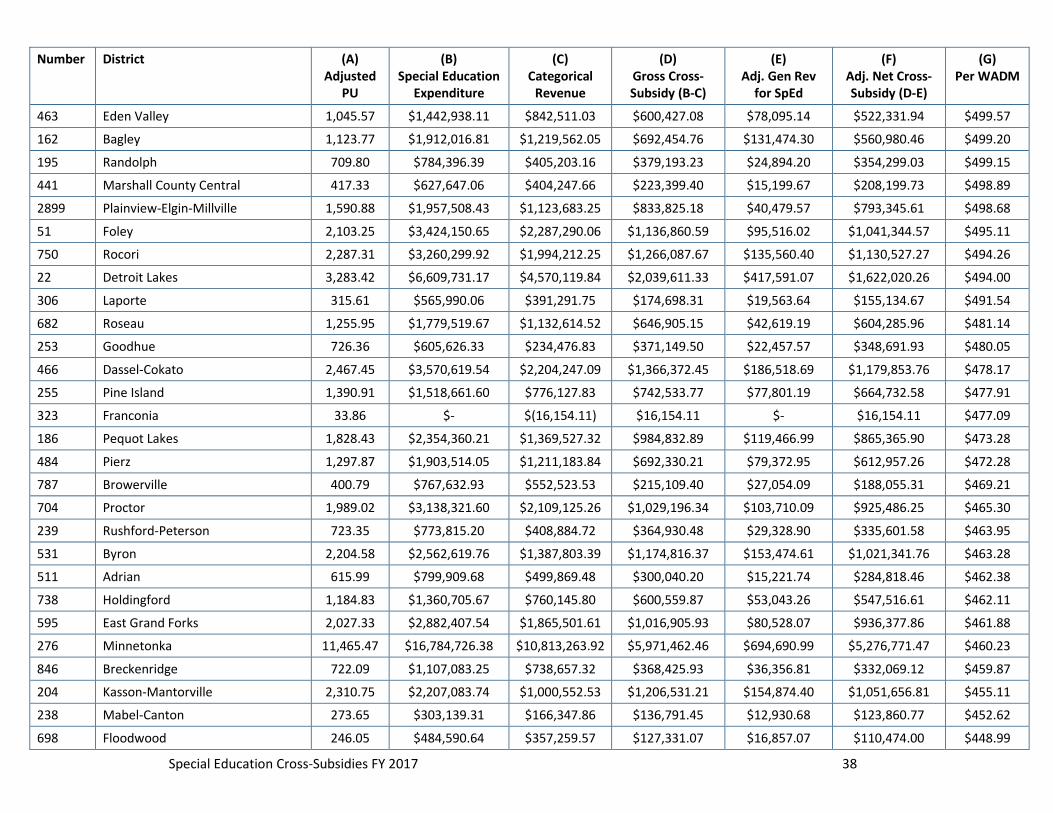
Special Education Cross-Subsidies FY 2017 38
Number District (A) Adjusted
PU
(B) Special Education
Expenditure
(C) Categorical
Revenue
(D) Gross Cross-Subsidy (B-C)
(E) Adj. Gen Rev
for SpEd
(F) Adj. Net Cross-Subsidy (D-E)
(G) Per WADM
463 Eden Valley 1,045.57 $1,442,938.11 $842,511.03 $600,427.08 $78,095.14 $522,331.94 $499.57
162 Bagley 1,123.77 $1,912,016.81 $1,219,562.05 $692,454.76 $131,474.30 $560,980.46 $499.20
195 Randolph 709.80 $784,396.39 $405,203.16 $379,193.23 $24,894.20 $354,299.03 $499.15
441 Marshall County Central 417.33 $627,647.06 $404,247.66 $223,399.40 $15,199.67 $208,199.73 $498.89
2899 Plainview-Elgin-Millville 1,590.88 $1,957,508.43 $1,123,683.25 $833,825.18 $40,479.57 $793,345.61 $498.68
51 Foley 2,103.25 $3,424,150.65 $2,287,290.06 $1,136,860.59 $95,516.02 $1,041,344.57 $495.11
750 Rocori 2,287.31 $3,260,299.92 $1,994,212.25 $1,266,087.67 $135,560.40 $1,130,527.27 $494.26
22 Detroit Lakes 3,283.42 $6,609,731.17 $4,570,119.84 $2,039,611.33 $417,591.07 $1,622,020.26 $494.00
306 Laporte 315.61 $565,990.06 $391,291.75 $174,698.31 $19,563.64 $155,134.67 $491.54
682 Roseau 1,255.95 $1,779,519.67 $1,132,614.52 $646,905.15 $42,619.19 $604,285.96 $481.14
253 Goodhue 726.36 $605,626.33 $234,476.83 $371,149.50 $22,457.57 $348,691.93 $480.05
466 Dassel-Cokato 2,467.45 $3,570,619.54 $2,204,247.09 $1,366,372.45 $186,518.69 $1,179,853.76 $478.17
255 Pine Island 1,390.91 $1,518,661.60 $776,127.83 $742,533.77 $77,801.19 $664,732.58 $477.91
323 Franconia 33.86 $- $(16,154.11) $16,154.11 $- $16,154.11 $477.09
186 Pequot Lakes 1,828.43 $2,354,360.21 $1,369,527.32 $984,832.89 $119,466.99 $865,365.90 $473.28
484 Pierz 1,297.87 $1,903,514.05 $1,211,183.84 $692,330.21 $79,372.95 $612,957.26 $472.28
787 Browerville 400.79 $767,632.93 $552,523.53 $215,109.40 $27,054.09 $188,055.31 $469.21
704 Proctor 1,989.02 $3,138,321.60 $2,109,125.26 $1,029,196.34 $103,710.09 $925,486.25 $465.30
239 Rushford-Peterson 723.35 $773,815.20 $408,884.72 $364,930.48 $29,328.90 $335,601.58 $463.95
531 Byron 2,204.58 $2,562,619.76 $1,387,803.39 $1,174,816.37 $153,474.61 $1,021,341.76 $463.28
511 Adrian 615.99 $799,909.68 $499,869.48 $300,040.20 $15,221.74 $284,818.46 $462.38
738 Holdingford 1,184.83 $1,360,705.67 $760,145.80 $600,559.87 $53,043.26 $547,516.61 $462.11
595 East Grand Forks 2,027.33 $2,882,407.54 $1,865,501.61 $1,016,905.93 $80,528.07 $936,377.86 $461.88
276 Minnetonka 11,465.47 $16,784,726.38 $10,813,263.92 $5,971,462.46 $694,690.99 $5,276,771.47 $460.23
846 Breckenridge 722.09 $1,107,083.25 $738,657.32 $368,425.93 $36,356.81 $332,069.12 $459.87
204 Kasson-Mantorville 2,310.75 $2,207,083.74 $1,000,552.53 $1,206,531.21 $154,874.40 $1,051,656.81 $455.11
238 Mabel-Canton 273.65 $303,139.31 $166,347.86 $136,791.45 $12,930.68 $123,860.77 $452.62
698 Floodwood 246.05 $484,590.64 $357,259.57 $127,331.07 $16,857.07 $110,474.00 $448.99

Special Education Cross-Subsidies FY 2017 39
Number District (A) Adjusted
PU
(B) Special Education
Expenditure
(C) Categorical
Revenue
(D) Gross Cross-Subsidy (B-C)
(E) Adj. Gen Rev
for SpEd
(F) Adj. Net Cross-Subsidy (D-E)
(G) Per WADM
858 St. Charles 1,057.33 $1,094,286.94 $570,222.04 $524,064.90 $53,394.96 $470,669.94 $445.15
2167 Lakeview 709.76 $923,967.43 $572,115.84 $351,851.59 $38,811.97 $313,039.62 $441.05
150 Hawley 1,085.54 $1,144,541.97 $603,423.20 $541,118.77 $62,921.36 $478,197.41 $440.52
2164 Dilworth-Glyndon-Felton 1,770.62 $2,353,152.38 $1,507,640.03 $845,512.35 $76,616.38 $768,895.97 $434.25
763 Medford 972.54 $956,377.00 $511,323.62 $445,053.38 $26,432.85 $418,620.53 $430.44
768 Hancock 378.05 $411,247.09 $227,623.99 $183,623.10 $21,299.29 $162,323.81 $429.37
857 Lewiston 818.29 $1,115,282.62 $720,986.55 $394,296.07 $46,239.96 $348,056.11 $425.35
242 Alden 530.77 $813,589.63 $528,530.16 $285,059.47 $63,215.76 $221,843.71 $417.97
415 Lynd 199.69 $257,816.29 $166,964.77 $90,851.52 $8,964.12 $81,887.40 $410.07
486 Swanville 322.00 $423,826.26 $280,324.44 $143,501.82 $12,048.62 $131,453.20 $408.24
2168 N.R.H.E.G. 999.78 $1,459,414.43 $955,453.87 $503,960.56 $98,355.66 $405,604.90 $405.69
497 Lyle 321.28 $522,763.51 $351,023.67 $171,739.84 $42,326.40 $129,413.44 $402.81
640 Wabasso 423.56 $414,558.67 $224,491.55 $190,067.12 $26,322.13 $163,744.99 $386.59
487 Upsala 395.67 $419,354.97 $216,385.98 $202,968.99 $50,481.17 $152,487.82 $385.39
756 Blooming Prairie 801.52 $955,878.40 $580,501.27 $375,377.13 $67,660.71 $307,716.42 $383.92
676 Badger 264.32 $306,033.05 $193,038.98 $112,994.07 $12,446.89 $100,547.18 $380.40
227 Chatfield 983.04 $859,970.36 $463,819.71 $396,150.65 $22,759.15 $373,391.50 $379.83
813 Lake City 1,374.87 $1,662,753.91 $1,068,209.60 $594,544.31 $72,367.59 $522,176.72 $379.80
361 International Falls 1,244.34 $1,410,935.05 $864,432.53 $546,502.52 $74,222.48 $472,280.04 $379.54
213 Osakis 896.25 $1,323,828.79 $941,498.10 $382,330.69 $46,175.39 $336,155.30 $375.07
829 Waseca 2,089.55 $4,132,597.50 $3,171,621.11 $960,976.39 $180,302.87 $780,673.52 $373.61
330 Heron Lake-Okabena 316.39 $509,802.46 $348,923.37 $160,879.09 $45,202.01 $115,677.08 $365.62
95 Cromwell 371.22 $431,814.52 $285,706.07 $146,108.45 $14,025.83 $132,082.62 $355.81
308 Nevis 664.26 $735,199.29 $463,777.96 $271,421.33 $37,407.91 $234,013.42 $352.29
533 Dover-Eyota 1,229.78 $1,314,168.10 $853,892.04 $460,276.06 $30,454.20 $429,821.86 $349.51
891 Canby 589.98 $650,097.23 $404,637.75 $245,459.48 $40,931.99 $204,527.49 $346.67
99 Esko 1,312.46 $1,254,555.15 $800,608.17 $453,946.98 $44,485.21 $409,461.77 $311.98
630 Red Lake Falls 388.22 $516,194.39 $366,343.64 $149,850.75 $28,808.23 $121,042.52 $311.79

Special Education Cross-Subsidies FY 2017 40
Number District (A) Adjusted
PU
(B) Special Education
Expenditure
(C) Categorical
Revenue
(D) Gross Cross-Subsidy (B-C)
(E) Adj. Gen Rev
for SpEd
(F) Adj. Net Cross-Subsidy (D-E)
(G) Per WADM
550 Underwood 623.14 $583,926.69 $384,096.80 $199,829.89 $8,468.33 $191,361.56 $307.09
362 Littlefork-Big Falls 384.61 $597,969.85 $442,892.87 $155,076.98 $37,100.73 $117,976.25 $306.74
914 Ulen-Hitterdal 332.19 $362,966.17 $242,490.50 $120,475.67 $19,855.42 $100,620.25 $302.90
818 Verndale 591.80 $880,226.90 $675,598.10 $204,628.80 $28,630.37 $175,998.43 $297.40
261 Ashby 295.65 $285,187.31 $194,349.41 $90,837.90 $5,580.32 $85,257.58 $288.37
592 Climax 230.80 $317,624.56 $246,685.15 $70,939.41 $5,608.55 $65,330.86 $283.06
2884 Red Rock Central 464.92 $423,155.86 $249,991.47 $173,164.39 $43,727.20 $129,437.19 $278.41
696 Ely 626.77 $856,627.32 $651,535.70 $205,091.62 $32,467.35 $172,624.27 $275.42
404 Lake Benton 214.44 $284,319.31 $208,451.50 $75,867.81 $19,757.94 $56,109.87 $261.66
2135 Maple River 1,049.02 $1,916,013.49 $1,547,914.76 $368,098.73 $95,954.52 $272,144.21 $259.43
402 Hendricks 123.22 $212,815.41 $171,106.97 $41,708.44 $9,900.18 $31,808.26 $258.14
363 South Koochiching 296.84 $530,574.18 $418,935.00 $111,639.18 $39,087.42 $72,551.76 $244.41
2888 Clinton-Graceville-Beardsley 379.36 $535,962.31 $414,763.98 $121,198.33 $31,514.02 $89,684.31 $236.41
294 Houston 2,213.56 $2,491,000.65 $1,892,081.21 $598,919.44 $82,606.50 $516,312.94 $233.25
850 Rothsay 314.02 $201,557.35 $118,923.60 $82,633.75 $10,110.70 $72,523.05 $230.95
600 Fisher 302.46 $418,519.57 $338,379.89 $80,139.68 $12,360.14 $67,779.54 $224.09
2835 Janesville-Waldorf-Pemberton 692.89 $1,241,347.26 $1,043,456.27 $197,890.99 $45,532.16 $152,358.83 $219.89
414 Minneota 503.34 $583,336.58 $457,505.68 $125,830.90 $15,871.92 $109,958.98 $218.46
499 Leroy 302.80 $515,130.71 $442,295.45 $72,835.26 $17,697.42 $55,137.84 $182.09
229 Lanesboro 383.04 $465,577.34 $384,047.20 $81,530.14 $11,888.66 $69,641.48 $181.81
581 Edgerton 428.62 $578,904.49 $485,790.69 $93,113.80 $25,605.88 $67,507.92 $157.50
447 Grygla 169.20 $282,781.91 $253,369.32 $29,412.59 $5,643.56 $23,769.03 $140.48
391 Cleveland 545.83 $294,316.43 $217,174.35 $77,142.08 $11,577.36 $65,564.72 $120.12
75 St. Clair 723.97 $668,596.57 $576,215.51 $92,381.06 $20,145.66 $72,235.40 $99.78
495 Grand Meadow 480.06 $560,797.72 $529,732.84 $31,064.88 $31,064.88 $- $-
712 Mountain Iron-Buhl 521.90 $962,627.53 $909,410.85 $53,216.68 $53,216.68 $- $-

Special Education Cross-Subsidies FY 2017 41
Table 5: Special Education Cross-Subsidies – Charter Schools
Number District (A) Adjusted
PU
(B) Special Education
Expenditure
(C) Categorical
Revenue
(D) Gross Cross-Subsidy (B-C)
(E) Adj. Gen Rev
for SpEd
(F) Adj. Net Cross-Subsidy (D-E)
(G) Per WADM
1001 Crosswind Arts and Science Academy 146.75 $559,633.00 $414,612.32 $145,020.68 $8,027.87 $136,992.81 $933.51
4000 City Academy 163.72 $- $- $- $- $- $-
4001 Bluffview Montessori 207.17 $250,325.53 $239,788.15 $10,537.38 $287.45 $10,249.93 $49.48
4003 New Heights 147.77 $234,392.28 $225,880.60 $8,511.68 $485.86 $8,025.82 $54.31
4004 Cedar Riverside Community 193.45 $493,087.94 $457,744.44 $35,343.50 $13,343.82 $21,999.68 $113.72
4005 Metro Deaf School 33.96 $4,577,264.64 $4,525,531.54 $51,733.10 $51,733.10 $- $-
4007 Minnesota New Country School 240.68 $490,994.00 $448,994.72 $41,999.28 $11,860.52 $30,138.76 $125.22
4008 PACT Charter School 680.73 $1,096,439.16 $1,044,793.23 $51,645.93 $10,881.99 $40,763.94 $59.88
4011 Athlos Leadership Academy 979.78 $1,629,612.54 $1,627,929.01 $1,683.53 $1,683.53 $0.00 $-
4015 Community of Peace Academy 835.05 $1,302,982.04 $1,185,700.12 $117,281.92 $38,047.55 $79,234.37 $94.89
4016 World Learner Charter 217.66 $371,437.16 $368,508.93 $2,928.23 $(0.00) $2,928.23 $13.45
4017 Minnesota Transitions 3,588.43 $2,994,754.36 $2,745,533.14 $249,221.22 $249,221.22 $- $-
4018 Achieve Language Academy 463.23 $393,749.60 $375,498.62 $18,250.98 $3,538.52 $14,712.46 $31.76
4020 Duluth Public Schools Academy 1,469.16 $5,956,389.25 $5,415,848.53 $540,540.72 $187,543.51 $352,997.21 $240.27
4025 Cyber Village Academy 282.00 $694,929.76 $659,261.82 $35,667.94 $10,627.10 $25,040.84 $88.80
4026 E.C.H.O. Charter School 118.26 $133,745.84 $124,371.28 $9,374.56 $4,535.93 $4,838.63 $40.92
4027 Higher Ground Academy 808.52 $353,682.33 $333,085.29 $20,597.04 $10,516.74 $10,080.30 $12.47
4029 St. Paul City School 469.40 $906,278.65 $848,176.13 $58,102.52 $27,769.29 $30,333.23 $64.62
4030 Odyssey Charter School 319.58 $546,974.20 $496,569.66 $50,404.54 $894.08 $49,510.46 $154.92
4031 Jennings Community School 103.78 $85,325.69 $80,516.03 $4,809.66 $3,198.51 $1,611.15 $15.52
4032 Harvest Preparatory School 283.87 $1,197,157.70 $1,151,373.45 $45,784.25 $22,245.70 $23,538.55 $82.92
4035 Life Prep 304.22 $1,037,818.88 $984,794.26 $53,024.62 $1,722.58 $51,302.04 $168.63
4036 Face to Face Academy 92.95 $287,837.50 $272,394.89 $15,442.61 $7,252.36 $8,190.25 $88.11
4038 Sojourner Truth Academy 396.06 $1,527,344.82 $1,418,033.20 $109,311.62 $19,560.48 $89,751.14 $226.61
4039 High School For Recording Arts 394.78 $1,087,613.55 $1,014,101.65 $73,511.90 $581.74 $72,930.16 $184.74
4043 Math and Science Academy 544.40 $565,771.78 $531,835.27 $33,936.51 $4,222.34 $29,714.17 $54.58

Special Education Cross-Subsidies FY 2017 42
Number District (A) Adjusted
PU
(B) Special Education
Expenditure
(C) Categorical
Revenue
(D) Gross Cross-Subsidy (B-C)
(E) Adj. Gen Rev
for SpEd
(F) Adj. Net Cross-Subsidy (D-E)
(G) Per WADM
4049 Northwest Passage High School 210.87 $680,403.63 $631,396.80 $49,006.83 $- $49,006.83 $232.40
4050 Lafayette Public Charter 93.40 $110,769.66 $108,172.07 $2,597.59 $1,554.78 $1,042.81 $11.16
4053 North Lakes Charter School 446.35 $519,026.51 $491,737.68 $27,288.83 $- $27,288.83 $61.14
4054 La Crescent Montessori and STEM 62.08 $121,677.18 $119,145.93 $2,531.25 $- $2,531.25 $40.77
4055 Nerstrand Charter School 152.45 $313,189.69 $287,825.77 $25,363.92 $3,753.51 $21,610.41 $141.75
4056 Rosa Parks Charter High School 104.93 $269,917.22 $253,360.42 $16,556.80 $(0.00) $16,556.80 $157.79
4057 El Colegio Charter School 103.92 $230,073.81 $210,617.70 $19,456.11 $7,448.79 $12,007.32 $115.54
4058 Schoolcraft Learning 195.50 $828,459.16 $798,846.84 $29,612.32 $7,677.31 $21,935.01 $112.20
4059 Crosslake Community Charter 217.55 $494,059.32 $465,368.42 $28,690.90 $3,338.46 $25,352.44 $116.54
4064 Riverway Learning Community 101.50 $237,732.85 $231,694.14 $6,038.71 $397.94 $5,640.77 $55.57
4066 Kato Charter 88.29 $188,888.69 $181,361.60 $7,527.09 $- $7,527.09 $85.25
4067 Aurora Charter School 424.64 $626,281.53 $581,708.21 $44,573.32 $8,784.03 $35,789.29 $84.28
4068 Excell Charter 389.08 $968,557.97 $934,595.53 $33,962.44 $18,359.81 $15,602.63 $40.10
4070 Hope Academy Charter 529.34 $523,000.30 $477,573.07 $45,427.23 $369.77 $45,057.46 $85.12
4073 Academia Cesar Chavez Charter 445.15 $669,307.10 $621,154.45 $48,152.65 $26,261.48 $21,891.17 $49.18
4074 AFSA High School 421.65 $1,362,785.97 $1,306,758.97 $56,027.00 $9,148.27 $46,878.73 $111.18
4075 Avalon School 258.24 $1,023,385.75 $1,005,009.24 $18,376.51 $9,829.31 $8,547.20 $33.10
4077 Twin Cities International 599.10 $534,270.76 $497,145.42 $37,125.34 $4,399.15 $32,726.19 $54.63
4078 Minnesota International Middle 476.71 $591,798.32 $558,674.11 $33,124.21 $12,200.88 $20,923.33 $43.89
4079 Friendship Academy of Fine Arts 159.59 $317,148.85 $278,604.97 $38,543.88 $- $38,543.88 $241.52
4080 Pillager Area Charter 52.95 $65,885.95 $63,910.06 $1,975.89 $- $1,975.89 $37.32
4081 Discovery 71.32 $175,023.78 $161,957.79 $13,065.99 $6,614.64 $6,451.35 $90.46
4082 BlueSky Charter 580.12 $601,652.06 $546,016.85 $55,635.21 $33,844.19 $21,791.02 $37.56
4083 Ridgeway Community 99.51 $144,906.38 $137,860.08 $7,046.30 $724.12 $6,322.18 $63.53
4084 North Shore Community 367.61 $394,121.69 $351,462.12 $42,659.57 $10,799.56 $31,860.01 $86.67
4085 Harbor City International 256.23 $567,004.80 $534,769.84 $32,234.96 $1,303.39 $30,931.57 $120.72
4087 Sage Academy 90.10 $421,999.11 $389,340.20 $32,658.91 $2,245.64 $30,413.27 $337.55
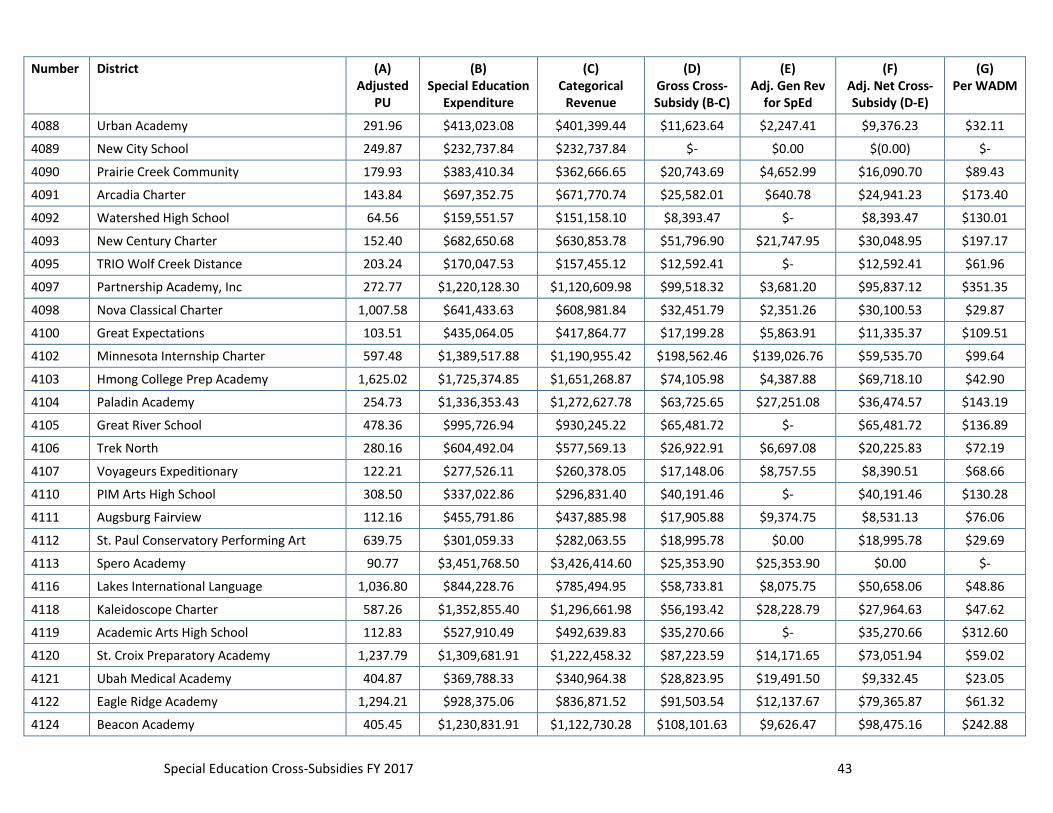
Special Education Cross-Subsidies FY 2017 43
Number District (A) Adjusted
PU
(B) Special Education
Expenditure
(C) Categorical
Revenue
(D) Gross Cross-Subsidy (B-C)
(E) Adj. Gen Rev
for SpEd
(F) Adj. Net Cross-Subsidy (D-E)
(G) Per WADM
4088 Urban Academy 291.96 $413,023.08 $401,399.44 $11,623.64 $2,247.41 $9,376.23 $32.11
4089 New City School 249.87 $232,737.84 $232,737.84 $- $0.00 $(0.00) $-
4090 Prairie Creek Community 179.93 $383,410.34 $362,666.65 $20,743.69 $4,652.99 $16,090.70 $89.43
4091 Arcadia Charter 143.84 $697,352.75 $671,770.74 $25,582.01 $640.78 $24,941.23 $173.40
4092 Watershed High School 64.56 $159,551.57 $151,158.10 $8,393.47 $- $8,393.47 $130.01
4093 New Century Charter 152.40 $682,650.68 $630,853.78 $51,796.90 $21,747.95 $30,048.95 $197.17
4095 TRIO Wolf Creek Distance 203.24 $170,047.53 $157,455.12 $12,592.41 $- $12,592.41 $61.96
4097 Partnership Academy, Inc 272.77 $1,220,128.30 $1,120,609.98 $99,518.32 $3,681.20 $95,837.12 $351.35
4098 Nova Classical Charter 1,007.58 $641,433.63 $608,981.84 $32,451.79 $2,351.26 $30,100.53 $29.87
4100 Great Expectations 103.51 $435,064.05 $417,864.77 $17,199.28 $5,863.91 $11,335.37 $109.51
4102 Minnesota Internship Charter 597.48 $1,389,517.88 $1,190,955.42 $198,562.46 $139,026.76 $59,535.70 $99.64
4103 Hmong College Prep Academy 1,625.02 $1,725,374.85 $1,651,268.87 $74,105.98 $4,387.88 $69,718.10 $42.90
4104 Paladin Academy 254.73 $1,336,353.43 $1,272,627.78 $63,725.65 $27,251.08 $36,474.57 $143.19
4105 Great River School 478.36 $995,726.94 $930,245.22 $65,481.72 $- $65,481.72 $136.89
4106 Trek North 280.16 $604,492.04 $577,569.13 $26,922.91 $6,697.08 $20,225.83 $72.19
4107 Voyageurs Expeditionary 122.21 $277,526.11 $260,378.05 $17,148.06 $8,757.55 $8,390.51 $68.66
4110 PIM Arts High School 308.50 $337,022.86 $296,831.40 $40,191.46 $- $40,191.46 $130.28
4111 Augsburg Fairview 112.16 $455,791.86 $437,885.98 $17,905.88 $9,374.75 $8,531.13 $76.06
4112 St. Paul Conservatory Performing Art 639.75 $301,059.33 $282,063.55 $18,995.78 $0.00 $18,995.78 $29.69
4113 Spero Academy 90.77 $3,451,768.50 $3,426,414.60 $25,353.90 $25,353.90 $0.00 $-
4116 Lakes International Language 1,036.80 $844,228.76 $785,494.95 $58,733.81 $8,075.75 $50,658.06 $48.86
4118 Kaleidoscope Charter 587.26 $1,352,855.40 $1,296,661.98 $56,193.42 $28,228.79 $27,964.63 $47.62
4119 Academic Arts High School 112.83 $527,910.49 $492,639.83 $35,270.66 $- $35,270.66 $312.60
4120 St. Croix Preparatory Academy 1,237.79 $1,309,681.91 $1,222,458.32 $87,223.59 $14,171.65 $73,051.94 $59.02
4121 Ubah Medical Academy 404.87 $369,788.33 $340,964.38 $28,823.95 $19,491.50 $9,332.45 $23.05
4122 Eagle Ridge Academy 1,294.21 $928,375.06 $836,871.52 $91,503.54 $12,137.67 $79,365.87 $61.32
4124 Beacon Academy 405.45 $1,230,831.91 $1,122,730.28 $108,101.63 $9,626.47 $98,475.16 $242.88

Special Education Cross-Subsidies FY 2017 44
Number District (A) Adjusted
PU
(B) Special Education
Expenditure
(C) Categorical
Revenue
(D) Gross Cross-Subsidy (B-C)
(E) Adj. Gen Rev
for SpEd
(F) Adj. Net Cross-Subsidy (D-E)
(G) Per WADM
4126 Prairie Seeds Academy 795.81 $668,412.72 $586,853.30 $81,559.42 $16,421.00 $65,138.42 $81.85
4127 Team Academy 108.70 $295,078.55 $293,389.79 $1,688.76 $1,688.76 $(0.00) $-
4131 Metro Schools Charter 375.29 $886,182.84 $838,572.04 $47,610.80 $15,216.90 $32,393.90 $86.32
4132 Twin City Academy 694.77 $1,250,163.21 $1,156,975.82 $93,187.39 $471.13 $92,716.26 $133.45
4135 Rochester Math and Science 357.36 $885,131.87 $826,681.68 $58,450.19 $12,388.66 $46,061.53 $128.89
4137 Swan River Montessori 157.87 $587,684.96 $533,885.35 $53,799.61 $19,984.31 $33,815.30 $214.20
4138 Milroy Area Charter 43.54 $41,506.06 $39,009.98 $2,496.08 $(0.00) $2,496.08 $57.33
4139 LoveWorks Academy for Arts 196.01 $732,627.69 $708,031.01 $24,596.68 $(0.00) $24,596.68 $125.49
4140 Yinghua Academy 822.01 $537,717.93 $508,228.68 $29,489.25 $3,735.98 $25,753.27 $31.33
4142 Stride Academy 687.99 $1,091,038.51 $983,475.74 $107,562.77 $24,727.09 $82,835.68 $120.40
4143 New Millennium 685.59 $1,055,792.25 $995,856.56 $59,935.69 $9,120.35 $50,815.34 $74.12
4144 Green Isle Community 65.46 $203,113.21 $192,034.58 $11,078.63 $1,775.15 $9,303.48 $142.12
4145 Birch Grove Community 28.00 $130,432.24 $101,073.18 $29,359.06 $- $29,359.06 $1,048.54
4146 Northern Lights Community 121.58 $708,520.09 $668,786.35 $39,733.74 $3,431.58 $36,302.16 $298.59
4150 Minnesota Online High School 174.59 $259,067.56 $223,826.31 $35,241.25 $34,054.60 $1,186.65 $6.80
4151 EdVisions Off Campus 130.98 $260,125.21 $246,131.69 $13,993.52 $- $13,993.52 $106.84
4152 Twin Cities German Immersion 530.44 $852,036.33 $793,582.47 $58,453.86 $11,044.95 $47,408.91 $89.38
4153 Dugsi Academy 301.63 $751,617.04 $689,504.62 $62,112.42 $24,120.36 $37,992.06 $125.96
4155 Naytahwaush Community 99.11 $393,832.50 $386,947.07 $6,885.43 $2,042.91 $4,842.52 $48.86
4159 Seven Hills Prep Academy 842.03 $1,372,506.85 $1,245,196.43 $127,310.42 $8,539.49 $118,770.93 $141.05
4160 Spectrum High School 769.98 $577,536.13 $554,910.62 $22,625.51 $- $22,625.51 $29.38
4161 New Discoveries Montessori 153.48 $1,526,386.80 $1,471,844.60 $54,542.20 $9,989.20 $44,553.00 $290.29
4162 Southside Family Charter 119.72 $417,405.55 $391,634.21 $25,771.34 $4,072.35 $21,698.99 $181.25
4163 Learning for Leadership 266.90 $762,072.00 $697,653.80 $64,418.20 $526.35 $63,891.85 $239.38
4164 Laura Jeffrey Academy 130.96 $635,551.96 $623,998.54 $11,553.42 $(0.00) $11,553.42 $88.22
4166 East Range Acad-Tech and Science 173.71 $399,517.45 $369,955.24 $29,562.21 $21,458.12 $8,104.09 $46.65
4167 International Spanish Language 315.03 $217,265.82 $205,331.04 $11,934.78 $1,178.44 $10,756.34 $34.14

Special Education Cross-Subsidies FY 2017 45
Number District (A) Adjusted
PU
(B) Special Education
Expenditure
(C) Categorical
Revenue
(D) Gross Cross-Subsidy (B-C)
(E) Adj. Gen Rev
for SpEd
(F) Adj. Net Cross-Subsidy (D-E)
(G) Per WADM
4168 Glacial Hills Elementary 112.69 $168,533.53 $166,625.49 $1,908.04 $1,908.04 $0.00 $-
4169 Stonebridge Community School 239.79 $1,056,870.72 $1,025,613.88 $31,256.84 $8,737.07 $22,519.77 $93.91
4170 Hiawatha Leadership 1,280.04 $2,174,833.47 $2,020,198.99 $154,634.48 $22,575.59 $132,058.89 $103.17
4171 Noble Academy 801.18 $174,060.00 $174,060.00 $- $- $- $-
4172 Clarkfield Charter School 52.84 $99,526.11 $97,217.27 $2,308.84 $(0.00) $2,308.84 $43.69
4177 Minisinaakwaang Leadership 31.56 $196,204.83 $189,849.95 $6,354.88 $6,354.88 $- $-
4178 Lincoln International 179.48 $133,538.01 $127,996.04 $5,541.97 $0.00 $5,541.97 $30.88
4181 Community School of Excellence 964.17 $811,922.29 $791,609.91 $20,312.38 $3,910.73 $16,401.65 $17.01
4183 Lionsgate Academy 221.19 $7,428,453.52 $7,194,641.01 $233,812.51 $233,812.51 $(0.00) $-
4184 Aspen Academy 497.07 $679,928.28 $633,354.19 $46,574.09 $4,317.39 $42,256.70 $85.01
4185 DaVinci Academy 457.00 $750,241.25 $707,929.87 $42,311.38 $6,026.18 $36,285.20 $79.40
4186 Global Academy 442.30 $1,090,955.28 $671,540.02 $419,415.26 $4,925.25 $414,490.01 $937.12
4187 Natural Science Academy 77.64 $131,907.12 $130,733.10 $1,174.02 $(0.00) $1,174.02 $15.12
4188 Cologne Academy 628.96 $1,642,911.70 $1,571,913.91 $70,997.79 $46,745.58 $24,252.21 $38.56
4189 Bright Water Elementary 176.67 $909,123.09 $909,123.09 $- $(0.00) $0.00 $-
4190 Rivers Edge Academy 81.68 $402,915.08 $386,876.44 $16,038.64 $7,151.95 $8,886.69 $108.80
4191 KIPP Minnesota Charter 258.94 $1,112,859.70 $1,064,664.29 $48,195.41 $11,352.44 $36,842.97 $142.28
4192 Best Academy 715.80 $2,801,613.63 $2,605,672.28 $195,941.35 $77,449.81 $118,491.54 $165.54
4193 College Preparatory Elementary 355.97 $1,609,895.66 $1,546,236.05 $63,659.61 $10,587.40 $53,072.21 $149.09
4194 Cannon River STEM School 358.06 $420,306.33 $410,112.01 $10,194.32 $1,926.25 $8,268.07 $23.09
4195 Oshki Ogimaag Charter 25.26 $139,338.84 $129,994.17 $9,344.67 $1,574.30 $7,770.37 $307.62
4198 Discovery Woods Montessori 90.85 $158,844.31 $158,699.35 $144.96 $144.96 $(0.00) $-
4199 Parnassus Preparatory 1,036.49 $820,894.58 $782,605.31 $38,289.27 $7,504.47 $30,784.80 $29.70
4200 STEP Academy Charter 295.22 $104,554.50 $96,584.08 $7,970.42 $- $7,970.42 $27.00
4201 Cornerstone Montessori Elementary 131.74 $502,632.31 $472,065.51 $30,566.80 $1,591.59 $28,975.21 $219.94
4204 Rochester STEM Academy 112.30 $151,415.09 $132,433.80 $18,981.29 $17,849.09 $1,132.20 $10.08
4205 Hennepin Elementary School 338.28 $816,380.00 $797,900.67 $18,479.33 $13,393.66 $5,085.67 $15.03

Special Education Cross-Subsidies FY 2017 46
Number District (A) Adjusted
PU
(B) Special Education
Expenditure
(C) Categorical
Revenue
(D) Gross Cross-Subsidy (B-C)
(E) Adj. Gen Rev
for SpEd
(F) Adj. Net Cross-Subsidy (D-E)
(G) Per WADM
4207 Vermillion Country School 47.99 $126,192.89 $123,225.51 $2,967.38 $2,425.94 $541.44 $11.28
4208 Nasha Shkola Charter 101.80 $98,242.38 $85,499.98 $12,742.40 $- $12,742.40 $125.17
4209 Mastery School 157.65 $964,265.22 $923,162.60 $41,102.62 $5,099.28 $36,003.34 $228.38
4210 Upper Mississippi Academy 279.02 $716,465.48 $678,713.68 $37,751.80 $(0.00) $37,751.80 $135.30
4212 West Side Summit School 161.94 $771,981.68 $711,974.76 $60,006.92 $14,588.37 $45,418.55 $280.47
4213 Prodeo Academy 280.84 $852,594.96 $732,720.39 $119,874.57 $646.18 $119,228.39 $424.54
4215 Sejong Academy of Minnesota 122.75 $108,653.03 $106,152.65 $2,500.38 $0.00 $2,500.38 $20.37
4216 Freedom Academy Charter School 20.72 $82,664.86 $80,585.83 $2,079.03 $2,079.03 $- $-
4217 Technical Academies of Minnesota 179.49 $377,336.24 $362,898.72 $14,437.52 $6,518.97 $7,918.55 $44.12
4218 Venture Academy 293.65 $1,568,962.90 $1,363,005.07 $205,957.83 $36,191.34 $169,766.49 $578.13
4219 Northeast College Prep 259.28 $746,341.10 $692,497.99 $53,843.11 $5,613.02 $48,230.09 $186.02
4220 Agamim Classical Academy 161.42 $645,582.48 $568,766.63 $76,815.85 $7,869.89 $68,945.96 $427.12
4221 Discovery Charter School 189.33 $153,361.22 $146,207.75 $7,153.47 $6,034.72 $1,118.75 $5.91
4223 Saint Cloud Math and Science Academy 171.67 $169,688.37 $161,854.87 $7,833.50 $- $7,833.50 $45.63
4224 Star of the North Academy Charter 160.57 $61,336.40 $55,755.18 $5,581.22 $884.03 $4,697.19 $29.25
4225 Universal Academy Charter School 287.68 $303,357.61 $287,408.64 $15,948.97 $4,821.36 $11,127.61 $38.68
4226 Bdote Learning Center 76.25 $302,008.58 $220,401.66 $81,606.92 $4,620.62 $76,986.30 $1,009.66
4227 Art and Science Academy 261.04 $543,142.53 $520,637.16 $22,505.37 $0.00 $22,505.37 $86.21
4228 Woodbury Leadership Academy 252.67 $259,512.06 $257,627.78 $1,884.28 $1,756.65 $127.63 $0.51
4229 Jane Goodall Environmental Science 114.55 $566,758.86 $508,687.99 $58,070.87 $7,144.52 $50,926.35 $444.58
4230 Minnesota Excellence in Learning 197.72 $507,835.90 $455,593.00 $52,242.90 $9,536.57 $42,706.33 $215.99
4231 Minnesota Math and Science Academy 477.16 $310,509.00 $278,451.12 $32,057.88 $5,309.36 $26,748.52 $56.06
4232 Summit Charter School 66.99 $192,446.80 $181,459.81 $10,986.99 $- $10,986.99 $164.01
4233 Level Up Academy 85.73 $655,382.53 $602,208.67 $53,173.86 $8,305.03 $44,868.83 $523.37
4235 Flex Academy 81.14 $224,957.23 $219,449.62 $5,507.61 $25.07 $5,482.54 $67.57
4237 Metro Ed for Future Employment 98.07 $153,152.20 $131,487.50 $21,664.70 $20,395.72 $1,268.98 $12.94
4238 Rochester Beacon Academy 116.81 $1,394,152.51 $1,375,468.81 $18,683.70 $18,683.70 $(0.00) $-

Special Education Cross-Subsidies FY 2017 47
Number District (A) Adjusted
PU
(B) Special Education
Expenditure
(C) Categorical
Revenue
(D) Gross Cross-Subsidy (B-C)
(E) Adj. Gen Rev
for SpEd
(F) Adj. Net Cross-Subsidy (D-E)
(G) Per WADM
4239 Tesfa International School 130.95 $345,852.62 $312,728.82 $33,123.80 $10,936.77 $22,187.03 $169.43
4240 New Century School 104.52 $1,333.25 $1,333.25 $- $- $- $-
4243 North Metro Flex Academy 154.25 $411,532.63 $387,923.44 $23,609.19 $6,757.81 $16,851.38 $109.25
4248 T.R.U.T.H. Preparatory Academy 119.15 $- $- $- $- $- $-
4249 Sankofa Underground North Academy 38.64 $53,252.27 $53,252.27 $- $- $- $-
4250 Athlos Academy of Saint Cloud 478.17 $344,966.54 $333,194.06 $11,772.48 $9,009.25 $2,763.23 $5.78

Special Education Cross-Subsidies FY 2017 48
Appendix C
Special Education Cross-Subsidies Report, FY 2017
Data Sources
Line 1 – Adjusted General Education Revenue per Adjusted Pupil Unit (Current Year) for Cross-Subsidy Computation
The amount shown on this line was computed as explained in detail in Appendix A.
Line 2 – Adjusted Pupil Units (Current Year) By Special Education Federal Settings
The settings are defined as follows:
• Early Childhood Special Education – Learners receiving services through early childhood special educationprograms generate at least .28 Full-Time Equivalent (FTE).
• Setting I – Learners receiving the majority of their education program in regular class. Includes childrenand youth with disabilities, receiving special education and related services outside the regular classroomfor less than 21 percent of the school day.
• Setting II – Learners receiving education programs in a resource room. Includes children and youth withdisabilities receiving special education and related services outside the regular classroom for 60 percentor less of the school day and at least 21 percent of the school day.
• Setting III – Learners receiving education programs in separate class. Includes children and youth withdisabilities receiving special education and related services outside the regular classroom for more than 60percent of the school day. Does not include pupils who received education programs in public or privateseparate day or residential facilities.
• Setting IV – Learners receiving education programs in public separate day school facilities. Includeschildren and youth with disabilities receiving special education and related services for greater than 50percent of the school day in separate facilities.
• Setting V – Learners receiving education programs in private separate day school facilities at publicexpense for greater than 50 percent of the school day.
• Setting VI – Learners receiving education programs in public residential facilities for greater than 50percent of the school day.
• Setting VII – Learners receiving education programs in private residential facilities at public expense forgreater than 50 percent of the school day.
• Setting VIII – Learners receiving education programs in homebound/hospital placement. Includes childrenand youth with disabilities placed in and receiving education in hospital programs or homeboundprograms.
The data showing Adjusted Pupil Unit (PU) by special education setting are based on pupil data from MARSS, adjusted for the grade level weighting factors (1.00 for EC to elementary and 1.20 for secondary students) to determine the Adjusted Weight Pupil Unit (AWPU).

Special Education Cross-Subsidies FY 2017 49
Changes to the AWPU by setting were made only by changing the special education settings for individual students on MARSS.
Line 3 – Percent of School Day Students Spend In Special Education Settings
The percentages shown on the report are MDE estimates based on the midpoints for each federal setting. For example, the 10 percent assumption for Setting I is the midpoint of the range for Setting 1 (0 percent to 20 percent).
Line 4 – General Education Revenue Attributable to Special Education Students for the Time They Spend In Special Education
This was calculated as shown.
Line 5 – Special Education Expenditures
These data are reported on SEDRA, as summarized on reports sent to districts and as explained in Appendix A. They include the costs reported on SEDRA under Funding Source Codes “A”, “E”, “i”, “j”, “R”, “a”, “m” and Access to Career Technical Education for Students with a Disability (formerly called Transition Disabled)
Line 6 – Transportation Expenditures This is the district’s FY 2016 expenditure for special education transportation, as reported to MDE under finance code 723, excluding finance code 728, through UFARS and special education bus and van depreciation as reported to MDE as of December 15, 2016.
Line 7 – Total Special Education Expenditure
This was calculated as shown.
Lines 8-18 – Special Education Categorical Revenues These amounts were calculated using the data shown above. The aid entitlement reports available on MDE’s webpage, show the aid computations for several of the component formulas. This also shows the aids received for ADSIS and FIN 728 being backed out of the total eligible aid.
Lines 19-21 – General Education Cross-Subsidy of Special Education
These amounts were calculated as shown.