Embed Size (px)
Citation preview
Europeans and Biotechnology in 2002
Eurobarometer 58.0(2nd Edition: March 21st 2003)
A report to the EC Directorate General for Research from the project 'LifeSciences in European Society' QLG7-CT-1999-00286
by
George Gaskell*, Nick Allum and Sally Stares(Methodology Institute, London School of Economics, London WC2A 2AE, UK)
with
Martin W. Bauer, Nicola Lindsay and Morag Brocklehurst (UK)Wolfgang Wagner, Helge Torgersen, Nicole Kronberger and Petra Grabner (Austria)Erling Jelsøe, Arne Mortensen, Jesper Lassen and Mercy Wambui Kamara (Denmark)Timo Rusanen and Maria Rusanen (Finland)Daniel Boy, Suzanne de Cheveigne, Julie Bardes and Jacqueline Chervin (France)Jürgen Hampel, Matthias Kohring and Joerg Matthes (Germany)Giorgos Sakellaris and Aglaia Chatjouli (Greece)Agnes Allansdottir and Francesca Matteuci (Italy)Cees Midden, Anneleos Meijnders and Jan Gutteling (Netherlands)Torben Hviid Nielsen and Siv Froydis Berg (Norway)Tomasz Twardowski and Andrzej Przestalski (Poland)Correia Jesuino, Carmen Diego (Portugal)Björn Fjæstad, Susanna Ohman and Anna Olofsson (Sweden)Heinz Bonfadelli and Urs Dahinden and Martina Leonarz (Switzerland)
and North American associatesEdna Einsiedel and Robin Downey (Canada)Toby Ten Eyck and Susanna Priest (USA)
The Eurobarometer survey was managed and organised by Directorate General Press andCommunication, Public Opinion Analysis Unit.
Disclaimer: The opinions expressed in this report do not represent those of DG Research.
* Coordinator of Life Sciences in European Society, [email protected]
-------------------------------- Europeans and Biotechnology in 2002 (2nd Edition: 21/03/03) -----------------------------
Contents1 Summary of key findings..........................................................................................................................................1
1.1 General attitudes to technologies and biotechnology................................................................................................. 11.2 Attitudes to medical, industrial and agri-food applications of biotechnology ....................................................... 11.3 Movements in European attitudes 1996-2002............................................................................................................... 21.4 Changes in attitudes in the 15 EU countries: a turning point in 1999?..................................................................... 21.5 The engaged public of biotechnology............................................................................................................................ 21.6 Confidence in actors involved in biotechnology.......................................................................................................... 31.7 The acceptability of uses of genetic information.......................................................................................................... 31.8 Arguments in favour of buying GM foods ................................................................................................................... 41.9 Social and cultural values and biotechnology .............................................................................................................. 41.10 Factors underlying support and opposition to biotechnology .................................................................................. 51.11 Conclusions........................................................................................................................................................................ 5
2 Introduction ....................................................................................................................................................................6
2.1 The structure of the report............................................................................................................................................... 62.2 Brief technical details....................................................................................................................................................... 7
3 Expectations about the impact of new technologies.......................................................................................8
3.1 Technological optimism: implications......................................................................................................................... 11
4 Evaluating applications of biotechnology........................................................................................................12
4.1 Support for biotechnology across Europe................................................................................................................... 134.2 Have attitudes changed since 1999?............................................................................................................................. 144.3 How support, risk tolerant support and opposition has changed in the European countries............................ 17
5 The 'engaged' public of biotechnology..............................................................................................................18
5.1 Reported and intended behaviours.............................................................................................................................. 205.2 Awareness of biotechnologies ...................................................................................................................................... 205.3 Knowledge of biology and genetics............................................................................................................................. 205.4 Country differences and changes over time............................................................................................................... 225.5 The engaged public of Europe...................................................................................................................................... 225.6 The profile of the engaged public................................................................................................................................. 245.7 How engagement with biotechnology relates to attitudes....................................................................................... 245.8 Engagement, science, technology and politics ........................................................................................................... 27
6 Confidence in key actors and trust in sources of information..................................................................29
7 Opinions about the uses of genetic information............................................................................................34
7.1 Country comparisons..................................................................................................................................................... 35
8 GM foods: hypothetical purchasing intentions..............................................................................................36
9 Value-orientations and attitudes to science and technology .....................................................................38
10 The factors underlying support and opposition to biotechnology.........................................................40
11 Conclusions...................................................................................................................................................................42
12 References .....................................................................................................................................................................44
-------------------------------- Europeans and Biotechnology in 2002 (2nd Edition: 21/03/03) -----------------------------
List of figuresFigure 1 Impact of technologies on way of life............................................................................................................................ 8Figure 2 European optimism about technologies, 1991-2002 .................................................................................................... 9Figure 3 European attitudes to six applications of biotechnology in 2002 ............................................................................ 13Figure 4 Europeans’ opinions about access to genetic information........................................................................................ 34Figure 5 Acceptable medical and public uses of genetic information.................................................................................... 35Figure 6 European attitudes to purchasing and eating GM food........................................................................................... 37Figure 7 Acceptable reasons for buying GM food..................................................................................................................... 38
List of tablesTable 1 Index of biotechnology optimism 1991-2002 .............................................................................................................. 10Table 2 Level of support and opposition for six applications in 2002 .................................................................................. 14Table 3 Three Common Logics ................................................................................................................................................... 15Table 4 The logic of judgments for six applications of biotechnology ................................................................................. 16Table 5 National changes in support for applications of biotechnology 1996-2002 ........................................................... 18Table 6 Correct answers for the knowledge quiz 1996-2002.................................................................................................. 21Table 7 National trends in biology knowledge 1996-2002...................................................................................................... 22Table 8 Europeans’ engagement with biotechnology ............................................................................................................. 23Table 9 European judgments about six applications of biotechnology by engagement.................................................... 25Table 10 The effect of engagement on attitudes to genetic testing, controlling for education............................................ 26Table 11 The relative importance of usefulness, risk and moral acceptability...................................................................... 27Table 12 European interest in science, politics and food issues .............................................................................................. 28Table 13 European confidence in biotechnology actors in 1999 and 2002 ............................................................................. 30Table 14 Change in biotechnology industry’s confidence/surplus deficit 1999-2002.......................................................... 32Table 15 Which organisations Europeans select as trusting to tell the truth about biotechnology................................... 32Table 16 Trust in organisations 1991-2002 .................................................................................................................................. 33Table 17 Value-orientations in Europe........................................................................................................................................ 39Table 18 Logistic regressions predicting encouragement of GM foods and cloning human cells and tissues................. 41
-------------------------------- Europeans and Biotechnology in 2002 (2nd Edition: 21/03/03) -----------------------------
1
1 Summary of key findings
This is the fifth in a series of Eurobarometer surveys on biotechnology and the lifesciences. The surveys have been conducted in 1991, 1993, 1996, 1999 and in 2002. Thesurvey is based on a representative sample of 16,500 respondents, approximately 1000 ineach EU member state (see report for exceptions). Survey design and analysis wasconducted by a research group ‘Life Sciences in European Society’ supported by DGResearch. In a year when many European countries are involved in public discussions onaspects of biotechnology, this survey stands as a contribution to the informed debate.
1.1 General attitudes to technologies and biotechnology
Europeans are not technophobic. The greater majority think that telecommunications,computers and IT, the internet, solar energy and mobile phones will improve our way oflife over the next 20 years. Trend data since 1991 shows little change in optimism fortelecoms, computers and information technology.
Two interpretations of the 2002 survey are possible. For some Europeans, the jury is stillout on biotechnology - 25% said "Don’t know" when asked whether it would improve ourway of life or not, about the same percentage as in 1999. By contrast amongst those whoexpressed an opinion, 44% of Europeans were optimistic and 17% pessimistic aboutbiotechnology.
In the period 1999-2002, optimism has increased to the level seen in the early 1990s after adecade of continuously declining optimism in biotechnology. An index of optimismshows an appreciable change from the declining trend of the years 1991-1999. This rise inoptimism holds for the all the EU Member States with the exception of Germany and theNetherlands, where such a rise was observed between 1996 and 1999.
1.2 Attitudes to medical, industrial and agri-food applications of biotechnology
Judgments about six applications of biotechnology – genetic testing of inherited diseases,cloning human cells and tissues, GM enzymes for soaps, transgenic animals forxenotransplantation, GM crops and GM foods show that Europeans continue todistinguish between different types of applications, particularly medical in contrast toagri-food applications.
Genetic testing for inherited diseases is seen as useful, morally acceptable and to beencouraged (supported) and the same holds for cloning human cells and tissues, eventhough this application is also seen as a risk. These two applications are supported in allthe 15 EU member states.
A majority of Europeans do not support GM foods. These are judged not to be useful andto be risky for society. For GM crops, support is lukewarm, while they are judged to bemoderately useful they are seen as almost as risky as GM foods. While GM crops aresupported in Spain, Portugal, Ireland, Belgium, UK, Finland, Germany and theNetherlands, with the exception of Belgium, all the countries that called for the extensionof the de facto moratorium on the commercial exploitation of GM crops (France, Italy,Greece, Denmark, Austria and Luxembourg) have publics that are, on average, opposed to
-------------------------------- Europeans and Biotechnology in 2002 (2nd Edition: 21/03/03) -----------------------------
2
GM crops. Overall support for GM foods is seen in only four countries - Spain, Portugal,Ireland and Finland.
GM enzymes for the production of environmentally friendly soaps is seen as useful and issupported by a majority of Europeans. Only in France is the balance of opinion opposed.
Xenotransplantation is perceived to be both moderately useful and moderately risky andis only weakly supported. It gains overall support in all EU countries with the exceptionof Finland, Greece and Austria.
1.3 Movements in European attitudes 1996-2002
Amongst a sub-group of 'decided' Europeans, support for genetic testing has been bothhigh and stable over the period 1996 to 1999. For GM crops and GM foods supportdeclined and opposition increased over the period 1996-1999. Between 1999-2002 there isalmost no change in levels of support or opposition in Europe considered as a whole.However, within individual countries there are varying degrees of change.
1.4 Changes in attitudes in the 15 EU countries: a turning point in 1999?
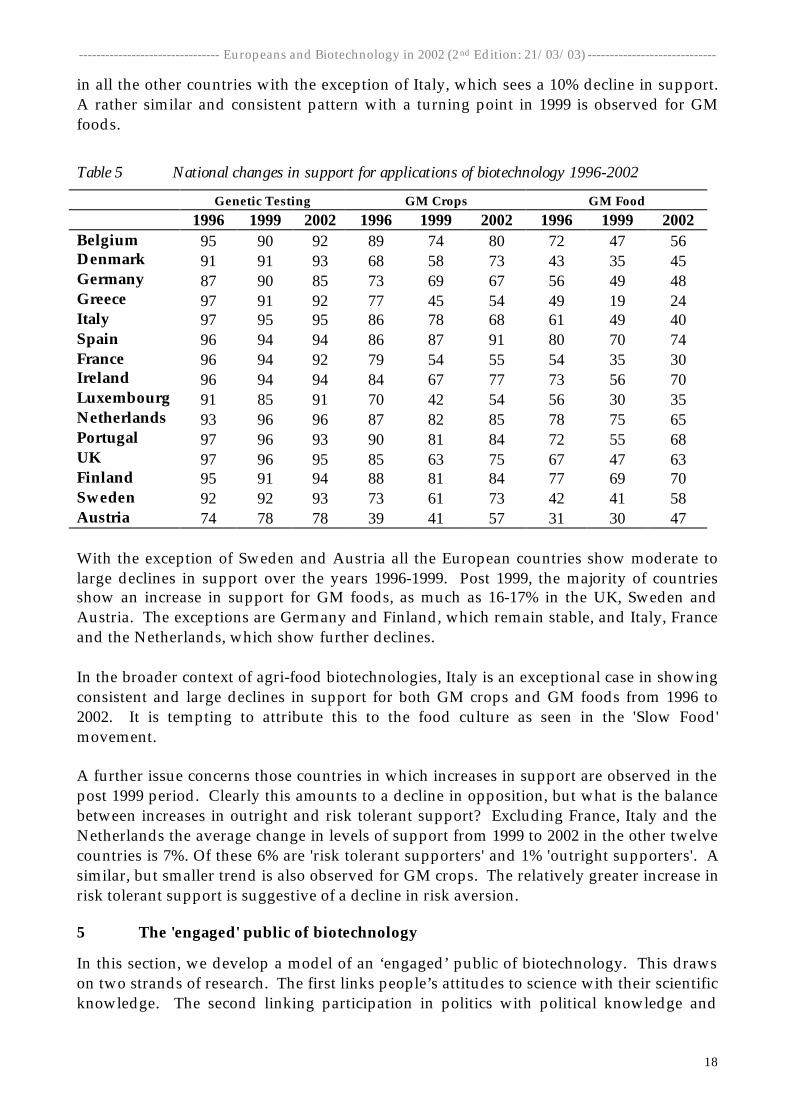
All the EU countries, with the exception of Spain and Austria, showed moderate to largedeclines in support for GM crops over the period 1996-1999. Thereafter support more orless stabilises in France and Germany and increases in all the other countries with theexception of Italy, which sees a 10% decline in support.
For GM food there is a rather similar pattern to GM crops. With the exception of Swedenand Austria all the European countries showed moderate to large declines in support overthe years 1996-1999. Post 1999, the majority of countries show an increase in support forGM foods with the exceptions of Germany and Finland, which are stable, and Italy, Franceand the Netherlands which show further declines.
In summary, support for GM food and crops has stabilised across Europe as a wholebetween 1999 and 2002. Within this general picture, most countries show small tomoderate increases in support, while Italy shows a marked decline. (These findings are notinconsistent with 1.3 above. The relative stability of France and Germany, with largepopulations, attenuates the impact of increased support in other countries when looking atEurope as a whole).
1.5 The engaged public of biotechnology
The engaged public of biotechnology are, on average, more supportive than the lessengaged. The 'engaged' are people who are more aware, knowledgeable andbehaviourally involved in the subject. They are more likely to be male, better educated,white collar workers, urban dwellers and younger than 55. Countries with higherpercentages of the engaged public include Denmark, Luxembourg and Finland and withlower percentages Spain, Portugal and Belgium.
Compared to the least engaged respondents, those with higher engagement are morelikely to judge the six applications to be useful, morally acceptable and to agree that theyshould be encouraged. However, the judgment on risk is only marginally influenced by
-------------------------------- Europeans and Biotechnology in 2002 (2nd Edition: 21/03/03) -----------------------------
3
the level of engagement with biotechnology. This suggests that for the engaged public, therisks are apparent, but in the context of perceptions of greater usefulness and moralacceptability, such risks are tolerated.
Biotechnology does not attract the interest of a narrow group of Europeans who areparticularly exercised by this issue alone. Rather, those who are most engaged withbiotechnology are ‘generalists’ - with interests in a wider range of public affairs. In thisway public opinion on biotechnology is likely to derive in part from views about thecredibility of wider political and scientific institutions, as well as those solely related tobiotechnology.
1.6 Confidence in actors involved in biotechnology
Around 70% of Europeans have confidence in doctors, university scientists, consumerorganisations and patients' organisations. Around 55% have confidence in scientistsworking in industry, newspapers and magazines, environmental groups, shops, farmersand the European Commission. However, less than 50% have confidence in their owngovernment and in industry. For all the actors mentioned more Europeans think they aredoing a good job than a bad job. Yet, across Europe as a whole about 25% lack confidencein farmers, shops, government and industry.
In 2002, all of the actors have a confidence surplus (the difference between the percentagesseen as doing a good and a bad job). Those actors with a higher confidence surplusinclude doctors, patients’ organisations, university scientists and consumers'organisations. At the lower end, but still with a confidence surplus are industry,government, farmers and shops. There is more confidence in the European Commission,than in national governments in relation to regulation – surpluses of 52% and 43%respectively. Confidence in university scientists is higher than for scientists working inindustry – surpluses of 76% and 56% respectively. And, for the media, confidence aboutreporting on biotechnology is almost 60%.
While the confidence index shows few changes from 1999 to 2002, a sizeable change isseen for industry. In 1999 industry had a confidence deficit of minus 10%, but by 2002 thishas shifted into a surplus of 23%. A possible explanation of this change is that the public'sassociation with the term industry has changed from agri-foods to medicalbiotechnologies.
1.7 The acceptability of uses of genetic information
The results on the acceptability of various uses of genetic data suggest that this is apotentially controversial issue; public concerns need to be taken into account.Respondents were asked whether they would or would not support six uses of geneticinformation. Three in the medical domain -genetic tests results being available to doctors,the testing of unborn babies for inherited diseases and having a test oneself for seriousdiseases; and three in the public domain – genetic testing for forensic purposes, bygovernment agencies and for commercial insurance.
While the three disease related medical applications attract majority support, it is alsoapparent that a significant minority is concerned about these medical uses of genetic
-------------------------------- Europeans and Biotechnology in 2002 (2nd Edition: 21/03/03) -----------------------------
4
information. In the context of crime detection, the European public is split - 43% in favourand 44% against. Access to genetic information by government agencies and bycommercial insurance is widely seen as unacceptable.Across the 15 EU states there is a North/South divide in the willingness to allow access togenetic information. Greece, Spain and Portugal are more relaxed than Austria, Sweden,Finland, Germany and Denmark. Is genetic testing likely to emerge as a civil libertiesissue in Northern Europe?
The engaged public more supportive than the unengaged public on the medical uses ofgenetic information. But in the case of the public uses, access to genetic information by thepolice, government agencies and insurance companies, there is a consensus amongst theengaged and unengaged publics that this is unacceptable.
1.8 Arguments in favour of buying GM foods
There are mixed opinions on the acceptability of buying and consuming GM foods.Respondents were asked if they would buy or consume GM foods if they contained lesspesticide residues, were more environmentally friendly, tasted better, contained less fat,were cheaper, or were offered in a restaurant. For all 'reasons' offered there are moreEuropeans saying they would not buy or eat GM foods than those saying they would. Themost persuasive reason for buying GM foods is the health benefit of lower pesticideresidues, closely followed by an environmental benefit. Somewhat surprisingly, of therange of benefits included in this question set, price is apparently the least incentive forbuying GM foods. However, what people say and what they do are sometimes ratherdifferent, and here it is likely that people are thinking as a citizen rather than as aconsumer.
In the different EU countries between 30% and 65% percent reject all the reasons forbuying GM foods. Countries with the highest percentage of rejecters are Greece, Irelandand France and with the lowest percentage are the UK, Austria and Finland.
Amongst the remaining non-rejecters it is notable that the mean number of acceptablereasons is relatively high. Once a threshold of minimal acceptability is reached, thenpeople are inclined to find a number of the reasons acceptable for buying GM foods.These results could be taken as indicating a more or less total rejection of GM foods anddiscussed in terms of the impossibility of introducing such new products. On the otherhand, it could be argued that if GM foods actually offered some of these benefits, and ifthey were labelled appropriately to give the rejecters the opportunity to express theirpreference, then the products might capture a sizable market share.
1.9 Social and cultural values and biotechnology
Europeans are concerned about the fragility of nature and about the impact of humanactions and technology upon nature. While materialist values are evidenced in supportfor the economic growth, there is little perceived 'harmony of interests' between citizensand the either the private sector or powerful multinationals. On social and political valuesEuropeans are somewhat left of centre, supporting trade unions and incomeredistribution. The values related to nature and to materialism are related to beliefs about
-------------------------------- Europeans and Biotechnology in 2002 (2nd Edition: 21/03/03) -----------------------------
5
biotechnology. Those more optimistic about biotechnology tend to be more materialisticand less concerned about nature.
1.10 Factors underlying support and opposition to biotechnology
Four factors are consistently associated with support for the six applications ofbiotechnology when a total of fourteen factors are considered simultaneously in a model.These are materialist values, optimism about technology, confidence in actors involved inbiotechnology and engagement with the issue of biotechnology. Men tend to be moresupportive than women but there is no significant difference between their attitudes togenetic testing and GM enzymes. Controlling for all the other factors, people agedbetween 15 and 39 are more supportive of industrial and agri-food biotechnologies thanpeople over 55, but there are no age differences in support for medical biotechnologies.Contrary to expectation, in catholic countries, people have higher odds of support forcloning human cells and tissues than in the non-catholic countries.
1.11 Conclusions
The final section illustrates the dynamics of public perceptions and the need forcontinuing vigilance, drawing on the findings on GM foods and crops, medicalbiotechnologies and genetic information. Future scenarios point to the possibility of moresober discussions of risks related to GM foods and crops, and the growth of risk tolerantsupport in Europe. But, unless new crops and products are seen to have consumer benefitsthe controversies of the 1990s may be reactivated. Bio-medical applications underline theimportance of benefits in the public's response to biotechnologies and suggests that thepublic adopts a more utilitarian approach than many official bodies. It is suggested thatgenetic information in forensic, social security and insurance contexts may become a newfocus of controversy and conflict, particularly if this issue becomes linked to widerconcerns such as civil liberties.
The Eurobarometer survey shows that what people think about biotechnology is alsorelated to their wider interests and social values. For this reason future research sholdcontinue to explore how particular perceptions of biotechnology are situated in the moregeneral context of European social and political attitudes.
-------------------------------- Europeans and Biotechnology in 2002 (2nd Edition: 21/03/03) -----------------------------
6
2 Introduction
This report presents an analysis of Europeans' perceptions of biotechnology in 2002, basedon a Eurobarometer survey (Eurobarometer 58.0) carried out in the fifteen member statesof the European Union, during September and October 2002. Recent reports from theEuropean Commission and Parliament have emphasised the need for "societal scrutinyand dialogue"1 and "public consultation as part of the process of a comprehensive andtransparent legislative framework".2 Many European countries are initiating publicconsultations as part of this new directive on deliberate releases of GMOs. Surveyresearch, such as the Eurobarometer, may be considered as one of a number ofinstruments through which the public voice may be heard. Such research provides asystematic and dispassionate picture of the broader contours of public perceptions. But asurvey should not be viewed as a referendum, it is not a vote for or against particularissues and it is not, in itself, a form of participation or dialogue with the public. Yet it canbecome a form of interaction with the public, if the views expressed by the public in theirresponses to the survey questions are noted and inform discussions and decisions on thefuture of the science and technology.
Two features of survey research deserve comment. First a survey inevitably frames issuesin a particular way and respondents are restricted to answering the questions within theresponse alternatives presented. From prior qualitative research and the existingliterature, the European team that devised the questionnaire have made every attempt tocapture the significant currents of opinion about biotechnology and to set these questionsin the context of relevant social scientific concepts. Secondly, survey data does not speakfor itself, providing self evident truths. The selection and interpretation of data such aspercentages involve prior assumptions and value judgments about what is relativelyimportant and relatively less important. This report is our interpretation of the data, butthere are other equally legitimate interpretations.
The survey is the fifth in the series of Eurobarometer studies of public perceptions ofbiotechnology.3, 4, 5, 6 The series started in 1991 (Eurobarometer 35.1) and the second in1993 (Eurobarometer 39.1), both conducted in the twelve member states of the EuropeanCommunity. In 1996 the third in the series, (Eurobarometer 46.1), covered the fifteenmember states of the European Union. The fourth in the series (Eurobarometer 52.1) wasconducted in 1999 and was also fielded in Norway, Switzerland, Canada and the UnitedStates. The new survey in 2002 included some key trend questions designed to assess thestability or change in particular aspects of public perceptions, together with some newquestions devised to capture more recent issues and developments in the field ofbiotechnology.
2.1 The structure of the report
The report is divided into two parts. Part 1 provides an analytic description of Europeans'perceptions of biotechnology in 2002, with, where possible, time series comparative data.Part 2 is a technical annex and includes the English language survey questionnaire, detailsof the survey sampling, weighting and other relevant information.
-------------------------------- Europeans and Biotechnology in 2002 (2nd Edition: 21/03/03) -----------------------------
7
2.2 Brief technical details
2.2.1 Sampling
In each of the 15 European countries, questions about topics related to biotechnology wereput to a representative sample of the national populations over 15 years of age. There are17 sample areas: one for each country of the European Union, in addition Germany isdivided into East and West, and United Kingdom into Great Britain and Northern Ireland.Each sample area contains a number of interviews, although this number may besomewhat above or below that aimed at. The target is 1,000 per sample area, except forNorthern Ireland, 300, and Luxembourg, 600. More details of the sampling procedure canbe found in the Technical Annexe.
2.2.2 Weighting
For each EU member state, a national weighting procedure, using marginal (RIM) andintercellular weighting (Iterative Proportional Fitting - IPF), is carried out, based on thisuniverse description. As such, in all countries at a minimum, gender, age and region areintroduced in the iteration procedure. An additional factor is added to bring East andWest Germany together in one entity. East Germany counts for 20.8% and West Germanycounts for 79.2%. The same principle is used to bring Northern Ireland together with GreatBritain, to form the United Kingdom. Here Northern Ireland counts for 2.5% and GreatBritain, for 97.5%.
In order to make a European weight, the data is extrapolated using population figures foreach sample area (15 members = 17 sample areas). This weight is used for all of theanalyses presented in this report. Each country’s influence on the Europe-wide figurespresented is therefore proportional to its population relative to the combined populationof the 15 member states. More details of the weighting procedure can be found in theTechnical Annexe.
2.2.3 Split ballot design
The survey employed a split-ballot design. Fifty percent of the sample in each countryreceived one of two versions of the questionnaire. Alternative questions were asked ineach of the two versions in order to cover a wider range of topics than would have beenpossible using a single-ballot design. The question sets that utilise this feature aredescribed in the main body of the report as they arise.
2.2.4 Abbreviations
The abbreviations used for the member states are as follows:
B Belgium I Italy LU Luxemburg FIN FinlandDK Denmark E Spain NL Netherlands S SwedenD Germany FR France P Portugal A AustriaGR Greece IRL Ireland UK United Kingdom
-------------------------------- Europeans and Biotechnology in 2002 (2nd Edition: 21/03/03) -----------------------------
8
3 Expectations about the impact of new technologies
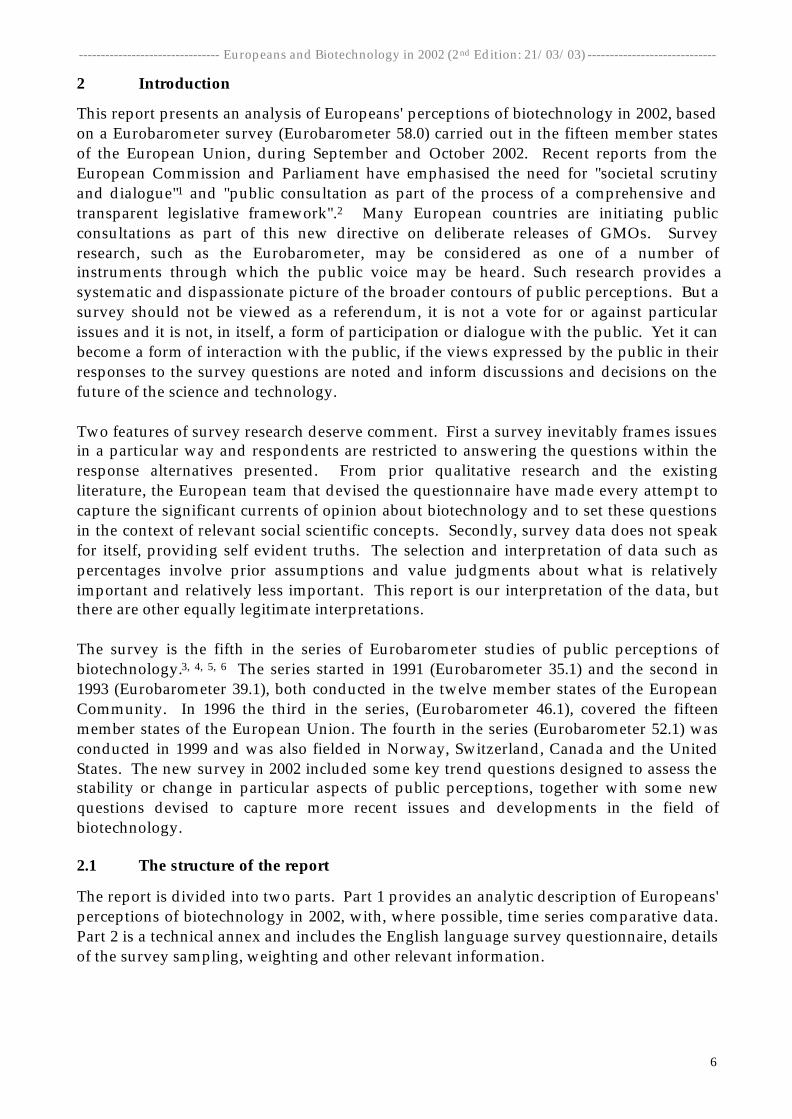
In this section we look at Europeans’ beliefs about some current and future technologies,including biotechnology and genetic engineering. Whether Europeans are optimistic orpessimistic about different technologies, and how such beliefs may have changed overtime, provides a picture of the climate for technology in general - a context in which publicviews about biotechnology are formed. Since 1991 the Eurobarometer surveys havecharted the public’s general attitudes to science and technology. For each of sixtechnologies (solar energy, computers and information technology, telecommunications,space exploration, the internet and biotechnology) respondents were asked, “do you think itwill improve our way of life in the next 20 years, it will have no effect, or it will make thingsworse?” In the 1999 Eurobarometer nuclear energy was added to the list and in 2002, forthe first time, mobile phones and nanotechnology were also included. The latter is aprospective technology with the potential for considerable impacts on European societyover the coming decades. While in 2002 it is unlikely that many people will have had aclear representation of nanotechnology, it was included in the survey with a view toestablishing a base line for studies in the future.
Figure 1 Impact of technologies on way of life
0 20 40 60 80
Nuclear energy
Nanotechnology
Biotechnology/genetic engineering
Space exploration
Mobile phones
Internet
Solar energy
Computers and IT
Telecommunications
Percentage
don't know will make things worse no effect will improve
For biotechnology a split ballot was used with half the sample asked about“biotechnology” and the other half asked about “genetic engineering”. For this analysisthe combined results are used. Figure 1 shows that across the selected technologiesEuropeans are less optimistic about biotechnology and genetic engineering than the othertechnologies, with the exception of nanotechnology and nuclear power. That some 53%said "Don’t know" about nanotechnology is hardly surprising. Yet of those who expresseda view, it is notable that five times as many thought it would improve our way of life,rather than make it worse. The contrast between the three so-called base technologies ofthe post World War Two years is striking. For modern biotechnology 43% are optimistic
-------------------------------- Europeans and Biotechnology in 2002 (2nd Edition: 21/03/03) -----------------------------
9
and 17% are pessimistic. The comparable figures for nuclear power are 27% optimisticand 36% pessimistic; and for computers 73% optimistic and 5% pessimistic. It is notablethat, notwithstanding the continuing controversies over GM foods and the high level ofmedia exposure across many applications of biotechnology over the last three years, asmany as 27% of Europeans said "Don’t Know" to this question. By contrast "Don’t Know "responses for computers were 8% and for nuclear power 20%. That the percentage of“Don’t know” responses regarding biotechnology is about the same as in 1999, suggestseither that the subject is still relatively marginal to people's everyday life or that weighingup the advantages and disadvantages of biotechnology remains now, as then, no easymatter.
The terms 'biotechnology' and 'genetic engineering', as in 1999, appear to have differentconnotations, although the gap is closing. 5% more Europeans see “biotechnology” aslikely to improve their way of life in the future, than those asked the same question about“genetic engineering”; in 1999 the gap was 8%. The more positive connotation ofbiotechnology, perhaps a result of the association of “bio” with healthy and natural foods,holds across much of Europe with the exception of Italy, Spain and Portugal.
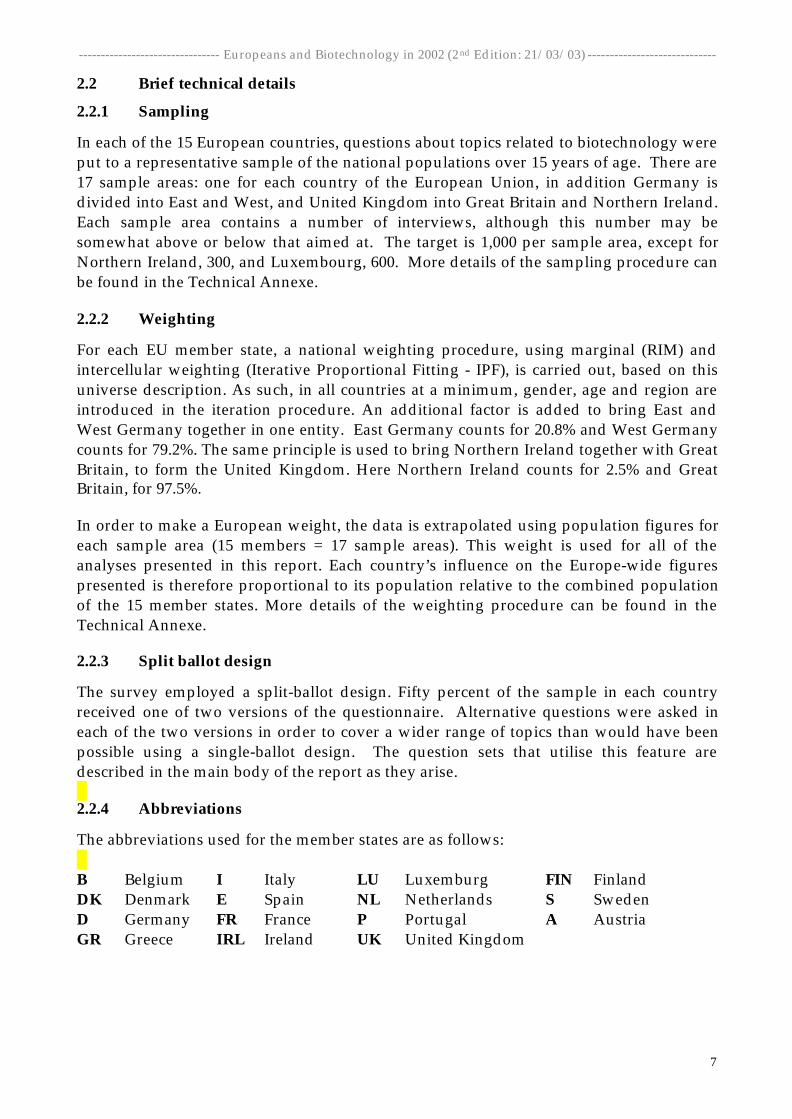
Figure 2 European optimism about technologies, 1991-2002
0
0.1
0.2
0.3
0.4
0.5
0.6
0.7
0.8
0.9
1
1991 1993 1996 1999 2002Year
Ind
ex
TelecommunicationsComputers and ITSpace explorationBiotechnology
To assess the changes in technological optimism and pessimism over time (1991 through2002) a summary index has been constructed. For this, the percentage of pessimists issubtracted from the percentage of optimists and the result divided by the combined
-------------------------------- Europeans and Biotechnology in 2002 (2nd Edition: 21/03/03) -----------------------------
10
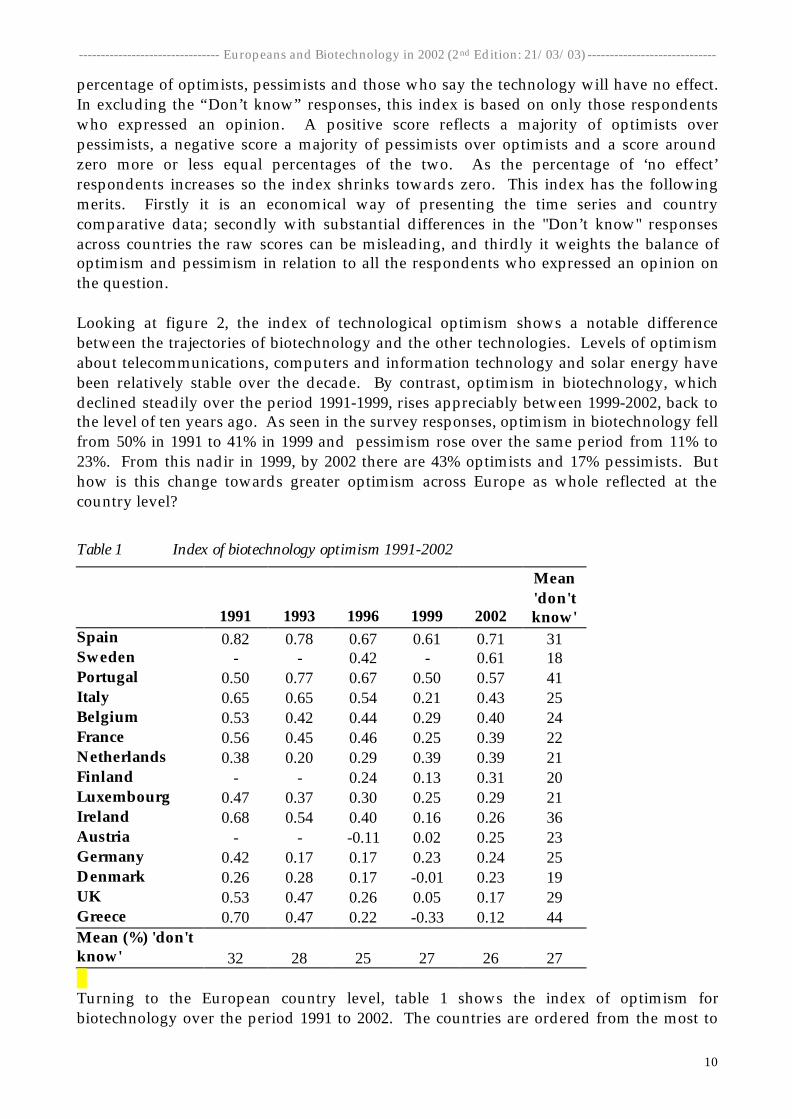
percentage of optimists, pessimists and those who say the technology will have no effect.In excluding the “Don’t know” responses, this index is based on only those respondentswho expressed an opinion. A positive score reflects a majority of optimists overpessimists, a negative score a majority of pessimists over optimists and a score aroundzero more or less equal percentages of the two. As the percentage of ‘no effect’respondents increases so the index shrinks towards zero. This index has the followingmerits. Firstly it is an economical way of presenting the time series and countrycomparative data; secondly with substantial differences in the "Don’t know" responsesacross countries the raw scores can be misleading, and thirdly it weights the balance ofoptimism and pessimism in relation to all the respondents who expressed an opinion onthe question.
Looking at figure 2, the index of technological optimism shows a notable differencebetween the trajectories of biotechnology and the other technologies. Levels of optimismabout telecommunications, computers and information technology and solar energy havebeen relatively stable over the decade. By contrast, optimism in biotechnology, whichdeclined steadily over the period 1991-1999, rises appreciably between 1999-2002, back tothe level of ten years ago. As seen in the survey responses, optimism in biotechnology fellfrom 50% in 1991 to 41% in 1999 and pessimism rose over the same period from 11% to23%. From this nadir in 1999, by 2002 there are 43% optimists and 17% pessimists. Buthow is this change towards greater optimism across Europe as whole reflected at thecountry level?
Table 1 Index of biotechnology optimism 1991-2002
1991 1993 1996 1999 2002
Mean'don'tknow'
Spain 0.82 0.78 0.67 0.61 0.71 31Sweden - - 0.42 - 0.61 18Portugal 0.50 0.77 0.67 0.50 0.57 41Italy 0.65 0.65 0.54 0.21 0.43 25Belgium 0.53 0.42 0.44 0.29 0.40 24France 0.56 0.45 0.46 0.25 0.39 22Netherlands 0.38 0.20 0.29 0.39 0.39 21Finland - - 0.24 0.13 0.31 20Luxembourg 0.47 0.37 0.30 0.25 0.29 21Ireland 0.68 0.54 0.40 0.16 0.26 36Austria - - -0.11 0.02 0.25 23Germany 0.42 0.17 0.17 0.23 0.24 25Denmark 0.26 0.28 0.17 -0.01 0.23 19UK 0.53 0.47 0.26 0.05 0.17 29Greece 0.70 0.47 0.22 -0.33 0.12 44Mean (%) 'don'tknow' 32 28 25 27 26 27
Turning to the European country level, table 1 shows the index of optimism forbiotechnology over the period 1991 to 2002. The countries are ordered from the most to
-------------------------------- Europeans and Biotechnology in 2002 (2nd Edition: 21/03/03) -----------------------------
11
the least optimistic in 2002. It is informative to divide the time period into two phases –pre and post-1999. In the pre-1999 phase the majority of countries follow the widerEuropean trend of declining scores on the index of optimism, despite the balance stillfavouring the optimists. The exceptions are Denmark and Greece where the outcome ofthis decline results in a majority of pessimists, as shown by a negative score on the index.The other exceptions are the Netherlands and Germany, where following a decline in theearly nineties, the index of optimism shows an upward movement by the end of thedecade.
By 2002 all the European countries have a majority of optimists and in all but twocountries there is an increase in the index of optimism post-1999. Interestingly, thecountries in question are the Netherlands and Germany, where the trend of increasingoptimism at the end of the 1990s comes to an end; in both countries there is no change inthe index of optimism in the post-1999 phase.
The consistency in the direction of change in the public optimism about biotechnology preand post-1999 is quite remarkable. Albeit countries start from different levels of optimismabout biotechnology. But that they almost all move in a similar direction in the period1991-1999 and then move in the opposite direction post-1999 invites further consideration.Whatever the explanation (or explanations) for this change, it is unlikely to be located at auniquely national level. It seems more likely that it is a consequence of events, or changesof some other type that may have occurred across Europe as a whole.
3.1 Technological optimism: implications
What conclusions can be drawn from the data on optimism and pessimism abouttechnologies in general and biotechnology in particular? First, it is clear that Europeanscannot be characterised as technological luddites or suffering from a symptom ofgeneralised technophobia. There is overwhelming optimism about the contribution tosociety of telecommunications, computers and information technology, solar energy andthe internet. Second, Europeans assessments of technology cannot be described as drivenby a generalised risk aversion. The possible health and environmental risks of mobilephones have been widely discussed, yet for every pessimist about mobile phones there areabout seven optimists. Third, and perhaps contrary to expectation given the results for1991-1999, there has been a shift towards greater optimism about biotechnology. With theexception of the Netherlands and Germany, where such a shift occurred in the years 96-99,all the European countries are now more optimistic about biotechnology and all now havea majority of optimists over pessimists.
There are a plethora of possible explanations for this movement towards greateroptimism. Could it be that the de facto moratorium on the commercial exploitation of GMcrops has taken the heat out of this particular controversy? Or could it be due to thepromise of new medical interventions following the completion of the sequencing of thehuman genome? One of the agendas of this report is to see whether the analyses of otherquestions in the Eurobarometer survey show complementary changes in perceptions andprovide some insights into the rising levels of optimism.
-------------------------------- Europeans and Biotechnology in 2002 (2nd Edition: 21/03/03) -----------------------------
12
4 Evaluating applications of biotechnology
We now turn to public perceptions of six applications of biotechnology. The six includemedical, industrial and agri-food applications. How, if at all, has the post-1999 increase inoptimism about biotechnology affected public perceptions of particular applications ofbiotechnology? Respondents were asked whether they thought the applications ofbiotechnology were useful for society, risky for society, morally acceptable and whether theyshould be encouraged. The response alternatives for these questions were 4-point Likerttype scales (definitely agree, tend to agree, tend to disagree and definitely disagree). Foreach country, the split ballots, A and B were used. Each respondent received one of thetwo versions of the survey in each of which three applications were presented.
Split ballot A
• Genetic testing: using genetic tests to detect inheritable diseases such as cysticfibrosis mucoviscidosis, thalassaemia.
• Xenotransplantation: introducing human genes into animals to produce organs forhuman transplants, such as into pigs for human heart transplants
• GM Food: using modern biotechnology in the production of foods, for example tomake them higher in protein, keep longer or change the taste.
Split ballot B
• GM Crops: taking genes from plant species and transferring them into crop plantsto increase resistance to insect pests.
• GM Enzymes: using genetically modified organisms to produce enzymes asadditives to soaps and detergents that are less damaging to the environment
• Cloning human cells: cloning human cells or tissues to replace a patient's diseasedcells that are not functioning properly, for example, in Parkinson’s disease or formsof diabetes or heart disease. (Note that in the 1999 survey this question did notinclude the three examples of the uses of cloning human cells.)
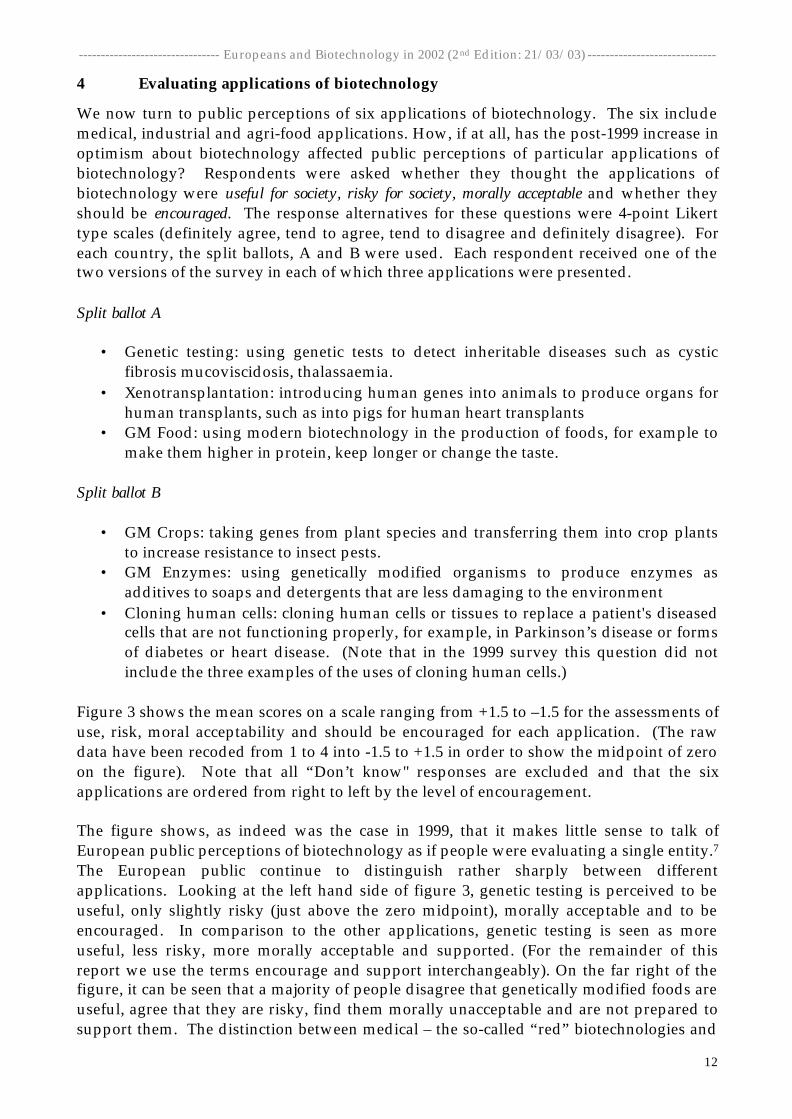
Figure 3 shows the mean scores on a scale ranging from +1.5 to –1.5 for the assessments ofuse, risk, moral acceptability and should be encouraged for each application. (The rawdata have been recoded from 1 to 4 into -1.5 to +1.5 in order to show the midpoint of zeroon the figure). Note that all “Don’t know" responses are excluded and that the sixapplications are ordered from right to left by the level of encouragement.
The figure shows, as indeed was the case in 1999, that it makes little sense to talk ofEuropean public perceptions of biotechnology as if people were evaluating a single entity.7The European public continue to distinguish rather sharply between differentapplications. Looking at the left hand side of figure 3, genetic testing is perceived to beuseful, only slightly risky (just above the zero midpoint), morally acceptable and to beencouraged. In comparison to the other applications, genetic testing is seen as moreuseful, less risky, more morally acceptable and supported. (For the remainder of thisreport we use the terms encourage and support interchangeably). On the far right of thefigure, it can be seen that a majority of people disagree that genetically modified foods areuseful, agree that they are risky, find them morally unacceptable and are not prepared tosupport them. The distinction between medical – the so-called “red” biotechnologies and
-------------------------------- Europeans and Biotechnology in 2002 (2nd Edition: 21/03/03) -----------------------------
13
agri-food – so-called “green” biotechnologies is apparent. Of the “red” biotechnologies,genetic testing for inherited diseases, and the cloning of human cells and tissue to combatconditions like Parkinson’s disease and diabetes are widely supported.
Contrary to what might be expected the term ‘cloning’ does not lead to automaticrejection. When cloning is employed in an application that is seen to be useful, people areprepared to discount the risks and affirm support. The ‘green’ biotechnologies attractmuch less support. A majority would not encourage GM foods, while GM crops gain verymodest support.
Figure 3 European attitudes to six applications of biotechnology in 2002
-0.5
0
0.5
1
Genetic test Clone human cells Enzymes Xenotransplantation Crops Food
Useful Risky Morally acceptable Should be encouraged
The greater opposition to GM foods over GM crops, reflected in perceptions of lowerusefulness, higher risk and lower moral acceptability, suggests that Europeans may bemore concerned about food safety than the environmental impacts of agri-foodbiotechnologies. This is not to say that Europeans lack environmental concerns. Theindustrial application of biotechnology - the production of GM enzymes forenvironmentally friendly soaps - is judged to be useful and is supported by a majority ofthe public. Finally, in the case of xenotransplantation, people perceive both moderaterisks and benefits while being ambivalent about its moral acceptability. Theseconsiderations lead to only weak support.
4.1 Support for biotechnology across Europe
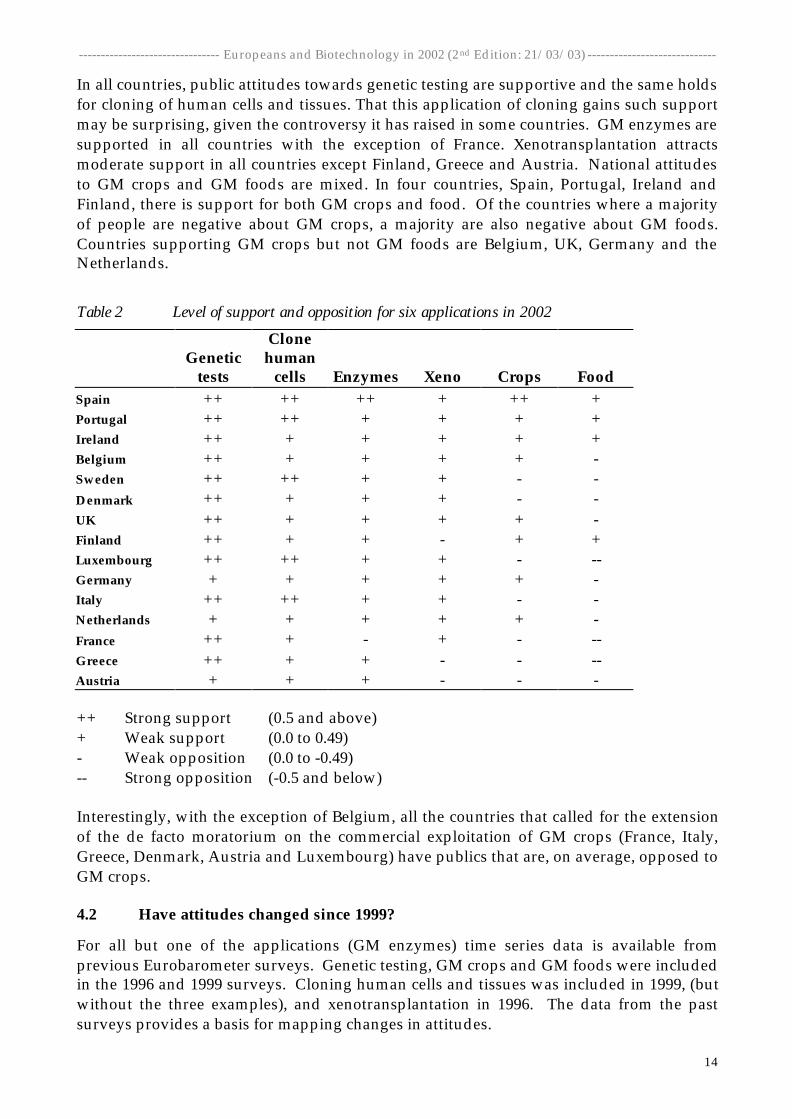
Turning from Europe as a whole to the individual countries, table 2 maps the relativelevels of support for the six applications and ranks the countries from the most supportive(Spain) to the most opposed (Austria). In the table, a single '+' or '-' represents a meanscore in the range of 0 to plus or minus 0.49, while '++' and '--' represent mean score ofplus or minus 0.5 and greater.
-------------------------------- Europeans and Biotechnology in 2002 (2nd Edition: 21/03/03) -----------------------------
14
In all countries, public attitudes towards genetic testing are supportive and the same holdsfor cloning of human cells and tissues. That this application of cloning gains such supportmay be surprising, given the controversy it has raised in some countries. GM enzymes aresupported in all countries with the exception of France. Xenotransplantation attractsmoderate support in all countries except Finland, Greece and Austria. National attitudesto GM crops and GM foods are mixed. In four countries, Spain, Portugal, Ireland andFinland, there is support for both GM crops and food. Of the countries where a majorityof people are negative about GM crops, a majority are also negative about GM foods.Countries supporting GM crops but not GM foods are Belgium, UK, Germany and theNetherlands.
Table 2 Level of support and opposition for six applications in 2002
Genetictests
Clonehuman
cells Enzymes Xeno Crops FoodSpain ++ ++ ++ + ++ +Portugal ++ ++ + + + +Ireland ++ + + + + +Belgium ++ + + + + -Sweden ++ ++ + + - -Denmark ++ + + + - -UK ++ + + + + -Finland ++ + + - + +Luxembourg ++ ++ + + - --Germany + + + + + -Italy ++ ++ + + - -Netherlands + + + + + -France ++ + - + - --Greece ++ + + - - --Austria + + + - - -
++ Strong support (0.5 and above)+ Weak support (0.0 to 0.49)- Weak opposition (0.0 to -0.49)-- Strong opposition (-0.5 and below)
Interestingly, with the exception of Belgium, all the countries that called for the extensionof the de facto moratorium on the commercial exploitation of GM crops (France, Italy,Greece, Denmark, Austria and Luxembourg) have publics that are, on average, opposed toGM crops.
4.2 Have attitudes changed since 1999?
For all but one of the applications (GM enzymes) time series data is available fromprevious Eurobarometer surveys. Genetic testing, GM crops and GM foods were includedin the 1996 and 1999 surveys. Cloning human cells and tissues was included in 1999, (butwithout the three examples), and xenotransplantation in 1996. The data from the pastsurveys provides a basis for mapping changes in attitudes.
-------------------------------- Europeans and Biotechnology in 2002 (2nd Edition: 21/03/03) -----------------------------
15
However, making simple comparisons between the mean scores is not appropriate as theformat of the questionnaire changed from 1996 to 1999. In 1999 and 2002, surveyrespondents were asked whether or not they had heard about each application beforegiving their judgments of usefulness, risk, moral acceptability and encouragement. Thisprior question provided a basis for distinguishing between those respondents who weremore likely to have an attitude formed before the survey, or at least some prior knowledgeof the topic, and those who, it may be assumed, formed a judgment on the spot, probablywithout much relevant information. As a consequence of this prior question concerningawareness of the particular applications, there was a significant increase in the percentageof “Don’t Know" responses in 1999 as compared to 1996.
4.2.1 Logics underlying support and opposition
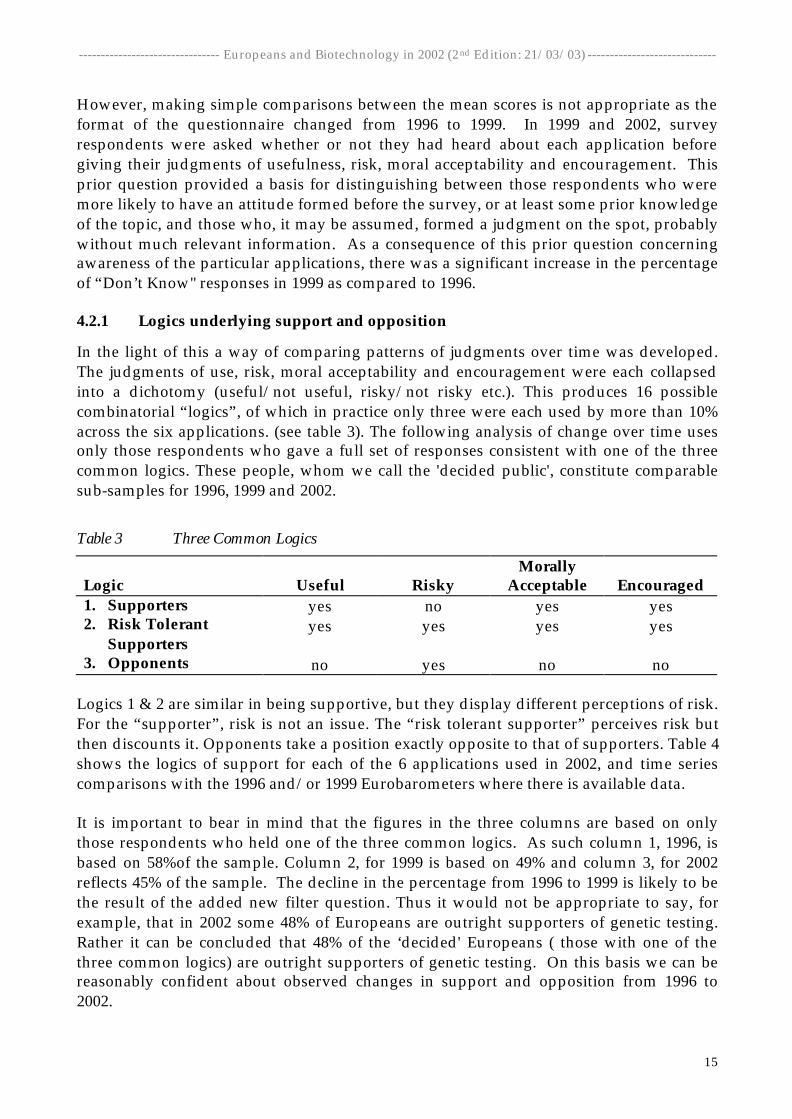
In the light of this a way of comparing patterns of judgments over time was developed.The judgments of use, risk, moral acceptability and encouragement were each collapsedinto a dichotomy (useful/not useful, risky/not risky etc.). This produces 16 possiblecombinatorial “logics”, of which in practice only three were each used by more than 10%across the six applications. (see table 3). The following analysis of change over time usesonly those respondents who gave a full set of responses consistent with one of the threecommon logics. These people, whom we call the 'decided public', constitute comparablesub-samples for 1996, 1999 and 2002.
Table 3 Three Common Logics
Logic Useful RiskyMorally
Acceptable Encouraged1. Supporters yes no yes yes2. Risk Tolerant
Supportersyes yes yes yes
3. Opponents no yes no no
Logics 1 & 2 are similar in being supportive, but they display different perceptions of risk.For the “supporter”, risk is not an issue. The “risk tolerant supporter” perceives risk butthen discounts it. Opponents take a position exactly opposite to that of supporters. Table 4shows the logics of support for each of the 6 applications used in 2002, and time seriescomparisons with the 1996 and/or 1999 Eurobarometers where there is available data.
It is important to bear in mind that the figures in the three columns are based on onlythose respondents who held one of the three common logics. As such column 1, 1996, isbased on 58%of the sample. Column 2, for 1999 is based on 49% and column 3, for 2002reflects 45% of the sample. The decline in the percentage from 1996 to 1999 is likely to bethe result of the added new filter question. Thus it would not be appropriate to say, forexample, that in 2002 some 48% of Europeans are outright supporters of genetic testing.Rather it can be concluded that 48% of the ‘decided' Europeans ( those with one of thethree common logics) are outright supporters of genetic testing. On this basis we can bereasonably confident about observed changes in support and opposition from 1996 to2002.
-------------------------------- Europeans and Biotechnology in 2002 (2nd Edition: 21/03/03) -----------------------------
16
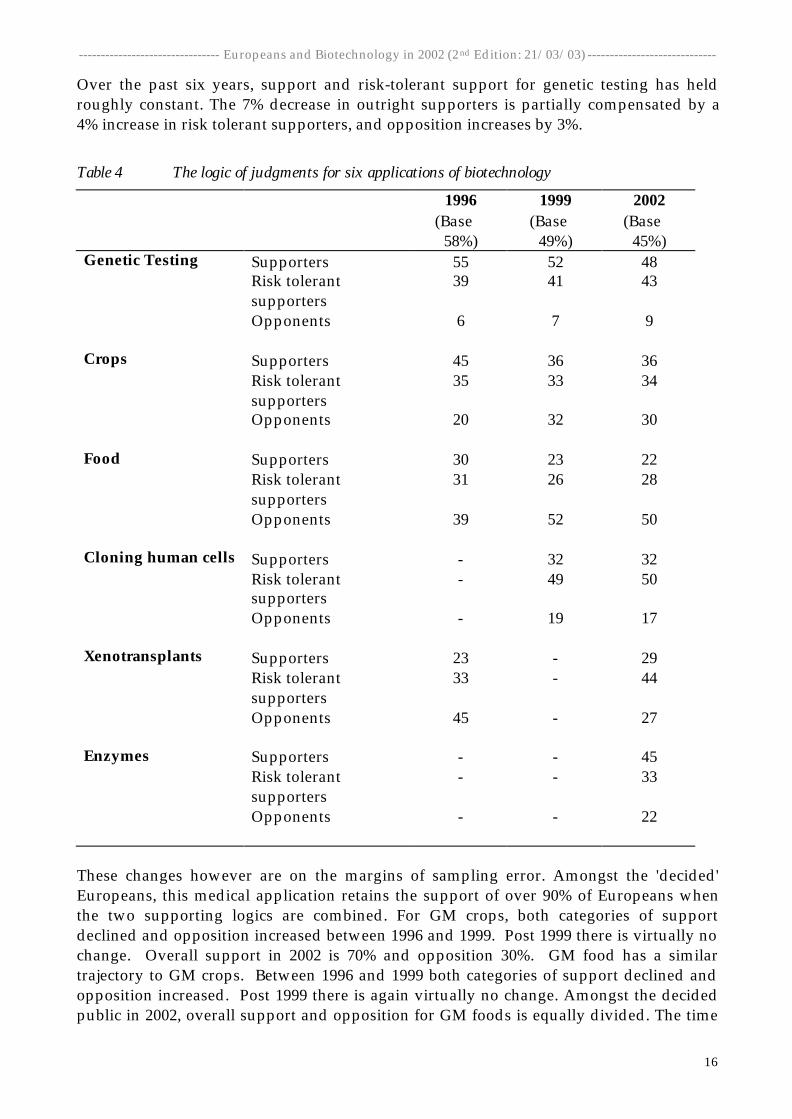
Over the past six years, support and risk-tolerant support for genetic testing has heldroughly constant. The 7% decrease in outright supporters is partially compensated by a4% increase in risk tolerant supporters, and opposition increases by 3%.
Table 4 The logic of judgments for six applications of biotechnology
1996(Base ≅
58%)
1999(Base ≅
49%)
2002(Base ≅
45%)Genetic Testing Supporters 55 52 48
Risk tolerantsupporters
39 41 43
Opponents 6 7 9
Crops Supporters 45 36 36Risk tolerantsupporters
35 33 34
Opponents 20 32 30
Food Supporters 30 23 22Risk tolerantsupporters
31 26 28
Opponents 39 52 50
Cloning human cells Supporters - 32 32Risk tolerantsupporters
- 49 50
Opponents - 19 17
Xenotransplants Supporters 23 - 29Risk tolerantsupporters
33 - 44
Opponents 45 - 27
Enzymes Supporters - - 45Risk tolerantsupporters
- - 33
Opponents - - 22
These changes however are on the margins of sampling error. Amongst the 'decided'Europeans, this medical application retains the support of over 90% of Europeans whenthe two supporting logics are combined. For GM crops, both categories of supportdeclined and opposition increased between 1996 and 1999. Post 1999 there is virtually nochange. Overall support in 2002 is 70% and opposition 30%. GM food has a similartrajectory to GM crops. Between 1996 and 1999 both categories of support declined andopposition increased. Post 1999 there is again virtually no change. Amongst the decidedpublic in 2002, overall support and opposition for GM foods is equally divided. The time
-------------------------------- Europeans and Biotechnology in 2002 (2nd Edition: 21/03/03) -----------------------------
17
series data for cloning human cells and tissues covers 1999 and 2002. Support for thisapplication is unchanged, with an aggregate level of 82%. For xenotransplantation, thetwo available time points are 1996 and 2002. Over the six year period, the two categories ofsupport increase from 56% to 73%, while opposition declines by 18% to 27%. Finally, inthe case of industrial GM enzymes, there are 78% supporters and 22% opponents withinthe decided public.
What general implications can be drawn from these shifts in the two types of support andopposition? To what extent do the observed changes in judgments of the specificapplications match the trend for biotechnological optimism? For genetic testing the trend,if any, is small. There is a hint of a movement from outright support to risk tolerantsupport and equally a hint of rising opposition. The most notable observation, however, isthe continued high level of support for this medical application. This, as will be seen insection 6, should not be interpreted as general support for genetic testing for otherpurposes, but limited, as suggested by the question wording, to testing for inheriteddiseases.
For GM crops and GM foods pattern of change corresponds in part to the trend previouslydescribed for biotechnological optimism. Here there was a consistent downward trendfrom 1991 to 1999 and then an appreciable increase between 1999 and 2002. GM crops andGM foods match the first part of this trend. Both categories of support declined between1996 and 1999, and opposition increased. Thereafter, but unlike biotechnologicaloptimism, which took an upward turn in the years 1999-2002, both GM crops and GMfoods stabilised. A similarly stable position over the period 1999-2002 is observed for thecloning of human cells and tissues.
4.3 How support, risk tolerant support and opposition has changed in theEuropean countries
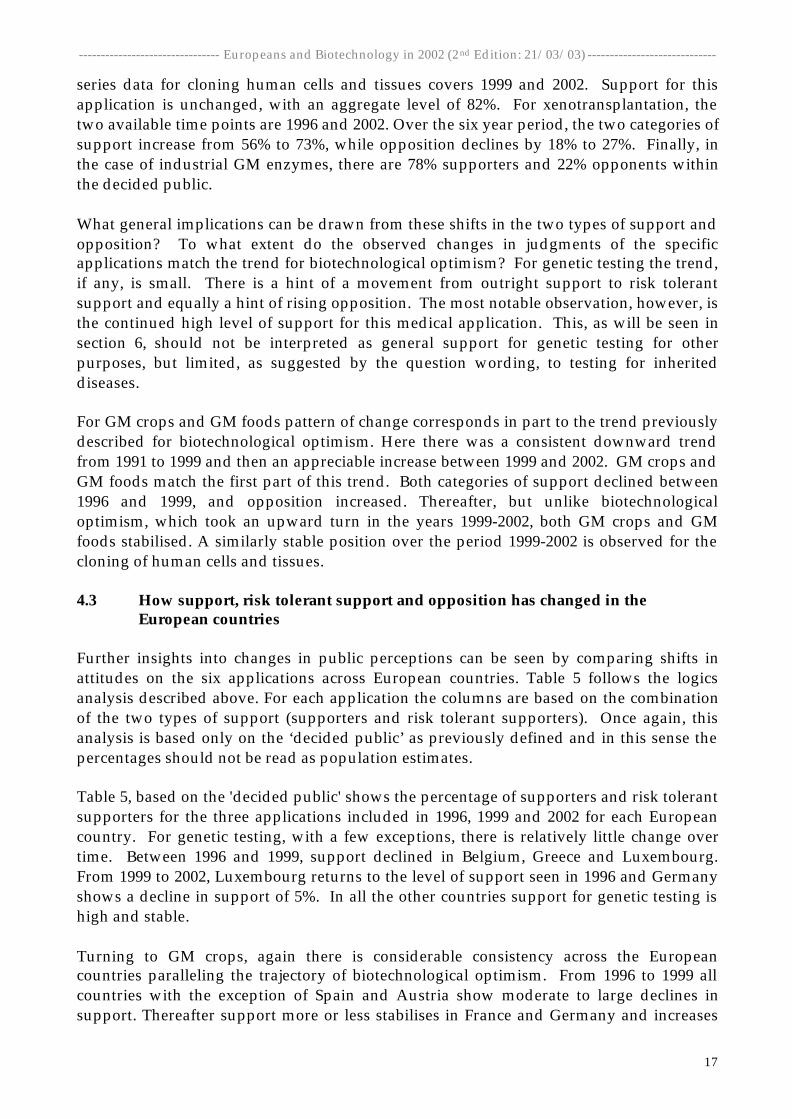
Further insights into changes in public perceptions can be seen by comparing shifts inattitudes on the six applications across European countries. Table 5 follows the logicsanalysis described above. For each application the columns are based on the combinationof the two types of support (supporters and risk tolerant supporters). Once again, thisanalysis is based only on the ‘decided public’ as previously defined and in this sense thepercentages should not be read as population estimates.
Table 5, based on the 'decided public' shows the percentage of supporters and risk tolerantsupporters for the three applications included in 1996, 1999 and 2002 for each Europeancountry. For genetic testing, with a few exceptions, there is relatively little change overtime. Between 1996 and 1999, support declined in Belgium, Greece and Luxembourg.From 1999 to 2002, Luxembourg returns to the level of support seen in 1996 and Germanyshows a decline in support of 5%. In all the other countries support for genetic testing ishigh and stable.
Turning to GM crops, again there is considerable consistency across the Europeancountries paralleling the trajectory of biotechnological optimism. From 1996 to 1999 allcountries with the exception of Spain and Austria show moderate to large declines insupport. Thereafter support more or less stabilises in France and Germany and increases
-------------------------------- Europeans and Biotechnology in 2002 (2nd Edition: 21/03/03) -----------------------------
18
in all the other countries with the exception of Italy, which sees a 10% decline in support.A rather similar and consistent pattern with a turning point in 1999 is observed for GMfoods.
Table 5 National changes in support for applications of biotechnology 1996-2002
Genetic Testing GM Crops GM Food1996 1999 2002 1996 1999 2002 1996 1999 2002
Belgium 95 90 92 89 74 80 72 47 56Denmark 91 91 93 68 58 73 43 35 45Germany 87 90 85 73 69 67 56 49 48Greece 97 91 92 77 45 54 49 19 24Italy 97 95 95 86 78 68 61 49 40Spain 96 94 94 86 87 91 80 70 74France 96 94 92 79 54 55 54 35 30Ireland 96 94 94 84 67 77 73 56 70Luxembourg 91 85 91 70 42 54 56 30 35Netherlands 93 96 96 87 82 85 78 75 65Portugal 97 96 93 90 81 84 72 55 68UK 97 96 95 85 63 75 67 47 63Finland 95 91 94 88 81 84 77 69 70Sweden 92 92 93 73 61 73 42 41 58Austria 74 78 78 39 41 57 31 30 47
With the exception of Sweden and Austria all the European countries show moderate tolarge declines in support over the years 1996-1999. Post 1999, the majority of countriesshow an increase in support for GM foods, as much as 16-17% in the UK, Sweden andAustria. The exceptions are Germany and Finland, which remain stable, and Italy, Franceand the Netherlands, which show further declines.
In the broader context of agri-food biotechnologies, Italy is an exceptional case in showingconsistent and large declines in support for both GM crops and GM foods from 1996 to2002. It is tempting to attribute this to the food culture as seen in the 'Slow Food'movement.
A further issue concerns those countries in which increases in support are observed in thepost 1999 period. Clearly this amounts to a decline in opposition, but what is the balancebetween increases in outright and risk tolerant support? Excluding France, Italy and theNetherlands the average change in levels of support from 1999 to 2002 in the other twelvecountries is 7%. Of these 6% are 'risk tolerant supporters' and 1% 'outright supporters'. Asimilar, but smaller trend is also observed for GM crops. The relatively greater increase inrisk tolerant support is suggestive of a decline in risk aversion.
5 The 'engaged' public of biotechnology
In this section, we develop a model of an ‘engaged’ public of biotechnology. This drawson two strands of research. The first links people’s attitudes to science with their scientificknowledge. The second linking participation in politics with political knowledge and
-------------------------------- Europeans and Biotechnology in 2002 (2nd Edition: 21/03/03) -----------------------------
19
interest. The relations between attitudes to biotechnology and levels of engagement withbiotechnology are then explored.
There has been a long standing interest in ‘scientific literacy’ and the public understandingof science.8, 9, 10 A scientifically literate public, it is argued, is a prerequisite for effectivedemocratic participation on issues of science and technology; all the more relevant asgovernments are increasingly taking up the idea of public participation and consultationabout the direction of new technological developments. Scientific literacy appeals to awidely held belief among scientists and regulators that an informed public will also tendto be more supportive of science and technology. This view, supported by findings ofmoderate correlations between scientific knowledge, and interest in and support forscience has been called the ‘deficit model’ of the public.11, 12, 13, 14, 15, 16 For instance, Allum,Boy and Bauer found that within most European countries, the correlation betweenscientific knowledge and a composite measure of attitudes to biotechnology rangedbetween 0.15 and 0.20.11 Evans and Durant found that scientific knowledge and generalattitudes to science in the UK were correlated at 0.30.15 Two implications follow from thismodel. Firstly, that opposition to new technologies is grounded in ignorance or mis-information, sometimes presumed to be the result of biased media reporting. Andsecondly, that information campaigns to inform the public about the ‘facts’ and methodsof science will be effective in cultivating greater public confidence in science andtechnology.
However, the finding that those who have greater scientific knowledge tend to be moresupportive of science and technology does not mean that scientific knowledge itself is thekey determinant of attitudes to science and technology. It might be just the reverse.Supporting science, for example in the belief that it will bring progress, may make peoplemore interested in matters of science, prompt them to be attentive to media coverage ofscience and encourage them to find out more about it. And the same could be true for theactive opponents of science and technology. Their critical position may well motivatethem to take a considerable interest in new scientific developments, which they see as athreat to society. Hence, the deficit model of the public as an explanation of publicattitudes to science and technology is open to question and the role of the centralconstruct, ‘scientific knowledge’ problematic. Perhaps the most that can be claimed, and itis not an unimportant claim, is that scientific knowledge, like knowledge of the politicalsystem for example, is a resource with which citizens may understand scientificdevelopments and contribute to public debates on such issues.
Our approach builds on the concept of the ‘issue public’, taken from political science.17
Members of the 'issue public' are more likely to be better informed and to seek out newinformation on political issues, to have a coherent belief system, more resistant attitudesand to be more likely to participate in political processes such as elections. We showedthat this concept could be usefully applied to public perceptions of biotechnology usingdata from the 1999 Eurobarometer survey.7
In light of these considerations, we identify the 'engaged' public of biotechnology usingnot only knowledge of biology and genetics, but also other relevant indicators. Theseconcern past and intended behaviours and awareness of biotechnological applications.
-------------------------------- Europeans and Biotechnology in 2002 (2nd Edition: 21/03/03) -----------------------------
20
5.1 Reported and intended behaviours
Respondents were asked three questions relevant to their engagement with biotechnology:
• 'Before today had you ever talked about modern biotechnology with anyone? (response categories: frequently, occasionally, once or twice, or never)
• 'I would take the time to read articles or watch TV programmes on the advantages anddisadvantages of developments in biotechnology' (response categories: tend to agree,tend to disagree and don’t know)
• 'I would be prepared to take part in public discussions or hearings about biotechnology’(response categories: tend to agree, tend to disagree and don’t know)
Those responding either 'frequently' or 'occasionally' to the first question were given ascore of one, as were those responding 'tend to agree' to the second and third questions.We would expect that these three behavioural indicators would be inter-correlated. Forexample, those who had talked about biotechnology before would be more likely to beinterested in a television programme on the topic. And this is confirmed by a test thatshows that the items form a cumulative scale with adequate statistical properties(Cronbach's alpha = 0.50). Hence we can create a summary score of behaviouralinvolvement for each respondent.
5.2 Awareness of biotechnologies
Following the concept of the issue public in political science, we expect, in accordancewith our results from the 1999 Eurobarometer that those who are behaviourally involvedwith biotechnology are likely to have heard more about the subject and, as such, be awareof a greater number of applications of biotechnology. Before respondents gave their viewson each of the three applications of biotechnology (as described in section 3) they wereasked the question
• "have you heard of this application of biotechnology before, or not?"
The three items form a reliable scale (Cronbach’s alpha = 0.67) and provide an index ofawareness of biotechnologies for each respondent, with a range from 0 to 3.
5.3 Knowledge of biology and genetics
The 1999 Eurobarometer survey included a set of questions about basic biology andgenetics, many of which were also asked in the 1996 survey. Respondents were asked tosay "true" or "false" in answer to each (a "Don't Know"' option was also available). Thequestions were of two types. First, there was textbook knowledge - the kind of facts that aperson might learn at school or from a popular science magazine or television programme.Seven such items were included in the survey.
The second type of knowledge question, while factual in nature, was also designed toassess what can be best described as menacing images of food biotechnology. For theseimage items, which were developed from qualitative research prior to the 1996Eurobarometer survey, an incorrect answer reflects a lack of scientific knowledge, but also
-------------------------------- Europeans and Biotechnology in 2002 (2nd Edition: 21/03/03) -----------------------------
21
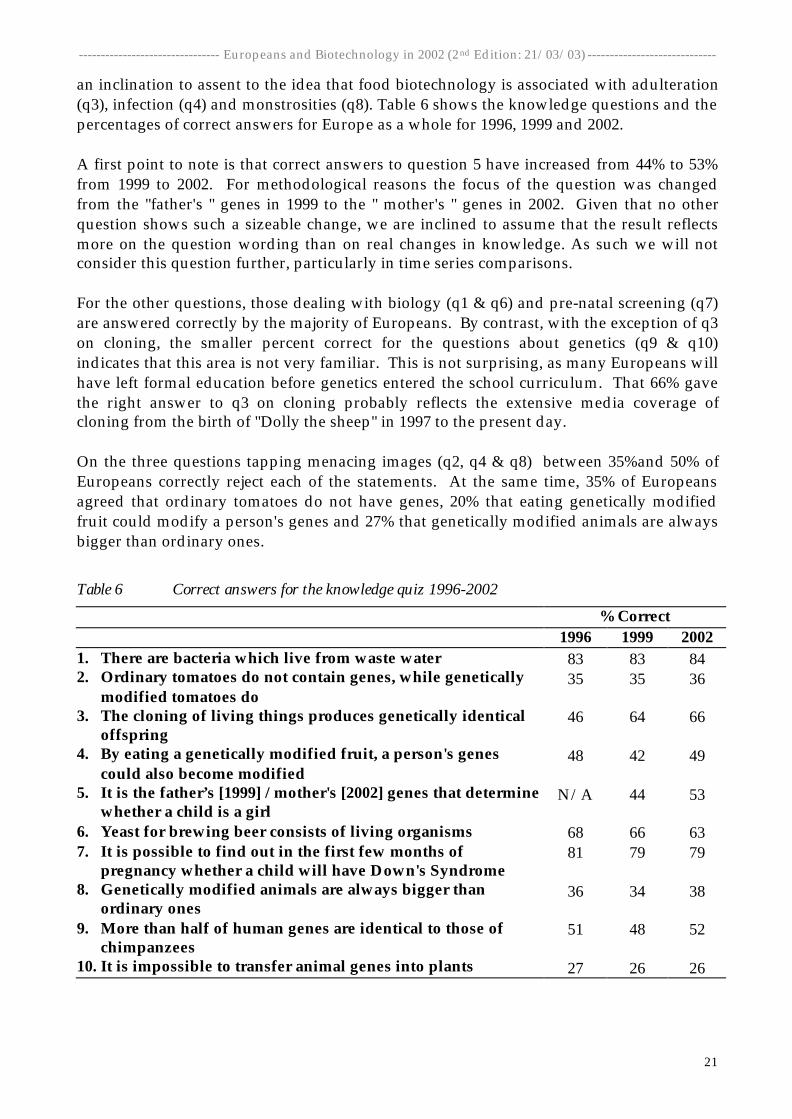
an inclination to assent to the idea that food biotechnology is associated with adulteration(q3), infection (q4) and monstrosities (q8). Table 6 shows the knowledge questions and thepercentages of correct answers for Europe as a whole for 1996, 1999 and 2002.
A first point to note is that correct answers to question 5 have increased from 44% to 53%from 1999 to 2002. For methodological reasons the focus of the question was changedfrom the "father's " genes in 1999 to the " mother's " genes in 2002. Given that no otherquestion shows such a sizeable change, we are inclined to assume that the result reflectsmore on the question wording than on real changes in knowledge. As such we will notconsider this question further, particularly in time series comparisons.
For the other questions, those dealing with biology (q1 & q6) and pre-natal screening (q7)are answered correctly by the majority of Europeans. By contrast, with the exception of q3on cloning, the smaller percent correct for the questions about genetics (q9 & q10)indicates that this area is not very familiar. This is not surprising, as many Europeans willhave left formal education before genetics entered the school curriculum. That 66% gavethe right answer to q3 on cloning probably reflects the extensive media coverage ofcloning from the birth of "Dolly the sheep" in 1997 to the present day.
On the three questions tapping menacing images (q2, q4 & q8) between 35%and 50% ofEuropeans correctly reject each of the statements. At the same time, 35% of Europeansagreed that ordinary tomatoes do not have genes, 20% that eating genetically modifiedfruit could modify a person's genes and 27% that genetically modified animals are alwaysbigger than ordinary ones.
Table 6 Correct answers for the knowledge quiz 1996-2002
% Correct 1996 1999 20021. There are bacteria which live from waste water 83 83 842. Ordinary tomatoes do not contain genes, while genetically
modified tomatoes do35 35 36
3. The cloning of living things produces genetically identicaloffspring
46 64 66
4. By eating a genetically modified fruit, a person's genescould also become modified
48 42 49
5. It is the father’s [1999] / mother's [2002] genes that determinewhether a child is a girl
N/A 44 53
6. Yeast for brewing beer consists of living organisms 68 66 637. It is possible to find out in the first few months of
pregnancy whether a child will have Down's Syndrome81 79 79
8. Genetically modified animals are always bigger thanordinary ones
36 34 38
9. More than half of human genes are identical to those ofchimpanzees
51 48 52
10. It is impossible to transfer animal genes into plants 27 26 26
-------------------------------- Europeans and Biotechnology in 2002 (2nd Edition: 21/03/03) -----------------------------
22
That about 20 and 35% of Europeans assent to these menacing image propositions doesnot necessarily mean that they actively held such views before being asked the question inthe survey interview. It is likely that many would not have thought about the issue before.Hence, a more realistic interpretation is that when asked these questions about theunfamiliar area of genetics, their general unease and possible anxieties about thetechnology leads them to assume the worst when asked about specific issues. This ismuch the same process as stereotyping. If a stereotype as a general evaluation is negative,then the holder is likely to impute negativity to all specific aspects of the object inquestion, including those of which they were previously unaware.
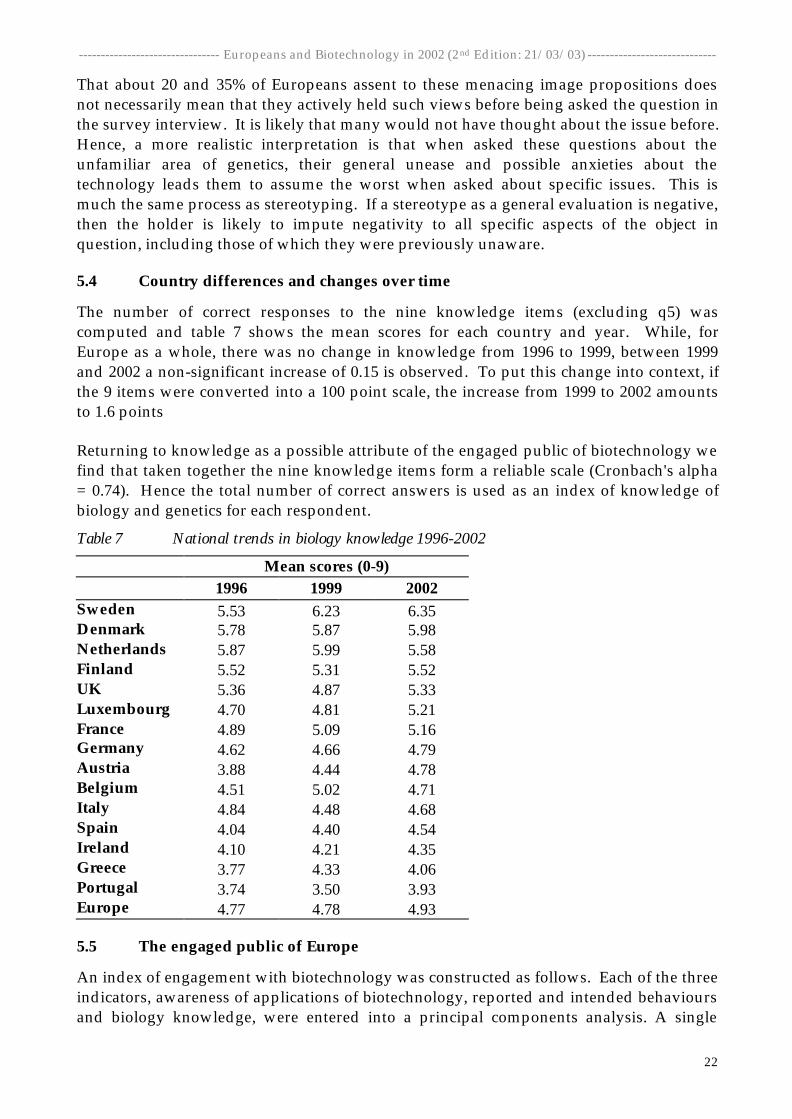
5.4 Country differences and changes over time
The number of correct responses to the nine knowledge items (excluding q5) wascomputed and table 7 shows the mean scores for each country and year. While, forEurope as a whole, there was no change in knowledge from 1996 to 1999, between 1999and 2002 a non-significant increase of 0.15 is observed. To put this change into context, ifthe 9 items were converted into a 100 point scale, the increase from 1999 to 2002 amountsto 1.6 points
Returning to knowledge as a possible attribute of the engaged public of biotechnology wefind that taken together the nine knowledge items form a reliable scale (Cronbach's alpha= 0.74). Hence the total number of correct answers is used as an index of knowledge ofbiology and genetics for each respondent.
Table 7 National trends in biology knowledge 1996-2002
Mean scores (0-9) 1996 1999 2002Sweden 5.53 6.23 6.35Denmark 5.78 5.87 5.98Netherlands 5.87 5.99 5.58Finland 5.52 5.31 5.52UK 5.36 4.87 5.33Luxembourg 4.70 4.81 5.21France 4.89 5.09 5.16Germany 4.62 4.66 4.79Austria 3.88 4.44 4.78Belgium 4.51 5.02 4.71Italy 4.84 4.48 4.68Spain 4.04 4.40 4.54Ireland 4.10 4.21 4.35Greece 3.77 4.33 4.06Portugal 3.74 3.50 3.93Europe 4.77 4.78 4.93
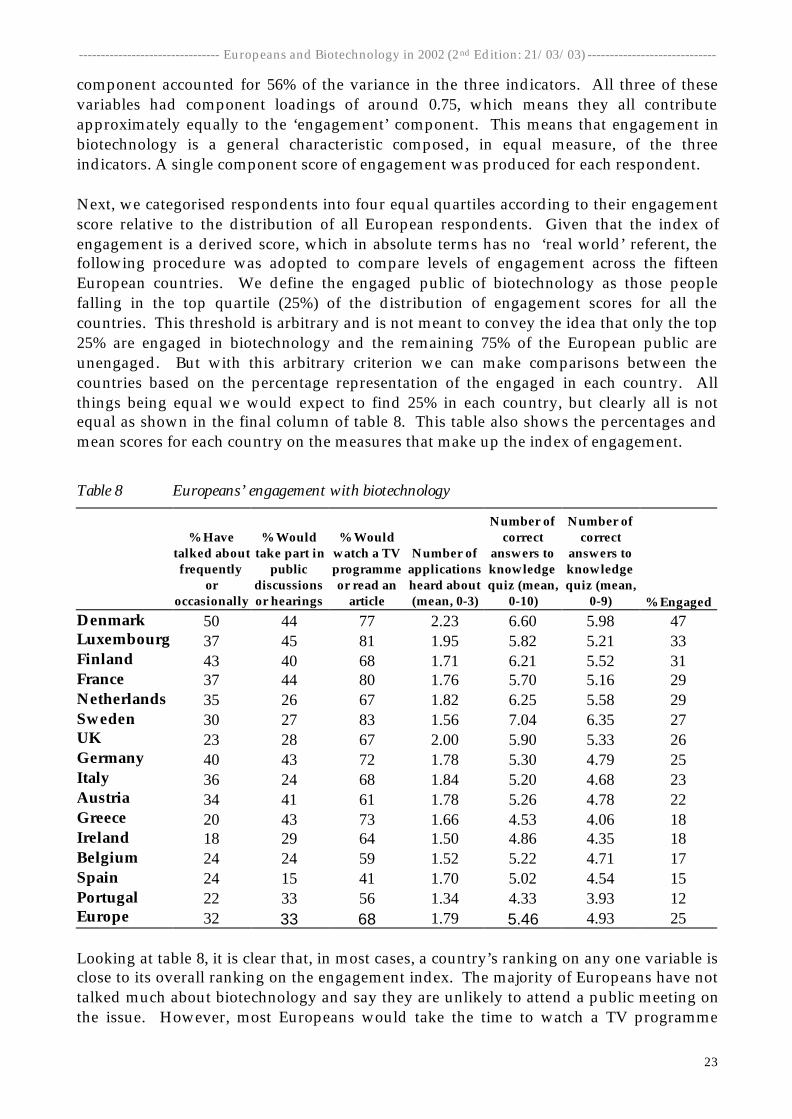
5.5 The engaged public of Europe
An index of engagement with biotechnology was constructed as follows. Each of the threeindicators, awareness of applications of biotechnology, reported and intended behavioursand biology knowledge, were entered into a principal components analysis. A single
-------------------------------- Europeans and Biotechnology in 2002 (2nd Edition: 21/03/03) -----------------------------
23
component accounted for 56% of the variance in the three indicators. All three of thesevariables had component loadings of around 0.75, which means they all contributeapproximately equally to the ‘engagement’ component. This means that engagement inbiotechnology is a general characteristic composed, in equal measure, of the threeindicators. A single component score of engagement was produced for each respondent.
Next, we categorised respondents into four equal quartiles according to their engagementscore relative to the distribution of all European respondents. Given that the index ofengagement is a derived score, which in absolute terms has no ‘real world’ referent, thefollowing procedure was adopted to compare levels of engagement across the fifteenEuropean countries. We define the engaged public of biotechnology as those peoplefalling in the top quartile (25%) of the distribution of engagement scores for all thecountries. This threshold is arbitrary and is not meant to convey the idea that only the top25% are engaged in biotechnology and the remaining 75% of the European public areunengaged. But with this arbitrary criterion we can make comparisons between thecountries based on the percentage representation of the engaged in each country. Allthings being equal we would expect to find 25% in each country, but clearly all is notequal as shown in the final column of table 8. This table also shows the percentages andmean scores for each country on the measures that make up the index of engagement.
Table 8 Europeans’ engagement with biotechnology
% Havetalked aboutfrequently
oroccasionally
% Wouldtake part in
publicdiscussionsor hearings
% Wouldwatch a TVprogrammeor read an
article
Number ofapplicationsheard about(mean, 0-3)
Number ofcorrect
answers toknowledgequiz (mean,
0-10)
Number ofcorrect
answers toknowledgequiz (mean,
0-9) % EngagedDenmark 50 44 77 2.23 6.60 5.98 47Luxembourg 37 45 81 1.95 5.82 5.21 33Finland 43 40 68 1.71 6.21 5.52 31France 37 44 80 1.76 5.70 5.16 29Netherlands 35 26 67 1.82 6.25 5.58 29Sweden 30 27 83 1.56 7.04 6.35 27UK 23 28 67 2.00 5.90 5.33 26Germany 40 43 72 1.78 5.30 4.79 25Italy 36 24 68 1.84 5.20 4.68 23Austria 34 41 61 1.78 5.26 4.78 22Greece 20 43 73 1.66 4.53 4.06 18Ireland 18 29 64 1.50 4.86 4.35 18Belgium 24 24 59 1.52 5.22 4.71 17Spain 24 15 41 1.70 5.02 4.54 15Portugal 22 33 56 1.34 4.33 3.93 12Europe 32 33 68 1.79 5.46 4.93 25
Looking at table 8, it is clear that, in most cases, a country’s ranking on any one variable isclose to its overall ranking on the engagement index. The majority of Europeans have nottalked much about biotechnology and say they are unlikely to attend a public meeting onthe issue. However, most Europeans would take the time to watch a TV programme
-------------------------------- Europeans and Biotechnology in 2002 (2nd Edition: 21/03/03) -----------------------------
24
about biotechnology and will previously have heard about two of the three applications ofbiotechnology that they were asked about in the survey.
The countries with the highest percentages of engaged public are Denmark, France,Luxembourg, Sweden, Finland and the Netherlands. With lower percentages arePortugal, Spain, Belgium, Greece, Austria and Ireland. The overall European patternreflects a 'north-south' divide, a pattern that would appear to correspond broadly both tothe onset of media coverage and of regulatory activities on biotechnology.18 But there areexceptions; Germany and the UK have a long history of regulation and of media reportingon biotechnology, yet they are close to the European mean.
One explanation for this is that the measure of engagement is a snapshot at a point in time– 2002, and it would be inappropriate to assume that levels of engagement are constantover time. While levels of engagement may reflect a longer term underlying interest inbiotechnology it might also reflect the extent to which biotechnology is a controversialissue within different countries at particular times.
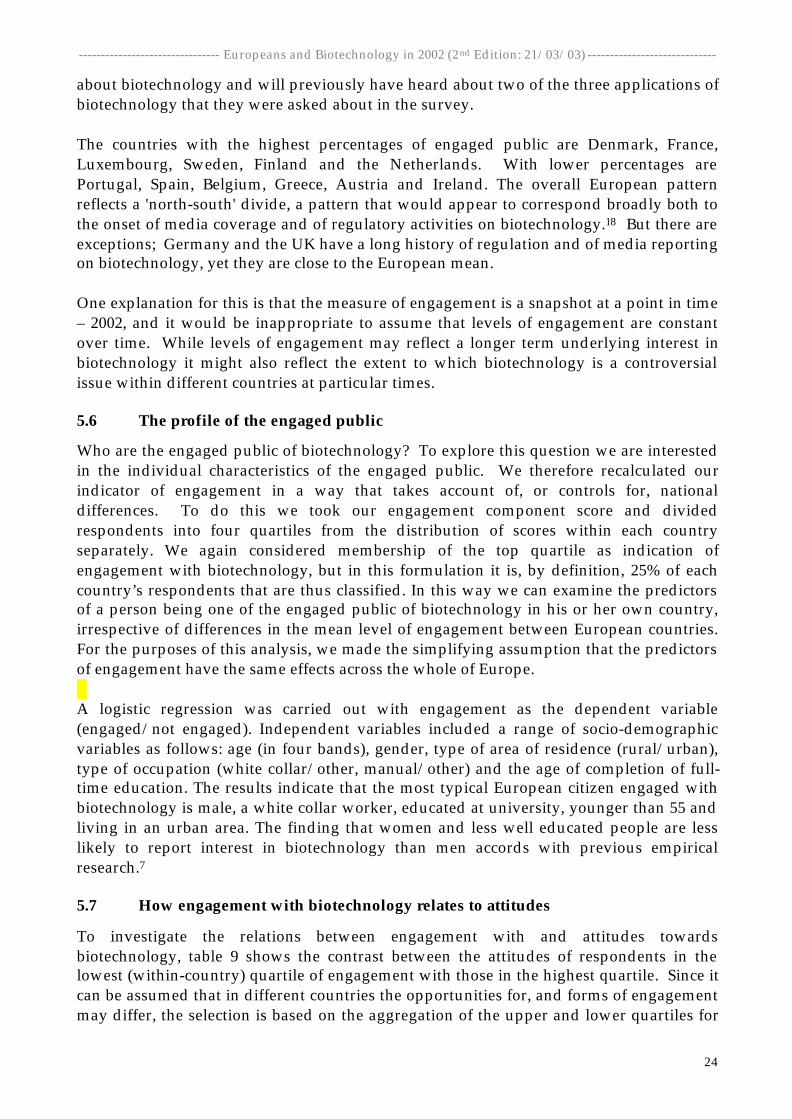
5.6 The profile of the engaged public
Who are the engaged public of biotechnology? To explore this question we are interestedin the individual characteristics of the engaged public. We therefore recalculated ourindicator of engagement in a way that takes account of, or controls for, nationaldifferences. To do this we took our engagement component score and dividedrespondents into four quartiles from the distribution of scores within each countryseparately. We again considered membership of the top quartile as indication ofengagement with biotechnology, but in this formulation it is, by definition, 25% of eachcountry’s respondents that are thus classified. In this way we can examine the predictorsof a person being one of the engaged public of biotechnology in his or her own country,irrespective of differences in the mean level of engagement between European countries.For the purposes of this analysis, we made the simplifying assumption that the predictorsof engagement have the same effects across the whole of Europe.
A logistic regression was carried out with engagement as the dependent variable(engaged/not engaged). Independent variables included a range of socio-demographicvariables as follows: age (in four bands), gender, type of area of residence (rural/urban),type of occupation (white collar/other, manual/other) and the age of completion of full-time education. The results indicate that the most typical European citizen engaged withbiotechnology is male, a white collar worker, educated at university, younger than 55 andliving in an urban area. The finding that women and less well educated people are lesslikely to report interest in biotechnology than men accords with previous empiricalresearch.7
5.7 How engagement with biotechnology relates to attitudes
To investigate the relations between engagement with and attitudes towardsbiotechnology, table 9 shows the contrast between the attitudes of respondents in thelowest (within-country) quartile of engagement with those in the highest quartile. Since itcan be assumed that in different countries the opportunities for, and forms of engagementmay differ, the selection is based on the aggregation of the upper and lower quartiles for
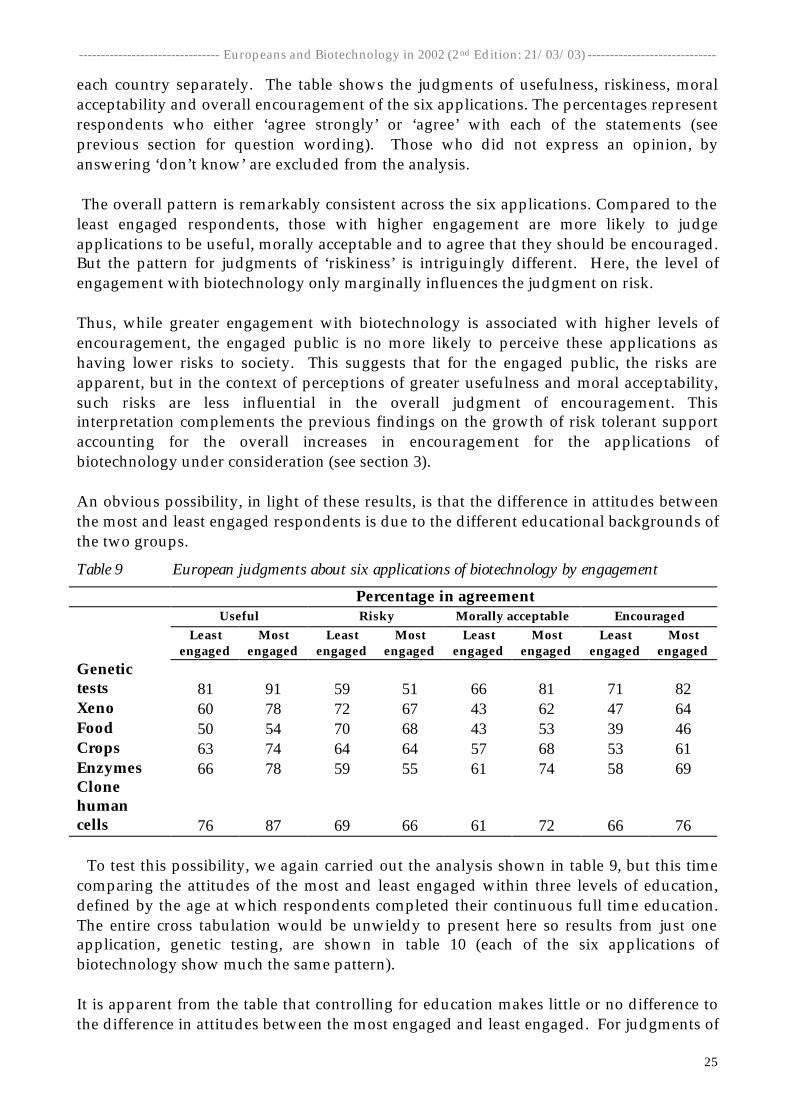
-------------------------------- Europeans and Biotechnology in 2002 (2nd Edition: 21/03/03) -----------------------------
25
each country separately. The table shows the judgments of usefulness, riskiness, moralacceptability and overall encouragement of the six applications. The percentages representrespondents who either ‘agree strongly’ or ‘agree’ with each of the statements (seeprevious section for question wording). Those who did not express an opinion, byanswering ‘don’t know’ are excluded from the analysis.
The overall pattern is remarkably consistent across the six applications. Compared to theleast engaged respondents, those with higher engagement are more likely to judgeapplications to be useful, morally acceptable and to agree that they should be encouraged.But the pattern for judgments of ‘riskiness’ is intriguingly different. Here, the level ofengagement with biotechnology only marginally influences the judgment on risk.
Thus, while greater engagement with biotechnology is associated with higher levels ofencouragement, the engaged public is no more likely to perceive these applications ashaving lower risks to society. This suggests that for the engaged public, the risks areapparent, but in the context of perceptions of greater usefulness and moral acceptability,such risks are less influential in the overall judgment of encouragement. Thisinterpretation complements the previous findings on the growth of risk tolerant supportaccounting for the overall increases in encouragement for the applications ofbiotechnology under consideration (see section 3).
An obvious possibility, in light of these results, is that the difference in attitudes betweenthe most and least engaged respondents is due to the different educational backgrounds ofthe two groups.
Table 9 European judgments about six applications of biotechnology by engagement
Percentage in agreementUseful Risky Morally acceptable Encouraged
Leastengaged
Mostengaged
Leastengaged
Mostengaged
Leastengaged
Mostengaged
Leastengaged
Mostengaged
Genetictests 81 91 59 51 66 81 71 82Xeno 60 78 72 67 43 62 47 64Food 50 54 70 68 43 53 39 46Crops 63 74 64 64 57 68 53 61Enzymes 66 78 59 55 61 74 58 69Clonehumancells 76 87 69 66 61 72 66 76
To test this possibility, we again carried out the analysis shown in table 9, but this timecomparing the attitudes of the most and least engaged within three levels of education,defined by the age at which respondents completed their continuous full time education.The entire cross tabulation would be unwieldy to present here so results from just oneapplication, genetic testing, are shown in table 10 (each of the six applications ofbiotechnology show much the same pattern).
It is apparent from the table that controlling for education makes little or no difference tothe difference in attitudes between the most engaged and least engaged. For judgments of
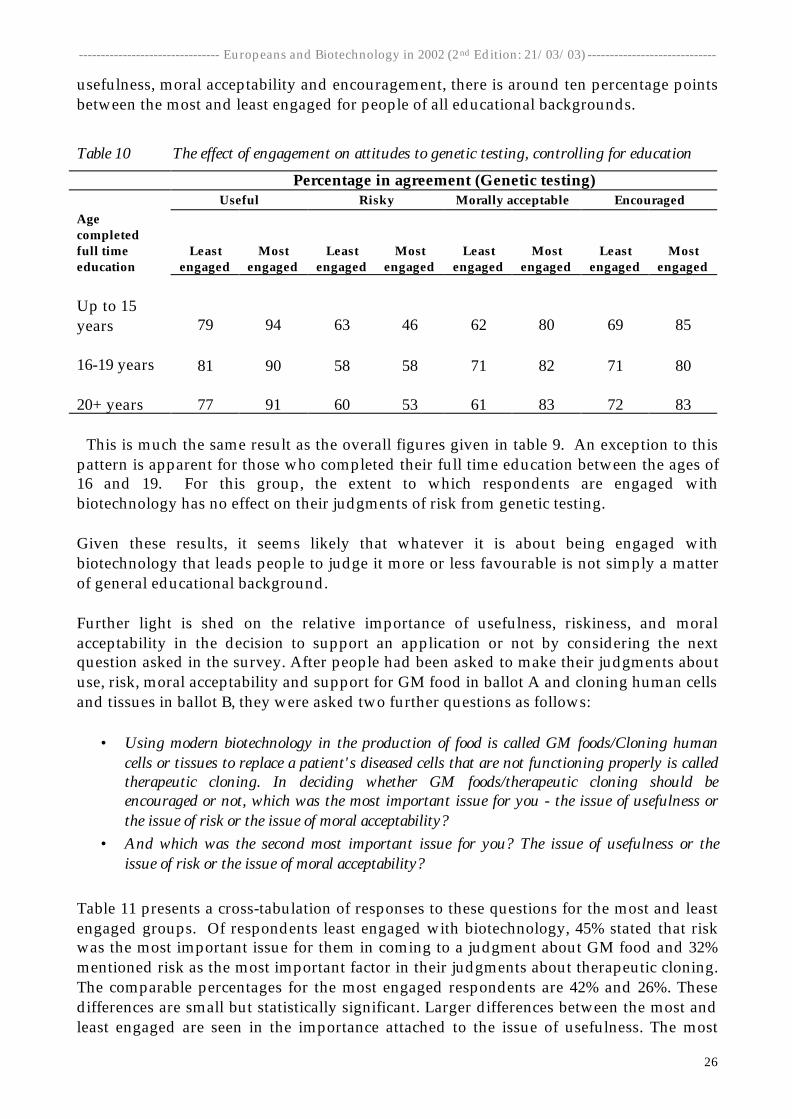
-------------------------------- Europeans and Biotechnology in 2002 (2nd Edition: 21/03/03) -----------------------------
26
usefulness, moral acceptability and encouragement, there is around ten percentage pointsbetween the most and least engaged for people of all educational backgrounds.
Table 10 The effect of engagement on attitudes to genetic testing, controlling for education
Percentage in agreement (Genetic testing)Useful Risky Morally acceptable Encouraged
Agecompletedfull timeeducation
Leastengaged
Mostengaged
Leastengaged
Mostengaged
Leastengaged
Mostengaged
Leastengaged
Mostengaged
Up to 15years 79 94 63 46 62 80 69 85
16-19 years 81 90 58 58 71 82 71 80
20+ years 77 91 60 53 61 83 72 83
This is much the same result as the overall figures given in table 9. An exception to thispattern is apparent for those who completed their full time education between the ages of16 and 19. For this group, the extent to which respondents are engaged withbiotechnology has no effect on their judgments of risk from genetic testing.
Given these results, it seems likely that whatever it is about being engaged withbiotechnology that leads people to judge it more or less favourable is not simply a matterof general educational background.
Further light is shed on the relative importance of usefulness, riskiness, and moralacceptability in the decision to support an application or not by considering the nextquestion asked in the survey. After people had been asked to make their judgments aboutuse, risk, moral acceptability and support for GM food in ballot A and cloning human cellsand tissues in ballot B, they were asked two further questions as follows:
• Using modern biotechnology in the production of food is called GM foods/Cloning humancells or tissues to replace a patient's diseased cells that are not functioning properly is calledtherapeutic cloning. In deciding whether GM foods/therapeutic cloning should beencouraged or not, which was the most important issue for you - the issue of usefulness orthe issue of risk or the issue of moral acceptability?
• And which was the second most important issue for you? The issue of usefulness or theissue of risk or the issue of moral acceptability?
Table 11 presents a cross-tabulation of responses to these questions for the most and leastengaged groups. Of respondents least engaged with biotechnology, 45% stated that riskwas the most important issue for them in coming to a judgment about GM food and 32%mentioned risk as the most important factor in their judgments about therapeutic cloning.The comparable percentages for the most engaged respondents are 42% and 26%. Thesedifferences are small but statistically significant. Larger differences between the most andleast engaged are seen in the importance attached to the issue of usefulness. The most
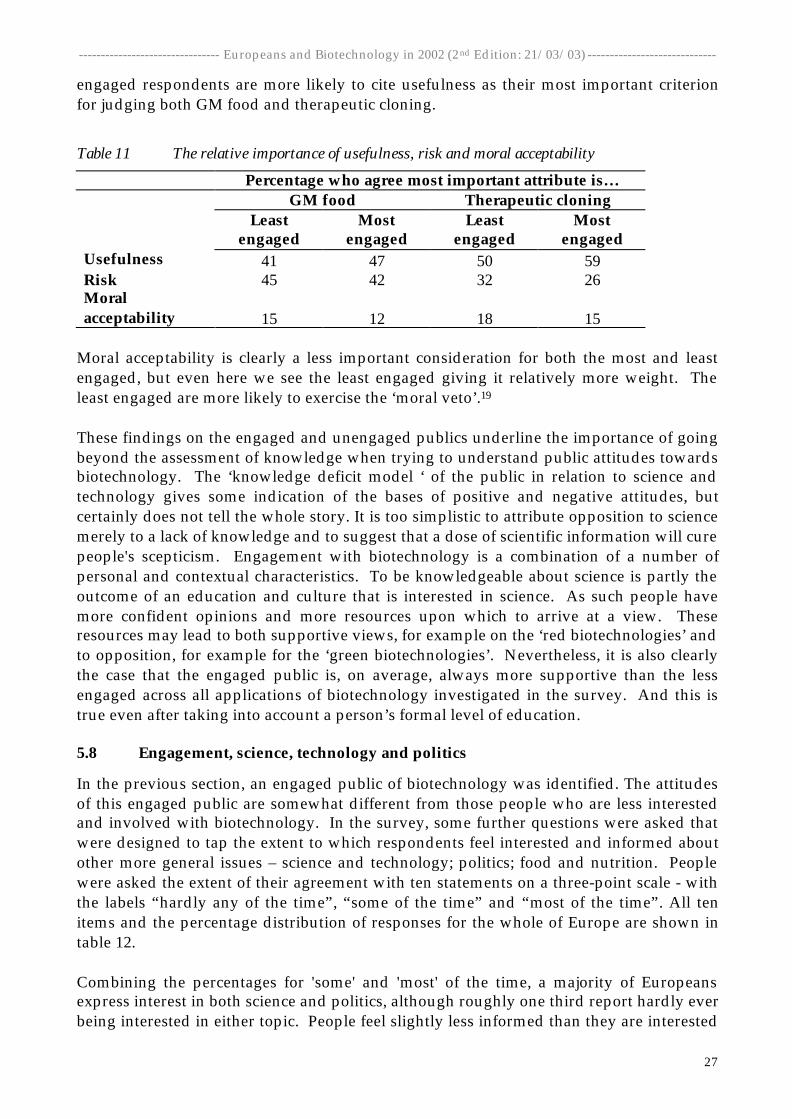
-------------------------------- Europeans and Biotechnology in 2002 (2nd Edition: 21/03/03) -----------------------------
27
engaged respondents are more likely to cite usefulness as their most important criterionfor judging both GM food and therapeutic cloning.
Table 11 The relative importance of usefulness, risk and moral acceptability
Percentage who agree most important attribute is…GM food Therapeutic cloning
Leastengaged
Mostengaged
Leastengaged
Mostengaged
Usefulness 41 47 50 59Risk 45 42 32 26Moralacceptability 15 12 18 15
Moral acceptability is clearly a less important consideration for both the most and leastengaged, but even here we see the least engaged giving it relatively more weight. Theleast engaged are more likely to exercise the ‘moral veto’.19
These findings on the engaged and unengaged publics underline the importance of goingbeyond the assessment of knowledge when trying to understand public attitudes towardsbiotechnology. The ‘knowledge deficit model ‘ of the public in relation to science andtechnology gives some indication of the bases of positive and negative attitudes, butcertainly does not tell the whole story. It is too simplistic to attribute opposition to sciencemerely to a lack of knowledge and to suggest that a dose of scientific information will curepeople's scepticism. Engagement with biotechnology is a combination of a number ofpersonal and contextual characteristics. To be knowledgeable about science is partly theoutcome of an education and culture that is interested in science. As such people havemore confident opinions and more resources upon which to arrive at a view. Theseresources may lead to both supportive views, for example on the ‘red biotechnologies’ andto opposition, for example for the ‘green biotechnologies’. Nevertheless, it is also clearlythe case that the engaged public is, on average, always more supportive than the lessengaged across all applications of biotechnology investigated in the survey. And this istrue even after taking into account a person’s formal level of education.
5.8 Engagement, science, technology and politics
In the previous section, an engaged public of biotechnology was identified. The attitudesof this engaged public are somewhat different from those people who are less interestedand involved with biotechnology. In the survey, some further questions were asked thatwere designed to tap the extent to which respondents feel interested and informed aboutother more general issues – science and technology; politics; food and nutrition. Peoplewere asked the extent of their agreement with ten statements on a three-point scale - withthe labels “hardly any of the time”, “some of the time” and “most of the time”. All tenitems and the percentage distribution of responses for the whole of Europe are shown intable 12.
Combining the percentages for 'some' and 'most' of the time, a majority of Europeansexpress interest in both science and politics, although roughly one third report hardly everbeing interested in either topic. People feel slightly less informed than they are interested
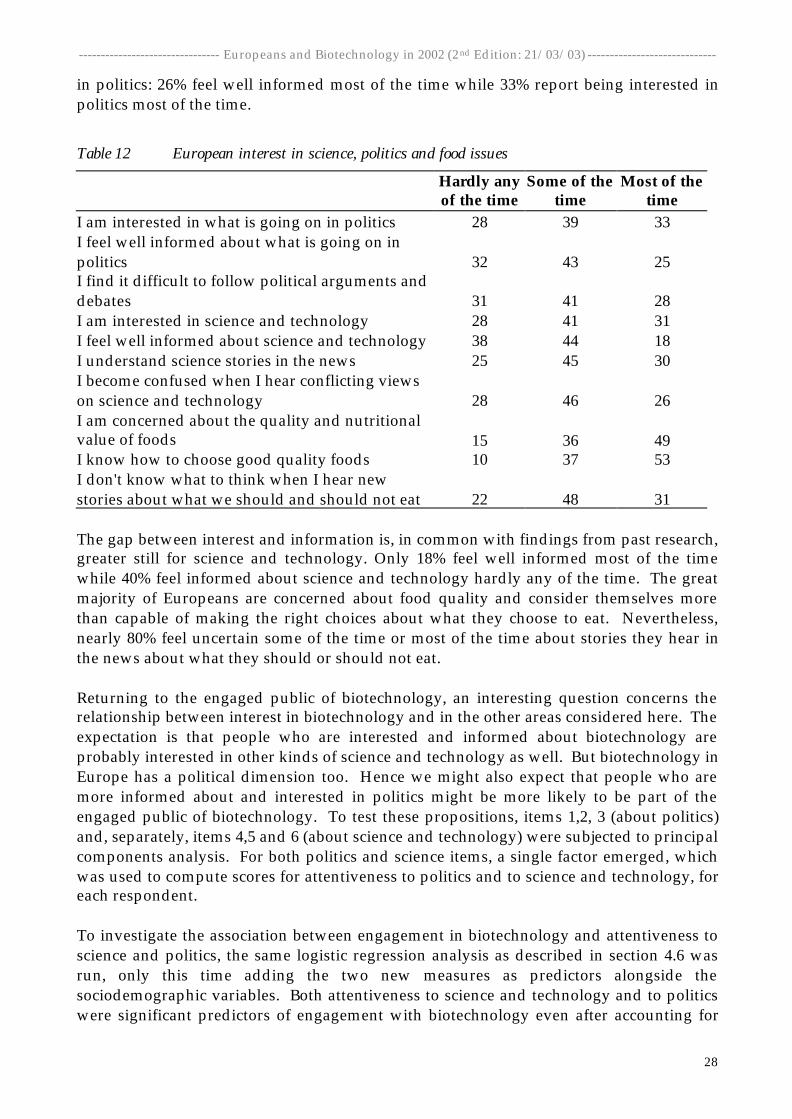
-------------------------------- Europeans and Biotechnology in 2002 (2nd Edition: 21/03/03) -----------------------------
28
in politics: 26% feel well informed most of the time while 33% report being interested inpolitics most of the time.
Table 12 European interest in science, politics and food issues
Hardly anyof the time
Some of thetime
Most of thetime
I am interested in what is going on in politics 28 39 33I feel well informed about what is going on inpolitics 32 43 25I find it difficult to follow political arguments anddebates 31 41 28I am interested in science and technology 28 41 31I feel well informed about science and technology 38 44 18I understand science stories in the news 25 45 30I become confused when I hear conflicting viewson science and technology 28 46 26I am concerned about the quality and nutritionalvalue of foods 15 36 49I know how to choose good quality foods 10 37 53I don't know what to think when I hear newstories about what we should and should not eat 22 48 31
The gap between interest and information is, in common with findings from past research,greater still for science and technology. Only 18% feel well informed most of the timewhile 40% feel informed about science and technology hardly any of the time. The greatmajority of Europeans are concerned about food quality and consider themselves morethan capable of making the right choices about what they choose to eat. Nevertheless,nearly 80% feel uncertain some of the time or most of the time about stories they hear inthe news about what they should or should not eat.
Returning to the engaged public of biotechnology, an interesting question concerns therelationship between interest in biotechnology and in the other areas considered here. Theexpectation is that people who are interested and informed about biotechnology areprobably interested in other kinds of science and technology as well. But biotechnology inEurope has a political dimension too. Hence we might also expect that people who aremore informed about and interested in politics might be more likely to be part of theengaged public of biotechnology. To test these propositions, items 1,2, 3 (about politics)and, separately, items 4,5 and 6 (about science and technology) were subjected to principalcomponents analysis. For both politics and science items, a single factor emerged, whichwas used to compute scores for attentiveness to politics and to science and technology, foreach respondent.
To investigate the association between engagement in biotechnology and attentiveness toscience and politics, the same logistic regression analysis as described in section 4.6 wasrun, only this time adding the two new measures as predictors alongside thesociodemographic variables. Both attentiveness to science and technology and to politicswere significant predictors of engagement with biotechnology even after accounting for
-------------------------------- Europeans and Biotechnology in 2002 (2nd Edition: 21/03/03) -----------------------------
29
age, education and social class. Interestingly, with the two new predictors included in theanalysis, the effects of gender and of living in a rural area, on engagement become non-significant. The implication is that women and rural dwellers are less interested inbiotechnology than men and urban residents because they tend to be less attentive toscience, technology and politics in general.
The evidence from these analyses is that biotechnology does not attract the interest of anarrow group of Europeans who are particularly exercised by this issue alone. Rather itseems that those who are most engaged with biotechnology are ‘generalists’ - people thathave interests in a wider range of public affairs.20 Hence, interest in politics, science andtechnology and biotechnology is akin to a way of life, an attitude of mind and a set ofinformation seeking habits and behaviours. To the extent that the more engaged publictends to express more positive opinions about biotechnology than sections of theEuropean public that are less engaged, it seems that public opinion on this issue will belinked to the credibility of political and scientific institutions more widely than thosesolely concerned with biotechnology.
6 Confidence in key actors and trust in sources of information
This section explores the prevalence of confidence in actors involved in biotechnology andtrust in sources of information. For the greater majority of Europeans, biotechnology isnot a part of everyday personal experience. People come to know about new scientificdiscoveries and technological developments from television, radio, newspapers andmagazines. In this way an understanding of biotechnology draws on 'second hand', ormediated, information rather than personal experience. Exposed to mediated information,questions may arise: are the sources credible? Are these actors competent to pronounce ofsuch matters? Are they motivated by sectional interests or have they the public interest inmind?21
Such questions raise the issues of trust and confidence22, which have been researched inrelation to science and technology since the emergence of nuclear power.23 It has beenargued that without confidence in key actors - scientists, regulators etc, people are likely tohave exaggerated perceptions of risks, as the assurances provided by the experts that therisks are low or manageable are treated with scepticism. In the Eurobarometer survey twoforms of questioning on the issue of confidence and trust were used. Respondents wereasked "Now I’m going to ask you about some people and groups involved in the variousapplications of modern biotechnology and genetic engineering. Do you suppose they are doing agood job for society or not doing a good job for society?”
The judgment of an actor group as 'doing a good job for society', is likely to be based on aview that the actor is both competent and behaves in a socially responsible way. Thus,‘doing a good job’ constitutes a proxy measure of confidence. For those respondents whoexpress a view, that is excluding the "don’t know" responses, subtracting the percentageof respondents who say 'doing a good job' for those saying 'doing a bad job' provides anestimate of the relative levels of confidence in different actors.
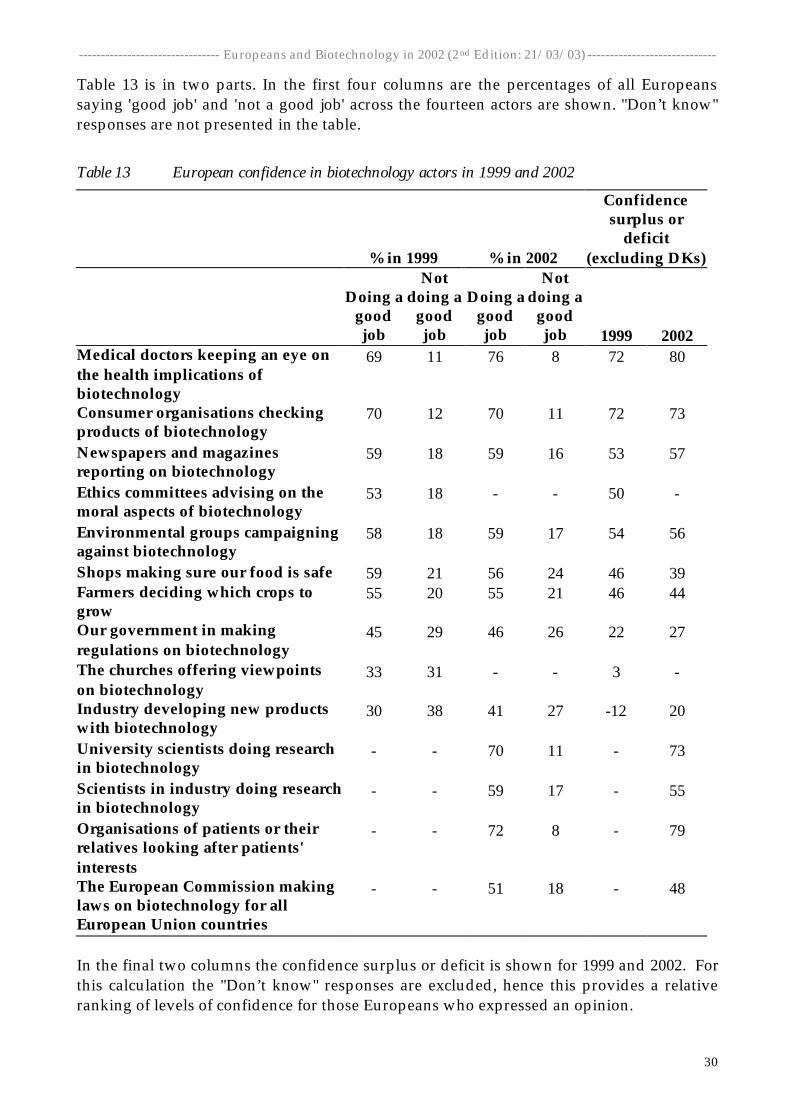
-------------------------------- Europeans and Biotechnology in 2002 (2nd Edition: 21/03/03) -----------------------------
30
Table 13 is in two parts. In the first four columns are the percentages of all Europeanssaying 'good job' and 'not a good job' across the fourteen actors are shown. "Don’t know"responses are not presented in the table.
Table 13 European confidence in biotechnology actors in 1999 and 2002
% in 1999 % in 2002
Confidencesurplus or
deficit(excluding DKs)
Doing a
goodjob
Notdoing a
goodjob
Doing agoodjob
Notdoing a
goodjob 1999 2002
Medical doctors keeping an eye onthe health implications ofbiotechnology
69 11 76 8 72 80
Consumer organisations checkingproducts of biotechnology
70 12 70 11 72 73
Newspapers and magazinesreporting on biotechnology
59 18 59 16 53 57
Ethics committees advising on themoral aspects of biotechnology
53 18 - - 50 -
Environmental groups campaigningagainst biotechnology
58 18 59 17 54 56
Shops making sure our food is safe 59 21 56 24 46 39Farmers deciding which crops togrow
55 20 55 21 46 44
Our government in makingregulations on biotechnology
45 29 46 26 22 27
The churches offering viewpointson biotechnology
33 31 - - 3 -
Industry developing new productswith biotechnology
30 38 41 27 -12 20
University scientists doing researchin biotechnology
- - 70 11 - 73
Scientists in industry doing researchin biotechnology
- - 59 17 - 55
Organisations of patients or theirrelatives looking after patients'interests
- - 72 8 - 79
The European Commission makinglaws on biotechnology for allEuropean Union countries
- - 51 18 - 48
In the final two columns the confidence surplus or deficit is shown for 1999 and 2002. Forthis calculation the "Don’t know" responses are excluded, hence this provides a relativeranking of levels of confidence for those Europeans who expressed an opinion.
-------------------------------- Europeans and Biotechnology in 2002 (2nd Edition: 21/03/03) -----------------------------
31
Looking at the actual percentages for 2002 (data columns 3 and 4) around 70% ofEuropeans have confidence in doctors, university scientists, consumer organisations andpatients' organisations. Between 50% and 59% have confidence in scientists working inindustry, newspapers and magazines, environmental groups, shops, farmers and theEuropean Commission. However, less than 50% have confidence in their own governmentand in industry. For all the actors mentioned more European think they are each doing agood job than a bad job. Yet, across Europe as a whole between 20% and 27% lackconfidence in farmers, shops, government and industry.
Comparing 2002 to 1999 the responses are rather consistent. The exceptions, are industryand to a much lesser extent shops. Industry gains the confidence of 11% more people andconfidence in shops declines by 3%.
A second way of looking at the data is to consider only those respondents who expressedan opinion either way. Because the level of "Don’t know" responses varies considerablyacross the actors, the differences between the percentage saying 'doing an good job' and'doing a bad job' provides a confidence surplus/deficit index for comparisons acrossactors and across time.
For 2002, all of the actors have a confidence surplus. Those actors with a higherconfidence surplus include doctors, patients’ organisations, university scientists andconsumers' organisations. At the lower end, but still with a confidence surplus areindustry, government, farmers and shops. Two contrasts are of note. There is moreconfidence in the European Commission, than in national governments in relation toregulation – the confidence surpluses are 52% and 43% respectively. And there is moreconfidence in university scientists than for scientists working in industry – confidencesurpluses of 76% and 56% respectively.
Turning to the changes from 1999 to 2002, the most dramatic is seen in the perception ofindustry. In 1999 there was a confidence deficit for industry of minus 10%, but by 2002this has shifted into a surplus of 23%. Table 14 shows how the confidence surplus/deficithas changed across the European countries.
With the exception of the Netherlands and Portugal, which show small increases inconfidence surplus, in all other countries substantial shifts towards greater confidence areobserved. Of note is the change from a confidence deficit to a confidence surplus inDenmark (35), Greece (61), France (50), UK (45) and Austria (56).
What could account for such a shift in the confidence in industry across Europe? Could itbe related to greater confidence in national regulation and relatively high confidence in theEuropean Commission? Another plausible explanation is that the connotations of the term"industry" have changed over the three years. In 1999 the term "industry" may have beenassociated with the controversial agri-food technologies. By 2002 agri-food biotechnologieshave increasingly become a regulatory issue, biomedical discoveries have been prominentand as such the immediate associations linked to "industry" have shifted towards bio-medical technologies.
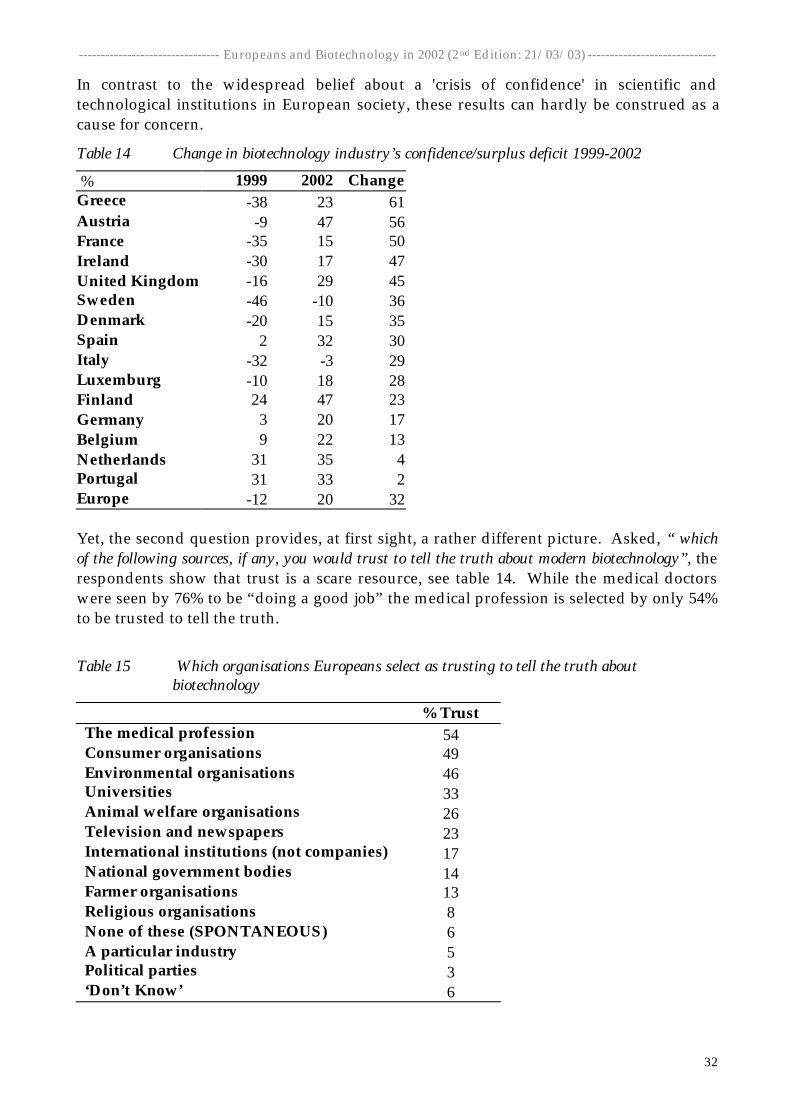
-------------------------------- Europeans and Biotechnology in 2002 (2nd Edition: 21/03/03) -----------------------------
32
In contrast to the widespread belief about a 'crisis of confidence' in scientific andtechnological institutions in European society, these results can hardly be construed as acause for concern.
Table 14 Change in biotechnology industry’s confidence/surplus deficit 1999-2002
% 1999 2002 ChangeGreece -38 23 61Austria -9 47 56France -35 15 50Ireland -30 17 47United Kingdom -16 29 45Sweden -46 -10 36Denmark -20 15 35Spain 2 32 30Italy -32 -3 29Luxemburg -10 18 28Finland 24 47 23Germany 3 20 17Belgium 9 22 13Netherlands 31 35 4Portugal 31 33 2Europe -12 20 32
Yet, the second question provides, at first sight, a rather different picture. Asked, “ whichof the following sources, if any, you would trust to tell the truth about modern biotechnology”, therespondents show that trust is a scare resource, see table 14. While the medical doctorswere seen by 76% to be “doing a good job” the medical profession is selected by only 54%to be trusted to tell the truth.
Table 15 Which organisations Europeans select as trusting to tell the truth aboutbiotechnology
% TrustThe medical profession 54Consumer organisations 49Environmental organisations 46Universities 33Animal welfare organisations 26Television and newspapers 23International institutions (not companies) 17National government bodies 14Farmer organisations 13Religious organisations 8None of these (SPONTANEOUS) 6A particular industry 5Political parties 3‘Don’t Know’ 6
-------------------------------- Europeans and Biotechnology in 2002 (2nd Edition: 21/03/03) -----------------------------
33
In order of trustworthiness, the medical profession is followed by consumers’organisations, environmental organisations, universities, and television and the media.National government bodies achieve only 14% and industry 5%.
The time series data (table 16) show that across the years 1991 to 2002 the ranking of theorganisations in terms of trustworthiness is very consistent. Only in the case ofenvironmental and consumer organisations is there a change. Equally, for eachorganisation, the percentage of Europeans selecting them as trustworthy is fairly stable.It is of note that in the period 1996 to 1999, which elsewhere we termed the 'watershedyears',24 trust in all the organisations declines.
Table 16 Trust in organisations 1991-2002
1991 1993 1996 1999 2002Consumer organisations 52 55 58 55 49Environmentalorganisations
53 61 56 45 46
Universities 37 39 35 25 33Animal welfareorganisations
29 32 31 25 26
National governmentbodies
20 17 17 15 14
Religious organisations 10 8 12 8 8A particular industry 6 6 7 4 5Political parties 5 4 7 3 3
This parallels a steep decline in optimism about biotechnology (section 3) and in supportfor GM crops and GM foods (section 4). Post 1999 trust stabilises with the exception ofconsumer organisation, which see a further decline and universities which recover fromthe low figure of 1999.While the rank ordering of actors “doing a good job” and organisations “trusted to tell thetruth” is broadly comparable, the discrepancy between the two indicators invites somediscussion. There are two issues here, the first concerns the form of the question, thesecond about the concept of trust, more generally. To ask which of a list of twelveorganisations one "trusts to tell the truth about biotechnology" may be interpreted byrespondents as inviting them to select those they would trust the most. This is supportedby the finding that in 2002, on average, respondents selected about three of the twelveorganisations. Since respondents were not asked who they would not trust, all we canconclude is that some are trusted more than others, but not that those organisationsselected only infrequently are distrusted.
The second consideration concerns the nature of trust itself. Trust is often part of the takenfor granted and is not the focus of deliberation.25 To ask about trust directly is to questionits very basis, to sow the seeds of doubt. A question such as 'do you trust' invites theperception that something could be wrong and forces the respondent to think about thereasons for trust. In this sense a direct question may measure a general image of anorganisation, an image more to do with risk perception itself, than with trust which is (asis mistrust) a reaction following the risk perception. Equally, for some respondents the
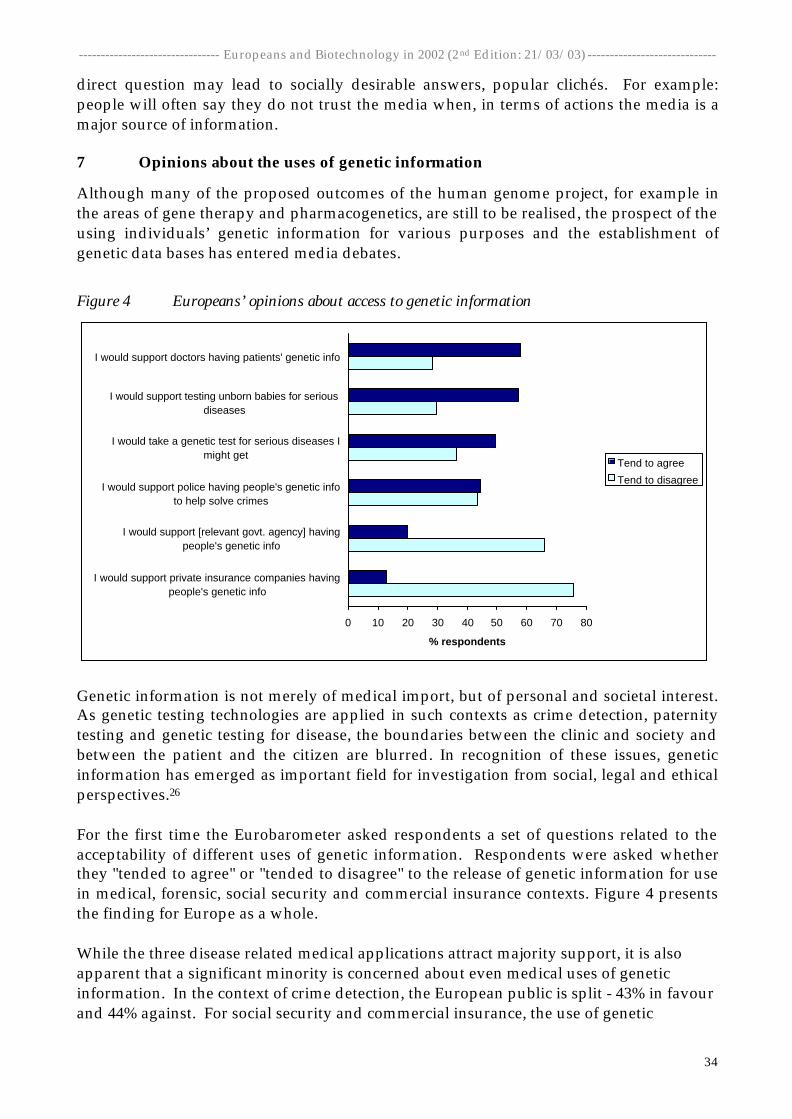
-------------------------------- Europeans and Biotechnology in 2002 (2nd Edition: 21/03/03) -----------------------------
34
direct question may lead to socially desirable answers, popular clichés. For example:people will often say they do not trust the media when, in terms of actions the media is amajor source of information.
7 Opinions about the uses of genetic information
Although many of the proposed outcomes of the human genome project, for example inthe areas of gene therapy and pharmacogenetics, are still to be realised, the prospect of theusing individuals’ genetic information for various purposes and the establishment ofgenetic data bases has entered media debates.
Figure 4 Europeans’ opinions about access to genetic information
0 10 20 30 40 50 60 70 80
I would support private insurance companies havingpeople's genetic info
I would support [relevant govt. agency] havingpeople's genetic info
I would support police having people's genetic infoto help solve crimes
I would take a genetic test for serious diseases Imight get
I would support testing unborn babies for seriousdiseases
I would support doctors having patients' genetic info
% respondents
Tend to agree
Tend to disagree
Genetic information is not merely of medical import, but of personal and societal interest.As genetic testing technologies are applied in such contexts as crime detection, paternitytesting and genetic testing for disease, the boundaries between the clinic and society andbetween the patient and the citizen are blurred. In recognition of these issues, geneticinformation has emerged as important field for investigation from social, legal and ethicalperspectives.26
For the first time the Eurobarometer asked respondents a set of questions related to theacceptability of different uses of genetic information. Respondents were asked whetherthey "tended to agree" or "tended to disagree" to the release of genetic information for usein medical, forensic, social security and commercial insurance contexts. Figure 4 presentsthe finding for Europe as a whole.
While the three disease related medical applications attract majority support, it is alsoapparent that a significant minority is concerned about even medical uses of geneticinformation. In the context of crime detection, the European public is split - 43% in favourand 44% against. For social security and commercial insurance, the use of genetic
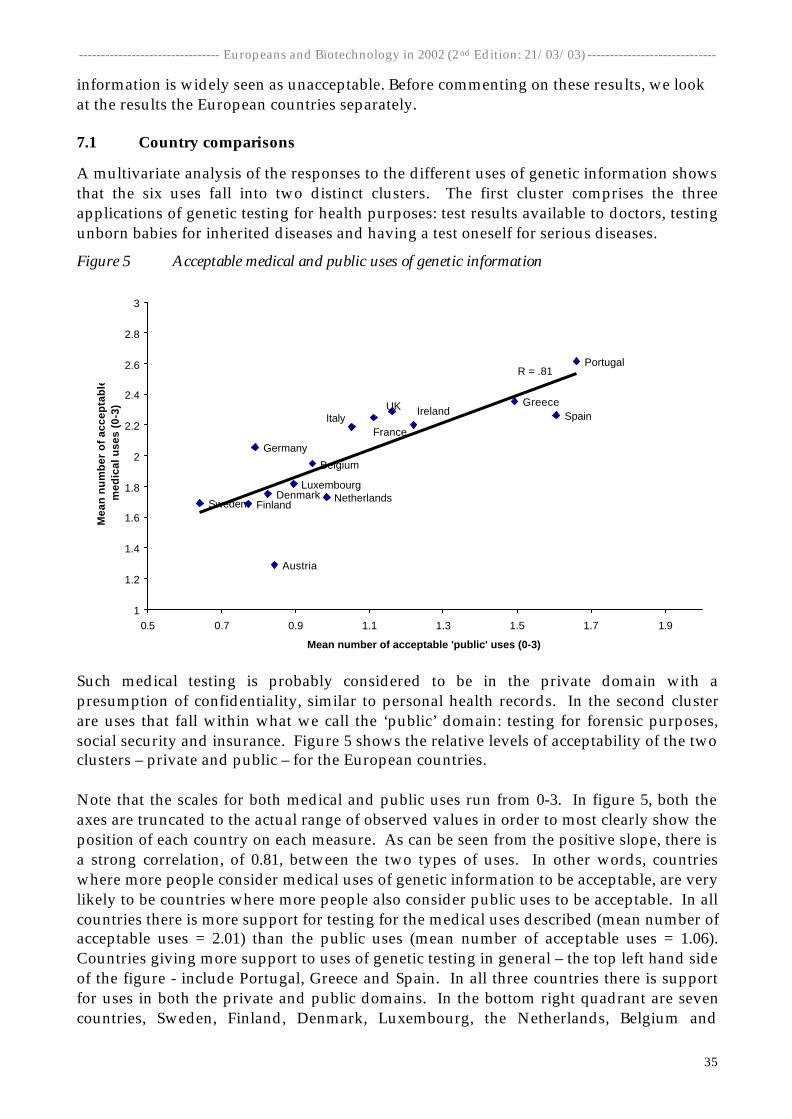
-------------------------------- Europeans and Biotechnology in 2002 (2nd Edition: 21/03/03) -----------------------------
35
information is widely seen as unacceptable. Before commenting on these results, we lookat the results the European countries separately.
7.1 Country comparisons
A multivariate analysis of the responses to the different uses of genetic information showsthat the six uses fall into two distinct clusters. The first cluster comprises the threeapplications of genetic testing for health purposes: test results available to doctors, testingunborn babies for inherited diseases and having a test oneself for serious diseases.
Figure 5 Acceptable medical and public uses of genetic information
Belgium
Denmark
Germany
GreeceItaly Spain
France
Ireland
LuxembourgNetherlands
Portugal
UK
FinlandSweden
Austria
R = .81
1
1.2
1.4
1.6
1.8
2
2.2
2.4
2.6
2.8
3
0.5 0.7 0.9 1.1 1.3 1.5 1.7 1.9
Mean number of acceptable 'public' uses (0-3)
Mea
n n
um
ber
of
acce
pta
ble
med
ical
use
s (0
-3)
Such medical testing is probably considered to be in the private domain with apresumption of confidentiality, similar to personal health records. In the second clusterare uses that fall within what we call the ‘public’ domain: testing for forensic purposes,social security and insurance. Figure 5 shows the relative levels of acceptability of the twoclusters – private and public – for the European countries.
Note that the scales for both medical and public uses run from 0-3. In figure 5, both theaxes are truncated to the actual range of observed values in order to most clearly show theposition of each country on each measure. As can be seen from the positive slope, there isa strong correlation, of 0.81, between the two types of uses. In other words, countrieswhere more people consider medical uses of genetic information to be acceptable, are verylikely to be countries where more people also consider public uses to be acceptable. In allcountries there is more support for testing for the medical uses described (mean number ofacceptable uses = 2.01) than the public uses (mean number of acceptable uses = 1.06).Countries giving more support to uses of genetic testing in general – the top left hand sideof the figure - include Portugal, Greece and Spain. In all three countries there is supportfor uses in both the private and public domains. In the bottom right quadrant are sevencountries, Sweden, Finland, Denmark, Luxembourg, the Netherlands, Belgium and
-------------------------------- Europeans and Biotechnology in 2002 (2nd Edition: 21/03/03) -----------------------------
36
Germany. In these countries there is less support for both the private and the public usesof genetic information. What is interesting here is the north/south divide. Do thediffering social and cultural contexts provide possible explanations? The northerncountries have a longer history of state organised health and social security systems, butequally some of these countries have collective memories of episodes of state sponsoredeugenics. Perhaps the greater resistance in the Northern countries relates to theemergence of emancipative values27 and concerns about civil liberties. While survey dataraises such questions, the answers are beyond the scope of the data available. Yet, ourresearch on media coverage and policy making points to another line of enquiry.
The less supportive Northern countries are those with a much longer history of thebiotechnology industry, media coverage, debates and regulatory activity, and as seen insection 4 a greater percentage of the public who are "engaged" in biotechnology. Havingfound that the "engaged" public are generally more prepared to support other applicationsof biotechnology than the less engaged, are these findings on the uses of geneticinformation a counter example? For this we need to look at associations at the individuallevel (to avoid the ecological fallacy of assuming that findings at the aggregate level applyto individual respondents). Comparing the top quartile of the engaged public with thebottom quartile, we find no significant difference on public uses of genetic information,but a significant difference on medical uses. The engaged public are more likely to be infavour of genetic information being used by doctors for therapeutic and diagnosticpurposes. This finding is in line with results reported earlier where engagement withbiotechnology was shown to be associated with more encouraging attitudes towardsgenetic testing for heritable diseases. But in the case of genetic information being used bythe police, government agencies and insurance companies, there seems to be a consensusamongst the engaged and unengaged publics that there are limits to the type of access thatshould be given to people’s genetic information.
Taken as a whole these results on the acceptability of various uses of genetic data suggestthat this is a potentially controversial issue. The findings suggest that there is publicanxiety about the use of genetic data and it seems likely that these anxieties will beaccentuated with increasing awareness of the development of genetic data banks. Will theexpansion of genetic data banks even for medical uses meet with some public resistance?A number of European countries have introduced new regulations for the uses of genetictesting. The Eurobarometer results suggest that without appropriate steps to ensure thatthe use and storage of genetic information is introduced within the context of sociallysustainable legislation, genetic testing may face generate similar controversies to those thathave surrounded GM foods.
8 GM foods: hypothetical purchasing intentions
Respondents were asked whether they thought they would buy GM foods described asoffering one of a number of particular benefits, for example lower prices or less pesticideresidues. Also included was a question as to whether they would mind eating foods withGM ingredients in a restaurant. It is important to bear in mind that these questions arehypothetical in the strong sense of the word. Since there are no GM foods currently in theshops, the respondents are not able to reflect on actual or related experiences. If, forexample, shoppers were asked whether they would buy a pink apple, they would be ableto base a judgment on some familiarity with apples of other colours. But, with questions
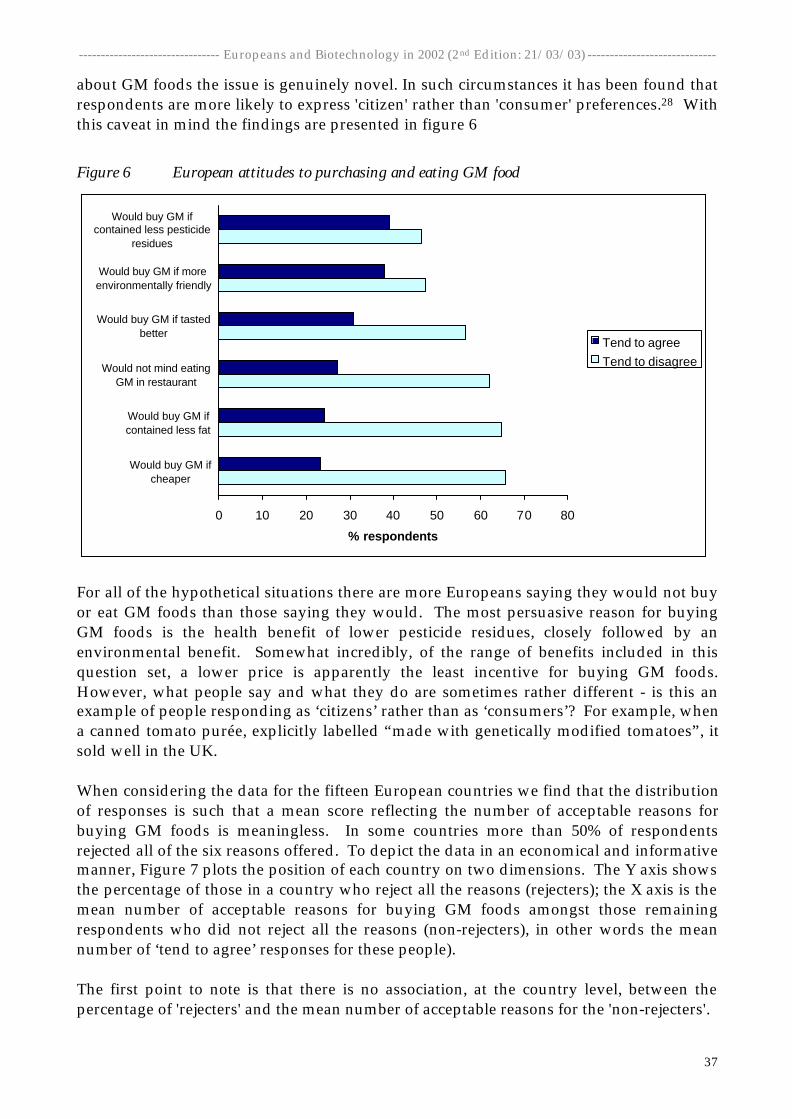
-------------------------------- Europeans and Biotechnology in 2002 (2nd Edition: 21/03/03) -----------------------------
37
about GM foods the issue is genuinely novel. In such circumstances it has been found thatrespondents are more likely to express 'citizen' rather than 'consumer' preferences.28 Withthis caveat in mind the findings are presented in figure 6
Figure 6 European attitudes to purchasing and eating GM food
0 10 20 30 40 50 60 70 80
Would buy GM ifcheaper
Would buy GM ifcontained less fat
Would not mind eatingGM in restaurant
Would buy GM if tastedbetter
Would buy GM if moreenvironmentally friendly
Would buy GM ifcontained less pesticide
residues
% respondents
Tend to agreeTend to disagree
For all of the hypothetical situations there are more Europeans saying they would not buyor eat GM foods than those saying they would. The most persuasive reason for buyingGM foods is the health benefit of lower pesticide residues, closely followed by anenvironmental benefit. Somewhat incredibly, of the range of benefits included in thisquestion set, a lower price is apparently the least incentive for buying GM foods.However, what people say and what they do are sometimes rather different - is this anexample of people responding as ‘citizens’ rather than as ‘consumers’? For example, whena canned tomato purée, explicitly labelled “made with genetically modified tomatoes”, itsold well in the UK.
When considering the data for the fifteen European countries we find that the distributionof responses is such that a mean score reflecting the number of acceptable reasons forbuying GM foods is meaningless. In some countries more than 50% of respondentsrejected all of the six reasons offered. To depict the data in an economical and informativemanner, Figure 7 plots the position of each country on two dimensions. The Y axis showsthe percentage of those in a country who reject all the reasons (rejecters); the X axis is themean number of acceptable reasons for buying GM foods amongst those remainingrespondents who did not reject all the reasons (non-rejecters), in other words the meannumber of ‘tend to agree’ responses for these people).
The first point to note is that there is no association, at the country level, between thepercentage of 'rejecters' and the mean number of acceptable reasons for the 'non-rejecters'.
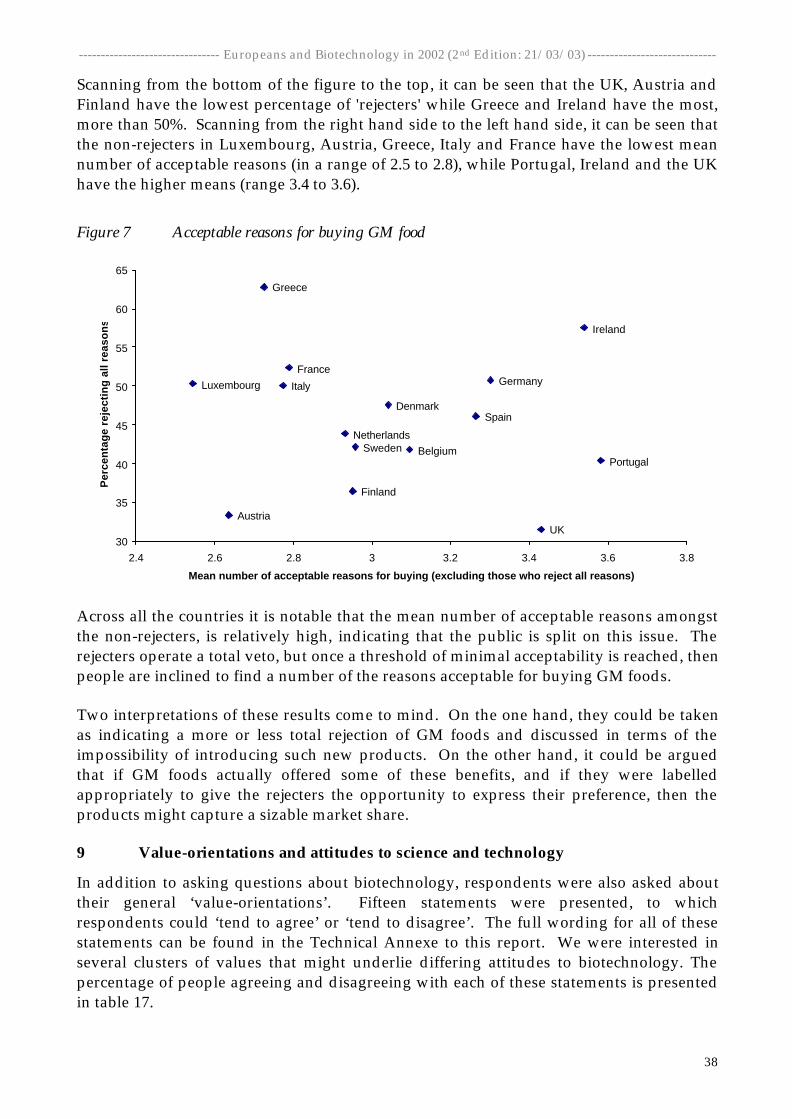
-------------------------------- Europeans and Biotechnology in 2002 (2nd Edition: 21/03/03) -----------------------------
38
Scanning from the bottom of the figure to the top, it can be seen that the UK, Austria andFinland have the lowest percentage of 'rejecters' while Greece and Ireland have the most,more than 50%. Scanning from the right hand side to the left hand side, it can be seen thatthe non-rejecters in Luxembourg, Austria, Greece, Italy and France have the lowest meannumber of acceptable reasons (in a range of 2.5 to 2.8), while Portugal, Ireland and the UKhave the higher means (range 3.4 to 3.6).
Figure 7 Acceptable reasons for buying GM food
Austria
Sweden
Finland
UK
Portugal
Netherlands
Luxembourg
Ireland
France
Spain
Italy
Greece
Germany
Denmark
Belgium
30
35
40
45
50
55
60
65
2.4 2.6 2.8 3 3.2 3.4 3.6 3.8
Mean number of acceptable reasons for buying (excluding those who reject all reasons)
Per
cen
tag
e re
ject
ing
all
reas
on
s
Across all the countries it is notable that the mean number of acceptable reasons amongstthe non-rejecters, is relatively high, indicating that the public is split on this issue. Therejecters operate a total veto, but once a threshold of minimal acceptability is reached, thenpeople are inclined to find a number of the reasons acceptable for buying GM foods.
Two interpretations of these results come to mind. On the one hand, they could be takenas indicating a more or less total rejection of GM foods and discussed in terms of theimpossibility of introducing such new products. On the other hand, it could be arguedthat if GM foods actually offered some of these benefits, and if they were labelledappropriately to give the rejecters the opportunity to express their preference, then theproducts might capture a sizable market share.
9 Value-orientations and attitudes to science and technology
In addition to asking questions about biotechnology, respondents were also asked abouttheir general ‘value-orientations’. Fifteen statements were presented, to whichrespondents could ‘tend to agree’ or ‘tend to disagree’. The full wording for all of thesestatements can be found in the Technical Annexe to this report. We were interested inseveral clusters of values that might underlie differing attitudes to biotechnology. Thepercentage of people agreeing and disagreeing with each of these statements is presentedin table 17.
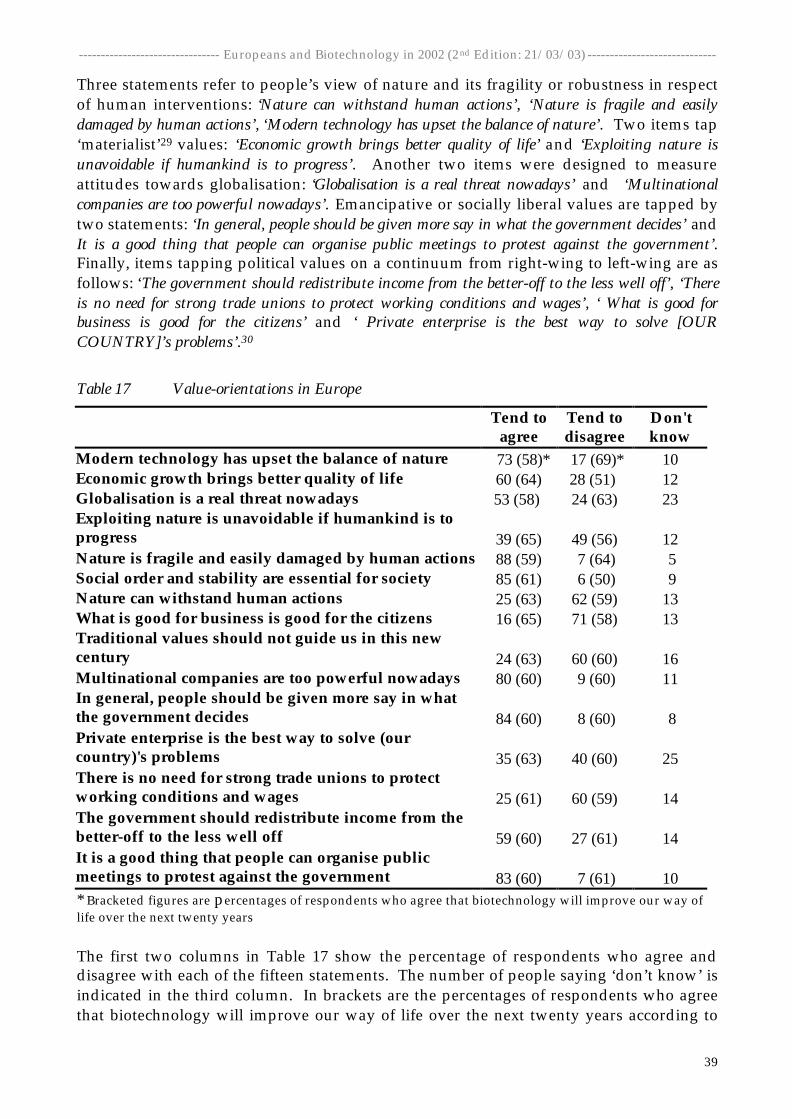
-------------------------------- Europeans and Biotechnology in 2002 (2nd Edition: 21/03/03) -----------------------------
39
Three statements refer to people’s view of nature and its fragility or robustness in respectof human interventions: ‘Nature can withstand human actions’, ‘Nature is fragile and easilydamaged by human actions’, ‘Modern technology has upset the balance of nature’. Two items tap‘materialist’29 values: ‘Economic growth brings better quality of life’ and ‘Exploiting nature isunavoidable if humankind is to progress’. Another two items were designed to measureattitudes towards globalisation: ‘Globalisation is a real threat nowadays’ and ‘Multinationalcompanies are too powerful nowadays’. Emancipative or socially liberal values are tapped bytwo statements: ‘In general, people should be given more say in what the government decides’ andIt is a good thing that people can organise public meetings to protest against the government’.Finally, items tapping political values on a continuum from right-wing to left-wing are asfollows: ‘The government should redistribute income from the better-off to the less well off’, ‘Thereis no need for strong trade unions to protect working conditions and wages’, ‘ What is good forbusiness is good for the citizens’ and ‘ Private enterprise is the best way to solve [OURCOUNTRY]’s problems’.30
Table 17 Value-orientations in Europe
Tend toagree
Tend todisagree
Don'tknow
Modern technology has upset the balance of nature 73 (58)* 17 (69)* 10Economic growth brings better quality of life 60 (64) 28 (51) 12Globalisation is a real threat nowadays 53 (58) 24 (63) 23Exploiting nature is unavoidable if humankind is toprogress 39 (65) 49 (56) 12Nature is fragile and easily damaged by human actions 88 (59) 7 (64) 5Social order and stability are essential for society 85 (61) 6 (50) 9Nature can withstand human actions 25 (63) 62 (59) 13What is good for business is good for the citizens 16 (65) 71 (58) 13Traditional values should not guide us in this newcentury 24 (63) 60 (60) 16Multinational companies are too powerful nowadays 80 (60) 9 (60) 11In general, people should be given more say in whatthe government decides 84 (60) 8 (60) 8Private enterprise is the best way to solve (ourcountry)'s problems 35 (63) 40 (60) 25There is no need for strong trade unions to protectworking conditions and wages 25 (61) 60 (59) 14The government should redistribute income from thebetter-off to the less well off 59 (60) 27 (61) 14It is a good thing that people can organise publicmeetings to protest against the government 83 (60) 7 (61) 10* Bracketed figures are percentages of respondents who agree that biotechnology will improve our way oflife over the next twenty years
The first two columns in Table 17 show the percentage of respondents who agree anddisagree with each of the fifteen statements. The number of people saying ‘don’t know’ isindicated in the third column. In brackets are the percentages of respondents who agreethat biotechnology will improve our way of life over the next twenty years according to
-------------------------------- Europeans and Biotechnology in 2002 (2nd Edition: 21/03/03) -----------------------------
40
agreement or disagreement with each of the values statements. Responses to the valuesstatements show that Europeans are conscious of the impact of human actions andtechnology on nature. Yet there is ambivalence about exploiting nature in the interests ofprogress. A majority believe economic growth brings better quality of life and in thisregard there is also ambivalence. Europeans are split on whether private enterprise is thebest way to solve a country’s problems, with one quarter saying they don’t know. Mostthink multinational companies are too powerful and only a small percentage think thatwhat is good for business is good for citizens. On other political issues, Europeans, onaverage, are left of centre. There is support for strong trade unions and for incomeredistribution. Emancipative values are seen in the overwhelming support for peoplehaving more say in government and in the right to organise public protest. Theassociation between value orientations and beliefs about biotechnology is illustrated bythe percentages shown in brackets in table 17. The values most strongly associated withoptimism about the contribution of biotechnology to society are related to views aboutnature and to materialism.
Those who are more concerned about nature are less optimistic about biotechnology,while those who espouse materialist values are more optimistic. Political orientation andemancipative values, by contrast, have little or no link with beliefs about biotechnology.
10 The factors underlying support and opposition to biotechnology
We conclude our exploration of European attitudes towards biotechnology by examiningthe simultaneous effect of the variables we have found that may underlie people’sattitudes. Since some of these predictors are likely to be intercorrelated, it is only bylooking at the effects of each one while controlling (holding constant) the others that wecan identify the key causal predictors.
Table 18 shows the results of the six binary logistic regression analyses. In these we assessthe relative impact of different factors on the odds of agreeing that each of the sixapplications should be encouraged. Fourteen such factors are considered here.
The first block concerns background characteristics: gender, education and age. We alsocompare respondents in catholic countries compared to non-catholic countries because ofpossible differences in sensitivities to human cloning and xenotransplantation. FollowingGiorgi and Marsh,31 we use the dominant religion of the country, which they found to bemore closely related to social values than the religious denomination of individualrespondents. The second block includes general interests and values elicited withquestions that do not mention biotechnology. Political and scientific interest are eachbased on summed responses to three questions asking respondents to what extent they areinterested, well-informed, and understand political and scientific news storiesrespectively. A high score indicates high interest. Materialist values and views aboutnature are measured with three items described in section 9 above. Optimism intechnology is the sum of the eight areas of technology which ‘will improve our way oflife’; this excludes biotechnology. The final block concerns indicators of engagement withbiotechnology and confidence in relevant actors involved in biotechnology. Engagementwith biotechnology is a composite score based on a principal components analysis ofelements of engagement (having heard of, discussed, seen or read about biotechnology,along with knowledge about biotechnology) where a high score indicates greater
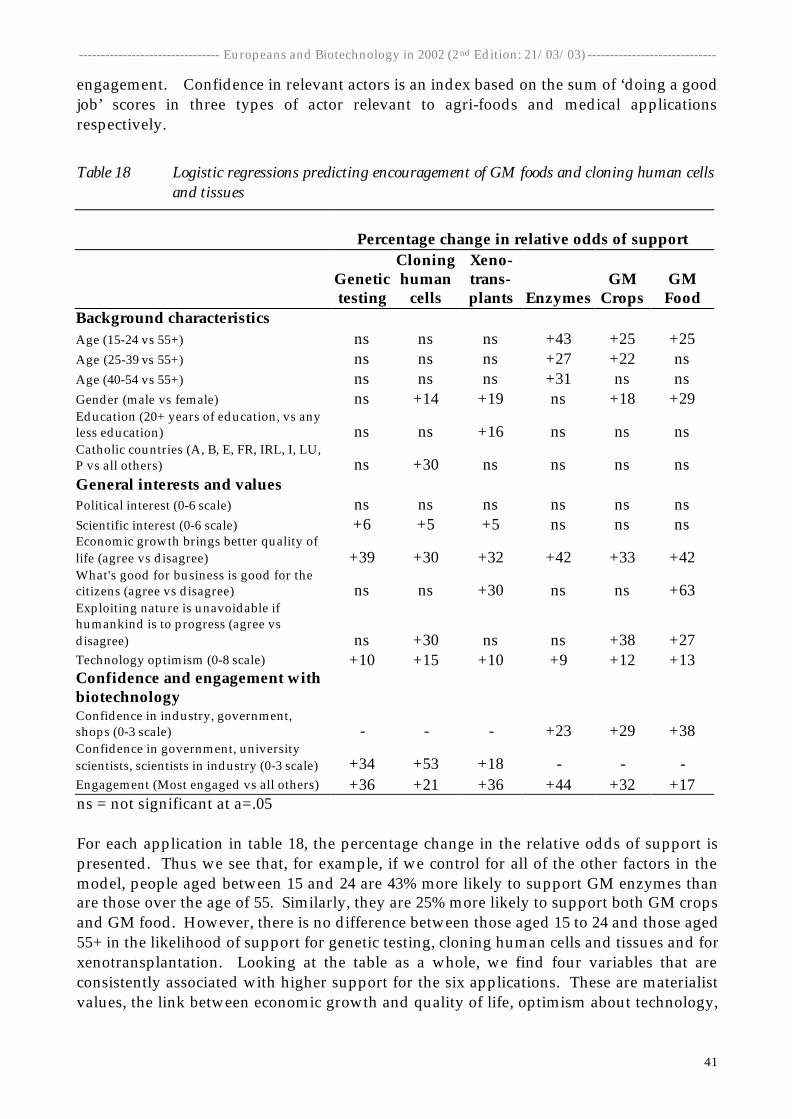
-------------------------------- Europeans and Biotechnology in 2002 (2nd Edition: 21/03/03) -----------------------------
41
engagement. Confidence in relevant actors is an index based on the sum of ‘doing a goodjob’ scores in three types of actor relevant to agri-foods and medical applicationsrespectively.
Table 18 Logistic regressions predicting encouragement of GM foods and cloning human cellsand tissues
Percentage change in relative odds of support
Genetictesting
Cloninghuman
cells
Xeno-trans-plants Enzymes
GMCrops
GMFood
Background characteristicsAge (15-24 vs 55+) ns ns ns +43 +25 +25Age (25-39 vs 55+) ns ns ns +27 +22 nsAge (40-54 vs 55+) ns ns ns +31 ns nsGender (male vs female) ns +14 +19 ns +18 +29Education (20+ years of education, vs anyless education) ns ns +16 ns ns nsCatholic countries (A, B, E, FR, IRL, I, LU,P vs all others) ns +30 ns ns ns nsGeneral interests and valuesPolitical interest (0-6 scale) ns ns ns ns ns nsScientific interest (0-6 scale) +6 +5 +5 ns ns nsEconomic growth brings better quality oflife (agree vs disagree) +39 +30 +32 +42 +33 +42What's good for business is good for thecitizens (agree vs disagree) ns ns +30 ns ns +63Exploiting nature is unavoidable ifhumankind is to progress (agree vsdisagree) ns +30 ns ns +38 +27Technology optimism (0-8 scale) +10 +15 +10 +9 +12 +13Confidence and engagement withbiotechnologyConfidence in industry, government,shops (0-3 scale) - - - +23 +29 +38Confidence in government, universityscientists, scientists in industry (0-3 scale) +34 +53 +18 - - -Engagement (Most engaged vs all others) +36 +21 +36 +44 +32 +17ns = not significant at a=.05
For each application in table 18, the percentage change in the relative odds of support ispresented. Thus we see that, for example, if we control for all of the other factors in themodel, people aged between 15 and 24 are 43% more likely to support GM enzymes thanare those over the age of 55. Similarly, they are 25% more likely to support both GM cropsand GM food. However, there is no difference between those aged 15 to 24 and those aged55+ in the likelihood of support for genetic testing, cloning human cells and tissues and forxenotransplantation. Looking at the table as a whole, we find four variables that areconsistently associated with higher support for the six applications. These are materialistvalues, the link between economic growth and quality of life, optimism about technology,
-------------------------------- Europeans and Biotechnology in 2002 (2nd Edition: 21/03/03) -----------------------------
42
confidence in actors involved in biotechnology and engagement with the issue ofbiotechnology.
A number of the other factors from the first and second blocks are related to greater levelsof encouragement for some, but not all, applications. In terms of backgroundcharacteristics, when we hold all other variables in the model constant, men are generallymore supportive than women, but there is no significant difference in the odds of supportfor genetic testing and GM enzymes. Again, holding everything else constant, age is notrelated to the odds of encouraging any of the three medical applications. Yet for GMenzymes, crops and foods, younger people are more supportive than older people.Turning to general interests and values, those who agree that exploiting nature isunavoidable are more likely to be supportive of cloning human cells and tissues, GMcrops and GM foods. Finally, and counter to our initial expectations, in catholic countries,people have higher odds of support for cloning human cells and tissues than in the non-catholic countries. This is consistent with findings from the survey showing greatersupport in the southern countries than in the north. Yet for the other five applications, aninterpretation of the north/south divide might point to differences between northern andsouthern countries in some of the variables in our model. However, what is interesting inthe case of cloning is that these variables cannot account for the greater support in thecatholic countries. Whilst it should be borne in mind that this could be a chance finding, itcertainly merits further research.
11 Conclusions
While the main findings of this Eurobarometer survey are set out in the summary, someconcluding comments are in order. The survey underlines the value of time-seriesquantitative research on public perceptions of science and technology. The series ofEurobarometer surveys on biotechnology from 1991 to 2002 have allowed us to identifyrelatively enduring beliefs, longer term shifts in opinions and shorter term fluctuations.While perceptions of agri-food or ‘green’ biotechnologies have been much influenced byevents and controversies over time, perceptions of medical or ‘red’ biotechnologies haveremained relatively stable.
What are the general implications of this assessment of public perceptions ofbiotechnology in 2002? The picture is interestingly different from 1999 and, from theviewpoint of those involved in the regulation and implementation of the technology, thereare mixed messages. Three issues illustrate the dynamics of public perceptions and theneed for continuing vigilance.
In the survey we find that support for GM crops and foods has increased in somecountries and where it has increased we see more risk tolerant support. This may implythat the debates about risk have lost their ferocity and that the risk issue is now discussedmore soberly. Yet at the same time a majority of Europeans do not support agri-foodbiotechnologies. Perhaps the risk issue has been temporarily handled by the moratorium -a strategy that has bought time and has been moderately successful. But what will happenwhen new crops and products arrive? While industry will describe them as bringing arange of benefits, what will the public think? Will they too see benefits? This will becrucial, as it is the perception of benefits that seems to be the driving force behind theemergence of risk tolerant support. However, if these new crops and products do not
-------------------------------- Europeans and Biotechnology in 2002 (2nd Edition: 21/03/03) -----------------------------
43
meet the public's criterion of usefulness, then the controversies of the 1990s could well bereactivated.
The importance of tangible benefits is illustrated by the findings for medical applications.The widely recognised contribution of bio-medical technologies to health generallyoutweighs perceived risks and moral concerns. This is particularly evident in the levels ofsupport observed for the cloning human cells and tissues and to a lesser extent in the caseof xenotransplantation, despite the emphasis on ethical dilemmas accompanying bothapplications as evidenced in official documents and some scientific research. Is this anindication that relying solely on "ethical" deliberations, such as those considered by ethicscommittees, fails to capture the public mood? Perhaps the public is more utilitarian thanpolitical bodies and ethical committees.
Finally, could genetic information become the next focus of controversy? Throughout the1990s support for genetic testing for inherited diseases was both high and stable. In 2002we took a closer look at a number of other uses for genetic information in the medical andpublic domains. The results show that the exploitation of genetic information in forensic,social security and insurance contexts raises anxieties across all European countries,particularly in the North. Is this a warning signal of impending controversy and conflict?The degree of conflict may depend as much on timely regulation as on the extent to whichgenetic information becomes associated with other issues. Just as GM foods and cropsbecame a platform for a number of other debates - food safety after the BSE and dioxinscares, the role of agriculture, the integration of the food chain and food as a cultural item,genetic information may reactivate fears of eugenics and become associated with civilliberties, social equality and justice.
More generally, the findings on Europeans and biotechnology illustrate the complexity ofthe relations between science and society. There are no simple or single explanations forthe dynamics of public perceptions, or of the representations that underlie people's views.What we find is that a 'matrix' of variables including interest in aspects of the publicdomain such as science and politics, optimism about technologies, social and culturalvalues, engagement with the issue of biotechnology and confidence in industry, regulationand other civil society groups, all contribute to the public's representation of and opinionsabout biotechnologies. Yet, it must also be recognised that socio-cultural andtechnological systems interact in complex ways. Understanding these interactions requiresattending to factors visible on the institutional or societal level, as well as the individuallevel; the regulatory climate, not just specific regulations; media systems, not just specificmessages; and social values, not just individual opinions. All these contribute to thetrajectory of a new technology. As such, a survey provides a particular perspective, amapping of the contours of public perceptions. It is a perspective that invitescomplementary research foci in order to interpret the results in the broader social andcultural context. This has been one of the key objectives of the research group 'LifeSciences in European Society' that produced this report.
-------------------------------- Europeans and Biotechnology in 2002 (2nd Edition: 21/03/03) -----------------------------
44
12 References
1. Commission of the European Communities, 'Life sciences and biotechnology - astrategy for Europe' COM 27 (2002).
2. European Parliament and Council of the European Union, 'Directive 2001/18/EC ofthe European Parliament and of Council', Official Journal of the European CommunitiesL 106, 1-38 (2001).
3. INRA, 'Eurobarometer 35.1' (1991).
4. INRA, 'Biotechnology and genetic engineering. What Europeans think about in1993' (Survey conducted in the context of Eurobarometer 39.1, 1993).
5. INRA, 'Eurobarometer 46.1, Les Europeens et la Biotechnologie Moderne' (1997).
6. INRA, 'Europeans and biotechnology' (2000).
7. Gaskell, G., N. C. Allum, W. Wagner, T. Hviid Nielsen, E. Jelsoe, M. Kohring, M. W.Bauer, 'In the public eye: representations of biotechnology in Europe' inBiotechnology 1996-2000: the years of controversy G. Gaskell, M. Bauer, Eds. (ScienceMuseum Publications, London, 2001).
8. Miller, J. D., 'The measurement of scientific literacy', Public Understanding of Science7, 203-223 (1998).
9. Miller, J. D., 'Scientific literacy: a conceptual and empirical review', Daedalus 11, 29-48 (1983).
10. Durant, J., G. Evans, P. Thomas, 'The public understanding of science', Nature 340,11-14 (1989).
11. Allum, N. C., D. Boy, M. W. Bauer, 'European regions and the knowledge deficitmodel' in Biotechnology: the making of a global controversy M. Bauer, G. Gaskell, Eds.(Cambridge University Press, Cambridge, 2002).
12. Sturgis, P. J., N. C. Allum, 'Gender differences in scientific knowledge and attitudestoward science: reply to Hayes and Tariq', Public Understanding of Science 10, 427-430(2001).
13. Ziman, J., 'Public understanding of science', Science, Technology and Human Values16, 99-105 (1991).
14. Wynne, B., 'Public understanding of science'. (1995).
15. Evans, G., J. Durant, 'The relationship between knowledge and attitudes in thepublic understanding of science in Britain', Public Understanding of Science 4, 57-74(1995).
-------------------------------- Europeans and Biotechnology in 2002 (2nd Edition: 21/03/03) -----------------------------
45
16. Bauer, M. W., J. Durant, G. Evans, 'European public perceptions of science',International Journal of Public Opinion Research 6, 163-186 (1994).
17. Almond, G., S. Verba, The civic culture (Little,Brown, Boston, 1963).
18. Bauer, M. W., G. Gaskell, Eds., Biotechnology - the making of a global controversy(Cambridge University Press, Cambridge, 2002).
19. Gaskell, G., N. C. Allum, M. W. Bauer, J. Durant, 'Worlds apart? the reception ofgenetically modified foods in Europe and the US', Science July 16 1999, 384-387(1999).
20. Delli Carpini, M. X., S. Keeter, What Americans know about politics and why it matters(Yale University Press, New Haven [Conn.], 1996).
21. Barber, B., The logic and limits of trust (Rutgers University Press, New Brunswick,N.J., 1983).
22. Luhmann, N., Trust and power (Wiley, Chichester, 1979).
23. Slovic, P., J. H. Flynn, M. Layman, 'Perceived Risk, Trust, and the Politics of NuclearWaste', Science 254, 1603-1607 (1991).
24. Gaskell, G., M. W. Bauer, 'Biotechnology in the years of controversy: a socialscientific perspective' in Biotechnology 1996-2000: the years of controversy G. Gaskell,M. Bauer, Eds. (Science Museum Publications, London, 2001) pp. 3-11.
25. Luhmann, N., 'Familiarity, Confidence, Trust: Problems and Alternatives' in Trust:Making and Breaking Cooperative Relations D. Gambetta, Ed. (Department ofSociology, University of Oxford (Electronic edition: available athttp://www.sociology.ox.ac.uk/papers/luhmann94-107.doc, 2000).
26. Richards, M., 'How distinctive is genetic information?' Studies in History andPhilosophy of Biological and Biomedical Sciences 32, 663-687 (2001).
27. Welzel, C., R. Inglehart, H. Klingemann, 'The theory of human development: across-cultural analysis', European Journal of Political Research 42, 311-380 (2003).
28. Noussair, C., S. Robin, B. Ruffieux, 'Do consumers not care about biotech foods ordo they just not read the labels?' Economics Letters 75, 47-53 (2002).
29. Inglehart, R., Culture shift in advanced societies (Princetown University Press,Princetown, 1990).
30. Heath, A., G. Evans, J. Martin, 'The Measurement of Core Beliefs and Values: TheDevelopment of Balanced Socialist/Laissez Faire and Libertarian/AuthoritarianScales', British Journal of Political Science 24, 115-133 (1993).

-------------------------------- Europeans and Biotechnology in 2002 (2nd Edition: 21/03/03) -----------------------------
46
31. Giorgi, L., C. Marsh, 'The protestant work ethic as a cultural phenomenon',European Journal of Social Psychology 20, 499-517 (1990).
Life Sciences in European Society
Coordinator: G.Gaskell
(European Commission Research Contract QLG7-CT-1999-00286)
Eurobarometer on Biotechnology 2002 (58.0)
Technical Annexe to accompany report 'Europeans and Biotechnology in 2002'

QUESTIONNAIRE FORMAT – ENGLISH VERSION
Q. 9. I am going to read out a list of areas in which new technologies are currently developing. For each of these areas, do you think it will improve our way of life in the next 20 years, it will have no effect, or it will make things worse?
READ OUT WILL IMPROVE NO EFFECT
WILL MAKE THINGS WORSE
DK
1 Solar Energy 1 2 3 4 (159)
2 Computers & Information Technology 1 2 3 4 (160)
3 Biotechnology (SPLIT BALLOT A)
1 2 3 4 (161)
3 Genetic engineering (SPLIT BALLOT B) 1 2 3 4 (162)
4 Telecommunications 1 2 3 4 (163)
5 Space exploration 1 2 3 4 (164)
6 The Internet 1 2 3 4 (165)
7 Nuclear energy 1 2 3 4 (166)
8 Nanotechnology (N) 1 2 3 4 (167)
9 Mobile phones (N) 1 2 3 4 (168)
EB52.1 – Q.2. – TREND MODIFIED
EUROPEAN OPINION RESEARCH GROUP – 58.0 – AUTUMN 2002 Page
1
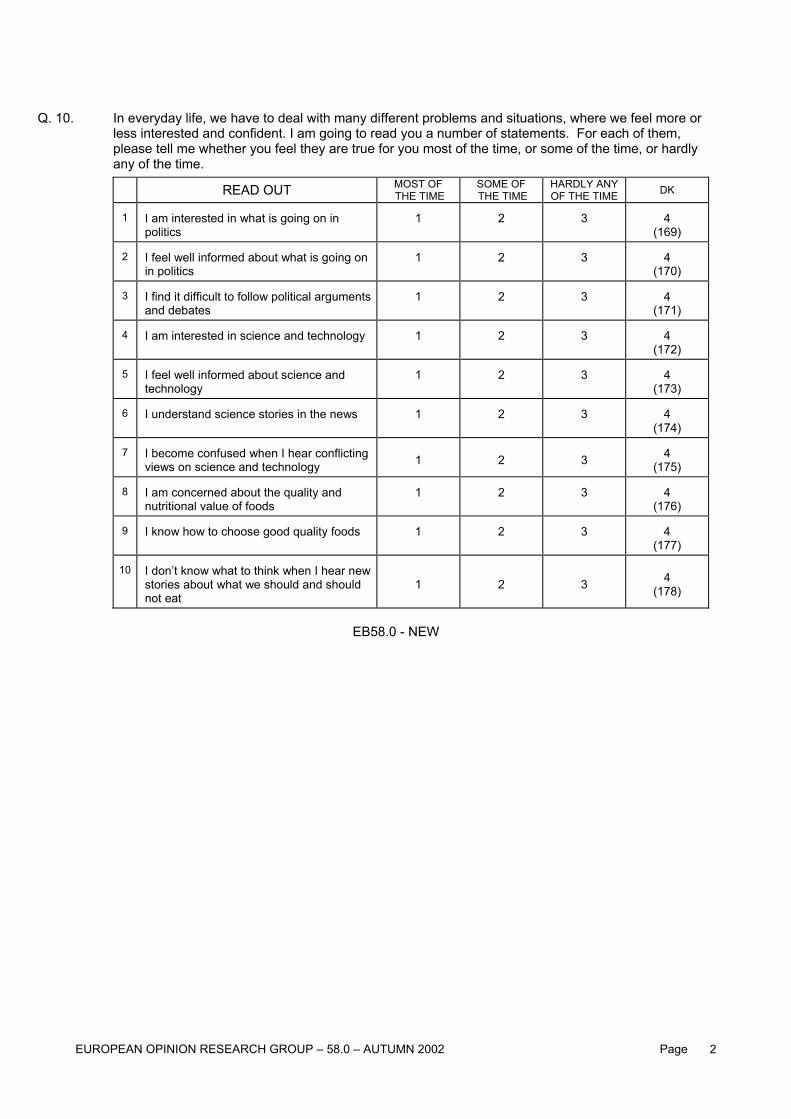
Q. 10. In everyday life, we have to deal with many different problems and situations, where we feel more or
less interested and confident. I am going to read you a number of statements. For each of them, please tell me whether you feel they are true for you most of the time, or some of the time, or hardly any of the time.
READ OUT MOST OF THE TIME
SOME OF THE TIME
HARDLY ANY OF THE TIME DK
1 I am interested in what is going on in politics
1 2 3 4 (169)
2 I feel well informed about what is going on in politics
1 2 3 4 (170)
3 I find it difficult to follow political arguments and debates
1 2 3 4 (171)
4 I am interested in science and technology 1 2 3 4 (172)
5 I feel well informed about science and technology
1 2 3 4 (173)
6 I understand science stories in the news 1 2 3 4 (174)
7 I become confused when I hear conflicting views on science and technology 1 2 3 4
(175)
8 I am concerned about the quality and nutritional value of foods
1 2 3 4 (176)
9 I know how to choose good quality foods 1 2 3 4 (177)
10 I don’t know what to think when I hear new stories about what we should and should not eat
1 2 3 4 (178)
EB58.0 - NEW
EUROPEAN OPINION RESEARCH GROUP – 58.0 – AUTUMN 2002 Page
2
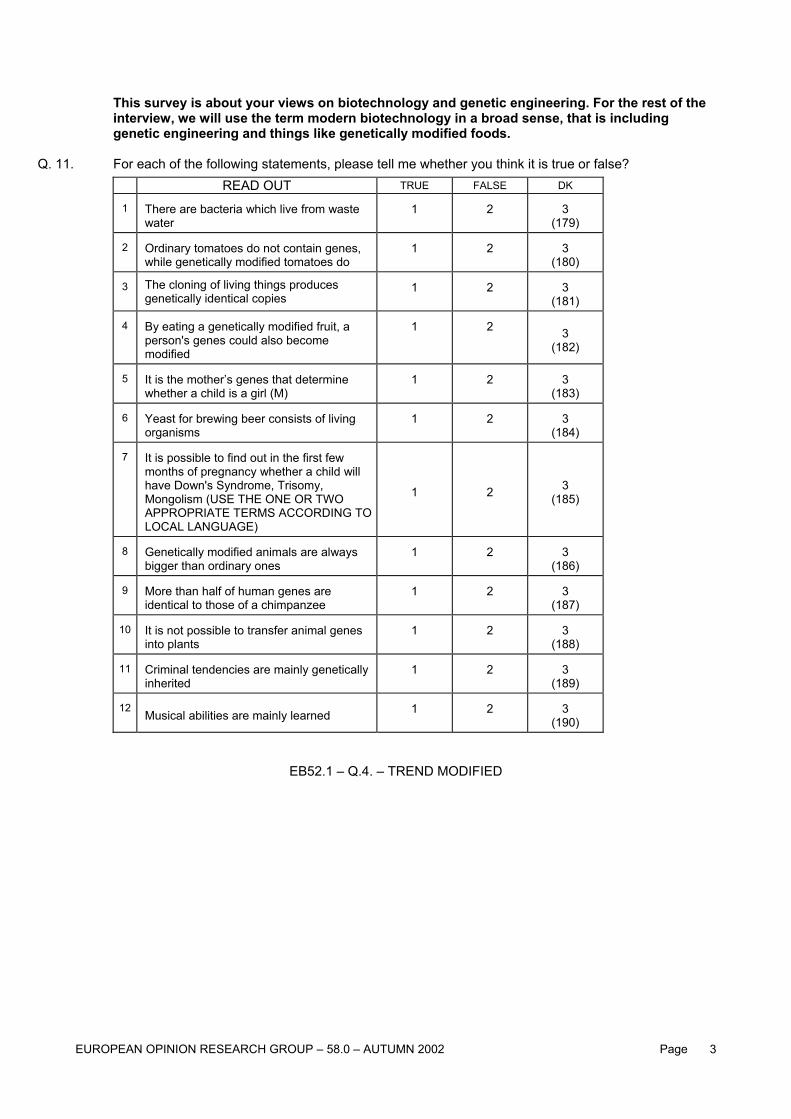
This survey is about your views on biotechnology and genetic engineering. For the rest of the interview, we will use the term modern biotechnology in a broad sense, that is including genetic engineering and things like genetically modified foods.
Q. 11. For each of the following statements, please tell me whether you think it is true or false?
READ OUT TRUE FALSE DK
1 There are bacteria which live from waste water
1 2 3 (179)
2 Ordinary tomatoes do not contain genes, while genetically modified tomatoes do
1 2 3 (180)
3 The cloning of living things produces genetically identical copies
1 2 3 (181)
4 By eating a genetically modified fruit, a person's genes could also become modified
1 2 3 (182)
5 It is the mother’s genes that determine whether a child is a girl (M)
1 2 3 (183)
6 Yeast for brewing beer consists of living organisms
1 2 3 (184)
7 It is possible to find out in the first few months of pregnancy whether a child will have Down's Syndrome, Trisomy, Mongolism (USE THE ONE OR TWO APPROPRIATE TERMS ACCORDING TO LOCAL LANGUAGE)
1 2 3 (185)
8 Genetically modified animals are always bigger than ordinary ones
1 2 3 (186)
9 More than half of human genes are identical to those of a chimpanzee
1 2 3 (187)
10 It is not possible to transfer animal genes into plants
1 2 3 (188)
11 Criminal tendencies are mainly genetically inherited
1 2 3 (189)
12 Musical abilities are mainly learned 1 2 3 (190)
EB52.1 – Q.4. – TREND MODIFIED
EUROPEAN OPINION RESEARCH GROUP – 58.0 – AUTUMN 2002 Page
3
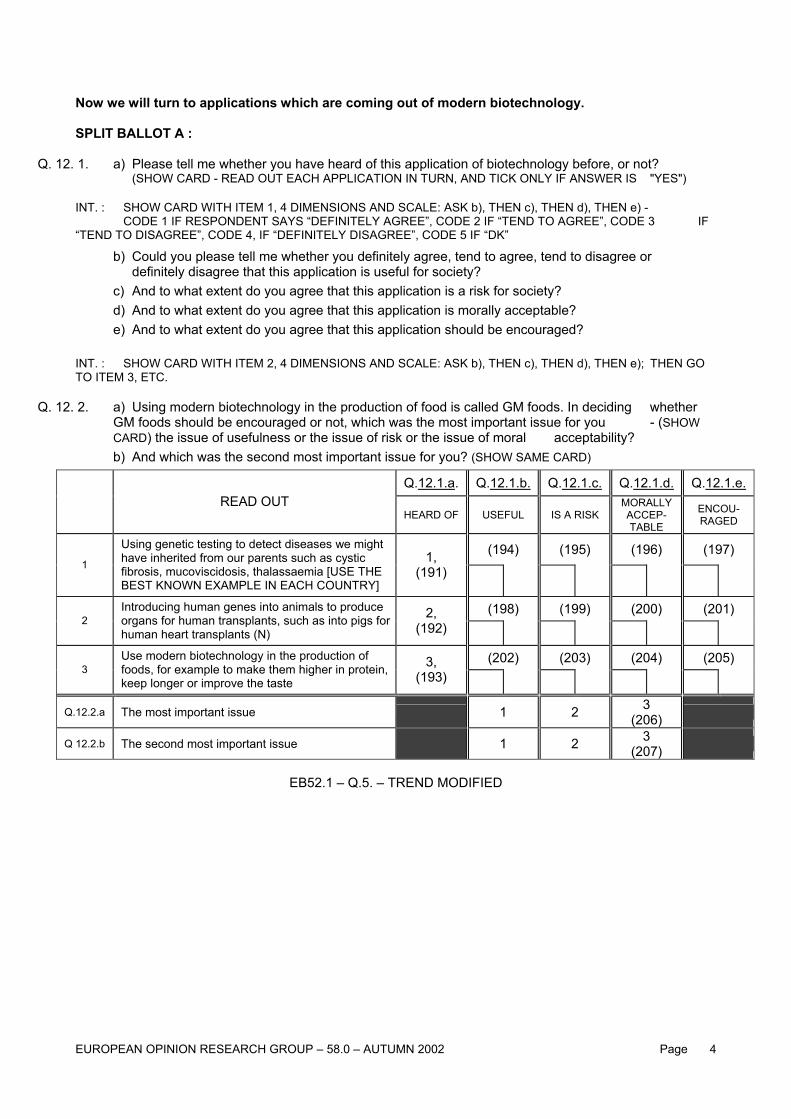
Now we will turn to applications which are coming out of modern biotechnology. SPLIT BALLOT A :
Q. 12. 1. a) Please tell me whether you have heard of this application of biotechnology before, or not? (SHOW CARD - READ OUT EACH APPLICATION IN TURN, AND TICK ONLY IF ANSWER IS "YES")
INT. : SHOW CARD WITH ITEM 1, 4 DIMENSIONS AND SCALE: ASK b), THEN c), THEN d), THEN e) - CODE 1 IF RESPONDENT SAYS “DEFINITELY AGREE”, CODE 2 IF “TEND TO AGREE”, CODE 3 IF TEND TO DISAGREE”, CODE 4, IF “DEFINITELY DISAGREE”, CODE 5 IF “DK” “
b) Could you please tell me whether you definitely agree, tend to agree, tend to disagree or definitely disagree that this application is useful for society? c) And to what extent do you agree that this application is a risk for society? d) And to what extent do you agree that this application is morally acceptable? e) And to what extent do you agree that this application should be encouraged?
INT. : SHOW CARD WITH ITEM 2, 4 DIMENSIONS AND SCALE: ASK b), THEN c), THEN d), THEN e); THEN GO TO ITEM 3, ETC.
Q. 12. 2. a) Using modern biotechnology in the production of food is called GM foods. In deciding whether GM foods should be encouraged or not, which was the most important issue for you - (SHOW CARD) the issue of usefulness or the issue of risk or the issue of moral acceptability?
b) And which was the second most important issue for you? (SHOW SAME CARD)
Q.12.1.a. Q.12.1.b. Q.12.1.c. Q.12.1.d. Q.12.1.e. READ OUT
HEARD OF USEFUL IS A RISK MORALLY ACCEP-TABLE
ENCOU-RAGED
(194) (195) (196) (197) 1
Using genetic testing to detect diseases we might have inherited from our parents such as cystic fibrosis, mucoviscidosis, thalassaemia [USE THE BEST KNOWN EXAMPLE IN EACH COUNTRY]
1, (191)
(198) (199) (200) (201) 2
Introducing human genes into animals to produce organs for human transplants, such as into pigs for human heart transplants (N)
2, (192)
(202) (203) (204) (205) 3
Use modern biotechnology in the production of foods, for example to make them higher in protein, keep longer or improve the taste
3, (193)
Q.12.2.a The most important issue 1 2 3 (206)
Q 12.2.b The second most important issue 1 2 3 (207)
EB52.1 – Q.5. – TREND MODIFIED
EUROPEAN OPINION RESEARCH GROUP – 58.0 – AUTUMN 2002 Page
4
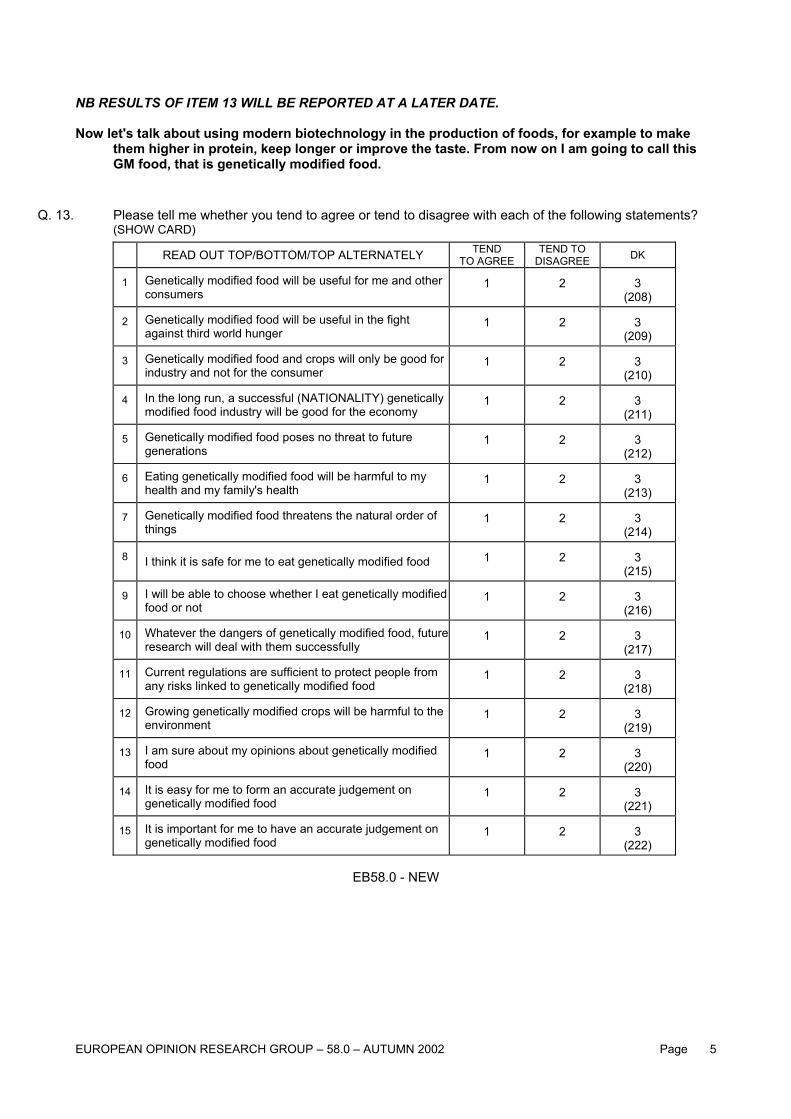
NB RESULTS OF ITEM 13 WILL BE REPORTED AT A LATER DATE. Now let's talk about using modern biotechnology in the production of foods, for example to make
them higher in protein, keep longer or improve the taste. From now on I am going to call this GM food, that is genetically modified food.
Q. 13. Please tell me whether you tend to agree or tend to disagree with each of the following statements? (SHOW CARD)
READ OUT TOP/BOTTOM/TOP ALTERNATELY TEND TO AGREE
TEND TO DISAGREE DK
1 Genetically modified food will be useful for me and other consumers
1 2 3 (208)
2 Genetically modified food will be useful in the fight against third world hunger
1 2 3 (209)
3 Genetically modified food and crops will only be good for industry and not for the consumer
1 2 3 (210)
4 In the long run, a successful (NATIONALITY) genetically modified food industry will be good for the economy
1 2 3 (211)
5 Genetically modified food poses no threat to future generations
1 2 3 (212)
6 Eating genetically modified food will be harmful to my health and my family's health
1 2 3 (213)
7 Genetically modified food threatens the natural order of things
1 2 3 (214)
8 I think it is safe for me to eat genetically modified food 1 2 3 (215)
9 I will be able to choose whether I eat genetically modified food or not
1 2 3 (216)
10 Whatever the dangers of genetically modified food, future research will deal with them successfully
1 2 3 (217)
11 Current regulations are sufficient to protect people from any risks linked to genetically modified food
1 2 3 (218)
12 Growing genetically modified crops will be harmful to the environment
1 2 3 (219)
13 I am sure about my opinions about genetically modified food
1 2 3 (220)
14 It is easy for me to form an accurate judgement on genetically modified food
1 2 3 (221)
15 It is important for me to have an accurate judgement on genetically modified food
1 2 3 (222)
EB58.0 - NEW
EUROPEAN OPINION RESEARCH GROUP – 58.0 – AUTUMN 2002 Page
5
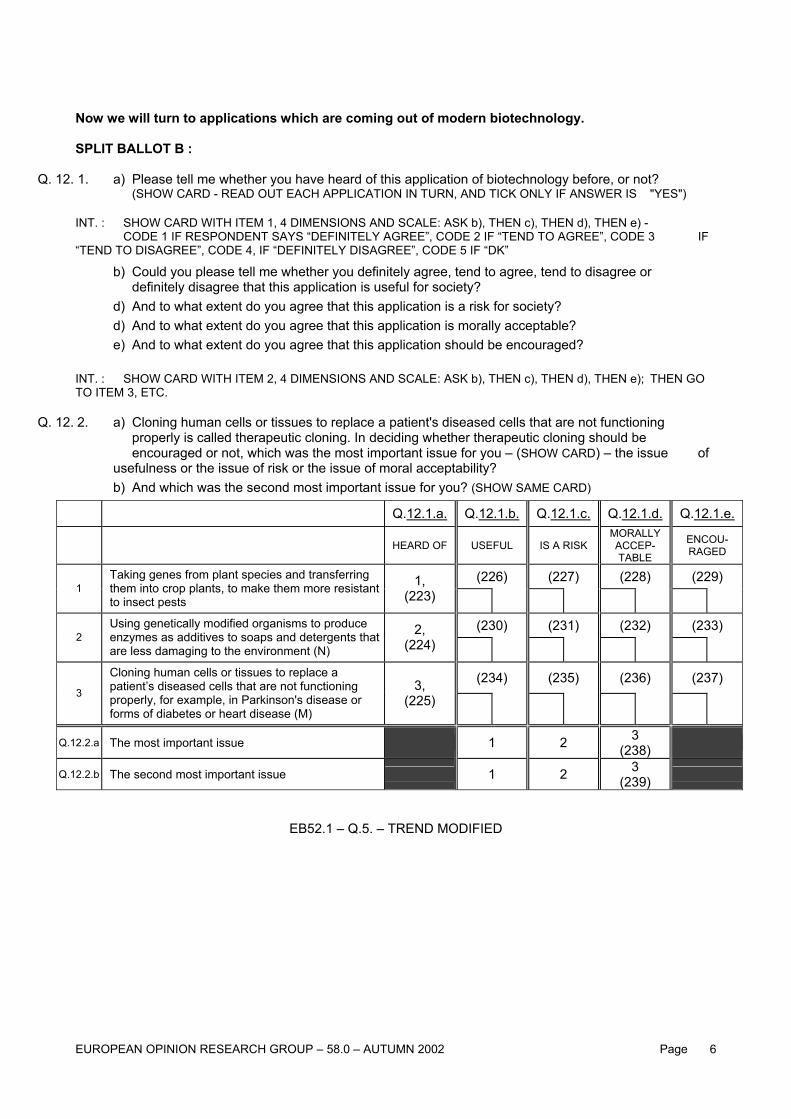
Now we will turn to applications which are coming out of modern biotechnology. SPLIT BALLOT B :
Q. 12. 1. a) Please tell me whether you have heard of this application of biotechnology before, or not? (SHOW CARD - READ OUT EACH APPLICATION IN TURN, AND TICK ONLY IF ANSWER IS "YES")
INT. : SHOW CARD WITH ITEM 1, 4 DIMENSIONS AND SCALE: ASK b), THEN c), THEN d), THEN e) - CODE 1 IF RESPONDENT SAYS “DEFINITELY AGREE”, CODE 2 IF “TEND TO AGREE”, CODE 3 IF TEND TO DISAGREE”, CODE 4, IF “DEFINITELY DISAGREE”, CODE 5 IF “DK” “
b) Could you please tell me whether you definitely agree, tend to agree, tend to disagree or definitely disagree that this application is useful for society? d) And to what extent do you agree that this application is a risk for society? d) And to what extent do you agree that this application is morally acceptable? e) And to what extent do you agree that this application should be encouraged?
INT. : SHOW CARD WITH ITEM 2, 4 DIMENSIONS AND SCALE: ASK b), THEN c), THEN d), THEN e); THEN GO TO ITEM 3, ETC.
Q. 12. 2. a) Cloning human cells or tissues to replace a patient's diseased cells that are not functioning properly is called therapeutic cloning. In deciding whether therapeutic cloning should be encouraged or not, which was the most important issue for you – (SHOW CARD) – the issue of usefulness or the issue of risk or the issue of moral acceptability?
b) And which was the second most important issue for you? (SHOW SAME CARD)
Q.12.1.a. Q.12.1.b. Q.12.1.c. Q.12.1.d. Q.12.1.e.
HEARD OF USEFUL IS A RISK MORALLY ACCEP-TABLE
ENCOU-RAGED
(226) (227) (228) (229) 1
Taking genes from plant species and transferring them into crop plants, to make them more resistant to insect pests
1, (223)
(230) (231) (232) (233) 2
Using genetically modified organisms to produce enzymes as additives to soaps and detergents that are less damaging to the environment (N)
2, (224)
(234) (235) (236) (237) 3
Cloning human cells or tissues to replace a patient’s diseased cells that are not functioning properly, for example, in Parkinson's disease or forms of diabetes or heart disease (M)
3, (225)
Q.12.2.a The most important issue 1 2 3 (238)
Q.12.2.b The second most important issue 1 2 3 (239)
EB52.1 – Q.5. – TREND MODIFIED
EUROPEAN OPINION RESEARCH GROUP – 58.0 – AUTUMN 2002 Page
6
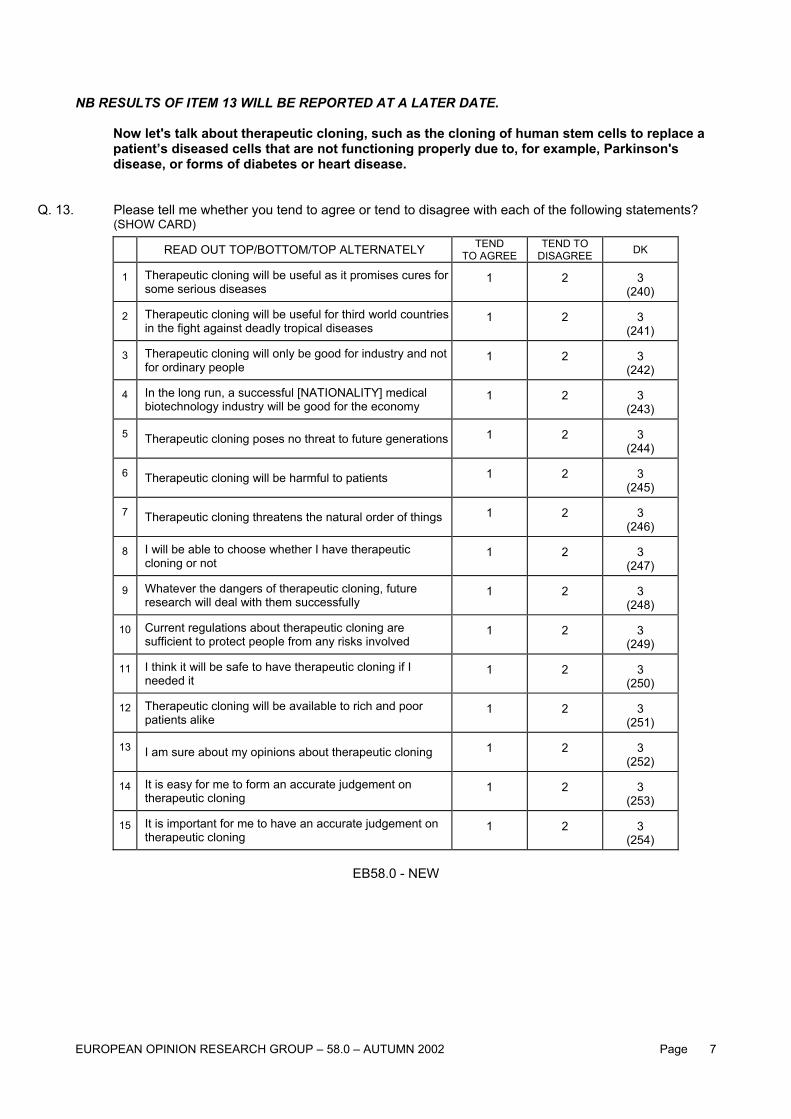
NB RESULTS OF ITEM 13 WILL BE REPORTED AT A LATER DATE. Now let's talk about therapeutic cloning, such as the cloning of human stem cells to replace a
patient’s diseased cells that are not functioning properly due to, for example, Parkinson's disease, or forms of diabetes or heart disease.
Q. 13. Please tell me whether you tend to agree or tend to disagree with each of the following statements?
(SHOW CARD)
READ OUT TOP/BOTTOM/TOP ALTERNATELY TEND TO AGREE
TEND TO DISAGREE DK
1 Therapeutic cloning will be useful as it promises cures for some serious diseases
1 2 3 (240)
2 Therapeutic cloning will be useful for third world countries in the fight against deadly tropical diseases
1 2 3 (241)
3 Therapeutic cloning will only be good for industry and not for ordinary people
1 2 3 (242)
4 In the long run, a successful [NATIONALITY] medical biotechnology industry will be good for the economy
1 2 3 (243)
5 Therapeutic cloning poses no threat to future generations 1 2 3 (244)
6 Therapeutic cloning will be harmful to patients 1 2 3 (245)
7 Therapeutic cloning threatens the natural order of things 1 2 3 (246)
8 I will be able to choose whether I have therapeutic cloning or not
1 2 3 (247)
9 Whatever the dangers of therapeutic cloning, future research will deal with them successfully
1 2 3 (248)
10 Current regulations about therapeutic cloning are sufficient to protect people from any risks involved
1 2 3 (249)
11 I think it will be safe to have therapeutic cloning if I needed it
1 2 3 (250)
12 Therapeutic cloning will be available to rich and poor patients alike
1 2 3 (251)
13 I am sure about my opinions about therapeutic cloning 1 2 3 (252)
14 It is easy for me to form an accurate judgement on therapeutic cloning
1 2 3 (253)
15 It is important for me to have an accurate judgement on therapeutic cloning
1 2 3 (254)
EB58.0 - NEW
EUROPEAN OPINION RESEARCH GROUP – 58.0 – AUTUMN 2002 Page
7
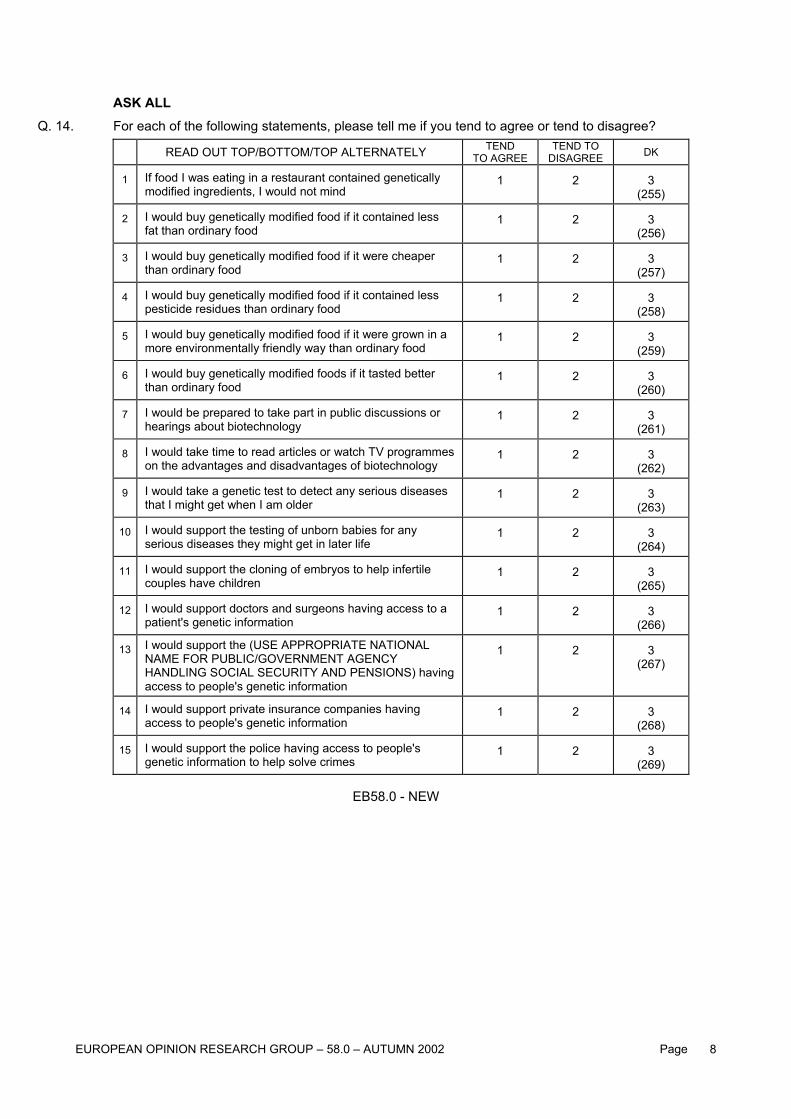
ASK ALL Q. 14. For each of the following statements, please tell me if you tend to agree or tend to disagree?
READ OUT TOP/BOTTOM/TOP ALTERNATELY TEND TO AGREE
TEND TO DISAGREE DK
1 If food I was eating in a restaurant contained genetically modified ingredients, I would not mind
1 2 3 (255)
2 I would buy genetically modified food if it contained less fat than ordinary food
1 2 3 (256)
3 I would buy genetically modified food if it were cheaper than ordinary food
1 2 3 (257)
4 I would buy genetically modified food if it contained less pesticide residues than ordinary food
1 2 3 (258)
5 I would buy genetically modified food if it were grown in a more environmentally friendly way than ordinary food
1 2 3 (259)
6 I would buy genetically modified foods if it tasted better than ordinary food
1 2 3 (260)
7 I would be prepared to take part in public discussions or hearings about biotechnology
1 2 3 (261)
8 I would take time to read articles or watch TV programmes on the advantages and disadvantages of biotechnology
1 2 3 (262)
9 I would take a genetic test to detect any serious diseases that I might get when I am older
1 2 3 (263)
10 I would support the testing of unborn babies for any serious diseases they might get in later life
1 2 3 (264)
11 I would support the cloning of embryos to help infertile couples have children
1 2 3 (265)
12 I would support doctors and surgeons having access to a patient's genetic information
1 2 3 (266)
13 I would support the (USE APPROPRIATE NATIONAL NAME FOR PUBLIC/GOVERNMENT AGENCY HANDLING SOCIAL SECURITY AND PENSIONS) having access to people's genetic information
1 2 3 (267)
14 I would support private insurance companies having access to people's genetic information
1 2 3 (268)
15 I would support the police having access to people's genetic information to help solve crimes
1 2 3 (269)
EB58.0 - NEW
EUROPEAN OPINION RESEARCH GROUP – 58.0 – AUTUMN 2002 Page
8
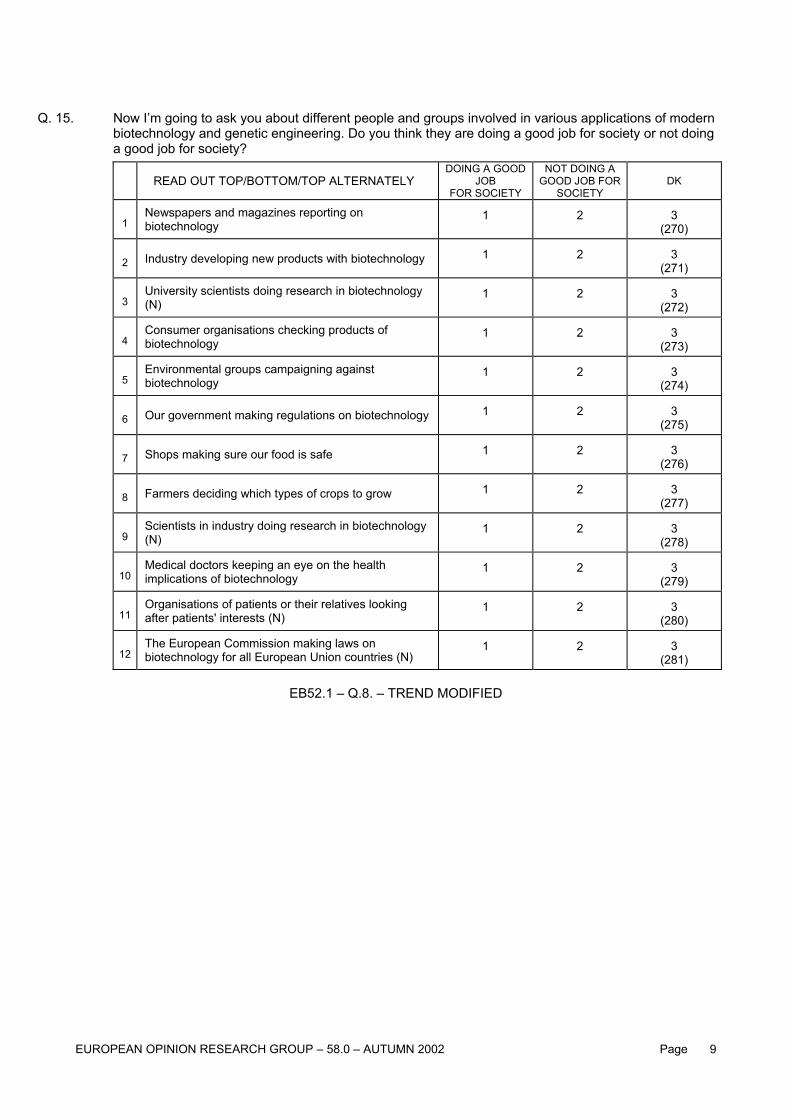
Q. 15. Now I’m going to ask you about different people and groups involved in various applications of modern
biotechnology and genetic engineering. Do you think they are doing a good job for society or not doing a good job for society?
READ OUT TOP/BOTTOM/TOP ALTERNATELY DOING A GOOD
JOB FOR SOCIETY
NOT DOING A GOOD JOB FOR
SOCIETY DK
1 Newspapers and magazines reporting on biotechnology
1 2 3 (270)
2 Industry developing new products with biotechnology 1 2 3 (271)
3 University scientists doing research in biotechnology (N)
1 2 3 (272)
4 Consumer organisations checking products of biotechnology
1 2 3 (273)
5 Environmental groups campaigning against biotechnology
1 2 3 (274)
6 Our government making regulations on biotechnology 1 2 3 (275)
7 Shops making sure our food is safe 1 2 3 (276)
8 Farmers deciding which types of crops to grow 1 2 3 (277)
9 Scientists in industry doing research in biotechnology (N)
1 2 3 (278)
10 Medical doctors keeping an eye on the health implications of biotechnology
1 2 3 (279)
11 Organisations of patients or their relatives looking after patients' interests (N)
1 2 3 (280)
12 The European Commission making laws on biotechnology for all European Union countries (N)
1 2 3 (281)
EB52.1 – Q.8. – TREND MODIFIED
EUROPEAN OPINION RESEARCH GROUP – 58.0 – AUTUMN 2002 Page
9

Q. 16. Now I would like to ask you which of the following sources of information, if any, you trust to tell you
the truth about modern biotechnology (SHOW CARD - MULTIPLE ANSWERS POSSIBLE)
READ OUT TRUST (282 – 295)
1 Consumer organisations 1,
2 Environmental organisations 2,
3 Animal welfare organisations 3,
4 The medical profession 4,
5 Farmer organisations 5,
6 Religious organisations 6,
7 National government bodies 7,
8 International institutions (not companies) 8,
9 A particular industry 9,
10 Universities 10,
11 Political parties 11,
12 Television and newspapers 12,
None of these (SPONTANEOUS) 13,
DK 14,
EB52.1 – Q.9.a. – TREND MODIFIED
Q. 17. Before today have you ever talked about modern biotechnology with anyone? (IF YES) Have you talked about it frequently, occasionally, or only once or twice? (READ OUT - SHOW CARD - ONE ANSWER ONLY)
No, never ………………………………………………………………………………… 1 (296)
Yes, frequently …………………………………………………………………………… 2
Yes, occasionally ………………………………………………………………………… 3
Yes, only once or twice …………………………………………………………………... 4
DK.……………………………………………………………………………………….. 5
EB52.1 - Q.10. - TREND
EUROPEAN OPINION RESEARCH GROUP – 58.0 – AUTUMN 2002 Page
10

Q. 18. Which, if any, of the following newspapers or magazines have you read regularly in the past few
months? (SHOW CARD - READ OUT - MULTIPLE ANSWERS POSSIBLE)
A………………………………………………………………………………………. 1, (297 – 307)
B………………………………………………………………………………………. 2,
C………………………………………………………………………………………. 3,
D………………………………………………………………………………………. 4,
E.……………………………………………………………………………………… 5,
F………………………………………………………………………………………. 6,
G……………………………………………………………………………………… 7,
H……………………………………………………………………………………… 8,
Other…………………………………………………………………………………. 9,
None…………………………………………………………………………………… 10,
DK ……………………………………………………………………………………. 11,
EB52.1 - Q.11.a. - TREND
Q. 19. Before this interview, over the last three months, have you heard or read anything about issues involving modern biotechnology? (IF YES) Where was it? (SHOW CARD - READ OUT - MULTIPLE ANSWERS POSSIBLE)
No………………………………………………………………………………………... 1, (308 – 314)
Yes, in newspapers ……………………………………………………………………… 2,
Yes, on the radio …………………………………………………………………………. 3,
Yes, in magazines ……………………………………………………………………….. 4,
Yes, on television.………………………………………………………………………… 5,
Yes, on the Internet ………………………………………………………………………. 6,
Yes, does not remember (SPONTANEOUS)………………………………………………….. 7,
EB46.1 – Q.16. – TREND MODIFIED
EUROPEAN OPINION RESEARCH GROUP – 58.0 – AUTUMN 2002 Page
11
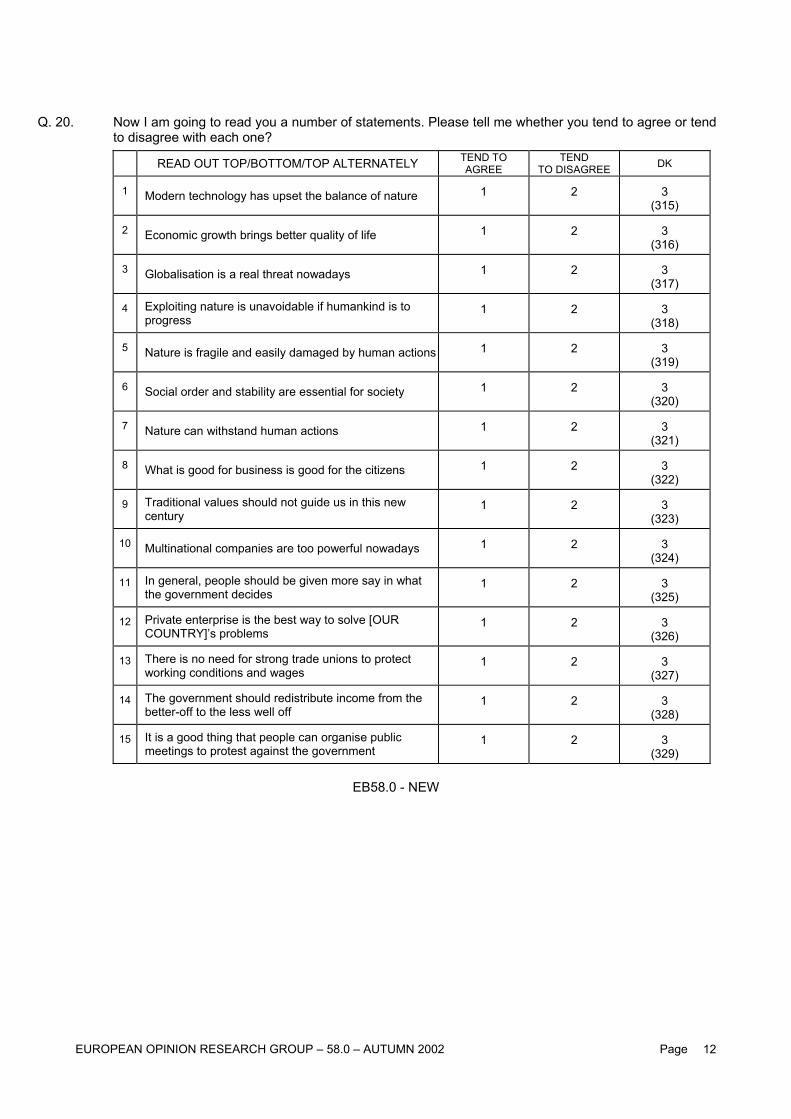
Q. 20. Now I am going to read you a number of statements. Please tell me whether you tend to agree or tend
to disagree with each one?
READ OUT TOP/BOTTOM/TOP ALTERNATELY TEND TO AGREE
TEND TO DISAGREE DK
1 Modern technology has upset the balance of nature 1 2 3 (315)
2 Economic growth brings better quality of life 1 2 3 (316)
3 Globalisation is a real threat nowadays 1 2 3 (317)
4 Exploiting nature is unavoidable if humankind is to progress
1 2 3 (318)
5 Nature is fragile and easily damaged by human actions 1 2 3 (319)
6 Social order and stability are essential for society 1 2 3 (320)
7 Nature can withstand human actions 1 2 3 (321)
8 What is good for business is good for the citizens 1 2 3 (322)
9 Traditional values should not guide us in this new century
1 2 3 (323)
10 Multinational companies are too powerful nowadays 1 2 3 (324)
11 In general, people should be given more say in what the government decides
1 2 3 (325)
12 Private enterprise is the best way to solve [OUR COUNTRY]’s problems
1 2 3 (326)
13 There is no need for strong trade unions to protect working conditions and wages
1 2 3 (327)
14 The government should redistribute income from the better-off to the less well off
1 2 3 (328)
15 It is a good thing that people can organise public meetings to protest against the government
1 2 3 (329)
EB58.0 - NEW
EUROPEAN OPINION RESEARCH GROUP – 58.0 – AUTUMN 2002 Page
12

DEMOGRAPHICS
D. 1. In political matters people talk of "the left" and "the right". How would you place your views on this scale? (SHOW CARD - DO NOT PROMPT. IF CONTACT HESITATES, ASK TO TRY AGAIN)
LEFT RIGHT1 2 3 4 5 6 7 8 9 10
Refusal………………………………………………………………………………………… 11 (578 – 579) DK……………………………………………………………………………………………… 12
EB57.2 – D.1. – DEMO TREND NO QUESTIONS D.2. TO D.6. D. 7. Could you give me the letter which corresponds best to your own current situation?
(SHOW CARD - READ OUT - ONE ANSWER ONLY)
Married………………………………………………………………………………………………………… 1(580 – 581)
Remarried…………………………………………………………………………………………………….. 2
Unmarried, currently living with partner…………………………………………………………………… 3
Unmarried, having never lived with a partner…………………………………………………………….. 4
Unmarried, having previously lived with a partner, but now on my own……………………………….. 5
Divorced………………………………………………………………………………………………………. 6
Separated……………………………………………………………………………………………………… 7
Widowed……………………………………………………………………………………………………….. 8
Other (SPONTANEOUS)…………………………………………………………………………………….. 9
Refusal (SPONTANEOUS)…………………………………………………………………………………... 10
EB57.2 – D.7. – DEMO TREND D. 8. How old were you when you stopped full-time education? (IF STILL STUDYING: CODE 00)
(582 – 583)
EB57.2 – D.8. – DEMO TREND NO QUESTION D.9. D. 10. Gender.
Male…………………………………………………………………………………………………………… 1 (584)
Female……………………………………………………………………………………………………….. 2
EB57.2 – D.10. – DEMO TREND D. 11. How old are you?
(585 – 586)
EB57.2 – D.11. – DEMO TREND NO QUESTIONS D.12. TO D.14.
EUROPEAN OPINION RESEARCH GROUP – 58.0 – AUTUMN 2002 Page
13

D.15. A. AND B. ASKED BEFORE Q.22. NO QUESTIONS D.16. TO D.18. D. 19. Are you in your household, the person who contributes most to the household income? (READ OUT) Yes…………………………………………………………………………………………………………….. 1 (587)
No……………………………………………………………………………………………………………… 2
Both equaly…………………………………………………………………………………………………… 3
DK……………………………………………………………………………………………………………… 4 EB57.2 – D.19. – DEMO TREND
NO QUESTION D.20. D. 21. (IF CODE 2 IN D.19.)
a) What is the current occupation of the person who contributes most to the household income? b) (IF NOT DOING ANY PAID WORK CURRENTLY - CODE 1 TO 4 IN D.21.a.) Did he / she do any paid
work in the past? What was his / her last occupation? D.21.a. D.21.b. CURRENT
OCCUPATION (588 – 589)
LAST OCCUPATION
(590 – 591) NOT WORKING Responsible for ordinary shopping and looking after the home, or without any current occupation, not working
1
Student 2
Unemployed or temporarily not working 3
Retired or unable to work through illness 4
SELF EMPLOYED Farmer
5 1
Fisherman 6 2
Professional (lawyer, medical practitioner, accountant, architect, etc.) 7 3
Owner of a shop, craftsmen, other self-employed person 8 4
Business proprietors, owner (full or partner) of a company 9 5
EMPLOYED Employed professional (employed doctor, lawyer, accountant, architect, etc.)
10 6
General management, director or top management (managing directors, director general, other director) 11 7
Middle management, other management (department head, junior manager, teacher, technician) 12 8
Employed position, working mainly at a desk 13 9
Employed position, not at a desk but travelling (salesmen, driver, etc.) 14 10 Employed position, not at a desk, but in a service job (hospital, restaurant, police, fireman, etc.) 15 11
Supervisor 16 12
Skilled manual worker 17 13
Other (unskilled) manual worker, servant 18 14
NEVER DID ANY PAID WORK 15
EB57.2 – D. 21. a&b – DEMO TREND
EUROPEAN OPINION RESEARCH GROUP – 58.0 – AUTUMN 2002 Page
14

NO QUESTIONS D.22. TO D.24.
D. 25. Would you say you live in a...? (READ OUT) Rural area or village…………………………………………………………………………………………. 1 (592) Small or middle sized town…………………………………………………………………………………. 2 Large town……………………………………………………………………………………………………. 3 DK……………………………………………………………………………………………………………… 4
EB57.2 – D.25. – DEMO TREND NO QUESTIONS D.26. TO D.28. D. 29. We also need some information about the income of this household to be able to analyse the survey
results for different types of households. Here is a list of income groups. (SHOW CARD) Please count the total wages and salaries PER MONTH of all members of this household; all pensions and social insurance benefits; child allowances and any other income like rents, etc...Of course, your answer as all other replies in this interview will be treated confidentially and referring back to you or your household will be impossible. Please give me the letter of the income group your household falls into before tax and other deductions.
B……………………………………………………………………………………………………………….. 1(593 – 594)
T……………………………………………………………………………………………………………….. 2
P……………………………………………………………………………………………………………….. 3
F……………………………………………………………………………………………………………….. 4
E……………………………………………………………………………………………………………….. 5
H………………………………………………………………………………………………………………. 6
L……………………………………………………………………………………………………………….. 7
N………………………………………………………………………………………………………………. 8
R……………………………………………………………………………………………………………… 9
M………………………………………………………………………………………………………………. 10
S………………………………………………………………………………………………………………. 11
K……………………………………………………………………………………………………………….. 12
Refusal………………………………………………………………………………………………………... 13
DK……………………………………………………………………………………………………………… 14
EB57.2 – D.29. – DEMO TREND
EUROPEAN OPINION RESEARCH GROUP – 58.0 – AUTUMN 2002 Page
15
TECHNICAL NOTES
1. INTRODUCTION This survey is part of wave 58.0 of the standard Eurobarometer, carried out between 1 September 2002 and 7 October 2002 by the European Opinion Research Group (a consortium of Market and Public Opinion Research agencies, made out of INRA and GfK Worldwide) on request of the EUROPEAN COMMISSION, Directorate-General Press and Communication, Public Opinion Sector. The following topics are covered in this wave: Services of general interest (Q.1-8)
New technologies (Q.9-20)
ICT (Information Communication Technologies) (Q.21-32)
Health (Q.31-36)
Environment (Q.37-48)
Public safety (Q.49-52) Standard Eurobarometer surveys cover the population of the respective nationalities of the European Union member states, aged 15 years and over, resident in each of the member states. The basic sample design applied in all member states is a multistage, random (probability) one. In each EU country, a number of sampling points are drawn with probability proportional to population size (for a total coverage of the country) and to population density. For doing so, points are drawn systematically from each of the "administrative regional units", after stratification by individual unit and type of area. Hence, they represent the whole territory of member states according to EUROSTAT-NUTS 2 (or equivalent) and according to the distribution of resident population of the respective EU-nationalities in terms of metropolitan, urban and rural areas. In each of the selected sampling points, a starting address is drawn at random. Further addresses are selected as every Nth address by standard random route procedures, from the initial address. In each household, respondent is drawn at random. All interviews are face-to-face in the respondent's home and in the appropriate national language.
EUROPEAN OPINION RESEARCH GROUP – 58.0 – AUTUMN 2002 Page
16
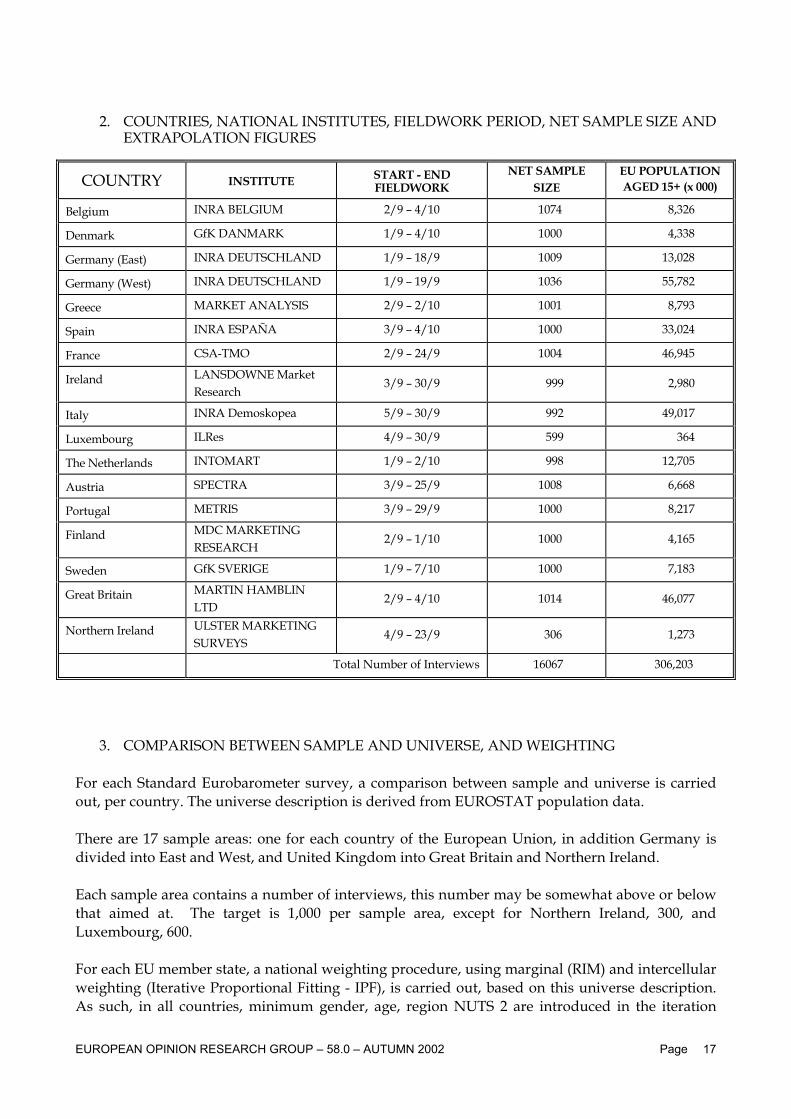
2. COUNTRIES, NATIONAL INSTITUTES, FIELDWORK PERIOD, NET SAMPLE SIZE AND
EXTRAPOLATION FIGURES
COUNTRY INSTITUTE START - END FIELDWORK
NET SAMPLE SIZE
EU POPULATION AGED 15+ (x 000)
Belgium INRA BELGIUM 2/9 – 4/10 1074 8,326
Denmark GfK DANMARK 1/9 – 4/10 1000 4,338
Germany (East) INRA DEUTSCHLAND 1/9 – 18/9 1009 13,028
Germany (West) INRA DEUTSCHLAND 1/9 – 19/9 1036 55,782
Greece MARKET ANALYSIS 2/9 – 2/10 1001 8,793
Spain INRA ESPAÑA 3/9 – 4/10 1000 33,024
France CSA-TMO 2/9 – 24/9 1004 46,945
Ireland LANSDOWNE Market Research
3/9 – 30/9 999 2,980
Italy INRA Demoskopea 5/9 – 30/9 992 49,017
Luxembourg ILRes 4/9 – 30/9 599 364
The Netherlands INTOMART 1/9 – 2/10 998 12,705
Austria SPECTRA 3/9 – 25/9 1008 6,668
Portugal METRIS 3/9 – 29/9 1000 8,217
Finland MDC MARKETING RESEARCH
2/9 – 1/10 1000 4,165
Sweden GfK SVERIGE 1/9 – 7/10 1000 7,183
Great Britain MARTIN HAMBLIN LTD
2/9 – 4/10 1014 46,077
Northern Ireland ULSTER MARKETING SURVEYS
4/9 – 23/9 306 1,273
Total Number of Interviews 16067 306,203
3. COMPARISON BETWEEN SAMPLE AND UNIVERSE, AND WEIGHTING For each Standard Eurobarometer survey, a comparison between sample and universe is carried out, per country. The universe description is derived from EUROSTAT population data. There are 17 sample areas: one for each country of the European Union, in addition Germany is divided into East and West, and United Kingdom into Great Britain and Northern Ireland. Each sample area contains a number of interviews, this number may be somewhat above or below that aimed at. The target is 1,000 per sample area, except for Northern Ireland, 300, and Luxembourg, 600. For each EU member state, a national weighting procedure, using marginal (RIM) and intercellular weighting (Iterative Proportional Fitting - IPF), is carried out, based on this universe description. As such, in all countries, minimum gender, age, region NUTS 2 are introduced in the iteration
EUROPEAN OPINION RESEARCH GROUP – 58.0 – AUTUMN 2002 Page
17
procedure. An additional factor (extrapolation) is added, to bring East and West Germany together in one entity. East Germany counts for 20.8% and West Germany counts for 79.2%. The same principle is used to bring Northern Ireland together with Great Britain, to form the United Kingdom. Here Northern Ireland counts for 2.5% and Great Britain, for 97.5%. For the EU Pop. weight (applied in the Codebook and main report), the data are extrapolated using population figures for each sample area (15 members = 17 sample areas).
4. RESULTS Eurobarometer surveys results are reported in the form of tables, datafiles and analyses. Analyses are made available through - DG PRESS - Public Opinion Sector of the European Commission, rue de la Loi 200, B-1049 Brussels. Results are published on the Internet server of the European Commission: http://europa.eu.int/comm/public_opinion/ All Eurobarometer datafiles are stored at the Zentral Archiv (Universität Köln, Bachemer Strasse, 40, D-50869 Köln-Lindenthal), available through the CESSDA Database: http://www.nsd.uib.no/cessda/europe.html They are accessible to all institutes which are members of the European Consortium for Political Research (Essex), the Inter-University Consortium for Political and Social Research (Michigan) and all those interested in social science research.
5. CONTACTS
For further information and technical queries, please contact: Mrs. Christine KOTARAKOS : [email protected] The European Opinion Research Group EEIG P.a. INRA in BELGIUM SA/NV av. de la Couronne, 159-165 B-1050 BRUSSELS - BELGIUM Tel. ++/32/2/642.47.11 - Fax. ++/32/2/648.34.08 Or: Mr. Renaud SOUFFLOT DE MAGNY [email protected] EUROPEAN COMMISSION DG PRESS – Public Opinion Sector rue de la Loi 200, BREY 7/156 B-1049 BRUSSELS - BELGIUM Tel. ++/32/2/296.19.27 - Fax. ++/32/2/296.17.49
EUROPEAN OPINION RESEARCH GROUP – 58.0 – AUTUMN 2002 Page
18
6. CO-OPERATING AGENCIES AND RESEARCH EXECUTIVES
The European Opinion Research Group EEIG P.a. INRA in BELGIUM SA/NV
Christine KOTARAKOS av. de la Couronne, 159-165
B -1050 BRUSSELS – BELGIUM Q1) Tel. ++/32/2/642.47.11 – Fax: ++/32/2/648.34.08
Q2) e-mail: [email protected]
BELGIQUE INRA BELGIUM Ms Verena MELAN tel. ++/32 2 642 47 11 159, avenue de la Couronne [email protected] fax ++/32 2 648 34 08 B-1050 BRUXELLES DANMARK GfK DANMARK Mr Erik CHRISTIANSEN tel. ++/45 38 32 20 00 Sylows Allé, 1 [email protected] fax ++/45 38 32 20 01 DK-2000 FREDERIKSBERG DEUTSCHLAND INRA DEUTSCHLAND Mr Christian HOLST tel. ++/49 4542 801 0 Papenkamp, 2-6 [email protected] fax ++/49 4542 801 201 D-23879 MÖLLN ELLAS Market Analysis Mr. Spyros Camileris tel. ++/30 1 75 64 688 190 Hymettus Street [email protected] fax. ++/30/1/70 19 355 GR-11635 ATHENA ESPAÑA INRA ESPAÑA Ms Victoria MIQUEL tel. ++/34 91 594 47 93 C/Alberto Aguilera, 7-5° [email protected] fax ++/34 91 594 52 23 E-28015 MADRID FRANCE CSA-TMO Mr. Bruno JEANBART tel. ++/33 1 44 94 59 10 30, rue Saint Augustin [email protected] fax ++/33 1 44 94 40 01 F-75002 PARIS IRELAND LANSDOWNE Market Research Mr Roger JUPP tel. ++/353 1 661 34 83 49, St. Stephen’s Green [email protected] fax ++/353 1 661 34 79 IRL-DUBLIN 2 ITALIA INRA Demoskopea Mrs Maria-Adelaïde SANTILLI tel. ++/39 06 85 37 521 Via Salaria, 290 [email protected] fax ++/39 06 85 35 01 75 I-00199 ROMA LUXEMBOURG ILReS Mr Charles MARGUE tel. ++/352 49 92 91 46, rue du Cimetière [email protected] fax ++/352 49 92 95 555 L-1338 LUXEMBOURG NEDERLAND Intomart Mr. Remko Van den Dool tel. ++/31/35/625 84 11 Noordse Bosje 13-15 [email protected] fax ++/31/35/625 84 33 NL - 1201 DA HILVERSUM AUSTRIA SPECTRA Ms Jitka NEUMANN tel. ++/43/732/6901 Brucknerstrasse, 3-5/4 [email protected] fax ++/43/732/6901-4 A-4020 LINZ PORTUGAL METRIS Ms Mafalda BRASIL tel. ++/351 21 843 22 00 Av. Eng. Arantes e Oliveira, 3-2° [email protected] fax ++/351 21 846 12 03 P-1900 LISBOA FINLAND MDC MARKETING RESEARCH Ltd Mrs Anu Simula tel. ++/358 9 613 500 Itätuulenkuja 10 A [email protected] fax ++/358 9 613 50 423 FIN-02100 ESPOO SWEDEN GfK SVERIGE Mr Rikard EKDAHL tel. ++/46 46 18 16 00 S:t Lars väg 46 [email protected] fax ++/46 46 18 16 11 S-221 00 LUND GREAT BRITAIN MARTIN HAMBLIN LTD Mrs. Lisa LUCKHURST tel. ++/44 207 222 81 81 Mulberry House, Smith Square 36 [email protected] fax ++/44 207 396 90 46 UK-London Swip 3HL
EUROPEAN OPINION RESEARCH GROUP – 58.0 – AUTUMN 2002 Page
19