Embed Size (px)
Citation preview
1381
American Journal of Botany 100(7): 1381–1397. 2013.
American Journal of Botany 100(7): 1381–1397, 2013 ; http://www.amjbot.org/ © 2013 Botanical Society of America
1 Manuscript received 31 August 2012; revision accepted 5 February 2013.
We are indebted to those who contributed the phenological time series analyzed here, including the many scientists and volunteers who recorded fi eld data or who managed subsets of the data, particularly A. H. Fitter, R. S. R. Fitter (Chinnor), David Inouye (Gothic), John O’Keefe (Harvard Forest), and Paul Huth, Shana Smiley, and John Thompson (Mohonk, NY). The observational studies examined here were originally designed by investigators and supported by funding sources listed in the online Supplemental Data (Appendix S1). Special thanks are due to the National Center for Ecological Analysis and Synthesis (funded by NSF EF-0553768, the University of California, Santa Barbara, and the State of California) for supporting the working group on “Forecasting Phenology”. The Stellenbosch Institute for Advanced Study graciously hosted S.J.M. during the preparation of this manuscript.
13 Author for correspondence (e-mail: [email protected]), phone: +1-805-893-8011
doi:10.3732/ajb.1200455
SPECIAL INVITED PAPER—GLOBAL BIOLOGICAL CHANGE
FLOWERING DATE OF TAXONOMIC FAMILIES PREDICTS PHENOLOGICAL SENSITIVITY TO TEMPERATURE:
IMPLICATIONS FOR FORECASTING THE EFFECTS OF CLIMATE CHANGE ON UNSTUDIED TAXA 1
SUSAN J. MAZER 2,3,13 , STEVEN E. TRAVERS 4 , BENJAMIN I. COOK 5,6 , T. JONATHAN DAVIES 7 , KJELL BOLMGREN 8,9 , NATHAN J. B. KRAFT 10 , NICOLAS SALAMIN 11 , AND DAVID W. INOUYE 10,12
2 Department of Ecology, Evolution and Marine Biology, University of California–Santa Barbara, Santa Barbara, California 93106 USA; 3 Stellenbosch Institute for Advanced Study (STIAS), ZA-7600, Mostertsdrift, Private Bag X1, Matieland 7602,
South Africa; 4 Department of Biological Sciences, North Dakota State University, Fargo, North Dakota, 58102, USA; 5 NASA Goddard Institute for Space Studies, New York, New York, 10025, USA: 6 Ocean and Climate Physics, Lamont-Doherty Earth
Observatory, Palisades, New York, 10964, USA: 7 Department of Biology, McGill University, Montreal, QC H3A 0G4, Canada; 8 Theoretical Population Ecology and Evolution Group, Lund University, 221 00, Lund, Sweden; 9 Swedish National Phenology Network, Swedish University of Agricultural Sciences, SE-360 30 Lammhult, Sweden; 10 Department of Biology, University of
Maryland, College Park, Maryland 20742 USA: 11 Swiss Institute of Bioinformatics, Quartier Sorge, 1015 Lausanne, Switzerland; and 12 Rocky Mountain Biological Laboratory, Crested Butte, Colorado 81224 USA
• Premise of the study: Numerous long-term studies in seasonal habitats have tracked interannual variation in fi rst fl owering date (FFD) in relation to climate, documenting the effect of warming on the FFD of many species. Despite these efforts, long-term phenological observations are still lacking for many species. If we could forecast responses based on taxonomic affi nity, how-ever, then we could leverage existing data to predict the climate-related phenological shifts of many taxa not yet studied.
• Methods: We examined phenological time series of 1226 species occurrences (1031 unique species in 119 families) across seven sites in North America and England to determine whether family membership (or family mean FFD) predicts the sensi-tivity of FFD to standardized interannual changes in temperature and precipitation during seasonal periods before fl owering and whether families differ signifi cantly in the direction of their phenological shifts.
• Key results: Patterns observed among species within and across sites are mirrored among family means across sites; early-fl owering families advance their FFD in response to warming more than late-fl owering families. By contrast, we found no consistent relationships among taxa between mean FFD and sensitivity to precipitation as measured here.
• Conclusions: Family membership can be used to identify taxa of high and low sensitivity to temperature within the seasonal, temperate zone plant communities analyzed here. The high sensitivity of early-fl owering families (and the absence of early-fl owering families not sensitive to temperature) may refl ect plasticity in fl owering time, which may be adaptive in environ-ments where early-season conditions are highly variable among years.
Key words: climate change; fi rst fl owering date; global warming; phenology; phenological response; phenological sensitivity.
Plant phenology encompasses the timing of seasonal life cycle events, including the onset and duration of vegetative and reproductive phases such as bud break, leaf expansion, fl owering, pollen release, and fruit ripening. Interannual variation in the phenology of an individual or population is typically interpreted as refl ecting variation in the annual timing of environmental cues, such as the start of spring. Interest in phenology has heightened recently because climate change is predicted to change the annual timing of the cues that initiate phenological transitions (e.g., from winter dormancy to springtime growth), with possible repercussions for plant fi tness and ecosystem function.
The timing of each phenophase relative to seasonal variation in temperature, precipitation, frost events, and soil moisture may infl uence both its duration and its intensity (e.g., the total number of fl owers produced), affecting the amount of plant re-sources available to support primary consumers. In addition, the timing of an individual plant’s phenophases relative to that of
https://ntrs.nasa.gov/search.jsp?R=20140017701 2019-02-16T06:45:19+00:00Z
1382 AMERICAN JOURNAL OF BOTANY [Vol. 100
interannual variation in the onset of phenological events and its re-lationship to variation in climate (reviewed in Parmesan and Yohe, 2003 ; Parmesan, 2006 ; Bertin, 2008 ; Cook et al., 2008 , 2012a , b ; Wolkovich et al., 2012 ). These studies have measured variation within and among plant communities and among taxa in the mag-nitude, direction, and environmental correlates of their phenologi-cal sensitivity to climate. One goal of these investigations has been to document the effects of interannual variation in climate on the onset and duration of phenological events (e.g., Sparks and Carey, 1995 ; Chung et al., 2011 ), and they have detected several patterns.
First, sympatric species differ both in the magnitude and the direction of their sensitivity to climate. Most taxa accelerate the onset of fl owering in response to interannual increases in mean an-nual temperature, but some exhibit no response or delay fl owering ( Fitter et al., 1995 ; Bradley et al., 1999 ; Menzel, 2000 ; Abu-Asab et al., 2001 ; Fitter and Fitter 2002 ; Ahas and Aasa, 2006 ; Menzel et al., 2006a ; Zhang et al., 2007 ; Amano et al., 2010 ; Cook et al., 2008 , 2012a , b ; Gordo and Sanz, 2009 , 2010 ; Beaubien and Hamann, 2011 ; Wolkovich et al., 2012 ; see Bertin, 2008 for other examples). Second, early-fl owering species often exhibit greater advances and/or higher interannual variation in fi rst fl owering date than do the later-fl owering ( Fitter et al., 1995 ; Sparks et al., 2000 ; Fitter and Fitter, 2002 ; Scheifi nger et al., 2002 ; Dunne et al., 2003 ; Menzel et al., 2006b ; Miller-Rushing et al., 2007 ; Miller-Rushing and Primack, 2008 ; Cook et al., 2012b ; Wolkovich et al., 2012 ; but see Miller-Rushing and Inouye, 2009 ). This pattern may refl ect particularly close tracking of winter and/or early spring tempera-tures by early-fl owering taxa combined with greater increases in temperatures in winter/spring relative to summer/fall over the last few decades ( Myneni et al., 1997 ; Ahas, 1999 ; Roetzer et al., 2000 ; Cayan et al., 2001 ; Ahas and Aasa, 2006 ; Bertin, 2008 ). In some cases, however, early-fl owering species delay FFD with increased autumn warming, potentially because they have not received the vernalization (cumulative chill) necessary to promote early fl ower-ing ( Fitter et al., 1995 ; Cook et al., 2012a ). In sum, species often appear to integrate recent climatic conditions, and then use a threshold sum of growing degree days (which may include a chill-ing requirement) as a cue to initiate fl owering, often after the risk of frost (in the temperate biome) has passed ( Scheifi nger et al., 2003 ; Ho et al., 2006 ; Cook et al., 2008 ; Wipf, 2010 ; but see Chmielewski, et al., 2004 ; Inouye, 2008 ).
From these community-level studies, we can now characterize the magnitude and direction of the phenological responses of hun-dreds of species to warmer temperatures. On average, plant species tend to fl ower 5–6 d earlier per ° C increase in mean annual tem-perature ( Wolkovich et al., 2012 ). The species-specifi c long-term records analyzed to date do not, however, allow us to forecast di-rectly the phenological response of species that have not been di-rectly observed. If, however, we could accurately forecast the phenological response of a taxon based on its taxonomic affi nities, then we could predict the climate-induced phenological shifts of many taxa that have not been previously studied.
In the present study, we evaluate the viability of forecasting phenological shifts on the basis of family membership. We fi rst examine the relationships between FFD and interannual variation in seasonal temperature and precipitation among hundreds of wild plant species from diverse families at seven temperate zone locations where long-term observational studies have been conducted ( Table 1 ). Previous species-level analyses of these data have demonstrated that phenological shifts between years can in many cases be attributed to climatic factors (e.g., Fitter et al., 1995 ; Abu-Asab et al., 2001 ; Fitter and Fitter, 2002 ; Cook et al., 2008 , 2012b ; Inouye, 2008 ; Dunnell and Travers, 2011 ;
its mutualists and antagonists infl uences its exposure to competitors, herbivores, diseases, pollinators, seed predators, and fruit dis-persers. Consequently, the phenological schedules of individual plants can have strong fi tness consequences both for plants and for the animals that depend on them ( Harrington et al., 1999 ; Gordo and Sanz, 2005 ; Durant et al., 2007 ; Bertin, 2008 ; Doi et al., 2008 ; Hegland et al., 2009 ; Forrest and Miller-Rushing, 2010 ; Aldridge et al., 2011 ; Gilman et al., 2011 ). For decades, these observations have been well known to evolutionary ecologists studying species interactions. What has only recently become clear is that the degree to which interacting taxa fail to alter syn-chronously the timing of their phenophases in response to cli-mate change can also have profound effects on indivi dual fi tness and population persistence ( Both and Visser, 2001 ; Strode, 2003 ; Winder and Schindler, 2004 ; Gordo and Sanz, 2005 ; Visser and Both, 2005 ; Both et al., 2006 ; Hegland et al., 2009 ; Jones and Cresswell, 2010 ; Burger et al., 2012 ; McKinney et al., 2012 ).
Within and among individual populations and species, the tim-ing of any phenological event may be both environmentally and genetically determined. For example, the fi rst fl owering date (FFD) of individual plants is strongly infl uenced by abiotic conditions, as revealed in many long-term observational studies (reviewed by Bertin, 2008 ). Populations of many wild taxa also retain signifi -cant genetically based variation in FFD ( Mazer, 1987 ; Mazer and Lebuhn, 1999 ; Leon et al., 2001 ; Franks and Weis, 2008 ; Franks, 2011 ; Kawai and Kudo, 2011 ; Brunet and Larson-Rabin, 2012 ), in spite of widespread evidence of strong selection on this trait ( Schemske, 1977 ; Munguía-Rosas et al., 2011 ), which might be expected to purge genetic variation. In addition, populations clearly respond to natural selection on FFD, which would not occur with-out a strong heritable component to FFD ( Franks et al., 2007 ; Franks and Weis, 2008 ; Franks, 2011 ). Genetic variation in FFD is also common among populations, apparently refl ecting adaptive differentiation in response to geographic variation in biotic and abiotic conditions ( Mazer and Lebuhn, 1999 ; Olsson and Ågren, 2002 ; Stinchcombe et al., 2004 ; Kawai and Kudo, 2011 ).
Genetically based variation in FFD among populations sug-gests that higher taxa may also be expected to diverge in FFD. In support of this view, predictable fl owering sequences among fami-lies have been found across plant communities ( Kochmer and Handel, 1986 ; Willis et al., 2008 ; Davis et al., 2010 ). In addition, FFD has often evolved in a correlated fashion with other traits that frequently show little variation at the family or genus level, such as pollination mode, fruit type, and fruit size ( Bolmgren et al., 2003 ; Bolmgren and Lönnberg, 2005 ; Bolmgren and Cowan, 2008 ), which suggests that FFD too may show low variance at higher taxo-nomic levels. Analyses that have detected a phylogenetic compo-nent to variation in FFD have supported this expectation ( Davis et al., 2010 ). Although the mean FFD differs predictably among taxonomic families, we know little about the genetic or taxonomic basis of phenological responses of FFD to climate and their long-term effects on population or species persistence. There is growing evidence, however, that the tendency to alter FFD in response to seasonal temperature promotes population persistence and abun-dance and has a signifi cant phylogenetic component to its variation ( Willis et al., 2008 , 2010 ; Davis et al., 2010 ; Cleland et al., 2012 ). In other words, phenological fl exibility in response to year-to-year variation in temperature appears to be an adaptive trait that evolves nonrandomly among higher taxa. If so, then even without long-term phenological observations on a given species, we could predict its phenological response to climate based on its taxonomic affi nity.
Many long-term observational studies have been conducted in North America, Europe, Asia, and the neotropics to track
1383July 2013] MAZER ET AL.—PHENOLOGICAL SENSITIVITY OF TAXONOMIC FAMILIES
GDD sum and SD GDD sum are the mean and standard deviation, respectively, of a given 3-mo window’s GDD sum estimated across all of the years during which phenological monitoring occurred at a given location.
This standardization yielded, for each site and 3-mo interval, a mean GDD sum of zero and a standard deviation of one across all years for which data were available, thereby accounting for differences among sites in the duration of the observations (i.e., the number of years, and its potential to infl uence on the within-site variance among years); differences among sites in the magnitude of interannual variance in temperature; differences among 3-mo intervals (within years) in the mean and variance in GDD sum ; and differences among 3-mo inter-vals in the variance in GDD sum across years (thereby eliminating the effects on the sensitivity estimates of higher interannual variation in temperature in winter or early spring than in late spring or summer). The daily precipitation values recorded during each 3-mo interval at each site were similarly summed and used to calculate standardized precipitation (PPT) values for each site.
We then used these standardized, 3-mo temperature and precipitation sums as independent variables with which to detect each species’ sensitivity of FFD to temperature and to precipitation at each of the sites. For each species at each site, and for each 3-mo window, we conducted bivariate linear regressions to examine the relationship (across years) between FFD (as the dependent vari-able) and either the standardized GDD or the standardized PPT (each regression included either GDD or PPT as the independent variable). At each site, for each species and climate predictor, the 3-mo period for which these regression mod-els yielded the highest R 2 value was identifi ed; the GDD and PPT sums repre-senting these 3-mo windows were then included in a multiple regression that included GDD, PPT, and the interaction between them. The beta coeffi cients associated with GDD and PPT resulting from this multiple regression were used as the measure of the sensitivity expressed as the change in FFD (in days) per change of one standard deviation in the standardized GDD sum ( Z t ). These sensitivities are referred to below as betaGDD and betaPPT, respectively. In these linear regressions, negative beta coeffi cients indicate earlier FFD in response to higher temperatures or higher precipitation, and positive beta coeffi cients indicate delayed FFD in response to increases in temperature or precipitation. The higher the absolute value of a taxon’s beta coeffi cient, the greater the sen-sitivity of FFD to the associated climatic predictor. These sensitivities were calculated in the same way as those used by Cook et al. (2012b) except that Cook et al. included only GDD sum (and not PPT sum ) in the model used to calcu-late each species’ sensitivity.
The method described for identifying the particular 3-mo window to be used for each climatic variable and species to estimate its phenological sensitivity represented a compromise between selecting a single global predictor that could be used for every taxon and location (e.g., mean annual temperature) and select-ing highly species-specifi c models, which would have made it diffi cult to com-pare sensitivities across sites and taxa.
Species-level data set — The species-specifi c beta values (i.e., sensitivities) for GDD and PPT were used in the analyses below. A few species, for which the multivariate model detected signifi cant interactions ( P < 0.01) between GDD and PPT, were excluded from the data set, as were two species that were strong outliers among the species at their site with respect to their estimated sensitivities to temperature: Dasiphora fruiticosa (Rosaceae) at Gothic, and Dyssoida papposa (Asteraceae) at Konza Prairie. For example, at Gothic, the betaGDD value for Dasiphora fruticosa was −131.01, while the range for the remaining 77 species was −19.36 to 9.61 (mean = −7.55 + SD 3.68). At Konza Prairie, the estimated betaGDD value for Dyssodia papposa was −52.16, while the range for the remaining 145 species was −18.47 to 12.65 (mean = −2.84 + SD 4.72). It is not clear whether these are biologically highly unusual taxa; whether the data for these taxa were unreliable (e.g., due to small sample sizes); or whether there were errors in the original data set. Several species were also excluded because their species’ names yielded no family identity in either the Kew or the Angiosperm Phylogeny Group data sets. The resulting data set in-cluded 1226 species occurrences (i.e., species × site combinations) in 119 fami-lies across the seven sites ( Table 1 ).
Family-level data sets — At each site, site-specifi c family means for be-taGDD and betaPPT were calculated as the means of the confamilial species’ beta coeffi cients. Subsequent analyses, described next, used subsets of these family mean × site combinations, depending on whether we wished to exclude families represented only by single species or at only one site. For example, 119 families were monitored across all sites, including families represented by a single species at a single site (yielding 325 family × site combinations). Only 60 families, however, were monitored at ≥ 3 sites (245 family × site combinations, with ≥ 1 species/family/site), and 21 families were present at three or more sites
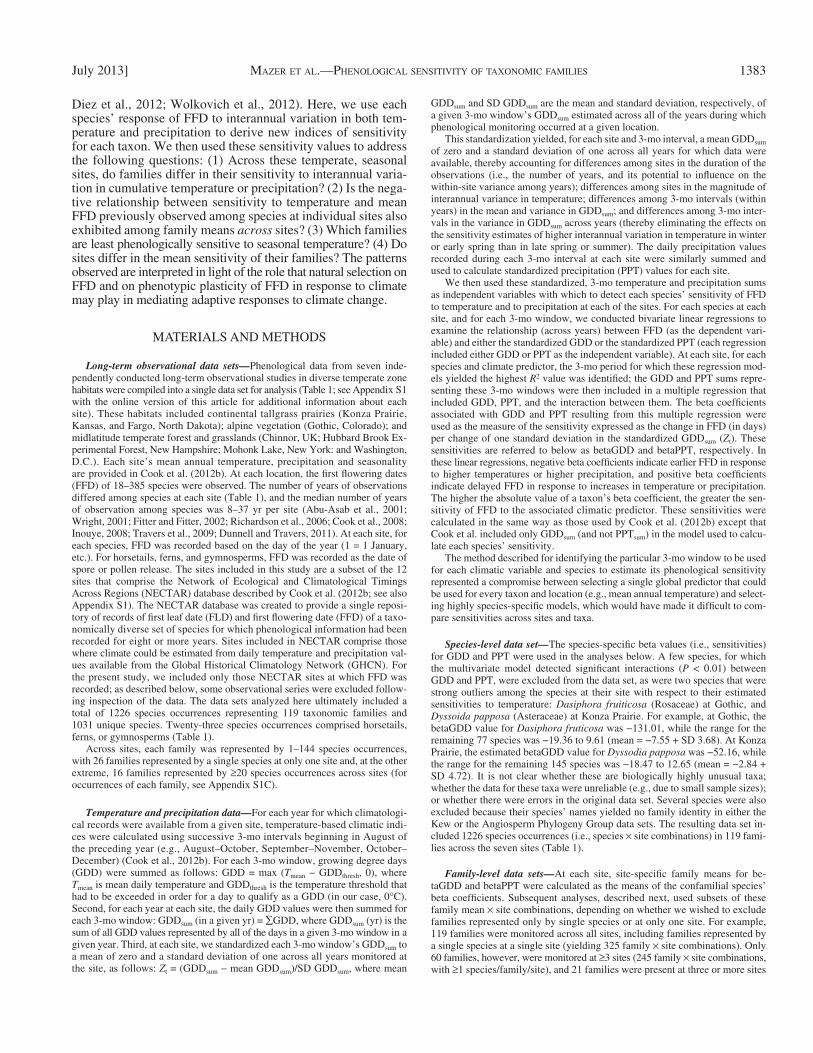
Diez et al., 2012 ; Wolkovich et al., 2012 ). Here, we use each species’ response of FFD to interannual variation in both tem-perature and precipitation to derive new indices of sensitivity for each taxon. We then used these sensitivity values to address the following questions: (1) Across these temperate, seasonal sites, do families differ in their sensitivity to interannual varia-tion in cumulative temperature or precipitation? (2) Is the nega-tive relationship between sensitivity to temperature and mean FFD previously observed among species at individual sites also exhibited among family means across sites? (3) Which families are least phenologically sensitive to seasonal temperature? (4) Do sites differ in the mean sensitivity of their families? The patterns observed are interpreted in light of the role that natural selection on FFD and on phenotypic plasticity of FFD in response to climate may play in mediating adaptive responses to climate change.
MATERIALS AND METHODS
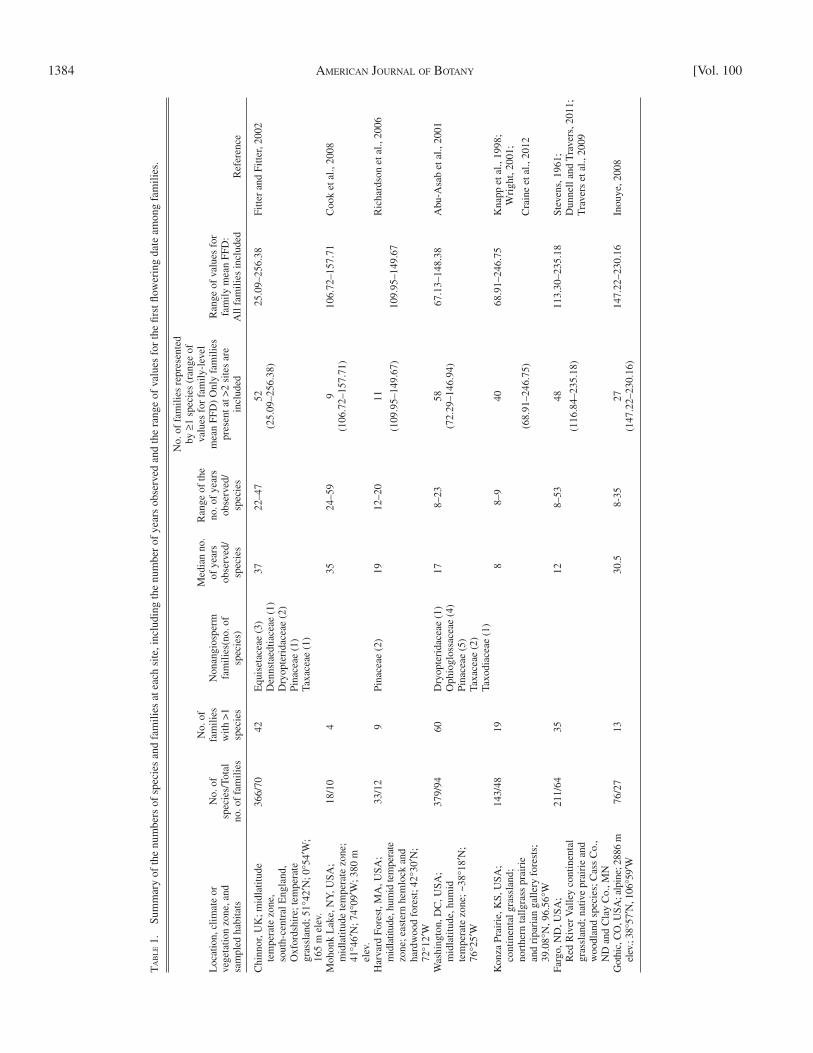
Long-term observational data sets — Phenological data from seven inde-pendently conducted long-term observational studies in diverse temperate zone habitats were compiled into a single data set for analysis ( Table 1 ; see Appendix S1 with the online version of this article for additional information about each site). These habitats included continental tallgrass prairies (Konza Prairie, Kansas, and Fargo, North Dakota); alpine vegetation (Gothic, Colorado); and midlatitude temperate forest and grasslands (Chinnor, UK; Hubbard Brook Ex-perimental Forest, New Hampshire; Mohonk Lake, New York: and Washington, D.C.). Each site’s mean annual temperature, precipitation and seasonality are provided in Cook et al. (2012b) . At each location, the fi rst fl owering dates (FFD) of 18–385 species were observed. The number of years of observations differed among species at each site ( Table 1 ), and the median number of years of observation among species was 8–37 yr per site ( Abu-Asab et al., 2001 ; Wright, 2001 ; Fitter and Fitter, 2002 ; Richardson et al., 2006 ; Cook et al., 2008 ; Inouye, 2008 ; Travers et al., 2009 ; Dunnell and Travers, 2011 ). At each site, for each species, FFD was recorded based on the day of the year (1 = 1 January, etc.). For horsetails, ferns, and gymnosperms, FFD was recorded as the date of spore or pollen release. The sites included in this study are a subset of the 12 sites that comprise the Network of Ecological and Climatological Timings Across Regions (NECTAR) database described by Cook et al. (2012b ; see also Appendix S1). The NECTAR database was created to provide a single reposi-tory of records of fi rst leaf date (FLD) and fi rst fl owering date (FFD) of a taxo-nomically diverse set of species for which phenological information had been recorded for eight or more years. Sites included in NECTAR comprise those where climate could be estimated from daily temperature and precipitation val-ues available from the Global Historical Climatology Network (GHCN). For the present study, we included only those NECTAR sites at which FFD was recorded; as described below, some observational series were excluded follow-ing inspection of the data. The data sets analyzed here ultimately included a total of 1226 species occurrences representing 119 taxonomic families and 1031 unique species. Twenty-three species occurrences comprised horsetails, ferns, or gymnosperms ( Table 1 ).
Across sites, each family was represented by 1–144 species occurrences, with 26 families represented by a single species at only one site and, at the other extreme, 16 families represented by ≥ 20 species occurrences across sites (for occurrences of each family, see Appendix S1C).
Temperature and precipitation data — For each year for which climatologi-cal records were available from a given site, temperature-based climatic indi-ces were calculated using successive 3-mo intervals beginning in August of the preceding year (e.g., August–October, September–November, October–December) ( Cook et al., 2012b ). For each 3-mo window, growing degree days (GDD) were summed as follows: GDD = max ( T mean − GDD thresh , 0), where T mean is mean daily temperature and GDD thresh is the temperature threshold that had to be exceeded in order for a day to qualify as a GDD (in our case, 0 ° C). Second, for each year at each site, the daily GDD values were then summed for each 3-mo window: GDD sum (in a given yr) = ∑GDD, where GDD sum (yr) is the sum of all GDD values represented by all of the days in a given 3-mo window in a given year. Third, at each site, we standardized each 3-mo window’s GDD sum to a mean of zero and a standard deviation of one across all years monitored at the site, as follows: Z t = (GDD sum − mean GDD sum )/SD GDD sum , where mean
1384 AMERICAN JOURNAL OF BOTANY [Vol. 100
TA
BL
E 1
. Su
mm
ary
of th
e nu
mbe
rs o
f sp
ecie
s an
d fa
mili
es a
t eac
h si
te, i
nclu
ding
the
num
ber
of y
ears
obs
erve
d an
d th
e ra
nge
of v
alue
s fo
r th
e fi r
st fl
ower
ing
date
am
ong
fam
ilies
.
Loc
atio
n, c
limat
e or
ve
geta
tion
zone
, and
sa
mpl
ed h
abita
ts
No.
of
spec
ies/
Tota
l no
. of
fam
ilies
No.
of
fam
ilies
w
ith >
1 sp
ecie
s
Non
angi
ospe
rm
fam
ilies
(no.
of
spec
ies)
Med
ian
no.
of y
ears
ob
serv
ed/
spec
ies
Ran
ge o
f th
e no
. of
year
s ob
serv
ed/
spec
ies
No.
of
fam
ilies
rep
rese
nted
by
≥ 1
spec
ies
(ran
ge o
f va
lues
for
fam
ily-l
evel
m
ean
FFD
) O
nly
fam
ilies
pr
esen
t at >
2 si
tes
are
incl
uded
Ran
ge o
f va
lues
for
fa
mily
mea
n FF
D:
All
fam
ilies
incl
uded
Ref
eren
ce
Chi
nnor
, UK
; mid
latit
ude
tem
pera
te z
one,
so
uth-
cent
ral E
ngla
nd,
Oxf
ords
hire
; tem
pera
te
gras
slan
d; 5
1 ° 42
′ N; 0
° 54 ′
W;
165
m e
lev.
366/
7042
Equ
iset
acea
e (3
)37
22–4
752
25.0
9–25
6.38
Fitte
r an
d Fi
tter,
2002
D
enns
taed
tiace
ae (
1)(2
5.09
–256
.38)
Dry
opte
rida
ceae
(2)
Pina
ceae
(1)
Taxa
ceae
(1)
Moh
onk
Lak
e, N
Y, U
SA;
mid
latit
ude
tem
pera
te z
one;
41
° 46 ′
N; 7
4 ° 09
′ W; 3
80 m
el
ev.
18/1
04
3524
–59
910
6.72
–157
.71
Coo
k et
al.,
200
8 (1
06.7
2–15
7.71
)
Har
vard
For
est,
MA
, USA
; m
idla
titud
e, h
umid
tem
pera
te
zone
; eas
tern
hem
lock
and
ha
rdw
ood
fore
st; 4
2 ° 30
′ N;
72 ° 1
2 ′ W
33/1
29
Pina
ceae
(2)
1912
–20
11 R
icha
rdso
n et
al.,
200
6
(109
.95–
149.
67)
109.
95–1
49.6
7
Was
hing
ton,
DC
, USA
; m
idla
titud
e, h
umid
te
mpe
rate
zon
e; ~
38 ° 1
8 ′ N
; 76
° 25 ′
W
379/
9460
Dry
opte
rida
ceae
(1)
178–
2358
67.1
3–14
8.38
Abu
-Asa
b et
al.,
200
1 O
phio
glos
sace
ae (
4)(7
2.29
–146
.94)
Pina
ceae
(5)
Taxa
ceae
(2)
Taxo
diac
eae
(1)
Kon
za P
rair
ie, K
S, U
SA;
cont
inen
tal g
rass
land
; no
rthe
rn ta
llgra
ss p
rair
ie
and
ripa
rian
gal
lery
for
ests
; 39
.08 °
N, 9
6.56
° W
143/
4819
88–
940
68.9
1–24
6.75
Kna
pp e
t al.,
199
8 ;
W
righ
t, 20
01 ;
(68.
91–2
46.7
5) C
rain
e et
al.,
201
2
Farg
o, N
D, U
SA;
Red
Riv
er V
alle
y co
ntin
enta
l gr
assl
and;
nat
ive
prai
rie
and
woo
dlan
d sp
ecie
s; C
ass
Co.
, N
D a
nd C
lay
Co.
, MN
211/
6435
128–
5348
113.
30–2
35.1
8 St
even
s, 1
961 ;
(116
.84–
235.
18)
Dun
nell
and
Tra
vers
, 201
1 ; T
rave
rs e
t al.,
200
9
Got
hic,
CO
, USA
; alp
ine;
288
6 m
el
ev.;
38 ° 5
7 ′ N
, 106
° 59 ′
W76
/27
1330
.58-
3527
147.
22–2
30.1
6 In
ouye
, 200
8 (1
47.2
2–23
0.16
)
1385July 2013] MAZER ET AL.—PHENOLOGICAL SENSITIVITY OF TAXONOMIC FAMILIES
represented by ≥ 1 species at ≥ 3 sites were conducted. Third, mean betaGDD and mean betaPTT were each regressed on, separately, the mean FFD and the mean standardized FFD among 21 family means, where every site × family combination included ≥ 3 species. Fourth, all species occurrences in each of the 10 most common families were examined to determine whether the relationships among taxa be-tween betaGDD or betaPTT and the standardized FFD were consistent across fami-lies. Within each of these families, some species contributed multiple data points because they were represented at multiple sites (where their betaGDD and betaPPT values were independently measured), but this did not drastically increase the degrees of freedom in each analysis (see Results).
RESULTS
Distribution of family-level sensitivities to GDD and PPT within sites — Most (or all) families at most sites advanced fl owering in response to increasing seasonal warmth; most be-taGDD values are <0, and the mean betaGDD among families is signifi cantly <0 at all sites ( Fig. 1 , Table 2 ). At fi ve of the seven sites, a few families delayed fl owering (betaGDD > 0) in response to increasing temperatures. By contrast, the family means for betaPPT indicate much lower mean sensitivity to standardized increases in precipitation ( Fig. 1 ). Only three of seven sites (Mohonk, Chinnor, and Gothic) exhibit a mean be-taPPT among family means that is signifi cantly different from zero. At these sites, the mean betaPPT values are signifi cantly > 0; increasing precipitation at these sites resulted, on average, in a delay in FFD ( Table 2 ).
FFD vs. standardized FFD across sites — Among the 21 most evenly distributed families, the mean raw and standard-ized FFDs are highly correlated ( Fig. 2 ). The few relatively large deviations of standardized FFD from the predicted values indicate cases where families are found in two or more habitats that differ greatly in the distributions of their raw FFDs. Using the standardized FFDs controls for variation among sites in the mean and range of their raw FFDs.
Differences among sites in mean FFD — Sites differed sig-nifi cantly in mean FFD, whether species or family means for FFD were used (one-way ANOVA: effect of site on species mean FFD: F 6, 1225 = 86.09, P < 0.0001, R 2 = 0.30; effect of site on family mean FFD, using the family means from all 119 families: F 6, 324 = 25.46, P < 0.0001, R 2 = 0.32). Washington, D.C. exhibited the earliest mean FFD, while Gothic exhibited the latest mean FFD. At each site, the mean FFD remained unchanged regardless of whether species’ or family mean val-ues for FFD were used ( Table 3 : the correlation among site means based on species- vs. family-level FFDs is highly sig-nifi cant and positive ( r = 0.98, P < 0.0002, df = 6). So, al-though some families were represented by many more species than others (see Appendix S1C), this imbalance did not affect the site means for FFD.
Among sites, the standard deviation (SD) in the FFD among species and among family means varies by a factor of four. These differences among sites in both the mean and variance of FFD justifi ed the standardization of FFD (for use in cross-site analyses, as described above) so that each site had a mean of zero and a SD of one.
Differences among sites in the mean sensitivity of their taxa to temperature or precipitation — There were signifi cant differences among sites in both mean betaGDD and mean betaPPT of the families present (based on the means of 119 families; Table 3 )
where at least three species per family were present at each site (83 family × site combinations). We estimated family means across sites by averaging site-specifi c family means.
Analyses — Frequency distributions of beta coeffi cients (sensitivities of FFD to GDD and PPT)— The distribution of site-specifi c family means for each variable was subjected to a two-tailed t test to determine whether the mean family-level sensitivities differed signifi cantly from zero.
Standardization of fi rst fl owering date— For analyses conducted within sites, the mean FFD of species and families was used. A one-way analysis of variance (ANOVA) detected signifi cant differences among sites with respect to the mean FFD of their species and families (see Results). To remove the effects of this variation among sites when pooling their data for subsequent analyses, we fi rst standardized FFD to a mean of zero and a standard deviation of one at each site by subtracting each species’ mean FFD across its phenological time series from the mean FFD (across species) for the site, and then dividing this difference by the standard deviation in FFD for the site. These species-specifi c standardized FFDs were used to obtain family means within sites, and these site-specifi c family means were averaged to estimate each family’s mean standardized FFD across sites, expressed in units of standard deviations. To examine the com-parability of these two measures of FFD, we used a simple regression to determine the relationship between the mean standardized FFD and the mean raw FFD among the 21 most common and widespread families (see above).
The standardized FFD values measure each taxon’s mean FFD relative to the other taxa at the site where it was observed. This parameter therefore statistically eliminates the effects of variation among species, families, and sites in FFD due to differences among sites in the mean and variance of the raw value for FFD. The standardization of FFD is crucial when pooling sites to examine the cross-site relationships among family means between sensitivity and FFD. Without this standardization, a family with a mean raw FFD value of 140 would be a very early-fl owering taxon if observed at Gothic but a very late-fl owering taxon if observed at Harvard ( Table 1 ). Using the standardized FFD, the family’s relative fl owering time is analyzed independently of its raw FFD value. Similar to all standardiza-tion procedures that control statistically for variation in factors that affect the variance in the independent variable (including routine residual analyses and the standardization of the climate predictors described above), the standardiza-tion of FFD increases the ability of the regressions to detect a statistically sig-nifi cant relationship between temperature- or precipitation-sensitivity and FFD.
Differences among families in standardized FFD, betaGDD, and betaPPT— We conducted two-way fi xed factor ANOVAs on each data set described above to detect signifi cant differences among families ( across sites) in standardized FFD, betaGDD, and betaPPT. Because the data were unbalanced (many families were absent at many sites), the model was restricted to including family and site (but not the family × site interaction) as independent factors. Type III sums of squares were used to detect signifi cant main effects (JMP, version 9.0; SAS Institute, Cary, North Carolina, USA).
Analyses of covariance to detect the independent effects of family and FFD on temperature-sensitivity— To determine whether the effects of family on betaGDD detected in the two-way ANOVAs described above were mediated by or indepen-dent of the families’ standardized FFD, we conducted analyses of covariance (ANCOVA) using betaGDD as the dependent variable and family and standard-ized FFD as the independent variables. In this model, if the effect of family is statistically signifi cant even when FFD is included in the model, this would mean that taxonomic families differ in their temperature-sensitivity independently of their FFD relative to other taxa at their site. If, however, the effect of family cannot be detected statistically when FFD is included in the model, this would mean that the differences in temperature-sensitivity detected among families are mediated by variation among them in their FFD (or by a factor strongly asso-ciated with FFD). These ANCOVAs were conducted on the data sets that were suffi ciently well balanced to permit the analysis.
Relationships between sensitivity to climatic predictors and FFD— Bivariate regressions of betaGDD or betaPPT vs. standardized (or raw) FFD were conducted at the species and family levels. To reduce the statistical effects of single families that were geographically restricted and/or rare in the data set, we repeated some analyses on the more restricted data sets ( N = 60 or N = 21 families). First, bivariate regressions of betaGDD and betaPPT on standardized FFD among the 1226 species occurrences distributed across and within sites were conducted. Second, regressions of mean betaGDD and betaPTT on mean standardized FFD among the 60 families

1386 AMERICAN JOURNAL OF BOTANY [Vol. 100
at Konza Prairie advanced FFD by only 2.8 d in response to temperature, and families at Fargo exhibited no change in FFD in response to precipitation (mean betaPPT = −0.005).
Differences among families in standardized FFD — Two-way ANOVAS detected highly signifi cant variation among fam-ily means, across sites, in the standardized FFD, regardless of the data set analyzed ( Table 4A–E ; for the 10 most common families, see Fig. 3 ).
Differences among families in betaGDD — Two-way ANOVAs consistently detected signifi cant variation among family means
(one-way ANOVAs: Effect of site on family mean betaGDD: F 6, 324 = 9.76, P < 0.0001, R 2 = 0.16; Effect of site on family mean betaPPT: F 6, 324 = 5.33, P < 0.0001, R 2 = 0.09). The rela-tively low R 2 values of these models, however, indicate that there was much more variation among families in sensitivity to tem-perature and precipitation than can be accounted for by site-specifi c conditions.
Family means at Gothic exhibited the highest absolute sensi-tivity to both temperature and precipitation. On average, fami-lies at Gothic advanced FFD by 7.9 d per standardized increase in GDD and delayed FFD by 3.8 d per standardized increase in PPT (likely the result of increased snowpack). By contrast, families
Fig. 1. Frequency distributions of mean sensitivity to temperature (betaGDD) (orange) and sensitivity to precipitation (betaPTT) (blue) among family means at each site. At each site, each family’s mean betaGDD and betaPTT were estimated from the values of the confamilial species. Shaded areas indicate where the distributions overlap.
TABLE 2. Summary of mean family sensitivities of fi rst fl owering day (FFD) to growing degree days and to total precipitation; sensitivities are reported as sensitivity to temperature (betaGDD) and betaPPT, the beta-coeffi cients for the regressions of FFD on standardized GDD and PPT values, respectively. Two-tailed t tests and signed rank tests were conducted to detect whether the mean family-level sensitivity at each site was signifi cantly different from zero.
Site ( N = number of families)
Family mean betaGDD < or > 0?
t test, test statistic
Probability > | t |, two-tailed t test
Family mean betaPPT < or > 0?
t test test statistic
Probability > | t |, two-tailed t test
Chinnor (70) <0 −13.18 <0.0001 >0 2.80 <0.0067Mohonk (10) <0 −13.11 <0.0001 >0 3.58 0.0059Harvard Forest (12) <0 −6.72 <0.0001 0 −2.11 0.0585Washington, DC (94) <0 −11.45 <0.0001 0 2.13 0.0356Konza Prairie (48) <0 −5.47 <0.0001 0 0.30 0.7645Fargo (64) <0 −5.02 <0.0001 0 −0.01 0.9890Gothic (27) <0 −14.92 <0.0001 >0 8.68 <0.0001

1387July 2013] MAZER ET AL.—PHENOLOGICAL SENSITIVITY OF TAXONOMIC FAMILIES
The effect of FFD on betaGDD, however, was statistically sig-nifi cant in all tests based on site-specifi c family means.
Relationships between sensitivities and standardized FFD — Relationships among species across pooled sites— The regres-sion of betaGDD on the standardized FFD was signifi cantly positive; species that fl owered early relative to the mean FFD of co-occurring species showed more negative betaGDD values than late-fl owering species ( Fig. 4 ). Of the 1226 phenological series, 1088 had betaGDD <0; 89% of them exhibited earlier FFDs in response to warmer temperatures. Moreover, the regres-sion illustrates that early-fl owering species advanced their fl ower-ing in response to a standardized increase in GDD to a greater degree than late-fl owering species (see also Wolkovich et al., 2012 ). The comparable relationship between betaPPT and the standardized FFD was not statistically signifi cant ( R 2 = 0, P > 0.6278, df = 1225).
Relationships among species within sites— Among species, the site-specifi c relationships between betaGDD and FFD agree with the cross-site relationships. All seven sites exhibit a posi-tive regression slope, although in only four (Chinnor, Fargo, Gothic, and Washington, DC) are the slopes signifi cantly >0 ( Fig. 5 ; at Mohonk, P < 0.09). The relationships between be-taGDD and the standardized FFD are qualitatively identical, although the regression parameters differ due to the standard-ization of the x -axis (see Appendix S1A). The comparable anal-yses for betaPPT indicate that three sites exhibit a signifi cant relationship between betaPPT and FFD, but the slope is >0 at 1 site (Chinnor), and <0 at two sites (Konza Prairie, KS and Washington, D.C.) (see Appendix S1B).
Relationships among species within families— The relation-ships between temperature-sensitivity and standardized FFD observed within families mirrors the relationships observed within sites. Within seven of the 10 most common families, earlier-fl owering taxa have signifi cantly more negative betaGDD values than later-fl owering taxa (betaGDD varies positively with standardized FFD; Table 6 ). The vast majority of species in each family have betaGDD values <0 ( Table 6 ), so these re-gressions indicate that earlier-fl owering confamilial species advance their FFD more than the late-fl owering ones. In all families, the mean betaGDD is <0 (Appendix S1E). In two of the 10 most common families (Poaceae and Ranunculaceae), betaPTT is negatively associated with standardized FFD ( Table 6 ); in these families, early-fl owering taxa have higher betaPTT values than late-fl owering taxa do, indicating that the former accelerated fl owering less or delay fl owering more in response to higher precipitation.
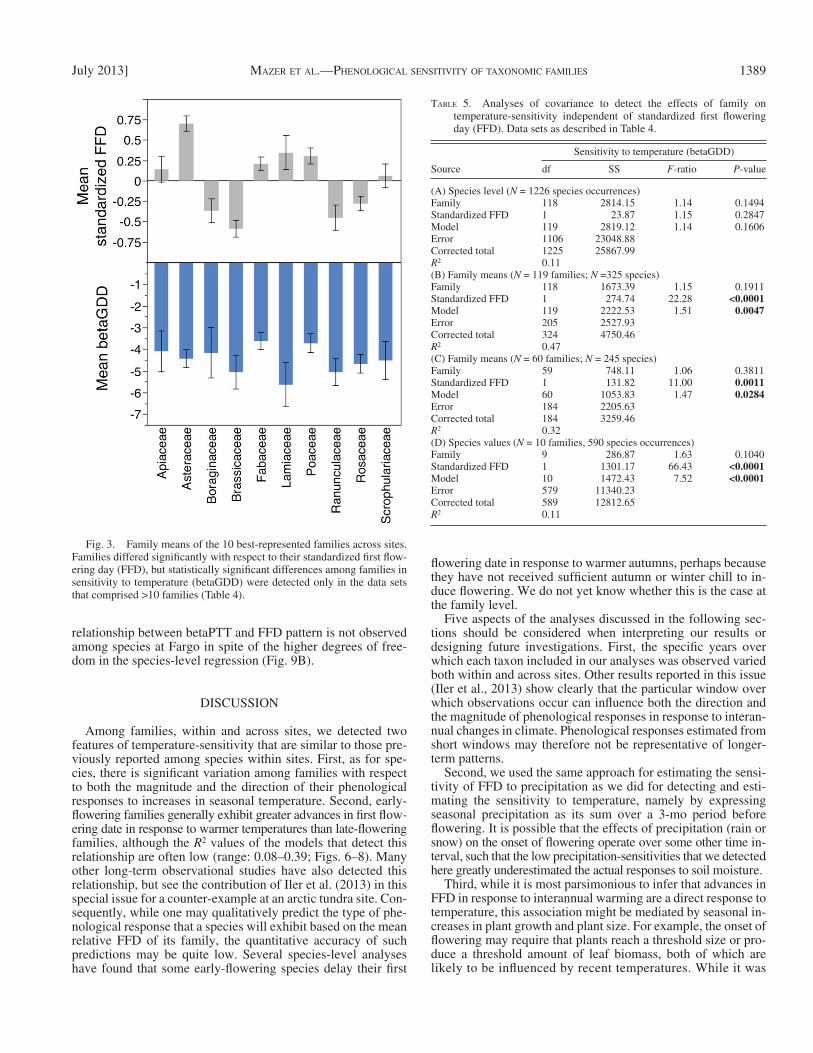
in temperature-sensitivity independently of the effects of site, but the strength of the family effect differed among data sets ( Table 4A–E ). The strongest family effects were detected in data sets that included site-specific family means ( Table 4B–D ); the weakest statistical effects of family affi nity were detected in the data sets composed of individual species’ val-ues ( Table 4A, E ). The mean values of the betaGDD of the 10 best-represented families show that, although the stan-dard errors of the most extreme family means for FFD and betaGDD do not overlap ( Fig. 3 ; Fabaceae and Poaceae vs. Brassicaceae, Lamiaceae, Ranunculaceae, and Rosaceae), the ANOVA did not detect a significant family effect on temperature-sensitivity when applied to the individual species values ( Table 4E ).
Differences among families in betaPPT — Two-way ANOVAs detected signifi cant variation among families only in the data set comprising the 119 site-specifi c family means ( Table 4B ).
Analyses of covariance to detect the independent effects of family and FFD on temperature-sensitivity — None of the ANCOVAs detected a signifi cant effect of family on betaGDD independently of the families’ standardized FFDs ( Table 5 ).
Fig. 2. Relationship between standardized vs. raw fi rst fl owering day (FFD) among 21 families distributed across all seven sites. Each family was represented by ≥ 3 species at each of ≥ 3 sites (every site × family com-bination ≥ 3 species). Although sites differed signifi cantly with respect to the mean FFD of their species and families ( Table 3 ), the values of FFD standardized for each site to a mean of zero and a standard deviation of one were highly correlated with the raw values of FFD.
TABLE 3. Site means: the mean values (and standard deviations) for fi rst fl owering day (FFD) exhibited by the species and families at each site. Site means of FFD based on species and on families are highly correlated ( r = 0.98, N = 7). Within columns, shared superscripts indicate that means do not differ signifi cantly based on a Tukey’s test following a one-way ANOVA.
Site (number of families)Mean (SD) FFD among species
Mean (SD) FFD among family means
Mean (SD) of betaGDD among families
Mean (SD) of betaPPT among families
Chinnor (70) 146.19 (40.34) cd 139.16 (41.39) c −5.59 (3.41) bc 0.70 (2.10) b Mohonk (10) 127.33 (19.80) de 123.69 (14.67) cd −4.80 (1.16) abc 1.09 (0.96) ab Harvard (12) 123.73 (10.33) e 123.87 (9.80) cd −3.31 (1.71) ab −1.31 (2.16) b Washington, DC (94) 112.19 (23.78) e 115.40 (19.78) d −3.45 (2.93) a 0.59 (2.67) b Konza Prairie (48) 154.14 (42.31) bc 141.63 (34.01) bc −2.83 (3.59) a 0.25 (5.74) b Fargo (64) 156.37 (27.30) b 154.55 (21.32) b −3.12 (4.98) a −0.005 (3.62) b Gothic (27) 181.65 (21.70) a 181.07 (20.48) a −7.92 (2.76) c 3.82 (2.29) a

1388 AMERICAN JOURNAL OF BOTANY [Vol. 100
y = 1.08 x – 4.72, R 2 = 0.47, P < 0.0009, N = 20). None of the comparable analyses of betaPTT are statistically signifi cant. Family means for FFD, standardized FFD, and betaGDD are shown in Appendix S1D.
Relationships among family means within sites— Four of the seven sites had a signifi cantly positive relationship between be-taGDD and FFD ( Fig. 8 ); at these sites, including families rep-resented by only one species, families that fl owered early had greater advances than later-fl owering families in FFD in re-sponse to high GDD. Moreover, only late-fl owering families had positive betaGDD values, indicating delays in FFD in response to warmer temperature. The three sites that did not exhibit statistically signifi cant relationships also show positive trend lines (data not shown), similar to the species-level analy-ses of these sites ( Fig. 5 ).
Only one site (Fargo) exhibited a signifi cant relationship be-tween betaPTT and FFD ( Fig. 9A ); families that fl owered early are more likely to advance their fl owering or to delay it less in response to higher PTT than late-fl owering families. Fargo was also the only site at which a large proportion of the families and species had betaPPT values >0. The signifi cant positive
Relationships among family means across sites— The rela-tionships between temperature-sensitivity and standardized FFD observed among families across sites mirrors the relation-ships observed within sites. Early-fl owering families were more sensitive to temperature, and advanced their mean FFDs in re-sponse to warmer temperatures to a greater extent than, late-fl owering families. Among the 60 families recorded at three or more sites, 59 exhibited mean betaGDD values that were less than zero, and the families that fl owered consistently early (rel-ative to each site’s mean FFD) had signifi cantly lower (more negative) betaGDD values than late-fl owering families ( Fig. 6 ). This regression remained signifi cant (and the slope positive) even when the outlier (the Commelinaceae) was excluded ( y = 0.99 x – 4.49; R 2 = 0.1, P < 0.0012, N = 59).
The positive relationship between betaGDD and FFD is also observed among the 21 families represented by three or more species at three or more sites ( Fig. 7 ) for both the raw and the standardized FFD, with a notable increase in the R 2 value relative to the 60-family regression. Removal of the outlier (the Onagraceae) does not qualitatively change the re-sults (for betaGDD vs. mean FFD: y = 0.03 x – 9.13, R 2 = 0.29, P < 0.0141, N = 20; for betaGDD vs. mean standardized FFD:
TABLE 4. Summary of two-way ANOVAs to detect signifi cant differences among families and sites in standardized fi rst fl owering day (FFD) and sensitivity to temperature (betaGDD) or to precipitation (betaPTT). (A) Species values were used in this analysis ( N = 1226 species occurrences). (B) Site-specifi c family means of 119 families ( N = 325 family × site combinations were used in this analysis. (C) Site-specifi c family means of 60 families present at ≥ 3 sites were used in this analysis ( N = 245 family × site combinations). (D) Site-specifi c family means of 21 families present at ≥ 3 sites, each with ≥ 3 species per family, were used in this analysis ( N = 83 family × site combinations. (E) Species values were used in this analysis, but only the 10 best-represented families were included ( N = 590 species occurrences across sites).
Standardized FFD betaGDD betaPPT
Source df SS F -ratio P -value SS F -ratio P -value Df SS F -ratio P -value
(A) Species level ( N = 1226 species occurrences)Family 118 434.20 5.16 <0.0001 2718.53 1.20 0 . 0785Site 6 11.62 2.72 0.0126 1746.09 15.18 <0.0001 Model 124 434.20 4.91 <0.0001 4747.64 2.00 <0.0001 Error 1101 784.80 21095.68Corrected total 1225 1219.00 25843.32 R 2 0.36 0.18(B) Family means ( N = 119 families)Family 118 152.40 2.83 <0.0001 1815.75 1.40 0.0182 118 1763.17 1.69 0.0006 Site 6 7.55 2.75 0.0136 607.00 9.22 < 0.0001 6 273.87 5.16 <0.0001 Model 124 159.80 2.82 <0.0001 2554.78 1.88 < 0.0001 124 2118.64 1.93 <0.0001 Error 200 91.35 2195.68 200 1770.35Corrected total 324 251.15 4750.46 324 3889.00 R 2 0.64 0.54 0.54(C) Family means ( N = 60 families)Family 59 134.03 3.91 <0.0001 840.64 1.46 0.0309 Site 6 1.17 0.34 0.9175 590.51 10.08 <0.0001 Model 65 134.04 3.55 <0.0001 1512.52 2.38 <0.0001 Error 179 103.96 1746.94Corrected total 244 238.00 3259.46 R 2 0.56 0.46(D) Family means ( N = 21 families)Family 20 38.31 7.67 <0.0001 217.56 2.01 0.0212 Site 6 2.62 1.75 0.1272 155.43 4.79 0.0005 Model 26 44.59 6.87 <0.0001 388.80 2.76 0.0007 Error 56 13.98 303.12Corrected total 82 58.58 691.92 R 2 0.76 0.56(E) Species values ( N = 10 families, 590 species occurrences)Family 9 108.04 14.68 <0.0001 152.95 0.83 0.5916Site 6 6.74 1.37 0.2229 842.12 6.83 <0.0001 Model 15 120.62 9.83 <0.0001 1013.38 3.29 <0.0001 Error 574 469.43 11799.28Corrected total 589 590.04 12812.65 R 2 0.20 0.08
1389July 2013] MAZER ET AL.—PHENOLOGICAL SENSITIVITY OF TAXONOMIC FAMILIES
fl owering date in response to warmer autumns, perhaps because they have not received suffi cient autumn or winter chill to in-duce fl owering. We do not yet know whether this is the case at the family level.
Five aspects of the analyses discussed in the following sec-tions should be considered when interpreting our results or designing future investigations. First, the specifi c years over which each taxon included in our analyses was observed varied both within and across sites. Other results reported in this issue ( Iler et al., 2013 ) show clearly that the particular window over which observations occur can infl uence both the direction and the magnitude of phenological responses in response to interan-nual changes in climate. Phenological responses estimated from short windows may therefore not be representative of longer-term patterns.
Second, we used the same approach for estimating the sensi-tivity of FFD to precipitation as we did for detecting and esti-mating the sensitivity to temperature, namely by expressing seasonal precipitation as its sum over a 3-mo period before fl owering. It is possible that the effects of precipitation (rain or snow) on the onset of fl owering operate over some other time in-terval, such that the low precipitation-sensitivities that we detected here greatly underestimated the actual responses to soil moisture.
Third, while it is most parsimonious to infer that advances in FFD in response to interannual warming are a direct response to temperature, this association might be mediated by seasonal in-creases in plant growth and plant size. For example, the onset of fl owering may require that plants reach a threshold size or pro-duce a threshold amount of leaf biomass, both of which are likely to be infl uenced by recent temperatures. While it was
relationship between betaPTT and FFD pattern is not observed among species at Fargo in spite of the higher degrees of free-dom in the species-level regression ( Fig. 9B ).
DISCUSSION
Among families, within and across sites, we detected two features of temperature-sensitivity that are similar to those pre-viously reported among species within sites. First, as for spe-cies, there is signifi cant variation among families with respect to both the magnitude and the direction of their phenological responses to increases in seasonal temperature. Second, early-fl owering families generally exhibit greater advances in fi rst fl ow-ering date in response to warmer temperatures than late-fl owering families, although the R 2 values of the models that detect this relationship are often low (range: 0.08–0.39; Figs. 6–8 ). Many other long-term observational studies have also detected this relationship, but see the contribution of Iler et al. (2013) in this special issue for a counter-example at an arctic tundra site. Con-sequently, while one may qualitatively predict the type of phe-nological response that a species will exhibit based on the mean relative FFD of its family, the quantitative accuracy of such predictions may be quite low. Several species-level analyses have found that some early-fl owering species delay their fi rst
Fig. 3. Family means of the 10 best-represented families across sites. Families differed signifi cantly with respect to their standardized fi rst fl ow-ering day (FFD), but statistically signifi cant differences among families in sensitivity to temperature (betaGDD) were detected only in the data sets that comprised >10 families ( Table 4 ).
TABLE 5. Analyses of covariance to detect the effects of family on temperature-sensitivity independent of standardized fi rst fl owering day (FFD). Data sets as described in Table 4 .
Source
Sensitivity to temperature (betaGDD)
df SS F -ratio P -value
(A) Species level ( N = 1226 species occurrences)Family 118 2814.15 1.14 0.1494Standardized FFD 1 23.87 1.15 0.2847Model 119 2819.12 1.14 0.1606Error 1106 23048.88Corrected total 1225 25867.99 R 2 0.11(B) Family means ( N = 119 families; N =325 species)Family 118 1673.39 1.15 0.1911Standardized FFD 1 274.74 22.28 <0.0001 Model 119 2222.53 1.51 0.0047 Error 205 2527.93Corrected total 324 4750.46 R 2 0.47(C) Family means ( N = 60 families; N = 245 species)Family 59 748.11 1.06 0.3811Standardized FFD 1 131.82 11.00 0.0011 Model 60 1053.83 1.47 0.0284 Error 184 2205.63Corrected total 184 3259.46 R 2 0.32(D) Species values ( N = 10 families, 590 species occurrences)Family 9 286.87 1.63 0.1040Standardized FFD 1 1301.17 66.43 <0.0001 Model 10 1472.43 7.52 <0.0001 Error 579 11340.23Corrected total 589 12812.65 R 2 0.11

1390 AMERICAN JOURNAL OF BOTANY [Vol. 100
Why does family membership matter? The link between FFD and phenological sensitivity among families — All analy-ses detected signifi cant differences among families with respect to their mean standardized FFD (examples in Fig. 4 ; cf. Davis et al., 2010 ), which in turn consistently predicted the direction and magnitude of the mean change in FFD in response to stan-dardized increases seasonal temperature ( Figs. 7, 8 ). This pattern mirrors the relationship among species at these sites previously reported by Wolkovich et al. (2012) , who estimated species-level sensitivities from mean annual temperature (rather than the species-specifi c 3-mo intervals used here). Here we have shown that the pattern observed among species within sites is mirrored by the pattern observed among family means across sites. The predictive value of these relationships, however, must be considered cautiously as the R 2 values of these bivariate re-lationships can be quite low when families are unequally dis-tributed across sites (e.g., Fig. 6 ).
The phenological response of FFD to temperature of a species for which we have no direct observations can be approximated either by knowing its FFD relative to other co-occurring taxa (which predicts its sensitivity) or by identifying its family (at least among the 119 families evaluated here). The degree of error in this approximation will be, in part, a function of the within-family variance (or standard deviation) in FFD and in betaGDD, both of which can be quite high (Appendices S1C, S1D, and S1E with the online version of this article). For example, among the 10 best-represented families examined here, the Fabaceae exhib-ited the lowest variation among confamilial taxa in the standard-ized FFD (mean standardized FFD = 0.21, SD = 0.71; N = 76 phenological series), and the Lamiaceae exhibited the highest variation (mean standardized FFD = 0.34, SD = 1.13; N = 29). The Fabaceae also exhibited the lowest variation among confa-milial taxa in the betaGDD (mean betaGDD = −3.62, SD = 3.39; N = 76) and the Boraginaceae exhibited the highest variation (mean betaGDD = −4.17, SD = 6.02; N = 27; see online Appen-dix S1E. The analyses of site-specifi c family means also indicate that, within sites, family membership can be used to predict the mean temperature-sensitivity of its species ( Table 4B–D ; Fig. 5 ), but this relationship is not always statistically detectable ( Table 4A, E ) and must be interpreted cautiously.
The relationships between temperature-sensitivity and FFD observed among family means were also observed among spe-cies within the majority of the most diverse and widespread families observed here ( Table 6 ). In seven of 10 families, early-fl owering taxa exhibited signifi cantly greater temperature-sensitivity (more negative betaGDD values) than late-fl owering taxa ( Table 6 ). The relationship was in the same direction but not signifi cant in the Fabaceae, Ranunculaceae, or Scrophulari-aceae. Exploration of the within-family relationships in other diverse or widespread families (e.g., there were six other families with ≥ 20 species occurrences; Appendix S1C) might detect whether families ever differ qualitatively in the relationship be-tween temperature-sensitivity and FFD. Species in late-fl owering families might be predicted to exhibit weaker relationships than those in early-fl owering families. Families with weak relation-ships might be comprised of “divergent responders” ( Cook et al., 2012a ); species that delay fl owering in response to warmer falls but advance fl owering in response to warmer springs, result-ing in little net change in FFD. The comparable relationships between sensitivity to precipitation (betaPTT) and FFD among confamilial taxa were statistically nonsignifi cant, except in two families (Poaceae and Ranunculaceae) in which a negative rela-tionship was observed ( Table 6 ).
beyond the scope of this study to include plant size as a cova-riate or causal variable infl uencing FFD independently of seasonal temperatures, examining the relationships among tem-perature, plant size, and FFD might help to elucidate the mech-anisms that contribute to the relationship between temperature and FFD.
Fourth, the analyses reported here assume that the identi-fi cation of the taxonomic families is correct. We used the most recent taxon names available in the International Plant Names Index (http://www.ipni.org) and the Angiosperm Phylogeny Group’s (APG: http://www.mobot.org/MOBOT/research/APweb/) family identifi cations, but should these change, the values in our data sets would also be altered. Finally, the 112 angiosperm families (excluding the seven nonangiosperm families reported in Table 1 ) included in the most inclusive data set examined here represent 27% of the 413 families identifi ed by the APG; future studies that include a broader range or different subset of families may well reveal differ-ent patterns.
Does family membership predict sensitivity to interannual variation in temperature or precipitation across these sites? — Taxonomic families differed signifi cantly across sites in the sen-sitivity of their species’ FFD to summed temperature during the 3-mo window before fl owering that best accounted for variation in FFD ( Table 4B–D ). Similarly, the families represented in our data set also differed signifi cantly in betaPPT, the estimated sensitivity of their species’ FFD to precipitation during the 3-mo window that best accounted for variation in FFD ( Table 4B ). The proportion of variance in these sensitivities that was explained by family membership depended strongly, however, on the composi-tion of the data set (i.e., whether the data included families found at only one site or families represented by only one species at a given site).
Fig. 4. Relationship between sensitivity to temperature (betaGDD) and standardized fi rst fl owering day (FFD) among 1226 species occur-rences distributed across all seven sites. Species that fl ower early relative to the mean FFD of the site where they occur tend to show more negative betaGDD values; they advance fl owering in response to higher GDD more than late-fl owering species. Of 1226 species, 1088 occurrences exhibit be-taGDD <0.

1391July 2013] MAZER ET AL.—PHENOLOGICAL SENSITIVITY OF TAXONOMIC FAMILIES
vs. betaPPT ( Table 3 ). At all sites, the absolute value of the mean of family means for betaGDD exceeds that for betaPPT.
The site means for betaGDD reported here differ slightly from those reported by Cook et al. (2012b) for three reasons. First, Cook et al. (2012b) estimated betaGDD in a model that included only growing degree days as the independent variable, while here we used a model that also included precipitation and the interaction between them. Second, here we used family means (as opposed to individual species’ values) to estimate site means, which reduces the infl uence of highly speciose fam-ilies with particularly high or low betaGDD values. Third, here we excluded a total of 39 species occurrences from the original data set (i.e., two outliers plus 37 phenological series that ex-hibited a signifi cant GDD × PPT interaction when estimating their sensitivities). Nevertheless, the estimates of Cook et al. (2012b) for the site mean betaGDD values are highly correlated with those reported here ( r = 0.83, P < 0.0222, N = 7).
The evolutionary signifi cance of the relationships between betaGDD and FFD — Early-fl owering families had signifi cantly more negative values of betaGDD than late-fl owering families, and it was rare to fi nd an early-fl owering taxon that delayed its
Although we observed high variation among species with re-spect to sensitivity to seasonal precipitation, the ability to pre-dict the responses of FFD to precipitation from either FFD or family membership was much lower than for temperature sen-sitivity, perhaps because plants in these habitats are not gener-ally water-limited prior to the initiation of fl owering. Moreover, the qualitative relationships between betaPTT and FFD were inconsistent even among the three sites where the relationship was statistically signifi cant (>0 at Chinnor; <0 at Konza Prairie and Washington, D.C.; Appendix S1B). In addition, at the one site (Fargo) where mean family FFD was a reliable predictor of mean family sensitivity to precipitation ( Fig. 9A ), the species-level relationship ( Fig. 9B ) was statistically very weak in spite of the much higher sample size (64 families vs. 211 species). At this site, the family membership of a taxon permitted a more reli-able prediction of its fl owering response to recent precipitation than did its species-specifi c FFD.
Differences among sites in the mean sensitivities of their taxa — The generalization that FFD is more sensitive to warming than to precipitation in seasonal, temperate zone habitats is also refl ected in the differences between the site means for betaGDD
Fig. 5. Relationship between sensitivity to temperature (betaGDD) and fi rst fl owering day (FFD) among species at each of seven sites. Four of seven sites exhibit regression slopes signifi cantly greater than zero; trend lines are retained on nonsignifi cant regressions to illustrate that the relationships are qualitatively similar among all seven sites.
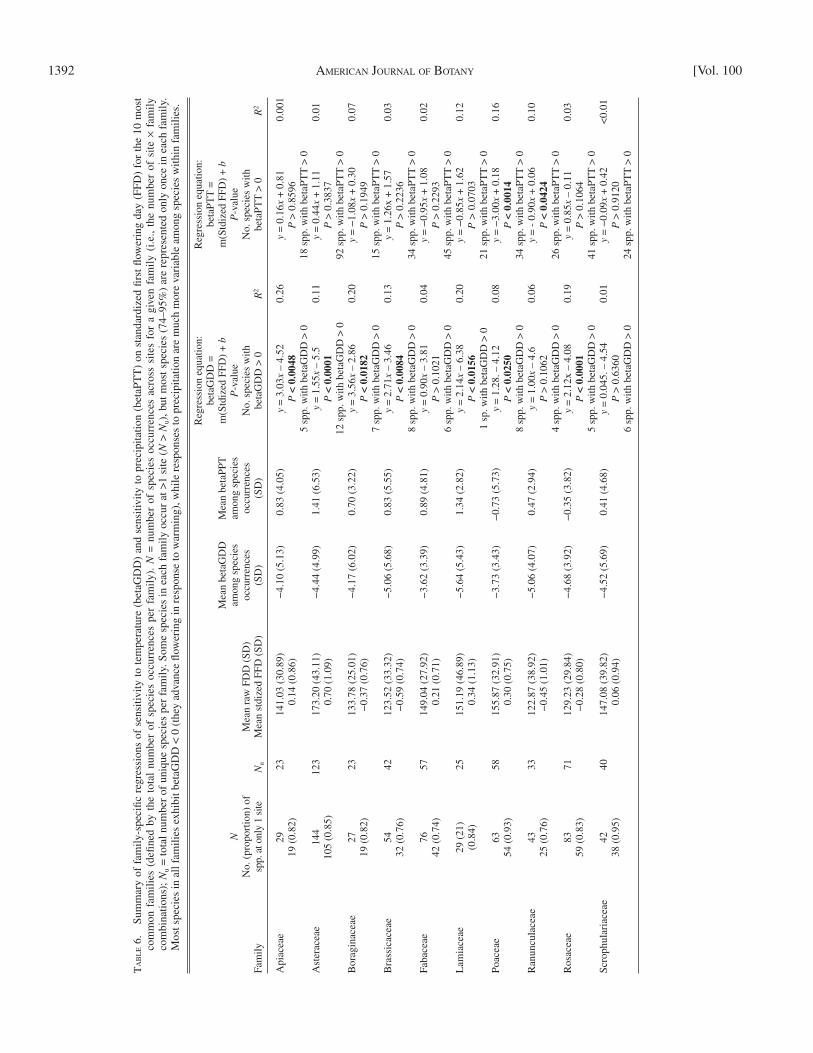
1392 AMERICAN JOURNAL OF BOTANY [Vol. 100
TA
BL
E 6
. Su
mm
ary
of f
amily
-spe
cifi c
reg
ress
ions
of
sens
itivi
ty t
o te
mpe
ratu
re (
beta
GD
D)
and
sens
itivi
ty t
o pr
ecip
itatio
n (b
etaP
TT
) on
sta
ndar
dize
d fi r
st fl
ow
erin
g da
y (F
FD)
for
the
10 m
ost
com
mon
fam
ilies
(de
fi ned
by
the
tota
l nu
mbe
r of
spe
cies
occ
urre
nces
per
fam
ily).
N =
num
ber
of s
peci
es o
ccur
renc
es a
cros
s si
tes
for
a gi
ven
fam
ily (
i.e.,
the
num
ber
of s
ite ×
fam
ily
com
bina
tions
); N
u =
tota
l num
ber
of u
niqu
e sp
ecie
s pe
r fa
mily
. Som
e sp
ecie
s in
eac
h fa
mily
occ
ur a
t >1
site
( N
> N
u ), b
ut m
ost s
peci
es (
74–9
5%)
are
repr
esen
ted
only
onc
e in
eac
h fa
mily
. M
ost s
peci
es in
all
fam
ilies
exh
ibit
beta
GD
D <
0 (
they
adv
ance
fl ow
erin
g in
res
pons
e to
war
min
g), w
hile
res
pons
es to
pre
cipi
tatio
n ar
e m
uch
mor
e va
riab
le a
mon
g sp
ecie
s w
ithin
fam
ilies
.
Fam
ily
N
No.
(pr
opor
tion)
of
spp.
at o
nly
1 si
te N
u M
ean
raw
FD
D (
SD)
Mea
n st
dize
d FF
D (
SD)
Mea
n be
taG
DD
am
ong
spec
ies
occu
rren
ces
(SD
)
Mea
n be
taPP
T
amon
g sp
ecie
s oc
curr
ence
s (S
D)
Reg
ress
ion
equa
tion:
be
taG
DD
=
m(S
tdiz
ed F
FD)
+ b
P
-val
ue
No.
spe
cies
with
be
taG
DD
> 0
R 2
Reg
ress
ion
equa
tion:
be
taPT
T =
m
(Std
ized
FFD
) +
b
P -v
alue
No.
spe
cies
with
be
taPT
T >
0 R
2
Api
acea
e29
2314
1.03
(30
.89)
0.14
(0.
86)
−4.
10 (
5.13
)0.
83 (
4.05
) y
= 3
.03 x
– 4
.52
0.26
y =
0.1
6 x +
0.8
10.
001
19 (
0.82
) P
< 0
.004
8 P
> 0
.859
65
spp.
with
bet
aGD
D >
018
spp
. with
bet
aPT
T >
0A
ster
acea
e14
412
317
3.20
(43
.11)
−4.
44 (
4.99
)1.
41 (
6.53
) y
= 1
.55 x
– 5
.50.
11 y
= 0
.44 x
+ 1
.11
0.01
105
(0.8
5)0.
70 (
1.09
) P
< 0
.000
1 P
> 0
.383
712
spp
. with
bet
aGD
D >
092
spp
. with
bet
aPT
T >
0B
orag
inac
eae
2723
133.
78 (
25.0
1)−
0.37
(0.
76)
−4.
17 (
6.02
)0.
70 (
3.22
) y
= 3
.56 x
– 2
.86
0.20
y =
−1.
08 x
+ 0
.30
0.07
19 (
0.82
) P
< 0
.018
2 P
> 0
.194
97
spp.
with
bet
aGD
D >
015
spp
. with
bet
aPT
T >
0B
rass
icac
eae
5442
123.
52 (
33.3
2)
−0.
59 (
0.74
)−
5.06
(5.
68)
0.83
(5.
55)
y =
2.7
1 x –
3.4
60.
13 y
= 1
.26x
+ 1
.57
0.03
32 (
0.76
) P
< 0
.008
4 P
> 0
.223
68
spp.
with
bet
aGD
D >
034
spp
. with
bet
aPT
T >
0Fa
bace
ae76
5714
9.04
(27
.92)
0.
21 (
0.71
)−
3.62
(3.
39)
0.89
(4.
81)
y =
0.9
0 x –
3.8
10.
04 y
= −
0.95
x +
1.0
80.
0242
(0.
74)
P >
0.1
021
P >
0.2
293
6 sp
p. w
ith b
etaG
DD
> 0
45 s
pp. w
ith b
etaP
TT
> 0
Lam
iace
ae29
(21
)25
151.
19 (
46.8
9)
0.34
(1.
13)
−5.
64 (
5.43
)1.
34 (
2.82
) y
= 2
.14 x
– 6
.38
0.20
y =
−0.
85 x
+ 1
.62
0.12
(0.8
4) P
< 0
.015
6 P
> 0
. 070
31
sp. w
ith b
etaG
DD
> 0
21 s
pp. w
ith b
etaP
TT
> 0
Poac
eae
6358
155.
87 (
32.9
1)
0.30
(0.
75)
−3.
73 (
3.43
)−
0.73
(5.
73)
y =
1.2
8. –
4.1
20.
08 y
= −
3.00
x +
0.1
80.
1654
(0.
93)
P <
0.0
250
P <
0.0
014
8 sp
p. w
ith b
etaG
DD
> 0
34 s
pp. w
ith b
etaP
TT
> 0
Ran
uncu
lace
ae43
3312
2.87
(38
.92)
−
0.45
(1.
01)
−5.
06 (
4.07
)0.
47 (
2.94
) y
= 1
.00 x
– 4
.60.
06 y
= -
0.9
0 x +
0.0
60.
1025
(0.
76)
P >
0.1
062
P <
0.0
424
4 sp
p. w
ith b
etaG
DD
> 0
26 s
pp. w
ith b
etaP
TT
> 0
Ros
acea
e83
7112
9.23
(29
.84)
−
0.28
(0.
80)
−4.
68 (
3.92
)−
0.35
(3.
82)
y =
2.1
2x –
4.0
80.
19 y
= 0
.85 x
– 0
.11
0.03
59 (
0.83
) P
< 0
.000
1 P
> 0
.106
45
spp.
with
bet
aGD
D >
041
spp
. with
bet
aPT
T >
0Sc
roph
ular
iace
ae42
4014
7.08
(39
.82)
0.
06 (
0.94
)−
4.52
(5.
69)
0.41
(4.
68)
y =
0.0
45. –
4.5
40.
01 y
= −
0.09
x +
0.4
2<
0.01
38 (
0.95
) P
> 0
.636
0 P
> 0
.912
06
spp.
with
bet
aGD
D >
024
spp
. with
bet
aPT
T >
0
1393July 2013] MAZER ET AL.—PHENOLOGICAL SENSITIVITY OF TAXONOMIC FAMILIES
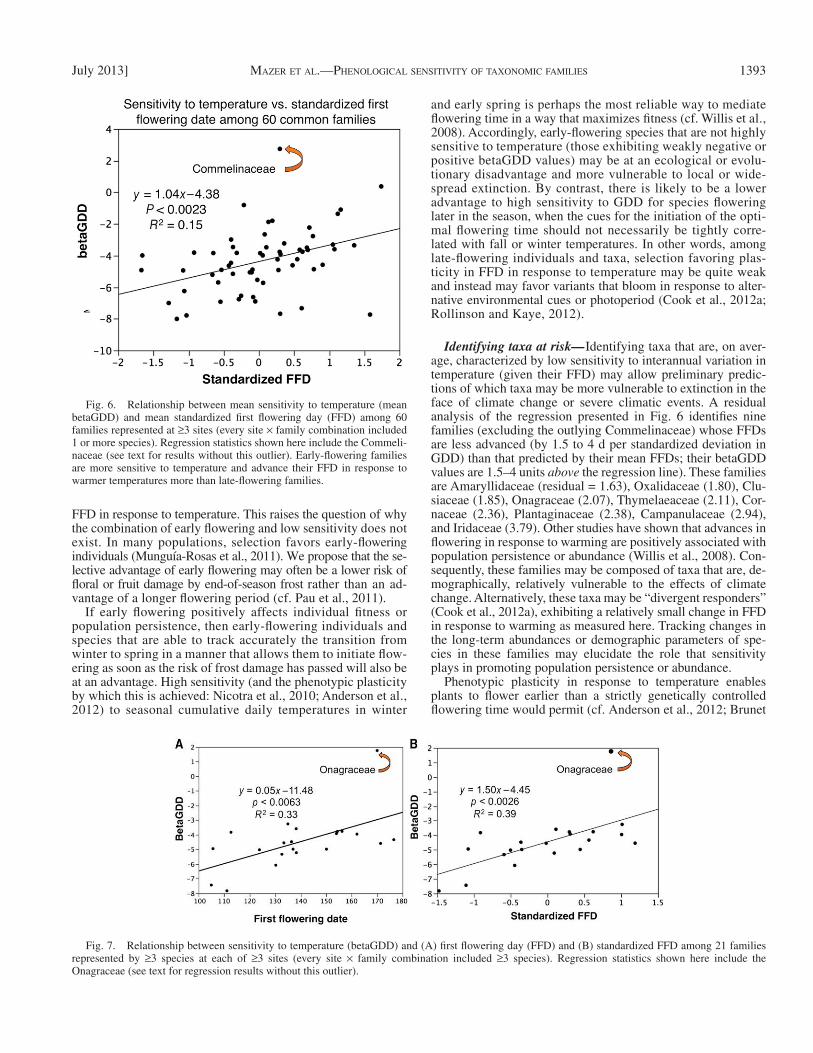
and early spring is perhaps the most reliable way to mediate fl owering time in a way that maximizes fi tness (cf. Willis et al., 2008 ). Accordingly, early-fl owering species that are not highly sensitive to temperature (those exhibiting weakly negative or positive betaGDD values) may be at an ecological or evolu-tionary disadvantage and more vulnerable to local or wide-spread extinction. By contrast, there is likely to be a lower advantage to high sensitivity to GDD for species fl owering later in the season, when the cues for the initiation of the opti-mal fl owering time should not necessarily be tightly corre-lated with fall or winter temperatures. In other words, among late-fl owering individuals and taxa, selection favoring plas-ticity in FFD in response to temperature may be quite weak and instead may favor variants that bloom in response to alter-native environmental cues or photoperiod ( Cook et al., 2012a ; Rollinson and Kaye, 2012 ).
Identifying taxa at risk — Identifying taxa that are, on aver-age, characterized by low sensitivity to interannual variation in temperature (given their FFD) may allow preliminary predic-tions of which taxa may be more vulnerable to extinction in the face of climate change or severe climatic events. A residual analysis of the regression presented in Fig. 6 identifi es nine families (excluding the outlying Commelinaceae) whose FFDs are less advanced (by 1.5 to 4 d per standardized deviation in GDD) than that predicted by their mean FFDs; their betaGDD values are 1.5–4 units above the regression line). These families are Amaryllidaceae (residual = 1.63), Oxalidaceae (1.80), Clu-siaceae (1.85), Onagraceae (2.07), Thymelaeaceae (2.11), Cor-naceae (2.36), Plantaginaceae (2.38), Campanulaceae (2.94), and Iridaceae (3.79). Other studies have shown that advances in fl owering in response to warming are positively associated with population persistence or abundance ( Willis et al., 2008 ). Con-sequently, these families may be composed of taxa that are, de-mographically, relatively vulnerable to the effects of climate change. Alternatively, these taxa may be “divergent responders” ( Cook et al., 2012a ), exhibiting a relatively small change in FFD in response to warming as measured here. Tracking changes in the long-term abundances or demographic parameters of spe-cies in these families may elucidate the role that sensitivity plays in promoting population persistence or abundance.
Phenotypic plasticity in response to temperature enables plants to fl ower earlier than a strictly genetically controlled fl owering time would permit (cf. Anderson et al., 2012 ; Brunet
FFD in response to temperature. This raises the question of why the combination of early fl owering and low sensitivity does not exist. In many populations, selection favors early-fl owering individuals ( Munguía-Rosas et al., 2011 ). We propose that the se-lective advantage of early fl owering may often be a lower risk of fl oral or fruit damage by end-of-season frost rather than an ad-vantage of a longer fl owering period (cf. Pau et al., 2011 ).
If early fl owering positively affects individual fi tness or population persistence, then early-fl owering individuals and species that are able to track accurately the transition from winter to spring in a manner that allows them to initiate fl ow-ering as soon as the risk of frost damage has passed will also be at an advantage. High sensitivity (and the phenotypic plasticity by which this is achieved: Nicotra et al., 2010 ; Anderson et al., 2012 ) to seasonal cumulative daily temperatures in winter
Fig. 6. Relationship between mean sensitivity to temperature (mean betaGDD) and mean standardized fi rst fl owering day (FFD) among 60 families represented at ≥ 3 sites (every site × family combination included 1 or more species). Regression statistics shown here include the Commeli-naceae (see text for results without this outlier). Early-fl owering families are more sensitive to temperature and advance their FFD in response to warmer temperatures more than late-fl owering families.
Fig. 7. Relationship between sensitivity to temperature (betaGDD) and (A) fi rst fl owering day (FFD) and (B) standardized FFD among 21 families represented by ≥ 3 species at each of ≥ 3 sites (every site × family combination included ≥ 3 species). Regression statistics shown here include the Onagraceae (see text for regression results without this outlier).

1394 AMERICAN JOURNAL OF BOTANY [Vol. 100
Conclusions — Taxonomic family membership can be used cautiously in concert with mean fi rst fl owering date to predict whether an unknown taxon will exhibit high vs. low sensitivity to temperature in seasonal, temperate zone plant communities. The particularly high sensitivity to temperature of species in families with early mean fl owering times (and the absence of species observed in early-fl owering families that delay fl ower-ing with increasing temperature) may refl ect an adaptive ad-vantage to early-fl owering genotypes and taxa of responding
and Larson-Rabin, 2012 ), so an individual’s phenotypic plas-ticity in FFD is as much a target of selection as is its mean FFD. Whether the relatively low sensitivities of the families above negatively affects their long-term persistence remains an empirical question, but the patterns of species loss de-tected by Willis et al. (2008) in Concord, Massachusetts, suggest that local extirpation may well result from insuffi -ciently plastic responses of fl owering dates to temperature variation.
Fig. 8. Site-specifi c relationships among family means (1 or more species per family per site) between sensitivity to temperature (betaGDD) and fi rst fl owering date (FFD). Four of seven sites (shown here) exhibit a signifi cant relationship; at these sites, early-fl owering families advance fl owering in re-sponse to high GDD more than late-fl owering families. The other three sites exhibit no signifi cant relationship among families between betaGDD and FFD, similar to the species-level relationships shown in Fig. 5 .
Fig. 9. Bivariate relationships between sensitivity to precipitation (betaPPT) and fi rst fl owering day (FFD) among (A) family means and (B) spe-cies at Fargo. At Fargo, early-fl owering families tend to advance fl owering (or to delay it less) in response to both GDD and PPT relative to late-fl owering families. The relationship among species at Fargo is much weaker than the relationship among family means in spite of a much higher sample size at the species level.
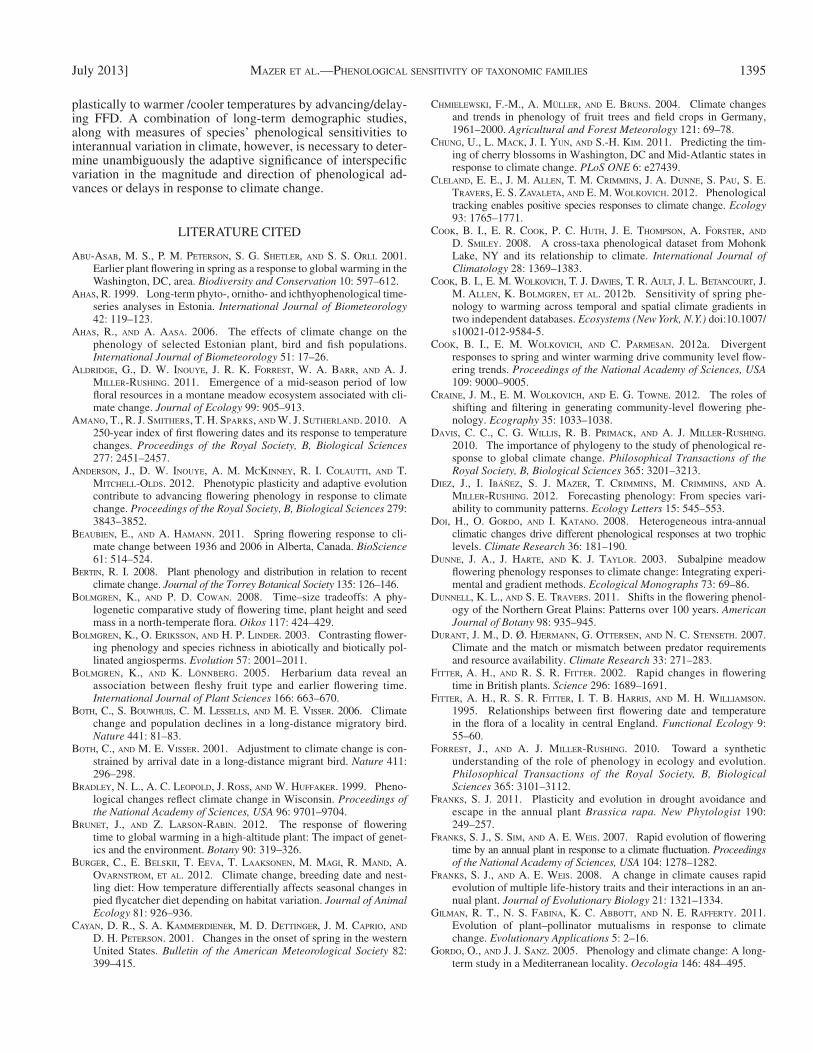
1395July 2013] MAZER ET AL.—PHENOLOGICAL SENSITIVITY OF TAXONOMIC FAMILIES
plastically to warmer /cooler temperatures by advancing/delay-ing FFD. A combination of long-term demographic studies, along with measures of species’ phenological sensitivities to interannual variation in climate, however, is necessary to deter-mine unambiguously the adaptive signifi cance of interspecifi c variation in the magnitude and direction of phenological ad-vances or delays in response to climate change.
LITERATURE CITED
ABU-ASAB , M. S. , P. M. PETERSON , S. G. SHETLER , AND S. S. ORLI . 2001 . Earlier plant fl owering in spring as a response to global warming in the Washington, DC, area. Biodiversity and Conservation 10 : 597 – 612 .
AHAS , R. 1999 . Long-term phyto-, ornitho- and ichthyophenological time-series analyses in Estonia. International Journal of Biometeorology 42 : 119 – 123 .
AHAS , R. , AND A. AASA . 2006 . The effects of climate change on the phenology of selected Estonian plant, bird and fi sh populations. International Journal of Biometeorology 51 : 17 – 26 .
ALDRIDGE , G. , D. W. INOUYE , J. R. K. FORREST , W. A. BARR , AND A. J. MILLER-RUSHING . 2011 . Emergence of a mid-season period of low fl oral resources in a montane meadow ecosystem associated with cli-mate change. Journal of Ecology 99 : 905 – 913 .
AMANO , T. , R. J. SMITHERS , T. H. SPARKS , AND W. J. SUTHERLAND . 2010 . A 250-year index of fi rst fl owering dates and its response to temperature changes. Proceedings of the Royal Society, B, Biological Sciences 277 : 2451 – 2457 .
ANDERSON , J. , D. W. INOUYE , A. M. MCKINNEY , R. I. COLAUTTI , AND T. MITCHELL-OLDS . 2012 . Phenotypic plasticity and adaptive evolution contribute to advancing fl owering phenology in response to climate change. Proceedings of the Royal Society, B, Biological Sciences 279 : 3843 – 3852 .
BEAUBIEN , E. , AND A. HAMANN . 2011 . Spring fl owering response to cli-mate change between 1936 and 2006 in Alberta, Canada. BioScience 61 : 514 – 524 .
BERTIN , R. I. 2008 . Plant phenology and distribution in relation to recent climate change. Journal of the Torrey Botanical Society 135 : 126 – 146 .
BOLMGREN , K. , AND P. D. COWAN . 2008 . Time–size tradeoffs: A phy-logenetic comparative study of fl owering time, plant height and seed mass in a north-temperate fl ora. Oikos 117 : 424 – 429 .
BOLMGREN , K. , O. ERIKSSON , AND H. P. LINDER . 2003 . Contrasting fl ower-ing phenology and species richness in abiotically and biotically pol-linated angiosperms. Evolution 57 : 2001 – 2011 .
BOLMGREN , K. , AND K. LÖNNBERG . 2005 . Herbarium data reveal an association between fl eshy fruit type and earlier fl owering time. International Journal of Plant Sciences 166 : 663 – 670 .
BOTH , C. , S. BOUWHUIS , C. M. LESSELLS , AND M. E. VISSER . 2006 . Climate change and population declines in a long-distance migratory bird. Nature 441 : 81 – 83 .
BOTH , C. , AND M. E. VISSER . 2001 . Adjustment to climate change is con-strained by arrival date in a long-distance migrant bird. Nature 411 : 296 – 298 .
BRADLEY , N. L. , A. C. LEOPOLD , J. ROSS , AND W. HUFFAKER . 1999 . Pheno-logical changes refl ect climate change in Wisconsin. Proceedings of the National Academy of Sciences, USA 96 : 9701 – 9704 .
BRUNET , J. , AND Z. LARSON-RABIN . 2012 . The response of fl owering time to global warming in a high-altitude plant: The impact of genet-ics and the environment. Botany 90 : 319 – 326 .
BURGER , C. , E. BELSKII , T. EEVA , T. LAAKSONEN , M. MAGI , R. MAND , A. OVARNSTROM , ET AL . 2012 . Climate change, breeding date and nest-ling diet: How temperature differentially affects seasonal changes in pied fl ycatcher diet depending on habitat variation. Journal of Animal Ecology 81 : 926 – 936 .
CAYAN , D. R. , S. A. KAMMERDIENER , M. D. DETTINGER , J. M. CAPRIO , AND D. H. PETERSON . 2001 . Changes in the onset of spring in the western United States. Bulletin of the American Meteorological Society 82 : 399 – 415 .
CHMIELEWSKI , F.-M. , A. MÜLLER , AND E. BRUNS . 2004 . Climate changes and trends in phenology of fruit trees and fi eld crops in Germany, 1961–2000. Agricultural and Forest Meteorology 121 : 69 – 78 .
CHUNG , U. , L. MACK , J. I. YUN , AND S.-H. KIM . 2011 . Predicting the tim-ing of cherry blossoms in Washington, DC and Mid-Atlantic states in response to climate change. PLoS ONE 6 : e27439 .
CLELAND , E. E. , J. M. ALLEN , T. M. CRIMMINS , J. A. DUNNE , S. PAU , S. E. TRAVERS , E. S. ZAVALETA , AND E. M. WOLKOVICH . 2012 . Pheno logical tracking enables positive species responses to climate change. Ecology 93 : 1765 – 1771 .
COOK , B. I. , E. R. COOK , P. C. HUTH , J. E. THOMPSON , A. FORSTER , AND D. SMILEY . 2008 . A cross-taxa phenological dataset from Mohonk Lake, NY and its relationship to climate. International Journal of Climatology 28 : 1369 – 1383 .
COOK , B. I. , E. M. WOLKOVICH , T. J. DAVIES , T. R. AULT , J. L. BETANCOURT , J. M. ALLEN , K. BOLMGREN , ET AL . 2012b . Sensitivity of spring phe-nology to warming across temporal and spatial climate gradients in two independent databases. Ecosystems (New York, N.Y.) doi:10.1007/s10021-012-9584-5.
COOK , B. I. , E. M. WOLKOVICH , AND C. PARMESAN . 2012a . Divergent responses to spring and winter warming drive community level fl ow-ering trends. Proceedings of the National Academy of Sciences, USA 109 : 9000 – 9005 .
CRAINE , J. M. , E. M. WOLKOVICH , AND E. G. TOWNE . 2012 . The roles of shifting and fi ltering in generating community-level fl owering phe-nology. Ecography 35 : 1033 – 1038 .
DAVIS , C. C. , C. G. WILLIS , R. B. PRIMACK , AND A. J. MILLER-RUSHING . 2010 . The importance of phylogeny to the study of phenological re-sponse to global climate change. Philosophical Transactions of the Royal Society, B, Biological Sciences 365 : 3201 – 3213 .
DIEZ , J. , I. IBÁÑEZ , S. J. MAZER , T. CRIMMINS , M. CRIMMINS , AND A. MILLER-RUSHING . 2012 . Forecasting phenology: From species vari-ability to community patterns. Ecology Letters 15 : 545 – 553 .
DOI , H. , O. GORDO , AND I. KATANO . 2008 . Heterogeneous intra-annual climatic changes drive different phenological responses at two trophic levels. Climate Research 36 : 181 – 190 .
DUNNE , J. A. , J. HARTE , AND K. J. TAYLOR . 2003 . Subalpine meadow fl owering phenology responses to climate change: Integrating experi-mental and gradient methods. Ecological Monographs 73 : 69 – 86 .
DUNNELL , K. L. , AND S. E. TRAVERS . 2011 . Shifts in the fl owering phenol-ogy of the Northern Great Plains: Patterns over 100 years. American Journal of Botany 98 : 935 – 945 .
DURANT , J. M. , D. Ø. HJERMANN , G. OTTERSEN , AND N. C. STENSETH . 2007 . Climate and the match or mismatch between predator requirements and resource availability. Climate Research 33 : 271 – 283 .
FITTER , A. H. , AND R. S. R. FITTER . 2002 . Rapid changes in fl owering time in British plants. Science 296 : 1689 – 1691 .
FITTER , A. H. , R. S. R. FITTER , I. T. B. HARRIS , AND M. H. WILLIAMSON . 1995 . Relationships between fi rst fl owering date and temperature in the fl ora of a locality in central England. Functional Ecology 9 : 55 – 60 .
FORREST , J. , AND A. J. MILLER-RUSHING . 2010 . Toward a synthetic understanding of the role of phenology in ecology and evolution. Philosophical Transactions of the Royal Society, B, Biological Sciences 365 : 3101 – 3112 .
FRANKS , S. J. 2011 . Plasticity and evolution in drought avoidance and escape in the annual plant Brassica rapa. New Phytologist 190 : 249 – 257 .
FRANKS , S. J. , S. SIM , AND A. E. WEIS . 2007 . Rapid evolution of fl owering time by an annual plant in response to a climate fl uctuation. Proceedings of the National Academy of Sciences, USA 104 : 1278 – 1282 .
FRANKS , S. J. , AND A. E. WEIS . 2008 . A change in climate causes rapid evolution of multiple life-history traits and their interactions in an an-nual plant. Journal of Evolutionary Biology 21 : 1321 – 1334 .
GILMAN , R. T. , N. S. FABINA , K. C. ABBOTT , AND N. E. RAFFERTY . 2011 . Evolution of plant–pollinator mutualisms in response to climate change. Evolutionary Applications 5 : 2 – 16 .
GORDO , O. , AND J. J. SANZ . 2005 . Phenology and climate change: A long-term study in a Mediterranean locality. Oecologia 146 : 484 – 495 .

1396 AMERICAN JOURNAL OF BOTANY [Vol. 100
GORDO , O. , AND J. J. SANZ . 2009 . Long-term temporal changes of plant phenology in the western Mediterranean. Global Change Biology 15 : 1930 – 1948 .
GORDO , O. , AND J. J. SANZ . 2010 . Impact of climate change on plant phe-nology in Mediterranean ecosystems. Global Change Biology 16 : 1082 – 1106 .
HARRINGTON , R. , I. WOIWOD , AND T. SPARKS . 1999 . Climate change and trophic interactions. Trends in Ecology & Evolution 14 : 146 – 150 .
HEGLAND , S. J. , A. NIELSEN , A. LAZARO , A. L. BJERKNES , AND Ø. TOTLAND . 2009 . How does climate warming affect plant–pollinator interac-tions? Ecology Letters 12 : 184 – 195 .
HO , C. H. , E. J. LEE , I. LEE , AND S. J. JEONG . 2006 . Earlier spring in Seoul, Korea. International Journal of Climatology 26 : 2117 – 2127 .
ILER , A. M. , T. T. HØYE , D. W. INOUYE , AND N. M. SCHMIDT . 2013 . Long-term trends mask variation in the direction and magnitude of short-term phenological shifts. American Journal of Botany 100 : 1398 – 1406 .
INOUYE , D. W. 2008 . Effects of climate change on phenology, frost damage, and fl oral abundance of montane wildfl owers. Ecology 89 : 353 – 362 .
JONES , T. , AND W. CRESSWELL . 2010 . The phenology mismatch hypoth-esis: Are declines of migrant birds linked to uneven global climate change? Journal of Animal Ecology 79 : 98 – 108 .
KAWAI , K. , AND G. KUDO . 2011 . Local differentiation of fl owering phenology in an alpine-snowbed herb Gentiana nipponica. Botany 89 : 361 – 367 .
KNAPP , A. K. , J. M. BRIGGS , D. C. HARTNETT , AND S. L. COLLINS . 1998 . Grassland dynamics: Long-term ecological research in tallgrass prai-rie. Oxford University Press, New York, New York, USA.
KOCHMER , J. P. , AND S. N. HANDEL . 1986 . Constraints and competition in the evolution of fl owering phenology. Ecological Monographs 56 : 303 – 325 .
LEON , A. J. , M. LEE , AND F. H. ANDRADE . 2001 . Quantitative trait loci for growing degree days to fl owering and photoperiod response in sunfl ower ( Helianthus annuus L.). Theoretical and Applied Genetics 102 : 497 – 503 .
MAZER , S. J. 1987 . Quantitative genetics of life-history and fi tness compo-nents in Raphanus raphanistrum L. (Brassicaceae): Ecological and evo-lutionary consequences of seed weight variation. American Naturalist 130 : 891 – 914 .
MAZER , S. J. , AND G. L. LEBUHN . 1999 . The genetic basis of life history traits in plants: Heritability within and genetic differentiation among populations. In P. Mutakainin and T. Vuorisalo [eds.], Life history evolution in plants, 85–171. Kluwer, Dordrecht, Netherlands.
MCKINNEY , A. M. , P. J. CARADONNA , D. W. INOUYE , B. BARR , C. D. BERTELSEN , AND N. M. WASER . 2012 . Asynchronous changes in phe-nology of migrating Broad-tailed hummingbirds and their early-sea-son nectar resources. Ecology 93 : 1987 – 1993 .
MENZEL , A. 2000 . Trends in phenological phases in Europe between 1951 and 1996. International Journal of Biometeorology 44 : 76 – 81 .
MENZEL , A. , T. H. SPARKS , N. ESTRELLA , E. KOCH , A. AASA , R. AHAS , K. ALM-KÜBLER , ET AL . 2006a . European phenological response to climate change matches the warming pattern. Global Change Biology 12 : 1969 – 1976 .
MENZEL , A. , T. H. SPARKS , AND D. B. ROY . 2006b . Altered geographic and temporal variability in phenology in response to climate change. Global Ecology and Biogeography 15 : 498 – 504 .
MILLER-RUSHING , A. J. T. , AND D. W. INOUYE . 2009 . Variation in the impact of climate change on fl owering phenology and abundance: An examination of two pairs of closely related wildfl ower species. American Journal of Botany 96 : 1821 – 1829 .
MILLER-RUSHING , A. J. , T. KATSUKI , R. B. PRIMACK , Y. ISHII , S. D. LEE , AND H. HIGUCHI . 2007 . Impact of global warming on a group of related species and their hybrids: cherry tree (Rosaceae) fl owering at Mt. Takao, Japan. American Journal of Botany 94 : 1470 – 1478 .
MILLER-RUSHING , A. J. , AND R. B. PRIMACK . 2008 . Global warming and fl owering times in Thoreau’s Concord: A community perspective. Ecology 89 : 332 – 341 .
MUNGUÍA-ROSAS , M. A. , J. OLLERTON , V. PARRA-TABLA , AND J. ARTURO DE-NOVA . 2011 . Meta-analysis of phenotypic selection on fl owering phenology suggests that early fl owering plants are favored. Ecology Letters 14 : 511 – 521 .
MYNENI , R. B. , C. D. KEELING , C. J. TUCKER , G. ASRAR , AND R. R. NEMANI . 1997 . Increased plant growth in the northern latitudes from 1981 to 1991. Nature 386 : 698 – 702 .
NICOTRA , A. B. , O. K. ATKIN , S. P. BONSER , A. M. DAVIDSON , E. J. FINNEGAN , U. MATHESIUS , P. POOT , ET AL . 2010 . Plant phenotypic plasticity in a changing climate. Trends in Ecology & Evolution 15 : 684 – 692 .
OLSSON , K. , AND J. ÅGREN . 2002 . Latitudinal population differentia-tion in phenology, life history and fl ower morphology in the peren-nial herb Lythrum salicaria. Journal of Evolutionary Biology 15 : 983 – 996 .
PARMESAN , C. 2006 . Ecological and evolutionary responses to recent cli-mate change. Annual Review of Ecology, Evolution and Systematics 37 : 637 – 669 .
PARMESAN , C. , AND G. YOHE . . 2003 . A globally coherent fi ngerprint of climate change impacts across natural systems. Nature 421 : 37 – 42 .
PAU , S. , E. M. WOLKOVICH , B. I. COOK , T. J. DAVIES , N. J. B. KRAFT , K. BOLMGREN , J. L. BETANCOURT , AND E. E. CLELAND . 2011 . Predicting phenology by integrating ecology, evolution and climate science. Global Change Biology 17 : 3633 – 3643 .
RICHARDSON , A. D. , A. S. BAILEY , E. G. DENNY , C. W. MARTIN , AND J. O’KEEFE . 2006 . Phenology of a northern hardwood forest canopy. Global Change Biology 12 : 1174 – 1188 .
ROLLINSON , C. R. , AND M. W. KAYE . 2012 . Experimental warming alters spring phenology of certain plant functional groups in an early succes-sional forest community. Global Change Biology 18 : 1108 – 1116 .
ROETZER , T. , M. WITTENZELLER , H. HAECKEL , AND J. NEKOVAR . 2000 . Phenology in central Europe-differences and trends in spring pheno-phases in urban and rural areas. International Journal of Biometeorology 44 : 60 – 66 .
SCHEIFINGER , H. , A. MENZEL , E. KOCH , AND C. PETER . 2003 . Trends of spring time frost events and phenological dates in Central Europe. Theoretical and Applied Climatology 74 : 41 – 51 .
SCHEIFINGER , H. , A. MENZEL , E. KOCH , C. PETER , AND R. AHAS . 2002 . Atmospheric mechanisms governing the spatial and temporal variabil-ity of phenological phases in central Europe. International Journal of Climatology 22 : 1739 – 1755 .
SCHEMSKE , D. W. 1977 . Flowering phenology and seed set in Claytonia virginica (Portulacaceae). Bulletin of the Torrey Botanical Club 104 : 254 – 263 .
SPARKS , T. H. , AND P. D. CAREY . 1995 . The responses of species to cli-mate over two centuries: An analysis of the Marsham phenological record, 1736–1947. Journal of Ecology 83 : 321 – 329 .
SPARKS , T. H. , E. P. JEFFREE , AND C. E. JEFFREE . 2000 . An examina-tion of the relationship between fl owering time and temperature at the national scale using long-term phenological records from the UK. International Journal of Biometeorology 44 : 82 – 87 .
STEVENS , O. A. 1961 . Plants of Fargo, North Dakota. American Midland Naturalist 66 : 171 – 177 .
STINCHCOMBE , J. R. , C. WEINIG , M. UNGERER , K. M. OLSEN , C. MAYS , S. S. HALLDORSDOTTIR , M. D. PURUGGANAN , AND J. SCHMITT . 2004 . A latitudinal cline in fl owering time in Arabidopsis thaliana modulated by the fl owering time gene FRIGIDA . Proceedings of the National Academy of Sciences, USA 101 : 4712 – 4717 .
STRODE , P. K. 2003 . Implications of climate change for North American wood warblers (Parulidae). Global Change Biology 9 : 1137 – 1144 .
TRAVERS , S. E. , K. L. DUNNELL , AND W. K. MICHENER . 2009 . First-fl owering dates of plants in the Northern Great Plains. Ecology 90 : 2332 .
VISSER , M. E. , AND C. BOTH . 2005 . Shifts in phenology due to global climate change: The need for a yardstick. Proceedings of the Royal Society, B, Biological Sciences 272 : 2561 – 2569 .
WILLIS , C. G. , B. RUHFEL , R. B. PRIMACK , A. J. MILLER-RUSHING , AND C. C. DAVIS . 2008 . Phylogenetic patterns of species loss in Thoreau’s woods are driven by climate change. Proceedings of the National Academy of Sciences, USA 105 : 17029 – 17033 .
WILLIS , C. G. , B. R. RUHFEL , R. B. PRIMACK , A. J. MILLER-RUSHING , J. B. LOSOS , AND C. C. DAVIS . 2010 . Favorable climate change response explains non-native species’ success in Thoreau’s woods. PLoS ONE 5 : e8878 .

1397July 2013] MAZER ET AL.—PHENOLOGICAL SENSITIVITY OF TAXONOMIC FAMILIES
WINDER , M. , AND D. E. SCHINDLER . 2004 . Climate change uncou-ples trophic interactions in an aquatic ecosystem. Ecology 85 : 2100 – 2106 .
WIPF , S. 2010 . Phenology, growth, and fecundity of eight subarctic tundra species in response to snowmelt manipulations. Plant Ecology 207 : 53 – 66 .
WOLKOVICH , E. M. , B. I. COOK , J. M. ALLEN , T. M. CRIMMINS , J. L. BETANCOURT , S. E. TRAVERS , S. PAU , ET AL . 2012 . Warming experiments underpredict
plant phenological responses to climate change. Nature 485 : 494 – 497 .
WRIGHT , V. 2001 . Prairies phenology. Technical Report, Konza Environ-mental Education Program , Konza Prairie Biological Station, Manhattan, Kansas, USA.
ZHANG , X. , D. TARPLEY , AND J. T. SULLIVAN . 2007 . Diverse responses of vegetation phenology to a warming climate. Geophysical Research Letters 34 : L19405 .


![[Bertin & Cummings] Aerodynamics for Engineers](https://img.pdfslide.net/doc/110x75/5474f499b4af9f63598b4578/bertin-cummings-aerodynamics-for-engineers.jpg)