Embed Size (px)
Citation preview

Special Issue: Age and Growth of Chondrichthyan Fishes: New Methods,Techniques and Analysis

Developments in environmental biology of fishes 25
Series EditorDAVID L.G. NOAKES
Special Issue: Age and Growth of Chondrichthyan Fishes: New Methods,Techniques and Analysis
Editor:
Carlson, John K. (Volume editor), National Marine Fisheries Service, Panama City, USA
Goldman, Kenneth J. (Volume editor), Alaska Department of Fish and Game, Homer, USA
Reprinted from Environmental Biology of Fishes, Volume 77 (3-4) 2006
123
A C.I.P catalogue record for this book is available from the Library of Congress
ISBN-10 1-4020-5569-2
ISBN-13 978-1-4020-5569-0
Published by Springer,
P.O. Box 17, 3300 AA Dordrecht, The Netherlands
Sold and distributed in North, Central and South America
By Springer,
101 Philip Drive, Norwell, MA 02061, USA
In all other countries, sold and distributed
By Springer,
P.O. Box 322, 3300 AH Dordrecht, The Netherlands
http://www.springer.com
Printed on acid-free paper
All Rights Reserved
� 2006 Springer
No part of the material protected by this copyright notice may be reproduced or utilized in any form or by any means,
electric or mechanical, including photocopying, recording or by any information storage and retrieval system, without
written permission from the copyright owner.
Printed in the Netherlands
CONTENTS
Special Issue: Age and Growth of Chondrichthyan Fishes: New Methods,Techniques and AnalysisGuest Editors: Carlson, John K. & Goldman, Kenneth J.
Acknowledgment of referees 209–210Age and growth studies of chondrichthyan fishes: the need for consistency in terminology,verification, validation, and growth function fitting by G.M. Cailliet, W.D. Smith,H.F. Mollet & K.J. Goldman 211–228
Age and growth of the sandbar shark, Carcharhinus plumbeus, in Hawaiian waters throughvertebral analysis by J.G. Romine, R.D. Grubbs & J.A. Musick 229–239
A re-examination of the age and growth of sand tiger sharks, Carcharias taurus, in thewestern North Atlantic: the importance of ageing protocols and use of multipleback-calculation techniques by K.J. Goldman, S. Branstetter & J.A. Musick 241–252
Comparing external and internal dorsal-spine bands to interpret the age and growth of thegiant lantern shark, Etmopterus baxteri (Squaliformes: Etmopteridae) by S.B. Irvine,J.D. Stevens & L.J.B. Laurenson 253–264
The potential use of caudal thorns as a non-invasive ageing structure in the thorny skate(Amblyraja radiata Donovan, 1808) by M.J. Gallagher, M.J. Green & C.P. Nolan 265–272
Terminology for the ageing of chondrichthyan fish using dorsal-fin spines by M.W. Clarke &S.B. Irvine 273–277
Do differences in life history exist for blacktip sharks, Carcharhinus limbatus, from theUnited States South Atlantic Bight and Eastern Gulf of Mexico? by J.K. Carlson,J.R. Sulikowski & I.E. Baremore 279–292
Evidence of two-phase growth in elasmobranchs by M. Araya & L.A. Cubillos 293–300Two Bayesian methods for estimating parameters of the von Bertalanffy growth equationby K.I. Siegfried & B. Sanso 301–308
A critical appraisal of marginal increment analysis for assessing temporal periodicity inband formation among tropical sharks by R. Lessa, F.M. Santana & P. Duarte-Neto 309–315
Elemental signatures in the vertebral cartilage of the round stingray, Urobatis halleri, fromSeal Beach, California by L.F. Hale, J.V. Dudgeon, A.Z. Mason & C.G. Lowe 317–325
Bomb dating and age validation using the spines of spiny dogfish (Squalus acanthias) byS.E. Campana, C. Jones, G.A. McFarlane & S. Myklevoll 327–336
Investigations of D14C, d13C, and d15N in vertebrae of white shark (Carcharodon carcharias)from the eastern North Pacific Ocean by L.A. Kerr, A.H. Andrews, G.M. Cailliet,T.A. Brown & K.H. Coale 337–353
Application of bomb radiocarbon chronologies to shortfin mako (Isurus oxyrinchus) agevalidation by D. Ardizzone, G.M. Cailliet, L.J. Natanson, A.H. Andrews, L.A. Kerr &T.A. Brown 355–366
Validated age and growth estimates for the shortfin mako, Isurus oxyrinchus, in the NorthAtlantic Ocean by L.J. Natanson, N.E. Kohler, D. Ardizzone, G.M. Cailliet, S.P. Wintner& H.F. Mollet 367–383
Validated age and growth of the sandbar shark, Carcharhinus plumbeus (Nardo 1827) in thewaters off Western Australia by R.B. McAuley, C.A. Simpfendorfer, G.A. Hyndes,R.R. Allison, J.A. Chidlow, S.J. Newman & R.C.J. Lenanton 385–400
Analysis of variability in vertebral morphology and growth ring counts in two Carcharhinidsharks by A.N. Piercy, T.S. Ford, L.M. Levy & F.F. Snelson Jr 401–406
Morphometric minefields—towards a measurement standard for chondrichthyan fishes byM.P. Francis 407–421

The guest editors would like to acknowledge the
following referees for taking the time out of their
schedules to review manuscripts for this volume.
Referee Institution
Allen Andrews Moss Landing Marine LaboratoriesAndre Punt University of WashingtonAndrew Piercy Florida Museum of Natural HistoryAshley Williams James Cook UniversityBrian Gervelis National Marine Fisheries ServiceChristina Conrath Florida Museum of Natural HistoryColinSimpfendorfer
Mote Marine Laboratory
Craig Kastelle National Marine Fisheries ServiceDavid Ebert Moss Landing Marine LaboratoriesDavid Kulka Department of Fisheries & Oceans-
CanadaDavid Milton CSIRO Marine Research-AustraliaR. Dean Grubbs Virginia Institute of Marine ScienceEnric Cortes National Marine Fisheries ServiceGreg Skomal Massachusetts Division of Marine
FisheriesHenry Mollet Monterey Bay AquariumIvy Baremore University of FloridaReferee InstitutionJack Musick Virginia Institute of Marine ScienceJamesGelsleichter
Mote Marine Laboratory
James Hobbs University of California, DavisJames Sulikowski Florida Museum of Natural HistoryJason Romine Virginia Institute of Marine ScienceJody Spence University of VictoriaJohn Hoenig Virginia Institute of Marine Science
Referee Institution
Joshua Loefer South Carolina Department of NaturalResources
Julie Neer National Marine Fisheries ServiceKateSiegfried
University of California, Santa Cruz
LindaLombardi
National Marine Fisheries Service
Lisa Kerr University of MarylandLisaNatanson
National Marine Fisheries Service
Lori Hale National Marine Fisheries ServiceMalcolmFrancis
National Institute of Water andAtmospheric Research-New Zealand
MalcolmSmale
Port Elizabeth Museum-South Africa
MartaNammack
National Marine Fisheries Service
MichaelGallagher
Irish Sea Fisheries Board
PeterSheridan
National Marine Fisheries Service
Rick Officer Fisheries Science Services MarineInstitute-Ireland
RICC Francis National Institute of Water andAtmospheric Research-New Zealand
Rich Beamish Department of Fisheries & Oceans-Canada
RoryMcAuley
Western Australian Fisheries and MarineResearch Laboratories
SarahGaichas
National Marine Fisheries Service
Sarah Irvine Deakin University-AustraliaScott Meyer Alaska Department of Fish and Game
Acknowledgment of referees
Published online: 17 October 2006� Springer Science+Business Media B.V. 2006
Environ Biol Fish (2006) 77:209–210
DOI 10.1007/s10641-006-9138-9
123

Acknowledgment of financial support
This publication and travel to the symposium for
some participants was supported in part by the
National Sea Grant College, Program of the U.S.
Department of Commerce’s National Oceanic
and Atmospheric Administration under NOAA
Grant # NA04OAR4170038, project # W05-23PD,
through the California Sea Grant College
Program; and in part by the California State
Resources Agency. Funding was also provided
by the American Elasmobranch Society, the
National Marine Fisheries Service-Southeast
Fisheries Science Center, and the Florida Aquar-
ium. The views expressed herein do not necessarily
reflect the views of any of those organizations.
Special acknowledgements
The guest editors extend their appreciation to
George Burgess, Jeff Carrier, John Morrissey,
Julie Neer, Ilze Berzins, Russell Moll, Alex
Chester, Nancy Thompson, Michelle Heupel, and
Colin Simpfendorfer for helping with various
aspects of the symposium. We also thank Lori
Hale and Dana Bethea for assisting with the edits
to all the manuscripts. Finally, our appreciation
goes to Suzanne Mekking, Martine van Bezooi-
jen, and David Noakes for working with us on
getting this volume published in Environmental
Biology of Fishes.
Referee Institution
SteveCampana
Bedford Institute of Oceanography-Canada
ToddGedamke
Virginia Institute of Marine Science
Warren Joyce Bedford Institute of Oceanography-Canada
Wade Smith Moss Landing Marine LaboratoriesYiotaApostolaki
Center for Environment, Fisheries andAquaculture Science-Lowestoft,England
123
210 Environ Biol Fish (2006) 77:209–210

Abstract Validated age and growth estimates
are important for constructing age-structured
population dynamic models of chondrichthyan
fishes, especially those which are exploited. We
review age and growth studies of chondrichth-
yan fishes, using 28 recent studies to identify
areas where improvements can be made in
describing the characteristics of ageing struc-
tures (both traditional and novel) utilized to
estimate ages of sharks, rays, and chimaeras.
The topics identified that need consistency in-
clude the: (1) terminology used to describe
growth features; (2) methods used to both
verify and validate age estimates from chon-
drichthyan calcified structures, especially edge
and marginal increment analyses; and (3) the
functions used to produce and describe growth
parameters, stressing the incorporation of size
at birth (L0) and multiple functions to charac-
terize growth characteristics, age at maturity
and longevity.
Keywords Age validation Æ Precision analysis ÆChondrichthyes Æ Growth Æ Longevity ÆVertebrae
Introduction
In recent years, there have been many advances in
the quantitative study of age and growth of
chondrichthyan fishes (Cailliet and Goldman
2004). Several new hard parts have been shown to
provide valid assessments of age in some species,
and new techniques for validation (e.g. bomb
carbon) are becoming more widely known and
applied. Moreover, the importance of assessing
the precision and accuracy of counts on ageing
structures, and the differences in growth models
and their fits to data, are becoming more widely
recognized. The book chapter cited above in a
book entitled ‘‘Biology of Sharks and their Rela-
tives,’’ edited by Carrier et al. (2004), reviewed the
field of age and growth in this group of fishes up to
2003. Although it has been less than two years
since this publication, numerous papers on these
subjects have been published, in addition to sev-
eral papers not covered in the 2004 review chapter.
Since then, we have found five papers that were
missed and 23 new publications that covered age
and growth of chondrichthyan fishes. These
papers covered the life histories of three species
G. M. Cailliet (&) Æ W. D. Smith Æ H. F. MolletMoss Landing Marine Laboratories, 8272 MossLanding Road, Moss Landing, CA 95039, USAe-mail: [email protected]
K. J. GoldmanAlaska Department of Fish and Game, 3298 DouglasPlace, Homer, AK 99603, USA
Environ Biol Fish (2006) 77:211–228
DOI 10.1007/s10641-006-9105-5
123
ELASMOBRANCHS
Age and growth studies of chondrichthyan fishes: the needfor consistency in terminology, verification, validation,and growth function fitting
Gregor M. Cailliet Æ Wade D. Smith ÆHenry F. Mollet Æ Kenneth J. Goldman
Received: 2 June 2006 /Accepted: 22 June 2006 / Published online: 29 September 2006� Springer Science+Business Media B.V. 2006
of chimaeras (Francis and Maolagain 2000, 2001,
2004; Moura et al. 2004), three species of rays
(Coelho and Erzini 2002; Neer and Thompson
2005; White and Potter 2005), nine species of
skates (Gallagher et al. 2004; Henderson et al.
2004; Francis and Maolagain 2005; Gedamke
et al. 2005; Sulikowski et al. 2005a, b), two species
of mackerel shark (Malcolm et al. 2001; Campana
et al. 2005), and ten species of ground or requiem
sharks (Yamaguchi et al. 1998; Lombardi-Carlson
et al. 2003; Oshitani et al. 2003; Cruz-Martinez
et al. 2004; Ivory et al. 2004; Joung et al. 2004,
2005; Lessa et al. 2004; Neer and Thompson 2004;
Santana and Lessa 2004; Carlson and Baremore
2005; Manning and Francis 2005; Neer et al.
2005).
We reviewed the 28 new or missed papers
mentioned above, analyzing the approaches that
were taken in them tohelp identify key problems, if
any, still existing in the methods involved in
chondrichthyan age and growth studies. We were
specifically interested in determining how these
authors handled issues like the terminology of
growth patterns, verification and validation tech-
niques (focusing on edge characteristics and mar-
ginal increment analyses), and growth function
fitting (how the von Bertalanffy (1938) growth
function was fit and what other functions might
have also been useful). At the end of each section,
we provide recommendations that will hopefully
guide researchers on how to proceed with each
type of growth-related analysis.
Cailliet and Goldman (2004) and Goldman
(2004) provided many guidelines on how to
approach the subjects mentioned above. How-
ever, since many of these recent papers used a
variety of different approaches, we have chosen
to use the variability encountered in them to
suggest ways to unify the field so that future pa-
pers might use suitable, and hopefully similar,
approaches in their assessment of chondrichthyan
life history parameters. Considerable variability
and inconsistency were found in the: (1) termi-
nology used for growth patterns in these struc-
tures; (2) methods used to verify and validate age
estimates, including whether or not statistical
analyses were applied; and (3) growth function
fitting and parameter estimation.
Calcified structures and terminology
used for chondrichthyan growth studies
Most age and growth studies of sharks, rays, and
chimaeras utilize growth patterns in vertebral
centra, dorsal fin spines (especially for those spe-
cieswhich donot have suitably calcified centra and/
or live in deep-sea habitats), and more recently in
skates, caudal thorns (Cailliet andGoldman 2004).
These structures tend to accumulate calcified
growth material as they age, thus producing con-
centric areas that often have characteristics
reflecting the time of year (season) in which this
material is being deposited. Of the papers we
recently reviewed, all used calcified structures,
including vertebral centra (23 of the studies),
dorsal spines (four), and caudal thorns (two).
In the field of fish ageing, there have been
several attempts to synthesize the terminology
used to describe growth features so that it is
consistent among studies, one of the earliest being
Wilson et al. (1987). Recently, Panfili et al. (2002)
provided a comprehensive review in their ‘‘Man-
ual of Fish Sclerochronology.’’ However, this
excellent review, with its glossary, is focused more
on bony fish ageing, involving the use of otoliths
and scales, which are not appropriate for chon-
drichthyan fishes.
It is important to distinguish between growth
patterns that reflect seasonal growth and those,
when combined, that may reflect annual (yearly)
growth. Therefore, we first need to distinguish the
length of time a particular growth pattern reflects.
Panfili et al. (2002), for example, discussed daily
growth rings, a phenomenon that has not yet been
found in chondrichthyans. For these fishes, the first
distinction is whether a term reflects a season (i.e.,
summer or winter patterns; but this may not always
be the same in all species) or a year (i.e., an annual
pattern, which requires some sort of validation,
discussed later). As Panfili et al. (2002) noted, the
term annulus ‘‘has traditionally been used to des-
ignate yearly marks even though the term is
derived from the Latin ‘‘anus,’’ meaning ring, not
from ‘‘annus,’’ which means year.’’ For the sea-
sonal growth pattern, Panfili et al. (2002) synony-
mized the words band, ring, increment, and mark,
something that we feel confuses researchers.
212 Environ Biol Fish (2006) 77:211–228
123
We would prefer to have a standardized termi-
nology that all, or at least the majority of chon-
drichthyan researchers, should follow.
Cailliet and Goldman (2004) and Goldman
(2004) tried to be consistent with their terminol-
ogy, suggesting that ‘‘band’’ be used for seasonal
periods (e.g. opaque bands tending to be depos-
ited in summer and translucent bands tending to
be deposited in winter months) and either ‘‘ring’’
or ‘‘annulus’’ be used for those growth patterns
demonstrated or assumed to represent a year’s
period. Cailliet and Goldman (2004) stated that
‘‘the most commonly distinguishable banding
pattern in sectioned centra when viewed micro-
scopically is one of wide bands separated by dis-
tinct narrow bands,’’ and also that the ‘‘terms
opaque and translucent are commonly used to
describe these bands.’’ An additional character-
ization of chondrichthyan growth bands was
applied by Officer et al. (1996, 1997) based upon
their relative extent of mineralization; these were
identified as ‘‘hypermineralized bands.’’
Although there is often regularity in the width
of bands, this can still be a potentially misleading
generalization. For broader discussions, we feel
that it is important to modify such statements
saying ‘‘there is often a consistency in the wide/
narrow pattern.’’ The width of these opaque and
translucent bands can be particularly exaggerated
during the early years, and later, as growth slows,
widths of these bands become more similar to
each other. In fact, opaque and translucent bands
may be narrower than translucent bands and/or
vice versa in ‘‘older’’ fish. In addition, the relative
widths of these bands may not remain consistent
throughout the life of the animal. It is the depo-
sition of opaque and translucent bands that is
usually more consistent seasonally. Therefore,
bands should be described and identified for their
optical qualities, rather than dimensions such as
band widths, which can be highly variable.
While reviewing the papers published since
Cailliet and Goldman (2004), we found that many
terms and combinations of terms were used. In
the 28 studies reviewed, seasonal patterns were
termed ‘‘band’’ (18 studies), ‘‘ring’’ and ‘‘zone’’
(4 each), ‘‘increment’’ (1), and in one publication,
not defined at all. The terms used to represent
annual patterns in these studies were ‘‘band’’
(7 studies), ‘‘band pair’’ (5), ‘‘annulus’’ (plural
annuli), ‘‘ring’’ (in one of these, ‘‘growth ring’’)
and ‘‘increment’’ (3 each), while 7 studies did not
provide a definition. This supports our assertion
that there is a need for consistency in the future
use of terminology.
Indeed, years ago Cailliet et al. (1985) sug-
gested counting band pairs, defined as one opa-
que and one translucent band combined, in their
study of white shark, Carcharodon carcharias,
growth. Martin and Cailliet (1988) added the term
rings, which referred to the fine features within
and making up either opaque or translucent
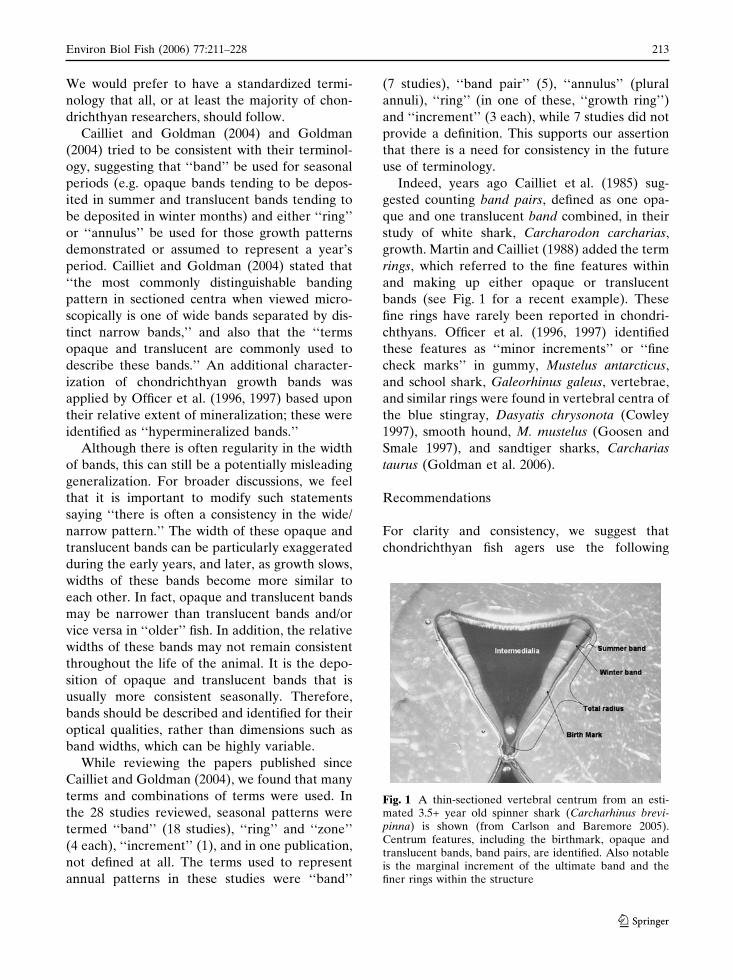
bands (see Fig. 1 for a recent example). These
fine rings have rarely been reported in chondri-
chthyans. Officer et al. (1996, 1997) identified
these features as ‘‘minor increments’’ or ‘‘fine
check marks’’ in gummy, Mustelus antarcticus,
and school shark, Galeorhinus galeus, vertebrae,
and similar rings were found in vertebral centra of
the blue stingray, Dasyatis chrysonota (Cowley
1997), smooth hound, M. mustelus (Goosen and
Smale 1997), and sandtiger sharks, Carcharias
taurus (Goldman et al. 2006).
Recommendations
For clarity and consistency, we suggest that
chondrichthyan fish agers use the following
Fig. 1 A thin-sectioned vertebral centrum from an esti-mated 3.5+ year old spinner shark (Carcharhinus brevi-pinna) is shown (from Carlson and Baremore 2005).Centrum features, including the birthmark, opaque andtranslucent bands, band pairs, are identified. Also notableis the marginal increment of the ultimate band and thefiner rings within the structure
Environ Biol Fish (2006) 77:211–228 213
123

terminology: (1) ‘‘Opaque’’ or ‘‘translucent bands’’
(following Cailliet et al. 1983); (2) ‘‘band pairs’’
(often referred to as annuli and/or rings, sensu
Cailliet and Goldman (2004) and Goldman
(2004)), comprising one opaque and one translu-
cent band; and (3) ‘‘increments’’ which are mea-
surements of partial to complete growth bands or
band pairs (which should be specifically defined by
authors). These terms should not be confused with
other terminology such as ‘‘checks’’ or ‘‘discon-
tinuous bands’’ (Panfili et al. 2002), although these
also appear as translucent and opaque features.We
remind investigators that the method of prepara-
tion and examination of an ageing structure (e.g.
stained vs. unstained, radiographed vs. micro-
photographed, and viewed using reflected vs.
transmitted light) alter the optical properties of
calcified structures. Therefore, features character-
ized as opaque or translucent may vary depending
uponmethodology. Finally, we propose that future
studies ascertain whether bands classified as
‘‘opaque’’ are hyper- or hypomineralized.
Verification and precision analysis
Panfili et al. (2002) defined ‘‘verification’’ as
confirming ‘‘the consistency of the interpretation
of age, i.e., the repeatability and/or precision of a
numerical interpretation that may be independent
of age.’’ They further define ‘‘precision’’ as ‘‘the
closeness of repeated measurements of the same
quantity.’’ They then pointed out that this can be
between or within readers or laboratories. The
techniques commonly used to verify age estimates
were presented by Campana (2001) for fishes in
general and by Cailliet and Goldman (2004) and
Goldman (2004) for use on chondrichthyans.
Most of the 28 recently reviewed studies pre-
sented evidence that verified or assessed preci-
sions of age estimates. The Index of Average
Percent Error (Beamish and Fournier 1981,
sometimes also including D and V of Chang 1982)
was presented in 13 of these papers, while per-
centage agreement (Beamish and Fournier 1981;
Cailliet et al. 1990; Kimura and Lyons 1991;
Campana 2001; Cailliet and Goldman 2004) and
age–bias curves (Campana et al. 1995) each were
reported in six papers. Combinations of the vari-
ous verification and precision assessments were
common (11 studies). This approach of combining
various assessments is a good one because when
more than one method produces similar results it
gives additional strength to the conclusions.
However, Hoenig et al. (1995) demonstrated
that there can be differences in precision that
APE indices obscure because they assume that
the variability among observations of individual
fish can be averaged over all age groups and that
this variability can be expressed in relative terms.
Additionally, APE indices do not result in values
that are independent of the age estimates, do not
test for systematic differences, do not distinguish
all sources of variability (such as differences in
precision with age) and do not take experimental
design among studies into account (i.e., number
of times each sample was read in each study.
Within a given ageing study, APE indices may
serve as good relative indicators of precision
within and between readers provided that each
reader ages each vertebra the same number of
times. However, even this appears only to tell us
which reader was less variable, not which one was
better or if either were biased. Bias is a more
critical issue than precision, particularly in long-
lived chondrichthyan fishes. We prefer also using
Goldman’s (2004) method for assessing precision,
in which the percent agreement within and be-
tween readers is calculated, with individuals di-
vided into appropriate length or disc width groups
(e.g., 5–10 cm increments). This can be done with
sexes separate and/or combined. Biases can then
be assessed using contingency table methods
(Bowker 1948; Hoenig et al. 1995). We feel that
there is validity in using percent agreement with
individuals grouped by length as a test of preci-
sion because it does not rely on ages (which have
been estimated or assessed), but rather on
empirical length measurements. Of course, age
could be used if, and only if, validation of abso-
lute age for all available age classes had been
achieved.
Recommendations
Chondrichthyan life history researchers should
continue to apply precision analyses in their
214 Environ Biol Fish (2006) 77:211–228
123

ageing studies, and should, whenever possible,
use multiple methods. In addition, within- or be-
tween-reader age–bias curves should be em-
ployed, including frequencies and levels of
agreements superimposed on these curves
(Fig. 2), and contingency tables.
Validation analysis
Panfili et al. (2002) defined ‘‘accuracy’’ as ‘‘the
closeness of the estimate of a quantity (measured
or computed value) to its true value.’’ Thus, to
document or test accuracy is to validate that the
growth zones being counted represent some
temporal unit such as season or year. Again, the
techniques commonly used to validate age esti-
mates were presented by Campana (2001) for
fishes in general and by Cailliet and Goldman
(2004) and Goldman (2004) for use on chondr-
ichthyans.
Campana (2001) included at least eight
approaches, all clearly summarized and listed, in
order of choice. These were: (1) release of known
age and marked fish; (2) bomb radiocarbon; (3)
mark-recapture of chemically tagged fish; (4)
radiochemical dating; (5) discrete length modes
sampled for age structures; (6) natural date-
specific markers; (7) marginal increment analysis;
and (8) captive rearing (with and without oxy-
tetracycline or OTC). While radiochemical dating
has proven to be quite useful for bony fish otoliths
(see Andrews et al. 1999, 2005; Stevens et al. 2004
for examples), its assumptions are invalid for
cartilaginous chondrichthyan skeletons and it
cannot be used on this group of fishes (Welden
et al. 1987).
According to Cailliet and Goldman (2004), the
techniques most commonly used on chondr-
ichthyan fishes were marginal increment analysis,
size frequency modal analysis, release of known-
age, marked fish, mark-recapture of chemically
tagged fish, and captive rearing. Also, one study
Fig. 2 An intra-readerage–bias plot that alsoincorporates age-specificagreements from acontingency table of thornband counts forAmblyraja georgiana(from Francis andMaolagain 2005).Numbers representnumber of skates, anddots with error bars arethe mean counts ofreading 2 (±2 standarderrors) relative to reading1 (offset by +0.1 bands forclarity) for 119 readings.The diagonal lineindicates a one-to-onerelationship
Environ Biol Fish (2006) 77:211–228 215
123
was published by Campana et al. (2002) utilizing
bomb radiocarbon age validation techniques for
the porbeagle, Lamna nasus, and one vertebral
centrum of the shortfin mako, Isurus oxyrinchus.
While this exciting new validation approach is
quite promising, it is also highly technical and
expensive, thus no new papers have been pub-
lished to date. However, three papers were pre-
sented at this symposium, which appear in these
proceedings (see Ardizzone et al. 2006; Campana
et al. 2006; Kerr et al. 2006)
In our review of the recent literature (Cailliet
and Goldman 2004), including the more recent 28
studies, validation studies have not been very
common for chondrichthyan fishes. This is mainly
because of their limited accessibility, large size
and mobility, and the difficulty of obtaining
monthly, or even seasonal, samples. As a result,
almost half of the 28 studies (13) did not report
any age validation results, and the rest used a
variety of tools.
Edge analysis
As discussed by Cailliet and Goldman (2004) and
Goldman (2004), edge analysis characterizes the
margin of a structure used for ageing over time in
many different individuals to discern seasonal
changes in growth. These structures have tradi-
tionally been vertebral centra, but this approach
could equally apply to spines, thorns and neural
arches. Edge analysis involves qualitatively char-
acterizing the margin of the calcified structure as
opaque or translucent, light or dark, wide or
narrow, or a combination of these features.
In our examination of the recent literature we
found that 6 of the 13 studies applied centrum
edge analysis as a validation method. One
approach was categorizing the edges simply as
opaque or translucent (four studies), while the
others categorized the edges as one of three
grades (two studies).
The use of edge analysis was introduced by
Holden and Vince (1973), who determined the
timing of band deposition and validated the an-
nual formation of one opaque and translucent
band (one band pair) in whole vertebral centra of
Raja clavata in conjunction with OTC mark
recapture. However, they warned that the timing
of opaque band formation did not necessarily
coincide with the time that they become visible at
the edge of the centrum. In their study, recogni-
tion of centrum edge types was commonly ob-
scured by remaining vertebral connective tissue.
Prompted by this earlier study, Tanaka and Mi-
zue (1979) sectioned vertebral centra to enhance
band clarity and determine the periodicity of
band formation. Three grades of band develop-
ment were classified from centrum edges. These
grades were based on the optical qualities and
width of the ultimate band (I: dark; II: light,
narrow; III: light, broad) in relation to the month
of capture.
Identifications of edge types may be influenced
by many factors. The optical qualities of an age-
ing structure vary with preparation (e.g. thickness
of section), species, its dimensions, and lighting
methods. Edge types of stained vertebrae may be
more difficult to interpret because of the accu-
mulation of stain at the sample–resin interface.
Inter-annual environmental variation may also
alter the pattern of band formation and reduce
the resolution of the technique. The experience
level of those estimating ages and inconsistent
criteria for assigning edge grades may further
introduce variability and subjectivity into the
analysis. It is therefore critical to include only
samples of good condition and clarity and to
carefully and consistently examine the edges of an
ageing structure.
Despite the subjectivity associated with this
approach, edge analysis has frequently been used
in chondrichthyan ageing studies. The percent
frequency of opaque and translucent bands has
been compared with month or season of specimen
capture (e.g. Roussouw 1984; Kusher et al. 1992;
Wintner et al. 2002), and Tanaka and Mizue’s
(1979) approach has been adopted in numerous
studies (e.g. Yudin and Cailliet 1990; Carlson
et al. 1999). Following modified edge analysis
methods introduced in teleost ageing studies
(Anderson et al. 1992; Vilizzi and Walker 1999),
Smith (2005) classified four distinct edge catego-
ries: narrow translucent, broad translucent, nar-
row opaque and broad opaque. The width of the
forming band (broad/narrow) was determined
based on proportional development in relation to
the previous like band. Although this approach
216 Environ Biol Fish (2006) 77:211–228
123

may not be well suited for small-bodied species or
may become more complicated among the larg-
est/oldest specimens, the consideration of four
general edge types can provide enhanced details
pertaining to seasonal patterns of band formation.
When combined with additional techniques, such
as Marginal Increment Analysis (MIA), edge
analysis can provide valuable corroborative
evidence to validate the periodicity of band
formation.
Marginal increment analysis
MIA provides a useful, semi-direct (Panfili et al.
2002) method of validating the periodicity of band
formation. It is the most commonly employed
validation technique among chondrichthyan age
and growth studies (Cailliet and Goldman 2004;
Goldman 2004). Like edge analysis, MIA requires
the recognition and identification of the band type
forming on the outer edge of an ageing structure.
Typically, the width of the ultimate, developing
band (or band pair) is compared to the width of
the last fully formed band pair and mean values of
these ratios are related to the month of capture.
Trends in the periodicity of band formation can be
compared by size class, pooled age classes, select
age classes (e.g. White et al. 2001; Sulikowski
et al. 2005a), or season (Neer and Thompson
2005), but should ideally be restricted to individ-
ual age classes (Campana 2001). Specimens esti-
mated to be age 0 cannot be included in MIA
because they lack fully formed band pairs.
Campana (2001) identified MIA as one of the
most difficult and likely to be abused methods of
validation. However, Parsons (1993) successfully
established the applicability and resolution of
MIA in chondrichthyan growth studies by vali-
dating the annual deposition of a single band pair
within the vertebral centra of Sphyrna tiburo
using MIA in conjunction with captive, known-
age and OTC-injected recaptured specimens.
Although the incorporation of MIA into elas-
mobranch ageing studies has increased markedly
since Parsons’ (1993) study, the technique had
previously been applied for many years. In his
pioneering work, Ishiyama (1951) was the first to
present a formula for MIA and examine ratios of
ultimate and penultimate marginal widths be-
tween months of capture to determine the season
of band formation. This attempt, however, was
largely overlooked.
More recent authors (e.g. Killam and Parsons
1989; Simpfendorfer 1993; Natanson et al. 1995;
Loefer and Sedberry 2003; Santana and Lessa
2004; Goldman and Musick 2006) have applied
MIA as a validation technique, but few have
provided examples of the formulae used to cal-
culate these values or explicit details of this
technique. Consequently, ambiguous and incon-
sistent terminology associated with MIA may
have restricted the effective use, interpretation,
and comparative value of these analyses among
many elasmobranch ageing studies.
Four publications are commonly cited in asso-
ciation with chondrichthyan MIA and each offer
seemingly different approaches and terminology:
(1) Natanson et al. (1995): MIR = (VR–Rn)/
(Rn–Rn–1), in which MIR is the Marginal
Increment Ratio, VR is the vertebral radius,
Rn is the radius of the ultimate band or band
pair, and Rn–1 is the radius of the next to last
complete band pair;
(2) Conrath et al. (2002): MIR = MW/PBW, in
which MIR remains as previously defined,
MW is the margin width, and PBW is the
previous band pair width;
(3) Lessa et al. (2004): MI = VR–Rn, in which
MI is termed the marginal increment, VR is
the vertebral radius, and Rn is the radius of
the last complete band or band pair.
(4) Branstetter and Musick (1994) apply the
term ‘‘relative marginal increment analysis,’’
but did not provide a formula or figure to
describe the calculation. In their description
of MIA, the authors’ definitions of the terms
‘‘band’’ and ‘‘ring’’ were unclear and they
proceeded to use them interchangeably
making it somewhat difficult to interpret the
features to which they were referring.
Ambiguity associated with only the presen-
tation of text and terminology may result in
differing interpretations as to what features
(e.g. bands or band pairs, opaque bands or
translucent bands, broad or narrow bands,
etc.) should be measured and compared.
Environ Biol Fish (2006) 77:211–228 217
123

Of these four methods, the one detailed by
Natanson et al. (1995) has been the most widely
cited and originated from Hayashi’s (1976) study
of marginal increment formation in the otoliths of
the red tilefish, Branchiostegus japonicus. Each of
the techniques described by Branstetter and
Musick (1994), Natanson et al. (1995) andConrath
et al. (2002) calculate relative MIRs because the
width of the outermost band pair (or band) is
divided by the last fully formed band pair, making
the marginal increment proportional to the previ-
ous growth band, but not necessarily to other fish
of different ages. Alternatively, Santana and Lessa
(2004) presented a variation that reports the mean
relative MIRs by expressing absolute marginal
increments as a percentage following Crabtree and
Bullock (1998). In contrast, Lessa et al.’s (2004)
approach does not provide values of the marginal
width. Instead, their formula provides a secondary
estimate of vertebral radius minus the ultimate
band pair. This approach should not be used as a
semi-direct validation method.
If the MIA methods of Branstetter and Musick
(1994), Natanson et al. (1995) and Conrath et al.
(2002) are interpreted and calculated correctly,
they will provide the same result. These methods
are not distinct and reflect the most commonly
applied form of MIA in teleost ageing studies.
The modification presented by Conrath et al.
(2002) provides a simplification that directly
compares the widths of the ultimate and penulti-
mate band pairs. Secondarily determining width
of the penultimate band pair (or band) by sub-
tracting measurements from the vertebral radius
introduces additional measurement error into
calculations. The percent marginal increment
applied by Santana and Lessa (2004) generates an
interesting assessment of increment patterns but
may inhibit the ability to assess the significance of
these trends using most common statistical
methods because values are expressed as a per-
centage. Therefore, we feel using the simplifica-
tion of MIA as described by Conrath et al. (2002)
is the most appropriate technique for validating
the temporal periodicity of band deposition
among chondrichthyans.
When considering preparation techniques for
structures used in age determination and valida-
tion, especially MIA, we caution against the use of
whole vertebrae. This is mainly because there can
be error measuring straight lines on a concave sur-
face. Many authors (e.g. Kusher et al. 1992) have
discussed the potential drawbacks of ageing whole
vertebrae and stressed the advantages of sectioning
these structures so as to more easily discern the
growth zones, especially from older fishes.
MIA typically tests the null hypothesis that a
single band pair is deposited annually within the
ageing structure of a study species. Given that
initial assumption, it is imperative that measure-
ments incorporated into these analyses consist of
the last fully-formed band pair (one translucent
and one opaque band) and the ultimate forming
band or band pair. Measurement of opaque or
translucent bands alone would not adequately test
this null hypothesis. If more than one band pair is
formed each year, or no pattern is evident what-
soever, it will be revealed in such analyses.
Following MIA, statistical analyses should be
applied to the resulting data set to determine if
significant differences exist among months. Too
frequently, authors have relied on visual assess-
ments of potential trends in marginal increment
formation based solely on graphical representation
of the data. Adequate statistical analyses include
parametric single factor ANOVA (e.g. Carlson
et al. 2003) and non-parametric Kruskal–Wallis
one-wayANOVA(e.g. Simpfendorfer et al. 2000).
The required assumptions for parametric analyses
(i.e., equality of variances and normality) should
be tested to determine if ANOVA is appropriate.
As a result, transformation of mean marginal
increment data may be necessary to perform
ANOVA (e.g. Neer et al. 2005). Likewise, power
analysis should be applied to assess the adequacy
of sample size and potential for statistical error.
Few authors have tested (or reported testing) their
marginal increment data to ensure that parametric
analyses were appropriate. Because non-para-
metric approaches may be more robust in cases of
unequal sample sizes, inequality of variances,
or departures from normality (e.g. Zar 1996),
Kruskal–Wallis tests on ranks may be particularly
well suited for marginal increment data.
Although rarely included, post-hoc tests should
be applied to determine the source and extent of
218 Environ Biol Fish (2006) 77:211–228
123

variation if significant differences are detected in
mean marginal increment ratios among months.
Tukey and Newman–Keuls are the most com-
monly used parametric tests for this purpose and
modifications of each are available in the com-
mon event of unequal sample sizes (Zar 1996;
Santana and Lessa 2004). Equivalent procedures
are available for non-parametric evaluations,
including the Nemenyi and Dunn tests (Zar 1996;
Smith 2005). The approach of Dunn (1964) may
be more applicable as it does not require equal
sample sizes. The ability to identify which
monthly or seasonal mean marginal increment
ratios are significant from one another may en-
hance conclusions on the timing of band deposi-
tion and the environmental or biological factors
that are associated with these events.
In our review of the recent 28 studies, authors
used a version of marginal increment analysis in
12 studies. However, of those studies using MIA,
only four attempted any statistical analyses to
determine if observed variation in the mean
marginal increment ratios differed significantly
among months or seasons. These statistics in-
cluded one factor ANOVA (3 studies), the Tukey
test (1 study), and non-parametric ANOVA or
the Kruskal–Wallace test (1 study).
Recommendations
For edge analysis, researchers should consider
using several grades based upon the optical
qualities and width of the ultimate band. It is also
essential that only samples of good condition and
clarity are used. Structures should be sectioned
for use with both edge and marginal increment
analyses because characterization and measure-
ment of the critical areas of the margin will be
more precise. We also feel that researchers need
to develop and apply statistical analyses to cate-
gorical edge data, perhaps including log-likeli-
hood ratios, Kolmogorov–Smirnov goodness of fit
tests, and frequency distribution analysis, among
other possibilities (e.g. Zar 1996; Cappo et al.
2000).
For both edge and marginal increment
analysis, we support recent recommendations
that trends in the periodicity of band formation
be analyzed separately by size class, pooled
age classes, selected age classes, and seasons.
We also support combining edge analysis with
other techniques (e.g. MIA) to strengthen the
interpretation of band formation periodicity
(Fig. 3).
The simplification of MIA as described by
Conrath et al. (2002) is the most appropriate
technique for validating the temporal periodicity
of band deposition among chondrichthyans. Sta-
tistical analyses for MIA are necessary to insure
that the edge dimensions really vary significantly
with season. These should include tests to deter-
mine whether parametric or non-parametric sta-
tistics would be most appropriate for a given
study. If significant differences among months or
seasons are detected, appropriate post-hoc tests
should be applied to identify the temporal source
of this variation.
L0 vs. t0 and other aspects of the von
Bertalanffy growth function (VBGF)
The VBGF (von Bertalanffy 1934, 1938, 1960) is
the most commonly used growth function in
chondrichthyan age and growth studies:
LðtÞ ¼ L1 � ðL1 � L0Þ e�kt;
where L(t) is length as a function of time (t), L¥ is
the theoretical asymptotic length, L0 is the size at
birth, and k is the rate constant. The function that
has consistently beenpresented as vonBertalanffy’s
(1934) growth function (e.g. Ricker 1979; Gulland
1983; Hilborn and Walters 1992; Haddon 2001)
represents a modification of the original formula
and is:
LðtÞ ¼ L1 1 � e�kðt�t0Þ� �
;
where t0 is the theoretical time at zero length and
the other parameters are as previously defined.
Von Bertalanffy (1934) obtained his growth
function by integrating the differential equation:
dw=dt ¼ gw2=3 � jw;
where g (eta) is the build-up (anabolic), j (kappa)
is the break-down (catabolic) physiological
Environ Biol Fish (2006) 77:211–228 219
123

parameter, and w is mass (weight). The constant
of integration is determined by the value of w(t)
at time zero (y-axis intercept) or L(t), and not
some imaginary, negative time when w(t) = 0 or
L(t) = 0 (x-axis intercept). His differential equa-
tion applied to mass, but the first step in this
integration is the substitution method y = w1/3
and this first mathematical step can be interpreted
biologically to produce a differential equation for
length if we substitute with L = qw1/3 where q is a
constant. The integration of the differential
equation also shows that it is convenient to use
the parameter L¥ = 3 q (g/k) which is inversely
proportional to the rate constant k (where k = j/3). The steady state value L (t = ¥) = L¥ is
determined by both g and k, while the time it
takes to reach the final length from birth is
determined by k alone.
It was Beverton (1954) who first used t0 in-
stead of L0 as the third parameter in the VBGF.
He mathematically transformed the VBGF with
the parameters L¥, k, and L0 to an equation
with the parameters L¥, k, and t0 to simplify
yield calculations. He stated in Lecture 9 on p.
43: ‘‘It must be remembered that the constant t0is largely artificial, insofar as it defines the age at
which the organism would be of zero length if it
grew throughout life with the same pattern of
growth as in the post-larval phase.’’ The VBGF
with t0 as the third parameter was also used in
Beverton and Holt (1957), and they also stated
on p. 34: ‘‘In practice, the constant t0 must be
regarded as quite artificial.’’ Nevertheless, this
led to widespread but unfortunate use of the
VBGF with t0 as the third parameter in age and
growth studies. Holden (1974) incorrectly as-
sumed that t0 had biological meaning for elas-
mobranchs (i.e., gestation period), but it does
not (Pratt and Casey 1990; Van Dykhuizen and
Mollet 1992).
We also note that the rate constant k has units
of reciprocal time and is difficult to interpret. It is
easier to interpret k in terms of half-lives (ln 2/k)
with units of time. The time it takes to reach the
fraction x of L¥ is given by:
tx ¼ 1=k ln ðL1 � L0Þ=ðL1ð1 � xÞÞ½ �:
If, for example, we use x = 0.95 (Ricker 1979),
we also need to specify L0 (for example 0.2L¥),
then we can interpret t0.95 as a longevity estimate
as given by:
T1 T2 O1 O2
Jan. Feb. Mar. Apr. May Jun. Jul. Aug. Sep. Oct. Nov. Dec.
Cen
trum
edg
e ty
pe p
erce
nt fr
eque
ncy
0
20
40
60
80
100
0.0
0.2
0.4
0.6
0.8
1.01 1
10
4
93
12
13
37
42
14
n = (12) (19) (11) (18) (55) (9) (15)
Mea
n M
IR
13 24
13 9
Fig. 3 Monthly variation among four centrum edge types(n = 205) and mean monthly marginal increment ratios(MIR) ±1 standard error (n = 139) determined frompooled sexes and size classes of the diamond stingray,Dasyatis dipterura (from Smith 2005). Values within the
histogram represent the number of samples included inmonthly centrum edge analyses. Sample sizes incorporatedinto the marginal increment analysis are listed in paren-theses below the x-axis
220 Environ Biol Fish (2006) 77:211–228
123

t0:95 ¼ 2:77=k ¼ 4:0 ln 2=kð4 half � livesÞ:
Fabens (1965) defined longevity based on
x = 0.9933, assumed L0 = 0, and obtained:
t0:99 ¼ 5=k ¼ 7:21 ln 2=k;
for 7.2 half-lives. This shows that there is a con-
siderable range for the definition of longevity
depending on the value of x postulated.
It does not matter which 3-parameter VBGF is
used for fitting length vs. age data as they are
mathematically equivalent. However, the equa-
tion with L0 as the third parameter has major
advantages. Size at birth of elasmobranchs is of-
ten well defined and known. It is therefore easy to
judge whether the fitted L0 is a reasonable value.
If the parameters L¥, k, and t0 are used as fitting
parameters for elasmobranch age and growth
studies, then L0 should at least be calculated
(L0 ¼ L1ð1 � ekt0Þ). If the calculation of L0 is
omitted, one cannot evaluate how reasonable the
fitted t0 might be; they often are quite excessive
(i.e., a t0 value that is far too large or far too
small) and this is an indication that an unrea-
sonable calculated L0 will result. Despite the
advantages of using L0 instead of t0 as the third
parameter in the VBGF, few papers dealing with
elasmobranch growth have used it (e.g. Aasen
1963; Cailliet et al. 1992; Van Dykhuizen and
Mollet 1992; Mollet et al. 2002). We are not sure
why t0 remained the preferred third parameter in
most publications over the last 20 or more years,
except that it is convenient.
Some authors have dealt with the lack of bio-
logical reality involved with estimating t0 by fixing
or anchoring the VBGF with an estimate of L0
from known or estimated size-at-birth values (e.g.
Van Dykhuisen and Mollet 1992; Neer and
Thompson 2005). This modification can often
significantly alter the other VBGF parameters.
For example, it could decrease L¥ and also
increase the mean square error (MSE) and the
standard error of the estimate (SEE) of the
function. The 2-parameter VBGF with L0 fixed as
only one value can ignore what is often highly
variable and sometime rapid early juvenile
growth rates. Thus, all known values of L0 should
be used.
In our review of the 28 most recent chondri-
chthyan growth studies, almost all estimated
growth parameters using the VBGF, and most (25
studies) also used the 3-parameter solution solv-
ing for k, L¥, and t0 but not L0). However, three
studies (Carlson and Baremore 2005; Neer et al.
2005; Santana and Lessa 2004) also used a two-
parameter solution, using a fixed (or average) L0
to anchor the model, solving only for k and L¥.
Recommendations
Our recommendation is to use L0 instead of t0,
whenever possible, because it can be biologically
meaningful (Cailliet and Goldman 2004). We
suggest that t0 should never be used to estimate
meaningful life history parameters of chondr-
ichthyans (e.g. gestation period). If a three-
parameter fit for the VBGF is used that incorpo-
rates t0, researchers should check to see whether
the resulting, calculatedL0 value crosses the y-axis
within the range of observed length at birth.
Multiple growth functions: biological relevance,quality of fit, and convenience
It is often important and even necessary, to use
more than one growth function to adequately
characterize the growth of a given species. Yet, as
previously stated, a single form of the VBGF
(after Beverton 1954) has primarily been applied
in chondrichthyan ageing studies. However, seri-
ous limitations and reservations have been iden-
tified with the growth function (e.g. Knight 1968;
Roff 1980; Moreau 1987), including a limited
ability to reflect early growth (Gamito 1998).
Some of the criticisms applied to the VBGF are
also relevant to many growth functions in general
(e.g. assumption of asymptotic growth). Appro-
priate models should be selected on the indication
of biological reality, statistical basis of their fit,
convenience (Moreau 1987), and, as models of
increased complexity are applied, parsimony (e.g.
Burnham and Anderson 2002; Spiegelhalter et al.
2002; Guthery et al. 2005). If an investigator’s
Environ Biol Fish (2006) 77:211–228 221
123

objective is to express the growth characteristics
of a species in quantitative terms, it is imprudent
and may be counter-productive to base this
description on a single, exclusive model.
Numerous models have been developed to
describe growth characteristics based on size-at-
age estimates or mark-recapture data (e.g. Ricker
1979; Baker et al. 1991; Haddon 2001). The
VBGF itself has been modified, including two-
parameter fits based on known size-at-birth (e.g.
Van Dykhuizen and Mollet 1992), weight-at-age
estimates (Fabens 1965), a generalized four-
parameter form (Pauly 1979), or ‘‘near-linear’’
reparamaterizations developed to improve statis-
tical properties of the model (e.g. Ratkowsky
1986; Hernandez-Llamas and Ratkowsky 2004).
Polynomial functions have been suggested and
applied as alternatives to the VBGF, but the
resulting parameters provide no correlate for
biological evaluation (Knight 1968; Chen et al.
1992). Flexible models, such as Richards (1959)
and Schnute (1981), provide formulations that are
capable of expressing more than one model form.
Growth models have also been developed that
incorporate the influences of ontogenetic or
strong seasonal changes in growth trajectories
(Soriano et al. 1992; Porch et al. 2002). However,
it is outside the scope of this review to summarize
each of the many available growth models and
detail their characteristics. Instead, we emphasize
that a single universal model is unlikely to ade-
quately describe the growth of all chondrichth-
yans and encourage the fitting of multiple
functions to enhance descriptions of growth.
Moreau (1987, p. 81) stated that ‘‘the main
criteria for choosing a growth curve are quality of
fit and convenience.’’ Goodness of fit is best
evaluated using several criteria. Coefficients of
determination (r2) have been the primary and
often sole measure of model fit among chondri-
chthyan ageing studies. However, this approach
may not be well suited for non-linear models (e.g.
Kvalseth 1985). Recommended methods of eval-
uating model performance include the lowest
residual MSE (also referred to as residual vari-
ance) or SEE, examination or comparison of
residuals, and level of significance (e.g. P < 0.05)
(Ratkowsky 1983; Neter et al. 1996). These mea-
sures used separately or in combination, are
valuable whether considering single or multiple
models. Although the potential for misinterpret-
ing the quality of fit based on analysis of residuals
alone increases when sample sizes are relatively
small, plots of standardized residuals vs. predicted
age allow a rapid means of identifying outliers
within a dataset. Such outliers could, in turn, dis-
proportionately influence estimates of MSE or
SEE (Ratkowsky 1983). Because standardized
residuals are normalized by their standard devia-
tion, these plots and related analyses provide
useful means of comparing fit between models
generated from differing size-at-age (e.g. total
length, disc width, weight) variables. Convenience
is also an important factor in model selection.
Specific models may be preferred for comparison
with other studies, application to additional fish-
ery models, or for indirect estimation of mortality
and other life history correlates (e.g. Jensen 1996).
Regardless of the quality of fit and need for
convenient models, the extent to which a given
growth function produces reasonable biological
estimates must remain a primary factor in model
selection. Goodness of fit, used alone, could lead
to choosing an inappropriate growth function.
Using a combination of fit and a biological
interpretation of one or more of the parameters,
such as L0 (from t0 if necessary), longevity (from
k), and L¥ (directly), may ensure that the most
biologically meaningful growth function is
chosen.
In our review of the 28 most recent chondri-
chthyan growth studies, most applied only the
VBGF (25 studies). However, four studies
(Carlson and Baremore 2005; Neer et al. 2005;
Neer and Thompson 2005; Santana and Lessa
2004) also fit their data to alternate growth
functions (Ricker 1979), including the Gompertz
(3 studies), logistic (3 studies), modified VBGF
using a fixed L0 based on a known size-at-birth
(2 studies), Richards (2 studies), and Schnute
(1 study) models (e.g. Winsor 1932; Ricker 1979;
Schnute 1981). In each of these four studies,
goodness of fit was evaluated by one or more
measures other than the coefficients of determi-
nation (r2).
Alternative models to the VBGF have been
demonstrated to provide improved fits or gener-
ate more biologically reasonable representations
222 Environ Biol Fish (2006) 77:211–228
123

of chondrichthyan growth in some studies.
Gompertz and logistic models have been reported
to produce significantly better fits to weight-at-
age estimates than other model forms for Rhin-
optera bonasus (Neer and Thompson 2005) and
Carcharhinus limbatus (Killam and Parsons
1989), respectively. A logistic model fit to total
length-at-age was presented as the most appro-
priate descriptor of growth for Raja binoculata
(Zeiner and Wolf 1993). In some instances (Neer
and Cailliet 2001), alternative growth functions
provided the best fit to observed size-at-age data
but were not reported because of the convenience
and recognition of using the VBGF. Although the
traditional VBGF may be an unsuitable descrip-
tor of growth for species which do not attenuate
toward an asymptote with increasing age, data
quality, sample size, and dispersion of data across
size-classes influence model performance, and
subsequent selection. These examples illustrate
the value of evaluating alternative models.
Recommendations
Although the VBGF may often provide a suitable
description of growth, we encourage the use of
multiple growth models to evaluate the growth
characteristics of a given species. We also rec-
ommend that one should certainly consider con-
venience (i.e., the ability to compare parameters
between sexes and among studies, locations, or
species) and fit (i.e., using numerous growth
functions, statistically examining them, and
choosing those that best fit the actual size-at-age
data) when characterizing growth for a given
species. This approach is needed, considering that
not all species follow the same growth function
and different stages of their lives may undergo
different characteristic growth patterns (Moreau
1987; Prince et al. 1991; Soriano et al. 1992;
Hernandez-Llamas and Ratkowsky 2004). Finally,
we encourage authors to consider and fit alternate
metrics of body size for use with various growth
models. For example, it may be more relevant to
use girth, disc width, and/or weight rather than
total length for angel sharks (Natanson and Cail-
liet 1990) and many species of batoids.
Summary and conclusions
Since validated age and growth estimates are
important for constructing age-structured popu-
lation dynamic models of chondrichthyan fishes,
we have reviewed the field of age and growth on
these fishes, briefly summarizing 28 recent studies
either missed or new since the publication of the
summary chapter on chondrichthyan ageing by
Cailliet and Goldman (2004). We used these re-
cent studies to identify areas where improvements
can be made in describing the characteristics of
ageing structures (both traditional and novel)
utilized to estimate ages of sharks, rays, and
chimaeras. The topics identified that we believe
would be improved through greater consistency
include the: (1) terminology used to describe
growth features, promoting the use of the terms
bands and band pairs; (2) methods used to both
verify and validate age estimates from chondri-
chthyan calcified structures, especially edge and
marginal increment analyses, and including sta-
tistical analyses; (3) the functions used to produce
and interpret growth model parameters, stressing
the incorporation of size at birth (L0); and (4) use
of multiple functions to characterize chondri-
chthyan growth, age at maturity, and longevity.
Finally, we also strongly urge chondrichthyan
agers to consult, review and incorporate estab-
lished and novel methods used in age and growth
studies of other organisms, including bony fishes
(e.g. Campana 2001; Panfili et al. 2002).
Acknowledgements We dedicate this paper to all ourgraduate students and colleagues who have made it pos-sible for us to keep up with the studies of fish age andgrowth, especially those who helped generate and evaluateageing techniques. We really appreciate the efforts of JohnCarlson and Ken Goldman in putting together the slate ofsymposium speakers (and contributors to this volume) atthe Joint Meeting of Ichthyologists and Herpetologists andAmerican Elasmobranch Society Annual Meeting in 2005entitled ‘‘Age and Growth of Chondrichthyan Fishes: NewMethods, Techniques, and Analyses’’ in Tampa, Florida,6–11 July, 2005. We appreciate the constructive commentson this manuscript by Colin Simpfendorfer, Jack Musickand several other anonymous reviewers. We acknowledgeJohn Carlson, Ivy Baremore, Malcolm Francis, and C.O.Maolagain for allowing us to use their figures. This studywas supported by funds from NOAA/NMFS to theNational Shark Research Consortium.
Environ Biol Fish (2006) 77:211–228 223
123
References
Aasen O (1963) Length and growth of the porbeagle(Lamna nasus, Bonnaterre) in the North West Atlan-tic. Rep Norwegian Fish Mar Investig 13(6):20–37
Anderson JR, Morison AK, Ray D (1992) Age and growthof the Murray cod, Maccullochella peeli (Perciformes:Percichthyidae), in the Lower Murray-Darling Basin,using thin-sectioned otoliths. Aust J Mar Freshw Res43:983–1013
Andrews AH, Cailliet GM, Coale KH (1999) Age andgrowth of the Pacific grenadier (Coryphaenoides ac-rolepis) with age estimate validation using an im-proved radiometric ageing technique. Can J FishAquat Sci 56:1339–1350
AndrewsAH, Burton EJ, Kerr LA, Cailliet GM, CoaleKH,Lundstrom CC, Brown TA (2005) Bomb radiocarbonand lead-radium disequilibria in otoliths of bocacciorockfish (Sebastes paucispinis): a determination of ageand longevity for a difficult-to-age fish. Proceedings ofthe 3rd international symposium on otolith researchand application. Marine Freshw Res 56:517–528
Ardizzone, D, Cailliet GM, Natanson LJ, Andrews AH,Kerr LA, Brown TA (2006) Application of bombradiocarbon chronologies to shortfin mako (Isurusoxyrinchus) age validation. In: Carlson JK, GoldmanKJ (eds) Age and growth of chondrichthyan fishes:new methods, techniques and analyses. Special Vol-ume from symposium of the American ElasmobranchSociety, July 2005. Environ Biol Fish (in press)
Baker TT, Lafferty R, Quinn II TJ (1991) A generalgrowth model for mark-recapture data. Fish Res11:257–281
Beamish RJ, Fournier DA (1981) A method for comparingthe precision of a set of age determinations. Can JFish Aquat Sci 38:982–983
von Bertalanffy L (1934) Untersuchungen ueber die Ges-etzlichkeit des Wachstums. Wilhelm Roux’ ArchEntwick Organ 131:613–652
von Bertalanffy L (1938) A quantitative theory of organicgrowth (inquiries on growth laws II). Hum Biol10:181–213
von Bertalanffy L (1960) Principles and theory of growth.In: Wowinski WW (ed) Fundamental aspects ofnormal and malignant growth. Elsevier, Amsterdam,pp 137–259
Beverton RJH (1954) Notes on the use of theoreticalmodels in the study of the dynamics of exploited fishpopulations. United States Fishery Laboratory,Beaufort, North Carolina, Miscellaneous Contribu-tion (2), 159 pp
Beverton RJH, Holt SJ (1957) On the dynamics ofexploited fish populations. United Kingdom Ministryof Agriculture and Fisheries, Fisheries Investigations(Series 2) 19, 533 pp
Bowker AH (1948) A test for symmetry in contingencytables. J Am Stat Assoc 43:572–574
Branstetter S, Musick JA (1994) Age and growth estimatesfor the sand tiger in the northwestern Atlantic ocean.Trans Am Fish Soc 123:242–254
Burnham KP, Anderson DR (2002) Model selection andmultimodel inference: a practical information-theo-retic approach, 2nd edn. Springer-Verlag, New York,488 pp
Cailliet GM, Goldman KJ (2004) Age determination andvalidation in chondrichthyan fishes. In: Carrier J,Musick JA, Heithaus MR (eds) Biology of sharks andtheir relatives. CRC Press LLC, Boca Raton, FL, pp399–447
Cailliet GM, Martin LK, Kusher D, Wolf P, Welden BA(1983) Techniques for enhancing vertebral bands inage estimation of California elasmobranchs. In: PrinceED, Pulos LM (eds) Proceedings international work-shop on age determination of oceanic pelagic fishes:tunas, billfishes, sharks. NOAA Tech. Rep. NMFS 8,pp 157–165
Cailliet GM, Natanson LJ, Welden BA, Ebert DA (1985)Preliminary studies on the age and growth of thewhite shark, Carcharodon carcharias, using vertebralbands. S Calif Acad Sci Mem 9:49–60
Cailliet GM, Yudin KG, Tanaka S, Taniuchi T (1990)Growth characteristics of two populations of Mustelusmanazo from Japan based upon cross-readingsof vertebral bands. In: Pratt HL Jr, Gruber SH,Taniuchi T (eds) Elasmobranchs as living resources:advances in the biology, ecology, systematics, and thestatus of the fisheries. NOAA Technical Report (90),pp 167–176
Cailliet GM, Mollet HF, Pittenger GG, Bedford D,Natanson LJ (1992) Growth and demography of thepacific angel shark (Squatina californica), based upontag returns off California. Aust J Mar Freshw Res43:1313–1330
Campana SE (2001) Accuracy, precision, and qualitycontrol in age determination, including a review of theuse and abuse of age validation methods. J Fish Biol59:197–242
Campana SE, Annand CM, McMillan JI (1995) Graphicaland statistical methods for determining the consis-tency of age determinations. Trans Am Fish Soc124:131–138
Campana SE, Natanson LJ, Myklevoll S (2002) Bombdating and age determination of large pelagic sharks.Can J Fish Aquat Sci 59:450–455
Campana SE, Marks L, Joyce W (2005) The biologyand fishery of shortfin mako sharks (Isurus oxy-rinchus) in Atlantic Canadian waters. Fish Res73:341–352
Campana SE, Jones C, McFarlane GA, Myklevoll S(2006) Bomb dating and age determination of spinydogfish. In: Carlson JK, Goldman KJ (eds) Age andgrowth of chondrichthyan fishes: new methods, tech-niques and analyses. Special Volume from symposiumof the American Elasmobranch Society, July 2005.Environ Biol Fish (in press)
Cappo M, Eden P, Newman SJ, Robertson S (2000) A newapproach to validation of periodicity and timing ofopaque zone formation in the otoliths of eleven spe-cies of Lutjanus from the central Great Barrier Reef.Fish Bull 98:474–488
224 Environ Biol Fish (2006) 77:211–228
123

Carlson JK, Baremore IE (2005) Growth dynamics of thespinner shark (Carcharhinus brevipinna) off the Uni-ted States southeast and Gulf of Mexico coasts: acomparison of methods. Fish Bull 103:280–291
Carlson JK, Cortes E, Bethea DM (2003) Life history andpopulation dynamics of the finetooth shark (Carcha-rhinus isodon) in the northeastern Gulf of Mexico.Fish Bull 101:281–292
Carlson JK, Cortes E, Johnson AG (1999) Age and growthof the blacknose shark, Carcharhinus acronotus, in theeastern Gulf of Mexico. Copeia 1999:684–691
Carrier J, Musick JA, Heithaus MR (eds) (2004) Biologyof sharks and their relatives. CRC Press LLC, BocaRaton, FL, 596 pp
Chang WYB (1982) A statistical method for evaluating thereproducibility of age determination. Can J FishAquat Sci 39:1208–1210
Chen Y, Jackson DA, Harvey HH (1992) A comparisonof von Bertalanffy and polynomial functions inmodelling fish growth data. Can J Aquat Sci 49:1228–1235
Coelho R, Erzini K (2002) Age and growth of the undulateray, Raja undulata, in the Algarve (southern Portu-gal). J Mar Biol Assoc UK 82:987–990
Conrath CL, Gelsleichter J, Musick JA (2002) Age andgrowth of the smooth dogfish (Mustelus canis) in thenorthwest Atlantic Ocean. Fish Bull 100:674–682
Cowley PDS (1997) Age and growth of the blue stingrayDasyatis chrysonota chrysonota from the SouthernEastern Cape coast of South Africa. S Afr J Mar Sci18:31–38
Crabtree RE, Bullock LH (1998) Age, growth, andreproduction of black grouper, Mycteroperca bonaci,in Florida waters. Fish Bull 96:735–753
Cruz-Martinez A, Chiappa-Carrara S, Arenas-Fuentes V(2004) Age and growth of the bull shark, Carcharhi-nus leucas, from southern Gulf of Mexico. E-J NorthwAtlant Fish Sci 35(13):1–10
Dunn OJ (1964) Multiple contrasts using ranks sums.Technometrics 6:241–252
Fabens AJ (1965) Properties and fitting of the von Ber-talanffy growth curve. Growth 29:265–289
Francis MP, Maolagain CO (2000) Age and growth ofghost sharks. Final Research Report for Ministry ofFisheries Research Project GSH1999/01 Objective 1,National Institute of Water and Atmospheric Re-search, pp 1–27
Francis MP, Maolagain CO (2001) Development of ageingtechniques for dark ghost shark (Hydrolagus novaez-elandiae). Final Research Report for Ministry ofFisheries Research Project MOF2000/03C, NationalInstitute of Water and Atmospheric Research, pp 1–18
Francis MP, Maolagain CO (2004) Feasibility of ageingpale ghost sharks (Hydrolagus bemisi). Final Re-search Report for Ministry of Fisheries ResearchProject GSH2002/01 Objective 2, National Institute ofWater and Atmospheric Research, pp 1–11
Francis MP, Maolagain CO (2005) Age and growth of theAntarctic skate, (Amblyraja georgiana), in the RossSea. Commission for the Conservation of Antarctic
Marine Living Resources (CCAMLR) Science12:183–194
Gallagher MJ, Nolan CP, Jeal F (2004) Age, growth andmaturity of the commercial ray species from the IrishSea. E-J Northw Atlant Fish Sci 35(10):22
Gamito S (1998) Growth models and their use in ecolog-ical modeling: an application to a fish population. EcolModel 113:83–94
Gedamke T, DuPaul WD, Musick JA (2005) Observationson the life history of the barndoor skate, Dipturuslaevis, on George Bank (western North Atlantic). E-JNorthw Atlant Fish Sci 35(10):13
Goldman KJ (2004) Age and growth of elasmobranchfishes. In: Musick JA, Bonfil R (eds) Elasmobranchfisheries management techniques. Asia Pacific Eco-nomic Cooperation, Singapore, 370 pp, pp 97–132
Goldman KJ, Branstetter S, Musick JA (2006) A re-examination of the age and growth of sand tigersharks, Carcharias taurus, in the western NorthAtlantic: the importance of ageing protocols and useof multiple back-calculation techniques. In: CarlsonJK, Goldman KJ (eds) Special volume from sympo-sium of the American Elasmobranch Society, July2005. Environ Biol Fish (in press)
Goldman KJ, Musick JA (2006) Growth and maturity ofsalmon sharks in the eastern and western North Pa-cific, with comments on back-calculation methods.Fish Bull 104:278–292
Goosen AJJ, Smale MJ (1997) A preliminary study of ageand growth of the smoothhound shark Mustelusmustelus (Triakidae). S Afr J Mar Sci 18:85–91
Gulland JA (1983) Fish stock assessment. A manual ofbasic methods. FAO/Wiley Ser Food Agric 1:86–97
Guthery FS, Brennan LA, Peterson MJ, Lusk JJ (2005)Information theory in wildlife science: critique andviewpoint. J Wildlife Manage 69(2):457–465
Haddon M (2001) Chapter 8: Growth of individuals. In:Modeling and quantitative measures in fisheries.Chapman and Hall/CRC, Boca Raton, FL, pp 187–246
Hayashi Y (1976) Studies on the growth of the red tilefishin the east China Sea – 1. A foundational consider-ation for age determination from otoliths. Bull JpnSoc Sci Fish 42(11):1237–1242
Henderson AC, Arkhipkin AI, Chtcherbich JN (2004)Distribution, growth and reproduction of the white-spotted skate Bathyraja albomaculata (Norman, 1937)around the Falkland Islands. E-J Northw Atlant FishSci 35(1):1–10
Hernandez-Lllamas A, Ratkowsky DA (2004) Growth offishes, crustaceans and molluscs: estimation of the vonBertalanffy, Logistic, Gompertz and Richards curvesand a new growth model. Mar Ecol Prog Ser 282:237–244
Hilborn R, Walter CJ (1992) Quantitative fisheries stockassessment: choice, dynamics and uncertainty. Chap-man and Hall, New York, 570 pp
Hoenig JM, Morgan MJ, Brown CA (1995) Analyzingdifferences between two age determination methodsby tests of symmetry. Can J Fish Aquat Sci 52:364–368
Environ Biol Fish (2006) 77:211–228 225
123