Embed Size (px)
Citation preview
Acute Communicable Disease Control Program
Special Studies Report
2010
Los Angeles County Department of Public Health
Public Health Laurene Mascola, MD, MPH Chief, Acute Communicable Disease Control Program
Table of Contents
Page i
Acute Communicable Disease Control 2010 Special Studies Report
ACDC SPECIAL STUDIES REPORT 2010
TABLE OF CONTENTS Disease Surveillance, Trends, & Summaries: Botulism Case Report Summary, 2010 ......................................................................................................... 1 David Dassey, MD, MPH Dengue Surveillance, Los Angeles County, 2009-2010 ............................................................................... 3 Van Ngo, MPH; Heather Maynard The Incidence and Clinical Presentation of Herpes Zoster Among African American and White Youths Under Age 20 Years, Antelope Valley, California, 2002-2008 ...................................................................... 9 Amanuel Hussien, MSc; Christina Jackson, MPH; Rachel Civen, MD, MPH Meningococcal Disease Trends in Los Angeles County, 1995-2008 ......................................................... 15 Van Ngo, MPH; Rachel Civen, MD, MPH Varicella Active Surveillance Project, 2009 Surveillance Summary ........................................................... 21 Christina Jackson, MPH; Rachel Civen, MD, MPH Healthcare-Associated Infections: Carbapenem-Resistant Klebsiella Pneumoniae (CRKP) Surveillance, Los Angeles County, June-December 2010 ........................................................................................................................................... 25 Patricia Marquez, MPH; Dawn Terashita, MD, MPH Viral Hepatitis Transmission at a Pain clinic ............................................................................... To be added Elizabeth Bancroft, MD, SM Infectious Disease Incidents/Clusters/Outbreaks: Hepatitis B Outbreak in An Assisted Living Facility .................................................................................... 31 Elizabeth Bancroft, MD, SM; Susan Hathaway, RN, PHN, MPH Invasive Group A Streptococcus Outbreak in a Skilled Nursing Facility, Los Angeles County 2010 ......... 35 Elizabeth Bancroft, MD, SM Nation-Wide Outbreak of Salmonella Enteriditis Associated with Contaminated Eggs .............................. 39 Curtis Croker, MPH; Rita Bagby, RN, MSN; Roshan Reporter, MD, MPH Public Health System, Policies, & Practice: Disease Reporting Practices and Attitudes Among Community Clinic Association of Los Angeles County (CCALAC) Providers, 2010 ....................................................................................... 43 Alan Wu, MPH Ecstasy Overdose at New Year’s Eve Rave—Los Angeles, California 2010 ............................................. 51 Laurene Mascola, MD, MPH; David Dassey, MD, MPH; Stella Fogleman, RN, MSN/MPH; Leonard Paulozzi, MD; and Caitlin Reed, MD Engaging Early Childhood Educators and Parents with a Fotonovela Intervention to Prevent Infectious Disease. ....................................................................................................................................... To be added Elaine Waldman
Table of Contents Page ii
Acute Communicable Disease Control 2010 Special Studies Report
Evaluating the Los Angeles County Public Health Urgent Disease Reporting System .............................. 57 Amber Zelenay, MPH Evaluating the Utility of School Absenteeism Data, 2009-2010 Influenza Season..................................... 61 Cheryl Faustino, MPH; Patricia Araki, MPH; Emily Kajita, MS, MPH; Megan Jones, MPH; and Bessie Hwang, MD, MPH Patients, Healthcare Workers and Varicella Screening: An Argument for Hospital Policy Change ........... 67 Dawn Terashita, MD, MPH; L’Tanya English, RN, MPH Vaccine Preventable Disease & Vaccination: Examination of a Unique Pertussis Epidemic in Los Angeles County ........................................ To be added Ekaterina Gee, MPH, Vi Nguyen, MPH, Idriss Fassassi, MPH, Eva Weinstein, MPH, Marifi Pulido, MPH, PhD, Alvin Nelson El Amin, MD, MPH, Duli Kodagoda, MPH The Impact of an East Coast Mumps Outbreak on Los Angeles County ................................... To be added Vi Nguyen, MPH, Alvin Nelson El Amin, MD, MPH, Duli Kodagoda, MPH
Botulism Case Report Summary, 2010
Page 1
Acute Communicable Disease Control 2010 Special Studies Report
BOTULISM CASE REPORT SUMMARY, 2010
David Dassey, MD, MPH
Five suspected botulism cases were reported in 2010 in Los Angeles County and only one was confirmed; this excludes infant botulism cases. The confirmed case was a male injection drug user with a recent history of subcutaneous injection of black tar heroin. He had no acute wounds noted on admission and no recent consumption of suspicious foods, but did give a history of recent skin popping. Type A botulinum toxin was detected in serum, confirming the diagnosis of wound botulism. He recovered after treatment with antitoxin. An elderly female developed progressive descending paralysis and ophthalmoplegia and was diagnosed with Guillain-Barré syndrome (GBS), Miller-Fisher variant. When she failed to respond clinically to treatment with intravenous immune globulin, her physician consulted Public Health to rule out botulism. There was no history of recent wounds or consumption of suspicious foods. Antitoxin was authorized and administered, without improvement. Tests on serum, gastric, and stool specimens showed no evidence for botulism. The final diagnosis was GBS. A young male presented with descending weakness and difficulty with speech and swallowing. He gave no history of recent injections, wounds, or suspicious food items. Trivalent antitoxin was administered after collection of serum, gastric, and stool specimens, all of which were negative for indicators of botulism. The patient responded to plasmapheresis with return of lost motor functions, making the diagnosis of GBS, Miller-Fisher variant. A homeless middle age male injection drug user complained of neck pain and weakness, trouble swallowing, and weakness in both arms; he also gave a history of a boil on his arm. On examination he had cellulitis of the neck. Although Public Health authorized release of botulinum antitoxin, his physician withheld its administration after noticing clinical response to antibiotic treatment of the cellulitis. No clinical specimens were submitted to the Public Health Laboratory (PHL), and the patient made a full recovery. Another elderly female was reported as a possible case of botulism after presenting with ophthalmoplegia and areflexia. Antitoxin was not administered, but tests were performed on stool, which was negative on culture and toxin screen. The final diagnosis was viral meningitis. The PHL was consulted regarding identification of an anaerobic Gram positive rod from a culture obtained during a gall bladder operation. The patient had no neurological symptoms or findings whatsoever. The submitting laboratory made the presumptive identification of Clostridium sporogenes, a non-toxigenic organism. The PHL showed the organism to be negative for toxin production by culture and mouse bioassay, and negative by polymerase chain reaction for any toxin genes, confirming the preliminary identity. The California Infant Botulism Program reported four confirmed Los Angeles County cases of infant botulism in infants ranging from seven weeks to seven months of age. Three were female; two were Hispanic white, one was non Hispanic white, and one was Asian. There were three cases with type A intoxication and one case with type B. In 2010, the Centers for Disease Control and Prevention (CDC) initiated a research study nationwide titled “Use of an Investigational New Drug, Heptavalent Equine-Based Botulinum Antitoxin (IND 6,7.50). Heptavalent botulinum antitoxin (H-BAT) consists of equine-derived antibody to the seven known botulinum toxin types (A-G). It replaces bivalent (AB) and monovalent (E) antitoxins previously used for treatment in the US. State and local public health agencies, along with the treating physicians, are monitoring the clinical efficacy and adverse events associated with this product.
Botulinum antitoxin for treatment of naturally occurring noninfant botulism is available only from CDC. BabyBIG (botulism immune globulin) remains available for infant botulism through the California Infant
Botulism Case Report Summary, 2010 Page 2
Acute Communicable Disease Control 2010 Special Studies Report
Botulism Treatment and Prevention Program. BabyBIG is an orphan drug that consists of human-derived botulism antitoxin antibodies and is approved by FDA for the treatment of infant botulism types A and B.
Dengue Surveillance
Page 3
Acute Communicable Disease Control 2010 Special Studies Report
DENGUE SURVEILLANCE, LOS ANGELES COUNTY 2009-2010
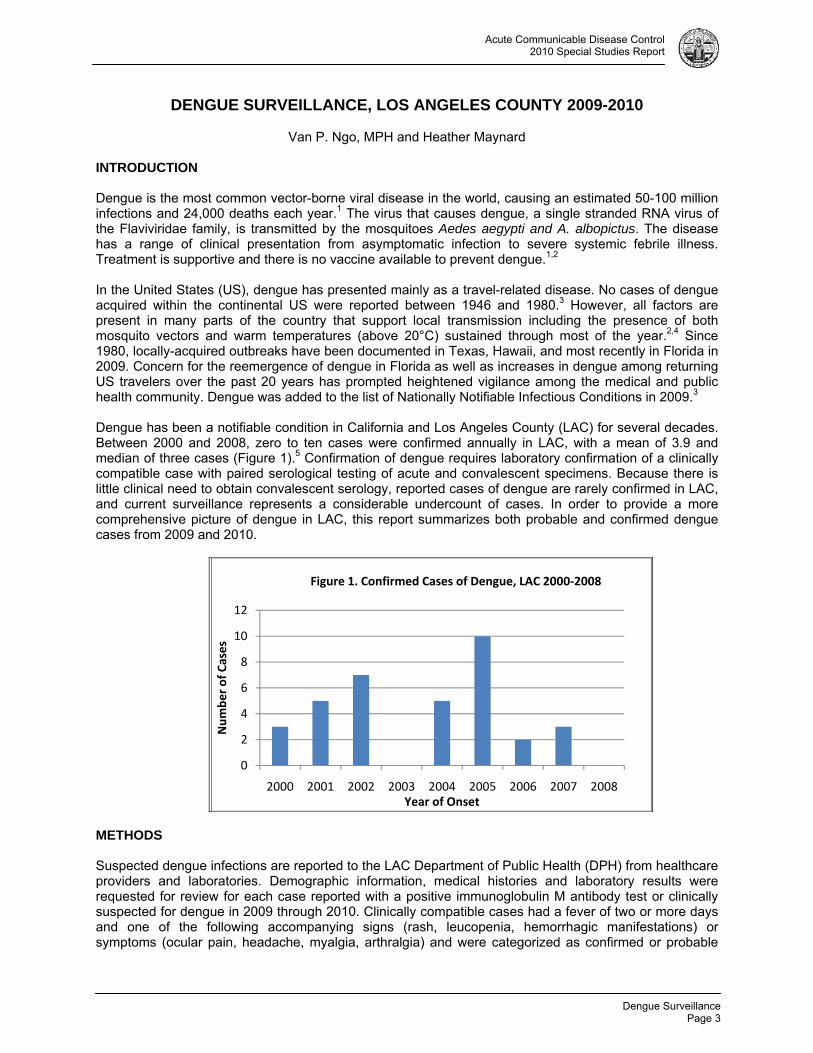
Van P. Ngo, MPH and Heather Maynard INTRODUCTION Dengue is the most common vector-borne viral disease in the world, causing an estimated 50-100 million infections and 24,000 deaths each year.1 The virus that causes dengue, a single stranded RNA virus of the Flaviviridae family, is transmitted by the mosquitoes Aedes aegypti and A. albopictus. The disease has a range of clinical presentation from asymptomatic infection to severe systemic febrile illness. Treatment is supportive and there is no vaccine available to prevent dengue.1,2 In the United States (US), dengue has presented mainly as a travel-related disease. No cases of dengue acquired within the continental US were reported between 1946 and 1980.3 However, all factors are present in many parts of the country that support local transmission including the presence of both mosquito vectors and warm temperatures (above 20°C) sustained through most of the year.2,4 Since 1980, locally-acquired outbreaks have been documented in Texas, Hawaii, and most recently in Florida in 2009. Concern for the reemergence of dengue in Florida as well as increases in dengue among returning US travelers over the past 20 years has prompted heightened vigilance among the medical and public health community. Dengue was added to the list of Nationally Notifiable Infectious Conditions in 2009.3 Dengue has been a notifiable condition in California and Los Angeles County (LAC) for several decades. Between 2000 and 2008, zero to ten cases were confirmed annually in LAC, with a mean of 3.9 and median of three cases (Figure 1).5 Confirmation of dengue requires laboratory confirmation of a clinically compatible case with paired serological testing of acute and convalescent specimens. Because there is little clinical need to obtain convalescent serology, reported cases of dengue are rarely confirmed in LAC, and current surveillance represents a considerable undercount of cases. In order to provide a more comprehensive picture of dengue in LAC, this report summarizes both probable and confirmed dengue cases from 2009 and 2010.
METHODS Suspected dengue infections are reported to the LAC Department of Public Health (DPH) from healthcare providers and laboratories. Demographic information, medical histories and laboratory results were requested for review for each case reported with a positive immunoglobulin M antibody test or clinically suspected for dengue in 2009 through 2010. Clinically compatible cases had a fever of two or more days and one of the following accompanying signs (rash, leucopenia, hemorrhagic manifestations) or symptoms (ocular pain, headache, myalgia, arthralgia) and were categorized as confirmed or probable
0
2
4
6
8
10
12
2000 2001 2002 2003 2004 2005 2006 2007 2008
Number of Cases
Year of Onset
Figure 1. Confirmed Cases of Dengue, LAC 2000‐2008
Dengue Surveillance Page 4
Acute Communicable Disease Control 2010 Special Studies Report
according to the CDC’s 2009 and 2010 requirements for laboratory evidence supporting dengue, as detailed in Table 1.
.Table 1. CDC Case Definitions for Dengue 2009 2010
Confirmed Demonstration of a ≥4 fold change in immunoglobulin M (IgM) or immunoglobulin G (IgG) antibody titers in paired serum samples
Seroconversion from negative to positive for IgM antibody in paired serum samples OR Demonstration of a ≥4 fold rise in IgG antibody titer in paired samples
Probable A positive IgM antibody test on a single serum specimen
Dengue-specific IgM antibodies present in serum with a P/N ration ≥2
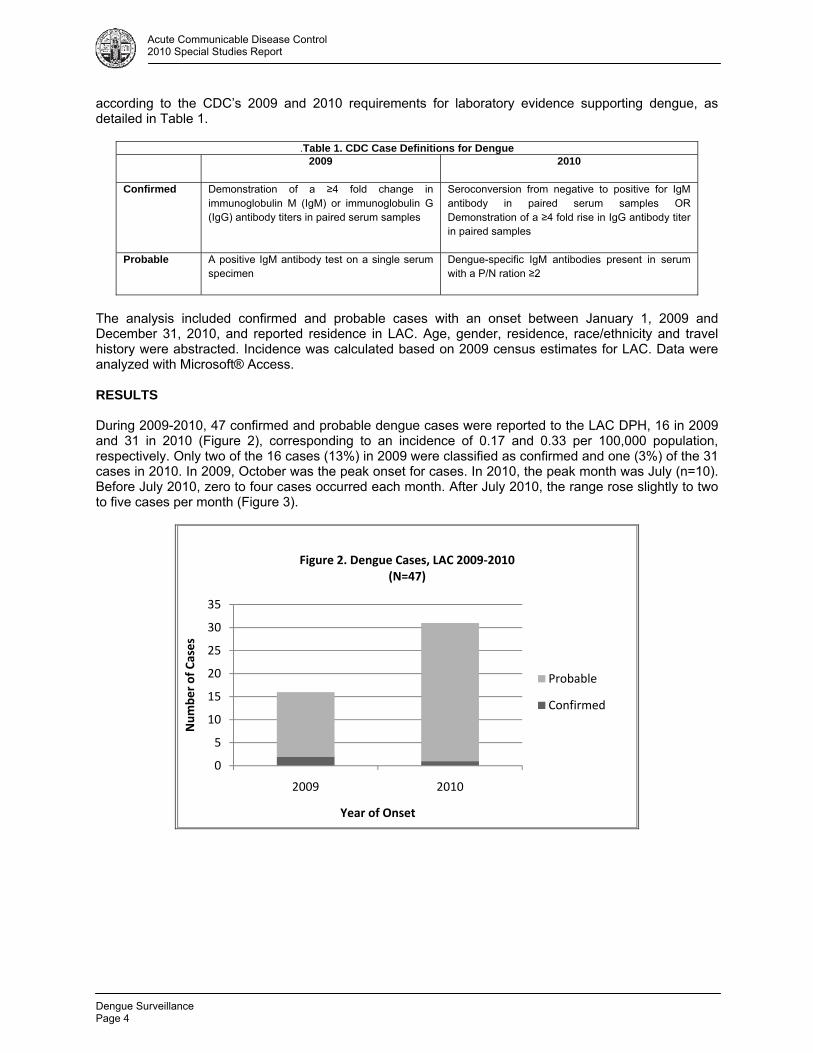
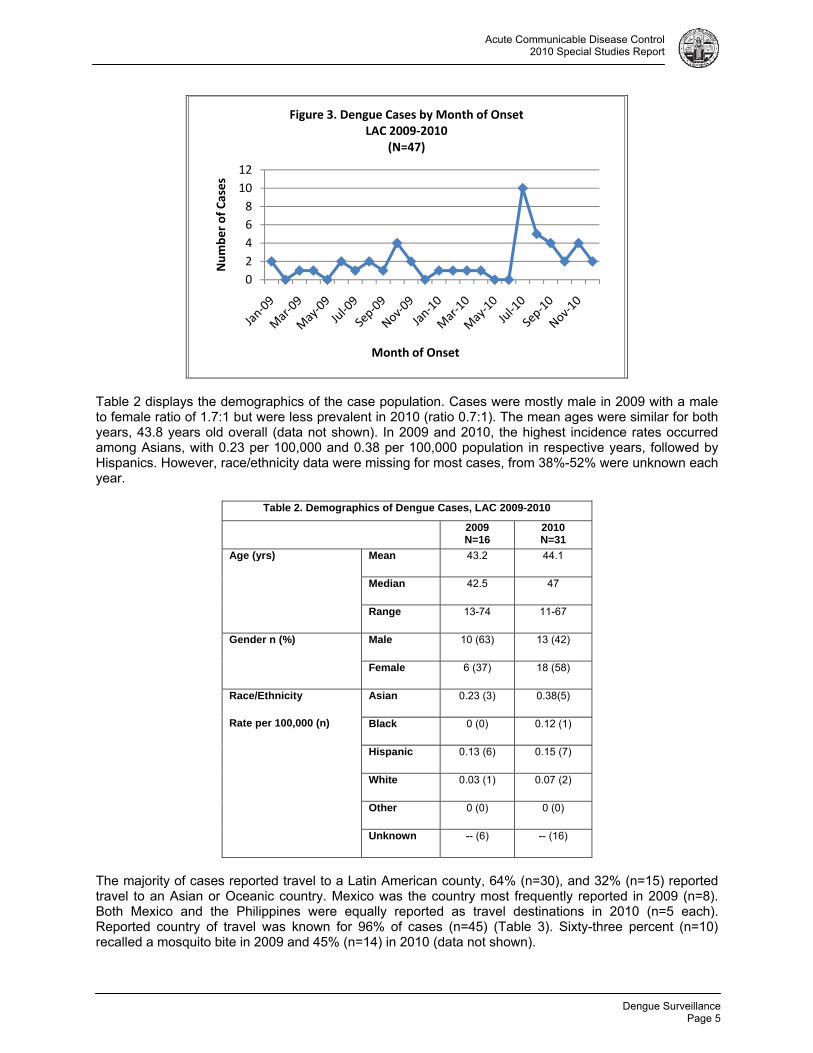
The analysis included confirmed and probable cases with an onset between January 1, 2009 and December 31, 2010, and reported residence in LAC. Age, gender, residence, race/ethnicity and travel history were abstracted. Incidence was calculated based on 2009 census estimates for LAC. Data were analyzed with Microsoft® Access. RESULTS During 2009-2010, 47 confirmed and probable dengue cases were reported to the LAC DPH, 16 in 2009 and 31 in 2010 (Figure 2), corresponding to an incidence of 0.17 and 0.33 per 100,000 population, respectively. Only two of the 16 cases (13%) in 2009 were classified as confirmed and one (3%) of the 31 cases in 2010. In 2009, October was the peak onset for cases. In 2010, the peak month was July (n=10). Before July 2010, zero to four cases occurred each month. After July 2010, the range rose slightly to two to five cases per month (Figure 3).
0
5
10
15
20
25
30
35
2009 2010
Number of Cases
Year of Onset
Figure 2. Dengue Cases, LAC 2009‐2010(N=47)
Probable
Confirmed
Dengue Surveillance
Page 5
Acute Communicable Disease Control 2010 Special Studies Report
Table 2 displays the demographics of the case population. Cases were mostly male in 2009 with a male to female ratio of 1.7:1 but were less prevalent in 2010 (ratio 0.7:1). The mean ages were similar for both years, 43.8 years old overall (data not shown). In 2009 and 2010, the highest incidence rates occurred among Asians, with 0.23 per 100,000 and 0.38 per 100,000 population in respective years, followed by Hispanics. However, race/ethnicity data were missing for most cases, from 38%-52% were unknown each year.
Table 2. Demographics of Dengue Cases, LAC 2009-2010
2009 N=16
2010 N=31
Age (yrs) Mean 43.2 44.1
Median 42.5 47
Range 13-74 11-67
Gender n (%) Male 10 (63) 13 (42)
Female 6 (37) 18 (58)
Race/Ethnicity
Rate per 100,000 (n)
Asian 0.23 (3) 0.38(5)
Black 0 (0) 0.12 (1)
Hispanic 0.13 (6) 0.15 (7)
White 0.03 (1) 0.07 (2)
Other 0 (0) 0 (0)
Unknown -- (6) -- (16)
The majority of cases reported travel to a Latin American county, 64% (n=30), and 32% (n=15) reported travel to an Asian or Oceanic country. Mexico was the country most frequently reported in 2009 (n=8). Both Mexico and the Philippines were equally reported as travel destinations in 2010 (n=5 each). Reported country of travel was known for 96% of cases (n=45) (Table 3). Sixty-three percent (n=10) recalled a mosquito bite in 2009 and 45% (n=14) in 2010 (data not shown).
0
2
4
6
8
10
12
Number of Cases
Month of Onset
Figure 3. Dengue Cases by Month of OnsetLAC 2009‐2010
(N=47)
Dengue Surveillance Page 6
Acute Communicable Disease Control 2010 Special Studies Report
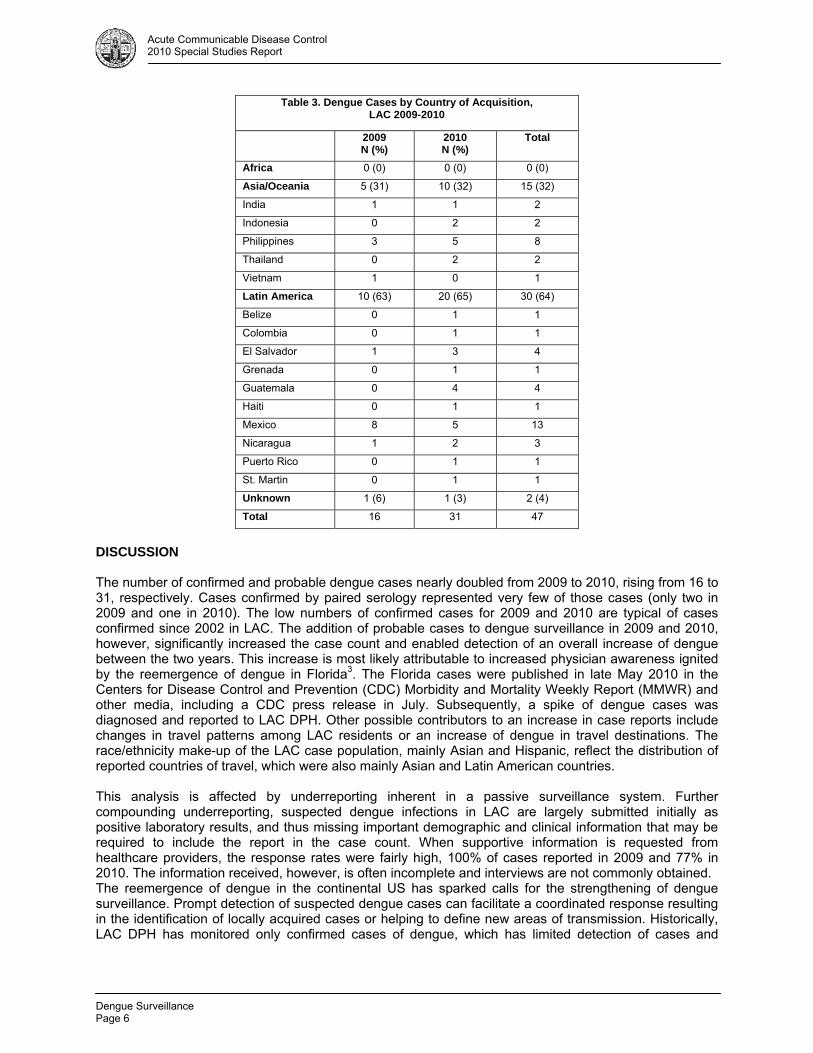
Table 3. Dengue Cases by Country of Acquisition, LAC 2009-2010
2009 N (%)
2010 N (%)
Total
Africa 0 (0) 0 (0) 0 (0)
Asia/Oceania 5 (31) 10 (32) 15 (32)
India 1 1 2
Indonesia 0 2 2
Philippines 3 5 8
Thailand 0 2 2
Vietnam 1 0 1
Latin America 10 (63) 20 (65) 30 (64)
Belize 0 1 1
Colombia 0 1 1
El Salvador 1 3 4
Grenada 0 1 1
Guatemala 0 4 4
Haiti 0 1 1
Mexico 8 5 13
Nicaragua 1 2 3
Puerto Rico 0 1 1
St. Martin 0 1 1
Unknown 1 (6) 1 (3) 2 (4)
Total 16 31 47
DISCUSSION The number of confirmed and probable dengue cases nearly doubled from 2009 to 2010, rising from 16 to 31, respectively. Cases confirmed by paired serology represented very few of those cases (only two in 2009 and one in 2010). The low numbers of confirmed cases for 2009 and 2010 are typical of cases confirmed since 2002 in LAC. The addition of probable cases to dengue surveillance in 2009 and 2010, however, significantly increased the case count and enabled detection of an overall increase of dengue between the two years. This increase is most likely attributable to increased physician awareness ignited by the reemergence of dengue in Florida3. The Florida cases were published in late May 2010 in the Centers for Disease Control and Prevention (CDC) Morbidity and Mortality Weekly Report (MMWR) and other media, including a CDC press release in July. Subsequently, a spike of dengue cases was diagnosed and reported to LAC DPH. Other possible contributors to an increase in case reports include changes in travel patterns among LAC residents or an increase of dengue in travel destinations. The race/ethnicity make-up of the LAC case population, mainly Asian and Hispanic, reflect the distribution of reported countries of travel, which were also mainly Asian and Latin American countries. This analysis is affected by underreporting inherent in a passive surveillance system. Further compounding underreporting, suspected dengue infections in LAC are largely submitted initially as positive laboratory results, and thus missing important demographic and clinical information that may be required to include the report in the case count. When supportive information is requested from healthcare providers, the response rates were fairly high, 100% of cases reported in 2009 and 77% in 2010. The information received, however, is often incomplete and interviews are not commonly obtained. The reemergence of dengue in the continental US has sparked calls for the strengthening of dengue surveillance. Prompt detection of suspected dengue cases can facilitate a coordinated response resulting in the identification of locally acquired cases or helping to define new areas of transmission. Historically, LAC DPH has monitored only confirmed cases of dengue, which has limited detection of cases and
Dengue Surveillance
Page 7
Acute Communicable Disease Control 2010 Special Studies Report
trends. The addition of probable cases to the surveillance case definition enabled the DPH to examine the details of dengue epidemiology in LAC.
REFERENCES 1. Gibbons RV and Vaughn DW. Dengue: an escalating problem. British Medical Journal 2002; 324: 1563-6. 2. Franco C, Hynes NA, Bouri N, and Henderson DA. The dengue threat to the United States. 2010, 8 (3): 273-276. 3. Centers for Disease Control and Prevention. Locally Acquired Dengue-Key West, Florida, 2009-2010. Morbidity and Mortality Weekly Report 2010; 59 (19); 577-581. 4. Gregory CJ. Dengue update for US Clinicians. In It’s a small world after all: dengue and malaria in US residents – Recognizing and treating these mosquito-borne diseases, June 9, 2010. Clinical Outreach and Communication Activity Conference Call, Centers for Disease Control and Prevention, 2010. 5. Los Angeles County Department of Public Health. Annual morbidity report and special studies report. Available at: http://lapublichealth.org/acd/Report.htm. Accessed 4 March 2011.

Dengue Surveillance Page 8
Acute Communicable Disease Control 2010 Special Studies Report
The Incidence and Clinical Presentation of Herpes Zoster
Page 9
Acute Communicable Disease Control 2010 Special Studies Report
THE INCIDENCE AND CLINICAL PRESENTATION OF HERPES ZOSTER AMONG AFRICAN AMERICAN AND WHITE YOUTHS UNDER AGES 20 YEARS,
ANTELOPE VALLEY, CALIFORNIA, 2002-2008
Amanuel Hussien, MSc, Christina Jackson, MPH, Rachel Civen, MD, MPH
BACKGROUND
Herpes zoster (shingles) is an acute cutaneous viral infection caused by the reactivation of varicella-zoster virus (VZV). After primary infection manifested as varicella disease, VZV lays dormant in the dorsal root ganglion until in undergoes local dermatomal reactivation in the form of the herpes zoster (HZ) [1]. Virus reactivation is associated with a decline in cell-mediated immunity due to age or to immunosuppressive illness or treatment [2]. In comparison to adults, HZ occurs infrequently in healthy children and its clinical course has been described as milder and with decreased pain [3,4,5]. However, immunocompromised children may experience similar or more severe symptoms as adults with HZ [6].
In 1995 a childhood varicella vaccination program was initiated in the US [7]. Since that time, the varicella vaccination coverage in Los Angeles County (LAC) has increased from 13.9% in 1996 to 92.2% in 2008 for children 19-35 months [8] while varicella disease morbidity and mortality declined by as much as 90% [9]. In 2000, the Varicella Active Surveillance Project (VASP) of Antelope Valley added HZ surveillance for children and adolescents aged < 20 years to its ongoing varicella surveillance program. Recently published data from VASP describing trends in youth HZ data from 2000 to 2007 showed that the incidence rate (IR) of HZ declined significantly in children <10 years but increased significantly in those 10-19 years. A risk model developed with these data revealed that vaccinated children in the <10 year old age group had significantly less risk of developing HZ than those who had never been vaccinated [10]. This finding is consistent with an earlier study which described a group of children with leukemia who were vaccinated with the live attenuated varicella vaccine and had less clinically severe varicella disease and fewer cases of HZ compared to children with leukemia with a history of wild type (natural) VZV infection [11]. Few epidemiologic studies have explored the relationship between the incidence of HZ and race. The few published reports present data showing that African Americans may have less risk of developing HZ compared to whites [12,13,14]. This report compares the HZ incidence and clinical presentation among African American (AA) and white youths <20 years of age who reside in Antelope Valley (AV), California from 2002 through 2008.
METHODS
Active surveillance for HZ has been conducted in children and adolescents <20 years since January 1, 2000 in AV. Nearly 200 surveillance sites, which include private medical providers, health maintenance organizations (HMOs), hospital emergency rooms, elementary, middle, and high schools, participate. All sites report HZ cases to VASP every two weeks, even if no cases are identified. Two large HMOs report electronically using International Statistical Classification of Disease (ICD9) HZ diagnostic codes on a monthly basis.
A case of HZ was defined as a child with acute onset of a unilateral vesicular rash located in at least one dermatome, diagnosed as herpes zoster by a licensed medical provider within the study period January 1, 2002 to December 31, 2008. History of varicella disease was defined as a clinical diagnosis of varicella during the child’s lifetime regardless of varicella vaccination status; laboratory confirmation of varicella was not required. Varicella disease history was either self-reported by the parent or case as present or not present, or documented in a medical record. Varicella vaccination history was verified on each case using the vaccination record provided by the case, the school, or the medical provider.
Project staff completed a structured telephone interview with each case age 18 and older or the parent/guardian of younger cases to collect detailed demographic and clinical data. If a phone interview was not obtainable, medical records were reviewed. Race/ethnicity designation was identified by the
The Incidence and Clinical Presentation of Herpes Zoster Page 10
Acute Communicable Disease Control 2010 Special Studies Report
parent/guardian or case if age 18 years or older. Cases classified as white included those of both Hispanic and non-Hispanic ethnicity. Cases that were categorized as Asian, American Indian or unknown race/ethnicity were excluded from the analysis due to relatively few reported cases.
Data were entered into Microsoft® Access and data analysis was performed with SAS® 9.2. Only verified HZ cases with rash onset from January 1, 2002 to December 31, 2008 were included in the analysis. Annual HZ incidence rates (IR) by race were calculated using AV 2002-2008 US census data annual estimates as denominators for the AV. The relative risk of acquiring HZ by race was calculated by comparing the IR of HZ among whites compared to AA. The Chi-square test was used to assess statistical significance among variables.
RESULTS
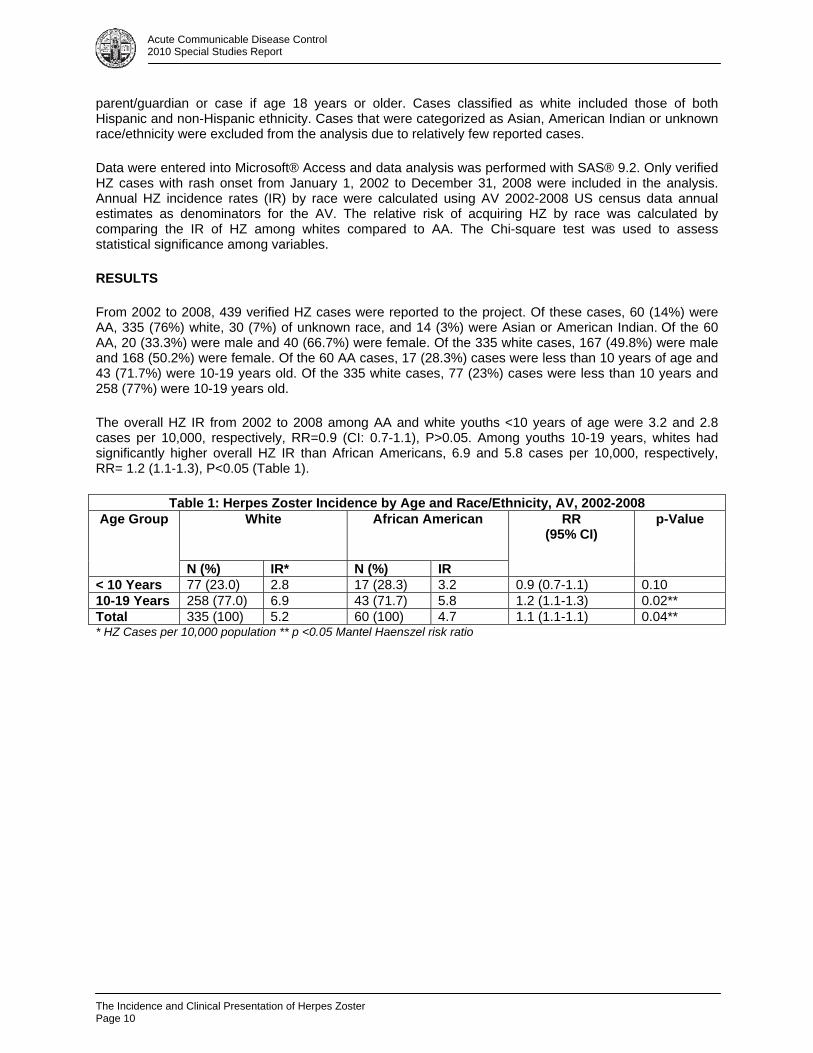
From 2002 to 2008, 439 verified HZ cases were reported to the project. Of these cases, 60 (14%) were AA, 335 (76%) white, 30 (7%) of unknown race, and 14 (3%) were Asian or American Indian. Of the 60 AA, 20 (33.3%) were male and 40 (66.7%) were female. Of the 335 white cases, 167 (49.8%) were male and 168 (50.2%) were female. Of the 60 AA cases, 17 (28.3%) cases were less than 10 years of age and 43 (71.7%) were 10-19 years old. Of the 335 white cases, 77 (23%) cases were less than 10 years and 258 (77%) were 10-19 years old.
The overall HZ IR from 2002 to 2008 among AA and white youths <10 years of age were 3.2 and 2.8 cases per 10,000, respectively, RR=0.9 (CI: 0.7-1.1), P>0.05. Among youths 10-19 years, whites had significantly higher overall HZ IR than African Americans, 6.9 and 5.8 cases per 10,000, respectively, RR= 1.2 (1.1-1.3), P<0.05 (Table 1).
Table 1: Herpes Zoster Incidence by Age and Race/Ethnicity, AV, 2002-2008 Age Group
White African American
RR (95% CI)
p-Value
N (%) IR* N (%) IR
< 10 Years 77 (23.0) 2.8 17 (28.3) 3.2 0.9 (0.7-1.1) 0.1010-19 Years 258 (77.0) 6.9 43 (71.7) 5.8 1.2 (1.1-1.3) 0.02**Total 335 (100) 5.2 60 (100) 4.7 1.1 (1.1-1.1) 0.04*** HZ Cases per 10,000 population ** p <0.05 Mantel Haenszel risk ratio
The Incidence and Clinical Presentation of Herpes Zoster
Page 11
Acute Communicable Disease Control 2010 Special Studies Report
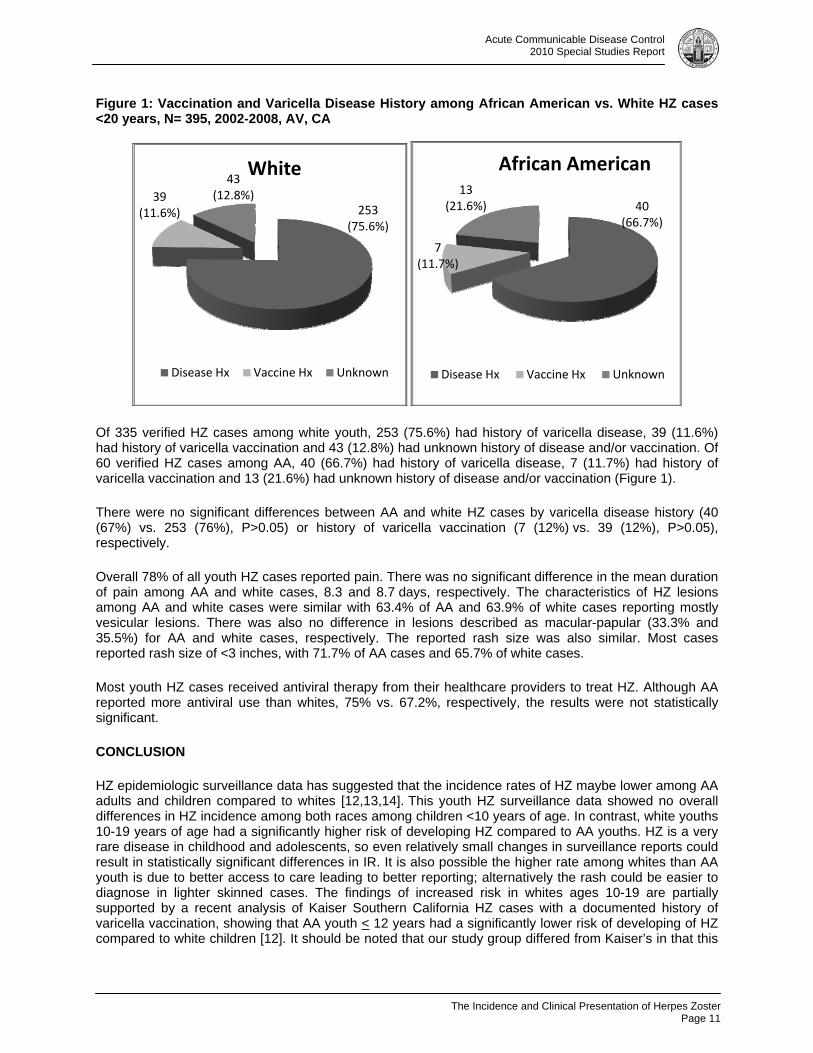
Figure 1: Vaccination and Varicella Disease History among African American vs. White HZ cases <20 years, N= 395, 2002-2008, AV, CA
Of 335 verified HZ cases among white youth, 253 (75.6%) had history of varicella disease, 39 (11.6%) had history of varicella vaccination and 43 (12.8%) had unknown history of disease and/or vaccination. Of 60 verified HZ cases among AA, 40 (66.7%) had history of varicella disease, 7 (11.7%) had history of varicella vaccination and 13 (21.6%) had unknown history of disease and/or vaccination (Figure 1).
There were no significant differences between AA and white HZ cases by varicella disease history (40 (67%) vs. 253 (76%), P>0.05) or history of varicella vaccination (7 (12%) vs. 39 (12%), P>0.05), respectively.
Overall 78% of all youth HZ cases reported pain. There was no significant difference in the mean duration of pain among AA and white cases, 8.3 and 8.7 days, respectively. The characteristics of HZ lesions among AA and white cases were similar with 63.4% of AA and 63.9% of white cases reporting mostly vesicular lesions. There was also no difference in lesions described as macular-papular (33.3% and 35.5%) for AA and white cases, respectively. The reported rash size was also similar. Most cases reported rash size of <3 inches, with 71.7% of AA cases and 65.7% of white cases.
Most youth HZ cases received antiviral therapy from their healthcare providers to treat HZ. Although AA reported more antiviral use than whites, 75% vs. 67.2%, respectively, the results were not statistically significant.
CONCLUSION
HZ epidemiologic surveillance data has suggested that the incidence rates of HZ maybe lower among AA adults and children compared to whites [12,13,14]. This youth HZ surveillance data showed no overall differences in HZ incidence among both races among children <10 years of age. In contrast, white youths 10-19 years of age had a significantly higher risk of developing HZ compared to AA youths. HZ is a very rare disease in childhood and adolescents, so even relatively small changes in surveillance reports could result in statistically significant differences in IR. It is also possible the higher rate among whites than AA youth is due to better access to care leading to better reporting; alternatively the rash could be easier to diagnose in lighter skinned cases. The findings of increased risk in whites ages 10-19 are partially supported by a recent analysis of Kaiser Southern California HZ cases with a documented history of varicella vaccination, showing that AA youth < 12 years had a significantly lower risk of developing of HZ compared to white children [12]. It should be noted that our study group differed from Kaiser’s in that this
253 (75.6%)
39 (11.6%)
43(12.8%)
White
Disease Hx Vaccine Hx Unknown
40 (66.7%)
7 (11.7%)
13 (21.6%)
African American
Disease Hx Vaccine Hx Unknown
The Incidence and Clinical Presentation of Herpes Zoster Page 12
Acute Communicable Disease Control 2010 Special Studies Report
study included both unvaccinated and vaccinated cases whereas Kaiser included only vaccinated cases, and the age group extended to 19 years of age.
No difference was found in the clinical presentation of HZ among AA and white youth. The project team is not aware of any published study comparing the clinical presentation of HZ among AA and white adults or youths. Overall nearly 80 % of young HZ cases <20 years from both races reported moderate to severe pain from HZ lasting 8 days. The reported rash size and the proportion of vesicular lesions were also similar. Although a greater proportion of AA received antiviral therapy, the treatment difference was not significant. The study also found that there was no significant difference in the proportion of AA versus white HZ cases <20 years that had a history of varicella vaccination versus varicella disease.
There are at least two limitations to this study. A relatively small proportion of HZ diagnoses were laboratory-confirmed (approximately 3%). Consistency of reporting of youth HZ among this project’s many surveillance sites may have varied, such that small changes in HZ reports could result in statistically significant differences in incidence.
REFERENCES
1. Hope-Simpson RE. The nature of herpes zoster: long-term study and a new hypothesis. Proc R. Soc Med 1965; 58:9-20.
2. Cohen JI, Brunell PA, Straus SE, Krause PR. Recent advances in varicella-zoster virus infection. Ann Intern Med 1999; 130:922-32.
3. Ragozzino MW, Melton LJ III, Kurland LT, Chu CP, Perry HO. Population-based study of herpes zoster and its sequelae. Medicine (Baltimore) 1982; 61: 310-6.
4. Guess HA, Broughton DD, Melton LJ III, Kurland LT. Epidemiology of herpes zoster in children and adolescents: a population-based study. Pediatrics 1985; 76: 512-517
5. Chidiac C, Bruxelle H, Daures JP, Hoang-Xan T, et al. Characteristics of patients with herpes zoster on presentation to practitioners in France. CID 2001: 33:62-69.
6. Petursson G, Helgason S, Gudmundsson S, Sigurdsson JA. Herpes zoster in children and adolescents. Pediatric Infect Dis J 1998; 17: 905-908.
7. Prevention of Varicella: Recommendations of the Advisory Committee on Immunization Practices (ACIP). MMWR Recomm Rep July 12, 1996/ 45(RR11): 1-25.
8. Advisory Committee on Immunization Practices. http://www.cdc.gov/vaccines/stats-surv/nis/data. Accessed on December 20, 2010.
9. Seward JF, Watson BM, Peterson CL et al. Varicella disease after introduction of varicella vaccine in the United States, 1995-2000. JAMA 2002; 287: 606-611.
10. Civen R, Chaves SS, Jumaan A, Wu H, Mascola L, Gargiullo P and Seward JF. Pediatric Infect Dis J 2009; 28(11):954-9. http://www.ncbi.nlm.nih.gov/pubmed/19536039. Accessed on December 21, 2010.
11. Brunell PA, Taylor-Wiedeman J, Geiser CF, et al. Risk of herpes zoster in children with leukemia: varicella vaccine compared with history of chickenpox. Pediatrics 1986; 77:53-56.
12. Tseng HF, Smith N, Marcy SM, Sy LS, et al. Risk factors of herpes zoster among children immunized with varicella vaccine. Pediatr Infect Dis J 2010;29:1-4.
The Incidence and Clinical Presentation of Herpes Zoster
Page 13
Acute Communicable Disease Control 2010 Special Studies Report
13. Schmader K, George LK, Burchett BM, Pieper CF. Racial and psychosocial risk factors for herpes zoster in the elderly. J of Infect Dis 1998; 178 (Suppl 1):S67-70.
14. Schmader K, George LK, Burchett BM, Pieper CF, Hamilton JD. Racial differences in the occurrence of herpes zoster. J of Infect Dis 1995; 171:701-704.
The Incidence and Clinical Presentation of Herpes Zoster Page 14
Acute Communicable Disease Control 2010 Special Studies Report
Meningococcal Disease Trends
Page 15
Acute Communicable Disease Control 2010 Special Studies Report
MENINGOCOCCAL DISEASE TRENDS IN LOS ANGELES COUNTY, 1995-2008
Van Ngo, MPH and Rachel Civen, MD, MPH BACKGROUND Neisseria meningitidis is an important cause of morbidity and mortality worldwide and a leading cause of bacterial meningitis and septicemia in the United States (US).1 Infection with N. meningitidis in a normally sterile site—invasive meningococcal disease (IMD)—is characterized by sudden onset of fever, headache, stiff neck, petechial rash and lethargy; illness can progress to overwhelming sepsis, shock and death within hours. Despite antibiotic treatment, 10-14% of cases are fatal. Among those who survive, 10-20% have permanent hearing loss, cognitive deficiencies, or loss of limbs.1,2 Of the 13 serogroups of N. meningitidis, almost all invasive meningococcal disease is caused by serogroups A, B, C, Y, and W-135. Two vaccines are available in the US that protect against serogroups A, C, Y, and W-135, but not B.3 Quadrivalent meningococcal polysaccharide vaccine (MPSV4), Menomune®, was licensed in 1981 for use among those ≥2 years old. In 2005, a new quadrivalent meningococcal conjugate vaccine (MCV4), Menactra®, was approved for use in the US. MCV4 is recommended for use in persons aged 2 to 55 years, although the use of MPSV4 is acceptable when MCV4 is not available. The latest approval of Menactra® also includes children as young as 9 months.13 As of 2007, MCV4 is recommended for all adolescents between ages 11-18 years. Routine vaccination is also recommended for college freshman living in dormitories as they are at higher risk for meningococcal disease.4 Suspected cases of IMD are reportable at the local level; confirmed cases are reported to state and national level. Laboratory results indicating the detection of N. meningitidis from a sterile site are also reportable to the California Department of Public Health (CDPH) and Los Angeles County (LAC) Department of Public Health (DPH). The LAC DPH conducts surveillance of meningococcal disease to monitor disease trends and to identify close contacts of cases to ensure prophylaxis is offered and counseling on the symptoms of disease is provided. Antimicrobial chemoprophylaxis of close contacts of sporadic cases remains the primary means for prevention of meningococcal disease. This study describes trends of IMD cases reported to LAC DPH from 1995 through 2008, with focus on changes in age, serogroup, and race/ethnicity distribution. METHODS The cases included in this study had culture-confirmed N. meningitidis from a normally sterile site, consistent with the Centers for Disease Control and Prevention (CDC) case definition were residents of LAC, and had onset of illness between January 1, 1995 and December 31, 2008. Patients diagnosed with meningococcal disease by other laboratory evidence, such as by Gram stain or positive polymerase chain reaction (PCR) testing of sterile material, were excluded as cases of IMD. Suspected cases of IMD were interviewed with a standardized reporting form that includes variables for age, gender, residence, race/ethnicity, outcome, culture site, and date. Information was obtained via case interview and medical record review. LAC Public Health Laboratory performed serogrouping on all available culture isolates. Cases were defined as sporadic if no close contacts were reported with IMD within a 10-day period. Non-sporadic cases were then classified as either co-primary or secondary to another case. An organization-based outbreak is defined as the occurrence of three or more confirmed or probable cases of meningococcal disease of the same serogroup in ≤3 months among persons who have a common affiliation but no close contact with each other.5 Cases with missing outcome information were cross-referenced with death certificate records. If no death certificate was found indicating death, the case was presumed to have survived. Incidence rates were calculated based on LAC population estimates created by the Population Estimates and Projections System (PEPS) provided to the LAC DPH by Los Angeles County Urban Research. To analyze incidence trends through time, cases were grouped into three groups comprised of cases with onsets from 1995-
Meningococcal Disease Trends Page 16
Acute Communicable Disease Control 2010 Special Studies Report
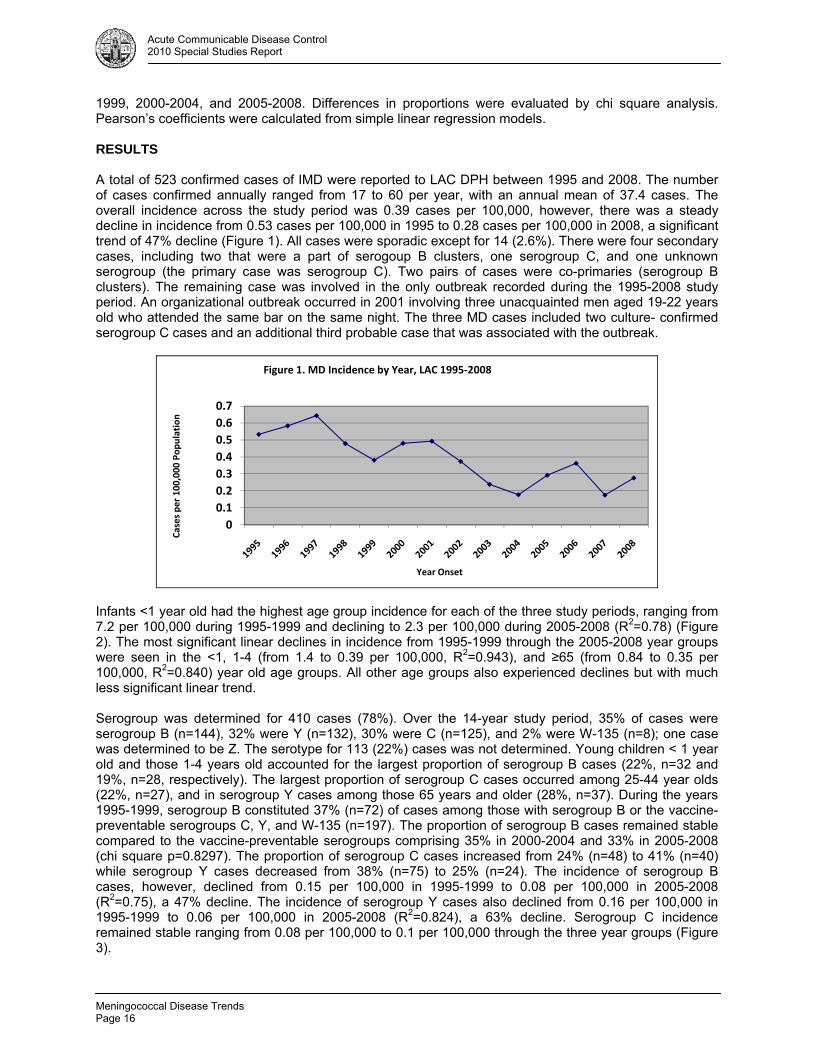
1999, 2000-2004, and 2005-2008. Differences in proportions were evaluated by chi square analysis. Pearson’s coefficients were calculated from simple linear regression models. RESULTS A total of 523 confirmed cases of IMD were reported to LAC DPH between 1995 and 2008. The number of cases confirmed annually ranged from 17 to 60 per year, with an annual mean of 37.4 cases. The overall incidence across the study period was 0.39 cases per 100,000, however, there was a steady decline in incidence from 0.53 cases per 100,000 in 1995 to 0.28 cases per 100,000 in 2008, a significant trend of 47% decline (Figure 1). All cases were sporadic except for 14 (2.6%). There were four secondary cases, including two that were a part of serogoup B clusters, one serogroup C, and one unknown serogroup (the primary case was serogroup C). Two pairs of cases were co-primaries (serogroup B clusters). The remaining case was involved in the only outbreak recorded during the 1995-2008 study period. An organizational outbreak occurred in 2001 involving three unacquainted men aged 19-22 years old who attended the same bar on the same night. The three MD cases included two culture- confirmed serogroup C cases and an additional third probable case that was associated with the outbreak.
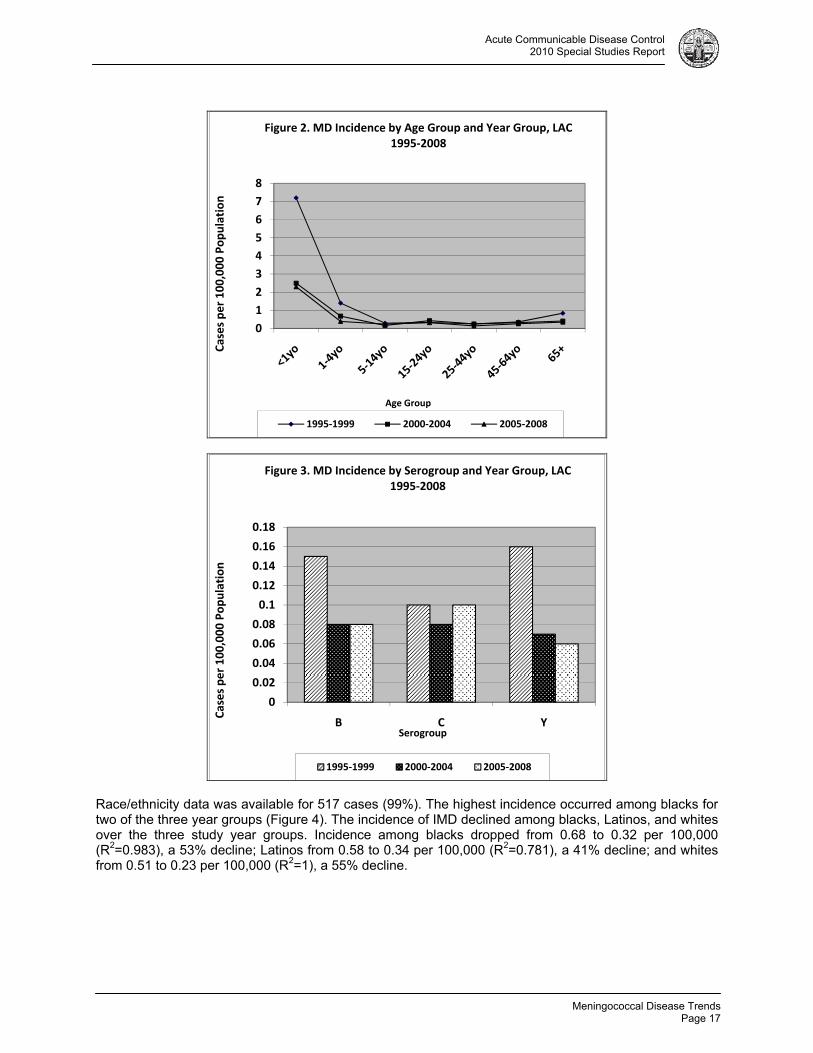
Infants <1 year old had the highest age group incidence for each of the three study periods, ranging from 7.2 per 100,000 during 1995-1999 and declining to 2.3 per 100,000 during 2005-2008 (R2=0.78) (Figure 2). The most significant linear declines in incidence from 1995-1999 through the 2005-2008 year groups were seen in the <1, 1-4 (from 1.4 to 0.39 per 100,000, R2=0.943), and ≥65 (from 0.84 to 0.35 per 100,000, R2=0.840) year old age groups. All other age groups also experienced declines but with much less significant linear trend. Serogroup was determined for 410 cases (78%). Over the 14-year study period, 35% of cases were serogroup B (n=144), 32% were Y (n=132), 30% were C (n=125), and 2% were W-135 (n=8); one case was determined to be Z. The serotype for 113 (22%) cases was not determined. Young children < 1 year old and those 1-4 years old accounted for the largest proportion of serogroup B cases (22%, n=32 and 19%, n=28, respectively). The largest proportion of serogroup C cases occurred among 25-44 year olds (22%, n=27), and in serogroup Y cases among those 65 years and older (28%, n=37). During the years 1995-1999, serogroup B constituted 37% (n=72) of cases among those with serogroup B or the vaccine-preventable serogroups C, Y, and W-135 (n=197). The proportion of serogroup B cases remained stable compared to the vaccine-preventable serogroups comprising 35% in 2000-2004 and 33% in 2005-2008 (chi square p=0.8297). The proportion of serogroup C cases increased from 24% (n=48) to 41% (n=40) while serogroup Y cases decreased from 38% (n=75) to 25% (n=24). The incidence of serogroup B cases, however, declined from 0.15 per 100,000 in 1995-1999 to 0.08 per 100,000 in 2005-2008 (R2=0.75), a 47% decline. The incidence of serogroup Y cases also declined from 0.16 per 100,000 in 1995-1999 to 0.06 per 100,000 in 2005-2008 (R2=0.824), a 63% decline. Serogroup C incidence remained stable ranging from 0.08 per 100,000 to 0.1 per 100,000 through the three year groups (Figure 3).
0
0.1
0.2
0.3
0.4
0.5
0.6
0.7
Cases per 100,000 Population
Year Onset
Figure 1. MD Incidence by Year, LAC 1995‐2008
Meningococcal Disease Trends
Page 17
Acute Communicable Disease Control 2010 Special Studies Report
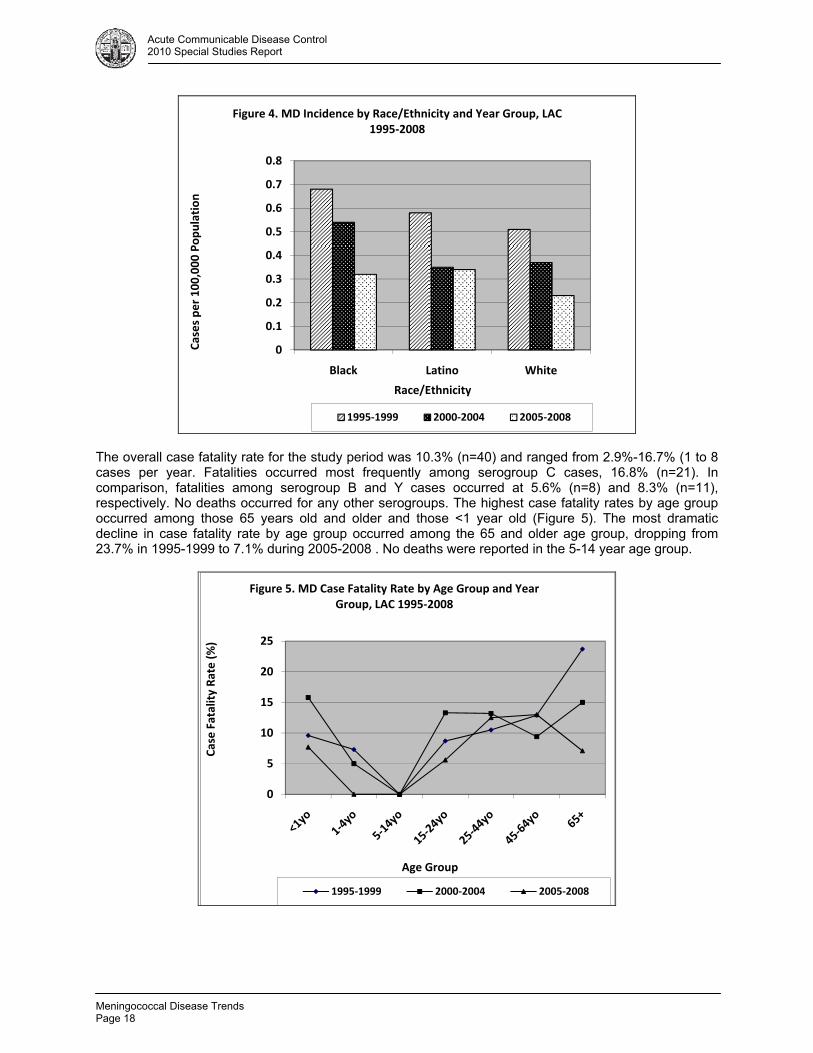
Race/ethnicity data was available for 517 cases (99%). The highest incidence occurred among blacks for two of the three year groups (Figure 4). The incidence of IMD declined among blacks, Latinos, and whites over the three study year groups. Incidence among blacks dropped from 0.68 to 0.32 per 100,000 (R2=0.983), a 53% decline; Latinos from 0.58 to 0.34 per 100,000 (R2=0.781), a 41% decline; and whites from 0.51 to 0.23 per 100,000 (R2=1), a 55% decline.
0
1
2
3
4
5
6
7
8
Cases per 100,000 Population
Age Group
Figure 2. MD Incidence by Age Group and Year Group, LAC 1995‐2008
1995‐1999 2000‐2004 2005‐2008
0
0.02
0.04
0.06
0.08
0.1
0.12
0.14
0.16
0.18
B C Y
Cases per 100,000 Population
Serogroup
Figure 3. MD Incidence by Serogroup and Year Group, LAC 1995‐2008
1995‐1999 2000‐2004 2005‐2008
Meningococcal Disease Trends Page 18
Acute Communicable Disease Control 2010 Special Studies Report
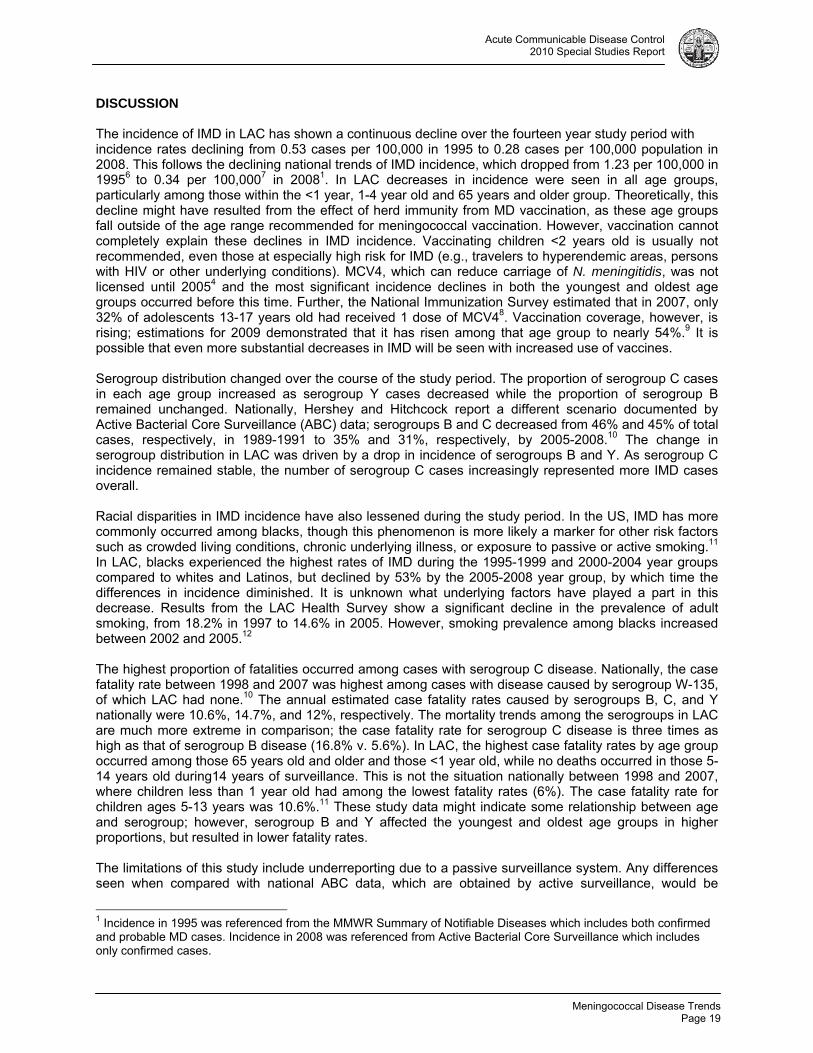
The overall case fatality rate for the study period was 10.3% (n=40) and ranged from 2.9%-16.7% (1 to 8 cases per year. Fatalities occurred most frequently among serogroup C cases, 16.8% (n=21). In comparison, fatalities among serogroup B and Y cases occurred at 5.6% (n=8) and 8.3% (n=11), respectively. No deaths occurred for any other serogroups. The highest case fatality rates by age group occurred among those 65 years old and older and those <1 year old (Figure 5). The most dramatic decline in case fatality rate by age group occurred among the 65 and older age group, dropping from 23.7% in 1995-1999 to 7.1% during 2005-2008 . No deaths were reported in the 5-14 year age group.
0
0.1
0.2
0.3
0.4
0.5
0.6
0.7
0.8
Black Latino White
Cases per 100,000 Population
Race/Ethnicity
Figure 4. MD Incidence by Race/Ethnicity and Year Group, LAC 1995‐2008
1995‐1999 2000‐2004 2005‐2008
0
5
10
15
20
25
Case Fatality Rate (%)
Age Group
Figure 5. MD Case Fatality Rate by Age Group and Year Group, LAC 1995‐2008
1995‐1999 2000‐2004 2005‐2008
Meningococcal Disease Trends
Page 19
Acute Communicable Disease Control 2010 Special Studies Report
DISCUSSION The incidence of IMD in LAC has shown a continuous decline over the fourteen year study period with incidence rates declining from 0.53 cases per 100,000 in 1995 to 0.28 cases per 100,000 population in 2008. This follows the declining national trends of IMD incidence, which dropped from 1.23 per 100,000 in 19956 to 0.34 per 100,0007 in 20081. In LAC decreases in incidence were seen in all age groups, particularly among those within the <1 year, 1-4 year old and 65 years and older group. Theoretically, this decline might have resulted from the effect of herd immunity from MD vaccination, as these age groups fall outside of the age range recommended for meningococcal vaccination. However, vaccination cannot completely explain these declines in IMD incidence. Vaccinating children <2 years old is usually not recommended, even those at especially high risk for IMD (e.g., travelers to hyperendemic areas, persons with HIV or other underlying conditions). MCV4, which can reduce carriage of N. meningitidis, was not licensed until 20054 and the most significant incidence declines in both the youngest and oldest age groups occurred before this time. Further, the National Immunization Survey estimated that in 2007, only 32% of adolescents 13-17 years old had received 1 dose of MCV48. Vaccination coverage, however, is rising; estimations for 2009 demonstrated that it has risen among that age group to nearly 54%.9 It is possible that even more substantial decreases in IMD will be seen with increased use of vaccines. Serogroup distribution changed over the course of the study period. The proportion of serogroup C cases in each age group increased as serogroup Y cases decreased while the proportion of serogroup B remained unchanged. Nationally, Hershey and Hitchcock report a different scenario documented by Active Bacterial Core Surveillance (ABC) data; serogroups B and C decreased from 46% and 45% of total cases, respectively, in 1989-1991 to 35% and 31%, respectively, by 2005-2008.10 The change in serogroup distribution in LAC was driven by a drop in incidence of serogroups B and Y. As serogroup C incidence remained stable, the number of serogroup C cases increasingly represented more IMD cases overall. Racial disparities in IMD incidence have also lessened during the study period. In the US, IMD has more commonly occurred among blacks, though this phenomenon is more likely a marker for other risk factors such as crowded living conditions, chronic underlying illness, or exposure to passive or active smoking.11 In LAC, blacks experienced the highest rates of IMD during the 1995-1999 and 2000-2004 year groups compared to whites and Latinos, but declined by 53% by the 2005-2008 year group, by which time the differences in incidence diminished. It is unknown what underlying factors have played a part in this decrease. Results from the LAC Health Survey show a significant decline in the prevalence of adult smoking, from 18.2% in 1997 to 14.6% in 2005. However, smoking prevalence among blacks increased between 2002 and 2005.12 The highest proportion of fatalities occurred among cases with serogroup C disease. Nationally, the case fatality rate between 1998 and 2007 was highest among cases with disease caused by serogroup W-135, of which LAC had none.10 The annual estimated case fatality rates caused by serogroups B, C, and Y nationally were 10.6%, 14.7%, and 12%, respectively. The mortality trends among the serogroups in LAC are much more extreme in comparison; the case fatality rate for serogroup C disease is three times as high as that of serogroup B disease (16.8% v. 5.6%). In LAC, the highest case fatality rates by age group occurred among those 65 years old and older and those <1 year old, while no deaths occurred in those 5-14 years old during14 years of surveillance. This is not the situation nationally between 1998 and 2007, where children less than 1 year old had among the lowest fatality rates (6%). The case fatality rate for children ages 5-13 years was 10.6%.11 These study data might indicate some relationship between age and serogroup; however, serogroup B and Y affected the youngest and oldest age groups in higher proportions, but resulted in lower fatality rates. The limitations of this study include underreporting due to a passive surveillance system. Any differences seen when compared with national ABC data, which are obtained by active surveillance, would be
1 Incidence in 1995 was referenced from the MMWR Summary of Notifiable Diseases which includes both confirmed and probable MD cases. Incidence in 2008 was referenced from Active Bacterial Core Surveillance which includes only confirmed cases.
Meningococcal Disease Trends Page 20
Acute Communicable Disease Control 2010 Special Studies Report
understated. The use of only confirmed cases in this analysis may also produce an underestimate of the burden of disease. As many as 10%-37% of cases reported each year to LAC DPH during 1995-2008 were classified as probable and thus excluded from this analysis. The grouping together of multiple years was done to enable a cleaner analysis of multiple variables, however, details of peaks and dips in incidence in specific years may have been missed. The specific reasons for decline in IMD incidence in LAC from 1995-2008 remain unknown. However, changes in the distribution of cases among different age groups, serogroups, and race/ethnicity groups are clearly seen. These changes may be a result of changes in high risk behaviors and environments in these groups. LAC has seen an overall decrease in smoking prevalence. Emphasis on hand hygiene or respiratory hygiene in disease prevention over the years could also be impacting transmission of bacteria and decreasing colonization among portions of the population. With increased adherence to the childhood vaccine schedule, as evidenced by National Immunization Survey estimates, a greater decline in IMD in the adolescent age group as well as other age groups is expected due to herd immunity. Even with increased vaccination coverage, current available vaccines do not protect against serogroup B disease and have limited use for specific age groups and those with underlying risk factors for invasive IMD; they also have no impact on the rate of colonization or carriage. Therefore, clinicians must remain vigilant in suspecting invasive meningococcal meningitis and bacteremia as an important cause of life threatening bacterial meningitis and sepsis. REFERENCES
1. Rosenstein, NE, Perkins BA, Stephens DS, Popovic T, Hughes JM. Meningococcal disease. N Engl J Med 2001; 344: 1378-88.
2. Heymann DL. Control of communicable disease manual. 19th ed. Washington: American Public Health Association; 2008.
3. Harrison LH. Epidemiological profile of meningococcal disease in the United States. Clin Infec Dis 2010; 50: S37-S44.
4. Poland, Gregory A. Prevention of meningococcal disease: current use of polysaccharide and conjugate vaccines. Clin Infect Dis 2010; 50: S45-S53.
5. Centers for Disease Control and Prevention. Prevention and Control of Meningococcal Disease. 2005; 54 (RR07); 1-21.
6. Centers for Disease Control and Prevention. Summary of Notifiable Diseases, United States, 1995. MMWR Morb Mortal Wkly Rep 1996; 44(53);1-96.
7. Centers for Disease Control and Prevention. 2009. Active Bacterial Core Surveillance Report, Emerging Infections Program Network, Neisseria meningitidis, 2008.
8. Centers for Disease Control and Prevention. Vaccination coverage among adolescents aged 13-17 years – United States, 2007. MMWR Morb Mortal Wkly Rep 2008; 57(40);1100-1103.
9. Centers for Disease Control and Prevention. National, state, and local area vaccination coverage among adolescents aged 13-17 years – United States, 2009. MMWR Morb Mortal Wkly Rep 2010; 59(32);1018-1023.
10. Hershey JH and Hitchcock W. Epidemiology and meningococcal serogroup distribution in the United States. Clin Pediatr 2010; 49 (6); 519-524.
11. Cohn AC, MacNeil JR, Harrison LH, et al. Changes in Neisseria meningitidis disease epidemiology in the United States, 1998-2007; implications for prevention of meningococcal disease. Clin Infect Dis. Jan 15 2010; 50(2): 184-191.
12. Los Angeles County Department of Public Health, Office of Health Assessment and Epidemiology, LA Health Trends: Smoking Prevalence Among Los Angeles County Adults, August 2006. Available at: http://lapublichealth.org/wwwfiles/ph/hae/ha/TobaccoTrends05.pdf. Accessed 19 November 2010.
13. American Academy of Family Physicians. FDA Approves Meningococcal Vaccine for Infants, Toddlers. Available at: http://www.aafp.org/online/en/home/publications/news/news-now/health-of-the-public/20110427meningvaccine.html.
Varicella Active Surveillance Project
Page 21
Acute Communicable Disease Control 2010 Special Studies Report
VARICELLA ACTIVE SURVEILLANCE PROJECT 2009 SURVEILLANCE SUMMARY
Christina Jackson, MPH; Rachel Civen, MD, MPH
BACKGROUND In September 1994, the Los Angeles County (LAC) Department of Public Health (DPH) entered into a cooperative agreement with the Centers for Disease Control and Prevention (CDC) to establish active surveillance for varicella disease in Antelope Valley (AV), California. Project objectives included obtaining population-based varicella incidence rates, to examine the clinical presentation of varicella, and to evaluate the transmission of varicella and varicella vaccine distribution practices. Baseline information on disease incidence and varicella vaccine coverage levels by age group, and the impact of increasing vaccine coverage have been collected since 1995. The 2009 surveillance data represents the 15th year of varicella, the 10th year of pediatric and adolescent (< 19 years) herpes zoster (HZ), and the fourth year of adult HZ (50 years and older) surveillance. Additionally, in September 2009, the Varicella Active Surveillance Project (VASP) was awarded funding from the American Recovery and Reinvestment Act (ARRA) to carry out a case control study titled, “Incremental Effectiveness of the 2-dose Varicella Vaccination Regimen among Children aged 1 to 18 years,” designed to assess added prevention benefits of two varicella vaccinations versus one versus no prior vaccination. In addition to collaborating with the West Philadelphia VASP site, VASP Antelope Valley has partnered with the Kaiser Permanente Research Division of Southern California in the recruitment of age matched vaccinated controls from the Kaiser Permanente vaccination registry, who are residents of the AV. This report summarizes highlights of varicella and HZ surveillance in 2009. METHODS VASP conducted active surveillance for varicella disease and HZ from more than 300 surveillance sites. Surveillance sites included public and private schools and day care centers with enrollments of 12 or more children; public health clinics, hospitals, skilled nursing facilities, private practice physicians and health maintenance organizations (HMO) offices; employers with 500 or more employees; correctional facilities; and others agencies likely to identify cases of varicella or herpes zoster. All sites submitted the surveillance logs of varicella and herpes zoster to VASP on a biweekly basis. If the log was not submitted, project staff contacted individual surveillance sites for follow-up. Vaccine providers submitted the Varivax® and Zostavax® immunization reports on a monthly basis, reporting total doses by age group. Additionally, Merck, manufacturer of both vaccines, reported the total vaccine distribution to providers within the AV for both vaccines. Receipt of varicella vaccine was confirmed in one of three ways: 1) interviewees checked the vaccine immunization record at the time of the telephone case interview, 2) medical office staff checked the medical record, or 3) the school the child attended was contacted. If the varicella vaccination could not be documented, parental recall was utilized. Susceptible household contacts of varicella or HZ cases less than 20 years of age are re-interviewed four weeks after the initial contact to identify additional cases. Case Definitions:
A case of varicella was defined as illness with acute onset of a diffuse papulovesicular rash without other known cause that is diagnosed and/or reported by a licensed healthcare provider, school nurse, or parent.
o A verified varicella case was the above case definition and had a completed case report which validated the diagnosis of varicella and resided in the AV. A case report was considered complete if an interview was carried out by the parent or guardian of a reported varicella case under age 18 years old or with a reported varicella case who was 18 years and older or medical chart review validated the diagnosis of varicella.
o A probable varicella case was reported to VASP but did not have a completed case report.
Varicella Active Surveillance Project Page 22
Acute Communicable Disease Control 2010 Special Studies Report
o A breakthrough varicella case was defined as a verified varicella case which occured more than 42 days after varicella vaccination.
A case of HZ was defined as a unilateral vesicular rash in a dermatomal distribution, diagnosed by a
licensed healthcare provider. o A verified HZ case met the case definition of HZ and had a completed case report or a
medical chart review which validated the diagnosis of HZ. o A probable HZ case was reported by a licensed medical provider but did not have a
completed case report or the medical chart was unobtainable for review. A structured telephone interview was conducted with each varicella or HZ case or their parent/guardian to collect detailed demographic, clinical, varicella vaccine history and to determine if there were additional cases or susceptible contacts within the household. If a telephone interview was not obtainable, medical records were reviewed for all potential cases. Cases of varicella and HZ were excluded if they lived outside the surveillance area, if the reported case did not have the diagnosis of varicella or HZ that was consistent with the established case definitions noted above, or had an alternative diagnosis. In HZ cases aged 50 years and older, the presence of post herpetic neuralgia (PHN) or persistent pain or discomfort associated with HZ lasting at least three months was evaluated in all cases where interviews were conducted. If pain was present at the time of the initial interview, a follow-up interview was conducted at four months after the herpes zoster rash had healed to assess the duration of the associated pain or discomfort. In 2009, as in prior years, completeness of varicella reporting was estimated using a two-source capture-recapture method. To calculate incidence rates, census estimates were obtained through the DPH for each corresponding year. Aggressive manual and computer verification of data ensured quality control. Data were analyzed in collaboration with investigators from the CDC. SUMMARY The 2009 varicella surveillance data reflects three years of data collection since the endorsement of a second varicella vaccine to the childhood vaccine schedule by the Advisory Committee of Immunization Practices (ACIP) and American Academy of Pediatrics for children four to six years in 2006. In 2009, the total varicella vaccine doses (Varivax® and MMRV) administered by surveillance sites declined by 17% with 14,076 doses reported in 2009 compared to 17,016 doses in 2008; however, the number of doses administered in 2009 represents a significant increase (77.3%) from the 7,937 total doses reported in 2006. As in past years, the one-to-two year old group had the largest proportion of vaccine doses administered, 4,877 doses (34.6%), followed by five year olds with 2,274 (16.2%) doses, 13-19 year olds with 1,490 (15.6%) doses, three to four year olds with 2,009 (14.3%) doses, 10-12 year olds with 1,881 (13.4%) doses and six to nine year olds with 1,502 (10.7%) of total doses, respectively. The overall varicella incidence rates have continued to decline from 1.9 cases per 1,000 in 2005 to 0.5 cases per 1,000 in 2009. In 2009, the highest varicella incidence was seen among both infants less than one year and children 10-14 years, with identical incidence rates of 1.9 cases per 1,000, followed by those five to nine years old at 1.6 cases per 1,000. Both infants less than one year and children ages one to four years old showed slight increases in incidence compared to 2008, reporting 1.7 and 1.9 cases per 1,000 in the less than one year age group and 1.3 and 1.4 cases per 1,000 in the one to four year age group in respective surveillance years. Children in all other age groups showed continued declines in incidence from 2008 to 2009. When comparing varicella incidence by race/ethnicity, Hispanics had the highest incidence of varicella at 0.6 cases per 1,000, followed by blacks (rates previously noted), whites (0.3 per 1,000) and Asian Pacific Islanders/American Indians (0.2 cases per 1,000). However, declines in incidence were also noted among all racial/ethnic groups from 2008 to 2009, most notably within blacks, whose rates declined from 0.8 cases per 1,000 in 2008 to 0.5 cases per 1,000 in 2009. The proportion of breakthrough (BT) varicella cases has shown steady increases since 2000, with 16.8% of all verified varicella cases classified as BT in 2000 compared to 66.4% in 2008. Although the proportion of

Varicella Active Surveillance Project
Page 23
Acute Communicable Disease Control 2010 Special Studies Report
BT cases declined in 2009 to 60.8%, the increasing trend in BT varicella disease remains important. In 2009, 30 (28.0%) of the total BT cases (107) received two doses of varicella vaccine, an increase from the 18 (13%) total BT varicella cases reported in 2008 and 11 (6%) cases in 2007. It will be essential to continue the documentation of varicella cases that have completed the recommended two dose schedule. The total number of varicella outbreaks and cases per outbreak declined significantly in 2009, with only two outbreaks documented compared to six outbreaks in 2008 with six and seven varicella cases per outbreak documented in respective years. In addition to fewer outbreaks in 2009, the mean outbreak duration was the shortest since 2003 (both 31 days) compared to 50 days in 2008. The proportion of BT cases in each outbreak in 2009 was 50%, slightly lower than those of the prior three years, which ranged from 58.5 to 73.5%. The clinical presentation of varicella continued to be a mild acute infection. In 2009, the largest proportion of cases reported <50 lesions (59.3%), compared to earlier surveillance years, followed by 50-249 lesions (37.0%) and those reporting 250-500 lesions (3.4%). No cases reported greater than 500 lesions in 2009, the first time since initialization of surveillance. As is 2008, there were no reports of hospitalized varicella cases, compared to one hospitalized varicella case in a previously healthy 14 year old male in 2007 and two immunocompromised adult females in 2006.
The total verified pediatric and adolescent HZ cases increased in 2009 compared to 2008, but the numbers were comparable to earlier surveillance years. In 2009, there was an 8% increase in verified HZ cases compared to 2008, with 67 and 62 verified cases reported from respective years. The increase in HZ case reports was most notable in children 10-19 years, with 50 and 60 cases reported in 2008 and 2009, respectively. In 2009, HZ incidence rates continued to decrease among children less than ten years but increased for those 10-19 years of age. An incidence rate of 14 HZ cases per 100,000 and 93 HZ cases per 100,000 population were documented in the less than ten year and 10-19 year old age groups, respectively, in 2009. During the ten years of pediatric and adolescent HZ surveillance, trends of increasing incidence in the 10-19 year old age group and decreasing incidence in the less than ten year old age group have become evident; however, incidence by race/ethnicity has remained stable.
In 2009, 422 verified cases of HZ in individuals aged 50 years and greater were documented among surveillance sites, 15% more that the 367 verified HZ cases documented in 2008. Consistent with prior surveillance years, HZ incidence increased incrementally within the ten year age groups. Individuals aged 70 years and older had the highest age-specific incidence, 6.5 cases per 1,000, followed by those 60-69 years, 5.3 cases per 1,000 and those 50-59 years, 3.5 cases per 1,000. These incidence rates were in general lower than that of published studies derived from administrative data sources, however, significantly higher than rates from the West Philadelphia VASP site. The clinical presentation of HZ cases was consistent with the established description; over 90% of cases reported a unilateral vesicular rash in a single dermatome. In 2009, using a pain scale of 1-10, 82% of verified cases reported pain; of those 38% reported severe pain, rated 9 -10. HZ cases reported a mean and median pain score of 8. Both the percentage of cases reporting pain and reported mean/median pain score has remained consistent throughout the four years of surveillance. Five (1%) HZ cases were hospitalized for HZ in 2009, each case reporting rash in multiple dermatomes and severe pain. Nineteen complications following HZ rash onset were reported by cases and were verified through medical chart abstraction; bacterial superinfections and ocular complications occurred most frequently, with 3% and 1%, respectively. In 2009, 22% of cases reported post-herpetic neuralgia (PHN); however, the proportion of cases reporting PHN has ranged from a high of 21% in 2006 to a low of 16% in 2007. During the four years of adult HZ surveillance, among the 1,223 (81%) adult HZ cases who completed telephone interviews and could be followed-up at four months after rash heal date, 288 (19%) reported PHN. In 2006, Zostavax® was approved by the FDA as the first shingles prevention vaccine for individuals age 60 years and older. In 2008, Zostavax® usage was documented in two HMOs (Kaiser Permanente Medical group and High Desert Medical Group) which report vaccine doses electronically. Vons Pharmacies began submitting electronic reports documenting Zostavax® administration in 2009. As expected, the greatest
Varicella Active Surveillance Project Page 24
Acute Communicable Disease Control 2010 Special Studies Report
proportion of vaccine usage was in the 60-69 year old age group. In 2011, with the completion of five years of HZ surveillance, the project plans on analyzing the combined years of surveillance data to estimate HZ incidence rates to determine the proportion of HZ cases that experience PHN and the factors that may be associated with developing PHN.
CRKP Surveillance
Page 25
Acute Communicable Disease Control 2010 Special Studies Report
CARBAPENEM-RESISTANT KLEBSIELLA PNEUMONIAE (CRKP) SURVEILLANCE LOS ANGELES COUNTY, JUNE - DECEMBER 2010
Patricia Marquez, MPH and Dawn Terashita, MD, MPH
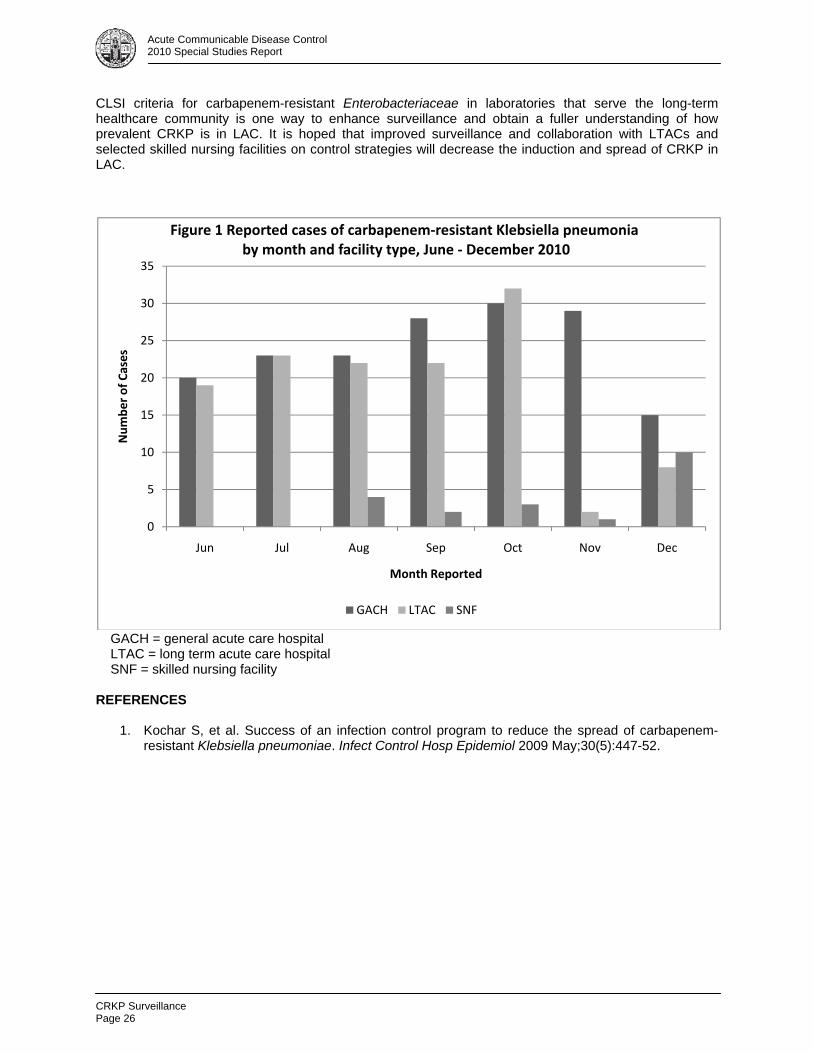
Carbapenems are often the last line of defense in the treatment of severe infections caused by multi-drug resistant gram negative pathogens.1 Misuse of antibiotics and selection pressure has led to an increased reliance on the use of carbapenems for infections caused by Enterobacteriaceae, the family of Gram-negative bacilli that includes such clinically relevant genera as Klebsiella, Acinetobacter, and Pseudomonas. Originally seen only in New York and New Jersey, carbapenem resistant Klebsiella pneumoniae (CRKP) has emerged in healthcare settings of other regions of the US where it was previously not found. The Los Angeles County Department of Public Health (DPH) established CRKP as a laboratory reportable disease on June 1, 2010. Criteria for reporting included any isolate of Klebsiella pneumoniae showing resistance to carbapenems using 2009 Clinical and Laboratory Standards Institute (CLSI) criteria or the modified Hodge test. Isolates testing positive for extended spectrum beta-lactamase production but not carbapenem resistance were excluded from analysis. Laboratories were asked to report all susceptibility laboratory results when submitting cases to DPH. Cases were defined based on the Centers for Disease Control and Prevention (CDC) National Healthcare Safety Network (NHSN) LabID module criteria. Positive specimens for cases that had already been reported were considered recurrent if the specimen was collected 14 or more days after previous positive lab report. Individuals with specimens collected on or before the 3rd day after admission were considered community-onset; those with specimens collected on the 4th day post admission or later were considered healthcare-onset. From June to December 2010 a total of 439 cases were reported to DPH; of these 350 were confirmed as CRKP; nine remain under investigation and are not included in this review. Of the 102 acute care facilities in LAC, 50 (49%) facilities and one large regional laboratory that mainly serves the skilled nursing facility population reported cases. All eight long-term acute care facilities (LTAC) in LAC reported cases, accounting for nearly half of all cases reported (172, 49%) (Figure 1). Of the cases reported by acute care facilities, 124 (35%) were admitted to hospital from skilled nursing facilities. Females (193, 56%) accounted for a larger proportion of cases reported than males. The average age of CRKP cases was 73 years, with a range of 1-102 years. The one-year-old case demonstrated the New Delhi metallo-beta lactamase (NDM-1) and was the first such K. pneumoniae reported in LAC. This individual had recently travelled to and received medical care in Pakistan prior to hospitalization in the LAC facility. Positive specimen sources included urine (105, 45%), sputum (70, 30%), wounds (22, 9%) and blood (19, 8%). One hundred twenty-eight cases were positive for at least one other organism in the CRKP positive specimen. Of the 128 cases, 24 had a total of three organisms present in the specimen tested. The most frequently identified co-infections were Pseudomonas aeruginosa, vancomycin-resistant Enterococcus, and Acinetobacter baumannii. Complete admission date and date of specimen collection information were available for 172 cases. The average length of hospitalization from admission to first CRKP positive test was 18 days with a range of 0-247 days. Cases with a longer length of hospitalization were generally reported from LTAC facilities. Forty-two cases (24%) had their positive specimen collected on the day of admission. The majority of cases (110, 64%) had their positive specimen collected four or more days after admission, and would be considered to have healthcare-onset infections by NHSN definitions. The remaining 20 cases with specimens collected within the first three days after admission were considered community-onset. CDC laboratory surveillance of LAC hospitals indicated CRKP was previously identified very sporadically in the area, and its prevalence in our healthcare community was unknown. This passive surveillance system has identified more cases than expected in such a short period of time. Improving knowledge of
CRKP Surveillance Page 26
Acute Communicable Disease Control 2010 Special Studies Report
CLSI criteria for carbapenem-resistant Enterobacteriaceae in laboratories that serve the long-term healthcare community is one way to enhance surveillance and obtain a fuller understanding of how prevalent CRKP is in LAC. It is hoped that improved surveillance and collaboration with LTACs and selected skilled nursing facilities on control strategies will decrease the induction and spread of CRKP in LAC.
GACH = general acute care hospital LTAC = long term acute care hospital SNF = skilled nursing facility REFERENCES
1. Kochar S, et al. Success of an infection control program to reduce the spread of carbapenem-resistant Klebsiella pneumoniae. Infect Control Hosp Epidemiol 2009 May;30(5):447-52.
0
5
10
15
20
25
30
35
Jun Jul Aug Sep Oct Nov Dec
Number of Cases
Month Reported
Figure 1 Reported cases of carbapenem‐resistant Klebsiella pneumoniaby month and facility type, June ‐ December 2010
GACH LTAC SNF
Viral Hepatitis Transmission
Page 27
Acute Communicable Disease Control 2010 Special Studies Report
VIRAL HEPATITIS TRANSMISSION AT A PAIN CLINC
Elizabeth Bancroft, MD, SM This article will be published in near future.

Viral Hepatitis Transmission Page 28
Acute Communicable Disease Control 2010 Special Studies Report

Viral Hepatitis Transmission
Page 29
Acute Communicable Disease Control 2010 Special Studies Report

Viral Hepatitis Transmission Page 30
Acute Communicable Disease Control 2010 Special Studies Report

Hepatitis B Outbreak
Page 31
Acute Communicable Disease Control 2010 Special Studies Report
HEPATITIS B OUTBREAK IN AN ASSISTED LIVING FACILITY
Elizabeth Bancroft, MD, SM and Susan Hathaway, RN, PHN, MPH BACKGROUND On February 26, 2010, Acute Communicable Disease Control (ACDC) staff of the Los Angeles County (LAC) Department of Public Health (DPH) was notified by a physician of a possible outbreak of hepatitis B at an assisted living facility (ALF). A diabetic resident at the ALF tested positive for acute hepatitis B. The resident was asymptomatic but had elevated liver function tests in January 2010. At that time, there were two other insulin dependent diabetic residents who newly tested positive for hepatitis B. According to the ALF administrator and the attending physician, all three diabetics with newly diagnosed hepatitis B received diabetes care from the same home healthcare agency (HHA) during the incubation period of the acute hepatitis B case. An investigation was conducted by DPH staff to determine the source of the hepatitis B outbreak and control spread of the disease. The investigation was undertaken with the authority of the local health officer (“upon receiving a report made pursuant to reportable diseases or notification by laboratories, the local health officer shall take whatever steps deemed necessary for the investigation and control for the disease, condition or outbreak reported.”)i The investigation consisted of site visits to the ALF, interviews with residents, detailed interviews with staff from the HHA regarding infection control procedures, and laboratory testing. Of note, the HHA stopped servicing the three diabetic residents at the end of January 2010, approximately one month before the cluster was reported to ACDC. CONTEXT The ALF is licensed for 120 residents but at the time of the outbreak the census was 84. The ALF had a staff of 22 who provided assistance with daily living activities which includes meal preparation, housekeeping, laundry, oral medication dispensing, assistance with grooming activities such as bathing, and urine incontinence assistance. The ALF did not employ any registered nurses or licensed vocational nurses; home health agencies provide any licensed nursing care required by the residents including diabetes management such as fingersticks and insulin injections. No medical records are kept on site for the residents except for oral medications lists. DPH staff observed the residents’ rooms, the dining area and the medication room. The overall appearance of the facility was neat and clean. The residents’ rooms were furnished with two beds and had a bathroom which was shared if two residents were assigned to a room. The medication room contained extra syringes and a refrigerator for storage of insulin for the diabetic patients. DPH staff also observed a second refrigerator used for storage of insulin which was located in the kitchen; each resident’s insulin vial was stored in an individual plastic bin. The insulin vials were labeled with the patient name and stamped with the pharmacy expiration date. Residents who performed their own fingersticks and insulin administration kept their own supplies in their room; they also had their own refrigerators to store insulin. CASE FINDING The names of the 84 current residents were entered in the LAC DPH hepatitis B registry to determine if any had ever been reported with hepatitis B infection. One of the diabetic residents had been reported to the registry in 2001. The second resident, whom the administrator identified as having liver cancer, was reported with hepatitis B in 2006. No other residents were found in the registry. The investigation team also contacted the primary care provider for all eighty-four current residents to determine if they had elevated liver tests in last six months or if they had a record of a positive hepatitis test. No further cases of hepatitis B were identified by contacting the primary care providers.
Hepatitis B Outbreak Page 32
Acute Communicable Disease Control 2010 Special Studies Report
BLOOD TEST RESULTS In order to identify other cases of acute hepatitis B among diabetics at the ALF, blood samples of seven of eight diabetic residents were obtained by LAC DPH on March 10, 2010 and sent to the Centers for Disease Control and Prevention in Atlanta, GA, for testing. The tests revealed that all three viruses isolated from three newly diagnosed hepatitis B cases were essentially identical, implicating person-to-person transmission of the same virus among these patients. Results for the remaining three diabetic residents were negative, indicating that these residents are still at risk of becoming infected with hepatitis B. Test results for the final resident (the one who had been reported to the hepatitis registry in 2001) indicated past infection with immunity. ACDC with several primary care providers at the facility ordered hepatitis B testing for 21 residents and 18 staff members. The ALF provided the test results. All 21 residents tested were negative for current infection with hepatitis B including one roommate of a diabetic resident and one diabetic resident. All eighteen staff members tested negative for active (infectious) hepatitis B. INTERVIEWS Interviews were conducted with 11 residents: eight identified diabetic residents, two roommates of the diabetic residents, and a resident identified by the facility administrator who had previously tested positive for hepatitis B and was recently diagnosed with liver cancer. The interviews consisted of questioning the residents to determine if they experienced any symptoms of hepatitis in last six months, reviewing their vaccination status, and questions to determine if there was a contributing factor that increased the residents’ possibility of exposure to hepatitis B. None of 11 residents interviewed reported symptoms of hepatitis. None of 11 residents reported receiving hepatitis B vaccination. Eight of 11 residents interviewed were diabetics who received fingersticks and insulin injections. Three of the diabetic residents with positive hepatitis B tests reported receiving fingersticks, blood glucose testing and insulin injections from the same HHA. One of eight diabetic residents reported receiving fingersticks from a different home health agency. The remaining four diabetic residents reported that they performed their own fingersticks and insulin injections. One of these four reported that he did have a home health agency perform fingersticks during December 2009 because of temporary disability; however he could not remember the name of the agency. Two of the diabetic residents who tested positive for hepatitis B reported having engaged in sexual activity with a partner of the opposite gender during their incubation period, however not the same partner. One of four diabetic residents performing their own diabetic care reported receiving dialysis during the incubation period. Three of eight diabetic residents reported receiving podiatric care, however, a common podiatrist was not identified. SURVEY OF KNOWLEDGE AND PRACTICES OF NURSING STAFF AT HHA To assess infection control practices of the nursing staff at the HHA, a standardized telephone survey was conducted in March 2010 with seven staff members at HHA who were identified as providing diabetic care to three hepatitis B positive diabetic residents at the facility. No breaks in infection control were identified through the survey. However, it was noted that the HHA lacked written policies on injection safety and infection control relating to blood glucose monitoring. SUMMARY Outbreak investigations of hepatitis B in long-term care settings have repeatedly demonstrated person-to-person transmission as a consequence of inappropriate blood glucose monitoring practices, such as the sharing of equipment and inadequate aseptic technique during fingerstick blood glucose monitoringii. LAC DPH has investigated several of these outbreaks in the pastiii,iv. Hepatitis B can be easily transmitted if infection control procedures are not meticulously followed. The site visit and interviews with staff from HHA did not reveal any significant infection control lapses that would have explained this cluster of

Hepatitis B Outbreak
Page 33
Acute Communicable Disease Control 2010 Special Studies Report
hepatitis B but the interviews were conducted after the outbreak and the possible connection to HHA had been identified. It appears more likely than not likely that there was person-to-person transmission of hepatitis B at ALF among diabetic patients who received diabetic care from a single home health agency. Patients who did not receive care from this agency did not acquire hepatitis B; based on the paucity of the evidence, HHA could not be proven to be responsible for the transmission of hepatitis B at the ALF. However, it was noted that HHA lacked written policies on injection safety and infection control relating to blood glucose monitoring. In the year after the outbreak was reported, no new cases of hepatitis B were identified at ALF. RECOMMENDATIONS/INTERVENTIONS Given the extensive literature documenting transmission of hepatitis B and diabetes care, the investigation team recommended that the ALF:
Ensure that all home health agencies that they work with have written infection control policies which include preventing exposure to patients from bloodborne pathogens during diabetes care and Injection safety to prevent transmission of disease to patients.
Label the blood glucometer and pen lancet with each resident’s name and keep in resident’s room. Remind diabetic residents that blood glucometers, pen lancets, syringes, needles and insulin
should never be shared with another person. Report to ACDC any resident that has symptoms of hepatitis (yellowing of the eyes, nausea,
vomiting, abdominal pain) which may represent a newly acquired hepatitis infection. The investigation team recommended to the HHA that they develop infection control policies regarding injection safety based on the principles in these two documents:
CDC’s Diabetes and Viral Hepatitis: Important Information on Glucose Monitoring. Available online at: http://www.cdc.gov/hepatitis/Settings/GlucoseMonitoring.htm CDC’s Patient Safety, Injection Safety. Available online at: http://www.cdc.gov/ncidod/dhqp/injectionsafety.html
Hepatitis B Outbreak Page 34
Acute Communicable Disease Control 2010 Special Studies Report
i Investigation of a Reported Case, Unusual Disease, or Outbreak of Disease. Title 17, California Code of Regulations, Section 2501 ii Thompson ND, Perz JF, Moorman AC, Holmberg SD. Nonhospital health care-associated hepatitis B and C virus transmission: United States, 1998–2008. Ann Intern Med. 2009 Jan 6;150 (1):33-9. iii CDC Transmission of hepatitis B virus among persons undergoing blood glucose monitoring in long-term care facilities---Mississippi, North Carolina, and Los Angeles County, California, 2003—2004. MMWR. 2005;54(09):220-3. iv Bancroft E. Hepatitis B transmission in a nursing home, Los Angeles County, 1999. Acute Communicable Disease Control Special Studies Report 1999.
http://www.lapublichealth.org/acd/reports/spclrpts/spcrpt99/spcl99.pdf Accessed February 2, 2011.

IGAS Outbreak
Page 35
Acute Communicable Disease Control 2010 Special Studies Report
INVASIVE GROUP A STREPTOCOCCUS OUTBREAK IN A SKILLED NURSING FACILITY, LOS ANGELES COUNTY 2010
Elizabeth Bancroft, MD, SM
BACKGROUND Infections with invasive Group A Streptococcus (IGAS)—defined as GAS, also called beta-hemolytic streptocococcus or Stereptococcus pyogenes, in a normally sterile site of the body including blood, joint fluid, and cerebral spinal fluid—can result in serious, life threatening disease. Age over 65 years, diabetes, and immunosuppression have all been documented risk factors for IGAS infections in Los Angeles County and elsewhere.i,ii There have been numerous reports of outbreaks of IGAS in healthcare settings, especially in long term care facilities where close, crowded living conditions and the frailty of the residents are conducive to the transmission and sequelae of these infections. The Centers for Disease Control and Prevention (CDC) defines an outbreak of IGAS in a skilled nursing facility to be two cases occurring within a year; a recent review of GAS outbreaks in long term care facilities revealed that most reported outbreaks lasted longer than one month and that multiple measures were often necessary to control the outbreak(s).iii IGAS is a reportable disease in Los Angeles County (LAC). For all cases, medical records are reviewed and abstracted to a standard epidemiological form. To identify nosocomial cases of IGAS, since 2003 the LAC DPH IGAS epidemiological form contains questions about any surgical procedures, delivery, or admission to the hospital in the seven days before onset of IGAS infection. In 2007, a question was added to the form which asks if the patient had been admitted to the hospital from a long term care facility and the name of the facility. If the answer is yes to any hospital admission or residence in long term care facility, the case is classified as a “nosocomial.” From 2008-2010, 7.5% of confirmed IGAS cases in Los Angeles County have been classified as nosocomial but no clusters were identified until 2010. This report presents a self-limited outbreak of IGAS in a long term care facility that resolved with no interventions. In early June of 2010, three patients with IGAS were identified who had been admitted to two different hospitals in a 20-day period from the same 141-bed skilled nursing and rehabilitation facility (Facility A) in April. One patient died of necrotizing fasciitis less than 24 hours after admission to the hospital; the other two had blood cultures positive for GAS but were discharged from the hospital back to Facility A. One patient had terminal cancer and died shortly after readmission to Facility A. Two of the patients were immobile and remained in bed. An investigation was conducted to determine the source of the outbreak and to control the spread of IGAS. METHODS Case Finding The investigation team at the LAC DPH Acute Communicable Disease Control Program (ACDC) obtained a list of all Facility A patients with fever who were transferred to a hospital during March 1, 2010 through June 8, 2010 and reviewed their medical records. The investigation team contacted the microbiology laboratories of all acute care hospitals to which patients from Facility A were discharged with a diagnosis of fever or suspected infection from January 1, 2010 through June 8, 2010 to determine if additional positive cultures for GAS were documented. The medical charts also were reviewed of Facility A roommates of known patients with IGAS as well as the microbiology reports of cultures taken while the case patients were at Facility A.
Review of Infection Control Key informants were interviewed including the director of the Facility A, the nursing director and the director of staff development who worked as the infection preventionist (IP). The investigation team made
IGAS Outbreak Page 36
Acute Communicable Disease Control 2010 Special Studies Report
a comprehensive tour of the facility in June 2010 and observed infection control practices as healthcare workers tended to patients. Written infection control policies and procedures were reviewed. Infection Control Survey An anonymous employee survey was conducted at Facility A on infection control knowledge, attitudes and practices. The survey was written in English and distributed during each of the three daily shifts. Questions included current job, spoken language at home, self-reported knowledge and adherence to infection control practices, and impressions about fellow employees.
RESULTS Case Finding No other case of group A streptococcus was found in patients residing in or recently discharged from Facility A.
Infection Control Practices Several deficiencies in infection control policy and procedures were discovered:
a. Lack of adherence to internal infection control policies. On multiple occasions, the investigation team observed breaches in contact precautions. For example, observations were conducted of hand washing practices by staff caring for two patients cohorted for Clostridium difficile infection. Four staff were observed to put on gloves without prior hand washing and then initiate patient care. These staff appropriately removed gown and gloves and placed these items in the disposal bin in the patient room and then washed their hands on exiting. Washing with soap and water was performed using the patients’ bathroom. Paper towels were not consistently used to open and shut doors at the completion of hand washing. After completion of hand washing, two of four patient care staff were seen touching curtains, handrails, and walls prior to leaving the patient room which may have resulted in their hands becoming recontaminated with C. difficile or other pathogens.
b. Infection control policies were not standardized to CDC guidelines. At Facility A, when
infection control precautions were indicated, a color-coded binder was placed at the entrance of the patient’s room, designating the specific infection control precautions by organ systems such as fecal/enteric or urine. CDC guidelines are based on transmission risk and use a simple four step model for infection precautions: standard, contact, respiratory, and airborne precautions.
c. Access to hand hygiene supplies were limited or not well utilized.
i. Alcohol based hand rub (ABHR) products were available in each patient care room but were not observed to be utilized by patient care staff.
ii. Sinks utilized for hand washing were inside patient rooms which required opening and shutting a door by hand after hand hygiene, or were at the single nursing station on each floor.
d. By report, injection safety procedures were followed throughout Facility A.
DPH staff reviewed multi-vial and single vial medication practices with staff. By report, all insulin and injectable medications were labeled with patient’s name and utilized only by the specified patient; saline flushes were single-use only; and injectable pain medications were available in single-use vials only.
IGAS Outbreak
Page 37
Acute Communicable Disease Control 2010 Special Studies Report
Results of Infection Control Survey Of 70 total staff, 40 (57%) completed the survey. Most staff completing the survey were either licensed vocational nurses (LVNs, 60%), or nurse aides (23%); the remainder were registered nurses (RNs) and housekeeping staff. More than half of respondents speak Spanish at home. In general, employees rated their knowledge of infection control as very good to excellent, however, their answers to more specific questions revealed gaps in knowledge. More than half of respondents (55%) said their knowledge about hand hygiene is “excellent” while the rest said their knowledge is “very good.” However, when asked about the hand hygiene policy at Facility A, only 85% reported they should wash hands both before and after touching patients. Furthermore, only 55% said hand hygiene is “extremely useful” for avoiding infection, 40% said it is “useful,” and 5% said the hand hygiene is “extremely useless.” A total of 45% said they think their fellow employees consider hand hygiene as “extremely useful,” 50% picked “useful” and 5% of respondents think their fellow employees consider hand hygiene “extremely useless” in avoiding infection. Employees self-reported excellent practices for infection control but there were some gaps. A large majority (85%) of those completing the questionnaire responded that they “always” adhere to hand hygiene/infection control recommendations while 15% noted “almost always.” However, fewer thought that their fellow employees adhered to hand hygiene or infection control recommendations: 70% said their fellow employees adhere to hand hygiene recommendation “always” and 30% said “almost always.” Almost 95% of respondents said they use soap and water and only 5% said they use gel for hand hygiene. About 70% thought there is no barrier for hand hygiene and just over 20% considered unavailability of hand washing sinks as a barrier. Despite the self report of a high level of knowledge and adherence to infection control policies, a large majority (80%) thought they could improve their hand hygiene. For training, the majority of respondents preferred interactive discussions, role playing and watching videos compared to just listening to lectures. SUMMARY The CDC defines an outbreak of IGAS in a skilled nursing facility as two or more cases in a one-year period. This situation met the definition of a nosocomial outbreak, even without definitive laboratory testing. The fact that two of the three patients were not mobile suggests that the infections were spread by healthcare workers. Most reported outbreaks of IGAS in skilled nursing facilities have been associated with breaches in infection control, including employees working while ill with "strep throat" or/and poor adherence with hand hygiene. While these conditions cannot be proven to have resulted in the spread of group A streptococcus at Facility A in April 2010, it is clear that infection control practices as observed during the investigation could have resulted in the spread of this infection and others. Since the investigation, no more cases of IGAS have been reported from Facility A. Recommendations given to Facility A
1) The IP at Facility A should regularly contact, within seven days of discharge, all hospitals to which Facility A patients have been admitted to identify any positive cultures or infectious disease conditions that may have been identified during hospitalization. These diseases or test results (if appropriate) should be noted in the medical chart of the patients upon return to Facility A. The IP should keep a list of patients, the hospitals, and infections to identify any pattern of infections that need to be addressed. If a cluster of the same infection is noted, it must be reported to the Department of Public Health immediately.
2) The IP should consider reviewing on a daily or weekly basis all positive tests for infectious diseases that occur in residents of Facility A.
3) Floor nurses should notify the IP of any patient who tests positive for group A streptococcus
IGAS Outbreak Page 38
Acute Communicable Disease Control 2010 Special Studies Report
4) Any new GAS infection in a resident or an employee until April 2011 should be reported to ACDC immediately.
5) There should be additional didactic sessions with the staff regarding infection control and the importance of hand hygiene. Sessions should be given in English and Spanish and handouts should be available in both languages. Sessions should include interactive discussions with demonstrations of good and sub-standard practices. Explanations for best practices should be made in simple language.
6) Appropriate hand hygiene should be encouraged, including more liberal use of ABHR which has
been shown to increase compliance with hand hygiene. Consideration should be given to providing small bottles of ABHR for staff to carry and use between patients.
7) Policies and procedures on isolation practices should be updated. Isolation categories should
conform to the CDC guidelines for infection control. Instructions and signage should be posted in both English and the dominant language of care givers in any facility. More information on guidelines for isolation precautions may be found at the CDC website: http://www.cdc.gov/ncidod/dhqp/gl_longterm_care.html.
8) Staff need to be reminded that hand hygiene must be performed before putting on gloves and
gowns, and that after performing hand hygiene at the end of their duties in a patient room, nothing else should be touched before exiting the room.
Acknowledgement: Armin Shahronki, MD, Public Health Resident i Risk factors for invasive group A streptococcal disease in Los Angeles County, 2004-2006. Hageman L. Acute Communicable Disease Control Special Studies Report 2006: 77-80. http://publichealth.lacounty.gov/acd/reports/annual/2006SpecialStudies.pdf ii Invasive group A streptococcal infections in the San Francisco Bay area, 1989-99. Passaro et al. Epidemiol. Infect. 2002;129:471-478 http://www.ncbi.nlm.nih.gov/pmc/articles/PMC2869908/pdf/12558329.pdf iii Group A streptococcal disease in long term care facilities: descriptive epidemiology and potential Control Measures. Jordan et al. Clinical Infectious Diseases 2007; 45:742-52.
Salmonella Enteriditis
Page 39
Acute Communicable Disease Control 2010 Special Studies Report
NATION-WIDE OUTBREAK OF SALMONELLA ENTERITIDIS ASSOCIATED WITH CONTAMINATED EGGS
Curtis Croker, MPH, Rita Bagby, RN, MSN, and Roshan Reporter, MD, MPH
BACKGROUND In the summer of 2010, the Los Angeles County (LAC) Department of Public Health (DPH) was part of a nation-wide investigation that led to the largest egg recall in US history. Locally, this investigation involved collaboration and cooperation of multiple LAC Public Health Agencies, included Acute Communicable Disease Control (ACDC), Community Health Services (CHS), Environmental Health Food and Milk Program (EHFM) and the Public Health Laboratory (PHL). LAC DPH contributed significant investigational findings that assisted Centers for Disease Control and Prevention (CDC) and Food and Drug Administration (FDA) in identifying a food source and preventing further exposure. ACDC identified the first signs of the outbreak in early June of 2010 when a county-wide increase in Salmonella enteritidis (SE) cases was observed. LAC typically receives 15-25 SE case reports in a summer month, but the number of reports increased to 43 in May of 2010. In Mid-June of 2010, the California Department of Public Health (CDPH) identified an increased number of SE cases being reported, many with a pulsed field gel electrophoresis (PFGE) pattern JEGX01.0004 (pattern 04). In July, the CDC identified a nation-wide increase in SE cases. The CDC determined that the most effective method of investigating this increase in SE cases was to focus on local clusters of cases associated with a common restaurant or event. Trace back of any food items identified in these clusters was encouraged. METHODS ACDC increased surveillance of local SE cases by reviewing SE case interviews performed by Public Health Nurses (PHNs) to identify any clustering of cases by demographics or common exposure. Cases were mapped to observe geographic clustering. Initial findings identified by ACDC were relayed to CHS investigating PHNs to focus their investigations. Follow-up interviews were conducted on SE clusters identified.
EHFM made a site visit to any potential restaurant or food venue suspected in SE clusters identified by ACDC. EHFM performed trace-backs on any suspect food items.
ACDC ensured that Salmonella case isolates were sent to the Public Health Laboratory (PHL) for confirmation, serotyping and PFGE analysis a timely fashion.
ACDC requested that PHL begin performing PFGE testing on all sporadic SE isolates. Except for outbreaks, PFGE testing on SE isolates is not routinely performed by PHL due to limited resources.
ACDC compiled all cluster investigation findings from CHS, EHFM and PHL and relayed them to the CDPH.
RESULTS ACDC review of LAC SE cases occurring in May and June of 2010 did not reveal obvious geographical clustering. SE cases were more likely to be non-Hispanic and more likely to be working-age adults in comparison to the typical demographics for salmonellosis cases. After review of PHN case investigations, ACDC identified a clustering of cases associated with the entertainment industry. On July 23, 2010, ACDC requested that PHNs inquire about these types of occupations among salmonellosis cases and their household contacts and notify ACDC. Re-interview of salmonellosis cases in the entertainment industry revealed a cluster of cases working at the same transient movie set location in a neighboring county (n=3). All three cases reported eating various meals from the catering truck on the movie set. One case was hospitalized. All three cases were
Salmonella Enteriditis Page 40
Acute Communicable Disease Control 2010 Special Studies Report
later laboratory confirmed with SE, PFGE pattern 04 by the PHL. No epidemiologic food analysis was performed due to the small number of cases, lack of cooperation and poor food recall of cases. ACDC contacted the movie set production official to obtain information about the set and catering arrangements. The official reported that there was only one food truck assigned to the movie set, which followed the film production from site to site. The food truck was based in LAC. EHFM contacted the caterer of the movie set in question, but were unable to perform a site inspection as movie production had been completed. The management stated that the omelet bar was the most popular feature, with more than half of the film production crew typically eating this meal. Trace back of the eggs used by this caterer revealed that they purchased eggs through only one distributor, which in turn purchased its eggs from a single egg farm in Iowa. The PHL confirmed the associated clinical isolates as SE pattern 04. The CDPH combined this information with five additional SE outbreak investigations in other California jurisdictions which also implicated the same egg farm. These findings were conveyed to CDC and FDA on August 3, 2010. As a result, the egg farm recalled nearly half a million eggs on August 13. ACDC estimated the number of LAC cases related to this outbreak based on the number of SE cases in excess of the fiver-year average for May through September, the outbreak period (Figure 1). There were 153 excess cases during the outbreak period were assumed to be associated with this outbreak. LAC also noted a shift in the demographics of SE cases in general, to a working age and non-Hispanic ethnic group. The PHL performed PFGE testing on 270 LAC SE isolates with collection dates from May 11 through September 13, 2010; 196 (72.6 %) carried the 04 pattern. Though not all persons whose isolates had pattern 04 were part of the outbreak, PFGE allowed exclusion of SE cases with PFGE patterns other than pattern 04. ACDC identified several additional potential LAC SE clusters during the national outbreak period. Many of these clusters (n=6) involved small numbers of cases (n<2) eating food at a common restaurant within the outbreak time period. Due to the small numbers of cases and, in some instances, lack of cooperation of ill patrons, the information from these investigations was limited and did not identify a common source. However, many cases reported eating food items made from shell eggs. EHFM performed a trace back of the eggs used in these events. Trackbacks for five of the six SE clusters revealed the previously implicated egg supplier as the likely source. The preliminary CDC report indicates that from May 1 to November 30, 2010, approximately 1,939 illnesses were likely associated with this outbreak in the U.S.. Epidemiologic investigations conducted by public health officials in 11 states identified 29 restaurants or event clusters where more than one ill person with the outbreak strain had eaten. Data from these investigations suggested that shell eggs were a likely source of infections in many of these restaurants or events. The Iowa egg farm was an egg supplier in 15 of these 29 restaurants or event clusters. Through trace-back and FDA investigational findings, a second Iowa farm was also identified as a potential source of contaminated shell eggs contributing to this outbreak. FDA’s inspectional observations, in addition to sample results, indicate substantial potential for Salmonella to have persisted in the environment and to have contaminated eggs for an extended period. FDA collected nearly 600 samples from both farms during this investigation. Eleven environmental samples identified Salmonella with PFGE patterns indistinguishable from the outbreak strain. DISCUSSION Although the strict case definition used here identified only three LAC SE outbreak-related cases, there were an estimated 153 persons in LAC ill with SE potentially associated with the outbreak. Food trace-backs are intensive and could not be performed to subtype each individual SE case. LAC DPH’s cluster investigation findings were one of a handful of CA investigation findings that helped CDC and FDA identify a source early on in the national investigation and request a recall of eggs. The CA DPH worked
Salmonella Enteriditis
Page 41
Acute Communicable Disease Control 2010 Special Studies Report
diligently to compile the investigational results from multiple California jurisdictions and present the first evidence to CDC suggesting the source of the outbreak. Many of the SE cluster investigations performed by multiple state health jurisdictions in this investigation identified eggs and poultry as common foods eaten by cases. It became challenging to determine how relevant these findings were, given that these foods are commonly eaten in the US. The 2006-2007 FoodNet Population survey [1] indicates that 72.5% of persons in California consume fresh eggs (nationally 75.4%) and 63.3% of California consume chicken prepared at home (nationally 64.9%) in the past seven days. Nationally, the most common PFGE patterns of SE identified were 04 (45%), 05 (15%) and 02 (15%) with fairly equal frequency from each region of the US in relation to each labs submission frequency (Source: PULSNET representative in 2008). The remaining 35% of isolates were in the ≤2% category. Because of this, PFGE testing normally has limited use in SE cluster detection, but is valuable for supporting epidemiologic evidence. In LAC, SE pattern 02 had historically been the dominant PFGE pattern, representing 40% of a sample of SE isolates tested by PHL in 2005. Other issues that may have delayed the identification of this outbreak source included the batching of bacterial isolates by private laboratories to PHL, delaying confirmation and serotyping. Thus, serotyping of isolates can take weeks after the Salmonella has been identified. Food trace-backs can be very complex and time consuming and many times lead to multiple out of state sources. For example, one cluster trace-back involved 18 different egg farms as the possible source of eggs used in a suspect meal. The high demand for eggs by California consumers has driven suppliers to supplement their egg supplies with out of state eggs. It is estimated that at least 30% of eggs consumed in California are from out of state sources. States outside of California may not have as strict a standard for egg quality assurance as California. The California Egg Quality Assurance Program (CEQAP) established in California is a voluntary pre-harvest food safety program designed to ensure product quality and food safety from Salmonella and chemical residues in eggs. Training, record-keeping, and research are integral components in documenting the program’s success. Each participant implements an approved plan specific to their operation. Farms and processing facilities are annually reviewed by California Department of Food and Agriculture veterinarians to ensure compliance with the program components. The CEQAP was effective in reducing the incidence of SE in California- produced shell eggs during the 1990s. CONCLUSION This national outbreak investigation of Salmonella Enteritidis (SE) (PFGE pattern 04) involved considerable coordination and cooperation from federal, state and local entities to identify a source [2]. The outbreak occurred between May 1 and November 30, 2010 and implicated two farms in Iowa with nation-wide product distribution. Through the coordinated efforts of ACDC, EHFM, PHL and CHS, LAC DPH was able to identify one of six California outbreak-related clusters that led to identification of the source for the nationwide outbreak, resulting in a massive egg recall. REFERENCES 1. FoodNet Population Survey, Atlas of Exposures, 2006-2007. Available at:
http://www.cdc.gov/foodnet/ 2. CDC final web update for the SE investigation. Available at:
http://www.cdc.gov/salmonella/enteritidis/index.html
Salmonella Enteriditis Page 42
Acute Communicable Disease Control 2010 Special Studies Report
RESOURCES
FDA egg recall posting Website: http://www.fda.gov/Safety/Recalls/ucm222501.htm Egg Quality Assurance Program, CA Website: http://www.pacificegg.org/ceqap.html
Disease Reporting
Page 43
Acute Communicable Disease Control 2010 Special Studies Report
DISEASE REPORTING PRACTICES AND ATTITUDES AMONG COMMUNITY CLINIC ASSOCIATION OF LOS ANGELES COUNTY
(CCALAC) PROVIDERS, 2010
Alan Wu, MPH BACKGROUND Disease surveillance is an important function of public health. Timely and accurate reporting of communicable diseases (both confirmed and suspected cases) is a critical component of disease surveillance, prevention and control [1]. Routine collection and analysis of data gathered are essential to rapidly identify and effectively respond to new disease outbreaks [2]. Studies consistently demonstrate significant underreporting of communicable diseases, limiting the data available to guide local disease control efforts [2]. Los Angeles County (LAC) Department of Public Health (DPH) Acute Communicable Disease Control Program (ACDC) estimates that only 5% of communicable diseases occurring in LAC are reported. In LAC more than 80 diseases are reportable by law to the local health department [1]. In addition, the potential threat of emerging diseases and bioterrorism-related disease activity further increases the need for prompt and thorough disease reporting [1]. Primary healthcare providers are frequently the first to recognize unusual occurrences or patterns of disease. Therefore, it is critical that healthcare providers report all reportable diseases as well as any unusual disease occurrences. METHODS To identify and assess key barriers and factors involved in underreporting ACDC conducted an online survey of local healthcare providers from January to June 2010. The survey specifically targeted providers who are members of the Community Clinic Association of Los Angeles County (CCALAC). CCALAC is an important network of 44 provider members whose main role is to represent and help non-profit community and free clinics serve their patients in an efficient and cost-effective manner. The association strives to identify and address the collective needs of members at the local, state and federal levels. CCALAC delivers a variety of member services including policy advocacy, education and peer support. ACDC collaborated with CCALAC and presented the survey project at the CCALAC February 2010 medical directors’ monthly meeting to invite their participation. At this meeting ACDC also provided an opportunity for members to complete the survey. A total of 14 responses were gathered. In February 2010, a 23-question survey was distributed to all current CCALAC members using a web-based survey tool, SurveyMonkey™. An initial email was sent with a link to the web-based survey generated in SurveyMonkey™ to all CCALAC members. Email reminders were sent to all members to encourage participation. The time period to respond to the survey was extended several times for as many members as possible to participate and to maximize response rates. All CCALAC provider members were contacted by email to complete the survey. The survey was closed on June 15, 2010. To capture the various types of providers common in this network (other than physicians), participation was also extended to part-time and per diem physicians, physician assistants (PAs), nurse practitioners (NPs), osteopathic physicians (DOs), and nurse-midwives. RESULTS Response Rate and Survey Population The survey response rate was 37% with a total of 179 responses. The characteristics of the respondents are summarized in Table 1. Respondents were physicians (68%), physician assistants (12%), osteopathic physicians (3%), nurse practitioners (15%), and nurse-midwives (2%). A majority of the physicians (68%) were in family practice (52%) and female (63%). The highest percent of respondents have practiced
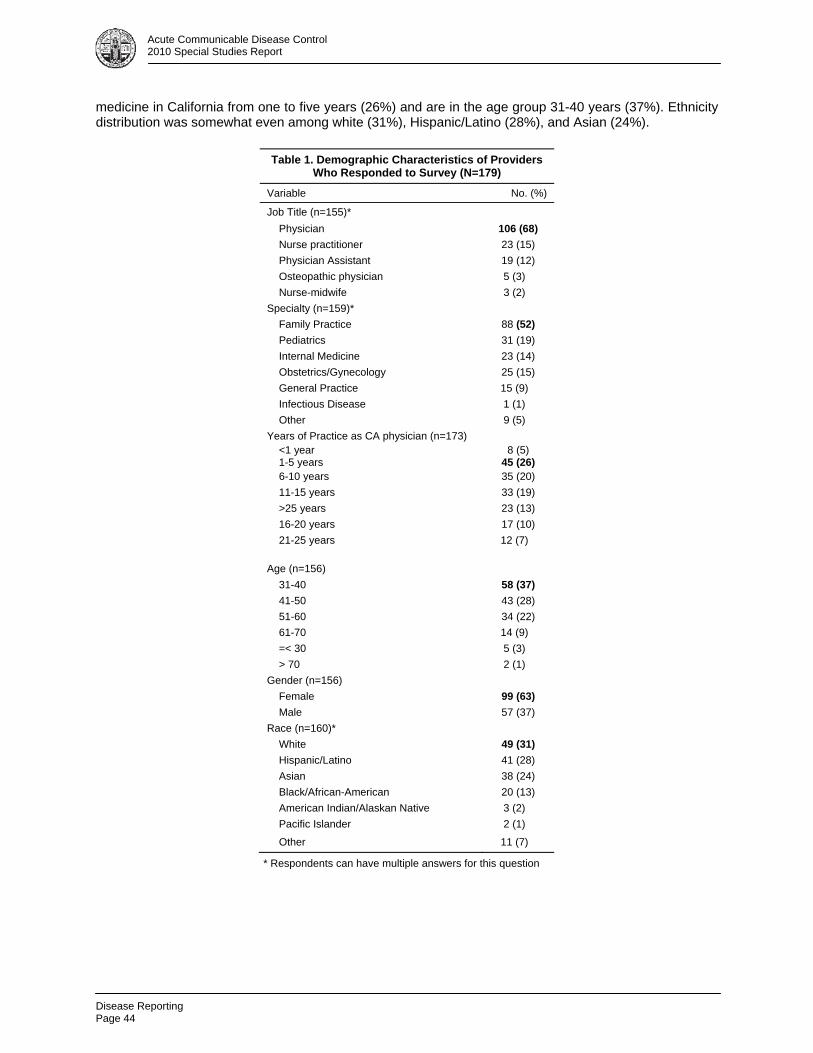
Disease Reporting Page 44
Acute Communicable Disease Control 2010 Special Studies Report
medicine in California from one to five years (26%) and are in the age group 31-40 years (37%). Ethnicity distribution was somewhat even among white (31%), Hispanic/Latino (28%), and Asian (24%).
* Respondents can have multiple answers for this question
Table 1. Demographic Characteristics of Providers Who Responded to Survey (N=179)
Variable No. (%)
Job Title (n=155)*
Physician 106 (68)
Nurse practitioner 23 (15)
Physician Assistant 19 (12)
Osteopathic physician 5 (3)
Nurse-midwife 3 (2)
Specialty (n=159)*
Family Practice 88 (52)
Pediatrics 31 (19)
Internal Medicine 23 (14)
Obstetrics/Gynecology 25 (15)
General Practice 15 (9)
Infectious Disease 1 (1)
Other 9 (5)
Years of Practice as CA physician (n=173) <1 year 1-5 years
8 (5) 45 (26)
6-10 years 35 (20)
11-15 years 33 (19)
>25 years 23 (13)
16-20 years 17 (10)
21-25 years 12 (7) Age (n=156)
31-40 58 (37)
41-50 43 (28)
51-60 34 (22)
61-70 14 (9)
=< 30 5 (3)
> 70 2 (1)
Gender (n=156)
Female 99 (63)
Male 57 (37)
Race (n=160)*
White 49 (31)
Hispanic/Latino 41 (28)
Asian 38 (24)
Black/African-American 20 (13)
American Indian/Alaskan Native 3 (2)
Pacific Islander 2 (1)
Other 11 (7)
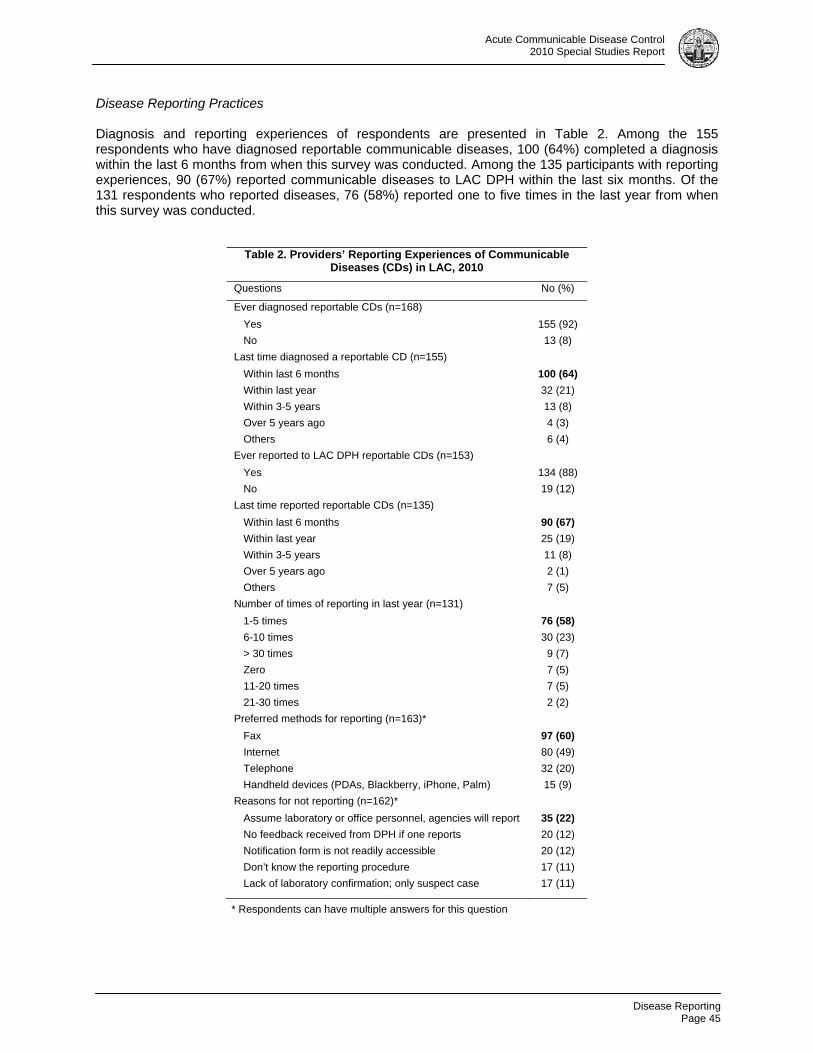
Disease Reporting
Page 45
Acute Communicable Disease Control 2010 Special Studies Report
Disease Reporting Practices Diagnosis and reporting experiences of respondents are presented in Table 2. Among the 155 respondents who have diagnosed reportable communicable diseases, 100 (64%) completed a diagnosis within the last 6 months from when this survey was conducted. Among the 135 participants with reporting experiences, 90 (67%) reported communicable diseases to LAC DPH within the last six months. Of the 131 respondents who reported diseases, 76 (58%) reported one to five times in the last year from when this survey was conducted.
* Respondents can have multiple answers for this question
Table 2. Providers’ Reporting Experiences of CommunicableDiseases (CDs) in LAC, 2010
Questions No (%)
Ever diagnosed reportable CDs (n=168)
Yes 155 (92)
No 13 (8)
Last time diagnosed a reportable CD (n=155)
Within last 6 months 100 (64)
Within last year 32 (21)
Within 3-5 years 13 (8)
Over 5 years ago 4 (3)
Others 6 (4)
Ever reported to LAC DPH reportable CDs (n=153)
Yes 134 (88)
No 19 (12)
Last time reported reportable CDs (n=135)
Within last 6 months 90 (67)
Within last year 25 (19)
Within 3-5 years 11 (8)
Over 5 years ago 2 (1)
Others 7 (5)
Number of times of reporting in last year (n=131)
1-5 times 76 (58)
6-10 times 30 (23)
> 30 times 9 (7)
Zero 7 (5)
11-20 times 7 (5)
21-30 times 2 (2)
Preferred methods for reporting (n=163)*
Fax 97 (60)
Internet 80 (49)
Telephone 32 (20)
Handheld devices (PDAs, Blackberry, iPhone, Palm) 15 (9)
Reasons for not reporting (n=162)*
Assume laboratory or office personnel, agencies will report 35 (22)
No feedback received from DPH if one reports 20 (12)
Notification form is not readily accessible 20 (12)
Don’t know the reporting procedure 17 (11)
Lack of laboratory confirmation; only suspect case 17 (11)
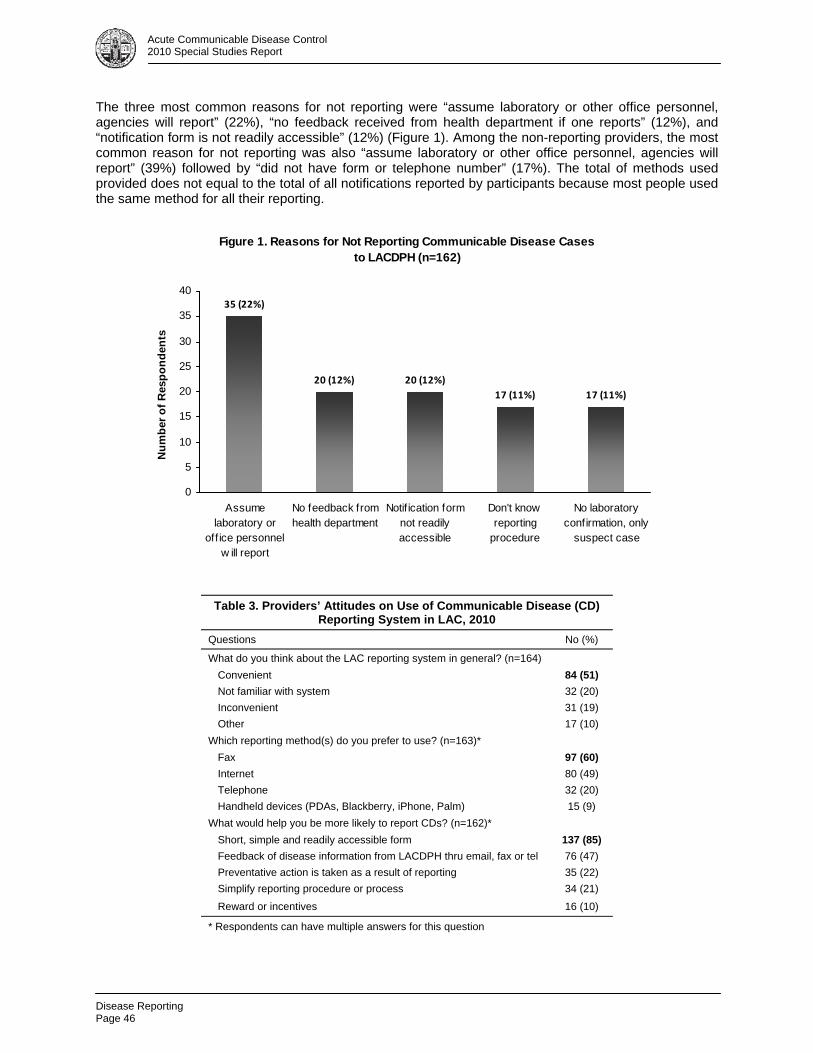
Disease Reporting Page 46
Acute Communicable Disease Control 2010 Special Studies Report
The three most common reasons for not reporting were “assume laboratory or other office personnel, agencies will report” (22%), “no feedback received from health department if one reports” (12%), and “notification form is not readily accessible” (12%) (Figure 1). Among the non-reporting providers, the most common reason for not reporting was also “assume laboratory or other office personnel, agencies will report” (39%) followed by “did not have form or telephone number” (17%). The total of methods used provided does not equal to the total of all notifications reported by participants because most people used the same method for all their reporting.
Table 3. Providers’ Attitudes on Use of Communicable Disease (CD) Reporting System in LAC, 2010
Questions No (%)
What do you think about the LAC reporting system in general? (n=164)
Convenient 84 (51)
Not familiar with system 32 (20)
Inconvenient 31 (19)
Other 17 (10)
Which reporting method(s) do you prefer to use? (n=163)*
Fax 97 (60)
Internet 80 (49)
Telephone 32 (20)
Handheld devices (PDAs, Blackberry, iPhone, Palm) 15 (9)
What would help you be more likely to report CDs? (n=162)*
Short, simple and readily accessible form 137 (85)
Feedback of disease information from LACDPH thru email, fax or tel 76 (47)
Preventative action is taken as a result of reporting 35 (22)
Simplify reporting procedure or process 34 (21)
Reward or incentives 16 (10)
* Respondents can have multiple answers for this question
Figure 1. Reasons for Not Reporting Communicable Disease Cases to LACDPH (n=162)
35 (22%)
20 (12%) 20 (12%)
17 (11%) 17 (11%)
0
5
10
15
20
25
30
35
40
Assumelaboratory or
off ice personnelw ill report
No feedback fromhealth department
Notif ication formnot readilyaccessible
Don't knowreporting
procedure
No laboratoryconfirmation, only
suspect case
Nu
mb
er o
f R
esp
on
den
ts
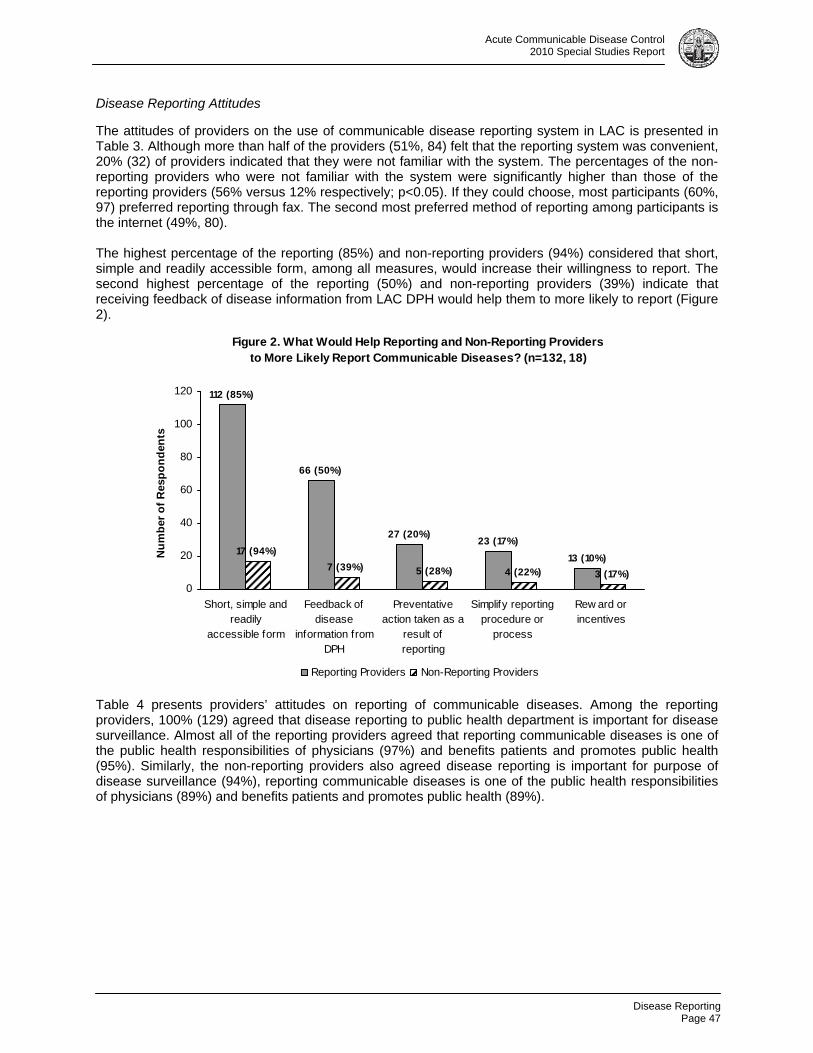
Disease Reporting
Page 47
Acute Communicable Disease Control 2010 Special Studies Report
Disease Reporting Attitudes The attitudes of providers on the use of communicable disease reporting system in LAC is presented in Table 3. Although more than half of the providers (51%, 84) felt that the reporting system was convenient, 20% (32) of providers indicated that they were not familiar with the system. The percentages of the non-reporting providers who were not familiar with the system were significantly higher than those of the reporting providers (56% versus 12% respectively; p<0.05). If they could choose, most participants (60%, 97) preferred reporting through fax. The second most preferred method of reporting among participants is the internet (49%, 80). The highest percentage of the reporting (85%) and non-reporting providers (94%) considered that short, simple and readily accessible form, among all measures, would increase their willingness to report. The second highest percentage of the reporting (50%) and non-reporting providers (39%) indicate that receiving feedback of disease information from LAC DPH would help them to more likely to report (Figure 2).
Table 4 presents providers’ attitudes on reporting of communicable diseases. Among the reporting providers, 100% (129) agreed that disease reporting to public health department is important for disease surveillance. Almost all of the reporting providers agreed that reporting communicable diseases is one of the public health responsibilities of physicians (97%) and benefits patients and promotes public health (95%). Similarly, the non-reporting providers also agreed disease reporting is important for purpose of disease surveillance (94%), reporting communicable diseases is one of the public health responsibilities of physicians (89%) and benefits patients and promotes public health (89%).
Figure 2. What Would Help Reporting and Non-Reporting Providersto More Likely Report Communicable Diseases? (n=132, 18)
13 (10%)
23 (17%)27 (20%)
66 (50%)
112 (85%)
3 (17%)4 (22%)5 (28%)7 (39%)
17 (94%)
0
20
40
60
80
100
120
Short, simple andreadily
accessible form
Feedback ofdisease
information fromDPH
Preventativeaction taken as a
result ofreporting
Simplify reportingprocedure or
process
Rew ard orincentives
Nu
mb
er o
f R
esp
on
den
ts
Reporting Providers Non-Reporting Providers
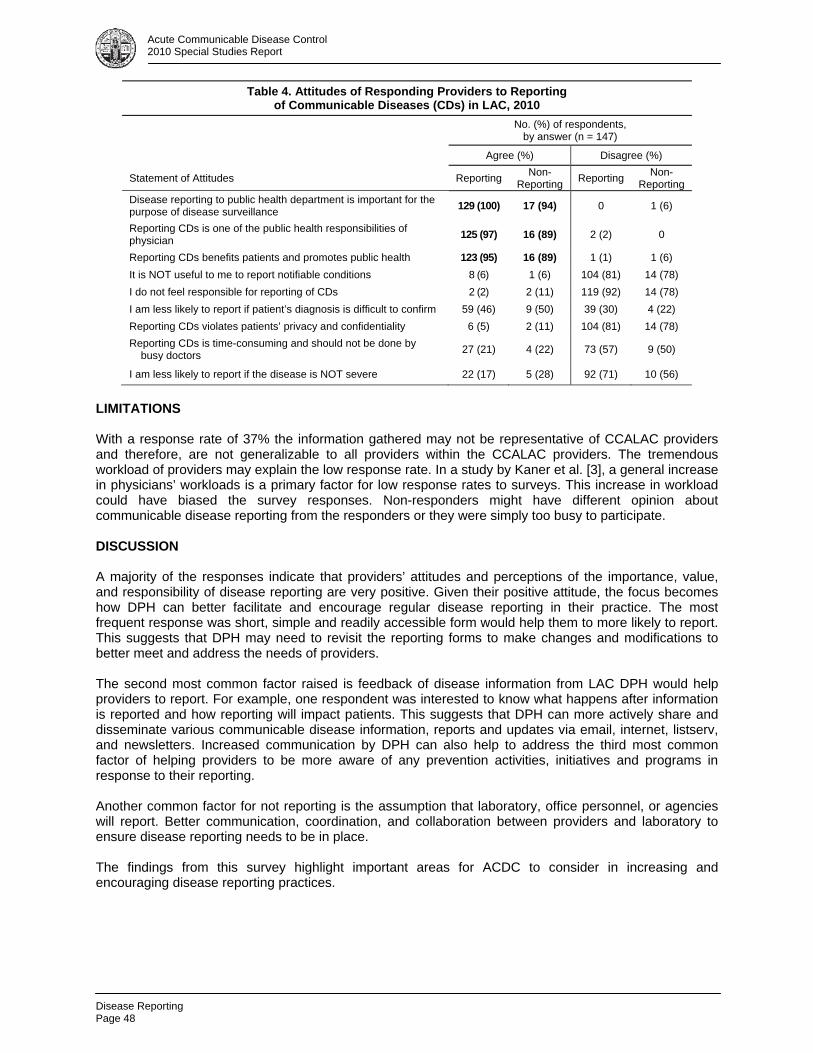
Disease Reporting Page 48
Acute Communicable Disease Control 2010 Special Studies Report
LIMITATIONS With a response rate of 37% the information gathered may not be representative of CCALAC providers and therefore, are not generalizable to all providers within the CCALAC providers. The tremendous workload of providers may explain the low response rate. In a study by Kaner et al. [3], a general increase in physicians’ workloads is a primary factor for low response rates to surveys. This increase in workload could have biased the survey responses. Non-responders might have different opinion about communicable disease reporting from the responders or they were simply too busy to participate. DISCUSSION
A majority of the responses indicate that providers’ attitudes and perceptions of the importance, value, and responsibility of disease reporting are very positive. Given their positive attitude, the focus becomes how DPH can better facilitate and encourage regular disease reporting in their practice. The most frequent response was short, simple and readily accessible form would help them to more likely to report. This suggests that DPH may need to revisit the reporting forms to make changes and modifications to better meet and address the needs of providers. The second most common factor raised is feedback of disease information from LAC DPH would help providers to report. For example, one respondent was interested to know what happens after information is reported and how reporting will impact patients. This suggests that DPH can more actively share and disseminate various communicable disease information, reports and updates via email, internet, listserv, and newsletters. Increased communication by DPH can also help to address the third most common factor of helping providers to be more aware of any prevention activities, initiatives and programs in response to their reporting. Another common factor for not reporting is the assumption that laboratory, office personnel, or agencies will report. Better communication, coordination, and collaboration between providers and laboratory to ensure disease reporting needs to be in place. The findings from this survey highlight important areas for ACDC to consider in increasing and encouraging disease reporting practices.
Table 4. Attitudes of Responding Providers to Reporting of Communicable Diseases (CDs) in LAC, 2010
No. (%) of respondents, by answer (n = 147)
Agree (%) Disagree (%)
Statement of Attitudes Reporting Non-
Reporting Reporting
Non-Reporting
Disease reporting to public health department is important for the purpose of disease surveillance
129 (100) 17 (94) 0 1 (6)
Reporting CDs is one of the public health responsibilities of physician
125 (97) 16 (89) 2 (2) 0
Reporting CDs benefits patients and promotes public health 123 (95) 16 (89) 1 (1) 1 (6)
It is NOT useful to me to report notifiable conditions 8 (6) 1 (6) 104 (81) 14 (78)
I do not feel responsible for reporting of CDs 2 (2) 2 (11) 119 (92) 14 (78)
I am less likely to report if patient’s diagnosis is difficult to confirm 59 (46) 9 (50) 39 (30) 4 (22)
Reporting CDs violates patients’ privacy and confidentiality 6 (5) 2 (11) 104 (81) 14 (78)
Reporting CDs is time-consuming and should not be done by busy doctors
27 (21) 4 (22) 73 (57) 9 (50)
I am less likely to report if the disease is NOT severe 22 (17) 5 (28) 92 (71) 10 (56)
Disease Reporting
Page 49
Acute Communicable Disease Control 2010 Special Studies Report
ACKNOWLEDGEMENTS ACDC appreciates all who assisted with the development and completion of this survey. Special thanks to Manisha Makwana and Lisa Holmes at CCALAC for assisting in the distribution of the survey and to all CCALAC members for their participation. REFERENCES 1. The Public’s Health January 2004; 4(1):1. 2. Ward LD, Spain V, Perilla MJ, et al. Improving disease reporting by clinicians: the effect of an
Internet-based intervention. J Public Health Management Practice 2008; 14(1):56-61. 3. Kaner EF, Haighton CA, McAvoy BR. ‘So much post, so busy with practice—so, no time!’: a
telephone survey of general practitioners’ reasons for not participating in postal questionnaire surveys. Br J Gen Pract 1998; 48(428):1067–9.

Disease Reporting Page 50
Acute Communicable Disease Control 2010 Special Studies Report
Ecstasy Overdose
Page 51
Acute Communicable Disease Control 2010 Special Studies Report
ECSTASY OVERDOSES AT NEW YEAR’S EVE RAVE – LOS ANGELES, CALIFORNIA 2010
Laurene Mascola, MD, David Dassey, MD, Stella Fogleman, MSN/MPH, Leonard Paulozzi, MD and
Caitlin Reed, MD
This investigation report was published in the Centers for Disease Control and Prevention’s Morbidity and Mortality Weekly Report on June 11, 2010. Please refer to MMWR 59(22);677-681 at http://www.cdc.gov/mmwr/preview/mmwrhtml/mm5922a1.htm.
Ecstasy Overdose Page 52
Acute Communicable Disease Control 2010 Special Studies Report
Fotonovela Intervention
Page 53
Acute Communicable Disease Control 2010 Special Studies Report
ENGAGING EARLY CHILDHOOD EDUCATORS AND PARENTS WITH A FOTONOVELA INTERVENTION TO PREVENT INFECTIOUS DISEASE
Elaine Waldman
This article will be published in near future.

Fotonovela Intervention Page 54
Acute Communicable Disease Control 2010 Special Studies Report

Fotonovela Intervention
Page 55
Acute Communicable Disease Control 2010 Special Studies Report

Fotonovela Intervention Page 56
Acute Communicable Disease Control 2010 Special Studies Report
Evaluation of Disease Reporting System
Page 57
Acute Communicable Disease Control 2010 Special Studies Report
EVALUATING THE LOS ANGELES COUNTY PUBLIC HEALTH URGENT DISEASE REPORTING SYSTEM
Amber Zelenay, MPH
Strengthening the ability of local public health agencies (LPHAs) to detect and respond to bioterrorism as well as natural disease outbreaks has become a national priority. In response to this priority, the Centers for Disease Control and Prevention (CDC) issued guidance that clarified LPHA responsibilities for receiving and responding to urgent disease case reports and outbreaks [1]. This guidance detailed four primary recommendations: 1) a single, well-publicized telephone number to receive urgent case reports; 2) a phone triage system to process urgent case reports; 3) being capable of receiving urgent case reports 24 hours a day, 7 days a week and 4) a trained public health (PH) professional to respond within 30 minutes of receiving the report. Lacking from this guidance was the provision of tools or methods that LPHAs could use to evaluate and test their disease reporting system to identify areas that were working well and areas that needed improvement. RAND Corporation developed a set of methods that could be used by LPHAs to evaluate their ability to respond to urgent case reports and assess their compliance with CDC recommendations. A pilot study using these methods was conducted by RAND in 2004 using several LPHAs across the country as test subjects. The study methods and results were published in 2005 [2]. Accompanying the report was a technical manual that LPHAs could use to perform similar evaluations of their own disease reporting systems. Using this manual as a guide, evaluations of the Los Angeles County (LAC) Disease Reporting System were performed in early-2006 [3] and early-2008. In June 2010 a follow-up test of the system was performed using the same methods. BACKGROUND LAC maintains a disease reporting system capable of receiving reports 24 hours a day, 7 days a week via an 888 toll-free disease reporting hotline. In addition to the hotline, urgent disease reports can also be called in directly to Acute Communicable Disease Control Program (ACDC). Calls received through the hotline during normal business hours—Monday-Friday, 8am-5pm—go directly to the LAC Department of Public Health Morbidity Unit. If a caller is requesting information or assistance related to infectious disease the call is transferred to ACDC. Calls are then triaged by ACDC clerical staff based on whether the caller is a healthcare provider and the exact nature of the call. All calls received after-hours—Monday-Friday, 5pm-8am, weekends, and holidays—are forwarded directly to the County Operator (CO; serves as the answering service for all county departments). Healthcare providers with questions related to infectious disease are transferred to the public health physician on call (aka Administrator On Duty [AOD]). Public callers, however, are provided with requested information, but not typically transferred to the AOD. METHODS The RAND technical manual provides a template for evaluating the competency of disease reporting systems. The manual was used to test how quickly a connection can be made between a caller and the action officer1 (AO). A test of the system was planned for June 2010. Selected ACDC staff persons with jobs unrelated to the immediate receipt and processing of urgent disease situations were used to perform test calls. For callers without previous experience with the project, a brief training session was given. Callers signed up to perform several test calls during the test month. The call process consisted of three phases: 1) initiating a call, 2) reaching an AO and 3) debriefing. A call was initiated when a test caller phoned the disease reporting system, used a lead-in (a short message
1 For purposes of this test, an Action Officer (AO) is defined as a public health professional responsible for responding to public health emergencies at the time of the test call.
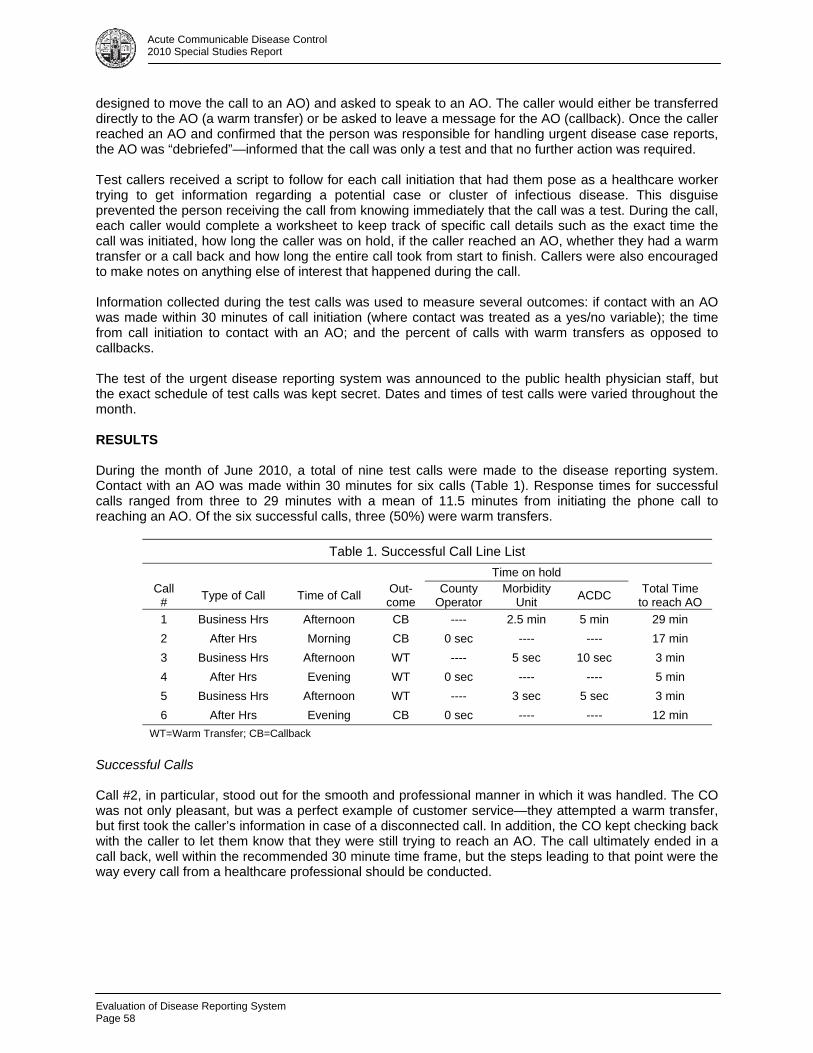
Evaluation of Disease Reporting System Page 58
Acute Communicable Disease Control 2010 Special Studies Report
designed to move the call to an AO) and asked to speak to an AO. The caller would either be transferred directly to the AO (a warm transfer) or be asked to leave a message for the AO (callback). Once the caller reached an AO and confirmed that the person was responsible for handling urgent disease case reports, the AO was “debriefed”—informed that the call was only a test and that no further action was required. Test callers received a script to follow for each call initiation that had them pose as a healthcare worker trying to get information regarding a potential case or cluster of infectious disease. This disguise prevented the person receiving the call from knowing immediately that the call was a test. During the call, each caller would complete a worksheet to keep track of specific call details such as the exact time the call was initiated, how long the caller was on hold, if the caller reached an AO, whether they had a warm transfer or a call back and how long the entire call took from start to finish. Callers were also encouraged to make notes on anything else of interest that happened during the call. Information collected during the test calls was used to measure several outcomes: if contact with an AO was made within 30 minutes of call initiation (where contact was treated as a yes/no variable); the time from call initiation to contact with an AO; and the percent of calls with warm transfers as opposed to callbacks. The test of the urgent disease reporting system was announced to the public health physician staff, but the exact schedule of test calls was kept secret. Dates and times of test calls were varied throughout the month. RESULTS During the month of June 2010, a total of nine test calls were made to the disease reporting system. Contact with an AO was made within 30 minutes for six calls (Table 1). Response times for successful calls ranged from three to 29 minutes with a mean of 11.5 minutes from initiating the phone call to reaching an AO. Of the six successful calls, three (50%) were warm transfers.
Table 1. Successful Call Line List
Time on hold
Call #
Type of Call Time of Call Out-come
County Operator
Morbidity Unit
ACDC Total Time
to reach AO
1 Business Hrs Afternoon CB ---- 2.5 min 5 min 29 min
2 After Hrs Morning CB 0 sec ---- ---- 17 min
3 Business Hrs Afternoon WT ---- 5 sec 10 sec 3 min
4 After Hrs Evening WT 0 sec ---- ---- 5 min
5 Business Hrs Afternoon WT ---- 3 sec 5 sec 3 min
6 After Hrs Evening CB 0 sec ---- ---- 12 min
WT=Warm Transfer; CB=Callback
Successful Calls Call #2, in particular, stood out for the smooth and professional manner in which it was handled. The CO was not only pleasant, but was a perfect example of customer service—they attempted a warm transfer, but first took the caller’s information in case of a disconnected call. In addition, the CO kept checking back with the caller to let them know that they were still trying to reach an AO. The call ultimately ended in a call back, well within the recommended 30 minute time frame, but the steps leading to that point were the way every call from a healthcare professional should be conducted.

Evaluation of Disease Reporting System
Page 59
Acute Communicable Disease Control 2010 Special Studies Report
Unsuccessful calls Three calls were not able to connect with an AO within the 30 minutes recommended by CDC (Table 2). In the first, the caller was connected to the CO, asked to leave a message and the CO would page the AO. The caller was told the CO would call them back once the AO had been reached. A callback was received 36 minutes after the call was initiated. In the second call, the caller was initially referred to Immunization Program (IP), a program outside the protocol, but insisted that they would like to speak with someone in ACDC. The caller was transferred to a nurse, who told the caller to call back later to speak with an on-call physician. When the caller said she would like to speak to the physician then, they were told the physician was not in the office and to call back later. No offer was made to take a message and have the on-call physician return the call when they arrived in the office. The caller checked in with the administrator of the test, who then tried the test call again, posing as the original caller’s “supervisor.” Contact with an AO was eventually made, 30 minutes after the initiation of the first call.
Table 2. Unsuccessful Call Line List
Time on hold
Call #
Type of Call Time of Call Out-come
County Operator
Morbidity Unit
ACDC Total Time
to reach AO
1 Business Hrs* Morning CB 0 sec ---- ---- 36 min
2 Business Hrs Morning WT ---- ---- 5 min 30 min
3 Business Hrs Afternoon NR ---- 3 sec 0 sec N/A CB=Callback; NR=No Response * Holiday
In the third call, the caller, posing as a physician, was transferred to ACDC from the Morbidity Unit. After reading the script, the caller was directed to call IP for assistance. The caller insisted that they would like to speak to another physician right then as it was an urgent case, but they were never transferred to an AO in ACDC. Instead, they were repeatedly directed to call IP. Suggested Improvements 1. Regularly review call-transfer procedures with ACDC front office and professional staff. External healthcare professionals calling about an urgent potential infectious disease case should be connected to the AOD or an appropriate back-up. As a last option, a message should be taken and a return call made as soon as possible. The caller should never be instructed to call back at a later time. 2. Remind on-call physicians to keep their communication devices close by so that urgent business and after-hours calls can be handled in a timely manner. 3. Infectious disease calls that may regularly be handled by another program (e.g., IP) should still be forwarded to an appropriate internal AOD if the external healthcare professional insists on speaking with someone immediately. DISCUSSION Most test calls reached an AO within 20 minutes; under the 30 minute standard recommended by the CDC. The telephone hardware systems functioned appropriately, but the need for improvements with the human element of the system were noted. Test callers reported back that County Operator, Morbidity Unit and ACDC staff were pleasant and professional on the phone. The evaluation of the LAC disease reporting system was successful in that it identified few problem areas in the response system that could be easily improved. The latest test shows that the current system is functional. The county maintains a system to receive reports 24 hours a day, 7 days a week and a toll-
Evaluation of Disease Reporting System Page 60
Acute Communicable Disease Control 2010 Special Studies Report
free hotline specific for receiving urgent disease case reports. The findings of this report have been shared with ACDC administration and areas of improvement have been discussed with appropriate staff affected by this response protocol. REFERENCES 1. U.S. Centers for Disease Control and Prevention. Improving Surveillance Infrastructure for Terrorism
Detection: The Eight-Cities Project Resource Materials. April 7, 2004. Available at: http://www.cdc.gov/epo/dphsi/8city.htm
2. Dausey DJ, Lurie N, Diamond A. Public Health Response to Urgent Case Reports. Health Affairs 2005; W5: 412—419.
3. ACDC. Responding to Urgent Case Reports: Testing the Los Angeles County Disease Reporting System. Acute Communicable Disease Control Special Studies Report 2006.
Influenza Season, School Absenteeism
Page 61
Acute Communicable Disease Control 2010 Special Studies Report
EVALUATING THE UTILITY OF SCHOOL ABSENTEEISM DATA 2009-2010 INFLUENZA SEASON
Cheryl Faustino, MPH; Patricia Araki, MPH; Emily Kajita, MS MPH; Megan Jones, MPH; and
Bessie Hwang, MD MPH BACKGROUND The epidemiology of influenza has suggested that school aged children play an important role in the acquisition and spread of ILI.1 During the pinnacle of the 2009-2010 H1N1 influenza pandemic, a principal focus on school absenteeism surveillance emerged — most notably as a non-traditional data source that could allow for earlier outbreak detection of like diseases.2 It has been postulated that school absenteeism data may detect various disease outbreaks early under the presumption that disease spreads rapidly in dense school populations. No study to date has been reported on school absenteeism surveillance data in Los Angeles County (LAC), which contains near 90 independent school districts, including the second largest school district in the nation.3 OBJECTIVE The purpose of this study was to evaluate the utility of LAC school absenteeism data from the largest school district in conjunction with current LAC Department of Public Health (DPH) Acute Communicable Disease Control (ACDC) Automated Disease Surveillance Section (ADSS) influenza-like-illness (ILI) surveillance systems during the 2009-2010 influenza season. METHODS Data Collection LAC school district absenteeism data, collected from school attendance, are negative-based (i.e., absence only) and completed by teachers via an electronic student information system; once per day for elementary schools, once per period for middle/high schools. Any final corrections to daily attendance are made at the end of the school day through an electronic administrative portal. School absenteeism data are received by ACDC ADSS in near real-time on a biweekly basis via Secure File Transfer Protocol. The line listed variables available within the dataset contained: date of school absence, school name, school address and zip code, school sub-district, track number, number of total students enrolled per school per date, and number of students absent per school per date. Reason for absence was not reported by schools. Aggregate percent absenteeism was calculated per date, per school per date, and by school-age groups (elementary/middle [E/M] school and high school) per date. ILI emergency department (ED) visits and over the counter (OTC) medication sales4 are current in-place surveillance systems utilized by ACDC ADSS. School-age stratified ILI ED visits were determined by age; where ages 5-13 were categorized as E/M school and ages 14-17 were categorized as high school. School or age data were not available for either OTC cough/cold medication sales or OTC thermometer sales, thus school-age categories were not created. Data Analysis For the purposes of this study, data available from September 1, 2009 through February 28, 2010 were examined. The dataset included 140 schools: 78 E/M schools and 62 high schools. Extreme data points with known explanations for high absenteeism (e.g., days preceding and succeeding major school holidays and winter recess) were removed. Wilcoxon-signed rank tests were performed to measure median differences in school-age percent absenteeism and in number of school-age ILI ED visits. Retrospective time series analyses were conducted to examine the correlations between percent school absenteeism and: (1) ILI ED visits, (2) OTC thermometer sales, and (3) OTC cough/cold medication sales. Cluster analyses were performed to explore levels of significant absenteeism at the school level.
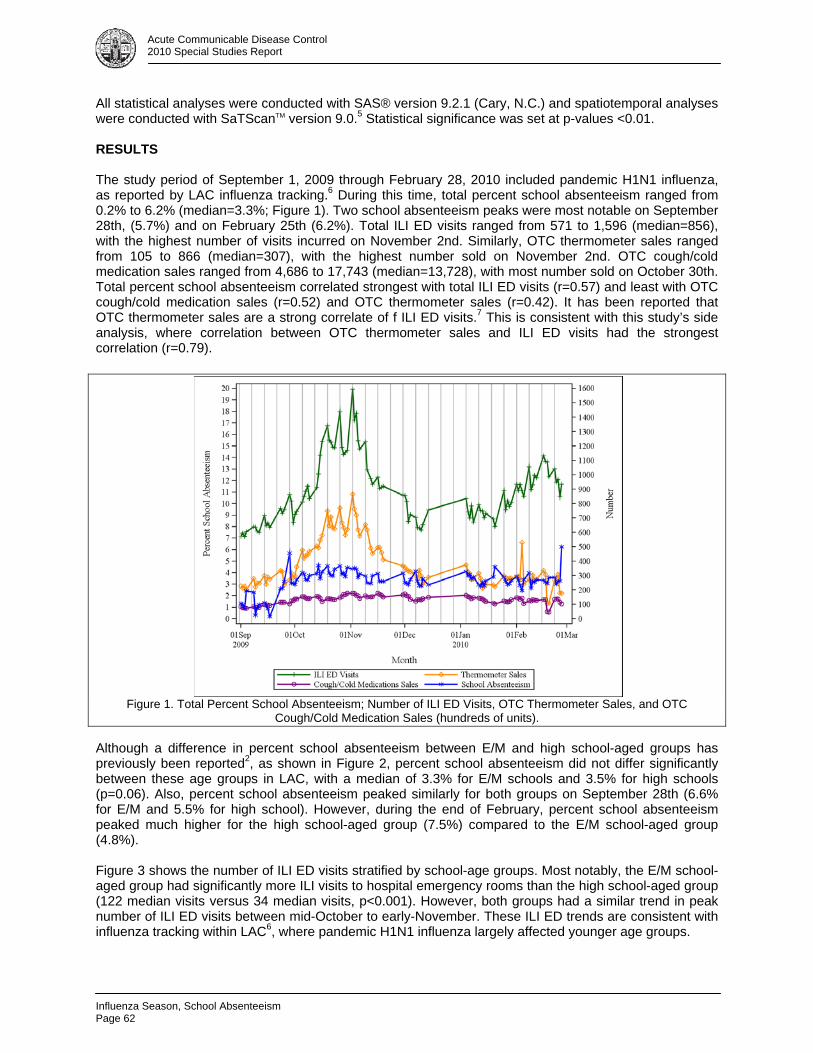
Influenza Season, School Absenteeism Page 62
Acute Communicable Disease Control 2010 Special Studies Report
All statistical analyses were conducted with SAS® version 9.2.1 (Cary, N.C.) and spatiotemporal analyses were conducted with SaTScanTM version 9.0.5 Statistical significance was set at p-values <0.01. RESULTS The study period of September 1, 2009 through February 28, 2010 included pandemic H1N1 influenza, as reported by LAC influenza tracking.6 During this time, total percent school absenteeism ranged from 0.2% to 6.2% (median=3.3%; Figure 1). Two school absenteeism peaks were most notable on September 28th, (5.7%) and on February 25th (6.2%). Total ILI ED visits ranged from 571 to 1,596 (median=856), with the highest number of visits incurred on November 2nd. Similarly, OTC thermometer sales ranged from 105 to 866 (median=307), with the highest number sold on November 2nd. OTC cough/cold medication sales ranged from 4,686 to 17,743 (median=13,728), with most number sold on October 30th. Total percent school absenteeism correlated strongest with total ILI ED visits (r=0.57) and least with OTC cough/cold medication sales (r=0.52) and OTC thermometer sales (r=0.42). It has been reported that OTC thermometer sales are a strong correlate of f ILI ED visits.7 This is consistent with this study’s side analysis, where correlation between OTC thermometer sales and ILI ED visits had the strongest correlation (r=0.79).
Figure 1. Total Percent School Absenteeism; Number of ILI ED Visits, OTC Thermometer Sales, and OTC
Cough/Cold Medication Sales (hundreds of units). Although a difference in percent school absenteeism between E/M and high school-aged groups has previously been reported2, as shown in Figure 2, percent school absenteeism did not differ significantly between these age groups in LAC, with a median of 3.3% for E/M schools and 3.5% for high schools (p=0.06). Also, percent school absenteeism peaked similarly for both groups on September 28th (6.6% for E/M and 5.5% for high school). However, during the end of February, percent school absenteeism peaked much higher for the high school-aged group (7.5%) compared to the E/M school-aged group (4.8%). Figure 3 shows the number of ILI ED visits stratified by school-age groups. Most notably, the E/M school-aged group had significantly more ILI visits to hospital emergency rooms than the high school-aged group (122 median visits versus 34 median visits, p<0.001). However, both groups had a similar trend in peak number of ILI ED visits between mid-October to early-November. These ILI ED trends are consistent with influenza tracking within LAC6, where pandemic H1N1 influenza largely affected younger age groups.
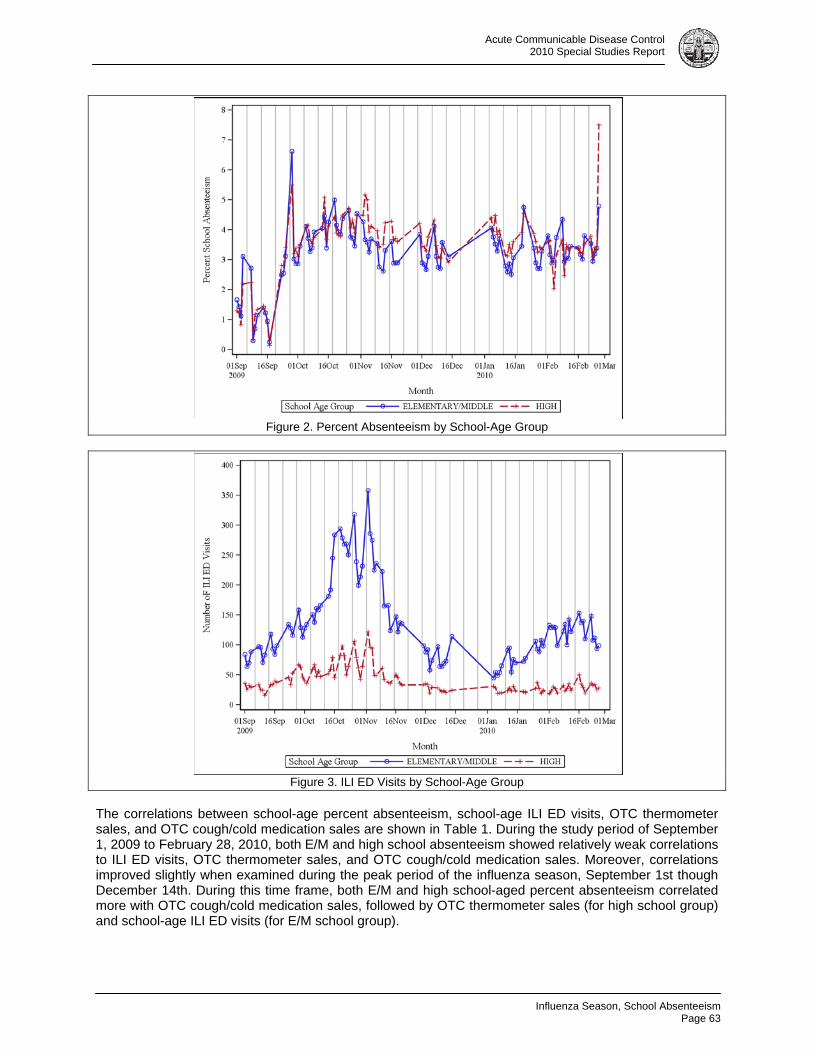
Influenza Season, School Absenteeism
Page 63
Acute Communicable Disease Control 2010 Special Studies Report
Figure 2. Percent Absenteeism by School-Age Group
Figure 3. ILI ED Visits by School-Age Group
The correlations between school-age percent absenteeism, school-age ILI ED visits, OTC thermometer sales, and OTC cough/cold medication sales are shown in Table 1. During the study period of September 1, 2009 to February 28, 2010, both E/M and high school absenteeism showed relatively weak correlations to ILI ED visits, OTC thermometer sales, and OTC cough/cold medication sales. Moreover, correlations improved slightly when examined during the peak period of the influenza season, September 1st though December 14th. During this time frame, both E/M and high school-aged percent absenteeism correlated more with OTC cough/cold medication sales, followed by OTC thermometer sales (for high school group) and school-age ILI ED visits (for E/M school group).

Influenza Season, School Absenteeism Page 64
Acute Communicable Disease Control 2010 Special Studies Report
Table 1. Pearson Correlation Coefficients by Dates and School-Age Group Full study Period
9/1/2009-2/28/2010 Peak Flu Period
9/1/2009-12/14/2009 Late Flu Period
12/15/2009-2/28/2010
E/M
School High School
E/M School
High School
E/M School
High School
School Absenteeism vs. ILI ED visits 0.45 0.36 0.57 0.49 -0.21 -0.19 School Absenteeism vs. OTC thermometer sales 0.40 0.41 0.55 0.62 -0.22 -0.31 School Absenteeism vs. OTC cough/cold medication sales 0.43 0.55 0.60 0.77 0.03 0.01
SaTScanTM spatiotemporal analysis was used to detect school absenteeism clusters during the peak period of the 2009-2010 influenza season (September 1-December 14), which included pandemic H1N1 influenza. Four statistically significant (p<0.01) school-specific absenteeism clusters were detected. The first cluster was detected at high school A on September 15-17 (observed/expected=15.1). The second cluster was detected at high school B on September 10-11 (observed/expected =23.1). The third and fourth clusters were detected at two different elementary schools but during the same time period of November 2-10 (elementary school A, observed/expected=4.6; elementary school B, observed/expected=2.81). These elementary school clusters coincided with the peak number of ILI ED visits observed in the E/M school-aged group on November 2nd (Figure 3).
Figure 4. SaTScanTM Map of School Absenteeism Clusters and School Type, Los Angeles County.
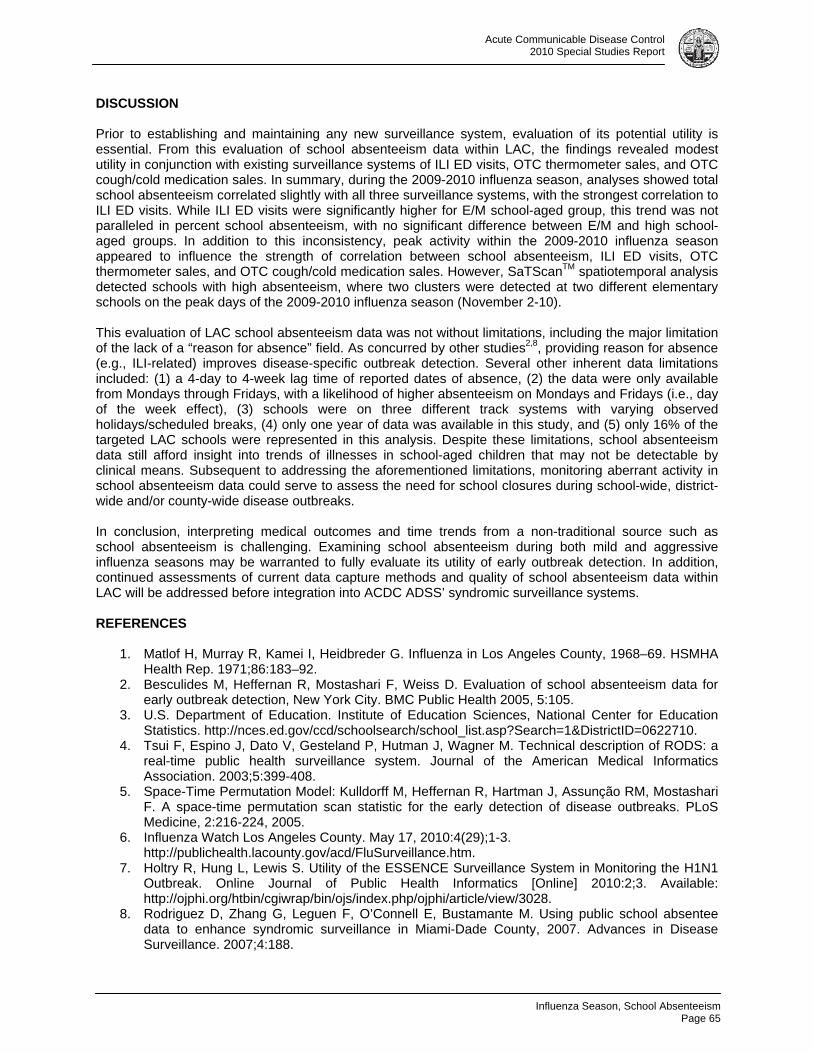
Influenza Season, School Absenteeism
Page 65
Acute Communicable Disease Control 2010 Special Studies Report
DISCUSSION Prior to establishing and maintaining any new surveillance system, evaluation of its potential utility is essential. From this evaluation of school absenteeism data within LAC, the findings revealed modest utility in conjunction with existing surveillance systems of ILI ED visits, OTC thermometer sales, and OTC cough/cold medication sales. In summary, during the 2009-2010 influenza season, analyses showed total school absenteeism correlated slightly with all three surveillance systems, with the strongest correlation to ILI ED visits. While ILI ED visits were significantly higher for E/M school-aged group, this trend was not paralleled in percent school absenteeism, with no significant difference between E/M and high school-aged groups. In addition to this inconsistency, peak activity within the 2009-2010 influenza season appeared to influence the strength of correlation between school absenteeism, ILI ED visits, OTC thermometer sales, and OTC cough/cold medication sales. However, SaTScanTM spatiotemporal analysis detected schools with high absenteeism, where two clusters were detected at two different elementary schools on the peak days of the 2009-2010 influenza season (November 2-10). This evaluation of LAC school absenteeism data was not without limitations, including the major limitation of the lack of a “reason for absence” field. As concurred by other studies2,8, providing reason for absence (e.g., ILI-related) improves disease-specific outbreak detection. Several other inherent data limitations included: (1) a 4-day to 4-week lag time of reported dates of absence, (2) the data were only available from Mondays through Fridays, with a likelihood of higher absenteeism on Mondays and Fridays (i.e., day of the week effect), (3) schools were on three different track systems with varying observed holidays/scheduled breaks, (4) only one year of data was available in this study, and (5) only 16% of the targeted LAC schools were represented in this analysis. Despite these limitations, school absenteeism data still afford insight into trends of illnesses in school-aged children that may not be detectable by clinical means. Subsequent to addressing the aforementioned limitations, monitoring aberrant activity in school absenteeism data could serve to assess the need for school closures during school-wide, district-wide and/or county-wide disease outbreaks. In conclusion, interpreting medical outcomes and time trends from a non-traditional source such as school absenteeism is challenging. Examining school absenteeism during both mild and aggressive influenza seasons may be warranted to fully evaluate its utility of early outbreak detection. In addition, continued assessments of current data capture methods and quality of school absenteeism data within LAC will be addressed before integration into ACDC ADSS’ syndromic surveillance systems. REFERENCES
1. Matlof H, Murray R, Kamei I, Heidbreder G. Influenza in Los Angeles County, 1968–69. HSMHA Health Rep. 1971;86:183–92.
2. Besculides M, Heffernan R, Mostashari F, Weiss D. Evaluation of school absenteeism data for early outbreak detection, New York City. BMC Public Health 2005, 5:105.
3. U.S. Department of Education. Institute of Education Sciences, National Center for Education Statistics. http://nces.ed.gov/ccd/schoolsearch/school_list.asp?Search=1&DistrictID=0622710.
4. Tsui F, Espino J, Dato V, Gesteland P, Hutman J, Wagner M. Technical description of RODS: a real-time public health surveillance system. Journal of the American Medical Informatics Association. 2003;5:399-408.
5. Space-Time Permutation Model: Kulldorff M, Heffernan R, Hartman J, Assunção RM, Mostashari F. A space-time permutation scan statistic for the early detection of disease outbreaks. PLoS Medicine, 2:216-224, 2005.
6. Influenza Watch Los Angeles County. May 17, 2010:4(29);1-3. http://publichealth.lacounty.gov/acd/FluSurveillance.htm.
7. Holtry R, Hung L, Lewis S. Utility of the ESSENCE Surveillance System in Monitoring the H1N1 Outbreak. Online Journal of Public Health Informatics [Online] 2010:2;3. Available: http://ojphi.org/htbin/cgiwrap/bin/ojs/index.php/ojphi/article/view/3028.
8. Rodriguez D, Zhang G, Leguen F, O’Connell E, Bustamante M. Using public school absentee data to enhance syndromic surveillance in Miami-Dade County, 2007. Advances in Disease Surveillance. 2007;4:188.
Influenza Season, School Absenteeism Page 66
Acute Communicable Disease Control 2010 Special Studies Report
Varicella Screening
Page 67
Acute Communicable Disease Control 2010 Special Studies Report
PATIENTS, HEALTHCARE WORKERS AND VARICELLA SCREENING: AN ARGUMENT FOR HOSPITAL POLICY CHANGE
Dawn Terashita, MD, MPH; L’Tanya English, RN, MPH
BACKGROUND Healthcare worker (HCW) exposure to varicella continues to occur. Nosocomial transmission and outbreaks of varicella among patients, visitors and HCWs in the acute care hospital are well documented. 1-3 Prevention in this setting has significant and sometimes hidden economic costs for patients and HCWs, including disease surveillance, serologic testing, paid leave and isolation supplies and equipment for nosocomial cases of varicella.4 The Centers for Disease Control and Prevention (CDC) Advisory Committee on Immunization Practices (ACIP) and Hospital Infection Control Practices Advisory Committee (HICPAC) have recommended varicella screening of HCWs since 1997.5 Professional healthcare organizations also recommend varicella screening of HCWs, such as the American Academy of Pediatrics (AAP) and the American Academy of Family Physicians.6, 7 The ACIP also recommends varicella immunization for susceptible HCWs especially those who have close contact with persons at high risk for serious complications, including a) premature infants born to susceptible mothers, b) infants who are born at less than 28 weeks of gestation or who weigh less than or equal to 1,000 g at birth (regardless of maternal immune status), c) pregnant women, and d) immunocompromised persons. The CDC recommends that all healthcare personnel be immune to varicella. Evidence of immunity includes documentation of two doses of varicella vaccine given at least 28 days apart, history of varicella or herpes zoster based on physician diagnosis, laboratory evidence of immunity, or laboratory confirmation of disease. In early spring 2010, Hospital A, a 400-bed acute care facility, notified Public Health of two cases of confirmed varicella infection (one herpes zoster [shingles], one varicella [chicken pox] among patients who were roommates in a six-bed room for three days. In addition, two healthcare workers (HCWs) were diagnosed with varicella. This report describes the investigation, management, control recommendations, and policy change implemented as a result of the investigation. METHODS A case was defined as a patient or HCW clinically diagnosed with either herpes zoster (HZ) or varicella. Our investigation included medical record review, conference calls, on-site investigation, telephone interviews, vaccination policy review, and antibody testing. We reviewed patient and staff exposures, staff vaccination status and staffing records. HCW evidence of varicella immunity is defined as documentation of age-appropriate vaccination with a varicella vaccine, laboratory evidence of immunity or laboratory confirmation of disease, and diagnosis or verification of a history of varicella disease or herpes zoster by a health care provider. The CDC and California Department of Public Health (CDPH) HCW vaccination recommendations were also reviewed. RESULTS Two patients, case patient 1 and case patient 2, and two employees, HCW case 1 and HCW case 2, met the case definition. The medical record was reviewed for both case patients. Prior history of varicella for case patient 1 was unknown. Case patient 2 did not have varicella as a child by self report. There was no documentation of a rash upon admission for either case patient. Case patient 1, a 50 year old Hispanic White female, was hospitalized continuously for five months prior to rash onset on March 2, 2010. The rash was noted on the chest in a dermatomal area around the left breast, left upper back, upper thoracic and lower cervical area; itching and pain were prominent.
Varicella Screening Page 68
Acute Communicable Disease Control 2010 Special Studies Report
Treatment included oral antiviral medication. This patient was considered to be the index case, diagnosed with herpes zoster, which is a reactivation of VZV and not nosocomially acquired. Case patient 2, a 45 year old non-Hispanic/non-Latin White female, was hospitalized three months prior to rash onset on March 18, 2010 which began with a blister on the chest and eventually extended to all of the body. Vesicles in different stages were noted on the chest, trunk, upper extremities and face, consistent with varicella. Treatment included oral antiviral medication and topical lotion. Case patient 2 resided in the same room as case patient 1 while case patient 1 was symptomatic. Telephone interviews with both HCW cases were conducted utilizing the CDC Varicella Case Report form. Medical record information from their private healthcare providers was also reviewed. Both HCWs were born outside the United States. HCW case 1 was born in Mexico and HCW case 2 was born in Indonesia.
HCW case 1 had no prior history of varicella infection and reported receiving two doses of varicella vaccine, the first dose received during childhood in Mexico and the second dose given in California but the date of administration is unknown. HCW case 1 was symptomatic with fever three days prior to rash onset. Additional symptoms included headache, backache, nausea and malaise. HCW case 1 reported to a private medical doctor (PMD) for evaluation on the day of fever onset. This was not verified by PMD office staff, who stated that HCW case 1 was not seen in the office at any time during the month of fever onset. HCW case 1 did not take any time off from work after initial symptom onset. Seventeen days after reported onset of fever, HCW case 1 was evaluated by hospital occupational health services (OHS), clinically diagnosed with varicella, taken off of work and advised to see the PMD. Later the same day, HCW case 1 was evaluated by a different PMD, had multiple erythematous open vesicles some final healing stages and some new vesicular non-open lesions, and was diagnosed with varicella. HCW case 1 had a PMD follow-up visit two weeks later and returned to work 19 days after being sent home. Staffing records indicated that HCW case 1 was assigned to provide care to case patient 1 and case patient 2 while they were symptomatic. HCW case 2 self reported varicella at age 12 years. HCW case 2 had fever onset eleven days after the onset of symptoms for HCW case 1. Symptoms included a maculo-papular, vesicular rash two days after fever onset, chills, malaise and sore mouth. HCW case 2 was evaluated by the PMD, diagnosed with varicella, and taken off work five days after initiation of symptoms. During a PMD follow-up visit one week later, HCW case 2 was diagnosed with mild local cellulitis. Treatment included an oral antibiotic and antiviral and pain medications. HCW case 2 returned to work 16 days after being taken off work. HCW case 2 was assigned to case patient 1 prior to the patient’s symptomatic period. HCW case 2 and HCW case 1 were friends and ate lunch together on several occasions during the period of communicability of HCW case 1. ACDC public health nursing staff collected skin scrapings from HCW case 1 and HCW case 2. A skin scraping was obtained from case patient 2 by hospital staff. All scrapings were submitted to the Public Health Laboratory (PHL) for confirmatory testing. Test results for HCW case 1 showed that one specimen was varicella zoster virus (VZV) positive and one specimen was VZV negative by polymerase chain reaction (PCR). Test results for HCW case 2 showed both specimens were VZV positive by PCR. A skin scraping collected by facility staff on case patient 2 tested VZV positive by PCR. All skin scrapings were also submitted to the CDC to differentiate community or wild type strain versus reactivation from the attenuated vaccine strain. The scrapings for case patient 2 and HCW case 2 were VZV positive, wild type. The scraping for HCW case 1 was VZV negative at the CDC; this result may be due to the timing of specimen collection. The specimen was collected 16 days after rash onset, and the sensitivity of PCR for skin scraping result begins to decrease 5 days after rash onset. A skin scraping specimen was not available for case patient 1. The hospital implemented control measures after each case patient was diagnosed. Control measures implemented for case patient 1 included contact and respiratory precautions, covering the lesions, and
Varicella Screening
Page 69
Acute Communicable Disease Control 2010 Special Studies Report
enhanced surveillance to identify new cases. After diagnosis, case patient 2 was placed on airborne precautions in a negative air pressure room. Two conference calls were conducted with hospital administration, medical, infection control, nursing, pharmacy and occupational health services staff. Outbreak management, HCW VZV serology and/or varicella immunization status, movement of potentially exposed patients and related topics were discussed. Interim recommendations were also provided and included:
determine which patients and staff had exposure with any case during the infectious period, defined as 5 days prior to rash onset until the crusting of the lesions
interview exposed patients and staff for history of clinically diagnosed chicken pox, a varicella serologic titer showing evidence of past infection, or documentation of varicella vaccination by a health care provider
test serum specimens from all non-immune exposed patients and HCW for varicella antibodies perform skin/vesicle scraping on patient cases for confirmation of diagnosis conduct enhanced surveillance for additional cases offer vaccine to all susceptible exposed individuals establish if any pregnant or immunosuppressed patient was eligible for varicella-zoster immune
globulin (VariZIG™). It was subsequently determined that post exposure prophylaxis with VariZIG™ was not applicable since it was already beyond the 96 hours exposure time period
The hospital followed up on Public Health recommendations. Hospital administration notified staff by memorandum and provided two status updates. Information regarding outbreak management, possible exposure, varicella antibody status, vaccine availability and related data was provided. Staffing records and work assignments for both HCW cases were reviewed to establish if either HCW case had been assigned to either patient case prior to the outbreak. The records indicated that HCW 1 was assigned to provide care to case patient 1 and case patient 2. HCW 2 was assigned to case patient 1 during the patient’s exposure period. HCW 2 was not assigned to case patient 2. A site investigation was conducted to discuss the outbreak status and management activities, gather additional data, tour the unit, and provide feedback and recommendations. Participants included administration, nursing, physicians, infection control and OHS. The facility was clean and orderly upon visual inspection and no lapses in staff infection control practices were noted. A list of potentially exposed patients and staff was requested to project the amount of vaccine that may be needed. There were 248 staff and 49 patients who had close contact with at least one of the four cases, for a total of 297 potentially exposed individuals. Four of the 297 potentially exposed individuals were pregnant. The hospital accepted a verbal history of varicella and did not require written documentation of HCW varicella vaccination. VZV serologies were obtained on 24 of the 248 exposed HCWs who could not verify prior disease or vaccination; these were tested by the PHL to determine varicella antibody status. Twenty-one HCWs had VZV antibody detected and three HCW did not have antibody detected. All VZV antibody negative HCWs were informed of their antibody status by hospital staff and offered varicella vaccine. It is unknown if the VZV antibody positive HCWs were notified of their antibody status. None of the 49 exposed patients had serology drawn. The hospital estimated the anticipated number of varicella vaccine doses required to vaccinate potentially exposed individuals (n=72). The Department of Public Health Immunization Program delivered 70 doses of varicella vaccine for exposed individuals. Seven of forty-nine exposed patients hospitalized on the same unit as the two case patients were assessed and identified as potentially exposed. Six received their initial varicella vaccine dose and one refused the vaccine. The status of the remaining 42 patients was not provided. Two exposed HCW who did not have detectable VZV antibody also received varicella vaccine. The vaccination status of the third non-immune exposed HCW was unknown.
Varicella Screening Page 70
Acute Communicable Disease Control 2010 Special Studies Report
A draft employee immunization policy dated March 2010 was reviewed and determined to be consistent with community standards. There was no prior HCW immunization policy. California law does not require proof of varicella antibody status for HCWs prior to employment in a healthcare facility, although ACIP strongly recommends that healthcare institutions ensure that all HCW provide evidence of varicella immunity. 8, 9 Per the California Code of Regulations (CCR), Title 22, §70723, Employee Health Examinations and Health Records: 10
Personnel evidencing signs or symptoms indicating the presence of an infectious disease shall be medically screened prior to having patient contact. Those employees determined to have infectious potential as defined by the Infection Control Committee shall be denied or removed from patient contact until it has been determined that the individual is no longer infectious.
Personnel shall be made aware of recommended vaccinations for preventable diseases that can be prevented by vaccination.
The California DPH Division of Occupational Health and Safety (Cal/OSHA) designated varicella an aerosol transmissible disease in September 2010 and developed new requirements to protect HCWs in the event of occupational exposure.11 HCWs must be offered vaccines against aerosol transmissible diseases, including varicella, free of cost to the worker. DISCUSSION Varicella (chicken pox) is a highly contagious disease caused by VZV. The incubation period is 14-16 days with a range of 10-21 days. Herpes zoster is caused by reactivation of VZV and is seen most frequently in aging and immunosuppressed individuals. Transmission is person to person by direct contact with individuals with varicella or zoster and occasionally occurs by airborne spread from respiratory tract secretions, and rarely, from zoster lesions. People are usually infectious 1-2 days prior to rash onset and until all lesions are crusted (exposure period). Hospital varicella outbreaks that began with a herpes zoster infection of the index case, although infrequent, have been documented in the literature.12, 13 In California, laws and regulations concerning employee health are found in the CCR, the California Health and Safety Code and CalOSHA. CCR Title 22 provides general legislation for hospitals to address HCWs health status upon hire and annually thereafter, which consists of an initial health examination and tuberculosis (TB) screening, with annual TB screening thereafter. HCWs must be free of signs or symptoms of infectious disease and be medically screened prior to patient contact. The law also addresses record maintenance as well as employee awareness of vaccinations for vaccine preventable diseases. There were no definitive varicella screening or vaccination policies presented to us at the time of the outbreak. Two patients and two HCWs met the case definition. The index case, case patient 1, was clinically diagnosed with HZ; no specimen was available for testing. The roommate, case patient 2, was clinically diagnosed with varicella 16 days after exposure to the index case and was VZV positive by PCR. Both case HCWs cared for case patient 1 and were diagnosed with varicella by PCR of skin scrapings. We hypothesize that the index case was likely the source of transmission to case patient 2 while both were roommates. Transmission to HCW case 1 most likely occurred while caring for case patient 1. Transmission to HCW case 2 most likely occurred while caring for case patient 1 or from HCW case 1 to HCW case 2. Two hundred ninety-seven potentially exposed individuals (248 HCWs, 49 patients) had close contact with at least one case. VZV serologies obtained on 24 exposed HCWs without verified prior disease or vaccination indicated 21 (87.5%) with and 3 (12.5%) without VZV antibody. Seven (14%) of 49 patients were identified as susceptible; 6 received varicella vaccine and one refused vaccine. The status of the remaining 42 patients was unknown. Two potentially exposed HCWs who did not have detectable VZV antibodies were vaccinated. The vaccination status of the third susceptible HCW was unknown.
Varicella Screening
Page 71
Acute Communicable Disease Control 2010 Special Studies Report
Although there were HCWs who were possibly exposed and whose vaccination status or disease history was unknown, we were informed that no HCWs were furloughed from work or temporarily reassigned, which is not consistent with recommended guidelines for HCWs. None of the 49 possibly exposed patients had varicella serology drawn. Six patients (12%) received varicella vaccine and one patient refused the vaccine. CONCLUSION The CDC recommends that healthcare institutions establish protocols for screening and vaccinating HCW and for management of HCWs after VZV exposure in the workplace. Prior to the outbreak, HCW varicella screening was inconsistent and HCWs were not required to provide evidence of varicella immunity. As a result of this investigation, the draft policy was changed to require evidence of immunity or lab confirmation of disease. The policy covers hospital employees including contract staff, volunteers, trainees and students. It addresses several communicable diseases, including aerosol transmissible diseases, verification of immunity, mandatory declination for declined vaccinations, and work restrictions, if indicated. This policy change may help to prevent future varicella transmission to susceptible patients and HCWs. REFERENCES 1. Weber DJ, Rutala WA. Prevention and control of varicella in hospitals. UpToDate® [online] ©2011 Available at: http://www.uptodate.com/online/content/topic.do?topicKey=inf_con/6095&view=print. Accessed January 20, 2011. 2. Haiduven DJ, Hench CP, Simpkins SM, Scott KE, Stevens DA. Management of varicella-vaccinated patients and employees to varicella in the healthcare setting, Infect Control and Hosp Epidemiol. 2003;24:538-543. 3. Weber DJ, Rutala WA, Schaffner. Lessons learned: protection of healthcare workers from infectious disease risks. Crit Care Med. 2010;38 (Suppl 8):S306-S314. 4. Tennenberg A, Brassard JE, Van Lieu J, Drusin L. Varicella vaccination for healthcare workers at a university hospital: an analysis of costs and benefits. Infect Control and Hosp Epidemiol 1997;18:405-411. 5. CDC. Immunization of Health-Care Workers: Recommendations of the Advisory Committee on Immunization Practices (ACIP) and the Hospital Infection Control Practices Advisory Committee (HICPAC). MMWR 1997; 46(RR-18);1-42. Available at: http://www.cdc.gov/mmwr/preview/mmwrhtml/00050577.htm. 6. AAP: Practice Management Online. 2006. Maintaining Standards of Excellence: Part 10: Standards for Child and Adolescent Immunization Practices.. Available at: http://practice.aap.org/popup.aspx?aID=1633&print=yes&isKeyContent=0. 7. AAFP: Special Medical Reports, March 15, 1998, ACIP releases recommendations for the immunization of health care workers. Available at: http://www.aafp.org/afp/98031ap/smr.html 8. CDC. Immunization of Health-Care Workers: Recommendations of the Advisory Committee on Immunization Practices (ACIP) and the Hospital Infection Control Practices Advisory Committee (HICPAC). MMWR 1997; 46(RR-18); 1-42. Available at: http://www.cdc.gov/mmwr/preview/mmwrhtml/00050577.htm. 9. CDC. Prevention of Varicella: Recommendations of the Advisory Committee on Immunization Practices (ACIP). MMWR 2007; 56(RR-4); 1-40. Available at: http://www.cdc.gov/mmwr/PDF/rr/rr5604.pdf.
Varicella Screening Page 72
Acute Communicable Disease Control 2010 Special Studies Report
10. Barclays Official California Code of Regulations, Title 22. Social Security, Division 5. Licensing and Certification of Health Facilities, Home Health Agencies, Clinics, and Referral Agencies, chapter 1. General Acute Care Hospitals, Article 7. Administration, §70723. Employee Health Examinations and Health Records. Available at: http://lnk.nu/weblinks.westlaw.com/1ovh.aspx 11. California Code of Regulations, Title 8, Subchapter 7. General Industry Safety Orders, Group 16. Control of Hazardous Substances, Article 109. Hazardous Substances and Processes, § 5199, Aerosol Transmissible Diseases 5199, Aerosol Transmissible Diseases. Available at: http://www.dir.ca.gov/Title8/5199.html 12. Breuer J. Herpes zoster: new insights provide an important wake-up call for management of nosocomial transmission. JID. 2008; 197:635-637. 13. Faizallah R, Green HT, Krasner N, Walker RJ.Outbreak of chickenpox from a patient with immunosuppressed herpes zoster in hospital, BMJ.1982; 285:1022-1023.
Pertussis Epidemic
Page 73
Acute Communicable Disease Control 2010 Special Studies Report
EXAMINATION OF A UNIQUE PERTUSSIS EPIDEMIC IN LOS ANGELES COUNTY
Vi Nguyen, MPH, Idriss Fassassi, MPH, Eva Weinstein, MPH, Marifi Pulido, MPH, PhD,
Alvin Nelson El Amin, MD, MPH, and Duli Kodagoda, MPH
This article will be published in near future.

Pertussis Epidemic Page 74
Acute Communicable Disease Control 2010 Special Studies Report

Pertussis Epidemic
Page 75
Acute Communicable Disease Control 2010 Special Studies Report

Pertussis Epidemic Page 76
Acute Communicable Disease Control 2010 Special Studies Report
Mumps Outbreak
Page 77
Acute Communicable Disease Control 2010 Special Studies Report
THE IMPACT OF AN EAST COAST MUMPS OUTBREAK
ON LOS ANGELES COUNTY
Vi Nguyen, MPH, Alvin Nelson El Amin, MD, MPH, and Duli Kodagoda, MPH
This article will be published in near future.

Mumps Outbreak Page 78
Acute Communicable Disease Control 2010 Special Studies Report

Mumps Outbreak
Page 79
Acute Communicable Disease Control 2010 Special Studies Report

Mumps Outbreak Page 80
Acute Communicable Disease Control 2010 Special Studies Report


![[PPT]Clostridium botulinium and Botulism - Santa Monica …homepage.smc.edu/.../presentations/clostridium-botulinum.ppt · Web viewTitle Clostridium botulinium and Botulism Author](https://img.pdfslide.net/doc/110x75/5ad21b467f8b9a0f198c0cca/pptclostridium-botulinium-and-botulism-santa-monica-viewtitle-clostridium.jpg)