Embed Size (px)
Citation preview

Annual Report & Accounts 2012
Specialist Paper & Advanced Materials

pages - | 1
VisionStatement
To prosper and grow through developing aportfolio of complementary and successfulbusiness activities
OurCompanyGoal
- the beliefs and standards by which wewill deliver our Company Goal
• An absolute commitment to safety andthe environment
• Having integrity and high standards ineverything we do
• Treating everyone with dignity andrespect
• Valuing customers as the lifeblood of ourbusiness
• Developing the potential of ouremployees in a stimulating and enjoyableworkplace
• Being enthusiastic about doing thingsbetter
• Making a positive contribution to ourcommunity
• Improving profitability and having the driveto succeed
OurValues
James Cropper plc

Pride pages 2 | 3
2012 Pride Awards
James Cropper plc Annual Report and Accounts 2012
Customer ServiceOur statement of Values recognises customers as the lifeblood of our business. Everyone in the organisation has theopportunity of contributing towards the exceptional service which our customers expect, even if they are several linksin the chain removed from the final customer. The winners of this category were Sherrie Brown, TFP Customer Service,Stefan Pryor, JCSP Inside Sales Executive and Danny Little, JCSP Palletmaker.
Taking PrideIt might sound a bit old fashioned and can take many forms, but we all recognise it when we see it. The Values statementtalks about having high standards in everything we do and this category recognises those employees who set the barwhen it comes to doing their job to the highest personal and professional standards. The winners of this category wereAndrew Ferguson, TFP Operator and Marcus Deacon, TFP Warehouse Operator.
The full Pride Award story which relates to Winners andCommendations, can be read by scanning the QR code or visitingwww.jamescropper.com/pride
Safety ImprovementOur absolute commitment to safety needs passionate safety champions throughout the organisation. Winners of thisaward have all contributed to making the workplace safer for everyone and have been ready to challenge unsafe practiceswherever they have seen them. The winner of this category was Chris May, JCC Converting Operator.
CommunityThe Mill has been a central part of the local community for 167 years. Many employees make a valuable contribution to thefabric of life in Burneside and South Lakeland, whether in education, sport or charitable activities. The winner of thiscategory was Mike Jeschke, TFP Research Manager.
Support for ColleaguesLife inevitably throws up challenges to all of us from time to time, either at work or in our private lives. This awardrecognises those unsung individuals who colleagues know they can turn to for help, advice or simply someone to talk to.The winners of this category were Kevin Allen, JCSP Shift Co-ordinator and Tony Bellas, JCSP Blenderman.
Innovation and CreativityA key element in ensuring that the Company continues to maintain a competitive edge in a fast changing and dynamicworld. Having the desire and confidence to do new things and old things differently has characterised the development ofthe business for generations and is more important now than ever. The winner of this category was Alan McKnight, JCSPCutterman.
Many companies have their own set of organisational values and shareholders will have seen those of James Cropperpublished in the Annual Report every year since the late 1990’s. In 2009 we reaffirmed this commitment to our values byintroducing the James Cropper Pride Awards which set out to celebrate outstanding achievement and effort in a number ofdifferent categories.
Employees are nominated by their colleagues.
Chris
Kevin Tony
Mike
Alan
Sherrie
Andrew
Stefan
Marcus
Danny
“the Pride Awardsare a celebration
of the outstandingachievements ofour employees”
“the winners ofthe Pride Awards setthe bar for personaland professionalstandards ”

Contents
James Cropper plc Annual Report and Accounts 2012
Summary of Results
6 | 7
Directors, Bankers and Advisors
8 | 9
Chairman’s Review
10 | 11
Financial and Operating Review
12 | 22
Report of the Directors
23 | 28
Directors’ Remuneration Report
29 | 31
Report of the Independent Auditor
32 | 32
Statement of Comprehensive Income
33 | 33
Statement of Financial Position
34 | 34
Statement of Cash Flows
35 | 35
Statement of Changes in Equity
36 | 36
Notes to the Financial Statements
38 | 66
Shareholder Information
67 | 67
Notice of Annual General Meeting
68 | 69

James Cropper plc Annual Report and Accounts 2012
Summary of Results2012 2011 2010 2009 2008
Group turnover £'000 £'000 £'000 £'000 £'000Continuing operations 78,223 83,264 70,714 69,129 66,542The Paper Mill Shop (discontinued operation) - 3,609 5,516 5,674 6,202
78,223 86,873 76,230 74,803 72,744
Trading profit before interest 1,207 1,665 3,568 1,556 2,365Depreciation 2,675 3,072 3,138 3,179 3,280EBITDA (before IAS 19 pension adjustment) 3,882 4,737 6,706 4,735 5,645
Trading profit before interestContinuing operations 1,207 3,361 3,942 1,944 2,723The Paper Mill Shop (discontinued operation) - (1,696) (374) (388) (358)
1,207 1,665 3,568 1,556 2,365Trading activitiesTechnical Fibre Products 629 2,289 1,327 2,099 1,426Speciality Papers 1,430 587 3,437 (310) 1,281Converting 192 1,272 446 406 548The Paper Mill Shop (discontinued operation) - (1,696) (374) (388) (358)Other Group expenses (158) (119) (393) (19) (147)
2,093 2,333 4,443 1,788 2,750Director and employee bonuses (86) (668) (875) (232) (324)Trading operating profit 2,007 1,665 3,568 1,556 2,426Joint venture - - - - (61)Redundancy provision (800) - - - -Trading profit before interest 1,207 1,665 3,568 1,556 2,365Net interest (364) 29 (271) (448) (402)
Trading profit before tax 843 1,694 3,297 1,108 1,963(After future service pension contributions paid)
Net IAS 19 pension adjustments toNet current service charge required (539) (763) (255) (476) (610)Exceptional curtailment adjustment - 10,158 - - -
Operating profit (539) 9,395 (255) (476) (610)Net interest 667 (3) (626) 226 227
Net pension adjustment before tax 128 9,392 (881) (250) (383)
Overall Group after pension adjustmentsOperating profit 1,468 11,060 3,313 1,080 1,816Joint venture - - - - (61)Redundancy provision (800) - - - -Profit before interest 668 11,060 3,313 1,080 1,755Net interest 303 26 (897) (222) (175)
Profit before Tax 971 11,086 2,416 858 1,580Profit/(loss) before Tax
Continuing operations 971 12,812 2,790 1,246 1,938The Paper Mill Shop (discontinued operation) - (1,726) (374) (388) (358)
971 11,086 2,416 858 1,580
Earnings/(losses) per Share - diluted 9.5p 117.4p 25.5p (1.0p) 14.0pContinuing operations after IAS 19
Dividends per Share 7.9p 7.9p 7.5p 5.1p 7.3p
Balance Sheet Summary £'000Non-pension assets - excluding cash 46,278 44,000 43,852 43,753 45,616Non-pension liabilities - excluding borrowings (11,956) (13,841) (15,800) (12,592) (12,640)
34,322 30,159 28,052 31,161 32,976Net IAS 19 pension deficit (after deferred tax) (5,850) (1,039) (10,210) (6,535) (1,299)
28,472 29,120 17,842 24,626 31,677Net borrowings (6,505) (1,711) (31) (4,452) (6,016)Equity shareholders' funds 21,967 27,409 17,811 20,174 25,661Gearing % - before IAS 19 deficit 23 6 - 17 22Gearing % - after IAS 19 deficit 30 6 - 22 23Capital Expenditure £'000 5,934 2,276 1,228 1,333 2,337
Notes to Summary of Results1. All references to: "Profit and Loss Account" refers to the Statement of Comprehensive Income.
"Balance Sheet" refers to the Statement of Financial Position. "Reserves" refers to the Statement ofChanges in Equity.Management have chosen to maintain the terminology that readers are familiar with.
2. “Trading Profit” refers to profits prior to interest on borrowings, “Net IAS 19 pension adjustment”and tax.
3. “Trading Profit before tax” refers to profits prior to “Net IAS 19 pension adjustment”.4. “Net IAS 19 pension adjustment” in the Profit and Loss Account refers to the net impact on the
Profit and Loss Account of the pension schemes’ operating costs and finance costs, as describedin the IAS 19 section of the Financial and Operating Review.
pages 6 | 7
£m
7
6
5
4
3
2
1
0
Depreciation Trading Profit
EBITDA
£m
7
6
5
4
3
2
1
0
EBITDA CAPEX
Funds and Capital ExpenditureNET DEBT
2008 2009 2010 2011 2012
35
30
25
20
15
10
5
0
Pre-pension deficit Post-pension deficit
Gearing
£m
5
4
3
2
1
0
-1
-2
Continuing Operations
Trading ProfitDiscontinuing Operations
2008 2009 2010 2011 2012
£m
70
60
50
40
30
20
10
0
Speciality Papers Converting
External Turnover - Business Segmentation
TFP
2008 2009 2010 2011 2012
Continuing operations
2008 2009 2010 2011 2012
70
60
50
40
30
20
10
0
% %
UK Europe
External Turnover - Geographical SegmentationAmericas Other
2008 2009 2010 2011 2012
Continuing operations
2008 2009 2010 2011 2012

James Cropper plc Annual Report and Accounts 2012
Chairman
Mark Cropper, MABorn in 1974. He joined the Board in 2006 and succeeded
his father as Chairman following the 2010 AGM. Mark Cropper
is the sixth generation of the Cropper family to be involved in
the business. He is Managing Director of Ellergreen Hydro Ltd,
a developer of hydro-electric projects. He is also a director of
Ellergreen Ltd, Ellergreen Tidal Ltd and Logan Gill Hydro Ltd.
Executive Directors
Alun I Lewis, BSc, MBAChief Executive . Managing Director, James CropperSpeciality Papers LimitedBorn 1957. He joined the Group in 1987 from Wiggins Teape
Limited and the Board in April 1998, becoming Chief Executive
in January 2001.
John M Denman, BSc, FCAGroup Finance DirectorBorn 1952. He joined the Group and the Board in 1995 from
Cable & Wireless PLC. He is responsible for Finance,
Purchasing, Information Systems and Safety and Environment.
He is a former trustee of the James Cropper plc Pension
Scheme, Treasurer of the Confederation of Paper Industries
Limited and a former Director of the Paper Federation of Great
Britain Limited.
Nigel A Read, BASales and Marketing Director, James Cropper SpecialityPapers LimitedBorn 1954. He joined the Group in 1981 from Robert Fletcher
& Sons Limited and the Board in 1998. He is a former trustee
of the James Cropper plc Pension Scheme.
Patrick J Willink, BSc, MBAOperations Director, James Cropper Speciality PapersLimitedBorn 1964 – is also related to the founder. He joined the
Group in 1990 from Aquascutum Limited and the Board in
1998.
George T Quayle, BSc, C. Chem, MRSCManaging Director, Technical Fibre Products LimitedBorn 1953. He joined the Group in 1992 from Whatman PLC
and the Board in 1998.
Directors,Bankers and Advisors
pages 8 | 9
Non Executive Directors
Sir James A Cropper, KCVO, BA, FCABorn 1938. He joined the Company in 1966. He became Non-
Executive Chairman in 2001 and resigned from this position
following the 2010 AGM. He is now a Non-Executive Director.
He is Lord-Lieutenant of Cumbria.
David R Wilks, LLB (Hons)Born 1954. He joined the Board in April 2004. He is a Director
of Wilks & Partners, a management consultancy company he
founded in 2001. Prior to this, he had extensive manufacturing
operations experience with H J Heinz and United Biscuits and
was a Director of ER Consultants.
James Sharp, BABorn 1967. He joined the Board in 2009. He is a partner of
Sirius Equity LLP, an investment firm which specialises in the
retail and luxury goods sectors, whose investments include
L K Bennett and Jeckerson. Previously he was a Director of
J Henry Schroder & Co. Limited, the investment banking arm
of Schroders plc.
Douglas Mitchell, BSc (Hons)Born 1950. He joined the Board in January 2012. Prior to his
retirement in 2010 he was Managing Director of 3M UK and
Ireland following a high profile career within 3M that included
many senior roles in General Management, Sales and
Marketing, Logistics and Manufacturing.
Company Secretary
David R Carey, FCCABorn 1947. He joined the Group in 1974 as Chief Accountant.
He became Company Secretary in 1996.
Bankers and Advisors
BankersBarclays Bank PLC
HSBC Bank PLC
Svenska Handelsbanken AB (publ)
Independent AuditorKPMG Audit PLC, Preston
Tax AdvisorsPricewaterhouseCoopers LLP, Newcastle upon Tyne
NOMAD & StockbrokersWesthouse Securities Limited, London
Corporate LawyersDickinson Dees, Newcastle upon Tyne
RegistrarsCapita Registrars, Huddersfield
Pension AdvisorTowers Watson, Manchester
Company Details
James Cropper plcBurneside Mills, Kendal, Cumbria, England LA9 6PZ
Telephone 01539 722002
Fax 01539 720001
www.cropper.com
Company RegistrationNo: 30226 (Limited by shares)
BS EN ISO 9001: 2000FM 10048
BS EN ISO 14001: 2004EMS 57536
OHSAS 18001: 1999OHS 93474

pages 10 | 11James Cropper plc Annual Report and Accounts 2012
Against the background of a challenging economic climate, the
Group has made major strategic investments in its capabilities
and has announced a significant restructuring of its UK
workforce during the year.
After allowing for major project expenditure and redundancy
costs, profit before tax was £843,000 compared to
£1,694,000 in 2010/11 (prior to the IAS 19 pension
adjustment).
Profit after the IAS 19 pension adjustment but before tax was
£971,000 compared to £11,086,000 in 2010/11.
Major project expenditure expensed against profit was
£1,444,000. This sum included costs associated with the
consolidation of Technical Fibre Products (“TFP”) US activities
onto one site.
A provision relating to redundancy costs of £800,000 has been
recognised in the financial statements for the year ended 31
March 2012.
Group turnover relating to continuing operations for the financial
year was £78,223,000, down 6% on last year. Both UK and
export sales were down 6%. Exports represented 51% of
turnover.
The weakening US$ had an adverse impact on the £Sterling
value of TFP and Converting sales and a broadly favourable
impact on Speciality Papers. The average exchange rate for the
year was US$1.60/£ compared to US$1.55/£ in the previous
year, a weakening of 3%.
Diluted Earnings per Share of the continuing operations, before
the adjustment for IAS 19 curtailment was 9.5 pence compared
to 33.3 pence in the previous year.
DividendThe Board has decided to maintain the final dividend at 5.7
pence per share making a total dividend for the full year of 7.9
pence (7.9 pence in 2010/11).
Technical Fibre Products (“TFP”)
TFP’s operating profit for the year was £629,000 compared to
£2,289,000 in 2010/11, with turnover down by 9% on the
previous year at £11,942,000.
Early in the year it became apparent that growing concerns
amongst TFP’s US customers relating to resurgent recessionary
pressures and Federal austerity measures were beginning to be
reflected in TFP’s order book. In the event sales in the USA
were down by 16% and 13% in £Sterling and US$ terms
respectively. Sales to the USA accounted for 50% of TFP’s
turnover compared with 54% in the previous year. Sales outside
of the USA were down by 2%. All sectors were adversely
affected with the exception of aerospace, which grew strongly.
TFP supplies specialist metal-coated fibres and non-woven
material to the aerospace, defence and electronic sectors. The
primary manufacture of these materials takes place at TFP’s
existing US facilities in Cincinnati, OH and Stratford, CT with
secondary processing at the Group’s main site in Kendal, UK.
In late 2011 TFP entered into a 10 year lease of a 50,000
square foot facility in Schenectady, New York State, in order to
consolidate all of its US activities onto one site as the existing
US manufacturing sites did not have the capacity or capability
to meet the expected growing demand in a number of
customer programmes which are anticipated to generate
significant long term revenues.
An initial investment of US$3 million at the Schenectady facility
has also been authorised. This will include the installation of two
fibre plating lines.
As the first step in consolidating our US facilities, the Cincinnati
facility was closed in April 2012. It will take until Autumn 2013
for the facility at Schenectady to attain accreditation to a
number of important customer programmes which consume
materials sourced from the Stratford facility. Once accreditation
has been achieved the Stratford facility will also be closed.
James Cropper Speciality Papers (“Speciality Papers”)
Speciality Papers reported an operating profit of £1,430,000
against £587,000 in the previous year.
Turnover fell by £2,003,000 to £59,591,000, a 3% decline.
Overall volume was down 9%, with UK and export volumes
down by 13% and 4% respectively. All sectors were lower with
the exception of the Luxury & Packaging sector.
The price of pulp continued to move upward during the first four
months of the financial year. Northern Bleached Softwood Kraft
(“NBSK”) pulp opened at US$965/tonne and peaked at
US$1020/tonne in July, an increase of 60% since July 2009.
By the period end the price of NBSK had fallen to
US$840/tonne. Since then however it has been on a rising
trend and was US$855/tonne at the end of May 2012.
The overall cost of consumption of natural gas at commodity
prices was £3.9 million compared to £3.5 million in the prior
year, up 11%.
James Cropper Converting (“Converting”)
Converting’s operating profit was £192,000 compared to
£1,272,000 in the previous year.
Turnover was down 15% to £10,997,000 with volume down by
12%. Sales denominated in US$ fell by 27% and 24% in
£Sterling and US$ terms respectively. Over the course of the
financial year sales in US$ accounted for 30% of Converting’s
turnover compared to 35% in the previous year. A significant fall
in sales of digital printing grades into the US retail sector was
expected in 2011/12 as a proportion of the 2010/11 sales
included customer launch stocks. Display board sales were
down 20% reflecting recessionary pressures in the UK retail
sector. Mount board sales were in line with last year.
Restructuring processIn late March 2012 the Group advised its employees of its
intent to embark on a restructuring process which would lead to
changes in working practices. This process, which will reduce
the size of the Group’s UK workforce by 8% during the course
of 2012, is expected to result in cost savings of approximately
£1.0 million on an annualised basis from 2013/14 onwards,
with savings of £0.3 million in 2012/13. The resultant increase
in productivity will improve the Group's competitive position.
The capacity and capability of the Group's three businesses will
be unaffected by this process. A full provision relating to
redundancy costs of £0.8 million has been recognised in the
financial statements for the year ended 31 March 2012.
PeopleOur employees are resourceful and resilient and will rise to
the challenge of making our businesses more efficient and
effective and hence more competitive as a consequence. I am
pleased to report that the restructuring changes we plan to
make will be achieved without the need for compulsory
redundancies. As ever, I am very grateful to our work force for
the commitment and energy that they devote to the success of
James Cropper plc.
Chairman’sReview
The Board recognises the continuing need to bring new talent
and experience into the Group. During the year TFP recruited
commercial and technical personnel both in the UK and USA to
strengthen its expertise.
I am also pleased to welcome Douglas Mitchell to the Board as
a Non-Executive Director. Prior to his retirement in 2010 he was
Managing Director of 3M UK and Ireland following a high profile
career within 3M, that included many senior roles in General
Management, Sales and Marketing, Logistics and
Manufacturing. I am confident that Douglas’ experience will be
of great value to the Group and TFP in particular.
Cash and borrowingsCapital expenditure during the year was £5.9 million (£2.3
million in 2010/11). At 31st March 2012 gross drawn down
loans totalled £11.9 million, with £5.4 million held as cash at
bank. In addition the Group had un-drawn overdraft facilities of
£3.3 million, US$1.4 million and €1.0 million. Gearing at the
financial year end, after deduction of the IAS 19 pension deficit,
was 30%. Capital expenditure in the coming year will revert to
normal levels and working capital will remain under tight control.
OutlookIn TFP current demand in the aerospace sector remains strong
through USA supply routes, whilst other sectors remain
somewhat unpredictable as short term buying patterns prevail.
In Speciality Papers the new financial year has opened in a
similar way to how last year ended. The economic uncertainty,
which led to the significant loss of confidence amongst
customers in many export paper markets in the second half of
last year, shows no immediate sign of lifting. In the home
market we have been successful in winning some business in
new areas which has helped to fill the capacity gap.
In Converting sales of mount board and digital printing grades in
the new financial year are broadly in line with the same period
last year, whilst display board sales are on an improving trend.
Although the troubles in the Euro-zone economy are a particular
challenge, I am confident that our competitiveness will improve
over the coming year as a consequence of our capability,
products and excellent service levels coupled with our recent
investments and the restructuring process.
We are also reorganising and strengthening our commercial
teams across the Group, not least in response to the significant
business development opportunities available to our
businesses in spite of the economic climate. Identifying and
converting these opportunities are the key to our future
prosperity.
Mark CropperChairman

pages 12 | 13James Cropper plc Annual Report and Accounts 2012
Financial andOperating Review
Overall Performance
• Trading operating profit for the year was £2,007,000 prior to a
provision for redundancy costs.
• A provision for redundancy of £800,000 was charged in the
year as a consequence of the restructuring process.
• Trading profit of continuing operations was £1,207,000
compared to £3,361,000 in the previous year. (Overall trading
profit in the previous year inclusive of discontinued operations
was £1,665,000).
• The net IAS 19 pension adjustment was a credit of
£128,000.
• Post net IAS 19 pension adjustment the Group recorded an
overall profit before tax of £971,000 for the year.
• A tax charge of £134,000 arose; an effective rate of 14%.
• The profit after tax was therefore £837,000.
• Post net IAS 19 pension adjustment diluted earnings per
share were 9.5 pence.
• The IAS 19 pension deficit increased by £6,294,000 to
£7,698,000 as a consequence of the Bank of England’s
Quantitative Easing measures.
• Shareholders’ funds at the year-end were £21,967,000, with
net debt of £6,505,000, resulting in a gearing ratio of 30%.
All references to:
“Profit and Loss Account” refers to the
Statement of Comprehensive Income.
“Balance Sheet” refers to the
Statement of Financial Position.
“Reserves” refers to the
Statement of Changes in Equity.
2012 2011 Change ChangeTurnover £'000 £'000 £'000s %Technical Fibre Products 11,942 13,152 (1,210) (9)Speciality Papers 59,591 61,594 (2,003) (3)Converting 10,997 12,981 (1,984) (15)The Paper Mill Shop (discontinued operation) - 3,609 (3,609) -
82,530 91,336 (8,806) (10)Less inter-segmental sales (4,307) (4,463) 156 (3)
78,223 86,873 (8,650) (10)ExpensesRaw materials and consumables used (35,433) (41,950) 6,517 (16)Energy costs (4,616) (4,268) (348) 8Employee benefit costs * (20,140) (20,070) (70) -Depreciation and amortisation (2,675) (3,072) 397 (13)Other expenses (14,987) (17,337) 2,350 (14)Other income and changes in inventory 835 1,489 (654) (44)
(77,016) (85,208) 8,192 (10)
Trading profit * 1,207 1,665 (458) (28)(* Before net pension adjustments)
Continuing operations 1,207 3,361 (2,154)Discontinued operation - (1,696)
1,207 1,665
Trading profit 1,207 1,665 (458)Depreciation 2,675 3,072 (397)EBITDA (before IAS 19 pension adjustment) 3,882 4,737 (855)
Profit and Loss SummaryTrading activitiesTechnical Fibre Products 629 2,289 (1,660)Speciality Papers 1,430 587 843Converting 192 1,272 (1,080)The Paper Mill Shop (discontinued operation) - (1,696) 1,696Other Group expenses (158) (119) (39)
2,093 2,333 (240)Director and employee bonuses (86) (668) 582Trading operating profit 2,007 1,665 342Redundancy provision (800) - (800)Trading profit 1,207 1,665 (458)Net interest (364) 29 (393)
Trading profit before tax 843 1,694 (851)(After future service pension contributions paid)Net pension adjustments
Net current service charge required (539) (763) 224Exceptional curtailment adjustment - 10,158 (10,158)
Group operating profit (539) 9,395 (9,934)Net interest 667 (3) 670
Net pension adjustment before tax 128 9,392 (9,264)
Overall Group after pension adjustmentsProfit before interest 668 11,060 (10,392)Net interest 303 26 277
Profit before Tax 971 11,086 (10,115)Profit before Tax
Continuing operations 971 12,812The Paper Mill Shop (discontinued operation) - (1,726)
971 11,086Balance Sheet SummaryNon-pension Assets - excluding Cash 46,278 44,000 2,278Non-pension Liabilities - excluding Borrowings (11,956) (13,841) 1,885
34,322 30,159 4,163Net pension liabilities (5,850) (1,039) (4,811)
28,472 29,120 (648)Net Borrowings (6,505) (1,711) (4,794)Equity shareholders' funds 21,967 27,409 (5,442)
Gearing % - before IAS 19 deficit 23 6Gearing % - after IAS 19 deficit 30 6

James Cropper plc Annual Report and Accounts 2012
Trading Profit and Loss Account in summaryGroup turnover was £78,223,000 compared to £86,873,000
last year, down £8,650,000, of which £5,041,000 was
attributable to continuing businesses. Overall turnover declined
by 10%.
Overall Group raw material and consumable costs, excluding
energy, were £35,433,000, down 12% on last year. The cost of
energy consumption increased over the previous year by
£348,000 to £4,616,000, up 8%.
Prior to the net IAS 19 pension adjustment employment costs
were £20,140,000 compared to £20,070,000 in the previous
year. The average number of people employed decreased from
597 to 527 over the year. For greater analysis of employment
costs see Table G.
Other external charges fell by £2,350,000 from £17,337,000 to
£14,987,000, primarily as a result of the closure of TPMS in the
previous year.
Foreign CurrencyThe majority of exports into continental Europe are invoiced in
€s. €s are used to purchase € priced pulp and other raw
materials sourced from Europe in €s. Similarly, export sales
outside Europe are invoiced in US$ and the receipts fund the
purchase of US$ priced pulp. These steps reduce exposure to
foreign currency rate fluctuations. The situation is monitored to
ensure that whenever possible currency receipts and payments
are matched. Table A compares the opening and closing
exchange rates for the financial year.
Table A
Currency US$ €Opening rate April 2011 v. £ 1.61 1.13
Closing rate March 2012 v. £ 1.60 1.20
Exchange rate movement % 0.8 (5.8)
Strengthen/(Weaken) v. £
Currency transactions in year
Sales receipts '000 21,410 21,432
Purchase payments ‘000 (22,079) (22,046)
Surplus/(deficit) '000 (669) (614)
£ @ Opening rate £'000 (414) (541)
£ @ Closing rate £'000 (418) (512)
Gain/(loss) £'000 (4) 29
Potential foreign currency surpluses or deficits are dealt with by
a combination of foreign currency forward selling and forward
purchasing contracts.
TFP and Converting generate surplus US$s. Speciality Papers
absorb these US$ funds. A weakening US$ will have an
adverse impact on the £ value of TFP and Converting sales and
a broadly favourable impact on Speciality Papers. The average
exchange rate for the year was US$1.60/£ compared to
US$1.55/£ in the previous year, a weakening of 3%.
Technical Fibre Products2012 2011 Change Change
£'000 £'000 £'000 %
Turnover 11,942 13,152 (1,210) (9)
Operating profit 629 2,289 (1,660)
Turnover was down by 9% on the previous year. All sectors
were adversely affected with the exception of aerospace, which
grew strongly. Sales in the USA were down by 16% and 13% in
£Sterling and US$ terms respectively as a consequence of
resurgent recessionary pressures and Federal austerity
measures. Sales to the USA accounted for 50% of TFP’s
turnover compared 54% in the previous year. Sales outside of
the USA were down by 2%.
Major revenue project expenditure chargeable against profit
was £500,000. This sum includes costs associated with the
consolidation of US activities onto one site.
Speciality Papers2012 2011 Change Change£'000 £'000 £'000 %
Turnover 59,591 61,594 (2,003) (3)
Operating profit/(loss) 1,430 587 843
Turnover fell by 3%. Overall volume was down 9%, with UK and
export volumes down by 13% and 4% respectively. All sectors
were down with the exception of the Luxury & Packaging sector.
The price of pulp continued to move upward during the first four
months of the financial year. Northern Bleached Softwood Kraft
(“NBSK”) pulp opened at US$965/tonne and peaked at
US$1020/tonne in July, an increase of 60% since July 2009. By
the period end the price of NBSK had fallen to US$840/tonne.
Since then however it has been on a rising trend and was
US$855/tonne at the end of May 2012.
The overall cost of consumption of natural gas at commodity
prices was £3.9 million compared to £3.5 million in the prior year,
up 11%.
Converting2012 2011 Change Change
£'000 £'000 £'000 %
Turnover 10,997 12,981 (1,984) (15)
Operating profit 192 1,272 (1,080)
Turnover was down 15% to £10,997,000 with volume down by
12%. Sales denominated in US$s fell by 27% and 24% in
£Sterling and US$ terms respectively. Over the course of the
financial year sales in US$s accounted for 30% of Converting’s
turnover compared to 35% in the previous year. A significant fall
in sales of digital printing grades into the US retail sector was
expected in 2011/12 as a proportion of the 2010/11 sales
included customer launch stocks. Display board sales were
down 20% reflecting recessionary pressures in the UK retail
sector. Mount board sales were in line with last year.
Financial andOperating Reviewcontinued
240
220
200
180
160
140
120
100
80
60
Pulp Index in Denominated Currencies
pages 14 | 15
09/10 10/11 11/12
80
70
60
50
40
30
20
10
0Apr May Jun Jul Aug Sep Oct Nov Dec Jan Feb Mar
Gas Cost (pence per therm)
Mar Mar Mar Mar Mar Mar Mar Mar Mar Mar Mar02 03 04 05 06 07 08 09 10 11 12
Softwoods £/tonne $/tonne
Hardwoods £/tonne €/tonne
$/£ €/£
Currency Index
$/€
180
160
140
120
100
80
60Mar Mar Mar Mar Mar Mar Mar Mar Mar Mar Mar02 03 04 05 06 07 08 09 10 11 12

pages 16 | 17James Cropper plc Annual Report and Accounts 2012
TaxationTable B Prior Current Future Total
years year years change£000 £000 £000 £000
Corporation Tax (45) 481 - 436
Foreign tax - 15 - 15
Deferred tax (28) (70) (219) (317)
(73) 426 (219) 134
Effective tax rate - % 14%
The adjustment in respect of future years reflects the reduction in the Corporation Tax rate from 26% to 24% as from the start of the
new financial year.
Balance SheetShareholders’ Funds fell by £5,442,000 from £27,409,000 at the previous year-end to £21,967,000 as at 31 March 2012.
The overall IAS 19 pension deficit increased by £6,294,000 to £7,698,000. This was offset by a £1,483,000 increase in the
Deferred Tax Asset to £1,848,000. The IAS 19 pension deficit net of Deferred Tax increased by £4,811,000 over the year. For
greater analysis of IAS 19 see Table F.
Net borrowings increased by £4,794,000, whilst other liabilities excluding pensions fell by £2,459,000.
Capital expenditure was £5,934,000 (£2,275,000 in previous year).
Net current assets increased by £1,231,000 over the year from £18,367,000 to £19,598,000, with working capital (stocks,
debtors, net of creditors) increasing by £718,000 and net cash increasing by £513,000. Working capital movements included;
• A £405,000 increase in stocks, a £818,000 decrease in trade and other creditors and a £808,000 decrease in current tax
liabilities offset by
• A £1,283,000 decrease in trade and other debtors.
Over the year bank loans falling due after more than a year increased by £5,307,000 from £4,567,000 to £9,874,000.
Cash FlowSummarised cash flow is shown in table C.
Table C 2012 2011 ChangeCash Flow £'000 £'000 £'000
Net cash inflow from operating activities 2,028 1,172 856
Net cash outflow from investing activities (5,928) (2,269) (3,659)
(3,900) (1,097) (2,803)
Net cash flow from financing activities 5,056 329 4,727
Net increase in cash and cash equivalents 1,156 (768) 1,924
Opening cash and cash equivalents 4,282 5,050 (768)
Closing cash and cash equivalents 5,438 4,282 1,156
Net cash inflow from operating activities in the year was after deducting past service pension deficit payments of £996,000. Net
cash outflow from investing activities in the year includes capital expenditure totalling £5,934,000.
Total cash and borrowing changes over the year and facilities available are shown in table D.
Table D 2012 2011 ChangeNet debt £'000 £'000 £'000
Cash and cash equivalents 5,438 4,282 1,156
Borrowings: repayable within one year (2,069) (1,426) (643)
Net cash 3,369 2,856 513
Borrowings: non-current (9,874) (4,567) (5,307)
Net debt (6,505) (1,711) (4,794)
FacilitiesBorrowings: repayable within one year 2,069 1,426 643
Borrowings: non-current 9,874 4,567 5,307
Facilities drawn down 11,943 5,993 5,950
Undrawn facilities 4,959 5,001 (42)
Facilities 16,902 10,994 5,908
Funds availableCash and cash equivalents 5,438 4,282 1,156
Undrawn facilities 4,959 5,001 (42)
Funds available at year end 10,397 9,283 1,114Borrowings: repayable within one year (2,069) (1,426) (643)
Funds available in excess of one year 8,328 7,857 471
At 31 March 2012 the Group had undrawn overdraft facilities of £3.3 million, US$1.4 million and €1.0 million. At this date these
facilities, which are renewable annually, were valued in total at £4,959,000.
PensionsThe Group operates two funded pension schemes providing defined benefits for the majority of its full time employees including
Executive Directors. Membership of the Schemes has been closed to new members for a number of years in order to contain the
Group’s exposure to rising pension costs. Since 2001 all new employees have been able to join a defined contribution Group
Personal Pension Plan. The Group exposure to employee’s GPP plans is limited to a fixed percentage of contractual pay. The latest
actuarial “on-going” valuations of the James Cropper plc Pension Scheme (the “Staff Scheme”) and the James Cropper plc Works
Pension Plan (the “Works Scheme”) were conducted as at April 2010.
As from 1 April 2011 active members’ benefits have been reduced such that future increases in pensionable salaries are restricted
to RPI up to a maximum of 2% per annum. Thus the Staff and Works Schemes will remain defined benefit schemes but they will no
longer be “final salary” schemes. Table E reflects the “on-going” valuations as at April 2010 based upon these reduced benefits.
Financial andOperating Reviewcontinued

pages 18 | 19James Cropper plc Annual Report and Accounts 2012
Financial andOperating ReviewcontinuedPensions continuedTable E
Staff Works Total
Discount rate 5.60% 5.60%
£'000 £'000 £'000
Assets 28,877 33,301 62,178
Liabilities (31,794) (35,642) (67,436)
(Deficit) (2,917) (2,341) (5,258)
Funding level - % 91 93 92
The Group intends to continue paying deficit contributions on a
equal monthly basis, totalling £876,000 per annum, with the
aim of removing the combined deficit in accordance with the
Schemes’ agreed Schedules of Contributions.
IAS 19IAS 19 requires that actuaries calculate the assets and liabilities
of companies’ pension schemes based on values and interest
rates at their annual Balance Sheet date. Under IAS 19 pension
scheme liabilities are measured on an actuarial basis using the
projected unit method. Pension liabilities are discounted at the
current rate of return on an AA rated quality corporate bond of
equivalent currency and term. The pension scheme assets are
measured at fair value at the Balance Sheet date. The net of
these two figures gives the scheme surplus or deficit. As
market values of the scheme assets and the discount factors
applied to the scheme liabilities will fluctuate, this method of
valuation will often lead to large variations in the “pension
balance” year on year. An “on-going” valuation takes account of
the projected growth in the pension schemes’ assets by asset
type over the projected life of the scheme.
The assumptions used by the actuaries for their IAS 19
valuations are likely to be very different from those that they
used with regard to their “on-going” valuations.
IAS 19 regards a sponsoring company and its pension
schemes as a single accounting entity rather than two or more
separate legal entities. The actuarial valuation is the starting
point for the creation of the IAS 19 accounting entity. The
valuation determines the net position of a pension scheme, i.e.
the difference between its assets and liabilities. On the
introduction of IAS 19 the net position, surplus or deficit, is
brought onto the sponsoring company’s Balance Sheet such
that Reserves are immediately adjusted by the net position
reduced by deferred tax. This obviously results in either an
increase or decrease in the net asset value of the sponsoring
company. Upon valuation at subsequent year-ends the
movement in value from the previous valuation is expressed in
the following component parts:
Those which affect Profit
Operating costs
• Current service charge, being the cost of benefits earned in
the current period shown net of employees’ contributions.
• Past service costs, being the costs of benefit improvements.
• Curtailment and settlement costs.
Finance costs, being the net of
• Expected return on pension scheme assets.
• Interest cost on the accrued pension scheme liabilities.
Those which do not affect Profit
• Actuarial gains and losses arising from variances against
previous actuarial assumptions.
The above items are offset in the year-to-year movement by
actual contributions paid by the employer in the period.
Table F shows the results of the IAS 19 valuations.
Table F Staff Works Total Total Change Change2012 2012 2012 2011
IAS19 DEFICIT £'000 £'000 £'000 £'000 £'000 %
Current Service Charge (449) (851) (1,300) (1,370) 70Future service contributions paid 385 376 761 607 154Curtailment - - - 10,158 (10,158)
Net impact on Operating Profit (64) (475) (539) 9,395 (9,934)Finance costs 318 349 667 (3) 670
Net impact on Profit and Loss Account 254 (126) 128 9,392 (9,264)Past service deficit contributions paid 432 564 996 996 -Actuarial (losses)/gains (2,708) (4,710) (7,418) 2,388 (9,806)
Opening deficit (561) (843) (1,404) (14,180) 12,776
Closing deficit (2,583) (5,115) (7,698) (1,404) (6,294)Deferred Taxation 620 1,228 1,848 365 1,483
Net deficit (1,963) (3,887) (5,850) (1,039) (4,811)
Assets 34,385 35,922 70,307 68,189 2,118 3.1%Liabilities (36,968) (41,037) (78,005) (69,593) (8,412) 12.1%
Closing deficit (2,583) (5,115) (7,698) (1,404) (6,294)
AssetsEquities 16,848 19,558 36,406 38,384 (1,978)Gilts and Corporate Bonds 14,555 14,474 29,029 25,667 3,362Property - 285 285 80 205Annuities 2,058 - 2,058 1,992 66Cash 924 1,605 2,529 2,066 463
34,385 35,922 70,307 68,189 2,118
Asset - %
Equities 49.0 54.4 51.8 56.3Gilts and Corporate Bonds 42.3 40.3 41.3 37.7Property - 0.8 0.4 0.1Annuities 6.0 - 2.9 2.9Cash 2.7 4.5 3.6 3.0
100.0 100.0 100.0 100.0
The overall value of the schemes’ assets grew by 3% over the period however their liabilities increased by 12%. The IAS19
valuations of these schemes as at 31 March 2012 revealed a combined deficit of £7,698,000, compared with £1,404,000 at the
previous year end, an increase of £6,294,000. The primary reason for the increase in the schemes’ liabilities is the discount rate of
4.95% used at March 2012 compared to 5.50% at March 2011, reflecting the decline in corporate bond yields over this period as a
consequence of the Bank of England’s “Quantitative Easing” programme.
pages 20 | 21James Cropper plc Annual Report and Accounts 2012
IAS 19 continuedAs from 1 April 2011 active members’ benefits have been reduced such that future increases in pensionable salaries are restricted
to RPI up to a maximum of 2% per annum.
Actual future service pension contributions paid in the period by the Group to its two final salary schemes in accordance with the
actuaries’ recommendations, resulting from their 2010 “on-going” valuations, were £761,000. Under IAS 19 the charge against
operating profit in the year was £1,300,000. This sum includes an excess charge required by IAS 19 over and above the future
service contributions.
Table G analyses employment costs charged against Operating Profit.
Table G
Total adjusted employment costs 2012 2011 Change£'000 £'000 £'000
Wages and salaries 16,461 16,874 413Director and employee bonuses 86 668 582Social security costs 1,484 1,339 (145)Future service pension contributions paid 761 607 (154)Other pension costs 548 582 34
Total employment costs 19,340 20,070 730Provision for redundancy costs 800 - (800)
Chargeable against Trading Operating Profit 20,140 20,070 (70)
Wages and salaries 16,461 16,874 413Director and employee bonuses 86 668 582Social security costs 1,484 1,339 (145)Current service pension charge (IAS 19) 1,300 1,370 70Other pension costs 548 582 34
Total employment costs 19,879 20,833 954Provision for redundancy costs 800 - (800)
Chargeable against Group Operating Profit 20,679 20,833 154
Difference being:Net IAS 19 pension adjustment againstoperating profit 539 763 224
Average monthly number of employees 527 597 70
Financial andOperating Reviewcontinued
Environmental ManagementOver the next few years it is anticipated that there will be a
significant increase in output from our manufacturing facility in
Burneside. As a consequence there will be a corresponding
increase in energy consumption, water abstraction and waste
generation, balanced wherever possible by in-house
conservation and minimisation activities. This expansion will
take place against the background of increasingly tighter
regulatory control by Government agencies, most notably
through the terms and conditions of the Group’s Environmental
Permit Regulations (EPR), Climate Change Agreement and the
European Union Emission Trading Scheme (“EUETS”). The
Group’s location on the edge of the Lake District National Park
and on the River Kent, a Site of Special Scientific Interest and a
European Site, Special Area of Conservation, will ensure that its
activities will come under close scrutiny. In addition the rapid
increase in energy costs in recent years brings consumption
and conservation of energy into sharp business focus
particularly when weighed against the background of increasing
manufacturing output. Unless managed effectively, a number of
energy and environmental issues could constrain the Group
from meeting its strategic objectives.
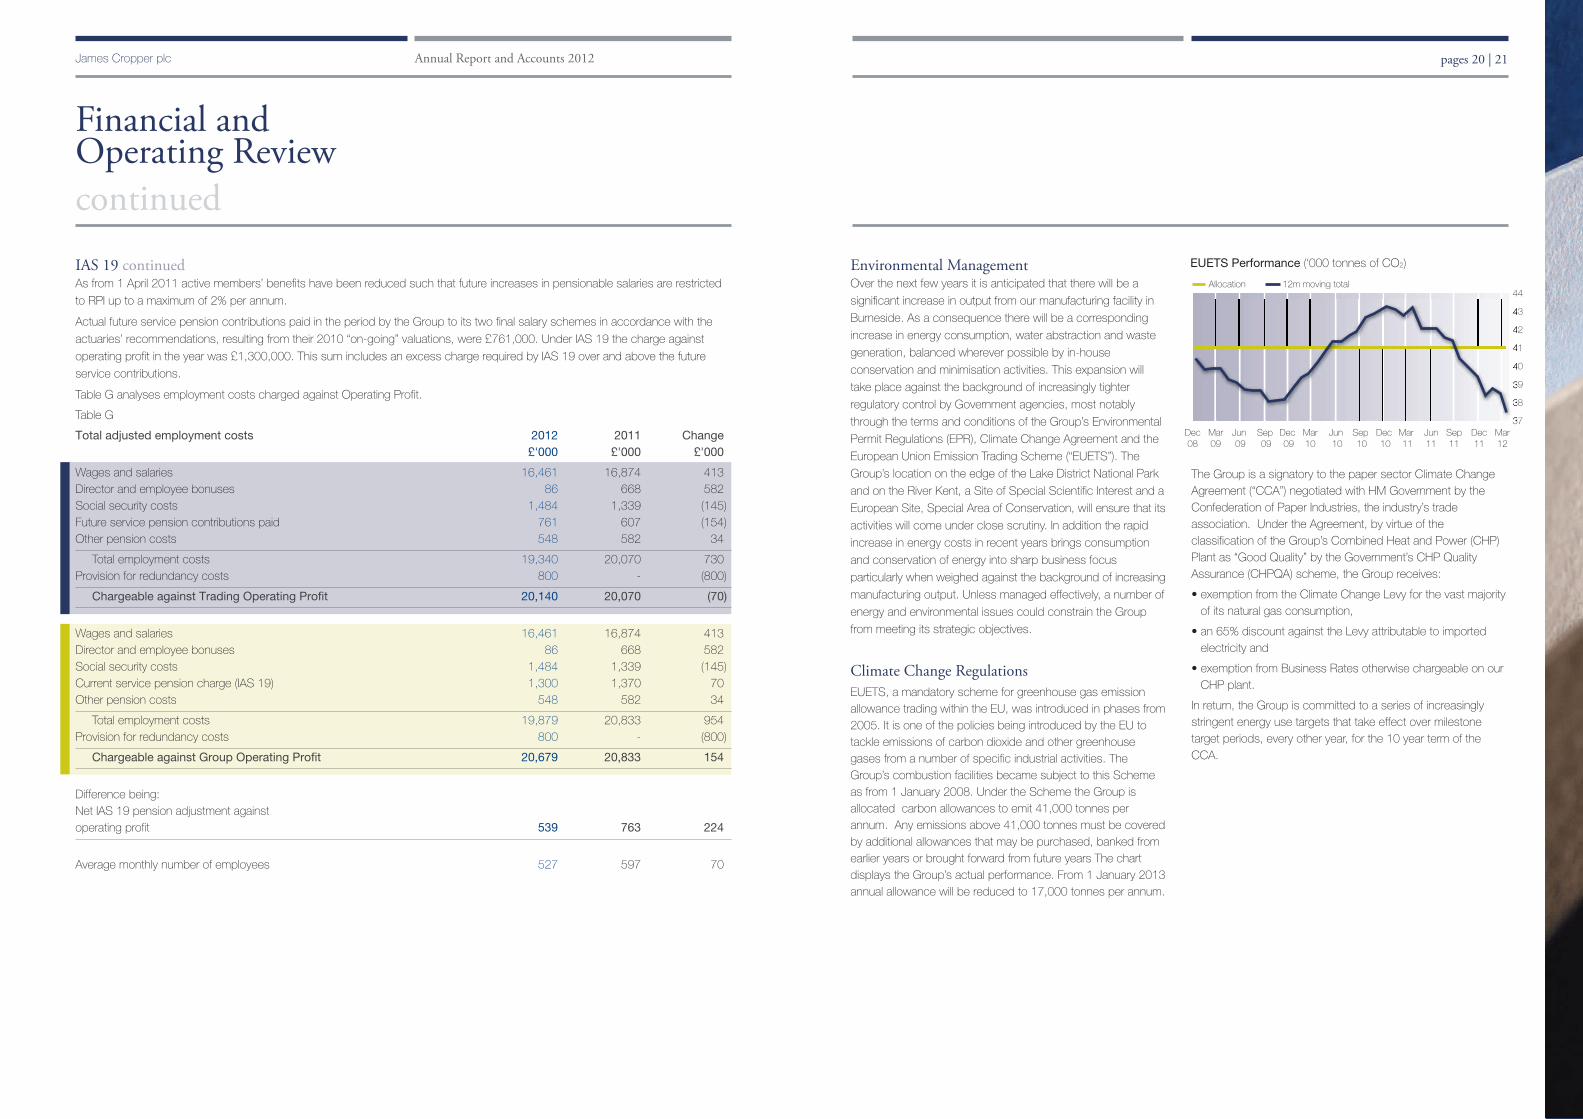
Climate Change RegulationsEUETS, a mandatory scheme for greenhouse gas emissionallowance trading within the EU, was introduced in phases from2005. It is one of the policies being introduced by the EU totackle emissions of carbon dioxide and other greenhousegases from a number of specific industrial activities. TheGroup’s combustion facilities became subject to this Schemeas from 1 January 2008. Under the Scheme the Group isallocated carbon allowances to emit 41,000 tonnes perannum. Any emissions above 41,000 tonnes must be coveredby additional allowances that may be purchased, banked fromearlier years or brought forward from future years The chartdisplays the Group’s actual performance. From 1 January 2013annual allowance will be reduced to 17,000 tonnes per annum.
The Group is a signatory to the paper sector Climate ChangeAgreement (“CCA”) negotiated with HM Government by theConfederation of Paper Industries, the industry’s tradeassociation. Under the Agreement, by virtue of theclassification of the Group’s Combined Heat and Power (CHP)Plant as “Good Quality” by the Government’s CHP QualityAssurance (CHPQA) scheme, the Group receives:
• exemption from the Climate Change Levy for the vast majorityof its natural gas consumption,
• an 65% discount against the Levy attributable to importedelectricity and
• exemption from Business Rates otherwise chargeable on ourCHP plant.
In return, the Group is committed to a series of increasinglystringent energy use targets that take effect over milestonetarget periods, every other year, for the 10 year term of theCCA.
Dec Mar Jun Sep Dec Mar Jun Sep Dec Mar Jun Sep Dec Mar08 09 09 09 09 10 10 10 10 11 11 11 11 12
44
43
42
41
40
39
38
37
Allocation 12m moving total
EUETS Performance (‘000 tonnes of CO2)

pages 22 | 23James Cropper plc Annual Report and Accounts 2012
Financial andOperating ReviewcontinuedForestryJames Cropper plc continued its policy of purchasing only from
those suppliers who demonstrate practical application of sound
environmental management. Annually James Cropper Speciality
Papers purchases some 40,000 tonnes of virgin wood pulp of
the highest environmental pedigree, which is largely sourced
from long established suppliers based in Sweden, Finland,
Spain and Portugal. All suppliers are committed to sustainable
forest management and comply fully with their local national
standards and legislation. The Group has accreditation to
International Standards ISO 9000 and ISO 14001 relating to
quality and environmental management procedures
respectively. James Cropper Speciality Papers also holds dual
accreditation to FSC (Forest Stewardship Council) and PEFC
(Programme for the Endorsement of Forest Certification)
standards. Certification imposes strict controls, including an
auditable chain of custody for pulp sourced by the mill. This
enables the subsidiary to satisfy the increasing demand from
customers and end consumers for creditable certification of the
source of fibre used in the products they purchase.
Health and SafetyThe Group’s Safety Strategy embraces the need to create well-developed safety management processes and a sound safetyculture. The aim of the Strategy is to achieve zero Lost TimeAccidents (“LTAs”). By adopting the principle that all LTAs arepreventable, management are accepting that it is theirresponsibility to achieve this aim.
There were 5 LTAs in the past financial year compared to 12 inthe previous year.
16
14
12
10
8
6
4
2
0
Total Lost Time Accidents
07/08 08/09 09/10 10/11 11/12
e Directors have pleasure in submitting to themembers their Annual Report and the auditedaccounts of the Group for the 52 weeks ended31 March 2012.The Annual General Meeting of the Group will be held at the
Bryce Institute, Burneside on Wednesday, 1 August 2012 at
11.00am
Review of the BusinessThe Group’s principal activities comprise the manufacture of
specialist paper and advanced materials.
The Chairman’s Review includes a review of business activities
during the year and comments on future developments and
prospects. Details of the Group’s activities are included in the
Divisional Reviews.
ResultsThe profit attributable to equity holders of the Company for the
52 weeks ended 31 March 2012 is set out in the Statement of
Comprehensive Income. The dividends paid during the year,
and the proposed final dividend, are set out in the Notes to the
Financial Statements.
Research and DevelopmentThe Group continues to invest in research and development to
ensure that the range and quality of products are continually
updated.
Statement of Directors’ responsibilities in respectof the Annual Report and the financial statementsThe Directors are responsible for preparing the Annual Report
and the financial statements in accordance with applicable law
and regulations.
Company law requires the Directors to prepare Group and
Parent Company financial statements for each financial year.
Under that law they have elected to prepare both the Group
and the Parent Company financial statements in accordance
with IFRSs as adopted by the EU and applicable law. As
required by the AIM Rules of the London Stock Exchange they
are required to prepare the Group financial statements in
accordance with IFRSs as adopted by the EU and applicable
law and have elected to prepare the Parent Company financial
statements on the same basis.
Under company law the Directors must not approve the
financial statements unless they are satisfied that they give a
true and fair view of the state of affairs of the Group and Parent
Company and of their profit or loss for that period. In preparing
each of the Group and Parent Company financial statements,
the Directors are required to:
• select suitable accounting policies and then apply them
consistently;
• make judgments and estimates that are reasonable and
prudent;
• state whether they have been prepared in accordance with
IFRSs as adopted by the EU; and
• prepare the financial statements on the going concern basis
unless it is inappropriate to presume that the Group and the
Parent Company will continue in business.
The Directors are responsible for keeping adequate accounting
records that are sufficient to show and explain the Parent
Company's transactions and disclose with reasonable
accuracy at any time the financial position of the Parent
Company and enable them to ensure that its financial
statements comply with the Companies Act 2006. They have
general responsibility for taking such steps as are reasonably
open to them to safeguard the assets of the Group and to
prevent and detect fraud and other irregularities.
The Directors are responsible for the maintenance and integrity
of the corporate and financial information included on the
Company's website. Legislation in the UK governing the
preparation and dissemination of financial statements may differ
from legislation in other jurisdictions.
Corporate Governance(i) Directors’ ResponsibilitiesThe Board is accountable to the Group’s shareholders for
corporate governance. Whilst there is no requirement to comply
with the Combined Code, the Group is committed to a high
standard of corporate governance and this section describes
how the relevant principles of governance are applied to the
Group.
(ii) The BoardThe Group Board considers that it is well balanced and
operates in an effective manner and is collectively responsible
for the success of the Company. It comprises five Executive
Directors and five Non-Executive Directors.
Report of theDirectors

pages 24 | 25James Cropper plc Annual Report and Accounts 2012
(ii) The Board continuedDespite two Directors not being independent under the
Combined Code, the Board deems all the Non-Executive
Directors to be independent even though Mark Cropper and
James Cropper have close family ties. They display
independence of character and judgment and provide
unequivocal counsel and advice to the Board.
Mark Cropper is the Chairman of the Company and is
responsible for the running of the Board.
Alun Lewis is the Chief Executive and is responsible for the
running of the Company’s business.
David Wilks is the senior independent Non-Executive Director.
The Group Board met eight times during the year, with
prepared agendas for discussion and formal schedules of
items to be approved covering structure and strategy,
management, financial reporting and controls, board
membership and committees, and corporate governance.
There is a schedule of matters reserved for the Board’s
decision.
The Executive Committee, under the chairmanship of
Alun Lewis, met twelve times during the year with prepared
agendas for discussion.
All Directors have access to the advice and services of the
Company Secretary. The Board has also established a formal
procedure whereby Directors, wishing to do so in the
furtherance of their duties, may take independent professional
advice, if necessary, at the Company’s expense. All Directors
are aware of their responsibility to regularly update their skills
and knowledge.
(iii) Board CommitteesThere are four sub-committees reporting to the Group Board:
• Executive Committee
• Remuneration & Management Development Committee
• Audit Committee
• Nomination Committee
The Executive Committee comprises the Executive Directors
and one senior executive. The Committee’s terms of reference
include the development and implementation of strategies,
operational plans, and the assessment and control of risk.
Alun Lewis, the Company’s Chief Executive, is Chairman of the
Committee.
The Audit Committee, the Remuneration & Management
Development Committee, and the Nomination Committee
comprise the Non-Executive Directors of the Company.
Jim Sharp is Chairman of the Audit Committee, David Wilks is
Chairman of the Remuneration & Management Development
Committee, and Mark Cropper is Chairman of the Nomination
Committee. These committees do not consist solely of
Directors deemed independent under the Combined Code.
The Board is satisfied that the Audit Committee has at least two
members who have relevant financial experience.
The Committees’ terms of reference are displayed on the
Company’s website.
(iv) Re-election
The Directors are subject to retirement on a periodic basis and
re-election by the shareholders in accordance with the Articles
of Association whereby a Director shall retire from office at the
first AGM after their appointment and thereafter shall retire at
every third AGM after the AGM at which last appointed.
Alun Lewis, Patrick Willink and David Wilks retire by rotation in
accordance with the Articles of Association and, being eligible,
offer themselves up for re-election.
Douglas Mitchell was appointed a Director in January 2012 and
offers himself for re-election.
Non-Executive Directors who have served on the Board for
more than 9 years are put forward for re-election on an annual
basis. James Cropper has served on the Board for more than 9
years and offers himself for re-election.
Resolutions 3 to 7 at the Annual General Meeting deal with the
proposed re-election of Directors.
(v) Performance EvaluationThe Chairman undertakes an annual Group Board appraisal
with each Executive Director.
The performance evaluation process includes the Chairman
reviewing and monitoring the Chief Executive’s performance on
an annual basis and the Chief Executive reviewing and
monitoring the Executive Directors. The high level individual
objectives agreed at the reviews are communicated to the
Remuneration & Management Development Committee.
The Chairman reviews the Non-Executive Directors’
performance annually on an individual basis.
The Chairman’s performance is appraised by the senior
independent Director and the other Non-Executive Directors
without the Chairman being present, and the comments fed
back to him for discussion.
Report of theDirectorscontinued
(vi) Financial Policies and Internal ControlsThe Board is committed to presenting a full, balanced and
understandable assessment of the Company’s position and
prospects, both in the Annual Report and at other times as
appropriate throughout the year.
The Directors are responsible for preparing the Annual Report,
the Directors’ Remuneration Report and the financial
statements in accordance with applicable law and International
Financial Reporting Standards (IFRSs) as adopted by the
European Union.
The Directors are responsible for preparing financial statements
for each financial year which give a true and fair view, in
accordance with IFRSs as adopted by the European Union, of
the state of affairs of the Company and the Group and of the
profit or loss of the Group for that period. In preparing those
financial statements, the Directors are required to: -
• select suitable accounting policies and then apply them
consistently;
• make judgements and estimates that are reasonable and
prudent;
• state whether the financial statements comply with IFRSs as
adopted by the European Union;
The Directors confirm that they have complied with the above
requirements in preparing the financial statements.
The Directors are responsible for keeping proper accounting
records that disclose with reasonable accuracy at any time the
financial position of the Company and the Group and to enable
them to ensure that the financial statements and the Directors’
Remuneration Report comply with the Companies Act and
Article 4 of the IAS Regulation. They are also responsible for
safeguarding the assets of the Company and the Group and
hence for taking reasonable steps for the prevention and
detection of fraud and other irregularities.
The Directors are responsible for the maintenance and integrity
of the corporate and financial information included on the
Company’s website. Legislation in the United Kingdom
governing the preparation and dissemination of financial
statements may differ from legislation in other jurisdictions.
The Board is responsible for and sets appropriate policies on
internal control and seeks regular assurance, at least annually,
that enables it to satisfy itself that processes are functioning
effectively. Such a system is designed to manage rather than
eliminate the risk of failure to achieve business objectives and
can provide reasonable, but not absolute, assurance against
material misstatement or loss. If a failure is discovered the
Board will take remedial action.
There is no internal audit function within the Company and the
Board consider that this is appropriate given the nature of the
Group’s activities. The letter from the external auditors’
confirming their independence and objectivity was reviewed by
the Audit Committee. KPMG Audit Plc have confirmed their
independence and the Directors believe KPMG Audit Plc to be
independent and objective.
The Audit Committee monitors and reviews the effectiveness of
the Company’s financial accounting process.
The Key Performance Indicators (KPIs) and principal risks and
uncertainties affecting the Group are considered in the
Chairman’s Review and the Financial Review.
(vii) Risk ManagementThe Directors continually review the effectiveness of the
Group’s system of internal controls.
The Board has overall ownership of the risk management
strategy and process and coordinates activity across the
Group. There is an ongoing process for identifying, evaluating
and managing significant risks faced by the Group, which has
been in place for the year under review and up to the date of
approval of this Annual Report. The Group manages risk by a
combination of insurance and self-insurance. Self-insurance
refers to actions taken internally or in conjunction with other
third parties. In broad terms, high risks in financial and
operational areas are more dependent on insurance than risks
in commercial and personnel areas, which because of their
nature are more likely to be managed by self-insurance.
Each subsidiary Company has a strategy and process for
highlighting the key risk areas of their business, and explaining
the control measures and risk exposure. It then takes
appropriate steps to manage the risk exposure taking into
consideration the likelihood, impact and cost/benefit of each of
the risks, In addition to the Audit Committee, which is a
mandatory requirement under the Combined Code, the Board
has Steering Groups with risk management briefs.
These include:
• Health & Safety • Environment
• Insurance • Foreign Currency
• Human Resources • Purchasing
• Pensions • Information Systems

pages 26 | 27James Cropper plc Annual Report and Accounts 2012
Report of theDirectorscontinued(viii) Relations with ShareholdersThe Finance Director, the Chairman and the Chief Executive
maintain contact with institutional investors as appropriate and
any presentations made to them can be found on the
Company’s website.
The Non-Executive Directors attend the Annual General
Meeting and are available for discussions with shareholders.
Currently the Company makes available its financial results on
the website www.cropper.com and issues printed copies of the
Annual Report to shareholders.
(ix) Going ConcernThe Directors consider that the risks noted in (vii) above are the
most significant to the Group but these do not necessarily
comprise all risks to which the Group is exposed. In particular,
the Group’s performance could be adversely affected by poor
economic conditions. Additional risks and uncertainties
currently unknown to the Directors, or which the Directors
currently believe are immaterial, may also have a material
adverse effect on its business, financial condition or prospects.
At 31 March 2012 the Group’s available borrowing facilities
were £10,397,000, of which £4,959,000 was undrawn. Having
taken account of current borrowings to be repaid within 12
months of the balance sheet date, £8,328,000 was available to
the Group beyond 12 months.
The Directors having considered the current trading prospects,
identifiable risks, working capital requirements and the
availability of finance are of the opinion that the Group and
Company are going concerns. The accounts have been
prepared on this basis.
At the Annual General Meeting the Chairman will give an update
on the current trading position and invites shareholders to table
any questions and encourages their participation.
Payment of CreditorsThe Company had 30 days (2011: 36 days) purchases
outstanding at 31 March 2012. It is the Group’s policy to agree
terms of payment with its suppliers when agreeing the terms of
a business transaction or transactions. All suppliers are aware
of this procedure and the Group abides by the agreed payment
terms subject to the terms and conditions being met by the
supplier.
Employee InvolvementRegular Consultative Meetings are held with the employee trade
union representatives to advise them on all aspects of
Company developments. A monthly briefing on Group
performance is carried out for all employees and they have
access to a copy of the Annual Report. As a matter of policy,
plans are formally discussed with those who will use new
equipment, plant and computer systems before designs are
finalised. Safety Improvement teams deal with day-to-day
aspects of safety improvement.
The Group operates an Employee Profit Sharing Scheme which
is made up of three elements – financial performance, safety
performance, and attendance performance. A Save as You
Earn Share Option Scheme is also available to encourage
employee involvement.
Independent to the assets on the Group Balance Sheet there is
an Employee Share Trust which currently holds approx 128,000
shares in James Cropper plc for the benefit of all employees so
that their interests are linked to the Company’s future growth.
The Trust was set up in 1997 and the initial finance came from
savings achieved through the introduction of a Profit Related
Pay salary replacement scheme.
No Director is a trustee of the Scheme, and the trustees
confirm that they apply the assets for purely benevolent
purposes.
Employment of Disabled PeopleIt is the Group’s policy to give equality of opportunity when
considering applications from disabled people where the job
requirements are considered to be within their ability. When
existing employees become disabled they are retained
wherever reasonable and practicable. The Group tries to
provide equal promotion opportunities wherever possible.
Donations for Political and Charitable PurposesIt is the Company’s policy not to make any donations to, or
incur expenditure on behalf of political parties, other political
organisations or independent election candidates and the
Board does not intend to change this policy.
Donations totalling £6,000 (2011: £14,000) were made for
various local charitable purposes.
Directors’ Authority to Allot SharesResolution 11 which will be proposed as a special resolution
renews an existing authority which expires this year and gives
the Directors authority to exercise the powers of the Company
to allot un-issued shares.
The Directors have no present intention of exercising the
allotment authority proposed by the resolution other than
pursuant to existing rights under employee share schemes.
To ensure compliance with institutional guidelines and market
practice, it is proposed that the authority will:-
• be limited to £381,083, being less than one-third of the
Company’s issued share capital; and
• expire at the conclusion of the next Annual General Meeting
or, if earlier, 15 months from the forthcoming Annual General
Meeting except insofar as commitments to allot shares have
been entered into before that date.
It is the intention of the Directors to seek a similar authority
annually.
Directors’ Power to Disapply Pre-emption RightsResolution 12 is being proposed as a special resolution
granting the Directors authority for the ensuing year to allot
shares by way of rights to shareholders and to issue a
maximum of £211,892 of the nominal share capital of the
Company for cash without first offering the shares to the
existing shareholders pursuant to Section 570 of the
Companies Act 2006. The resolution also disapplies pre-
exemption rights in the event of the sale of treasury shares.
Other than in the case of rights issues, the amount of the
general authority to the Directors is limited to allotments of
shares for cash up to a total nominal value of £211,892 which
represents approximately 10% of the issued ordinary share
capital. The authority will terminate at the next Annual General
Meeting or 15 months after the forthcoming Annual General
Meeting, whichever comes first. The Directors propose to
renew this authority annually.
Company’s Authority to Purchase SharesResolution 13 will be proposed as a special resolution to renew
an existing authority which expires at the Annual General
Meeting and gives the Company authority to make market
purchases of its own shares. The Directors would only
exercise this power when it would be in the interests of the
Group’s shareholders as a whole to do so, having regard to the
effect on both earnings and net asset values per share.
Currently there is no intention of making repurchases.
If such repurchases were made, the Directors would have to
agree whether the shares are to be cancelled or to be held in
treasury so as to be available for sale at a later date.
The amount of the general authority to the Directors represents
approximately 15% of the issued ordinary share capital. The
authority will terminate at the next Annual General Meeting or 15
months after the forthcoming Annual General Meeting,
whichever comes first. The Directors intend to renew this
authority annually.
Substantial InterestsShareholdings in excess of 3% of the issued capital at 5 June
2012 were as follows: -
Name of Number of % Noteshareholding shares holding no.
M A J CropperDirectors’ Beneficial Interest 1,206,540 14.2
P J WillinkDirectors’ Non-beneficial Interest 1,132,408 13.4 1
J A Cropper1974 Settlement 1,062,974 12.5 2
J A CropperDirectors’ Beneficial Interest 568,337 6.7
Principal Nominees Ltd 549,098 6.5 5
J A CropperDirectors’ Non-beneficial Interest 454,418 5.4 3
Barclayshare Nominees Ltd 428,040 5.1 4
Notes on Shareholding Table
1. Included in this percentage is 12.5% disclosed in the
shareholding of J A Cropper 1974 Settlement.
2. Included in this percentage is 6.3 % disclosed in the
shareholding of M A J Cropper – Directors’ Beneficial
Interest.
3. Included in this percentage is 3.3% disclosed in the
shareholding of M A J Cropper – Directors’ Beneficial
Interest.
4. Included in this percentage is 4.2% disclosed in the
shareholding of M A J Cropper – Directors’ Beneficial
Interest.
5. Included in this percentage is 0.7% disclosed in the
shareholding of J A Cropper – Directors’ Beneficial Interest.
Auditor and Disclosure of Information to AuditorEach Director, as at the date of this report, has confirmed that
insofar as they are aware there is no relevant audit information
(that is, information needed by the Company's auditor in
connection with preparing their report) of which the Company's
auditor is unaware, and they have taken all the steps that they
ought to have taken as a Director in order to make themselves
aware of any relevant audit information and to establish that the
Company's auditor is aware of that information.
The auditor, KPMG Audit Plc, have indicated their willingness to
continue in office and Resolution 8 will be proposed at the
Annual General Meeting for their re-appointment.

pages 28 | 29James Cropper plc Annual Report and Accounts 2012
Report of theDirectorscontinuedDetails of Directors’ Interests
At 31 March 2012 At 2 April 2011
Ordinary Options on Ordinary Options onShares Ordinary Shares Ordinary
Shares Shares
Director Interest
M A J Cropper Beneficial 1,206,540 - 1,206,540 -
Non-beneficial 114,000 - 174,000 -
J A Cropper Beneficial 568,337 - 568,337 -
Non-beneficial 454,418 - 532,752 -
A I Lewis Beneficial 67,761 63,000 55,261 103,000
J M Denman Beneficial 11,716 52,000 7,716 75,000
Non-beneficial - - 381,000 -
N A Read Beneficial 19,289 52,000 9,289 75,000
Non-beneficial - - 381,000 -
P J Willink Beneficial 36,306 52,000 26,306 75,000
Non-beneficial 1,132,408 - 1,132,408 -
G T Quayle Beneficial 20,327 52,000 10,327 75,000
Non-beneficial 28,084 - 28,084 -
D R Wilks Beneficial 7,445 - 7,445 -
Non-beneficial 114,000 - 174,000 -
J E Sharp Beneficial 7,950 - 7,950 -
Non-beneficial 114,000 - 174,000 -
D Mitchell Beneficial 1,000 - - -
Non-beneficial 114,000 - - -
Details of Directors’ InterestsThe Directors who served throughout the period are detailed in
the Directors’ Remuneration Report, and details of their
interests in shares of the Company are listed above.
Any material related party transactions between the Directors
and the Company are set out in the Notes to the Accounts.
Further information relating to the interests of the Directors
regarding options on ordinary shares is given in the Directors’
Remuneration Report.
Non-beneficial interests include shares held jointly as trustee
with other Directors.
There have been no material changes between the year end
and 25 June 2012.
Approved by the Board of Directors on 25 June 2012 and were
signed on its behalf by
M A J CropperChairman
Burneside Mills
Kendal
Directors’Remuneration Report
This Report provides details of Directors’ remuneration.
Service ContractsThe Executive Directors are employed on rolling one year
contracts subject to one year’s notice served by the Group on
the Executive, and six months notice served by the Executive
on the Group. The Chairman is employed on a rolling contract
subject to twelve months notice by either side. Other Non-
Executive Directors are on one month’s notice by either side
and they are typically expected to serve two three-year terms,
with additional terms of office agreed on an annual basis.
Salaries and FeesThe remuneration and emoluments of Executive Directors are
determined by the Remuneration Committee. The remuneration
of the Non-Executive Directors is agreed by the Group Board
and they are not entitled to participate in pension schemes,
bonus arrangements or share schemes. The basic salaries of
the Executive Directors are reviewed annually and take into
consideration cost of living and overall accountability. Also
considered is remuneration paid to senior executives in
comparable public companies. This information is checked by
reference to published surveys, but no formula is in place to
determine any specific relationship.
The remuneration of senior management is discussed by the
Chairman of the Remuneration Committee and the Chief
Executive and their recommendations endorsed by the
Remuneration Committee.
No Director can take part in the decision on his own salary or
reward.
Annual BonusThe Group operates an Executive Directors’ Reward Scheme
which is structured to reward the Executive Directors if targets
are achieved on Group profitability, return on investment, safety,
productivity improvements and a discretionary element agreed
by the Remuneration Committee. The total bonus payable to a
Director is capped at 25% of their contractual salary and is not
pensionable.
Employee Share SchemesThe Group operates Inland Revenue Approved and
Unapproved Share Option Schemes, and a Long Term
Incentive Plan Scheme for the Executive Directors, of which
details of the options granted are shown later in this Report.
Comparison of Five Year Cumulative TotalShareholder Return (TSR)To enable shareholders to assess the Company’s performance
against the London Stock Exchange, the cumulative TSR for
the period ended 31 March 2012 is shown in the graph below.
The FTSE All Share is deemed to be the most appropriate
comparison in terms of performance. TSR is the total return to
shareholders in terms of capital growth and dividends
reinvested.
Rebased
200
180
160
140
120
100
80
60
40
20
James Cropper plc FTSE AIM All share FTSE All share
Total Shareholder Return
Mar Mar Mar Mar Mar Mar Mar Mar Mar Mar Mar02 03 04 05 06 07 08 09 10 11 12

pages 30 | 31James Cropper plc Annual Report and Accounts 2012
Directors’Remuneration ReportcontinuedDetails of Directors’ RemunerationThe financial details within this report have been audited. The following table brings together the various elements of remuneration of
each Director for the financial year period ended 31 March 2012: -
Salary & Fees Benefits Annual Bonus Total2012 2011 2012 2011 2012 2011 2012 2011£’000 £’000 £’000 £’000 £’000 £’000 £’000 £’000
ExecutiveA I Lewis 117 114 19 17 - 17 136 148
J M Denman 93 91 17 17 - 17 110 125
N A Read 89 86 17 16 - 15 106 117
P J Willink 88 86 19 19 - 15 107 120
G T Quayle 93 91 19 17 - 24 112 132
Non-ExecutiveM A J Cropper 46 40 - - - - 46 40
J A Cropper 18 37 - 11 - - 18 48
D R Wilks 22 21 - - - - 22 21
J E Sharp 18 18 - - - - 18 18
D Mitchell (appointed January 2012) 6 - - - - - 6 -
590 584 91 97 - 88 681 769
Highest paid Director2012 2011
£’000 £’000
Aggregate emoluments 136 148
Accrued pension under defined benefit pension scheme 48 45
Long term incentive scheme 3 7
Directors’ PensionsThe Executive Directors who served during the year have retirement benefits accruing under the Group’s Staff Pension Scheme,
which is a Defined Benefit Scheme.
The following table shows the amount of entitlements earned, the accrued pension liabilities and the changes therein:
Increase Increase Total Transfer Increase in Transfer Transferin accrued in accrued accrued value of net transfer value of value of
pension pension pension at increase in value less accrued accruedduring year during year 31 March accrual after Directors’ pension at pension at
after before 2012 inflation contri- 31 March 2 Aprilinflation inflation during year butions 2012 2011
£’000 £’000 £’000 £’000 £’000 £’000 £’000
A I Lewis - 3 48 (6) 235 904 660
J M Denman 1 4 53 21 275 1131 849
N A Read - 2 45 (10) 223 926 697
P J Willink - 2 31 (3) 133 432 291
G T Quayle - 2 31 1 153 649 489
The accrued pension is the amount that the Director would receive if he retired at the end of the year. The increase in the accrued
pension is the difference between the accrued benefit at the year end and that at the previous year end.
All transfer values have been calculated on the basis of actuarial advice in accordance with technical actuarial standards issued by
the Board for Actuarial Standards. The transfer values represent the value of assets that the pension scheme would need to
transfer to another pension provider on transferring the scheme’s liability in respect of the Directors’ pension benefits. They do not
represent sums payable to individual Directors and therefore cannot be added meaningfully to annual remuneration.
The increase in transfer value less Directors’ contributions is the increase in the transfer value of the accrued benefits during the year
after deducting the Directors’ personal contributions to the scheme.
The transfer value of net increase in accrual, required by the Listing Rules, discloses the current value of the increase in accrued
benefits that the Director has earned in the period, whereas his change in transfer value, required by the Companies Act, discloses
the absolute increase or decreases in his transfer value and includes the change in value of the accrued benefits that results from
market volatility affecting the transfer value at the beginning of the period, as well as the additional value earned in the year.
Share OptionsAt the 2000 Annual General Meeting shareholders approved the introduction of the Unapproved Part of the 1998 Senior Executive
Share Option Scheme. The movements on this Scheme during the year were: -
Number Number Number Options Exercise Number at
at 2 April granted exercised lapsed Price 31 March
2011 in period in period in period £ Exercisable 2012
A I Lewis 30,000 - - 30,000 2.065 June 2004 to June 2011 -
J M Denman 15,000 - - 15,000 2.065 June 2004 to June 2011 -
N A Read 15,000 - - 15,000 2.065 June 2004 to June 2011 -
P J Willink 15,000 - - 15,000 2.065 June 2004 to June 2011 -
G T Quayle 15,000 - - 15,000 2.065 June 2004 to June 2011 -
The Senior Executive Share Option Scheme has now ceased.
Long Term Incentive PlansAwards were made during the year under the Long Term Incentive Plan were as follows:
Number Number Number Options Number atat 2 April granted exercised lapsed 31 March
2011 in period in period in period 2012
A I Lewis 73,000 15,000 25,000 - 63,000
J M Denman 60,000 12,000 20,000 - 52,000
N A Read 60,000 12,000 20,000 - 52,000
P J Willink 60,000 12,000 20,000 - 52,000
G T Quayle 60,000 12,000 20,000 - 52,000
The maximum number of shares that can be awarded to any
participant in a financial year under the Long Term Incentive
Scheme, determined by reference to average mid market prices
at the time of the award, is limited to 50% of the participant’s
basic salary. The average mid market price of the awards
granted in the year was £2.273.
The Awards are subject to the following performance conditions:
• Awards will vest in full if the earnings per share, adjusted for
IFRS pension adjustments, exceed the increase in retail price
index plus 10% per annum over a three year period;
• Awards will vest as to 10% if the earnings per share, adjusted
for IFRS pension adjustments, exceed the increase in retail
price index plus 2.5% per annum over a three year period;
• Awards will vest proportionally between 10% and 100% if the
earnings per share, adjusted for IFRS adjustments, exceed the
increase in retail price index by more than 2.5% and less than
10% per annum over a three year period;
• Awards will lapse if earnings per share, adjusted for IFRS
pension adjustments, do not exceed the increase in retail
price plus 2.5% per annum over a three year period.
The market price of the shares at the period end was £1.81 and
the high and low for the period was £2.43 and £1.52
respectively.
D R WilksChairman of the Remuneration Committee
25 June 2012

James Cropper plc Annual Report and Accounts 2012
Statementof Comprehensive Income
52 week 53 week 53 week 53 weekperiod to period to period to period to
31 March 2 April 2 April 2 April2012 2011 2011 2011
Continuing Continuing PensionOperations Operations Curtailment Total
Note £'000 £'000 £'000 £'000
Continuing operationsRevenue 2 78,223 83,264 - 83,264
Other income 187 209 - 209
Changes in inventories of finished goods and work in progress 648 1,281 - 1,281
Raw materials and consumables used (35,433) (40,494) - (40,494)
Energy costs (4,616) (4,255) - (4,255)
Employee benefit costs 20 (20,679) (19,596) - (19,596)
Depreciation and amortisation 4 (2,675) (2,908) - (2,908)
Exceptional Pension Credit 17 - - 10,158 10,158
Other expenses (14,987) (14,903) - (14,903)
Operating Profit 2 668 2,598 10,158 12,756
Interest payable and similar charges 3 (369) (137)
Interest receivable and similar income 3 672 193
Profit before taxation 4 971 12,812Tax expense 5 (134) (2,598)
Profit from continuing operations 837 10,214
Discontinued operation 25 - (1,726)
Profit for the period 837 8,488
Other comprehensive incomeForeign currency translation 4 4
Retirement benefit liabilities – actuarial (losses) / gains 17 (7,418) 2,388
Deferred tax on actuarial losses / (gains) on retirement
benefit liabilities 18 1,483 (621)
Income tax on other comprehensive income 292 -
Total comprehensive income for the period attributable toequity holders of the Company (4,802) 10,259
Earnings per share - basic 6 9.9p 100.2p
Earnings per share -diluted 6 9.5p 97.6p
Continuing Operations Earnings per share - basic 6 9.9p 120.6p
Continuing Operations Earnings per share -diluted 6 9.5p 117.4p
Dividend declared in the period - pence per share 7.9p 7.9p
pages 32 | 33
Report of theIndependent Auditor
We have audited the financial statements of James Cropper plc
for the period ended 31 March 2012 set out on pages 33 to
66. The financial reporting framework that has been applied in
their preparation is applicable law and International Financial
Reporting Standards (IFRSs) as adopted by the EU and, as
regards the Parent Company financial statements, as applied in
accordance with the provisions of the Companies Act 2006.
This report is made solely to the Company's members, as a
body, in accordance with Chapter 3 of Part 16 of the
Companies Act 2006. Our audit work has been undertaken so
that we might state to the Company's members those matters
we are required to state to them in an auditor's report and for
no other purpose. To the fullest extent permitted by law, we do
not accept or assume responsibility to anyone other than the
Company and the Company's members, as a body, for our
audit work, for this report, or for the opinions we have formed.
Respective responsibilities of Directors and AuditorAs explained more fully in the Directors' Responsibilities
Statement set out on page 23, the Directors are responsible for
the preparation of the financial statements and for being
satisfied that they give a true and fair view. Our responsibility is
to audit, and express an opinion on, the financial statements in
accordance with applicable law and International Standards on
Auditing (UK and Ireland). Those standards require us to
comply with the Auditing Practices Board's (APB's) Ethical
Standards for Auditors.
Scope of the audit of the financial statementsA description of the scope of an audit of financial statements is
provided on the APB's website at
www.frc.org.uk/apb/scope/private.cfm.
Opinion on financial statementsIn our opinion:
• the financial statements give a true and fair view of the state
of the Group's and of the Parent Company's affairs as at
31 March 2012 and of the Group's profit for the year then
ended;
• the Group financial statements have been properly prepared
in accordance with IFRSs as adopted by the EU;
• the Parent Company financial statements have been properly
prepared in accordance with IFRSs as adopted by the EU
and as applied in accordance with the provisions of the
Companies Act 2006; and
• the financial statements have been prepared in accordance
with the requirements of the Companies Act 2006.
Opinion on other matter prescribed by theCompanies Act 2006In our opinion the information given in the Directors' Report for
the financial year for which the financial statements are prepared
is consistent with the financial statements.
Matters on which we are required to report byexceptionWe have nothing to report in respect of the following matters
where the Companies Act 2006 requires us to report to you if,
in our opinion:
• adequate accounting records have not been kept by the
Parent Company, or returns adequate for our audit have not
been received from branches not visited by us; or
• the Parent Company financial statements are not in
agreement with the accounting records and returns; or
• certain disclosures of Directors' Remuneration specified by
law are not made; or
• we have not received all the information and explanations we
require for our audit.
Jonathan HurstSenior Statutory Auditor
for and on behalf of KPMG Audit Plc, Statutory Auditor
Chartered Accountants
Edward VII Quay
Navigation Way
Preston
PR2 2YF
25 June 2012
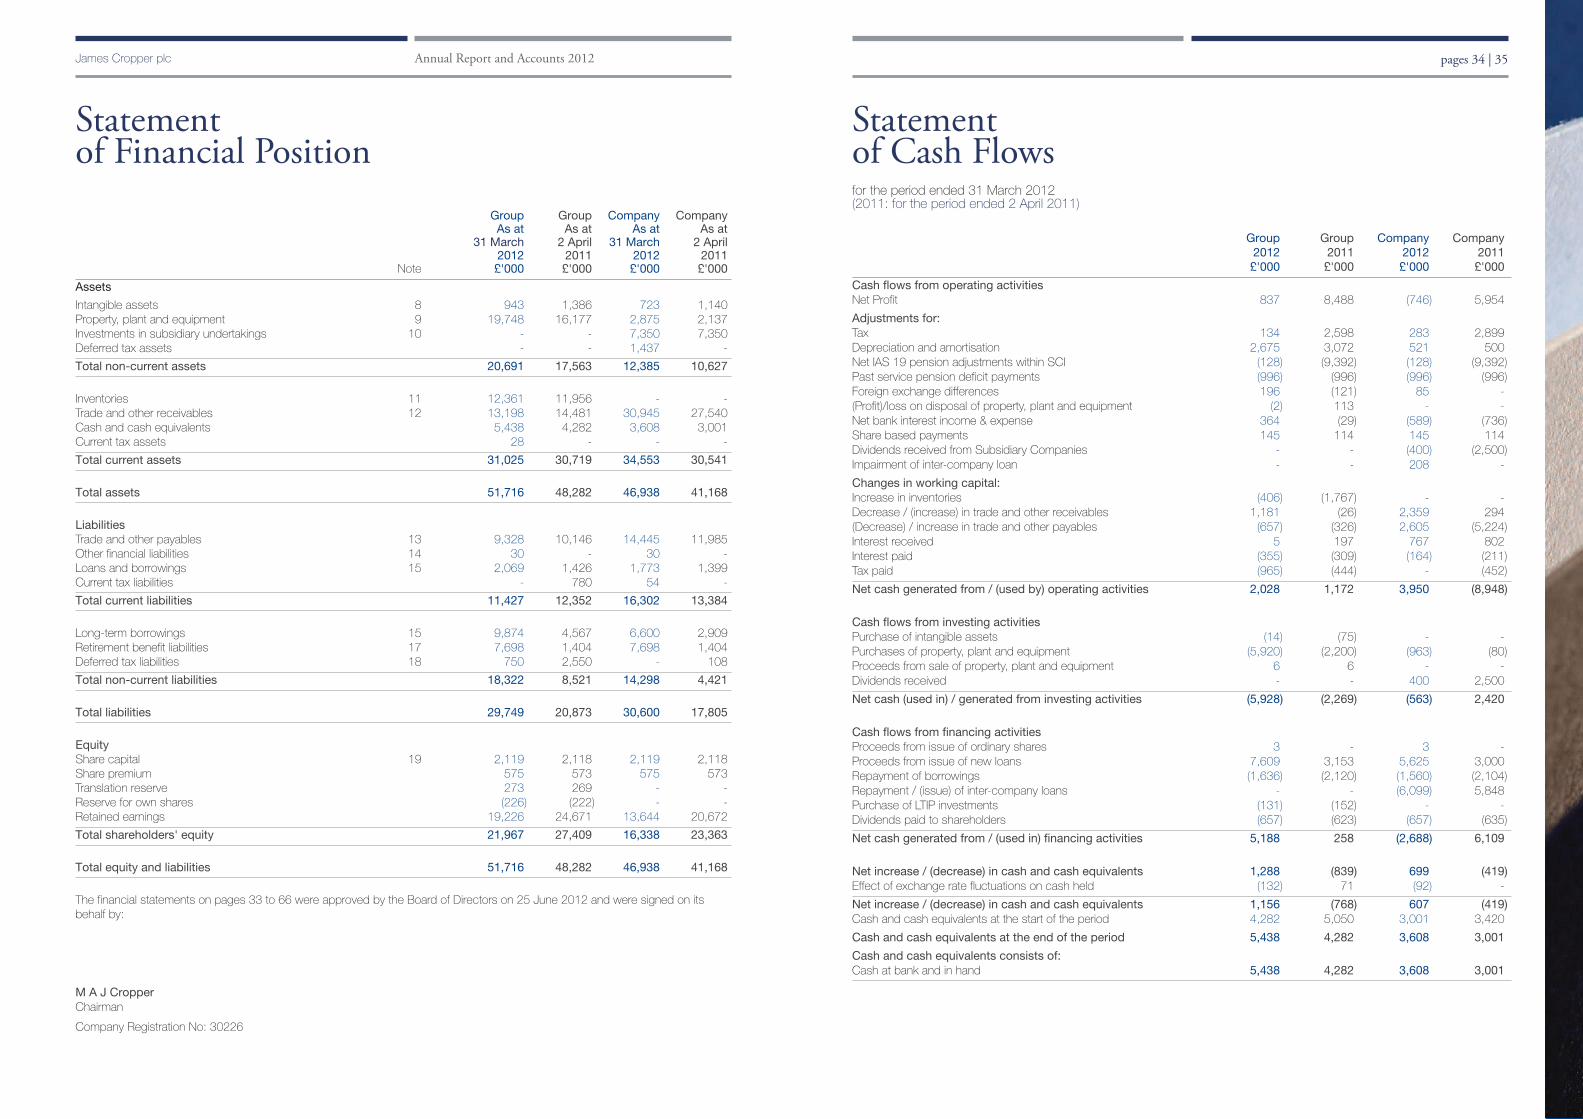
pages 34 | 35James Cropper plc Annual Report and Accounts 2012
Group Group Company CompanyAs at As at As at As at
31 March 2 April 31 March 2 April2012 2011 2012 2011
Note £'000 £'000 £'000 £'000
Assets
Intangible assets 8 943 1,386 723 1,140Property, plant and equipment 9 19,748 16,177 2,875 2,137Investments in subsidiary undertakings 10 - - 7,350 7,350Deferred tax assets - - 1,437 -
Total non-current assets 20,691 17,563 12,385 10,627
Inventories 11 12,361 11,956 - -Trade and other receivables 12 13,198 14,481 30,945 27,540Cash and cash equivalents 5,438 4,282 3,608 3,001Current tax assets 28 - - -
Total current assets 31,025 30,719 34,553 30,541
Total assets 51,716 48,282 46,938 41,168
LiabilitiesTrade and other payables 13 9,328 10,146 14,445 11,985Other financial liabilities 14 30 - 30 -Loans and borrowings 15 2,069 1,426 1,773 1,399Current tax liabilities - 780 54 -
Total current liabilities 11,427 12,352 16,302 13,384
Long-term borrowings 15 9,874 4,567 6,600 2,909Retirement benefit liabilities 17 7,698 1,404 7,698 1,404Deferred tax liabilities 18 750 2,550 - 108
Total non-current liabilities 18,322 8,521 14,298 4,421
Total liabilities 29,749 20,873 30,600 17,805
EquityShare capital 19 2,119 2,118 2,119 2,118Share premium 575 573 575 573Translation reserve 273 269 - -Reserve for own shares (226) (222) - -Retained earnings 19,226 24,671 13,644 20,672
Total shareholders' equity 21,967 27,409 16,338 23,363
Total equity and liabilities 51,716 48,282 46,938 41,168
The financial statements on pages 33 to 66 were approved by the Board of Directors on 25 June 2012 and were signed on itsbehalf by:
M A J CropperChairman
Company Registration No: 30226
Statementof Financial Position
Statementof Cash Flowsfor the period ended 31 March 2012(2011: for the period ended 2 April 2011)
Group Group Company Company2012 2011 2012 2011
£'000 £'000 £'000 £'000
Cash flows from operating activitiesNet Profit 837 8,488 (746) 5,954
Adjustments for:Tax 134 2,598 283 2,899Depreciation and amortisation 2,675 3,072 521 500Net IAS 19 pension adjustments within SCI (128) (9,392) (128) (9,392)Past service pension deficit payments (996) (996) (996) (996)Foreign exchange differences 196 (121) 85 -(Profit)/loss on disposal of property, plant and equipment (2) 113 - -Net bank interest income & expense 364 (29) (589) (736)Share based payments 145 114 145 114Dividends received from Subsidiary Companies - - (400) (2,500)Impairment of inter-company loan - - 208 -
Changes in working capital:Increase in inventories (406) (1,767) - -Decrease / (increase) in trade and other receivables 1,181 (26) 2,359 294(Decrease) / increase in trade and other payables (657) (326) 2,605 (5,224)Interest received 5 197 767 802Interest paid (355) (309) (164) (211)Tax paid (965) (444) - (452)
Net cash generated from / (used by) operating activities 2,028 1,172 3,950 (8,948)
Cash flows from investing activitiesPurchase of intangible assets (14) (75) - -Purchases of property, plant and equipment (5,920) (2,200) (963) (80)Proceeds from sale of property, plant and equipment 6 6 - -Dividends received - - 400 2,500
Net cash (used in) / generated from investing activities (5,928) (2,269) (563) 2,420
Cash flows from financing activitiesProceeds from issue of ordinary shares 3 - 3 -Proceeds from issue of new loans 7,609 3,153 5,625 3,000Repayment of borrowings (1,636) (2,120) (1,560) (2,104)Repayment / (issue) of inter-company loans - - (6,099) 5,848Purchase of LTIP investments (131) (152) - -Dividends paid to shareholders (657) (623) (657) (635)
Net cash generated from / (used in) financing activities 5,188 258 (2,688) 6,109
Net increase / (decrease) in cash and cash equivalents 1,288 (839) 699 (419)Effect of exchange rate fluctuations on cash held (132) 71 (92) -
Net increase / (decrease) in cash and cash equivalents 1,156 (768) 607 (419)Cash and cash equivalents at the start of the period 4,282 5,050 3,001 3,420
Cash and cash equivalents at the end of the period 5,438 4,282 3,608 3,001
Cash and cash equivalents consists of:Cash at bank and in hand 5,438 4,282 3,608 3,001

James Cropper plc Annual Report and Accounts 2012
Group Share Share Translation Own Retainedcapital premium reserve shares earnings Total£'000 £'000 £'000 £'000 £'000 £'000
At 27 March 2010 2,118 573 265 (128) 14,983 17,811
Profit for the period - - - - 8,488 8,488
Exchange differences - - 4 - - 4Actuarial gains on retirement benefit liabilities (net of tax) - - - - 1,767 1,767
Total other comprehensive income - - 4 - 1,767 1,771
Dividends paid - - - - (623) (623)Share based payment charge - - - - 114 114Distribution of own shares - - - 58 (58) -Consideration paid for own shares - - - (152) - (152)
Total contributions by and distributions to owners of the Group - - - (94) (567) (661)
At 2 April 2011 2,118 573 269 (222) 24,671 27,409
Profit for the period 837 837
Exchange differences - - 4 - - 4Actuarial losses on retirement benefit liabilities (net of tax) - - - - (5,643) (5,643)
Total other comprehensive income - - 4 - (5,643) (5,639)
Dividends paid - - - - (657) (657)Share based payment charge - - - - 145 145Distribution of own shares - - - 127 (127) -Proceeds from issue of ordinary shares 1 2 - - - 3Consideration paid for own shares - - - (131) - (131)
Total contributions by and distributions to owners of the Group 1 2 - (4) (639) (640)
At 31 March 2012 2,119 575 273 (226) 19,226 21,967
Company
At 27 March 2010 2,118 573 13,530 16,221
Profit for the period - - 5,954 5,954
Actuarial gains on retirement benefit liabilities (net of tax) - - 1,767 1,767
Total other comprehensive income - - 1,767 1,767
Dividends paid - - (635) (635)Share based payment charge - - 114 114Distribution of own shares - - (58) (58)
Total contributions by and distributions to owners of the Group - - (579) (579)
At 2 April 2011 2,118 573 20,672 23,363
Profit for the period - - (746) (746)
Actuarial losses on retirement benefit liabilities (net of tax) - - (5,643) (5,643)
Total other comprehensive income - - (5,643) (5,643)
Dividends paid - - (657) (657)Share based payment charge - - 145 145Proceeds from issue of ordinary shares 1 2 - 3Distribution of own shares - - (127) (127)
Total contributions by and distributions to owners of the Group 1 2 (639) (636)
At 31 March 2012 2,119 575 13,644 16,338
Statementof Changes in Equity
James Cropper plc Annual Report and Accounts 2012
1. Accounting policiesThe principal accounting policies adopted in the preparation of
these financial statements are set out below. These policies
have been consistently applied to all the years presented,
unless otherwise stated.
Basis of preparationThe accounting “year” for the Group is a 52 week accounting
period ending 31 March 2012, (2011: 53 week accounting
period ended 2 April 2011).
Throughout these notes, the following references apply:
The Statement of Comprehensive Income is referenced
as “SCI”
The Statement of Financial Position is referenced as “SFP”
Both the Parent Company financial statements and the Group
financial statements have been prepared and approved by the
Directors in accordance with International Financial Reporting
Standards as adopted by the EU (“Adopted IFRSs”). On
publishing the Parent Company financial statements here
together with the Group financial statements, the Company is
taking advantage of the exemption in s408 of the Companies
Act 2006 not to present its individual Statement of
Comprehensive Income and related notes that form a part of
these approved financial statements.
Use of estimates and judgementsThe preparation of financial statements in conformity with
generally accepted accounting principles requires the use of
estimates and judgements that affect the reported amounts of
assets and liabilities at the date of the financial statements and
the reported amounts of revenues and expenses during the
reporting period. Although these estimates are based on
management’s best knowledge of the amount, event or actions,
actual results ultimately may differ from those estimates.
The following are the policies and accompanying notes are
where the assumptions and judgements made by management
could have an impact on the Group’s consolidated financial
statements.
Note 9 Property, plant and equipmentIt is the Group’s policy to depreciate categories within property,
plant and equipment on a straight line basis over their estimated
useful lives. A key element of this policy is the estimate of the
useful life applied to each category of asset which in turn
determines the annual depreciation charge. Variations in asset
lives could affect Group profit through an increase or decrease
in the depreciation charge.
Note 11 InventoriesIn the course of normal trading activities management uses its
judgement to establish the net realisable value of its stocks.
Provisions are established for obsolete or slow moving stocks,
based on past practice, current conditions and aged inventory
facts available to management.
Note 12 Trade receivablesIn estimating the collectability of trade receivables judgement is
required and the policies in regard to credit risk are further
described in note 16.2.
Note 17 Retirement benefitsAssumptions used in the calculation of the Group’s retirement
liability have the biggest impact on these financial statements
and are detailed in note 17.
Basis of consolidationThe financial statements of the Group consolidate the accounts
of the Company and those of its subsidiary undertakings. No
subsidiaries are excluded from consolidation. The results and
cash flows of subsidiary undertakings acquired are included
from the effective date of acquisition. Intragroup balances and
any unrealised income and expenses arising from intra-group
transactions are eliminated in preparing the consolidated
financial statements.
Subsidiaries are entities controlled by the Group. Control exists
when the Group has the power, directly or indirectly, to govern
the financial and operating policies of an entity so as to obtain
benefits from its activities. The financial statements of
subsidiaries are included in the consolidated financial
statements from the date that control commences until the date
that control ceases.
Revenue recognitionRevenue is recognised when the significant risks and rewards
of ownership have been transferred to the customer. For the
majority of customers this is when delivery has been made or
specifically when title has passed, the point at which title
passes varying in accordance with the terms and conditions of
trade. Revenue is recognised when the amount of the revenue
and related costs can be measured reliably and the
collectability of the related receivables is reasonably assured.
Revenue is measured at the fair value of the amount received or
receivable which is arrived at after deducting trade rebates,
customer returns and value added tax. Shipping and handling
costs, such as freight to our customers’ destination are
included in cost of sales. These costs, when included in the
sales price charged for our products are recognised in net
sales.
Notes to theFinancial Statements
Operating segmentsIFRS 8 Operating Segments has been adopted by the Group
and requires that entities reflect the ‘management approach’ to
reporting the financial performance of its operating segments.
Management has determined the segments that are reported in
a manner consistent with the internal reporting provided to the
chief operating decision maker, identified as the Executive
Committee that makes strategic decisions. The committee
considers the business principally via the four main business
segments, on the basis of its statutory structure. Business
segments are those components of the Group that are
engaged in providing a group of related products that are
subject to risks and returns that are different to other business
segments. Geographical segments are components where
the eventual product destination is in a particular geographic
environment which is subject to risks and returns that are
different from other such segments. Costs are allocated to
segments based on the segment to which they relate. Central
costs are recharged on an appropriate basis.
Foreign currenciesTransactions in foreign currencies are translated at the foreign
exchange rate ruling at the date of the transaction. Monetary
assets and liabilities denominated in foreign currencies at the
Statement of Financial Position date are translated at the
foreign exchange rate ruling at that date. Foreign exchange
differences arising on translation are recognised in the
Statement of Comprehensive Income. Non-monetary assets
and liabilities that are measured in terms of historical cost in a
foreign currency are translated using the exchange rate at the
date of the transaction.
The assets and liabilities of foreign operations are translated at
foreign exchange rates ruling at the Statement of Financial
Position date. The revenues and expenses of foreign
operations are translated at an average rate for the period
where this rate approximates to the foreign exchange rates
ruling at the dates of the transactions. Exchange differences
arising from translation of foreign operations are taken directly
to the translation reserve; they are released into the Statement
of Comprehensive Income upon disposal.
The portion of gain or loss on foreign currency borrowings that
are used to hedge a net investment in a foreign operation, that
is determined to be an effective hedge, is included as a
movement in the cumulative translation reserve. On
subsequent disposal such gains or losses will form part of the
profit/loss on disposal within the Statement of Comprehensive
Income. Any ineffective portion is recognised immediately in the
Statement of Comprehensive Income. This Policy was adopted
for the first time in the period ended 27 March 2010.
Research and developmentResearch expenditure is recognised as an expense as
incurred. Costs incurred on development projects (relating to
the design and testing of new or improved products) are
recognised as intangible assets when the IAS38 conditions are
met. Other development expenditures are recognised as an
expense as incurred. Development costs with a finite useful life
that have been capitalised are amortised from the
commencement of the commercial production of the product
on a straight-line basis over the period of its expected benefit,
not exceeding 5 years.
Retirement benefitsThe Group operates various pension schemes. The schemes
are generally funded through payments to trustee-administered
funds, determined by periodic actuarial valuations. The Group
has both defined benefit and defined contribution plans.
A defined benefit plan is a pension plan that defines an amount
of pension benefit that an employee will receive on retirement.
A defined contribution plan is a pension plan under which the
Group pays fixed contributions.
The liability recognised in the Statement of Financial Position in
respect of defined benefit pension plans is the present value of
the defined benefit obligation at the Statement of Financial
Position date less the fair value of plan assets. The defined
benefit obligation is calculated annually by independent
actuaries using the projected unit credit method. The present
value of the defined benefit obligation is determined by
discounting the estimated future cash flows using interest rates
of high-quality corporate bonds that are denominated in the
currency in which the benefits will be paid, and that have terms
to maturity approximating to the terms of the related pension
liability.
Actuarial gains and losses arising from experience adjustments
and changes in actuarial assumptions are recognised in the
period in which they occur outside of Statement of
Comprehensive Income in the Statement of Changes in Equity.
Past service costs are recognised immediately in income,
unless the changes to the pension plan are conditional on the
employees remaining in service for a specified period of time
(the vesting period). In this case, the past-service costs are
amortised on a straight-line basis over the vesting period.
For defined contribution plans, the Group pays agreed
contributions to the schemes. The Group has no further
payment obligations once the contributions have been paid.
The contributions are recognised as an employee benefit
expense when they are due.
Share based paymentsOptions granted to employees are recognised as employee
expenses based on fair value at grant date, with a
corresponding increase in equity, over the period in which the
employees become unconditionally entitled to the options. The
fair value of the options granted is measured using an option
valuation model, taking into account the terms and conditions
upon which the options were granted. The amount recognised
as an expense is adjusted to reflect the actual number of share
options that vest except where forfeiture is due only to share
prices not achieving the threshold for vesting.
pages 38 | 39
James Cropper plc Annual Report and Accounts 2012
Intangible fixed assetsIntangible assets are stated at cost less accumulated
amortisation and accumulated impairment losses, if any.
The following useful lives have been determined for intangible
assets.
Trade secrets such as processes or unique recipes
10 years
Computer software
3 - 10 years
Emission Allowances
0 years
(refer to note below on Emissions trading scheme for policy)
Property plant and equipmentProperty, plant and equipment are stated at cost less
accumulated depreciation. Depreciation is provided on all
property, plant and equipment, other than freehold land, at rates
calculated to write off the cost less residual value of each asset
evenly over its expected useful life, as follows:
Freehold land and buildings
14 - 40 years
Plant and machinery
4 - 20 years
Residual values and useful lives are reviewed annually.
InventoriesInventories are stated at the lower of cost and net realisable
value. The cost of finished goods and work in progress
comprises design costs, raw materials, direct labour, other
direct costs and related production overheads (based on normal
operating capacity). It excludes borrowing costs. Net realisable
value is the estimated selling price in the ordinary course of
business, less applicable variable selling expenses.
Emissions trading schemeThe Group’s power generation facilities became subject to the
European Union Emission Trading Scheme (“EUETS”) as from 1
January 2008. The Group’s is permitted to emit 41,000 tonnes
of carbon dioxide in a calendar year. Credits for this quantum
are issued to the Group free of charge by HM Government. The
Group has adopted an accounting policy which recognises the
emission allowances as an intangible asset and an associated
liability. The intangible asset is valued at the market price on the
date of issue. The liability is valued at the market price on the
date of issue up to the level of allocated allowances held.
Should emissions exceed the annual allowance any excess of
liability above the level of the allowances held is valued at the
market price ruling at the Statement of Financial Position date
and charged against operating profit. Un-utilised allowances are
maintained against a potential future shortall. When allowances
are utilised both the intangible asset and liability are amortised to
the Statement of Comprehensive Income. Currently the Group’s
emissions are running in line with its permitted EUETS allowance
and hence there is no impact on profit. At 31 March 2012 the
intangible asset and an associated liability were valued at
£256,000. The liability is categorised under current liabilities.
GrantsCapital grants are credited to a deferral account and released to
income over the expected useful lives of the relevant assets.
Grants of a revenue nature are credited to the Statement of
Comprehensive Income in the period to which they relate.
LeasingLeases are classified as finance leases at inception where
substantially all of the risks and rewards of ownership are
transferred to the Group. Assets classified as finance leases
are capitalised on the Statement of Financial Position and are
depreciated over the expected useful life of the asset. The
interest element of the rental obligation is charged to the
Statement of Comprehensive Income over the period of the
lease and represents a constant proportion of the balance of
capital repayments outstanding. Operating lease payments are
charged to the Statement of Comprehensive Income in the
appropriate period.
TaxationTax on the Statement of Comprehensive Income for the year
comprises current and deferred tax. Tax is recognised in the
Statement of Comprehensive Income except to the extent that it
relates to items recognised directly in equity, in which case it is
recognised in equity.
Deferred tax is provided on temporary differences between the
carrying amounts of assets and liabilities for financial reporting
purposes and the amounts used for taxation purposes. The
following temporary differences are not provided for: the initial
recognition of goodwill; the initial recognition of assets or
liabilities that affect neither accounting nor taxable profit other
than in a business combination, and differences relating to
investments in subsidiaries to the extent that they will probably
not reverse in the foreseeable future. The amount of deferred tax
provided is based on the expected manner of realisation or
settlement of the carrying amount of assets and liabilities, using
tax rates enacted or substantively enacted at the Statement of
Financial Position date.
Notes to theFinancial Statementscontinued
A deferred tax asset is recognised only to the extent that it is
probable that future taxable profits will be available against which
the asset can be utilised.
Financial instrumentsDerivatives are initially recognised at fair value on the date a
derivative contract is entered into and are subsequently re-
measured at their fair value at each Statement of Financial
Position date. The resulting gain or loss on re-measurement is
recognised in the Statement of Comprehensive Income, unless
hedge accounting is applicable. There were no material
balances at the year end.
Loans and receivables are non-derivative financial assets with
fixed or determinable payments that are not quoted in an active
market. They arise when the Group provides money, goods or
services directly to a debtor with no intention of trading the
receivable. They are included in current assets, except those
with maturities greater than twelve months after the Statement of
Financial Position date, which are classified as non-current
assets. Loans and receivables are included within trade and
other receivables in the Statement of Financial Position.
The fair value of financial instruments traded in active markets is
based on quoted market prices at the Statement of Financial
Position date.
InvestmentsTrade investments are stated at cost less any impairment in
value.
The Group’s share of the profit is included in the Statement of
Comprehensive Income on the equity accounting basis. The
carrying value of joint ventures in the Group Statement of
Financial Position is calculated by reference to the Group’s
equity in the net assets of such joint ventures as shown in the
most recent accounts.
Cash and cash equivalentsCash and cash equivalents includes cash in hand, deposits
held at call with banks, other short-term highly liquid investments
with original maturities of three months or less, and bank
overdrafts. Bank overdrafts are shown as borrowings within
current liabilities on the Statement of Financial Position. Bank
overdrafts that are repayable on demand and form an integral
part of the Group’s cash management are included as a
component of cash and cash equivalents for the purpose only
of the Statement of Cash Flows.
Borrowing costsBorrowings are recognised initially at fair value, net of transaction
costs incurred. Borrowings are subsequently stated at
amortised cost; any difference between the proceeds (net of
transaction costs) and the redemption value is recognised in the
Statement of Comprehensive Income over the period of the
borrowings using the effective interest method. Interest is not
capitalised within property, plant and equipment.
InterestInterest is recognised in the Statement of Comprehensive
Income on an accruals basis using the effective interest method.
Trade receivablesTrade receivables are recorded at their initial fair value after
appropriate revision of impairment.
Trade payablesTrade payables are stated at their fair value.
Impairment of assetsAt each reporting date, the Group assesses whether there is
any indication that an asset may be impaired. Where an
indicator of impairment exists, the Group makes an estimate of
recoverable amount. Where the carrying value of an asset
exceeds its recoverable amount the asset is written down to its
recoverable amount. Recoverable amount is the higher of fair
value less costs to sell and value in use and is deemed for an
individual asset. If the asset does not generate cash flows that
are largely independent of those from other assets or groups of
assets, the recoverable amount of the cash generating unit to
which the asset belongs is determined. Discount rates reflecting
the asset specific risks and the time value of money are used for
the value in use calculation.
Capital ManagementGroup and Company’s capital includes share capital, reserves
and retained earnings. The Group and Company’s policy is to
maintain the ability to continue as a going concern, in order to
provide returns to the shareholder and benefits to other
stakeholders. The Group, and Company, invest in financial
assets that will provide an adequate level of return to the
shareholder commensurate with the level of risk.
The Group and Company manages the capital structure and
adjusts this in light of the changes in the economic conditions
and risk associated with the underlying assets. In order to
maintain or adjust the capital structure, the Group and Company
may adjust the amount of any dividend paid to the shareholder,
return capital to the shareholder, issues new shares, or sell
assets to reduce debt. Detail borrowings can be seen in note
15 and share holdings can be referred to in note 19. The
Group, and Company, are not subject to any externally imposed
capital requirements. There have been no material changes in
the management of capital during the period.
Going ConcernThe Directors have prepared the accounts for James Cropper
plc on a going concern basis. See the Report of the Directors
section (ix) for the basis of the going concern assumption.
New standards and interpretation not appliedFrom the beginning of the financial year, the Group has applied
the revised IAS 24 ‘Related Party Disclosure’. The standard
amends the definition of a related party. This has had no
significant impact on the consolidated results or financial
position of the Group.
A number of new standards, amendments to standards and
interpretations have been issued during the year ended
31 March 2012 but are not yet effective, and therefore have not
yet been adopted by the Group.
pages 40 | 41
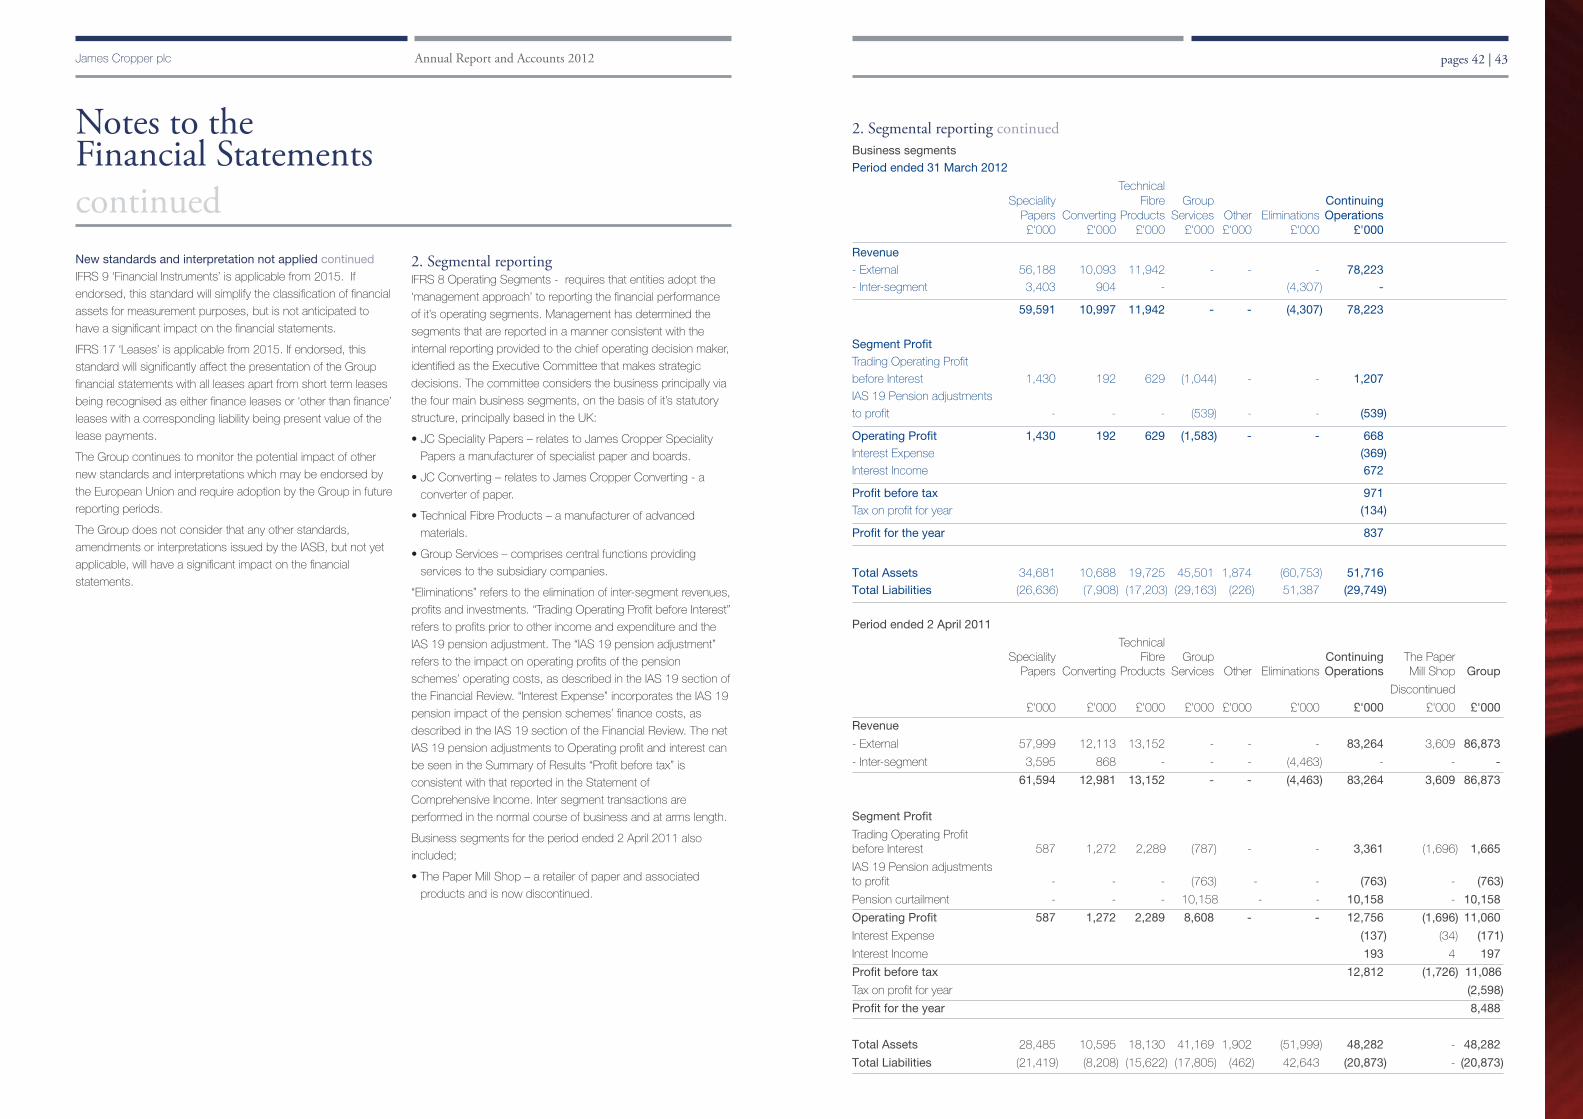
James Cropper plc Annual Report and Accounts 2012
New standards and interpretation not applied continuedIFRS 9 ‘Financial Instruments’ is applicable from 2015. If
endorsed, this standard will simplify the classification of financial
assets for measurement purposes, but is not anticipated to
have a significant impact on the financial statements.
IFRS 17 ‘Leases’ is applicable from 2015. If endorsed, this
standard will significantly affect the presentation of the Group
financial statements with all leases apart from short term leases
being recognised as either finance leases or ‘other than finance’
leases with a corresponding liability being present value of the
lease payments.
The Group continues to monitor the potential impact of other
new standards and interpretations which may be endorsed by
the European Union and require adoption by the Group in future
reporting periods.
The Group does not consider that any other standards,
amendments or interpretations issued by the IASB, but not yet
applicable, will have a significant impact on the financial
statements.
2. Segmental reportingIFRS 8 Operating Segments - requires that entities adopt the
‘management approach’ to reporting the financial performance
of it’s operating segments. Management has determined the
segments that are reported in a manner consistent with the
internal reporting provided to the chief operating decision maker,
identified as the Executive Committee that makes strategic
decisions. The committee considers the business principally via
the four main business segments, on the basis of it’s statutory
structure, principally based in the UK:
• JC Speciality Papers – relates to James Cropper Speciality
Papers a manufacturer of specialist paper and boards.
• JC Converting – relates to James Cropper Converting - a
converter of paper.
• Technical Fibre Products – a manufacturer of advanced
materials.
• Group Services – comprises central functions providing
services to the subsidiary companies.
“Eliminations” refers to the elimination of inter-segment revenues,
profits and investments. “Trading Operating Profit before Interest”
refers to profits prior to other income and expenditure and the
IAS 19 pension adjustment. The “IAS 19 pension adjustment”
refers to the impact on operating profits of the pension
schemes’ operating costs, as described in the IAS 19 section of
the Financial Review. “Interest Expense” incorporates the IAS 19
pension impact of the pension schemes’ finance costs, as
described in the IAS 19 section of the Financial Review. The net
IAS 19 pension adjustments to Operating profit and interest can
be seen in the Summary of Results “Profit before tax” is
consistent with that reported in the Statement of
Comprehensive Income. Inter segment transactions are
performed in the normal course of business and at arms length.
Business segments for the period ended 2 April 2011 also
included;
• The Paper Mill Shop – a retailer of paper and associated
products and is now discontinued.
Notes to theFinancial Statementscontinued
2. Segmental reporting continuedBusiness segmentsPeriod ended 31 March 2012
TechnicalSpeciality Fibre Group Continuing
Papers Converting Products Services Other Eliminations Operations£'000 £'000 £'000 £'000 £'000 £'000 £'000
Revenue- External 56,188 10,093 11,942 - - - 78,223- Inter-segment 3,403 904 - (4,307) -
59,591 10,997 11,942 - - (4,307) 78,223
Segment ProfitTrading Operating Profit
before Interest 1,430 192 629 (1,044) - - 1,207IAS 19 Pension adjustments
to profit - - - (539) - - (539)
Operating Profit 1,430 192 629 (1,583) - - 668Interest Expense (369)Interest Income 672
Profit before tax 971Tax on profit for year (134)
Profit for the year 837
Total Assets 34,681 10,688 19,725 45,501 1,874 (60,753) 51,716Total Liabilities (26,636) (7,908) (17,203) (29,163) (226) 51,387 (29,749)
pages 42 | 43
Period ended 2 April 2011
TechnicalSpeciality Fibre Group Continuing The Paper
Papers Converting Products Services Other Eliminations Operations Mill Shop Group
Discontinued
£'000 £'000 £'000 £'000 £'000 £'000 £'000 £'000 £'000
Revenue
- External 57,999 12,113 13,152 - - - 83,264 3,609 86,873
- Inter-segment 3,595 868 - - - (4,463) - - -
61,594 12,981 13,152 - - (4,463) 83,264 3,609 86,873
Segment Profit
Trading Operating Profitbefore Interest 587 1,272 2,289 (787) - - 3,361 (1,696) 1,665
IAS 19 Pension adjustmentsto profit - - - (763) - - (763) - (763)
Pension curtailment - - - 10,158 - - 10,158 - 10,158
Operating Profit 587 1,272 2,289 8,608 - - 12,756 (1,696) 11,060
Interest Expense (137) (34) (171)
Interest Income 193 4 197
Profit before tax 12,812 (1,726) 11,086
Tax on profit for year (2,598)
Profit for the year 8,488
Total Assets 28,485 10,595 18,130 41,169 1,902 (51,999) 48,282 - 48,282
Total Liabilities (21,419) (8,208) (15,622) (17,805) (462) 42,643 (20,873) - (20,873)
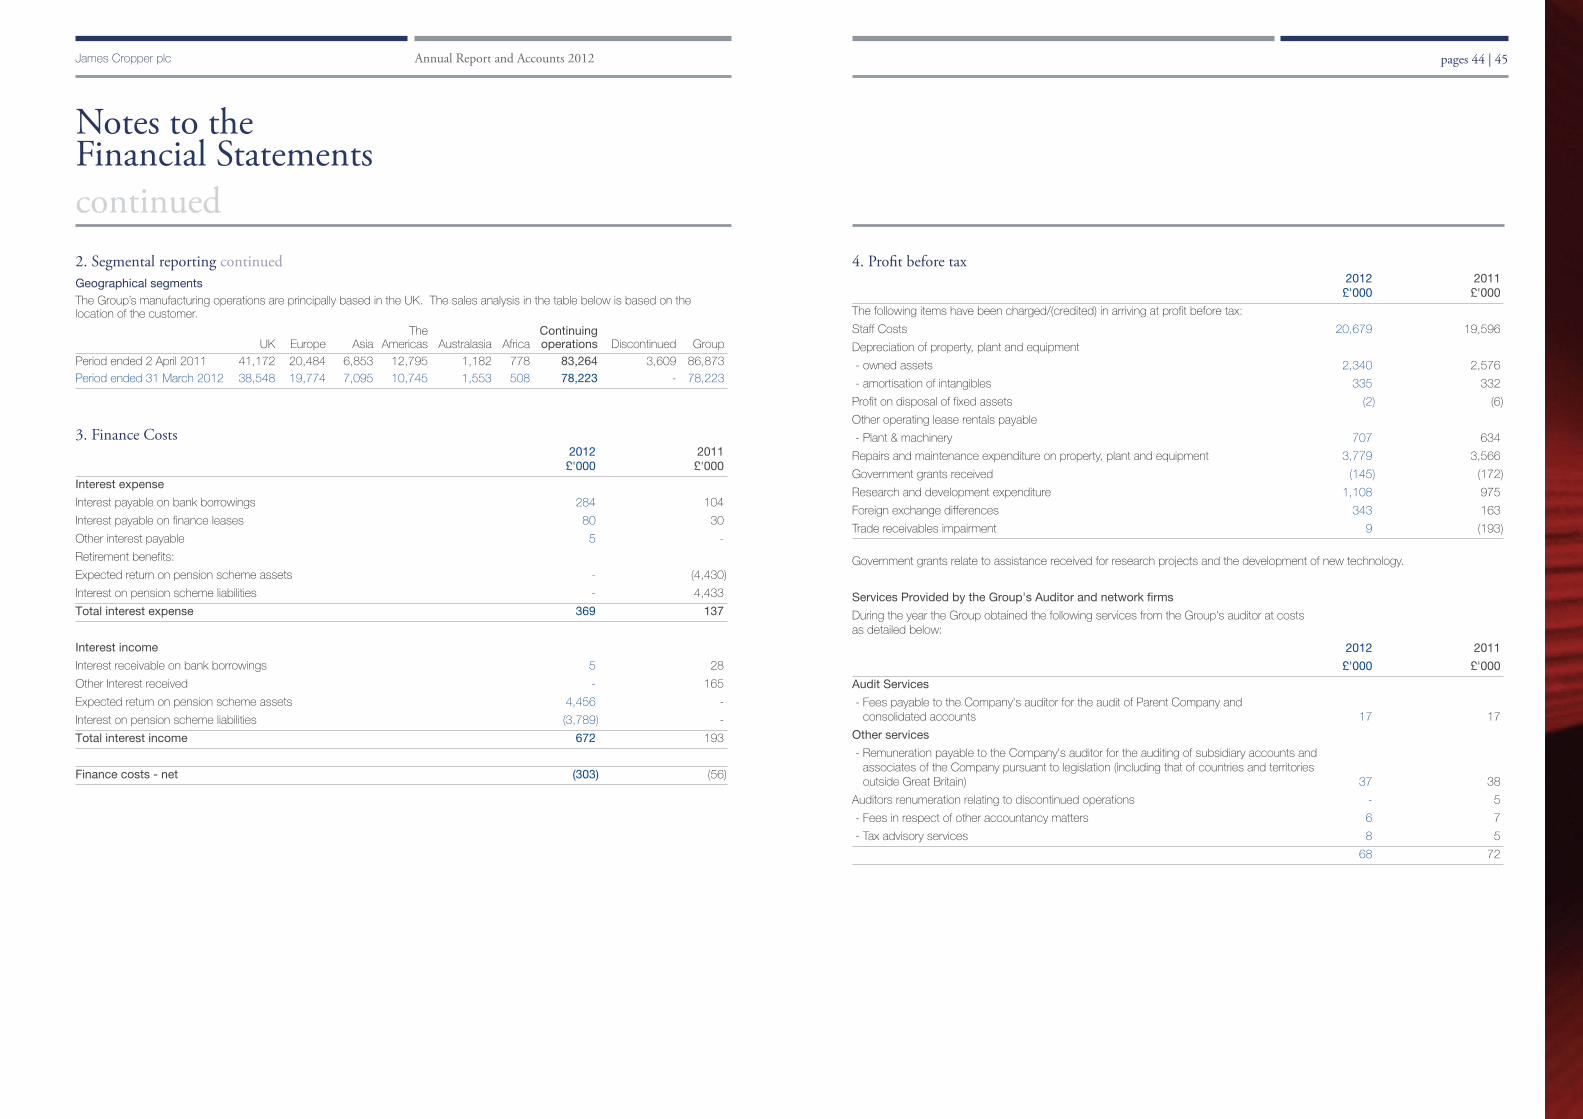
Notes to theFinancial Statementscontinued2. Segmental reporting continuedGeographical segmentsThe Group’s manufacturing operations are principally based in the UK. The sales analysis in the table below is based on thelocation of the customer.
The ContinuingUK Europe Asia Americas Australasia Africa operations Discontinued Group
Period ended 2 April 2011 41,172 20,484 6,853 12,795 1,182 778 83,264 3,609 86,873Period ended 31 March 2012 38,548 19,774 7,095 10,745 1,553 508 78,223 - 78,223
3. Finance Costs2012 2011£'000 £'000
Interest expense
Interest payable on bank borrowings 284 104
Interest payable on finance leases 80 30
Other interest payable 5 -
Retirement benefits:
Expected return on pension scheme assets - (4,430)
Interest on pension scheme liabilities - 4,433
Total interest expense 369 137
Interest income
Interest receivable on bank borrowings 5 28
Other Interest received - 165
Expected return on pension scheme assets 4,456 -
Interest on pension scheme liabilities (3,789) -
Total interest income 672 193
Finance costs - net (303) (56)
4. Profit before tax2012 2011
£'000 £'000
The following items have been charged/(credited) in arriving at profit before tax:
Staff Costs 20,679 19,596
Depreciation of property, plant and equipment
- owned assets 2,340 2,576
- amortisation of intangibles 335 332
Profit on disposal of fixed assets (2) (6)
Other operating lease rentals payable
- Plant & machinery 707 634
Repairs and maintenance expenditure on property, plant and equipment 3,779 3,566
Government grants received (145) (172)
Research and development expenditure 1,108 975
Foreign exchange differences 343 163
Trade receivables impairment 9 (193)
Government grants relate to assistance received for research projects and the development of new technology.
Services Provided by the Group's Auditor and network firms
During the year the Group obtained the following services from the Group's auditor at costsas detailed below:
2012 2011
£'000 £'000
Audit Services
- Fees payable to the Company's auditor for the audit of Parent Company andconsolidated accounts 17 17
Other services
- Remuneration payable to the Company's auditor for the auditing of subsidiary accounts andassociates of the Company pursuant to legislation (including that of countries and territoriesoutside Great Britain) 37 38
Auditors renumeration relating to discontinued operations - 5
- Fees in respect of other accountancy matters 6 7
- Tax advisory services 8 5
68 72
pages 44 | 45James Cropper plc Annual Report and Accounts 2012

5. TaxationAnalysis of charge in the period
2012 2011Continuing operations Note £'000 £'000
Current tax 481 817
Adjustments in respect of prior period current tax (45) (349)
Foreign tax 15 12
Total current tax 451 480
Deferred tax (70) 2,311
Adjustments in respect of prior period deferred tax (28) (193)
Effects of changes in tax rate (219) -
Total deferred tax 18 (317) 2,118
Taxation 134 2,598
Tax on items charged to equity
Deferred tax on actuarial gains on retirement benefit liabilities 1,483 621
The tax for the period is lower from the standard rate of corporation tax in the UK of 26% (2011: 28%).The differences are explained below:
2012 2011£’000 £'000
Profit before tax 971 11,087
Profit on ordinary activities multiplied by rate of corporation tax in the UK of 26% (2011:28%) 252 3,104
Effects of:
Adjustments to tax in respect of prior period (73) (568)
Overseas tax rates 109 1
Expenses not deductible for tax purposes 28 218
Rate change on deferred tax (219) (156)
Fixed asset timing differences 32 (1)
Other 9 -
Small companies rate relief (4) -
Total tax charge for the period 134 2,598
Notes to theFinancial Statementscontinued
6. Earning per shareBasic earnings per share is calculated by dividing the earnings attributable to ordinary shareholders by the weighted average numberof shares outstanding during the year.
For diluted earnings per share, the weighted average number of ordinary shares in issue is adjusted to assume conversion of alldilutive potential ordinary shares. The Group has one class of dilutive potential ordinary shares - those share options granted toemployees where the exercise price is less than the average market price of the Company’s ordinary shares during the year.Reconciliations of the earnings and weighted average number of shares used in the calculations are set out below.
Group 2012 2011
Earnings Weighted Per-share Earnings Weighted Per-shareaverage amount average amountnumber number
of shares of shares£’000 ’000 pence £’000 ’000 pence
Basic EPS
Earnings attributable to ordinary shareholders 837 8,473 9.9 8,488 8,472 100.2
Effect of dilutive securities - Options - 333 - - 227 -
Diluted EPS 837 8,806 9.5 8,488 8,699 97.6
Continuing Operations 2012 2011
Earnings Weighted Per-share Earnings Weighted Per-shareaverage amount average amountnumber number
of shares of shares£’000 ’000 pence £’000 ’000 pence
Basic EPS
Earnings attributable to ordinary shareholders 837 8,473 9.9 10,214 8,472 120.6
Effect of dilutive securities - Options - 333 - - 227 -
Diluted EPS 837 8,806 9.5 10,214 8,699 117.4
Discontinuing Operations 2011
Earnings Weighted Per-shareaverage amountnumber
of shares£’000 ’000 pence
Basic EPS
Losses attributable to ordinary shareholders (1,726) 8,472 (20.4)
Effect of dilutive securities - Options - 227 -
Diluted EPS (1,726) 8,699 (19.8)
7. Dividends 2012 2011£'000 £'000
Final paid for the period ended 2 April 2011 / period ended 27 March 2010 474 440
Interim paid for the period ended 31 March 2012 / period ended 2 April 2011 183 183
Final dividend payment paid pence per share for the period ended 2 April 2011 /period ended 27 March 2010 5.7 5.3
Interim dividend payment paid pence per share for the period ended 31 March 2012 /period ended 2 April 2011 2.2 2.2
In addition, the Directors are proposing a final dividend in respect of the financial period ended 31 March 2012 of 5.7p per share
(2011: 5.7p per share) which will absorb an estimated £474,000 (2011: £474,000) of shareholders’ funds. If approved by
members at the Annual General Meeting, it will be paid on 10 August 2012 to shareholders who are on the register of members at
11 July 2012. There are no tax implications in respect of this proposed dividend.
The proposed dividend is not accounted for until it is formally approved at the Annual General Meeting.
pages 46 | 47James Cropper plc Annual Report and Accounts 2012
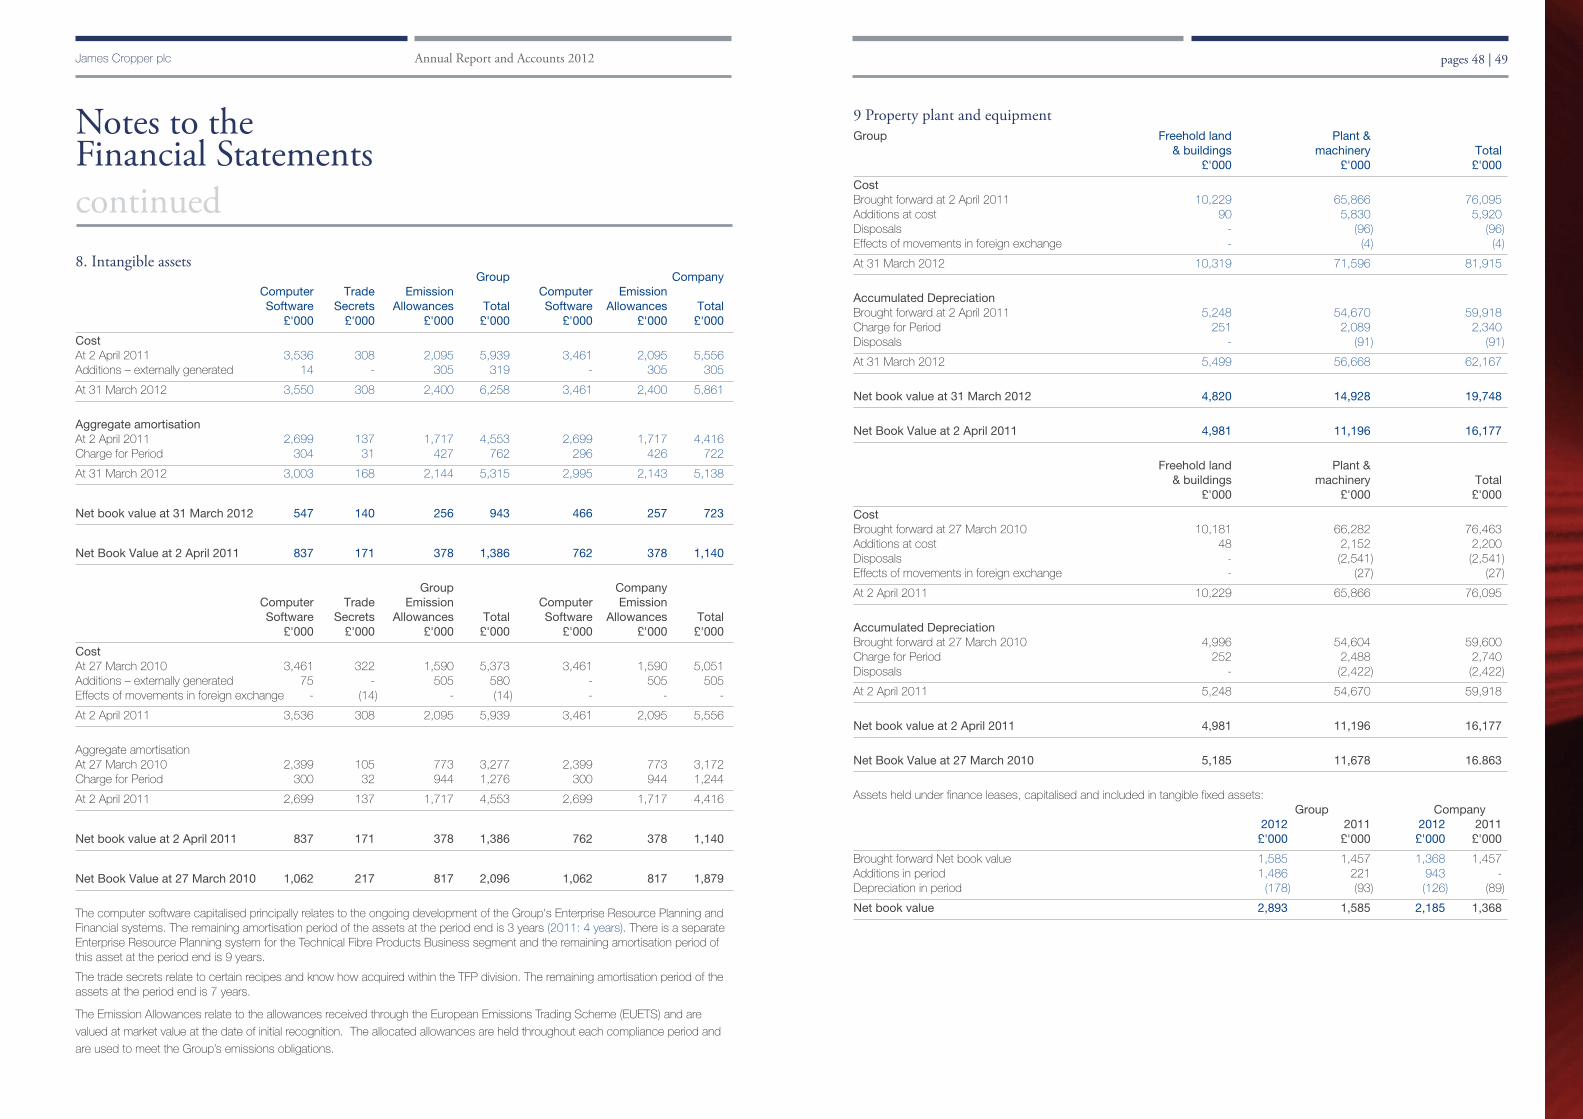
8. Intangible assetsGroup Company
Computer Trade Emission Computer EmissionSoftware Secrets Allowances Total Software Allowances Total
£'000 £'000 £'000 £'000 £'000 £'000 £'000
CostAt 2 April 2011 3,536 308 2,095 5,939 3,461 2,095 5,556Additions – externally generated 14 - 305 319 - 305 305
At 31 March 2012 3,550 308 2,400 6,258 3,461 2,400 5,861
Aggregate amortisationAt 2 April 2011 2,699 137 1,717 4,553 2,699 1,717 4,416Charge for Period 304 31 427 762 296 426 722
At 31 March 2012 3,003 168 2,144 5,315 2,995 2,143 5,138
Net book value at 31 March 2012 547 140 256 943 466 257 723
Net Book Value at 2 April 2011 837 171 378 1,386 762 378 1,140
Group CompanyComputer Trade Emission Computer EmissionSoftware Secrets Allowances Total Software Allowances Total
£'000 £'000 £'000 £'000 £'000 £'000 £'000
CostAt 27 March 2010 3,461 322 1,590 5,373 3,461 1,590 5,051Additions – externally generated 75 - 505 580 - 505 505Effects of movements in foreign exchange - (14) - (14) - - -
At 2 April 2011 3,536 308 2,095 5,939 3,461 2,095 5,556
Aggregate amortisationAt 27 March 2010 2,399 105 773 3,277 2,399 773 3,172Charge for Period 300 32 944 1,276 300 944 1,244
At 2 April 2011 2,699 137 1,717 4,553 2,699 1,717 4,416
Net book value at 2 April 2011 837 171 378 1,386 762 378 1,140
Net Book Value at 27 March 2010 1,062 217 817 2,096 1,062 817 1,879
The computer software capitalised principally relates to the ongoing development of the Group's Enterprise Resource Planning andFinancial systems. The remaining amortisation period of the assets at the period end is 3 years (2011: 4 years). There is a separateEnterprise Resource Planning system for the Technical Fibre Products Business segment and the remaining amortisation period ofthis asset at the period end is 9 years.
The trade secrets relate to certain recipes and know how acquired within the TFP division. The remaining amortisation period of theassets at the period end is 7 years.
The Emission Allowances relate to the allowances received through the European Emissions Trading Scheme (EUETS) and are
valued at market value at the date of initial recognition. The allocated allowances are held throughout each compliance period and
are used to meet the Group’s emissions obligations.
Notes to theFinancial Statementscontinued
9 Property plant and equipmentGroup Freehold land Plant &
& buildings machinery Total£'000 £'000 £'000
CostBrought forward at 2 April 2011 10,229 65,866 76,095Additions at cost 90 5,830 5,920Disposals - (96) (96)Effects of movements in foreign exchange - (4) (4)
At 31 March 2012 10,319 71,596 81,915
Accumulated DepreciationBrought forward at 2 April 2011 5,248 54,670 59,918Charge for Period 251 2,089 2,340Disposals - (91) (91)
At 31 March 2012 5,499 56,668 62,167
Net book value at 31 March 2012 4,820 14,928 19,748
Net Book Value at 2 April 2011 4,981 11,196 16,177
Freehold land Plant && buildings machinery Total
£'000 £'000 £'000
CostBrought forward at 27 March 2010 10,181 66,282 76,463Additions at cost 48 2,152 2,200Disposals - (2,541) (2,541)Effects of movements in foreign exchange - (27) (27)
At 2 April 2011 10,229 65,866 76,095
Accumulated DepreciationBrought forward at 27 March 2010 4,996 54,604 59,600Charge for Period 252 2,488 2,740Disposals - (2,422) (2,422)
At 2 April 2011 5,248 54,670 59,918
Net book value at 2 April 2011 4,981 11,196 16,177
Net Book Value at 27 March 2010 5,185 11,678 16.863
Assets held under finance leases, capitalised and included in tangible fixed assets:Group Company
2012 2011 2012 2011£'000 £'000 £'000 £'000
Brought forward Net book value 1,585 1,457 1,368 1,457Additions in period 1,486 221 943 -Depreciation in period (178) (93) (126) (89)
Net book value 2,893 1,585 2,185 1,368
pages 48 | 49James Cropper plc Annual Report and Accounts 2012

9. Property plant and equipment
Company Freehold land Plant && buildings machinery Total
£'000 £'000 £'000
CostBrought forward at 2 April 2011 863 3,829 4,692Transfers - 931 931Additions at cost - 34 34
At 31 March 2012 863 4,794 5,657
Accumulated DepreciationBrought forward at 2 April 2011 307 2,248 2,555Charge for Period 14 211 225Transfers - 2 2
At 31 March 2012 321 2,461 2,782
Net book value at 31 March 2012 542 2,333 2,875
Net book value at 2 April 2011 556 1,581 2,137
Freehold land Plant && buildings machinery Total
£'000 £'000 £'000
CostBrought forward at 27 March 2010 863 3,731 4,594Transfers - 69 69Additions at cost - 81 81Disposals - (52) (52)
At 2 April 2011 863 3,829 4,692
Accumulated DepreciationBrought forward at 27 March 2010 293 2,043 2,336Charge for Period 14 188 202Transfers - 69 69Disposals - (52) (52)
At 2 April 2011 307 2,248 2,555
Net book value at 2 April 2011 556 1,581 2,137
Net book value at 27 March 2010 570 1,688 2,258
Notes to theFinancial Statementscontinued
pages 50 | 51James Cropper plc Annual Report and Accounts 2012
10. Investments
(i) Investments in subsidiary undertakings
Group Company2012 2011 2012 2011£'000 £'000 £'000 £'000
At 31 March 2012 and 2 April 2011 - - 7,350 7,350
Investments in subsidiary undertakings are stated at cost. A list of principal subsidiary undertakings is given below:
Country of % holdingincorporation (of ordinary shares) Nature of business
James Cropper Speciality Papers Limited England 100 Manufacture of specialist paper and boards
James Cropper Converting Limited England 100 Paper converter
Technical Fibre Products Limited England 100 Manufacture of advanced materials
Tech Fibers Inc. USA 100 Holding Company
Technical Fibre Products Inc. USA 100 Sales and marketing organisation
Metal Coated Fibers Inc. USA 100 Manufacturer of metal coated carbon fibres
Electro Fiber Technologies LLC USA 100 Manufacturer of metal coated fibres
James Cropper EBT Limited England 100 Trustee of an employee benefit trust
Melmore Limited England 100 Dormant company
Papermilldirect.com Limited England 100 Dormant company
The Paper Mill Shop Company Limited England 100 Dormant company
11. InventoriesGroup
2012 2011£'000 £'000
Materials 6,908 5,954
Work in progress 1,334 2,525
Finished goods 4,119 3,477
12,361 11,956
Inventories are stated after a provision for impairment of £100,000 (2011: £122,000).
The cost of inventories recognised as expenses and included in cost of sales for continuing operations for the year ended31 March 2012 was £62,458,000. (2011: £67,995,000).
The Company does not have inventories.
12. Trade and other receivablesGroup Company
2012 2011 2012 2011£'000 £'000 £'000 £'000
Trade debtors 12,381 13,581 - -
Less: Provision for impairment of receivables (100) (148) - -
Trade debtors - net 12,281 13,433 - -
Amounts owed by Group undertakings - - 30,349 26,753
Other debtors 229 191 208 190
Prepayments 688 857 388 597
13,198 14,481 30,945 27,540
Management believe there is no further credit risk provision required in excess of normal provision for doubtful receivables. Theadoption of IFRS 7 “Financial Instruments: Disclosure” has resulted in additional disclosures on credit risk which can be viewed innote 16.

Notes to theFinancial Statementscontinued13. Trade and other Payables
Group Company2012 2011 2012 2011£'000 £'000 £'000 £'000
Trade payables 2,611 2,475 2,000 1,959
Amounts owed to Group undertakings - - 10,380 8,130
Other tax and social security payable 404 481 73 143
Other payables 706 1,306 591 1,116
Accruals 5,607 5,884 1,401 637
Total contractual cash flows 9,328 10,146 14,445 11,985
Included within "Accruals" for Group and Company is a provision for redundancy of £800,000.
14. Other Financial Liabilities2012 2011
£'000 £'000
Interest rate swap 30 -
The Group uses an interest rate swap to hedge the risk associated with interest rate increases
against a proportion of its existing borrowings.
The loss arising in the SCI on fair value hedging instruments was £30,000 (2011: £nil)
15. BorrowingsGroup Company
2012 2011 2012 2011Note £'000 £'000 £'000 £'000
CurrentBank loans and overdrafts due within one year or on demand:
Unsecured bank loans 1,357 1,061 1,215 1,061
Secured finance lease 712 365 558 338
2,069 1,426 1,773 1,399
Non-current loansUnsecured bank loans 8,598 4,013 5,931 2,464
Secured finance lease 1,276 554 669 445
16.3 9,874 4,567 6,600 2,909
Bank loans bear interest at rates between 1% and 4.5% above UK bank base rates.
The future minimum lease payments under finance leases held, together with the value of principal are as follows:
Minimum Minimumlease lease
Group payments Interest Principal payments Interest Principal2012 2012 2012 2011 2011 2011
£’000 £’000 £’000 £’000 £’000 £’000
Within one year 812 100 712 389 24 365
Greater than one year and less than five years 1,367 152 1,215 575 21 554
Greater than 5 years 63 2 61 - - -
Minimum Minimumlease lease
Company payments Interest Principal payments Interest Principal2012 2012 2012 2011 2011 2011
£’000 £’000 £’000 £’000 £’000 £’000
Within one year 611 53 558 389 24 365
Greater than one year and less than five years 751 82 669 575 21 554
16. Financial Instruments and Risk
The Group has exposure to the following risks from its use of financial instruments:
• Credit risk
• Liquidity risk
• Currency risk
• Interest rate risk
This note presents information about the fair value of the Group’s financial instruments, the Group’s exposure to each of the risksnoted and the Group’s objectives, policies and processes for measuring and managing risk. The Board has overall responsibility ofthe risk management strategy and coordinates activity across the Group. This responsibility is discussed further in the Directors’Report.
Exposure to the financial risks noted, arise in the normal course of the Group’s business.
pages 52 | 53James Cropper plc Annual Report and Accounts 2012

16.1 Categories of non-derivative financial assets and liabilities and fair values
The fair values of the financial assets and liabilities of the Group together with their book values are as follows:
Group GroupBook value Fair value Book value Fair value
2012 2012 2011 2011Note £'000 £'000 £'000 £'000
Financial assetsCurrentTrade and other receivables 12 13,198 13,198 14,481 14,481
Cash and cash equivalents 5,438 5,438 4,282 4,282
18,636 18,636 18,763 18,763
Financial liabilitiesCurrentTrade and other payables 13 9,328 9,328 10,146 10,146
Short term borrowings 15 2,069 2,069 1,426 1,426
11,397 11,397 11,572 11,572
Non-currentLong term borrowings 15 9,874 9,874 4,567 4,567
Company CompanyBook value Fair value Book value Fair value
2012 2012 2011 2011Note £'000 £'000 £'000 £'000
Financial assetsCurrentTrade and other receivables 12 30,945 30,945 27,540 27,540
Cash and cash equivalents 3,608 3,608 3,001 3,001
34,553 34,553 30,541 30,541
Non-currentInvestments in subsidiary undertakings 10 7,350 7,350 7,350 7,350
Financial liabilitiesCurrentTrade and other payables 13 14,445 14,445 11,985 11,985
Short term borrowings 15 1,773 1,773 1,399 1,399
16,218 16,218 13,384 13,384
Non-currentLong term borrowings 15 6,600 6,600 2,909 2,909
The fair values are stated at the reporting date and may be different from the amounts which will be actually paid or received on
settlement of the instruments. The fair values are based on book values as the Directors do not consider that there is a material
difference between the book values and the fair values.
Notes to theFinancial Statementscontinued
16.2 Credit risk
Credit risk is the risk of financial loss to the Group if a customer or counterparty fails to meet its contractual obligations. Credit risk
arising from the Group’s normal commercial activities are controlled by individual business units operating in accordance with Group
policies and procedures. Exposure to credit risk arises from the potential of a customer defaulting on their invoiced sales. Some of
the Group’s businesses have credit insurance in place. For un-insured customers, the financial strength and credit worthiness of the
customer is assessed from a variety of internal and external information, and specific credit risk controls that match the risk profile of
those customers are applied.
Trade receivables recorded by business held at the 31 March 2012 were:
2012 2011£'000 £'000
JC Speciality Papers 8,650 9,673
JC Converting 1,933 1,922
Technical Fibre Products 1,698 1,838
12,281 13,433
The Company does not have trade receivables.
The ageing of trade receivables at the reporting date was:
2012 2011£'000 £'000
Not past due 10,134 11,564
Past due 0 - 30 days 2,196 1,890
Past due 31 - 60 days 50 102
Over 61 days 1 25
12,381 13,581
Less impairment (100) (148)
12,281 13,433
At the end of each reporting period a review of the provision for bad and doubtful debts is performed. It is an assessment of thepotential amount of trade debtors which will not be paid by customers after the balance sheet date. This amount is calculated byreference to the age, status and risk of each receivable.
Provision for doubtful debts.
Group 2012 2011£'000 £'000
Balance at start of period 147 340
Released during the period (13) (88)
Utilised during the period (34) (105)
Balance at end of period 100 147
Included in the outstanding trade receivables balance are debtors with an overdue amount of £2,147,000 (2011: £1,869,000) thatthe Group has not provided for. The Directors believe that these amounts are still considered recoverable from customers for whomthere is no recent history of default.
pages 54 | 55James Cropper plc Annual Report and Accounts 2012

Notes to theFinancial Statementscontinued
pages 56 | 57James Cropper plc Annual Report and Accounts 2012
16.3 Liquidity risk
Liquidity risk is the risk that the Group will not have sufficient funds to meet liabilities. The Group’s policy is to maintain a mix of short,medium and long term borrowings with a number of banks. Short term flexibility is achieved through overdraft facilities. In addition, itis the Group’s policy to maintain undrawn committed borrowing facilities in order to provide flexibility in the management of liquidity.
Current and non-current financial liabilities
The maturity profile of the carrying amount of the current and non-current financial liabilities, at 31 March 2012, was as follows:
Finance lease Finance leaseDebt obligations Total Debt obligations Total2012 2012 2012 2011 2011 2011
Group £'000 £'000 £’000 £’000 £'000 £'000
In less than one year 1,357 712 2,069 1,061 365 1,426
In more than one year but not more than two years 2,703 498 3,201 814 484 1,298
In more than two years but not more than five years 3,214 684 3,898 3,199 70 3,269
In more than five years 2,681 94 2,775 - - -
9,955 1,988 11,943 5,074 919 5,993
Finance lease Finance leaseDebt obligations Total Debt obligations Total2012 2012 2012 2011 2011 2011
Company £'000 £'000 £’000 £’000 £'000 £'000
In less than one year 1,214 558 1,772 1,061 338 1,399
In more than one year but not more than two years 1,000 333 1,333 814 375 1,189
In more than two years but not more than five years 2,250 243 2,493 1,650 70 1,720
In more than five years 2,681 94 2,775 - - -
7,145 1,228 8,373 3,525 783 4,308
Trade payablesGroup Company
2012 2011 2012 2011£'000 £'000 £'000 £'000
Trade payables at the reporting date was 2,611 2,475 2,000 1,959
Total contractual cash flows 2,611 2,475 2,000 1,959
Borrowing facilitiesThe Group has the following undrawn committed borrowing facilities available at 31 March 2012:
at 31 March 2012 at 2 April 2011Floating rate Floating rate
£'000 £'000
Expiring within one year (renewable annually) 4,959 5,001
The Group’s expiry profile of the drawn down facilities is as follows:
Bank Borrowings Group Companyat 31 March at 2 April at 31 March at 2 April
2012 2011 2012 2011£'000 £'000 £'000 £'000
Expiry by: April 2012 - 175 - 175October 2012 215 500 214 500
May 2013 1,561 1,549 - -December 2014 1,248 - - -September 2015 2,250 2,850 2,250 2,850
April 2017 2,000 - 2,000 -March 2020 2,681 - 2,681 -
9,955 5,074 7,145 3,525
16.4 Currency riskThe Group publishes it’s consolidated financial statements in sterling but also conducts business in foreign currencies. As a result itis subject to foreign currency exchange risk arising from exchange rate movements which will be reflected in the Group’s transactioncosts or in the underlying foreign currency assets of it’s foreign operations. The Group has operations in the US. The Group isexposed to foreign exchange risks primarily with respect to US Dollars and the Euro. Where possible, the Group maintains a policyof balancing sales and purchases denominated in foreign currencies. Where an imbalance remains, the Group has also entered intocertain forward exchange contracts. No material contracts were outstanding at the year end. The management of foreign currency isdescribed in further detail in the Financial Review.
Represented below is the net exposure to foreign currencies, reported in pounds sterling, and arising from all Group activities, as at31 March 2012.
USD Euro GBP Total£'000 £'000 £'000 £'000
Trade Receivables 1,841 2,102 8,338 12,281Cash and cash equivalents 1,800 1,052 2,586 5,438Trade Payables (281) (286) (2,044) (2,611)Unsecured current loans (142) - (1,215) (1,357)Finance lease current - - (712) (712)Unsecured non-current loans (2,667) - (5,931) (8,598)Finance lease non-current - - (1,276) (1,276)
Net exposure 551 2,868 (254) 3,165
At the 2 April 2011 the Group's exposure to foreign currency risk was as follows:USD Euro GBP Total
£'000 £'000 £'000 £'000
Trade Receivables 2,009 3,344 8,080 13,433Cash and cash equivalents 1,012 17 3,253 4,282Trade Payables (348) (378) (1,749) (2,475)Unsecured current loans - - (1,061) (1,061)Finance lease current - - (365) (365)Unsecured non-current loans (1,549) - (2,464) (4,013)Finance lease non-current - - (554) (554)
Net exposure 1,124 2,983 5,140 9,247
This represents the net exposure to foreign currencies, reported in pounds Sterling, and arising from all Group activities.

Notes to theFinancial Statementscontinued
James Cropper plc Annual Report and Accounts 2012 pages 38 | 39
16.4 Currency risk continuedAt the 31 March 2012 the Company's exposure to foreign currency risk was as follows:
USD Euro GBP Total£'000 £'000 £'000 £'000
Cash and cash equivalents 1 1,050 2,557 3,608
Trade Payables (233) (98) (1,669) (2,000)
Unsecured current loans - - (1,215) (1,215)
Finance lease current - - (558) (558)
Unsecured non-current loans - - (5,931) (5,931)
Finance lease non-current - - (669) (669)
Net exposure (232) 952 (7,485) (6,765)
At the 2 April 2011 the Company's exposure to foreign currency risk was as follows:
USD Euro GBP Total£'000 £'000 £'000 £'000
Cash and cash equivalents 2 5 2,994 3,001
Trade Payables (335) (221) (1,403) (1,959)
Unsecured current loans - - (1,061) (1,061)
Finance lease current - - (338) (338)
Unsecured non-current loans - - (2,464) (2,464)
Finance lease non-current - - (445) (445)
Net exposure (333) (216) (2,717) (3,266)
A 1% strengthening of the Pound against the Euro and the US Dollar at 31 March 2012 would have had the following impact onequity and profit by the amounts shown below:
Equity SCIGroup £'000 £'000
31 March 2012 USD (5) (15)
31 March 2012 Euro (28) (18)
02 April 2011 USD (11) (16)
02 April 2011 Euro (30) (29)
Equity SCICompany £'000 £'000
31 March 2012 USD 2 2
31 March 2012 Euro (9) 1
02 April 2011 USD 3 3
02 April 2011 Euro 2 2
This sensitivity analysis is indicative only and it should be noted that the Group’s exposure to such market rate changes is continuallychanging. The calculations assume all other variables, in particular interest rates, remain constant.
16.5 Interest rate risk
Interest rate risk derives from the Group’s exposure to changes in value of an asset or liability or future cash flow through changes ininterest rates. The Group finances its operations through a mixture of retained profits and bank borrowings. The Group borrows inthe desired currencies at fixed or floating rates of interest. As part of the Group’s interest rate management strategy the Companyentered into an interest rate swap which will mature in January 2015. Under the swap the maximum base rate the Group will pay onbank borrowings of up to £3m is 0.96%. The exposure is measured on variable rate debt and instruments. The net exposure tointerest rates at the Statement of Financial Position date can be summarised as follows:
Group Company2012 2011 2012 2011
£'000 £'000 £'000 £'000
Interest bearing liabilities - floating
Borrowings 9,955 5,074 7,145 3,525
Finance lease 439 782 439 783
10,394 5,856 7,584 4,308
Interest bearing liabilities - fixed
Finance lease 1,549 137 789 -
Interest bearing liabilities 11,943 5,993 8,373 4,308
The effective interest rates at the balance sheet date were as follows:
2012 2011% %
Bank overdraft 1.5 1.5
Borrowings 3.9 3.7
The sensitivity analysis below assumes a 100 basis point change in interest rates from their levels at the reporting date, with all othervariables held constant. A 1% rise in interest rates would result in an additional £47,000 for the Group and £27,000 for the Companyin interest expense being incurred per year. The impact of a decrease in rates would be an identical reduction in the annual charge.
Group CompanySCI SCI
£’000 £’000
31 March 2012 47 27
2 April 2011 42 34
17. Retirement benefitsThe Group operates a number of pension schemes. Two of these schemes, the James Cropper plc Works Pension Plan (“Works
Scheme”) and the James Cropper plc Pension Scheme (“Staff Scheme”) are funded schemes of the defined benefit type. The
Group also operates a defined contribution scheme and makes contributions to personal pension plans for its employees in the
USA. Pension costs for the defined contribution scheme and personal pension contributions are as follows:
Group2012 2011
£’000 £’000
Defined contribution schemes 279 267
Personal pension contributions 18 28
Other pension costs totalled £251,000 (2011: £312,000) and represent life assurance charges and government pension protection
fund levies.
pages 58 | 59

Notes to theFinancial Statementscontinued17. Retirement benefits continuedDefined benefit plansAs from 1 April 2011 active members’ benefits have been reduced such that future increases in pensionable salaries are restricted toRPI up to a maximum of 2% per annum. Thus the Staff and Works Schemes will remain defined benefit schemes but they will nolonger be “final salary” schemes. The most recent actuarial valuations of the Staff Scheme and the Works Scheme have beenupdated to 31 March 2012 by qualified independent actuaries. The major assumptions used by the actuary for each scheme wereas noted below. The expected return on plan assets is calculated by using a weighted average across each category of asset:
Staff Scheme Works Scheme2012 2011 2012 2011
% % % %
Inflation assumption 3.2 3.6 3.2 3.6
Rate of increase in pensionable salaries 2.0 2.0 2.0 2.0
Discount rate 5.0 5.5 5.0 5.5
Allowance for pension in payment increases of RPIor 5% p.a. if less (subject to minimum of 3% p.a) 3.4 3.7 3.4 3.7
Allowance for revaluation of deferred pensions of CPIor 5% p.a if less on the Staff scheme or RPI or2.5% p.a. if less on the Works scheme 2.65 3.1 2.5 2.5
Expected return on plan assets 5.6 6.5 5.9 6.6
In respect of mortality for the Works members the PA92 series table has been used with the medium cohort projections applied, anda plus three year age rating. For the Staff members the PNA00 tables with a 120% rating has been used with the long cohortprojections and a 1% underpin. The different tables and methods applied to each Scheme reflect the different characteristics of themembers within these Schemes. The long-term expected rate of return on cash is determined by reference to bank base rates atthe balance sheet dates. The long-term expected return on bonds is determined by reference to UK long dated government andcorporate bond yields at the balance sheet date. The long-term expected rate of return on equities is based on the rate of return onbonds with an allowance for out-performance. Following the Government's change in the statutory inflation measure for pensionincreases and legal advice provided to the Trustees of the Schemes, allowance has been made for the rate of increase in somescheme benefits to be linked to the CPI measure of inflation in the future. This has been allowed for as a change in assumptionswithin Other Comprehensive Income.
The amounts recognised in the Statement of Financial Position are determined as follows:
2012 2011 2010 2009 2008£’000 £’000 £’000 £’000 £’000
Present value of scheme liabilities (78,005) (69,593) (78,130) (57,333) (60,335)Fair value of plan assets 70,307 68,189 63,950 48,257 58,531
Net liability recognised in the SFP (7,698) (1,404) (14,180) (9,076) (1,804)
The fair value of the plan assets comprises the following categories of asset in the stated proportions:
Staff Scheme Works Scheme2012 2011 2012 2011
% % % %
Equities 49 53 54 59Bonds 16 15 40 36Property - - 1 -Cash 3 1 5 5Annuities 6 6 - -Corporate Bonds 26 25 - -
The pension plan assets do not include any investments in the shares of the Company. (2011: Plan assets included investments inthe shares of the Company with a fair value of £626,000).
The amounts recognised in the Statement of Comprehensive Income are as follows: 2012 2011£'000 £'000
Total included within employee benefit costs – current service cost 1,300 1,370
Expected return on plan assets (4,456) (4,430)
Interest on pension scheme liabilities 3,789 4,433
Total included within interest (667) 3
Total 633 1,373
Analysis of the movement in the Statement of Financial Position liability
2012 2011£'000 £'000
At brought forward (1,404) (14,180)
Total expense as above (633) (1,373)
Contributions paid 1,757 1,603
Gains on curtailment - 10,158
Actuarial (losses)/gains recognised in SCI (7,418) 2,388
At 31 March 2012 (7,698) (1,404)
The actual return on plan assets was £2,697,000 (2011: £4,542,000). The Company expects to pay £792,000 (2011: £710,000)in contributions to the Staff Scheme and £971,000 (2011: £857,000) in contributions to the Works Scheme in the next financialperiod.
The cumulative amount of gains/losses recognised in the Statement of Comprehensive Income since the adoption of IAS 19 arelosses of £7,825,000 (2011: losses of £407,000).
Analysis of the movement in the defined benefit obligation (DBO) and scheme assets
Works Scheme Staff Scheme Works Scheme Staff Scheme
Assets DBO Assets DBO Assets DBO Assets DBO2012 2012 2012 2012 2011 2011 2011 2011
£'000 £'000 £'000 £'000 £'000 £'000 £'000 £'000
Brought forward 35,445 (36,288) 32,744 (33,305) 33,172 (42,051) 30,778 (36,079)
Expected return on assets 2,326 - 2,130 - 2,322 - 2,108 -
Current service costs - (851) - (449) - (889) - (481)
Benefits paid (1,695) 1,695 (1,203) 1,203 (1,433) 1,433 (1,073) 1,073
Contributions by plan participants 344 (344) 218 (218) 386 (386) 214 (214)
Employer contributions 940 - 817 - 894 - 709 -
Interest cost - (1,977) - (1,812) - (2,389) - (2,044)
Gains on curtailment - - - - - 6,002 - 4,156
Actuarial (losses)/gains (1,438) (3,272) (321) (2,387) 104 1,992 8 284
At 31 March 2012 35,922 (41,037) 34,385 (36,968) 35,445 (36,288) 32,744 (33,305)
Experience adjustments
2012 2011 2010 2009 2008£’000 £’000 £’000 £’000 £’000
Arising on plan assets (1,759) 112 12,544 (14,718) (5,780)
Percentage of scheme assets (2.5%) 0.2% 19.6% (30.5%) (9.9%)
Arising on plan liabilities - 2,717 (15) 152 3,291
Percentage of scheme liabilities - 3.9% - 0.3% 5.5%
pages 60 | 61James Cropper plc Annual Report and Accounts 2012

18. Deferred taxation
The movement on the deferred tax account is shown below:
Group Company2012 2011 2012 2011£'000 £'000 £'000 £'000
At 2 April 2011 (2,550) 189 (108) 3,462
Deferred tax on actuarial gains on retirement liabilities 1,483 (621) 1,483 (621)
SCI credit / (charge) 317 (2,118) 62 (2,949)
At 31 March 2012 (750) (2,550) 1,437 (108)
Deferred tax assets have been recognised in respect of all temporary differences giving rise to deferred tax assets because it isprobable that these assets will be recovered. No deferred tax is recognised on the un-remitted earnings of overseas subsidiaries.
Based on the combined distributable reserves in the US Companies of £646,000 (2011: £254,000), tax at 26% of £168,000 couldbe receivable, before any application for double tax relief, which could be expected to reduce the UK liability to nil.
Deferred tax liabilities Acceleratedcapital
allowances Other Total£'000 £'000 £'000
At 2 April 2011 (2,999) 84 (2,915)SCI credit 98 219 317
At 31 March 2012 (2,901) 303 (2,598)
Deferred tax assetsPension Total
£'000 £'000
At 2 April 2011 365 365Deferred tax on actuarial gains on retirement liabilities 1,483 1,483
At 31 March 2012 1,848 1,848
Total£'000
Net deferred tax liability (750)
On 21 March 2012 the Chancellor announced that the main rate of UK corporation tax will reduce from 26% to 24% with effect from1 April 2012. This change became substantively enacted on 26 March 2012 and therefore the effect of the rate reduction on thedeferred tax balances has been included in the figures above.
The Chancellor has also proposed changes to further reduce the main rate of UK corporation tax by 1% per annum to 22% by1 April 2014. These reductions have not been substantively enacted and the changes are not reflected in the above figures.
Notes to theFinancial Statementscontinued
19. Called up equity share capital
Group and Company2012 2011
Authorised £’000 £’000
10,000,000 (2011: 10,000,000) ordinary shares of 25p each 2,500 2,500
Issued and fully paid
Number ofOrdinary shares £’000
At 2 April 2011 8,472,368 2,118Issued during the period 3,299 1
At 31 March 2012 8,475,667 2,119
Potential issue of ordinary sharesUnder the James Cropper plc Executive Share Option Scheme, no options were outstanding at 31 March 2012 in respect of thefollowing:
Year of grant Exercise price Exercise period 2012 2011(p) Number Number
2001 206.5 June 2004 to June 2011 - 90,000
Under the Group’s long-term incentive plan for Executive Directors and Senior Executives, such individuals hold rights over ordinaryshares that may result in the issue of up to 314,000 25p ordinary shares by 2015 (2011: 361,000 25p ordinary shares by 2014).There were 120,000 share options exercised in the period (2011: 72,000 were exercised). Further information on Directors shareoptions can be seen in the Directors Remuneration Report.
The Save As You Earn (SAYE) schemes were introduced in August 2007, August 2009 and September 2010 respectively and eachrun for either a three or five year period. Options were valued using a Black-Scholes option pricing model. The fair value per optionand assumptions used in the calculation are as follows:
Aug 07 Aug 09 Aug 09 Sep 10 Sep 105 year 3 year 5 year 3 year 5 year
scheme scheme scheme scheme scheme
Fair value per option 69p 23p 23p 42p 46p
Date of grant 21 Aug 18 Aug 18 Aug 30 Sep 30 Sep2007 2009 2009 2010 2010
Exercise Price 191p 85p 85p 130p 130p
Market Price at date of grant 235p 112p 112p 163p 163p
Volatility 22% 27% 27% 35% 35%
Net dividend yield 3% 6% 6% 4% 4%
Term of option 5.25 years 3.25 years 5.25 years 3.25 years 5.25 years
Risk free rate of interest 5.2% 1.9% 2.8% 0.9% 1.6%
During the period 3,299 options were exercised (2011: no options were exercised).
20. Employees and Directors
Staff costs during the period
Continuing operations Group Company2012 2011 2012 2011
Note £'000 £'000 £'000 £'000
Wages and salaries 17,347 16,305 2,630 2,382Social Security costs 1,484 1,339 220 195Pension costs 17 1,848 1,952 772 1,015
20,679 19,596 3,622 3,592
pages 62 | 63James Cropper plc Annual Report and Accounts 2012

Notes to theFinancial Statementscontinued
pages 64 | 65James Cropper plc Annual Report and Accounts 2012
20. Employees and Directors continued
The average monthly number of people (including Executive Directors) employed in the Group during the year, analysed by divisionwas as follows:
2012 2011Number Number
Continuing operationsJC Speciality Papers 312 302JC Converting 58 56Technical Fibre Products 95 91JC plc Company 62 61
527 510Discontinued operationThe Paper Mill Shop - 87
Key management compensation2012 2011
£'000 £'000
Salaries and short term benefits 1,012 1,093Post-employment benefits 113 102Shared based payments 89 70
1,214 1,265
21. Commitments under operating leases
Group 2012 2012 2011 2011Property Plant & Property Plant &
machinery machinery£'000 £'000 £'000 £'000
Commitments under non-cancellable operating leases expiring:
Within one year 56 - 20 -
Later than one year and less than five years 214 767 398 1,314
After five years 1,546 - - -
1,816 767 418 1,314
Company 2012 2012 2011 2011Property Plant & Property Plant &
machinery machinery£'000 £'000 £'000 £'000
Commitments under non-cancellable operating leases expiring:
Within one year 20 - 10 -
Later than one year and less than five years 214 407 353 520
234 407 363 520
22. Capital commitmentsGroup Company
2012 2011 2012 2011
£’000 £’000 £’000 £’000
Contracts placed for future capital expenditure not provided in the financial statements 1,298 655 - -
23. Contingent liabilities
There were no contingent liabilities at the period end for the Group. The Company is included in a cross guarantee between itself andits subsidiaries.
24. Related party transactions
GroupThe Group has taken advantage of the exemption not to disclose intra-group transactions that are eliminated on consolidation.
CompanyThe Company pays £35,000 (2011: £35,000) annually to Mr J A Cropper for the use of reservoirs to supply water to the factorypremises. The contract is based on a twenty year repairing lease with rent reviews every five years. The rent is negotiated throughindependent advisers representing each party. The Company paid £11,529 (2011: Nil) to Ellergreen Hydro, a company in whichM A J Cropper is Managing Director, in the period for a maintenance project.
The Company also has the following transactions with related entities:
Loans and netManagement Receivable / intercompany
2012 charges (Payable) funding£'000 £'000 £'000
James Cropper Speciality Papers Limited 3,596 4,846 13,486
James Cropper Converting Limited 730 209 4,068
Technical Fibre Products Limited 870 1,069 (3,935)
James Cropper EBT Limited - - 226
5,196 6,124 13,845
Loans and netManagement Receivable / intercompany
2011 charges (Payable) funding£'000 £'000 £'000
James Cropper Speciality Papers Limited 3,828 4,652 8,031
The Paper Mill Shop Company Limited (discontinued operation) 188 - -
James Cropper Converting Limited 768 920 5,679
Technical Fibre Products Limited 882 219 (1,340)
James Cropper EBT Limited - - 462
5,666 5,791 12,832

25. Discontinued operation
The Paper Mill Shop (TPMS), a segment dedicated to the retailing of paper and associated products suffered four years oflosses and despite the best efforts of the TPMS management team to bring this subsidiary back to profitability, the Board ofJames Cropper plc took the decision to close and exit all TPMS retail outlets by 2 April 2011. The Board of James Cropper plcare now focused on the development of the 3 remaining manufacturing operations, being:
• JC Speciality Papers - a manufacturer of specialist paper and boards.
• JC Converting – a converter of paper.
• Technical Fibre Products – a manufacture of advanced materials.
Results of discontinued operation2012 2011
Note £'000 £'000
Revenue - 3,609Expenses - (5,335)
Results from operating activities - (1,726)
Income tax - -
Loss for the year - (1,726)
Basic loss per share 6 - (20.4p)Diluted loss per share 6 - (19.8p)
Cash flows (used in) / from discontinued operation
2012 2011£'000 £'000
Net cash used in operating activities - (150)
Net cash from investing activities - -
Net cash from financing activities - -
Net cash flows for the year - (150)
Notes to theFinancial Statementscontinued
Reporting
Interim Results announced and sent to
Ordinary Shareholders 15 November 2011
Final results announced 26 June 2012
Annual Report issued by 9 July 2012
Annual General Meeting -at The Bryce Institute, Burneside, Kendal
Wednesday 1 August 2012 at 11.00am.
Dividends on ordinary shares
Interim dividend paid on 13 January 2012 to Ordinary Shareholders registered on 16 December 2011.
Final dividend to be paid on 10 August 2012 to Ordinary Shareholders registered on 13 July 2012.
Registrars
Capita Registrars
Northern House
Woodsome Park, Fenay Bridge
Huddersfield
HD8 0GA
Tel 0871 664 0300
www.capitaregistrars.com
2011 - 2012Shareholder Information
pages 66 | 67James Cropper plc Annual Report and Accounts 2012

Notice is hereby given that the one hundred and twenty-thirdannual general meeting of James Cropper plc (the “Company”)will be held at The Bryce Institute, Burneside, Kendal, Cumbriaat 11.00am on Wednesday 1 August 2012 to consider and, ifthought fit, pass the following resolutions of which resolutions1 to 10 are being proposed as ordinary resolutions andresolutions 11 and 12 as special resolutions:-
1. To receive and consider the statement of accounts andreports of the Directors and the auditors for the 52 weeksended 31 March 2012.
2. To declare a final dividend of 5.7p per share in respect ofthe ordinary shares in the Company payable on 10 August2012 to all ordinary shareholders on the register at theclose of business on 13 July 2012.
3. To re-elect Alun I Lewis as a Director of the Company.
4. To re-elect Patrick J Willink as a Director of the Company.
5. To re-elect David R Wilks as a Director of the Company.
6. To re-elect James A Cropper as a Director of theCompany.
7. To re-elect Douglas Mitchell as a Director of the Company.
8. To re-appoint KPMG Audit Plc as auditors to hold officefrom the conclusion of the meeting until the next AnnualGeneral Meeting.
9. To authorise the Directors to agree the remuneration of theauditors of the Company.
10. To consider and approve the Directors’ RemunerationReport for the 52 weeks ended 31 March 2012.
11. That the Directors be authorised for the purpose of Section551 of the Companies Act 2006 to allot shares in theCompany or grant rights to subscribe for, or to convert anysecurity into, shares in the Company up to an aggregatenominal amount of £381,083 provided that:-
11.1 except as provided in paragraph 11.2 below thisauthority shall expire at the conclusion of the nextAnnual General Meeting of the Company after thepassing of this resolution, or 15 months from the dateof this resolution (whichever is earlier) but may bepreviously revoked or varied by an ordinary resolutionof the Company; and
11.2 the Company may before such expiry make an offeror agreement which would or might require theallotment of shares in the Company or the grant ofrights to subscribe for, or to convert any security into,shares in the Company after such expiry and theDirectors may allot shares in the Company, or grantrights to subscribe for, or convert any security into,shares in the Company, in pursuance of such offer oragreement notwithstanding that the authorityconferred by this resolution has expired.
12. That subject to the passing of and pursuant to the generalauthority conferred by the resolution numbered 11 in thenotice convening this meeting the Directors be empoweredpursuant to Section 570 of the Companies Act 2006 (the“Act”) to allot equity securities (as defined in Section 560 ofthe Act) for cash, either pursuant to the authority soconferred or where the equity securities are held by theCompany as treasury shares (within the meaning of Section724(5) of the Act), as if Section 560 of the Act did notapply to any such allotment, provided that this power shallbe limited to:-
12.1 the allotment of equity securities in connection withany rights or other pre-emptive issue in favour of theordinary shareholders where the equity securitiesrespectively attributable to the interests of all ordinaryshareholders are proportionate (as nearly as may be)to the respective numbers of ordinary shares held bythem on a fixed record date (but subject to suchexclusions or other arrangements as the Directorsmay deem necessary or expedient in relation tofractional entitlements or any legal or practicalproblems under the laws of any territory or therequirements of any regulatory body or stockexchange in any territory or any other matterwhatsoever); and
12.2 otherwise than pursuant to paragraph (a) of thisresolution, the allotment of equity securities up to anaggregate nominal amount of £211,892,
and shall expire on the conclusion of the next AnnualGeneral Meeting of the Company after the passing of thisresolution or 15 months from the date of this resolution(whichever is earlier) except that the Company may beforesuch expiry make an offer or agreement which would ormight require equity securities to be allotted after suchexpiry and the Directors may allot equity securities inpursuance of any such offer or agreement as if the powerconferred by this resolution had not expired.
13. That the Company be generally and unconditionallyauthorised for the purposes of Section 701 of theCompanies Act 2006 (“the Act”) to make market purchases(within the meaning of Section 693(4) of the Act) on theLondon Stock Exchange of ordinary shares of 25p each inthe capital of the Company either for cancellation or to holdas treasury shares (within the meaning of Section 724(5) ofthe Act) provided that:-
13.1 the maximum aggregate number of ordinary shareshereby authorised to be purchased is 1,271,350;
13.2 the maximum number of shares held in treasury willnever exceed 10% of the issued share capital of theCompany;
Notice ofAnnual GeneralMeeting
13.3 the minimum price which may be paid for suchshares is 25p per ordinary share;
13.4 the maximum price which may be paid for suchordinary shares shall not be more than 5% above theaverage of the market values for a ordinary share asderived from the AIM appendix to the London StockExchange’s Daily Official List for the five businessdays immediately preceding the date on which theordinary shares are purchased;
13.5 unless previously renewed, varied or revoked, theauthority hereby conferred shall expire at theconclusion of the Company’s next Annual GeneralMeeting or 15 months from the date of this resolution(whichever is earlier); and
13.6 the Company may make a contract or contracts topurchase ordinary shares under the authorityconferred by this resolution prior to the expiry of suchauthority which will or may be executed wholly orpartly after the expiry of such authority and may makea purchase of ordinary shares in pursuance of anysuch contract or contracts.
By order of the Board
D R CareySecretary
9 July 2012
Registered office:
Burneside Mills, Kendal, Cumbria LA9 6PZ
Registered in England and Wales No. 30226
NotesThe following notes explain your general rights as a shareholder and your right toattend and vote at this meeting or to appoint someone else to vote on your behalf.
1. Only those members registered in the Register of Members of the Company asat 6.00pm on 30 July 2012 shall be entitled to attend and vote at the meetingconvened above in respect of the number of shares registered in their names atthat time.
2. A member entitled to attend and vote at the meeting convened by the abovenotice is entitled to appoint another person as his proxy to exercise all or any of hisrights to attend and to speak and vote at a meeting of the Company. Any suchmember may appoint more than one proxy provided that each proxy is appointedto exercise the rights attached to a different share or shares held by such member.You may not appoint more than one proxy to exercise rights attached to any oneshare. To appoint more than one proxy, please photocopy the form of proxy andindicate in the box next to the proxy’s name the number of shares in relation towhich he or she is authorised to act as your proxy. Please also indicate by tickingthe box provided if the proxy instruction is one of multiple instructions being given.All forms must be signed and should be returned together in the same envelope.A proxy need not be a member of the Company. Appointing a proxy will notprevent a shareholder from attending in person and voting at the meeting. If youwish your proxy to speak on your behalf at the meeting you will need to appointyour own choice of proxy (not the Chairman of the meeting) and give yourinstructions directly to that person.
3. A form of appointment of proxy is enclosed. If you return more than one proxyappointment, that received last by the registrar before the latest time for the receiptof proxies will take precedence.
4. The form of proxy includes a vote withheld option. Please note that a votewithheld is not a vote in law and will not be counted in the calculation of theproportion of votes for and against any particular resolution.
5. The appointment of a proxy and the original or duly certified copy of the powerof attorney or other authority (if any) under which it is signed or authenticatedshould be deposited with the Company’s registrar at the address shown on theproxy form not later than 11.00am on 30 July 2012 or 48 hours before the time forholding any adjourned meeting.
6. CREST members who wish to appoint a proxy or proxies through the CRESTelectronic proxy appointment service may do so by using the proceduresdescribed in the CREST Manual. CREST Personal Members or other CRESTsponsored members, and those CREST members who have appointed a serviceprovider(s), should refer to their CREST sponsor or voting service provider(s), whowill be able to take the appropriate action on their behalf.
7. In order for a proxy appointment or instruction made using the CREST serviceto be valid, the appropriate CREST message (a “CREST Proxy Instruction”) mustbe properly authenticated in accordance with Euroclear UK & Ireland Limited’sspecifications, and must contain the information required for such instruction, asdescribed in the CREST Manual (available via www.euroclear.com/CREST). Themessage, regardless of whether it constitutes the appointment of a proxy or is anamendment to the instruction given to a previously appointed proxy must, in orderto be valid, be transmitted so as to be received by the issuer’s agent (ID RA10 nolater than 48 hours before the time set for the Meeting. For this purpose, the timeof receipt will be taken to be the time (as determined by the time stamp applied tothe message by the CREST Application Host) from which the issuer’s agent is ableto retrieve the message by enquiry to CREST in the manner prescribed by CREST.After this time any change of instructions to proxies appointed through CRESTshould be communicated to the appointee through other means.
8. CREST members and, where applicable, their CREST sponsors, or votingservice providers should note that Euroclear UK & Ireland Limited does not makeavailable special procedures in CREST for any particular message. Normal systemtimings and limitations will, therefore, apply in relation to the input of CREST ProxyInstructions. It is the responsibility of the CREST member concerned to take (or, ifthe CREST member is a CREST personal member, or sponsored member, or hasappointed a voting service provider, to procure that his CREST sponsor or votingservice provider(s) take(s)) such action as shall be necessary to ensure that amessage is transmitted by means of the CREST system by any particular time. Inthis connection, CREST members and, where applicable, their CREST sponsorsor voting system providers are referred, in particular, to those Sections of theCREST Manual concerning practical limitations of the CREST system and timings.
9. The Company may treat as invalid a CREST Proxy Instruction in thecircumstances set out in Regulation 35(5)(a) of the Uncertificated SecuritiesRegulations 2001.
10. As at 9.00am on 5 June 2012, being the last practicable day prior to thepublication of this notice, the Company’s issued share capital comprised8,475,667 ordinary shares of 25p each. Each ordinary share carries the right toone vote at a general meeting of the Company and, therefore, the total number ofvoting rights in the Company as at 9.00am on 5 June 2012, being the lastpracticable date prior to the publication of this notice is 8,475,667.
11. Copies of the contracts of service for Directors, the rules of theJames Cropper plc Savings-related Option Scheme, and a statement of Directors’interests are available for inspection during normal business hours at the registeredoffice of the Company and they may be inspected at the place of the AnnualGeneral Meeting for at least 15 minutes prior to the meeting and at the meeting.
pages 68 | 69James Cropper plc Annual Report and Accounts 2012
ImageInformation
The full page images used throughout the Annual Report are representative of the advanced materials and papers created byTFP, Converting and Speciality Papers.
Paper
All the paper used in this report has been produced by James Cropper plc
Cover . Colorplan Imperial Blue 350gsmInset . Kendal Ivory Board 160gsmColorplan is made exclusively for GFSmith & Son (London) Ltd
Pride Awards and Chairman's Report photography by Steve Crook. www.stevecrookphotography.comPrinted by Dixons Printing Company LtdDesign by RJ Design UK Ltd
James Cropper plc Annual Report and Accounts 2012
Microfine Polyester Veil (4gsm)
page 1
The Natural Collection (120gsm - 330gsm)
page 5
Fluting Kraft (100gsm)
page 37


![INDEX [controlwell.com]controlwell.com/cataloguepdf/cableglands.pdf · 4 Size Cat. No. Grey BS-01 BS-02 BS-03 BS-04 BS-05 BS-06 BS-07 BS-08 BS-09 BS-10 Clamping Range (mm) 3 - 6.5](https://img.pdfslide.net/doc/110x75/5aa168cf7f8b9a07758b8558/index-4-size-cat-no-grey-bs-01-bs-02-bs-03-bs-04-bs-05-bs-06-bs-07-bs-08-bs-09.jpg)