Embed Size (px)
Citation preview
Objectives:
• Understand the Biological Species Concept its strengths and its weaknesses.
• Understand the types of information biologists use when delineating species, and the strengths and weaknesses of these different sources of information.
• Understand the terms cryptic species and sexual dimorphism, and be able to give examples of each.
• Understand the difference between anagenesis and cladogenesis.
• Understand the terms adaptive radiation, niche and key innovation.
• Understand the difference between prezygotic and postzygotic reproductive barriers.
• Be familiar with the diversity of Darwin’s Finches and understand the relationship between diet and beak form in these birds.
• Understand the mechanics of producing bird songs, and know the components of song structure.
• Understand the relationship between beak form and song structure in Darwin’s Finches, and know what is meant by vocal deviation.
• Understand the importance of song structure in mate recognition in Darwin’s Finches and understand the impact that changes in beak form may have in the maintenance of distinct species of Darwin’s Finches.
• Be comfortable with using Excel to generate a graph. Important Note!! – Throughout this Lab you will be asked to open up documents on your computer. Links to these files will be posted soon.
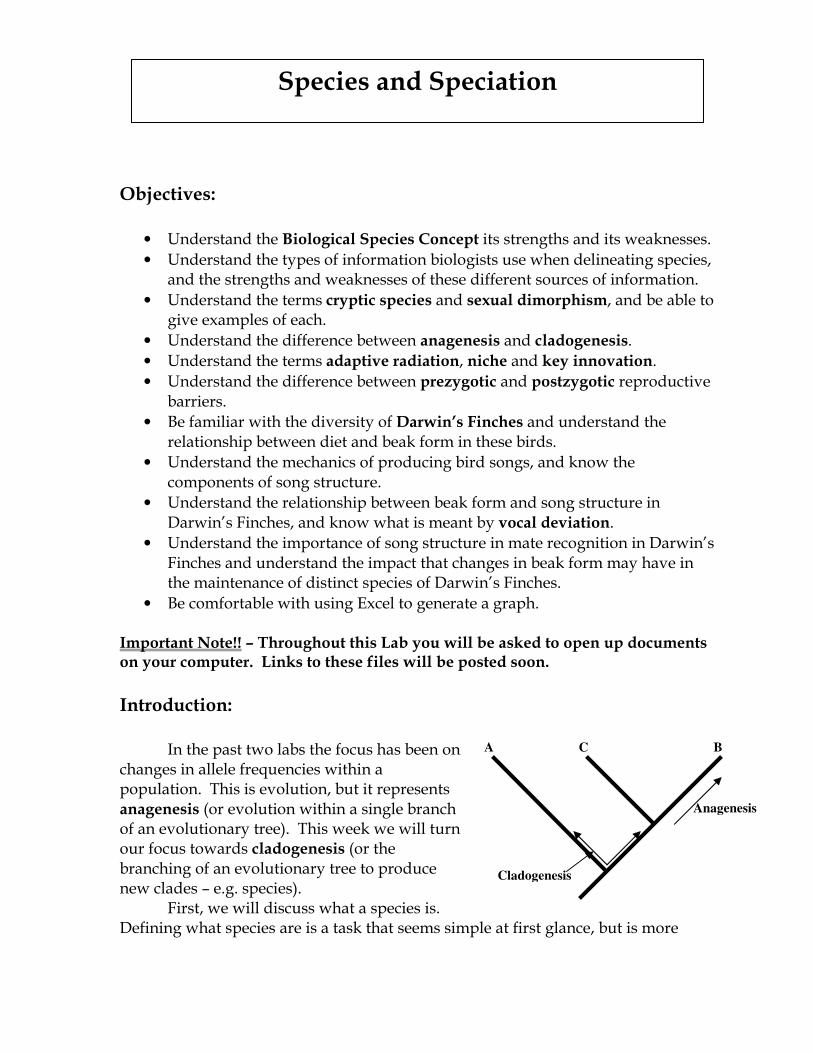
Introduction: In the past two labs the focus has been on changes in allele frequencies within a population. This is evolution, but it represents anagenesis (or evolution within a single branch of an evolutionary tree). This week we will turn our focus towards cladogenesis (or the branching of an evolutionary tree to produce new clades – e.g. species). First, we will discuss what a species is. Defining what species are is a task that seems simple at first glance, but is more
Species and Speciation
A C B
Anagenesis
Cladogenesis
2
complex once you take a closer look at it. Then we will take a look at the forces that can drive speciation and the mechanisms by which species remain separate from one-another. We will be taking a close look at a group of organisms that is famous for improving our understanding of how evolution works – Darwin’s Finches.
Species: You may not think defining what a species is would be a difficult task. After all, we can all recognize that a wolf is different from a chimpanzee, which is different from a bullfrog, which is different from a pangolin, which is different from a sunflower, which is different from a toad stool etc. etc. etc., but as you will see it is not always a straight forward process. The Biological Species Concept (put forth by Ernst Mayr) is probably the most commonly used concept concerning the definition of species (at least by vertebrate biologists). At its heart is the idea that members of the same species have the potential to mate and produce viable offspring, which they cannot do with members of a different species. Of course, I am sure you are aware that sometimes separate species can hybridize (e.g. Napoleon Dynamite’s favorite animal – the Liger). There are other problems with this concept as well – the largest being the fact that not all organisms reproduce sexually (e.g. bacteria). There have been many alternative ideas put forth as to how to think about species (a few are discussed in your textbook). In practice, however, most systematists (people who study the classification and evolutionary relationships of organisms) rely on the same tools to delineate species. They typically group together organisms that share traits not found in other organisms. Those traits can be morphological (physical features), molecular (e.g. DNA), and/or behavioral. This does not mean that there is always 100% agreement, and some species can be difficult for researchers to recognize – as you will see in the following exercise.
Exercise 1: Caminalcules Members of the genus Caminalcule are imaginary creatures that were named after their creator Joseph H. Camin. You will be given a packet that contains cards that give relevant information for 50 individual caminalcules. A. Flip the cards to the side that contains ONLY the picture and sort them into species: ► How many groups of species did you end up with? ________

3
B. Now flip the cards to the side that contains ALL the information (picture, DNA sequence and Sex) and reassess your species groups: ► How many groups of species did you end up with now? ________ ► What process did you use to determine which group each individual belonged to? Which information did you use first? Did you have to use more than one type of information to make your decisions? Were there any groups that caused you any difficulty or changed after you had all the information instead of just the picture? If so, why were they tricky? After you are done with this exercise, your instructor will go over some important information with regards to this exercise. Take careful notes, this information is bound to show up on a quiz! ► Notes from instructor presentation about determining species groups:
4
Speciation: The process of speciation is what has lead to the abundant biodiversity present on earth today. Speciation can occur when a population becomes subdivided into smaller groups because of a geographic barrier (Allopatric speciation). These subdivided groups tend to undergo different changes, and may become dissimilar enough to be considered separate species. Speciation can also occur within a population (Sympatric speciation). Certain members of the population may increase their ploidy (the number of chromosome copies), which is a process that is somewhat common in plants, making them incompatible with rest of the individuals in a population. Sympatric speciation may also occur if there is habitat differentiation or sexual selection (Please see your textbook for a more in-depth discussion of these categories of speciation). Certain factors can sometimes lead to abundant and rapid (in the geological sense) speciation known as adaptive radiations where speciation occurs as the result of new niches opening up. A niche describes how an organism interacts with its environment (e.g. what it eats, what eats it, when does it reproduce, where does it live etc.). Some of the factors that can cause new niches to become available are mass extinctions, which open up the niches of extinct species; key innovations, which allow organisms to do something completely new (e.g. change from being aquatic to terrestrial, or develop flight); or the development of new island chains, which provide new and differing habitats that can be exploited. One famous example of an island chain and the speciation that has occurred on them is the Galapagos Islands; the very islands that aided Darwin’s thinking about the process of evolution and the home of Darwin’s finches, which are the subject of the next exercise. No matter how the division of an ancestral population into separate species gets its start, the question remains as to how these divisions are reinforced. In sexually reproducing organisms (the focus of this lab), divisions are reinforced by reproductive barriers. These barriers fall into two major categories prezygotic and postzygotic. Prezygotic barriers are factors that prevent members of different species from mating with each other in the first place. For instance, we know that it is possible for lions (Panthera leo) and tigers (Panthera tigris) to produce offspring (Napoleon Dynamite’s ligers), but lions and tigers have virtually no overlap in their geographic distributions, making it highly unlikely that they would copulate in the wild. Postzygotic barriers are those that occur after mating has occurred. For instance the offspring that are produced may be sterile or otherwise have reduced viability (they may be less vigorous or have reduced fertility). Again, in the case of the ligers – even when matings do occur between lions and tigers, the ligers that are produced have reduced viability. For a more thorough explanation of reproductive barriers, please see your textbook. In the following exercise you will investigate

5
how reproductive barriers may actually have arisen in the famous Darwin’s Finches of the Galapagos Islands.
Exercise 2 – Reproductive Barriers in Darwin’s Finches: Beaks, Food and Evolution: Darwin’s Finches (members of the genera Geospiza, Certhidea, Platyspiza, Cactospiza, and Camarhynchus) represent an adaptive radiation. A single common ancestor came to inhabit the Galapagos Islands and speciation occurred as populations adapted to the different food sources found on each island. Darwin’s Finches provided a classic example of microevolution (evolution occurring within a population over a span of generations). Peter and Rosemary Grant measured beak depth in the medium ground finch (Geospiza fortis) over a span of nearly a decade and kept records of weather conditions over that same span of time. During normal conditions, a wide range of seed sizes is available for these birds to eat; however, in dry years – only the larger seeds tend to be available. ► On your computer, look at the figure labeled “Microevolution in Beak Depth”. What happened to the average beak depth in G. fortis during dry years? What do you think accounts for this change in beak depth?
6
The previous example of microevolution in beak dimensions gives us a glimpse at how natural selection can drive changes in morphology. Darwin’s Finches are also an excellent example of macroevolutionary changes because they show a great deal of variation in beak proportions that corresponds to the type of food they eat. ► On your computer, look at the figure labeled “Adaptive Radiation in Darwin’s Finches”. How would you describe the differences between the beaks of insect eaters and the beaks of seed-eaters? Singing in Darwin’s Finches: Male songbirds sing for two main purposes – to establish and defend their territories, and to attract females. The song that a bird sings to attract a female is a critical component of mate recognition. In other words, the song that a male bird sings is one of the main features that females use to recognize members of their own species.
7
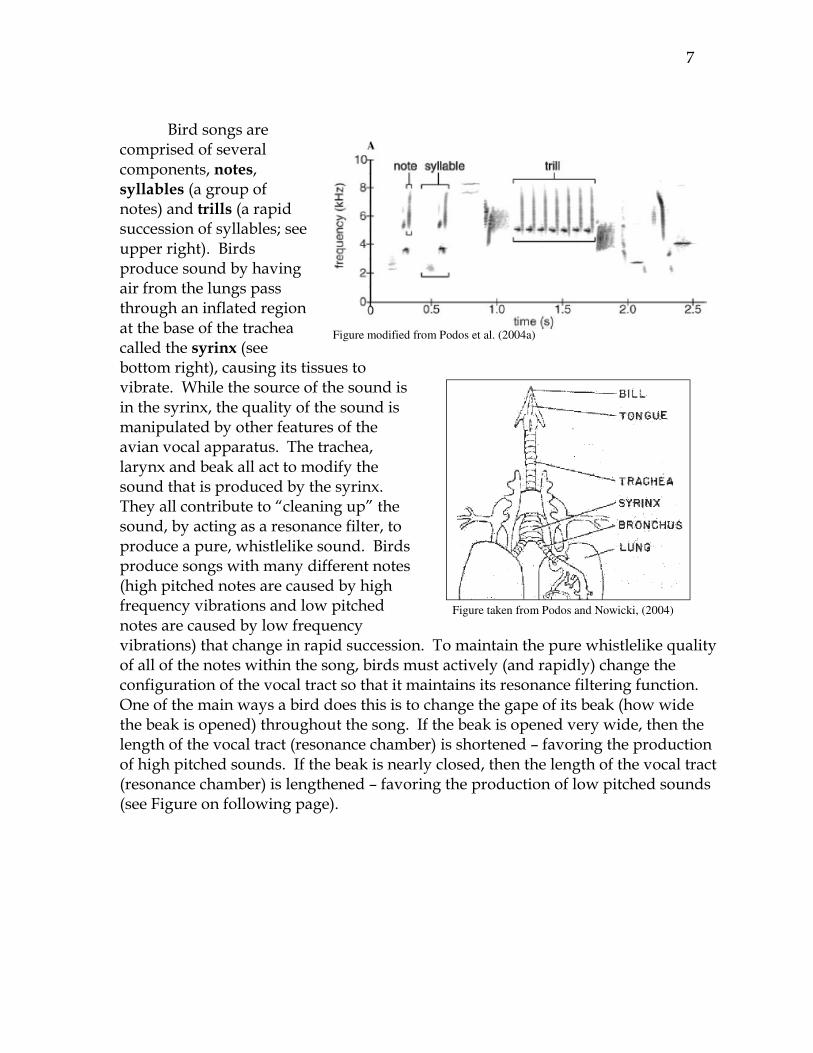
Bird songs are comprised of several components, notes, syllables (a group of notes) and trills (a rapid succession of syllables; see upper right). Birds produce sound by having air from the lungs pass through an inflated region at the base of the trachea called the syrinx (see bottom right), causing its tissues to vibrate. While the source of the sound is in the syrinx, the quality of the sound is manipulated by other features of the avian vocal apparatus. The trachea, larynx and beak all act to modify the sound that is produced by the syrinx. They all contribute to “cleaning up” the sound, by acting as a resonance filter, to produce a pure, whistlelike sound. Birds produce songs with many different notes (high pitched notes are caused by high frequency vibrations and low pitched notes are caused by low frequency vibrations) that change in rapid succession. To maintain the pure whistlelike quality of all of the notes within the song, birds must actively (and rapidly) change the configuration of the vocal tract so that it maintains its resonance filtering function. One of the main ways a bird does this is to change the gape of its beak (how wide the beak is opened) throughout the song. If the beak is opened very wide, then the length of the vocal tract (resonance chamber) is shortened – favoring the production of high pitched sounds. If the beak is nearly closed, then the length of the vocal tract (resonance chamber) is lengthened – favoring the production of low pitched sounds (see Figure on following page).
Figure taken from Podos and Nowicki, (2004)
Figure modified from Podos et al. (2004a)
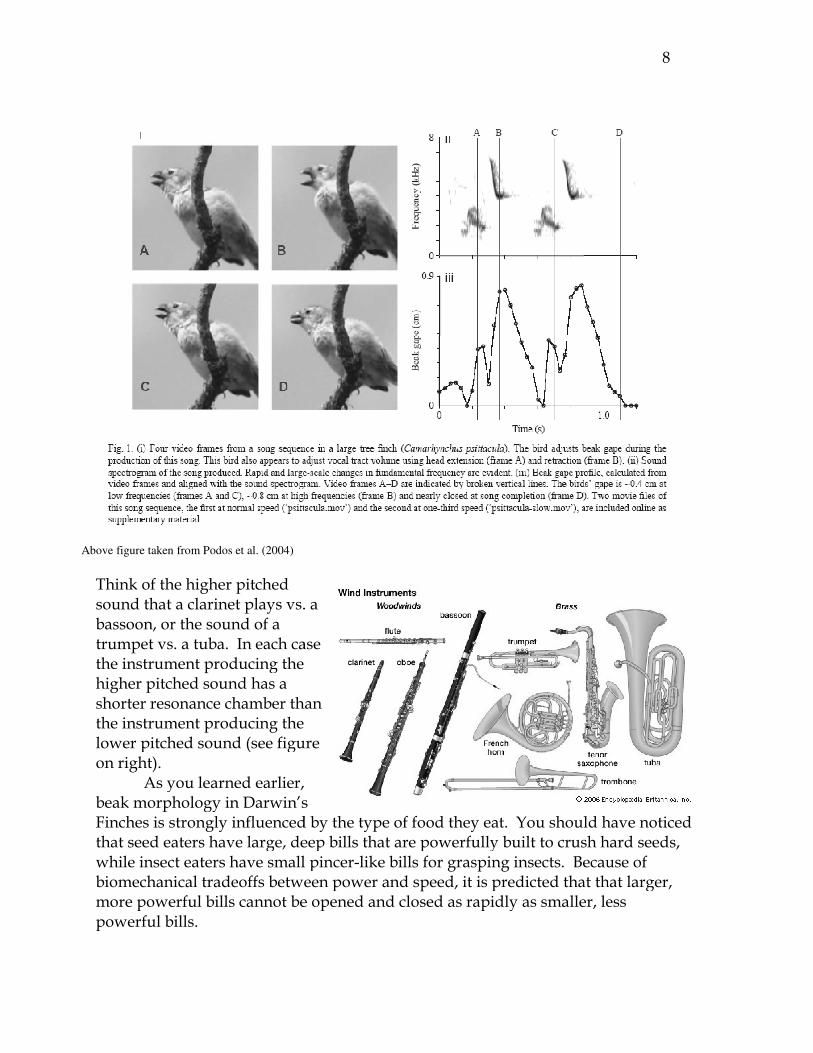
Think of the higher pitched sound that a clarinet plays vs. abassoon, or the sound of a trumpet vs. a tuba. In each case the instrument producing the higher pitched sound has a shorter resonance chamber than the instrument producing the lower pitched sound (see figure on right).
As you learned earlier, beak morphology in Darwin’s Finches is strongly influenced bythat seed eaters have large, deep bills that are powerfully built to crush hard seeds, while insect eaters have small pincerbiomechanical tradeoffs between pmore powerful bills cannot be opened and closed as rapidly as smaller, less powerful bills.
Above figure taken from Podos et al. (2004)
sound that a clarinet plays vs. a
ach case ducing the
shorter resonance chamber than producing the
lower pitched sound (see figure
As you learned earlier, beak morphology in Darwin’s Finches is strongly influenced by the type of food they eat. You should have noticed that seed eaters have large, deep bills that are powerfully built to crush hard seeds, while insect eaters have small pincer-like bills for grasping insects. Because of biomechanical tradeoffs between power and speed, it is predicted that that larger, more powerful bills cannot be opened and closed as rapidly as smaller, less
8
the type of food they eat. You should have noticed that seed eaters have large, deep bills that are powerfully built to crush hard seeds,
Because of t is predicted that that larger,
more powerful bills cannot be opened and closed as rapidly as smaller, less
9
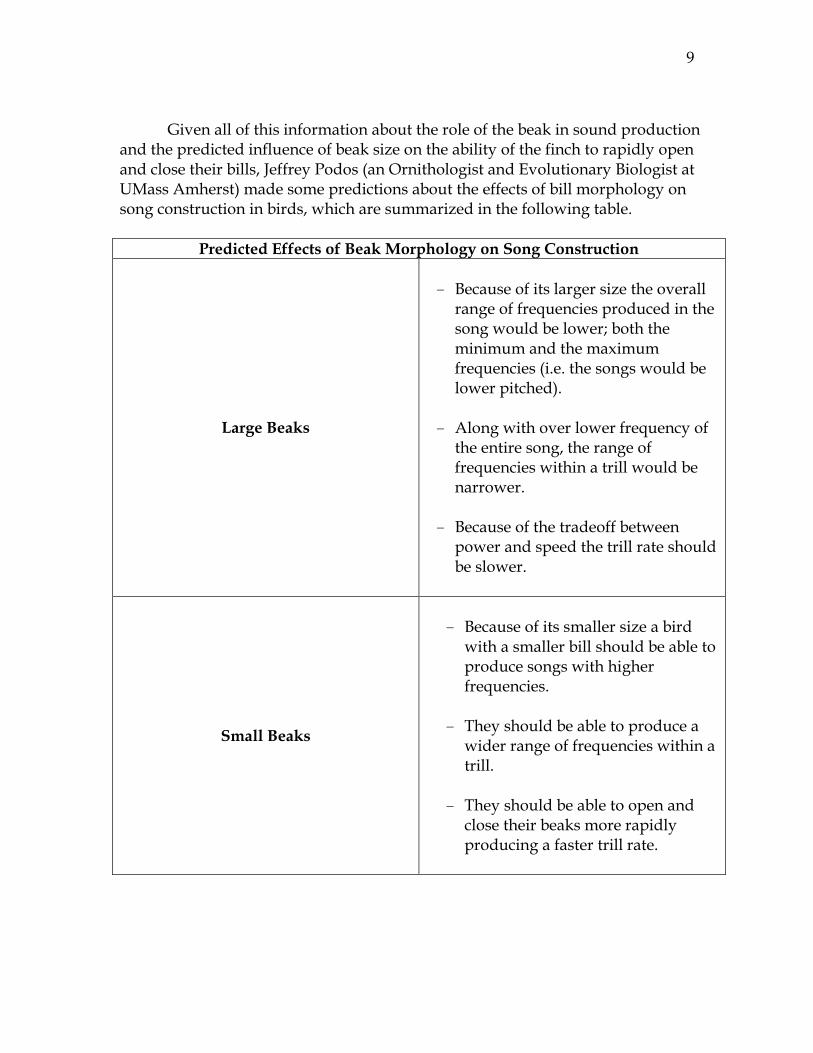
Given all of this information about the role of the beak in sound production and the predicted influence of beak size on the ability of the finch to rapidly open and close their bills, Jeffrey Podos (an Ornithologist and Evolutionary Biologist at UMass Amherst) made some predictions about the effects of bill morphology on song construction in birds, which are summarized in the following table.
Predicted Effects of Beak Morphology on Song Construction
Large Beaks
- Because of its larger size the overall range of frequencies produced in the song would be lower; both the minimum and the maximum frequencies (i.e. the songs would be lower pitched).
- Along with over lower frequency of the entire song, the range of frequencies within a trill would be narrower.
- Because of the tradeoff between power and speed the trill rate should be slower.
Small Beaks
- Because of its smaller size a bird with a smaller bill should be able to produce songs with higher frequencies.
- They should be able to produce a wider range of frequencies within a trill.
- They should be able to open and close their beaks more rapidly producing a faster trill rate.

10
► Look at the data below. Based on the information regarding beak morphology and song construction given above, which of these birds is likely to produce the highest pitched notes in their songs?
► How might you go about testing the prediction that smaller beaks lead to higher pitched notes being included in a finch’s song?
11
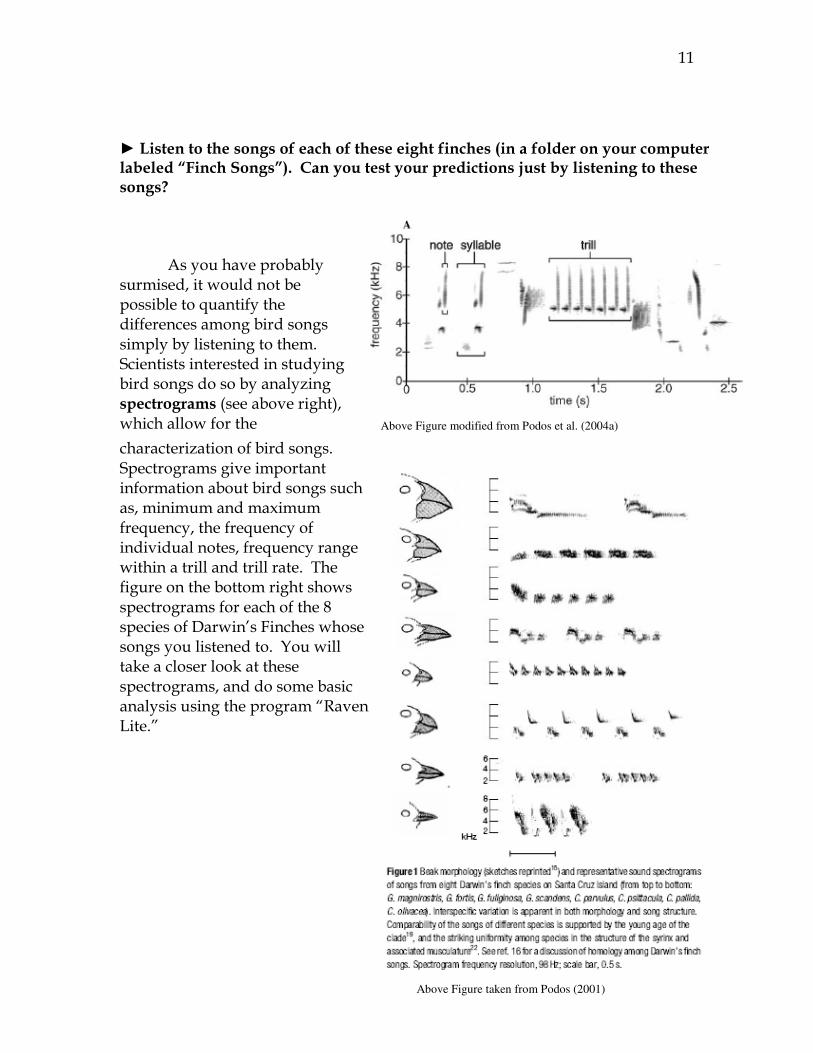
► Listen to the songs of each of these eight finches (in a folder on your computer labeled “Finch Songs”). Can you test your predictions just by listening to these songs? As you have probably surmised, it would not be possible to quantify the differences among bird songs simply by listening to them. Scientists interested in studying bird songs do so by analyzing spectrograms (see above right), which allow for the
characterization of bird songs. Spectrograms give important information about bird songs such as, minimum and maximum frequency, the frequency of individual notes, frequency range within a trill and trill rate. The figure on the bottom right shows spectrograms for each of the 8 species of Darwin’s Finches whose songs you listened to. You will take a closer look at these spectrograms, and do some basic analysis using the program “Raven Lite.”
Above Figure modified from Podos et al. (2004a)
Above Figure taken from Podos (2001)
12
Spectrogram Analysis Using Raven Lite:
1) Open the program Raven Lite on your computer.
2) Under “File” choose “Open Sound Files” and navigate to the folder “Finch Songs.” Open each of the finch song sound files found there (unfortunately you cannot select them all at once; therefore, you will need to repeat this process for each song).
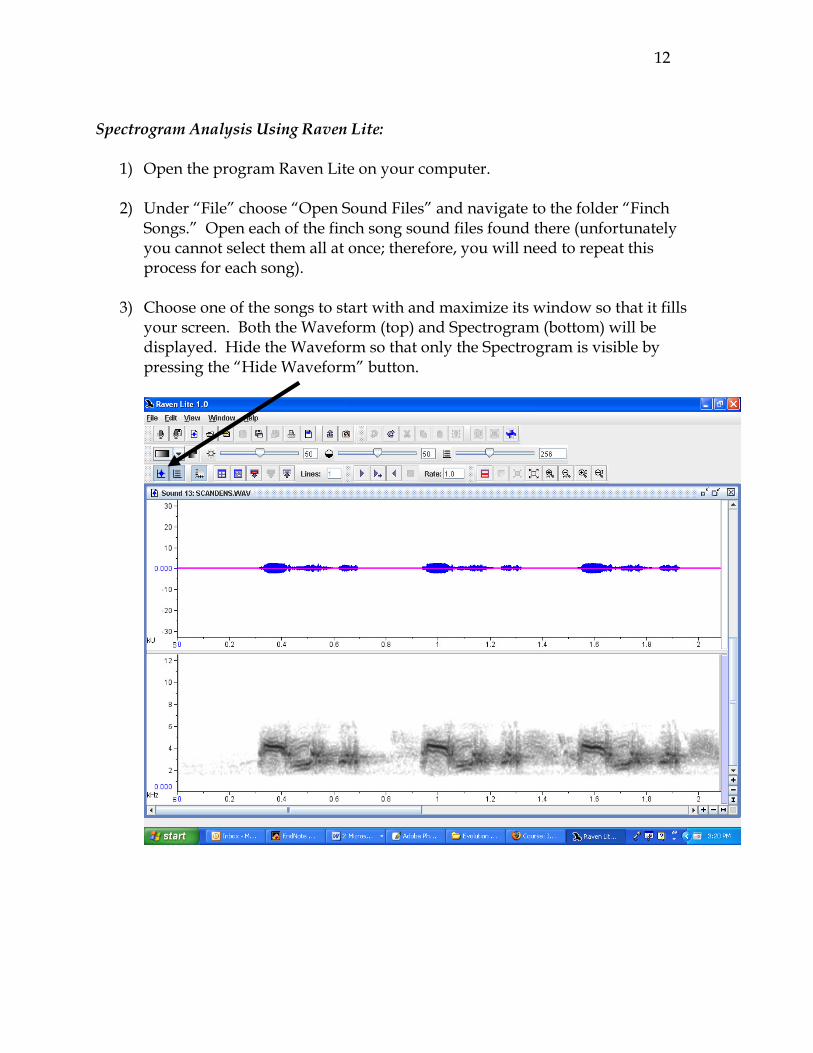
3) Choose one of the songs to start with and maximize its window so that it fills your screen. Both the Waveform (top) and Spectrogram (bottom) will be displayed. Hide the Waveform so that only the Spectrogram is visible by pressing the “Hide Waveform” button.
13
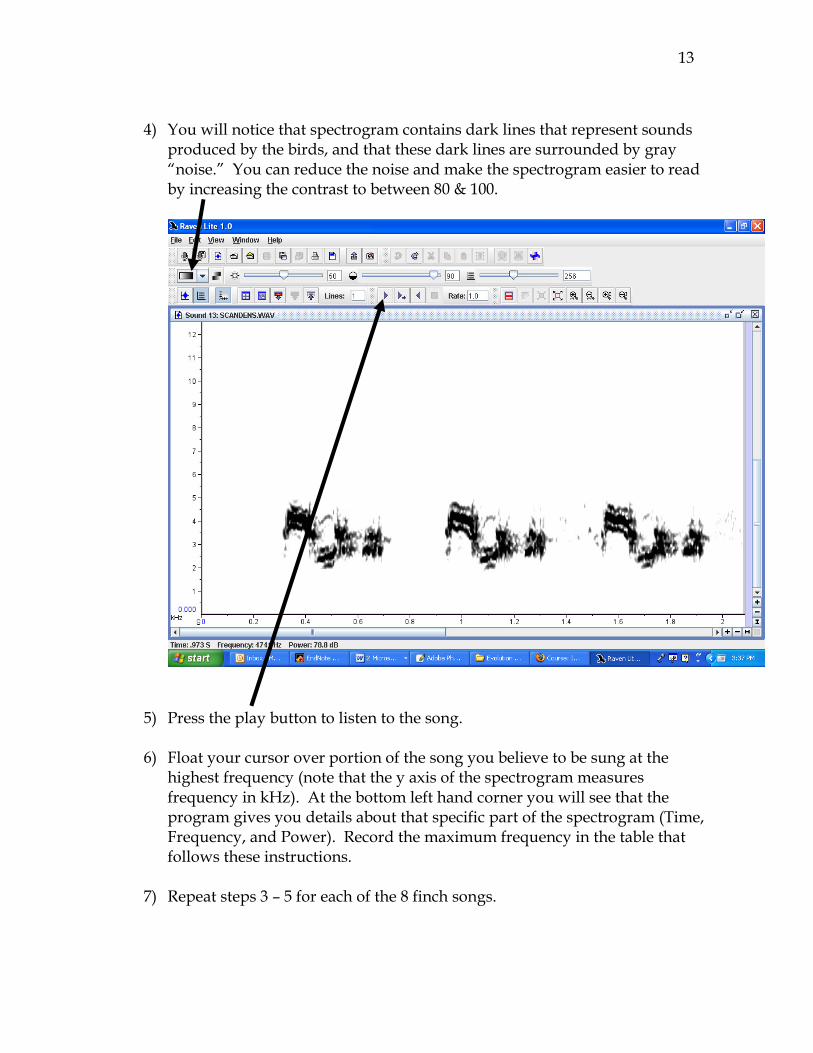
4) You will notice that spectrogram contains dark lines that represent sounds produced by the birds, and that these dark lines are surrounded by gray “noise.” You can reduce the noise and make the spectrogram easier to read by increasing the contrast to between 80 & 100.
5) Press the play button to listen to the song.
6) Float your cursor over portion of the song you believe to be sung at the highest frequency (note that the y axis of the spectrogram measures frequency in kHz). At the bottom left hand corner you will see that the program gives you details about that specific part of the spectrogram (Time, Frequency, and Power). Record the maximum frequency in the table that follows these instructions.
7) Repeat steps 3 – 5 for each of the 8 finch songs.

14
8) Have fun with this program. This program allows you to do some fun things such as take a closer look at any one section of the song, change the playback speed of the song, as well as other things. As time allows you should feel free to play around with this program.
Finch Species Bill Depth (mm) Maximum Frequency Certhidea olivacea 4 Camarhynchus parvulus 7 Geospiza fulginosa 7 Cactospiza pallida 8.75 Geospiza scandarus 8.9 Camarhynchus psittacula 9.75 Geospiza fortis 12 Geospiza magnirostris 16
Analysis of Bill Depth and Frequency Data:
Using the data in the above table generate a Best-fit line graph (using Excel) that plots maximum frequency vs. bill depth. Be sure to label your axes, provide a title, and include the R2 value in your graph. (Tips on how to use the graphing function in Excel are given in a separate handout; in addition, an explanation of R2 is included in a separate handout) When you have completed your graph, be sure to show it to your TA. ► Describe the relationship that is depicted in your graph between bill depth and maximum frequency. ► Does the data support the predicted relationship between beak size and the maximum frequency produced in the finch’s song? ______________ ► How strong is this support (based on the R2 value)?

15
Vocal Deviation: To further quantify differences in songs, Jeffrey Podos devised a metric called vocal deviation. A large value for vocal deviation indicates that the bird has either slower trill rate and/or a narrower frequency range within a trill. ► What would your hypothesis be with regards to the relationship between bill size and vocal deviation? (Be sure to run your hypothesis by your instructor) ► Open up the file on your computer labeled “Vocal Deviation Data.” Using the data in this table generate a graph (using Excel) that creates a best-fit line graph for vocal deviation vs. bill depth. Be sure to label your axes, provide a title and include the R2 value in your graph. When you have completed your graph, be sure to show it to your instructor. ► Describe the relationship that is depicted in your graph between bill depth and vocal deviation.
16
► Does the data support your hypothesis? ______________ ► How strong is this support (based on the R2 value)? ► What implications do these findings have with regards to speciation in Darwin’s Finches? (Once you have answered this question – share your thoughts with your instructor, and your they will give you a handout that summarizes the implications of these findings.) This story that you have just put together regarding diet, beak size, song production and speciation in Darwin’s Finches is a very cool story. So cool, in fact, that it was published in one of the science community’s most prestigious journals – Nature (Podos, 2001). However, the Podos (2001) study was not without limitations. Podos was unable to fully account for the influence of body size, which varies among these finch species and can influence song characteristics. There is no such thing as a flawless study, which is why multiple studies are done – each building on the findings of previous studies (or sometimes refuting them) and improving our understanding of biological systems. As it turns out, the same brilliant mind behind the Nature paper joined forces with another investigator to take a closer look at a single species of finch (Geospiza fortis) that exhibits a bimodal distribution for beak depth (Huber and Podos, 2006). A bimodal distribution means that there are two different modes within a data set (the mode is the most frequently occurring value in a data set). In this case it means that there are two different modes for bill depth within G. fortis, one being a few millimeters smaller than the other. Presumably this is because subsets of this species have specialized on slightly different seed types that favor different bill dimensions. The investigators wanted to know if the

17
differences in bill depth found within this single species of finch would be enough to affect song characteristics, and this time they were able to take body size into account. ► Open the file on your computer labeled “Geospiza fortis Vocal Deviations” and examine the relationships between the three different bill dimensions and vocal deviation. Describe this relationship below. ► Do these relationships mirror those that you discovered between bill depth and vocal deviation in the 8 different species of Darwin’s Finches? ► What do you think these results might mean for the future of G. fortis?

18
Literature Cited: Huber SK, Podos J. 2006. Beak morphology and song features covary in a population of
Darwin's finches (Geospiza fortis). Biol. J. Linn. Soc. 88:489-498.
Podos J. 2001. Correlated evolution of morphology and vocal signal structure in Darwin's
finches. Nature 409:185-187.
Podos J, Huber SK, Taft B. 2004a. Bird song: The interface of evolution and mechanism.
Annu. Rev. Ecol. Evol. Syst. 35:55-87.
Podos J, Nowicki S. 2004. Beaks, adaptation, and vocal evolution in Darwin's finches.
BioScience 54:501-510.
Podos J, Southall JA, Rossi-Santos MR. 2004b. Vocal mechanics in Darwin's finches:
correlation of beak gape and song frequency. J. Exp. Biol. 207:607-619.

19
Notes:

20
Notes: