Embed Size (px)
Citation preview
THE JOURNAL. OF BIOLOGICAL CHEMISTRY Vol. 251, No. 8, Issue of April 25, pp. 2499-2510, 1976
Printed in U.S.A.
Specificity of Bacterial Ribosomes and Messenger Ribonucleic Acids in Protein Synthesis Reactions in Vitro*
(Received for publication, August 7, 1975)
MICHAEL R. STALLCUP,$ WILLIAM J. SHARROCK, AND JESSE C. RABINOWITZ
From the Department of Biochemistry, University of California, Berkeley, California 94720
Ribosomes from two Gram-negative bacteria translated f2 RNA, T4 early mRNA, mRNA from three Gram-negative bacteria, and mRNA from six Gram-positive bacteria; ribosomes from three Gram-posi- tive bacteria translated mRNA from the Gram-positive strains, but did not translate the other mRNAs. Ribosomes from the Gram-negative bacterium Escherichiu coli translated synthetic poly(U,G) but ribosomes from the Gram-positive bacterium Clostridium pasteurianum translated poly(U,G) very poorly. mRNA from Gram-negative bacteria was translated only in the presence of a high salt ribosomal wash containing initiation factors. mRNA from Gram-positive bacteria and synthetic poly(U,G) were translated much more efficiently when wash components were present, but were also translated to a small, but significant, extent in the absence of wash components. The translation specificity of each type of ribosome was independent of the source of ribosomal wash components. When the radioactively labeled products of in vitro protein synthesis were analyzed by sodium dodecyl sulfate-polyacrylamide slab gel
electrophoresis and autoradiography, it was found that each different bacterial and phage RNA preparation directed the synthesis of a unique set of polypeptide products of discrete sizes. Three different types of ribosomes were used to translate each of several Gram-positive bacterial messenger preparations; the overall patterns of products obtained with a given mRNA are similar, but some differences in the products formed or the relative amounts of the various products synthesized can be detected.
Recent reports from several laboratories have demonstrated that ribosomes from different species of bacteria can have different specificities for the types of natural messenger RNA which they can translate (l-5). In all of these studies the salt-washed ribosomes, and not the initiation factors or other
components of the high salt ribosomal wash, determined the specificity of translation.
We have shown previously that ribosomes from Escherichia coli could translate f2 RNA, formaldehyde-treated f2 RNA, T4
early mRNA, E. cob mRNA and Clostridium pasteurianum mRNA, while ribosomes from C. pusteurianum could translate C. pasteuriunum mRNA but not the other four messengers (1, 2). We have now extended our studies on translational specific-
ity among bacterial protein synthesizing systems to include ribosomes and salt wash components from three additional bacterial species, messenger RNA from seven additional spe- cies, and the synthetic messenger RNA poly(U,G). The bacte- rial ribosomes and messenger RNAs tested in this study fall into two different classes according to their behavior in pro- tein synthesis assays in uitro. All the ribosomes and mRNAs in one class came from Gram-negative bacteria, while all those in the other class were obtained from Gram-positive bacteria.
* This investigation was supported by National Institutes of Health Research Grant AM02109 from the National Institute of Arthritis, Metabolism, and Digestive Diseases.
t Present address, Department of Biochemistry and Biophysics, University of California, San Francisco, California 94143.
Synthetic messengers are classified separately from the two
classes of natural messengers. Some aspects of these studies have been reported in a preliminary form (6).
The above conclusions are based on the quantitative deter- mination of labeled amino acid incorporation into material insoluble in hot 5% trichloroacetic acid. By analyzing the protein products synthesized in the assays with sodium do- decyl sulfate-polyacrylamide slab gel electrophoresis and auto- radiography, the conclusions previously established by the protein synthesis assay were supported and extended in the following ways: (a) in systems in which the amino acid incorporation increased in response to the addition of an exogenous messenger, the autoradiogram of the dried slab gel
showed new product bands; (b) in systems in which the amount of amino acid incorporation increased only a little or not at all in response to the addition of a given messenger, the gel technique detected low levels of synthetic activity which were not easily measured with the incorporation assay; (c) since Gram-positive mRNA preparations were translated b’y both Gram-positive and Gram-negative ribosomes, this slab gel technique permitted us to demonstrate that similar pat- terns of products were synthesized from a given preparation of Gram-positive mRKA by the different types of ribosomes.
EXPERIMENTAL PROCEDURE
Materials All materials were the same as those given previously (l), unless
otherwise stated. Poly(U,G) was kindly provided by M. Grunberg-
2499
by guest on February 14, 2018http://w
ww
.jbc.org/D
ownloaded from
2500 Translation Specificity of Bacterial Ribosomes and mRNA
Manago (Institut de Biologie Physico-Chimique Paris, France). The bacterial strainsused in these studies are described in Table I. Acrylamide and N,N’-methylenebisacrylamide (electrophoresis
grade) were purchased from Bio-Rad Laboratories; specially pure sodium lauryl sulfate (sodium dodecyl sulfate) from BDH Chemicals; ribonuclease-free, ultrapure sucrose from Mann Research Corp.
Methods
Growth of Bacteria-Culture media and conditions for the bacterial strains used in this study, except for Peptococcus aerogenes and Pseudomonas jluorescens, were as given in the references cited in Table I. P. aerogenes was grown at 37” on the following medium, which is a modification of the one described by Curtis and Ordal (17): Tryptone, 1%; yeast extract, 1%; sodium glutamate (Accent), 0.4%; potassium phosphate buffer, pH 7.2, 15 mM; MgSO,, 1 mM; FeSO,, 0.02 mM; CaSO,, 0.05% saturated; methylene blue, 2.5 pM; and sodium thio- glycolate, 0.1% (added just before autoclaving; medium is cooled and used immediately), or sodium dithionite, just enough added to reduce the methylene blue just before inoculation. The culture was main- tained in tubes containing 10 ml of the same medium supplemented with 0.1% of Difco Ionagar. Anaerobic conditions were maintained in all P. aerogenes cultures by the same technique used for the growth of Clostridium acidi-urici (9). P. fluorescens was grown at 30” on a rotary shaker in the following medium: 33 mM sodium potassium phosphate, pH 6.8/0.1% NH,C1/0.05% MgSO,.7H,0/0.5% yeast extract/0.2% sodium lactate (from a neutralized stock solution).
Preparation of mRNA-Purified f2 RNA and cellular RNA fractions containing T4 early mRNA, E. coli mRNA, and C. pasteurianum mRNA were prepared as previously described (1). Deproteinized extracts containing mRNA were prepared from each of the other bacterial strains essentially by the procedure used t,o prepare E. coli mRNA. An exponential culture of bacteria (0.5 to 2 liters) was poured over crushed ice. The approximate generation time and A,,, of the culture at harvest is given for each bacterial species in Table I. The cells were collected by centrifugation, resuspended in neutral buffer, frozen and thawed in the presence of lysozyme, and finally lysed by the addition of sodium dodecyl sulfate. The RNA was prepared from the lysate by phenol extraction (2 times at 60”) and ethanol precipitation. The addition of detergent lysed the Gram-negative cells easily after they had been frozen and thawed in the presence of lysozyme. However, the Gram-positive bacteria required additional lysozyme (25 mg/l-liter culture of bacteria) and 3 min of incubation at 37” with the lysozyme before they were rendered susceptible to lysis by sodium dodecyl sulfate. Preparations of bacterial RNA obtained by this method are referred to in the text as “mRNA”; it should be noted however, that none were further fractionated, and they thus contained large proportions of ribosomal RNA as well as transfer RNA.
Preparation of Ribosomes and Ribosomal Wash Fractions-E. coli MRE 600 salt-washed ribosomes, C. pasteurianum salt-washed, prein- cubated ribosomes, and the crude ribosomal wash fractions containing initiation factors from these two bacterial species were prepared as described previously (1). Salt-washed ribosomes and salt wash fraction were prepared from Streptococcus jaecalis cells by the method used for E. coli cells. Bacillus subtilis and P. fluorescens salt-washed ribosomes and wash fractions were also prepared by the method used for E. coli cells, except that the cells were disrupted by sonic oscillation rather than by grinding with alumina. For sonic oscillation, frozen cells were thawed in 2 volumes of buffer (10 mM Tris-chloride, pH 7.7/60 rnM NH&l/10 mM magnesium acetate/l3 mM @-mercaptoethanol) and sub- jected to a total of 3 min of sonic oscillation at maximum power of a Branson W185P instrument. The sonic oscillation was carried out in four 45-s periods with intervals of several minutes between periods to allow cooling. The beaker containing the cells was cooled in ice water throughout the procedure. The high salt wash fractions, referred to in earlier publications (1, 2) as “crude initiation factors,” will be indicated here as “ribosomal wash,” or “salt wash fraction.”
Preparation of S-150 for Protein Synthesis Assays-The high speed supernatant fraction (S-150) used in the protein synthesis assays was prepared from E. coli MRE 600. The post-rihosomal supernatant solution was concentrated by ammonium sulfate precipitation; amino acids and other small molecules were removed by desalting on Sephadex G-25, and nucleic acids were removed by passing the S-150 over a DEAE-cellulose column, using the buffer system of Ohta et al.
(18). Protein Synthesis Assays in Vitro-The details of the procedure for
the protein synthesis assay were given previously (1). Analysis of Products of Protein Synthesis by Sodium Dodecyl
Sulfate-Polyacrylamide Slab Gel Electrophoresis and Autoradiog- raphy-In vitro protein synthesis for analysis on gels was performed with the system described previously (l), modified as follows. The total reaction volume was 0.05 ml, containing 1.5 A,., units of ribosomes, 50 to 80 pg of salt wash protein, 80 pg of S-150 protein from E. coli MRE 600, and varying amounts of mRNA. Each assay contained 2.5 PCi of I.-“C-amino-acid mixture (Amersham/Searle, 57 mCi/mmilliatom, 50 &i/ml); all 20 amino acids were present at a total concentration of 48 PM each, a concentration found to be saturating under the conditions employed here. Assays were incubated at 37” for 20 min, then cooled on ice. A 10.~1 aliquot of each was counted on a filter paper disc as described previously (1); the remaining reaction mixture was stored frozen for analysis by polyacryl- amide gel electrophoresis.
Sodium dodecyl sulfate-polyacrylamide slab gel electrophoresis was performed by the method of Studier (19), employing the discontinuous buffer system of Laemmli (20). The resolving gel consisted of a linear
TABLE I
Classification and growth conditions of bacterial strains used in this study
Gram stain classification is as in Bergey’s Manual of Determinative Bacteriology (14), except for Clostridium acidi-urici and Clostridium
tetanomorphum; these strains have been classified as Gram-positive on the basis of their consideration with “typically Gram-positive” 1 endospore-forming bacteria in Stanier et al. (15).
Bacterial strain
Gram-negative organisms Escherichia coli BE Escherichia coli MRE 600 Pseudomonas fluorescens C-18 Azotobacter uinelandii OP
Culture source
Ref. 1 Ref. 1 --a Ref. 13
DNA base composition0
mol’% GC
50-51 50-51 59-61 66
Medium and culture
Ref. 7 Ref. 1 see text Ref. 8
Generation time
min
40 20
50
64
A.,,at harvest
0.8 1.0 0.8
1.0
Gram-positive organisms Clostridium pasteurianum ATCC 6013 26-28 Ref. 1 110 2.5 Clostridium acidi-urici 9a ATCC 7906 25-32 Ref. 9 90 0.3
Clostridium tetanomorphum Hl ATCC 15920 39.5 Ref. 10 2.0
Streptococcus faecalis R ATCC 8043 34-38 Ref. 11 40 0.4
Bacillus subtilis, wild type, UC strain 4 --a 42-43 Ref. 12 18 1.0 Peptococcus aerogenes ATCC 14963 36 see text 90 0.7
a H. Nikaido, Department of Bacteriology and Immunology, University of California, Berkeley. b GC content as given in Bergey’s Manual (14), with exception of values for Clostridium acidi-urici and Clostridium tetanomorphum, as quoted
by Hill (16).
by guest on February 14, 2018http://w
ww
.jbc.org/D
ownloaded from
Translation Specificity of Bacterial Ribosomes and mRNA 2501
gradient of acrylamide from 10 to 18%, stabilized by a parallel 0 to 5% gradient of glycerol; the stacking gel was 5% acrylamide. All gels were prepared from a stock solution containing 30% acrylamide/0.8% N,N’- methylenebisacrylamide (w/v). Samples were prepared by diluting 7.~1 aliquots of the protein synthesis assays into 35 ~1 of Laemmli’s “final sample buffer” containing bromphenol blue as a marker dye, and were heated for 2 min in a boiling water bath before being applied to the gel. Because the sample aliquot was the same in all of the gels shown here, the radioactivity detected by autoradiography is directly proportional to the incorporation activity of a given system.
Molecular weight standard proteins were run on each gel for use in determining the molecular weights of the products synthesized. The molecular weights of the standards ranged from 12,000 to 67,000.
Gels were run at 125 volts for 5 hours (or until about V’z hour after the dye band migrated off the bottom of the gel). Gels were fixed for 30 min in 10% (w/v) trichloroacetic acid/25% (v/v) isopropyl alcohol; stained overnight in 0.1% Coomassie brilliant blue (in trichloroacetic acid/iso- propyl alcohol as above); and destained in two changes of 10% acetic acid. Destained gels were dried onto filter paper under plastic film as described by Maize1 (21), taking care that the temperature of the water bath did not exceed 70”.
Autoradiography was performed with Kodak No Screen x-ray film; films were developed with Kodak Liquid X-ray Developer and Fixer. Quantitative data were obtained from autoradiograms with a Joyce- Loebl recording microdensitometer. Using very long exposure times (up to 34 days), bands containing less than 100 cpm could be detected.
RESULTS
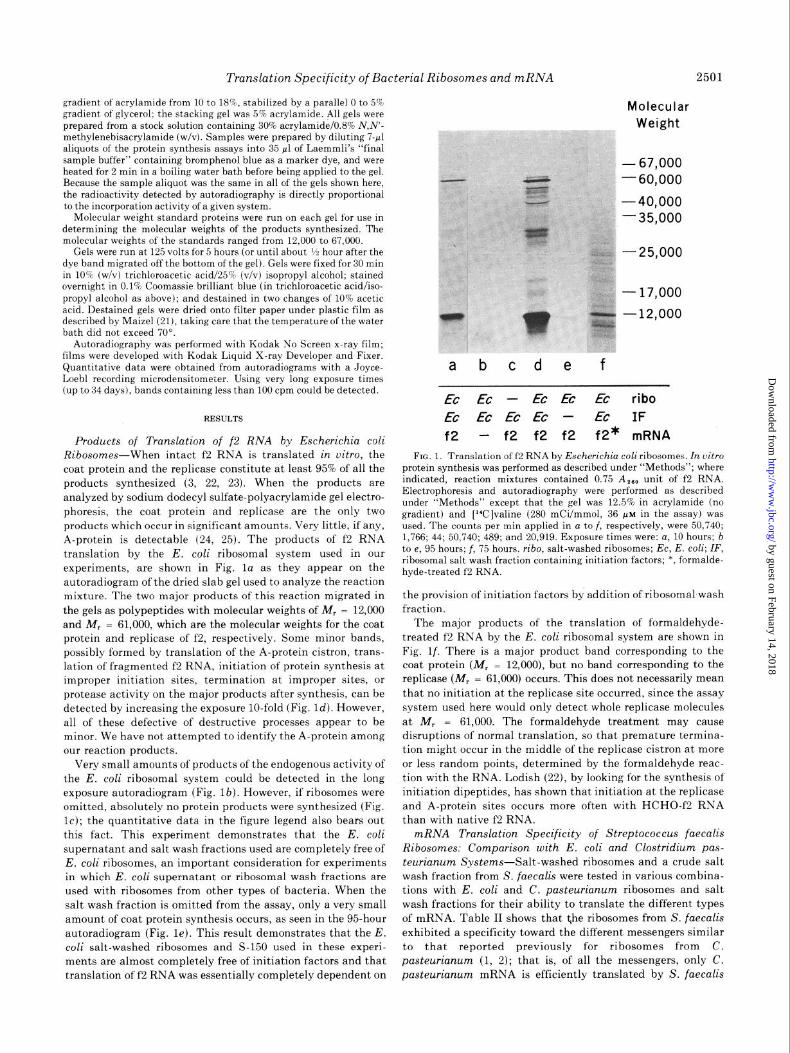
Products of Translation of f2 RNA by Escherichia coli Ribosomes-When intact f2 RNA is translated in uitro, the
coat protein and the replicase constitute at least 95% of all the products synthesized (3, 22, 23). When the products are analyzed by sodium dodecyl sulfate-polyacrylamide gel electro- phoresis, the coat protein and replicase are the only two products which occur in significant amounts. Very little, if any, A-protein is detectable (24, 25). The products of f2 RNA
translation by the E. coli ribosomal system used in our experiments, are shown in Fig. la as they appear on the
autoradiogram of the dried slab gel used to analyze the reaction mixture. The two major products of this reaction migrated in the gels as polypeptides with molecular weights of M, = 12,000 and M, = 61,000, which are the molecular weights for the coat protein and replicase of f2, respectively. Some minor bands, possibly formed by translation of the A-protein cistron, trans- lation of fragmented f2 RNA, initiation of protein synthesis at improper initiation sites, termination at improper sites, or protease activity on the major products after synthesis, can be detected by increasing the exposure lo-fold (Fig. Id). However, all of these defective of destructive processes appear to be minor. We have not attempted to identify the A-protein among our reaction products.
Very small amounts of products of the endogenous activity of the E. coli ribosomal system could be detected in the long exposure autoradiogram (Fig. lb). However, if ribosomes were omitted, absolutely no protein products were synthesized (Fig. lc); the quantitative data in the figure legend also bears out
this fact. This experiment demonstrates that the E. coli supernatant and salt wash fractions used are completely free of E. coli ribosomes, an important consideration for experiments in which E. coli supernatant or ribosomal wash fractions are used with ribosomes from other types of bacteria. When the salt wash fraction is omitted from the assay, only a very small amount of coat protein synthesis occurs, as seen in the 95-hour autoradiogram (Fig. le). This result demonstrates that the E. coli salt-washed ribosomes and S-150 used in these experi- ments are almost completely free of initiation factors and that translation of f2 RNA was essentially completely dependent on
Molecular Weight
- 67,000 - 60,000
- 40,000 - 35,000
-25,000
a bcde f
EC EC - EC EC EC ribo
EC EcEcEc - EC IF f2 - f2 f2 f2 f2* mRNA
FIG. 1. Translation of f’2 RNA by Escherichia coli ribosomes. In uitro protein synthesis was performed as described under “Methods”; where indicated, reaction mixtures contained 0.75 A,,, unit of f2 RNA. Electrophoresis and autoradiography were performed as described under “Methods” except that the gel was 12.5% in acrylamide (no gradient) and [“Clvaline (280 mCi/mmol, 36 FM in the assay) was used. The counts per min applied in a to f, respectively, were 50,740; 1,766; 44; 50,740; 489; and 20,919. Exposure times were: a, 10 hours; b to e, 95 hours; f, 75 hours. ribo, salt-washed ribosomes; EC, E. coli; IF, ribosomal salt wash fraction containing initiation factors; *, formalde- hyde-treated f2 RNA.
the provision of initiation factors by addition of ribosomal,wash fraction.
The major products of the translation of formaldehyde- treated f2 RNA by the E. coli ribosomal system are shown in Fig. lf. There is a major product band corresponding to the coat protein (M, = 12,000), but no band corresponding to the replicase (M, = 61,000) occurs. This does not necessarily mean
that no initiation at the replicase site occurred, since the assay system used here would only detect whole replicase molecules
at M, = 61,000. The formaldehyde treatment may cause disruptions of normal translation, so that premature termina- tion might occur in the middle of the replicase cistron at more
or less random points, determined by the formaldehyde reac- tion with the RNA. Lodish (22), by looking for the synthesis of initiation dipeptides, has shown that initiation at the replicase
and A-protein sites occurs more often with HCHO-f2 RNA than with native f2 RNA.
mRNA Translation Specificity of Streptococcus faecalis Ribosomes: Comparison with E. coli and Clostridium pas- teurianum Systems--Salt-washed ribosomes and a crude salt wash fraction from S. faecalis were tested in various combina- tions with E. coli and C. pasteurianum ribosomes and salt wash fractions for their ability to translate the different types of mRNA. Table II shows that the ribosomes from S. faecalis exhibited a specificity toward the different messengers similar to that reported previously for ribosomes from C. pasteurianum (1, 2); that is, of all the messengers, only C. pasteurianum mRNA is efficiently translated by S. faecalis
by guest on February 14, 2018http://w
ww
.jbc.org/D
ownloaded from
2502 Translation Specificity of Bacterial Ribosomes and mRNA
TABLE II
Translation of natural messenger RNAs by combinations of Escherichia coli, Clostridium pasteurianum, and Streptococcus faecalis ribosomes and salt wash fractions
The assay procedure was that described under “Experimental used were: 11 rn~ for E. coli ribosomes, 15 rn~ for C. pasteurianum Procedure” for use with the slab gel technique. The ribosomes used ribosomes, and 13 mM for S. faecalis ribosomes. Concentrations of salt were E. coli, salt-washed; C. pasteurianum, salt-washed and preincu- wash protein were saturating. The data are presented in counts per min bated; and S. faecalis salt-washed ribosomes. The amounts of mRNA of labeled amino acids incorporated into protein. Because a mixture of used, in A,,, units, were: f2 RNA, 0.8; T4 early mRNA, 2.1; E. coli B” labeled amino acids was used, it is impossible to calculate the exact mRNA, 3.3; C. pasteurianum mRNA, 2.4. The Mgz+ concentrations amounts, in picomoles, of any or all of the amino acids incorporated.
- “C-Amino-acids incorporated Into protein
Salt-washed Rihosomal wash nhosomes fraction Endoeenous
in the presence of
E. coli E. coli 7,824
E. coli C. pasteurianum 4,221 E. coli S. faecalis 6,177
C. pasteurianum E. coli 6,015
C. pasteurianum C. pasteurianum 9,815
C. pasteurianum S. faecalis 8,192
S. faecalis E. coli 3,093 S. faecalis C. pasteurianum 5,333
S. faecalis S. faecalis 3,994
f’2 RNA
135,620
42,395 111,830
6,644
10,386
8,920
3,940 5,537
4,198
T4 earl!. mRSA
cm
73,098
47,106 62.052
7,865
10,538
9,408 4,561
4,864
6,594
ribosomes. The results also agree with the previously stated conclusion (2) that the major translational specificity toward these messengers is determined by the salt-washed ribosomes, not the initiation factors or other components of the salt wash fraction.
The data in Table II were derived from assays which were
performed for analysis of protein products by slab gel electro- phoresis; the amount of radioactivity incorporated into protein was much higher than in the standard assays, which used [3H]valine of low specific radioactivity as the labeled amino acid. Therefore, in these assays it is easier to detect small amounts of protein synthesis in response to the addition of messengers. From these data it appears that the homologous S. fuecalis system gives a small amount of synthesis in response to E. coli mRNA; 5’. fuecalis ribosomes also appear to be slightly stimulated by T4 early mRNA in the presence of E. coli ribosomal wash. C. pasteurianum ribosomes may translate T4 messenger slightly in the presence of salt wash from E. coli or S. fueculis.
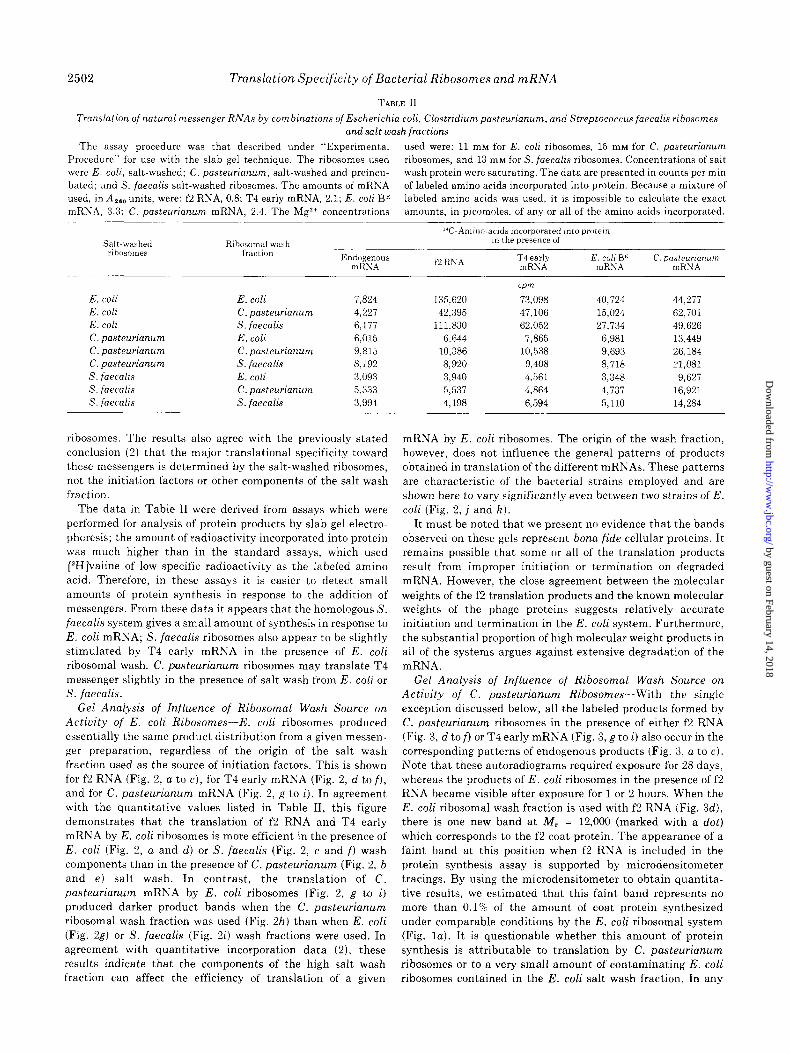
Gel Analysis of Influence of Ribosomal Wash Source on Activity of E. coli Ribosomes-E. coli ribosomes produced essentially the same product distribution from a given messen-
ger preparation, regardless of the origin of the salt wash fraction used as the source of initiation factors. This is shown for f2 RNA (Fig. 2, a to c), for T4 early mRNA (Fig. 2, d to f), and for C. pasteurianum mRNA (Fig. 2, g to i). In agreement with the quantitative values listed in Table II, this figure demonstrates that the translation of f2 RNA and T4 early mRNA by E. coli ribosomes is more efficient in the presence of E. coli (Fig. 2, a and d) or S. fuecalis (Fig. 2, c and f) wash components than in the presence of C. pasteurianum (Fig. 2, b and e) salt wash. In contrast, the translation of C. pusteuriunum mRNA by E. coli ribosomes (Fig. 2, g to i) produced darker product bands when the C. pasteuriunum
ribosomal wash fraction was used (Fig. 2h) than when E. coli (Fig. 2g) or S. fueculis (Fig. 2i) wash fractions were used. In agreement with quantitative incorporation data (2), these results indicate that the components of the high salt wash fraction can affect the efficiency of translation of a given
E. colt BE c. pasteurmnum mRSA mRNA
40,724 44,277
15,024 62,701
27,134 49,626
6,981 13,449
9,693 26,184
8,718 21,081
3,348 9,627
4,737 16,921
5,110 14,284
mRNA by E. coli ribosomes. The origin of the wash fraction, however, does not influence the general patterns of products obtained in translation of the different mRNAs. These patterns are characteristic of the bacterial strains employed and are shown here to vary significantly even between two strains of E.
coli (Fig. 2, j and k). It must be noted that we present no evidence that the bands
observed on these gels represent bona fide cellular proteins. It remains possible that some or all of the translation products result from improper initiation or termination on degraded mRNA. However, the close agreement between the molecular
weights of the f2 translation products and the known molecular weights of the phage proteins suggests relatively accurate initiation and termination in the E. coli system. Furthermore, the substantial proportion of high molecular weight products in all of the systems argues against extensive degradation of the mRNA.
Gel Analysis of Influence of Ribosomal Wash Source on Actiuity of C. pasteurianum Ribosomes-With the single exception discussed below, all the labeled products formed by C. pusteurianum ribosomes in the presence of either f2 RNA (Fig. 3, d to f) or T4 early mRNA (Fig. 3, g to i) also occur in the
corresponding patterns of endogenous products (Fig. 3, a to c). Note that these autoradiograms required exposure for 28 days, whereas the products of E. coli ribosomes in the presence of f2 RNA became visible after exposure for 1 or 2 hours. When the E. coli ribosomal wash fraction is used with f2 RNA (Fig. 3d), there is one new band at M, = 12,000 (marked with a dot) which corresponds to the f2 coat protein. The appearance of a faint band at this position when f2 RNA is included in the protein synthesis assay is supported by microdensitometer tracings. By using the microdensitometer to obtain quantita- tive results, we estimated that this faint band represents no more than 0.1% of the amount of coat protein synthesized
under comparable conditions by the E. coli ribosomal system (Fig. la). It is questionable whether this amount of protein synthesis is attributable to translation by C. pusteurianum ribosomes or to a very small amount of contaminating E. coli ribosomes contained in the E. coli salt wash fraction. In any
by guest on February 14, 2018http://w
ww
.jbc.org/D
ownloaded from
Translation Specificity of Bacterial Ribosomes and mRNA 2503
Molecular Weght
-67,000 -._- a-. -60,000
-." - 25,000
--
- “ c , - 17,000
-.-.- ‘- 12,000
abcdefghijk a bcdefghijkl
E-c Cp sf EC Cp sf Ec Cp Sf EC EC IF t---2---i I---T4+ +Cp----I EC* EC* mRNA
FIG. 2 (left). Influence of different salt wash fraction and mRNAs on Escherichia coli ribosomes. All reaction mixtures contained E. coli ribosomes. Gel electrophoresis and autoradiography were performed as described under “Methods.” Samples a to i consisted of 7-~1 aliquots of the corresponding reaction mixtures described in Table II. Samples j and k were 7-~1 aliquots from similar reaction mixtures incorporating, respectively, 17,381 and 10,506 cpm of “C-amino-acids. The reaction mixtures analyzed in j and k contained, respectively, 3.3 and 1.6 A,,, units of mRNA. Exposure times were: a to c, 7 hours; d to j, 100 hours; g to i, 304 hours; j and k, 73 hours. IF, ribosomal salt wash fraction
case, the figure 0.1% calculated here gives an estimate for the maximum amount of contaminating E. coli ribosomes and subunits in the assay system (from the E. coli S-150 and E. coli ribosomal wash fractions).
When C. pasteurianum ribosomes are used to translate C. pasteurianum mRNA (Fig. 3, j to I), the autoradiogram shows a large number of new product bands which do not appear in the corresponding pattern of products for endogenous activity (Fig. 3, a to c). As with E. coli ribosomes, the pattern of prod- ucts obtained from the translation of C. pasteurianum mRNA by C. pasteurianum ribosomes is relatively invariant with the origin of the ribosomal wash fraction used as source of initia- tion factors. However, a few significant differences in the pattern of products do appear to be caused by the introduction of wash components from other bacterial species.
Gel Analysis of Influence of Different Ribosomal Wash Fractions on Activity of S. faecalis Ribosomes-The transla- tion of the various messengers by S. faecalis ribosomes gives results very similar to those obtained with the clostridial ribosomes (results not shown). No new bands were detected in response to f2 RNA in the systems containing C. pasteurianum or S. faecalis ribosomal wash fraction relative to those formed in the endogenous system without added messenger, but in the presence of E. cob salt wash fraction, two faint bands could be detected at positions M, = 61,000 and 12,000, corresponding to the f2 replicase and coat protein, respectively. The amounts of these proteins are about 0.2 to 0.3% of the amounts formed in the E. coli system. Similarly, one or two very faint bands could be detected in response to the addition of T4 early mRNA to the system containing S. faecalis ribosomes, but the amounts of translation of these messengers were exceedingly small. In contrast, many new proteins were synthesized in the system containing the S. faecalis ribosomes in the presence of C. pasteurianum mRNA with all of the salt wash fractions tested.
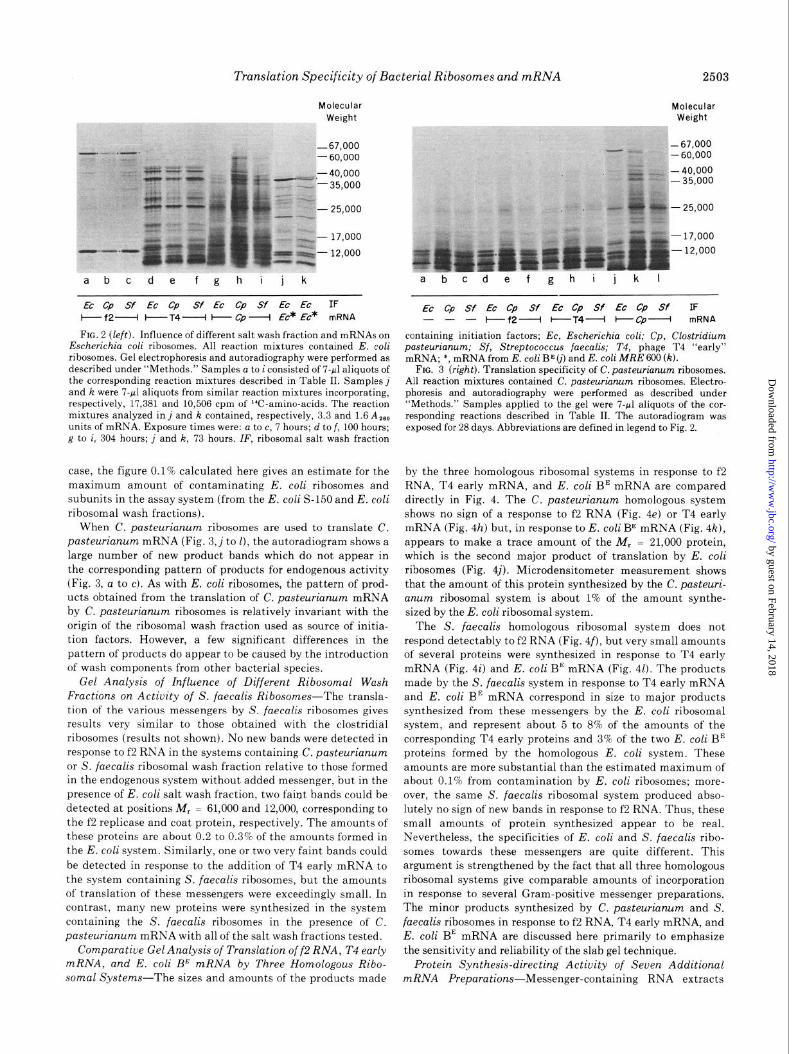
Comparative Gel Analysis of Translation of f2 RNA, T4 early mRNA, and E. coli BE mRNA by Three Homologous Ribo- somal Systems-The sizes and amounts of the products made
Molecular Weight
-67,000 -60,000
EC cp sf EC Cp sf EC Cp Sf EC Cp Sf IF -- - I----f2---I +T4----i +Cp+ mRNA
containing initiation factors; EC, Escherichia coli; Cp, Clostridium pasteurianum; Sf, Streptococcus faecalis; T4, phage T4 “early” mRNA; *, mRNA from E. coli BE (j) and E. coli MRE 600 (k).
FIG. 3 (right). Translation specificity of C. pasteurianum ribosomes. All reaction mixtures contained C. pasteurianum ribosomes. Electro- phoresis and autoradiography were performed as described under “Methods.” Samples applied to the gel were 7-~1 aliquots of the cor- responding reactions described in Table II. The autoradiogram was exposed for 28 days. Abbreviations are defined in legend to Fig. 2.
by the three homologous ribosomal systems in response to f2 RNA, T4 early mRNA, and E. coli BE mRNA are compared directly in Fig. 4. The C. pasteurianum homologous system shows no sign of a response to f2 RNA (Fig. 4e) or T4 early mRNA (Fig. 4h) but, in response to E. coli BE mRNA (Fig. 412), appears to make a trace amount of the M, = 21,000 protein, which is the second major product of translation by E. coli ribosomes (Fig. 4j). Microdensitometer measurement shows that the amount of this protein synthesized by the C. pasteuri- unum ribosomal system is about 1% of the amount synthe- sized by the E. coli ribosomal system.
The S. faecalis homologous ribosomal system does not respond detectably to f2 RNA (Fig. 4f), but very small amounts of several proteins were synthesized in response to T4 early mRNA (Fig. 4i) and E. coli BE mRNA (Fig. 41). The products made by the S. faecalis system in response to T4 early mRNA and E. cob BE mRNA correspond in size to major products synthesized from these messengers by the E. coli ribosomal system, and represent about 5 to 8% of the amounts of the corresponding T4 early proteins and 3% of the two E. cob BE proteins formed by the homologous E. coli system. These amounts are more substantial than the estimated maximum of about 0.1% from contamination by E. coli ribosomes; more- over, the same S. faecalis ribosomal system produced abso- lutely no sign of new bands in response to f2 RNA. Thus, these small amounts of protein synthesized appear to be real. Nevertheless, the specificities of E. cob and S. faecalis ribo- somes towards these messengers are quite different. This argument is strengthened by the fact that all three homologous ribosomal systems give comparable amounts of incorporation in response to several Gram-positive messenger preparations. The minor products synthesized by C. pasteuriunum and S. fuecalis ribosomes in response to f2 RNA, T4 early mRNA, and E. coli BE mRNA are discussed here primarily to emphasize the sensitivity and reliability of the slab gel technique.
Protein Synthesis-directing Activity of Seven Additional mRNA Preparations-Messenger-containing RNA extracts
by guest on February 14, 2018http://w
ww
.jbc.org/D
ownloaded from
2504 Translation Specificity of Bacterial Ribosomes and mRNA
Molecular Weight
-67,000 -60,000 - 40,000 - 35,000
- 25,000
a bcdefghijkl
EC cp Sf EC cp Sf EC cp sf EC cp Sf ribo+IF -- - +f2- --4---I +-EC----~ mRNA
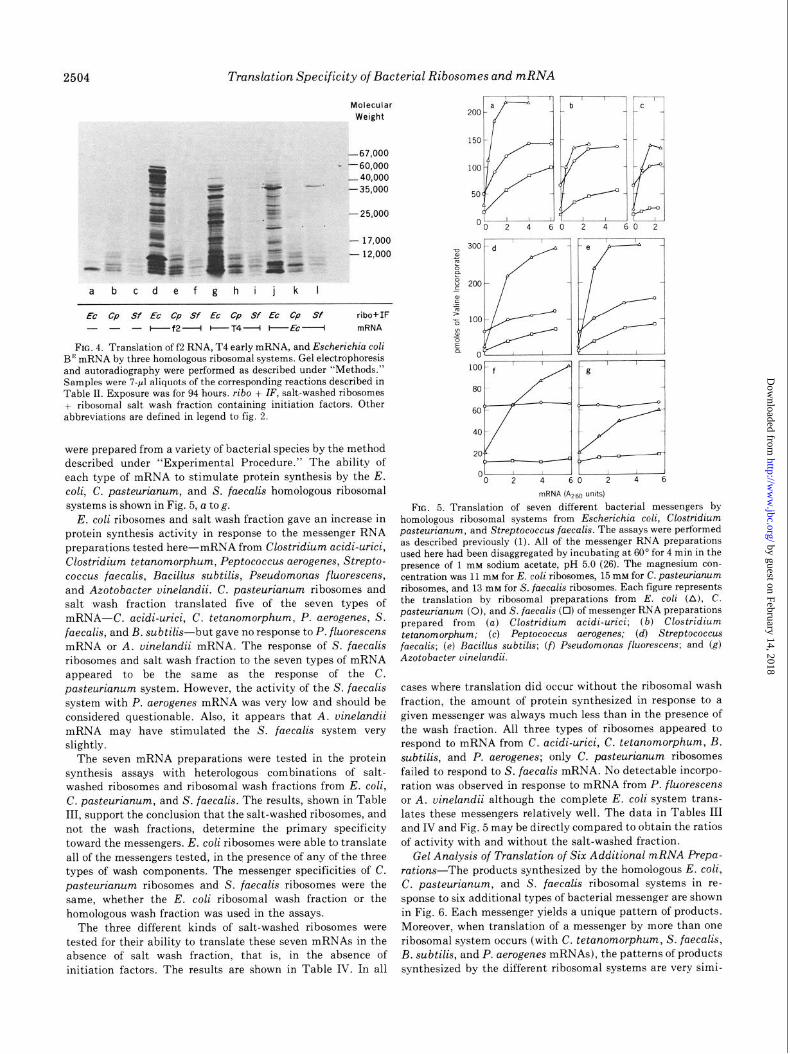
FIG. 4. Translation of f2 RNA, T4 early mRNA, and Escherichia coli BE mRNA by three homologous ribosomal systems. Gel electrophoresis and autoradiography were performed as described under “Methods.” Samples were 7-~1 aliquots of the corresponding reactions described in Table II. Exposure was for 94 hours. ribo + IF, salt-washed ribosomes + ribosomal salt wash fraction containing initiation factors. Other abbreviations are defined in legend to fig. 2.
were prepared from a variety of bacterial species by the method described under “Experimental Procedure.” The ability of each type of mRNA to stimulate protein synthesis by the E. coli, C. pasteurianum, and S. faecalis homologous ribosomal systems is shown in Fig. 5, a tog.
E. coli ribosomes and salt wash fraction gave an increase in protein synthesis activity in response to the messenger RNA preparations tested here-mRNA from Clostridium acidi-urici, Clostridium tetanomorphum, Peptococcus aerogenes, Strepto- coccus faecalis, Bacillus subtilis, Pseudomonas fluorescens, and Azotobacter vinelandii. C. pasteurianum ribosomes and salt wash fraction translated five of the seven types of mRNA-C. acidi-urici, C. tetanomorphum, P. aerogenes, S. faecalis, and B. subtilis-but gave no response to P. fluorescens mRNA or A. uinelandii mRNA. The response of S. faecalis ribosomes and salt wash fraction to the seven types of mRNA appeared to be the same as the response of the C. pasteurianum system. However, the activity of the S. faecalis system with P. aerogenes mRNA was very low and should be considered questionable. Also, it appears that A. vinelandii mRNA may have stimulated the S. fuecalis system very slightly.
The seven mRNA preparations were tested in the protein synthesis assays with heterologous combinations of salt- washed ribosomes and ribosomal wash fractions from E. coli, C. pasteurianum, and S. faecalis. The results, shown in Table III, support the conclusion that the salt-washed ribosomes, and not the wash fractions, determine the primary specificity toward the messengers. E. coli ribosomes were able to translate all of the messengers tested, in the presence of any of the three types of wash components. The messenger specificities of C. pasteurianum ribosomes and S. faecalis ribosomes were the same, whether the E. coli ribosomal wash fraction or the homologous wash fraction was used in the assays.
The three different kinds of salt-washed ribosomes were tested for their ability to translate these seven mRNAs in the absence of salt wash fraction, that is, in the absence of initiation factors. The results are shown in Table IV. In all
‘5---?-db /
4 2 4 6
mRNA (A,,, units)
FIG. 5. Translation of seven different bacterial messengers by homologous ribosomal systems from Escherichia coli, Clostridium pasteurianum, and Streptococcus faecalis. The assays were performed as described previously (1). All of the messenger RNA preparations used here had been disaggregated by incubating at 60” for 4 min in the presence of 1 mM sodium acetate, pH 5.0 (26). The magnesium con- centration was 11 rnhr for E. coli ribosomes, 15 mM for C. pasteurianum ribosomes, and 13 mM for S. faecalis ribosomes. Each figure represents the translation by ribosomal preparations from E. coli (A), C. pasteurianum (0), and S. faecalis (0) of messenger RNA preparations prepared from (a) Clostridium acidi-urici; (b) Clostridium tetanomorphum; (c) Peptococcus aerogenes; (d) Streptococcus faecalis; (e) Bacillus subtilis; (f) Pseudomonas fluorescens; and (g) Azotobacter uinelandii.
cases where translation did occur without the ribosomal wash fraction, the amount of protein synthesized in response to a given messenger was always much less than in the presence of the wash fraction. All three types of ribosomes appeared to respond to mRNA from C. acidi-urici, C. tetanomorphum, B. subtilis, and P. aerogenes; only C. pasteurianum ribosomes failed to respond to S. fuecalis mRNA. No detectable incorpo- ration was observed in response to mRNA from P. fluorescens or A. uinelandii although the complete E. coli system trans- lates these messengers relatively well. The data in Tables III and IV and Fig. 5 may be directly compared to obtain the ratios of activity with and without the salt-washed fraction.
Gel Analysis of Translation of Six Additional mRNA Prepa- rations-The products synthesized by the homologous E. coli, C. pasteurianum, and S. faecalis ribosomal systems in re- sponse to six additional types of bacterial messenger are shown in Fig. 6. Each messenger yields a unique pattern of products. Moreover, when translation of a messenger by more than one ribosomal system occurs (with C. tetanomorphum, S. fuecalis, B. subtilis, and P. aerogenes mRNAs), the patterns of products synthesized by the different ribosomal systems are very simi-
by guest on February 14, 2018http://w
ww
.jbc.org/D
ownloaded from
Translation Specificity of Bacterial Ribosomes and mRNA 2505
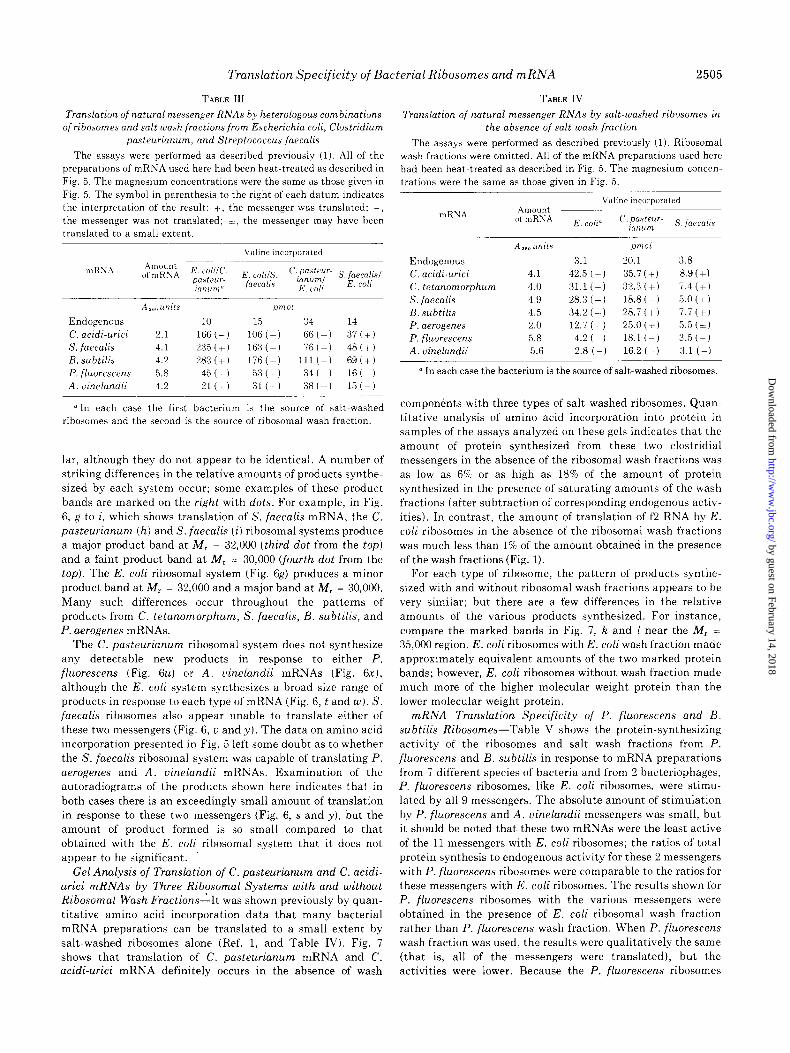
Translation of natural messenger RNAs by heterologous combinations ofribosomes and salt wash fractions from Escherichia coli, Clostridium
pasteurianum, and Streptococcus faecalis
The assays were performed as described previously (1). All of the preparations of mRNA used here had been heat-treated as described in Fig. 5. The magnesium concentrations were the same as those given in Fig. 5. The symbol in parenthesis to the right of each datum indicates the interpretation of the result: t, the messenger was translated; -, the messenger was not translated; *: the messenger may have been translated to a small extent.
TABLE III TABLE IV
Translation of natural messenger RNAs by salt-washed ribosomes in the absence of salt wash fraction
The assays were performed as described previously (1). Ribosomal wash fractions were omitted. All of the mRNA preparations used here had been heat-treated as described in Fig. 5. The magnesium concen- trations were the same as those given in Fig. .5.
mRNA Amount of mRXA
A,,, uruts pm01
Endogenous 10 15 34 14 C. acidi-urici 2.1 166(i) 106 (+) 66(+) 37 (+)
s. faecalis 4.1 235 (+) 163 (+) 76(+) 48(-J B. subtilis 4.2 283 ( + 1 176 (+) ill(+) 69 ( i- 1 P. fluorescens 5.8 45 (-1 <?I3 ( + ) 34 ( -) 1’3~) A. uinelandii 4.2 21 (+I :?I1 (+) 38(--l 15(-J
“In each case the first bacterium is the source of salt-washed ribosomes and the second is the source of ribosomal wash fraction.
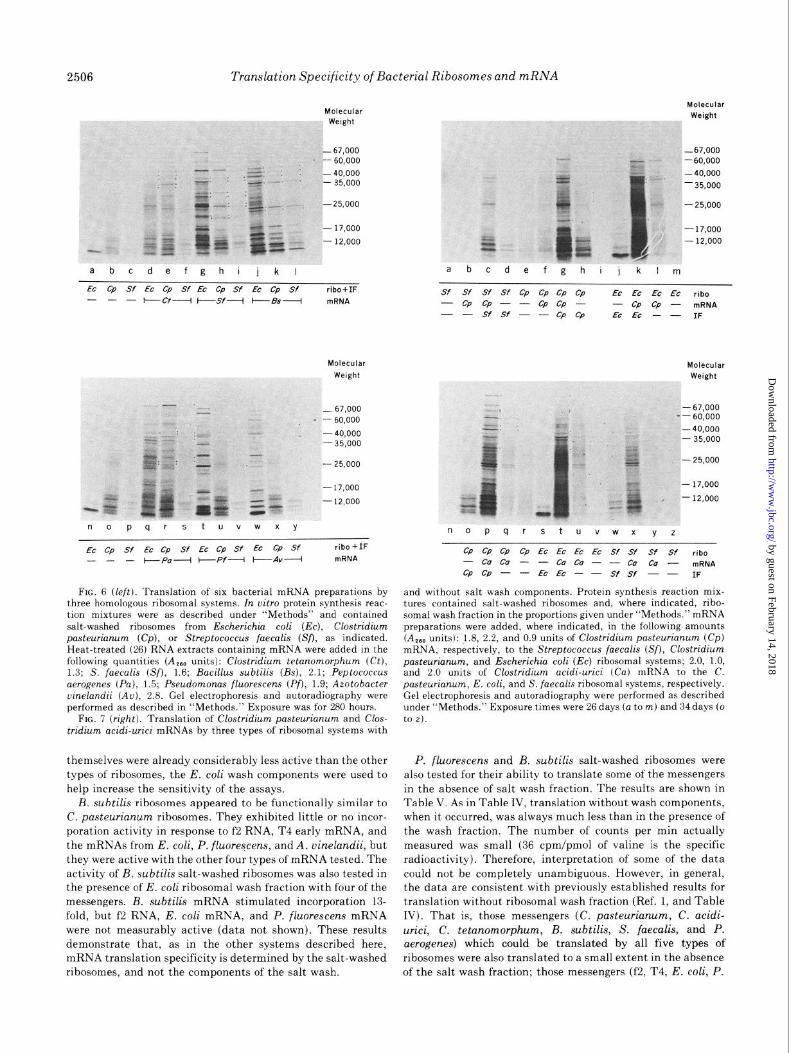
lar, although they do not appear to be identical. A number of striking differences in the relative amounts of products synthe- sized by each system occur; some examples of these product bands are marked on the right with dots. For example, in Fig. 6, g to i, which shows translation of S. faecalis mRNA, the C. pasteurianum (h) and S. fuecalis (i) ribosomal systems produce
a major product band at M, = 32,000 (third dot from the top) and a faint product band at M, = 30,000 (fourth dot from the top). The E. coli ribosomal system (Fig. 6g) produces a minor product band at M, = 32,000 and a major band at M, = 30,000. Many such differences occur throughout the patterns of products from C. tetanomorphum, S. fueculis, B. subtilis, and P. uerogenes mRNAs.
The C. pusteurianam ribosomal system does not synthesize any detectable new products in response to either P. fluorescens (Fig. 6~) or A. oinelundii mRNAs (Fig. 6x), although the E. coli system synthesizes a broad size range of products in response to each type of mRNA (Fig. 6, t and w). S. fueculis ribosomes also appear unable to translate either of
these two messengers (Fig. 6, u and y). The data on amino acid incorporation presented in Fig. 5 left some doubt as to whether the 5’. faeculis ribosomal system was capable of translating P. aerogenes and A. uinelundii mRNAs. Examination of the autoradiograms of the products shown here indicates that in both cases there is an exceedingly small amount of translation in response to these two messengers (Fig. 6, s and y), but the amount of product formed is so small compared to that obtained with the E. coli ribosomal system that it does not appear to be significant.
Gel Analysis of Translation of C. pusteuriunum and C. acidi- urici mRNAs by Three Ribosomul Systems with and without Ribosomal Wash Fractions-It was shown previously by quan- titative amino acid incorporation data that many bacterial mRNA preparations can be translated to a small extent by salt-washed ribosomes alone (Ref. 1, and Table IV). Fig. 7 shows that translation of C. pusteuriunum mRNA and C. acidi-urici mRNA definitely occurs in the absence of wash
Endogenous C. acidi-urici
C. tetanomorphum S. faecalis
B. subtilis
P. aerogenes P. fluorescens
A. uinelandii
4.1
4.0
4.9
4.5 2.0
5.8
5.6
3.1
42.5 (t) 31.1(i)
28.3(+) 34.2 (+)
12.7 (+)
4.2 (-1
2.8 (-1
pm01
20.1
35.7 (+)
32.3 (+)
18.8(G) 28.7 (+)
25.0 (r)
18.1 (-)
16.2 (-)
3.8
8.9(+)
7.4 (+I
3.0 (+)
7.1 (+I 5.5 (i)
3.5(-)
3.1 (-)
“In each case the bacterium is the source of salt-washed ribosomes.
components with three types of salt--washed ribosomes. Quan- titative analysis of amino acid incorporation into protein in samples of the assays analyzed on these gels indicates that the amount of protein synthesized from these two clostridial messengers in the absence of the ribosomal wash fractions was as low as 6% or as high as 18% of the amount of protein synthesized in the presence of saturating amounts of the wash fractions (after subtraction of corresponding endogenous activ-
ities). In contrast, the amount of translation of f2 RNA by E. coli ribosomes in the absence of the ribosomal wash fractions
was much less than 1% of the amount obtained in the presence of the wash fractions (Fig. 1).
For each type of ribosome, the pattern of products synthe- sized with and without ribosomal wash fractions appears to be very similar; but there are a few differences in the relative amounts of the various products synthesized. For instance, compare the marked bands in Fig. 7, k and 1 near the M, = 35,000 region. E. coli ribosomes with E. coli wash fraction made approximately equivalent amounts of the two marked protein bands; however, E. coli ribosomes without wash fraction made much more of the higher molecular weight protein than the lower molecular weight protein.
mRNA Translation Specificity of P. fluorescens and B.
subtilis Ribosomes-Table V shows the protein-synthesizing activity of the ribosomes and salt wash fractions from P. fluorescens and B. subtilis in response to mRNA preparations from 7 different species of bacteria and from 2 bacteriophages, P. fluorescens ribosomes, like E. coli ribosomes, were stimu- lated by all 9 messengers. The absolute amount of stimulation by P. fluorescens and A. uinelundii messengers was small, but it should be noted that these two mRNAs were the least active
of the 11 messengers with E. coli ribosomes; the ratios of total protein synthesis to endogenous activity for these 2 messengers with P. fluorescens ribosomes were comparable to the ratios for these messengers with E. coli ribosomes. The results shown for P. fluorescens ribosomes with the various messengers were obtained in the presence of E. coli ribosomal wash fraction rather than P. fluorescens wash fraction. When P. fluorescens wash fraction was used, the results were qualitatively the same (that is, all of the messengers were translated), but the activities were lower. Because the P. fluorescens ribosomes
by guest on February 14, 2018http://w
ww
.jbc.org/D
ownloaded from
2506 Translation Specificity of Bacterial Ribosomes and mRNA
MOleCUlar Weight
-67,000 - 60,000 -40,000 - 35,000
-25,000
- 17,000
- 12,000
a b c defghi jkl
EC CP Sf EC CP Sf EC CP Sf EC CP Sf ribo+IF - - - t--ct* t--Sf---l +&?---4 mRNA
MOkCUl.31
Weight
_ 67,000 - 60,000
-40,000 -35,000
-25,000
-17,000
-12,000
n 0 p q r s t u ” w x y
EC Cp Sf EC CP Sf EC CP Sf EC CP Sf ribo +IF
--- +Po----i ePf--l +?4v---+ mRNA
FIG. 6 (left). Translation of six bacterial mRNA preparations by three homologous ribosomal systems. In vitro protein synthesis reac- tion mixtures were as described under “Methods” and contained salt-washed ribosomes from Escherichio coli (EC), Clostridium pasteurianum (Cp), or Streptococcus faecalis (Sfl, as indicated. Heat-treated (26) RNA extracts containing mRNA were added in the following quantities (A,., units): Clostridium tetanomorphum (Ct), 1.3; S. foe&is (Sf), 1.6; Bacillus subtilis (Bs), 2.1; Peptococcus aerogenes (Pa), 1.5; Pseudomonas fluorescens (Pf), 1.9; Azotobacter uinelandii (Au), 2.8. Gel electrophoresis and autoradiography were performed as described in “Methods.” Exposure was for 280 hours.
FIG. 7 (right). Translation of Clostridium pasteurianum and Clos- tridium acidi-urici mRNAs by three types of ribosomal systems with
themselves were already considerably less active than the other types of ribosomes, the E. coli wash components were used to help increase the sensitivity of the assays.
B. suhtilis rihosomes appeared to be functionally similar to
C. pasteurianum ribosomes. They exhibited little or no incor- poration activity in response to f2 RNA, T4 early mRNA, and the mRNAs from E. coli, P. fluoregcens, and A. uinelandii, hut they were active with the other four types of mRNA tested. The activity of B. subtilis salt-washed ribosomes was also tested in the presence of E. coli rihosomal wash fraction with four of the messengers. B. subtilis mRNA stimulated incorporation 13- fold, hut f2 RNA, E. coli mRNA, and P. fluorescens mRNA were not measurably active (data not shown). These results demonstrate that, as in the other systems described here, mRNA translation specificity is determined by the salt-washed ribosomes, and not the components of the salt wash.
Weight
-67,000 - -60,000
_II_ -40,000 -35,000
-25,000
-17,000 - 12,000
a bcdefghijkim
Sf Sf Sf Sf cp cp cp cp EC EC EC EC ribo - cp cp - - cp cp - - cp cp - mRNA - - Sf Sf - - cp cp EC EC - - IF
Weight
-
_.-
-67,000 67,000 --60,000 60,000
-40,000 -40,000 - 35,000 - 35,000
. i. . d a+- a+- - F-- -25,000 25,000
-17,000
-12,000
nopqrstuvwxyz
CP CP CP CP EC EC EC EC Sf Sf Sf Sf ribo - co co - - co co - - co co - mRNA CP CP - - EC EC - - Sf Sf - - IF
and without salt wash components. Protein synthesis reaction mix- tures contained salt-washed ribosomes and, where indicated, ribo- somal wash fraction in the proportions given under “Methods.” mRNA preparations were added, where indicated, in the following amounts (A,,, units): 1.8, 2.2, and 0.9 units of Clostridium pasteurianum (Cp) mRNA, respectively, to the Streptococcus faecalis (Sf), Clostridium pasteurianum, and Escherichiu coli (EC) ribosomal systems; 2.0, 1.0, and 2.0 units of Clostridium acidi-urici (Ca) mRNA to the C. pasteurianum, E. coli, and S. faecalis ribosomal systems, respectively. Gel electrophoresis and autoradiography were performed as described under “Methods.” Exposure times were 26 days (a to m) and 34 days (o to 2).
P. fluorescens and B. subtilis salt-washed rihosomes were also tested for their ability to translate some of the messengers in the absence of salt wash fraction. The results are shown in Table V. As in Table IV, translation without wash components, when it occurred, was always much less than in the presence of the wash fraction. The number of counts per min actually measured was small (36 cpm/pmol of valine is the specific radioactivity). Therefore, interpretation of some of the data could not be completely unambiguous. However, in general, the data are consistent with previously established results for translation without rihosomal wash fraction (Ref. 1, and Table IV). That is, those messengers (C. pasteurianum, C. acidi- urici, C. tetanomorphum, B. subtilis, S. faecalis, and P. aerogenes) which could be translated by all five types of rihosomes were also translated to a small extent in the absence of the salt wash fraction; those messengers (f2, T4, E. coli, P.
by guest on February 14, 2018http://w
ww
.jbc.org/D
ownloaded from
Translation Specificity of Bacterial Ribosomes and mRNA 2507
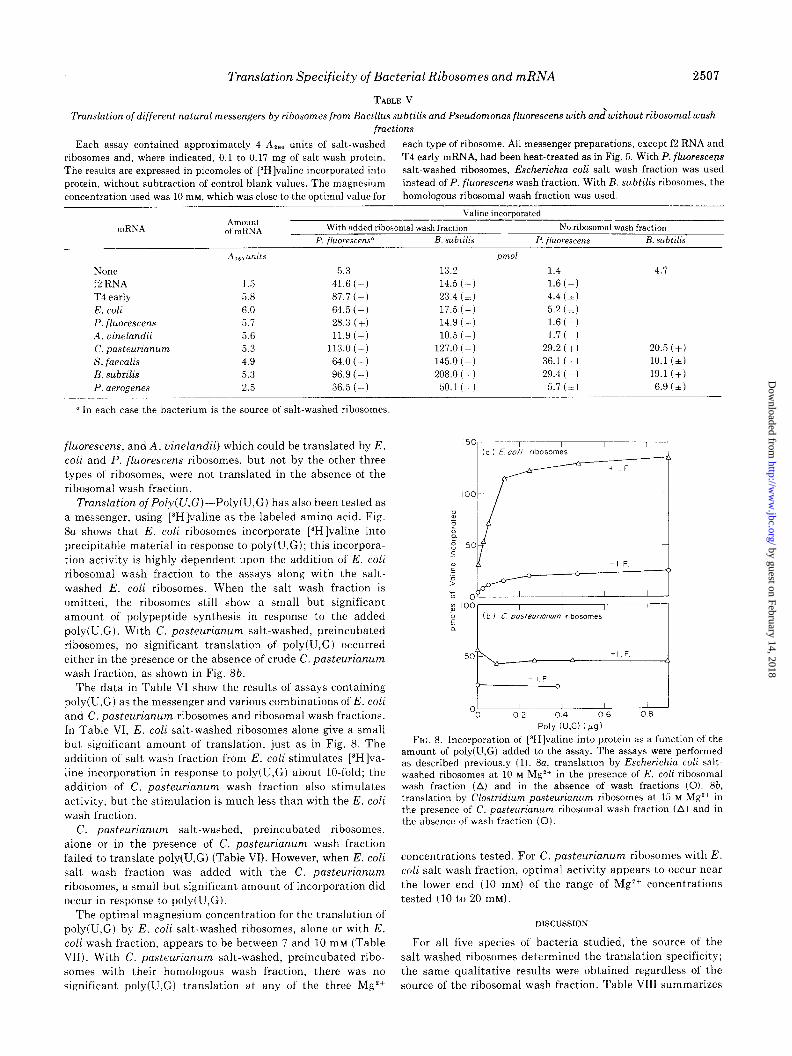
TABLE V
Translation of different natural messengers by ribosomss from Bacillus subtilis and Pseudomonas fluorescens with andwithout ribosomal wash fractions
Each assay contained approximately 4 A,,, units of salt-washed each type of ribosome. All messenger preparations, except f2 RNA and
ribosomes and, where indicated, 0.1 to 0.17 mg of salt wash protein. T4 early mRNA, had been heat-treated as in Fig. 5. With P. fluorescevs The results are expressed in picomoles of [3H]valine incorporated into salt-washed ribosomes, Escherichia coli salt wash fraction was used
protein, without subtraction of control blank values. The magnesium instead of P. fluorescens wash fraction. With B. subtilis ribosomes, the
concentration used was 10 mrq which was close to the optimal value for homologous ribosomal wash fraction was used.
Valine incorporated
mRKA Amount
of mRNA With added ribosomal wash f’raction No ribosomal wash fraction P. fluorescens” B. subtilis P. fluorescens B. subtilis
A,., unrts
None 5.3 f2 RNA 1.5 41.6 (+) T4 early 5.8 87.7 (+) E. coli 6.0 64.5 t+) P. fluorescens 5.1 28.3 (+I A, uinelandii 5.6 11.9 (+) C. pasteurianum 5.3 113.0 (+) S. faecalis 4.9 64.0 (+) B. subtilis 5.3 96.9 (+I P. aerogenes 2.5 36.5 (+)
a In each case the bacterium is the source of salt-washed ribosomes.
fluorescens, and A. uinelandii) which could be translated by E. coli and P. fluorescens ribosomes, but not by the other three types of ribosomes, were not translated in the absence of the ribosomal wash fraction.
Translation ofPoly(u,C)--Poly(U,G) has also been tested as a messenger, using [3H]valine as the labeled amino acid. Fig. 8a shows that E. coli ribosomes incorporate [3H]valine into precipitable material in response to poly(U,G); this incorpora- tion activity is highly dependent upon the addition of E. coli ribosomal wash fraction to the assays along with the salt- washed E. coli ribosomes. When the salt wash fraction is omitted, the ribosomes still show a small but significant amount of polypeptide synthesis in response to the added poly(U,G). With C. pusteurianum salt-washed, preincubated ribosomes, no significant translation of poly(U,G) occurred either in the presence or the absence of crude C. pasteuriunum wash fraction, as shown in Fig. 8b.
The data in Table VI show the results of assays containing poly(U,G) as the messenger and various combinations of E. coli and C. pasteurianum ribosomes and ribosomal wash fractions. In Table VI, E. coli salt-washed ribosomes alone give a small but significant amount of translation, just as in Fig. 8. The addition of salt wash fraction from E. coli stimulates [3H]va- line incorporation in response to poly(U,G) about lo-fold; the addition of C. pusteuriunum wash fraction also stimulates activity, but the stimulation is much less than with the E. coli wash fraction.
C. pusteuriunum salt-washed, preincubated ribosomes, alone or in the presence of C. pusteuriunum wash fraction failed to translate poly(U,G) (Table VI). However, when E. coli salt wash fraction was added with the C. pusteuriunum ribosomes, a small but significant amount of incorporation did occur in response to poly(U,G).
The optimal magnesium concentration for the translation of poly(U,G) by E. coli salt-washed ribosomes, alone or with E. coli wash fraction, appears to be between 7 and 10 ITIM (Table VII). With C. pusteuriunum salt-washed, preincubated ribo- somes with their homologous wash fraction, there was no
significant poly(U,G) translation at any of the three Mg*’
13.2
14.5 ( -) 23.4 (+)
17.5(-j 14.9 (-)
10.5 (-1
127.0 (+)
145.0 (+)
208.0 (+) 50.1(+)
pI?d
1.4 4.7
1.6 (-1 4.4 (+)
5.2 (i) IX-)
1.7 (-)
29.2 (+) 20.5 (+) 36.1 (+) lO.l(*)
29.4 i+) 19.1 (+) 5.1(h) 6.9 (+)
150- (a I E CO/I ribosomk
-I F 0
/ 50 - +,.F
-IF 0 0
0 / / 0 02 0.4 06- OS
Poly (U,G) (pg)
FIG. 8. Incorporation of [3H]valine into protein as a function of the amount of poly(U,G) added to the assay. The assays were performed as described previously (1). 8a, translation by Escherichia coli salt-
washed ribosomes at 10 M Mg2+ in the presence of E. coli ribosomal wash fraction (A) and in the absence of wash fractions (0). 8b, translation by Clostridium pasteurianum ribosomes at 15 M Mg’+ in the presence of C. pasteurianum ribosomal wash fraction (A) and in the absence of wash fraction (0).
concentrations tested. For C. pusteuriunum ribosomes with E. coli salt wash fraction, optimal activity appears to occur near the lower end (10 InM) of the range of Mg*+ concentrations tested (10 to 20 mM).
DISCUSSION
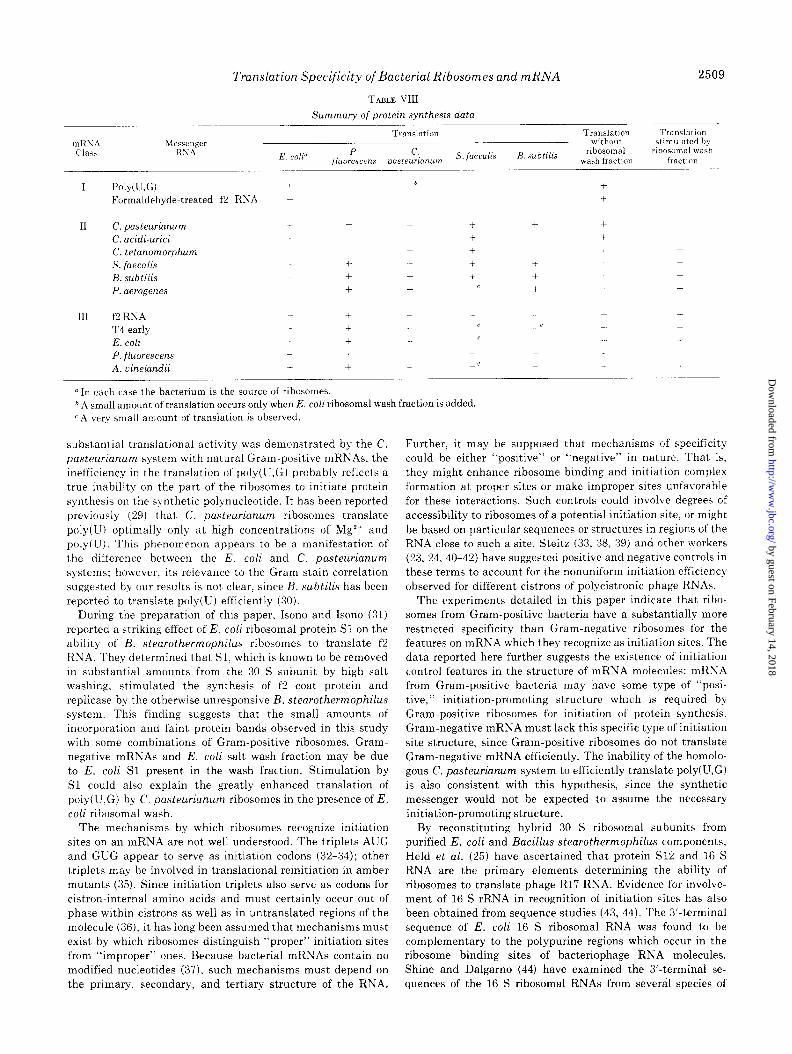
For all five species of bacteria studied, the source of the salt-washed ribosomes determined the translation specificity; the same qualitative results were obtained regardless of the source of the ribosomal wash fraction. Table VIII summarizes
by guest on February 14, 2018http://w
ww
.jbc.org/D
ownloaded from
2508 Translation Specificity of Bacterial Ribosomes and mRNA
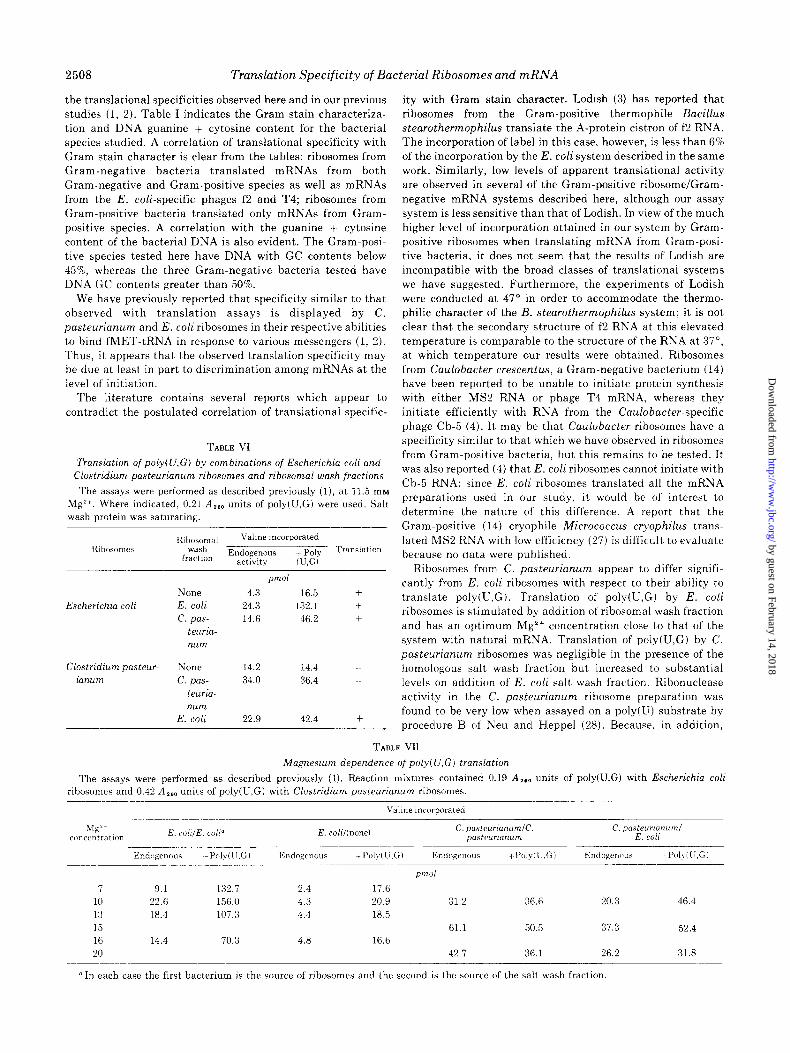
the translational specificities observed here and in our previous studies (1, 2). Table I indicates the Gram stain characteriza- tion and DNA guanine + cytosine content for the bacterial species studied. A correlation of translational specificity with
Gram stain character is clear from the tables: ribosomes from Gram-negative bacteria translated mRNAs from both Gram-negative and Gram-positive species as well as mRNAs from the E. co&specific phages f2 and T4; ribosomes from Gram-positive bacteria translated only mRNAs from Gram- positive species. A correlation with the guanine + cytosine content of the bacterial DNA is also evident. The Gram-posi- tive species tested here have DNA with GC contents below 45%, whereas the three Gram-negative bacteria tested have DNA GC contents greater than 50%.
We have previously reported that specificity similar to that
observed with translation assays is displayed by C. pasteurianum and E. coli ribosomes in their respective abilities to bind fMET-tRNA in response to various messengers (I, 2). Thus, it appears that the observed translation specificity may be due at least in part to discrimination among mRNAs at the
level of initiation. The literature contains several reports which appear to
contradict the postulated correlation of translational specific-
TABLE VI
Translation of poly(U,G) by combinations of Escherichia coli and Clostridium pasteurianum ribosomes and ribosomal wash fractions
The assays were performed as described previously (I), at 11.5 rn~ Mg”. Where indicated, 0.21 A,,, units of poly(U,G) were used. Salt wash protein was saturating.
Hihosomal Valine incorporated wash
fraction Endogenous + Poly Translation
activity (U,G)
Escherichia coli
pITI
None 4.3 16.5 +
E. coli 24.3 132.1 -t
c. pas- 14.6 46.2 T
teuria- num
Clostridium pasteur- None 14.2 14.4
ianum c. pas- 34.0 36.4
teuriu- num
E. coli 22.9 42.4 -t
ity with Gram stain character. Lodish (3) has reported that ribosomes from the Gram-positive thermophile Bacillus stearothermophilus translate the A-protein cistron of f2 RNA. The incorporation of label in this case, however, is less than 6% of the incorporation by the E. coli system described in the same work. Similarly, low levels of apparent translational activity are observed in several of the Gram-positive ribosome/Gram- negative mRNA systems described here, although our assay
system is less sensitive than that of Lodish. In view of the much higher level of incorporation attained in our system by Gram- positive ribosomes when translating mRNA from Gram-posi- tive bacteria, it does not seem that the results of Lodish are incompatible with the broad classes of translational systems we have suggested. Furthermore, the experiments of Lodish were conducted at 47” in order to accommodate the thermo- philic character of the B. stearothermophilus system; it is not clear that the secondary structure of f2 RNA at this elevated temperature is comparable to the structure of the RNA at 37”: at which temperature our results were obtained. Ribosomes from Caulobacter crescentus, a Gram-negative bacterium (14)
have been reported to be unable to initiate protein synthesis with either MS2 RNA or phage T4 mRNA, whereas they initiate efficiently with RNA from the Caulobucter-specific phage Cb-5 (4). It may be that Cuulobucter ribosomes have a specificity similar to that which we have observed in ribosomes from Gram-positive bacteria, but this remains to be tested. It was also reported (4) that E. coli ribosomes cannot initiate with Cb-5 RNA; since E. coli ribosomes translated all the mRNA preparations used in our study, it would be of interest to determine the nature of this difference. A report that the
Gram-positive (14) cryophile Micrococcus cryophilus trans- lated MS2 RNA with low efficiency (27) is difficult to evaluate because no data were published.
Ribosomes from C. pasteuriunum appear to differ signifi- cantly from E. coli ribosomes with respect to their ability to translate poly(U,G). Translation of poly(U,G) by E. coli ribosomes is stimulated by addition of ribosomal wash fraction and has an optimum Mg2+ concentration close to that of the system with natural mRNA. Translation of poiy(U,G) by C. pasteuriunum ribosomes was negligible in the presence of the homologous salt wash fraction but increased to substantial
levels on addition of E. coli salt wash fraction. Ribonuclease activity in the C. pasteuriunum ribosome preparation was found to be very low when assayed on a poly(U) substrate by procedure B of Neu and Heppel (28). Because, in addition,
TABLE V11
Magnesium dependence of poly(U,G) translation
The assays were performed as described previously (1). Reaction mixtures contained 0.19 A 160 units of poly(U.G) with Escherichia coli nbosomes and 0.42 A,,, units of poly(U,G) with Clostridium pasteurianum ribosomes.
Valine incorporated
pl7ld
7 9.1 132.7 2.4 17.6 10 22.6 156.0 4.3 20.9 31.2 36.6 20.3 46.4
13 18.4 107.3 4.4 18.5
I 5 61.1 50.5 37.3 52.4 16 14.4 70.3 4.8 16.6 20 42.7 36.1 26.2 31.8
n In each case the first bacterium is the source of ribosomes and the second is the source of the salt wash fraction
by guest on February 14, 2018http://w
ww
.jbc.org/D
ownloaded from
Translation Specificity of Bacterial Ribosomes and mRNA 2509
mRSA Chhi
TABLE VIII
Summary of protein synthesis data
Translation Translation Translation without stimulated by
E. colP P. c.
jluorescens pasteurianum s. faecalis H. subtilis rhosomal r~bosomal wash
wash fraction fractim
I Poly(U,G) i -0 + + Formaldehyde-treated f2 RNA + -+ +
I1 C. pasteurianum -t + + -1 + t +
C. acidi-urici + + + + t C. tetanomorphum + t + + + S. faecalis + i- + + t + -c B. subtilis + t + + + + + P. aerogenes t + + -c i + +
III f’2 RNA + + - + T4 early 4 + -c -c +
E. coli t -t .- - + P. fluorescens + + +
A. vinelandii + -t -c +
u In each case the bacterium is the source of ribosomes. b A small amount of translation occurs only when E. coli rihosomal wash fraction is added. c A very small amount of translation is observed.
substantial translational activity was demonstrated by the C. pasteurianum system with natural Gram-positive mRNAs, the inefficiency in the translation of poly(U,G) probably reflects a true inability on the part of the ribosomes to initiate protein synthesis on the synthetic polynucleotide. It has been reported previously (29) that C. pasteurianum ribosomes translate
poly(U) optimally only at high concentrations of Mg*+ and poly(U). This phenomenon appears to be a manifestation of the difference between the E. coli and C. pasteuriunum systems; however, its relevance to the Gram stain correlation suggested by our results is not clear, since B. subtilis has been reported to translate poly(U) efficiently (30).
During the preparation of this paper, Isono and Isono (31) reported a striking effect of E. coli ribosomal protein Sl on the ability of B. stearothermophilus ribosomes to translate f2 RNA. They determined that Sl, which is known to be removed in substantial amounts from the 30 S subunit by high salt washing, stimulated the synthesis of f2 coat protein and replicase by the otherwise unresponsive B. steurothermophilus system. This finding suggests that the small amounts of incorporation and faint protein bands observed in this study with some combinations of Gram-positive ribosomes, Gram- negative mRNAs and E. coli salt wash fraction may be due t,o E. coli S1 present in the wash fraction. Stimulation by
Sl could also explain the greatly enhanced translation of poly(U,G) by C. pasteurianum ribosomes in the presence of E. coli ribosomal wash.
The mechanisms by which ribosomes recognize initiation sites on an mRNA are not well understood. The triplets AUG and GUG appear to serve as initiation codons (32-34); other triplets may be involved in translational reinitiation in amber mutants (35). Since initiation triplets also serve as codons for cistron-internal amino acids and must certainly occur out of phase within cistrons as well as in untranslated regions of the molecule (36), it has long been assumed that mechanisms must exist by which ribosomes distinguish “proper” initiation sites
from “improper” ones. Because bacterial mRNAs contain no modified nucleotides (37), such mechanisms must depend on the primary, secondary, and tertiary structure of the RNA.
Further, it may be supposed that mechanisms of specificity could be either “positive” or “negative” in nature. That is, they might enhance ribosome binding and initiation complex formation at proper sites or make improper sites unfavorable for these interactions. Such controls could involve degrees of
accessibility to ribosomes of a potential initiation site, or might be based on particular sequences or structures in regions of the RNA close to such a site. Steitz (33, 38, 39) and other workers (23, 24, 40-42) have suggested positive and negative controls in these terms to account for the nonuniform initiation efficiency observed for different cistrons of polycistronic phage RNAs.
The experiments detailed in this paper indicate that ribo- somes from Gram-positive bacteria have a substantially more restricted specificity than Gram-negative ribosomes for the features on mRNA which they recognize as initiation sites. The data reported here further suggests the existence of initiation control features in the structure of mRNA molecules: mRNA from Gram-positive bacteria may have some type of “posi-
tive,” initiation-promoting structure which is required by Gram-positive ribosomes for initiation of protein synthesis.
Gram-negative mRNA must lack this specific type of initiation site structure, since Gram-positive ribosomes do not translate Gram-negative mRNA efficiently. The inability of the homolo- gous C. pasteuriunum system to efficiently translate poly(U,G) is also consistent with this hypothesis, since the synthetic messenger would not be expected to assume the necessary initiation-promoting structure.
By reconstituting hybrid 30 S ribosomal subunits from
purified E. coli and Bacillus stearothermophilus components, Held et al. (25) have ascertained that protein S12 and 16 S RNA are the primary elements determining the ability of ribosomes to translate phage RI7 RNA. Evidence for involve- ment of 16 S rRNA in recognition of initiation sites has also been obtained from sequence studies (43, 44). The 3’-terminal sequence of E. coli 16 S ribosomal RNA was found to be complementary to the polypurine regions which occur in the ribosome binding sites of bacteriophage RNA molecules. Shine and Dalgarno (44) have examined the X,-terminal se- quences of the 16 S ribosomal RNAs from several species of
by guest on February 14, 2018http://w
ww
.jbc.org/D
ownloaded from
2510 Translation Specificity of Bacterial Ribosomes and mRNA
bacteria. They found that for each bacterial species the degree of complementarity between the 16 S ribosomal RNA 3’- terminal sequence and the polypurine sequence in the phage- RNA ribosome binding site correlates well with the ability of the ribosomes to translate the phage-RNA cistrons. Ribosomal protein Sl has recently been shown to be required for initia- tion complex formation with MS2 RNA (45). With the report
by Isono and Isono (31) that addition of E. coli Sl to a B. stearothermophilus system facilitates the translation of f2 RNA, it seems probable that Sl also plays a role in the recognition of initiation sites on mRNA.
The differences demonstrated in this paper between the ribosomes and mRNAs of Gram-positive and Gram-negative bacteria appear to be manifestations of the broad evolutionary
gap between these two groups. The concepts of ribosome specificity and initiation site recognition discussed here, how- ever, could also be utilized in a single cell as controls at the translational level of gene expression.
REFERENCES
1. Stallcup, M. R., and Rabinowitz, J. C. (1973) J. Biol. Chem. 248, 3209-3215
2. Stallcup, M. R., and Rabinowitz, J. C. (1973) J. Biol. Chem. 248, 3216-3219
3. Lodish. H. F. (1970) Nature 226, 705-707 4. Leffler, S., and Szer, W. (1974) j. Biol. Chem. 249, 1458-1464 5. Lepault-Demare, L.. and Chambliss. G. H. (1974) J. Bacterial.
i20, 1300-1307 6. Stallcuo, M. R.. Sharrock, W. J.. and Rabinowitz, J. C. (1974)
Bio&em. Biophys. Res. Comnun. 58, 92-98 7. Bolle, A., Epstein, R. H., Salser, W., and Geiduschek, E. P. (1968)
J. Mol. Biol. 31, 325-348 8, Newton. J. W., Wilson. I’. W., and Burris, R. H. (1953) J. Biol.
Chem. 204, 445-451 9. Rabinowitz, J. C. (1963) Methods Enzymol. 6,703-713
10. Barker, H. A., Smyth, R. D., Wilson, R. M., and Weissbach, H. (1959) J. Biol. Chem. 234, 320-328
11. Samuel, C. E., Murray, C. L., and Rabinowitz, J. C. (1972) J. Biol. Chem. 247, 6856-6865
12 D&o Manual, (1953) Ed. 9, pp. 203-204, Difco Laboratories, Detroit
13. Yoch, D. C. (1975) Arch. Biochem. Biophys. 170, 326-333 14. Buchanan, R. E., and Gibbons, N. E. (eds) (1974) Bergey’s
Manual of Determinatioe Bacteriology, Ed. 8, Williams and
15.
16. 17. 18.
19. 20. 21. 22. 23. 24. 25.
26.
27.
28.
29.
30.
31. 32.
33. 34. 35.
36.
37. 38. 39. 40.
41.
42.
43. 44. 45.
Wilkins Co., Baltimore Stanier, R. Y., Doudoroff, M., ‘and Adelherg, E. A. (1970) The
Microbial World, Ed. 3, pp~ 523-685, Prentice-Hall, Inc. Engle- wood Cliffs, N. J.
Hill, L. R. (1966) J. Gen. Microbial. 44, 419-437 Curtis, W., and Ordal, E. J. (1954) J. Bacterial. 68, 351-361 Ohta, T., Sarkar, S., snd Thach, R. E. (1967) Proc. N&l. Acad.
Sci. ill. S.A. 58, 1638-1644 Studier, F. W. (1973) J. Mol. Biol. 79, 237-248 Laemmli, U. K. (1970) Nature 227,680-685 Maizel, J. V., Jr. (1971) Methods Viral. 5, 218-220 Lodish, H. F. (1970) J. Mol. Biol. 50, 689-702 Lodish, H. F. (1971) J. Mol. Biol. 56, 627-632 Lodish, H., and Robertson, H. (1969) J. Mol. Biol. 45, 9-22 Held, W. A., Gette, W. R., and Nomura, M. (1974) Biochemistry,
13, 2115-2122 Gesteland, R. F., and Salser, W. (1969) Genetics 61, Suppl. 1,
429-437 Szer, W., and Brenowitz, d. (1970) Biochem. Biophys. Res.
Commun. 38, 1154-1160 Neu, H. C., and Heppel, L. A. (1964) fioc. N&l. Acad. Sci,
U. S. A. 51,1267-1274 Himes, R. H., Stallcup, M. R., and Rabinowitz, J. C. (1972) J.
Bacterial. 112, 1057-1069 Sala, F., Bazzicalupo, M., and Parisi, B. (1974) J, Bacterial. 119,
821-829 Isono, S., and Isono K. (1975) Eur. J. Biochem, 56, 15.-22 Brown, J. C., and Doty, P. (1971) Biochim. Biophys. Acta 228,
746-748 Steitz, J. A. (1969) Nature 224, 957-964 Volckaert, G., and Fiers, W. (1973) FEBS Lett. 35, 91-96 Files, J. G., Weber, K., and Miller, .J. H. (1974) Proc. N&l. Acad.
Sci. U. S. A. 71, 667-670 DeWachter, R., Merregaert, J., Vandenberghe, A., Contreras, R.,
and Fiers, W. (1971) Eur. J. Biochem. 22, 400-414 Starr, J. L., and Sells, B. H. (1969) Physiol. Reu. 49, 623-669 Steitz, J. A. (1973) Proc. Natl. Acad. Sci. U. S. A. 70, 2605-2609 Steitz, J. A. (1972) Nature New Biol. 236, 71-75 Staples, D. H., Hindley, J., Billeter, M. A., and Weissmann, C.
(1971) Nature New Biol. 234, 202-204 Staples, D. H., and Hindley, J. (1971) Nature New Biol. 234,
211-212 Gupta, S, L., Chen, J., Schaefer, L., Lengyel, P., and Weissman,
S. M. (1970) Biochem. Biophys. Res. Commun. 39, 883-888 van Knippenberg, P. H. (1975) Nucleic Acid Res. 2,79-85 Shine, J., and Dalgarno, L. (1975) Eur. J. Biochem. 57, 221-230 Szer, W., Hermoso, J. M., and Leffler, S. (1975) Proc. Natl. Acad.
Sci. U. S. A. 72, 2325-2329
by guest on February 14, 2018http://w
ww
.jbc.org/D
ownloaded from
M R Stallcup, W J Sharrock and J C Rabinowitzsynthesis reactions in vitro.
Specificity of bacterial ribosomes and messenger ribonucleic acids in protein
1976, 251:2499-2510.J. Biol. Chem.
http://www.jbc.org/content/251/8/2499Access the most updated version of this article at
Alerts:
When a correction for this article is posted•
When this article is cited•
to choose from all of JBC's e-mail alertsClick here
http://www.jbc.org/content/251/8/2499.full.html#ref-list-1
This article cites 0 references, 0 of which can be accessed free at
by guest on February 14, 2018http://w
ww
.jbc.org/D
ownloaded from