Embed Size (px)
Citation preview
SPECIMEN CONSOLIDATED MUNICIPAL ANNUAL FINANCIAL STATEMENTS
National Treasury September 2006
Specimen Consolidated Municipal Annual Financial Statements
2
SPECIMEN CONSOLIDATED MUNICIPAL ANNUAL FINANCIAL
Specimen Consolidated Municipal Annual Financial Statements
3
SECTION ONE: INTRODUCTION AND BACKGROUND
1 Purpose of the Specimen Consolidated Group Annual Financial Statements
1.1 The purpose of the specimen group annual financial statements is: a. to ensure that there is consistency amongst all municipalities in the presentation of
consolidated annual financial statements; b. to ensure that there is the greatest possible consistency with the specimen consolidated
annual financial statements of other spheres of government; c. to provide guidance on the application of Standards of Generally Recognised
Accounting Practice (GRAP) and Standards of Generally Accepted Municipal Accounting Practice (GAMAP) in the consolidation of Group annual financial statements;
d. to facilitate the requirement of the Municipal Finance Management Act (MFMA) on the preparation of consolidated annual financial statements;
e. to demonstrate the group annual financial statement disclosure of the new budget formats.
1.2 Although the specimen municipal annual financial statements are written as a guide, all municipalities are required to prepare annual financial statements in accordance with GRAP 1,2 and 3, the 8 GAMAP standards, National Treasury formats and the capacity levels reflecting High, Medium and Low capacity in terms of the MFMA implementation strategy. The specimen municipal annual financial statements are extended to incorporate the requirements of GAMAP 6, 7 and 8 in the preparation of consolidated annual financial statements for the group.
1.3 These specimen annual financial statements also illustrate the first-time implementation of GAMAP. The “Guidelines for the implementation of accounting Standards of Generally Recognised Accounting Practice”, issued by National Treasury, should also be referred to for GAMAP implementation assistance.
2 Basis used to prepare these Specimen Consolidated Annual Financial Statements
2.1 The specimen municipal annual financial statements have been prepared from the following sources:
a. Standards of GRAP approved by the Accounting Standards Board. These are GRAP 1, GRAP 2, and GRAP 3 and the 8 GAMAP standards.
b. The new budget formats prescribed by National Treasury. c. Budget circulars issued by the National Treasury. d. The Municipal Finance Management Act. e. The Division of Revenue Act.
2.2 The municipal annual financial statements have been consolidated with the annual financial statements of controlled municipal entities, joint ventures and investment in associates to prepare the specimen consolidated annual financial statements. Not all the requirements of GAMAP 6, 7 and 8 have been illustrated in these specimen consolidated annual financial statements. It is the intention of National Treasury to further develop these specimen consolidated annual financial statements over time.
2.3 It should be noted that while these specimen annual financial statements and the specimen consolidated annual financial statements are intended as a source of reference, preparers of annual financial statements must ensure that they have a thorough understanding of the Standards of GRAP and GAMAP, the new budget formats and relevant municipal legislation.
Specimen Consolidated Municipal Annual Financial Statements
4
2.4 The above-mentioned standards can be viewed on the website of the Accounting Standards Board: http://www.asb.co.za
3 Timeframes
3.1 Standards of GRAP change continually. These specimen consolidated annual financial statements are based on GRAP standards that will apply during the financial year ending on 30 JUNE 2006. Municipalities are only required to prepare financial statements in terms of their capacity levels set out in the MFMA implementation strategy.
3.2 National Treasury will issue new specimen annual financial statements and specimen consolidated annual financial statements annually to take into account any new Standards of GRAP that have been issued by the Accounting Standards Board and that will apply in future reporting periods.
4 Using this specimen
4.1 This specimen applies to all municipalities, and municipal entities whose financial results are consolidated into group annual financial statements. Explanatory notes are given in italics for ease of reference.
4.2 It is important that GRAP 1 is studied in conjunction with this specimen. GRAP 1 provides guidance on current versus non-current classifications, offsetting, rounding and information to be included on each page in a set of consolidated annual financial statements, amongst other information.
4.3 Despite the comment in paragraph 1.2 above, it should be noted that accounting policies are municipality specific and are not generic. Although accounting policies are set out in the specimen financial statements, these are for guidance purposes only. For example, the accounting policy on inventories included in these specimen financial statements incorporates a first-in, first-out method of determining cost. In some municipalities, the basis of determining the cost of inventories will be the weighted average method. Those municipalities that use the weighted average method will need to draft an appropriate accounting policy accordingly.
4.4 Where material activities of municipalities and/or municipal entities have not been addressed by these specimen annual financial statements guidance on appropriate accounting policies should be obtained from the relevant accounting Standards or through consultation with the National Treasury.
5 Content of the specimen
5.1 This specimen sets out an example of group annual financial statements. Explanatory notes are provided for each matter in the specimen.
5.2 This specimen is not intended to explain accounting entries or provide information on accounting principles. It merely provides information on the content and format of consolidated annual financial statements.
5.3 In terms of the Municipal Finance Management Act, group annual financial statements will form part of the annual report. The annual report will contain organisational, service delivery, performance and other information and there is therefore no need for a Municipal Manager’s or Political Executive report to be included in the consolidated annual financial statements.
Specimen Consolidated Municipal Annual Financial Statements
5
SECTION TWO: SUMMARY OF GAMAP 6, 7 AND 8
1 Consolidation procedures
1.1 Controlled entities Control is defined in GAMAP 6 as the power to govern the financial and operating policies of another entity so as to benefit from its activities. Where a municipality has control over an entity, it must prepare consolidated annual financial statements unless the circumstances set out below in this summary apply to such controlled entity. There are two elements of the definition of control. These are the power element (the power to govern the financial and operating policies of another entity) and the benefit element (which represents the ability of the controlling municipality to benefit from the activities of the other entity). Power indicators (a) The municipality has, directly or indirectly through controlled entities, ownership of a majority voting interest in the other entity. (b) The entity has the power, either granted by or exercised within existing legislation, to appoint or remove a majority of the members of the governing body of the other entity. (c) The municipality has the power to cast, or regulate the casting of, a majority of the votes that are likely to be cast at a general meeting of the other entity. (d) The municipality has the power to cast the majority of votes at meetings of the council or equivalent governing body. Benefit indicators (a) The municipality has the power to dissolve the other entity and obtain a significant level of the residual economic benefits or bear significant obligations. For example, the benefit condition may be met if a municipality had responsibility for the residual liabilities of another entity. (b) The municipality has the power to extract distributions of assets from the other entity, and/or may be liable for certain obligations of the other entity. When one or more of the circumstances listed in the paragraph above do not exist, the following factors are likely, either individually or collectively, to be indicative of the existence of control: - Power indicators (a) The municipality has the ability to veto operating and capital budgets of the other entity. (b) The municipality has the ability to veto, overrule, or modify council or equivalent governing body decisions of the other entity. (c) The municipality has the ability to approve the hiring, reassignment and removal of key personnel of the other entity. (d) The mandate of the other entity is established and limited by legislation. (e) The municipality holds a “golden share”3 (or equivalent) in the other entity that confers rights to govern the financial and operating policies of that other entity. Benefit indicators (a) The municipality holds direct or indirect title to the net assets of the other entity with an ongoing right to access these. (b) The municipality has a right to a significant level of the net assets of the other entity in the event of liquidation or in a distribution other than liquidation. (c) The municipality is able to direct the other entity to co-operate with it in achieving its objectives. (d) The municipality is exposed to the residual liabilities of the other entity.
Specimen Consolidated Municipal Annual Financial Statements
6
In preparing consolidated financial statements, the financial statements of the controlling entity and its controlled entities are combined on a line-by-line basis by adding together like items of assets, liabilities, net assets, revenue and expenses. In order that the consolidated financial statements present financial information about the economic entity as that of a single entity, the following steps are then taken: (a) The carrying amount of the controlling municipality’s investment in each controlled entity and the controlling municipality’s portion of net assets of each controlled entity are eliminated; (b) Minority interests in the surplus or deficit of consolidated controlled entities for the reporting period are identified and adjusted against the surplus or deficit of the economic entity in order to arrive at the surplus or deficit attributable to the owners of the controlling entity, and (c) Minority interests in the net assets of consolidated controlled entities are identified and presented in the consolidated statement of financial position separately from liabilities and the controlling entity’s net assets. Minority interests in the net assets consist of: (i) the amount at the date of the original combination, and (ii) the minority’s share of movements in net assets since the date of combination. Balances and transactions between entities within the economic entity and resulting unrealised gains shall be eliminated in full. Unrealised losses resulting from transactions within the economic entity shall also be eliminated unless cost cannot be recovered. Balances and transactions between entities within the economic entity, including sales, transfers and revenues recognised consequent to an appropriation or other budgetary authority, expenses and dividends, are eliminated in full. Unrealised surpluses resulting from transactions within the economic entity that are included in the carrying amount of assets, such as inventory and fixed assets, are eliminated in full. Unrealised deficits resulting from transactions within the economic entity that are deducted in arriving at the carrying amount of assets are also eliminated unless cost cannot be recovered. When the financial statements used in the consolidation are drawn up to different reporting dates, adjustments shall be made for the effects of significant transactions or other events that occur between those dates and the date of the controlling entity’s financial statements. In any case the difference between reporting dates shall be no more than three months. A controlled entity shall be excluded from consolidation when: (a) control is intended to be temporary because the controlled entity is acquired and held exclusively with a view to its subsequent disposal in the near future, or (b) it operates under severe external long-term restrictions which prevent the controlling entity from benefiting from its activities. In these instances, the controlled entity should be accounted for as if it was an investment. The financial statements of the controlling entity and its controlled entities used in the preparation of the consolidated financial statements are usually drawn up to the same date. When the reporting dates are different, the controlled entity often prepares, for consolidation purposes, statements as at the same date as the economic entity. When it is impracticable to do this, financial statements drawn up to different reporting dates may be used provided the difference is no greater than three months. The consistency principle dictates that the length of the reporting periods and any difference in the reporting dates should be the same from period to period. Consolidated financial statements shall be prepared using uniform accounting policies for like transactions and other events in similar circumstances. If it is not practicable to use uniform accounting policies (other than the bases of accounting) in preparing the consolidated financial statements, that fact shall be disclosed together with the proportions of the items in the consolidated financial statements to which the different accounting policies have been applied.
Specimen Consolidated Municipal Annual Financial Statements
7
If a member of the economic entity uses accounting policies other than those adopted in the consolidated financial statements for like transactions and events in similar circumstances, appropriate adjustments are made to its financial statements when they are used in preparing the consolidated financial statements. The surplus or deficit of a controlled entity is included in the consolidated financial statements as from the date on which control becomes effective. The surplus or deficit from operating activities of a controlled entity disposed of is included in the consolidated statement of financial performance until the date of disposal, which is the date on which the controlling entity ceases to have control of the controlled entity. The difference between the proceeds from the disposal of the controlled entity and the carrying amount of its assets less liabilities as of the date of disposal is recognised in the consolidated statement of financial performance as the surplus or deficit on the disposal of the controlled entity. In order to ensure the comparability of the financial statements from one accounting period to the next, supplementary information is often provided about the effect of the acquisition and disposal of controlled entities on the financial position at the reporting date and the results for the reporting period and on the corresponding amounts for the preceding period. From the date an entity ceases to fall within the definition of a controlled entity and does not become an associate as defined in the Standard of Generally Accepted Municipal Accounting Practice on Accounting for Investments in Associates, or a jointly controlled entity as defined in the Standard of Generally Accepted Municipal Accounting Practice on Financial Reporting of Interests in Joint Ventures, it should be accounted for as an investment. The International Accounting Standard on Financial Instruments: Recognition and Measurement provides guidance on accounting for investments. The carrying amount of the investment at the date that it ceases to be a controlled entity is regarded as cost thereafter. Minority interests shall be presented in the statement of changes in net assets, separately from the controlling entity’s equity. Minority interests in the surplus or deficit of the economic entity shall also be separately disclosed. The losses applicable to the minority in a consolidated controlled entity may exceed the minority interest in the net assets of the controlled entity. The excess, and any further losses applicable to the minority, is charged against the majority interest except to the extent that the minority has a binding obligation to, and is able to, make good the losses. If the controlled entity subsequently reports surpluses, the majority interest is allocated all such surpluses until the minority’s share of losses previously absorbed by the majority has been recovered. If a controlled entity has outstanding cumulative preferred shares which are held outside the economic entity, the controlling entity computes its share of surpluses and losses after adjusting for the controlled entity’s preferred dividends, whether or not dividends have been declared.
1.2 Disclosure The following disclosures shall be made: (a) In consolidated financial statements, a list of significant controlled entities including the name, the jurisdiction in which it operates (when it is different from that of the controlling entity), proportion of ownership interest and, where that interest is in the form of shares, the proportion of voting power held (only where this is different from the proportionate ownership interest), (b) In consolidated financial statements, where applicable, the reasons for not consolidating a controlled entity, (c) In the controlling entity’s separate financial statements, a description of the method used to account for controlled entities, (d) Distributions received from or accrued in respect of controlled entities, (e) Gains or losses on the sale of shares or other dilutions in controlled entities by the investor, and (f) Fees charged for administration of the controlled entity.
Specimen Consolidated Municipal Annual Financial Statements
8
2 Associates
2.1 Consolidated financial statements A municipality will recognize an associate where it exercises significant influence over such entity. Significant influence is defined as the power to participate in the financial and operating policy decisions of the investee, but is not control over those policies. The existence of significant influence by a municipality is usually evidenced in one or more of the following ways: (a) representation on the board of directors or equivalent governing body of the investee, (b) participation in policy-making processes, (c) material transactions between the municipality and the investee, (d) interchange of managerial personnel, or (e) provision of essential technical information. If the municipality’s ownership interest is in the form of shares and it holds, directly or indirectly through controlled entities, 20% or more of the voting power of the investee, it is presumed that the municipality has significant influence, unless it can be clearly demonstrated that this is not the case. Conversely, if the municipality holds, directly or indirectly through controlled entities, less than 20% of the voting power of the investee, it is presumed that the municipality does not have significant influence, unless such influence can be clearly demonstrated. It should be noted that a substantial or majority ownership by another investor does not necessarily preclude a municipality from having significant influence. An investment in an associate shall be accounted for in consolidated financial statements under the equity method except when the investment is acquired and held exclusively with a view to its disposal in the near future, in which case it shall be accounted for under the cost method. The recognition of revenue on the basis of distributions received may not be an adequate measure of the revenue earned by an investor on an investment in an associate because the distributions received may bear little relationship to the performance of the associate. In particular, where the associate has not-for-profit objectives, investment performance will be determined by factors such as the cost of outputs and overall service delivery. As the investor has significant influence over the associate, the investor has a measure of responsibility for the associate’s performance and, as a result, the return on its investment. The investor accounts for this stewardship by extending the scope of its consolidated financial statements to include its share of surpluses or deficits of such an associate and so provides an analysis of earnings and investment from which more useful ratios can b calculated. As a result, the application of the equity method provides more informative reporting of the net assets and surplus or deficit of the investor. An investment in an associate is accounted for using the cost method when it operates under severe long-term restrictions that significantly impair its ability to transfer funds or provide other non-financial benefits to, or on behalf of, the investor. Investment in associates is also accounted for using the cost method when the investment is acquired and held exclusively with a view to its disposal in the near future. An investor shall discontinue the use of the equity method from the date that: (a) it ceases to have significant influence in an associate but retains, either in whole or in part, its investment, or (b) the use of the equity method is no longer appropriate because the associate operates under severe long-term restrictions that significantly impair its ability to transfer funds or provide other non-financial benefits to, or on behalf of, the investor. The carrying amount of the investment at that date should be regarded as cost thereafter.
Specimen Consolidated Municipal Annual Financial Statements
9
2.2 Separate financial statements of the investor An investment in an associate that is included in the separate financial statements of an investor that issues consolidated financial statements shall be either: (a) accounted for using the equity method or the cost method, whichever is used for the associate in the investor’s consolidated financial statements, or (b) accounted for as an investment. The preparation of consolidated financial statements does not, in itself, obviate the need for separate financial statements for an investor. An investor that has investments in associates may not issue consolidated financial statements because it does not have controlled entities. It is appropriate that such an investor provides the same information about its investments in associates as those entities that issue consolidated financial statements.
2.3 Application of the equity method Many of the procedures appropriate for the application of the equity method are similar to the consolidation procedures set out in the Standard of Generally Accepted Municipal Accounting Practice on Consolidated Financial Statements and Accounting for Controlled Entities. Furthermore, the broad concepts underlying the consolidation procedures used in the acquisition of a controlled entity are adopted on the acquisition of an investment in an associate. Where an associate is accounted for using the equity method, unrealized surpluses and deficits resulting from all transactions between an investor (or its consolidated controlled entities) and associates shall be eliminated to the extent of the investor’s interest in the associate. Unrealised deficits shall not be eliminated to the extent that the transaction provides evidence of an impairment of the asset transferred. An investment in an associate is accounted for under the equity method from the date on which it falls within the definition of an associate. Guidance on accounting for any difference (whether positive or negative) between the cost of acquisition and the investor’s share of the fair values of the net identifiable assets of the associate can be found in the International Accounting Standard on Business Combinations. Appropriate adjustments to the investor's share of the surpluses or deficits after acquisition are made to account for: (a) depreciation of the depreciable assets, based on their fair values, and (b) amortisation of the difference between the cost of the investment and the investor’s share of the fair values of the net identifiable assets. The most recent available financial statements of the associate are used by the investor in applying the equity method; they are usually drawn up to the same date as the financial statements of the investor. When the reporting date of the investor and the associate are different, the associate often prepares, for the use of the investor, statements as at the same date as the financial statements of the investor. When it is impracticable to do this, financial statements drawn up to a different reporting date may be used. The consistency principle dictates that the length of the reporting periods, and any difference in the reporting dates, are consistent from period to period. When financial statements with a different reporting date are used, adjustments are made for the effects of any significant events or transactions between the investor and the associate that occur between the date of the associate's financial statements and the date of the investor's financial statements. The investor's financial statements are usually prepared using uniform accounting policies for like transactions and events in similar circumstances. In many cases, if an associate uses accounting policies other than those adopted by the investor for like transactions and events in similar circumstances, appropriate adjustments are made to the associate's financial statements when
Specimen Consolidated Municipal Annual Financial Statements
10
they are used by the investor in applying the equity method. If it is not practicable for such adjustments to be calculated, that fact is generally disclosed. If an associate has outstanding cumulative preferred shares, held by outside interests, the investor computes its share of surpluses or deficits after adjusting for the preferred dividends, whether or not the dividends have been declared. If, under the equity method, an investor's share of deficits of an associate equals or exceeds the carrying amount of an investment, the investor discontinues including its share of further losses. The investment is reported at nil value. Additional deficits are provided for to the extent that the investor has incurred obligations or made payments on behalf of the associate to satisfy obligations of the associate that the investor has guaranteed or otherwise committed. If the associate subsequently reports surpluses, the investor resumes including its share of those surpluses only after such share of the surpluses equals the share of net deficits not recognised.
2.4 Disclosure The following disclosures shall be made: (c) An appropriate listing and description of significant associates including the proportion of ownership interest and, if different, the proportion of voting power held, (d) The methods used to account for such investments, (e) The carrying amount of the investment for each significant associate’ (f) Summarised financial information in regard to asset, liabilities and the results of the operations of significant associates presented individually or in aggregate, (g) The investor’s share of cumulative post acquisition reserves or deficits of associates, (h) The gross amount of loans made to the associate or received from associate by the investor, (i) Accounting periods for which the financial statements of the associate have been prepared where they are different from that of the investor, (j) The total market value of the listed investment in associates and the total council’s valuation of investments in unlisted associates, (k) Distribution received from or accrued in respect of associates, and (l) Gains and losses on the sale of shares or other dilutions in associates by the investor. Investments in associates accounted for using the equity method shall be classified as non-current assets and disclosed as a separate item in the statement of financial position. The investor's share of the surpluses or deficits of such investments should be disclosed as a separate item in the statement of financial performance. The Standard of Generally Recognised Accounting Practice on Presentation of Financial Statements also requires the share of surpluses or deficits of associates accounted for using the equity method of accounting to be presented on the face of the statement of financial performance.
3 JOINT VENTURES
3.1 Consolidated financial statements of a venturer An economic entity may consist of only a venturer and a jointly controlled entity and consequently consolidated financial statements for such a group are prepared in accordance with the requirements of this Standard. A venturer shall report its interest in a jointly controlled entity in its consolidated financial statements. When reporting an interest in a jointly controlled entity in consolidated financial statements, it is essential that a venturer reflects the substance and economic reality of the arrangement rather
Specimen Consolidated Municipal Annual Financial Statements
11
than the joint venture’s particular structure or form. In a jointly controlled entity, a venturer has control over its share of future economic benefits or potential service provision through its share of the assets and liabilities of the venture. This substance and economic reality is reflected in the consolidated financial statements of the venturer when the venture reports its interests in the assets, liabilities, revenue and expenses of the jointly controlled entity by using one of the two reporting formats for proportionate consolidation. The application of proportionate consolidation means that the consolidated statement of financial position of the venturer includes its share of the assets that it controls jointly and its share of the liabilities for which it is jointly responsible. The consolidated statement of financial performance of the venturer includes its share of the revenue and expenses of the jointly controlled entity. Many of the procedures appropriate for the application of proportionate consolidation are similar to the procedures for the consolidation of investments in controlled entities. Different reporting formats may be used to give effect to proportionate consolidation. The venturer may combine its share of each of the assets, liabilities, revenue and expenses of the jointly controlled entity with the similar items in its consolidated financial statements on a line-by-line basis. For example, it may combine its share of the jointly controlled entity’s inventory with the inventory of the economic entity and its share of the jointly controlled entity’s property, plant and equipment with the same items of the economic entity. Alternatively, the venturer may include separate line items for its share of the assets, liabilities, revenue and expenses of the jointly controlled entity in its consolidated financial statements. For example, it may show its share of the current assets of the jointly controlled entity separately as part of the current assets of the economic entity; it may show its share of the property, plant and equipment of the jointly controlled entity separately as part of the property, plant and equipment of the economic entity. Both these reporting formats result in the reporting of identical amounts of net revenue and expenses; both formats are acceptable for the purposes of this Standard. Whatever format is used to give effect to proportionate consolidation, it is inappropriate to offset any assets or liabilities by the deduction of other liabilities or assets or any revenue or expense by the deduction of other expenses or revenue, unless a legal right of set-off exists and the offsetting represents the expectation as to the realisation of the asset or the settlement of the liability. The use of proportionate consolidation is inappropriate when the interest in a jointly controlled entity is acquired and held exclusively with a view to its subsequent disposal in the near future. It is also inappropriate when the jointly controlled entity operates under severe long-term restrictions that significantly impair its ability to transfer funds or provide other non-financial benefits to the venturer. Separate financial statements may be presented by a venturer in order to meet legal or other requirements. Such separate financial statements are prepared in order to meet a variety of needs with the result that different reporting practices are in use. Accordingly, this Standard does not indicate a preference for any particular treatment. When a venturer contributes or sells assets to a joint venture, recognition of any portion of a gain or loss from the transaction shall reflect the substance of the transaction. While the assets are retained by the joint venture, and provided the venturer has transferred the significant risks and rewards of ownership, the venturer shall recognise only that portion of the gain that is attributable to the interest of the other venturers. The venturer shall recognise the full amount of any loss when the contribution or sale provides evidence of a reduction in the net realisable value of current assets or an impairment loss. When a venturer purchases assets from a joint venture, the venturer should not recognise its share of the gains of the joint venture from the transaction until it resells the assets to an independent party. A venturer should recognise its share of the losses resulting from these transactions in the same way as gains except that losses should be recognised immediately when they represent a reduction in the net realisable value of current assets or an impairment loss.
Specimen Consolidated Municipal Annual Financial Statements
12
A venturer discontinues the use of proportionate consolidation from the date on which it ceases to share in the control of a jointly controlled entity. This may happen, for example, when the venturer disposes of its interest, or when external restrictions are placed on the jointly controlled entity so that it can no longer achieve its goals.
3.2 Disclosure In accordance with the Standard of Generally Accepted Municipal Accounting Practice on Provisions, Contingent Liabilities and Contingent Assets, a venturer shall disclose the following: (a) The aggregate amount of the following contingent liabilities, unless the possibility of any outflow in settlement is remote, separately from the amount of other contingent liabilities: (i) any contingent liabilities that the venturer has incurred in relation to its interests in joint ventures, and its share in each of the contingent liabilities that have been incurred jointly with other venturers, (ii) its share of the contingent liabilities of the joint ventures themselves for which it is contingently liable, and (iii) those contingent liabilities that arise because the venturer is contingently liable for the liabilities of the other venturers of a joint venture, and (b) A brief description of the following contingent assets and, where practicable, an estimate of their financial effect, where an inflow of economic benefits or service potential is probable: (i) any contingent assets of the venturer arising in relation to its interests in joint ventures and its share in each of the contingent assets which have arisen jointly with other venturers, and (ii) its share of the contingent assets of the joint ventures themselves. A venturer shall disclose the aggregate amount of the following commitments, in respect of its interests in joint ventures separately from other commitments: (a) any capital commitments of the venturer in relation to its interests in joint ventures, and its share in the capital commitments that have been incurred jointly with other venturers, and (b) its share of the capital commitments of the joint ventures themselves. A venturer shall disclose a listing and description of interests in significant joint ventures and the proportion of ownership interest held in jointly controlled entities. A venturer which reports its interests in jointly controlled entities using the line-by-line reporting format for proportionate consolidation shall disclose the aggregate amounts of each of current assets, non-current assets, current liabilities, non-current liabilities, revenue and expenses related to its interests in joint ventures.
Specimen Consolidated Municipal Annual Financial Statements
13
SECTION THREE: PRACTICAL CONSIDERATIONS
1 INTRODUCTION The purpose of these guidelines is to highlight important factors for municipal practitioners to take into account in performing consolidations. The information in this section of the specimen consolidated annual financial statements is not to illustrate all the concepts in the relevant GAMAP standards but rather to illustrate the basic principles that need to be taken into account in preparing consolidated annual financial statements. Finance practitioners that require more detailed information on consolidations will need to undertake the necessary research of the relevant GAMAP standards or seek guidance from appropriate financial accounting literature. The information in this section of the specimen consolidated annual financial statements provides guidance on: - • Determining control • The responsibilities of control from a financial reporting perspective; • Group accounting policies; • Elimination of inter-group transactions and account balances.
2 DETERMINING CONTROL It is important to determine initially whether a municipality has control over an entity to determine whether it should consolidate the entity in the group annual financial statements. A municipal entity can comprise: - • A private company incorporated in terms of Sections 19 or 20 of the Companies Act; • A service utility incorporated in terms of Chapter 8 of the Municipal Systems Act; and • A company established in terms of Section 21 of the Companies Act, where such company
was established or under the control of the municipality prior to the amendments of the Municipal Systems Act in 2003.
Control is determined through two scenarios (see summary of GAMAP 6 in Section Two): - • The power element (the power to govern the financial and operating policies of another entity);
and/or • The benefit element (which represents the ability of the controlling entity to benefit from the
activities of the other entity) If any of the two scenarios apply to a municipality that has established or purchased an entity, then the municipality has ownership control over such entity and must incorporate such entity in to its consolidated annual financial statements. It should be noted that in certain instances, a municipality may provide substantial funding to an entity. This in itself does not indicate that the municipality controls the entity. The municipality will still need to control the entity in terms of the scenarios explained above. A further matter to consider is where an entity is established in terms of a by-law, for example, a service utility. The municipality concerned will in all likelihood appoint the majority of members of the governing body of the service utility and therefore exercises control.
Specimen Consolidated Municipal Annual Financial Statements
14
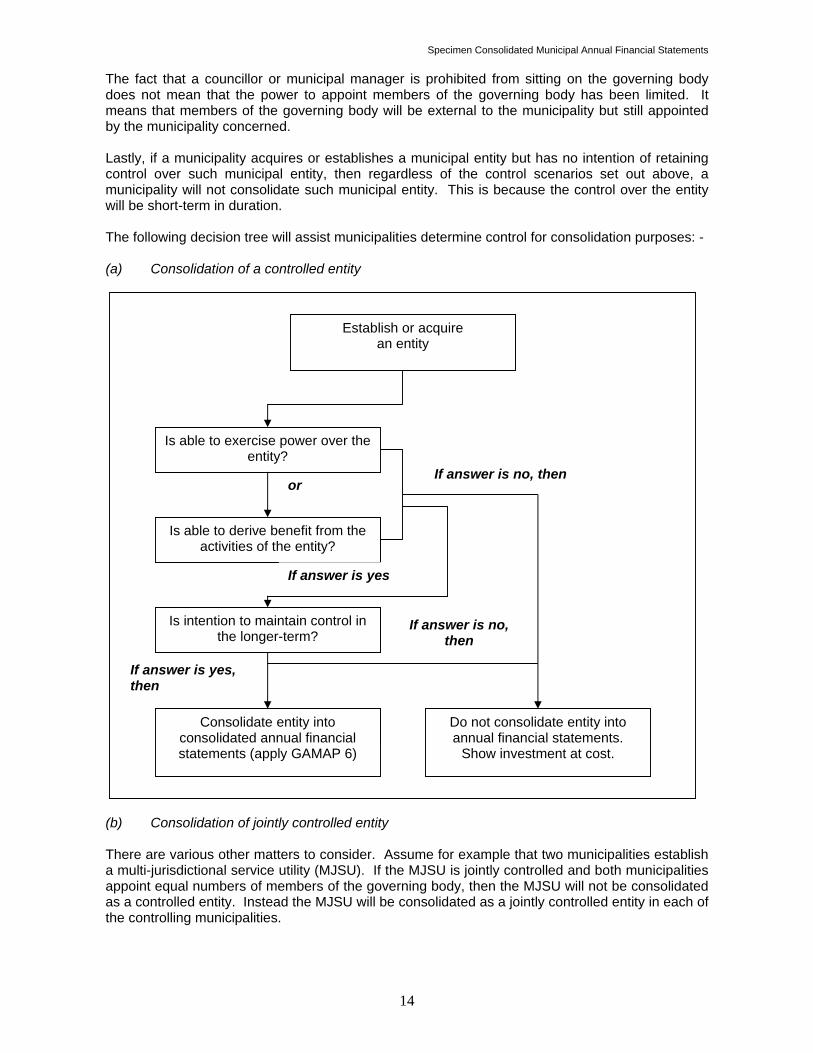
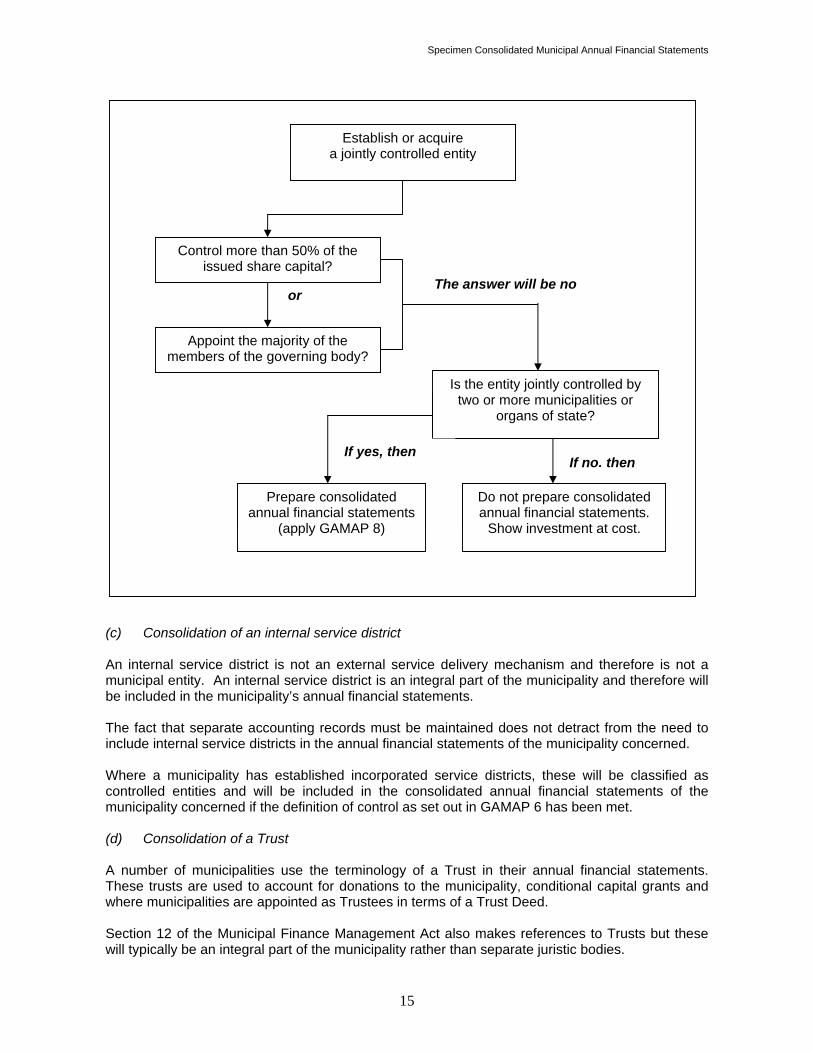
The fact that a councillor or municipal manager is prohibited from sitting on the governing body does not mean that the power to appoint members of the governing body has been limited. It means that members of the governing body will be external to the municipality but still appointed by the municipality concerned. Lastly, if a municipality acquires or establishes a municipal entity but has no intention of retaining control over such municipal entity, then regardless of the control scenarios set out above, a municipality will not consolidate such municipal entity. This is because the control over the entity will be short-term in duration. The following decision tree will assist municipalities determine control for consolidation purposes: - (a) Consolidation of a controlled entity (b) Consolidation of jointly controlled entity There are various other matters to consider. Assume for example that two municipalities establish a multi-jurisdictional service utility (MJSU). If the MJSU is jointly controlled and both municipalities appoint equal numbers of members of the governing body, then the MJSU will not be consolidated as a controlled entity. Instead the MJSU will be consolidated as a jointly controlled entity in each of the controlling municipalities.
Establish or acquire an entity
Is able to exercise power over the entity?
Is able to derive benefit from the activities of the entity?
Is intention to maintain control in the longer-term?
Consolidate entity into consolidated annual financial statements (apply GAMAP 6)
Do not consolidate entity into annual financial statements.
Show investment at cost.
or
If answer is yes, then
If answer is no, then
If answer is yes
If answer is no, then
Specimen Consolidated Municipal Annual Financial Statements
15
(c) Consolidation of an internal service district An internal service district is not an external service delivery mechanism and therefore is not a municipal entity. An internal service district is an integral part of the municipality and therefore will be included in the municipality’s annual financial statements. The fact that separate accounting records must be maintained does not detract from the need to include internal service districts in the annual financial statements of the municipality concerned. Where a municipality has established incorporated service districts, these will be classified as controlled entities and will be included in the consolidated annual financial statements of the municipality concerned if the definition of control as set out in GAMAP 6 has been met. (d) Consolidation of a Trust A number of municipalities use the terminology of a Trust in their annual financial statements. These trusts are used to account for donations to the municipality, conditional capital grants and where municipalities are appointed as Trustees in terms of a Trust Deed. Section 12 of the Municipal Finance Management Act also makes references to Trusts but these will typically be an integral part of the municipality rather than separate juristic bodies.
Establish or acquire a jointly controlled entity
Control more than 50% of the issued share capital?
Appoint the majority of the members of the governing body?
or The answer will be no
Is the entity jointly controlled by two or more municipalities or
organs of state?
Prepare consolidated annual financial statements
(apply GAMAP 8)
Do not prepare consolidated annual financial statements.
Show investment at cost.
If no, then If yes, then
Specimen Consolidated Municipal Annual Financial Statements
16
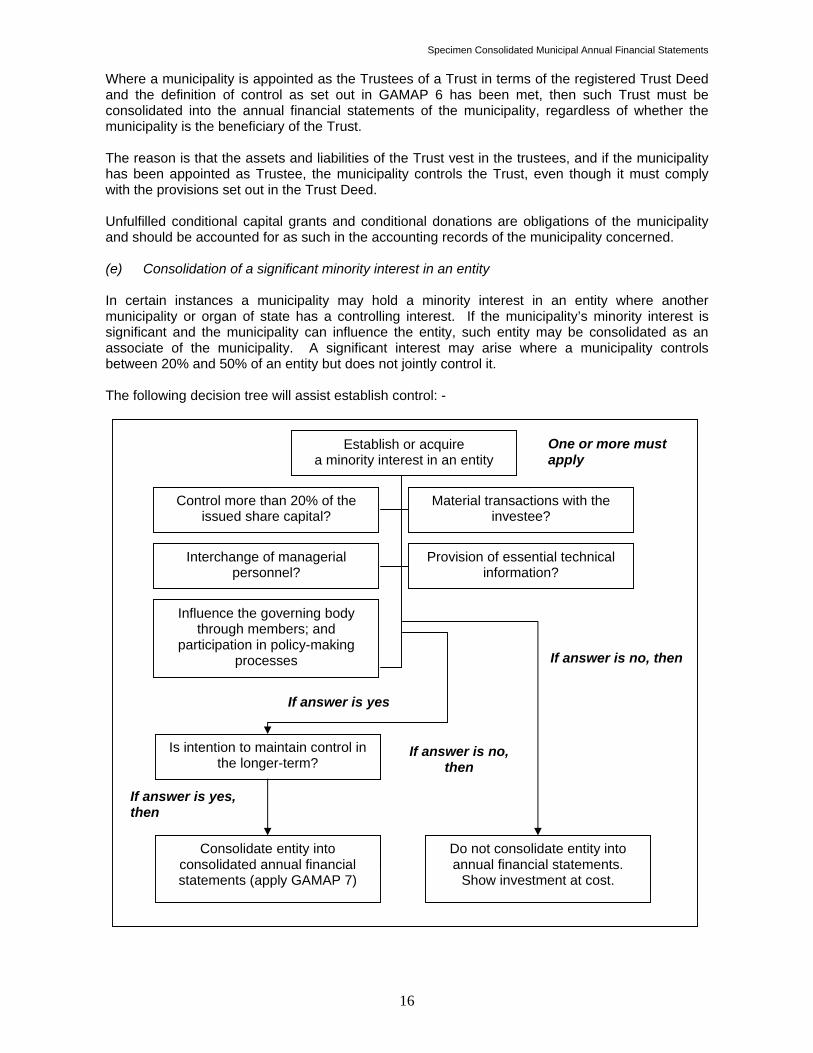
Where a municipality is appointed as the Trustees of a Trust in terms of the registered Trust Deed and the definition of control as set out in GAMAP 6 has been met, then such Trust must be consolidated into the annual financial statements of the municipality, regardless of whether the municipality is the beneficiary of the Trust. The reason is that the assets and liabilities of the Trust vest in the trustees, and if the municipality has been appointed as Trustee, the municipality controls the Trust, even though it must comply with the provisions set out in the Trust Deed. Unfulfilled conditional capital grants and conditional donations are obligations of the municipality and should be accounted for as such in the accounting records of the municipality concerned. (e) Consolidation of a significant minority interest in an entity In certain instances a municipality may hold a minority interest in an entity where another municipality or organ of state has a controlling interest. If the municipality’s minority interest is significant and the municipality can influence the entity, such entity may be consolidated as an associate of the municipality. A significant interest may arise where a municipality controls between 20% and 50% of an entity but does not jointly control it. The following decision tree will assist establish control: -
Establish or acquire a minority interest in an entity
Control more than 20% of the issued share capital?
Influence the governing body through members; and
participation in policy-making processes
Is intention to maintain control in the longer-term?
Consolidate entity into consolidated annual financial statements (apply GAMAP 7)
Do not consolidate entity into annual financial statements.
Show investment at cost.
If answer is yes, then
If answer is no, then
If answer is yes
If answer is no, then
Material transactions with the investee?
Interchange of managerial personnel?
Provision of essential technical information?
One or more must apply
Specimen Consolidated Municipal Annual Financial Statements
17
3 THE RESPONSIBILITIES OF CONTROL FROM A FINANCIAL REPORTING PERSPECTIVE
A municipality that has control over an entity (which will be a municipal entity) must exercise that control from a financial reporting perspective. This will typically include the following: - • Ensuring that the municipal entity has a 30 June financial year-end (this should have been
done prior to 30 June 2005); • Ensuring that the municipal entity prepares annual financial statements prior to 31 August each
year; • Ensuring that in addition to submitting annual financial statements by 31 August each year, the
municipal entity provides information in a format that facilitates the consolidation of the municipality’s and the municipal entity’s financial information in the form of consolidated annual financial statements. Consideration should be given to prepare an accounting pack that will facilitate the consolidation. This pack is a template of information that the municipality and its municipal entities will prepare to facilitate consolidation;
• Preparing accounting policies that will be used in the consolidated annual financial statements. These accounting policies must be applied consistently in the consolidated annual financial statements. (refer where discussed in more detail below);
• Transactions and balances between the municipality and its municipal entities are eliminated for consolidation purposes. This is discussed in more detail below.
• Where a municipality has acquired a municipal entity, the accumulated surplus of the municipal entity at the date of acquisition forms part of the purchase price of the municipal entity and thus is not to be included in the consolidated accumulated surplus of the municipality and its municipal entity. Only the accumulated surplus of the municipal entity that is generated subsequent to acquisition is included in the consolidated accumulated surplus of the municipality and its municipal entity. The municipality concerned must keep track of the post-acquisition accumulated surplus.
Where there is a joint venture between two municipalities and a jointly controlled entity is established, both municipalities will have joint responsibilities to exercise control over the jointly controlled entity. Where a municipality has an interest in an associate, it will not be able to exercise control. For example, if a Provincial Department controls the associate, the year-end of the associate will likely be 31 March rather than 30 June of each year. The municipality will need to use the 31 March financial statements of the associate to prepare its consolidated annual financial statements as it will not be able to change the year-end of the associate as it does not have control over the associate.
4 ACCOUNTING POLICIES A municipality and a municipal entity must apply the same accounting policy when consolidated annual financial statements are prepared. This is a challenge because in the absence of a comprehensive set of GRAP standards, municipal entities will use International Public Sector Accounting Standards (IPSAS), International Accounting Standards (IAS) or South African Generally Accepted Accounting Practices (SA GAAP). What this means is that until the scope of GRAP standards is increased, there is likely to be differences in the accounting policies used by the municipality and its municipal entities. Assuming that a municipal entity applies SA GAAP in preparing its annual financial statements and a municipality applies the 3 GRAP standards and 8 GAMAP standards in preparing its annual financial statements, there will not be consistent accounting policies. There are two options to be considered when preparing consolidated annual financial statements. The first option is that the municipality applies SA GAAP to the extent that SA GAAP is consistent
Specimen Consolidated Municipal Annual Financial Statements
18
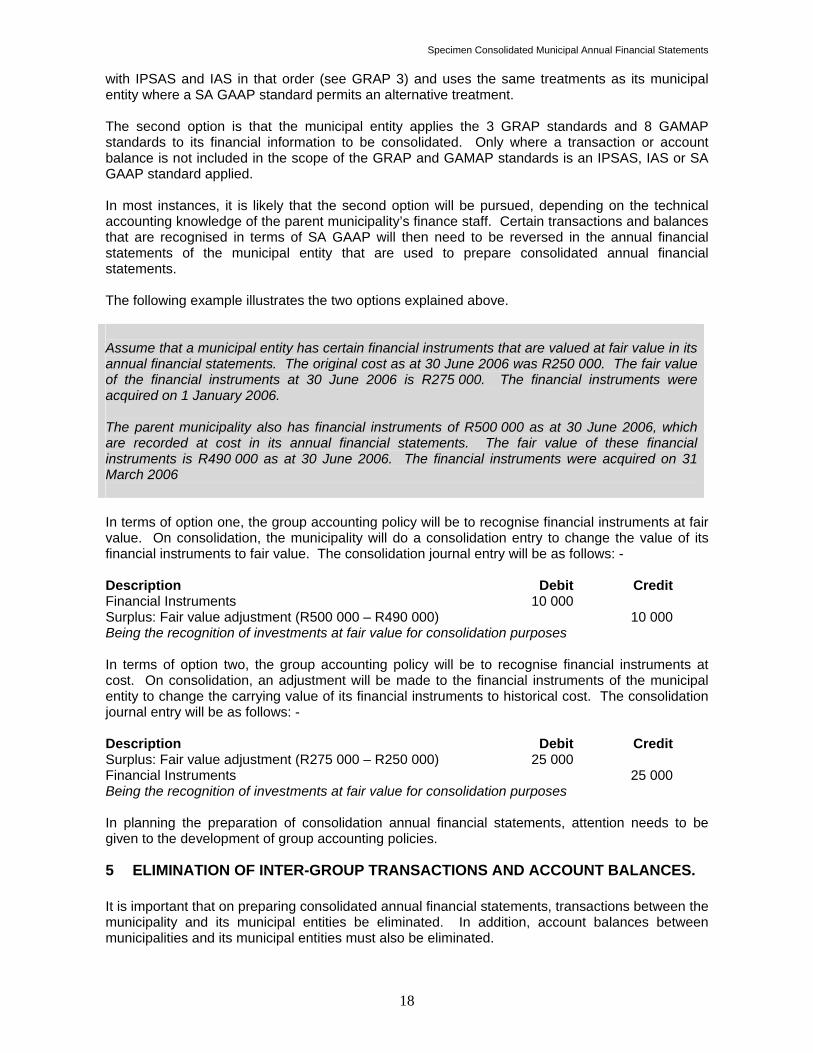
with IPSAS and IAS in that order (see GRAP 3) and uses the same treatments as its municipal entity where a SA GAAP standard permits an alternative treatment. The second option is that the municipal entity applies the 3 GRAP standards and 8 GAMAP standards to its financial information to be consolidated. Only where a transaction or account balance is not included in the scope of the GRAP and GAMAP standards is an IPSAS, IAS or SA GAAP standard applied. In most instances, it is likely that the second option will be pursued, depending on the technical accounting knowledge of the parent municipality’s finance staff. Certain transactions and balances that are recognised in terms of SA GAAP will then need to be reversed in the annual financial statements of the municipal entity that are used to prepare consolidated annual financial statements. The following example illustrates the two options explained above. Assume that a municipal entity has certain financial instruments that are valued at fair value in its annual financial statements. The original cost as at 30 June 2006 was R250 000. The fair value of the financial instruments at 30 June 2006 is R275 000. The financial instruments were acquired on 1 January 2006. The parent municipality also has financial instruments of R500 000 as at 30 June 2006, which are recorded at cost in its annual financial statements. The fair value of these financial instruments is R490 000 as at 30 June 2006. The financial instruments were acquired on 31 March 2006 In terms of option one, the group accounting policy will be to recognise financial instruments at fair value. On consolidation, the municipality will do a consolidation entry to change the value of its financial instruments to fair value. The consolidation journal entry will be as follows: - Description Debit CreditFinancial Instruments 10 000 Surplus: Fair value adjustment (R500 000 – R490 000) 10 000Being the recognition of investments at fair value for consolidation purposes In terms of option two, the group accounting policy will be to recognise financial instruments at cost. On consolidation, an adjustment will be made to the financial instruments of the municipal entity to change the carrying value of its financial instruments to historical cost. The consolidation journal entry will be as follows: - Description Debit CreditSurplus: Fair value adjustment (R275 000 – R250 000) 25 000 Financial Instruments 25 000Being the recognition of investments at fair value for consolidation purposes In planning the preparation of consolidation annual financial statements, attention needs to be given to the development of group accounting policies.
5 ELIMINATION OF INTER-GROUP TRANSACTIONS AND ACCOUNT BALANCES. It is important that on preparing consolidated annual financial statements, transactions between the municipality and its municipal entities be eliminated. In addition, account balances between municipalities and its municipal entities must also be eliminated.
Specimen Consolidated Municipal Annual Financial Statements
19
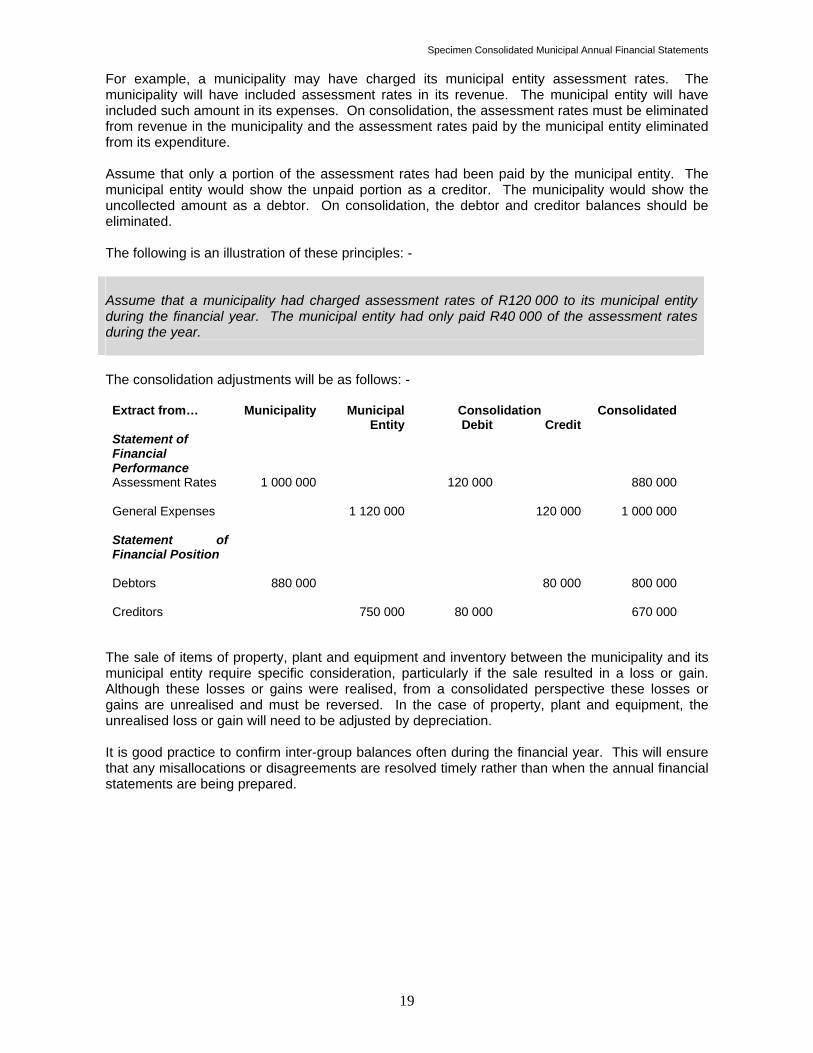
For example, a municipality may have charged its municipal entity assessment rates. The municipality will have included assessment rates in its revenue. The municipal entity will have included such amount in its expenses. On consolidation, the assessment rates must be eliminated from revenue in the municipality and the assessment rates paid by the municipal entity eliminated from its expenditure. Assume that only a portion of the assessment rates had been paid by the municipal entity. The municipal entity would show the unpaid portion as a creditor. The municipality would show the uncollected amount as a debtor. On consolidation, the debtor and creditor balances should be eliminated. The following is an illustration of these principles: - Assume that a municipality had charged assessment rates of R120 000 to its municipal entity during the financial year. The municipal entity had only paid R40 000 of the assessment rates during the year. The consolidation adjustments will be as follows: -
Consolidation Extract from… Municipality Municipal Entity Debit Credit
Consolidated
Statement of Financial Performance
Assessment Rates 1 000 000 120 000 880 000 General Expenses 1 120 000 120 000 1 000 000 Statement of Financial Position
Debtors 880 000 80 000 800 000 Creditors 750 000 80 000 670 000
The sale of items of property, plant and equipment and inventory between the municipality and its municipal entity require specific consideration, particularly if the sale resulted in a loss or gain. Although these losses or gains were realised, from a consolidated perspective these losses or gains are unrealised and must be reversed. In the case of property, plant and equipment, the unrealised loss or gain will need to be adjusted by depreciation. It is good practice to confirm inter-group balances often during the financial year. This will ensure that any misallocations or disagreements are resolved timely rather than when the annual financial statements are being prepared.
Specimen Consolidated Municipal Annual Financial Statements
20
SECTION FOUR: SUMMARY INFORMATION USED TO PREPARE THE SPECIMEN CONSOLIDATED ANNUAL FINANCIAL STATEMENTS
The specimen consolidated annual financial statements have been prepared based on the information included in this section.
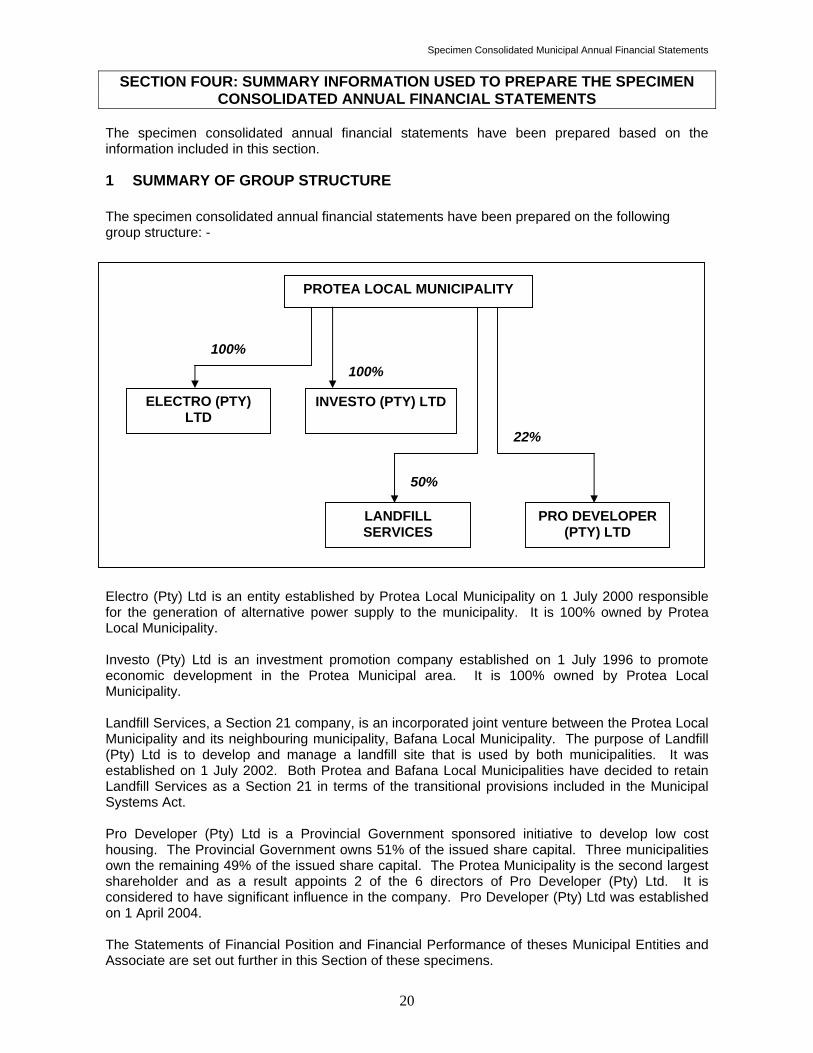
1 SUMMARY OF GROUP STRUCTURE The specimen consolidated annual financial statements have been prepared on the following group structure: - Electro (Pty) Ltd is an entity established by Protea Local Municipality on 1 July 2000 responsible for the generation of alternative power supply to the municipality. It is 100% owned by Protea Local Municipality. Investo (Pty) Ltd is an investment promotion company established on 1 July 1996 to promote economic development in the Protea Municipal area. It is 100% owned by Protea Local Municipality. Landfill Services, a Section 21 company, is an incorporated joint venture between the Protea Local Municipality and its neighbouring municipality, Bafana Local Municipality. The purpose of Landfill (Pty) Ltd is to develop and manage a landfill site that is used by both municipalities. It was established on 1 July 2002. Both Protea and Bafana Local Municipalities have decided to retain Landfill Services as a Section 21 in terms of the transitional provisions included in the Municipal Systems Act. Pro Developer (Pty) Ltd is a Provincial Government sponsored initiative to develop low cost housing. The Provincial Government owns 51% of the issued share capital. Three municipalities own the remaining 49% of the issued share capital. The Protea Municipality is the second largest shareholder and as a result appoints 2 of the 6 directors of Pro Developer (Pty) Ltd. It is considered to have significant influence in the company. Pro Developer (Pty) Ltd was established on 1 April 2004. The Statements of Financial Position and Financial Performance of theses Municipal Entities and Associate are set out further in this Section of these specimens.
PROTEA LOCAL MUNICIPALITY
ELECTRO (PTY) LTD
INVESTO (PTY) LTD
LANDFILL SERVICES
PRO DEVELOPER (PTY) LTD
22%
50%
100%100%
Specimen Consolidated Municipal Annual Financial Statements
21
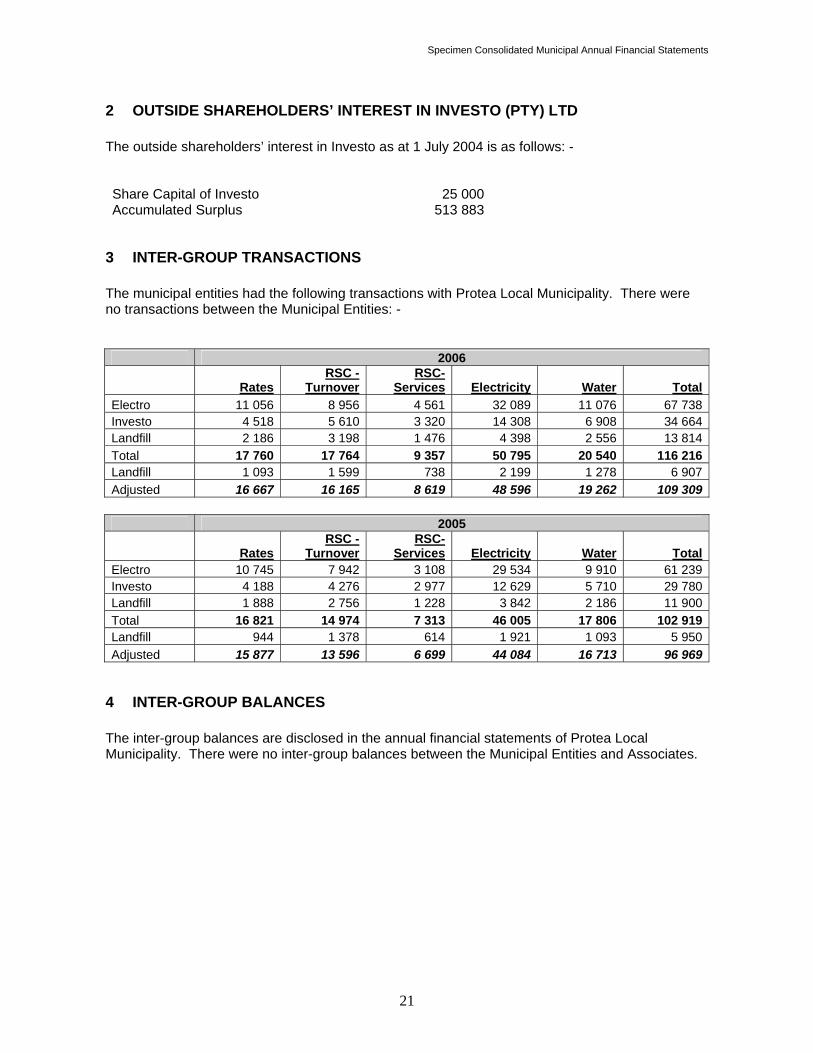
2 OUTSIDE SHAREHOLDERS’ INTEREST IN INVESTO (PTY) LTD The outside shareholders’ interest in Investo as at 1 July 2004 is as follows: - Share Capital of Investo 25 000Accumulated Surplus 513 883
3 INTER-GROUP TRANSACTIONS The municipal entities had the following transactions with Protea Local Municipality. There were no transactions between the Municipal Entities: - 2006
Rates RSC -
TurnoverRSC-
Services Electricity Water TotalElectro 11 056 8 956 4 561 32 089 11 076 67 738Investo 4 518 5 610 3 320 14 308 6 908 34 664Landfill 2 186 3 198 1 476 4 398 2 556 13 814Total 17 760 17 764 9 357 50 795 20 540 116 216Landfill 1 093 1 599 738 2 199 1 278 6 907Adjusted 16 667 16 165 8 619 48 596 19 262 109 309 2005
Rates RSC -
TurnoverRSC-
Services Electricity Water TotalElectro 10 745 7 942 3 108 29 534 9 910 61 239Investo 4 188 4 276 2 977 12 629 5 710 29 780Landfill 1 888 2 756 1 228 3 842 2 186 11 900Total 16 821 14 974 7 313 46 005 17 806 102 919Landfill 944 1 378 614 1 921 1 093 5 950Adjusted 15 877 13 596 6 699 44 084 16 713 96 969
4 INTER-GROUP BALANCES The inter-group balances are disclosed in the annual financial statements of Protea Local Municipality. There were no inter-group balances between the Municipal Entities and Associates.
Specimen Consolidated Municipal Annual Financial Statements
22
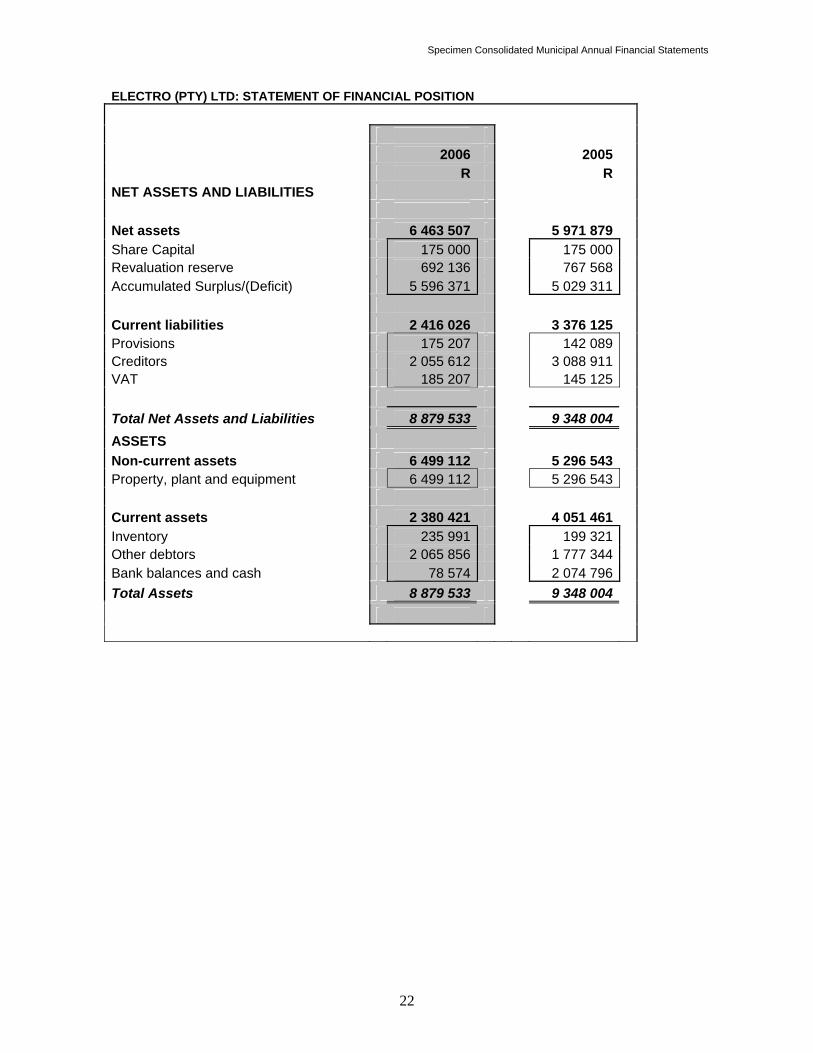
ELECTRO (PTY) LTD: STATEMENT OF FINANCIAL POSITION
2006 2005 R R NET ASSETS AND LIABILITIES Net assets 6 463 507 5 971 879 Share Capital 175 000 175 000 Revaluation reserve 692 136 767 568 Accumulated Surplus/(Deficit) 5 596 371 5 029 311 Current liabilities 2 416 026 3 376 125 Provisions 175 207 142 089 Creditors 2 055 612 3 088 911 VAT 185 207 145 125 Total Net Assets and Liabilities 8 879 533 9 348 004 ASSETS Non-current assets 6 499 112 5 296 543 Property, plant and equipment 6 499 112 5 296 543 Current assets 2 380 421 4 051 461 Inventory 235 991 199 321 Other debtors 2 065 856 1 777 344 Bank balances and cash 78 574 2 074 796 Total Assets 8 879 533 9 348 004
Specimen Consolidated Municipal Annual Financial Statements
23
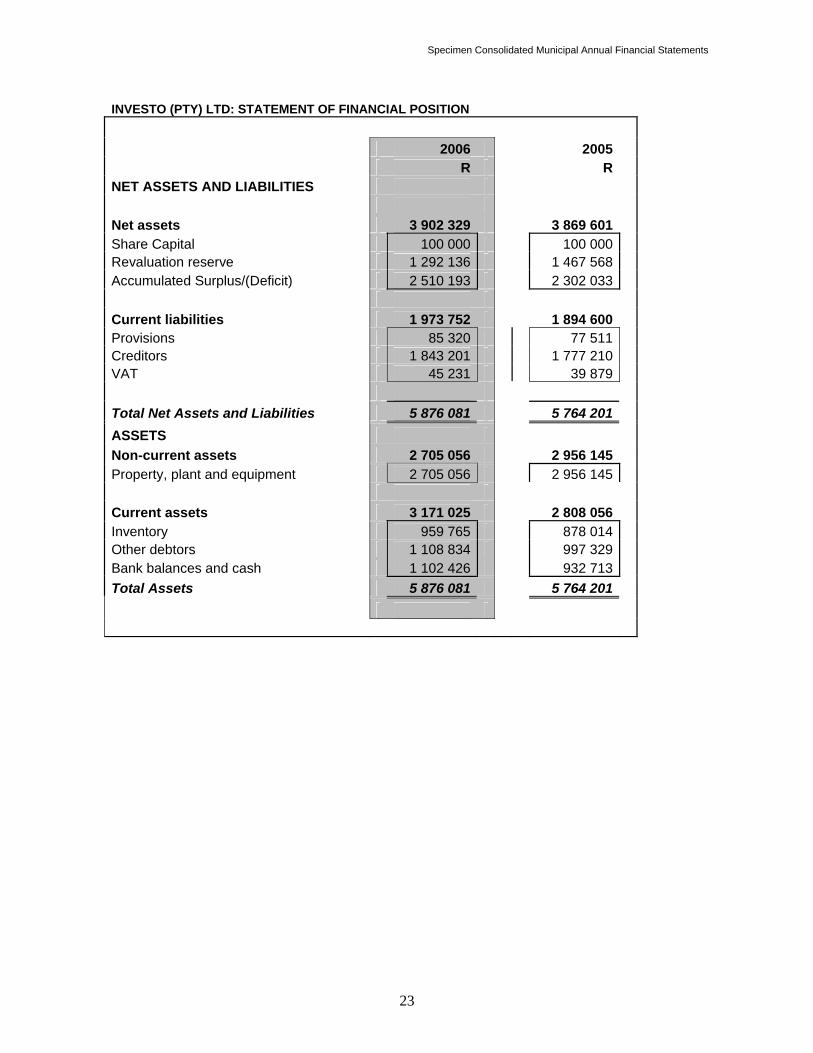
INVESTO (PTY) LTD: STATEMENT OF FINANCIAL POSITION
2006 2005 R R NET ASSETS AND LIABILITIES Net assets 3 902 329 3 869 601 Share Capital 100 000 100 000 Revaluation reserve 1 292 136 1 467 568 Accumulated Surplus/(Deficit) 2 510 193 2 302 033 Current liabilities 1 973 752 1 894 600 Provisions 85 320 77 511 Creditors 1 843 201 1 777 210 VAT 45 231 39 879 Total Net Assets and Liabilities 5 876 081 5 764 201 ASSETS Non-current assets 2 705 056 2 956 145 Property, plant and equipment 2 705 056 2 956 145 Current assets 3 171 025 2 808 056 Inventory 959 765 878 014 Other debtors 1 108 834 997 329 Bank balances and cash 1 102 426 932 713 Total Assets 5 876 081 5 764 201
Specimen Consolidated Municipal Annual Financial Statements
24
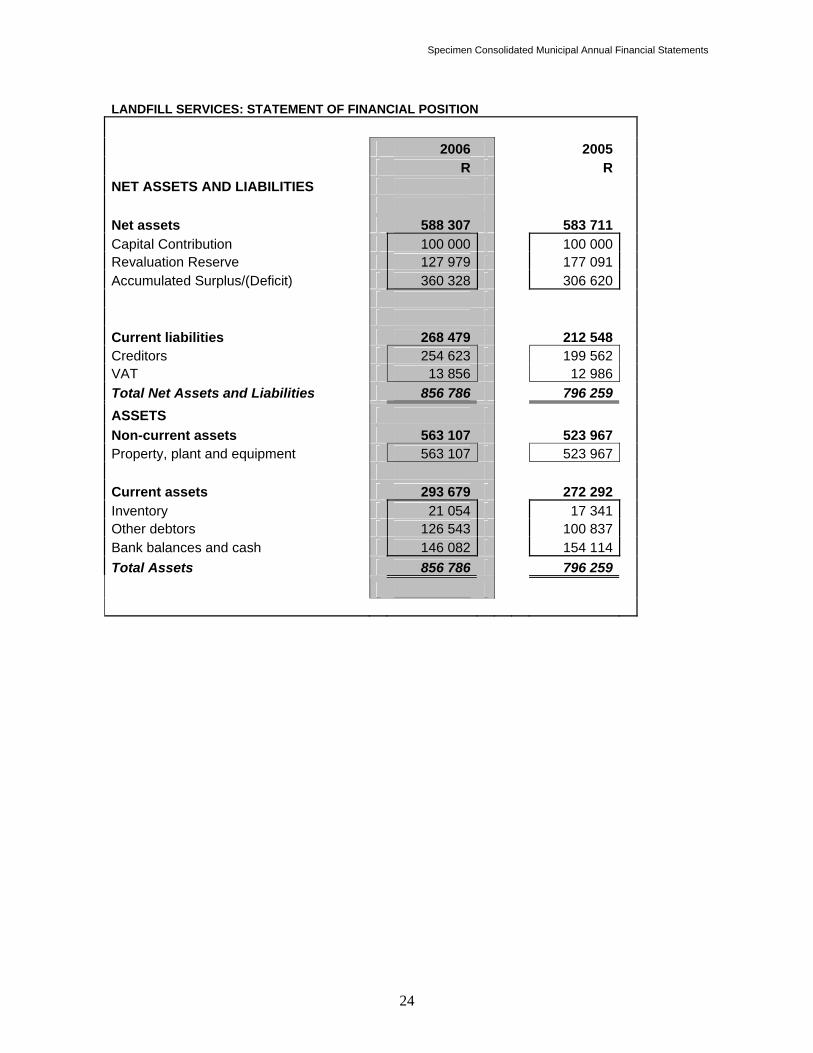
LANDFILL SERVICES: STATEMENT OF FINANCIAL POSITION
2006 2005 R R NET ASSETS AND LIABILITIES Net assets 588 307 583 711 Capital Contribution 100 000 100 000 Revaluation Reserve 127 979 177 091 Accumulated Surplus/(Deficit) 360 328 306 620 Current liabilities 268 479 212 548 Creditors 254 623 199 562 VAT 13 856 12 986 Total Net Assets and Liabilities 856 786 796 259 ASSETS Non-current assets 563 107 523 967 Property, plant and equipment 563 107 523 967 Current assets 293 679 272 292 Inventory 21 054 17 341 Other debtors 126 543 100 837 Bank balances and cash 146 082 154 114 Total Assets 856 786 796 259
Specimen Consolidated Municipal Annual Financial Statements
25
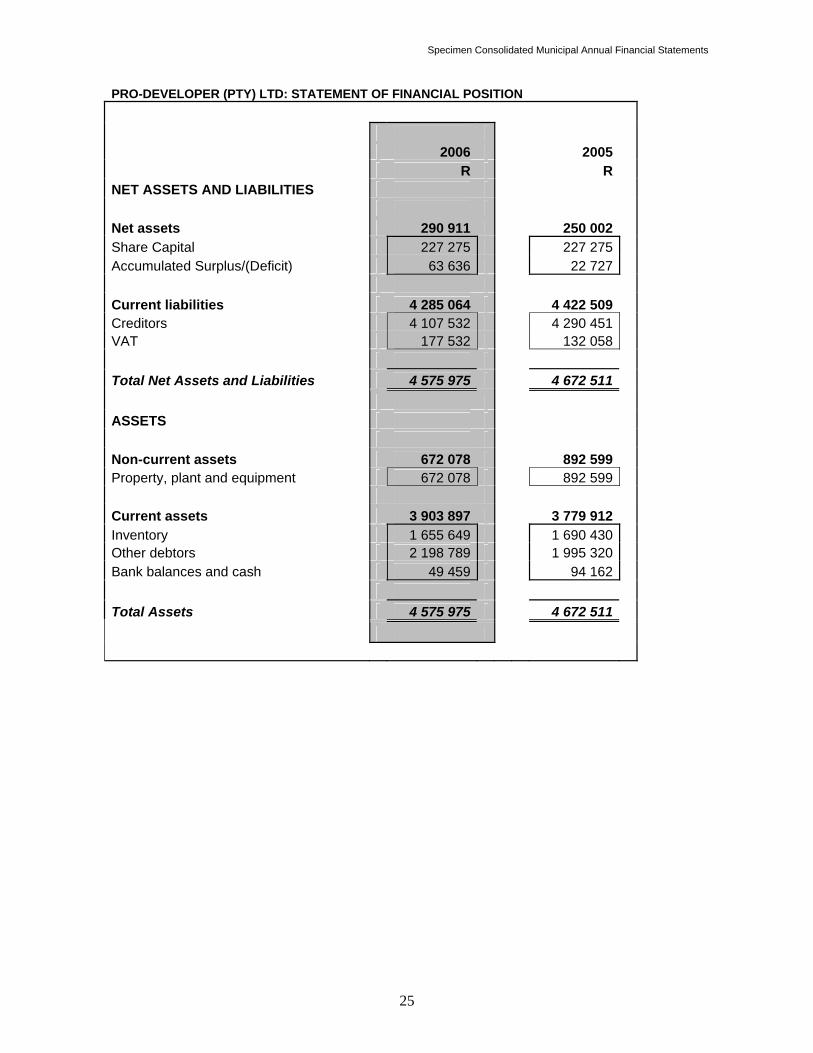
PRO-DEVELOPER (PTY) LTD: STATEMENT OF FINANCIAL POSITION
2006 2005 R R NET ASSETS AND LIABILITIES Net assets 290 911 250 002 Share Capital 227 275 227 275 Accumulated Surplus/(Deficit) 63 636 22 727 Current liabilities 4 285 064 4 422 509 Creditors 4 107 532 4 290 451 VAT 177 532 132 058 Total Net Assets and Liabilities 4 575 975 4 672 511 ASSETS Non-current assets 672 078 892 599 Property, plant and equipment 672 078 892 599 Current assets 3 903 897 3 779 912 Inventory 1 655 649 1 690 430 Other debtors 2 198 789 1 995 320 Bank balances and cash 49 459 94 162 Total Assets 4 575 975 4 672 511
Specimen Consolidated Municipal Annual Financial Statements
26
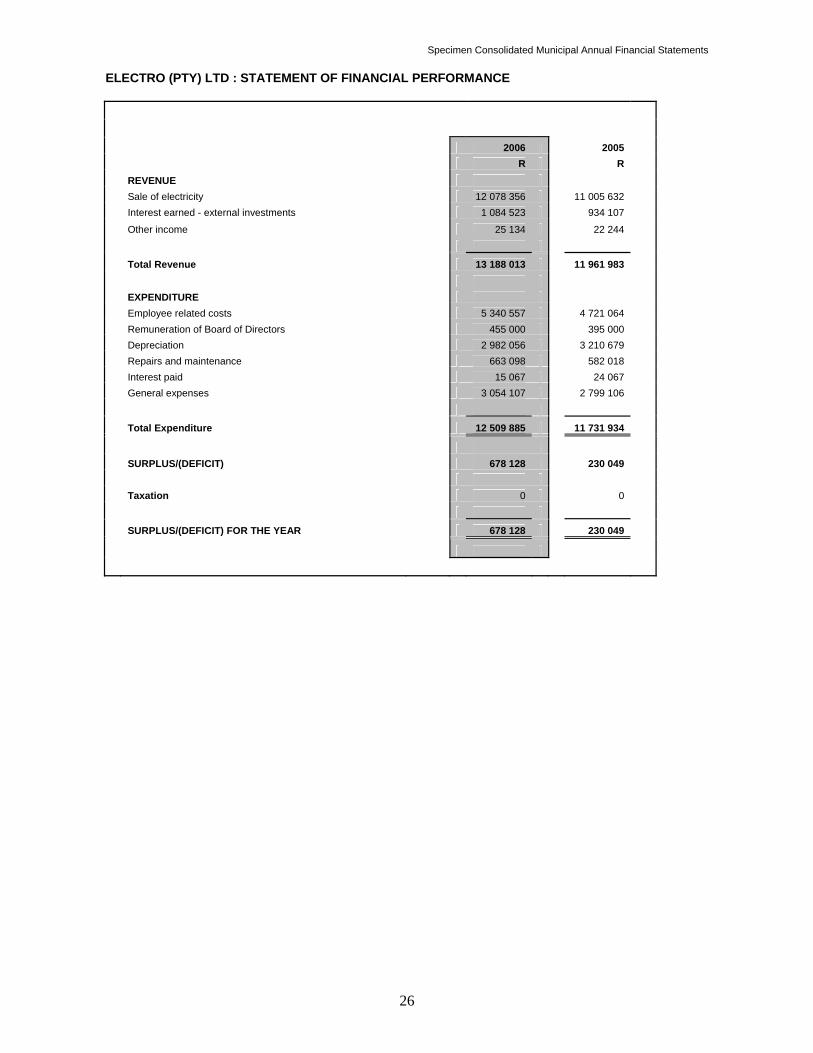
ELECTRO (PTY) LTD : STATEMENT OF FINANCIAL PERFORMANCE
2006 2005 R R
REVENUE Sale of electricity 12 078 356 11 005 632 Interest earned - external investments 1 084 523 934 107
Other income 25 134 22 244
Total Revenue 13 188 013 11 961 983
EXPENDITURE Employee related costs 5 340 557 4 721 064 Remuneration of Board of Directors 455 000 395 000 Depreciation 2 982 056 3 210 679 Repairs and maintenance 663 098 582 018 Interest paid 15 067 24 067 General expenses 3 054 107 2 799 106
Total Expenditure 12 509 885 11 731 934
SURPLUS/(DEFICIT) 678 128 230 049 Taxation 0 0
SURPLUS/(DEFICIT) FOR THE YEAR 678 128 230 049
Specimen Consolidated Municipal Annual Financial Statements
27
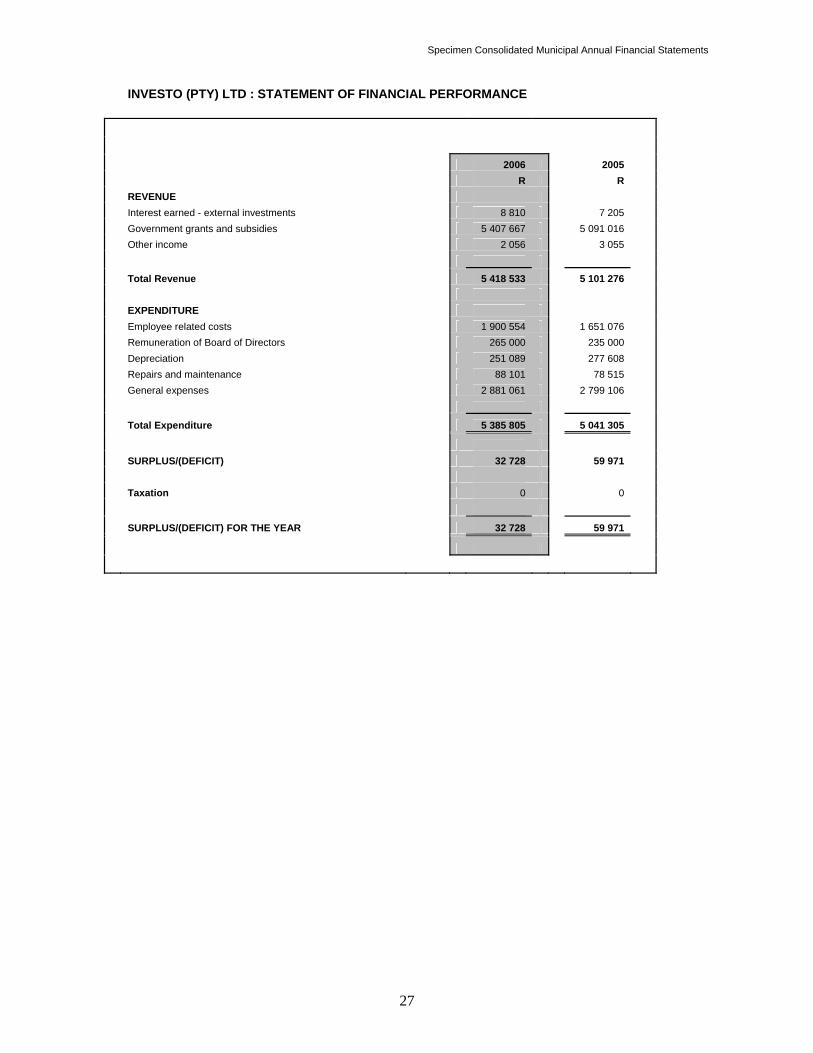
INVESTO (PTY) LTD : STATEMENT OF FINANCIAL PERFORMANCE
2006 2005 R R REVENUE Interest earned - external investments 8 810 7 205 Government grants and subsidies 5 407 667 5 091 016 Other income 2 056 3 055
Total Revenue 5 418 533 5 101 276 EXPENDITURE Employee related costs 1 900 554 1 651 076 Remuneration of Board of Directors 265 000 235 000 Depreciation 251 089 277 608 Repairs and maintenance 88 101 78 515 General expenses 2 881 061 2 799 106
Total Expenditure 5 385 805 5 041 305
SURPLUS/(DEFICIT) 32 728 59 971 Taxation 0 0
SURPLUS/(DEFICIT) FOR THE YEAR 32 728 59 971
Specimen Consolidated Municipal Annual Financial Statements
28
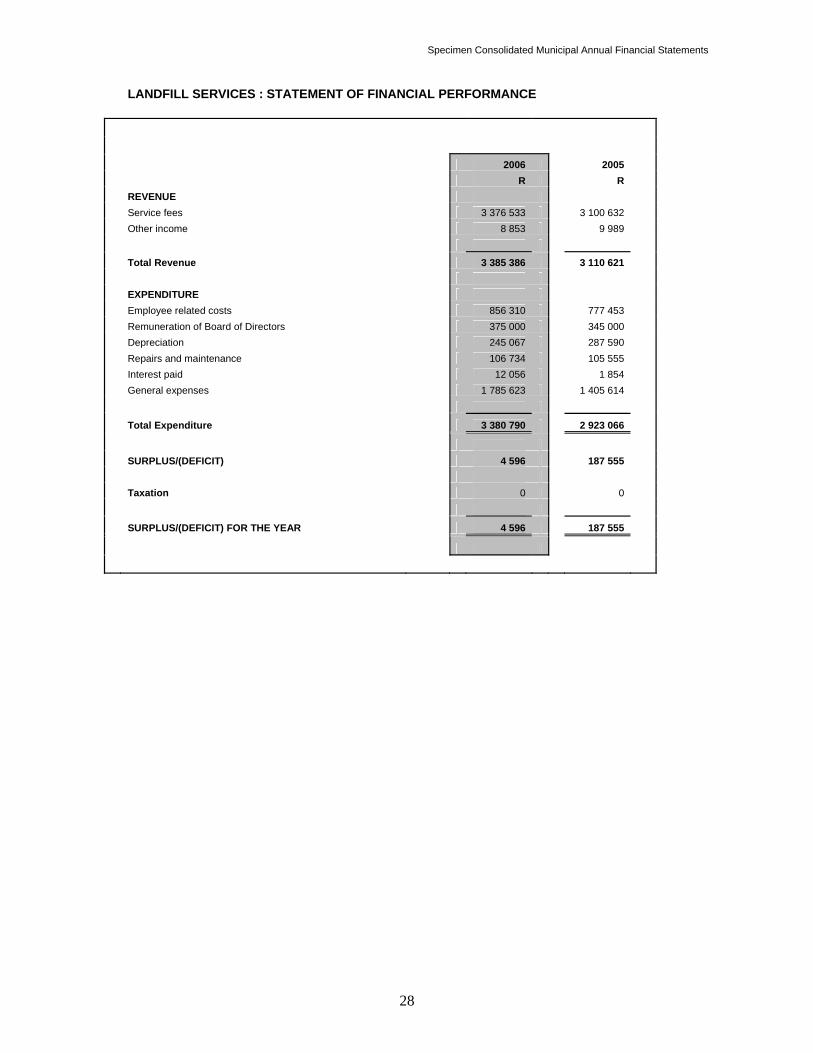
LANDFILL SERVICES : STATEMENT OF FINANCIAL PERFORMANCE
2006 2005 R R REVENUE Service fees 3 376 533 3 100 632 Other income 8 853 9 989
Total Revenue 3 385 386 3 110 621 EXPENDITURE Employee related costs 856 310 777 453 Remuneration of Board of Directors 375 000 345 000 Depreciation 245 067 287 590 Repairs and maintenance 106 734 105 555 Interest paid 12 056 1 854 General expenses 1 785 623 1 405 614
Total Expenditure 3 380 790 2 923 066
SURPLUS/(DEFICIT) 4 596 187 555 Taxation 0 0
SURPLUS/(DEFICIT) FOR THE YEAR 4 596 187 555
Specimen Consolidated Municipal Annual Financial Statements
29
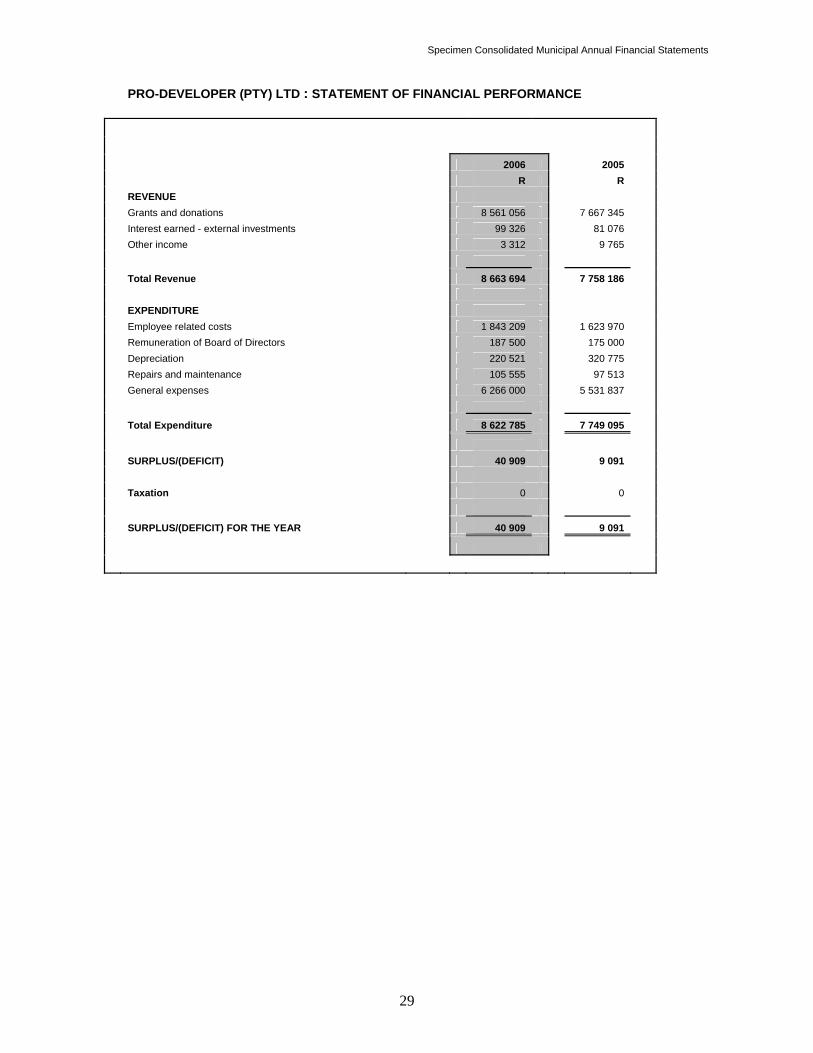
PRO-DEVELOPER (PTY) LTD : STATEMENT OF FINANCIAL PERFORMANCE
2006 2005 R R REVENUE Grants and donations 8 561 056 7 667 345 Interest earned - external investments 99 326 81 076 Other income 3 312 9 765
Total Revenue 8 663 694 7 758 186 EXPENDITURE Employee related costs 1 843 209 1 623 970 Remuneration of Board of Directors 187 500 175 000 Depreciation 220 521 320 775 Repairs and maintenance 105 555 97 513 General expenses 6 266 000 5 531 837
Total Expenditure 8 622 785 7 749 095
SURPLUS/(DEFICIT) 40 909 9 091 Taxation 0 0
SURPLUS/(DEFICIT) FOR THE YEAR 40 909 9 091
Specimen Consolidated Municipal Annual Financial Statements
30
PROTEA LOCAL MUNICIPALITY
CONSOLIDATED ANNUAL FINANCIAL STATEMENTS
for the year ended
30 June 2006
I am responsible for the preparation of these consolidated annual financial statements, which are set out on pages x to x, in terms of Section 126(1) of the Municipal Finance Management Act and which I have signed on behalf of the Municipality. I certify that the salaries, allowances and benefits of Councillors as disclosed in note 25 of these annual financial statements are within the upper limits of the framework envisaged in Section 219 of the Constitution, read with the Remuneration of Public Officer Bearers Act and the Minister of Provincial and Local Government’s determination in accordance with this Act. (Name) Date Municipal Manager
Specimen Consolidated Municipal Annual Financial Statements
31
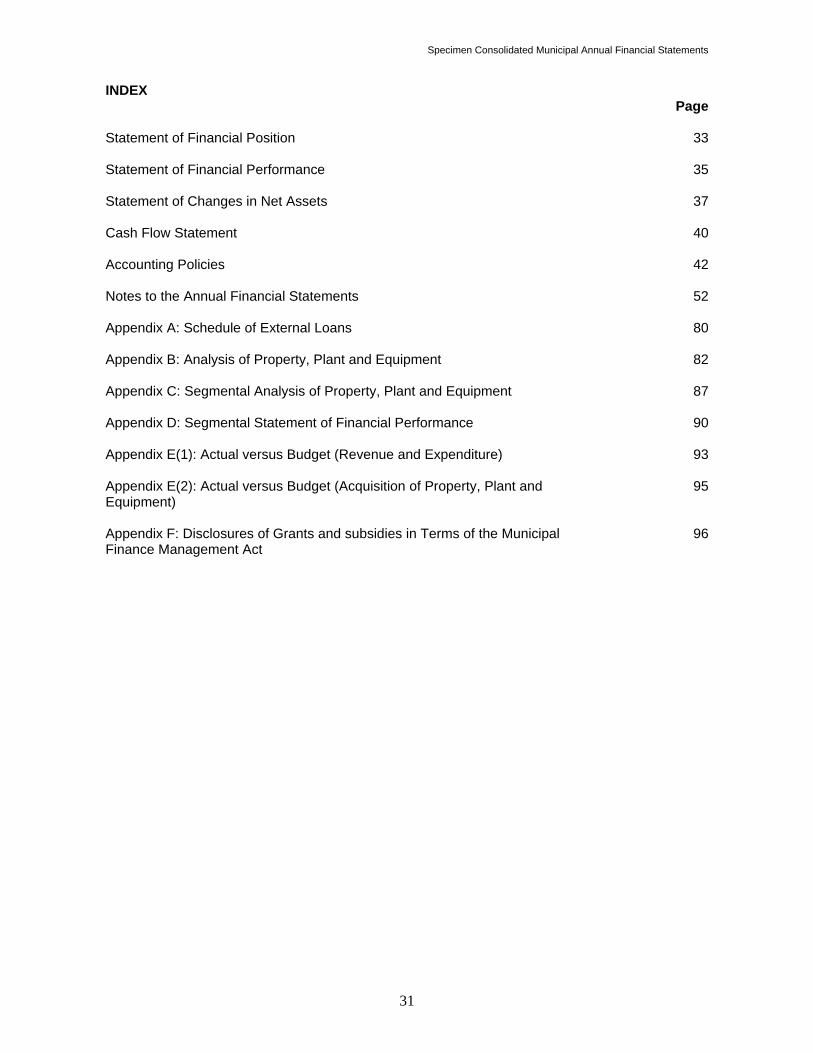
INDEX
Page
Statement of Financial Position
33
Statement of Financial Performance
35
Statement of Changes in Net Assets
37
Cash Flow Statement
40
Accounting Policies
42
Notes to the Annual Financial Statements
52
Appendix A: Schedule of External Loans
80
Appendix B: Analysis of Property, Plant and Equipment
82
Appendix C: Segmental Analysis of Property, Plant and Equipment
87
Appendix D: Segmental Statement of Financial Performance
90
Appendix E(1): Actual versus Budget (Revenue and Expenditure)
93
Appendix E(2): Actual versus Budget (Acquisition of Property, Plant and Equipment)
95
Appendix F: Disclosures of Grants and subsidies in Terms of the Municipal Finance Management Act
96
Specimen Consolidated Municipal Annual Financial Statements
32
Explanatory Notes: Specific Consolidation Matters
The following requirements are contained in GAMAP 6, 7 and 8 but are not illustrated fully in these Specimen Consolidated Annual Financial Statements. The reasons for not consolidating a controlled entity must be set out. Where the reporting date of an associate differs from that of the municipality, adjustments must be made for transactions and balances between the associates reporting date and that of the municipality (GAMAP 7.25). As required by GAMAP 7.31 (a), the following disclosures must be set out for investments in Associates: Summarised financial information in regard to asset, liabilities and the results of the operations of significant associates
presented individually or in aggregate (GAMAP 7.31(d)); The gross amount of loans made to the associate or received from associate by the investor (GAMAP 7.31(f)); Accounting periods for which the financial statement of the associate has been prepared where they are different from that of
the investor (GAMAP 7.31(g); and Gains and losses on the sale of shares or other dilutions in associates by the investor.
It should be noted that when an associate has outstanding cumulative preferred shares, the municipality must compute its share of surpluses or deficits after adjusting for the preferred dividends (GAMAP 7.27) GAMAP 6.11, GAMAP 7.10 and GAMAP 8.36 provide for certain circumstances where a controlled entity, investment in an associate and an interest in a jointly controlled entity shall be excluded from consolidation. These circumstances have not been set out in these specimen annual financial statements. In terms of GAMAP 6.43, a list of significant controlled entities including the name, the jurisdiction in which it operates when different from that of the controlling entity, proportion of ownership interest and, where that interest is in the form of shares and the proportion of voting power held where this is different from the proportionate ownership interest must be disclosed.

Specimen Consolidated Municipal Annual Financial Statements
33
Explanatory Notes: Statement of Financial Position
The Minorities’ Interests in the Net Assets of the subsidiary of Protea Local Municipality is shown in the consolidated Statement of Changes in Net Assets and on the face of the Statement of Financial Position. The investments of Protea Local Municipality in its municipal entities are eliminated on consolidation. All indebtness between Protea Local Municipality and its municipal entities are also eliminated on consolidation
Specimen Consolidated Municipal Annual Financial Statements
34
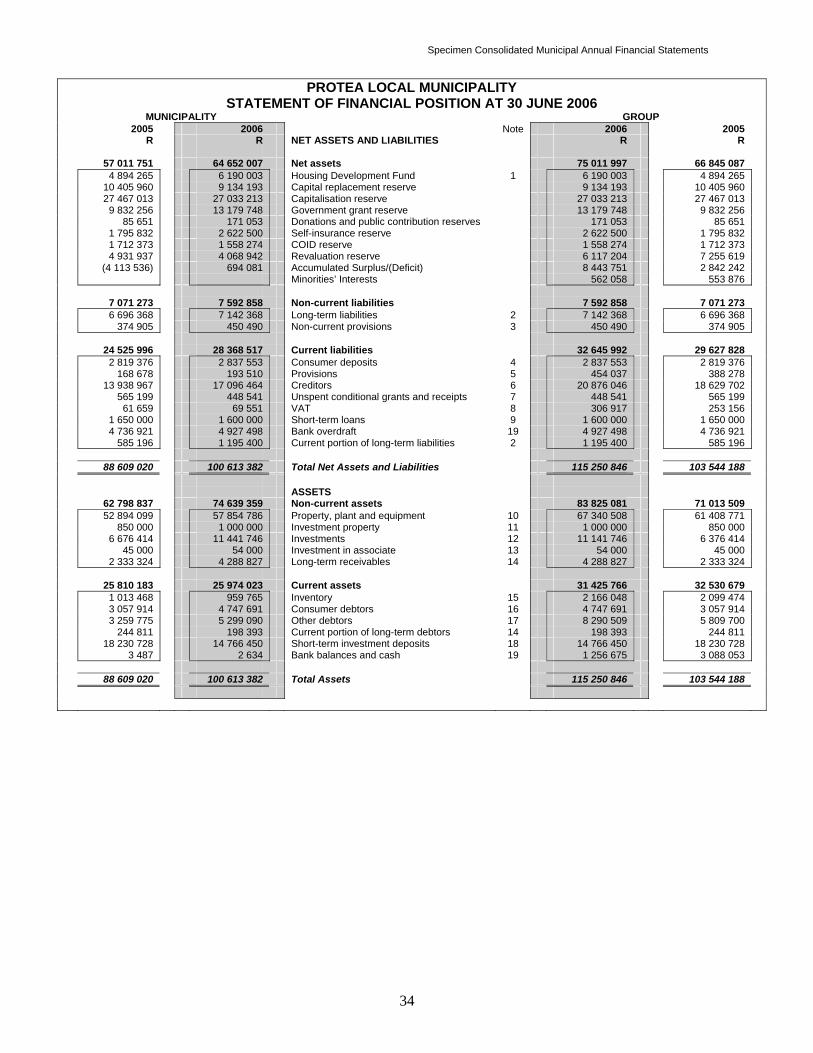
PROTEA LOCAL MUNICIPALITY STATEMENT OF FINANCIAL POSITION AT 30 JUNE 2006
MUNICIPALITY GROUP 2005 2006 Note 2006 2005 R R NET ASSETS AND LIABILITIES R R 57 011 751 64 652 007 Net assets 75 011 997 66 845 087 4 894 265 6 190 003 Housing Development Fund 1 6 190 003 4 894 265 10 405 960 9 134 193 Capital replacement reserve 9 134 193 10 405 960 27 467 013 27 033 213 Capitalisation reserve 27 033 213 27 467 013 9 832 256 13 179 748 Government grant reserve 13 179 748 9 832 256 85 651 171 053 Donations and public contribution reserves 171 053 85 651 1 795 832 2 622 500 Self-insurance reserve 2 622 500 1 795 832 1 712 373 1 558 274 COID reserve 1 558 274 1 712 373 4 931 937 4 068 942 Revaluation reserve 6 117 204 7 255 619 (4 113 536) 694 081 Accumulated Surplus/(Deficit) 8 443 751 2 842 242 Minorities’ Interests 562 058 553 876 7 071 273 7 592 858 Non-current liabilities 7 592 858 7 071 273 6 696 368 7 142 368 Long-term liabilities 2 7 142 368 6 696 368 374 905 450 490 Non-current provisions 3 450 490 374 905 24 525 996 28 368 517 Current liabilities 32 645 992 29 627 828 2 819 376 2 837 553 Consumer deposits 4 2 837 553 2 819 376 168 678 193 510 Provisions 5 454 037 388 278 13 938 967 17 096 464 Creditors 6 20 876 046 18 629 702 565 199 448 541 Unspent conditional grants and receipts 7 448 541 565 199 61 659 69 551 VAT 8 306 917 253 156 1 650 000 1 600 000 Short-term loans 9 1 600 000 1 650 000 4 736 921 4 927 498 Bank overdraft 19 4 927 498 4 736 921 585 196 1 195 400 Current portion of long-term liabilities 2 1 195 400 585 196 88 609 020 100 613 382 Total Net Assets and Liabilities 115 250 846 103 544 188 ASSETS 62 798 837 74 639 359 Non-current assets 83 825 081 71 013 509 52 894 099 57 854 786 Property, plant and equipment 10 67 340 508 61 408 771 850 000 1 000 000 Investment property 11 1 000 000 850 000 6 676 414 11 441 746 Investments 12 11 141 746 6 376 414 45 000 54 000 Investment in associate 13 54 000 45 000 2 333 324 4 288 827 Long-term receivables 14 4 288 827 2 333 324 25 810 183 25 974 023 Current assets 31 425 766 32 530 679 1 013 468 959 765 Inventory 15 2 166 048 2 099 474 3 057 914 4 747 691 Consumer debtors 16 4 747 691 3 057 914 3 259 775 5 299 090 Other debtors 17 8 290 509 5 809 700 244 811 198 393 Current portion of long-term debtors 14 198 393 244 811 18 230 728 14 766 450 Short-term investment deposits 18 14 766 450 18 230 728 3 487 2 634 Bank balances and cash 19 1 256 675 3 088 053 88 609 020 100 613 382 Total Assets 115 250 846 103 544 188

Specimen Consolidated Municipal Annual Financial Statements
35
Explanatory Notes: Statement of Financial Performance
The minorities’ interest in the net surplus for the year is transferred to the Minorities Interest reflected in the Statement of Net Assets.. Dividends, inter-group charges for rates, services and levies have been eliminated on consolidation. Should a municipality dispose of shares in a controlled entity, an associate or in an incorporated joint venture, an additional line item will need to appear on the face of the Statement of Financial Performance titled “gains or losses on the sale or dilutions of shares”. As required by GAMAP 12.43(a) and (b), the statement of financial performance should also require the disclosure of either the cost of inventories recognised as an expense during the period, or the operating costs applicable to revenues, recognised as an expense during the period, classified by their nature.
Specimen Consolidated Municipal Annual Financial Statements
36
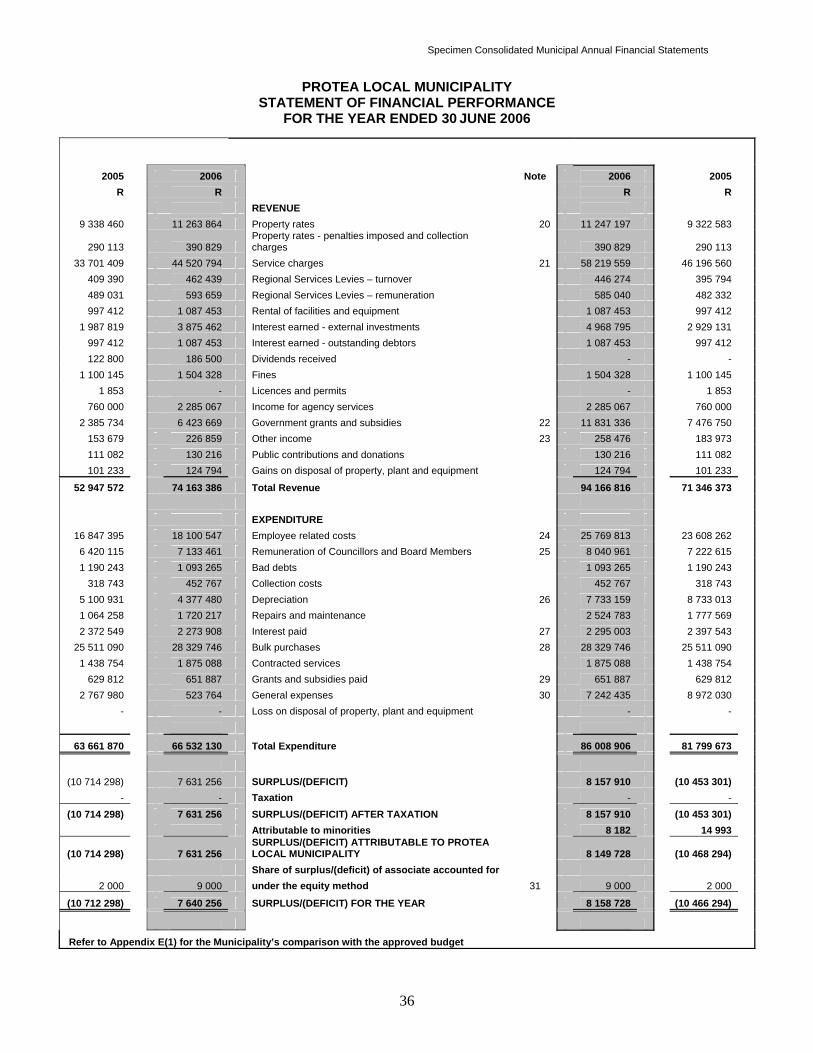
PROTEA LOCAL MUNICIPALITY STATEMENT OF FINANCIAL PERFORMANCE
FOR THE YEAR ENDED 30 JUNE 2006
2005 2006 Note 2006 2005 R R R R
REVENUE 9 338 460 11 263 864 Property rates 20 11 247 197 9 322 583
290 113 390 829 Property rates - penalties imposed and collection charges 390 829 290 113
33 701 409 44 520 794 Service charges 21 58 219 559 46 196 560 409 390 462 439 Regional Services Levies – turnover 446 274 395 794 489 031 593 659 Regional Services Levies – remuneration 585 040 482 332 997 412 1 087 453 Rental of facilities and equipment 1 087 453 997 412
1 987 819 3 875 462 Interest earned - external investments 4 968 795 2 929 131 997 412 1 087 453 Interest earned - outstanding debtors 1 087 453 997 412 122 800 186 500 Dividends received - -
1 100 145 1 504 328 Fines 1 504 328 1 100 145 1 853 - Licences and permits - 1 853
760 000 2 285 067 Income for agency services 2 285 067 760 000 2 385 734 6 423 669 Government grants and subsidies 22 11 831 336 7 476 750
153 679 226 859 Other income 23 258 476 183 973 111 082 130 216 Public contributions and donations 130 216 111 082 101 233 124 794 Gains on disposal of property, plant and equipment 124 794 101 233
52 947 572 74 163 386 Total Revenue 94 166 816 71 346 373 EXPENDITURE
16 847 395 18 100 547 Employee related costs 24 25 769 813 23 608 262 6 420 115 7 133 461 Remuneration of Councillors and Board Members 25 8 040 961 7 222 615 1 190 243 1 093 265 Bad debts 1 093 265 1 190 243
318 743 452 767 Collection costs 452 767 318 743 5 100 931 4 377 480 Depreciation 26 7 733 159 8 733 013 1 064 258 1 720 217 Repairs and maintenance 2 524 783 1 777 569 2 372 549 2 273 908 Interest paid 27 2 295 003 2 397 543
25 511 090 28 329 746 Bulk purchases 28 28 329 746 25 511 090 1 438 754 1 875 088 Contracted services 1 875 088 1 438 754
629 812 651 887 Grants and subsidies paid 29 651 887 629 812 2 767 980 523 764 General expenses 30 7 242 435 8 972 030
- - Loss on disposal of property, plant and equipment - -
63 661 870 66 532 130 Total Expenditure 86 008 906 81 799 673
(10 714 298) 7 631 256 SURPLUS/(DEFICIT) 8 157 910 (10 453 301)
- - Taxation - - (10 714 298) 7 631 256 SURPLUS/(DEFICIT) AFTER TAXATION 8 157 910 (10 453 301)
Attributable to minorities 8 182 14 993
(10 714 298) 7 631 256 SURPLUS/(DEFICIT) ATTRIBUTABLE TO PROTEA LOCAL MUNICIPALITY 8 149 728 (10 468 294)
Share of surplus/(deficit) of associate accounted for 2 000 9 000 under the equity method 31 9 000 2 000
(10 712 298) 7 640 256 SURPLUS/(DEFICIT) FOR THE YEAR 8 158 728 (10 466 294)
Refer to Appendix E(1) for the Municipality’s comparison with the approved budget

Specimen Consolidated Municipal Annual Financial Statements
37
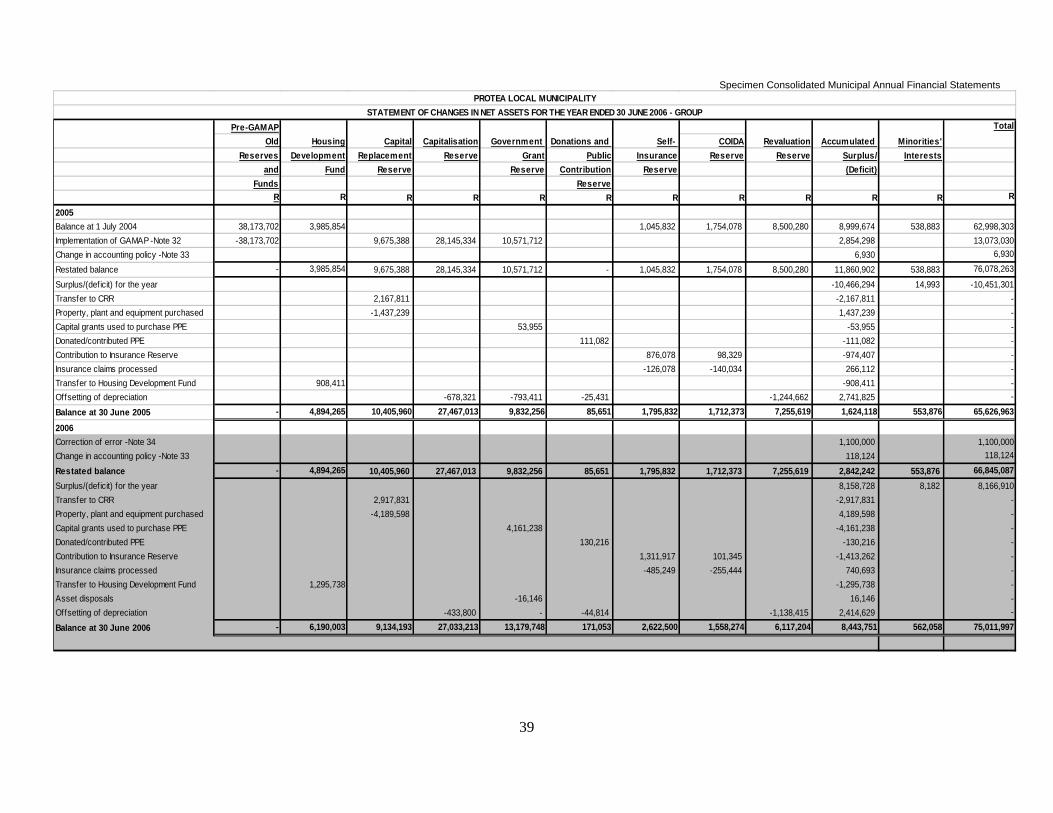
Explanatory Notes: Statement of Changes in Net Assets There are two Statements of Changes in Net Assets; one for the Municipality and one for the Group.
Specimen Consolidated Municipal Annual Financial Statements
38
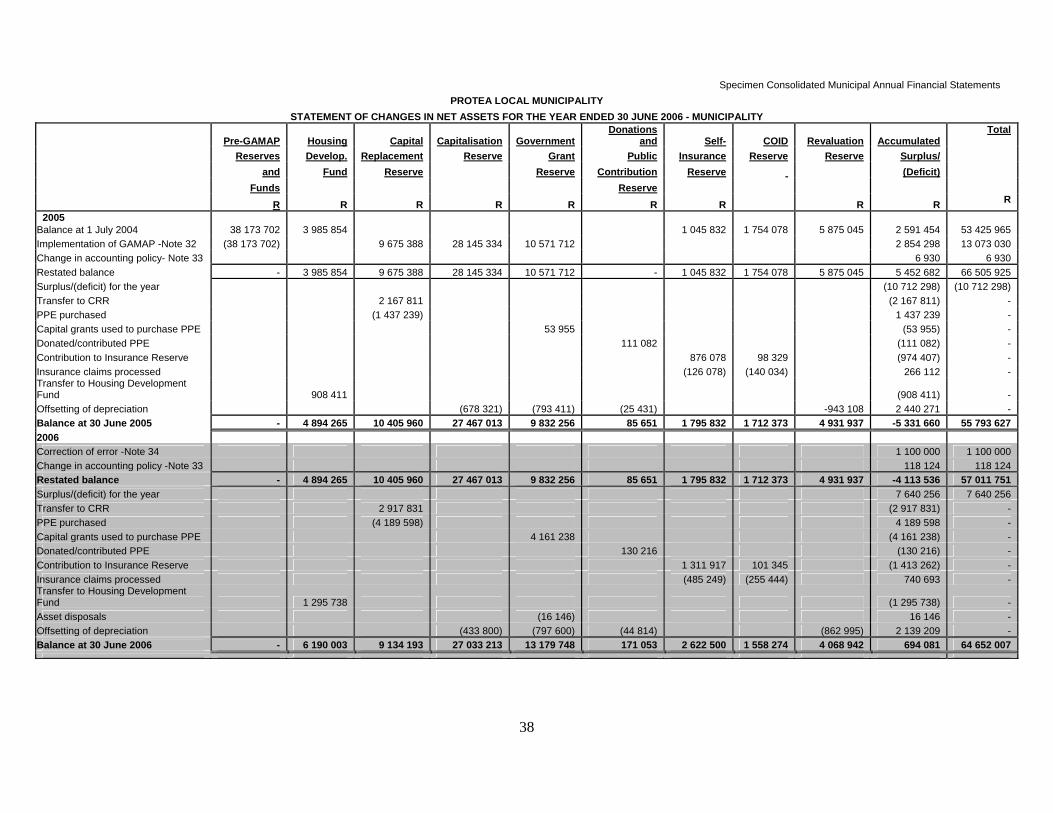
PROTEA LOCAL MUNICIPALITY STATEMENT OF CHANGES IN NET ASSETS FOR THE YEAR ENDED 30 JUNE 2006 - MUNICIPALITY
Pre-GAMAP Housing Capital Capitalisation Government Donations
and Self-
COID Revaluation Accumulated Total
Reserves Develop. Replacement Reserve Grant Public Insurance Reserve Reserve Surplus/
and Fund Reserve Reserve Contribution Reserve (Deficit)
Funds Reserve
R R R R R R R R R R
2005 Balance at 1 July 2004 38 173 702 3 985 854 1 045 832 1 754 078 5 875 045 2 591 454 53 425 965 Implementation of GAMAP -Note 32 (38 173 702) 9 675 388 28 145 334 10 571 712 2 854 298 13 073 030 Change in accounting policy- Note 33 6 930 6 930 Restated balance - 3 985 854 9 675 388 28 145 334 10 571 712 - 1 045 832 1 754 078 5 875 045 5 452 682 66 505 925 Surplus/(deficit) for the year (10 712 298) (10 712 298) Transfer to CRR 2 167 811 (2 167 811) - PPE purchased (1 437 239) 1 437 239 - Capital grants used to purchase PPE 53 955 (53 955) - Donated/contributed PPE 111 082 (111 082) - Contribution to Insurance Reserve 876 078 98 329 (974 407) - Insurance claims processed (126 078) (140 034) 266 112 - Transfer to Housing Development Fund 908 411 (908 411) - Offsetting of depreciation (678 321) (793 411) (25 431) -943 108 2 440 271 - Balance at 30 June 2005 - 4 894 265 10 405 960 27 467 013 9 832 256 85 651 1 795 832 1 712 373 4 931 937 -5 331 660 55 793 627 2006 Correction of error -Note 34 1 100 000 1 100 000 Change in accounting policy -Note 33 118 124 118 124 Restated balance - 4 894 265 10 405 960 27 467 013 9 832 256 85 651 1 795 832 1 712 373 4 931 937 -4 113 536 57 011 751 Surplus/(deficit) for the year 7 640 256 7 640 256 Transfer to CRR 2 917 831 (2 917 831) - PPE purchased (4 189 598) 4 189 598 - Capital grants used to purchase PPE 4 161 238 (4 161 238) - Donated/contributed PPE 130 216 (130 216) - Contribution to Insurance Reserve 1 311 917 101 345 (1 413 262) - Insurance claims processed (485 249) (255 444) 740 693 - Transfer to Housing Development Fund 1 295 738 (1 295 738) - Asset disposals (16 146) 16 146 - Offsetting of depreciation (433 800) (797 600) (44 814) (862 995) 2 139 209 - Balance at 30 June 2006 - 6 190 003 9 134 193 27 033 213 13 179 748 171 053 2 622 500 1 558 274 4 068 942 694 081 64 652 007
Specimen Consolidated Municipal Annual Financial Statements
39
Pre-GAMAPOld COIDA
Reserves Development Replacement Reserve Grant Public Insurance Reserve Reserve Surplus/ Interestsand Fund Reserve Reserve Contribution Reserve (Deficit)
Funds ReserveR R R R R R R R R R R R
2005Balance at 1 July 2004 38,173,702 3,985,854 1,045,832 1,754,078 8,500,280 8,999,674 538,883 62,998,303 Implementation of GAMAP -Note 32 -38,173,702 9,675,388 28,145,334 10,571,712 2,854,298 13,073,030 Change in accounting policy -Note 33 6,930 6,930
Restated balance - 3,985,854 9,675,388 28,145,334 10,571,712 - 1,045,832 1,754,078 8,500,280 11,860,902 538,883 76,078,263
Surplus/(deficit) for the year -10,466,294 14,993 -10,451,301 Transfer to CRR 2,167,811 -2,167,811 - Property, plant and equipment purchased -1,437,239 1,437,239 - Capital grants used to purchase PPE 53,955 -53,955 - Donated/contributed PPE 111,082 -111,082 - Contribution to Insurance Reserve 876,078 98,329 -974,407 - Insurance claims processed -126,078 -140,034 266,112 - Transfer to Housing Development Fund 908,411 -908,411 - Offsetting of depreciation -678,321 -793,411 -25,431 -1,244,662 2,741,825 -
Balance at 30 June 2005 - 4,894,265 10,405,960 27,467,013 9,832,256 85,651 1,795,832 1,712,373 7,255,619 1,624,118 553,876 65,626,963
2006Correction of error -Note 34 1,100,000 1,100,000 Change in accounting policy -Note 33 118,124 118,124
Restated balance - 4,894,265 10,405,960 27,467,013 9,832,256 85,651 1,795,832 1,712,373 7,255,619 2,842,242 553,876 66,845,087 Surplus/(deficit) for the year 8,158,728 8,182 8,166,910 Transfer to CRR 2,917,831 -2,917,831 - Property, plant and equipment purchased -4,189,598 4,189,598 - Capital grants used to purchase PPE 4,161,238 -4,161,238 - Donated/contributed PPE 130,216 -130,216 - Contribution to Insurance Reserve 1,311,917 101,345 -1,413,262 - Insurance claims processed -485,249 -255,444 740,693 - Transfer to Housing Development Fund 1,295,738 -1,295,738 - Asset disposals -16,146 16,146 - Offsetting of depreciation -433,800 - -44,814 -1,138,415 2,414,629 -
Balance at 30 June 2006 - 6,190,003 9,134,193 27,033,213 13,179,748 171,053 2,622,500 1,558,274 6,117,204 8,443,751 562,058 75,011,997
Minorities'
PROTEA LOCAL MUNICIPALITYSTATEMENT OF CHANGES IN NET ASSETS FOR THE YEAR ENDED 30 JUNE 2006 - GROUP
Housing Capital Capitalisation Government Donations and Self- Revaluation Accumulated Total

Specimen Consolidated Municipal Annual Financial Statements
40
Explanatory Notes: Cash-Flow Statement
As indicated, the direct method is prescribed for inclusion on the face of the Cash Flow Statement to determine “Cash generated from operations”. Municipalities must ensure that they will be in a position to extract operating receipts and payments in order to obtain figures for cash generated from operations. The following treatment is recommended for: Increases or decreases in consumer deposits are deemed to be a financing activity Conditional “capital” government grants, donations and public contributions are deemed to be an operating activity
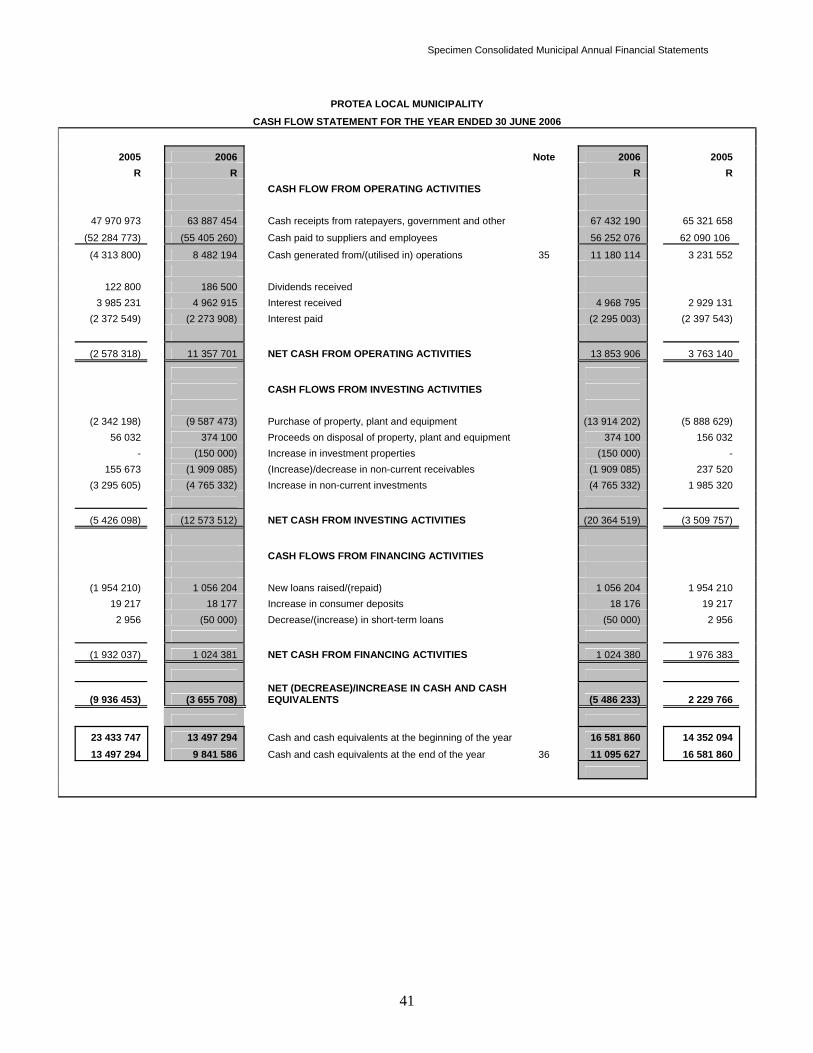
Specimen Consolidated Municipal Annual Financial Statements
41
PROTEA LOCAL MUNICIPALITY
CASH FLOW STATEMENT FOR THE YEAR ENDED 30 JUNE 2006
2005 2006 Note 2006 2005 R R R R CASH FLOW FROM OPERATING ACTIVITIES 47 970 973 63 887 454 Cash receipts from ratepayers, government and other 67 432 190 65 321 658 (52 284 773) (55 405 260) Cash paid to suppliers and employees 56 252 076 62 090 106
(4 313 800) 8 482 194 Cash generated from/(utilised in) operations 35 11 180 114 3 231 552 122 800 186 500 Dividends received 3 985 231 4 962 915 Interest received 4 968 795 2 929 131 (2 372 549) (2 273 908) Interest paid (2 295 003) (2 397 543)
(2 578 318) 11 357 701 NET CASH FROM OPERATING ACTIVITIES 13 853 906 3 763 140
CASH FLOWS FROM INVESTING ACTIVITIES (2 342 198) (9 587 473) Purchase of property, plant and equipment (13 914 202) (5 888 629) 56 032 374 100 Proceeds on disposal of property, plant and equipment 374 100 156 032 - (150 000) Increase in investment properties (150 000) - 155 673 (1 909 085) (Increase)/decrease in non-current receivables (1 909 085) 237 520 (3 295 605) (4 765 332) Increase in non-current investments (4 765 332) 1 985 320
(5 426 098) (12 573 512) NET CASH FROM INVESTING ACTIVITIES (20 364 519) (3 509 757)
CASH FLOWS FROM FINANCING ACTIVITIES (1 954 210) 1 056 204 New loans raised/(repaid) 1 056 204 1 954 210 19 217 18 177 Increase in consumer deposits 18 176 19 217 2 956 (50 000) Decrease/(increase) in short-term loans (50 000) 2 956
(1 932 037) 1 024 381 NET CASH FROM FINANCING ACTIVITIES 1 024 380 1 976 383
(9 936 453) (3 655 708) NET (DECREASE)/INCREASE IN CASH AND CASH EQUIVALENTS (5 486 233) 2 229 766
23 433 747 13 497 294 Cash and cash equivalents at the beginning of the year 16 581 860 14 352 094 13 497 294 9 841 586 Cash and cash equivalents at the end of the year 36 11 095 627 16 581 860

Specimen Consolidated Municipal Annual Financial Statements
42
Explanatory Notes: Mandatory Accounting Policies Specimen Accounting Policies The accounting policies included in the specimen consolidated annual financial statements are for guidance purposes only. The accounting policies support the transactions, balances and events included in the specimen annual financial statements. Accounting policies are specific to individual municipalities and it is therefore not possible to provide generic accounting policies.
GAMAP 7.26 requires that uniform accounting policies should be used by associates, but if this is not practicable, that fact shall be disclosed.
Specimen Consolidated Municipal Annual Financial Statements
43
PROTEA LOCAL MUNICIPALITY
MANDATORY GROUP ACCOUNTING POLICIES TO THE ANNUAL FINANCIAL STATEMENTS FOR THE YEAR ENDED 30 JUNE 2006
1. BASIS OF PRESENTATION The annual financial statements have been prepared on an accrual basis of accounting and are in accordance with historical cost convention, except for the revaluation of land and buildings, which are carried at fair value. [First – time Implementation of GAMAP/GRAP] In accordance with section 122(3) of the Municipal Finance Management Act (Act No. 56 of 2003), the Group has adopted Standards of GAMAP and GRAP issued by the Accounting Standards Board during the financial year, with the exception of ….. GAMAP and GRAP standards are fundamentally different to the fund accounting policies adopted in previous financial years by the Protea Local Municipality. The differences between GAMAP and GRAP and Generally Accepted Accounting Practice issued by the South African Accounting Practices Board and the South African Institute of Chartered Accountants which was used by the municipal entities of the Municipality consolidated into these annual financial statements was minimal. Comparative amounts have been restated retrospectively to the extent possible. The effect of the change in accounting policy arising from the implementation of GAMAP and GRAP is set out in Note 30. Furthermore, the Municipality has changed its accounting policy in respect of Regional Council Levies as set out in Note 31. Exemption from complying with …… was obtained from the Minister of Finance until ….. (date). The Group may have transactions, events or balances that are outside the ambit of GAMAP and GRAP but which are included in Standards of International Public Sector Accounting Standards (IPSAS) issued by the International Federation of Accountants – Public Sector Committee, International Accounting Standards (IAS) issued by the International Accounting Standards Board or Generally Accepted Accounting Practice issued by the South African Accounting Practices Board and the South African Institute of Chartered Accountants. The Group has not complied with the measurement, recognition and disclosure requirements of those accounting standards. The principal accounting policies adopted in the preparation of these annual financial statements are set out below. Assets, liabilities, revenues and expenses have not been offset except when offsetting is required or permitted by a Standard of GAMAP or GRAP. [Where a municipality has previously adopted GAMAP] These annual financial statements have been prepared in accordance with Generally Accepted Municipal Accounting Practices (GAMAP) and Generally Recognised Accounting Practice (GRAP), with the exception of ………, issued by the Accounting Standards Board in accordance with Section 122(3) of the Municipal Finance Management Act, (Act No.56 of 2003). These accounting policies are consistent with those of the previous financial year, except as indicated in Note 31. Exemption from complying with …… was obtained from the Minister of Finance until …… (date). The Group may have transactions, events or balances that are outside the ambit of the accounting standards referred to above but which are included in Standards of International Public Sector Accounting Standards (IPSAS) issued by the International Federation of Accountants – Public Sector Committee, International Accounting Standards (IAS) issued by the International Accounting Standards Board or Generally Accepted Accounting Practice issued by the South African Accounting Practices Board and the South African Institute of Chartered Accountants’ Accounting Practices Committee. The Group has not complied with the measurement, recognition and disclosure requirements of those accounting standards. The principal accounting policies adopted in the preparation of these annual financial statements are set out below. Assets, liabilities, revenues and expenses have not been offset except when offsetting is required or permitted by a Standard of GAMAP or GRAP. 2. BASIS OF CONSOLIDATION The consolidated annual financial statements incorporate the financial statements of the Municipality and Municipal Entities controlled by the Municipality. On acquisition, the assets and liabilities of a municipal entity are measured at their fair values at the date of acquisition. The interests of outside shareholders are stated at the minority’s proportion of the fair values of the assets and liabilities recognized. The results of municipal entities acquired or disposed during the year are included in the consolidated Statement of Financial Performance from the effective date of acquisition or up to the effective date of disposal, as appropriate. Where necessary, adjustments are made to the annual financial statements of municipal entities to bring the accounting policies used into line with those used by the Municipality and other municipal entities included in the Group. All significant transactions and balances between members of the Group are eliminated on consolidation. 3. PRESENTATION CURRENCY These annual financial statements are presented in South African Rand.
Specimen Consolidated Municipal Annual Financial Statements
44
PROTEA LOCAL MUNICIPALITY MANDATORY GROUP ACCOUNTING POLICIES TO THE ANNUAL FINANCIAL STATEMENTS
FOR THE YEAR ENDED 30 JUNE 2006 (continued) 4. GOING CONCERN ASSUMPTION These annual financial statements have been prepared on a going concern basis. 5. HOUSING DEVELOPMENT FUND The Housing Development Fund was established in terms of the Housing Act, (Act No. 107 of 1997). Loans from national and provincial government used to finance housing selling schemes undertaken by the Municipality were extinguished on 1 April 1998 and transferred to a Housing Development Fund. Housing selling schemes, both complete and in progress as at 1 April 1998, were also transferred to the Housing Development Fund. In terms of the Housing Act, all proceeds from housing developments, which include rental income and sales of houses, must be paid into the Housing Development Fund. Monies standing to the credit of the Housing Development Fund can be used only to finance housing developments within the municipal area subject to the approval of the Provincial MEC responsible for housing. 6. RESERVES 6.1 Capital Replacement Reserve (CRR)
In order to finance the provision of infrastructure and other items of property, plant and equipment from internal sources, amounts are transferred from the accumulated surplus/(deficit) to the CRR in terms of a Council resolution (Number … dated…..) A corresponding amount is transferred to a designated CRR bank or investment account. The cash in the designated CRR bank account can only be utilised to finance items of property, plant and equipment. The CRR is reduced when the amounts in the CRR are utilised and the accumulated surplus/(deficit) is credited by a corresponding amount. The amount transferred to the CRR is based on the municipality's need to finance future capital projects included in the Integrated Development Plan.
6.2 Capitalisation Reserve
On the implementation of GAMAP/GRAP, the balance on certain funds, created in terms of the various Provincial Ordinances applicable at the time, that had historically been utilised for the acquisition of items of property, plant and equipment have been transferred to a Capitalisation Reserve instead of the accumulated surplus/(deficit) as required in terms of a directive (budget circular) issued by National Treasury. The purpose of this Reserve is to ensure that the future depreciation expenses that will be incurred over the useful lives of these items of property, plant and equipment are offset by transfers from this reserve to the accumulated surplus/(deficit). The reason is to promote consumer equity as the amounts originally contributed to the former funds were established as a charge against revenue, which was borne by consumers, and the reserve eliminates the double expensing of the original contributions to the funds and the future charging of depreciation. The balance on the Capitalisation Reserve equals the carrying value of the items of property, plant and equipment financed from the former legislated funds. When items of property, plant and equipment are depreciated, a transfer is made from the Capitalisation Reserve to the accumulated surplus/(deficit). When an item of property, plant and equipment is disposed, the balance in the Capitalisation Reserve relating to such item is transferred to the accumulated surplus/(deficit).
6.3 Government Grant Reserve
When items of property, plant and equipment are financed from government grants, a transfer is made from the accumulated surplus/(deficit) to the Government Grants Reserve equal to the Government Grant recorded as revenue in the Statement of Financial Performance as required in terms of a directive (budget circular) issued by National Treasury. When such items of property, plant and equipment are depreciated, a transfer is made from the Government Grant Reserve to the accumulated surplus/(deficit). The purpose of this policy is to promote consumer equity by ensuring that the future depreciation expenses that will be incurred over the useful lives of government grant funded items of property, plant and equipment are offset by transfers from this reserve to the accumulated surplus/(deficit), thereby ensuring that the benefit of the government grant is given to consumers over the useful life of the item of property, plant and equipment funded by such government grants. When an item of property, plant and equipment financed from government grants is disposed, the balance in the Government Grant Reserve relating to such item is transferred to the accumulated surplus/(deficit).
6.4 Donations and Public Contributions Reserve
When items of property, plant and equipment are financed from public contributions and donations, a transfer is made from the accumulated surplus/(deficit) to the Donations and Public Contributions Reserve equal to the donations and public contributions recorded as revenue in the Statement of Financial Performance as required in terms of a directive (budget circular) issued by National Treasury. When such items of property, plant and equipment are depreciated, a transfer is made from the Donations and Public Contributions Reserve to the accumulated surplus/(deficit). The purpose of this policy is to promote consumer equity and facilitate budgetary control by ensuring that sufficient funds are set aside to offset the future depreciation charges that will be incurred over the estimated useful life of the item of property, plant and equipment financed from donations and public contributions. In this way, the benefit of the public contribution and donation is passed on to consumers over the period that the item of property, plant and equipment financed from donations and public contribution is used.
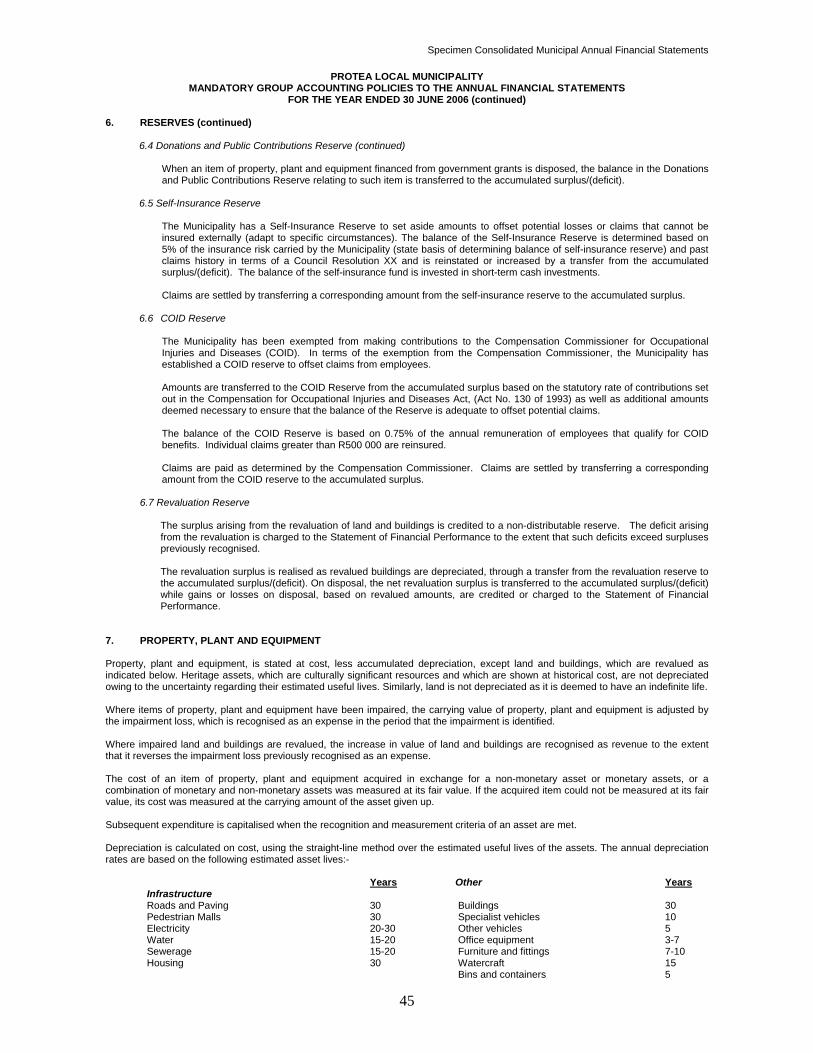
Specimen Consolidated Municipal Annual Financial Statements
45
PROTEA LOCAL MUNICIPALITY MANDATORY GROUP ACCOUNTING POLICIES TO THE ANNUAL FINANCIAL STATEMENTS
FOR THE YEAR ENDED 30 JUNE 2006 (continued)
6. RESERVES (continued) 6.4 Donations and Public Contributions Reserve (continued)
When an item of property, plant and equipment financed from government grants is disposed, the balance in the Donations and Public Contributions Reserve relating to such item is transferred to the accumulated surplus/(deficit).
6.5 Self-Insurance Reserve
The Municipality has a Self-Insurance Reserve to set aside amounts to offset potential losses or claims that cannot be insured externally (adapt to specific circumstances). The balance of the Self-Insurance Reserve is determined based on 5% of the insurance risk carried by the Municipality (state basis of determining balance of self-insurance reserve) and past claims history in terms of a Council Resolution XX and is reinstated or increased by a transfer from the accumulated surplus/(deficit). The balance of the self-insurance fund is invested in short-term cash investments. Claims are settled by transferring a corresponding amount from the self-insurance reserve to the accumulated surplus.
6.6 COID Reserve
The Municipality has been exempted from making contributions to the Compensation Commissioner for Occupational Injuries and Diseases (COID). In terms of the exemption from the Compensation Commissioner, the Municipality has established a COID reserve to offset claims from employees. Amounts are transferred to the COID Reserve from the accumulated surplus based on the statutory rate of contributions set out in the Compensation for Occupational Injuries and Diseases Act, (Act No. 130 of 1993) as well as additional amounts deemed necessary to ensure that the balance of the Reserve is adequate to offset potential claims. The balance of the COID Reserve is based on 0.75% of the annual remuneration of employees that qualify for COID benefits. Individual claims greater than R500 000 are reinsured. Claims are paid as determined by the Compensation Commissioner. Claims are settled by transferring a corresponding amount from the COID reserve to the accumulated surplus.
6.7 Revaluation Reserve
The surplus arising from the revaluation of land and buildings is credited to a non-distributable reserve. The deficit arising from the revaluation is charged to the Statement of Financial Performance to the extent that such deficits exceed surpluses previously recognised. The revaluation surplus is realised as revalued buildings are depreciated, through a transfer from the revaluation reserve to the accumulated surplus/(deficit). On disposal, the net revaluation surplus is transferred to the accumulated surplus/(deficit) while gains or losses on disposal, based on revalued amounts, are credited or charged to the Statement of Financial Performance.
7. PROPERTY, PLANT AND EQUIPMENT Property, plant and equipment, is stated at cost, less accumulated depreciation, except land and buildings, which are revalued as indicated below. Heritage assets, which are culturally significant resources and which are shown at historical cost, are not depreciated owing to the uncertainty regarding their estimated useful lives. Similarly, land is not depreciated as it is deemed to have an indefinite life. Where items of property, plant and equipment have been impaired, the carrying value of property, plant and equipment is adjusted by the impairment loss, which is recognised as an expense in the period that the impairment is identified. Where impaired land and buildings are revalued, the increase in value of land and buildings are recognised as revenue to the extent that it reverses the impairment loss previously recognised as an expense. The cost of an item of property, plant and equipment acquired in exchange for a non-monetary asset or monetary assets, or a combination of monetary and non-monetary assets was measured at its fair value. If the acquired item could not be measured at its fair value, its cost was measured at the carrying amount of the asset given up. Subsequent expenditure is capitalised when the recognition and measurement criteria of an asset are met. Depreciation is calculated on cost, using the straight-line method over the estimated useful lives of the assets. The annual depreciation rates are based on the following estimated asset lives:-
Years Other Years Infrastructure Roads and Paving 30 Buildings 30 Pedestrian Malls 30 Specialist vehicles 10 Electricity 20-30 Other vehicles 5 Water 15-20 Office equipment 3-7 Sewerage 15-20 Furniture and fittings 7-10 Housing 30 Watercraft 15 Bins and containers 5
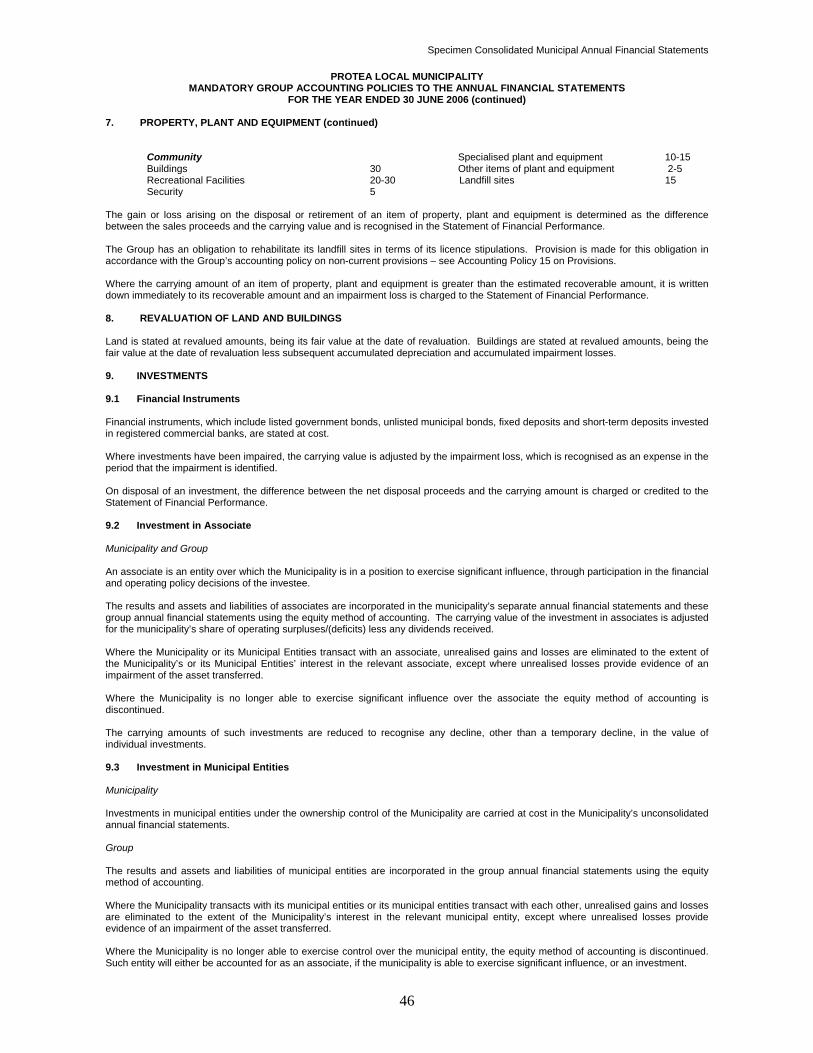
Specimen Consolidated Municipal Annual Financial Statements
46
PROTEA LOCAL MUNICIPALITY MANDATORY GROUP ACCOUNTING POLICIES TO THE ANNUAL FINANCIAL STATEMENTS
FOR THE YEAR ENDED 30 JUNE 2006 (continued) 7. PROPERTY, PLANT AND EQUIPMENT (continued)
Community Specialised plant and equipment 10-15 Buildings 30 Other items of plant and equipment 2-5 Recreational Facilities 20-30 Landfill sites 15 Security 5
The gain or loss arising on the disposal or retirement of an item of property, plant and equipment is determined as the difference between the sales proceeds and the carrying value and is recognised in the Statement of Financial Performance. The Group has an obligation to rehabilitate its landfill sites in terms of its licence stipulations. Provision is made for this obligation in accordance with the Group’s accounting policy on non-current provisions – see Accounting Policy 15 on Provisions. Where the carrying amount of an item of property, plant and equipment is greater than the estimated recoverable amount, it is written down immediately to its recoverable amount and an impairment loss is charged to the Statement of Financial Performance.
8. REVALUATION OF LAND AND BUILDINGS Land is stated at revalued amounts, being its fair value at the date of revaluation. Buildings are stated at revalued amounts, being the fair value at the date of revaluation less subsequent accumulated depreciation and accumulated impairment losses. 9. INVESTMENTS 9.1 Financial Instruments Financial instruments, which include listed government bonds, unlisted municipal bonds, fixed deposits and short-term deposits invested in registered commercial banks, are stated at cost. Where investments have been impaired, the carrying value is adjusted by the impairment loss, which is recognised as an expense in the period that the impairment is identified. On disposal of an investment, the difference between the net disposal proceeds and the carrying amount is charged or credited to the Statement of Financial Performance. 9.2 Investment in Associate Municipality and Group An associate is an entity over which the Municipality is in a position to exercise significant influence, through participation in the financial and operating policy decisions of the investee. The results and assets and liabilities of associates are incorporated in the municipality’s separate annual financial statements and these group annual financial statements using the equity method of accounting. The carrying value of the investment in associates is adjusted for the municipality’s share of operating surpluses/(deficits) less any dividends received. Where the Municipality or its Municipal Entities transact with an associate, unrealised gains and losses are eliminated to the extent of the Municipality’s or its Municipal Entities’ interest in the relevant associate, except where unrealised losses provide evidence of an impairment of the asset transferred. Where the Municipality is no longer able to exercise significant influence over the associate the equity method of accounting is discontinued. The carrying amounts of such investments are reduced to recognise any decline, other than a temporary decline, in the value of individual investments. 9.3 Investment in Municipal Entities Municipality Investments in municipal entities under the ownership control of the Municipality are carried at cost in the Municipality’s unconsolidated annual financial statements. Group The results and assets and liabilities of municipal entities are incorporated in the group annual financial statements using the equity method of accounting. Where the Municipality transacts with its municipal entities or its municipal entities transact with each other, unrealised gains and losses are eliminated to the extent of the Municipality’s interest in the relevant municipal entity, except where unrealised losses provide evidence of an impairment of the asset transferred. Where the Municipality is no longer able to exercise control over the municipal entity, the equity method of accounting is discontinued. Such entity will either be accounted for as an associate, if the municipality is able to exercise significant influence, or an investment.
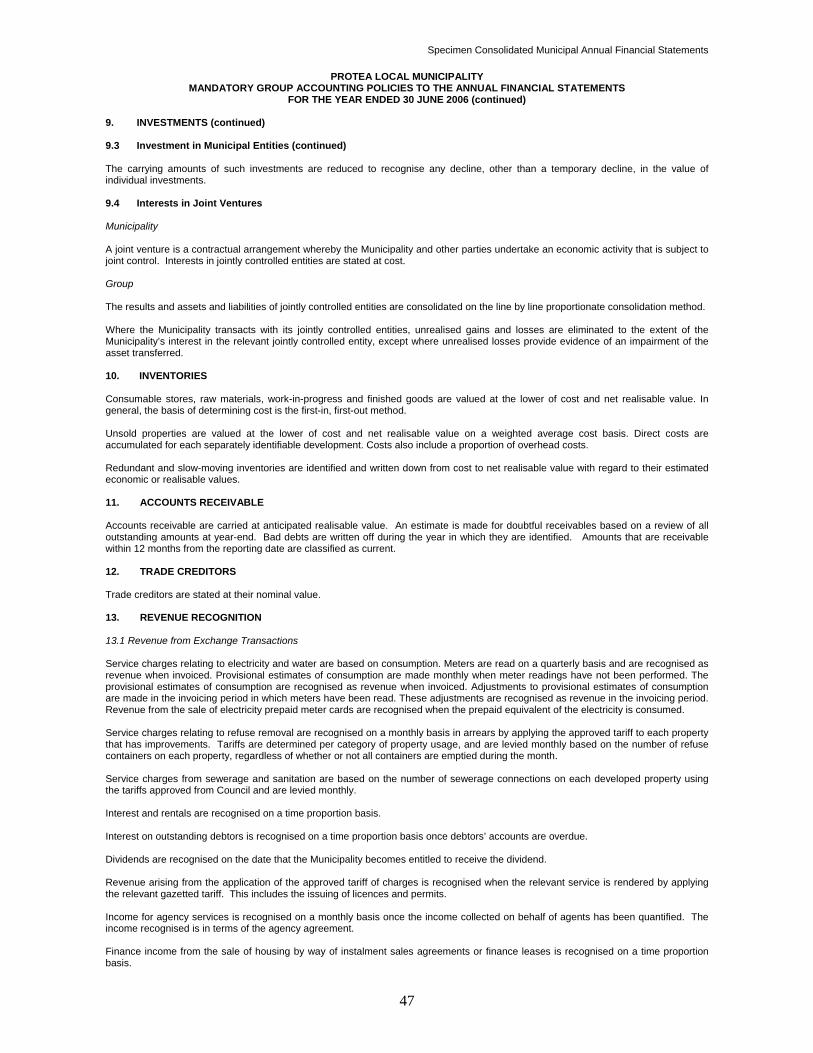
Specimen Consolidated Municipal Annual Financial Statements
47
PROTEA LOCAL MUNICIPALITY MANDATORY GROUP ACCOUNTING POLICIES TO THE ANNUAL FINANCIAL STATEMENTS
FOR THE YEAR ENDED 30 JUNE 2006 (continued) 9. INVESTMENTS (continued) 9.3 Investment in Municipal Entities (continued) The carrying amounts of such investments are reduced to recognise any decline, other than a temporary decline, in the value of individual investments. 9.4 Interests in Joint Ventures Municipality A joint venture is a contractual arrangement whereby the Municipality and other parties undertake an economic activity that is subject to joint control. Interests in jointly controlled entities are stated at cost. Group The results and assets and liabilities of jointly controlled entities are consolidated on the line by line proportionate consolidation method. Where the Municipality transacts with its jointly controlled entities, unrealised gains and losses are eliminated to the extent of the Municipality’s interest in the relevant jointly controlled entity, except where unrealised losses provide evidence of an impairment of the asset transferred. 10. INVENTORIES Consumable stores, raw materials, work-in-progress and finished goods are valued at the lower of cost and net realisable value. In general, the basis of determining cost is the first-in, first-out method. Unsold properties are valued at the lower of cost and net realisable value on a weighted average cost basis. Direct costs are accumulated for each separately identifiable development. Costs also include a proportion of overhead costs. Redundant and slow-moving inventories are identified and written down from cost to net realisable value with regard to their estimated economic or realisable values.
11. ACCOUNTS RECEIVABLE Accounts receivable are carried at anticipated realisable value. An estimate is made for doubtful receivables based on a review of all outstanding amounts at year-end. Bad debts are written off during the year in which they are identified. Amounts that are receivable within 12 months from the reporting date are classified as current. 12. TRADE CREDITORS Trade creditors are stated at their nominal value. 13. REVENUE RECOGNITION 13.1 Revenue from Exchange Transactions Service charges relating to electricity and water are based on consumption. Meters are read on a quarterly basis and are recognised as revenue when invoiced. Provisional estimates of consumption are made monthly when meter readings have not been performed. The provisional estimates of consumption are recognised as revenue when invoiced. Adjustments to provisional estimates of consumption are made in the invoicing period in which meters have been read. These adjustments are recognised as revenue in the invoicing period. Revenue from the sale of electricity prepaid meter cards are recognised when the prepaid equivalent of the electricity is consumed. Service charges relating to refuse removal are recognised on a monthly basis in arrears by applying the approved tariff to each property that has improvements. Tariffs are determined per category of property usage, and are levied monthly based on the number of refuse containers on each property, regardless of whether or not all containers are emptied during the month. Service charges from sewerage and sanitation are based on the number of sewerage connections on each developed property using the tariffs approved from Council and are levied monthly. Interest and rentals are recognised on a time proportion basis. Interest on outstanding debtors is recognised on a time proportion basis once debtors’ accounts are overdue. Dividends are recognised on the date that the Municipality becomes entitled to receive the dividend. Revenue arising from the application of the approved tariff of charges is recognised when the relevant service is rendered by applying the relevant gazetted tariff. This includes the issuing of licences and permits. Income for agency services is recognised on a monthly basis once the income collected on behalf of agents has been quantified. The income recognised is in terms of the agency agreement. Finance income from the sale of housing by way of instalment sales agreements or finance leases is recognised on a time proportion basis.
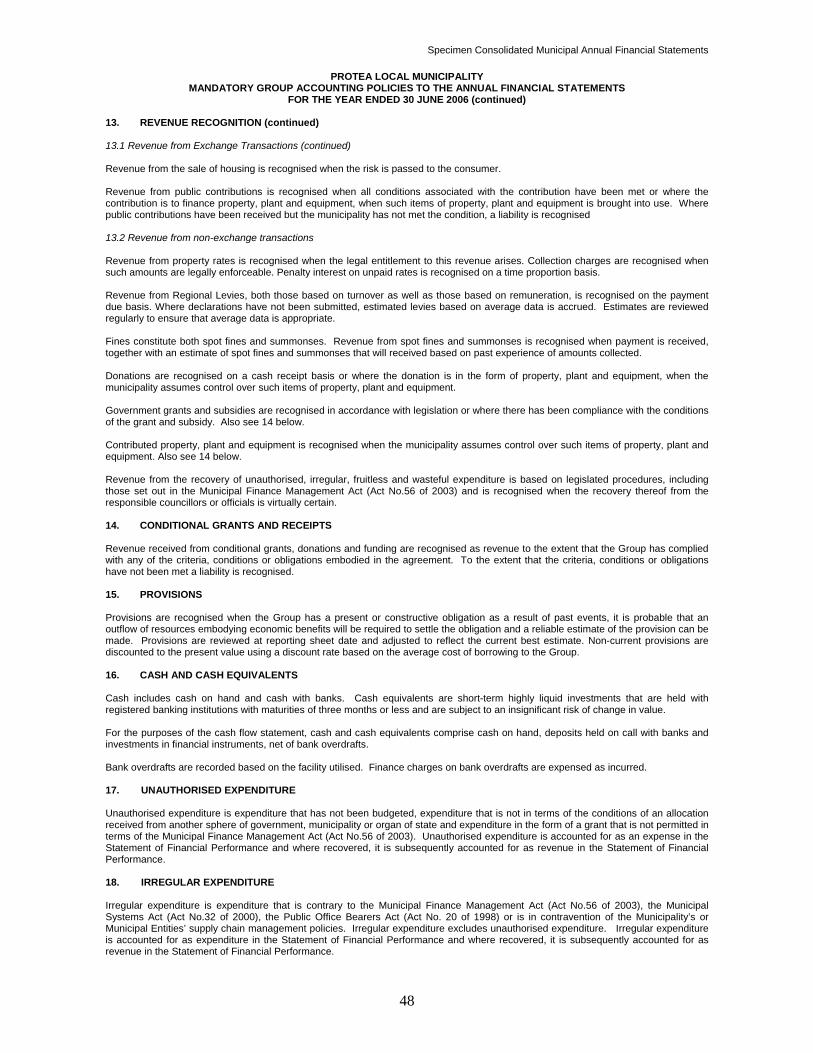
Specimen Consolidated Municipal Annual Financial Statements
48
PROTEA LOCAL MUNICIPALITY MANDATORY GROUP ACCOUNTING POLICIES TO THE ANNUAL FINANCIAL STATEMENTS
FOR THE YEAR ENDED 30 JUNE 2006 (continued) 13. REVENUE RECOGNITION (continued) 13.1 Revenue from Exchange Transactions (continued) Revenue from the sale of housing is recognised when the risk is passed to the consumer. Revenue from public contributions is recognised when all conditions associated with the contribution have been met or where the contribution is to finance property, plant and equipment, when such items of property, plant and equipment is brought into use. Where public contributions have been received but the municipality has not met the condition, a liability is recognised 13.2 Revenue from non-exchange transactions Revenue from property rates is recognised when the legal entitlement to this revenue arises. Collection charges are recognised when such amounts are legally enforceable. Penalty interest on unpaid rates is recognised on a time proportion basis.
Revenue from Regional Levies, both those based on turnover as well as those based on remuneration, is recognised on the payment due basis. Where declarations have not been submitted, estimated levies based on average data is accrued. Estimates are reviewed regularly to ensure that average data is appropriate. Fines constitute both spot fines and summonses. Revenue from spot fines and summonses is recognised when payment is received, together with an estimate of spot fines and summonses that will received based on past experience of amounts collected. Donations are recognised on a cash receipt basis or where the donation is in the form of property, plant and equipment, when the municipality assumes control over such items of property, plant and equipment. Government grants and subsidies are recognised in accordance with legislation or where there has been compliance with the conditions of the grant and subsidy. Also see 14 below. Contributed property, plant and equipment is recognised when the municipality assumes control over such items of property, plant and equipment. Also see 14 below. Revenue from the recovery of unauthorised, irregular, fruitless and wasteful expenditure is based on legislated procedures, including those set out in the Municipal Finance Management Act (Act No.56 of 2003) and is recognised when the recovery thereof from the responsible councillors or officials is virtually certain. 14. CONDITIONAL GRANTS AND RECEIPTS Revenue received from conditional grants, donations and funding are recognised as revenue to the extent that the Group has complied with any of the criteria, conditions or obligations embodied in the agreement. To the extent that the criteria, conditions or obligations have not been met a liability is recognised. 15. PROVISIONS Provisions are recognised when the Group has a present or constructive obligation as a result of past events, it is probable that an outflow of resources embodying economic benefits will be required to settle the obligation and a reliable estimate of the provision can be made. Provisions are reviewed at reporting sheet date and adjusted to reflect the current best estimate. Non-current provisions are discounted to the present value using a discount rate based on the average cost of borrowing to the Group. 16. CASH AND CASH EQUIVALENTS Cash includes cash on hand and cash with banks. Cash equivalents are short-term highly liquid investments that are held with registered banking institutions with maturities of three months or less and are subject to an insignificant risk of change in value. For the purposes of the cash flow statement, cash and cash equivalents comprise cash on hand, deposits held on call with banks and investments in financial instruments, net of bank overdrafts. Bank overdrafts are recorded based on the facility utilised. Finance charges on bank overdrafts are expensed as incurred. 17. UNAUTHORISED EXPENDITURE Unauthorised expenditure is expenditure that has not been budgeted, expenditure that is not in terms of the conditions of an allocation received from another sphere of government, municipality or organ of state and expenditure in the form of a grant that is not permitted in terms of the Municipal Finance Management Act (Act No.56 of 2003). Unauthorised expenditure is accounted for as an expense in the Statement of Financial Performance and where recovered, it is subsequently accounted for as revenue in the Statement of Financial Performance. 18. IRREGULAR EXPENDITURE Irregular expenditure is expenditure that is contrary to the Municipal Finance Management Act (Act No.56 of 2003), the Municipal Systems Act (Act No.32 of 2000), the Public Office Bearers Act (Act No. 20 of 1998) or is in contravention of the Municipality’s or Municipal Entities’ supply chain management policies. Irregular expenditure excludes unauthorised expenditure. Irregular expenditure is accounted for as expenditure in the Statement of Financial Performance and where recovered, it is subsequently accounted for as revenue in the Statement of Financial Performance.
Specimen Consolidated Municipal Annual Financial Statements
49
PROTEA LOCAL MUNICIPALITY MANDATORY GROUP ACCOUNTING POLICIES TO THE ANNUAL FINANCIAL STATEMENTS
FOR THE YEAR ENDED 30 JUNE 2006 (continued)
19. FRUITLESS AND WASTEFUL EXPENDITURE Fruitless and wasteful expenditure is expenditure that was made in vain and would have been avoided had reasonable care been exercised. Fruitless and wasteful expenditure is accounted for as expenditure in the Statement of Financial Performance and where recovered, it is subsequently accounted for as revenue in the Statement of Financial Performance. 20. FOREIGN CURRENCIES Transactions in foreign currencies are initially recorded at the prevailing exchange rate on the dates of the transactions. Monetary assets and liabilities denominated in such foreign currencies are retranslated at the rates prevailing at the reporting date. Exchange differences are included in the Statement of Financial Performance. 21. COMPARATIVE INFORMATION 21.1 Current year comparatives: Budgeted amounts have been included in the annual financial statements for the current financial year only. 21.2 Prior year comparatives: When the presentation or classification of items in the annual financial statements is amended, prior period comparative amounts are reclassified. The nature and reason for the reclassification is disclosed.

Specimen Consolidated Municipal Annual Financial Statements
50
Explanatory Notes: Encouraged Accounting Policies Municipalities may have to increase the scope of GAMAP and GRAP standards in developing group accounting policies. The reason is that it is likely that the municipal entities will use accounting policies standards, such as SA GAAP, which are more comprehensive than GAMAP and GRAP standards. The municipality may have to adopt these encouraged accounting policies to facilitate consolidation.
Specimen Consolidated Municipal Annual Financial Statements
51
PROTEA LOCAL MUNICIPALITY ENCOURAGED ACCOUNTING POLICIES TO THE ANNUAL FINANCIAL STATEMENTS
FOR THE YEAR ENDED 30 JUNE 2006 1. INVESTMENT PROPERTY Investment property, which is property held to earn rental revenue or for capital appreciation, is stated at cost less accumulated depreciation and accumulated impairment losses. Depreciation is calculated on cost, using the straight-line method over the useful life of the property, which is 50 years. 2. INVESTMENTS 2.1 Where the carrying amount of an investment is greater than the estimated recoverable amount, it is written down immediately to
its recoverable amount and an impairment loss is charged to the Statement of Financial Performance. 2.2 Investments in Securities
Investments in securities are recognised on a trade date basis and are initially measured at cost. At subsequent reporting dates, debt securities that the Municipality has the expressed intention and ability to hold to maturity (held-to-maturity debt securities) are measured at amortised cost, less any impairment losses recognised to reflect irrecoverable amounts. The annual amortisation of any discount or premium on the acquisition of a held-to-maturity security is aggregated with over investment income receivable over the term of the instrument so that the revenue recognised in each period represents a constant yield on the investment. Investments other than held-to-maturity debt securities are classified as either held for trading or available-for-sale, and are measured at subsequent reporting dates at fair value, based on quoted market prices at the reporting date. Where securities are held for trading purposes, unrealised gains and losses are included in net surplus/(deficit) for the period. For available for sale investments, unrealised gains and losses are recognised directly in net assets, until the security is disposed of or is determined to be impaired, at which time the cumulative gain or loss previously recognised in net assets is included in the net surplus/(deficit) for the period.
2.3 Investments in Derivative Financial Instruments
Derivative financial instruments are initially recorded at cost and are re-measured to fair value at subsequent reporting dates. Changes in the fair value of derivative financial instruments that are designated and effective as cash flow hedges are recognised directly in accumulated surpluses/(deficits). Amounts deferred in net assets are recognised in the Statement of Financial Performance in the same period in which the hedged firm commitment or forecasted transaction affects net surplus/(deficit). Changes in the fair value of derivative financial instruments that do not qualify for hedge accounting are recognised in the Statement of Financial Performance as they arise.”
3. LEASES The Group as Lessee Leases are classified as finance leases where substantially all the risks and rewards associated with ownership of an asset are transferred to the municipality. Property, plant and equipment subject to finance lease agreements are capitalised at their cash cost equivalent and the corresponding liabilities are raised. The cost of the item of property, plant and equipment is depreciated at appropriate rates on the straight-line basis over its estimated useful life. Lease payments are allocated between the lease finance cost and the capital repayment using the effective interest rate method. Lease finance costs are expensed when incurred. Operating leases are those leases that do not fall within the scope of the above definition. Operating lease rentals are expensed as they become due. The Group as Lessor Amounts due from lessees under finance leases or instalment sale agreements are recorded as receivables at the amount of the Municipality’s net investment in the leases. Finance lease or instalment sale income is allocated to accounting periods so as to reflect a constant periodic rate of return on the Municipality’s net investment outstanding in respect of the leases or instalment sale agreements. Rental income from operating leases is recognised on a straight-line basis over the term of the relevant lease. 4. RETIREMENT BENEFITS The Group provides retirement benefits for its employees and councillors. The contributions to fund obligations for the payment of retirement benefits are charged against revenue in the year they become payable. The defined benefit funds, which are administered on a provincial basis, are actuarially valued triennially on the projected unit credit method basis. Deficits identified are recognised as a liability and are recovered through lump sum payments or increased future contributions on a proportional basis to all participating municipalities. 5. BORROWING COSTS Borrowing costs are recognised as an expense in the Statement of Financial Performance in the period that such costs are incurred.
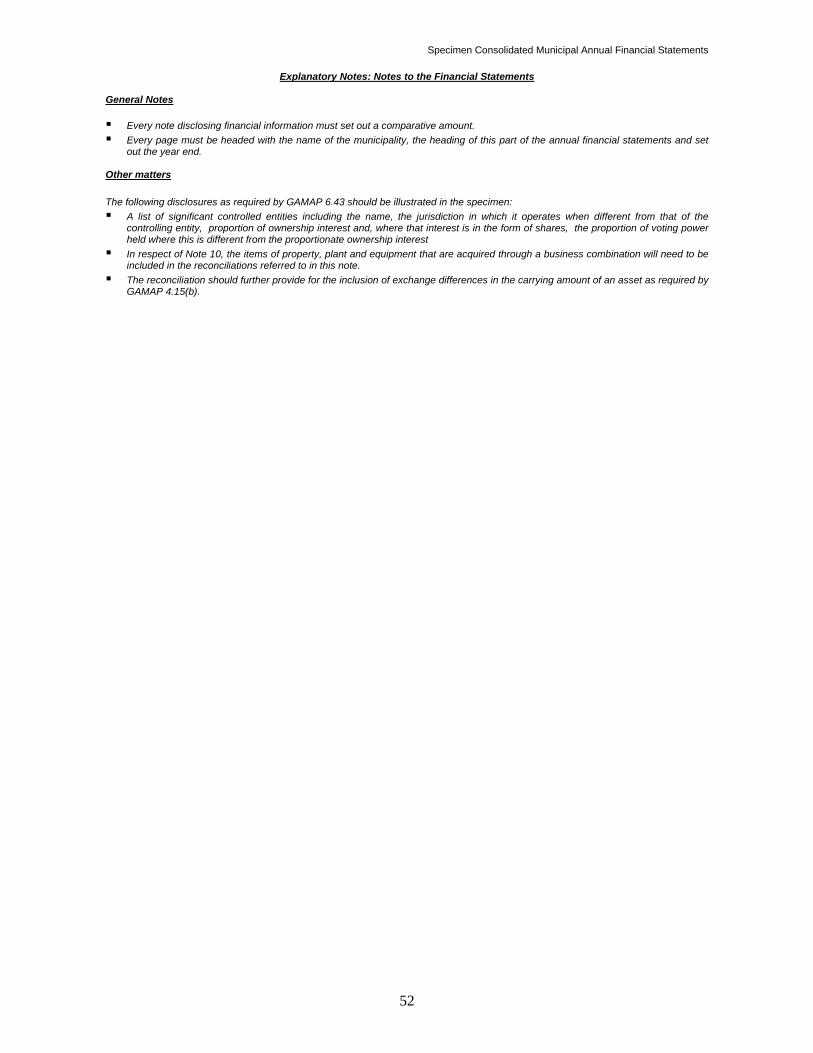
Specimen Consolidated Municipal Annual Financial Statements
52
Explanatory Notes: Notes to the Financial Statements General Notes Every note disclosing financial information must set out a comparative amount. Every page must be headed with the name of the municipality, the heading of this part of the annual financial statements and set
out the year end. Other matters The following disclosures as required by GAMAP 6.43 should be illustrated in the specimen: A list of significant controlled entities including the name, the jurisdiction in which it operates when different from that of the
controlling entity, proportion of ownership interest and, where that interest is in the form of shares, the proportion of voting power held where this is different from the proportionate ownership interest
In respect of Note 10, the items of property, plant and equipment that are acquired through a business combination will need to be included in the reconciliations referred to in this note.
The reconciliation should further provide for the inclusion of exchange differences in the carrying amount of an asset as required by GAMAP 4.15(b).
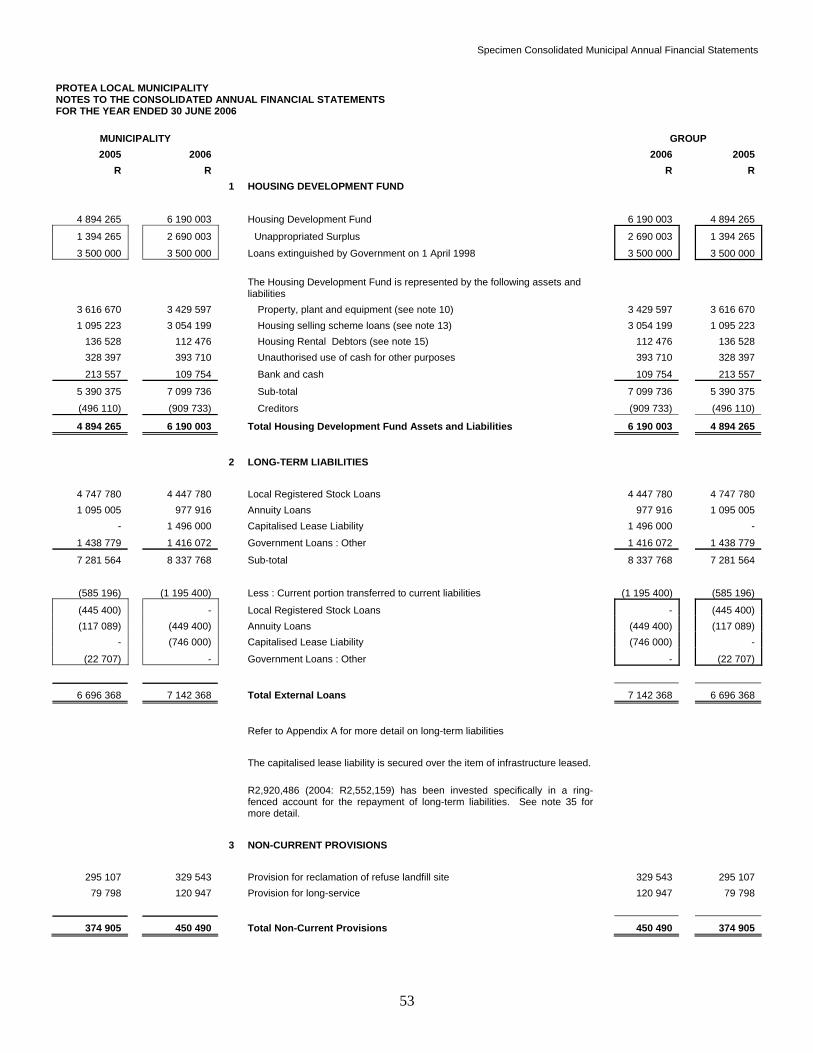
Specimen Consolidated Municipal Annual Financial Statements
53
PROTEA LOCAL MUNICIPALITY NOTES TO THE CONSOLIDATED ANNUAL FINANCIAL STATEMENTS FOR THE YEAR ENDED 30 JUNE 2006
MUNICIPALITY GROUP 2005 2006 2006 2005
R R R R 1 HOUSING DEVELOPMENT FUND
4 894 265 6 190 003 Housing Development Fund 6 190 003 4 894 265
1 394 265 2 690 003 Unappropriated Surplus 2 690 003 1 394 265
3 500 000 3 500 000 Loans extinguished by Government on 1 April 1998 3 500 000 3 500 000
The Housing Development Fund is represented by the following assets and liabilities
3 616 670 3 429 597 Property, plant and equipment (see note 10) 3 429 597 3 616 670 1 095 223 3 054 199 Housing selling scheme loans (see note 13) 3 054 199 1 095 223
136 528 112 476 Housing Rental Debtors (see note 15) 112 476 136 528 328 397 393 710 Unauthorised use of cash for other purposes 393 710 328 397
213 557 109 754 Bank and cash 109 754 213 557
5 390 375 7 099 736 Sub-total 7 099 736 5 390 375
(496 110) (909 733) Creditors (909 733) (496 110)
4 894 265 6 190 003 Total Housing Development Fund Assets and Liabilities 6 190 003 4 894 265
2 LONG-TERM LIABILITIES
4 747 780 4 447 780 Local Registered Stock Loans 4 447 780 4 747 780 1 095 005 977 916 Annuity Loans 977 916 1 095 005
- 1 496 000 Capitalised Lease Liability 1 496 000 -
1 438 779 1 416 072 Government Loans : Other 1 416 072 1 438 779
7 281 564 8 337 768 Sub-total 8 337 768 7 281 564
(585 196) (1 195 400) Less : Current portion transferred to current liabilities (1 195 400) (585 196)
(445 400) - Local Registered Stock Loans - (445 400) (117 089) (449 400) Annuity Loans (449 400) (117 089)
- (746 000) Capitalised Lease Liability (746 000) -
(22 707) - Government Loans : Other - (22 707)
6 696 368 7 142 368 Total External Loans 7 142 368 6 696 368
Refer to Appendix A for more detail on long-term liabilities The capitalised lease liability is secured over the item of infrastructure leased.
R2,920,486 (2004: R2,552,159) has been invested specifically in a ring-fenced account for the repayment of long-term liabilities. See note 35 for more detail.
3 NON-CURRENT PROVISIONS
295 107 329 543 Provision for reclamation of refuse landfill site 329 543 295 107 79 798 120 947 Provision for long-service 120 947 79 798
374 905 450 490 Total Non-Current Provisions 450 490 374 905
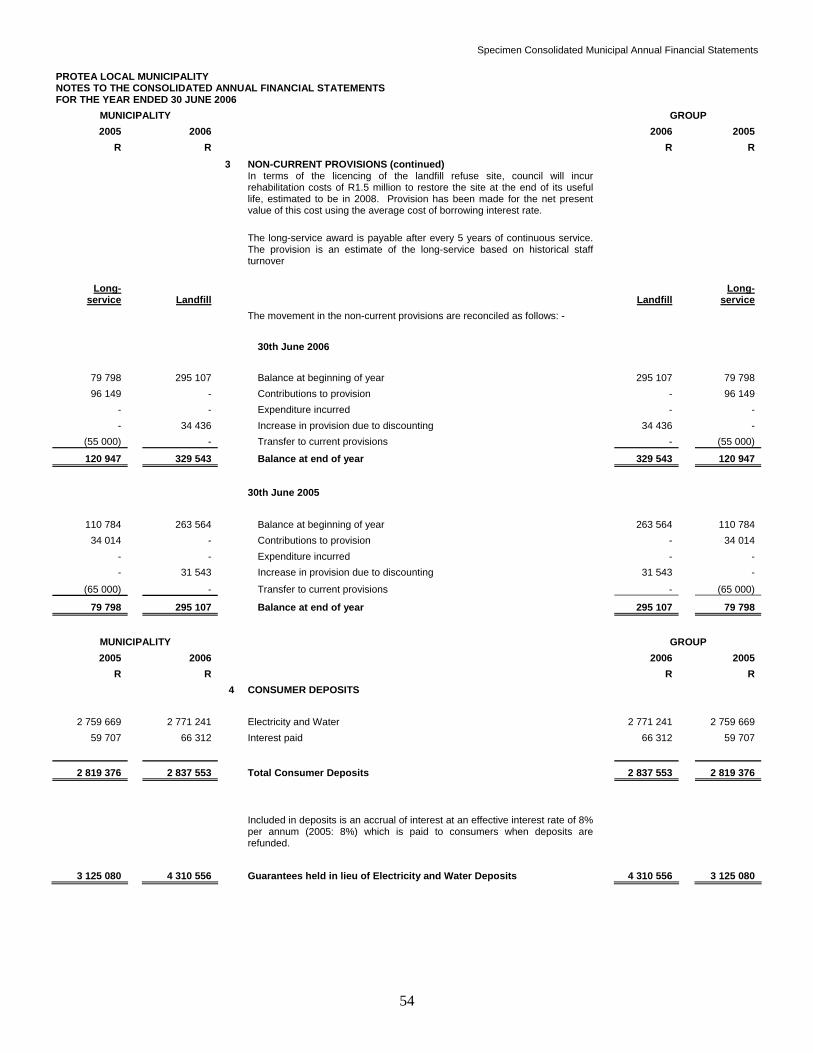
Specimen Consolidated Municipal Annual Financial Statements
54
PROTEA LOCAL MUNICIPALITY NOTES TO THE CONSOLIDATED ANNUAL FINANCIAL STATEMENTS FOR THE YEAR ENDED 30 JUNE 2006
MUNICIPALITY GROUP 2005 2006 2006 2005
R R R R 3 NON-CURRENT PROVISIONS (continued)
In terms of the licencing of the landfill refuse site, council will incur rehabilitation costs of R1.5 million to restore the site at the end of its useful life, estimated to be in 2008. Provision has been made for the net present value of this cost using the average cost of borrowing interest rate.
The long-service award is payable after every 5 years of continuous service. The provision is an estimate of the long-service based on historical staff turnover
Long-
service
Landfill Landfill Long-
service The movement in the non-current provisions are reconciled as follows: -
30th June 2006
79 798 295 107 Balance at beginning of year 295 107 79 798 96 149 - Contributions to provision - 96 149
- - Expenditure incurred - - - 34 436 Increase in provision due to discounting 34 436 -
(55 000) - Transfer to current provisions - (55 000)
120 947 329 543 Balance at end of year 329 543 120 947
30th June 2005
110 784 263 564 Balance at beginning of year 263 564 110 784 34 014 - Contributions to provision - 34 014
- - Expenditure incurred - - - 31 543 Increase in provision due to discounting 31 543 -
(65 000) - Transfer to current provisions - (65 000)
79 798 295 107 Balance at end of year 295 107 79 798
MUNICIPALITY GROUP 2005 2006 2006 2005
R R R R 4 CONSUMER DEPOSITS
2 759 669 2 771 241 Electricity and Water 2 771 241 2 759 669 59 707 66 312 Interest paid 66 312 59 707
2 819 376 2 837 553 Total Consumer Deposits 2 837 553 2 819 376
Included in deposits is an accrual of interest at an effective interest rate of 8% per annum (2005: 8%) which is paid to consumers when deposits are refunded.
3 125 080 4 310 556 Guarantees held in lieu of Electricity and Water Deposits 4 310 556 3 125 080
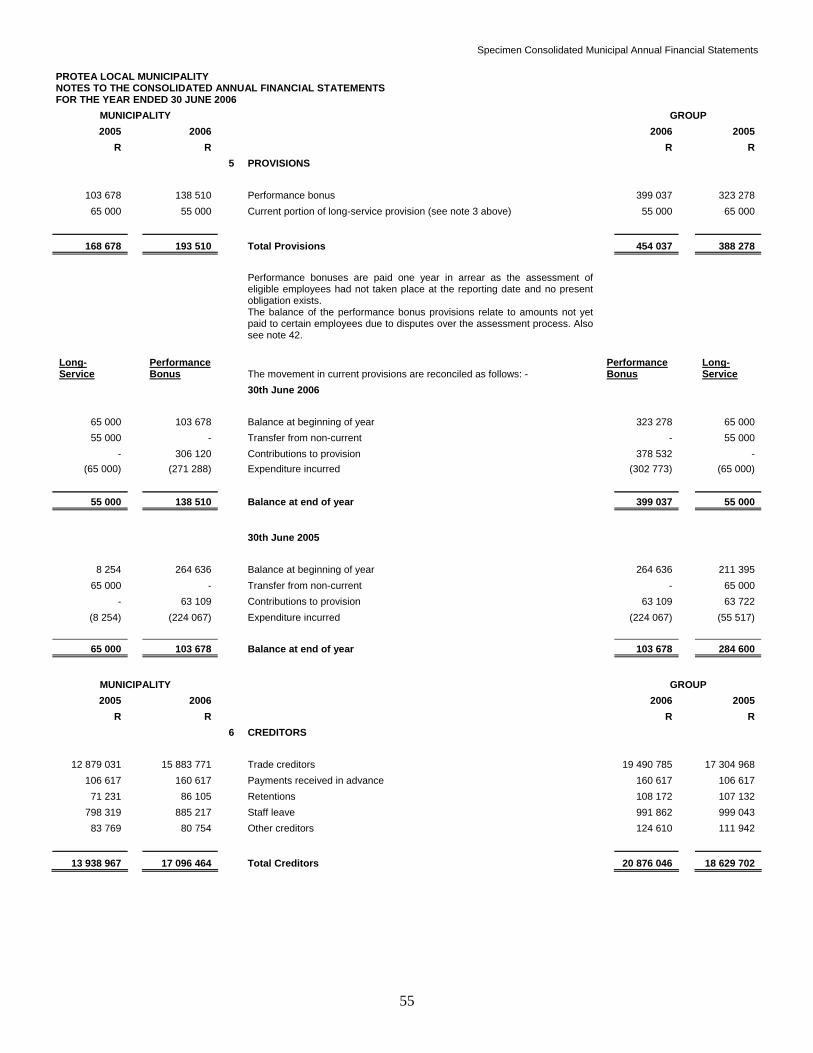
Specimen Consolidated Municipal Annual Financial Statements
55
PROTEA LOCAL MUNICIPALITY NOTES TO THE CONSOLIDATED ANNUAL FINANCIAL STATEMENTS FOR THE YEAR ENDED 30 JUNE 2006
MUNICIPALITY GROUP 2005 2006 2006 2005
R R R R 5 PROVISIONS
103 678 138 510 Performance bonus 399 037 323 278 65 000 55 000 Current portion of long-service provision (see note 3 above) 55 000 65 000
168 678 193 510 Total Provisions 454 037 388 278
Performance bonuses are paid one year in arrear as the assessment of eligible employees had not taken place at the reporting date and no present obligation exists.
The balance of the performance bonus provisions relate to amounts not yet paid to certain employees due to disputes over the assessment process. Also see note 42.
Long-Service
Performance Bonus The movement in current provisions are reconciled as follows: -
Performance Bonus
Long-Service
30th June 2006
65 000 103 678 Balance at beginning of year 323 278 65 000 55 000 - Transfer from non-current - 55 000
- 306 120 Contributions to provision 378 532 - (65 000) (271 288) Expenditure incurred (302 773) (65 000)
55 000 138 510 Balance at end of year 399 037 55 000
30th June 2005
8 254 264 636 Balance at beginning of year 264 636 211 395 65 000 - Transfer from non-current - 65 000
- 63 109 Contributions to provision 63 109 63 722 (8 254) (224 067) Expenditure incurred (224 067) (55 517)
65 000 103 678 Balance at end of year 103 678 284 600
MUNICIPALITY GROUP 2005 2006 2006 2005
R R R R 6 CREDITORS
12 879 031 15 883 771 Trade creditors 19 490 785 17 304 968 106 617 160 617 Payments received in advance 160 617 106 617
71 231 86 105 Retentions 108 172 107 132 798 319 885 217 Staff leave 991 862 999 043
83 769 80 754 Other creditors 124 610 111 942
13 938 967 17 096 464 Total Creditors 20 876 046 18 629 702
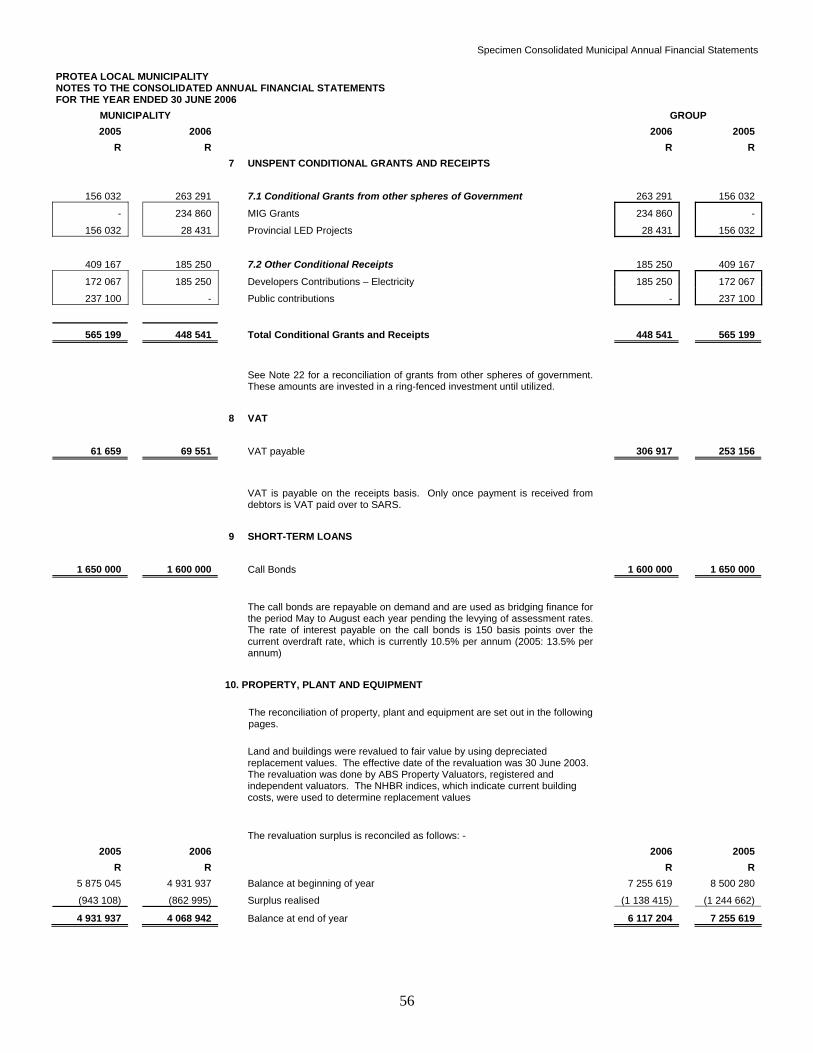
Specimen Consolidated Municipal Annual Financial Statements
56
PROTEA LOCAL MUNICIPALITY NOTES TO THE CONSOLIDATED ANNUAL FINANCIAL STATEMENTS FOR THE YEAR ENDED 30 JUNE 2006
MUNICIPALITY GROUP 2005 2006 2006 2005
R R R R 7 UNSPENT CONDITIONAL GRANTS AND RECEIPTS
156 032 263 291 7.1 Conditional Grants from other spheres of Government 263 291 156 032
- 234 860 MIG Grants 234 860 -
156 032 28 431 Provincial LED Projects 28 431 156 032
409 167 185 250 7.2 Other Conditional Receipts 185 250 409 167
172 067 185 250 Developers Contributions – Electricity 185 250 172 067
237 100 - Public contributions - 237 100
565 199 448 541 Total Conditional Grants and Receipts 448 541 565 199
See Note 22 for a reconciliation of grants from other spheres of government. These amounts are invested in a ring-fenced investment until utilized.
8 VAT
61 659 69 551 VAT payable 306 917 253 156
VAT is payable on the receipts basis. Only once payment is received from debtors is VAT paid over to SARS.
9 SHORT-TERM LOANS
1 650 000 1 600 000 Call Bonds 1 600 000 1 650 000
The call bonds are repayable on demand and are used as bridging finance for the period May to August each year pending the levying of assessment rates. The rate of interest payable on the call bonds is 150 basis points over the current overdraft rate, which is currently 10.5% per annum (2005: 13.5% per annum)
10. PROPERTY, PLANT AND EQUIPMENT
The reconciliation of property, plant and equipment are set out in the following pages.
Land and buildings were revalued to fair value by using depreciated replacement values. The effective date of the revaluation was 30 June 2003. The revaluation was done by ABS Property Valuators, registered and independent valuators. The NHBR indices, which indicate current building costs, were used to determine replacement values
The revaluation surplus is reconciled as follows: -
2005 2006 2006 2005 R R R R
5 875 045 4 931 937 Balance at beginning of year 7 255 619 8 500 280
(943 108) (862 995) Surplus realised (1 138 415) (1 244 662)
4 931 937 4 068 942 Balance at end of year 6 117 204 7 255 619
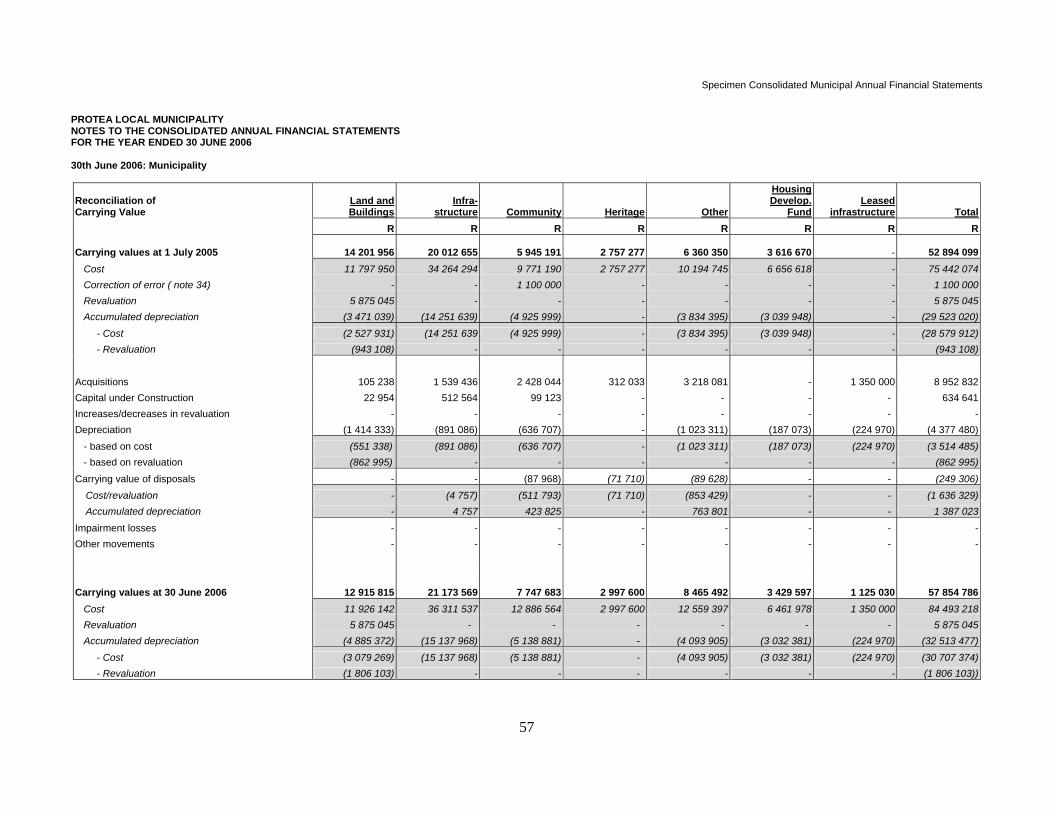
Specimen Consolidated Municipal Annual Financial Statements
57
PROTEA LOCAL MUNICIPALITY NOTES TO THE CONSOLIDATED ANNUAL FINANCIAL STATEMENTS FOR THE YEAR ENDED 30 JUNE 2006 30th June 2006: Municipality Reconciliation of Carrying Value
Land and Buildings
Infra-structure Community Heritage Other
HousingDevelop.
Fund Leased
infrastructure Total R R R R R R R R
Carrying values at 1 July 2005 14 201 956 20 012 655 5 945 191 2 757 277 6 360 350 3 616 670 - 52 894 099Cost 11 797 950 34 264 294 9 771 190 2 757 277 10 194 745 6 656 618 - 75 442 074Correction of error ( note 34) - - 1 100 000 - - - - 1 100 000Revaluation 5 875 045 - - - - - - 5 875 045Accumulated depreciation (3 471 039) (14 251 639) (4 925 999) - (3 834 395) (3 039 948) - (29 523 020)
- Cost (2 527 931) (14 251 639 (4 925 999) - (3 834 395) (3 039 948) - (28 579 912)- Revaluation (943 108) - - - - - - (943 108)
Acquisitions 105 238 1 539 436 2 428 044 312 033 3 218 081 - 1 350 000 8 952 832Capital under Construction 22 954 512 564 99 123 - - - - 634 641Increases/decreases in revaluation - - - - - - - -Depreciation (1 414 333) (891 086) (636 707) - (1 023 311) (187 073) (224 970) (4 377 480)
- based on cost (551 338) (891 086) (636 707) - (1 023 311) (187 073) (224 970) (3 514 485)- based on revaluation (862 995) - - - - - - (862 995)
Carrying value of disposals - - (87 968) (71 710) (89 628) - - (249 306)
Cost/revaluation - (4 757) (511 793) (71 710) (853 429) - - (1 636 329)Accumulated depreciation - 4 757 423 825 - 763 801 - - 1 387 023
Impairment losses - - - - - - - -Other movements - - - - - - - -
Carrying values at 30 June 2006 12 915 815 21 173 569 7 747 683 2 997 600 8 465 492 3 429 597 1 125 030 57 854 786Cost 11 926 142 36 311 537 12 886 564 2 997 600 12 559 397 6 461 978 1 350 000 84 493 218Revaluation 5 875 045 - - - - - - 5 875 045Accumulated depreciation (4 885 372) (15 137 968) (5 138 881) - (4 093 905) (3 032 381) (224 970) (32 513 477)
- Cost (3 079 269) (15 137 968) (5 138 881) - (4 093 905) (3 032 381) (224 970) (30 707 374)- Revaluation (1 806 103) - - - - - - (1 806 103))
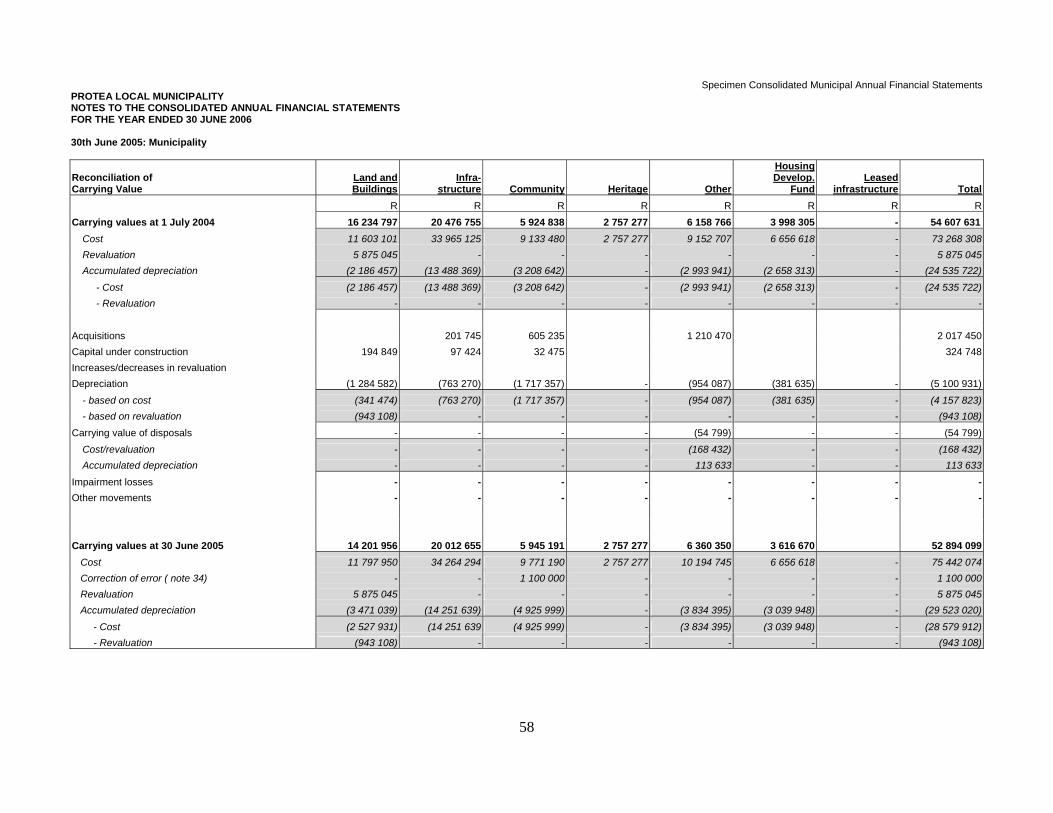
Specimen Consolidated Municipal Annual Financial Statements
58
PROTEA LOCAL MUNICIPALITY NOTES TO THE CONSOLIDATED ANNUAL FINANCIAL STATEMENTS FOR THE YEAR ENDED 30 JUNE 2006 30th June 2005: Municipality Reconciliation of Carrying Value
Land and Buildings
Infra-structure Community Heritage Other
HousingDevelop.
Fund Leased
infrastructure
Total R R R R R R R R Carrying values at 1 July 2004 16 234 797 20 476 755 5 924 838 2 757 277 6 158 766 3 998 305 - 54 607 631
Cost 11 603 101 33 965 125 9 133 480 2 757 277 9 152 707 6 656 618 - 73 268 308 Revaluation 5 875 045 - - - - - - 5 875 045 Accumulated depreciation (2 186 457) (13 488 369) (3 208 642) - (2 993 941) (2 658 313) - (24 535 722)
- Cost (2 186 457) (13 488 369) (3 208 642) - (2 993 941) (2 658 313) - (24 535 722) - Revaluation - - - - - - - -
Acquisitions 201 745 605 235 1 210 470 2 017 450 Capital under construction 194 849 97 424 32 475 324 748 Increases/decreases in revaluation Depreciation (1 284 582) (763 270) (1 717 357) - (954 087) (381 635) - (5 100 931)
- based on cost (341 474) (763 270) (1 717 357) - (954 087) (381 635) - (4 157 823) - based on revaluation (943 108) - - - - - - (943 108)
Carrying value of disposals - - - - (54 799) - - (54 799) Cost/revaluation - - - - (168 432) - - (168 432) Accumulated depreciation - - - - 113 633 - - 113 633
Impairment losses - - - - - - - - Other movements - - - - - - - -
Carrying values at 30 June 2005 14 201 956 20 012 655 5 945 191 2 757 277 6 360 350 3 616 670 52 894 099 Cost 11 797 950 34 264 294 9 771 190 2 757 277 10 194 745 6 656 618 - 75 442 074 Correction of error ( note 34) - - 1 100 000 - - - - 1 100 000 Revaluation 5 875 045 - - - - - - 5 875 045 Accumulated depreciation (3 471 039) (14 251 639) (4 925 999) - (3 834 395) (3 039 948) - (29 523 020)
- Cost (2 527 931) (14 251 639 (4 925 999) - (3 834 395) (3 039 948) - (28 579 912) - Revaluation (943 108) - - - - - - (943 108)
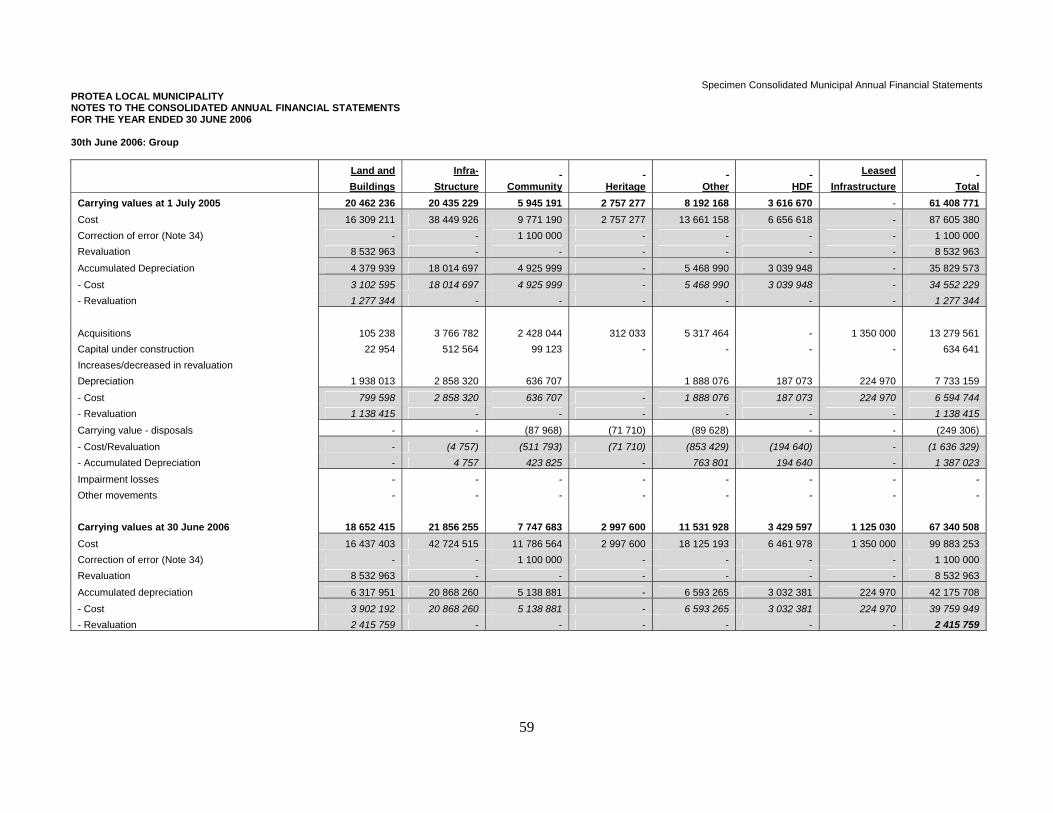
Specimen Consolidated Municipal Annual Financial Statements
59
PROTEA LOCAL MUNICIPALITY NOTES TO THE CONSOLIDATED ANNUAL FINANCIAL STATEMENTS FOR THE YEAR ENDED 30 JUNE 2006 30th June 2006: Group
Land and Infra- Leased Buildings Structure Community Heritage Other HDF Infrastructure Total Carrying values at 1 July 2005 20 462 236 20 435 229 5 945 191 2 757 277 8 192 168 3 616 670 - 61 408 771 Cost 16 309 211 38 449 926 9 771 190 2 757 277 13 661 158 6 656 618 - 87 605 380 Correction of error (Note 34) - - 1 100 000 - - - - 1 100 000 Revaluation 8 532 963 - - - - - - 8 532 963
Accumulated Depreciation 4 379 939 18 014 697 4 925 999 - 5 468 990 3 039 948 - 35 829 573 - Cost 3 102 595 18 014 697 4 925 999 - 5 468 990 3 039 948 - 34 552 229 - Revaluation 1 277 344 - - - - - - 1 277 344
Acquisitions 105 238 3 766 782 2 428 044 312 033 5 317 464 - 1 350 000 13 279 561 Capital under construction 22 954 512 564 99 123 - - - - 634 641 Increases/decreased in revaluation Depreciation 1 938 013 2 858 320 636 707 1 888 076 187 073 224 970 7 733 159
- Cost 799 598 2 858 320 636 707 - 1 888 076 187 073 224 970 6 594 744 - Revaluation 1 138 415 - - - - - - 1 138 415
Carrying value - disposals - - (87 968) (71 710) (89 628) - - (249 306) - Cost/Revaluation - (4 757) (511 793) (71 710) (853 429) (194 640) - (1 636 329) - Accumulated Depreciation - 4 757 423 825 - 763 801 194 640 - 1 387 023
Impairment losses - - - - - - - - Other movements - - - - - - - - Carrying values at 30 June 2006 18 652 415 21 856 255 7 747 683 2 997 600 11 531 928 3 429 597 1 125 030 67 340 508 Cost 16 437 403 42 724 515 11 786 564 2 997 600 18 125 193 6 461 978 1 350 000 99 883 253 Correction of error (Note 34) - - 1 100 000 - - - - 1 100 000 Revaluation 8 532 963 - - - - - - 8 532 963
Accumulated depreciation 6 317 951 20 868 260 5 138 881 - 6 593 265 3 032 381 224 970 42 175 708 - Cost 3 902 192 20 868 260 5 138 881 - 6 593 265 3 032 381 224 970 39 759 949 - Revaluation 2 415 759 - - - - - - 2 415 759
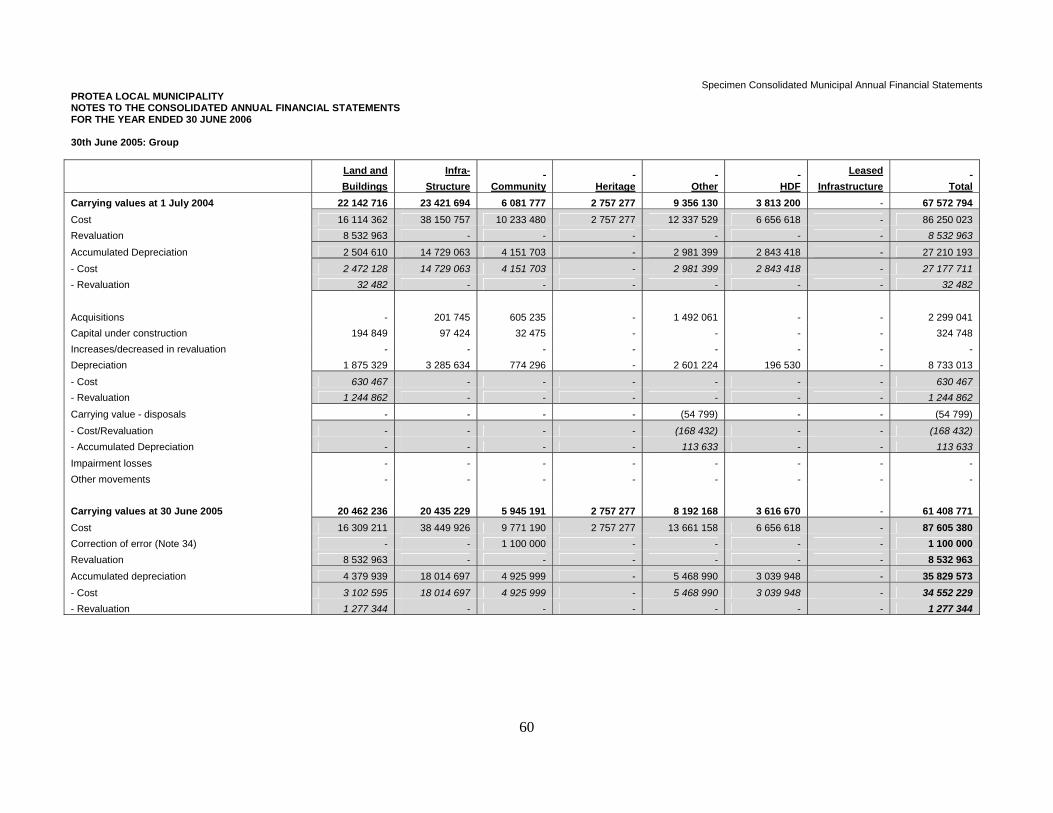
Specimen Consolidated Municipal Annual Financial Statements
60
PROTEA LOCAL MUNICIPALITY NOTES TO THE CONSOLIDATED ANNUAL FINANCIAL STATEMENTS FOR THE YEAR ENDED 30 JUNE 2006 30th June 2005: Group Land and Infra- Leased Buildings Structure Community Heritage Other HDF Infrastructure Total Carrying values at 1 July 2004 22 142 716 23 421 694 6 081 777 2 757 277 9 356 130 3 813 200 - 67 572 794 Cost 16 114 362 38 150 757 10 233 480 2 757 277 12 337 529 6 656 618 - 86 250 023 Revaluation 8 532 963 - - - - - - 8 532 963
Accumulated Depreciation 2 504 610 14 729 063 4 151 703 - 2 981 399 2 843 418 - 27 210 193 - Cost 2 472 128 14 729 063 4 151 703 - 2 981 399 2 843 418 - 27 177 711 - Revaluation 32 482 - - - - - - 32 482
Acquisitions - 201 745 605 235 - 1 492 061 - - 2 299 041 Capital under construction 194 849 97 424 32 475 - - - - 324 748 Increases/decreased in revaluation - - - - - - - - Depreciation 1 875 329 3 285 634 774 296 - 2 601 224 196 530 - 8 733 013
- Cost 630 467 - - - - - - 630 467 - Revaluation 1 244 862 - - - - - - 1 244 862
Carrying value - disposals - - - - (54 799) - - (54 799) - Cost/Revaluation - - - - (168 432) - - (168 432) - Accumulated Depreciation - - - - 113 633 - - 113 633
Impairment losses - - - - - - - - Other movements - - - - - - - - Carrying values at 30 June 2005 20 462 236 20 435 229 5 945 191 2 757 277 8 192 168 3 616 670 - 61 408 771 Cost 16 309 211 38 449 926 9 771 190 2 757 277 13 661 158 6 656 618 - 87 605 380 Correction of error (Note 34) - - 1 100 000 - - - - 1 100 000 Revaluation 8 532 963 - - - - - - 8 532 963 Accumulated depreciation 4 379 939 18 014 697 4 925 999 - 5 468 990 3 039 948 - 35 829 573 - Cost 3 102 595 18 014 697 4 925 999 - 5 468 990 3 039 948 - 34 552 229 - Revaluation 1 277 344 - - - - - - 1 277 344
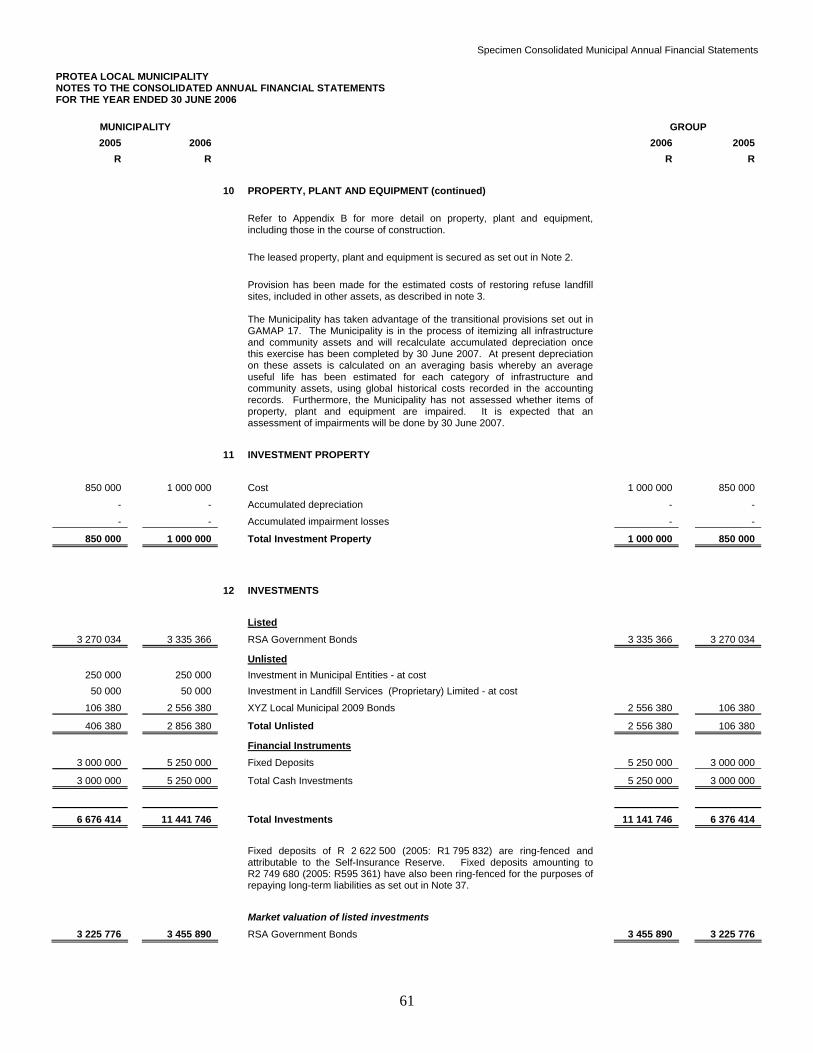
Specimen Consolidated Municipal Annual Financial Statements
61
PROTEA LOCAL MUNICIPALITY NOTES TO THE CONSOLIDATED ANNUAL FINANCIAL STATEMENTS FOR THE YEAR ENDED 30 JUNE 2006
MUNICIPALITY GROUP 2005 2006 2006 2005
R R R R 10 PROPERTY, PLANT AND EQUIPMENT (continued)
Refer to Appendix B for more detail on property, plant and equipment, including those in the course of construction.
The leased property, plant and equipment is secured as set out in Note 2.
Provision has been made for the estimated costs of restoring refuse landfill sites, included in other assets, as described in note 3.
The Municipality has taken advantage of the transitional provisions set out in GAMAP 17. The Municipality is in the process of itemizing all infrastructure and community assets and will recalculate accumulated depreciation once this exercise has been completed by 30 June 2007. At present depreciation on these assets is calculated on an averaging basis whereby an average useful life has been estimated for each category of infrastructure and community assets, using global historical costs recorded in the accounting records. Furthermore, the Municipality has not assessed whether items of property, plant and equipment are impaired. It is expected that an assessment of impairments will be done by 30 June 2007.
11 INVESTMENT PROPERTY
850 000 1 000 000 Cost 1 000 000 850 000
- - Accumulated depreciation - -
- - Accumulated impairment losses - -
850 000 1 000 000 Total Investment Property 1 000 000 850 000
12 INVESTMENTS
Listed
3 270 034 3 335 366 RSA Government Bonds 3 335 366 3 270 034
Unlisted 250 000 250 000 Investment in Municipal Entities - at cost
50 000 50 000 Investment in Landfill Services (Proprietary) Limited - at cost
106 380 2 556 380 XYZ Local Municipal 2009 Bonds 2 556 380 106 380
406 380 2 856 380 Total Unlisted 2 556 380 106 380
Financial Instruments
3 000 000 5 250 000 Fixed Deposits 5 250 000 3 000 000
3 000 000 5 250 000 Total Cash Investments 5 250 000 3 000 000
6 676 414 11 441 746 Total Investments 11 141 746 6 376 414
Fixed deposits of R 2 622 500 (2005: R1 795 832) are ring-fenced and attributable to the Self-Insurance Reserve. Fixed deposits amounting to R2 749 680 (2005: R595 361) have also been ring-fenced for the purposes of repaying long-term liabilities as set out in Note 37.
Market valuation of listed investments
3 225 776 3 455 890 RSA Government Bonds 3 455 890 3 225 776
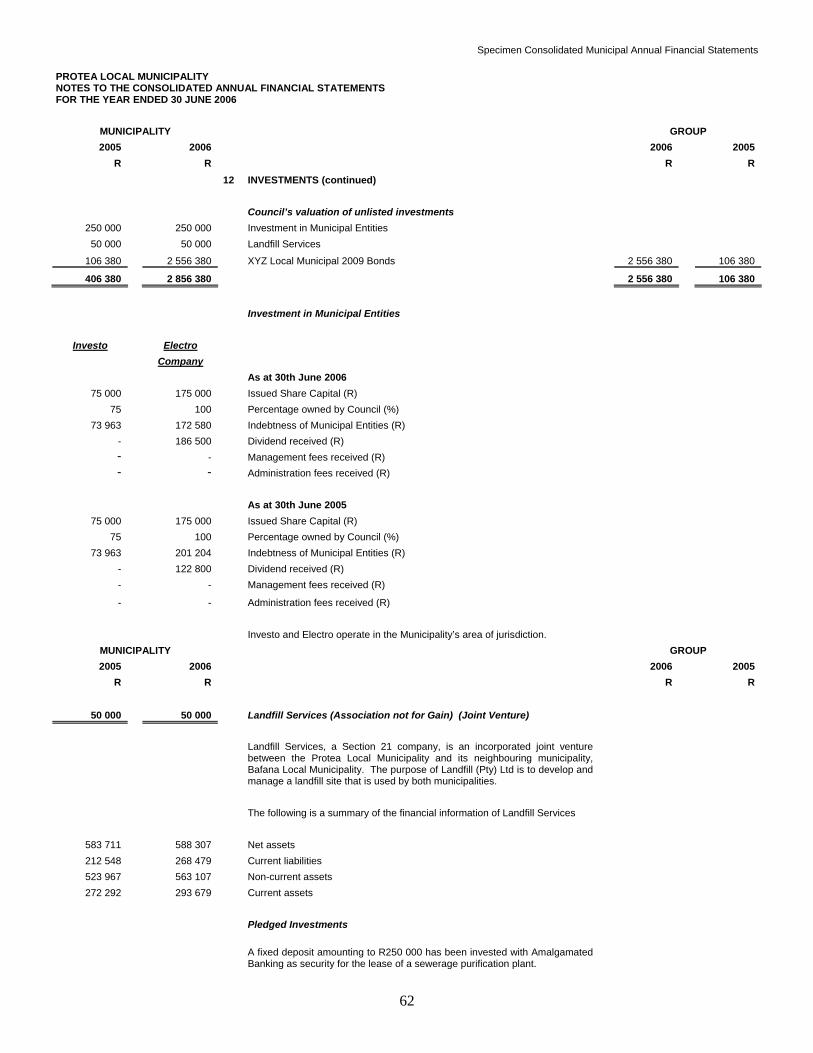
Specimen Consolidated Municipal Annual Financial Statements
62
PROTEA LOCAL MUNICIPALITY NOTES TO THE CONSOLIDATED ANNUAL FINANCIAL STATEMENTS FOR THE YEAR ENDED 30 JUNE 2006
MUNICIPALITY GROUP 2005 2006 2006 2005
R R R R 12 INVESTMENTS (continued) Council’s valuation of unlisted investments
250 000 250 000 Investment in Municipal Entities 50 000 50 000 Landfill Services
106 380 2 556 380 XYZ Local Municipal 2009 Bonds 2 556 380 106 380
406 380 2 856 380 2 556 380 106 380
Investment in Municipal Entities
Investo Electro Company
As at 30th June 2006 75 000 175 000 Issued Share Capital (R)
75 100 Percentage owned by Council (%) 73 963 172 580 Indebtness of Municipal Entities (R)
- 186 500 Dividend received (R) - - Management fees received (R) - - Administration fees received (R)
As at 30th June 2005
75 000 175 000 Issued Share Capital (R) 75 100 Percentage owned by Council (%)
73 963 201 204 Indebtness of Municipal Entities (R) - 122 800 Dividend received (R) - - Management fees received (R)
- - Administration fees received (R) Investo and Electro operate in the Municipality’s area of jurisdiction.
MUNICIPALITY GROUP 2005 2006 2006 2005
R R R R
50 000 50 000 Landfill Services (Association not for Gain) (Joint Venture)
Landfill Services, a Section 21 company, is an incorporated joint venture between the Protea Local Municipality and its neighbouring municipality, Bafana Local Municipality. The purpose of Landfill (Pty) Ltd is to develop and manage a landfill site that is used by both municipalities.
The following is a summary of the financial information of Landfill Services
583 711 588 307 Net assets 212 548 268 479 Current liabilities 523 967 563 107 Non-current assets 272 292 293 679 Current assets
Pledged Investments
A fixed deposit amounting to R250 000 has been invested with Amalgamated Banking as security for the lease of a sewerage purification plant.
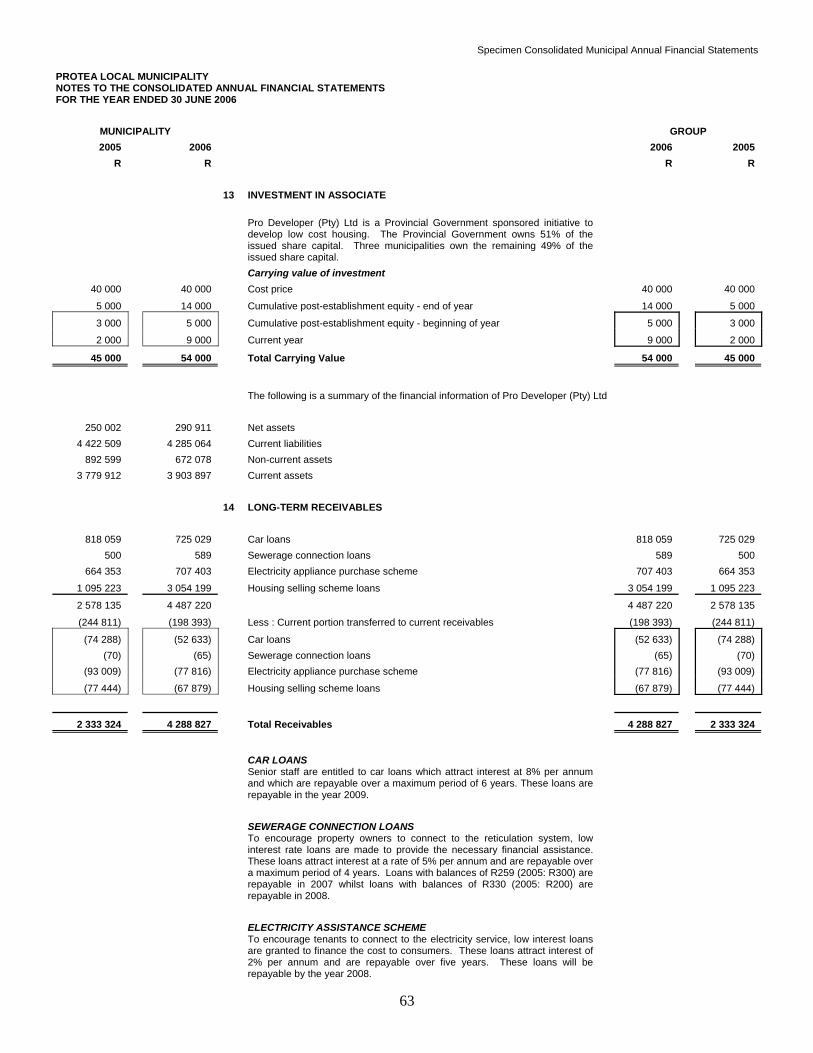
Specimen Consolidated Municipal Annual Financial Statements
63
PROTEA LOCAL MUNICIPALITY NOTES TO THE CONSOLIDATED ANNUAL FINANCIAL STATEMENTS FOR THE YEAR ENDED 30 JUNE 2006
MUNICIPALITY GROUP 2005 2006 2006 2005
R R R R 13 INVESTMENT IN ASSOCIATE
Pro Developer (Pty) Ltd is a Provincial Government sponsored initiative to develop low cost housing. The Provincial Government owns 51% of the issued share capital. Three municipalities own the remaining 49% of the issued share capital.
Carrying value of investment 40 000 40 000 Cost price 40 000 40 000
5 000 14 000 Cumulative post-establishment equity - end of year 14 000 5 000
3 000 5 000 Cumulative post-establishment equity - beginning of year 5 000 3 000
2 000 9 000 Current year 9 000 2 000
45 000 54 000 Total Carrying Value 54 000 45 000
The following is a summary of the financial information of Pro Developer (Pty) Ltd
250 002 290 911 Net assets 4 422 509 4 285 064 Current liabilities
892 599 672 078 Non-current assets 3 779 912 3 903 897 Current assets
14 LONG-TERM RECEIVABLES
818 059 725 029 Car loans 818 059 725 029 500 589 Sewerage connection loans 589 500
664 353 707 403 Electricity appliance purchase scheme 707 403 664 353
1 095 223 3 054 199 Housing selling scheme loans 3 054 199 1 095 223
2 578 135 4 487 220 4 487 220 2 578 135
(244 811) (198 393) Less : Current portion transferred to current receivables (198 393) (244 811)
(74 288) (52 633) Car loans (52 633) (74 288) (70) (65) Sewerage connection loans (65) (70)
(93 009) (77 816) Electricity appliance purchase scheme (77 816) (93 009)
(77 444) (67 879) Housing selling scheme loans (67 879) (77 444)
2 333 324 4 288 827 Total Receivables 4 288 827 2 333 324
CAR LOANS
Senior staff are entitled to car loans which attract interest at 8% per annum and which are repayable over a maximum period of 6 years. These loans are repayable in the year 2009.
SEWERAGE CONNECTION LOANS
To encourage property owners to connect to the reticulation system, low interest rate loans are made to provide the necessary financial assistance. These loans attract interest at a rate of 5% per annum and are repayable over a maximum period of 4 years. Loans with balances of R259 (2005: R300) are repayable in 2007 whilst loans with balances of R330 (2005: R200) are repayable in 2008.
ELECTRICITY ASSISTANCE SCHEME
To encourage tenants to connect to the electricity service, low interest loans are granted to finance the cost to consumers. These loans attract interest of 2% per annum and are repayable over five years. These loans will be repayable by the year 2008.
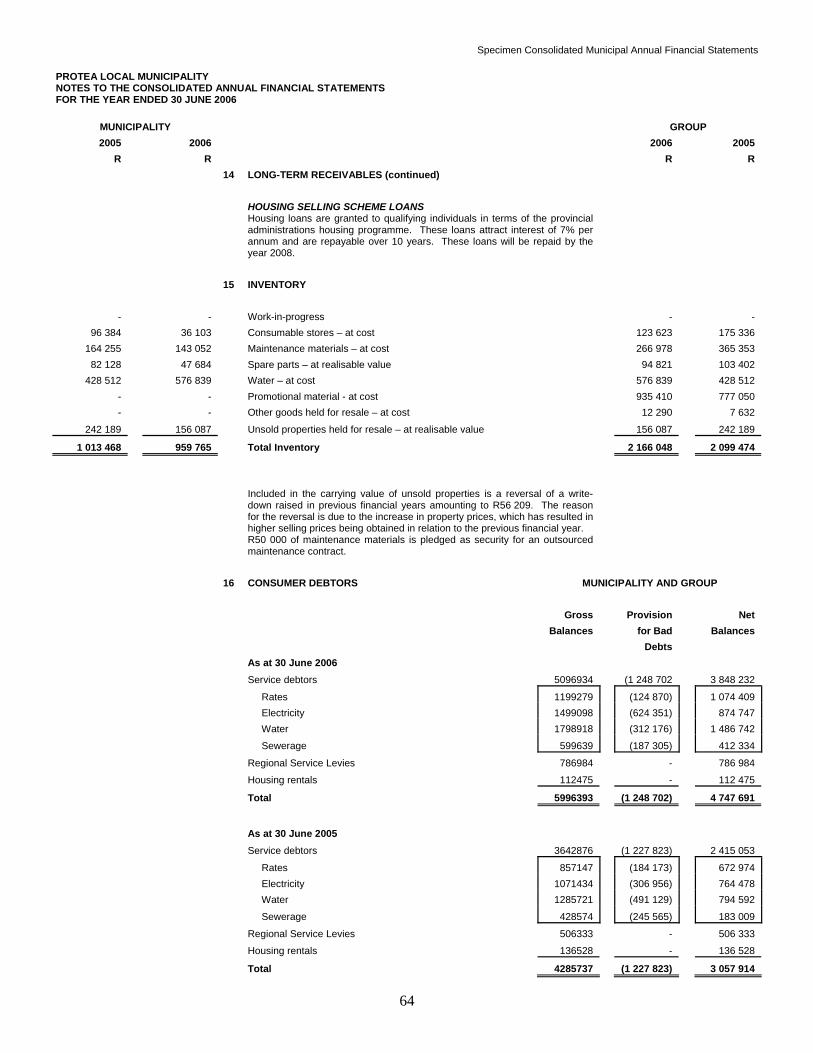
Specimen Consolidated Municipal Annual Financial Statements
64
PROTEA LOCAL MUNICIPALITY NOTES TO THE CONSOLIDATED ANNUAL FINANCIAL STATEMENTS FOR THE YEAR ENDED 30 JUNE 2006
MUNICIPALITY GROUP 2005 2006 2006 2005
R R R R 14 LONG-TERM RECEIVABLES (continued) HOUSING SELLING SCHEME LOANS
Housing loans are granted to qualifying individuals in terms of the provincial administrations housing programme. These loans attract interest of 7% per annum and are repayable over 10 years. These loans will be repaid by the year 2008.
15 INVENTORY
- - Work-in-progress - - 96 384 36 103 Consumable stores – at cost 123 623 175 336
164 255 143 052 Maintenance materials – at cost 266 978 365 353 82 128 47 684 Spare parts – at realisable value 94 821 103 402
428 512 576 839 Water – at cost 576 839 428 512 - - Promotional material - at cost 935 410 777 050 - - Other goods held for resale – at cost 12 290 7 632
242 189 156 087 Unsold properties held for resale – at realisable value 156 087 242 189
1 013 468 959 765 Total Inventory 2 166 048 2 099 474
Included in the carrying value of unsold properties is a reversal of a write-down raised in previous financial years amounting to R56 209. The reason for the reversal is due to the increase in property prices, which has resulted in higher selling prices being obtained in relation to the previous financial year.
R50 000 of maintenance materials is pledged as security for an outsourced maintenance contract.
16 CONSUMER DEBTORS MUNICIPALITY AND GROUP Gross Provision Net Balances for Bad Balances Debts As at 30 June 2006 Service debtors 5096934 (1 248 702 3 848 232
Rates 1199279 (124 870) 1 074 409 Electricity 1499098 (624 351) 874 747 Water 1798918 (312 176) 1 486 742 Sewerage 599639 (187 305) 412 334
Regional Service Levies 786984 - 786 984 Housing rentals 112475 - 112 475
Total 5996393 (1 248 702) 4 747 691
As at 30 June 2005 Service debtors 3642876 (1 227 823) 2 415 053
Rates 857147 (184 173) 672 974 Electricity 1071434 (306 956) 764 478 Water 1285721 (491 129) 794 592 Sewerage 428574 (245 565) 183 009
Regional Service Levies 506333 - 506 333 Housing rentals 136528 - 136 528
Total 4285737 (1 227 823) 3 057 914
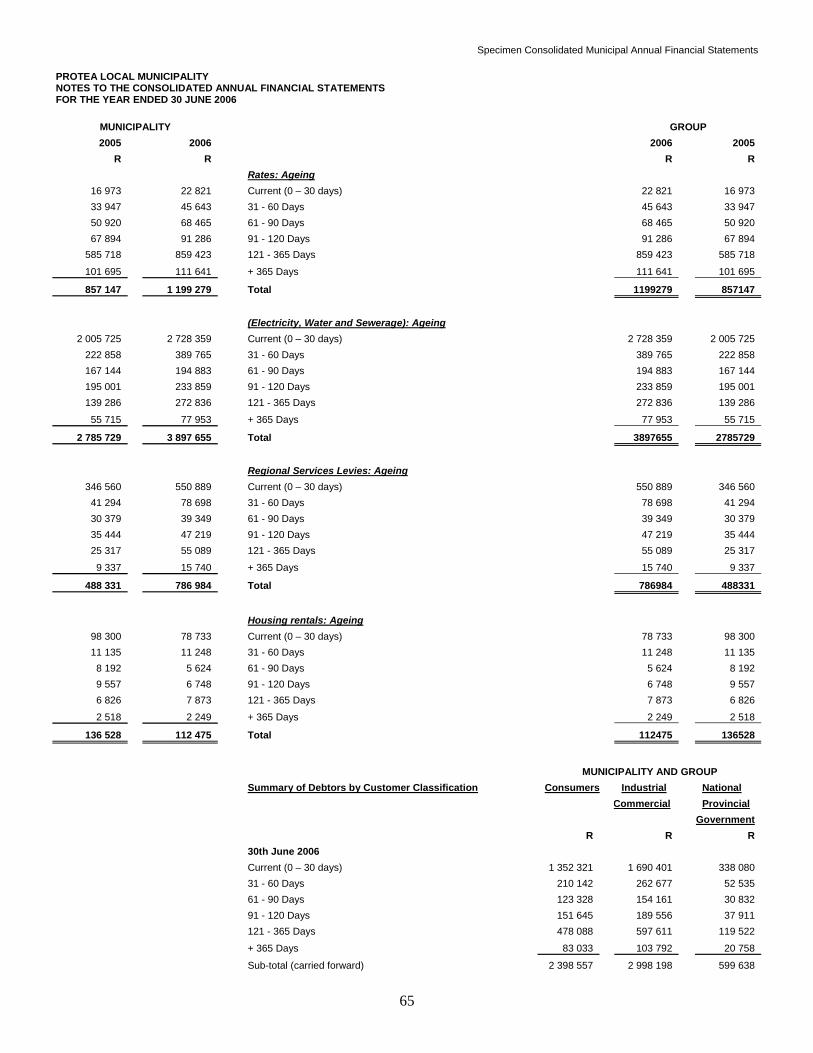
Specimen Consolidated Municipal Annual Financial Statements
65
PROTEA LOCAL MUNICIPALITY NOTES TO THE CONSOLIDATED ANNUAL FINANCIAL STATEMENTS FOR THE YEAR ENDED 30 JUNE 2006
MUNICIPALITY GROUP 2005 2006 2006 2005
R R R R Rates: Ageing
16 973 22 821 Current (0 – 30 days) 22 821 16 973 33 947 45 643 31 - 60 Days 45 643 33 947 50 920 68 465 61 - 90 Days 68 465 50 920 67 894 91 286 91 - 120 Days 91 286 67 894
585 718 859 423 121 - 365 Days 859 423 585 718
101 695 111 641 + 365 Days 111 641 101 695
857 147 1 199 279 Total 1199279 857147 (Electricity, Water and Sewerage): Ageing
2 005 725 2 728 359 Current (0 – 30 days) 2 728 359 2 005 725 222 858 389 765 31 - 60 Days 389 765 222 858 167 144 194 883 61 - 90 Days 194 883 167 144 195 001 233 859 91 - 120 Days 233 859 195 001 139 286 272 836 121 - 365 Days 272 836 139 286
55 715 77 953 + 365 Days 77 953 55 715
2 785 729 3 897 655 Total 3897655 2785729 Regional Services Levies: Ageing
346 560 550 889 Current (0 – 30 days) 550 889 346 560 41 294 78 698 31 - 60 Days 78 698 41 294 30 379 39 349 61 - 90 Days 39 349 30 379 35 444 47 219 91 - 120 Days 47 219 35 444 25 317 55 089 121 - 365 Days 55 089 25 317
9 337 15 740 + 365 Days 15 740 9 337
488 331 786 984 Total 786984 488331
Housing rentals: Ageing
98 300 78 733 Current (0 – 30 days) 78 733 98 300 11 135 11 248 31 - 60 Days 11 248 11 135 8 192 5 624 61 - 90 Days 5 624 8 192 9 557 6 748 91 - 120 Days 6 748 9 557 6 826 7 873 121 - 365 Days 7 873 6 826
2 518 2 249 + 365 Days 2 249 2 518
136 528 112 475 Total 112475 136528
MUNICIPALITY AND GROUP Summary of Debtors by Customer Classification Consumers Industrial National Commercial Provincial Government R R R 30th June 2006 Current (0 – 30 days) 1 352 321 1 690 401 338 080 31 - 60 Days 210 142 262 677 52 535 61 - 90 Days 123 328 154 161 30 832 91 - 120 Days 151 645 189 556 37 911 121 - 365 Days 478 088 597 611 119 522 + 365 Days 83 033 103 792 20 758
Sub-total (carried forward) 2 398 557 2 998 198 599 638
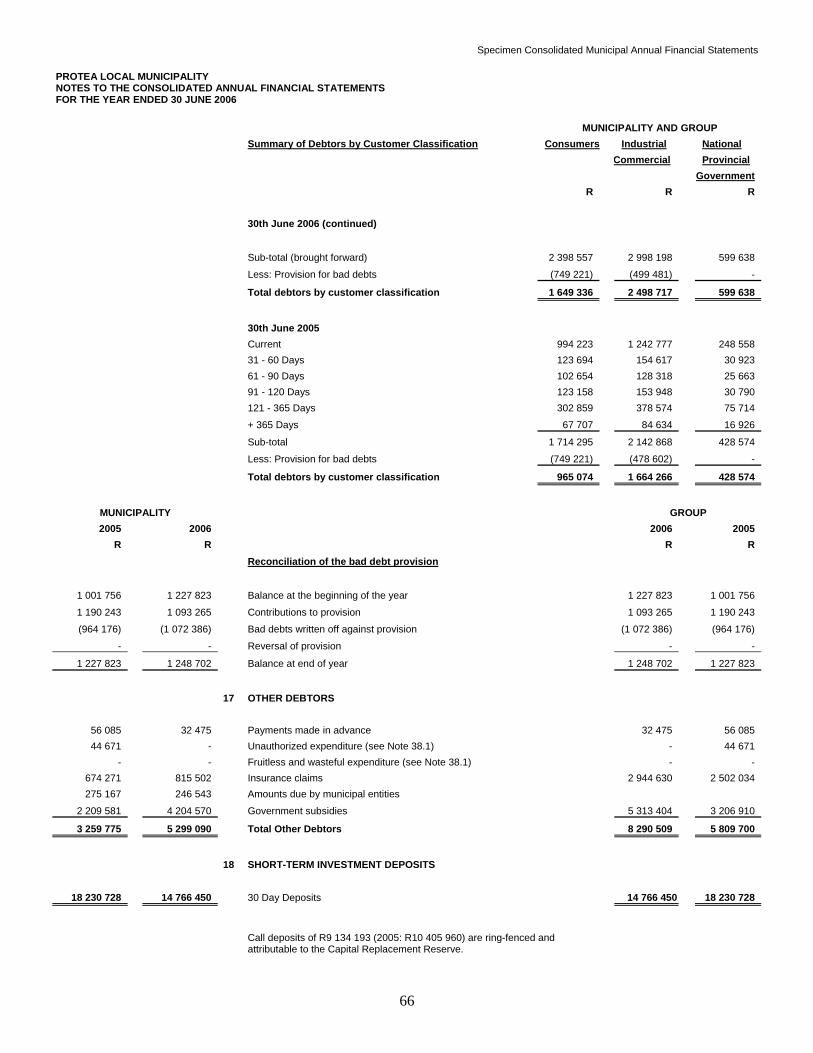
Specimen Consolidated Municipal Annual Financial Statements
66
PROTEA LOCAL MUNICIPALITY NOTES TO THE CONSOLIDATED ANNUAL FINANCIAL STATEMENTS FOR THE YEAR ENDED 30 JUNE 2006 MUNICIPALITY AND GROUP Summary of Debtors by Customer Classification Consumers Industrial National Commercial Provincial Government R R R 30th June 2006 (continued) Sub-total (brought forward) 2 398 557 2 998 198 599 638 Less: Provision for bad debts (749 221) (499 481) -
Total debtors by customer classification 1 649 336 2 498 717 599 638
30th June 2005 Current 994 223 1 242 777 248 558 31 - 60 Days 123 694 154 617 30 923 61 - 90 Days 102 654 128 318 25 663 91 - 120 Days 123 158 153 948 30 790 121 - 365 Days 302 859 378 574 75 714 + 365 Days 67 707 84 634 16 926
Sub-total 1 714 295 2 142 868 428 574 Less: Provision for bad debts (749 221) (478 602) -
Total debtors by customer classification 965 074 1 664 266 428 574
MUNICIPALITY GROUP 2005 2006 2006 2005
R R R R Reconciliation of the bad debt provision
1 001 756 1 227 823 Balance at the beginning of the year 1 227 823 1 001 756
1 190 243 1 093 265 Contributions to provision 1 093 265 1 190 243
(964 176) (1 072 386) Bad debts written off against provision (1 072 386) (964 176)
- - Reversal of provision - -
1 227 823 1 248 702 Balance at end of year 1 248 702 1 227 823
17 OTHER DEBTORS
56 085 32 475 Payments made in advance 32 475 56 085 44 671 - Unauthorized expenditure (see Note 38.1) - 44 671
- - Fruitless and wasteful expenditure (see Note 38.1) - - 674 271 815 502 Insurance claims 2 944 630 2 502 034 275 167 246 543 Amounts due by municipal entities
2 209 581 4 204 570 Government subsidies 5 313 404 3 206 910
3 259 775 5 299 090 Total Other Debtors 8 290 509 5 809 700
18 SHORT-TERM INVESTMENT DEPOSITS
18 230 728 14 766 450 30 Day Deposits 14 766 450 18 230 728
Call deposits of R9 134 193 (2005: R10 405 960) are ring-fenced and attributable to the Capital Replacement Reserve.
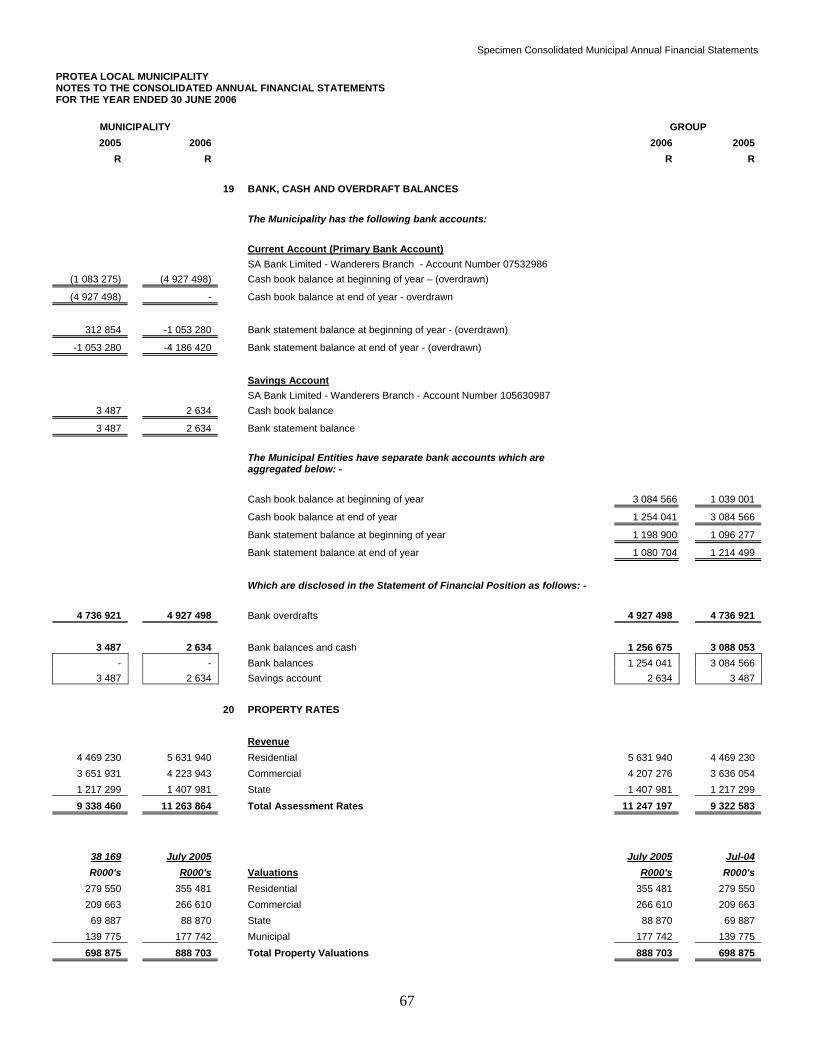
Specimen Consolidated Municipal Annual Financial Statements
67
PROTEA LOCAL MUNICIPALITY NOTES TO THE CONSOLIDATED ANNUAL FINANCIAL STATEMENTS FOR THE YEAR ENDED 30 JUNE 2006
MUNICIPALITY GROUP 2005 2006 2006 2005
R R R R 19 BANK, CASH AND OVERDRAFT BALANCES The Municipality has the following bank accounts: Current Account (Primary Bank Account) SA Bank Limited - Wanderers Branch - Account Number 07532986
(1 083 275) (4 927 498) Cash book balance at beginning of year – (overdrawn)
(4 927 498) - Cash book balance at end of year - overdrawn
312 854 -1 053 280 Bank statement balance at beginning of year - (overdrawn)
-1 053 280 -4 186 420 Bank statement balance at end of year - (overdrawn)
Savings Account SA Bank Limited - Wanderers Branch - Account Number 105630987
3 487 2 634 Cash book balance
3 487 2 634 Bank statement balance
The Municipal Entities have separate bank accounts which are aggregated below: -
Cash book balance at beginning of year 3 084 566 1 039 001
Cash book balance at end of year 1 254 041 3 084 566
Bank statement balance at beginning of year 1 198 900 1 096 277
Bank statement balance at end of year 1 080 704 1 214 499
Which are disclosed in the Statement of Financial Position as follows: -
4 736 921 4 927 498 Bank overdrafts 4 927 498 4 736 921
3 487 2 634 Bank balances and cash 1 256 675 3 088 053
- - Bank balances 1 254 041 3 084 566 3 487 2 634 Savings account 2 634 3 487
20 PROPERTY RATES Revenue
4 469 230 5 631 940 Residential 5 631 940 4 469 230 3 651 931 4 223 943 Commercial 4 207 276 3 636 054 1 217 299 1 407 981 State 1 407 981 1 217 299 9 338 460 11 263 864 Total Assessment Rates 11 247 197 9 322 583
38 169 July 2005 July 2005 Jul-04 R000's R000's Valuations R000's R000's
279 550 355 481 Residential 355 481 279 550 209 663 266 610 Commercial 266 610 209 663
69 887 88 870 State 88 870 69 887 139 775 177 742 Municipal 177 742 139 775 698 875 888 703 Total Property Valuations 888 703 698 875
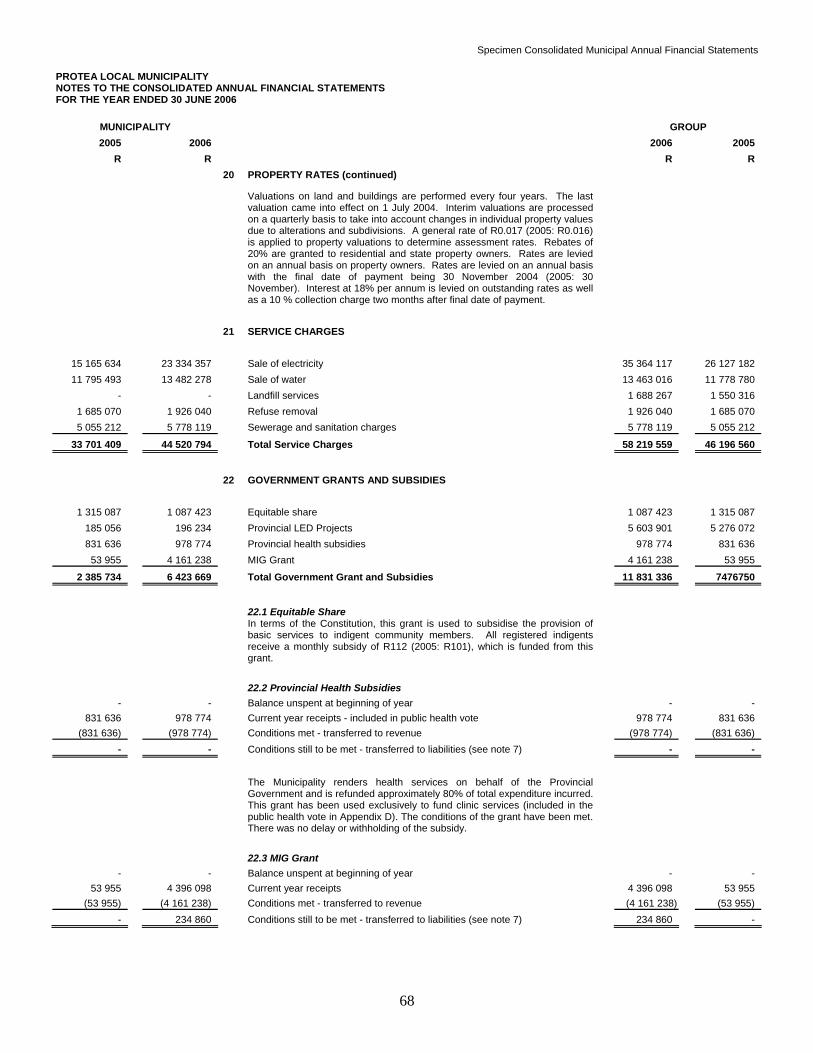
Specimen Consolidated Municipal Annual Financial Statements
68
PROTEA LOCAL MUNICIPALITY NOTES TO THE CONSOLIDATED ANNUAL FINANCIAL STATEMENTS FOR THE YEAR ENDED 30 JUNE 2006
MUNICIPALITY GROUP 2005 2006 2006 2005
R R R R 20 PROPERTY RATES (continued)
Valuations on land and buildings are performed every four years. The last valuation came into effect on 1 July 2004. Interim valuations are processed on a quarterly basis to take into account changes in individual property values due to alterations and subdivisions. A general rate of R0.017 (2005: R0.016) is applied to property valuations to determine assessment rates. Rebates of 20% are granted to residential and state property owners. Rates are levied on an annual basis on property owners. Rates are levied on an annual basis with the final date of payment being 30 November 2004 (2005: 30 November). Interest at 18% per annum is levied on outstanding rates as well as a 10 % collection charge two months after final date of payment.
21 SERVICE CHARGES
15 165 634 23 334 357 Sale of electricity 35 364 117 26 127 182 11 795 493 13 482 278 Sale of water 13 463 016 11 778 780
- - Landfill services 1 688 267 1 550 316 1 685 070 1 926 040 Refuse removal 1 926 040 1 685 070 5 055 212 5 778 119 Sewerage and sanitation charges 5 778 119 5 055 212
33 701 409 44 520 794 Total Service Charges 58 219 559 46 196 560
22 GOVERNMENT GRANTS AND SUBSIDIES
1 315 087 1 087 423 Equitable share 1 087 423 1 315 087 185 056 196 234 Provincial LED Projects 5 603 901 5 276 072 831 636 978 774 Provincial health subsidies 978 774 831 636
53 955 4 161 238 MIG Grant 4 161 238 53 955
2 385 734 6 423 669 Total Government Grant and Subsidies 11 831 336 7476750
22.1 Equitable Share
In terms of the Constitution, this grant is used to subsidise the provision of basic services to indigent community members. All registered indigents receive a monthly subsidy of R112 (2005: R101), which is funded from this grant.
22.2 Provincial Health Subsidies
- - Balance unspent at beginning of year - - 831 636 978 774 Current year receipts - included in public health vote 978 774 831 636
(831 636) (978 774) Conditions met - transferred to revenue (978 774) (831 636) - - Conditions still to be met - transferred to liabilities (see note 7) - -
The Municipality renders health services on behalf of the Provincial Government and is refunded approximately 80% of total expenditure incurred. This grant has been used exclusively to fund clinic services (included in the public health vote in Appendix D). The conditions of the grant have been met. There was no delay or withholding of the subsidy.
22.3 MIG Grant
- - Balance unspent at beginning of year - - 53 955 4 396 098 Current year receipts 4 396 098 53 955
(53 955) (4 161 238) Conditions met - transferred to revenue (4 161 238) (53 955) - 234 860 Conditions still to be met - transferred to liabilities (see note 7) 234 860 -
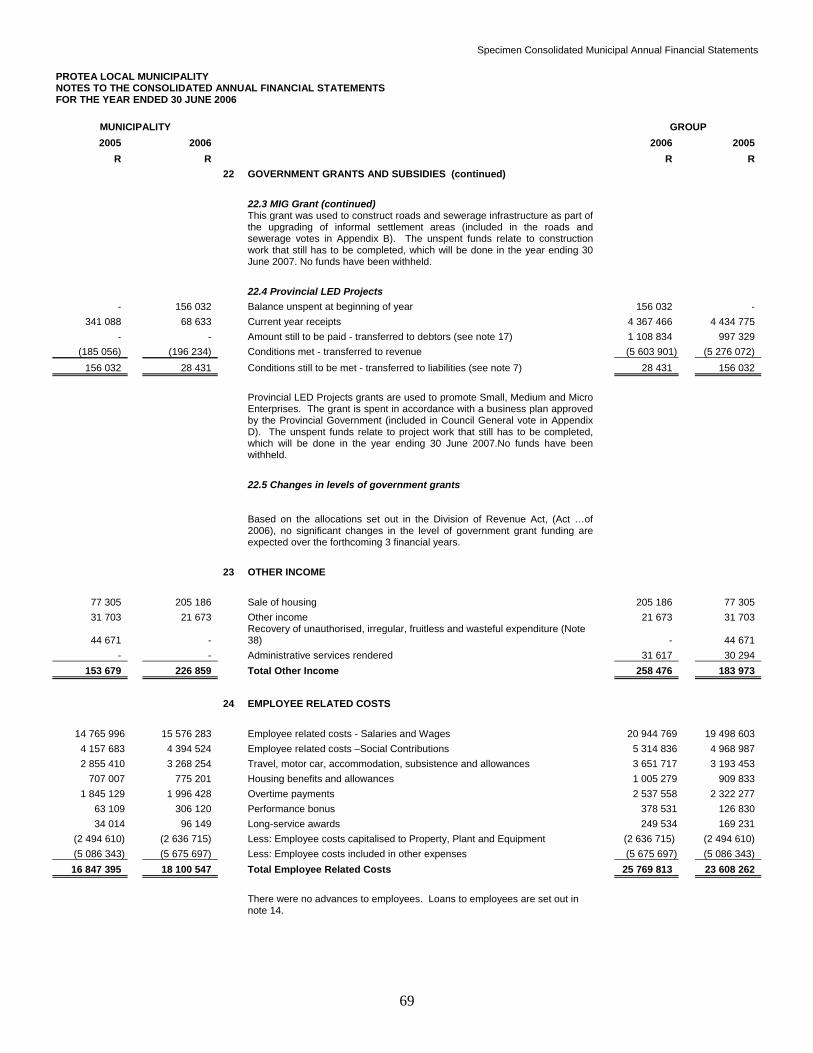
Specimen Consolidated Municipal Annual Financial Statements
69
PROTEA LOCAL MUNICIPALITY NOTES TO THE CONSOLIDATED ANNUAL FINANCIAL STATEMENTS FOR THE YEAR ENDED 30 JUNE 2006
MUNICIPALITY GROUP 2005 2006 2006 2005
R R R R 22 GOVERNMENT GRANTS AND SUBSIDIES (continued) 22.3 MIG Grant (continued)
This grant was used to construct roads and sewerage infrastructure as part of the upgrading of informal settlement areas (included in the roads and sewerage votes in Appendix B). The unspent funds relate to construction work that still has to be completed, which will be done in the year ending 30 June 2007. No funds have been withheld.
22.4 Provincial LED Projects
- 156 032 Balance unspent at beginning of year 156 032 - 341 088 68 633 Current year receipts 4 367 466 4 434 775
- - Amount still to be paid - transferred to debtors (see note 17) 1 108 834 997 329 (185 056) (196 234) Conditions met - transferred to revenue (5 603 901) (5 276 072)
156 032 28 431 Conditions still to be met - transferred to liabilities (see note 7) 28 431 156 032
Provincial LED Projects grants are used to promote Small, Medium and Micro Enterprises. The grant is spent in accordance with a business plan approved by the Provincial Government (included in Council General vote in Appendix D). The unspent funds relate to project work that still has to be completed, which will be done in the year ending 30 June 2007.No funds have been withheld.
22.5 Changes in levels of government grants
Based on the allocations set out in the Division of Revenue Act, (Act …of 2006), no significant changes in the level of government grant funding are expected over the forthcoming 3 financial years.
23 OTHER INCOME
77 305 205 186 Sale of housing 205 186 77 305 31 703 21 673 Other income 21 673 31 703
44 671
- Recovery of unauthorised, irregular, fruitless and wasteful expenditure (Note 38) - 44 671
- - Administrative services rendered 31 617 30 294 153 679 226 859 Total Other Income 258 476 183 973
24 EMPLOYEE RELATED COSTS
14 765 996 15 576 283 Employee related costs - Salaries and Wages 20 944 769 19 498 603 4 157 683 4 394 524 Employee related costs –Social Contributions 5 314 836 4 968 987 2 855 410 3 268 254 Travel, motor car, accommodation, subsistence and allowances 3 651 717 3 193 453
707 007 775 201 Housing benefits and allowances 1 005 279 909 833 1 845 129 1 996 428 Overtime payments 2 537 558 2 322 277
63 109 306 120 Performance bonus 378 531 126 830 34 014 96 149 Long-service awards 249 534 169 231
(2 494 610) (2 636 715) Less: Employee costs capitalised to Property, Plant and Equipment (2 636 715) (2 494 610) (5 086 343) (5 675 697) Less: Employee costs included in other expenses (5 675 697) (5 086 343) 16 847 395 18 100 547 Total Employee Related Costs 25 769 813 23 608 262
There were no advances to employees. Loans to employees are set out in note 14.
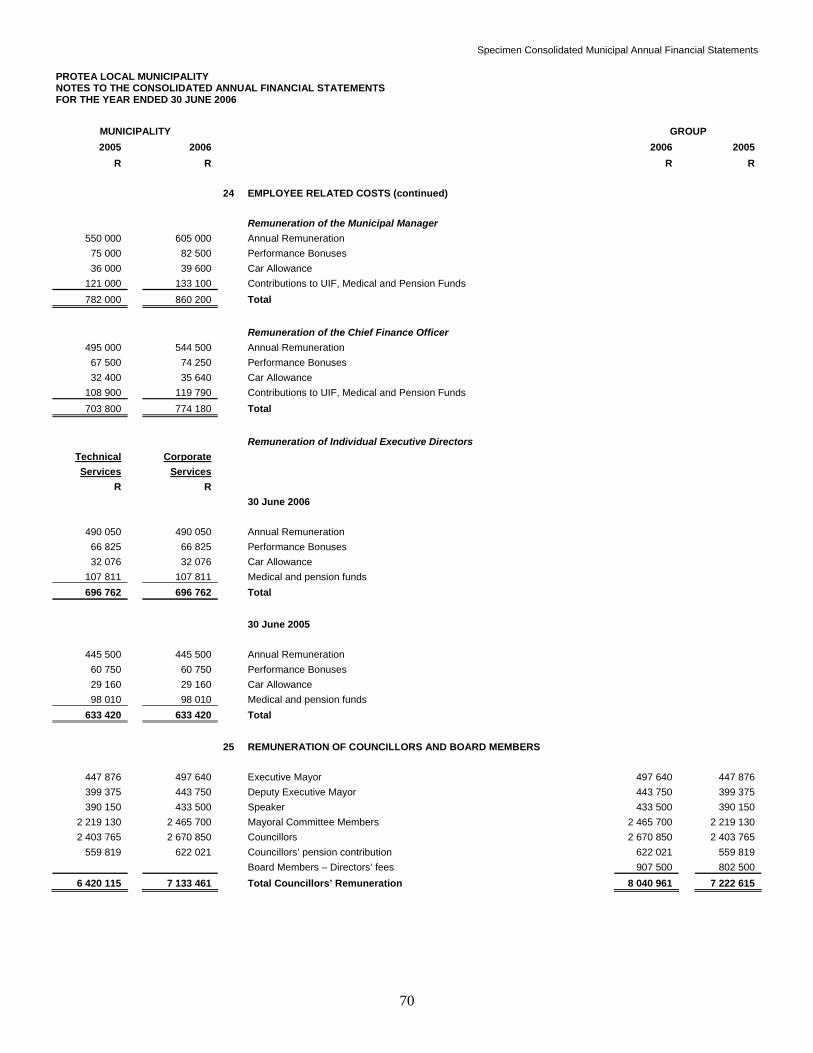
Specimen Consolidated Municipal Annual Financial Statements
70
PROTEA LOCAL MUNICIPALITY NOTES TO THE CONSOLIDATED ANNUAL FINANCIAL STATEMENTS FOR THE YEAR ENDED 30 JUNE 2006
MUNICIPALITY GROUP 2005 2006 2006 2005
R R R R 24 EMPLOYEE RELATED COSTS (continued)
Remuneration of the Municipal Manager
550 000 605 000 Annual Remuneration 75 000 82 500 Performance Bonuses 36 000 39 600 Car Allowance
121 000 133 100 Contributions to UIF, Medical and Pension Funds 782 000 860 200 Total
Remuneration of the Chief Finance Officer
495 000 544 500 Annual Remuneration 67 500 74 250 Performance Bonuses 32 400 35 640 Car Allowance
108 900 119 790 Contributions to UIF, Medical and Pension Funds 703 800 774 180 Total
Remuneration of Individual Executive Directors
Technical Corporate Services Services
R R 30 June 2006
490 050 490 050 Annual Remuneration 66 825 66 825 Performance Bonuses 32 076 32 076 Car Allowance
107 811 107 811 Medical and pension funds 696 762 696 762 Total
30 June 2005
445 500 445 500 Annual Remuneration 60 750 60 750 Performance Bonuses 29 160 29 160 Car Allowance 98 010 98 010 Medical and pension funds
633 420 633 420 Total 25 REMUNERATION OF COUNCILLORS AND BOARD MEMBERS
447 876 497 640 Executive Mayor 497 640 447 876 399 375 443 750 Deputy Executive Mayor 443 750 399 375 390 150 433 500 Speaker 433 500 390 150
2 219 130 2 465 700 Mayoral Committee Members 2 465 700 2 219 130 2 403 765 2 670 850 Councillors 2 670 850 2 403 765
559 819 622 021 Councillors’ pension contribution 622 021 559 819 Board Members – Directors’ fees 907 500 802 500
6 420 115 7 133 461 Total Councillors’ Remuneration 8 040 961 7 222 615
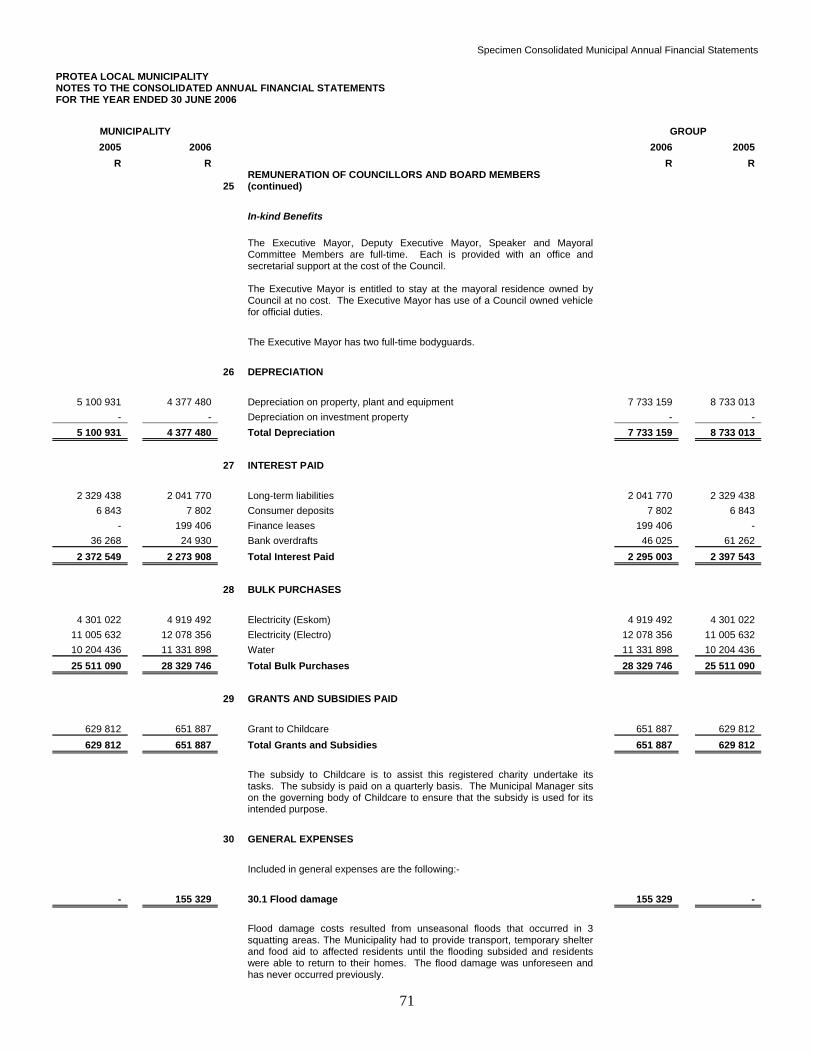
Specimen Consolidated Municipal Annual Financial Statements
71
PROTEA LOCAL MUNICIPALITY NOTES TO THE CONSOLIDATED ANNUAL FINANCIAL STATEMENTS FOR THE YEAR ENDED 30 JUNE 2006
MUNICIPALITY GROUP 2005 2006 2006 2005
R R R R
25 REMUNERATION OF COUNCILLORS AND BOARD MEMBERS (continued)
In-kind Benefits
The Executive Mayor, Deputy Executive Mayor, Speaker and Mayoral Committee Members are full-time. Each is provided with an office and secretarial support at the cost of the Council.
The Executive Mayor is entitled to stay at the mayoral residence owned by Council at no cost. The Executive Mayor has use of a Council owned vehicle for official duties.
The Executive Mayor has two full-time bodyguards. 26 DEPRECIATION
5 100 931 4 377 480 Depreciation on property, plant and equipment 7 733 159 8 733 013 - - Depreciation on investment property - -
5 100 931 4 377 480 Total Depreciation 7 733 159 8 733 013
27 INTEREST PAID
2 329 438 2 041 770 Long-term liabilities 2 041 770 2 329 438 6 843 7 802 Consumer deposits 7 802 6 843
- 199 406 Finance leases 199 406 - 36 268 24 930 Bank overdrafts 46 025 61 262
2 372 549 2 273 908 Total Interest Paid 2 295 003 2 397 543
28 BULK PURCHASES
4 301 022 4 919 492 Electricity (Eskom) 4 919 492 4 301 022 11 005 632 12 078 356 Electricity (Electro) 12 078 356 11 005 632 10 204 436 11 331 898 Water 11 331 898 10 204 436 25 511 090 28 329 746 Total Bulk Purchases 28 329 746 25 511 090
29 GRANTS AND SUBSIDIES PAID
629 812 651 887 Grant to Childcare 651 887 629 812 629 812 651 887 Total Grants and Subsidies 651 887 629 812
The subsidy to Childcare is to assist this registered charity undertake its tasks. The subsidy is paid on a quarterly basis. The Municipal Manager sits on the governing body of Childcare to ensure that the subsidy is used for its intended purpose.
30 GENERAL EXPENSES Included in general expenses are the following:-
- 155 329 30.1 Flood damage 155 329 -
Flood damage costs resulted from unseasonal floods that occurred in 3 squatting areas. The Municipality had to provide transport, temporary shelter and food aid to affected residents until the flooding subsided and residents were able to return to their homes. The flood damage was unforeseen and has never occurred previously.
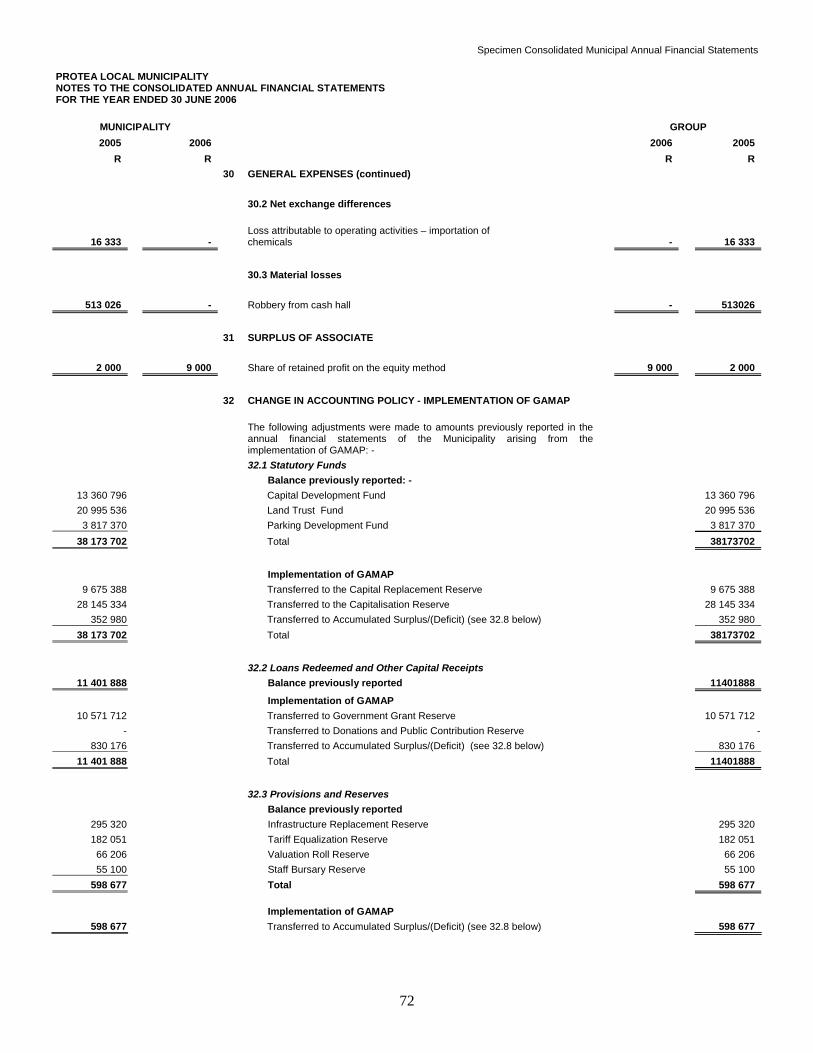
Specimen Consolidated Municipal Annual Financial Statements
72
PROTEA LOCAL MUNICIPALITY NOTES TO THE CONSOLIDATED ANNUAL FINANCIAL STATEMENTS FOR THE YEAR ENDED 30 JUNE 2006
MUNICIPALITY GROUP 2005 2006 2006 2005
R R R R 30 GENERAL EXPENSES (continued) 30.2 Net exchange differences
16 333
- Loss attributable to operating activities – importation of chemicals - 16 333
30.3 Material losses
513 026 - Robbery from cash hall - 513026
31 SURPLUS OF ASSOCIATE
2 000 9 000 Share of retained profit on the equity method 9 000 2 000
32 CHANGE IN ACCOUNTING POLICY - IMPLEMENTATION OF GAMAP
The following adjustments were made to amounts previously reported in the annual financial statements of the Municipality arising from the implementation of GAMAP: -
32.1 Statutory Funds Balance previously reported: -
13 360 796 Capital Development Fund 13 360 796 20 995 536 Land Trust Fund 20 995 536 3 817 370 Parking Development Fund 3 817 370
38 173 702 Total 38173702
Implementation of GAMAP
9 675 388 Transferred to the Capital Replacement Reserve 9 675 388 28 145 334 Transferred to the Capitalisation Reserve 28 145 334
352 980 Transferred to Accumulated Surplus/(Deficit) (see 32.8 below) 352 980 38 173 702 Total 38173702
32.2 Loans Redeemed and Other Capital Receipts
11 401 888 Balance previously reported 11401888
Implementation of GAMAP 10 571 712 Transferred to Government Grant Reserve 10 571 712
- Transferred to Donations and Public Contribution Reserve -830 176 Transferred to Accumulated Surplus/(Deficit) (see 32.8 below) 830 176
11 401 888 Total 11401888
32.3 Provisions and Reserves Balance previously reported
295 320 Infrastructure Replacement Reserve 295 320 182 051 Tariff Equalization Reserve 182 051 66 206 Valuation Roll Reserve 66 206 55 100 Staff Bursary Reserve 55 100
598 677 Total 598 677 Implementation of GAMAP
598 677 Transferred to Accumulated Surplus/(Deficit) (see 32.8 below) 598 677
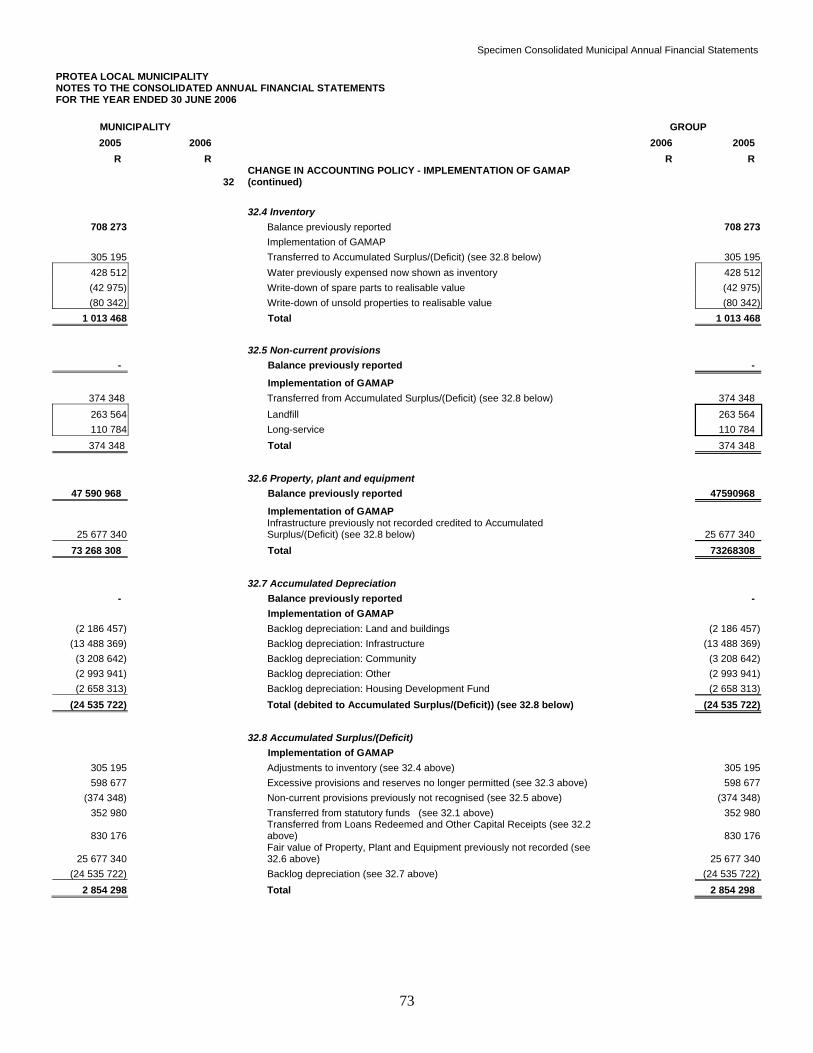
Specimen Consolidated Municipal Annual Financial Statements
73
PROTEA LOCAL MUNICIPALITY NOTES TO THE CONSOLIDATED ANNUAL FINANCIAL STATEMENTS FOR THE YEAR ENDED 30 JUNE 2006
MUNICIPALITY GROUP 2005 2006 2006 2005
R R R R
32 CHANGE IN ACCOUNTING POLICY - IMPLEMENTATION OF GAMAP (continued)
32.4 Inventory
708 273 Balance previously reported 708 273 Implementation of GAMAP
305 195 Transferred to Accumulated Surplus/(Deficit) (see 32.8 below) 305 195428 512 Water previously expensed now shown as inventory 428 512(42 975) Write-down of spare parts to realisable value (42 975)(80 342) Write-down of unsold properties to realisable value (80 342)
1 013 468 Total 1 013 468 32.5 Non-current provisions
- Balance previously reported -
Implementation of GAMAP 374 348 Transferred from Accumulated Surplus/(Deficit) (see 32.8 below) 374 348 263 564 Landfill 263 564 110 784 Long-service 110 784 374 348 Total 374 348
32.6 Property, plant and equipment
47 590 968 Balance previously reported 47590968
Implementation of GAMAP
25 677 340
Infrastructure previously not recorded credited to Accumulated Surplus/(Deficit) (see 32.8 below) 25 677 340
73 268 308 Total 73268308
32.7 Accumulated Depreciation
- Balance previously reported - Implementation of GAMAP
(2 186 457) Backlog depreciation: Land and buildings (2 186 457)(13 488 369) Backlog depreciation: Infrastructure (13 488 369)
(3 208 642) Backlog depreciation: Community (3 208 642)(2 993 941) Backlog depreciation: Other (2 993 941)(2 658 313) Backlog depreciation: Housing Development Fund (2 658 313)
(24 535 722) Total (debited to Accumulated Surplus/(Deficit)) (see 32.8 below) (24 535 722)
32.8 Accumulated Surplus/(Deficit) Implementation of GAMAP
305 195 Adjustments to inventory (see 32.4 above) 305 195598 677 Excessive provisions and reserves no longer permitted (see 32.3 above) 598 677
(374 348) Non-current provisions previously not recognised (see 32.5 above) (374 348)352 980 Transferred from statutory funds (see 32.1 above) 352 980
830 176
Transferred from Loans Redeemed and Other Capital Receipts (see 32.2 above) 830 176
25 677 340
Fair value of Property, Plant and Equipment previously not recorded (see 32.6 above) 25 677 340
(24 535 722) Backlog depreciation (see 32.7 above) (24 535 722)2 854 298 Total 2 854 298
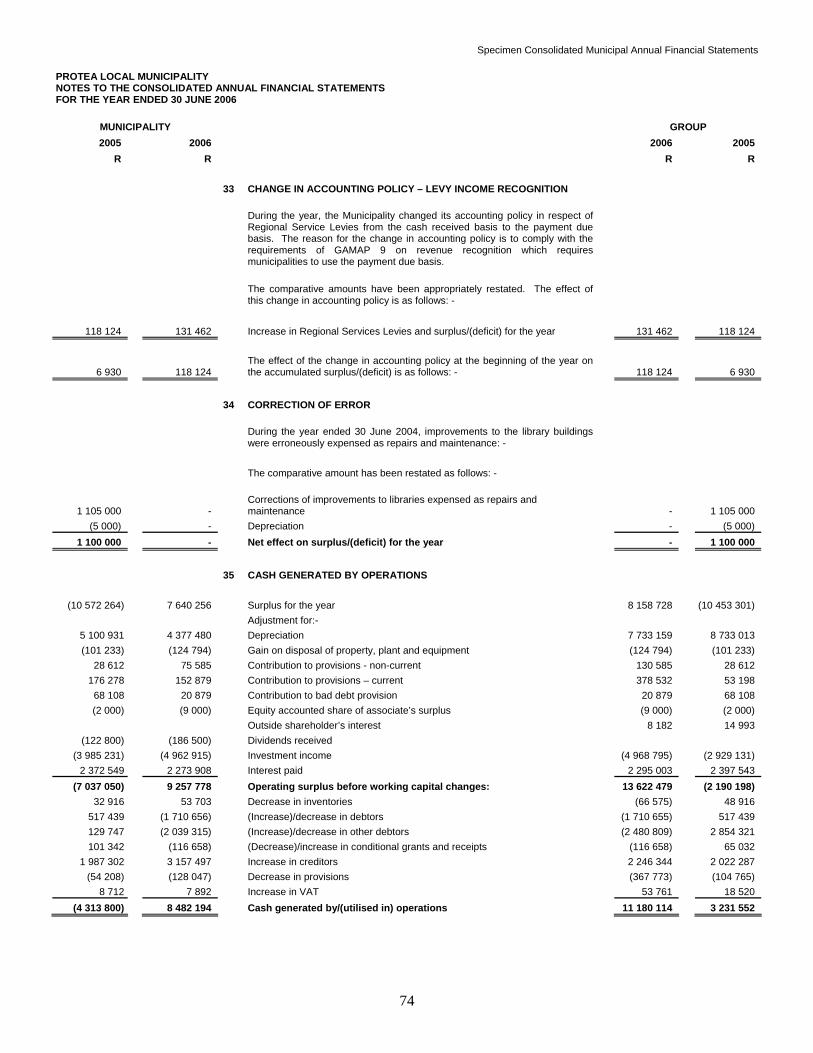
Specimen Consolidated Municipal Annual Financial Statements
74
PROTEA LOCAL MUNICIPALITY NOTES TO THE CONSOLIDATED ANNUAL FINANCIAL STATEMENTS FOR THE YEAR ENDED 30 JUNE 2006
MUNICIPALITY GROUP 2005 2006 2006 2005
R R R R 33 CHANGE IN ACCOUNTING POLICY – LEVY INCOME RECOGNITION
During the year, the Municipality changed its accounting policy in respect of Regional Service Levies from the cash received basis to the payment due basis. The reason for the change in accounting policy is to comply with the requirements of GAMAP 9 on revenue recognition which requires municipalities to use the payment due basis.
The comparative amounts have been appropriately restated. The effect of this change in accounting policy is as follows: -
118 124 131 462 Increase in Regional Services Levies and surplus/(deficit) for the year 131 462 118 124
6 930
118 124 The effect of the change in accounting policy at the beginning of the year on the accumulated surplus/(deficit) is as follows: - 118 124 6 930
34 CORRECTION OF ERROR
During the year ended 30 June 2004, improvements to the library buildings were erroneously expensed as repairs and maintenance: -
The comparative amount has been restated as follows: -
1 105 000
- Corrections of improvements to libraries expensed as repairs and maintenance - 1 105 000
(5 000) - Depreciation - (5 000) 1 100 000 - Net effect on surplus/(deficit) for the year - 1 100 000
35 CASH GENERATED BY OPERATIONS
(10 572 264) 7 640 256 Surplus for the year 8 158 728 (10 453 301) Adjustment for:-
5 100 931 4 377 480 Depreciation 7 733 159 8 733 013 (101 233) (124 794) Gain on disposal of property, plant and equipment (124 794) (101 233)
28 612 75 585 Contribution to provisions - non-current 130 585 28 612 176 278 152 879 Contribution to provisions – current 378 532 53 198 68 108 20 879 Contribution to bad debt provision 20 879 68 108 (2 000) (9 000) Equity accounted share of associate’s surplus (9 000) (2 000)
Outside shareholder’s interest 8 182 14 993 (122 800) (186 500) Dividends received
(3 985 231) (4 962 915) Investment income (4 968 795) (2 929 131) 2 372 549 2 273 908 Interest paid 2 295 003 2 397 543
(7 037 050) 9 257 778 Operating surplus before working capital changes: 13 622 479 (2 190 198) 32 916 53 703 Decrease in inventories (66 575) 48 916
517 439 (1 710 656) (Increase)/decrease in debtors (1 710 655) 517 439 129 747 (2 039 315) (Increase)/decrease in other debtors (2 480 809) 2 854 321 101 342 (116 658) (Decrease)/increase in conditional grants and receipts (116 658) 65 032
1 987 302 3 157 497 Increase in creditors 2 246 344 2 022 287 (54 208) (128 047) Decrease in provisions (367 773) (104 765)
8 712 7 892 Increase in VAT 53 761 18 520 (4 313 800) 8 482 194 Cash generated by/(utilised in) operations 11 180 114 3 231 552
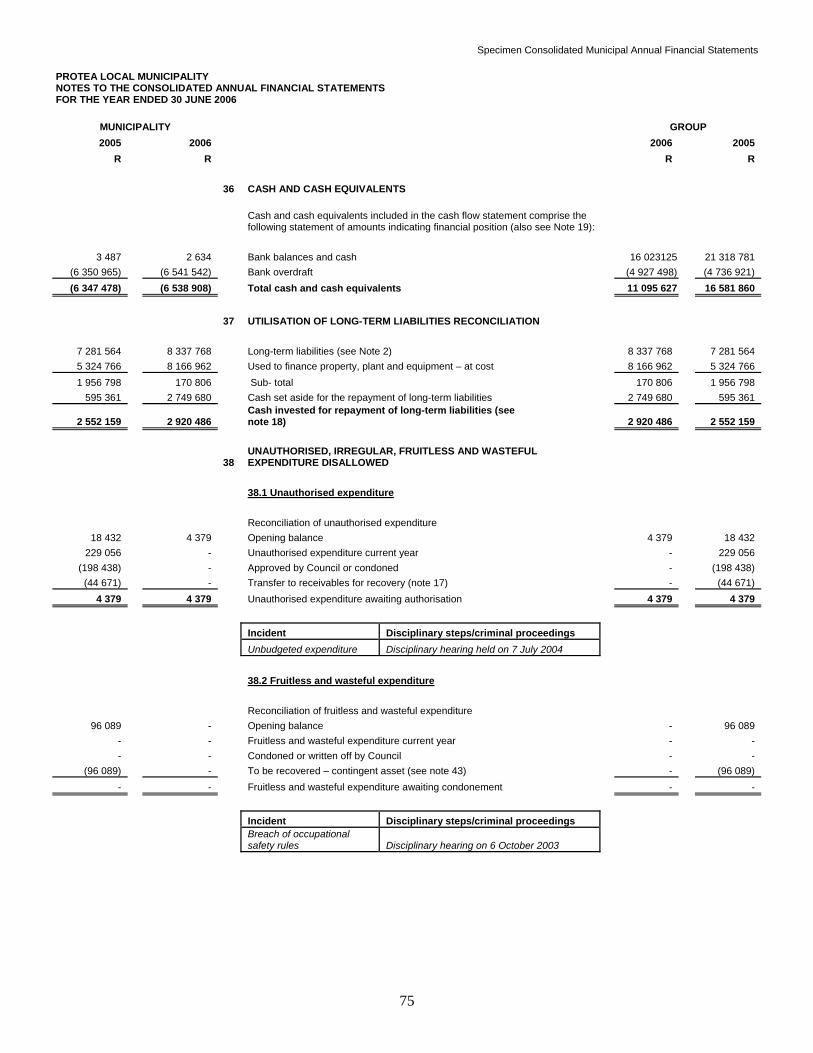
Specimen Consolidated Municipal Annual Financial Statements
75
PROTEA LOCAL MUNICIPALITY NOTES TO THE CONSOLIDATED ANNUAL FINANCIAL STATEMENTS FOR THE YEAR ENDED 30 JUNE 2006
MUNICIPALITY GROUP 2005 2006 2006 2005
R R R R 36 CASH AND CASH EQUIVALENTS
Cash and cash equivalents included in the cash flow statement comprise the following statement of amounts indicating financial position (also see Note 19):
3 487 2 634 Bank balances and cash 16 023125 21 318 781
(6 350 965) (6 541 542) Bank overdraft (4 927 498) (4 736 921) (6 347 478) (6 538 908) Total cash and cash equivalents 11 095 627 16 581 860
37 UTILISATION OF LONG-TERM LIABILITIES RECONCILIATION
7 281 564 8 337 768 Long-term liabilities (see Note 2) 8 337 768 7 281 564 5 324 766 8 166 962 Used to finance property, plant and equipment – at cost 8 166 962 5 324 766 1 956 798 170 806 Sub- total 170 806 1 956 798
595 361 2 749 680 Cash set aside for the repayment of long-term liabilities 2 749 680 595 361
2 552 159
2 920 486 Cash invested for repayment of long-term liabilities (see note 18) 2 920 486 2 552 159
38 UNAUTHORISED, IRREGULAR, FRUITLESS AND WASTEFUL EXPENDITURE DISALLOWED
38.1 Unauthorised expenditure Reconciliation of unauthorised expenditure
18 432 4 379 Opening balance 4 379 18 432 229 056 - Unauthorised expenditure current year - 229 056
(198 438) - Approved by Council or condoned - (198 438) (44 671) - Transfer to receivables for recovery (note 17) - (44 671)
4 379 4 379 Unauthorised expenditure awaiting authorisation 4 379 4 379
Incident Disciplinary steps/criminal proceedings Unbudgeted expenditure Disciplinary hearing held on 7 July 2004 38.2 Fruitless and wasteful expenditure Reconciliation of fruitless and wasteful expenditure
96 089 - Opening balance - 96 089 - - Fruitless and wasteful expenditure current year - - - - Condoned or written off by Council - -
(96 089) - To be recovered – contingent asset (see note 43) - (96 089) - - Fruitless and wasteful expenditure awaiting condonement - -
Incident Disciplinary steps/criminal proceedings
Breach of occupational safety rules Disciplinary hearing on 6 October 2003
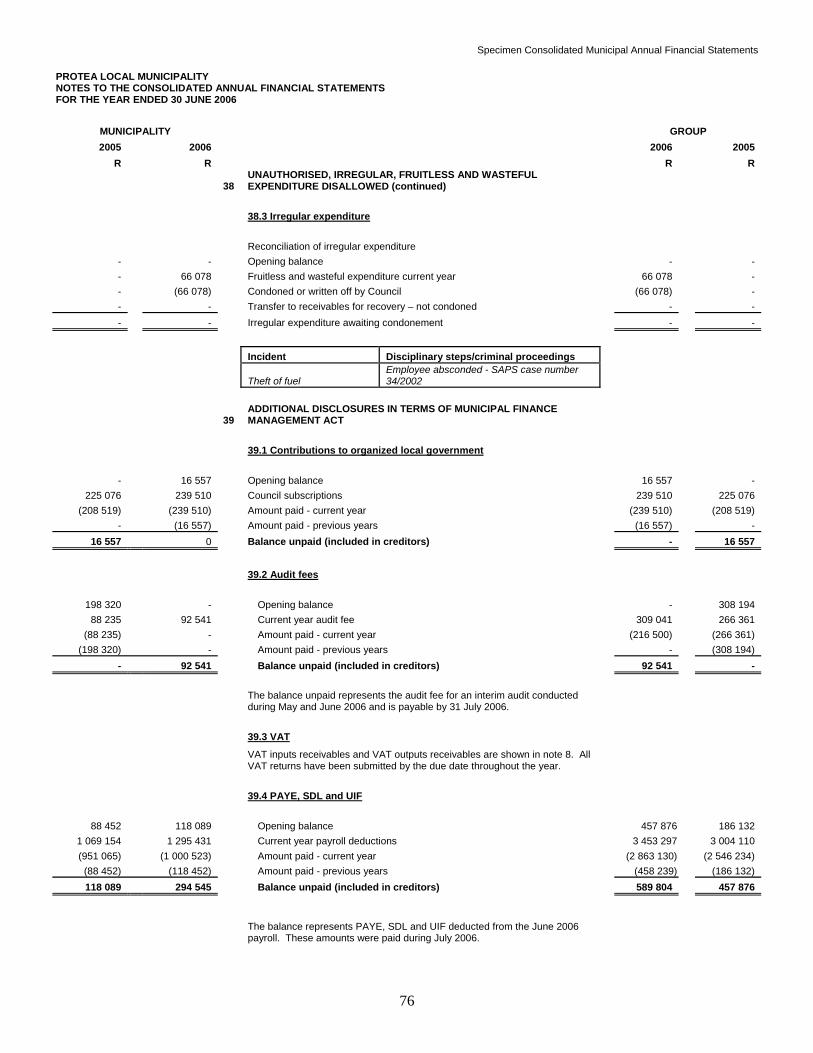
Specimen Consolidated Municipal Annual Financial Statements
76
PROTEA LOCAL MUNICIPALITY NOTES TO THE CONSOLIDATED ANNUAL FINANCIAL STATEMENTS FOR THE YEAR ENDED 30 JUNE 2006
MUNICIPALITY GROUP 2005 2006 2006 2005
R R R R
38 UNAUTHORISED, IRREGULAR, FRUITLESS AND WASTEFUL EXPENDITURE DISALLOWED (continued)
38.3 Irregular expenditure Reconciliation of irregular expenditure
- - Opening balance - - - 66 078 Fruitless and wasteful expenditure current year 66 078 - - (66 078) Condoned or written off by Council (66 078) - - - Transfer to receivables for recovery – not condoned - - - - Irregular expenditure awaiting condonement - -
Incident Disciplinary steps/criminal proceedings
Theft of fuel Employee absconded - SAPS case number 34/2002
39 ADDITIONAL DISCLOSURES IN TERMS OF MUNICIPAL FINANCE MANAGEMENT ACT
39.1 Contributions to organized local government
- 16 557 Opening balance 16 557 - 225 076 239 510 Council subscriptions 239 510 225 076
(208 519) (239 510) Amount paid - current year (239 510) (208 519) - (16 557) Amount paid - previous years (16 557) -
16 557 0 Balance unpaid (included in creditors) - 16 557
39.2 Audit fees
198 320 - Opening balance - 308 194 88 235 92 541 Current year audit fee 309 041 266 361
(88 235) - Amount paid - current year (216 500) (266 361) (198 320) - Amount paid - previous years - (308 194)
- 92 541 Balance unpaid (included in creditors) 92 541 -
The balance unpaid represents the audit fee for an interim audit conducted during May and June 2006 and is payable by 31 July 2006.
39.3 VAT
VAT inputs receivables and VAT outputs receivables are shown in note 8. All VAT returns have been submitted by the due date throughout the year.
39.4 PAYE, SDL and UIF
88 452 118 089 Opening balance 457 876 186 132 1 069 154 1 295 431 Current year payroll deductions 3 453 297 3 004 110 (951 065) (1 000 523) Amount paid - current year (2 863 130) (2 546 234)
(88 452) (118 452) Amount paid - previous years (458 239) (186 132) 118 089 294 545 Balance unpaid (included in creditors) 589 804 457 876
The balance represents PAYE, SDL and UIF deducted from the June 2006 payroll. These amounts were paid during July 2006.
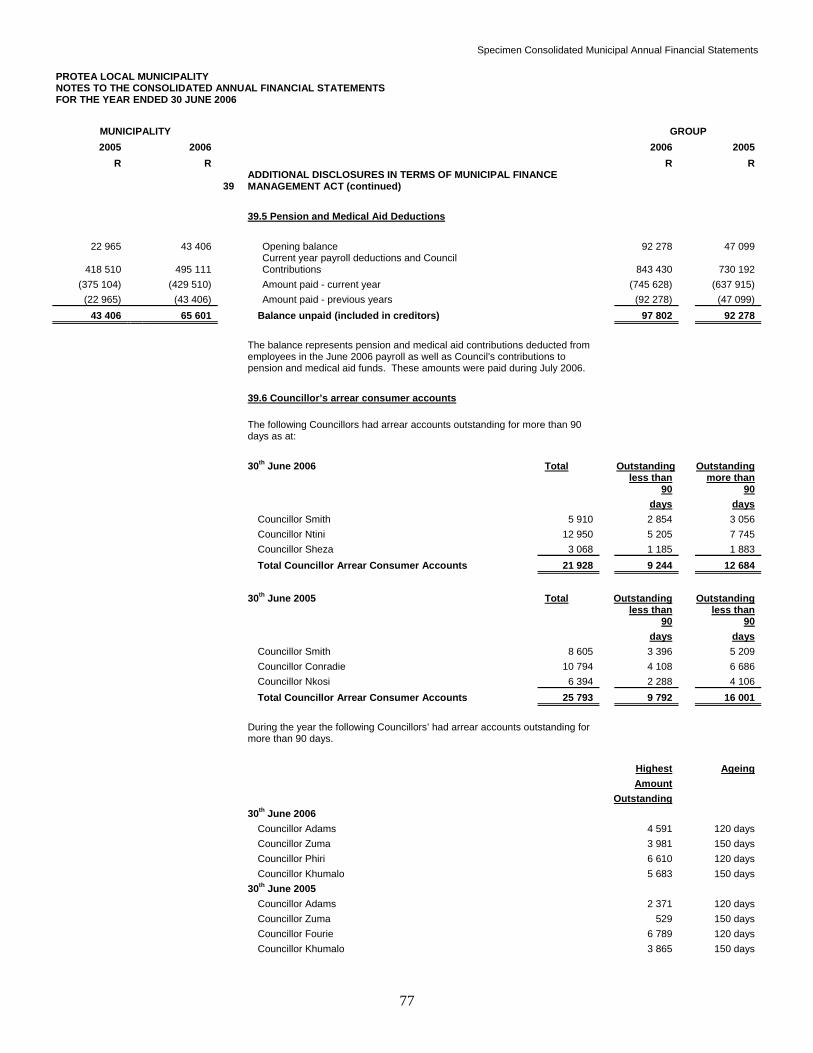
Specimen Consolidated Municipal Annual Financial Statements
77
PROTEA LOCAL MUNICIPALITY NOTES TO THE CONSOLIDATED ANNUAL FINANCIAL STATEMENTS FOR THE YEAR ENDED 30 JUNE 2006
MUNICIPALITY GROUP 2005 2006 2006 2005
R R R R
39 ADDITIONAL DISCLOSURES IN TERMS OF MUNICIPAL FINANCE MANAGEMENT ACT (continued)
39.5 Pension and Medical Aid Deductions
22 965 43 406 Opening balance 92 278 47 099
418 510
495 111 Current year payroll deductions and Council Contributions 843 430 730 192
(375 104) (429 510) Amount paid - current year (745 628) (637 915) (22 965) (43 406) Amount paid - previous years (92 278) (47 099)
43 406 65 601 Balance unpaid (included in creditors) 97 802 92 278
The balance represents pension and medical aid contributions deducted from employees in the June 2006 payroll as well as Council's contributions to pension and medical aid funds. These amounts were paid during July 2006.
39.6 Councillor’s arrear consumer accounts
The following Councillors had arrear accounts outstanding for more than 90 days as at:
30th June 2006 Total Outstanding Outstanding
less than
90 more than
90 days days Councillor Smith 5 910 2 854 3 056 Councillor Ntini 12 950 5 205 7 745 Councillor Sheza 3 068 1 185 1 883 Total Councillor Arrear Consumer Accounts 21 928 9 244 12 684
30th June 2005 Total Outstanding Outstanding
less than
90 less than
90 days days Councillor Smith 8 605 3 396 5 209 Councillor Conradie 10 794 4 108 6 686 Councillor Nkosi 6 394 2 288 4 106 Total Councillor Arrear Consumer Accounts 25 793 9 792 16 001
During the year the following Councillors’ had arrear accounts outstanding for more than 90 days.
Highest Ageing Amount Outstanding 30th June 2006 Councillor Adams 4 591 120 days Councillor Zuma 3 981 150 days Councillor Phiri 6 610 120 days Councillor Khumalo 5 683 150 days 30th June 2005 Councillor Adams 2 371 120 days Councillor Zuma 529 150 days Councillor Fourie 6 789 120 days Councillor Khumalo 3 865 150 days
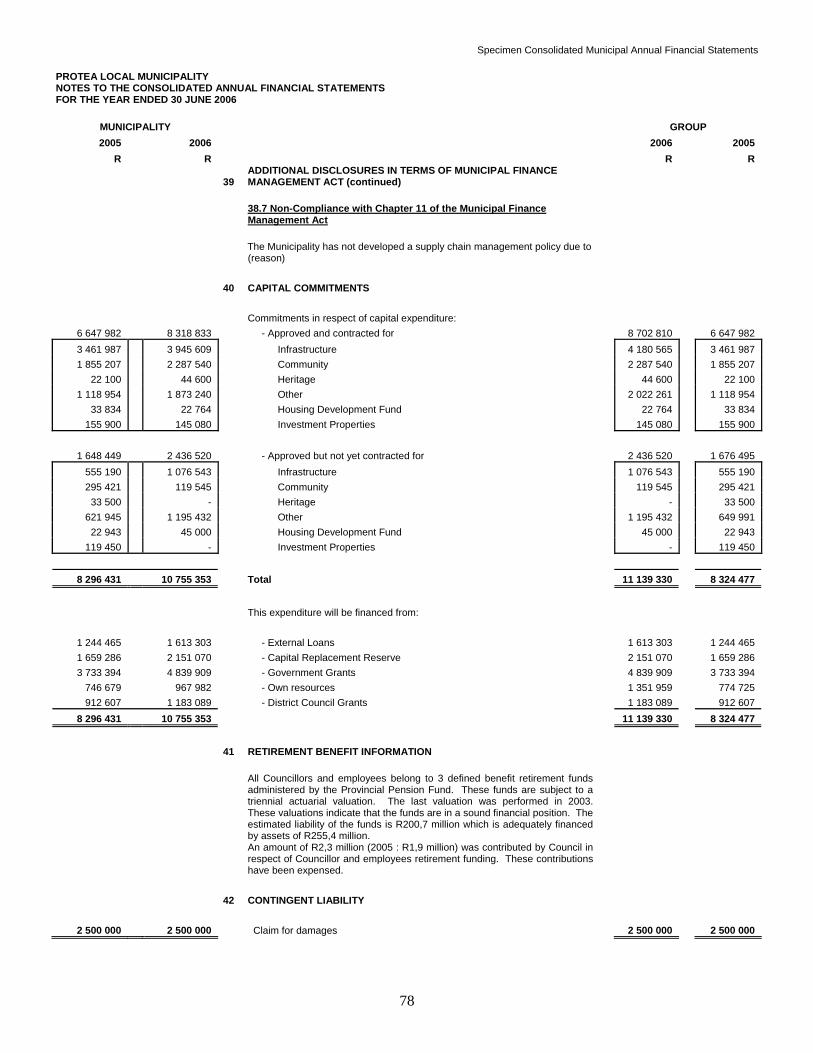
Specimen Consolidated Municipal Annual Financial Statements
78
PROTEA LOCAL MUNICIPALITY NOTES TO THE CONSOLIDATED ANNUAL FINANCIAL STATEMENTS FOR THE YEAR ENDED 30 JUNE 2006
MUNICIPALITY GROUP 2005 2006 2006 2005
R R R R
39 ADDITIONAL DISCLOSURES IN TERMS OF MUNICIPAL FINANCE MANAGEMENT ACT (continued)
38.7 Non-Compliance with Chapter 11 of the Municipal Finance Management Act
The Municipality has not developed a supply chain management policy due to (reason)
40 CAPITAL COMMITMENTS Commitments in respect of capital expenditure:
6 647 982 8 318 833 - Approved and contracted for 8 702 810 6 647 982 3 461 987 3 945 609 Infrastructure 4 180 565 3 461 987 1 855 207 2 287 540 Community 2 287 540 1 855 207
22 100 44 600 Heritage 44 600 22 100 1 118 954 1 873 240 Other 2 022 261 1 118 954
33 834 22 764 Housing Development Fund 22 764 33 834 155 900 145 080 Investment Properties 145 080 155 900
1 648 449 2 436 520 - Approved but not yet contracted for 2 436 520 1 676 495
555 190 1 076 543 Infrastructure 1 076 543 555 190 295 421 119 545 Community 119 545 295 421
33 500 - Heritage - 33 500 621 945 1 195 432 Other 1 195 432 649 991
22 943 45 000 Housing Development Fund 45 000 22 943 119 450 - Investment Properties - 119 450
8 296 431 10 755 353 Total 11 139 330 8 324 477
This expenditure will be financed from:
1 244 465 1 613 303 - External Loans 1 613 303 1 244 465 1 659 286 2 151 070 - Capital Replacement Reserve 2 151 070 1 659 286 3 733 394 4 839 909 - Government Grants 4 839 909 3 733 394
746 679 967 982 - Own resources 1 351 959 774 725 912 607 1 183 089 - District Council Grants 1 183 089 912 607
8 296 431 10 755 353 11 139 330 8 324 477
41 RETIREMENT BENEFIT INFORMATION
All Councillors and employees belong to 3 defined benefit retirement funds administered by the Provincial Pension Fund. These funds are subject to a triennial actuarial valuation. The last valuation was performed in 2003. These valuations indicate that the funds are in a sound financial position. The estimated liability of the funds is R200,7 million which is adequately financed by assets of R255,4 million.
An amount of R2,3 million (2005 : R1,9 million) was contributed by Council in respect of Councillor and employees retirement funding. These contributions have been expensed.
42 CONTINGENT LIABILITY
2 500 000 2 500 000 Claim for damages 2 500 000 2 500 000

Specimen Consolidated Municipal Annual Financial Statements
79
PROTEA LOCAL MUNICIPALITY NOTES TO THE CONSOLIDATED ANNUAL FINANCIAL STATEMENTS FOR THE YEAR ENDED 30 JUNE 2006
MUNICIPALITY GROUP 2005 2006 2006 2005
R R R R 42 CONTINGENT LIABILITY (continued)
A ratepayer due to damages arising from flooding is suing the Municipality. Council is contesting the claim based on legal advice. A court date has not yet been set. The contingent liability includes legal costs of R500 000. Should Council be unsuccessful in defending the claim, there is a possibility that the claim will be settled from
43 CONTINGENT ASSET
Subsequent to the disciplinary hearing in respect of the fruitless and wasteful expenditure referred to in Note 38.2, civil proceedings have commenced against the employee concerned to recover an amount of R96 089. According to Council’s legal advisors, it is probable that the proceedings will result in the recovery of the full amount but this recovery is not virtually certain.
44 IN-KIND DONATIONS AND ASSISTANCE
The Municipality received the following in-kind donations and assistance
Description 45 PRIVATE PUBLIC PARTNERSHIPS (Record the following information to the extent possible) Disclose a description of the arrangement
Set out significant terms of the arrangement that may
affect the amount, timing and certainty of future cash flows Provide information on the nature and extent of: 1. rights to use specified assets
2. obligations to provide or rights to expect provisions of services
3. obligations to acquire or build items of property, plant and equipment
4. obligations to deliver or rights to receive specified assets at the end of the concession period
5. renewal and termination options 6. other rights and obligations (e.g. major overhauls)
Describe any Changes in the arrangement occurring
during the period 46 EVENTS AFTER THE REPORTING DATE
The Municipality has agreed in principle to transfer its electricity function to the new Regional Electricity Distributor (RED) – Region AB. The date of transfer is proposed for 1 July 2007. The financial effect of this transfer is not yet known as the Municipality is uncertain as to what its share of the revenues of the RED will be or what the terms and conditions of the transfer will be. There are ongoing discussions with the management of RED – Region AB and EDI Holdings, which is the responsible authority for the implementation of REDS nationally.
47 COMPARISON WITH THE BUDGET
The comparison of the Municipality’s and Group’s actual financial performance with that budgeted is set out in Annexures E(1) to E(2)

Specimen Consolidated Municipal Annual Financial Statements
80
EXPLANATORY NOTES: APPENDIX A
This Appendix is part of the annual financial statements and is subject to audit.
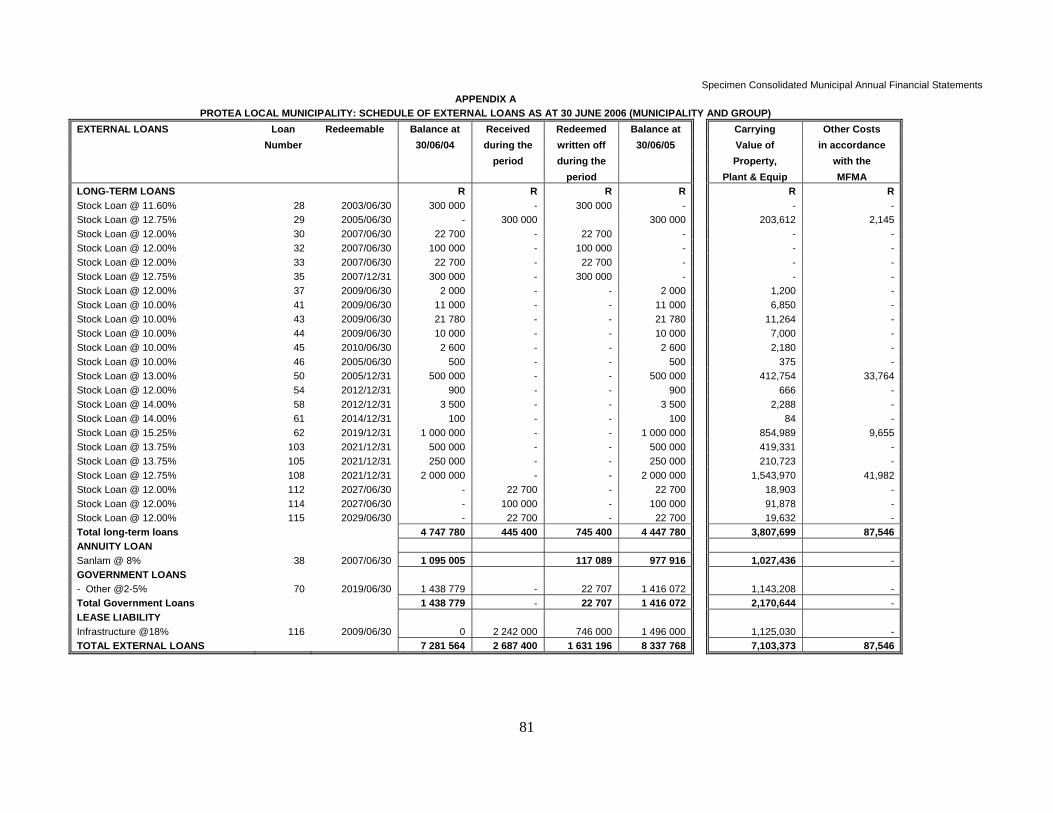
Specimen Consolidated Municipal Annual Financial Statements
81
APPENDIX A PROTEA LOCAL MUNICIPALITY: SCHEDULE OF EXTERNAL LOANS AS AT 30 JUNE 2006 (MUNICIPALITY AND GROUP)
EXTERNAL LOANS Loan Redeemable Balance at Received Redeemed Balance at Carrying Other Costs Number 30/06/04 during the written off 30/06/05 Value of in accordance period during the Property, with the period Plant & Equip MFMA LONG-TERM LOANS R R R R R RStock Loan @ 11.60% 28 2003/06/30 300 000 - 300 000 - - - Stock Loan @ 12.75% 29 2005/06/30 - 300 000 300 000 203,612 2,145Stock Loan @ 12.00% 30 2007/06/30 22 700 - 22 700 - - - Stock Loan @ 12.00% 32 2007/06/30 100 000 - 100 000 - - - Stock Loan @ 12.00% 33 2007/06/30 22 700 - 22 700 - - - Stock Loan @ 12.75% 35 2007/12/31 300 000 - 300 000 - - - Stock Loan @ 12.00% 37 2009/06/30 2 000 - - 2 000 1,200 - Stock Loan @ 10.00% 41 2009/06/30 11 000 - - 11 000 6,850 - Stock Loan @ 10.00% 43 2009/06/30 21 780 - - 21 780 11,264 - Stock Loan @ 10.00% 44 2009/06/30 10 000 - - 10 000 7,000 - Stock Loan @ 10.00% 45 2010/06/30 2 600 - - 2 600 2,180 - Stock Loan @ 10.00% 46 2005/06/30 500 - - 500 375 - Stock Loan @ 13.00% 50 2005/12/31 500 000 - - 500 000 412,754 33,764Stock Loan @ 12.00% 54 2012/12/31 900 - - 900 666 - Stock Loan @ 14.00% 58 2012/12/31 3 500 - - 3 500 2,288 - Stock Loan @ 14.00% 61 2014/12/31 100 - - 100 84 - Stock Loan @ 15.25% 62 2019/12/31 1 000 000 - - 1 000 000 854,989 9,655Stock Loan @ 13.75% 103 2021/12/31 500 000 - - 500 000 419,331 - Stock Loan @ 13.75% 105 2021/12/31 250 000 - - 250 000 210,723 - Stock Loan @ 12.75% 108 2021/12/31 2 000 000 - - 2 000 000 1,543,970 41,982Stock Loan @ 12.00% 112 2027/06/30 - 22 700 - 22 700 18,903 - Stock Loan @ 12.00% 114 2027/06/30 - 100 000 - 100 000 91,878 - Stock Loan @ 12.00% 115 2029/06/30 - 22 700 - 22 700 19,632 - Total long-term loans 4 747 780 445 400 745 400 4 447 780 3,807,699 87,546ANNUITY LOAN Sanlam @ 8% 38 2007/06/30 1 095 005 117 089 977 916 1,027,436 - GOVERNMENT LOANS - Other @2-5% 70 2019/06/30 1 438 779 - 22 707 1 416 072 1,143,208 - Total Government Loans 1 438 779 - 22 707 1 416 072 2,170,644 - LEASE LIABILITY Infrastructure @18% 116 2009/06/30 0 2 242 000 746 000 1 496 000 1,125,030 - TOTAL EXTERNAL LOANS 7 281 564 2 687 400 1 631 196 8 337 768 7,103,373 87,546

Specimen Consolidated Municipal Annual Financial Statements
82
EXPLANATORY NOTES: APPENDIX B
This Appendix sets out more information on Property, Plant and Equipment (note 10). This Appendix is part of the annual financial statements and is subject to audit.
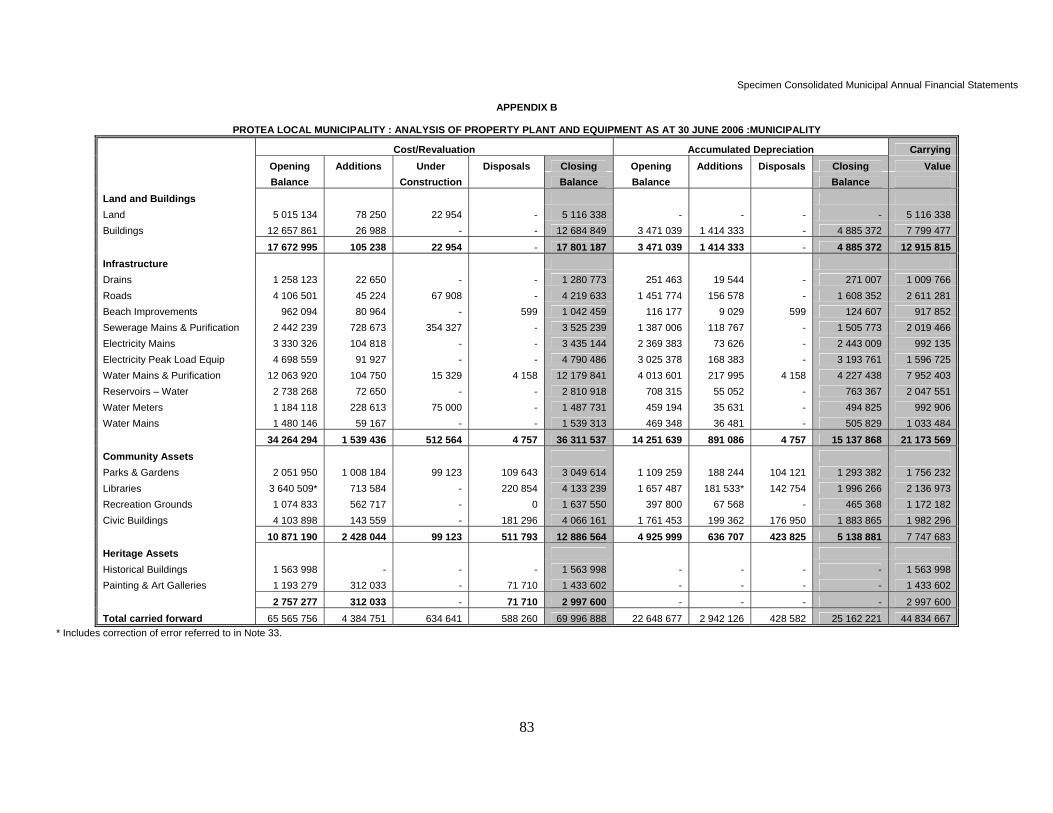
Specimen Consolidated Municipal Annual Financial Statements
83
APPENDIX B
PROTEA LOCAL MUNICIPALITY : ANALYSIS OF PROPERTY PLANT AND EQUIPMENT AS AT 30 JUNE 2006 :MUNICIPALITY
Cost/Revaluation Accumulated Depreciation Carrying Opening Additions Under Disposals Closing Opening Additions Disposals Closing Value Balance Construction Balance Balance Balance Land and Buildings Land 5 015 134 78 250 22 954 - 5 116 338 - - - - 5 116 338Buildings 12 657 861 26 988 - - 12 684 849 3 471 039 1 414 333 - 4 885 372 7 799 477 17 672 995 105 238 22 954 - 17 801 187 3 471 039 1 414 333 - 4 885 372 12 915 815Infrastructure Drains 1 258 123 22 650 - - 1 280 773 251 463 19 544 - 271 007 1 009 766 Roads 4 106 501 45 224 67 908 - 4 219 633 1 451 774 156 578 - 1 608 352 2 611 281 Beach Improvements 962 094 80 964 - 599 1 042 459 116 177 9 029 599 124 607 917 852 Sewerage Mains & Purification 2 442 239 728 673 354 327 - 3 525 239 1 387 006 118 767 - 1 505 773 2 019 466 Electricity Mains 3 330 326 104 818 - - 3 435 144 2 369 383 73 626 - 2 443 009 992 135 Electricity Peak Load Equip 4 698 559 91 927 - - 4 790 486 3 025 378 168 383 - 3 193 761 1 596 725 Water Mains & Purification 12 063 920 104 750 15 329 4 158 12 179 841 4 013 601 217 995 4 158 4 227 438 7 952 403Reservoirs – Water 2 738 268 72 650 - - 2 810 918 708 315 55 052 - 763 367 2 047 551 Water Meters 1 184 118 228 613 75 000 - 1 487 731 459 194 35 631 - 494 825 992 906 Water Mains 1 480 146 59 167 - - 1 539 313 469 348 36 481 - 505 829 1 033 484 34 264 294 1 539 436 512 564 4 757 36 311 537 14 251 639 891 086 4 757 15 137 868 21 173 569Community Assets Parks & Gardens 2 051 950 1 008 184 99 123 109 643 3 049 614 1 109 259 188 244 104 121 1 293 382 1 756 232 Libraries 3 640 509* 713 584 - 220 854 4 133 239 1 657 487 181 533* 142 754 1 996 266 2 136 973 Recreation Grounds 1 074 833 562 717 - 0 1 637 550 397 800 67 568 - 465 368 1 172 182 Civic Buildings 4 103 898 143 559 - 181 296 4 066 161 1 761 453 199 362 176 950 1 883 865 1 982 296 10 871 190 2 428 044 99 123 511 793 12 886 564 4 925 999 636 707 423 825 5 138 881 7 747 683 Heritage Assets Historical Buildings 1 563 998 - - - 1 563 998 - - - - 1 563 998 Painting & Art Galleries 1 193 279 312 033 - 71 710 1 433 602 - - - - 1 433 602
2 757 277 312 033 - 71 710 2 997 600 - - - - 2 997 600 Total carried forward 65 565 756 4 384 751 634 641 588 260 69 996 888 22 648 677 2 942 126 428 582 25 162 221 44 834 667
* Includes correction of error referred to in Note 33.
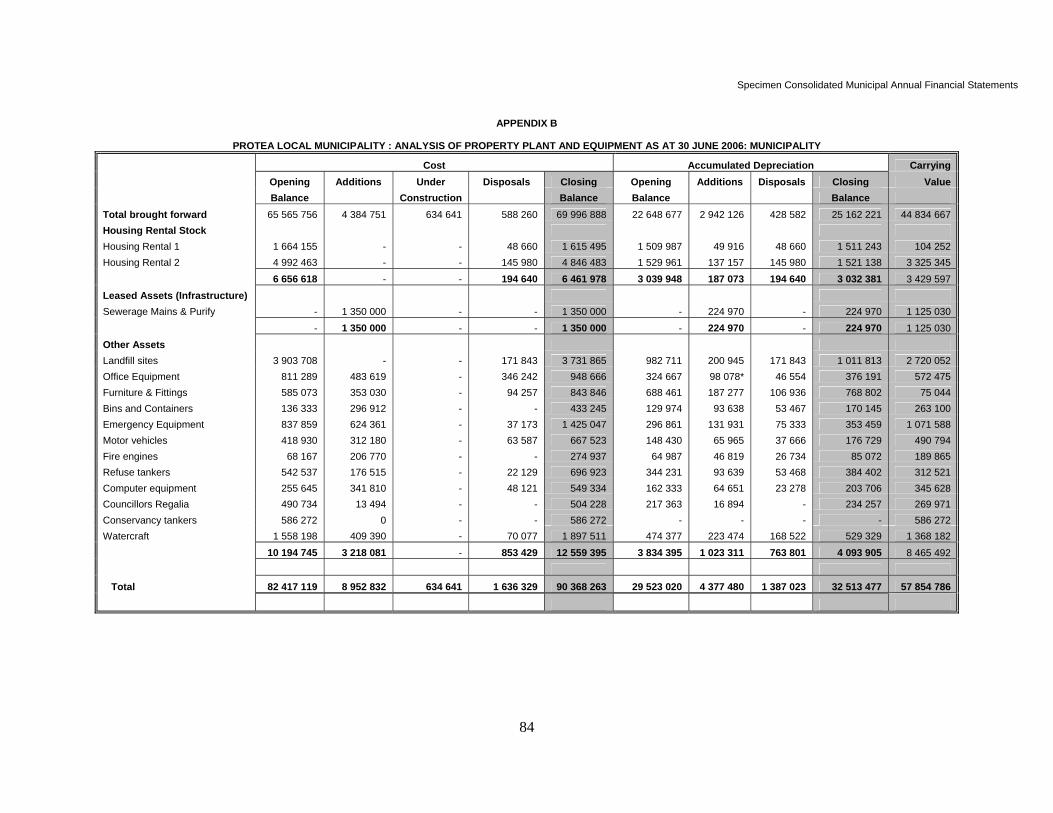
Specimen Consolidated Municipal Annual Financial Statements
84
APPENDIX B
PROTEA LOCAL MUNICIPALITY : ANALYSIS OF PROPERTY PLANT AND EQUIPMENT AS AT 30 JUNE 2006: MUNICIPALITY
Cost Accumulated Depreciation Carrying Opening Additions Under Disposals Closing Opening Additions Disposals Closing Value Balance Construction Balance Balance Balance Total brought forward 65 565 756 4 384 751 634 641 588 260 69 996 888 22 648 677 2 942 126 428 582 25 162 221 44 834 667Housing Rental Stock Housing Rental 1 1 664 155 - - 48 660 1 615 495 1 509 987 49 916 48 660 1 511 243 104 252 Housing Rental 2 4 992 463 - - 145 980 4 846 483 1 529 961 137 157 145 980 1 521 138 3 325 345 6 656 618 - - 194 640 6 461 978 3 039 948 187 073 194 640 3 032 381 3 429 597 Leased Assets (Infrastructure) Sewerage Mains & Purify - 1 350 000 - - 1 350 000 - 224 970 - 224 970 1 125 030 - 1 350 000 - - 1 350 000 - 224 970 - 224 970 1 125 030 Other Assets Landfill sites 3 903 708 - - 171 843 3 731 865 982 711 200 945 171 843 1 011 813 2 720 052 Office Equipment 811 289 483 619 - 346 242 948 666 324 667 98 078* 46 554 376 191 572 475 Furniture & Fittings 585 073 353 030 - 94 257 843 846 688 461 187 277 106 936 768 802 75 044 Bins and Containers 136 333 296 912 - - 433 245 129 974 93 638 53 467 170 145 263 100 Emergency Equipment 837 859 624 361 - 37 173 1 425 047 296 861 131 931 75 333 353 459 1 071 588 Motor vehicles 418 930 312 180 - 63 587 667 523 148 430 65 965 37 666 176 729 490 794 Fire engines 68 167 206 770 - - 274 937 64 987 46 819 26 734 85 072 189 865 Refuse tankers 542 537 176 515 - 22 129 696 923 344 231 93 639 53 468 384 402 312 521 Computer equipment 255 645 341 810 - 48 121 549 334 162 333 64 651 23 278 203 706 345 628 Councillors Regalia 490 734 13 494 - - 504 228 217 363 16 894 - 234 257 269 971 Conservancy tankers 586 272 0 - - 586 272 - - - - 586 272 Watercraft 1 558 198 409 390 - 70 077 1 897 511 474 377 223 474 168 522 529 329 1 368 182
10 194 745 3 218 081 - 853 429 12 559 395 3 834 395 1 023 311 763 801 4 093 905 8 465 492
Total 82 417 119 8 952 832 634 641 1 636 329 90 368 263 29 523 020 4 377 480 1 387 023 32 513 477 57 854 786
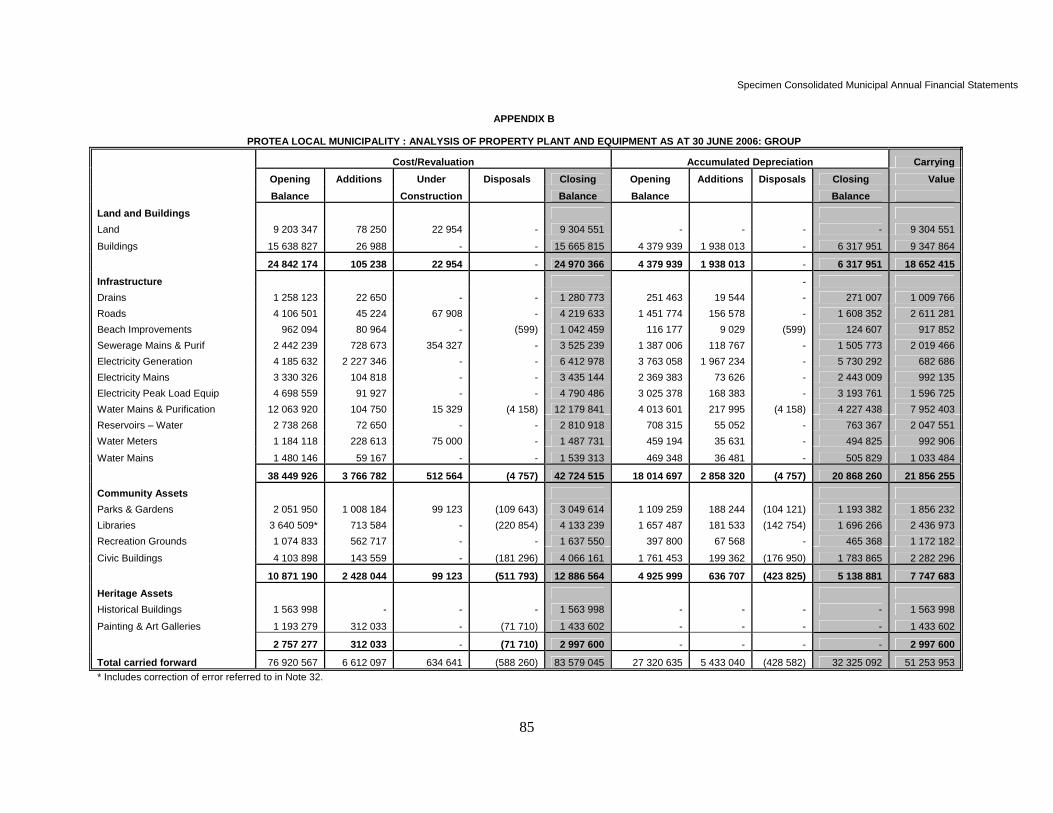
Specimen Consolidated Municipal Annual Financial Statements
85
APPENDIX B
PROTEA LOCAL MUNICIPALITY : ANALYSIS OF PROPERTY PLANT AND EQUIPMENT AS AT 30 JUNE 2006: GROUP
Cost/Revaluation Accumulated Depreciation Carrying Opening Additions Under Disposals Closing Opening Additions Disposals Closing Value Balance Construction Balance Balance Balance
Land and Buildings Land 9 203 347 78 250 22 954 - 9 304 551 - - - - 9 304 551
Buildings 15 638 827 26 988 - - 15 665 815 4 379 939 1 938 013 - 6 317 951 9 347 864
24 842 174 105 238 22 954 - 24 970 366 4 379 939 1 938 013 - 6 317 951 18 652 415
Infrastructure - Drains 1 258 123 22 650 - - 1 280 773 251 463 19 544 - 271 007 1 009 766Roads 4 106 501 45 224 67 908 - 4 219 633 1 451 774 156 578 - 1 608 352 2 611 281Beach Improvements 962 094 80 964 - (599) 1 042 459 116 177 9 029 (599) 124 607 917 852Sewerage Mains & Purif 2 442 239 728 673 354 327 - 3 525 239 1 387 006 118 767 - 1 505 773 2 019 466Electricity Generation 4 185 632 2 227 346 - - 6 412 978 3 763 058 1 967 234 - 5 730 292 682 686Electricity Mains 3 330 326 104 818 - - 3 435 144 2 369 383 73 626 - 2 443 009 992 135Electricity Peak Load Equip 4 698 559 91 927 - - 4 790 486 3 025 378 168 383 - 3 193 761 1 596 725Water Mains & Purification 12 063 920 104 750 15 329 (4 158) 12 179 841 4 013 601 217 995 (4 158) 4 227 438 7 952 403Reservoirs – Water 2 738 268 72 650 - - 2 810 918 708 315 55 052 - 763 367 2 047 551Water Meters 1 184 118 228 613 75 000 - 1 487 731 459 194 35 631 - 494 825 992 906
Water Mains 1 480 146 59 167 - - 1 539 313 469 348 36 481 - 505 829 1 033 484
38 449 926 3 766 782 512 564 (4 757) 42 724 515 18 014 697 2 858 320 (4 757) 20 868 260 21 856 255
Community Assets Parks & Gardens 2 051 950 1 008 184 99 123 (109 643) 3 049 614 1 109 259 188 244 (104 121) 1 193 382 1 856 232Libraries 3 640 509* 713 584 - (220 854) 4 133 239 1 657 487 181 533 (142 754) 1 696 266 2 436 973Recreation Grounds 1 074 833 562 717 - - 1 637 550 397 800 67 568 - 465 368 1 172 182
Civic Buildings 4 103 898 143 559 - (181 296) 4 066 161 1 761 453 199 362 (176 950) 1 783 865 2 282 296
10 871 190 2 428 044 99 123 (511 793) 12 886 564 4 925 999 636 707 (423 825) 5 138 881 7 747 683Heritage Assets Historical Buildings 1 563 998 - - - 1 563 998 - - - - 1 563 998
Painting & Art Galleries 1 193 279 312 033 - (71 710) 1 433 602 - - - - 1 433 602
2 757 277 312 033 - (71 710) 2 997 600 - - - - 2 997 600
Total carried forward 76 920 567 6 612 097 634 641 (588 260) 83 579 045 27 320 635 5 433 040 (428 582) 32 325 092 51 253 953* Includes correction of error referred to in Note 32.
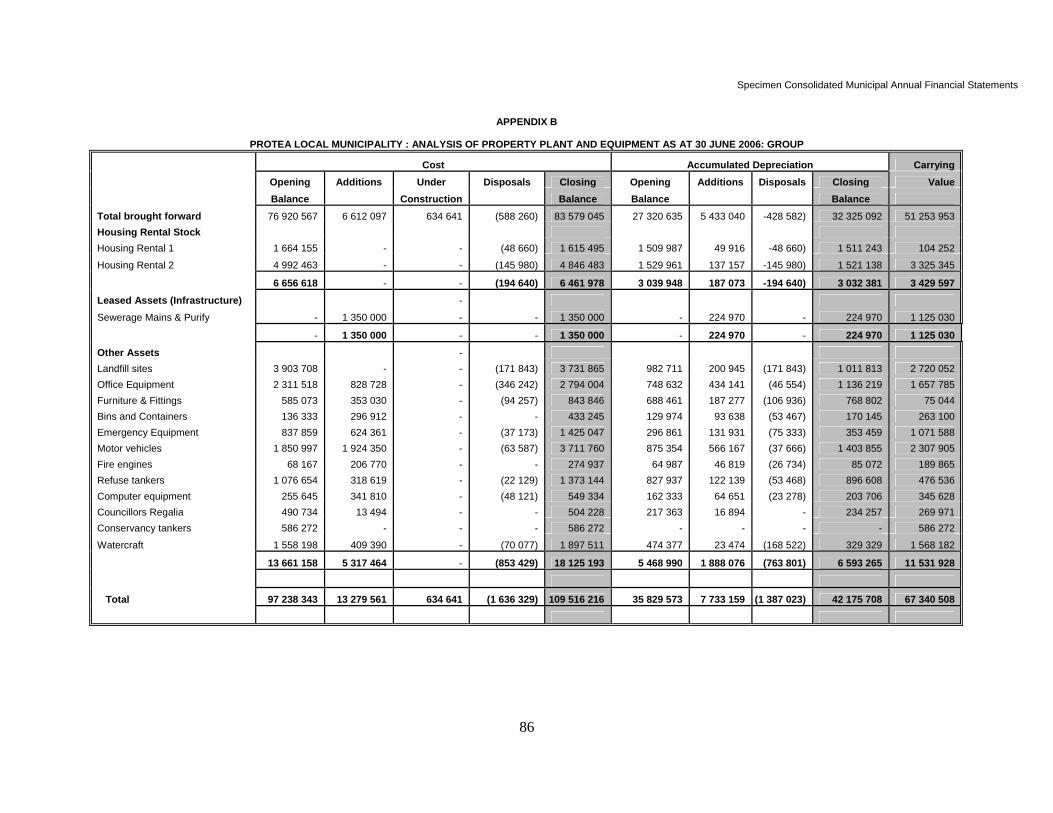
Specimen Consolidated Municipal Annual Financial Statements
86
APPENDIX B
PROTEA LOCAL MUNICIPALITY : ANALYSIS OF PROPERTY PLANT AND EQUIPMENT AS AT 30 JUNE 2006: GROUP
Cost Accumulated Depreciation Carrying Opening Additions Under Disposals Closing Opening Additions Disposals Closing Value Balance Construction Balance Balance Balance
Total brought forward 76 920 567 6 612 097 634 641 (588 260) 83 579 045 27 320 635 5 433 040 -428 582) 32 325 092 51 253 953Housing Rental Stock Housing Rental 1 1 664 155 - - (48 660) 1 615 495 1 509 987 49 916 -48 660) 1 511 243 104 252
Housing Rental 2 4 992 463 - - (145 980) 4 846 483 1 529 961 137 157 -145 980) 1 521 138 3 325 345
6 656 618 - - (194 640) 6 461 978 3 039 948 187 073 -194 640) 3 032 381 3 429 597Leased Assets (Infrastructure) -
Sewerage Mains & Purify - 1 350 000 - - 1 350 000 - 224 970 - 224 970 1 125 030
- 1 350 000 - - 1 350 000 - 224 970 - 224 970 1 125 030
Other Assets - Landfill sites 3 903 708 - - (171 843) 3 731 865 982 711 200 945 (171 843) 1 011 813 2 720 052Office Equipment 2 311 518 828 728 - (346 242) 2 794 004 748 632 434 141 (46 554) 1 136 219 1 657 785Furniture & Fittings 585 073 353 030 - (94 257) 843 846 688 461 187 277 (106 936) 768 802 75 044Bins and Containers 136 333 296 912 - - 433 245 129 974 93 638 (53 467) 170 145 263 100Emergency Equipment 837 859 624 361 - (37 173) 1 425 047 296 861 131 931 (75 333) 353 459 1 071 588Motor vehicles 1 850 997 1 924 350 - (63 587) 3 711 760 875 354 566 167 (37 666) 1 403 855 2 307 905Fire engines 68 167 206 770 - - 274 937 64 987 46 819 (26 734) 85 072 189 865Refuse tankers 1 076 654 318 619 - (22 129) 1 373 144 827 937 122 139 (53 468) 896 608 476 536Computer equipment 255 645 341 810 - (48 121) 549 334 162 333 64 651 (23 278) 203 706 345 628Councillors Regalia 490 734 13 494 - - 504 228 217 363 16 894 - 234 257 269 971Conservancy tankers 586 272 - - - 586 272 - - - - 586 272
Watercraft 1 558 198 409 390 - (70 077) 1 897 511 474 377 23 474 (168 522) 329 329 1 568 182
13 661 158 5 317 464 - (853 429) 18 125 193 5 468 990 1 888 076 (763 801) 6 593 265 11 531 928
Total 97 238 343 13 279 561 634 641 (1 636 329) 109 516 216 35 829 573 7 733 159 (1 387 023) 42 175 708 67 340 508

Specimen Consolidated Municipal Annual Financial Statements
87
EXPLANATORY NOTES: APPENDIX C This is a segmental analysis of Property, Plant and Equipment. The standard GFS classifications set out in the Budget Reforms have been used. However, the segments used can be the organisational structure of the Municipality. The totals of Appendix C must agree to those in Appendix B. This Appendix is part of the annual financial statements and is subject to audit.
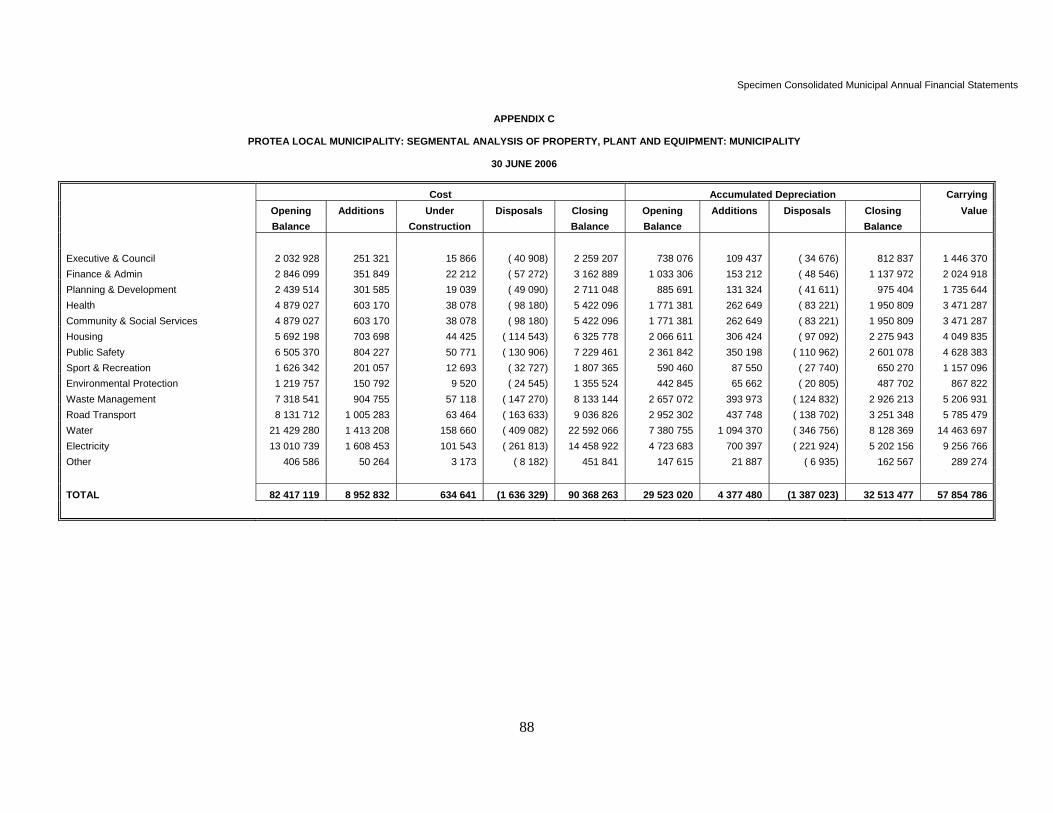
Specimen Consolidated Municipal Annual Financial Statements
88
APPENDIX C
PROTEA LOCAL MUNICIPALITY: SEGMENTAL ANALYSIS OF PROPERTY, PLANT AND EQUIPMENT: MUNICIPALITY
30 JUNE 2006
Cost Accumulated Depreciation Carrying Opening Additions Under Disposals Closing Opening Additions Disposals Closing Value Balance Construction Balance Balance Balance Executive & Council 2 032 928 251 321 15 866 ( 40 908) 2 259 207 738 076 109 437 ( 34 676) 812 837 1 446 370 Finance & Admin 2 846 099 351 849 22 212 ( 57 272) 3 162 889 1 033 306 153 212 ( 48 546) 1 137 972 2 024 918 Planning & Development 2 439 514 301 585 19 039 ( 49 090) 2 711 048 885 691 131 324 ( 41 611) 975 404 1 735 644 Health 4 879 027 603 170 38 078 ( 98 180) 5 422 096 1 771 381 262 649 ( 83 221) 1 950 809 3 471 287 Community & Social Services 4 879 027 603 170 38 078 ( 98 180) 5 422 096 1 771 381 262 649 ( 83 221) 1 950 809 3 471 287 Housing 5 692 198 703 698 44 425 ( 114 543) 6 325 778 2 066 611 306 424 ( 97 092) 2 275 943 4 049 835 Public Safety 6 505 370 804 227 50 771 ( 130 906) 7 229 461 2 361 842 350 198 ( 110 962) 2 601 078 4 628 383 Sport & Recreation 1 626 342 201 057 12 693 ( 32 727) 1 807 365 590 460 87 550 ( 27 740) 650 270 1 157 096 Environmental Protection 1 219 757 150 792 9 520 ( 24 545) 1 355 524 442 845 65 662 ( 20 805) 487 702 867 822 Waste Management 7 318 541 904 755 57 118 ( 147 270) 8 133 144 2 657 072 393 973 ( 124 832) 2 926 213 5 206 931 Road Transport 8 131 712 1 005 283 63 464 ( 163 633) 9 036 826 2 952 302 437 748 ( 138 702) 3 251 348 5 785 479 Water 21 429 280 1 413 208 158 660 ( 409 082) 22 592 066 7 380 755 1 094 370 ( 346 756) 8 128 369 14 463 697 Electricity 13 010 739 1 608 453 101 543 ( 261 813) 14 458 922 4 723 683 700 397 ( 221 924) 5 202 156 9 256 766 Other 406 586 50 264 3 173 ( 8 182) 451 841 147 615 21 887 ( 6 935) 162 567 289 274
TOTAL 82 417 119 8 952 832 634 641 (1 636 329) 90 368 263 29 523 020 4 377 480 (1 387 023) 32 513 477 57 854 786
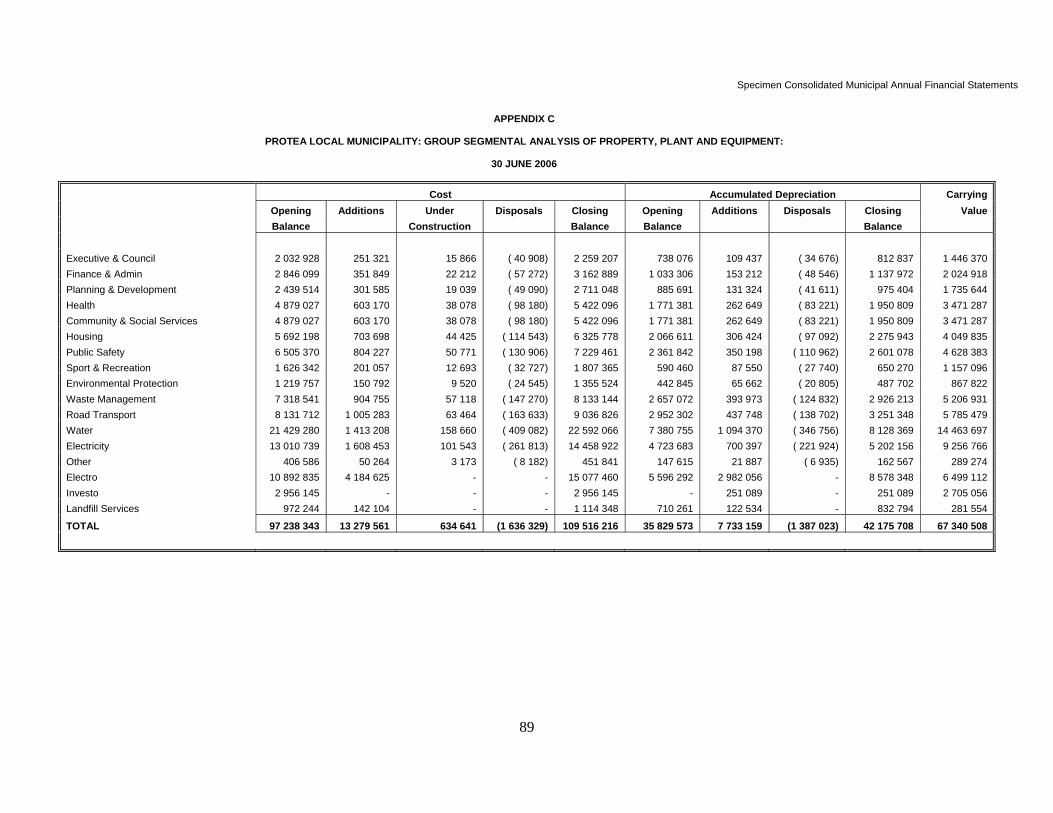
Specimen Consolidated Municipal Annual Financial Statements
89
APPENDIX C
PROTEA LOCAL MUNICIPALITY: GROUP SEGMENTAL ANALYSIS OF PROPERTY, PLANT AND EQUIPMENT:
30 JUNE 2006
Cost Accumulated Depreciation Carrying Opening Additions Under Disposals Closing Opening Additions Disposals Closing Value Balance Construction Balance Balance Balance Executive & Council 2 032 928 251 321 15 866 ( 40 908) 2 259 207 738 076 109 437 ( 34 676) 812 837 1 446 370 Finance & Admin 2 846 099 351 849 22 212 ( 57 272) 3 162 889 1 033 306 153 212 ( 48 546) 1 137 972 2 024 918 Planning & Development 2 439 514 301 585 19 039 ( 49 090) 2 711 048 885 691 131 324 ( 41 611) 975 404 1 735 644 Health 4 879 027 603 170 38 078 ( 98 180) 5 422 096 1 771 381 262 649 ( 83 221) 1 950 809 3 471 287 Community & Social Services 4 879 027 603 170 38 078 ( 98 180) 5 422 096 1 771 381 262 649 ( 83 221) 1 950 809 3 471 287 Housing 5 692 198 703 698 44 425 ( 114 543) 6 325 778 2 066 611 306 424 ( 97 092) 2 275 943 4 049 835 Public Safety 6 505 370 804 227 50 771 ( 130 906) 7 229 461 2 361 842 350 198 ( 110 962) 2 601 078 4 628 383 Sport & Recreation 1 626 342 201 057 12 693 ( 32 727) 1 807 365 590 460 87 550 ( 27 740) 650 270 1 157 096 Environmental Protection 1 219 757 150 792 9 520 ( 24 545) 1 355 524 442 845 65 662 ( 20 805) 487 702 867 822 Waste Management 7 318 541 904 755 57 118 ( 147 270) 8 133 144 2 657 072 393 973 ( 124 832) 2 926 213 5 206 931 Road Transport 8 131 712 1 005 283 63 464 ( 163 633) 9 036 826 2 952 302 437 748 ( 138 702) 3 251 348 5 785 479 Water 21 429 280 1 413 208 158 660 ( 409 082) 22 592 066 7 380 755 1 094 370 ( 346 756) 8 128 369 14 463 697 Electricity 13 010 739 1 608 453 101 543 ( 261 813) 14 458 922 4 723 683 700 397 ( 221 924) 5 202 156 9 256 766 Other 406 586 50 264 3 173 ( 8 182) 451 841 147 615 21 887 ( 6 935) 162 567 289 274 Electro 10 892 835 4 184 625 - - 15 077 460 5 596 292 2 982 056 - 8 578 348 6 499 112 Investo 2 956 145 - - - 2 956 145 - 251 089 - 251 089 2 705 056 Landfill Services 972 244 142 104 - - 1 114 348 710 261 122 534 - 832 794 281 554
TOTAL 97 238 343 13 279 561 634 641 (1 636 329) 109 516 216 35 829 573 7 733 159 (1 387 023) 42 175 708 67 340 508

Specimen Consolidated Municipal Annual Financial Statements
90
EXPLANATORY NOTES: APPENDIX D This is a segmental income statement. The standard GFS classifications set out in the Budget Reforms have been used. However, the segments used can be the organisational structure of the Municipality. The totals of Appendix D must agree to the total included in the Statement of Financial Performance. A reconciling item will be inter-departmental charges. These are included in the various functions or segments but are deducted in order to reconcile to the totals shown on the face of the Statement of Financial Performance. This Appendix is part of the annual financial statements and is subject to audit.
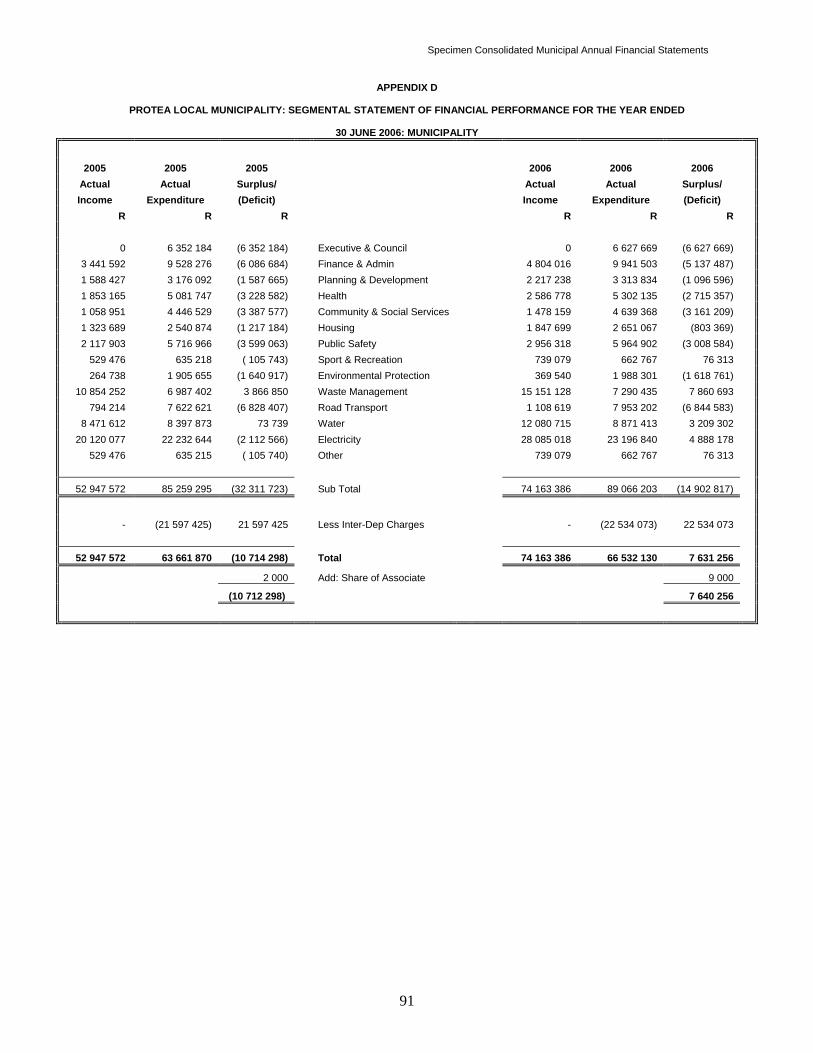
Specimen Consolidated Municipal Annual Financial Statements
91
APPENDIX D
PROTEA LOCAL MUNICIPALITY: SEGMENTAL STATEMENT OF FINANCIAL PERFORMANCE FOR THE YEAR ENDED
30 JUNE 2006: MUNICIPALITY
2005 2005 2005 2006 2006 2006
Actual Actual Surplus/ Actual Actual Surplus/ Income Expenditure (Deficit) Income Expenditure (Deficit)
R R R R R R
0 6 352 184 (6 352 184) Executive & Council 0 6 627 669 (6 627 669) 3 441 592 9 528 276 (6 086 684) Finance & Admin 4 804 016 9 941 503 (5 137 487) 1 588 427 3 176 092 (1 587 665) Planning & Development 2 217 238 3 313 834 (1 096 596) 1 853 165 5 081 747 (3 228 582) Health 2 586 778 5 302 135 (2 715 357) 1 058 951 4 446 529 (3 387 577) Community & Social Services 1 478 159 4 639 368 (3 161 209) 1 323 689 2 540 874 (1 217 184) Housing 1 847 699 2 651 067 (803 369) 2 117 903 5 716 966 (3 599 063) Public Safety 2 956 318 5 964 902 (3 008 584)
529 476 635 218 ( 105 743) Sport & Recreation 739 079 662 767 76 313 264 738 1 905 655 (1 640 917) Environmental Protection 369 540 1 988 301 (1 618 761)
10 854 252 6 987 402 3 866 850 Waste Management 15 151 128 7 290 435 7 860 693 794 214 7 622 621 (6 828 407) Road Transport 1 108 619 7 953 202 (6 844 583)
8 471 612 8 397 873 73 739 Water 12 080 715 8 871 413 3 209 302 20 120 077 22 232 644 (2 112 566) Electricity 28 085 018 23 196 840 4 888 178
529 476 635 215 ( 105 740) Other 739 079 662 767 76 313
52 947 572 85 259 295 (32 311 723) Sub Total 74 163 386 89 066 203 (14 902 817)
- (21 597 425) 21 597 425 Less Inter-Dep Charges - (22 534 073) 22 534 073
52 947 572 63 661 870 (10 714 298) Total 74 163 386 66 532 130 7 631 256
2 000 Add: Share of Associate 9 000
(10 712 298) 7 640 256
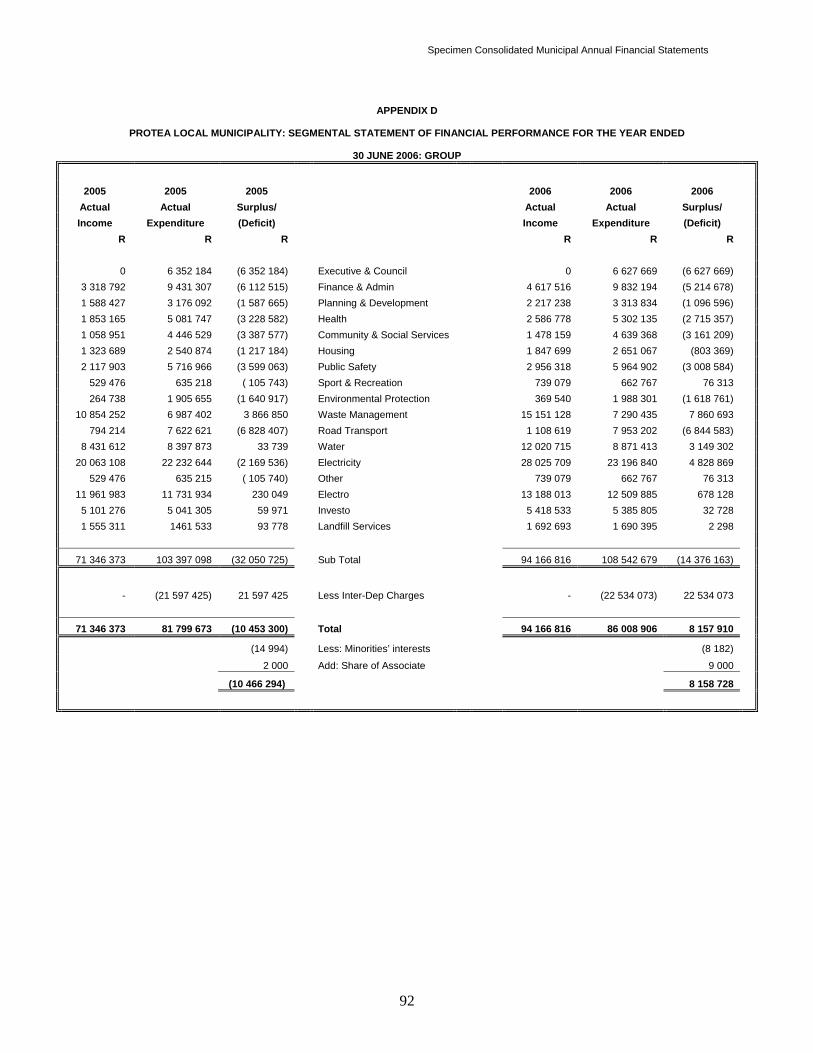
Specimen Consolidated Municipal Annual Financial Statements
92
APPENDIX D
PROTEA LOCAL MUNICIPALITY: SEGMENTAL STATEMENT OF FINANCIAL PERFORMANCE FOR THE YEAR ENDED
30 JUNE 2006: GROUP
2005 2005 2005 2006 2006 2006
Actual Actual Surplus/ Actual Actual Surplus/ Income Expenditure (Deficit) Income Expenditure (Deficit)
R R R R R R
0 6 352 184 (6 352 184) Executive & Council 0 6 627 669 (6 627 669) 3 318 792 9 431 307 (6 112 515) Finance & Admin 4 617 516 9 832 194 (5 214 678) 1 588 427 3 176 092 (1 587 665) Planning & Development 2 217 238 3 313 834 (1 096 596) 1 853 165 5 081 747 (3 228 582) Health 2 586 778 5 302 135 (2 715 357) 1 058 951 4 446 529 (3 387 577) Community & Social Services 1 478 159 4 639 368 (3 161 209) 1 323 689 2 540 874 (1 217 184) Housing 1 847 699 2 651 067 (803 369) 2 117 903 5 716 966 (3 599 063) Public Safety 2 956 318 5 964 902 (3 008 584)
529 476 635 218 ( 105 743) Sport & Recreation 739 079 662 767 76 313 264 738 1 905 655 (1 640 917) Environmental Protection 369 540 1 988 301 (1 618 761)
10 854 252 6 987 402 3 866 850 Waste Management 15 151 128 7 290 435 7 860 693 794 214 7 622 621 (6 828 407) Road Transport 1 108 619 7 953 202 (6 844 583)
8 431 612 8 397 873 33 739 Water 12 020 715 8 871 413 3 149 302 20 063 108 22 232 644 (2 169 536) Electricity 28 025 709 23 196 840 4 828 869
529 476 635 215 ( 105 740) Other 739 079 662 767 76 313 11 961 983 11 731 934 230 049 Electro 13 188 013 12 509 885 678 128 5 101 276 5 041 305 59 971 Investo 5 418 533 5 385 805 32 728 1 555 311 1461 533 93 778 Landfill Services 1 692 693 1 690 395 2 298
71 346 373 103 397 098 (32 050 725) Sub Total 94 166 816 108 542 679 (14 376 163)
- (21 597 425) 21 597 425 Less Inter-Dep Charges - (22 534 073) 22 534 073
71 346 373 81 799 673 (10 453 300) Total 94 166 816 86 008 906 8 157 910
(14 994) Less: Minorities’ interests (8 182)
2 000 Add: Share of Associate 9 000
(10 466 294) 8 158 728

Specimen Consolidated Municipal Annual Financial Statements
93
EXPLANATORY NOTES: APPENDIX E(1)
This Appendix is a summary of budget variances and an explanation of major variances and is based on the Statement of Financial Performance for revenue and Appendix D for expenditure. A consolidated budget variance is not required; instead similar schedules (not illustrated in this specimen) should be attached for each of the entities included in the consolidated annual financial statements. The latest adjustment budget must be used to prepare this Appendix. Variances, both monetary and percentage, have been calculated on actual in relation to budget. Comments on variances should be provided where the variance percentage is greater than 10. This Appendix is part of the annual financial statements and is subject to audit.
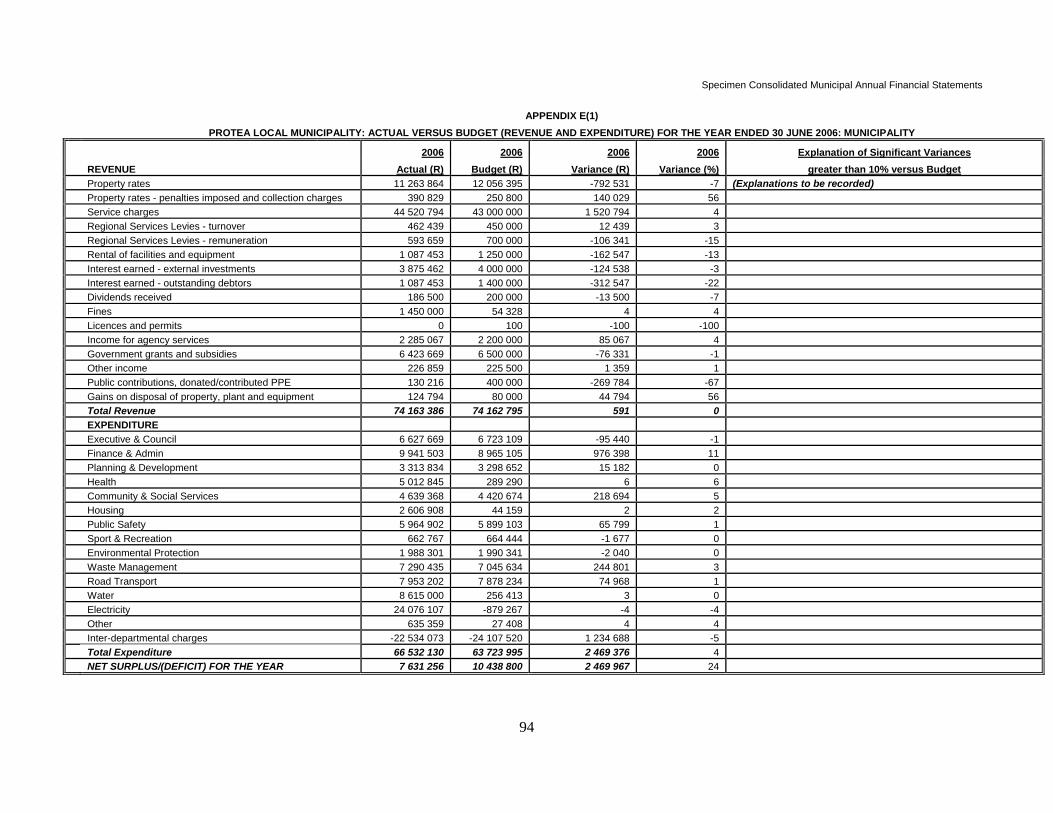
Specimen Consolidated Municipal Annual Financial Statements
94
APPENDIX E(1) PROTEA LOCAL MUNICIPALITY: ACTUAL VERSUS BUDGET (REVENUE AND EXPENDITURE) FOR THE YEAR ENDED 30 JUNE 2006: MUNICIPALITY
2006 2006 2006 2006 Explanation of Significant Variances REVENUE Actual (R) Budget (R) Variance (R) Variance (%) greater than 10% versus Budget Property rates 11 263 864 12 056 395 -792 531 -7 (Explanations to be recorded) Property rates - penalties imposed and collection charges 390 829 250 800 140 029 56 Service charges 44 520 794 43 000 000 1 520 794 4 Regional Services Levies - turnover 462 439 450 000 12 439 3 Regional Services Levies - remuneration 593 659 700 000 -106 341 -15 Rental of facilities and equipment 1 087 453 1 250 000 -162 547 -13 Interest earned - external investments 3 875 462 4 000 000 -124 538 -3 Interest earned - outstanding debtors 1 087 453 1 400 000 -312 547 -22 Dividends received 186 500 200 000 -13 500 -7 Fines 1 450 000 54 328 4 4 Licences and permits 0 100 -100 -100 Income for agency services 2 285 067 2 200 000 85 067 4 Government grants and subsidies 6 423 669 6 500 000 -76 331 -1 Other income 226 859 225 500 1 359 1 Public contributions, donated/contributed PPE 130 216 400 000 -269 784 -67 Gains on disposal of property, plant and equipment 124 794 80 000 44 794 56 Total Revenue 74 163 386 74 162 795 591 0 EXPENDITURE Executive & Council 6 627 669 6 723 109 -95 440 -1 Finance & Admin 9 941 503 8 965 105 976 398 11 Planning & Development 3 313 834 3 298 652 15 182 0 Health 5 012 845 289 290 6 6 Community & Social Services 4 639 368 4 420 674 218 694 5 Housing 2 606 908 44 159 2 2 Public Safety 5 964 902 5 899 103 65 799 1 Sport & Recreation 662 767 664 444 -1 677 0 Environmental Protection 1 988 301 1 990 341 -2 040 0 Waste Management 7 290 435 7 045 634 244 801 3 Road Transport 7 953 202 7 878 234 74 968 1 Water 8 615 000 256 413 3 0 Electricity 24 076 107 -879 267 -4 -4 Other 635 359 27 408 4 4 Inter-departmental charges -22 534 073 -24 107 520 1 234 688 -5 Total Expenditure 66 532 130 63 723 995 2 469 376 4 NET SURPLUS/(DEFICIT) FOR THE YEAR 7 631 256 10 438 800 2 469 967 24

Specimen Consolidated Municipal Annual Financial Statements
95
EXPLANATORY NOTES: APPENDIX E(2)
This Appendix is a summary of budget variances and an explanation of major variances and is based on Appendix B. A consolidated budget variance is not required; instead similar schedules (not illustrated in this specimen) should be attached for each of the entities included in the consolidated annual financial statements. Variances, both monetary and percentage, have been calculated on actual in relation to budget. The latest adjustment budget must be used to prepare this Appendix. Comments on variances should be provided where the variance percentage is greater than 5. This Appendix is part of the annual financial statements and is subject to audit.
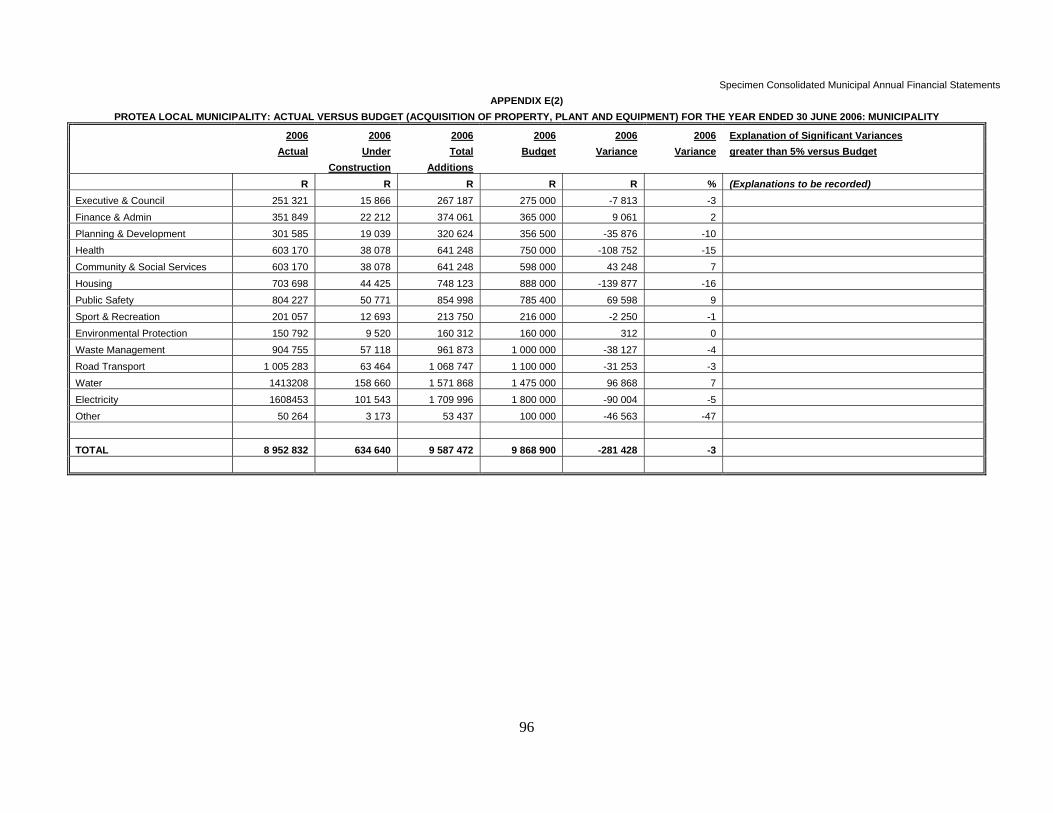
Specimen Consolidated Municipal Annual Financial Statements
96
APPENDIX E(2) PROTEA LOCAL MUNICIPALITY: ACTUAL VERSUS BUDGET (ACQUISITION OF PROPERTY, PLANT AND EQUIPMENT) FOR THE YEAR ENDED 30 JUNE 2006: MUNICIPALITY
2006 2006 2006 2006 2006 2006 Explanation of Significant Variances Actual Under Total Budget Variance Variance greater than 5% versus Budget Construction Additions R R R R R % (Explanations to be recorded) Executive & Council 251 321 15 866 267 187 275 000 -7 813 -3 Finance & Admin 351 849 22 212 374 061 365 000 9 061 2 Planning & Development 301 585 19 039 320 624 356 500 -35 876 -10 Health 603 170 38 078 641 248 750 000 -108 752 -15 Community & Social Services 603 170 38 078 641 248 598 000 43 248 7 Housing 703 698 44 425 748 123 888 000 -139 877 -16 Public Safety 804 227 50 771 854 998 785 400 69 598 9 Sport & Recreation 201 057 12 693 213 750 216 000 -2 250 -1 Environmental Protection 150 792 9 520 160 312 160 000 312 0 Waste Management 904 755 57 118 961 873 1 000 000 -38 127 -4 Road Transport 1 005 283 63 464 1 068 747 1 100 000 -31 253 -3 Water 1413208 158 660 1 571 868 1 475 000 96 868 7 Electricity 1608453 101 543 1 709 996 1 800 000 -90 004 -5 Other 50 264 3 173 53 437 100 000 -46 563 -47
TOTAL 8 952 832 634 640 9 587 472 9 868 900 -281 428 -3
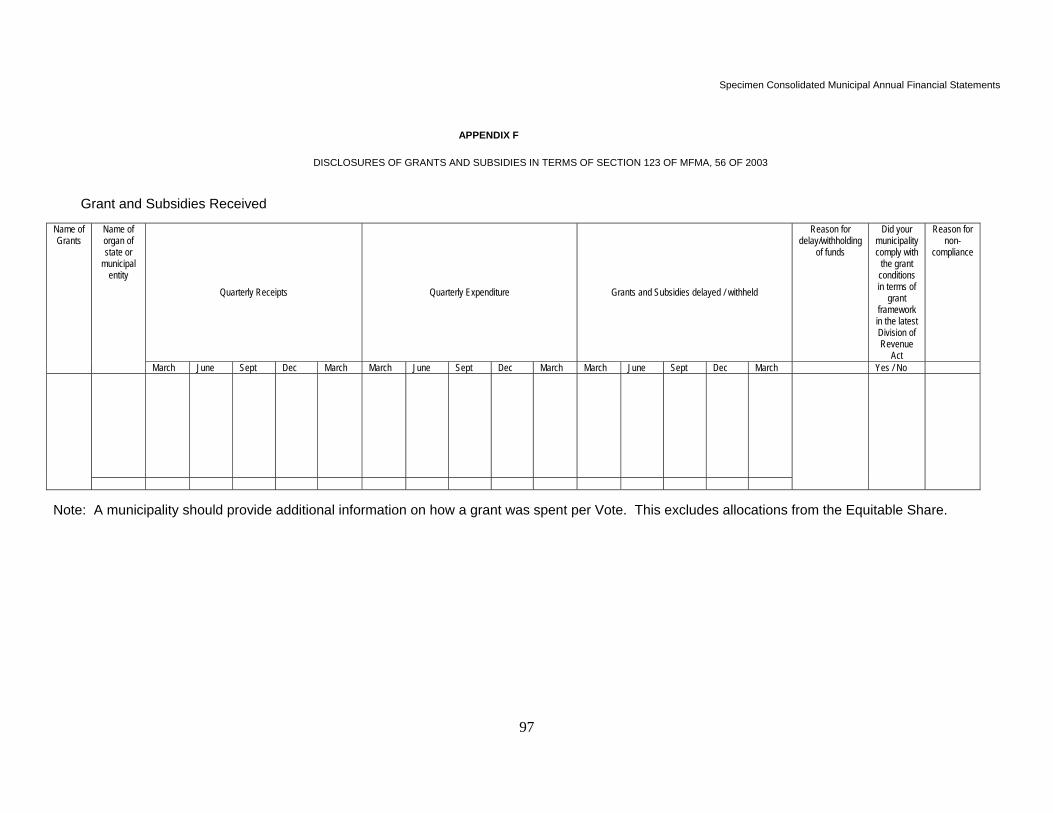
Specimen Consolidated Municipal Annual Financial Statements
97
APPENDIX F
DISCLOSURES OF GRANTS AND SUBSIDIES IN TERMS OF SECTION 123 OF MFMA, 56 OF 2003
Grant and Subsidies Received
Quarterly Receipts Quarterly Expenditure Grants and Subsidies delayed / withheld
Reason for delay/withholding
of funds
Did your municipality comply with
the grant conditions in terms of
grant framework in the latest Division of Revenue
Act
Reason for non-
compliance
Name of Grants
Name of organ of state or
municipal entity
March June Sept Dec March March June Sept Dec March March June Sept Dec March Yes / No
Note: A municipality should provide additional information on how a grant was spent per Vote. This excludes allocations from the Equitable Share.