Embed Size (px)
Citation preview
SERITR-215-3513A UC Categories 233 234 DE89009447
Spectral Solar RadiationData Base Documentation
Volume I
Carol J Riordan Daryl R Myers Roland L Hulstrom
January 1990
Prepared under Task No RA91 0201
Solar Energy Research Institute
1617 Cole Boulevard Golden Colorado 80401-3393
Prepared for the US Department of EnergyContract No DE-AC02-83CH1 0093
NOTICE
This report was prepared as an account of work sponsored by an agency of the United States government Neither the United States government nor any agency thereof nor any of their employees makes any warranty express or implied or assumes any legal liability or responsibility for the accuracy comshypleteness or usefulness of any information apparatus product or process disclosed or represents that its use would not infringe privately owned rights Reference herein to any specific commercial product process or service by trade name trademark manufacturer or otherwise does not necessarily conshystitute or imply its endorsement recommendation or favoring by the United States government or any agency thereof The views and opinions of authors expressed herein do not necessarily state or reflect those of the United States government or any agency thereof
Printed in the United States of America Available from
National Technical Information Service US Department of Commerce
5285 Port Royal Road Springfield VA 22161
Price Microfiche A01 Printed Copy A04
Codes are used for pricing all publications The code is determined by the number of pages in the publication Information pertaining to the pricing codes can be found in the current issue of the following publications which are generally available in most libraries Energy Research Abstracts (ERA) Governshyment Reports Announcements and Index (GRA and I) Scientific and Technical Abstract Reports (STAR) and publication NTIS-PR-360 available from NTIS at the above address
TR-35 13A
PREFACE
This report documents the Solar Energy Research Inst i tutes spectral solar radiation data base Volume I describes the history approach content and format of the data and Volume I I contains graphs of each o f the spectral solar radiat i on curves and assoc iated f ield notes
This is the f i rst pub l i c rel ease of these data Our intent is to make the data ava i l ab l e as soon as possible so that others can use i t However we also intend t o create addi t i onal products and data subsets in the future t o i l lustrate app l i ca t i ons o f the data f o r special purposes or analyses
Comments or ques t ions about these data should be directed t o the Solar Energy Research Inst i tut e Solar Electric Research Division Resource Assessment and Instrumenta t i on Branch in Golden Col orado 80401
ACKNOWLEDGMENTS
SERI would l i ke t o acknowl edge the work of the Florida Solar Energy Center and the Pac i f i c Gas and E l ectric Company in building this spectral solar rad i a t i on data base Wi thout their he l p this data base would no t have been possibl e
111
Objective
The objec t ive o f thi s report so lar radiat i on data base at re s i de on magnet i c tape
Discussion
Vo lume I of thi s report document s of the data ba s e Volume I I spec tral data s et s Together and acc e s s any part i cular f i eld the magnet i c t ape
Conclusions
TR-3513A
SUMMARY
i s to provide documentation for the spectral the Solar Energy Research Ins t i tut e The data
the hi s t ory approach content and f o rmat cont ains graphs and field notes for each o f the
these two vo lume s should a l l ow users to f ind of data or de s i red data subset contained on
The se data are be ing released at thi s point to make the informa t i on ava i l ab l e to tho s e who have immediate uses or app l i cat i ons W e a l s o intend t o create other produc t s and data subset s in the future to i l lustrate par t i cular applishycat i ons and analyses
lV
Page
TR-35 1 3A
TABLE OF CONTENTS
1 0 Int roduc t i on bull bull bull bull bull bull bull bull bull bull bull bull bull bull bull bull bull bull bull bull bull bull bull bull bull bull bull bull bull bull bull bull bull bull bull bull bull bull bull bull bull bull bull bull bull bull bull bull bull bull bull bull bull bull bull bull 1
2 0 History bull bull bull bull bull bull bull bull bull bull bull bull bull bull bull bull bull bull bull bull bull bull bull bull bull bull bull bull bull 2
3 0 Approach bull bull bull bull bull bull bull bull bull bull bull bull bull bull bull bull bull bull bull bull bull bull bull bull bull bull bull bull bull bull bull bull bull bull bull bull bull bull bull bull bull bull bull bull bull bull bull bull bull s
4 0 Contents o f the Data Base bull bull bull bull bull bull bull bull bull bull bull bull bull bull bull bull bull bull bull bull bull bull bull bull bull bull bull bull bull bull bull bull bull bull bull bull bull bull bull bull bull bull bull 1 7
s o Measurement Uncert aintY bull bull bull bull bull bull bull bull bull bull bull bull bull bull bull bull bull bull bull bull bull bull bull bull bull bull bull bull bull bull bull bull bull bull bull bull bull bull bull bull bull bull bull bull bull 2 7
6 0 Format o f the Data Tape bull bull bull bull bull bull bull bull bull bull bull bull bull bull bull bull bull bull bull bull bull bull bull bull bull bull bull bull bull bull bull bull bull bull bull bull bull bull bull bull bull bull bull bull bull 3 6
7 0 References bull bull bull bull bull bull bull bull bull bull bull bull bull bull bull bull bull bull bull bull bull bull bull bull bull bull bull bull bull bull bull bull bull bull bull bull bull bull bull bull bull bull bull bull bull bull bull bull bull bull bull bull bull bull bull bull bull bull 48
Appendix Qua l i ty-Control Processing bull bull bull bull bull bull bull bull bull bull bull bull bull bull bull bull bull bull bull bull bull bull bull bull bull bull bull bull bull bull bull bull bull bull bull bull so
v
bull bull bull bull bull bull bull bull bull bull bull bull bull bull bull bull bull bull bull
3-2
TR-35 1 3A
LIST OF FIGURES
2-1 Spectral and broadband s olar radiation collection at FSEG Cape Canaveral Fl a in conjunction wi th phot ovo l taic module data in the same plane bull bull bull bull bull bull bull bull bull bull bull bull bull bull bull bull bull bull bull bull bull bull bull bull bull bull bull bull bull bull bull bull bull bull bull bull bull bull bull bull bull bull bull bull bull 3
2-2 Data co l l ection s i t e at PGampE San Ramon Cal i f 3
2-3 Data co l l ect ion s i t e at Wel by Co lo where SERI acquired re search data t o s tudy air pollut i on effect s on solar radiat i on bull bull bull bull bull bull bull bull bull bull bull bull bull 4
3-1 The atmo s phere act s as a t emporally and spatially variabl e f i l ter on solar radiation The path l ength ( a ir ma s s ) of direct-beamradiat i on increa ses with increas ing solar zeni th angle scattering and absorp t i on increa se with l onger path lengths Global radiationon a hori zontal plane ( Gh ) i s equal t o the direct-beam rad iation( from the s o lar di sk) normal to the surface ( D ) mul t i pl i ed by thenco s ine of the solar zenith angle ( z ) plus scatt ered rad i a t i on from the sky ( S ) For a t i l ted ( rather than hori zontal ) plane D i s mul t i p l i ed b y the cos ine o f the incidence angl e The surfac al s o rece ive s radiation ref l ected from the ground t o the surface ( R ) The se re l a t i onships are
Direct norma l Gl obal hori zontal D x Cos ( z ) + SnGlobal t i l t D x Co s (e ) + s + R `Gl obal normal ` D
n + S + R bull bull bull bull bull bull bull bull bull bull bull bull bull bull bull bull bull bull bull bull bull bull bull bull bull bull bull bull bull bull bull 6n
Spectroradi ometers equi pped with view-l imi ting tubes t o acquire direct-normal solar rad i a t i on Aluminum foil wa s placed over the instrument s to reflect radiation and keep the ins truments from overheat ing 8
3-3 Spectrorad i omet ers equi pped wi th integra t ing sphere s to measure gl oba l s o lar rad i a t i on 8
3-4 Spectroradi ometers equi pped with the Tef l on dome rece ivers bull bull bull bull bull bull bull bull bull 9
3-5 Outdoor int ercompari s on o f four spectrorad i ometers bull bull bull bull bull bull bull bull bull bull bull bull bull bull bull bull bull 9
3-6 Examp l e s of the very few di s torted spectra in the data base ( a b c ) Broadband solar radiation data ( d ) corre s pond ing with the spectra in b and c show that irradi ance was decrea s i ng at 10 3 1 due t o part ly cl oudy condit ion s bull bull bull bull bull bull bull bull bull bull bull bull bull bull bull bull bull bull bull bull bull bull bull bull bull bull bull bull bull bull 12
3-7 Exampl e of a l l- sky photographs acquired at FSEC The s e pho tographs provi ded evidence o f ra in pos sible- condensation on op t ics and clouds 13
3-8 Example o f a l l -sky pho tograph acquired at SERI wi th a d i s k bl ocking sun to s how di ffuse sky cond i t i ons bull bull bull bull bull bull bull bull bull bull bull bull bull bull bull bull bull bull bull bull bull bull bull bull bull bull bull bull bull bull bull bull bull 13
V l
TR-3 5 13A
LIST OF FIGURES ( Continued)
3-9 Exampl e of the instrument configuration data recorded with the measured data 14
3-10 Example of the c omputer terminal out put during a quality-control sess1on 1 5
4- 1 Exampl es of ( a ) direct-normal and ( b ) global-normal spectra and ( c ) broadband solar radiation measured at FSEC on a cl ear day bull bull bull bull bull bull 1 8
4-2 Examples of (a ) direct-normal and ( b ) global-til t spectra and ( c ) broadband solar radiation measured at FSEC on a cl oudy day bull bull bull bull bull 1 9
4-3 Exampl es of global-normal spectra (upper ) and broadband solar radiation ( lower ) measured at FSEC on a part ly cloudy day The spectrum at 1 6 3 1 shows data dropout during data transfer bull bull bull bull bull bull bull bull bull bull 20
4-4 Examples of so lar spec tra enhanced by cl oud bright spots ( a ) at 1 0 3 1 on day 132 and ( c ) at 1 2 30 on day 133 and corresponding [ ( b ) and ( d ) respectively] broadband solar radiation bull bull bull bull bull bull bull bull bull bull bull bull bull bull 2 1
4-5 Exampl es of direct -normal global-horizontal and diffuse-horizontal spectra measured by SERI on two days bull bull bull bull bull bull bull bull bull bull bull bull bull bull bull bull bull bull bull bull 22
4-6 The cumulative number of spectra ( horizontal axis ) measured over a range of air mass and atmospheric descriptors ( vertical axis ) bull bull bull bull 23
4-7 Exampl es of spectra showing noisy data iri the ul traviolet ( 300shy400 nm ) and near-infrared ( 10 0 0- 1 100 nm) regions bull bull bull bull bull bull bull bull bull bull bull bull bull bull bull bull bull bull bull 26
5-l Estimated t otal spectral measurement uncertainty for global measurements with the integrating spheres on ( a ) units number 102 1 5 8 and 174 ( b ) gl obal-normal measurements with the Teflon dome receivers on units 174 and 2 1 8 and ( c ) direct-normal measurements with the view-limiting tubes on units 158 1 7 2 and 1 7 4 The measurement uncertainty is symmetrical except in ( a ) where a -8 bias is inc luded in the l ower limit for global-horizontal and global-til t cases due t o nonuniform sphere response when a strong direct-beam component is present bull bull bull bull bull 28
5-2 Comparison of the spectral intensity of an outdoor global -normal measurement and the NIST calibration lamp source Low lamp values below 400 nm resul t in high measurement uncertainty bull bull bull bull bull bull bull bull bull bull bull bull bull bull bull bull 29
5-3 Between-instrument precision for global-normal spectral solar radiation measurements using the integrating spheres bull bull bull bull bull bull bull bull bull bull bull bull bull bull bull 29
5-4 Ratio of the spec troradiometer detect or response at different t emperatures to the response at 40degC bull bull bull bull bull bull bull bull bull bull bull bull bull bull bull bull bull bull bull bull bull bull bull bull bull bull bull bull bull bull bull 30
vii
6-5
TR-3 5 1 3A
LIST OF FIGURES ( Concluded )
6-1 Examp l e o f the ins trument configurat i on data on the data base tape The numbers refer t o
1 c indicat ing configurat i on 2 FSEC 1987 Day 122 at 8 13 s tandard t ime 3 Lat i tude 4 Longi tude 5 E l evation 6 Reference t o conf igurat i on f i l e that wi l l be f ound in the
data files 7 S t art ing data-acqui s i t ion t ime plus number of attempt s t o
acquire spectra ( which would extend the data acqui s i t i on t ime )
8 Number o f data channel s 9 Number o f spectra ( 0 for configuration files 1 or 2 f or
data f i l e s ) 1 0 Number o f l ines i n thi s s egment bullbullbullbullbullbullbullbullbullbullbullbullbullbullbullbullbullbullbullbullbullbullbullbullbullbullbullbullbullbull 3 8
6-2 Examp l e s of the data on the data-ba s e tape bullbullbullbullbullbullbullbullbullbullbullbullbullbullbullbullbullbullbullbullbullbullbullbullbull 3 9
6-3 Exampl e o f qua l i ty-contro l informa t i on on the data-ba se t ape 44
6-4 Examp l e s of dai ly no tes on the data-ba s e tape bullbullbullbullbullbullbullbullbullbull bullbullbullbullbullbullbullbull 45
Examp l e s o f spectral measurement uncertainty on the data-ba s e t ape A value o f plusmn100 indicates greater than 1 00 mea surement uncertaintYbullbullbullbullbullbullbullbullbullbullbullbullbullbullbullbullbullbullbullbullbullbullbullbullbullbullbullbullbullbullbullbullbullbullbullbullbullbullbullbullbullbullbullbullbullbullbullbullbullbullbullbullbullbullbullbull 46
Vlll
TR-35 13A
LIST OF TABLES
3-1 Measurement s and Documenta t i on for Each File in the Spec tral Solar Rad i a t i on Data Basebullbullbullbullbullbullbullbullbullbullbullbullbullbullbullbullbullbullbullbullbullbullbullbullbullbullbullbullbullbullbullbullbullbullbullbullbullbullbullbullbullbullbull 1 0
S-1 FSEC Instrument Cal i brat ion H i s tory and E s t imated Measurement Uncertainty 3 1
S-2 PGampE Instrument Cal ibration Hi s tory and Est imated Measurement Uncertainty 3 3
S-3 SERI Instrument Cal ibrat ion H i s tory and Est imated Measurement Uncertainty bull 34
6-1 F i l ename s on the Data Tape bullbullbullbullbullbullbullbullbullbullbullbullbullbullbullbullbullbullbullbullbullbullbullbullbullbullbullbullbullbullbullbullbullbullbullbullbullbullbullbullbullbull 3 7
ix
1 0 INTRODUCTION
The Solar Energy Res earch Inst i tute ( SERI ) Electric Power Research Ins t i tute ( EPRI ) Florida Solar Energy Center ( FSEC ) and Pac i f i c Gas and Electric Company PGampE ) cooperated to produce a spectral solar radiation dat a bas e repres ent ing a range of atmospheric cond i t i ons ( or c l imates ) that i s appl ishycable to s everal d i f ferent type s of solar col lectors Thes e data wi l l he l p to characterize the natural variab i l i ty in the spec tral color) cont ent of outshydoor solar radi at i on so that the sens i t ivity of spectrally s elect ive solar devices such a s photovo l tai c s smart windows and bioma s s ) to these variations can be s tudied quant i tat ively
Thi s report document s the hi s tory approach content and format of the data base to make it useful to the s c i ent i f i c community A s econd volume of thi s report contains graphs of each of the spectral so lar radiation curve s and a s s o c i ated f i e l d note s The data are avai lable on magnetic tape in ASCII forshymat and cons i s t of broadband 1 and spectral2 solar radi at ion and meteorologi cal measurement s dai ly f i eld notes qual ity control informat ion and measurement
middotuncertainty Que s t i ons about the data base should be directed to SERI Solar Electric Res earch Divi s i on Re source As ses sment and Instrumentat ion Branch in Golden Col orado
1sroadband int egrated solar radiat ion 0 3 to 3 m
2spectral solar rad i a t i on as a func t i on of wavelength 03 to 1 1 m at0 002 m interva l s
1
2 0 HISTORY
The need for spectral sol ar rad i at ion data has been expre s sed in s everal forums [ 1-4] The bas i c need i s for data that can be used wi th solar c o l shylector spectral respons ivi ty data t o s c ient i f i cally and quantit a t ively det er-middot mine how the c o l l ector responds to natural variations in the spect ral con t ent of solar radiat ion and thereby det ermine how its performance is a f fec ted In the photovoltaic ( PV ) commun i t y for example there i s no consensus on the magni tude of spectral effec t s because there are no standard procedures for eva luating outdoor spectral sen s i tivity of PV devi ces the s en s i t ivity i s devi ce dependent and the qua l i ty and uncertainty o f the spec tral solar rad iashyt i on data used in the analyses are unknown or undocumented [ 5] In many cases only one s t andard or reference spectrum i s used to report the perforshymance of a PV devi ce and the uncertainty a s soc iated wi th natural spec t ra l var iations i s unknown
To s tudy the spec tral sens i t ivity of a solar col lector i t s spec tral respon s e quantum e f f i c i ency or spectral abs orpt i ontransmi s s ion curve i s mul t ipl ied by inci dent s pectra l sol ar radiat ion for a range of real i s t i c out door condi t i ons and the resul t s are integrat ed over the ent i re spectrum and the des ired t ime period Al l measurement uncertainty ( in the spectral data and spec t ra l response ) mus t b e evaluated to det ermine the s tat i s t ical s i gni ficance of any variations in the solar collec t or s performance that are attributed to specshytral vari a t i ons To make thi s determinat ion spec tra l solar radiat ion data wi t h documented measurement uncertainty are requi red
In 1984 EPRI and SERI met to def ine a research project that woul d addre s s t he need for measured outdoor spectral solar rad iation data for a range o f c l i shymat e cond i t ion s A formal project wa s ini t i ated in 1985 in whi ch EPRI proshyvided funds to SERI to perform three tasks ( 1 ) mod i fy c a l ibrat e and del iver to EPRI two computer-contro l l ed LI-COR Inc model LI-1800 spec trashyradiometer s ( 2 ) train EPRI -de s i gnated operators to use sof tware that acquires s pectra l so lar radiat ion and concurrent broadband solar radiat i on and me teorological data and ( 3 ) deve l op data collec t i on gui del ine s [ 6] EPRI a l s o ini t i at ed cooperat ive agreement s wi th FSEC and PGampE to co l l ect the s e data at their s i t e s in Cape Canavera l F la and San Ramon Cal i f respect ively In 1986 EPRI extended the agreement with SERI to use remaining project funds to as s i s t wi th the s tart-up of mea surement s at FSEC and PGampE
Spectral solar radiation and suppor t ing data were collected at FSEC and PGampE and sent to SERI for qua l i ty-control proc e s s ing and archiving [ 7 ] SERI coordinated the data col l e c t i on periodically cal ibrat ed the spec t rashyrad iometer s added data to the data ba s e and documented and forma t ted the data ba s e under the Department of Energy ( DOE ) SERI Re source As ses sment Program
Data that are inc luded in the data base were col lected at FSEC f rom Oct ober 1 98 6 to Apr i l 1 988 and at PGampE from Apti l 1987 to Apr i l 1988 FSEC opera ted one EPRI and one SERI spect roradiomet er almo s t daily at Cape Canavera l ( s ee Figure 2-1 ) whi ch contributed nearl y 2800 spectra to the data ba s e PGampE operated one EPRI spectrorad iometer at San Ramon Ca l i f ( s ee F i gure 2-2) as re s ource s permi t t ed contribut ing nearly 300 spectra to the data base SERI col lected about 200 spec tra in the DenverGolden Co l o ( s ee F i gure 2-3) area from November 1987 to February 1988 as part of a res earch project to s t udy urban spec tral solar radiat ion and added the s e data to the da ta ba s e [7]
2
TR-35 1 3A s= middot
Fi gure 2-1 Spectral and broadband solar radiation collection at FSEC Cape Canaveral Fla in conjuncti on with photovoltaic module data i n the same plane
Figure 2-2 Data collection si te at PGampE San Ramon Calif
3
middotmiddot
TR-35 13A
figure 2-3 Data colLect i on site at middotWelby Colomiddot where SERI acquired research data to study air polluiion effects bn solar radiat i on
4
3 0 APPROACH
A detailed de script ion of the approach for data collection i s avai lable in the Data Col l ect i on Plan [ 9 ] The goal s of thi s plan were to collect and to archive spectral s o l ar radiat i on broadband so lar radiat ion and meteoroshylogical data for a range of air ma s se s and atmo spheric cond i t i ons from various col l ector conf igurat i ons
A range of air ma s s values i s important because air mas s i s the path length of the s olar beam through the atmo sphere ( Figure 3-1 ) Air mas s increas e s wi th increas ing solar zenith angle and thus changes wi th locat ion ( l at itude ) seashyson and t ime of day As air mas s ( the path length) increases there i s increas ed spectral absorpt ion and scat tering of solar radiat ion by atmospheric cons t i tuent s such a s aero sol s and water vapor and the spectral content of solar radiat ion at the collector surface change s
The mo st important atmo s pheric variables that determine broadband and spectral solar radiation are cloud cover atmospheric turbidity ( aerosol s ) preshyc i pi table water vapor and barometric pres sure ( number of air mol ecules in the path of the solar beam) To properly document the spectra i t i s important to mea sure or characterize these variables Several methods can be used depending on the instrument s ava i lable at the measurement s i tes
bull Cl oud cover i s measured in terms of
Opaque sky c over ( tenths ) and type as determined by an observer an all-sky phot ograph or-both
Kt the atmo s pheric frac t i onal transmi ttance of broadband gl obal s olar radiation on a horizontal surface ( global-horizontal divided by extrashyterrestrial s o l ar radiation on a horizontal surface ) or D GH the rat i o of direct-to-gl obal broadband solar radiat i on on a hori zontal surface or bot h
bull Turbidity i s mea sured i n terms of
Atmo spheri c opti cal depth due to aero s ol s as cal cul ated from narrowshywavel ength s pec tral measurements taken with a sunphot ometer or a specshytroradiometer measuring direct-beam rad iation [10 1 1 pp 1 1 8-122 ]
Kn t he atmo spheric frac t i onal transmi t t ance of broadband direc t-beam solar rad i at i on or D GH as described previously or both
bull Precipi table water vapor i s
Cal culated from sunphotometer o r spectroradi ometer measurements [12 ]
Measured wi t h a bal loon radiosonde on- s i t e or at a nearby Nat i onal Weather Serv i ce stat ion
Calculated from measured relative humi d i ty or dew-point temperature [ 1 3 ]
5
Sunrise sunset
--
Zenith ___
Atmosphere Aerosols Water vapor Clouds Ozone (etc)
Spectralscattering
and absorption
TR-35 13A
0CJCJ
0(9
Global Radiation
Figure 3-1 The atmosphere f ilter on soLar direct-beam radiation increases with increasing solar zenith angle scattering and absorption incre4se with l onger path lengths Global radiation on a horizontal plane (Gh) is equal to the direct-beam radiation (from the solar disk) normal to the surface (D ) multiplied by the cosine of the solar zenith nangle (z) plus scattered radiation from the sky (S) For a tilted (rather than horizontal) plane D is multiplied by then cosine of the incidence angle The surface also receives radiation reflected from the ground to the surface (R) These relationships are
Direct normal D n Global horizontal = D x Cos(z) + SGh n Global tilt Gt = Dn x Cos(e) + S + R Global normal G = D + S + R n n
bull Barome tric pres sure is
Mea sured with a barometer
Cal culated using site el evation [ 1 1 p 100]
At least one o f these options is used for each variable to document a tmo shyspheric conditions during the spectral s o l ar radia tion mea surement s Redundant information is used for qua lity-control checks
acts as a temporally and spatially variable radiation The path length (air mass) of
6
TR-3 5 1 3A
The spectral solar radiat ion measurement s were made in several different meashysurement modes corre s pond ing to solar collector conf igurations Di rectnorma l s o l ar radiation ( radiation from the solar d i sk in about a 5 -deg field of view) i s used by concentrat ing ( focusing ) col lectors global-normal ( d irect plus scatt ered radia t i on on a surface normal to the solar d i s k ) is used by two-axi s sun-tracking f lat-plate col lectors and global-t i l t i s used by f ixed-t i l t f l at plate s such as south-fac ing col lectors t i lted at the lat itude angle or s ingle-axi s tracking flat plate s Global-horizontal ( direct plus scatt ered radiation on a hor i zontal surface ) is used to develop and t e s t mode l s that convert global radiat ion t o radiat ion on a surface of any orienshytat i on such as bui lding wal l s and windows the photosynthe t i cally active reg i on of the spectrum i s a l s o important for bioma s s appl i ca t i ons The di ffuse spectra ( sky radiation with the solar disk blocked ) inc luded in the data ba s e were measured a s part o f SERIs res earch data collection t o examine air po l shylut i on effec t s i n the DenverGolden area
Spectral solar rad iat ion data were acquired us ing spectrorad iometers with the fo l l owing character i s t i c s
bull Holographic grating monochromator
bull Wavelength range 0 3 - 1 1 m
bull Bandwidth 0 006 m
bull S canning s t ep s i z e 0 002 m
bull S can t ime 27 s
Several modi f i cat ions were made to these spec troradiometers by SERI [14] A view- l imi t ing tube was placed over the Teflon dome receiver ( d i f fuser) to make direct-normal mea surements ( Figure 3-2 ) For global mea surement s the Teflon dome was replaced by an integrat ing sphere ( Figure 3-3 ) although the Tef l on dome ( Figure 3-4 ) was somet ime s used for gl obal-normal measurements A temshyperature control ler wa s added to each spectroradiometer to maintain the s i l icon detector temperature at 40degC
The spectroradi ometers were cali brated at SERI every s i x months against standard lamps traceable to the Nati onal Institute of Standard s and Technol ogy [ NI ST formerly Nati onal Bureau of Standard s (NBS ) ] In thi s proce s s the spectroradiometers were cal i brated in the laboratory and then compared with one another outdoors (Figure 3-5 ) to determine spectral uncertainty l imi t s prec i s ion ( or repeatab i l i t y ) error s and bias error est imate s
At the measurement s ites the instrument s were checked monthly against a reference lamp ( LI -COR Opt i ca l Rad iat ion Cal i brator ) t o monitor instrument s tabi l i ty these resul t s were reported to SERI (Measurement uncertainty i s reported in detail i n references 1 5 1 6 and a summary i s given i n Section 5 )
Table 3-1 l i s t s the data coll ected to cal culate or spec i fy the atmo s pheric c ond i t i ons and properly document each spectrum in the data ba s e The broadshyband sol ar radiation data were measured to correspond wi th the different specshyt roradiometer measurement modes and to calculate atmospheric descriptors such as Kt Ground albedo was inc luded becaus e it affects both solar radiation
7
SE Imiddot-middot TR-35 1 3A
Figure 3-2 Spectroradiometers equipped with view-limiting tubes to acquire 1direct-normal solar radiation Aluminum foil was placed over
the instruments to reflect radiation and keep the instruments from overheating
Figure 3-3 Spectroradiometers equipped with integrating spheres to measure global solar radiation
8
Fi gure 3-4 Spectroradi ometers equi pped wi th the Tefl on dome recei vers
Fi gure 3-5 Outdoor i ntercompari son of four spectroradi ometers
9
I
Table 3-1 Measurements and Documentation f or
bull Sit e identifiera
Four-l et ter code Longitude ( decimal) Latitude ( decimal)
bull Site
Dat e a elevation ( m)
Day number Year
bull Local standard timea
Hour Minutes
bull Col lection mode for spectral irradiance scan( s) t-0
Two-le tter code Gl obal horizontal - GH Gl obal normal - GN Gl obal til t - GT use
horizontal ( e g 30 Direct normal - DN
til t angle from deg) and azimuth
bull Direc t-no rmal irradiance va lue (Wm2)bull Global-normal irradiance value (Wm2)bull Global-horizontal irradiance value (Wm2)
IllN-Each File in the Spectral Solar Radiation Data Base -
bull Global-tilt pyranomet er value Til t angle o f pyranometer from horizontal
and azimuth Irradiance val ue ( Wm2)
bull I rradianc e-st abil ity check ( silicon pyrheliomet er)b
bull Irradiance-stability check (silicon pyranomet er )b
bull Spectroradiometer scan( s) ( 2-nm step size) ( Wm2-nm)
bull Repeat of broadband irradianc e measurement s b
bull Ambient t emperature (degC) bull Surface pressure (mb) bull Rel ative humidity ( ) bull Average wind speed (mph) bull Ground albedo (measured or estimated)c ( )bull Mul tiwavelength sunphot omet er measurements
( four-channel maximum)d
bull Opaque cl oud cover ( t en ths) bull National Weather Service water vapor
val ue ( em) bull Comment field (15 charact ers)
aLocation dat e and time are used t o calcul ate air mass
bThe silicon inc luded to
pyrhe liomet er1 silicon pyranometer and repeated broadband so lar radiation values allow eval uation of irradiance stability during the spectral irradiance scan
are
cValue s should be repres enta tive of the dominant land-cover type or mixture in the vicinity of t he s pect roradiomet er
dspectral m a surements at several wave leng ths are made using sunphot omet ers with narrow-band filters cal culate atmos pheric turbidity and water vapor
to
VJV1VJtgt
TR-35 1 3A
measured on til ted surfaces and ground-to-sky reflec tions ( especial ly under cl oud cover) Wind speed and ambient temperature were recorded because they may be useful along with the spectral data to predict collector perforshymance The broadband and met eorological sensors were maintained and calishybrat ed by the measurement sites as documented in Sec tion 5
Broadband solar radiation measurements were made immediately ( within 15 s) before and after the spec t ral solar radiation scan to allow evaluation of atmospheric stability at the time of the scan In addition the datashyacquisition software was designed so that global-horizontal solar radiation was sampl ed six times during the spectral scan using a silicon-detector pyrashynome t er if global solar radiation varied by more than 2 the spec tral scan was not recorded Three attempts were made to acquire a spectral scan during unstable c onditions ( such as partly cl oudy skies) I f a scan was not obtained after three t ries the broadband and meteorological data were recorded and then the data acquisition system waited until the next regularly scheduled data acquisition time ( usually an hour) to attempt another spectral scan Because o f the stability monitoring during the spectral scans wemiddot believe there are very few cases when the spectral scan was acquired during variable solar radiation conditions We found three examples of distorted spectra ( see Figure 3-6) that possibly were caused by unstabl e conditions
Software to test the atmospheric stability and acquire the data in a specific format was integrated into the field operations by FSEC and PGampE The format included fields for sit e identification date and time broadband solar radiashytion values atmospheric data spectral solar radiation data and comments In addition an instrument deampcription and configura tion file was stored for each data fil e
The data acquisition software was designed to accept manual ly entered data from sunphot ometers cl oud-cover estimates and Nat i onal Weather Service preshycipitable water vapor measurements However the personnel instruments and measurements were generally not available to enter these data each hour at the measurement sites
The schedule for dat a coll ection was fl exible to accommodate individual site requirements and constraints The goals which were accomplished were to collect data over at l east one year at each sit e t o capture seasonal variashytions and to cover a wide range of atmospheric conditions for each measurement configuration
Measured spec tra and supporting data were sent to SERI on fl oppy disks from PGampE and on magnetic tape from FSEC Daily log sheets that describe the specshytroradiomet er operation and operator comments were included with the data Al l-sky photographs c orresponding to many of the FSEC spectral data sets were provided by the FSEC Fenest ration Energy and Illumination Performance Research Program ( Figure 3-7) Al l-sky photographs were also taken for each of the SERI spec tral data sets ( Figure 3-8) A camera system was installed at PGampE late in the data col l ec tion period but no photographs are available
At SERI the data were processed through an interactive quality-control proshycedure during which the data were visually inspected for obvious probl ems First the inst rument configuration file ( see exampl e in Figure 3-9) was examined against a t emplate from the previous data set to check for any inst rument changes or a change in the mode of opera tion After the operator
l l
middot 400
01+--+----+--+--
U1Ill-25 0Day No 205 1987 (a) 1= 25 Day No 319 1987 (b)Oslash a -E c Nc
N 0 IDistorted direct-normal E CJ bull= m
E 15 Distorted direct-normal spectrum 15 spectrum at 10316 cl
Q)Q) 00 c co c 056 g 105
shy t -
300 500 700 900 1100 300 500 700 900 1100 Wavelength (nm)Oslash Wavelength (nm)
Day No 319 1987 Day No 319 1987 25 1200 (c) (d)Distorted global normal spectrum E ltilc at 10316 E_
N E 800 15 Q) 0 Q) c Direct0 Global tilt c normalco Global6 056 co
horizontal
300 500 700 900 1100 6 8 12 14 16 Wavelength (nm) Time
Figure 3-6 Examples of the very few distorted spectra in the data base (a b c) Broadband solar radiation data (d) corresponding with the spectra in b and c show that irradiance was decreasing at 1031 due to partly cloudy conditions JOIwU11-w
xgt
S5 llifl TR-3 5 1 3A
Figure 3-7 Example Qpound all-sky photographs acquired at FSEC These photog aphs proviGed evidence f rain possible condensation oa optics and ducls
Figure 3-8 Example of all-sky photograph acquired at SERI with a disk blocking sun to show diffuse sky conditions
13
---middot---------middot---------middot---------middot---------middot---------middot---middot --middot---------middot--------middot
TR-3 5 1 3A
t(OK P 11 buy this) Press [Helpl for help
CHN PARAHETER +-------INSTRUHENT----------+ +--CALIBRATION-+ OUTPUT rom NO TYPE HAICER TYPE SERIAL FACTOR- DATE --UNITS NOTES
1 Dir NorR Eppley NIP 17828E6 680 11-187 WRA2 2 Clo NorR EPPLEY PSPH 17863F3 811 11-187 WRA2 3 Glo Horz Eppley PSP 17863f3 811 11-187WfRA2 ltl Glo Tilt EPPLEY PSPT 17863F3 811 1-187 RA2 5 Dir N Si Unused Unused Unused -9900 -1-1-1 WRA2 6 ARb TeRp TAYLOR HGGLASS 00718C LOO 11-187 Deg C 7 Surf Pres OBSERVER ELEVATION RIORDAN -9900 -1-1-1 Hillibar atilde8 Rei HuR DC DIGITAL XXXXXC 100 -1-1 1 Percent 3 9 Wind Spd OBSERVER OBSERVD STOFFEL -9900 -1-1-1 KetersS 3
10 I Albedo Unused Unused Unused -9900 -1-1-1 Percent 11 Phot 380 S TEIC SUNPHOT SPH7624 66300 10-184 Countamp 3 12 Phot 500 SOHOTEIC SUNPHOT SPH7524 77500 10-184 Counts 3 13 Phot 860 SOHOTEIC SUHPHOT SPH7524 45700 10-184 Counts 3 14 Phot 942 SONOTEIC SUNPHOT Unused -9900 -1 1-1 Codnts 1 15 Opq Cloud OBSERVER OBSERVER STOFFEL 100 -1-1-1 Tenths 16 H20 NWS NWS SONDE STAPLETON 100 -1-1-1 CR 17 Spect 11 LICOR LI1800 PRS158 100 9-187 Wsq RlnR 2 18 Spect 12 Unused Unused Unused -9900 -1-1-1 Wsq RnR 19 Glo H Si LICOR SIPYRAN PY1245 811 11-187 WRA2
Figure 3-9 Example of the instrument configuration data -eeorded with the measured data J-middot middot
approved the configura t i on tabl e the template was updated and the informat ion was wri t ten to the data base
Figure 3-10 shows an-exampl e of the comput er terminal output dur ing the cond step o f the qua l i ty-control session
The informa t i on displayed ( see c i rcled nu bers in Figure 3-10) inc luded the foll owing
1` Si te dat e day number standard t ime lati tude l ongi tude and number o f attempts to acquite the spectrum as cont ro l l ed by the atmospher i c stab i l ity monitor
2 Plot o f the spectrum with the mode of operat ion printed bel ow the plot
3` Indicat ion o f stabi l i t y based on the before-scan and after-scan me iureshyment of gl obal-horizontal solar rad iat ion from the iil i con pyranome t er ( although the measurements by thi iiJtrument ciuring the _scaq are actual l y used to test f o r atmospheric stability)
4 Graphic descr i p t i on o f the az imuth and zenith angles of the sun
14
y I
r
ijn 2PR
1100300
II I -
38 50
94
-99
l
IlIllN
lt ltX) Softwa re by M Rymes 0
2 t N AFT BEF a DN 864 863
0 1K SN 852 852 reg A GH 1007 1005 8 SH 984 981 I GN 1089 1088
IL GT 924 920
DN SN GH SH GN GT T Azimuth Zenith reg T 27 c
679 9132 1019 mb V1 RH 73
0 reg ws 4 ms AL 136 Wm2
-99 Co -99 Co
86 -99 Co -99 Co
cc -99 wv
110 mm
300 Di r Norm Glo Norm 1100 FSEC 051387 (Day 133) 1030 2840N 8060W 1 tries G)
terminal output during a quality-control session o--3Figure 3-10 Example of the computer lt1 wV1 wgt
I
TR-3 5 1 3A
5 Bar graph of the before-scan broadband measurements of direct-normal ( thershymopile detec t o r ) DN direct-normal ( silicon detec t or ) SN global-horizontal ( thermopile ) GH gl obal-horizontal ( silicon ) SH gl obal-normal ( thermopi l e ) GN and global-til t ( thermopile ) GT solar radiation The darkened bar graphs show the integral of themiddot spectral middotso lar middotradiation llm))(0 3-11 which is printed under the bar graph Before-scan and after-scan broadband values are printed to the right of the bar graph
6 Listing of the supporting data The first five values are t emperature T pressure PR relative humidity RH wind speed WS and ground-reflected solar radiation AL used for albedo calculations The remaining fie l ds were not used for this data base and were included for future data col lecshytion projects
This quality-control process was performed short ly after the data arrived a t SERI to flag obvious field probl ems The operator could add comments to the data fil e after viewing the information in Figure 3-10 The software also calculated atmospheric descriptors such as Kt and then the data and descripshytors were writ t en to the data base Quantitative qua lity control was applied iu the post-processing of the data base ( described in detail in the appendix )
We chose to include all data in the data base and to be as specific as posshysible about the measurement uncertainty rather than set stringent criteria for excluding data sets This allows users to select data based on their specific application and accuracy requirements or to use portions of the damiddotta sets such as broadband datamiddot or spectral solar radiation segm(nts None of middot
the data should be used without referencing the measurement uncertainty
16
40 CONTENTS OF THE DATA BASE
A t otal of 3 364 spectral data sets ( 16 Mb) are included in the data base
bull 1 4 1 5 Direc t normal
bull 899 Global normal
bull 542 Gl obal horizontal
bull 455 Global tilt
bull 5 3 Dif fuse
I f the data acquisition systems were operating but the atmospheric conditions were too unstable to record a spectrum the broadband and meteorol ogical data were inc luded in the data base but no quality-control processing was applied
FSEC normally operated two spectroradiometers simultaneously one in the direct-normal mode and the other in one of the global modes PGampE operated one spectroradiometer and rotated through the different measurement modes SERI collected direct-normal global-horizontal and dif fuse-horizontal specshytra mostly during cl oudless-sky conditions
Examples of the spec tra are shown in Figures 4-1 through 4-5 Figshyure 4-1 ( a b) shows examples of spectra measured at FSEC in the direct-normal and global modes on a clear day As air mass increases the direct-normal spectra ( a) shift toward longer wavelengths ( the red end o f the spect rum) The global spectra ( b) are slight ly l ess affec ted by the red shift because the radiation scattered out of the direct beam is added back int o the gl obal spectra as diffuse radiation thus returning a portion of the short-wavel engt h ( blue) radiation Figure 4- l ( c) shows the broadband solar radiation corresponding to the spectra
Figure 4-2 shows exampl es of spectra measured under cloudy skies The directshynormal spectra ( a) are almost zero and the global-til t spectra (b ) have low values The graph o f corresponding broadband solar radiation ( c ) shows nearly zero direct normal the global values approach each other becausemiddot all of the irradiance is diffuse under cl oudy skies
Figure 4-3 shows examples of spectra measured on a partly cl oudy day The graph also shows an exampl e of data dropout during data transfer The shape of the spec t ral curve is quite diff erent for low-intensity spec tra measured under cl oud c over ( 10 3 1 air mass 1 88 13 3 1 air mass 1 7 3 ) versus the lowshyintensity spec t rum at higher air mass values ( 1 6 3 1 air mass 5 48 )
Figure 4-4 shows two exampl es of spectra that appear to correspond with sun reflections o f f of clouds which causes a bright spo t [ 1 7 ] and a focusing effect on the solar radiometers The broadband solar radiation values can actually approach or exceed the extraterrestrial value of about 1 3 3 8 on day number 1 3 2 1 3 3 The global solar radiation values approach each o ther while the direct-normal radiation drops indicating that the solar disk is partially blocked by c l ouds
1 7
25 Ec
C1E 1 5
Q)()cctS0 05ctS
Day No 53 1 988 1ico(a) Direct Normal Spectra 0931 to 1 631 ()lt(OJ
00 500 700 900 Wavelength (nm)
EcE
Q)()cctS
0ctS
25
1 5
05
Day No 53 1 988 Global Normal Spectra
931 to 1 631 (b)
300 500 700 900 1 1 00 Wavelength (nm)
1 200 Day No 53 1 988 (c)
cJE
800 Q)()cctS 4000ctS
Global tilt
Global horizontal
0 6 8 1 0 1 2 1 4 1 6 1 8
Time
Figure 4-1 Examples of a) direct-normal and b) global-normal spectra and c) broadband solar radiatio n measured at FSEC o n a clear day
18
0+-+--+-f=t-=F==F==t=P=T==t--+-===+----f
TR-35 13A
- 20 E
Clc E
1 0 Q)()sect 0
300 500
- 20 E
C1c E
1 0 Q)()c laquoS 0laquoS = 00
300 500
1 200
ClE
800 Q)()c -C 400 laquoS
0 6 8
Day No 273 1 987 Direct Normal Spectra
831 to 1 231 (a)
700 Wavelength (nm)
900 1 1 00
Day No 273 1 987 Global Tilt Spectra
831 to 1 231 (b)
700 Wavelength (nm)
900 1 1 00
Day No 273 (c)
middot Global no rmal Global tilt Global horizontal
1 0 1 2 Time
1 4 1 6 1 8
Fi gure 4-2 Examples of (a) direct-normal and (b) global-ti lt spectra and (c) broadband solar radi ation measured at FSEC on a cloudy day
19
I
EcCl
25
E 1 5
Q)()cctl 05
Day No 353 1 986 Global Normal Spectra
Wavelength (nm)
Day No 353 1 986
Fi gure 4-3 radi ati on (lower) measured at FSEC on a partly cloudy day The
-ClE Q)()cctl
1 200
800
400
0
Time
lilobal normal
8 1 0 1 2 1 4
Global horizontal
16 1 8
TR-3 5 1 3A
Examples of global-normal spectra (upper) and broadband solar
spectrum at 1631 shows data dropout duri ng data transfer
Figure 4-5 shows examples o f d i rect-normal gl obal-hor izontal and d i f fuseshyhorizontal spec t ra measured by SERI The di ffuse radi a t i on is most ly concenshytrated in the short-wavelength ( visible) region of the spect rum ( blue sky) The global-ho r i zontal spectrum is equal t o the direct-normal spec t rum mul t i shypl ied by the c osine o f the zenith angle plus the diffuse spec tral radiat i on
The cumula t i ve number o f these spec t ra versus air mass the atmospher i c descriptors Kt Kn DGH and rel at ive humi dity are shown 1n Figshyures 4-6 ( a-f ) The large number of spec t ra at low air mass values is caused by t he opera t i on of the spect roradiometers dur ing normal working hours at midshylat itudes and by the larger air mass values oc curring near sunr ise and sunset whi ch occupy a relat ively smal l frac t i on of the day The large number o f spec tra duri ng relat ively c l ear sky conditi ons i s due t o sdec t i on of clear days for the data taken at SERI the requirement for atmospheric stability during spectral scans and perhaps cl imate types at the three sites Figshyure 4-6 ( c ) shows tha t relat ive humi dity measurements were missing for about 25 global-normal spectra The dif fuse spec tra assoc iated wi th DGH rat i os near 1 0 indi cate very clear condi t i ons where dif fuse measurements are probably within the measurement uncertaint y
20
1200I -
u a
Wmmiddot2)1 I
v+--+--
˜
middot (a) (b) Global normal
(c) Global horizontal (1403
15
InIllDay No 132 19 7 Day No132 1987
Global Normal Spectra 900 to 1 63 0-- 25
clra -Ec bat horizontal Global tilt cJ
N E 800 15 - Q cbull
g 400ctl red - 0 5 ctl I
0 300 500 700 900 11 00 6 8 1 0 12 14 16 18
Wavelength (nm) Time
Day No133 1987 Day No 133 198V
Global normal Global Normal Spectra N 730to 1430 2 5middot Glob tilt
(d) Ec
E 1000
- 500 gctl ctlmiddot- 0 5 -g 1
300 500 700 900 11 00 6 8 1p 12 14 16 18
Wavelength (nm) Time
igure 4-4 Examples pound solar spectra enhanced by cloud bright spots (a) at 1031 on day 132 and (c) at 1230 on day 133 and correspondin [(b) and (d) re pectively] broadband solar radiation J
w111wgt
I
OlDay No 328 1987 0
(a) r1052to 1231 ltt-- 2 5 0
E CDc )E Direct Normal
1 5 Q)C)cro5 05ro
300 500 700 Wavelength (nmr
900 1100
- 25 Ec
E 15
Q)C)cro5 05ro=
Day No 334 1987 1222to 1508
Direct Normal
(b)
300 500 700 900 1100 Wavelength (nm)
Figure 4-5 Examples of direct-normal global-horizontal and diffuseshyhorizontal spectra measured by SERI on two days
Inc luded on the data tape are daily f i eld notes qua l i t y control informa t i on and measuremen t uncertainty Thi s informat i on alert s the user t o problems such as data dropout s ( a s seen in Figure 4-3) and noise in the spectrum (Figshyure 4-7 ) Thi s informa t i on should always be revi ewed when any s pectraL data s e t s are u sed
Phot ographs or s l i de s corre sponding to many of the spectral data s e t s are avai lable at ERI The daily f i eld no t e s that are inc luded wi th the dat a base document the exi s t ence and qual ity of the pho t o s slides
2 2
--------I-
J v l----
r
---
_rV I--
I v
f-
v
I II
I I
___ v -
---- --
I )
-I
v --- --------v f-----
40
TR-3 5 1 3A
LO Direct Normal Spectra vs Air Mass Global Normal Spectra vs Air Mass i40
30ct1E -
lt( 20
1 0 0 400 800 1 200 1 600
40 - -middot 30coE lt( 20
1 0 0 200 400 600 800
ltlil
Number of spectra Number of spectra
Global Horizontal Spectra vs Air Mass Global Tilt Spectra vs Air Mass
40
UJUJco_E -
30 bull
lt( 20
30 coE -
lt( 20
1 0 1 o
Diffuse Spectra vs Air Mass
0 1 00 200 300 400 5000 200 400 600 Number of spectra Number of spectra
40
coE lt(
30
20 bull
1 0 0 1 0 20 30 40
Number of spectra 50
23
I )
v 1-
I--v
( I
)
v --1------I--__
1 I
--l---
If 1
v 1---1-
-_ I---
l u
-----
v I I
----f--e--r-----
I If-
1--- middot
---
100
60
20
Direct Nermal Spectra vs Kn
0 400 800 1200 1600
100
60
0
Direct Normal Spectra vs Kt
400 800 1 200 1600
TR-35 13A
Number of spectra Number of spectra
Figure 4-6 (b) The cumulative number of spectra (horizontal axis) measured over a range of air mass and atmospheric descriptors (vertical axis)
100
60I
20
Direct Norma Spectra vs DirGH
400 soe 1200 160CJ Number of spectra
Direct Normal Spectra vs Rei Hum
6 100
- 60sQ)gt
g 20Q5a 0 400 800 1200 1 600
Number of spectra
c
100
60
20
0
Global Normal Spectra-vs Kn
300 600 900 Number of spectra
Globa Normal Spectm vs DirGHtOO
I 60
20
0 300 600 900 Number of spectra
Global Normal Spectra vs Kt 100
602
20-
0 300 600 900 Number of spectra
Global Normal Spectra vs Rei Hum 100
6E) 60s Q)gt
Q5 20a
a 300 600 900 Number of spectra
Figure 4-6 (c) The cumulative number of spectra (horizontal axis) measured over a range ofmiddot air mass and atmospheric descriptors (vertical axis)
24
f--f--
-I
lJ
1--f-- v
I 1
f--f-
v
1------
1--
( j
---
--
( I
J
1--- -
v
) -----
(
l) __---
v I
1 00
c 60
20
1 00
I 60Q0 20
Global Tilt Spectra vs Kn
0 1 00 200 300 400 500
Global Tilt Spectra vs Kt
Number of spectra
Global Tilt Spectra vs DirGH
Number of spectra
0 1 00 200 300 400 500 Number of spectra
0
1 00
60
20
0 1 00 200 300 400 500
1 00 2-5EE 60 Q)gt-Qi 20a
Global Tilt Spectra vs Rei Hum
1 00 200 300 400 500 Number of spectra
Figure 4-6 (d) The cumulat ive number of spectra (horizontal axis) over a range of air mass and atmospheric descriptors (vertical axis)
Global Horizontal Spectra vs Kn 1 00
c 60
20
0 200 400 600
1 00
60sz
20
Global Horizontal Spectra vs Kt
200 400 600
TR-35 13Amiddot
measured
Number of spectra Number of spectra
Global Horizontal Spectra vs Global Horizontal Spectra vs DirGH Relative Humidity
0
1 00
I 60G
20
0 200 400 600 Number of spectra
0
2-1 00 5EE 60 Q)gt
Qi 20 a
middot
200 400 600 Number of spectra
Figure 4-6 (e) The cumulative number of spectra (horiz ontal axis) measured over a range of a1 r mas s and atmospheric descriptors (vertical axis )
2 5
v-L-
1-----lr--f-
_ v
I
_J7 r
----
v -
_ 1----
___ ---f--
II (
I
r r-[--
r
v---
- 25
1 5
Diffuse Spectra vs Kn 80
70
c 60
50
0 1 0 20 30 40 50
TR-35 13A
Diffuse Spectra vs Kt 85
2 65
75
1 0 20 30 40 50
Number of spectra Number of spectra
Diffuse Spectra vs DirGH Diffuse Spectra vs Relative Humidity
0 1 0 20 30 40 50 0 1 0 20 30 40 50 Number of spectra_ Number of spectra
95 middotE 50
75 Qi 1 0
70
5J
c 30
secta -
Fi gure 4-6 f ) The cumulati ve number of spectra hori zontal axis) measured over a range of air mass and atmospheri c descri ptors verti cal axis)
1 05
r 85
EclE
Clluc m =g
300 500 700 900 1 1 00
05
Day No 2 1 6 1 987 Global Normal Spectra
730 to 1 5 30
Wavelength (nm)
Fi gure 4-7 Exampl es of spectra showi ng noisy data i n the ultravi olet 300shy400 nm) and near-inf rared 1000-1 100 nm) regions
26
5 0 MEASUREMENT UNCERTAINTY
( No t e Thi s s ec t ion contains only a brief summary o f the total uncertainty The deta i l ed reports [ 1 5 1 6 ] on the methods used to e s t imate tota l spect ra l measurement uncertainty should he consul ted- when using thi s datamiddot middot ba se )
The data set de scribed in thi s document i s the bes t set of measurement s posshys ible wi th the personnel equipment methods and cal i brat i on procedure s avai l able t o us We found that making continuous measurements wi th complex s ens i t ive equipment and account ing for all source s o f error in order to specify total mea surement uncertainty were not triviaL tasmiddotkamp oo
The e s t imat ed total uncertainty ( 95 confidence int erval ) for each of the spec troradi ometers and each of the measurement modes is shown in Figure 5-l The upper and l ower spec tral uncertainty limi t s are symmetrical except when gl obal-t i l t or gl obal-hori zontal s pectra were measured us ing the integrat ing sphere and when a s t rong direct-beam component wa s present ( Kt gt 6 0 ) We added an 8 maximum bias to the l ower uncertainty l imi t s for these cases based on resul t s o f experimen t s in whi ch we mapped the integrat ing sphere res ponse under bri ght sun wi th the image o f the sun in di f ferent locations on the ins ide of the sphere During the se exper iment s we observed variat i on s o f up to -8 compared t o the calibrat i on point
The high uncertainty in the abso lute value o f the spectral measurement s l e s s than 0 45 m wa s caused by l ow s pectra l irradiance for the calibrat i on l amp s which resul ted in a l ow s i gnal-t o-no i s e rat io for the spec troradiorriet er cal i shybrat ions ( F igure 5-2) In add i t ion we experienced a change ( i e l o s s o f respon s e ) i n the ultraviolet ( UV ) re sponse of the instruments when us ing the integrating sphere s
To tal uncert ainty i s a combinat i on o f an e s t imated total spectral bias error and to tal spec tral random error The f inal est imated total uncertainty for a 95 conf idence interval i s calculated as the
random (R) error root- sum-s quare of the bias ( B)
erro r plus two t ime s the
To eva luate instrument-to-instrument d i f ferences or variabi l i ty ( al s o called between-inst rument prec i s i on ) s imul t aneous spectral solar radiat i on s c an s were made wi th each ins t rument in each conf igurat i on The s tandard devi a t i on of the se mea surement s mul t i plied by three was converted to a percentage o f the mean Thi s percent age ind icates the expected instrument-to-instrument varibi l i t y or prec i s i on for thi s set of instrumen t s Fi gure S-3 shows the resul t s obtained for one o f these compari sons us ing the integrat ing s phere s Simi lar resul t s oc cur wi th the other conf igurations The between-inst rument prec i s i on above 0 4 m i s close to 5
Temperature control o f the spe ro adiorrieters with s i l icon detectors wa s import ant Figure 5-4 shows the change in the res pori se o f the instrumen t s espec i a l ly in the near- infrared when o perated at d i fferent control temperashyture s Uncertainty of l deg C in the set point resul t s in about a 2 uncertainty in the near-inf rared measurement s On ho t days we found that the t emperat ure
2 7
(
-Lower
r --
I IV
limityen(-)
-
A u1pp r li it +) f I II I
y 1 I rl ( I _ L
-
-
I I )
f--+- -+--+--1-+---+--1- r--J- Upper -c- A I u o t-iE $ == $= =$S y I I I I t (
1 --( -
----L---------------------- -_j_j_J__J__J__J
TR-35 1 3A
20
c(ij 0tQ)ucJ -20
Global (Sphere) 1 02 1 58 1 74
limit (-) Kt lt 60 Upper limit ( +)
Lower Kt gt 60
(a)
20
c(ij 0t
5 -20 L t )ower 1m1 -
300 500 700 900 1 1 00
Wavelength (nm)
Global Normal (Domes) 1 74 2 1 8 (b)
300 500 700 900 1 1 00 Wavelength (nm)
Direct Normal 1 58 1 72 1 74 (c) 20
limit ( +)gt- iQl u Lower 1m1 -) 5 -20
300 500 700 900 1 1 00 Wavelength (nm)
Figure 5-l Estimated total spectral measurement uncertainty f or global measurements with the i ntegrating spheres on (a) units number 102 158 and 174 (b) global-normal measurements with the Teflon dome receivers on units 174 and 218 and (c) directshynormal measurements with the view-limiting tubes on units 158 172 and 174 The measurement uncertainty is synmetrical except in (a) where a -8 bias is included in the lower limit f or global-horizontal and global-tilt cases due to nonunif orm sphere response when a str ong direct-beam component is present
28
I I
0
0 (J) ()
- 1 0
t U
TR 35l3A
Wavelength (nm)
Figure S-2 Comparison of the spectral intensity of an out door global-normal measurement and the NIST calibrationmiddotmiddot lamp source L ow lamp values below 400 nm result in high measurement uncertainty
20
1 5
R 1 0
X 5Q)0c c 0
-5 Q)_0
300 400 500 600 700 800 900 1 000 1 1 00 Wavelength (nm)
Figure S-3 Between-ins trument precis ion for glo bal-normal spectral solar radiation measurements us ing the integrating spheres
29
5 1 deg C N
ij0
()00- caQ)uc
1 000 Q)-Q) 8 0950 0ca
c 0900
0 300 500 700 900 1 1 00
Wavelength (nm)
Figure 5-4 Ratio of the spectroradiometer detector response at different temperatures to the response at 40deg C
o f the detectors ( contro l l er s ) somet imes exceeded the set point and we experienced runaway temperatures Thi s resul ted in ampl i f i er mi l l ivolt drift errors and no i s e in s ome o f the s pectra We achieved better t emperature conshytrol by shield ing the spectroradiometers with Mylar sheet s supported by foam offsets to allow air flow
Mea surement uncertainty for the broadband and meteorological data i s based on the cal ibration hi s tories provided by the mea surement s i t e s and charact ershyi s t i cs of the instrument s Thi s information is given in Tables 5-l through 5-3 and the values are included on the data-ba se tape
In these table s the measurement uncertainty for a 95 confi dence int erval was e s t imated by root-sum-s quaring the est imated bias errors a d by doubl ing the random errors in the cal i brat i on proce s s and measurement s [ 15 1 6 ] Radishyometers used at PGampE in 1987 were po st-cal i brated at SERI allowing e s t imate s of the random calibrat i on error component the radi ometers used i n 1988 were cal ibrated elsewhere so nominal e s t imated errors were used in the uncertainty analys i s Ins t rument s used at SERI were pre- and po st-cal ibrated at SERI Instrument s used at FSEC were cal i brated by FSEC and nominal values for random and bias errors for the s e types of radiometers were used in the uncershytainty analys i s Cal i brat i on informat ion for the meteorological instrument s i s included i n these tables but no mea surement uncertainty analys i s was performed
30
H 11 VI _ w
Jgt
--
IllIll
Tabl e 5- l FSEC Instrument Calibrat ion Hi story Ul d Estimated Meas urement Uncert ainty N-
Es timated Beg i nn ing Calibrat ion Measurement
Channe l iF Meas urement Instrument Comment s Time Stamp Date Uncertainty
( )
1 Direct normal 862961507 Eppley NIP 14306 E6 5-86 ( thermopi l e ) 863520931 Epp l ey NIP 23943E6 12-86 plusmn2 9
8801 2093 1 Eppl ey NIP 23943E6 12-87 1 32 change
2 Global normal 862961507 Eppl ey PSP 24185F3 Eppley PSP 24185F3 1 1-86 1 6 7 change plusmn3 8
872881032 Eppley PSP 18273F3 4-87 880120931 Eppley PSP 24185F3 1 2-87
3 Globa l hori zontal 862961507 Eppl ey PSP 1 43 2 1 F3 4-86 ( thermopi l e ) 8709 3 1 6 3 1 Eppl ey P S P 14322F3 1 2-87 -- plusmn3 8
w _ 872881032 Eppley PSP 143 18F3 4-87
4 G lobal t i l t 86329103 1 872881032
Eppley PSP 24183F3 Eppley PSP l4320F3
1 1-86 4-87 -- plusmn3 8
880120931 Eppley PSP 24183F3 1 2-87
5 D irec t normal 8629 6 1 507 Mat r ix NIP3826 9-86 ( si l i con) 88012093 1 Matrix NIP3826 12-87 1 32 change plusmn2 9
6 Temperature 862961507 Weathermeasure 1 7 7
1420A 6-86 3-87 8-88
smal l changes the cal ibratiqft factor was changed i software
7 Pressure 86296 1507 Weathermeasure 1 70 5 1-86 smal l c anges the 1 7 8 5-87 cal ibra t i on factor was
Hmiddot 6-88 changed i n software
8 Relat ive humi dity 8629 6 1 5 0 7 Weathermeasure 1 54 0 6-86 Cal culated from dew 175 point compared every
o ther week wi th another instrument
9 Wind speed 862961507 Weathermeasure 1 222 7-86 smal l chlnges the 1219 3-87 cal ibrat i o fac tor was ---
6-88 changed in software
J
-
Ill _-
bull I
Table 5-l FSEC Instrument Calibrat ion Hi stb y and Estimated Measurement Uncertainty (Concluded)
Channel Measurement Beginning Time Stamp ihsttument Cal ibrat ion
Date Comment s
Estimated Measurement Uncertainty
( )
INN
10 Albedo 86329103 1
87288103 2
Eppley PSP 1629 FJ Eppley PSP l 106Srl
1 1-86
4-87
-- plusmn3 8
19 Global hori zontal
( si l i con)
862961507
87 148143 1
LI-COR Py PY22J6 LI-COR yt PY2279
7-86
5-87
plusmn3 8 --
Mo wV11-wgt
I
--
p V1 1-
--
--
--
UlIllN-
Tabl e 5-2 PGampE Ins trument Calibrat ion Hi s ory and Estimated Measurement Uncertainty 1 _
Estimated Beginning Pre- Po st-Channe l if Measurement Instrument Comment s Mea surement
Time S tamp Cal ibra t i on Cal ibrati on Uncertainty ( )
l D irec t normal 87 1 100632 Eppl ey NIP 255 08E6 1-86 8-88 0 3 change plusmn2 8 ( thermopi l e ) 880190 752 Eppl ey NIP 255 10E6 12-8 7 -- plusmn3 6
2 G lobal normal 87 1 100632 Eppl ey PSP 2 32 02F3 1-86 8-88 1 7 change plusmn2 4 880190 7 5 2 Epp l ey PSP 23996F3 12-87 -- -- plusmn4 7
3 G lobal hori zontal 8 7 1 1 00632 Eppley PSP 23995E3 10-84 8-88 3 2 change plusmn2 8 w w
( thermopi l e ) 880190 752 Eppl ey PSP 25390F3 12-8 7 plusmn4 7
4 G lobal t i lt 8 7 1 1 00632 Epp l ey PSP 25387F3 12-84 8-88 0 2 change plusmn3 8 -- plusmn4 7 880190 752 Eppley PSP 23201F3 12-87
5 D irec t normal 8 7 1 100632 Matrix NIP 38Hi 5-86 7-88 2 7 change plusmn2 2 ( si li con)
6 Temperature 8 7 1 1 00632 Omega T-coupl e
7 Pres s ure 8 7 1 1 00632 Yel l ow Springs 2014-22 3 1 -HA- 1-WH 15593 3-84
8 Relat ive humi dity 87 1 100632 Hygr o 14276 2-85
9 Wind speed 8 7 1 1 00632 8804007 3 7
Weathert ronics Weathertron i c s
2301 230 1
184 184
9-82 2-88
10
19
Albedo 8 7 1 1 00632 Eppl ey PSP 2 1235F3
Globa l hori zont al 87 1 100632 LI-COR Pyr PY5558 ( s i l i con)
Beginning about 8 7 2 1 1 the s i l i con NI P va lues appear cons i s tent ly l ow
-- 8-88 2 4 change
1 1-83 8-88 1 9 change
may be an al ignment problem
plusmn2 6
plusmn2 6
gt-3 Iw
wgt
-- --
--
-- --
1ftIll -
Table 5-3 SERI Instrument Calibration Hi story and Estimated Measurement Uncertainty =
Estimated Beginning Pre- Post-Channel I Measurement Instrument Comment s Measurement Time S tamp Cal ibration Cal ibration Uncertainty ( )
1 Direct normal 87328 Eppley NIP 1 7828E6 11-87 2-88 1 5 7 change plusmn3 3 ( thermopil e )
2 Global normal None
3 bull Global horizontal 87328 Eppley PSP 1 78 63F3 1 1-87 2-88 2 22 change plusmn3 7 ( thermo pi l e ) a t Welby
w+- At SRRL 8805 7 Eppley PSP 200 79F3 7-87 8-88 0 7 3 change plusmn2 3
4 Global t i l t None
5 Direct normal None ( si li con)
6 Temperature 87328 Taylor Pocket 21430-1 10-86 (Due 10-9 1 )
7 Pressure Cal culated from elevat ion
plusmn0 2 (deg )
8 Relat ive humidity 87328 Dickson 86 100-1 9-87 10-88 -- plusmn2 ( counts )
9 Wind speed Observat ion
10 Albedo -- None
1 1-14 -- Sun photometer ( relative compari sons only)
15 Cloud c over Observed o-3-- lXlIw Global Ho rizontal -- LI-COR Pyr PY1245 11-87 2-88 3 67 change plusmn2 9 V119 ( si l icon) ( s tabi l i ty monitor only) wgt
TR-35 13A
We urge users of the data ba se to refer to the dai l y f i eld no tes for s pe c i a l c i rcumstances recorded b y the operator that may affect data uncertainty The s e no tes include references to the spectroradiometer t emperature c onshyt ro l l e r solar-tracking accuracy and weather cond i t i ons ( such as rain ) Included in the dai l y notes on tbe data-base tape are obs ervat i ons made in qual i t y-control processing as wel l as references to the exi s t ence and qual i t y o f pho t ographs or s l ides
Quant i tat ive pos t-proces s ing qual i ty-control informat i on i s al s o inc luded on t he data-bas e tape and a complete descript ion is given in the appendix o f thi s report Redundant measurement s ( such as before- smiddotcan andmiddot middot aft et-smiddotcan
broadband solar radiat i on direct-norma l and global-hor izont al mea surement s with both thermopile and s i l i con detectors ) and compar i s ons o f integrat ed s pectral so lar radiat ion wi th broadband s o lar radiat i on were used in the qual i ty-control procedure s Users are encouraged to perform the i r own qual i t y-cont rol proce s s ing on the data t o meet their par t i cular requiremen t s
3 5
6 0 FORMAT OF THE DATA TAPE
The meas ured dat a f i eld notes quali ty-control informa t i on and mea surement uncertainty are s t ored on magne t i c tape in 80-character l ines wi th the fi leshyname s given in Table 6- 1 The f i l enaming convent ion used for the mea sured data was
Filename Content
FLA8705 DAT FSEC data 1987 May PGE880 l DAT PGampE data 1988 January SER8 7 1 1 DAT SERI data 1987 November
Data were not acqui red in a l l months so the months may not be cont iguous
Qua l i t y-control informa t i on has the same f i l enaming conven t i on with QC extens ion ( for example FLA8 705 QC ) Dai ly notes are contained in the f i l e s FSEC NOTES PGE NOTES and SERI NOTES respec t i vely The mea surement uncershytainty is in the UNCERT f i l e s
c The DAT f i l e s contain two types of informa t i on D for data and for inst rument configurat ion The f i r s t l ine of a data or confi guration segment beg ins wi th a D or a c re spect ively in the f i r s t column followed by the s i t e year day and t ime stamp the number of l ines in the segment i s in column-s 76-80 so that the user can eas i ly skip the de s i red number of l ine s An example of the information in the conf iguration or 1 1C segment i s
c shown in Figure 6-1 I t begins wi th a followed b y the s i t e FSEC year 11 1 98 7 day 122 and t i me u0830 latitude longi tude and eleva t i on There are 19 channel s for mea surement s zero s pectra in the C segment and 40 l ine s in the segment The con f i gurat ion informa t i on appear s whenever the inst rument set-up or cal ibrat ion wa s changed or t he data acqui s i t ion sys t em wa s res tarted I f the configurat i on wa s not changed at the beginning of the month the configura t i on segment wi l l be in the previous mont h s DAT f i l e
An examp le of a D segment i s shown in Figure 6-2 Thi s segment contains the mea s ured me teoro logical dat a broadband and spectral solar rad i a t i on dat a and anc i l l ary data The data contained in each l ine and column and i t s format are as follows
POS ITION OF VARIABLES IN THE D SEGMENTS (ALL LINES ARE 80 CHARACTERS )
Line Column Cont ent s Format
a = character 1 = integer f = f l oat ing point
LINE 1 1 1 D ( for data ) ( a l ) 3 1 5 Site Year Day Number Time Stamp ( a 1 3 )
3 6 F SEC PGampE o r SERI ( a4 ) 7 8 Year (a2 or i 2 ) 9 1 1 Day Number ( a3 o r i 3 ) 1 2 15 Standard Time ( a4 o r i4 )
36
5-111 - il ll
Da i ly
Uncertainty
-
TR-35 13A -
Table 6 1 Namesmiddot of Files on the Data Tape
Measured and
FSEC
FLA8610 DAT FLA8 6 1 0 QC
FLAB 6 1 1 bull DAT FLA8 6 l l QC
FLA86 1 2 DAT FLA8 6 1 2 QC
FLA8 7 0 1 DAT FLA8 70 l QC
FLA8 704 DAT FLA8 704 QC
FLA8 705 DAT FLA8 7 05 QC
PGampE
PGE8 704 DAT PGE8 704 QC
PGE8 705 DAT PGE8 705 QC
PGE8 706 DAT PGE8 7 06 QC
PGE8 7 0 7- DAT PGE8 7 0 7 QC
SERI
SER87 l l DAT SER8 7 l l QC
S ER8 7 1 2 DAT SER8 7 1 2 QC
SER880 1 DAT SER880l QC
SER8802 DAT SER8802 QC
Ca lcui a t ed Data
FLA8 706 DAT FLA8 706 QA
FLA8 7 0 7 DAT FLA8 7 0 7 QC
FLA8 7 0 8 DAT FLA8 7 0 8 QC
FLA8 709 DAT FLA8 7 09 QC
FLA8 7 1 0 DAT FLA8 7 1 0 QC
FLA8 7 l l DAT FLA8 7 l l QC
PGE8 708 DAT middot
PGE8 708 QC
PGE8 7 0 9 DAT PGE8 709 QC
PGE8 7 l l DAT PGE8 7 l l QC
No t e s
FSEC NOTES PGampE NOTES SERI NOTES
Mea s urement
FSEC UNCERT PGamp E UNCERT SERI UNCERT
FLA8 7 1 2 DAT FLA8 7 1 2 QC
FLA880l DAT FLA880l QC
FLA8 802 DAT FLA8802 QC
FLA8803 DAT FLA8803 QC _
FLA8804 DAT FLA8804 QC
PGE_880l DAT PGE880l QC
PGE8802 DAT PGE8802 QC
PGE8803 DAT PGE8803 QC
3 7 _middot
1 3
1 7
55 1 1-1 TR-3 5 1 3A
0 G) 0 G)G) iC FSEC8 7 1 2 2 0 8 1 3 2 8 4 0 0 0N 80 6 0 0 0W 2M C = 8 7 1 2 2 0 8 1 3 8 7 1 2 2 0 8 1 3+0 0 0 0 0 0 1 9 0 4 0
CHN PARAMETER +- - - - - - - INSTRUMENT- - - - - - - - - -+ +- -CALIBRATION- + OUTPUT FOOT NO TYPE MAKER TYPE SERIAL FACTOR DATE UNITS NOTES
1 Di r- Nor-m Eppley NIP 2 3 9 4 3E6 6 08 1 2 - 186 Wm2 2 Glo Nor-m Eppley PSP 2 4 1 85F3 8 85 l l - 186 Wm2 3 G l o Hor-z Eppl ey PSP l 4 3 2 2F3 6 3 8 1 2 - 2 86 Wm 2 4 Glo Tilt Eppley PSP 2 4 1 83F3 8 9 9 l l - 186 Wm2 iacute5 Dir- N S i MATRIX SI NIP 3826 31 8 0 9 - 186 Wm2 6 Amb Temp WTHRMEAS PRT 1 7 7 l 0 0 3 - 1 8 7 Deq c 7 Sur-f Pr-es WTHRMEAS PIEZO 1 7 8 l 0 0 5 - 1 8 7 Mi l l ibar-8 Re1 Hum WTHRMEAS LiCl 1 7 5 l 0 0 6 - 1 86 Per-cent 9 Wind Spd WTHRMEAS OPT CHOP 1 2 1 9 l 0 0 3 - 1 8 7 Met e r- s i S
1 0 Albedo Epp ley PSP l 6 2 9 7F3 1 0 0 9 l l - 1 8 6 Per-cent l l hot 380 Unused Unused Unused - 9 9 0 0 - 1 - l - 1 Counts iacute1 2 hot 5 0 0 Unused Unused Unused - 9 9 0 0 - 1 - l - l Count s
14 hot 860 Unused Unused Unused - 9 9 0 0 - 1 - 1 - 1 Counts hot 942 Unused Unused Unused - 9 9 0 0 - 1 - l - l Counts
1 5 Opq C loud Unused Unused Unused - 9 9 0 0 - 1 - l - l Tenths 1 6 H2 0 NWS Unused Unused Unused - 9 9 0 0 - 1 - l - l em
Spect l LI -COR L I - 1 8 0 0 PRS - 1 7 2 l 0 0 2 - 1 8 7 W sq m nm l Spect 2 L I - COR L I - 1 800 PRS - 1 0 2 1 0 0 2 - 1 8 71 8 W sq m nm l
1 9 Glo H Si LI -COR L I - 2 0 0S PY2 276 8 4 5 7 - 1 86 Wm2 2 - 1 FIN
FOOTNOTES
1 - 1 7 = DN 18 = GT 2 - SERI l oan un i t
- 1 - FIN
Figure 6-1 Example of the instrument configuration data on the data base tape The numbers refer tmiddotO
1 c indicating configuration 2 FSEC 1987 Day 122 at 8 13 standard time 3 Latitude 4 Longitude 5 Ele vation 6 Reference to configuration file that will be f ound in the
data files 7 Starting data-acquisition time plus number of attempts to
acquire spectra (which would extend the data acquisition time)
8 Number of data channels 9 Number of spectra ( 0 f or configuration files 1 or 2 f or
data files) 10 Number of lines in this segment
38
TR35 1 3A
D FSEC8 7 1 2 2 0 8 1 3 2 8 4 0 0 0N 8 0 6 00 0W 2M C=871 2 2 0 8 1 3 8 7 1 220 814+0 0 0 1 0 0 1 9 2 1 0 0 gS e e Q N FSEC8 7 1 2 2 U PRS - 1 7 2 Col 2 ( + - ) U PRS - 1 0 2 Col 2 ( - ) Col 4 ( + ) 1 7 84 5 5 7 54 5 2 9 3 0 2 - 1 - 9 9 0 3 48 0 1 1 9 48 3 3 4 4 2 7 9 - 1 -9 9 0 1 7 85 0 5 7 5 5 7 2 9 3 0 4 - 1 - 9 9 0 3 4 8 1 1 1 9 4 85 3 4 43 0 1 - 1 - 9 9 0 2 8 4 1 80 0
1 0 9 5 4 1 5 - 99 0 7 1 0 1 7 8 6 2 0 7 8 7 5 8 9 1 5 - 1 - 9 9 0 - 1 - 9 9 0 iacute1 1 3 80 0 - 99 0 Co 1 2 5 0 0 0 - 99 0 Co 1 3 860 0 - 99 0 Co 1 4 942 0 - 9 9 0 Co iacute
- 1 6 0 7 1 5 8 5 7 8 5 6 7 1 58 3 86 9 1 9 9 1 8 7 - 9 0 0 - 9 0 0 - 9 0 0 - 9 0 0 - 9 0 - 9 0 3 1 1 7 4 0 1 3 0 0 1 1 0 0 2 0 57 9 8 9 4 0 0 DNT1 8 4 0 1 3 0 0 1 1 0 0 2 0 2 8 4 1 8 0 0 6 2 4 GTS - 1 0 0 0 0 0 0 0 0 0 0 0 - 1 0 0 0 o o 0 0 0 0 o o
1 3 0 0 0 0 0 0 0 0 3 5 0 0 0 4 0 0 2 1 0 02 5 0 0 14 0 04 1 0 02 1 0 0 5 7 0 0 3 8 amp 1 3 2 0 0 0 7 2 0 056 0 1 0 1 0 0 8 1 0 1 1 8 0 1 2 1 0 1 1 9 0 140 0 138 0 1 3 1 amp 1 340 0 1 4 9 0 16 1 0 162 0 1 5 5 0 16 0 0 1 6 3 0 1 8 5 0 1 9 5 0 1 9 8 0 1 9 9 amp 1 360 0 2 0 9 0 2 1 9 0 228 0 2 4 3 0 258 0 26 5 0 258 0 265 0 268 0 2 89 amp 1 380 0 2 8 0 0 2 7 9 0 26 7 0 2 7 3 0 3 0 1 0 3 08 0 3 1 7 0 326 0 349 0 4 0 2 amp 1 4 0 0 0 4 7 6 0 52 7 0 55 7 0 569 0 580 0 5 9 5 0 6 12 0 63 0 0 64 1 0 648 amp 1 4 2 0 0 652 0 6 54 0 6 58 0 649 0 6 36 0 6 3 2 0 646 0 67 8 0 7 1 8 0 746 amp 1 440 0 7 6 8 0 7 9 9 0 82 2 0 854 0 8 7 7 0 9 0 4 0 9 1 5 0 92 2 0 934 0 94 2 amp 1 460 0 9 6 0 0 964 0 9 7 0 0 9 7 3 0 96 9 0 9 74 0 9 9 0 0 9 9 9 1 0 1 7 1 028 amp 1 4 8 0 1 0 3 3 1 0 25 1 0 0 6 0 9 9 1 0 9 9 0 1 0 1 0 1 026 1 0 3 8 1 043 1 0 4 7 amp 1 500 1 0 3 8 1 034 1 038 1 0 5 1 1 0 58 1 058 1 0 5 1 1 0 3 5 1 0 1 7 1 0 0 7 amp 1 520 1 0 2 0 1 04 1 1 0 5 7 1 063 1 068 1 0 8 1 1 088 1 0 9 3 1 0 9 3 1 0 9 1 amp 1 540 1 0 8 9 1 0 84 1 088 1 0 9 5 1 0 9 7 1 0 9 5 1 0 9 8 1 1 0 2 1 094 1 0 8 7 amp 1 560 1 0 7 8 1 0 7 9 1 08 1 1 0 7 7 1 0 7 2 1 0 7 1 1 0 7 6 1 0 7 8 1 0 7 8 1 0 82 amp 1 580 1 0 9 0 1 0 9 8 1 1 0 1 1 088 1 0 7 4 1 062 1 06 1 1 06 7 1 0 7 4 1 0 80 amp 1 6 0 0 1 082 1 085 1 08 8 1 0 9 2 1 0 9 3 1 0 89 1 083 1 0 7 8 1 0 78 1 0 7 9 amp 1 620 1 0 8 2 1 083 1 0 7 6 1 065 1 0 5 9 1 056 1 06 1 1 0 7 3 1 0 8 0 1 085 amp 1 640 1 0 86 1 084 1 08 1 1 0 7 6 1 067 1 062 1 0 5 2 1 04 2 1 038 1 048 amp 1 660 1 0 7 0 1 086 1 0 9 4 1 0 9 7 1 0 96 1 096 1 09 2 1 0 9 3 1 0 9 1 1 0 89 amp 1 680 1 0 7 9 1 064 1 02 8 0 9 8 0 0 94 3 0 9 3 7 0 954 0 98 0 0 9 9 6 1 0 0 5 amp 1 7 0 0 1 0 0 8 1 0 0 9 1 0 1 3 1 0 1 9 1 0 2 5 1 0 2 2 1 0 0 3 0 9 7 3 0 924 0 8 74 amp 1 7 2 0 0 846 0 842 0 84 8 0 84 9 0 8 54 0 8 7 8 0 9 0 3 0 9 3 1 0 9 52 0 965 amp 1 740 0 9 6 9 0 9 7 7 0 98 3 0 989 0 988 0 9 8 2 0 9 7 6 0 95 0 0 8 81 0 7 6 7 amp 1 760 0 6 1 6 0 5 24 0 54 0 0 646 0 7 7 9 0 8 76 0 924 0 94 5 0 94 7 0 9 45 amp 1 7 8 0 0 94 2 0 94 2 0 9 3 7 0 9 2 6 0 9 1 6 0 9 0 7 0 89 9 0 894 0 8 9 1 0 89 0 amp 1 800 0 888 0 883 0 8 7 9 0 87 5 0 863 0 836 0 8 0 1 0 7 5 7 0 7 2 2 0 7 1 0 amp 1 820 0 7 1 0 0 7 1 9 0 7 3 3 0 74 1 0 7 4 9 0 7 5 7 0 76 3 0 7 7 7 0 7 9 7 0 8 1 0 amp 1 840 0 82 0 0 82 8 0 82 7 0 82 2 0 8 1 5 0 7 9 7 0 786 0 7 83 0 7 8 8 0 7 9 7 amp 1 860 0 80 4 0 8 0 0 0 7 8 8 0 7 8 0 0 7 7 5 0 7 8 0 0 7 8 7 0 786 0 785 0 7 81 amp 1 880 0 7 7 5 0 7 7 4 0 7 7 2 0 767 0 763 0 7 4 7 0 72 1 0 68 2 0 6 30 0 5 88 amp 1 9 0 0 0 57 1 0 5 7 3 0 58 9 0 584 0 568 0 549 0 53 4 0 53 3 0 5 38 0 5 56 amp 1 9 2 0 0 5 7 3 0 57 9 0 56 7 0 526 0 448 0 362 0 2 7 2 0 2 18 0 2 1 0 0 2 32 amp 1 940 0 254 0 262 0 2 5 7 0 253 0 25 7 0 266 0 2 7 5 0 2 85 0 29 9 0 3 1 7 amp 1 960 0 3 33 0 362 0 3 9 6 0 4 3 5 0 4 7 9 0 5 06 0 5 1 5 0 5 1 2 0 5 08 0 5 2 1 amp 1 9 8 0 0 53 7 0 560 0 5 84 0 5 9 7 0 6 0 9 0 6 1 7 0 6 1 8 0 6 2 3 0 62 1 0 6 1 9 amp 1 1 0 0 0 0 6 1 8 0 6 0 7 0 6 0 5 0 6 0 2 0 60 1 0 60 5 0 6 04 0 604 0 604 0 6 0 1 amp 1 1 0 2 0 0 60 1 0 59 5 0 5 9 5 0 5 93 0 589 0 59 0 0 584 0 5 82 0 580 0 5 75 amp 1 1 0 4 0 0 5 7 6 0 5 7 1 0 57 1 0 56 7 0 56 0 0 56 0 0 558 0 552 0 545 0 54 0 amp 1 1 0 6 0 0 5 36 0 53 2 0 5 2 9 0 5 2 5 0 5 1 9 0 5 1 5 0 5 1 2 0 51 1 0 50 9 0 5 08 amp 1 1 0 8 0 0 50 6 0 502 0 4 9 2 0 48 3 0 48 3 0 483 0 46 9 middot 0 4 5 2 0 447 0 3 1 amp 1 1 1 0 0 0 4 1 1 - 9 9 0 0 0 - 9 9 0 0 0 - 9 9 0 0 0 - 9 9 0 0 0 - 9 9 0 0 0 - 9 9 0 0 0 - 9 9 00 0 - 1 582 3 2 2 3 0 0 0 0 0 6 0 0 0 1 0 0 0 4 0 0 1 3 0 0 1 9 0 0 2 3 0 04 1 0 0 5 5 0 064 0 088 amp 2 3 2 0 0 1 0 5 0 1 3 9 0 1 7 9 0 1 8 9 0 2 2 4 0 2 38 0 26 2 0 252 0 261 0 2 64 amp 2 340 0 2 8 7 0 2 9 2 0 266 0 2 88 0 2 98 0 286 0 3 0 0 0 3 0 0 0 2 9 1 0 2 85 amp 2 360 0 296 0 3 1 0 0 3 36 0 367 0 3 9 0 0 3 7 2 0 3 56 0 356 0 3 7 3 0 3 88 amp
Figur e 6-2 Examples of the data on the data-base tape
3 9
TR-3 5 1 3A
16 2 3 24 24 2S 3 3 34 34 3S 3 9 40 40 4 1 S 2 S4 69
54 62
6 3 6 3
6 7 6 7
7 0 7 3
74 7 S
7 6 80
LINE 2
LINE 3
1 3 4 10
1 1 1 3 14 20 2 1 23 24 30 3 1 40 4 1 43 44 SO 5 1 5 3 54 60
Lat i tude ( deg ) N ( north) Longi t ude ( deg ) W ( we s t ) `Elevat i on (m) M (m) Reference t o Conf i guration Segment Start ing year day t ime for the spectral `scan s ) i f any and number of attempt s t o `acquire the s can ( which ind i cates po s s ible `t ime delay from the s tart ing t ime ) middot
Year Day Number Time
11+11 for plus number of attempt s to acquire a s pect rum
Number o f attempt s t o acquire a s pectrum
Po s s ible Number o f Measurement s ( 1 9 )
Number o f Spec tra i n thi s Segment ( 0 1 or 2 )
Number o f Lines in Segment
Pointer to the qua l i ty-cont rol dai ly f i e ld note s and measurement uncertainty informa t ion Qua l i ty-control informa t i on is in the QC f i l e of the same month wi th the same s i t e year day and t ime s t amp Dai l y field notes are i n the NOTES f i l e f o r the same s i t e wi th the same s i t e year and day s tamp Mea surement uncertainty i s in the f i l e s UNCERT under t h e instrument serial number ident i f i ed by PRS-xxx and the column s in the uncertainty f i le s for + and - uncertainty l imi t s
Broadband mea surement s before the spectral scan
Channel fH Direct Normal ( thermopi l e ) (Wm2 ) Channel ffoS Direct Normal ( s i l i con) (Wm2 ) Channel tn Global Normal ( Wm2 ) Channel not used Charinel ffo3 Globa l Hori zontal ( thermop i l e ) ( Wm2 ) Channel fH 9 Gl obal Horizontal ( s i l icon ) ( Wm2 )
( f 8 4 ) ( a 1 ) ( f 9 4 ) ( a l ) ( i S ) ( a l ) ( a l 2 )
( a9 o r i 9 )
( a 1 )
( i 1 )
( i4 )
( i 2 )
( i S )
( a8 0 )
( i 3 ) ( pound 7 2 ) ( i 3 ) ( pound 7 2 ) ( i 3 ) ( f 7 2 )
( i 3 ) ( pound 7 2 ) ( i 3 ) ( pound 7 2 )
40
TR-35 3A
6 1 6 3 64 7 0 7 1 80
LINE 4
LINE 5
1 6
7 1 2
1 3 80
LINE 6
1 3 4 1 0
1 1 1 3 1 4 20 2 1 23 24 3 0
3 1 3 3 34 40 4 1 43 44 5 0 5 1 5 3 5 4 6 0 6 1 6 3 64 7 0 7 1 7 3 7 4 8 0
LINE 7
LINE 8
1 5
6 1 2
Channe l 114 Gl obal Ti l t (Wm2 ) hellipChannel not used
Broad band mea suremen t s a f t e r t h e s p e c t ral s can same format a s beforeshy scan ( LINE 3 )
T i l t o f the f ixed- t i l t i n s t rument s hellipf rom the hor i z ont a l ( d eg )
Az i muth of the f i xed-t i l t ins t rumen t s ( de g ) ( 1 8 0 deg = s outh)
De s c r i p t i on o f any s pec i al i n s t rument ( fo r example d i ffu s e-hori zont a l mea s uremen t s a t SERI )
Channe l IFlOAl bedo (Wm2 ) hellipChannel IH5C l oud Cover ( t enths ) Channel fF7 Surface Pres sure ( mb ) Mea s ured at FSEC and PGampE c a l c u l ated from e l eva t i on a t S ERI [ 1 1 p 1 0 0 ]
Channel 116 Amb i en t Temperature ( deg C ) Channel fiB Rel a t i ve Humi d i t y ( ) Channe l ffo9 Wind S peed ( m s ) Add i t i onal channe l des cri bed 1n l i ne 5 Va l ue Add i t i onal channel descri bed 1n l ine 5 Va l u e
Sun Pho t ometer read ings ( only recorded for SERI dat a not u s ed except for re l a t i ve c ompar i s on s ) hellip
Earth-S un d i s tance c orrec t i on ( d e v i a t i on from 1 0 ) hellip
Ext ra t erre s t r i a l Rad i a t i on (Wm2 ) hellip
( i 3 ) ( pound 7 2 )
( f 6 1 )
( f 6 1 )
( a 8 8 )
( i 3 ) ( 7 1 ) ( i 3 ) ( 7 1 ) ( i 3 ) ( f 7 1 )
( i 3 ) ( pound 7 1 ) ( i 3 ) ( pound 7 1 ) ( i 3 ) ( pound 7 1 ) ( i 3 ) ( variabl e ) ( i 3 ) ( variabl e )
( f5 2 )
( f 7 1 )
4 1
9
42
TR-3S l 3A
1 3 1 8
1 9 24
25 30
3 1 36
3742
43 48
49 68
69 72
13 76
1780
LINE
I
3 6
7 1 1 1216 1 7 20 21 25
2631
3236
3839
40 40
41 42
43 46
Zen i t h Angl e ( deg ) ( f6 2 )
Kt ( ra t i o calculated from ( f6 1 ) thermo p i l e inst rument s )
Kn ( rat i o calculated from ( f6 1 ) thermo p i l e instrument s )
D GH ( ra t i o cal culated from thermopile instrument s ) ( f6 1 )
Albedo ( ) ( f6 1 )
Ai r Mas s ( f6 2 )
Res erved for Turbidi ty i f calculated
Precipi table Water Vapor i f calculated from sun photomet er
Precipi table Water Vapor from the ( f4 1 ) Nat ional Weather Servi ce
Prec i p i table Water Vapor Cal culated from Relative Humid i t y ( f4 1 )
Channel H7 Number o f Wave l engths Recorded by Spect roradi ometer 1
Beginning Wavelength ( nm ) Ending Wavel ength (nm) Wavelength Step Size (nm ) Spectroradi ometer 1 Ti l t from the Horizontal ( deg )
Spectroradiometer 1 Azimuth ( deg )
Angle o f Incidence o f the Direct Beam on Spectroradi ometer 1 ( deg )
Measurement Type ( DN GN GH GT DF )
Attachment ( Tef lon Dome D Integrat ing Sphere S View- l imit ing Tube T )
Channel H8 Number o f Wavel engths Recorded by Spectroradi ometer 2
( i2 )
( i4 )
( i S ) ( i S ) ( f4 1 )
( fS l )
( f6 1 )
( fS 1 )
( a2 )
( a l )
( i 2 )
(i4)
TR-3S l3A
4 7 S l Beginning Wavel ength (nm ) ( i S )
S 2 S 6` Ending Wavel ength ( nm ) ( i S )
S 7 60 Wavelength Step S i z e ( nm ) ( f4 bull 1 )
6 1 6S Spec troradi ometer 1 T i l t from the Hori zontal ( deg ) ( fS l )
6 6 7 1 ` Spect roradi ometer 2 Az imuth ( deg ) ( f6 1 )
7 2 76` Angle of Incidence o f the Direct Beam on Spect rorad i ometer 2 ( deg ) ( fS l )
7 8 7 9 Mea surement Type ( DN GN GH GT DF ) ( a2 )
8 0 80 At tachment ( Teflon Dome D Integrat ing Sphere s View-l imi t ing Tube T ) ( al )
LINE 10 Saved f o r extra spectroradi ometers i f needed
I f no spec tral data were recorded the number of l ines in the D s egment i s 1 0 the number of spectra i s 0 and there i s no corre sponding qual i ty-control information for thi s dat e t ime in the QC f i l e s No qual i ty c ontrol wa s performed because the atmo sphere was uns table I f the number o f spectra i s 1 there are 60 l ines in the D s egment i f there are two spectra t he number o f l ines i s 100
I f middot the number of spectra i s 1 or 2 the spectral data fol low after the f i r s t 1 0 l i nes o f the D segment There are 1 0 spectral measurement s per l ine wi th the number in the lef t-mo s t column indicat ing the f i r s t or second specshyt roradiometer ( 1 or 2 ) f o l l owed by the s tart ing wavelength ( in nanometers ) and t he 10 spectral mea surements ( in Wm2-nm) The 1 0 measurement s are at wave l ength inc rements of 2 nm There are 401 spect ral mea surement s from 300 t o 1 1 0 0 nm in 2-nm s teps with 10 measurement s per line for 40 l ine s and one measurement in the 4 1 s t l ine The l a s t number in the 4 1 s t l ine i s the specshytral integral I f a second s pectrorad i ometer wa s used the next 4 1 l ines folshylow t he same format Blank 1 ines follow the spec tral data t o f i l l the D segment to 60 or 100 l ines
An example of a QC f i l e i s shown in Figure 6-3 The f i r s t l ine o f each segment begins with a Q f o l l owed by the s i t e year day number and t ime s tamp with the number of l ines in the segment given in the l a s t col umn s o f the l ine Following the iden t i fier are me s sage s about var iables that were flagged by the automat i c qua l i ty-control proc e s s ing ( s ee appendi x ) noted by an operator at the measurement s i t e or noted dur ing inspec t i on at SERI The l a s t l ine of the segment shows the QC code for as DN ( direct normal thermopile detect o r ) SN ( d i rect normal detector ) AL
var iabl e s such s i l i con
( a lbedo ) and SP ( s pectrum) a s de s c r i bed in the appendi x Three qual i tyshycontrol code s ar8 used 1 = good 2 = suspec t see me s sages and dai ly not e s and 3 = poor or mi s s ing see me s s ages and da i l y no te s The broadband codes ( DN SN GN GH SH and GT ) have two value s the f i r s t is the before- scan measurement and the second is the after-s can mea surement
4 3
TR-35 13A
Q FSEC87 1 2 1 0 7 3 1 4 Noise in GH spectrum in UV QCDN1DN1SN1SN1GN1GN1GH1GH1SH1SH1GT1GT1AL1AP1PR1TC1RH1WV1WS1KT1KN1DG1SPl iN1SP2IN2
Q FSEC8 7 1 2 1 0 8 3 0 8 SN bef SN af t = 1 0 5 5 S H bef SH aft = 1 0 5 3 2nd Int BB b e f = 0 636 2nd Int BB aft = 0 6 5 1 Noise in GH spectrum i n UV QCDN1DN1SN2SN2GN1GN1GH1GH1SH2SH2GT1GT1AL1AP1PR1TC1RH1WV1WS1KT1KN1DG1SP1 IN1SP2IN2
Q FSEC8 7 1 2 1 1 0 3 1 3 QCDN1DN1SN1SN1GN1GN1GH1GH1SH1SH1GT1GT1AL1AP1PR1TC1RH1WV1WS1KT1KN1DG1SP1 IN1SPl iNl iacute
Q FSEC87 1 2 1 1 1 3 1 3 QCDN1DN1SN1 SN1GN1GN1GH1GH1SH1SH1GT1GT1AL 1AP1PR1TC1RH1WV1WS1KT1KH1DG1SP 1 IN1SP1 IN1
Q FSEC8 7 1 2 1 1 2 3 1 3 QCDN1DN 1SN1SN1GN1GN1GH1GH1SH1SH1GT1GT1AL1AP1PR1TC1RH1WV1WS1KT1KN1DG1 SP1 IN1SP 1 IN1
Q FSEC8 7 1 2 1 1 3 3 1 3 QCDN1DN1SNlSNlGNlGN1GH1GH1SH1SH1GTlGTlALlAPlPRlTClRHlWVlWSlKTlKNlDGlSP l iNlSPliNl
Q FSEC8 7 1 2 1 1 4 3 1 3QCDNlDNlSNlSNlGNlGNlGHlGHlSHlSHlGTlGTlALlAPlPRlTClRHlHVlHSlKTlKNlDGlSPl iN1SP1IN1 Q FSECB7 1 2 1 1 554 3 QCDNlDNlSNlSNlGNlGNlGHlGHlSHlSHlGTlGTlALlAPlPRlTClRHlWV1WSlKT1KN1DG1SP 1 IN1SP l iN1
Q FSEC8 7 1 2 1 16 3 0 3 QCDNlDNlSNlSNlGNlGNlGHlGHlSHlSHlGTlGTlALlAPlPRlTC1RH1WV1WSlKTlKNlDG1SP l iNlSPl iNl
Q FSECB 7 1 2 1 1 7 3 1 5 GH bef SH bef = 0 9 3 1 GH aft SH af t = 0 9 3 3 QCDN1DN1SN1SN1GN1GNlGH2GH2SH2SH2GTlGT1ALlAPlPRlTClRHlWVlWSlKTlKNlDGlSPl iNlSPl iNl
Q FSECB 7 1 2 2 0 7 3 1 3 QCDNlDNlSNlSNlGNlGNlGHlGHlSHlSHlGT1GTlALlAPlPRlTClRHlWVlWS 1KT1KNlDGlSP l iNlSPl iNl
Figure 6-3 Example of quali ty-control inf ormation on the data- base tape
Figure 6-4 shows an exampl e of a segment of the daily notes from the FSEC NOTES f i l e Each segment of the f i l e beg ins wi th an followed b y the s i t e year and day number s t amp with the number of l ines in the segment given in the last columns of the l i ne The next l ine contains the s i te operashytor log sheet number month day year day number spectroradi ometer serial number( s ) and mea surement mode( s ) The PGampE and SERI not e s do not include the dai ly l og sheet number The f i rst two l ines are followed by f i eld no te s No tes that were added after inspec t i on at SERI are s eparat d from the operator notes wi th ------- The exi s tence of s l ides or photographs i s ind i cat ed a s wel l a s their qua l i ty i e good ( G ) marginal ( M ) or poor ( P ) In the exampl e in thi s f i gure there were two log sheets for thi s day (number 1 1 6 and 1 1 7 ) because the mea surement mode changed from gl obal hor i z onshytal ( GH ) to global t i l t ( GT )
44
TR-3513A
N FSEC87 1 2 2 1 1 6 0 5 0 2 8 7 1 2 2 1 7 2 DN 1 0 2 GH Clear at 0 7 3 0 GH f o r f ir s t two s cans then GT S l i de s 0 6 3 2 G
0 7 3 3 G 0 8 3 3 G 0 9 3 3 H ( dark ) 1 0 3 3 p1 1 3 3 p1 2 3 3 p 1 3 3 3 p1433 H 1 5 3 3 G 1633 G 1733 G
1 1 7 0 5 0 2 87 1 2 2 1 7 2 DN 1 0 2 GT GT s tart ing at 0 8 0 0 iacuteC lear a t 0 8 0 0 iacuteS l ides S e e above
16 1 1 8 0 5 0 3 8 7 1 2 3 1 7 2 DN 1 0 2 GT Clear at 0830 S l i de s 0633 G
0733 G 0833 G 0933 H ( dark ) 1 0 3 3 p1 1 3 3 p 1233 p 1333 p1433 H 1533 G 1633 G 1733 G
N FSEC87 1 2 3
Figure 6-4 Examples of daily notes on the data-base tape
An example o f a segment of the measurement uncertainty file UNCERT CAL i s shown in Figure 6-5 The f i r s t l ine begins with a U followed by the serial number of the s pect rorad i ometer The upper and lower measurement uncertainty l imi t s are given in the co lumns fol lowing wavelength wi th the appropri a t e measur ement mode dat es and de script ion at the top o f the column The s econd l ine in each segment o f the DAT f i l e s is a pointer to the correct uncershytainty information in UNCERT CAL The broadband s o lar radiat i on and meteshyorolog ical instrument measurement uncertainty fol lows each spectra l measureshyment uncertainty segment in UNCERT CAL
The format o f thi s data ba se was es tabl i shed at SERI t o accommodat e expanded mul t i year long-term data collect ion Users can reformat the data t o suit their part icular needs We recommend the following s t eps for acce s s ing and document ing parti cular data set s
1 Se lect and extract the des ired spectral data from the DAT f i l e s us i ng in formation such as measurement mode day number t ime air mas s or a moshys pheric condi t ions depending on the de s i red attribut es
2 Ex trac t and review the corres ponding segment s of the qua l i ty-cont rol i n format i on from the QC f i l es
3 Ex trac t and review the corres pond ing field no tes from the NOTES f i l e s
4 5
+ I -
5 4
3 7
TR- 3 5 13A
U PRS - 1 0 2 L I -COR PRS - 1 0 2 i
1 2 3 4 5 Ill
Wav GHS GHS GHS GHS GTS GTS GTS GTS Kt gt 6 0 Kt gt 6 0 Kt gt 60 Kt gt 6 0 iacutel ower lower upper upper 2 8 7 - 8 8 7 -8 8 7 5 8 8 GNS GNS
upper upper lower l ower
+ 1 -
- GHS GHS GTS GTS Kt lt 60 Kt lt 6 0 upper uppe r l ower l ower + I - + I -2 8 7 - 8 8 7 -8 87 5 - 8 8
3 0 0 - 1 0 0 0 - 1 00 0 1 0 0 0 1 0 0 0 3 0 2 - 1 0 0 0 - 1 0 0 0 1 0 0 0 1 0 0 0
4 0 0 - 2 3 3 - 1 7 1 1 5 3 9 1 4 0 2 iacute -2 2 0 - 1 7 3 1 4 0 9 3
5 0 0 - 1 3 4 - 1 1 7 3 7 5 0 2 iacute - 1 3 3 - 1 1 7 5 3 3 7
6 0 0 - 1 1 8 - 1 1 1 3 8 3 1 6 0 2 - 1 1 9 - 1 1 1 3 9 3 1
7 0 0 - 1 1 5 - 1 0 7 3 5 2 7 7 0 2 - 1 1 3 - 1 0 7 3 3 2 7
8 0 0 - 1 1 6 - 1 0 6 3 6 2 6 8 0 2 - 11 7 - 1 0 6 3 7 2 6
9 0 0 - 1 1 2 - 1 0 5 3 2 2 5 9 0 2 - 1 1 4 - 1 0 8 3 4 2 8
1 0 0 0 - 1 1 7 - 1 0 8 2 8 1 0 0 2 - 1 1 8 - 1 0 8 3 8 2 8
1 1 0 0 - 1 2 9 - 12 2 4 9 4 2
Figure 6-5 Examples of spe ctral measurement uncertainty on the data-base tape A value of plusmn100 indi cates greater t han 100 measurement uncertainty
46
TR-35 13A
4 Extract the measurement uncertainty information from the 1 1 UNCERT f i l e s and quot e mea surement uncertainty for a l l data used
5 Examine the dai l y broadband and spec tral solar radiatio data graphs in the catalog ( Volume I I of thi s report [ 1 8 ] i f avai labl e These graphs provide informa t i on on atmo spheric condi t i ons during the day For exampl e Figure 4-3 shows dai l y broadband and spec tral plot s for part ly c loudy condi t i ons when s olar rad i a t i on i s changing rapidly throughout the day The sun i s obs cured when the direc t-normal values drop t o zero and the gl obal value s approach each o ther Figure 4-1 shows a clear daybull
No data should be used wi thout consult ing the qua l i ty-control informa t i on dai ly no tes and measurement uncertainty
4 7
Cel l s
Ce l l s
Energy
Meteorologi cal Society
Appl i ed Meteorol ogy
Energy
Radiat ion Topical Overview Solar Cel l s Vo l 1 8
of the Pho tovo l t a i c s and Insolat ion Mea sureshySolar Vol 1 8 1 986 pp 393-3 9 5
TR-35 1 3A
1 0 REFERENCES
1 Hul st rom R L Solar 1 986 PPbull 1 7 9- 1 8 7
2 Hul st rom R L A Summary ments Workshop Panel Resul t s
3 Hul strom R L Re sul t s of the Amorphous S i l i con Mea surement s Ta sk Force Solar Cel l s Vo l 18 1 986 pp 1 7 1-1 7 7
4 Hul strom R L and J M Ohi Resul t s of the SERI Mul t i junction Devi ce Efficiency Measurement Task Forc e pre sented at the 20th I EEE Photovo lshytaic Spec ial i s t s Conference September 1 988
5 Riordan c and R L Hul s t rom Summary of S tud i e s that Examine the Effec t s of Spect ral Solar Radition Vari at ions on PV Device Des ign and Pershyformance SERI-TR-2 15-343 7 Golden CO Solar Energy Research Ins t i tute 1989
6 Riordan c Joint EPRI-SERI Spectral Solar Rad i a t i on Database Pro j ec t
1
8
9
1 0
1 1
1 2
1 3
14
Solar Vol 2 1 1 98 7 pp 3 3 7-342
Riordan c D Myers M Rymes R Hul strom W Mar i on c Jenning s and c Whi taker Spectral Solar Radiat ion Data Bas e at SERI Solar Vol 42 No 1 1 989 PP bull 6 7-79
Riordan C J T L Stoffe l and R L Hul s trom The Effect s of Urban Air Pollut ion on Solar Radiat i on SERI-TR-2 15-3482 Golden CO Solar Energy Res arch I n s t i tute ( draft ) 1989
Riordan c and R Hul s t rom The SERI Re s ource As ses sment Project s Plan for Col l ect ing Spectral-Solar-I rradiance Data SERI -TR-21 5-2948 Gol den CO Solar Energy Re search Ins t i tut e 1986
Shaw G E Sun Pho tometry Bul letin Ameri can Vol 64 No 1 January 1983 pp 4-10
Iqbal M bull An Int roduction to Solar Radiation New York Academic Pre s s
1983
Bartel s R A Comment s on Prec ipi table Water Mea surement s with Sun Photometer s Journal of Cl imate and Vol 25 1 986 PP bull 1 788- 1 789
Leckner B The Spectral Distribution o f Solar Radiat ion at the Earth s Surface -- El ements of a Model Solar Vol 20 1 9 7 8 pp 143- 1 5 0
Cannon T W Spectral So lar Irradiance Instrumentat i on and Measurement Techniques Solar Cel l s Vol 1 8 1986 pp 2 3 3-24 1
48
Energy
Photogrammetric Engineering
TR 3 5 13A
1 5 Myers D R E s t imate s of Uncertainty for Measured Spec tra in the SERI Spectral Solar Radiat i on Data Base ac cepted by Solar 1 98 9
1 6 Myers D R E s t imates of Uncertainty for Measured Spectra in the SERI Spec tral Solar Radiat i on Data aa s e 11 SERI e_clmical Report Golden CO S o l ar Energy Res earch Ins t i tute ( draft ) 1989
middot
1 7 Hul s trom R L The Cl oud Bright Spo t 1 9 73 PP bull 3 7 0-3 7 6
18 Ri ordan c D Myer s and R Hul s t rom Spectral Scflar Raltfiation Data Base Documentat i on and User 1 s Manual Vo lume I I SERI-TR-2 15-3 5 1 3 Golden CO Solar Energy Re search Ins t i tut e 1989
49
TR- 3 5 1 3A
APPENDIX
QUALITY-CONTROL PROCESSING
Limi ted qua l i ty-control proces s ing wa s appl i ed to the data ba se as de s c r i bed below The resul t s are i n the QC f i l es on the data-base t ape by s i t e year and mont h For examp l e
FLA8705 QC i s FSEC 1 98 7 May PGE8 80 l QC i s PGampE 1 9 8 8 January SER8 7 l l QC i s SERI 1 98 7 November
These f i l e s correspond t o the 11 OAT f i les for the s ame s i t e year and month Each data segment that includes a spectrum wa s proces sed through thi s quali ty-control procedure I f the atmospheric cond i t i on s were uns tab l e and a spectrum was not acquired the broadband and meteorologi cal data were inc l uded on the data-base tape but no qua l i ty-contro l proc e s s ing wa s app l i ed
An example o f a segment of a 11 QC f i l e i s shown in F i gure 6-3 The f i r s t Q l ine beg ins wi th a fol l owed by the s i t e year day and t ime s tamp The
last columns give the number of l ines in the s egment so the user can skip to the next s egment Fo l l owing the f i r s t l ine are me s sages that were printed whenever the qua l i ty-control proce s s ing f lagged a suspect or poor value
Following the mes sages in an SO-character QC l ine l i s t ing the variables that were examined are one of three qua l i ty-control code s 1 good 2 marg inal or suspect and 3 mi s s ing or poor The QC l ine was prepared using an automa t i c ( computeri zed ) check of the variabl e s and manual edi t ing to include informashyt ion from correspondence l og sheet s and vi sual inspe ct i on Addi t i onal me sshysages were added above the QC l ine if appropriate
The two-charact er descriptors in the QC l ine are
DN Direct-normal ( thermopi l e ) solar radiat ion before the spectral s can DN Direct-normal ( thermopi l e ) so lar radiation after the spectra l scan SN Direct-normal ( s i l i c on ) before SN Direct-normal ( s i l i c on ) after GN Globa l-normal before GN Globa l-normal after GH Globa l -horizontal ( thermop i l e ) before
WS Wind Speed KT KKN K
t n
GH Global-hori zontal thermopil e ) after SH Global-hori zontal ( s i l i con ) before SH Global-hori zontal ( s i l icon ) after GT Global-t i l t before GT Gl obal- t i l t after AL Al bedo ( Wm ) AP Albedo ( ) PR Surface Pres sure TC Temperature ( deg C ) RH Relat ive Humi dity WV Water Vapor ( al culated from rel a t i ve humidity)
5 0
S- flllit = - ( middotmiddot middot
( e g Wm2 )
TR-3 5 1 3A
DG D GH SP F i r s t Sp qtrum I T Integral of t he F i r s t Spec t rum SP Second Spectrum IT I nt egral of the - Second SpecttUI11
The aut oma t i c tes t s that were performed to det ermine the QC code fol l owing each var iable were
( a ) Check for mi s s ing or negat ive values for the broadband solar radiashyt i on meteoro l og i cal or a tmo spheric dat a or the spec t ral integral s
lt 0 = Code 2 Mi s s ing ( - 9 or -9 9 ) = Code 3
( b ) Check for atmo spheric or broadband instrument instab i l i ty us ing the difference and rat i o o f the before- and aft er-scan values and redundant mea surement s if nei t her values are negat i ve or mi s s ing
DN before DN after if the abs lute d i fference SN before SN after i s gt10 Wm DN beforeSN before 5 of 200 DN before SN after and GH before GH after SH beforeSH after the rat io i s lt0 95 or gt1 05 each of the GH before SH before two var iables = GH afterSH after or middot GN beforeGN after the rat i o i s lt0 90 or gt1 10 each of the GT beforeGT after two var iable s = Code 3
Code 2
( c ) Check for DN gt GN or GN gt ETR ( extraterre s trial solar radiat i on ) us 1ng rat ios of the var iabl e s
DN before GN before gt0 95 each variable = Code 2 DN afterGN after gt 1 0 each var i able = Code 3 GN before ETR GN afterETR
( d ) Check for values o f Kt Kn and DGH tha t are too high
KT ( invo lves GH before and after and KT ) KN ( involves DN before and after and KN ) DG ( invo lves DN and GH before and after and DG )
gt0 9 5 each variable = Code 2 gt 1 0 each var iable = Code 3
( e ) Check the s pe c t ral integral s for unusual rat i o s to the corresponding broadband so lar radiat ion value
IT ( Broadband va lue before and after )
For d i rect s pe c t ra lt 0 6 or gt0 8 5 I T = Code 2 For gl obal s pe c t ra lt0 7 o r gt0 95 I T = Code 2
For d i rect and g l obal s pec t ra lt0 5 or gt l O IT = Code 3
5 1
TR-35 13A
We sugge s t that users of the data ba s e develop a computer program to acc e s s fields i n the Q C l ine and t o print the me s sages Thi s l imi ted qua l i ty cont rol wi l l not f lag a l l po s s ible errors and addi t i onal t e s t s should be applied depend ing on the users requi rement s and appl icat i on s
52
1 1 2
Document Control SEAl Report No
Page 4 Title and Subtitle
NTIS Accession No 3 Recipients Accession No SERI TR- 2 1 5-35 13A DE89009447
5 Publication Date
January 1990 Sp ectral Solar Radiation Data Base Documentation
6Vo lume I
7 Author(s) 8 Performing Organization Rept No
9 Performing Organization Name and Address 10 ProjectTaskWork Unit No
1 1 Contract (C) or Grant (G) No
(C)
(G)
1 2 Sponsoring Organization Name and Address 13 Type of Report amp Period Covered
Solar Energy Res ear ch Ins titute Technical Repor t 1 6 1 7 Col e Boulevard Golden Colorado 804 0 1-3393 1 4
1 5 Supplementary Notes
16 Abstract (Limit 200 words) The Solar Energy Research Ins titute ( SERI) Electric Power Research Ins titute Flor ida Solar Energy Center and Pacific Gas and Electric Company cooperated to produce a spec tral solar radiation data base representing a range of atmospheric conditions These data will help to characterize the natural variab ility in the spectral (color) content o f outdoor solar radiation so that the sensitivity of spec trally selective solar devices ( such as photovoltaics ) to these variations c n b e s tudied quant itatively Volume I o f this report documents the history approach content and format of the data base Volume II contains graphs and field no tes for each of the spectral data sets The data res ide on magnetic tape at SERI
1 7 Document Analysis
a Descriptors Spec tral solar radiation broadband solar radiation met eorological
data sp ectroradiometers
b IdentifiersOpen-Ended Terms
c UC Categories
233 234
18 Availabil ity Statement
National Technical Information U S Depar tment of Commerce 5 285 Port Royal Road Springfield Virginia 2 2 1 6 1
Service 19 No of Pages
60
20 Price
A04
Form No 0069 (6-30-87)
TR-35 13A
PREFACE
This report documents the Solar Energy Research Inst i tutes spectral solar radiation data base Volume I describes the history approach content and format of the data and Volume I I contains graphs of each o f the spectral solar radiat i on curves and assoc iated f ield notes
This is the f i rst pub l i c rel ease of these data Our intent is to make the data ava i l ab l e as soon as possible so that others can use i t However we also intend t o create addi t i onal products and data subsets in the future t o i l lustrate app l i ca t i ons o f the data f o r special purposes or analyses
Comments or ques t ions about these data should be directed t o the Solar Energy Research Inst i tut e Solar Electric Research Division Resource Assessment and Instrumenta t i on Branch in Golden Col orado 80401
ACKNOWLEDGMENTS
SERI would l i ke t o acknowl edge the work of the Florida Solar Energy Center and the Pac i f i c Gas and E l ectric Company in building this spectral solar rad i a t i on data base Wi thout their he l p this data base would no t have been possibl e
111
Objective
The objec t ive o f thi s report so lar radiat i on data base at re s i de on magnet i c tape
Discussion
Vo lume I of thi s report document s of the data ba s e Volume I I spec tral data s et s Together and acc e s s any part i cular f i eld the magnet i c t ape
Conclusions
TR-3513A
SUMMARY
i s to provide documentation for the spectral the Solar Energy Research Ins t i tut e The data
the hi s t ory approach content and f o rmat cont ains graphs and field notes for each o f the
these two vo lume s should a l l ow users to f ind of data or de s i red data subset contained on
The se data are be ing released at thi s point to make the informa t i on ava i l ab l e to tho s e who have immediate uses or app l i cat i ons W e a l s o intend t o create other produc t s and data subset s in the future to i l lustrate par t i cular applishycat i ons and analyses
lV
Page
TR-35 1 3A
TABLE OF CONTENTS
1 0 Int roduc t i on bull bull bull bull bull bull bull bull bull bull bull bull bull bull bull bull bull bull bull bull bull bull bull bull bull bull bull bull bull bull bull bull bull bull bull bull bull bull bull bull bull bull bull bull bull bull bull bull bull bull bull bull bull bull bull bull 1
2 0 History bull bull bull bull bull bull bull bull bull bull bull bull bull bull bull bull bull bull bull bull bull bull bull bull bull bull bull bull bull 2
3 0 Approach bull bull bull bull bull bull bull bull bull bull bull bull bull bull bull bull bull bull bull bull bull bull bull bull bull bull bull bull bull bull bull bull bull bull bull bull bull bull bull bull bull bull bull bull bull bull bull bull bull s
4 0 Contents o f the Data Base bull bull bull bull bull bull bull bull bull bull bull bull bull bull bull bull bull bull bull bull bull bull bull bull bull bull bull bull bull bull bull bull bull bull bull bull bull bull bull bull bull bull bull 1 7
s o Measurement Uncert aintY bull bull bull bull bull bull bull bull bull bull bull bull bull bull bull bull bull bull bull bull bull bull bull bull bull bull bull bull bull bull bull bull bull bull bull bull bull bull bull bull bull bull bull bull bull 2 7
6 0 Format o f the Data Tape bull bull bull bull bull bull bull bull bull bull bull bull bull bull bull bull bull bull bull bull bull bull bull bull bull bull bull bull bull bull bull bull bull bull bull bull bull bull bull bull bull bull bull bull bull 3 6
7 0 References bull bull bull bull bull bull bull bull bull bull bull bull bull bull bull bull bull bull bull bull bull bull bull bull bull bull bull bull bull bull bull bull bull bull bull bull bull bull bull bull bull bull bull bull bull bull bull bull bull bull bull bull bull bull bull bull bull bull 48
Appendix Qua l i ty-Control Processing bull bull bull bull bull bull bull bull bull bull bull bull bull bull bull bull bull bull bull bull bull bull bull bull bull bull bull bull bull bull bull bull bull bull bull bull so
v
bull bull bull bull bull bull bull bull bull bull bull bull bull bull bull bull bull bull bull
3-2
TR-35 1 3A
LIST OF FIGURES
2-1 Spectral and broadband s olar radiation collection at FSEG Cape Canaveral Fl a in conjunction wi th phot ovo l taic module data in the same plane bull bull bull bull bull bull bull bull bull bull bull bull bull bull bull bull bull bull bull bull bull bull bull bull bull bull bull bull bull bull bull bull bull bull bull bull bull bull bull bull bull bull bull bull bull 3
2-2 Data co l l ection s i t e at PGampE San Ramon Cal i f 3
2-3 Data co l l ect ion s i t e at Wel by Co lo where SERI acquired re search data t o s tudy air pollut i on effect s on solar radiat i on bull bull bull bull bull bull bull bull bull bull bull bull bull 4
3-1 The atmo s phere act s as a t emporally and spatially variabl e f i l ter on solar radiation The path l ength ( a ir ma s s ) of direct-beamradiat i on increa ses with increas ing solar zeni th angle scattering and absorp t i on increa se with l onger path lengths Global radiationon a hori zontal plane ( Gh ) i s equal t o the direct-beam rad iation( from the s o lar di sk) normal to the surface ( D ) mul t i pl i ed by thenco s ine of the solar zenith angle ( z ) plus scatt ered rad i a t i on from the sky ( S ) For a t i l ted ( rather than hori zontal ) plane D i s mul t i p l i ed b y the cos ine o f the incidence angl e The surfac al s o rece ive s radiation ref l ected from the ground t o the surface ( R ) The se re l a t i onships are
Direct norma l Gl obal hori zontal D x Cos ( z ) + SnGlobal t i l t D x Co s (e ) + s + R `Gl obal normal ` D
n + S + R bull bull bull bull bull bull bull bull bull bull bull bull bull bull bull bull bull bull bull bull bull bull bull bull bull bull bull bull bull bull bull 6n
Spectroradi ometers equi pped with view-l imi ting tubes t o acquire direct-normal solar rad i a t i on Aluminum foil wa s placed over the instrument s to reflect radiation and keep the ins truments from overheat ing 8
3-3 Spectrorad i omet ers equi pped wi th integra t ing sphere s to measure gl oba l s o lar rad i a t i on 8
3-4 Spectroradi ometers equi pped with the Tef l on dome rece ivers bull bull bull bull bull bull bull bull bull 9
3-5 Outdoor int ercompari s on o f four spectrorad i ometers bull bull bull bull bull bull bull bull bull bull bull bull bull bull bull bull bull 9
3-6 Examp l e s of the very few di s torted spectra in the data base ( a b c ) Broadband solar radiation data ( d ) corre s pond ing with the spectra in b and c show that irradi ance was decrea s i ng at 10 3 1 due t o part ly cl oudy condit ion s bull bull bull bull bull bull bull bull bull bull bull bull bull bull bull bull bull bull bull bull bull bull bull bull bull bull bull bull bull bull 12
3-7 Exampl e of a l l- sky photographs acquired at FSEC The s e pho tographs provi ded evidence o f ra in pos sible- condensation on op t ics and clouds 13
3-8 Example o f a l l -sky pho tograph acquired at SERI wi th a d i s k bl ocking sun to s how di ffuse sky cond i t i ons bull bull bull bull bull bull bull bull bull bull bull bull bull bull bull bull bull bull bull bull bull bull bull bull bull bull bull bull bull bull bull bull bull 13
V l
TR-3 5 13A
LIST OF FIGURES ( Continued)
3-9 Exampl e of the instrument configuration data recorded with the measured data 14
3-10 Example of the c omputer terminal out put during a quality-control sess1on 1 5
4- 1 Exampl es of ( a ) direct-normal and ( b ) global-normal spectra and ( c ) broadband solar radiation measured at FSEC on a cl ear day bull bull bull bull bull bull 1 8
4-2 Examples of (a ) direct-normal and ( b ) global-til t spectra and ( c ) broadband solar radiation measured at FSEC on a cl oudy day bull bull bull bull bull 1 9
4-3 Exampl es of global-normal spectra (upper ) and broadband solar radiation ( lower ) measured at FSEC on a part ly cloudy day The spectrum at 1 6 3 1 shows data dropout during data transfer bull bull bull bull bull bull bull bull bull bull 20
4-4 Examples of so lar spec tra enhanced by cl oud bright spots ( a ) at 1 0 3 1 on day 132 and ( c ) at 1 2 30 on day 133 and corresponding [ ( b ) and ( d ) respectively] broadband solar radiation bull bull bull bull bull bull bull bull bull bull bull bull bull bull 2 1
4-5 Exampl es of direct -normal global-horizontal and diffuse-horizontal spectra measured by SERI on two days bull bull bull bull bull bull bull bull bull bull bull bull bull bull bull bull bull bull bull bull 22
4-6 The cumulative number of spectra ( horizontal axis ) measured over a range of air mass and atmospheric descriptors ( vertical axis ) bull bull bull bull 23
4-7 Exampl es of spectra showing noisy data iri the ul traviolet ( 300shy400 nm ) and near-infrared ( 10 0 0- 1 100 nm) regions bull bull bull bull bull bull bull bull bull bull bull bull bull bull bull bull bull bull bull 26
5-l Estimated t otal spectral measurement uncertainty for global measurements with the integrating spheres on ( a ) units number 102 1 5 8 and 174 ( b ) gl obal-normal measurements with the Teflon dome receivers on units 174 and 2 1 8 and ( c ) direct-normal measurements with the view-limiting tubes on units 158 1 7 2 and 1 7 4 The measurement uncertainty is symmetrical except in ( a ) where a -8 bias is inc luded in the l ower limit for global-horizontal and global-til t cases due t o nonuniform sphere response when a strong direct-beam component is present bull bull bull bull bull 28
5-2 Comparison of the spectral intensity of an outdoor global -normal measurement and the NIST calibration lamp source Low lamp values below 400 nm resul t in high measurement uncertainty bull bull bull bull bull bull bull bull bull bull bull bull bull bull bull bull 29
5-3 Between-instrument precision for global-normal spectral solar radiation measurements using the integrating spheres bull bull bull bull bull bull bull bull bull bull bull bull bull bull bull 29
5-4 Ratio of the spec troradiometer detect or response at different t emperatures to the response at 40degC bull bull bull bull bull bull bull bull bull bull bull bull bull bull bull bull bull bull bull bull bull bull bull bull bull bull bull bull bull bull bull 30
vii
6-5
TR-3 5 1 3A
LIST OF FIGURES ( Concluded )
6-1 Examp l e o f the ins trument configurat i on data on the data base tape The numbers refer t o
1 c indicat ing configurat i on 2 FSEC 1987 Day 122 at 8 13 s tandard t ime 3 Lat i tude 4 Longi tude 5 E l evation 6 Reference t o conf igurat i on f i l e that wi l l be f ound in the
data files 7 S t art ing data-acqui s i t ion t ime plus number of attempt s t o
acquire spectra ( which would extend the data acqui s i t i on t ime )
8 Number o f data channel s 9 Number o f spectra ( 0 for configuration files 1 or 2 f or
data f i l e s ) 1 0 Number o f l ines i n thi s s egment bullbullbullbullbullbullbullbullbullbullbullbullbullbullbullbullbullbullbullbullbullbullbullbullbullbullbullbullbullbull 3 8
6-2 Examp l e s of the data on the data-ba s e tape bullbullbullbullbullbullbullbullbullbullbullbullbullbullbullbullbullbullbullbullbullbullbullbullbull 3 9
6-3 Exampl e o f qua l i ty-contro l informa t i on on the data-ba se t ape 44
6-4 Examp l e s of dai ly no tes on the data-ba s e tape bullbullbullbullbullbullbullbullbullbull bullbullbullbullbullbullbullbull 45
Examp l e s o f spectral measurement uncertainty on the data-ba s e t ape A value o f plusmn100 indicates greater than 1 00 mea surement uncertaintYbullbullbullbullbullbullbullbullbullbullbullbullbullbullbullbullbullbullbullbullbullbullbullbullbullbullbullbullbullbullbullbullbullbullbullbullbullbullbullbullbullbullbullbullbullbullbullbullbullbullbullbullbullbullbullbull 46
Vlll
TR-35 13A
LIST OF TABLES
3-1 Measurement s and Documenta t i on for Each File in the Spec tral Solar Rad i a t i on Data Basebullbullbullbullbullbullbullbullbullbullbullbullbullbullbullbullbullbullbullbullbullbullbullbullbullbullbullbullbullbullbullbullbullbullbullbullbullbullbullbullbullbullbull 1 0
S-1 FSEC Instrument Cal i brat ion H i s tory and E s t imated Measurement Uncertainty 3 1
S-2 PGampE Instrument Cal ibration Hi s tory and Est imated Measurement Uncertainty 3 3
S-3 SERI Instrument Cal ibrat ion H i s tory and Est imated Measurement Uncertainty bull 34
6-1 F i l ename s on the Data Tape bullbullbullbullbullbullbullbullbullbullbullbullbullbullbullbullbullbullbullbullbullbullbullbullbullbullbullbullbullbullbullbullbullbullbullbullbullbullbullbullbullbull 3 7
ix
1 0 INTRODUCTION
The Solar Energy Res earch Inst i tute ( SERI ) Electric Power Research Ins t i tute ( EPRI ) Florida Solar Energy Center ( FSEC ) and Pac i f i c Gas and Electric Company PGampE ) cooperated to produce a spectral solar radiation dat a bas e repres ent ing a range of atmospheric cond i t i ons ( or c l imates ) that i s appl ishycable to s everal d i f ferent type s of solar col lectors Thes e data wi l l he l p to characterize the natural variab i l i ty in the spec tral color) cont ent of outshydoor solar radi at i on so that the sens i t ivity of spectrally s elect ive solar devices such a s photovo l tai c s smart windows and bioma s s ) to these variations can be s tudied quant i tat ively
Thi s report document s the hi s tory approach content and format of the data base to make it useful to the s c i ent i f i c community A s econd volume of thi s report contains graphs of each of the spectral so lar radiation curve s and a s s o c i ated f i e l d note s The data are avai lable on magnetic tape in ASCII forshymat and cons i s t of broadband 1 and spectral2 solar radi at ion and meteorologi cal measurement s dai ly f i eld notes qual ity control informat ion and measurement
middotuncertainty Que s t i ons about the data base should be directed to SERI Solar Electric Res earch Divi s i on Re source As ses sment and Instrumentat ion Branch in Golden Col orado
1sroadband int egrated solar radiat ion 0 3 to 3 m
2spectral solar rad i a t i on as a func t i on of wavelength 03 to 1 1 m at0 002 m interva l s
1
2 0 HISTORY
The need for spectral sol ar rad i at ion data has been expre s sed in s everal forums [ 1-4] The bas i c need i s for data that can be used wi th solar c o l shylector spectral respons ivi ty data t o s c ient i f i cally and quantit a t ively det er-middot mine how the c o l l ector responds to natural variations in the spect ral con t ent of solar radiat ion and thereby det ermine how its performance is a f fec ted In the photovoltaic ( PV ) commun i t y for example there i s no consensus on the magni tude of spectral effec t s because there are no standard procedures for eva luating outdoor spectral sen s i tivity of PV devi ces the s en s i t ivity i s devi ce dependent and the qua l i ty and uncertainty o f the spec tral solar rad iashyt i on data used in the analyses are unknown or undocumented [ 5] In many cases only one s t andard or reference spectrum i s used to report the perforshymance of a PV devi ce and the uncertainty a s soc iated wi th natural spec t ra l var iations i s unknown
To s tudy the spec tral sens i t ivity of a solar col lector i t s spec tral respon s e quantum e f f i c i ency or spectral abs orpt i ontransmi s s ion curve i s mul t ipl ied by inci dent s pectra l sol ar radiat ion for a range of real i s t i c out door condi t i ons and the resul t s are integrat ed over the ent i re spectrum and the des ired t ime period Al l measurement uncertainty ( in the spectral data and spec t ra l response ) mus t b e evaluated to det ermine the s tat i s t ical s i gni ficance of any variations in the solar collec t or s performance that are attributed to specshytral vari a t i ons To make thi s determinat ion spec tra l solar radiat ion data wi t h documented measurement uncertainty are requi red
In 1984 EPRI and SERI met to def ine a research project that woul d addre s s t he need for measured outdoor spectral solar rad iation data for a range o f c l i shymat e cond i t ion s A formal project wa s ini t i ated in 1985 in whi ch EPRI proshyvided funds to SERI to perform three tasks ( 1 ) mod i fy c a l ibrat e and del iver to EPRI two computer-contro l l ed LI-COR Inc model LI-1800 spec trashyradiometer s ( 2 ) train EPRI -de s i gnated operators to use sof tware that acquires s pectra l so lar radiat ion and concurrent broadband solar radiat i on and me teorological data and ( 3 ) deve l op data collec t i on gui del ine s [ 6] EPRI a l s o ini t i at ed cooperat ive agreement s wi th FSEC and PGampE to co l l ect the s e data at their s i t e s in Cape Canavera l F la and San Ramon Cal i f respect ively In 1986 EPRI extended the agreement with SERI to use remaining project funds to as s i s t wi th the s tart-up of mea surement s at FSEC and PGampE
Spectral solar radiation and suppor t ing data were collected at FSEC and PGampE and sent to SERI for qua l i ty-control proc e s s ing and archiving [ 7 ] SERI coordinated the data col l e c t i on periodically cal ibrat ed the spec t rashyrad iometer s added data to the data ba s e and documented and forma t ted the data ba s e under the Department of Energy ( DOE ) SERI Re source As ses sment Program
Data that are inc luded in the data base were col lected at FSEC f rom Oct ober 1 98 6 to Apr i l 1 988 and at PGampE from Apti l 1987 to Apr i l 1988 FSEC opera ted one EPRI and one SERI spect roradiomet er almo s t daily at Cape Canavera l ( s ee Figure 2-1 ) whi ch contributed nearl y 2800 spectra to the data ba s e PGampE operated one EPRI spectrorad iometer at San Ramon Ca l i f ( s ee F i gure 2-2) as re s ource s permi t t ed contribut ing nearly 300 spectra to the data base SERI col lected about 200 spec tra in the DenverGolden Co l o ( s ee F i gure 2-3) area from November 1987 to February 1988 as part of a res earch project to s t udy urban spec tral solar radiat ion and added the s e data to the da ta ba s e [7]
2
TR-35 1 3A s= middot
Fi gure 2-1 Spectral and broadband solar radiation collection at FSEC Cape Canaveral Fla in conjuncti on with photovoltaic module data i n the same plane
Figure 2-2 Data collection si te at PGampE San Ramon Calif
3
middotmiddot
TR-35 13A
figure 2-3 Data colLect i on site at middotWelby Colomiddot where SERI acquired research data to study air polluiion effects bn solar radiat i on
4
3 0 APPROACH
A detailed de script ion of the approach for data collection i s avai lable in the Data Col l ect i on Plan [ 9 ] The goal s of thi s plan were to collect and to archive spectral s o l ar radiat i on broadband so lar radiat ion and meteoroshylogical data for a range of air ma s se s and atmo spheric cond i t i ons from various col l ector conf igurat i ons
A range of air ma s s values i s important because air mas s i s the path length of the s olar beam through the atmo sphere ( Figure 3-1 ) Air mas s increas e s wi th increas ing solar zenith angle and thus changes wi th locat ion ( l at itude ) seashyson and t ime of day As air mas s ( the path length) increases there i s increas ed spectral absorpt ion and scat tering of solar radiat ion by atmospheric cons t i tuent s such a s aero sol s and water vapor and the spectral content of solar radiat ion at the collector surface change s
The mo st important atmo s pheric variables that determine broadband and spectral solar radiation are cloud cover atmospheric turbidity ( aerosol s ) preshyc i pi table water vapor and barometric pres sure ( number of air mol ecules in the path of the solar beam) To properly document the spectra i t i s important to mea sure or characterize these variables Several methods can be used depending on the instrument s ava i lable at the measurement s i tes
bull Cl oud cover i s measured in terms of
Opaque sky c over ( tenths ) and type as determined by an observer an all-sky phot ograph or-both
Kt the atmo s pheric frac t i onal transmi ttance of broadband gl obal s olar radiation on a horizontal surface ( global-horizontal divided by extrashyterrestrial s o l ar radiation on a horizontal surface ) or D GH the rat i o of direct-to-gl obal broadband solar radiat i on on a hori zontal surface or bot h
bull Turbidity i s mea sured i n terms of
Atmo spheri c opti cal depth due to aero s ol s as cal cul ated from narrowshywavel ength s pec tral measurements taken with a sunphot ometer or a specshytroradiometer measuring direct-beam rad iation [10 1 1 pp 1 1 8-122 ]
Kn t he atmo spheric frac t i onal transmi t t ance of broadband direc t-beam solar rad i at i on or D GH as described previously or both
bull Precipi table water vapor i s
Cal culated from sunphotometer o r spectroradi ometer measurements [12 ]
Measured wi t h a bal loon radiosonde on- s i t e or at a nearby Nat i onal Weather Serv i ce stat ion
Calculated from measured relative humi d i ty or dew-point temperature [ 1 3 ]
5
Sunrise sunset
--
Zenith ___
Atmosphere Aerosols Water vapor Clouds Ozone (etc)
Spectralscattering
and absorption
TR-35 13A
0CJCJ
0(9
Global Radiation
Figure 3-1 The atmosphere f ilter on soLar direct-beam radiation increases with increasing solar zenith angle scattering and absorption incre4se with l onger path lengths Global radiation on a horizontal plane (Gh) is equal to the direct-beam radiation (from the solar disk) normal to the surface (D ) multiplied by the cosine of the solar zenith nangle (z) plus scattered radiation from the sky (S) For a tilted (rather than horizontal) plane D is multiplied by then cosine of the incidence angle The surface also receives radiation reflected from the ground to the surface (R) These relationships are
Direct normal D n Global horizontal = D x Cos(z) + SGh n Global tilt Gt = Dn x Cos(e) + S + R Global normal G = D + S + R n n
bull Barome tric pres sure is
Mea sured with a barometer
Cal culated using site el evation [ 1 1 p 100]
At least one o f these options is used for each variable to document a tmo shyspheric conditions during the spectral s o l ar radia tion mea surement s Redundant information is used for qua lity-control checks
acts as a temporally and spatially variable radiation The path length (air mass) of
6
TR-3 5 1 3A
The spectral solar radiat ion measurement s were made in several different meashysurement modes corre s pond ing to solar collector conf igurations Di rectnorma l s o l ar radiation ( radiation from the solar d i sk in about a 5 -deg field of view) i s used by concentrat ing ( focusing ) col lectors global-normal ( d irect plus scatt ered radia t i on on a surface normal to the solar d i s k ) is used by two-axi s sun-tracking f lat-plate col lectors and global-t i l t i s used by f ixed-t i l t f l at plate s such as south-fac ing col lectors t i lted at the lat itude angle or s ingle-axi s tracking flat plate s Global-horizontal ( direct plus scatt ered radiation on a hor i zontal surface ) is used to develop and t e s t mode l s that convert global radiat ion t o radiat ion on a surface of any orienshytat i on such as bui lding wal l s and windows the photosynthe t i cally active reg i on of the spectrum i s a l s o important for bioma s s appl i ca t i ons The di ffuse spectra ( sky radiation with the solar disk blocked ) inc luded in the data ba s e were measured a s part o f SERIs res earch data collection t o examine air po l shylut i on effec t s i n the DenverGolden area
Spectral solar rad iat ion data were acquired us ing spectrorad iometers with the fo l l owing character i s t i c s
bull Holographic grating monochromator
bull Wavelength range 0 3 - 1 1 m
bull Bandwidth 0 006 m
bull S canning s t ep s i z e 0 002 m
bull S can t ime 27 s
Several modi f i cat ions were made to these spec troradiometers by SERI [14] A view- l imi t ing tube was placed over the Teflon dome receiver ( d i f fuser) to make direct-normal mea surements ( Figure 3-2 ) For global mea surement s the Teflon dome was replaced by an integrat ing sphere ( Figure 3-3 ) although the Tef l on dome ( Figure 3-4 ) was somet ime s used for gl obal-normal measurements A temshyperature control ler wa s added to each spectroradiometer to maintain the s i l icon detector temperature at 40degC
The spectroradi ometers were cali brated at SERI every s i x months against standard lamps traceable to the Nati onal Institute of Standard s and Technol ogy [ NI ST formerly Nati onal Bureau of Standard s (NBS ) ] In thi s proce s s the spectroradiometers were cal i brated in the laboratory and then compared with one another outdoors (Figure 3-5 ) to determine spectral uncertainty l imi t s prec i s ion ( or repeatab i l i t y ) error s and bias error est imate s
At the measurement s ites the instrument s were checked monthly against a reference lamp ( LI -COR Opt i ca l Rad iat ion Cal i brator ) t o monitor instrument s tabi l i ty these resul t s were reported to SERI (Measurement uncertainty i s reported in detail i n references 1 5 1 6 and a summary i s given i n Section 5 )
Table 3-1 l i s t s the data coll ected to cal culate or spec i fy the atmo s pheric c ond i t i ons and properly document each spectrum in the data ba s e The broadshyband sol ar radiation data were measured to correspond wi th the different specshyt roradiometer measurement modes and to calculate atmospheric descriptors such as Kt Ground albedo was inc luded becaus e it affects both solar radiation
7
SE Imiddot-middot TR-35 1 3A
Figure 3-2 Spectroradiometers equipped with view-limiting tubes to acquire 1direct-normal solar radiation Aluminum foil was placed over
the instruments to reflect radiation and keep the instruments from overheating
Figure 3-3 Spectroradiometers equipped with integrating spheres to measure global solar radiation
8
Fi gure 3-4 Spectroradi ometers equi pped wi th the Tefl on dome recei vers
Fi gure 3-5 Outdoor i ntercompari son of four spectroradi ometers
9
I
Table 3-1 Measurements and Documentation f or
bull Sit e identifiera
Four-l et ter code Longitude ( decimal) Latitude ( decimal)
bull Site
Dat e a elevation ( m)
Day number Year
bull Local standard timea
Hour Minutes
bull Col lection mode for spectral irradiance scan( s) t-0
Two-le tter code Gl obal horizontal - GH Gl obal normal - GN Gl obal til t - GT use
horizontal ( e g 30 Direct normal - DN
til t angle from deg) and azimuth
bull Direc t-no rmal irradiance va lue (Wm2)bull Global-normal irradiance value (Wm2)bull Global-horizontal irradiance value (Wm2)
IllN-Each File in the Spectral Solar Radiation Data Base -
bull Global-tilt pyranomet er value Til t angle o f pyranometer from horizontal
and azimuth Irradiance val ue ( Wm2)
bull I rradianc e-st abil ity check ( silicon pyrheliomet er)b
bull Irradiance-stability check (silicon pyranomet er )b
bull Spectroradiometer scan( s) ( 2-nm step size) ( Wm2-nm)
bull Repeat of broadband irradianc e measurement s b
bull Ambient t emperature (degC) bull Surface pressure (mb) bull Rel ative humidity ( ) bull Average wind speed (mph) bull Ground albedo (measured or estimated)c ( )bull Mul tiwavelength sunphot omet er measurements
( four-channel maximum)d
bull Opaque cl oud cover ( t en ths) bull National Weather Service water vapor
val ue ( em) bull Comment field (15 charact ers)
aLocation dat e and time are used t o calcul ate air mass
bThe silicon inc luded to
pyrhe liomet er1 silicon pyranometer and repeated broadband so lar radiation values allow eval uation of irradiance stability during the spectral irradiance scan
are
cValue s should be repres enta tive of the dominant land-cover type or mixture in the vicinity of t he s pect roradiomet er
dspectral m a surements at several wave leng ths are made using sunphot omet ers with narrow-band filters cal culate atmos pheric turbidity and water vapor
to
VJV1VJtgt
TR-35 1 3A
measured on til ted surfaces and ground-to-sky reflec tions ( especial ly under cl oud cover) Wind speed and ambient temperature were recorded because they may be useful along with the spectral data to predict collector perforshymance The broadband and met eorological sensors were maintained and calishybrat ed by the measurement sites as documented in Sec tion 5
Broadband solar radiation measurements were made immediately ( within 15 s) before and after the spec t ral solar radiation scan to allow evaluation of atmospheric stability at the time of the scan In addition the datashyacquisition software was designed so that global-horizontal solar radiation was sampl ed six times during the spectral scan using a silicon-detector pyrashynome t er if global solar radiation varied by more than 2 the spec tral scan was not recorded Three attempts were made to acquire a spectral scan during unstable c onditions ( such as partly cl oudy skies) I f a scan was not obtained after three t ries the broadband and meteorological data were recorded and then the data acquisition system waited until the next regularly scheduled data acquisition time ( usually an hour) to attempt another spectral scan Because o f the stability monitoring during the spectral scans wemiddot believe there are very few cases when the spectral scan was acquired during variable solar radiation conditions We found three examples of distorted spectra ( see Figure 3-6) that possibly were caused by unstabl e conditions
Software to test the atmospheric stability and acquire the data in a specific format was integrated into the field operations by FSEC and PGampE The format included fields for sit e identification date and time broadband solar radiashytion values atmospheric data spectral solar radiation data and comments In addition an instrument deampcription and configura tion file was stored for each data fil e
The data acquisition software was designed to accept manual ly entered data from sunphot ometers cl oud-cover estimates and Nat i onal Weather Service preshycipitable water vapor measurements However the personnel instruments and measurements were generally not available to enter these data each hour at the measurement sites
The schedule for dat a coll ection was fl exible to accommodate individual site requirements and constraints The goals which were accomplished were to collect data over at l east one year at each sit e t o capture seasonal variashytions and to cover a wide range of atmospheric conditions for each measurement configuration
Measured spec tra and supporting data were sent to SERI on fl oppy disks from PGampE and on magnetic tape from FSEC Daily log sheets that describe the specshytroradiomet er operation and operator comments were included with the data Al l-sky photographs c orresponding to many of the FSEC spectral data sets were provided by the FSEC Fenest ration Energy and Illumination Performance Research Program ( Figure 3-7) Al l-sky photographs were also taken for each of the SERI spec tral data sets ( Figure 3-8) A camera system was installed at PGampE late in the data col l ec tion period but no photographs are available
At SERI the data were processed through an interactive quality-control proshycedure during which the data were visually inspected for obvious probl ems First the inst rument configuration file ( see exampl e in Figure 3-9) was examined against a t emplate from the previous data set to check for any inst rument changes or a change in the mode of opera tion After the operator
l l
middot 400
01+--+----+--+--
U1Ill-25 0Day No 205 1987 (a) 1= 25 Day No 319 1987 (b)Oslash a -E c Nc
N 0 IDistorted direct-normal E CJ bull= m
E 15 Distorted direct-normal spectrum 15 spectrum at 10316 cl
Q)Q) 00 c co c 056 g 105
shy t -
300 500 700 900 1100 300 500 700 900 1100 Wavelength (nm)Oslash Wavelength (nm)
Day No 319 1987 Day No 319 1987 25 1200 (c) (d)Distorted global normal spectrum E ltilc at 10316 E_
N E 800 15 Q) 0 Q) c Direct0 Global tilt c normalco Global6 056 co
horizontal
300 500 700 900 1100 6 8 12 14 16 Wavelength (nm) Time
Figure 3-6 Examples of the very few distorted spectra in the data base (a b c) Broadband solar radiation data (d) corresponding with the spectra in b and c show that irradiance was decreasing at 1031 due to partly cloudy conditions JOIwU11-w
xgt
S5 llifl TR-3 5 1 3A
Figure 3-7 Example Qpound all-sky photographs acquired at FSEC These photog aphs proviGed evidence f rain possible condensation oa optics and ducls
Figure 3-8 Example of all-sky photograph acquired at SERI with a disk blocking sun to show diffuse sky conditions
13
---middot---------middot---------middot---------middot---------middot---------middot---middot --middot---------middot--------middot
TR-3 5 1 3A
t(OK P 11 buy this) Press [Helpl for help
CHN PARAHETER +-------INSTRUHENT----------+ +--CALIBRATION-+ OUTPUT rom NO TYPE HAICER TYPE SERIAL FACTOR- DATE --UNITS NOTES
1 Dir NorR Eppley NIP 17828E6 680 11-187 WRA2 2 Clo NorR EPPLEY PSPH 17863F3 811 11-187 WRA2 3 Glo Horz Eppley PSP 17863f3 811 11-187WfRA2 ltl Glo Tilt EPPLEY PSPT 17863F3 811 1-187 RA2 5 Dir N Si Unused Unused Unused -9900 -1-1-1 WRA2 6 ARb TeRp TAYLOR HGGLASS 00718C LOO 11-187 Deg C 7 Surf Pres OBSERVER ELEVATION RIORDAN -9900 -1-1-1 Hillibar atilde8 Rei HuR DC DIGITAL XXXXXC 100 -1-1 1 Percent 3 9 Wind Spd OBSERVER OBSERVD STOFFEL -9900 -1-1-1 KetersS 3
10 I Albedo Unused Unused Unused -9900 -1-1-1 Percent 11 Phot 380 S TEIC SUNPHOT SPH7624 66300 10-184 Countamp 3 12 Phot 500 SOHOTEIC SUNPHOT SPH7524 77500 10-184 Counts 3 13 Phot 860 SOHOTEIC SUHPHOT SPH7524 45700 10-184 Counts 3 14 Phot 942 SONOTEIC SUNPHOT Unused -9900 -1 1-1 Codnts 1 15 Opq Cloud OBSERVER OBSERVER STOFFEL 100 -1-1-1 Tenths 16 H20 NWS NWS SONDE STAPLETON 100 -1-1-1 CR 17 Spect 11 LICOR LI1800 PRS158 100 9-187 Wsq RlnR 2 18 Spect 12 Unused Unused Unused -9900 -1-1-1 Wsq RnR 19 Glo H Si LICOR SIPYRAN PY1245 811 11-187 WRA2
Figure 3-9 Example of the instrument configuration data -eeorded with the measured data J-middot middot
approved the configura t i on tabl e the template was updated and the informat ion was wri t ten to the data base
Figure 3-10 shows an-exampl e of the comput er terminal output dur ing the cond step o f the qua l i ty-control session
The informa t i on displayed ( see c i rcled nu bers in Figure 3-10) inc luded the foll owing
1` Si te dat e day number standard t ime lati tude l ongi tude and number o f attempts to acquite the spectrum as cont ro l l ed by the atmospher i c stab i l ity monitor
2 Plot o f the spectrum with the mode of operat ion printed bel ow the plot
3` Indicat ion o f stabi l i t y based on the before-scan and after-scan me iureshyment of gl obal-horizontal solar rad iat ion from the iil i con pyranome t er ( although the measurements by thi iiJtrument ciuring the _scaq are actual l y used to test f o r atmospheric stability)
4 Graphic descr i p t i on o f the az imuth and zenith angles of the sun
14
y I
r
ijn 2PR
1100300
II I -
38 50
94
-99
l
IlIllN
lt ltX) Softwa re by M Rymes 0
2 t N AFT BEF a DN 864 863
0 1K SN 852 852 reg A GH 1007 1005 8 SH 984 981 I GN 1089 1088
IL GT 924 920
DN SN GH SH GN GT T Azimuth Zenith reg T 27 c
679 9132 1019 mb V1 RH 73
0 reg ws 4 ms AL 136 Wm2
-99 Co -99 Co
86 -99 Co -99 Co
cc -99 wv
110 mm
300 Di r Norm Glo Norm 1100 FSEC 051387 (Day 133) 1030 2840N 8060W 1 tries G)
terminal output during a quality-control session o--3Figure 3-10 Example of the computer lt1 wV1 wgt
I
TR-3 5 1 3A
5 Bar graph of the before-scan broadband measurements of direct-normal ( thershymopile detec t o r ) DN direct-normal ( silicon detec t or ) SN global-horizontal ( thermopile ) GH gl obal-horizontal ( silicon ) SH gl obal-normal ( thermopi l e ) GN and global-til t ( thermopile ) GT solar radiation The darkened bar graphs show the integral of themiddot spectral middotso lar middotradiation llm))(0 3-11 which is printed under the bar graph Before-scan and after-scan broadband values are printed to the right of the bar graph
6 Listing of the supporting data The first five values are t emperature T pressure PR relative humidity RH wind speed WS and ground-reflected solar radiation AL used for albedo calculations The remaining fie l ds were not used for this data base and were included for future data col lecshytion projects
This quality-control process was performed short ly after the data arrived a t SERI to flag obvious field probl ems The operator could add comments to the data fil e after viewing the information in Figure 3-10 The software also calculated atmospheric descriptors such as Kt and then the data and descripshytors were writ t en to the data base Quantitative qua lity control was applied iu the post-processing of the data base ( described in detail in the appendix )
We chose to include all data in the data base and to be as specific as posshysible about the measurement uncertainty rather than set stringent criteria for excluding data sets This allows users to select data based on their specific application and accuracy requirements or to use portions of the damiddotta sets such as broadband datamiddot or spectral solar radiation segm(nts None of middot
the data should be used without referencing the measurement uncertainty
16
40 CONTENTS OF THE DATA BASE
A t otal of 3 364 spectral data sets ( 16 Mb) are included in the data base
bull 1 4 1 5 Direc t normal
bull 899 Global normal
bull 542 Gl obal horizontal
bull 455 Global tilt
bull 5 3 Dif fuse
I f the data acquisition systems were operating but the atmospheric conditions were too unstable to record a spectrum the broadband and meteorol ogical data were inc luded in the data base but no quality-control processing was applied
FSEC normally operated two spectroradiometers simultaneously one in the direct-normal mode and the other in one of the global modes PGampE operated one spectroradiometer and rotated through the different measurement modes SERI collected direct-normal global-horizontal and dif fuse-horizontal specshytra mostly during cl oudless-sky conditions
Examples of the spec tra are shown in Figures 4-1 through 4-5 Figshyure 4-1 ( a b) shows examples of spectra measured at FSEC in the direct-normal and global modes on a clear day As air mass increases the direct-normal spectra ( a) shift toward longer wavelengths ( the red end o f the spect rum) The global spectra ( b) are slight ly l ess affec ted by the red shift because the radiation scattered out of the direct beam is added back int o the gl obal spectra as diffuse radiation thus returning a portion of the short-wavel engt h ( blue) radiation Figure 4- l ( c) shows the broadband solar radiation corresponding to the spectra
Figure 4-2 shows exampl es of spectra measured under cloudy skies The directshynormal spectra ( a) are almost zero and the global-til t spectra (b ) have low values The graph o f corresponding broadband solar radiation ( c ) shows nearly zero direct normal the global values approach each other becausemiddot all of the irradiance is diffuse under cl oudy skies
Figure 4-3 shows examples of spectra measured on a partly cl oudy day The graph also shows an exampl e of data dropout during data transfer The shape of the spec t ral curve is quite diff erent for low-intensity spec tra measured under cl oud c over ( 10 3 1 air mass 1 88 13 3 1 air mass 1 7 3 ) versus the lowshyintensity spec t rum at higher air mass values ( 1 6 3 1 air mass 5 48 )
Figure 4-4 shows two exampl es of spectra that appear to correspond with sun reflections o f f of clouds which causes a bright spo t [ 1 7 ] and a focusing effect on the solar radiometers The broadband solar radiation values can actually approach or exceed the extraterrestrial value of about 1 3 3 8 on day number 1 3 2 1 3 3 The global solar radiation values approach each o ther while the direct-normal radiation drops indicating that the solar disk is partially blocked by c l ouds
1 7
25 Ec
C1E 1 5
Q)()cctS0 05ctS
Day No 53 1 988 1ico(a) Direct Normal Spectra 0931 to 1 631 ()lt(OJ
00 500 700 900 Wavelength (nm)
EcE
Q)()cctS
0ctS
25
1 5
05
Day No 53 1 988 Global Normal Spectra
931 to 1 631 (b)
300 500 700 900 1 1 00 Wavelength (nm)
1 200 Day No 53 1 988 (c)
cJE
800 Q)()cctS 4000ctS
Global tilt
Global horizontal
0 6 8 1 0 1 2 1 4 1 6 1 8
Time
Figure 4-1 Examples of a) direct-normal and b) global-normal spectra and c) broadband solar radiatio n measured at FSEC o n a clear day
18
0+-+--+-f=t-=F==F==t=P=T==t--+-===+----f
TR-35 13A
- 20 E
Clc E
1 0 Q)()sect 0
300 500
- 20 E
C1c E
1 0 Q)()c laquoS 0laquoS = 00
300 500
1 200
ClE
800 Q)()c -C 400 laquoS
0 6 8
Day No 273 1 987 Direct Normal Spectra
831 to 1 231 (a)
700 Wavelength (nm)
900 1 1 00
Day No 273 1 987 Global Tilt Spectra
831 to 1 231 (b)
700 Wavelength (nm)
900 1 1 00
Day No 273 (c)
middot Global no rmal Global tilt Global horizontal
1 0 1 2 Time
1 4 1 6 1 8
Fi gure 4-2 Examples of (a) direct-normal and (b) global-ti lt spectra and (c) broadband solar radi ation measured at FSEC on a cloudy day
19
I
EcCl
25
E 1 5
Q)()cctl 05
Day No 353 1 986 Global Normal Spectra
Wavelength (nm)
Day No 353 1 986
Fi gure 4-3 radi ati on (lower) measured at FSEC on a partly cloudy day The
-ClE Q)()cctl
1 200
800
400
0
Time
lilobal normal
8 1 0 1 2 1 4
Global horizontal
16 1 8
TR-3 5 1 3A
Examples of global-normal spectra (upper) and broadband solar
spectrum at 1631 shows data dropout duri ng data transfer
Figure 4-5 shows examples o f d i rect-normal gl obal-hor izontal and d i f fuseshyhorizontal spec t ra measured by SERI The di ffuse radi a t i on is most ly concenshytrated in the short-wavelength ( visible) region of the spect rum ( blue sky) The global-ho r i zontal spectrum is equal t o the direct-normal spec t rum mul t i shypl ied by the c osine o f the zenith angle plus the diffuse spec tral radiat i on
The cumula t i ve number o f these spec t ra versus air mass the atmospher i c descriptors Kt Kn DGH and rel at ive humi dity are shown 1n Figshyures 4-6 ( a-f ) The large number of spec t ra at low air mass values is caused by t he opera t i on of the spect roradiometers dur ing normal working hours at midshylat itudes and by the larger air mass values oc curring near sunr ise and sunset whi ch occupy a relat ively smal l frac t i on of the day The large number o f spec tra duri ng relat ively c l ear sky conditi ons i s due t o sdec t i on of clear days for the data taken at SERI the requirement for atmospheric stability during spectral scans and perhaps cl imate types at the three sites Figshyure 4-6 ( c ) shows tha t relat ive humi dity measurements were missing for about 25 global-normal spectra The dif fuse spec tra assoc iated wi th DGH rat i os near 1 0 indi cate very clear condi t i ons where dif fuse measurements are probably within the measurement uncertaint y
20
1200I -
u a
Wmmiddot2)1 I
v+--+--
˜
middot (a) (b) Global normal
(c) Global horizontal (1403
15
InIllDay No 132 19 7 Day No132 1987
Global Normal Spectra 900 to 1 63 0-- 25
clra -Ec bat horizontal Global tilt cJ
N E 800 15 - Q cbull
g 400ctl red - 0 5 ctl I
0 300 500 700 900 11 00 6 8 1 0 12 14 16 18
Wavelength (nm) Time
Day No133 1987 Day No 133 198V
Global normal Global Normal Spectra N 730to 1430 2 5middot Glob tilt
(d) Ec
E 1000
- 500 gctl ctlmiddot- 0 5 -g 1
300 500 700 900 11 00 6 8 1p 12 14 16 18
Wavelength (nm) Time
igure 4-4 Examples pound solar spectra enhanced by cloud bright spots (a) at 1031 on day 132 and (c) at 1230 on day 133 and correspondin [(b) and (d) re pectively] broadband solar radiation J
w111wgt
I
OlDay No 328 1987 0
(a) r1052to 1231 ltt-- 2 5 0
E CDc )E Direct Normal
1 5 Q)C)cro5 05ro
300 500 700 Wavelength (nmr
900 1100
- 25 Ec
E 15
Q)C)cro5 05ro=
Day No 334 1987 1222to 1508
Direct Normal
(b)
300 500 700 900 1100 Wavelength (nm)
Figure 4-5 Examples of direct-normal global-horizontal and diffuseshyhorizontal spectra measured by SERI on two days
Inc luded on the data tape are daily f i eld notes qua l i t y control informa t i on and measuremen t uncertainty Thi s informat i on alert s the user t o problems such as data dropout s ( a s seen in Figure 4-3) and noise in the spectrum (Figshyure 4-7 ) Thi s informa t i on should always be revi ewed when any s pectraL data s e t s are u sed
Phot ographs or s l i de s corre sponding to many of the spectral data s e t s are avai lable at ERI The daily f i eld no t e s that are inc luded wi th the dat a base document the exi s t ence and qual ity of the pho t o s slides
2 2
--------I-
J v l----
r
---
_rV I--
I v
f-
v
I II
I I
___ v -
---- --
I )
-I
v --- --------v f-----
40
TR-3 5 1 3A
LO Direct Normal Spectra vs Air Mass Global Normal Spectra vs Air Mass i40
30ct1E -
lt( 20
1 0 0 400 800 1 200 1 600
40 - -middot 30coE lt( 20
1 0 0 200 400 600 800
ltlil
Number of spectra Number of spectra
Global Horizontal Spectra vs Air Mass Global Tilt Spectra vs Air Mass
40
UJUJco_E -
30 bull
lt( 20
30 coE -
lt( 20
1 0 1 o
Diffuse Spectra vs Air Mass
0 1 00 200 300 400 5000 200 400 600 Number of spectra Number of spectra
40
coE lt(
30
20 bull
1 0 0 1 0 20 30 40
Number of spectra 50
23
I )
v 1-
I--v
( I
)
v --1------I--__
1 I
--l---
If 1
v 1---1-
-_ I---
l u
-----
v I I
----f--e--r-----
I If-
1--- middot
---
100
60
20
Direct Nermal Spectra vs Kn
0 400 800 1200 1600
100
60
0
Direct Normal Spectra vs Kt
400 800 1 200 1600
TR-35 13A
Number of spectra Number of spectra
Figure 4-6 (b) The cumulative number of spectra (horizontal axis) measured over a range of air mass and atmospheric descriptors (vertical axis)
100
60I
20
Direct Norma Spectra vs DirGH
400 soe 1200 160CJ Number of spectra
Direct Normal Spectra vs Rei Hum
6 100
- 60sQ)gt
g 20Q5a 0 400 800 1200 1 600
Number of spectra
c
100
60
20
0
Global Normal Spectra-vs Kn
300 600 900 Number of spectra
Globa Normal Spectm vs DirGHtOO
I 60
20
0 300 600 900 Number of spectra
Global Normal Spectra vs Kt 100
602
20-
0 300 600 900 Number of spectra
Global Normal Spectra vs Rei Hum 100
6E) 60s Q)gt
Q5 20a
a 300 600 900 Number of spectra
Figure 4-6 (c) The cumulative number of spectra (horizontal axis) measured over a range ofmiddot air mass and atmospheric descriptors (vertical axis)
24
f--f--
-I
lJ
1--f-- v
I 1
f--f-
v
1------
1--
( j
---
--
( I
J
1--- -
v
) -----
(
l) __---
v I
1 00
c 60
20
1 00
I 60Q0 20
Global Tilt Spectra vs Kn
0 1 00 200 300 400 500
Global Tilt Spectra vs Kt
Number of spectra
Global Tilt Spectra vs DirGH
Number of spectra
0 1 00 200 300 400 500 Number of spectra
0
1 00
60
20
0 1 00 200 300 400 500
1 00 2-5EE 60 Q)gt-Qi 20a
Global Tilt Spectra vs Rei Hum
1 00 200 300 400 500 Number of spectra
Figure 4-6 (d) The cumulat ive number of spectra (horizontal axis) over a range of air mass and atmospheric descriptors (vertical axis)
Global Horizontal Spectra vs Kn 1 00
c 60
20
0 200 400 600
1 00
60sz
20
Global Horizontal Spectra vs Kt
200 400 600
TR-35 13Amiddot
measured
Number of spectra Number of spectra
Global Horizontal Spectra vs Global Horizontal Spectra vs DirGH Relative Humidity
0
1 00
I 60G
20
0 200 400 600 Number of spectra
0
2-1 00 5EE 60 Q)gt
Qi 20 a
middot
200 400 600 Number of spectra
Figure 4-6 (e) The cumulative number of spectra (horiz ontal axis) measured over a range of a1 r mas s and atmospheric descriptors (vertical axis )
2 5
v-L-
1-----lr--f-
_ v
I
_J7 r
----
v -
_ 1----
___ ---f--
II (
I
r r-[--
r
v---
- 25
1 5
Diffuse Spectra vs Kn 80
70
c 60
50
0 1 0 20 30 40 50
TR-35 13A
Diffuse Spectra vs Kt 85
2 65
75
1 0 20 30 40 50
Number of spectra Number of spectra
Diffuse Spectra vs DirGH Diffuse Spectra vs Relative Humidity
0 1 0 20 30 40 50 0 1 0 20 30 40 50 Number of spectra_ Number of spectra
95 middotE 50
75 Qi 1 0
70
5J
c 30
secta -
Fi gure 4-6 f ) The cumulati ve number of spectra hori zontal axis) measured over a range of air mass and atmospheri c descri ptors verti cal axis)
1 05
r 85
EclE
Clluc m =g
300 500 700 900 1 1 00
05
Day No 2 1 6 1 987 Global Normal Spectra
730 to 1 5 30
Wavelength (nm)
Fi gure 4-7 Exampl es of spectra showi ng noisy data i n the ultravi olet 300shy400 nm) and near-inf rared 1000-1 100 nm) regions
26
5 0 MEASUREMENT UNCERTAINTY
( No t e Thi s s ec t ion contains only a brief summary o f the total uncertainty The deta i l ed reports [ 1 5 1 6 ] on the methods used to e s t imate tota l spect ra l measurement uncertainty should he consul ted- when using thi s datamiddot middot ba se )
The data set de scribed in thi s document i s the bes t set of measurement s posshys ible wi th the personnel equipment methods and cal i brat i on procedure s avai l able t o us We found that making continuous measurements wi th complex s ens i t ive equipment and account ing for all source s o f error in order to specify total mea surement uncertainty were not triviaL tasmiddotkamp oo
The e s t imat ed total uncertainty ( 95 confidence int erval ) for each of the spec troradi ometers and each of the measurement modes is shown in Figure 5-l The upper and l ower spec tral uncertainty limi t s are symmetrical except when gl obal-t i l t or gl obal-hori zontal s pectra were measured us ing the integrat ing sphere and when a s t rong direct-beam component wa s present ( Kt gt 6 0 ) We added an 8 maximum bias to the l ower uncertainty l imi t s for these cases based on resul t s o f experimen t s in whi ch we mapped the integrat ing sphere res ponse under bri ght sun wi th the image o f the sun in di f ferent locations on the ins ide of the sphere During the se exper iment s we observed variat i on s o f up to -8 compared t o the calibrat i on point
The high uncertainty in the abso lute value o f the spectral measurement s l e s s than 0 45 m wa s caused by l ow s pectra l irradiance for the calibrat i on l amp s which resul ted in a l ow s i gnal-t o-no i s e rat io for the spec troradiorriet er cal i shybrat ions ( F igure 5-2) In add i t ion we experienced a change ( i e l o s s o f respon s e ) i n the ultraviolet ( UV ) re sponse of the instruments when us ing the integrating sphere s
To tal uncert ainty i s a combinat i on o f an e s t imated total spectral bias error and to tal spec tral random error The f inal est imated total uncertainty for a 95 conf idence interval i s calculated as the
random (R) error root- sum-s quare of the bias ( B)
erro r plus two t ime s the
To eva luate instrument-to-instrument d i f ferences or variabi l i ty ( al s o called between-inst rument prec i s i on ) s imul t aneous spectral solar radiat i on s c an s were made wi th each ins t rument in each conf igurat i on The s tandard devi a t i on of the se mea surement s mul t i plied by three was converted to a percentage o f the mean Thi s percent age ind icates the expected instrument-to-instrument varibi l i t y or prec i s i on for thi s set of instrumen t s Fi gure S-3 shows the resul t s obtained for one o f these compari sons us ing the integrat ing s phere s Simi lar resul t s oc cur wi th the other conf igurations The between-inst rument prec i s i on above 0 4 m i s close to 5
Temperature control o f the spe ro adiorrieters with s i l icon detectors wa s import ant Figure 5-4 shows the change in the res pori se o f the instrumen t s espec i a l ly in the near- infrared when o perated at d i fferent control temperashyture s Uncertainty of l deg C in the set point resul t s in about a 2 uncertainty in the near-inf rared measurement s On ho t days we found that the t emperat ure
2 7
(
-Lower
r --
I IV
limityen(-)
-
A u1pp r li it +) f I II I
y 1 I rl ( I _ L
-
-
I I )
f--+- -+--+--1-+---+--1- r--J- Upper -c- A I u o t-iE $ == $= =$S y I I I I t (
1 --( -
----L---------------------- -_j_j_J__J__J__J
TR-35 1 3A
20
c(ij 0tQ)ucJ -20
Global (Sphere) 1 02 1 58 1 74
limit (-) Kt lt 60 Upper limit ( +)
Lower Kt gt 60
(a)
20
c(ij 0t
5 -20 L t )ower 1m1 -
300 500 700 900 1 1 00
Wavelength (nm)
Global Normal (Domes) 1 74 2 1 8 (b)
300 500 700 900 1 1 00 Wavelength (nm)
Direct Normal 1 58 1 72 1 74 (c) 20
limit ( +)gt- iQl u Lower 1m1 -) 5 -20
300 500 700 900 1 1 00 Wavelength (nm)
Figure 5-l Estimated total spectral measurement uncertainty f or global measurements with the i ntegrating spheres on (a) units number 102 158 and 174 (b) global-normal measurements with the Teflon dome receivers on units 174 and 218 and (c) directshynormal measurements with the view-limiting tubes on units 158 172 and 174 The measurement uncertainty is synmetrical except in (a) where a -8 bias is included in the lower limit f or global-horizontal and global-tilt cases due to nonunif orm sphere response when a str ong direct-beam component is present
28
I I
0
0 (J) ()
- 1 0
t U
TR 35l3A
Wavelength (nm)
Figure S-2 Comparison of the spectral intensity of an out door global-normal measurement and the NIST calibrationmiddotmiddot lamp source L ow lamp values below 400 nm result in high measurement uncertainty
20
1 5
R 1 0
X 5Q)0c c 0
-5 Q)_0
300 400 500 600 700 800 900 1 000 1 1 00 Wavelength (nm)
Figure S-3 Between-ins trument precis ion for glo bal-normal spectral solar radiation measurements us ing the integrating spheres
29
5 1 deg C N
ij0
()00- caQ)uc
1 000 Q)-Q) 8 0950 0ca
c 0900
0 300 500 700 900 1 1 00
Wavelength (nm)
Figure 5-4 Ratio of the spectroradiometer detector response at different temperatures to the response at 40deg C
o f the detectors ( contro l l er s ) somet imes exceeded the set point and we experienced runaway temperatures Thi s resul ted in ampl i f i er mi l l ivolt drift errors and no i s e in s ome o f the s pectra We achieved better t emperature conshytrol by shield ing the spectroradiometers with Mylar sheet s supported by foam offsets to allow air flow
Mea surement uncertainty for the broadband and meteorological data i s based on the cal ibration hi s tories provided by the mea surement s i t e s and charact ershyi s t i cs of the instrument s Thi s information is given in Tables 5-l through 5-3 and the values are included on the data-ba se tape
In these table s the measurement uncertainty for a 95 confi dence int erval was e s t imated by root-sum-s quaring the est imated bias errors a d by doubl ing the random errors in the cal i brat i on proce s s and measurement s [ 15 1 6 ] Radishyometers used at PGampE in 1987 were po st-cal i brated at SERI allowing e s t imate s of the random calibrat i on error component the radi ometers used i n 1988 were cal ibrated elsewhere so nominal e s t imated errors were used in the uncertainty analys i s Ins t rument s used at SERI were pre- and po st-cal ibrated at SERI Instrument s used at FSEC were cal i brated by FSEC and nominal values for random and bias errors for the s e types of radiometers were used in the uncershytainty analys i s Cal i brat i on informat ion for the meteorological instrument s i s included i n these tables but no mea surement uncertainty analys i s was performed
30
H 11 VI _ w
Jgt
--
IllIll
Tabl e 5- l FSEC Instrument Calibrat ion Hi story Ul d Estimated Meas urement Uncert ainty N-
Es timated Beg i nn ing Calibrat ion Measurement
Channe l iF Meas urement Instrument Comment s Time Stamp Date Uncertainty
( )
1 Direct normal 862961507 Eppley NIP 14306 E6 5-86 ( thermopi l e ) 863520931 Epp l ey NIP 23943E6 12-86 plusmn2 9
8801 2093 1 Eppl ey NIP 23943E6 12-87 1 32 change
2 Global normal 862961507 Eppl ey PSP 24185F3 Eppley PSP 24185F3 1 1-86 1 6 7 change plusmn3 8
872881032 Eppley PSP 18273F3 4-87 880120931 Eppley PSP 24185F3 1 2-87
3 Globa l hori zontal 862961507 Eppl ey PSP 1 43 2 1 F3 4-86 ( thermopi l e ) 8709 3 1 6 3 1 Eppl ey P S P 14322F3 1 2-87 -- plusmn3 8
w _ 872881032 Eppley PSP 143 18F3 4-87
4 G lobal t i l t 86329103 1 872881032
Eppley PSP 24183F3 Eppley PSP l4320F3
1 1-86 4-87 -- plusmn3 8
880120931 Eppley PSP 24183F3 1 2-87
5 D irec t normal 8629 6 1 507 Mat r ix NIP3826 9-86 ( si l i con) 88012093 1 Matrix NIP3826 12-87 1 32 change plusmn2 9
6 Temperature 862961507 Weathermeasure 1 7 7
1420A 6-86 3-87 8-88
smal l changes the cal ibratiqft factor was changed i software
7 Pressure 86296 1507 Weathermeasure 1 70 5 1-86 smal l c anges the 1 7 8 5-87 cal ibra t i on factor was
Hmiddot 6-88 changed i n software
8 Relat ive humi dity 8629 6 1 5 0 7 Weathermeasure 1 54 0 6-86 Cal culated from dew 175 point compared every
o ther week wi th another instrument
9 Wind speed 862961507 Weathermeasure 1 222 7-86 smal l chlnges the 1219 3-87 cal ibrat i o fac tor was ---
6-88 changed in software
J
-
Ill _-
bull I
Table 5-l FSEC Instrument Calibrat ion Hi stb y and Estimated Measurement Uncertainty (Concluded)
Channel Measurement Beginning Time Stamp ihsttument Cal ibrat ion
Date Comment s
Estimated Measurement Uncertainty
( )
INN
10 Albedo 86329103 1
87288103 2
Eppley PSP 1629 FJ Eppley PSP l 106Srl
1 1-86
4-87
-- plusmn3 8
19 Global hori zontal
( si l i con)
862961507
87 148143 1
LI-COR Py PY22J6 LI-COR yt PY2279
7-86
5-87
plusmn3 8 --
Mo wV11-wgt
I
--
p V1 1-
--
--
--
UlIllN-
Tabl e 5-2 PGampE Ins trument Calibrat ion Hi s ory and Estimated Measurement Uncertainty 1 _
Estimated Beginning Pre- Po st-Channe l if Measurement Instrument Comment s Mea surement
Time S tamp Cal ibra t i on Cal ibrati on Uncertainty ( )
l D irec t normal 87 1 100632 Eppl ey NIP 255 08E6 1-86 8-88 0 3 change plusmn2 8 ( thermopi l e ) 880190 752 Eppl ey NIP 255 10E6 12-8 7 -- plusmn3 6
2 G lobal normal 87 1 100632 Eppl ey PSP 2 32 02F3 1-86 8-88 1 7 change plusmn2 4 880190 7 5 2 Epp l ey PSP 23996F3 12-87 -- -- plusmn4 7
3 G lobal hori zontal 8 7 1 1 00632 Eppley PSP 23995E3 10-84 8-88 3 2 change plusmn2 8 w w
( thermopi l e ) 880190 752 Eppl ey PSP 25390F3 12-8 7 plusmn4 7
4 G lobal t i lt 8 7 1 1 00632 Epp l ey PSP 25387F3 12-84 8-88 0 2 change plusmn3 8 -- plusmn4 7 880190 752 Eppley PSP 23201F3 12-87
5 D irec t normal 8 7 1 100632 Matrix NIP 38Hi 5-86 7-88 2 7 change plusmn2 2 ( si li con)
6 Temperature 8 7 1 1 00632 Omega T-coupl e
7 Pres s ure 8 7 1 1 00632 Yel l ow Springs 2014-22 3 1 -HA- 1-WH 15593 3-84
8 Relat ive humi dity 87 1 100632 Hygr o 14276 2-85
9 Wind speed 8 7 1 1 00632 8804007 3 7
Weathert ronics Weathertron i c s
2301 230 1
184 184
9-82 2-88
10
19
Albedo 8 7 1 1 00632 Eppl ey PSP 2 1235F3
Globa l hori zont al 87 1 100632 LI-COR Pyr PY5558 ( s i l i con)
Beginning about 8 7 2 1 1 the s i l i con NI P va lues appear cons i s tent ly l ow
-- 8-88 2 4 change
1 1-83 8-88 1 9 change
may be an al ignment problem
plusmn2 6
plusmn2 6
gt-3 Iw
wgt
-- --
--
-- --
1ftIll -
Table 5-3 SERI Instrument Calibration Hi story and Estimated Measurement Uncertainty =
Estimated Beginning Pre- Post-Channel I Measurement Instrument Comment s Measurement Time S tamp Cal ibration Cal ibration Uncertainty ( )
1 Direct normal 87328 Eppley NIP 1 7828E6 11-87 2-88 1 5 7 change plusmn3 3 ( thermopil e )
2 Global normal None
3 bull Global horizontal 87328 Eppley PSP 1 78 63F3 1 1-87 2-88 2 22 change plusmn3 7 ( thermo pi l e ) a t Welby
w+- At SRRL 8805 7 Eppley PSP 200 79F3 7-87 8-88 0 7 3 change plusmn2 3
4 Global t i l t None
5 Direct normal None ( si li con)
6 Temperature 87328 Taylor Pocket 21430-1 10-86 (Due 10-9 1 )
7 Pressure Cal culated from elevat ion
plusmn0 2 (deg )
8 Relat ive humidity 87328 Dickson 86 100-1 9-87 10-88 -- plusmn2 ( counts )
9 Wind speed Observat ion
10 Albedo -- None
1 1-14 -- Sun photometer ( relative compari sons only)
15 Cloud c over Observed o-3-- lXlIw Global Ho rizontal -- LI-COR Pyr PY1245 11-87 2-88 3 67 change plusmn2 9 V119 ( si l icon) ( s tabi l i ty monitor only) wgt
TR-35 13A
We urge users of the data ba se to refer to the dai l y f i eld no tes for s pe c i a l c i rcumstances recorded b y the operator that may affect data uncertainty The s e no tes include references to the spectroradiometer t emperature c onshyt ro l l e r solar-tracking accuracy and weather cond i t i ons ( such as rain ) Included in the dai l y notes on tbe data-base tape are obs ervat i ons made in qual i t y-control processing as wel l as references to the exi s t ence and qual i t y o f pho t ographs or s l ides
Quant i tat ive pos t-proces s ing qual i ty-control informat i on i s al s o inc luded on t he data-bas e tape and a complete descript ion is given in the appendix o f thi s report Redundant measurement s ( such as before- smiddotcan andmiddot middot aft et-smiddotcan
broadband solar radiat i on direct-norma l and global-hor izont al mea surement s with both thermopile and s i l i con detectors ) and compar i s ons o f integrat ed s pectral so lar radiat ion wi th broadband s o lar radiat i on were used in the qual i ty-control procedure s Users are encouraged to perform the i r own qual i t y-cont rol proce s s ing on the data t o meet their par t i cular requiremen t s
3 5
6 0 FORMAT OF THE DATA TAPE
The meas ured dat a f i eld notes quali ty-control informa t i on and mea surement uncertainty are s t ored on magne t i c tape in 80-character l ines wi th the fi leshyname s given in Table 6- 1 The f i l enaming convent ion used for the mea sured data was
Filename Content
FLA8705 DAT FSEC data 1987 May PGE880 l DAT PGampE data 1988 January SER8 7 1 1 DAT SERI data 1987 November
Data were not acqui red in a l l months so the months may not be cont iguous
Qua l i t y-control informa t i on has the same f i l enaming conven t i on with QC extens ion ( for example FLA8 705 QC ) Dai ly notes are contained in the f i l e s FSEC NOTES PGE NOTES and SERI NOTES respec t i vely The mea surement uncershytainty is in the UNCERT f i l e s
c The DAT f i l e s contain two types of informa t i on D for data and for inst rument configurat ion The f i r s t l ine of a data or confi guration segment beg ins wi th a D or a c re spect ively in the f i r s t column followed by the s i t e year day and t ime stamp the number of l ines in the segment i s in column-s 76-80 so that the user can eas i ly skip the de s i red number of l ine s An example of the information in the conf iguration or 1 1C segment i s
c shown in Figure 6-1 I t begins wi th a followed b y the s i t e FSEC year 11 1 98 7 day 122 and t i me u0830 latitude longi tude and eleva t i on There are 19 channel s for mea surement s zero s pectra in the C segment and 40 l ine s in the segment The con f i gurat ion informa t i on appear s whenever the inst rument set-up or cal ibrat ion wa s changed or t he data acqui s i t ion sys t em wa s res tarted I f the configurat i on wa s not changed at the beginning of the month the configura t i on segment wi l l be in the previous mont h s DAT f i l e
An examp le of a D segment i s shown in Figure 6-2 Thi s segment contains the mea s ured me teoro logical dat a broadband and spectral solar rad i a t i on dat a and anc i l l ary data The data contained in each l ine and column and i t s format are as follows
POS ITION OF VARIABLES IN THE D SEGMENTS (ALL LINES ARE 80 CHARACTERS )
Line Column Cont ent s Format
a = character 1 = integer f = f l oat ing point
LINE 1 1 1 D ( for data ) ( a l ) 3 1 5 Site Year Day Number Time Stamp ( a 1 3 )
3 6 F SEC PGampE o r SERI ( a4 ) 7 8 Year (a2 or i 2 ) 9 1 1 Day Number ( a3 o r i 3 ) 1 2 15 Standard Time ( a4 o r i4 )
36
5-111 - il ll
Da i ly
Uncertainty
-
TR-35 13A -
Table 6 1 Namesmiddot of Files on the Data Tape
Measured and
FSEC
FLA8610 DAT FLA8 6 1 0 QC
FLAB 6 1 1 bull DAT FLA8 6 l l QC
FLA86 1 2 DAT FLA8 6 1 2 QC
FLA8 7 0 1 DAT FLA8 70 l QC
FLA8 704 DAT FLA8 704 QC
FLA8 705 DAT FLA8 7 05 QC
PGampE
PGE8 704 DAT PGE8 704 QC
PGE8 705 DAT PGE8 705 QC
PGE8 706 DAT PGE8 7 06 QC
PGE8 7 0 7- DAT PGE8 7 0 7 QC
SERI
SER87 l l DAT SER8 7 l l QC
S ER8 7 1 2 DAT SER8 7 1 2 QC
SER880 1 DAT SER880l QC
SER8802 DAT SER8802 QC
Ca lcui a t ed Data
FLA8 706 DAT FLA8 706 QA
FLA8 7 0 7 DAT FLA8 7 0 7 QC
FLA8 7 0 8 DAT FLA8 7 0 8 QC
FLA8 709 DAT FLA8 7 09 QC
FLA8 7 1 0 DAT FLA8 7 1 0 QC
FLA8 7 l l DAT FLA8 7 l l QC
PGE8 708 DAT middot
PGE8 708 QC
PGE8 7 0 9 DAT PGE8 709 QC
PGE8 7 l l DAT PGE8 7 l l QC
No t e s
FSEC NOTES PGampE NOTES SERI NOTES
Mea s urement
FSEC UNCERT PGamp E UNCERT SERI UNCERT
FLA8 7 1 2 DAT FLA8 7 1 2 QC
FLA880l DAT FLA880l QC
FLA8 802 DAT FLA8802 QC
FLA8803 DAT FLA8803 QC _
FLA8804 DAT FLA8804 QC
PGE_880l DAT PGE880l QC
PGE8802 DAT PGE8802 QC
PGE8803 DAT PGE8803 QC
3 7 _middot
1 3
1 7
55 1 1-1 TR-3 5 1 3A
0 G) 0 G)G) iC FSEC8 7 1 2 2 0 8 1 3 2 8 4 0 0 0N 80 6 0 0 0W 2M C = 8 7 1 2 2 0 8 1 3 8 7 1 2 2 0 8 1 3+0 0 0 0 0 0 1 9 0 4 0
CHN PARAMETER +- - - - - - - INSTRUMENT- - - - - - - - - -+ +- -CALIBRATION- + OUTPUT FOOT NO TYPE MAKER TYPE SERIAL FACTOR DATE UNITS NOTES
1 Di r- Nor-m Eppley NIP 2 3 9 4 3E6 6 08 1 2 - 186 Wm2 2 Glo Nor-m Eppley PSP 2 4 1 85F3 8 85 l l - 186 Wm2 3 G l o Hor-z Eppl ey PSP l 4 3 2 2F3 6 3 8 1 2 - 2 86 Wm 2 4 Glo Tilt Eppley PSP 2 4 1 83F3 8 9 9 l l - 186 Wm2 iacute5 Dir- N S i MATRIX SI NIP 3826 31 8 0 9 - 186 Wm2 6 Amb Temp WTHRMEAS PRT 1 7 7 l 0 0 3 - 1 8 7 Deq c 7 Sur-f Pr-es WTHRMEAS PIEZO 1 7 8 l 0 0 5 - 1 8 7 Mi l l ibar-8 Re1 Hum WTHRMEAS LiCl 1 7 5 l 0 0 6 - 1 86 Per-cent 9 Wind Spd WTHRMEAS OPT CHOP 1 2 1 9 l 0 0 3 - 1 8 7 Met e r- s i S
1 0 Albedo Epp ley PSP l 6 2 9 7F3 1 0 0 9 l l - 1 8 6 Per-cent l l hot 380 Unused Unused Unused - 9 9 0 0 - 1 - l - 1 Counts iacute1 2 hot 5 0 0 Unused Unused Unused - 9 9 0 0 - 1 - l - l Count s
14 hot 860 Unused Unused Unused - 9 9 0 0 - 1 - 1 - 1 Counts hot 942 Unused Unused Unused - 9 9 0 0 - 1 - l - l Counts
1 5 Opq C loud Unused Unused Unused - 9 9 0 0 - 1 - l - l Tenths 1 6 H2 0 NWS Unused Unused Unused - 9 9 0 0 - 1 - l - l em
Spect l LI -COR L I - 1 8 0 0 PRS - 1 7 2 l 0 0 2 - 1 8 7 W sq m nm l Spect 2 L I - COR L I - 1 800 PRS - 1 0 2 1 0 0 2 - 1 8 71 8 W sq m nm l
1 9 Glo H Si LI -COR L I - 2 0 0S PY2 276 8 4 5 7 - 1 86 Wm2 2 - 1 FIN
FOOTNOTES
1 - 1 7 = DN 18 = GT 2 - SERI l oan un i t
- 1 - FIN
Figure 6-1 Example of the instrument configuration data on the data base tape The numbers refer tmiddotO
1 c indicating configuration 2 FSEC 1987 Day 122 at 8 13 standard time 3 Latitude 4 Longitude 5 Ele vation 6 Reference to configuration file that will be f ound in the
data files 7 Starting data-acquisition time plus number of attempts to
acquire spectra (which would extend the data acquisition time)
8 Number of data channels 9 Number of spectra ( 0 f or configuration files 1 or 2 f or
data files) 10 Number of lines in this segment
38
TR35 1 3A
D FSEC8 7 1 2 2 0 8 1 3 2 8 4 0 0 0N 8 0 6 00 0W 2M C=871 2 2 0 8 1 3 8 7 1 220 814+0 0 0 1 0 0 1 9 2 1 0 0 gS e e Q N FSEC8 7 1 2 2 U PRS - 1 7 2 Col 2 ( + - ) U PRS - 1 0 2 Col 2 ( - ) Col 4 ( + ) 1 7 84 5 5 7 54 5 2 9 3 0 2 - 1 - 9 9 0 3 48 0 1 1 9 48 3 3 4 4 2 7 9 - 1 -9 9 0 1 7 85 0 5 7 5 5 7 2 9 3 0 4 - 1 - 9 9 0 3 4 8 1 1 1 9 4 85 3 4 43 0 1 - 1 - 9 9 0 2 8 4 1 80 0
1 0 9 5 4 1 5 - 99 0 7 1 0 1 7 8 6 2 0 7 8 7 5 8 9 1 5 - 1 - 9 9 0 - 1 - 9 9 0 iacute1 1 3 80 0 - 99 0 Co 1 2 5 0 0 0 - 99 0 Co 1 3 860 0 - 99 0 Co 1 4 942 0 - 9 9 0 Co iacute
- 1 6 0 7 1 5 8 5 7 8 5 6 7 1 58 3 86 9 1 9 9 1 8 7 - 9 0 0 - 9 0 0 - 9 0 0 - 9 0 0 - 9 0 - 9 0 3 1 1 7 4 0 1 3 0 0 1 1 0 0 2 0 57 9 8 9 4 0 0 DNT1 8 4 0 1 3 0 0 1 1 0 0 2 0 2 8 4 1 8 0 0 6 2 4 GTS - 1 0 0 0 0 0 0 0 0 0 0 0 - 1 0 0 0 o o 0 0 0 0 o o
1 3 0 0 0 0 0 0 0 0 3 5 0 0 0 4 0 0 2 1 0 02 5 0 0 14 0 04 1 0 02 1 0 0 5 7 0 0 3 8 amp 1 3 2 0 0 0 7 2 0 056 0 1 0 1 0 0 8 1 0 1 1 8 0 1 2 1 0 1 1 9 0 140 0 138 0 1 3 1 amp 1 340 0 1 4 9 0 16 1 0 162 0 1 5 5 0 16 0 0 1 6 3 0 1 8 5 0 1 9 5 0 1 9 8 0 1 9 9 amp 1 360 0 2 0 9 0 2 1 9 0 228 0 2 4 3 0 258 0 26 5 0 258 0 265 0 268 0 2 89 amp 1 380 0 2 8 0 0 2 7 9 0 26 7 0 2 7 3 0 3 0 1 0 3 08 0 3 1 7 0 326 0 349 0 4 0 2 amp 1 4 0 0 0 4 7 6 0 52 7 0 55 7 0 569 0 580 0 5 9 5 0 6 12 0 63 0 0 64 1 0 648 amp 1 4 2 0 0 652 0 6 54 0 6 58 0 649 0 6 36 0 6 3 2 0 646 0 67 8 0 7 1 8 0 746 amp 1 440 0 7 6 8 0 7 9 9 0 82 2 0 854 0 8 7 7 0 9 0 4 0 9 1 5 0 92 2 0 934 0 94 2 amp 1 460 0 9 6 0 0 964 0 9 7 0 0 9 7 3 0 96 9 0 9 74 0 9 9 0 0 9 9 9 1 0 1 7 1 028 amp 1 4 8 0 1 0 3 3 1 0 25 1 0 0 6 0 9 9 1 0 9 9 0 1 0 1 0 1 026 1 0 3 8 1 043 1 0 4 7 amp 1 500 1 0 3 8 1 034 1 038 1 0 5 1 1 0 58 1 058 1 0 5 1 1 0 3 5 1 0 1 7 1 0 0 7 amp 1 520 1 0 2 0 1 04 1 1 0 5 7 1 063 1 068 1 0 8 1 1 088 1 0 9 3 1 0 9 3 1 0 9 1 amp 1 540 1 0 8 9 1 0 84 1 088 1 0 9 5 1 0 9 7 1 0 9 5 1 0 9 8 1 1 0 2 1 094 1 0 8 7 amp 1 560 1 0 7 8 1 0 7 9 1 08 1 1 0 7 7 1 0 7 2 1 0 7 1 1 0 7 6 1 0 7 8 1 0 7 8 1 0 82 amp 1 580 1 0 9 0 1 0 9 8 1 1 0 1 1 088 1 0 7 4 1 062 1 06 1 1 06 7 1 0 7 4 1 0 80 amp 1 6 0 0 1 082 1 085 1 08 8 1 0 9 2 1 0 9 3 1 0 89 1 083 1 0 7 8 1 0 78 1 0 7 9 amp 1 620 1 0 8 2 1 083 1 0 7 6 1 065 1 0 5 9 1 056 1 06 1 1 0 7 3 1 0 8 0 1 085 amp 1 640 1 0 86 1 084 1 08 1 1 0 7 6 1 067 1 062 1 0 5 2 1 04 2 1 038 1 048 amp 1 660 1 0 7 0 1 086 1 0 9 4 1 0 9 7 1 0 96 1 096 1 09 2 1 0 9 3 1 0 9 1 1 0 89 amp 1 680 1 0 7 9 1 064 1 02 8 0 9 8 0 0 94 3 0 9 3 7 0 954 0 98 0 0 9 9 6 1 0 0 5 amp 1 7 0 0 1 0 0 8 1 0 0 9 1 0 1 3 1 0 1 9 1 0 2 5 1 0 2 2 1 0 0 3 0 9 7 3 0 924 0 8 74 amp 1 7 2 0 0 846 0 842 0 84 8 0 84 9 0 8 54 0 8 7 8 0 9 0 3 0 9 3 1 0 9 52 0 965 amp 1 740 0 9 6 9 0 9 7 7 0 98 3 0 989 0 988 0 9 8 2 0 9 7 6 0 95 0 0 8 81 0 7 6 7 amp 1 760 0 6 1 6 0 5 24 0 54 0 0 646 0 7 7 9 0 8 76 0 924 0 94 5 0 94 7 0 9 45 amp 1 7 8 0 0 94 2 0 94 2 0 9 3 7 0 9 2 6 0 9 1 6 0 9 0 7 0 89 9 0 894 0 8 9 1 0 89 0 amp 1 800 0 888 0 883 0 8 7 9 0 87 5 0 863 0 836 0 8 0 1 0 7 5 7 0 7 2 2 0 7 1 0 amp 1 820 0 7 1 0 0 7 1 9 0 7 3 3 0 74 1 0 7 4 9 0 7 5 7 0 76 3 0 7 7 7 0 7 9 7 0 8 1 0 amp 1 840 0 82 0 0 82 8 0 82 7 0 82 2 0 8 1 5 0 7 9 7 0 786 0 7 83 0 7 8 8 0 7 9 7 amp 1 860 0 80 4 0 8 0 0 0 7 8 8 0 7 8 0 0 7 7 5 0 7 8 0 0 7 8 7 0 786 0 785 0 7 81 amp 1 880 0 7 7 5 0 7 7 4 0 7 7 2 0 767 0 763 0 7 4 7 0 72 1 0 68 2 0 6 30 0 5 88 amp 1 9 0 0 0 57 1 0 5 7 3 0 58 9 0 584 0 568 0 549 0 53 4 0 53 3 0 5 38 0 5 56 amp 1 9 2 0 0 5 7 3 0 57 9 0 56 7 0 526 0 448 0 362 0 2 7 2 0 2 18 0 2 1 0 0 2 32 amp 1 940 0 254 0 262 0 2 5 7 0 253 0 25 7 0 266 0 2 7 5 0 2 85 0 29 9 0 3 1 7 amp 1 960 0 3 33 0 362 0 3 9 6 0 4 3 5 0 4 7 9 0 5 06 0 5 1 5 0 5 1 2 0 5 08 0 5 2 1 amp 1 9 8 0 0 53 7 0 560 0 5 84 0 5 9 7 0 6 0 9 0 6 1 7 0 6 1 8 0 6 2 3 0 62 1 0 6 1 9 amp 1 1 0 0 0 0 6 1 8 0 6 0 7 0 6 0 5 0 6 0 2 0 60 1 0 60 5 0 6 04 0 604 0 604 0 6 0 1 amp 1 1 0 2 0 0 60 1 0 59 5 0 5 9 5 0 5 93 0 589 0 59 0 0 584 0 5 82 0 580 0 5 75 amp 1 1 0 4 0 0 5 7 6 0 5 7 1 0 57 1 0 56 7 0 56 0 0 56 0 0 558 0 552 0 545 0 54 0 amp 1 1 0 6 0 0 5 36 0 53 2 0 5 2 9 0 5 2 5 0 5 1 9 0 5 1 5 0 5 1 2 0 51 1 0 50 9 0 5 08 amp 1 1 0 8 0 0 50 6 0 502 0 4 9 2 0 48 3 0 48 3 0 483 0 46 9 middot 0 4 5 2 0 447 0 3 1 amp 1 1 1 0 0 0 4 1 1 - 9 9 0 0 0 - 9 9 0 0 0 - 9 9 0 0 0 - 9 9 0 0 0 - 9 9 0 0 0 - 9 9 0 0 0 - 9 9 00 0 - 1 582 3 2 2 3 0 0 0 0 0 6 0 0 0 1 0 0 0 4 0 0 1 3 0 0 1 9 0 0 2 3 0 04 1 0 0 5 5 0 064 0 088 amp 2 3 2 0 0 1 0 5 0 1 3 9 0 1 7 9 0 1 8 9 0 2 2 4 0 2 38 0 26 2 0 252 0 261 0 2 64 amp 2 340 0 2 8 7 0 2 9 2 0 266 0 2 88 0 2 98 0 286 0 3 0 0 0 3 0 0 0 2 9 1 0 2 85 amp 2 360 0 296 0 3 1 0 0 3 36 0 367 0 3 9 0 0 3 7 2 0 3 56 0 356 0 3 7 3 0 3 88 amp
Figur e 6-2 Examples of the data on the data-base tape
3 9
TR-3 5 1 3A
16 2 3 24 24 2S 3 3 34 34 3S 3 9 40 40 4 1 S 2 S4 69
54 62
6 3 6 3
6 7 6 7
7 0 7 3
74 7 S
7 6 80
LINE 2
LINE 3
1 3 4 10
1 1 1 3 14 20 2 1 23 24 30 3 1 40 4 1 43 44 SO 5 1 5 3 54 60
Lat i tude ( deg ) N ( north) Longi t ude ( deg ) W ( we s t ) `Elevat i on (m) M (m) Reference t o Conf i guration Segment Start ing year day t ime for the spectral `scan s ) i f any and number of attempt s t o `acquire the s can ( which ind i cates po s s ible `t ime delay from the s tart ing t ime ) middot
Year Day Number Time
11+11 for plus number of attempt s to acquire a s pect rum
Number o f attempt s t o acquire a s pectrum
Po s s ible Number o f Measurement s ( 1 9 )
Number o f Spec tra i n thi s Segment ( 0 1 or 2 )
Number o f Lines in Segment
Pointer to the qua l i ty-cont rol dai ly f i e ld note s and measurement uncertainty informa t ion Qua l i ty-control informa t i on is in the QC f i l e of the same month wi th the same s i t e year day and t ime s t amp Dai l y field notes are i n the NOTES f i l e f o r the same s i t e wi th the same s i t e year and day s tamp Mea surement uncertainty i s in the f i l e s UNCERT under t h e instrument serial number ident i f i ed by PRS-xxx and the column s in the uncertainty f i le s for + and - uncertainty l imi t s
Broadband mea surement s before the spectral scan
Channel fH Direct Normal ( thermopi l e ) (Wm2 ) Channel ffoS Direct Normal ( s i l i con) (Wm2 ) Channel tn Global Normal ( Wm2 ) Channel not used Charinel ffo3 Globa l Hori zontal ( thermop i l e ) ( Wm2 ) Channel fH 9 Gl obal Horizontal ( s i l icon ) ( Wm2 )
( f 8 4 ) ( a 1 ) ( f 9 4 ) ( a l ) ( i S ) ( a l ) ( a l 2 )
( a9 o r i 9 )
( a 1 )
( i 1 )
( i4 )
( i 2 )
( i S )
( a8 0 )
( i 3 ) ( pound 7 2 ) ( i 3 ) ( pound 7 2 ) ( i 3 ) ( f 7 2 )
( i 3 ) ( pound 7 2 ) ( i 3 ) ( pound 7 2 )
40
TR-35 3A
6 1 6 3 64 7 0 7 1 80
LINE 4
LINE 5
1 6
7 1 2
1 3 80
LINE 6
1 3 4 1 0
1 1 1 3 1 4 20 2 1 23 24 3 0
3 1 3 3 34 40 4 1 43 44 5 0 5 1 5 3 5 4 6 0 6 1 6 3 64 7 0 7 1 7 3 7 4 8 0
LINE 7
LINE 8
1 5
6 1 2
Channe l 114 Gl obal Ti l t (Wm2 ) hellipChannel not used
Broad band mea suremen t s a f t e r t h e s p e c t ral s can same format a s beforeshy scan ( LINE 3 )
T i l t o f the f ixed- t i l t i n s t rument s hellipf rom the hor i z ont a l ( d eg )
Az i muth of the f i xed-t i l t ins t rumen t s ( de g ) ( 1 8 0 deg = s outh)
De s c r i p t i on o f any s pec i al i n s t rument ( fo r example d i ffu s e-hori zont a l mea s uremen t s a t SERI )
Channe l IFlOAl bedo (Wm2 ) hellipChannel IH5C l oud Cover ( t enths ) Channel fF7 Surface Pres sure ( mb ) Mea s ured at FSEC and PGampE c a l c u l ated from e l eva t i on a t S ERI [ 1 1 p 1 0 0 ]
Channel 116 Amb i en t Temperature ( deg C ) Channel fiB Rel a t i ve Humi d i t y ( ) Channe l ffo9 Wind S peed ( m s ) Add i t i onal channe l des cri bed 1n l i ne 5 Va l ue Add i t i onal channel descri bed 1n l ine 5 Va l u e
Sun Pho t ometer read ings ( only recorded for SERI dat a not u s ed except for re l a t i ve c ompar i s on s ) hellip
Earth-S un d i s tance c orrec t i on ( d e v i a t i on from 1 0 ) hellip
Ext ra t erre s t r i a l Rad i a t i on (Wm2 ) hellip
( i 3 ) ( pound 7 2 )
( f 6 1 )
( f 6 1 )
( a 8 8 )
( i 3 ) ( 7 1 ) ( i 3 ) ( 7 1 ) ( i 3 ) ( f 7 1 )
( i 3 ) ( pound 7 1 ) ( i 3 ) ( pound 7 1 ) ( i 3 ) ( pound 7 1 ) ( i 3 ) ( variabl e ) ( i 3 ) ( variabl e )
( f5 2 )
( f 7 1 )
4 1
9
42
TR-3S l 3A
1 3 1 8
1 9 24
25 30
3 1 36
3742
43 48
49 68
69 72
13 76
1780
LINE
I
3 6
7 1 1 1216 1 7 20 21 25
2631
3236
3839
40 40
41 42
43 46
Zen i t h Angl e ( deg ) ( f6 2 )
Kt ( ra t i o calculated from ( f6 1 ) thermo p i l e inst rument s )
Kn ( rat i o calculated from ( f6 1 ) thermo p i l e instrument s )
D GH ( ra t i o cal culated from thermopile instrument s ) ( f6 1 )
Albedo ( ) ( f6 1 )
Ai r Mas s ( f6 2 )
Res erved for Turbidi ty i f calculated
Precipi table Water Vapor i f calculated from sun photomet er
Precipi table Water Vapor from the ( f4 1 ) Nat ional Weather Servi ce
Prec i p i table Water Vapor Cal culated from Relative Humid i t y ( f4 1 )
Channel H7 Number o f Wave l engths Recorded by Spect roradi ometer 1
Beginning Wavelength ( nm ) Ending Wavel ength (nm) Wavelength Step Size (nm ) Spectroradi ometer 1 Ti l t from the Horizontal ( deg )
Spectroradiometer 1 Azimuth ( deg )
Angle o f Incidence o f the Direct Beam on Spectroradi ometer 1 ( deg )
Measurement Type ( DN GN GH GT DF )
Attachment ( Tef lon Dome D Integrat ing Sphere S View- l imit ing Tube T )
Channel H8 Number o f Wavel engths Recorded by Spectroradi ometer 2
( i2 )
( i4 )
( i S ) ( i S ) ( f4 1 )
( fS l )
( f6 1 )
( fS 1 )
( a2 )
( a l )
( i 2 )
(i4)
TR-3S l3A
4 7 S l Beginning Wavel ength (nm ) ( i S )
S 2 S 6` Ending Wavel ength ( nm ) ( i S )
S 7 60 Wavelength Step S i z e ( nm ) ( f4 bull 1 )
6 1 6S Spec troradi ometer 1 T i l t from the Hori zontal ( deg ) ( fS l )
6 6 7 1 ` Spect roradi ometer 2 Az imuth ( deg ) ( f6 1 )
7 2 76` Angle of Incidence o f the Direct Beam on Spect rorad i ometer 2 ( deg ) ( fS l )
7 8 7 9 Mea surement Type ( DN GN GH GT DF ) ( a2 )
8 0 80 At tachment ( Teflon Dome D Integrat ing Sphere s View-l imi t ing Tube T ) ( al )
LINE 10 Saved f o r extra spectroradi ometers i f needed
I f no spec tral data were recorded the number of l ines in the D s egment i s 1 0 the number of spectra i s 0 and there i s no corre sponding qual i ty-control information for thi s dat e t ime in the QC f i l e s No qual i ty c ontrol wa s performed because the atmo sphere was uns table I f the number o f spectra i s 1 there are 60 l ines in the D s egment i f there are two spectra t he number o f l ines i s 100
I f middot the number of spectra i s 1 or 2 the spectral data fol low after the f i r s t 1 0 l i nes o f the D segment There are 1 0 spectral measurement s per l ine wi th the number in the lef t-mo s t column indicat ing the f i r s t or second specshyt roradiometer ( 1 or 2 ) f o l l owed by the s tart ing wavelength ( in nanometers ) and t he 10 spectral mea surements ( in Wm2-nm) The 1 0 measurement s are at wave l ength inc rements of 2 nm There are 401 spect ral mea surement s from 300 t o 1 1 0 0 nm in 2-nm s teps with 10 measurement s per line for 40 l ine s and one measurement in the 4 1 s t l ine The l a s t number in the 4 1 s t l ine i s the specshytral integral I f a second s pectrorad i ometer wa s used the next 4 1 l ines folshylow t he same format Blank 1 ines follow the spec tral data t o f i l l the D segment to 60 or 100 l ines
An example of a QC f i l e i s shown in Figure 6-3 The f i r s t l ine o f each segment begins with a Q f o l l owed by the s i t e year day number and t ime s tamp with the number of l ines in the segment given in the l a s t col umn s o f the l ine Following the iden t i fier are me s sage s about var iables that were flagged by the automat i c qua l i ty-control proc e s s ing ( s ee appendi x ) noted by an operator at the measurement s i t e or noted dur ing inspec t i on at SERI The l a s t l ine of the segment shows the QC code for as DN ( direct normal thermopile detect o r ) SN ( d i rect normal detector ) AL
var iabl e s such s i l i con
( a lbedo ) and SP ( s pectrum) a s de s c r i bed in the appendi x Three qual i tyshycontrol code s ar8 used 1 = good 2 = suspec t see me s sages and dai ly not e s and 3 = poor or mi s s ing see me s s ages and da i l y no te s The broadband codes ( DN SN GN GH SH and GT ) have two value s the f i r s t is the before- scan measurement and the second is the after-s can mea surement
4 3
TR-35 13A
Q FSEC87 1 2 1 0 7 3 1 4 Noise in GH spectrum in UV QCDN1DN1SN1SN1GN1GN1GH1GH1SH1SH1GT1GT1AL1AP1PR1TC1RH1WV1WS1KT1KN1DG1SPl iN1SP2IN2
Q FSEC8 7 1 2 1 0 8 3 0 8 SN bef SN af t = 1 0 5 5 S H bef SH aft = 1 0 5 3 2nd Int BB b e f = 0 636 2nd Int BB aft = 0 6 5 1 Noise in GH spectrum i n UV QCDN1DN1SN2SN2GN1GN1GH1GH1SH2SH2GT1GT1AL1AP1PR1TC1RH1WV1WS1KT1KN1DG1SP1 IN1SP2IN2
Q FSEC8 7 1 2 1 1 0 3 1 3 QCDN1DN1SN1SN1GN1GN1GH1GH1SH1SH1GT1GT1AL1AP1PR1TC1RH1WV1WS1KT1KN1DG1SP1 IN1SPl iNl iacute
Q FSEC87 1 2 1 1 1 3 1 3 QCDN1DN1SN1 SN1GN1GN1GH1GH1SH1SH1GT1GT1AL 1AP1PR1TC1RH1WV1WS1KT1KH1DG1SP 1 IN1SP1 IN1
Q FSEC8 7 1 2 1 1 2 3 1 3 QCDN1DN 1SN1SN1GN1GN1GH1GH1SH1SH1GT1GT1AL1AP1PR1TC1RH1WV1WS1KT1KN1DG1 SP1 IN1SP 1 IN1
Q FSEC8 7 1 2 1 1 3 3 1 3 QCDN1DN1SNlSNlGNlGN1GH1GH1SH1SH1GTlGTlALlAPlPRlTClRHlWVlWSlKTlKNlDGlSP l iNlSPliNl
Q FSEC8 7 1 2 1 1 4 3 1 3QCDNlDNlSNlSNlGNlGNlGHlGHlSHlSHlGTlGTlALlAPlPRlTClRHlHVlHSlKTlKNlDGlSPl iN1SP1IN1 Q FSECB7 1 2 1 1 554 3 QCDNlDNlSNlSNlGNlGNlGHlGHlSHlSHlGTlGTlALlAPlPRlTClRHlWV1WSlKT1KN1DG1SP 1 IN1SP l iN1
Q FSEC8 7 1 2 1 16 3 0 3 QCDNlDNlSNlSNlGNlGNlGHlGHlSHlSHlGTlGTlALlAPlPRlTC1RH1WV1WSlKTlKNlDG1SP l iNlSPl iNl
Q FSECB 7 1 2 1 1 7 3 1 5 GH bef SH bef = 0 9 3 1 GH aft SH af t = 0 9 3 3 QCDN1DN1SN1SN1GN1GNlGH2GH2SH2SH2GTlGT1ALlAPlPRlTClRHlWVlWSlKTlKNlDGlSPl iNlSPl iNl
Q FSECB 7 1 2 2 0 7 3 1 3 QCDNlDNlSNlSNlGNlGNlGHlGHlSHlSHlGT1GTlALlAPlPRlTClRHlWVlWS 1KT1KNlDGlSP l iNlSPl iNl
Figure 6-3 Example of quali ty-control inf ormation on the data- base tape
Figure 6-4 shows an exampl e of a segment of the daily notes from the FSEC NOTES f i l e Each segment of the f i l e beg ins wi th an followed b y the s i t e year and day number s t amp with the number of l ines in the segment given in the last columns of the l i ne The next l ine contains the s i te operashytor log sheet number month day year day number spectroradi ometer serial number( s ) and mea surement mode( s ) The PGampE and SERI not e s do not include the dai ly l og sheet number The f i rst two l ines are followed by f i eld no te s No tes that were added after inspec t i on at SERI are s eparat d from the operator notes wi th ------- The exi s tence of s l ides or photographs i s ind i cat ed a s wel l a s their qua l i ty i e good ( G ) marginal ( M ) or poor ( P ) In the exampl e in thi s f i gure there were two log sheets for thi s day (number 1 1 6 and 1 1 7 ) because the mea surement mode changed from gl obal hor i z onshytal ( GH ) to global t i l t ( GT )
44
TR-3513A
N FSEC87 1 2 2 1 1 6 0 5 0 2 8 7 1 2 2 1 7 2 DN 1 0 2 GH Clear at 0 7 3 0 GH f o r f ir s t two s cans then GT S l i de s 0 6 3 2 G
0 7 3 3 G 0 8 3 3 G 0 9 3 3 H ( dark ) 1 0 3 3 p1 1 3 3 p1 2 3 3 p 1 3 3 3 p1433 H 1 5 3 3 G 1633 G 1733 G
1 1 7 0 5 0 2 87 1 2 2 1 7 2 DN 1 0 2 GT GT s tart ing at 0 8 0 0 iacuteC lear a t 0 8 0 0 iacuteS l ides S e e above
16 1 1 8 0 5 0 3 8 7 1 2 3 1 7 2 DN 1 0 2 GT Clear at 0830 S l i de s 0633 G
0733 G 0833 G 0933 H ( dark ) 1 0 3 3 p1 1 3 3 p 1233 p 1333 p1433 H 1533 G 1633 G 1733 G
N FSEC87 1 2 3
Figure 6-4 Examples of daily notes on the data-base tape
An example o f a segment of the measurement uncertainty file UNCERT CAL i s shown in Figure 6-5 The f i r s t l ine begins with a U followed by the serial number of the s pect rorad i ometer The upper and lower measurement uncertainty l imi t s are given in the co lumns fol lowing wavelength wi th the appropri a t e measur ement mode dat es and de script ion at the top o f the column The s econd l ine in each segment o f the DAT f i l e s is a pointer to the correct uncershytainty information in UNCERT CAL The broadband s o lar radiat i on and meteshyorolog ical instrument measurement uncertainty fol lows each spectra l measureshyment uncertainty segment in UNCERT CAL
The format o f thi s data ba se was es tabl i shed at SERI t o accommodat e expanded mul t i year long-term data collect ion Users can reformat the data t o suit their part icular needs We recommend the following s t eps for acce s s ing and document ing parti cular data set s
1 Se lect and extract the des ired spectral data from the DAT f i l e s us i ng in formation such as measurement mode day number t ime air mas s or a moshys pheric condi t ions depending on the de s i red attribut es
2 Ex trac t and review the corres ponding segment s of the qua l i ty-cont rol i n format i on from the QC f i l es
3 Ex trac t and review the corres pond ing field no tes from the NOTES f i l e s
4 5
+ I -
5 4
3 7
TR- 3 5 13A
U PRS - 1 0 2 L I -COR PRS - 1 0 2 i
1 2 3 4 5 Ill
Wav GHS GHS GHS GHS GTS GTS GTS GTS Kt gt 6 0 Kt gt 6 0 Kt gt 60 Kt gt 6 0 iacutel ower lower upper upper 2 8 7 - 8 8 7 -8 8 7 5 8 8 GNS GNS
upper upper lower l ower
+ 1 -
- GHS GHS GTS GTS Kt lt 60 Kt lt 6 0 upper uppe r l ower l ower + I - + I -2 8 7 - 8 8 7 -8 87 5 - 8 8
3 0 0 - 1 0 0 0 - 1 00 0 1 0 0 0 1 0 0 0 3 0 2 - 1 0 0 0 - 1 0 0 0 1 0 0 0 1 0 0 0
4 0 0 - 2 3 3 - 1 7 1 1 5 3 9 1 4 0 2 iacute -2 2 0 - 1 7 3 1 4 0 9 3
5 0 0 - 1 3 4 - 1 1 7 3 7 5 0 2 iacute - 1 3 3 - 1 1 7 5 3 3 7
6 0 0 - 1 1 8 - 1 1 1 3 8 3 1 6 0 2 - 1 1 9 - 1 1 1 3 9 3 1
7 0 0 - 1 1 5 - 1 0 7 3 5 2 7 7 0 2 - 1 1 3 - 1 0 7 3 3 2 7
8 0 0 - 1 1 6 - 1 0 6 3 6 2 6 8 0 2 - 11 7 - 1 0 6 3 7 2 6
9 0 0 - 1 1 2 - 1 0 5 3 2 2 5 9 0 2 - 1 1 4 - 1 0 8 3 4 2 8
1 0 0 0 - 1 1 7 - 1 0 8 2 8 1 0 0 2 - 1 1 8 - 1 0 8 3 8 2 8
1 1 0 0 - 1 2 9 - 12 2 4 9 4 2
Figure 6-5 Examples of spe ctral measurement uncertainty on the data-base tape A value of plusmn100 indi cates greater t han 100 measurement uncertainty
46
TR-35 13A
4 Extract the measurement uncertainty information from the 1 1 UNCERT f i l e s and quot e mea surement uncertainty for a l l data used
5 Examine the dai l y broadband and spec tral solar radiatio data graphs in the catalog ( Volume I I of thi s report [ 1 8 ] i f avai labl e These graphs provide informa t i on on atmo spheric condi t i ons during the day For exampl e Figure 4-3 shows dai l y broadband and spec tral plot s for part ly c loudy condi t i ons when s olar rad i a t i on i s changing rapidly throughout the day The sun i s obs cured when the direc t-normal values drop t o zero and the gl obal value s approach each o ther Figure 4-1 shows a clear daybull
No data should be used wi thout consult ing the qua l i ty-control informa t i on dai ly no tes and measurement uncertainty
4 7
Cel l s
Ce l l s
Energy
Meteorologi cal Society
Appl i ed Meteorol ogy
Energy
Radiat ion Topical Overview Solar Cel l s Vo l 1 8
of the Pho tovo l t a i c s and Insolat ion Mea sureshySolar Vol 1 8 1 986 pp 393-3 9 5
TR-35 1 3A
1 0 REFERENCES
1 Hul st rom R L Solar 1 986 PPbull 1 7 9- 1 8 7
2 Hul st rom R L A Summary ments Workshop Panel Resul t s
3 Hul strom R L Re sul t s of the Amorphous S i l i con Mea surement s Ta sk Force Solar Cel l s Vo l 18 1 986 pp 1 7 1-1 7 7
4 Hul strom R L and J M Ohi Resul t s of the SERI Mul t i junction Devi ce Efficiency Measurement Task Forc e pre sented at the 20th I EEE Photovo lshytaic Spec ial i s t s Conference September 1 988
5 Riordan c and R L Hul s t rom Summary of S tud i e s that Examine the Effec t s of Spect ral Solar Radition Vari at ions on PV Device Des ign and Pershyformance SERI-TR-2 15-343 7 Golden CO Solar Energy Research Ins t i tute 1989
6 Riordan c Joint EPRI-SERI Spectral Solar Rad i a t i on Database Pro j ec t
1
8
9
1 0
1 1
1 2
1 3
14
Solar Vol 2 1 1 98 7 pp 3 3 7-342
Riordan c D Myers M Rymes R Hul strom W Mar i on c Jenning s and c Whi taker Spectral Solar Radiat ion Data Bas e at SERI Solar Vol 42 No 1 1 989 PP bull 6 7-79
Riordan C J T L Stoffe l and R L Hul s trom The Effect s of Urban Air Pollut ion on Solar Radiat i on SERI-TR-2 15-3482 Golden CO Solar Energy Res arch I n s t i tute ( draft ) 1989
Riordan c and R Hul s t rom The SERI Re s ource As ses sment Project s Plan for Col l ect ing Spectral-Solar-I rradiance Data SERI -TR-21 5-2948 Gol den CO Solar Energy Re search Ins t i tut e 1986
Shaw G E Sun Pho tometry Bul letin Ameri can Vol 64 No 1 January 1983 pp 4-10
Iqbal M bull An Int roduction to Solar Radiation New York Academic Pre s s
1983
Bartel s R A Comment s on Prec ipi table Water Mea surement s with Sun Photometer s Journal of Cl imate and Vol 25 1 986 PP bull 1 788- 1 789
Leckner B The Spectral Distribution o f Solar Radiat ion at the Earth s Surface -- El ements of a Model Solar Vol 20 1 9 7 8 pp 143- 1 5 0
Cannon T W Spectral So lar Irradiance Instrumentat i on and Measurement Techniques Solar Cel l s Vol 1 8 1986 pp 2 3 3-24 1
48
Energy
Photogrammetric Engineering
TR 3 5 13A
1 5 Myers D R E s t imate s of Uncertainty for Measured Spec tra in the SERI Spectral Solar Radiat i on Data Base ac cepted by Solar 1 98 9
1 6 Myers D R E s t imates of Uncertainty for Measured Spectra in the SERI Spec tral Solar Radiat i on Data aa s e 11 SERI e_clmical Report Golden CO S o l ar Energy Res earch Ins t i tute ( draft ) 1989
middot
1 7 Hul s trom R L The Cl oud Bright Spo t 1 9 73 PP bull 3 7 0-3 7 6
18 Ri ordan c D Myer s and R Hul s t rom Spectral Scflar Raltfiation Data Base Documentat i on and User 1 s Manual Vo lume I I SERI-TR-2 15-3 5 1 3 Golden CO Solar Energy Re search Ins t i tut e 1989
49
TR- 3 5 1 3A
APPENDIX
QUALITY-CONTROL PROCESSING
Limi ted qua l i ty-control proces s ing wa s appl i ed to the data ba se as de s c r i bed below The resul t s are i n the QC f i l es on the data-base t ape by s i t e year and mont h For examp l e
FLA8705 QC i s FSEC 1 98 7 May PGE8 80 l QC i s PGampE 1 9 8 8 January SER8 7 l l QC i s SERI 1 98 7 November
These f i l e s correspond t o the 11 OAT f i les for the s ame s i t e year and month Each data segment that includes a spectrum wa s proces sed through thi s quali ty-control procedure I f the atmospheric cond i t i on s were uns tab l e and a spectrum was not acquired the broadband and meteorologi cal data were inc l uded on the data-base tape but no qua l i ty-contro l proc e s s ing wa s app l i ed
An example o f a segment of a 11 QC f i l e i s shown in F i gure 6-3 The f i r s t Q l ine beg ins wi th a fol l owed by the s i t e year day and t ime s tamp The
last columns give the number of l ines in the s egment so the user can skip to the next s egment Fo l l owing the f i r s t l ine are me s sages that were printed whenever the qua l i ty-control proce s s ing f lagged a suspect or poor value
Following the mes sages in an SO-character QC l ine l i s t ing the variables that were examined are one of three qua l i ty-control code s 1 good 2 marg inal or suspect and 3 mi s s ing or poor The QC l ine was prepared using an automa t i c ( computeri zed ) check of the variabl e s and manual edi t ing to include informashyt ion from correspondence l og sheet s and vi sual inspe ct i on Addi t i onal me sshysages were added above the QC l ine if appropriate
The two-charact er descriptors in the QC l ine are
DN Direct-normal ( thermopi l e ) solar radiat ion before the spectral s can DN Direct-normal ( thermopi l e ) so lar radiation after the spectra l scan SN Direct-normal ( s i l i c on ) before SN Direct-normal ( s i l i c on ) after GN Globa l-normal before GN Globa l-normal after GH Globa l -horizontal ( thermop i l e ) before
WS Wind Speed KT KKN K
t n
GH Global-hori zontal thermopil e ) after SH Global-hori zontal ( s i l i con ) before SH Global-hori zontal ( s i l icon ) after GT Global-t i l t before GT Gl obal- t i l t after AL Al bedo ( Wm ) AP Albedo ( ) PR Surface Pres sure TC Temperature ( deg C ) RH Relat ive Humi dity WV Water Vapor ( al culated from rel a t i ve humidity)
5 0
S- flllit = - ( middotmiddot middot
( e g Wm2 )
TR-3 5 1 3A
DG D GH SP F i r s t Sp qtrum I T Integral of t he F i r s t Spec t rum SP Second Spectrum IT I nt egral of the - Second SpecttUI11
The aut oma t i c tes t s that were performed to det ermine the QC code fol l owing each var iable were
( a ) Check for mi s s ing or negat ive values for the broadband solar radiashyt i on meteoro l og i cal or a tmo spheric dat a or the spec t ral integral s
lt 0 = Code 2 Mi s s ing ( - 9 or -9 9 ) = Code 3
( b ) Check for atmo spheric or broadband instrument instab i l i ty us ing the difference and rat i o o f the before- and aft er-scan values and redundant mea surement s if nei t her values are negat i ve or mi s s ing
DN before DN after if the abs lute d i fference SN before SN after i s gt10 Wm DN beforeSN before 5 of 200 DN before SN after and GH before GH after SH beforeSH after the rat io i s lt0 95 or gt1 05 each of the GH before SH before two var iables = GH afterSH after or middot GN beforeGN after the rat i o i s lt0 90 or gt1 10 each of the GT beforeGT after two var iable s = Code 3
Code 2
( c ) Check for DN gt GN or GN gt ETR ( extraterre s trial solar radiat i on ) us 1ng rat ios of the var iabl e s
DN before GN before gt0 95 each variable = Code 2 DN afterGN after gt 1 0 each var i able = Code 3 GN before ETR GN afterETR
( d ) Check for values o f Kt Kn and DGH tha t are too high
KT ( invo lves GH before and after and KT ) KN ( involves DN before and after and KN ) DG ( invo lves DN and GH before and after and DG )
gt0 9 5 each variable = Code 2 gt 1 0 each var iable = Code 3
( e ) Check the s pe c t ral integral s for unusual rat i o s to the corresponding broadband so lar radiat ion value
IT ( Broadband va lue before and after )
For d i rect s pe c t ra lt 0 6 or gt0 8 5 I T = Code 2 For gl obal s pe c t ra lt0 7 o r gt0 95 I T = Code 2
For d i rect and g l obal s pec t ra lt0 5 or gt l O IT = Code 3
5 1
TR-35 13A
We sugge s t that users of the data ba s e develop a computer program to acc e s s fields i n the Q C l ine and t o print the me s sages Thi s l imi ted qua l i ty cont rol wi l l not f lag a l l po s s ible errors and addi t i onal t e s t s should be applied depend ing on the users requi rement s and appl icat i on s
52
1 1 2
Document Control SEAl Report No
Page 4 Title and Subtitle
NTIS Accession No 3 Recipients Accession No SERI TR- 2 1 5-35 13A DE89009447
5 Publication Date
January 1990 Sp ectral Solar Radiation Data Base Documentation
6Vo lume I
7 Author(s) 8 Performing Organization Rept No
9 Performing Organization Name and Address 10 ProjectTaskWork Unit No
1 1 Contract (C) or Grant (G) No
(C)
(G)
1 2 Sponsoring Organization Name and Address 13 Type of Report amp Period Covered
Solar Energy Res ear ch Ins titute Technical Repor t 1 6 1 7 Col e Boulevard Golden Colorado 804 0 1-3393 1 4
1 5 Supplementary Notes
16 Abstract (Limit 200 words) The Solar Energy Research Ins titute ( SERI) Electric Power Research Ins titute Flor ida Solar Energy Center and Pacific Gas and Electric Company cooperated to produce a spec tral solar radiation data base representing a range of atmospheric conditions These data will help to characterize the natural variab ility in the spectral (color) content o f outdoor solar radiation so that the sensitivity of spec trally selective solar devices ( such as photovoltaics ) to these variations c n b e s tudied quant itatively Volume I o f this report documents the history approach content and format of the data base Volume II contains graphs and field no tes for each of the spectral data sets The data res ide on magnetic tape at SERI
1 7 Document Analysis
a Descriptors Spec tral solar radiation broadband solar radiation met eorological
data sp ectroradiometers
b IdentifiersOpen-Ended Terms
c UC Categories
233 234
18 Availabil ity Statement
National Technical Information U S Depar tment of Commerce 5 285 Port Royal Road Springfield Virginia 2 2 1 6 1
Service 19 No of Pages
60
20 Price
A04
Form No 0069 (6-30-87)
TR-35 13A
LIST OF TABLES
3-1 Measurement s and Documenta t i on for Each File in the Spec tral Solar Rad i a t i on Data Basebullbullbullbullbullbullbullbullbullbullbullbullbullbullbullbullbullbullbullbullbullbullbullbullbullbullbullbullbullbullbullbullbullbullbullbullbullbullbullbullbullbullbull 1 0
S-1 FSEC Instrument Cal i brat ion H i s tory and E s t imated Measurement Uncertainty 3 1
S-2 PGampE Instrument Cal ibration Hi s tory and Est imated Measurement Uncertainty 3 3
S-3 SERI Instrument Cal ibrat ion H i s tory and Est imated Measurement Uncertainty bull 34
6-1 F i l ename s on the Data Tape bullbullbullbullbullbullbullbullbullbullbullbullbullbullbullbullbullbullbullbullbullbullbullbullbullbullbullbullbullbullbullbullbullbullbullbullbullbullbullbullbullbull 3 7
ix
1 0 INTRODUCTION
The Solar Energy Res earch Inst i tute ( SERI ) Electric Power Research Ins t i tute ( EPRI ) Florida Solar Energy Center ( FSEC ) and Pac i f i c Gas and Electric Company PGampE ) cooperated to produce a spectral solar radiation dat a bas e repres ent ing a range of atmospheric cond i t i ons ( or c l imates ) that i s appl ishycable to s everal d i f ferent type s of solar col lectors Thes e data wi l l he l p to characterize the natural variab i l i ty in the spec tral color) cont ent of outshydoor solar radi at i on so that the sens i t ivity of spectrally s elect ive solar devices such a s photovo l tai c s smart windows and bioma s s ) to these variations can be s tudied quant i tat ively
Thi s report document s the hi s tory approach content and format of the data base to make it useful to the s c i ent i f i c community A s econd volume of thi s report contains graphs of each of the spectral so lar radiation curve s and a s s o c i ated f i e l d note s The data are avai lable on magnetic tape in ASCII forshymat and cons i s t of broadband 1 and spectral2 solar radi at ion and meteorologi cal measurement s dai ly f i eld notes qual ity control informat ion and measurement
middotuncertainty Que s t i ons about the data base should be directed to SERI Solar Electric Res earch Divi s i on Re source As ses sment and Instrumentat ion Branch in Golden Col orado
1sroadband int egrated solar radiat ion 0 3 to 3 m
2spectral solar rad i a t i on as a func t i on of wavelength 03 to 1 1 m at0 002 m interva l s
1
2 0 HISTORY
The need for spectral sol ar rad i at ion data has been expre s sed in s everal forums [ 1-4] The bas i c need i s for data that can be used wi th solar c o l shylector spectral respons ivi ty data t o s c ient i f i cally and quantit a t ively det er-middot mine how the c o l l ector responds to natural variations in the spect ral con t ent of solar radiat ion and thereby det ermine how its performance is a f fec ted In the photovoltaic ( PV ) commun i t y for example there i s no consensus on the magni tude of spectral effec t s because there are no standard procedures for eva luating outdoor spectral sen s i tivity of PV devi ces the s en s i t ivity i s devi ce dependent and the qua l i ty and uncertainty o f the spec tral solar rad iashyt i on data used in the analyses are unknown or undocumented [ 5] In many cases only one s t andard or reference spectrum i s used to report the perforshymance of a PV devi ce and the uncertainty a s soc iated wi th natural spec t ra l var iations i s unknown
To s tudy the spec tral sens i t ivity of a solar col lector i t s spec tral respon s e quantum e f f i c i ency or spectral abs orpt i ontransmi s s ion curve i s mul t ipl ied by inci dent s pectra l sol ar radiat ion for a range of real i s t i c out door condi t i ons and the resul t s are integrat ed over the ent i re spectrum and the des ired t ime period Al l measurement uncertainty ( in the spectral data and spec t ra l response ) mus t b e evaluated to det ermine the s tat i s t ical s i gni ficance of any variations in the solar collec t or s performance that are attributed to specshytral vari a t i ons To make thi s determinat ion spec tra l solar radiat ion data wi t h documented measurement uncertainty are requi red
In 1984 EPRI and SERI met to def ine a research project that woul d addre s s t he need for measured outdoor spectral solar rad iation data for a range o f c l i shymat e cond i t ion s A formal project wa s ini t i ated in 1985 in whi ch EPRI proshyvided funds to SERI to perform three tasks ( 1 ) mod i fy c a l ibrat e and del iver to EPRI two computer-contro l l ed LI-COR Inc model LI-1800 spec trashyradiometer s ( 2 ) train EPRI -de s i gnated operators to use sof tware that acquires s pectra l so lar radiat ion and concurrent broadband solar radiat i on and me teorological data and ( 3 ) deve l op data collec t i on gui del ine s [ 6] EPRI a l s o ini t i at ed cooperat ive agreement s wi th FSEC and PGampE to co l l ect the s e data at their s i t e s in Cape Canavera l F la and San Ramon Cal i f respect ively In 1986 EPRI extended the agreement with SERI to use remaining project funds to as s i s t wi th the s tart-up of mea surement s at FSEC and PGampE
Spectral solar radiation and suppor t ing data were collected at FSEC and PGampE and sent to SERI for qua l i ty-control proc e s s ing and archiving [ 7 ] SERI coordinated the data col l e c t i on periodically cal ibrat ed the spec t rashyrad iometer s added data to the data ba s e and documented and forma t ted the data ba s e under the Department of Energy ( DOE ) SERI Re source As ses sment Program
Data that are inc luded in the data base were col lected at FSEC f rom Oct ober 1 98 6 to Apr i l 1 988 and at PGampE from Apti l 1987 to Apr i l 1988 FSEC opera ted one EPRI and one SERI spect roradiomet er almo s t daily at Cape Canavera l ( s ee Figure 2-1 ) whi ch contributed nearl y 2800 spectra to the data ba s e PGampE operated one EPRI spectrorad iometer at San Ramon Ca l i f ( s ee F i gure 2-2) as re s ource s permi t t ed contribut ing nearly 300 spectra to the data base SERI col lected about 200 spec tra in the DenverGolden Co l o ( s ee F i gure 2-3) area from November 1987 to February 1988 as part of a res earch project to s t udy urban spec tral solar radiat ion and added the s e data to the da ta ba s e [7]
2
TR-35 1 3A s= middot
Fi gure 2-1 Spectral and broadband solar radiation collection at FSEC Cape Canaveral Fla in conjuncti on with photovoltaic module data i n the same plane
Figure 2-2 Data collection si te at PGampE San Ramon Calif
3
middotmiddot
TR-35 13A
figure 2-3 Data colLect i on site at middotWelby Colomiddot where SERI acquired research data to study air polluiion effects bn solar radiat i on
4
3 0 APPROACH
A detailed de script ion of the approach for data collection i s avai lable in the Data Col l ect i on Plan [ 9 ] The goal s of thi s plan were to collect and to archive spectral s o l ar radiat i on broadband so lar radiat ion and meteoroshylogical data for a range of air ma s se s and atmo spheric cond i t i ons from various col l ector conf igurat i ons
A range of air ma s s values i s important because air mas s i s the path length of the s olar beam through the atmo sphere ( Figure 3-1 ) Air mas s increas e s wi th increas ing solar zenith angle and thus changes wi th locat ion ( l at itude ) seashyson and t ime of day As air mas s ( the path length) increases there i s increas ed spectral absorpt ion and scat tering of solar radiat ion by atmospheric cons t i tuent s such a s aero sol s and water vapor and the spectral content of solar radiat ion at the collector surface change s
The mo st important atmo s pheric variables that determine broadband and spectral solar radiation are cloud cover atmospheric turbidity ( aerosol s ) preshyc i pi table water vapor and barometric pres sure ( number of air mol ecules in the path of the solar beam) To properly document the spectra i t i s important to mea sure or characterize these variables Several methods can be used depending on the instrument s ava i lable at the measurement s i tes
bull Cl oud cover i s measured in terms of
Opaque sky c over ( tenths ) and type as determined by an observer an all-sky phot ograph or-both
Kt the atmo s pheric frac t i onal transmi ttance of broadband gl obal s olar radiation on a horizontal surface ( global-horizontal divided by extrashyterrestrial s o l ar radiation on a horizontal surface ) or D GH the rat i o of direct-to-gl obal broadband solar radiat i on on a hori zontal surface or bot h
bull Turbidity i s mea sured i n terms of
Atmo spheri c opti cal depth due to aero s ol s as cal cul ated from narrowshywavel ength s pec tral measurements taken with a sunphot ometer or a specshytroradiometer measuring direct-beam rad iation [10 1 1 pp 1 1 8-122 ]
Kn t he atmo spheric frac t i onal transmi t t ance of broadband direc t-beam solar rad i at i on or D GH as described previously or both
bull Precipi table water vapor i s
Cal culated from sunphotometer o r spectroradi ometer measurements [12 ]
Measured wi t h a bal loon radiosonde on- s i t e or at a nearby Nat i onal Weather Serv i ce stat ion
Calculated from measured relative humi d i ty or dew-point temperature [ 1 3 ]
5
Sunrise sunset
--
Zenith ___
Atmosphere Aerosols Water vapor Clouds Ozone (etc)
Spectralscattering
and absorption
TR-35 13A
0CJCJ
0(9
Global Radiation
Figure 3-1 The atmosphere f ilter on soLar direct-beam radiation increases with increasing solar zenith angle scattering and absorption incre4se with l onger path lengths Global radiation on a horizontal plane (Gh) is equal to the direct-beam radiation (from the solar disk) normal to the surface (D ) multiplied by the cosine of the solar zenith nangle (z) plus scattered radiation from the sky (S) For a tilted (rather than horizontal) plane D is multiplied by then cosine of the incidence angle The surface also receives radiation reflected from the ground to the surface (R) These relationships are
Direct normal D n Global horizontal = D x Cos(z) + SGh n Global tilt Gt = Dn x Cos(e) + S + R Global normal G = D + S + R n n
bull Barome tric pres sure is
Mea sured with a barometer
Cal culated using site el evation [ 1 1 p 100]
At least one o f these options is used for each variable to document a tmo shyspheric conditions during the spectral s o l ar radia tion mea surement s Redundant information is used for qua lity-control checks
acts as a temporally and spatially variable radiation The path length (air mass) of
6
TR-3 5 1 3A
The spectral solar radiat ion measurement s were made in several different meashysurement modes corre s pond ing to solar collector conf igurations Di rectnorma l s o l ar radiation ( radiation from the solar d i sk in about a 5 -deg field of view) i s used by concentrat ing ( focusing ) col lectors global-normal ( d irect plus scatt ered radia t i on on a surface normal to the solar d i s k ) is used by two-axi s sun-tracking f lat-plate col lectors and global-t i l t i s used by f ixed-t i l t f l at plate s such as south-fac ing col lectors t i lted at the lat itude angle or s ingle-axi s tracking flat plate s Global-horizontal ( direct plus scatt ered radiation on a hor i zontal surface ) is used to develop and t e s t mode l s that convert global radiat ion t o radiat ion on a surface of any orienshytat i on such as bui lding wal l s and windows the photosynthe t i cally active reg i on of the spectrum i s a l s o important for bioma s s appl i ca t i ons The di ffuse spectra ( sky radiation with the solar disk blocked ) inc luded in the data ba s e were measured a s part o f SERIs res earch data collection t o examine air po l shylut i on effec t s i n the DenverGolden area
Spectral solar rad iat ion data were acquired us ing spectrorad iometers with the fo l l owing character i s t i c s
bull Holographic grating monochromator
bull Wavelength range 0 3 - 1 1 m
bull Bandwidth 0 006 m
bull S canning s t ep s i z e 0 002 m
bull S can t ime 27 s
Several modi f i cat ions were made to these spec troradiometers by SERI [14] A view- l imi t ing tube was placed over the Teflon dome receiver ( d i f fuser) to make direct-normal mea surements ( Figure 3-2 ) For global mea surement s the Teflon dome was replaced by an integrat ing sphere ( Figure 3-3 ) although the Tef l on dome ( Figure 3-4 ) was somet ime s used for gl obal-normal measurements A temshyperature control ler wa s added to each spectroradiometer to maintain the s i l icon detector temperature at 40degC
The spectroradi ometers were cali brated at SERI every s i x months against standard lamps traceable to the Nati onal Institute of Standard s and Technol ogy [ NI ST formerly Nati onal Bureau of Standard s (NBS ) ] In thi s proce s s the spectroradiometers were cal i brated in the laboratory and then compared with one another outdoors (Figure 3-5 ) to determine spectral uncertainty l imi t s prec i s ion ( or repeatab i l i t y ) error s and bias error est imate s
At the measurement s ites the instrument s were checked monthly against a reference lamp ( LI -COR Opt i ca l Rad iat ion Cal i brator ) t o monitor instrument s tabi l i ty these resul t s were reported to SERI (Measurement uncertainty i s reported in detail i n references 1 5 1 6 and a summary i s given i n Section 5 )
Table 3-1 l i s t s the data coll ected to cal culate or spec i fy the atmo s pheric c ond i t i ons and properly document each spectrum in the data ba s e The broadshyband sol ar radiation data were measured to correspond wi th the different specshyt roradiometer measurement modes and to calculate atmospheric descriptors such as Kt Ground albedo was inc luded becaus e it affects both solar radiation
7
SE Imiddot-middot TR-35 1 3A
Figure 3-2 Spectroradiometers equipped with view-limiting tubes to acquire 1direct-normal solar radiation Aluminum foil was placed over
the instruments to reflect radiation and keep the instruments from overheating
Figure 3-3 Spectroradiometers equipped with integrating spheres to measure global solar radiation
8
Fi gure 3-4 Spectroradi ometers equi pped wi th the Tefl on dome recei vers
Fi gure 3-5 Outdoor i ntercompari son of four spectroradi ometers
9
I
Table 3-1 Measurements and Documentation f or
bull Sit e identifiera
Four-l et ter code Longitude ( decimal) Latitude ( decimal)
bull Site
Dat e a elevation ( m)
Day number Year
bull Local standard timea
Hour Minutes
bull Col lection mode for spectral irradiance scan( s) t-0
Two-le tter code Gl obal horizontal - GH Gl obal normal - GN Gl obal til t - GT use
horizontal ( e g 30 Direct normal - DN
til t angle from deg) and azimuth
bull Direc t-no rmal irradiance va lue (Wm2)bull Global-normal irradiance value (Wm2)bull Global-horizontal irradiance value (Wm2)
IllN-Each File in the Spectral Solar Radiation Data Base -
bull Global-tilt pyranomet er value Til t angle o f pyranometer from horizontal
and azimuth Irradiance val ue ( Wm2)
bull I rradianc e-st abil ity check ( silicon pyrheliomet er)b
bull Irradiance-stability check (silicon pyranomet er )b
bull Spectroradiometer scan( s) ( 2-nm step size) ( Wm2-nm)
bull Repeat of broadband irradianc e measurement s b
bull Ambient t emperature (degC) bull Surface pressure (mb) bull Rel ative humidity ( ) bull Average wind speed (mph) bull Ground albedo (measured or estimated)c ( )bull Mul tiwavelength sunphot omet er measurements
( four-channel maximum)d
bull Opaque cl oud cover ( t en ths) bull National Weather Service water vapor
val ue ( em) bull Comment field (15 charact ers)
aLocation dat e and time are used t o calcul ate air mass
bThe silicon inc luded to
pyrhe liomet er1 silicon pyranometer and repeated broadband so lar radiation values allow eval uation of irradiance stability during the spectral irradiance scan
are
cValue s should be repres enta tive of the dominant land-cover type or mixture in the vicinity of t he s pect roradiomet er
dspectral m a surements at several wave leng ths are made using sunphot omet ers with narrow-band filters cal culate atmos pheric turbidity and water vapor
to
VJV1VJtgt
TR-35 1 3A
measured on til ted surfaces and ground-to-sky reflec tions ( especial ly under cl oud cover) Wind speed and ambient temperature were recorded because they may be useful along with the spectral data to predict collector perforshymance The broadband and met eorological sensors were maintained and calishybrat ed by the measurement sites as documented in Sec tion 5
Broadband solar radiation measurements were made immediately ( within 15 s) before and after the spec t ral solar radiation scan to allow evaluation of atmospheric stability at the time of the scan In addition the datashyacquisition software was designed so that global-horizontal solar radiation was sampl ed six times during the spectral scan using a silicon-detector pyrashynome t er if global solar radiation varied by more than 2 the spec tral scan was not recorded Three attempts were made to acquire a spectral scan during unstable c onditions ( such as partly cl oudy skies) I f a scan was not obtained after three t ries the broadband and meteorological data were recorded and then the data acquisition system waited until the next regularly scheduled data acquisition time ( usually an hour) to attempt another spectral scan Because o f the stability monitoring during the spectral scans wemiddot believe there are very few cases when the spectral scan was acquired during variable solar radiation conditions We found three examples of distorted spectra ( see Figure 3-6) that possibly were caused by unstabl e conditions
Software to test the atmospheric stability and acquire the data in a specific format was integrated into the field operations by FSEC and PGampE The format included fields for sit e identification date and time broadband solar radiashytion values atmospheric data spectral solar radiation data and comments In addition an instrument deampcription and configura tion file was stored for each data fil e
The data acquisition software was designed to accept manual ly entered data from sunphot ometers cl oud-cover estimates and Nat i onal Weather Service preshycipitable water vapor measurements However the personnel instruments and measurements were generally not available to enter these data each hour at the measurement sites
The schedule for dat a coll ection was fl exible to accommodate individual site requirements and constraints The goals which were accomplished were to collect data over at l east one year at each sit e t o capture seasonal variashytions and to cover a wide range of atmospheric conditions for each measurement configuration
Measured spec tra and supporting data were sent to SERI on fl oppy disks from PGampE and on magnetic tape from FSEC Daily log sheets that describe the specshytroradiomet er operation and operator comments were included with the data Al l-sky photographs c orresponding to many of the FSEC spectral data sets were provided by the FSEC Fenest ration Energy and Illumination Performance Research Program ( Figure 3-7) Al l-sky photographs were also taken for each of the SERI spec tral data sets ( Figure 3-8) A camera system was installed at PGampE late in the data col l ec tion period but no photographs are available
At SERI the data were processed through an interactive quality-control proshycedure during which the data were visually inspected for obvious probl ems First the inst rument configuration file ( see exampl e in Figure 3-9) was examined against a t emplate from the previous data set to check for any inst rument changes or a change in the mode of opera tion After the operator
l l
middot 400
01+--+----+--+--
U1Ill-25 0Day No 205 1987 (a) 1= 25 Day No 319 1987 (b)Oslash a -E c Nc
N 0 IDistorted direct-normal E CJ bull= m
E 15 Distorted direct-normal spectrum 15 spectrum at 10316 cl
Q)Q) 00 c co c 056 g 105
shy t -
300 500 700 900 1100 300 500 700 900 1100 Wavelength (nm)Oslash Wavelength (nm)
Day No 319 1987 Day No 319 1987 25 1200 (c) (d)Distorted global normal spectrum E ltilc at 10316 E_
N E 800 15 Q) 0 Q) c Direct0 Global tilt c normalco Global6 056 co
horizontal
300 500 700 900 1100 6 8 12 14 16 Wavelength (nm) Time
Figure 3-6 Examples of the very few distorted spectra in the data base (a b c) Broadband solar radiation data (d) corresponding with the spectra in b and c show that irradiance was decreasing at 1031 due to partly cloudy conditions JOIwU11-w
xgt
S5 llifl TR-3 5 1 3A
Figure 3-7 Example Qpound all-sky photographs acquired at FSEC These photog aphs proviGed evidence f rain possible condensation oa optics and ducls
Figure 3-8 Example of all-sky photograph acquired at SERI with a disk blocking sun to show diffuse sky conditions
13
---middot---------middot---------middot---------middot---------middot---------middot---middot --middot---------middot--------middot
TR-3 5 1 3A
t(OK P 11 buy this) Press [Helpl for help
CHN PARAHETER +-------INSTRUHENT----------+ +--CALIBRATION-+ OUTPUT rom NO TYPE HAICER TYPE SERIAL FACTOR- DATE --UNITS NOTES
1 Dir NorR Eppley NIP 17828E6 680 11-187 WRA2 2 Clo NorR EPPLEY PSPH 17863F3 811 11-187 WRA2 3 Glo Horz Eppley PSP 17863f3 811 11-187WfRA2 ltl Glo Tilt EPPLEY PSPT 17863F3 811 1-187 RA2 5 Dir N Si Unused Unused Unused -9900 -1-1-1 WRA2 6 ARb TeRp TAYLOR HGGLASS 00718C LOO 11-187 Deg C 7 Surf Pres OBSERVER ELEVATION RIORDAN -9900 -1-1-1 Hillibar atilde8 Rei HuR DC DIGITAL XXXXXC 100 -1-1 1 Percent 3 9 Wind Spd OBSERVER OBSERVD STOFFEL -9900 -1-1-1 KetersS 3
10 I Albedo Unused Unused Unused -9900 -1-1-1 Percent 11 Phot 380 S TEIC SUNPHOT SPH7624 66300 10-184 Countamp 3 12 Phot 500 SOHOTEIC SUNPHOT SPH7524 77500 10-184 Counts 3 13 Phot 860 SOHOTEIC SUHPHOT SPH7524 45700 10-184 Counts 3 14 Phot 942 SONOTEIC SUNPHOT Unused -9900 -1 1-1 Codnts 1 15 Opq Cloud OBSERVER OBSERVER STOFFEL 100 -1-1-1 Tenths 16 H20 NWS NWS SONDE STAPLETON 100 -1-1-1 CR 17 Spect 11 LICOR LI1800 PRS158 100 9-187 Wsq RlnR 2 18 Spect 12 Unused Unused Unused -9900 -1-1-1 Wsq RnR 19 Glo H Si LICOR SIPYRAN PY1245 811 11-187 WRA2
Figure 3-9 Example of the instrument configuration data -eeorded with the measured data J-middot middot
approved the configura t i on tabl e the template was updated and the informat ion was wri t ten to the data base
Figure 3-10 shows an-exampl e of the comput er terminal output dur ing the cond step o f the qua l i ty-control session
The informa t i on displayed ( see c i rcled nu bers in Figure 3-10) inc luded the foll owing
1` Si te dat e day number standard t ime lati tude l ongi tude and number o f attempts to acquite the spectrum as cont ro l l ed by the atmospher i c stab i l ity monitor
2 Plot o f the spectrum with the mode of operat ion printed bel ow the plot
3` Indicat ion o f stabi l i t y based on the before-scan and after-scan me iureshyment of gl obal-horizontal solar rad iat ion from the iil i con pyranome t er ( although the measurements by thi iiJtrument ciuring the _scaq are actual l y used to test f o r atmospheric stability)
4 Graphic descr i p t i on o f the az imuth and zenith angles of the sun
14
y I
r
ijn 2PR
1100300
II I -
38 50
94
-99
l
IlIllN
lt ltX) Softwa re by M Rymes 0
2 t N AFT BEF a DN 864 863
0 1K SN 852 852 reg A GH 1007 1005 8 SH 984 981 I GN 1089 1088
IL GT 924 920
DN SN GH SH GN GT T Azimuth Zenith reg T 27 c
679 9132 1019 mb V1 RH 73
0 reg ws 4 ms AL 136 Wm2
-99 Co -99 Co
86 -99 Co -99 Co
cc -99 wv
110 mm
300 Di r Norm Glo Norm 1100 FSEC 051387 (Day 133) 1030 2840N 8060W 1 tries G)
terminal output during a quality-control session o--3Figure 3-10 Example of the computer lt1 wV1 wgt
I
TR-3 5 1 3A
5 Bar graph of the before-scan broadband measurements of direct-normal ( thershymopile detec t o r ) DN direct-normal ( silicon detec t or ) SN global-horizontal ( thermopile ) GH gl obal-horizontal ( silicon ) SH gl obal-normal ( thermopi l e ) GN and global-til t ( thermopile ) GT solar radiation The darkened bar graphs show the integral of themiddot spectral middotso lar middotradiation llm))(0 3-11 which is printed under the bar graph Before-scan and after-scan broadband values are printed to the right of the bar graph
6 Listing of the supporting data The first five values are t emperature T pressure PR relative humidity RH wind speed WS and ground-reflected solar radiation AL used for albedo calculations The remaining fie l ds were not used for this data base and were included for future data col lecshytion projects
This quality-control process was performed short ly after the data arrived a t SERI to flag obvious field probl ems The operator could add comments to the data fil e after viewing the information in Figure 3-10 The software also calculated atmospheric descriptors such as Kt and then the data and descripshytors were writ t en to the data base Quantitative qua lity control was applied iu the post-processing of the data base ( described in detail in the appendix )
We chose to include all data in the data base and to be as specific as posshysible about the measurement uncertainty rather than set stringent criteria for excluding data sets This allows users to select data based on their specific application and accuracy requirements or to use portions of the damiddotta sets such as broadband datamiddot or spectral solar radiation segm(nts None of middot
the data should be used without referencing the measurement uncertainty
16
40 CONTENTS OF THE DATA BASE
A t otal of 3 364 spectral data sets ( 16 Mb) are included in the data base
bull 1 4 1 5 Direc t normal
bull 899 Global normal
bull 542 Gl obal horizontal
bull 455 Global tilt
bull 5 3 Dif fuse
I f the data acquisition systems were operating but the atmospheric conditions were too unstable to record a spectrum the broadband and meteorol ogical data were inc luded in the data base but no quality-control processing was applied
FSEC normally operated two spectroradiometers simultaneously one in the direct-normal mode and the other in one of the global modes PGampE operated one spectroradiometer and rotated through the different measurement modes SERI collected direct-normal global-horizontal and dif fuse-horizontal specshytra mostly during cl oudless-sky conditions
Examples of the spec tra are shown in Figures 4-1 through 4-5 Figshyure 4-1 ( a b) shows examples of spectra measured at FSEC in the direct-normal and global modes on a clear day As air mass increases the direct-normal spectra ( a) shift toward longer wavelengths ( the red end o f the spect rum) The global spectra ( b) are slight ly l ess affec ted by the red shift because the radiation scattered out of the direct beam is added back int o the gl obal spectra as diffuse radiation thus returning a portion of the short-wavel engt h ( blue) radiation Figure 4- l ( c) shows the broadband solar radiation corresponding to the spectra
Figure 4-2 shows exampl es of spectra measured under cloudy skies The directshynormal spectra ( a) are almost zero and the global-til t spectra (b ) have low values The graph o f corresponding broadband solar radiation ( c ) shows nearly zero direct normal the global values approach each other becausemiddot all of the irradiance is diffuse under cl oudy skies
Figure 4-3 shows examples of spectra measured on a partly cl oudy day The graph also shows an exampl e of data dropout during data transfer The shape of the spec t ral curve is quite diff erent for low-intensity spec tra measured under cl oud c over ( 10 3 1 air mass 1 88 13 3 1 air mass 1 7 3 ) versus the lowshyintensity spec t rum at higher air mass values ( 1 6 3 1 air mass 5 48 )
Figure 4-4 shows two exampl es of spectra that appear to correspond with sun reflections o f f of clouds which causes a bright spo t [ 1 7 ] and a focusing effect on the solar radiometers The broadband solar radiation values can actually approach or exceed the extraterrestrial value of about 1 3 3 8 on day number 1 3 2 1 3 3 The global solar radiation values approach each o ther while the direct-normal radiation drops indicating that the solar disk is partially blocked by c l ouds
1 7
25 Ec
C1E 1 5
Q)()cctS0 05ctS
Day No 53 1 988 1ico(a) Direct Normal Spectra 0931 to 1 631 ()lt(OJ
00 500 700 900 Wavelength (nm)
EcE
Q)()cctS
0ctS
25
1 5
05
Day No 53 1 988 Global Normal Spectra
931 to 1 631 (b)
300 500 700 900 1 1 00 Wavelength (nm)
1 200 Day No 53 1 988 (c)
cJE
800 Q)()cctS 4000ctS
Global tilt
Global horizontal
0 6 8 1 0 1 2 1 4 1 6 1 8
Time
Figure 4-1 Examples of a) direct-normal and b) global-normal spectra and c) broadband solar radiatio n measured at FSEC o n a clear day
18
0+-+--+-f=t-=F==F==t=P=T==t--+-===+----f
TR-35 13A
- 20 E
Clc E
1 0 Q)()sect 0
300 500
- 20 E
C1c E
1 0 Q)()c laquoS 0laquoS = 00
300 500
1 200
ClE
800 Q)()c -C 400 laquoS
0 6 8
Day No 273 1 987 Direct Normal Spectra
831 to 1 231 (a)
700 Wavelength (nm)
900 1 1 00
Day No 273 1 987 Global Tilt Spectra
831 to 1 231 (b)
700 Wavelength (nm)
900 1 1 00
Day No 273 (c)
middot Global no rmal Global tilt Global horizontal
1 0 1 2 Time
1 4 1 6 1 8
Fi gure 4-2 Examples of (a) direct-normal and (b) global-ti lt spectra and (c) broadband solar radi ation measured at FSEC on a cloudy day
19
I
EcCl
25
E 1 5
Q)()cctl 05
Day No 353 1 986 Global Normal Spectra
Wavelength (nm)
Day No 353 1 986
Fi gure 4-3 radi ati on (lower) measured at FSEC on a partly cloudy day The
-ClE Q)()cctl
1 200
800
400
0
Time
lilobal normal
8 1 0 1 2 1 4
Global horizontal
16 1 8
TR-3 5 1 3A
Examples of global-normal spectra (upper) and broadband solar
spectrum at 1631 shows data dropout duri ng data transfer
Figure 4-5 shows examples o f d i rect-normal gl obal-hor izontal and d i f fuseshyhorizontal spec t ra measured by SERI The di ffuse radi a t i on is most ly concenshytrated in the short-wavelength ( visible) region of the spect rum ( blue sky) The global-ho r i zontal spectrum is equal t o the direct-normal spec t rum mul t i shypl ied by the c osine o f the zenith angle plus the diffuse spec tral radiat i on
The cumula t i ve number o f these spec t ra versus air mass the atmospher i c descriptors Kt Kn DGH and rel at ive humi dity are shown 1n Figshyures 4-6 ( a-f ) The large number of spec t ra at low air mass values is caused by t he opera t i on of the spect roradiometers dur ing normal working hours at midshylat itudes and by the larger air mass values oc curring near sunr ise and sunset whi ch occupy a relat ively smal l frac t i on of the day The large number o f spec tra duri ng relat ively c l ear sky conditi ons i s due t o sdec t i on of clear days for the data taken at SERI the requirement for atmospheric stability during spectral scans and perhaps cl imate types at the three sites Figshyure 4-6 ( c ) shows tha t relat ive humi dity measurements were missing for about 25 global-normal spectra The dif fuse spec tra assoc iated wi th DGH rat i os near 1 0 indi cate very clear condi t i ons where dif fuse measurements are probably within the measurement uncertaint y
20
1200I -
u a
Wmmiddot2)1 I
v+--+--
˜
middot (a) (b) Global normal
(c) Global horizontal (1403
15
InIllDay No 132 19 7 Day No132 1987
Global Normal Spectra 900 to 1 63 0-- 25
clra -Ec bat horizontal Global tilt cJ
N E 800 15 - Q cbull
g 400ctl red - 0 5 ctl I
0 300 500 700 900 11 00 6 8 1 0 12 14 16 18
Wavelength (nm) Time
Day No133 1987 Day No 133 198V
Global normal Global Normal Spectra N 730to 1430 2 5middot Glob tilt
(d) Ec
E 1000
- 500 gctl ctlmiddot- 0 5 -g 1
300 500 700 900 11 00 6 8 1p 12 14 16 18
Wavelength (nm) Time
igure 4-4 Examples pound solar spectra enhanced by cloud bright spots (a) at 1031 on day 132 and (c) at 1230 on day 133 and correspondin [(b) and (d) re pectively] broadband solar radiation J
w111wgt
I
OlDay No 328 1987 0
(a) r1052to 1231 ltt-- 2 5 0
E CDc )E Direct Normal
1 5 Q)C)cro5 05ro
300 500 700 Wavelength (nmr
900 1100
- 25 Ec
E 15
Q)C)cro5 05ro=
Day No 334 1987 1222to 1508
Direct Normal
(b)
300 500 700 900 1100 Wavelength (nm)
Figure 4-5 Examples of direct-normal global-horizontal and diffuseshyhorizontal spectra measured by SERI on two days
Inc luded on the data tape are daily f i eld notes qua l i t y control informa t i on and measuremen t uncertainty Thi s informat i on alert s the user t o problems such as data dropout s ( a s seen in Figure 4-3) and noise in the spectrum (Figshyure 4-7 ) Thi s informa t i on should always be revi ewed when any s pectraL data s e t s are u sed
Phot ographs or s l i de s corre sponding to many of the spectral data s e t s are avai lable at ERI The daily f i eld no t e s that are inc luded wi th the dat a base document the exi s t ence and qual ity of the pho t o s slides
2 2
--------I-
J v l----
r
---
_rV I--
I v
f-
v
I II
I I
___ v -
---- --
I )
-I
v --- --------v f-----
40
TR-3 5 1 3A
LO Direct Normal Spectra vs Air Mass Global Normal Spectra vs Air Mass i40
30ct1E -
lt( 20
1 0 0 400 800 1 200 1 600
40 - -middot 30coE lt( 20
1 0 0 200 400 600 800
ltlil
Number of spectra Number of spectra
Global Horizontal Spectra vs Air Mass Global Tilt Spectra vs Air Mass
40
UJUJco_E -
30 bull
lt( 20
30 coE -
lt( 20
1 0 1 o
Diffuse Spectra vs Air Mass
0 1 00 200 300 400 5000 200 400 600 Number of spectra Number of spectra
40
coE lt(
30
20 bull
1 0 0 1 0 20 30 40
Number of spectra 50
23
I )
v 1-
I--v
( I
)
v --1------I--__
1 I
--l---
If 1
v 1---1-
-_ I---
l u
-----
v I I
----f--e--r-----
I If-
1--- middot
---
100
60
20
Direct Nermal Spectra vs Kn
0 400 800 1200 1600
100
60
0
Direct Normal Spectra vs Kt
400 800 1 200 1600
TR-35 13A
Number of spectra Number of spectra
Figure 4-6 (b) The cumulative number of spectra (horizontal axis) measured over a range of air mass and atmospheric descriptors (vertical axis)
100
60I
20
Direct Norma Spectra vs DirGH
400 soe 1200 160CJ Number of spectra
Direct Normal Spectra vs Rei Hum
6 100
- 60sQ)gt
g 20Q5a 0 400 800 1200 1 600
Number of spectra
c
100
60
20
0
Global Normal Spectra-vs Kn
300 600 900 Number of spectra
Globa Normal Spectm vs DirGHtOO
I 60
20
0 300 600 900 Number of spectra
Global Normal Spectra vs Kt 100
602
20-
0 300 600 900 Number of spectra
Global Normal Spectra vs Rei Hum 100
6E) 60s Q)gt
Q5 20a
a 300 600 900 Number of spectra
Figure 4-6 (c) The cumulative number of spectra (horizontal axis) measured over a range ofmiddot air mass and atmospheric descriptors (vertical axis)
24
f--f--
-I
lJ
1--f-- v
I 1
f--f-
v
1------
1--
( j
---
--
( I
J
1--- -
v
) -----
(
l) __---
v I
1 00
c 60
20
1 00
I 60Q0 20
Global Tilt Spectra vs Kn
0 1 00 200 300 400 500
Global Tilt Spectra vs Kt
Number of spectra
Global Tilt Spectra vs DirGH
Number of spectra
0 1 00 200 300 400 500 Number of spectra
0
1 00
60
20
0 1 00 200 300 400 500
1 00 2-5EE 60 Q)gt-Qi 20a
Global Tilt Spectra vs Rei Hum
1 00 200 300 400 500 Number of spectra
Figure 4-6 (d) The cumulat ive number of spectra (horizontal axis) over a range of air mass and atmospheric descriptors (vertical axis)
Global Horizontal Spectra vs Kn 1 00
c 60
20
0 200 400 600
1 00
60sz
20
Global Horizontal Spectra vs Kt
200 400 600
TR-35 13Amiddot
measured
Number of spectra Number of spectra
Global Horizontal Spectra vs Global Horizontal Spectra vs DirGH Relative Humidity
0
1 00
I 60G
20
0 200 400 600 Number of spectra
0
2-1 00 5EE 60 Q)gt
Qi 20 a
middot
200 400 600 Number of spectra
Figure 4-6 (e) The cumulative number of spectra (horiz ontal axis) measured over a range of a1 r mas s and atmospheric descriptors (vertical axis )
2 5
v-L-
1-----lr--f-
_ v
I
_J7 r
----
v -
_ 1----
___ ---f--
II (
I
r r-[--
r
v---
- 25
1 5
Diffuse Spectra vs Kn 80
70
c 60
50
0 1 0 20 30 40 50
TR-35 13A
Diffuse Spectra vs Kt 85
2 65
75
1 0 20 30 40 50
Number of spectra Number of spectra
Diffuse Spectra vs DirGH Diffuse Spectra vs Relative Humidity
0 1 0 20 30 40 50 0 1 0 20 30 40 50 Number of spectra_ Number of spectra
95 middotE 50
75 Qi 1 0
70
5J
c 30
secta -
Fi gure 4-6 f ) The cumulati ve number of spectra hori zontal axis) measured over a range of air mass and atmospheri c descri ptors verti cal axis)
1 05
r 85
EclE
Clluc m =g
300 500 700 900 1 1 00
05
Day No 2 1 6 1 987 Global Normal Spectra
730 to 1 5 30
Wavelength (nm)
Fi gure 4-7 Exampl es of spectra showi ng noisy data i n the ultravi olet 300shy400 nm) and near-inf rared 1000-1 100 nm) regions
26
5 0 MEASUREMENT UNCERTAINTY
( No t e Thi s s ec t ion contains only a brief summary o f the total uncertainty The deta i l ed reports [ 1 5 1 6 ] on the methods used to e s t imate tota l spect ra l measurement uncertainty should he consul ted- when using thi s datamiddot middot ba se )
The data set de scribed in thi s document i s the bes t set of measurement s posshys ible wi th the personnel equipment methods and cal i brat i on procedure s avai l able t o us We found that making continuous measurements wi th complex s ens i t ive equipment and account ing for all source s o f error in order to specify total mea surement uncertainty were not triviaL tasmiddotkamp oo
The e s t imat ed total uncertainty ( 95 confidence int erval ) for each of the spec troradi ometers and each of the measurement modes is shown in Figure 5-l The upper and l ower spec tral uncertainty limi t s are symmetrical except when gl obal-t i l t or gl obal-hori zontal s pectra were measured us ing the integrat ing sphere and when a s t rong direct-beam component wa s present ( Kt gt 6 0 ) We added an 8 maximum bias to the l ower uncertainty l imi t s for these cases based on resul t s o f experimen t s in whi ch we mapped the integrat ing sphere res ponse under bri ght sun wi th the image o f the sun in di f ferent locations on the ins ide of the sphere During the se exper iment s we observed variat i on s o f up to -8 compared t o the calibrat i on point
The high uncertainty in the abso lute value o f the spectral measurement s l e s s than 0 45 m wa s caused by l ow s pectra l irradiance for the calibrat i on l amp s which resul ted in a l ow s i gnal-t o-no i s e rat io for the spec troradiorriet er cal i shybrat ions ( F igure 5-2) In add i t ion we experienced a change ( i e l o s s o f respon s e ) i n the ultraviolet ( UV ) re sponse of the instruments when us ing the integrating sphere s
To tal uncert ainty i s a combinat i on o f an e s t imated total spectral bias error and to tal spec tral random error The f inal est imated total uncertainty for a 95 conf idence interval i s calculated as the
random (R) error root- sum-s quare of the bias ( B)
erro r plus two t ime s the
To eva luate instrument-to-instrument d i f ferences or variabi l i ty ( al s o called between-inst rument prec i s i on ) s imul t aneous spectral solar radiat i on s c an s were made wi th each ins t rument in each conf igurat i on The s tandard devi a t i on of the se mea surement s mul t i plied by three was converted to a percentage o f the mean Thi s percent age ind icates the expected instrument-to-instrument varibi l i t y or prec i s i on for thi s set of instrumen t s Fi gure S-3 shows the resul t s obtained for one o f these compari sons us ing the integrat ing s phere s Simi lar resul t s oc cur wi th the other conf igurations The between-inst rument prec i s i on above 0 4 m i s close to 5
Temperature control o f the spe ro adiorrieters with s i l icon detectors wa s import ant Figure 5-4 shows the change in the res pori se o f the instrumen t s espec i a l ly in the near- infrared when o perated at d i fferent control temperashyture s Uncertainty of l deg C in the set point resul t s in about a 2 uncertainty in the near-inf rared measurement s On ho t days we found that the t emperat ure
2 7
(
-Lower
r --
I IV
limityen(-)
-
A u1pp r li it +) f I II I
y 1 I rl ( I _ L
-
-
I I )
f--+- -+--+--1-+---+--1- r--J- Upper -c- A I u o t-iE $ == $= =$S y I I I I t (
1 --( -
----L---------------------- -_j_j_J__J__J__J
TR-35 1 3A
20
c(ij 0tQ)ucJ -20
Global (Sphere) 1 02 1 58 1 74
limit (-) Kt lt 60 Upper limit ( +)
Lower Kt gt 60
(a)
20
c(ij 0t
5 -20 L t )ower 1m1 -
300 500 700 900 1 1 00
Wavelength (nm)
Global Normal (Domes) 1 74 2 1 8 (b)
300 500 700 900 1 1 00 Wavelength (nm)
Direct Normal 1 58 1 72 1 74 (c) 20
limit ( +)gt- iQl u Lower 1m1 -) 5 -20
300 500 700 900 1 1 00 Wavelength (nm)
Figure 5-l Estimated total spectral measurement uncertainty f or global measurements with the i ntegrating spheres on (a) units number 102 158 and 174 (b) global-normal measurements with the Teflon dome receivers on units 174 and 218 and (c) directshynormal measurements with the view-limiting tubes on units 158 172 and 174 The measurement uncertainty is synmetrical except in (a) where a -8 bias is included in the lower limit f or global-horizontal and global-tilt cases due to nonunif orm sphere response when a str ong direct-beam component is present
28
I I
0
0 (J) ()
- 1 0
t U
TR 35l3A
Wavelength (nm)
Figure S-2 Comparison of the spectral intensity of an out door global-normal measurement and the NIST calibrationmiddotmiddot lamp source L ow lamp values below 400 nm result in high measurement uncertainty
20
1 5
R 1 0
X 5Q)0c c 0
-5 Q)_0
300 400 500 600 700 800 900 1 000 1 1 00 Wavelength (nm)
Figure S-3 Between-ins trument precis ion for glo bal-normal spectral solar radiation measurements us ing the integrating spheres
29
5 1 deg C N
ij0
()00- caQ)uc
1 000 Q)-Q) 8 0950 0ca
c 0900
0 300 500 700 900 1 1 00
Wavelength (nm)
Figure 5-4 Ratio of the spectroradiometer detector response at different temperatures to the response at 40deg C
o f the detectors ( contro l l er s ) somet imes exceeded the set point and we experienced runaway temperatures Thi s resul ted in ampl i f i er mi l l ivolt drift errors and no i s e in s ome o f the s pectra We achieved better t emperature conshytrol by shield ing the spectroradiometers with Mylar sheet s supported by foam offsets to allow air flow
Mea surement uncertainty for the broadband and meteorological data i s based on the cal ibration hi s tories provided by the mea surement s i t e s and charact ershyi s t i cs of the instrument s Thi s information is given in Tables 5-l through 5-3 and the values are included on the data-ba se tape
In these table s the measurement uncertainty for a 95 confi dence int erval was e s t imated by root-sum-s quaring the est imated bias errors a d by doubl ing the random errors in the cal i brat i on proce s s and measurement s [ 15 1 6 ] Radishyometers used at PGampE in 1987 were po st-cal i brated at SERI allowing e s t imate s of the random calibrat i on error component the radi ometers used i n 1988 were cal ibrated elsewhere so nominal e s t imated errors were used in the uncertainty analys i s Ins t rument s used at SERI were pre- and po st-cal ibrated at SERI Instrument s used at FSEC were cal i brated by FSEC and nominal values for random and bias errors for the s e types of radiometers were used in the uncershytainty analys i s Cal i brat i on informat ion for the meteorological instrument s i s included i n these tables but no mea surement uncertainty analys i s was performed
30
H 11 VI _ w
Jgt
--
IllIll
Tabl e 5- l FSEC Instrument Calibrat ion Hi story Ul d Estimated Meas urement Uncert ainty N-
Es timated Beg i nn ing Calibrat ion Measurement
Channe l iF Meas urement Instrument Comment s Time Stamp Date Uncertainty
( )
1 Direct normal 862961507 Eppley NIP 14306 E6 5-86 ( thermopi l e ) 863520931 Epp l ey NIP 23943E6 12-86 plusmn2 9
8801 2093 1 Eppl ey NIP 23943E6 12-87 1 32 change
2 Global normal 862961507 Eppl ey PSP 24185F3 Eppley PSP 24185F3 1 1-86 1 6 7 change plusmn3 8
872881032 Eppley PSP 18273F3 4-87 880120931 Eppley PSP 24185F3 1 2-87
3 Globa l hori zontal 862961507 Eppl ey PSP 1 43 2 1 F3 4-86 ( thermopi l e ) 8709 3 1 6 3 1 Eppl ey P S P 14322F3 1 2-87 -- plusmn3 8
w _ 872881032 Eppley PSP 143 18F3 4-87
4 G lobal t i l t 86329103 1 872881032
Eppley PSP 24183F3 Eppley PSP l4320F3
1 1-86 4-87 -- plusmn3 8
880120931 Eppley PSP 24183F3 1 2-87
5 D irec t normal 8629 6 1 507 Mat r ix NIP3826 9-86 ( si l i con) 88012093 1 Matrix NIP3826 12-87 1 32 change plusmn2 9
6 Temperature 862961507 Weathermeasure 1 7 7
1420A 6-86 3-87 8-88
smal l changes the cal ibratiqft factor was changed i software
7 Pressure 86296 1507 Weathermeasure 1 70 5 1-86 smal l c anges the 1 7 8 5-87 cal ibra t i on factor was
Hmiddot 6-88 changed i n software
8 Relat ive humi dity 8629 6 1 5 0 7 Weathermeasure 1 54 0 6-86 Cal culated from dew 175 point compared every
o ther week wi th another instrument
9 Wind speed 862961507 Weathermeasure 1 222 7-86 smal l chlnges the 1219 3-87 cal ibrat i o fac tor was ---
6-88 changed in software
J
-
Ill _-
bull I
Table 5-l FSEC Instrument Calibrat ion Hi stb y and Estimated Measurement Uncertainty (Concluded)
Channel Measurement Beginning Time Stamp ihsttument Cal ibrat ion
Date Comment s
Estimated Measurement Uncertainty
( )
INN
10 Albedo 86329103 1
87288103 2
Eppley PSP 1629 FJ Eppley PSP l 106Srl
1 1-86
4-87
-- plusmn3 8
19 Global hori zontal
( si l i con)
862961507
87 148143 1
LI-COR Py PY22J6 LI-COR yt PY2279
7-86
5-87
plusmn3 8 --
Mo wV11-wgt
I
--
p V1 1-
--
--
--
UlIllN-
Tabl e 5-2 PGampE Ins trument Calibrat ion Hi s ory and Estimated Measurement Uncertainty 1 _
Estimated Beginning Pre- Po st-Channe l if Measurement Instrument Comment s Mea surement
Time S tamp Cal ibra t i on Cal ibrati on Uncertainty ( )
l D irec t normal 87 1 100632 Eppl ey NIP 255 08E6 1-86 8-88 0 3 change plusmn2 8 ( thermopi l e ) 880190 752 Eppl ey NIP 255 10E6 12-8 7 -- plusmn3 6
2 G lobal normal 87 1 100632 Eppl ey PSP 2 32 02F3 1-86 8-88 1 7 change plusmn2 4 880190 7 5 2 Epp l ey PSP 23996F3 12-87 -- -- plusmn4 7
3 G lobal hori zontal 8 7 1 1 00632 Eppley PSP 23995E3 10-84 8-88 3 2 change plusmn2 8 w w
( thermopi l e ) 880190 752 Eppl ey PSP 25390F3 12-8 7 plusmn4 7
4 G lobal t i lt 8 7 1 1 00632 Epp l ey PSP 25387F3 12-84 8-88 0 2 change plusmn3 8 -- plusmn4 7 880190 752 Eppley PSP 23201F3 12-87
5 D irec t normal 8 7 1 100632 Matrix NIP 38Hi 5-86 7-88 2 7 change plusmn2 2 ( si li con)
6 Temperature 8 7 1 1 00632 Omega T-coupl e
7 Pres s ure 8 7 1 1 00632 Yel l ow Springs 2014-22 3 1 -HA- 1-WH 15593 3-84
8 Relat ive humi dity 87 1 100632 Hygr o 14276 2-85
9 Wind speed 8 7 1 1 00632 8804007 3 7
Weathert ronics Weathertron i c s
2301 230 1
184 184
9-82 2-88
10
19
Albedo 8 7 1 1 00632 Eppl ey PSP 2 1235F3
Globa l hori zont al 87 1 100632 LI-COR Pyr PY5558 ( s i l i con)
Beginning about 8 7 2 1 1 the s i l i con NI P va lues appear cons i s tent ly l ow
-- 8-88 2 4 change
1 1-83 8-88 1 9 change
may be an al ignment problem
plusmn2 6
plusmn2 6
gt-3 Iw
wgt
-- --
--
-- --
1ftIll -
Table 5-3 SERI Instrument Calibration Hi story and Estimated Measurement Uncertainty =
Estimated Beginning Pre- Post-Channel I Measurement Instrument Comment s Measurement Time S tamp Cal ibration Cal ibration Uncertainty ( )
1 Direct normal 87328 Eppley NIP 1 7828E6 11-87 2-88 1 5 7 change plusmn3 3 ( thermopil e )
2 Global normal None
3 bull Global horizontal 87328 Eppley PSP 1 78 63F3 1 1-87 2-88 2 22 change plusmn3 7 ( thermo pi l e ) a t Welby
w+- At SRRL 8805 7 Eppley PSP 200 79F3 7-87 8-88 0 7 3 change plusmn2 3
4 Global t i l t None
5 Direct normal None ( si li con)
6 Temperature 87328 Taylor Pocket 21430-1 10-86 (Due 10-9 1 )
7 Pressure Cal culated from elevat ion
plusmn0 2 (deg )
8 Relat ive humidity 87328 Dickson 86 100-1 9-87 10-88 -- plusmn2 ( counts )
9 Wind speed Observat ion
10 Albedo -- None
1 1-14 -- Sun photometer ( relative compari sons only)
15 Cloud c over Observed o-3-- lXlIw Global Ho rizontal -- LI-COR Pyr PY1245 11-87 2-88 3 67 change plusmn2 9 V119 ( si l icon) ( s tabi l i ty monitor only) wgt
TR-35 13A
We urge users of the data ba se to refer to the dai l y f i eld no tes for s pe c i a l c i rcumstances recorded b y the operator that may affect data uncertainty The s e no tes include references to the spectroradiometer t emperature c onshyt ro l l e r solar-tracking accuracy and weather cond i t i ons ( such as rain ) Included in the dai l y notes on tbe data-base tape are obs ervat i ons made in qual i t y-control processing as wel l as references to the exi s t ence and qual i t y o f pho t ographs or s l ides
Quant i tat ive pos t-proces s ing qual i ty-control informat i on i s al s o inc luded on t he data-bas e tape and a complete descript ion is given in the appendix o f thi s report Redundant measurement s ( such as before- smiddotcan andmiddot middot aft et-smiddotcan
broadband solar radiat i on direct-norma l and global-hor izont al mea surement s with both thermopile and s i l i con detectors ) and compar i s ons o f integrat ed s pectral so lar radiat ion wi th broadband s o lar radiat i on were used in the qual i ty-control procedure s Users are encouraged to perform the i r own qual i t y-cont rol proce s s ing on the data t o meet their par t i cular requiremen t s
3 5
6 0 FORMAT OF THE DATA TAPE
The meas ured dat a f i eld notes quali ty-control informa t i on and mea surement uncertainty are s t ored on magne t i c tape in 80-character l ines wi th the fi leshyname s given in Table 6- 1 The f i l enaming convent ion used for the mea sured data was
Filename Content
FLA8705 DAT FSEC data 1987 May PGE880 l DAT PGampE data 1988 January SER8 7 1 1 DAT SERI data 1987 November
Data were not acqui red in a l l months so the months may not be cont iguous
Qua l i t y-control informa t i on has the same f i l enaming conven t i on with QC extens ion ( for example FLA8 705 QC ) Dai ly notes are contained in the f i l e s FSEC NOTES PGE NOTES and SERI NOTES respec t i vely The mea surement uncershytainty is in the UNCERT f i l e s
c The DAT f i l e s contain two types of informa t i on D for data and for inst rument configurat ion The f i r s t l ine of a data or confi guration segment beg ins wi th a D or a c re spect ively in the f i r s t column followed by the s i t e year day and t ime stamp the number of l ines in the segment i s in column-s 76-80 so that the user can eas i ly skip the de s i red number of l ine s An example of the information in the conf iguration or 1 1C segment i s
c shown in Figure 6-1 I t begins wi th a followed b y the s i t e FSEC year 11 1 98 7 day 122 and t i me u0830 latitude longi tude and eleva t i on There are 19 channel s for mea surement s zero s pectra in the C segment and 40 l ine s in the segment The con f i gurat ion informa t i on appear s whenever the inst rument set-up or cal ibrat ion wa s changed or t he data acqui s i t ion sys t em wa s res tarted I f the configurat i on wa s not changed at the beginning of the month the configura t i on segment wi l l be in the previous mont h s DAT f i l e
An examp le of a D segment i s shown in Figure 6-2 Thi s segment contains the mea s ured me teoro logical dat a broadband and spectral solar rad i a t i on dat a and anc i l l ary data The data contained in each l ine and column and i t s format are as follows
POS ITION OF VARIABLES IN THE D SEGMENTS (ALL LINES ARE 80 CHARACTERS )
Line Column Cont ent s Format
a = character 1 = integer f = f l oat ing point
LINE 1 1 1 D ( for data ) ( a l ) 3 1 5 Site Year Day Number Time Stamp ( a 1 3 )
3 6 F SEC PGampE o r SERI ( a4 ) 7 8 Year (a2 or i 2 ) 9 1 1 Day Number ( a3 o r i 3 ) 1 2 15 Standard Time ( a4 o r i4 )
36
5-111 - il ll
Da i ly
Uncertainty
-
TR-35 13A -
Table 6 1 Namesmiddot of Files on the Data Tape
Measured and
FSEC
FLA8610 DAT FLA8 6 1 0 QC
FLAB 6 1 1 bull DAT FLA8 6 l l QC
FLA86 1 2 DAT FLA8 6 1 2 QC
FLA8 7 0 1 DAT FLA8 70 l QC
FLA8 704 DAT FLA8 704 QC
FLA8 705 DAT FLA8 7 05 QC
PGampE
PGE8 704 DAT PGE8 704 QC
PGE8 705 DAT PGE8 705 QC
PGE8 706 DAT PGE8 7 06 QC
PGE8 7 0 7- DAT PGE8 7 0 7 QC
SERI
SER87 l l DAT SER8 7 l l QC
S ER8 7 1 2 DAT SER8 7 1 2 QC
SER880 1 DAT SER880l QC
SER8802 DAT SER8802 QC
Ca lcui a t ed Data
FLA8 706 DAT FLA8 706 QA
FLA8 7 0 7 DAT FLA8 7 0 7 QC
FLA8 7 0 8 DAT FLA8 7 0 8 QC
FLA8 709 DAT FLA8 7 09 QC
FLA8 7 1 0 DAT FLA8 7 1 0 QC
FLA8 7 l l DAT FLA8 7 l l QC
PGE8 708 DAT middot
PGE8 708 QC
PGE8 7 0 9 DAT PGE8 709 QC
PGE8 7 l l DAT PGE8 7 l l QC
No t e s
FSEC NOTES PGampE NOTES SERI NOTES
Mea s urement
FSEC UNCERT PGamp E UNCERT SERI UNCERT
FLA8 7 1 2 DAT FLA8 7 1 2 QC
FLA880l DAT FLA880l QC
FLA8 802 DAT FLA8802 QC
FLA8803 DAT FLA8803 QC _
FLA8804 DAT FLA8804 QC
PGE_880l DAT PGE880l QC
PGE8802 DAT PGE8802 QC
PGE8803 DAT PGE8803 QC
3 7 _middot
1 3
1 7
55 1 1-1 TR-3 5 1 3A
0 G) 0 G)G) iC FSEC8 7 1 2 2 0 8 1 3 2 8 4 0 0 0N 80 6 0 0 0W 2M C = 8 7 1 2 2 0 8 1 3 8 7 1 2 2 0 8 1 3+0 0 0 0 0 0 1 9 0 4 0
CHN PARAMETER +- - - - - - - INSTRUMENT- - - - - - - - - -+ +- -CALIBRATION- + OUTPUT FOOT NO TYPE MAKER TYPE SERIAL FACTOR DATE UNITS NOTES
1 Di r- Nor-m Eppley NIP 2 3 9 4 3E6 6 08 1 2 - 186 Wm2 2 Glo Nor-m Eppley PSP 2 4 1 85F3 8 85 l l - 186 Wm2 3 G l o Hor-z Eppl ey PSP l 4 3 2 2F3 6 3 8 1 2 - 2 86 Wm 2 4 Glo Tilt Eppley PSP 2 4 1 83F3 8 9 9 l l - 186 Wm2 iacute5 Dir- N S i MATRIX SI NIP 3826 31 8 0 9 - 186 Wm2 6 Amb Temp WTHRMEAS PRT 1 7 7 l 0 0 3 - 1 8 7 Deq c 7 Sur-f Pr-es WTHRMEAS PIEZO 1 7 8 l 0 0 5 - 1 8 7 Mi l l ibar-8 Re1 Hum WTHRMEAS LiCl 1 7 5 l 0 0 6 - 1 86 Per-cent 9 Wind Spd WTHRMEAS OPT CHOP 1 2 1 9 l 0 0 3 - 1 8 7 Met e r- s i S
1 0 Albedo Epp ley PSP l 6 2 9 7F3 1 0 0 9 l l - 1 8 6 Per-cent l l hot 380 Unused Unused Unused - 9 9 0 0 - 1 - l - 1 Counts iacute1 2 hot 5 0 0 Unused Unused Unused - 9 9 0 0 - 1 - l - l Count s
14 hot 860 Unused Unused Unused - 9 9 0 0 - 1 - 1 - 1 Counts hot 942 Unused Unused Unused - 9 9 0 0 - 1 - l - l Counts
1 5 Opq C loud Unused Unused Unused - 9 9 0 0 - 1 - l - l Tenths 1 6 H2 0 NWS Unused Unused Unused - 9 9 0 0 - 1 - l - l em
Spect l LI -COR L I - 1 8 0 0 PRS - 1 7 2 l 0 0 2 - 1 8 7 W sq m nm l Spect 2 L I - COR L I - 1 800 PRS - 1 0 2 1 0 0 2 - 1 8 71 8 W sq m nm l
1 9 Glo H Si LI -COR L I - 2 0 0S PY2 276 8 4 5 7 - 1 86 Wm2 2 - 1 FIN
FOOTNOTES
1 - 1 7 = DN 18 = GT 2 - SERI l oan un i t
- 1 - FIN
Figure 6-1 Example of the instrument configuration data on the data base tape The numbers refer tmiddotO
1 c indicating configuration 2 FSEC 1987 Day 122 at 8 13 standard time 3 Latitude 4 Longitude 5 Ele vation 6 Reference to configuration file that will be f ound in the
data files 7 Starting data-acquisition time plus number of attempts to
acquire spectra (which would extend the data acquisition time)
8 Number of data channels 9 Number of spectra ( 0 f or configuration files 1 or 2 f or
data files) 10 Number of lines in this segment
38
TR35 1 3A
D FSEC8 7 1 2 2 0 8 1 3 2 8 4 0 0 0N 8 0 6 00 0W 2M C=871 2 2 0 8 1 3 8 7 1 220 814+0 0 0 1 0 0 1 9 2 1 0 0 gS e e Q N FSEC8 7 1 2 2 U PRS - 1 7 2 Col 2 ( + - ) U PRS - 1 0 2 Col 2 ( - ) Col 4 ( + ) 1 7 84 5 5 7 54 5 2 9 3 0 2 - 1 - 9 9 0 3 48 0 1 1 9 48 3 3 4 4 2 7 9 - 1 -9 9 0 1 7 85 0 5 7 5 5 7 2 9 3 0 4 - 1 - 9 9 0 3 4 8 1 1 1 9 4 85 3 4 43 0 1 - 1 - 9 9 0 2 8 4 1 80 0
1 0 9 5 4 1 5 - 99 0 7 1 0 1 7 8 6 2 0 7 8 7 5 8 9 1 5 - 1 - 9 9 0 - 1 - 9 9 0 iacute1 1 3 80 0 - 99 0 Co 1 2 5 0 0 0 - 99 0 Co 1 3 860 0 - 99 0 Co 1 4 942 0 - 9 9 0 Co iacute
- 1 6 0 7 1 5 8 5 7 8 5 6 7 1 58 3 86 9 1 9 9 1 8 7 - 9 0 0 - 9 0 0 - 9 0 0 - 9 0 0 - 9 0 - 9 0 3 1 1 7 4 0 1 3 0 0 1 1 0 0 2 0 57 9 8 9 4 0 0 DNT1 8 4 0 1 3 0 0 1 1 0 0 2 0 2 8 4 1 8 0 0 6 2 4 GTS - 1 0 0 0 0 0 0 0 0 0 0 0 - 1 0 0 0 o o 0 0 0 0 o o
1 3 0 0 0 0 0 0 0 0 3 5 0 0 0 4 0 0 2 1 0 02 5 0 0 14 0 04 1 0 02 1 0 0 5 7 0 0 3 8 amp 1 3 2 0 0 0 7 2 0 056 0 1 0 1 0 0 8 1 0 1 1 8 0 1 2 1 0 1 1 9 0 140 0 138 0 1 3 1 amp 1 340 0 1 4 9 0 16 1 0 162 0 1 5 5 0 16 0 0 1 6 3 0 1 8 5 0 1 9 5 0 1 9 8 0 1 9 9 amp 1 360 0 2 0 9 0 2 1 9 0 228 0 2 4 3 0 258 0 26 5 0 258 0 265 0 268 0 2 89 amp 1 380 0 2 8 0 0 2 7 9 0 26 7 0 2 7 3 0 3 0 1 0 3 08 0 3 1 7 0 326 0 349 0 4 0 2 amp 1 4 0 0 0 4 7 6 0 52 7 0 55 7 0 569 0 580 0 5 9 5 0 6 12 0 63 0 0 64 1 0 648 amp 1 4 2 0 0 652 0 6 54 0 6 58 0 649 0 6 36 0 6 3 2 0 646 0 67 8 0 7 1 8 0 746 amp 1 440 0 7 6 8 0 7 9 9 0 82 2 0 854 0 8 7 7 0 9 0 4 0 9 1 5 0 92 2 0 934 0 94 2 amp 1 460 0 9 6 0 0 964 0 9 7 0 0 9 7 3 0 96 9 0 9 74 0 9 9 0 0 9 9 9 1 0 1 7 1 028 amp 1 4 8 0 1 0 3 3 1 0 25 1 0 0 6 0 9 9 1 0 9 9 0 1 0 1 0 1 026 1 0 3 8 1 043 1 0 4 7 amp 1 500 1 0 3 8 1 034 1 038 1 0 5 1 1 0 58 1 058 1 0 5 1 1 0 3 5 1 0 1 7 1 0 0 7 amp 1 520 1 0 2 0 1 04 1 1 0 5 7 1 063 1 068 1 0 8 1 1 088 1 0 9 3 1 0 9 3 1 0 9 1 amp 1 540 1 0 8 9 1 0 84 1 088 1 0 9 5 1 0 9 7 1 0 9 5 1 0 9 8 1 1 0 2 1 094 1 0 8 7 amp 1 560 1 0 7 8 1 0 7 9 1 08 1 1 0 7 7 1 0 7 2 1 0 7 1 1 0 7 6 1 0 7 8 1 0 7 8 1 0 82 amp 1 580 1 0 9 0 1 0 9 8 1 1 0 1 1 088 1 0 7 4 1 062 1 06 1 1 06 7 1 0 7 4 1 0 80 amp 1 6 0 0 1 082 1 085 1 08 8 1 0 9 2 1 0 9 3 1 0 89 1 083 1 0 7 8 1 0 78 1 0 7 9 amp 1 620 1 0 8 2 1 083 1 0 7 6 1 065 1 0 5 9 1 056 1 06 1 1 0 7 3 1 0 8 0 1 085 amp 1 640 1 0 86 1 084 1 08 1 1 0 7 6 1 067 1 062 1 0 5 2 1 04 2 1 038 1 048 amp 1 660 1 0 7 0 1 086 1 0 9 4 1 0 9 7 1 0 96 1 096 1 09 2 1 0 9 3 1 0 9 1 1 0 89 amp 1 680 1 0 7 9 1 064 1 02 8 0 9 8 0 0 94 3 0 9 3 7 0 954 0 98 0 0 9 9 6 1 0 0 5 amp 1 7 0 0 1 0 0 8 1 0 0 9 1 0 1 3 1 0 1 9 1 0 2 5 1 0 2 2 1 0 0 3 0 9 7 3 0 924 0 8 74 amp 1 7 2 0 0 846 0 842 0 84 8 0 84 9 0 8 54 0 8 7 8 0 9 0 3 0 9 3 1 0 9 52 0 965 amp 1 740 0 9 6 9 0 9 7 7 0 98 3 0 989 0 988 0 9 8 2 0 9 7 6 0 95 0 0 8 81 0 7 6 7 amp 1 760 0 6 1 6 0 5 24 0 54 0 0 646 0 7 7 9 0 8 76 0 924 0 94 5 0 94 7 0 9 45 amp 1 7 8 0 0 94 2 0 94 2 0 9 3 7 0 9 2 6 0 9 1 6 0 9 0 7 0 89 9 0 894 0 8 9 1 0 89 0 amp 1 800 0 888 0 883 0 8 7 9 0 87 5 0 863 0 836 0 8 0 1 0 7 5 7 0 7 2 2 0 7 1 0 amp 1 820 0 7 1 0 0 7 1 9 0 7 3 3 0 74 1 0 7 4 9 0 7 5 7 0 76 3 0 7 7 7 0 7 9 7 0 8 1 0 amp 1 840 0 82 0 0 82 8 0 82 7 0 82 2 0 8 1 5 0 7 9 7 0 786 0 7 83 0 7 8 8 0 7 9 7 amp 1 860 0 80 4 0 8 0 0 0 7 8 8 0 7 8 0 0 7 7 5 0 7 8 0 0 7 8 7 0 786 0 785 0 7 81 amp 1 880 0 7 7 5 0 7 7 4 0 7 7 2 0 767 0 763 0 7 4 7 0 72 1 0 68 2 0 6 30 0 5 88 amp 1 9 0 0 0 57 1 0 5 7 3 0 58 9 0 584 0 568 0 549 0 53 4 0 53 3 0 5 38 0 5 56 amp 1 9 2 0 0 5 7 3 0 57 9 0 56 7 0 526 0 448 0 362 0 2 7 2 0 2 18 0 2 1 0 0 2 32 amp 1 940 0 254 0 262 0 2 5 7 0 253 0 25 7 0 266 0 2 7 5 0 2 85 0 29 9 0 3 1 7 amp 1 960 0 3 33 0 362 0 3 9 6 0 4 3 5 0 4 7 9 0 5 06 0 5 1 5 0 5 1 2 0 5 08 0 5 2 1 amp 1 9 8 0 0 53 7 0 560 0 5 84 0 5 9 7 0 6 0 9 0 6 1 7 0 6 1 8 0 6 2 3 0 62 1 0 6 1 9 amp 1 1 0 0 0 0 6 1 8 0 6 0 7 0 6 0 5 0 6 0 2 0 60 1 0 60 5 0 6 04 0 604 0 604 0 6 0 1 amp 1 1 0 2 0 0 60 1 0 59 5 0 5 9 5 0 5 93 0 589 0 59 0 0 584 0 5 82 0 580 0 5 75 amp 1 1 0 4 0 0 5 7 6 0 5 7 1 0 57 1 0 56 7 0 56 0 0 56 0 0 558 0 552 0 545 0 54 0 amp 1 1 0 6 0 0 5 36 0 53 2 0 5 2 9 0 5 2 5 0 5 1 9 0 5 1 5 0 5 1 2 0 51 1 0 50 9 0 5 08 amp 1 1 0 8 0 0 50 6 0 502 0 4 9 2 0 48 3 0 48 3 0 483 0 46 9 middot 0 4 5 2 0 447 0 3 1 amp 1 1 1 0 0 0 4 1 1 - 9 9 0 0 0 - 9 9 0 0 0 - 9 9 0 0 0 - 9 9 0 0 0 - 9 9 0 0 0 - 9 9 0 0 0 - 9 9 00 0 - 1 582 3 2 2 3 0 0 0 0 0 6 0 0 0 1 0 0 0 4 0 0 1 3 0 0 1 9 0 0 2 3 0 04 1 0 0 5 5 0 064 0 088 amp 2 3 2 0 0 1 0 5 0 1 3 9 0 1 7 9 0 1 8 9 0 2 2 4 0 2 38 0 26 2 0 252 0 261 0 2 64 amp 2 340 0 2 8 7 0 2 9 2 0 266 0 2 88 0 2 98 0 286 0 3 0 0 0 3 0 0 0 2 9 1 0 2 85 amp 2 360 0 296 0 3 1 0 0 3 36 0 367 0 3 9 0 0 3 7 2 0 3 56 0 356 0 3 7 3 0 3 88 amp
Figur e 6-2 Examples of the data on the data-base tape
3 9
TR-3 5 1 3A
16 2 3 24 24 2S 3 3 34 34 3S 3 9 40 40 4 1 S 2 S4 69
54 62
6 3 6 3
6 7 6 7
7 0 7 3
74 7 S
7 6 80
LINE 2
LINE 3
1 3 4 10
1 1 1 3 14 20 2 1 23 24 30 3 1 40 4 1 43 44 SO 5 1 5 3 54 60
Lat i tude ( deg ) N ( north) Longi t ude ( deg ) W ( we s t ) `Elevat i on (m) M (m) Reference t o Conf i guration Segment Start ing year day t ime for the spectral `scan s ) i f any and number of attempt s t o `acquire the s can ( which ind i cates po s s ible `t ime delay from the s tart ing t ime ) middot
Year Day Number Time
11+11 for plus number of attempt s to acquire a s pect rum
Number o f attempt s t o acquire a s pectrum
Po s s ible Number o f Measurement s ( 1 9 )
Number o f Spec tra i n thi s Segment ( 0 1 or 2 )
Number o f Lines in Segment
Pointer to the qua l i ty-cont rol dai ly f i e ld note s and measurement uncertainty informa t ion Qua l i ty-control informa t i on is in the QC f i l e of the same month wi th the same s i t e year day and t ime s t amp Dai l y field notes are i n the NOTES f i l e f o r the same s i t e wi th the same s i t e year and day s tamp Mea surement uncertainty i s in the f i l e s UNCERT under t h e instrument serial number ident i f i ed by PRS-xxx and the column s in the uncertainty f i le s for + and - uncertainty l imi t s
Broadband mea surement s before the spectral scan
Channel fH Direct Normal ( thermopi l e ) (Wm2 ) Channel ffoS Direct Normal ( s i l i con) (Wm2 ) Channel tn Global Normal ( Wm2 ) Channel not used Charinel ffo3 Globa l Hori zontal ( thermop i l e ) ( Wm2 ) Channel fH 9 Gl obal Horizontal ( s i l icon ) ( Wm2 )
( f 8 4 ) ( a 1 ) ( f 9 4 ) ( a l ) ( i S ) ( a l ) ( a l 2 )
( a9 o r i 9 )
( a 1 )
( i 1 )
( i4 )
( i 2 )
( i S )
( a8 0 )
( i 3 ) ( pound 7 2 ) ( i 3 ) ( pound 7 2 ) ( i 3 ) ( f 7 2 )
( i 3 ) ( pound 7 2 ) ( i 3 ) ( pound 7 2 )
40
TR-35 3A
6 1 6 3 64 7 0 7 1 80
LINE 4
LINE 5
1 6
7 1 2
1 3 80
LINE 6
1 3 4 1 0
1 1 1 3 1 4 20 2 1 23 24 3 0
3 1 3 3 34 40 4 1 43 44 5 0 5 1 5 3 5 4 6 0 6 1 6 3 64 7 0 7 1 7 3 7 4 8 0
LINE 7
LINE 8
1 5
6 1 2
Channe l 114 Gl obal Ti l t (Wm2 ) hellipChannel not used
Broad band mea suremen t s a f t e r t h e s p e c t ral s can same format a s beforeshy scan ( LINE 3 )
T i l t o f the f ixed- t i l t i n s t rument s hellipf rom the hor i z ont a l ( d eg )
Az i muth of the f i xed-t i l t ins t rumen t s ( de g ) ( 1 8 0 deg = s outh)
De s c r i p t i on o f any s pec i al i n s t rument ( fo r example d i ffu s e-hori zont a l mea s uremen t s a t SERI )
Channe l IFlOAl bedo (Wm2 ) hellipChannel IH5C l oud Cover ( t enths ) Channel fF7 Surface Pres sure ( mb ) Mea s ured at FSEC and PGampE c a l c u l ated from e l eva t i on a t S ERI [ 1 1 p 1 0 0 ]
Channel 116 Amb i en t Temperature ( deg C ) Channel fiB Rel a t i ve Humi d i t y ( ) Channe l ffo9 Wind S peed ( m s ) Add i t i onal channe l des cri bed 1n l i ne 5 Va l ue Add i t i onal channel descri bed 1n l ine 5 Va l u e
Sun Pho t ometer read ings ( only recorded for SERI dat a not u s ed except for re l a t i ve c ompar i s on s ) hellip
Earth-S un d i s tance c orrec t i on ( d e v i a t i on from 1 0 ) hellip
Ext ra t erre s t r i a l Rad i a t i on (Wm2 ) hellip
( i 3 ) ( pound 7 2 )
( f 6 1 )
( f 6 1 )
( a 8 8 )
( i 3 ) ( 7 1 ) ( i 3 ) ( 7 1 ) ( i 3 ) ( f 7 1 )
( i 3 ) ( pound 7 1 ) ( i 3 ) ( pound 7 1 ) ( i 3 ) ( pound 7 1 ) ( i 3 ) ( variabl e ) ( i 3 ) ( variabl e )
( f5 2 )
( f 7 1 )
4 1
9
42
TR-3S l 3A
1 3 1 8
1 9 24
25 30
3 1 36
3742
43 48
49 68
69 72
13 76
1780
LINE
I
3 6
7 1 1 1216 1 7 20 21 25
2631
3236
3839
40 40
41 42
43 46
Zen i t h Angl e ( deg ) ( f6 2 )
Kt ( ra t i o calculated from ( f6 1 ) thermo p i l e inst rument s )
Kn ( rat i o calculated from ( f6 1 ) thermo p i l e instrument s )
D GH ( ra t i o cal culated from thermopile instrument s ) ( f6 1 )
Albedo ( ) ( f6 1 )
Ai r Mas s ( f6 2 )
Res erved for Turbidi ty i f calculated
Precipi table Water Vapor i f calculated from sun photomet er
Precipi table Water Vapor from the ( f4 1 ) Nat ional Weather Servi ce
Prec i p i table Water Vapor Cal culated from Relative Humid i t y ( f4 1 )
Channel H7 Number o f Wave l engths Recorded by Spect roradi ometer 1
Beginning Wavelength ( nm ) Ending Wavel ength (nm) Wavelength Step Size (nm ) Spectroradi ometer 1 Ti l t from the Horizontal ( deg )
Spectroradiometer 1 Azimuth ( deg )
Angle o f Incidence o f the Direct Beam on Spectroradi ometer 1 ( deg )
Measurement Type ( DN GN GH GT DF )
Attachment ( Tef lon Dome D Integrat ing Sphere S View- l imit ing Tube T )
Channel H8 Number o f Wavel engths Recorded by Spectroradi ometer 2
( i2 )
( i4 )
( i S ) ( i S ) ( f4 1 )
( fS l )
( f6 1 )
( fS 1 )
( a2 )
( a l )
( i 2 )
(i4)
TR-3S l3A
4 7 S l Beginning Wavel ength (nm ) ( i S )
S 2 S 6` Ending Wavel ength ( nm ) ( i S )
S 7 60 Wavelength Step S i z e ( nm ) ( f4 bull 1 )
6 1 6S Spec troradi ometer 1 T i l t from the Hori zontal ( deg ) ( fS l )
6 6 7 1 ` Spect roradi ometer 2 Az imuth ( deg ) ( f6 1 )
7 2 76` Angle of Incidence o f the Direct Beam on Spect rorad i ometer 2 ( deg ) ( fS l )
7 8 7 9 Mea surement Type ( DN GN GH GT DF ) ( a2 )
8 0 80 At tachment ( Teflon Dome D Integrat ing Sphere s View-l imi t ing Tube T ) ( al )
LINE 10 Saved f o r extra spectroradi ometers i f needed
I f no spec tral data were recorded the number of l ines in the D s egment i s 1 0 the number of spectra i s 0 and there i s no corre sponding qual i ty-control information for thi s dat e t ime in the QC f i l e s No qual i ty c ontrol wa s performed because the atmo sphere was uns table I f the number o f spectra i s 1 there are 60 l ines in the D s egment i f there are two spectra t he number o f l ines i s 100
I f middot the number of spectra i s 1 or 2 the spectral data fol low after the f i r s t 1 0 l i nes o f the D segment There are 1 0 spectral measurement s per l ine wi th the number in the lef t-mo s t column indicat ing the f i r s t or second specshyt roradiometer ( 1 or 2 ) f o l l owed by the s tart ing wavelength ( in nanometers ) and t he 10 spectral mea surements ( in Wm2-nm) The 1 0 measurement s are at wave l ength inc rements of 2 nm There are 401 spect ral mea surement s from 300 t o 1 1 0 0 nm in 2-nm s teps with 10 measurement s per line for 40 l ine s and one measurement in the 4 1 s t l ine The l a s t number in the 4 1 s t l ine i s the specshytral integral I f a second s pectrorad i ometer wa s used the next 4 1 l ines folshylow t he same format Blank 1 ines follow the spec tral data t o f i l l the D segment to 60 or 100 l ines
An example of a QC f i l e i s shown in Figure 6-3 The f i r s t l ine o f each segment begins with a Q f o l l owed by the s i t e year day number and t ime s tamp with the number of l ines in the segment given in the l a s t col umn s o f the l ine Following the iden t i fier are me s sage s about var iables that were flagged by the automat i c qua l i ty-control proc e s s ing ( s ee appendi x ) noted by an operator at the measurement s i t e or noted dur ing inspec t i on at SERI The l a s t l ine of the segment shows the QC code for as DN ( direct normal thermopile detect o r ) SN ( d i rect normal detector ) AL
var iabl e s such s i l i con
( a lbedo ) and SP ( s pectrum) a s de s c r i bed in the appendi x Three qual i tyshycontrol code s ar8 used 1 = good 2 = suspec t see me s sages and dai ly not e s and 3 = poor or mi s s ing see me s s ages and da i l y no te s The broadband codes ( DN SN GN GH SH and GT ) have two value s the f i r s t is the before- scan measurement and the second is the after-s can mea surement
4 3
TR-35 13A
Q FSEC87 1 2 1 0 7 3 1 4 Noise in GH spectrum in UV QCDN1DN1SN1SN1GN1GN1GH1GH1SH1SH1GT1GT1AL1AP1PR1TC1RH1WV1WS1KT1KN1DG1SPl iN1SP2IN2
Q FSEC8 7 1 2 1 0 8 3 0 8 SN bef SN af t = 1 0 5 5 S H bef SH aft = 1 0 5 3 2nd Int BB b e f = 0 636 2nd Int BB aft = 0 6 5 1 Noise in GH spectrum i n UV QCDN1DN1SN2SN2GN1GN1GH1GH1SH2SH2GT1GT1AL1AP1PR1TC1RH1WV1WS1KT1KN1DG1SP1 IN1SP2IN2
Q FSEC8 7 1 2 1 1 0 3 1 3 QCDN1DN1SN1SN1GN1GN1GH1GH1SH1SH1GT1GT1AL1AP1PR1TC1RH1WV1WS1KT1KN1DG1SP1 IN1SPl iNl iacute
Q FSEC87 1 2 1 1 1 3 1 3 QCDN1DN1SN1 SN1GN1GN1GH1GH1SH1SH1GT1GT1AL 1AP1PR1TC1RH1WV1WS1KT1KH1DG1SP 1 IN1SP1 IN1
Q FSEC8 7 1 2 1 1 2 3 1 3 QCDN1DN 1SN1SN1GN1GN1GH1GH1SH1SH1GT1GT1AL1AP1PR1TC1RH1WV1WS1KT1KN1DG1 SP1 IN1SP 1 IN1
Q FSEC8 7 1 2 1 1 3 3 1 3 QCDN1DN1SNlSNlGNlGN1GH1GH1SH1SH1GTlGTlALlAPlPRlTClRHlWVlWSlKTlKNlDGlSP l iNlSPliNl
Q FSEC8 7 1 2 1 1 4 3 1 3QCDNlDNlSNlSNlGNlGNlGHlGHlSHlSHlGTlGTlALlAPlPRlTClRHlHVlHSlKTlKNlDGlSPl iN1SP1IN1 Q FSECB7 1 2 1 1 554 3 QCDNlDNlSNlSNlGNlGNlGHlGHlSHlSHlGTlGTlALlAPlPRlTClRHlWV1WSlKT1KN1DG1SP 1 IN1SP l iN1
Q FSEC8 7 1 2 1 16 3 0 3 QCDNlDNlSNlSNlGNlGNlGHlGHlSHlSHlGTlGTlALlAPlPRlTC1RH1WV1WSlKTlKNlDG1SP l iNlSPl iNl
Q FSECB 7 1 2 1 1 7 3 1 5 GH bef SH bef = 0 9 3 1 GH aft SH af t = 0 9 3 3 QCDN1DN1SN1SN1GN1GNlGH2GH2SH2SH2GTlGT1ALlAPlPRlTClRHlWVlWSlKTlKNlDGlSPl iNlSPl iNl
Q FSECB 7 1 2 2 0 7 3 1 3 QCDNlDNlSNlSNlGNlGNlGHlGHlSHlSHlGT1GTlALlAPlPRlTClRHlWVlWS 1KT1KNlDGlSP l iNlSPl iNl
Figure 6-3 Example of quali ty-control inf ormation on the data- base tape
Figure 6-4 shows an exampl e of a segment of the daily notes from the FSEC NOTES f i l e Each segment of the f i l e beg ins wi th an followed b y the s i t e year and day number s t amp with the number of l ines in the segment given in the last columns of the l i ne The next l ine contains the s i te operashytor log sheet number month day year day number spectroradi ometer serial number( s ) and mea surement mode( s ) The PGampE and SERI not e s do not include the dai ly l og sheet number The f i rst two l ines are followed by f i eld no te s No tes that were added after inspec t i on at SERI are s eparat d from the operator notes wi th ------- The exi s tence of s l ides or photographs i s ind i cat ed a s wel l a s their qua l i ty i e good ( G ) marginal ( M ) or poor ( P ) In the exampl e in thi s f i gure there were two log sheets for thi s day (number 1 1 6 and 1 1 7 ) because the mea surement mode changed from gl obal hor i z onshytal ( GH ) to global t i l t ( GT )
44
TR-3513A
N FSEC87 1 2 2 1 1 6 0 5 0 2 8 7 1 2 2 1 7 2 DN 1 0 2 GH Clear at 0 7 3 0 GH f o r f ir s t two s cans then GT S l i de s 0 6 3 2 G
0 7 3 3 G 0 8 3 3 G 0 9 3 3 H ( dark ) 1 0 3 3 p1 1 3 3 p1 2 3 3 p 1 3 3 3 p1433 H 1 5 3 3 G 1633 G 1733 G
1 1 7 0 5 0 2 87 1 2 2 1 7 2 DN 1 0 2 GT GT s tart ing at 0 8 0 0 iacuteC lear a t 0 8 0 0 iacuteS l ides S e e above
16 1 1 8 0 5 0 3 8 7 1 2 3 1 7 2 DN 1 0 2 GT Clear at 0830 S l i de s 0633 G
0733 G 0833 G 0933 H ( dark ) 1 0 3 3 p1 1 3 3 p 1233 p 1333 p1433 H 1533 G 1633 G 1733 G
N FSEC87 1 2 3
Figure 6-4 Examples of daily notes on the data-base tape
An example o f a segment of the measurement uncertainty file UNCERT CAL i s shown in Figure 6-5 The f i r s t l ine begins with a U followed by the serial number of the s pect rorad i ometer The upper and lower measurement uncertainty l imi t s are given in the co lumns fol lowing wavelength wi th the appropri a t e measur ement mode dat es and de script ion at the top o f the column The s econd l ine in each segment o f the DAT f i l e s is a pointer to the correct uncershytainty information in UNCERT CAL The broadband s o lar radiat i on and meteshyorolog ical instrument measurement uncertainty fol lows each spectra l measureshyment uncertainty segment in UNCERT CAL
The format o f thi s data ba se was es tabl i shed at SERI t o accommodat e expanded mul t i year long-term data collect ion Users can reformat the data t o suit their part icular needs We recommend the following s t eps for acce s s ing and document ing parti cular data set s
1 Se lect and extract the des ired spectral data from the DAT f i l e s us i ng in formation such as measurement mode day number t ime air mas s or a moshys pheric condi t ions depending on the de s i red attribut es
2 Ex trac t and review the corres ponding segment s of the qua l i ty-cont rol i n format i on from the QC f i l es
3 Ex trac t and review the corres pond ing field no tes from the NOTES f i l e s
4 5
+ I -
5 4
3 7
TR- 3 5 13A
U PRS - 1 0 2 L I -COR PRS - 1 0 2 i
1 2 3 4 5 Ill
Wav GHS GHS GHS GHS GTS GTS GTS GTS Kt gt 6 0 Kt gt 6 0 Kt gt 60 Kt gt 6 0 iacutel ower lower upper upper 2 8 7 - 8 8 7 -8 8 7 5 8 8 GNS GNS
upper upper lower l ower
+ 1 -
- GHS GHS GTS GTS Kt lt 60 Kt lt 6 0 upper uppe r l ower l ower + I - + I -2 8 7 - 8 8 7 -8 87 5 - 8 8
3 0 0 - 1 0 0 0 - 1 00 0 1 0 0 0 1 0 0 0 3 0 2 - 1 0 0 0 - 1 0 0 0 1 0 0 0 1 0 0 0
4 0 0 - 2 3 3 - 1 7 1 1 5 3 9 1 4 0 2 iacute -2 2 0 - 1 7 3 1 4 0 9 3
5 0 0 - 1 3 4 - 1 1 7 3 7 5 0 2 iacute - 1 3 3 - 1 1 7 5 3 3 7
6 0 0 - 1 1 8 - 1 1 1 3 8 3 1 6 0 2 - 1 1 9 - 1 1 1 3 9 3 1
7 0 0 - 1 1 5 - 1 0 7 3 5 2 7 7 0 2 - 1 1 3 - 1 0 7 3 3 2 7
8 0 0 - 1 1 6 - 1 0 6 3 6 2 6 8 0 2 - 11 7 - 1 0 6 3 7 2 6
9 0 0 - 1 1 2 - 1 0 5 3 2 2 5 9 0 2 - 1 1 4 - 1 0 8 3 4 2 8
1 0 0 0 - 1 1 7 - 1 0 8 2 8 1 0 0 2 - 1 1 8 - 1 0 8 3 8 2 8
1 1 0 0 - 1 2 9 - 12 2 4 9 4 2
Figure 6-5 Examples of spe ctral measurement uncertainty on the data-base tape A value of plusmn100 indi cates greater t han 100 measurement uncertainty
46
TR-35 13A
4 Extract the measurement uncertainty information from the 1 1 UNCERT f i l e s and quot e mea surement uncertainty for a l l data used
5 Examine the dai l y broadband and spec tral solar radiatio data graphs in the catalog ( Volume I I of thi s report [ 1 8 ] i f avai labl e These graphs provide informa t i on on atmo spheric condi t i ons during the day For exampl e Figure 4-3 shows dai l y broadband and spec tral plot s for part ly c loudy condi t i ons when s olar rad i a t i on i s changing rapidly throughout the day The sun i s obs cured when the direc t-normal values drop t o zero and the gl obal value s approach each o ther Figure 4-1 shows a clear daybull
No data should be used wi thout consult ing the qua l i ty-control informa t i on dai ly no tes and measurement uncertainty
4 7
Cel l s
Ce l l s
Energy
Meteorologi cal Society
Appl i ed Meteorol ogy
Energy
Radiat ion Topical Overview Solar Cel l s Vo l 1 8
of the Pho tovo l t a i c s and Insolat ion Mea sureshySolar Vol 1 8 1 986 pp 393-3 9 5
TR-35 1 3A
1 0 REFERENCES
1 Hul st rom R L Solar 1 986 PPbull 1 7 9- 1 8 7
2 Hul st rom R L A Summary ments Workshop Panel Resul t s
3 Hul strom R L Re sul t s of the Amorphous S i l i con Mea surement s Ta sk Force Solar Cel l s Vo l 18 1 986 pp 1 7 1-1 7 7
4 Hul strom R L and J M Ohi Resul t s of the SERI Mul t i junction Devi ce Efficiency Measurement Task Forc e pre sented at the 20th I EEE Photovo lshytaic Spec ial i s t s Conference September 1 988
5 Riordan c and R L Hul s t rom Summary of S tud i e s that Examine the Effec t s of Spect ral Solar Radition Vari at ions on PV Device Des ign and Pershyformance SERI-TR-2 15-343 7 Golden CO Solar Energy Research Ins t i tute 1989
6 Riordan c Joint EPRI-SERI Spectral Solar Rad i a t i on Database Pro j ec t
1
8
9
1 0
1 1
1 2
1 3
14
Solar Vol 2 1 1 98 7 pp 3 3 7-342
Riordan c D Myers M Rymes R Hul strom W Mar i on c Jenning s and c Whi taker Spectral Solar Radiat ion Data Bas e at SERI Solar Vol 42 No 1 1 989 PP bull 6 7-79
Riordan C J T L Stoffe l and R L Hul s trom The Effect s of Urban Air Pollut ion on Solar Radiat i on SERI-TR-2 15-3482 Golden CO Solar Energy Res arch I n s t i tute ( draft ) 1989
Riordan c and R Hul s t rom The SERI Re s ource As ses sment Project s Plan for Col l ect ing Spectral-Solar-I rradiance Data SERI -TR-21 5-2948 Gol den CO Solar Energy Re search Ins t i tut e 1986
Shaw G E Sun Pho tometry Bul letin Ameri can Vol 64 No 1 January 1983 pp 4-10
Iqbal M bull An Int roduction to Solar Radiation New York Academic Pre s s
1983
Bartel s R A Comment s on Prec ipi table Water Mea surement s with Sun Photometer s Journal of Cl imate and Vol 25 1 986 PP bull 1 788- 1 789
Leckner B The Spectral Distribution o f Solar Radiat ion at the Earth s Surface -- El ements of a Model Solar Vol 20 1 9 7 8 pp 143- 1 5 0
Cannon T W Spectral So lar Irradiance Instrumentat i on and Measurement Techniques Solar Cel l s Vol 1 8 1986 pp 2 3 3-24 1
48
Energy
Photogrammetric Engineering
TR 3 5 13A
1 5 Myers D R E s t imate s of Uncertainty for Measured Spec tra in the SERI Spectral Solar Radiat i on Data Base ac cepted by Solar 1 98 9
1 6 Myers D R E s t imates of Uncertainty for Measured Spectra in the SERI Spec tral Solar Radiat i on Data aa s e 11 SERI e_clmical Report Golden CO S o l ar Energy Res earch Ins t i tute ( draft ) 1989
middot
1 7 Hul s trom R L The Cl oud Bright Spo t 1 9 73 PP bull 3 7 0-3 7 6
18 Ri ordan c D Myer s and R Hul s t rom Spectral Scflar Raltfiation Data Base Documentat i on and User 1 s Manual Vo lume I I SERI-TR-2 15-3 5 1 3 Golden CO Solar Energy Re search Ins t i tut e 1989
49
TR- 3 5 1 3A
APPENDIX
QUALITY-CONTROL PROCESSING
Limi ted qua l i ty-control proces s ing wa s appl i ed to the data ba se as de s c r i bed below The resul t s are i n the QC f i l es on the data-base t ape by s i t e year and mont h For examp l e
FLA8705 QC i s FSEC 1 98 7 May PGE8 80 l QC i s PGampE 1 9 8 8 January SER8 7 l l QC i s SERI 1 98 7 November
These f i l e s correspond t o the 11 OAT f i les for the s ame s i t e year and month Each data segment that includes a spectrum wa s proces sed through thi s quali ty-control procedure I f the atmospheric cond i t i on s were uns tab l e and a spectrum was not acquired the broadband and meteorologi cal data were inc l uded on the data-base tape but no qua l i ty-contro l proc e s s ing wa s app l i ed
An example o f a segment of a 11 QC f i l e i s shown in F i gure 6-3 The f i r s t Q l ine beg ins wi th a fol l owed by the s i t e year day and t ime s tamp The
last columns give the number of l ines in the s egment so the user can skip to the next s egment Fo l l owing the f i r s t l ine are me s sages that were printed whenever the qua l i ty-control proce s s ing f lagged a suspect or poor value
Following the mes sages in an SO-character QC l ine l i s t ing the variables that were examined are one of three qua l i ty-control code s 1 good 2 marg inal or suspect and 3 mi s s ing or poor The QC l ine was prepared using an automa t i c ( computeri zed ) check of the variabl e s and manual edi t ing to include informashyt ion from correspondence l og sheet s and vi sual inspe ct i on Addi t i onal me sshysages were added above the QC l ine if appropriate
The two-charact er descriptors in the QC l ine are
DN Direct-normal ( thermopi l e ) solar radiat ion before the spectral s can DN Direct-normal ( thermopi l e ) so lar radiation after the spectra l scan SN Direct-normal ( s i l i c on ) before SN Direct-normal ( s i l i c on ) after GN Globa l-normal before GN Globa l-normal after GH Globa l -horizontal ( thermop i l e ) before
WS Wind Speed KT KKN K
t n
GH Global-hori zontal thermopil e ) after SH Global-hori zontal ( s i l i con ) before SH Global-hori zontal ( s i l icon ) after GT Global-t i l t before GT Gl obal- t i l t after AL Al bedo ( Wm ) AP Albedo ( ) PR Surface Pres sure TC Temperature ( deg C ) RH Relat ive Humi dity WV Water Vapor ( al culated from rel a t i ve humidity)
5 0
S- flllit = - ( middotmiddot middot
( e g Wm2 )
TR-3 5 1 3A
DG D GH SP F i r s t Sp qtrum I T Integral of t he F i r s t Spec t rum SP Second Spectrum IT I nt egral of the - Second SpecttUI11
The aut oma t i c tes t s that were performed to det ermine the QC code fol l owing each var iable were
( a ) Check for mi s s ing or negat ive values for the broadband solar radiashyt i on meteoro l og i cal or a tmo spheric dat a or the spec t ral integral s
lt 0 = Code 2 Mi s s ing ( - 9 or -9 9 ) = Code 3
( b ) Check for atmo spheric or broadband instrument instab i l i ty us ing the difference and rat i o o f the before- and aft er-scan values and redundant mea surement s if nei t her values are negat i ve or mi s s ing
DN before DN after if the abs lute d i fference SN before SN after i s gt10 Wm DN beforeSN before 5 of 200 DN before SN after and GH before GH after SH beforeSH after the rat io i s lt0 95 or gt1 05 each of the GH before SH before two var iables = GH afterSH after or middot GN beforeGN after the rat i o i s lt0 90 or gt1 10 each of the GT beforeGT after two var iable s = Code 3
Code 2
( c ) Check for DN gt GN or GN gt ETR ( extraterre s trial solar radiat i on ) us 1ng rat ios of the var iabl e s
DN before GN before gt0 95 each variable = Code 2 DN afterGN after gt 1 0 each var i able = Code 3 GN before ETR GN afterETR
( d ) Check for values o f Kt Kn and DGH tha t are too high
KT ( invo lves GH before and after and KT ) KN ( involves DN before and after and KN ) DG ( invo lves DN and GH before and after and DG )
gt0 9 5 each variable = Code 2 gt 1 0 each var iable = Code 3
( e ) Check the s pe c t ral integral s for unusual rat i o s to the corresponding broadband so lar radiat ion value
IT ( Broadband va lue before and after )
For d i rect s pe c t ra lt 0 6 or gt0 8 5 I T = Code 2 For gl obal s pe c t ra lt0 7 o r gt0 95 I T = Code 2
For d i rect and g l obal s pec t ra lt0 5 or gt l O IT = Code 3
5 1
TR-35 13A
We sugge s t that users of the data ba s e develop a computer program to acc e s s fields i n the Q C l ine and t o print the me s sages Thi s l imi ted qua l i ty cont rol wi l l not f lag a l l po s s ible errors and addi t i onal t e s t s should be applied depend ing on the users requi rement s and appl icat i on s
52
1 1 2
Document Control SEAl Report No
Page 4 Title and Subtitle
NTIS Accession No 3 Recipients Accession No SERI TR- 2 1 5-35 13A DE89009447
5 Publication Date
January 1990 Sp ectral Solar Radiation Data Base Documentation
6Vo lume I
7 Author(s) 8 Performing Organization Rept No
9 Performing Organization Name and Address 10 ProjectTaskWork Unit No
1 1 Contract (C) or Grant (G) No
(C)
(G)
1 2 Sponsoring Organization Name and Address 13 Type of Report amp Period Covered
Solar Energy Res ear ch Ins titute Technical Repor t 1 6 1 7 Col e Boulevard Golden Colorado 804 0 1-3393 1 4
1 5 Supplementary Notes
16 Abstract (Limit 200 words) The Solar Energy Research Ins titute ( SERI) Electric Power Research Ins titute Flor ida Solar Energy Center and Pacific Gas and Electric Company cooperated to produce a spec tral solar radiation data base representing a range of atmospheric conditions These data will help to characterize the natural variab ility in the spectral (color) content o f outdoor solar radiation so that the sensitivity of spec trally selective solar devices ( such as photovoltaics ) to these variations c n b e s tudied quant itatively Volume I o f this report documents the history approach content and format of the data base Volume II contains graphs and field no tes for each of the spectral data sets The data res ide on magnetic tape at SERI
1 7 Document Analysis
a Descriptors Spec tral solar radiation broadband solar radiation met eorological
data sp ectroradiometers
b IdentifiersOpen-Ended Terms
c UC Categories
233 234
18 Availabil ity Statement
National Technical Information U S Depar tment of Commerce 5 285 Port Royal Road Springfield Virginia 2 2 1 6 1
Service 19 No of Pages
60
20 Price
A04
Form No 0069 (6-30-87)
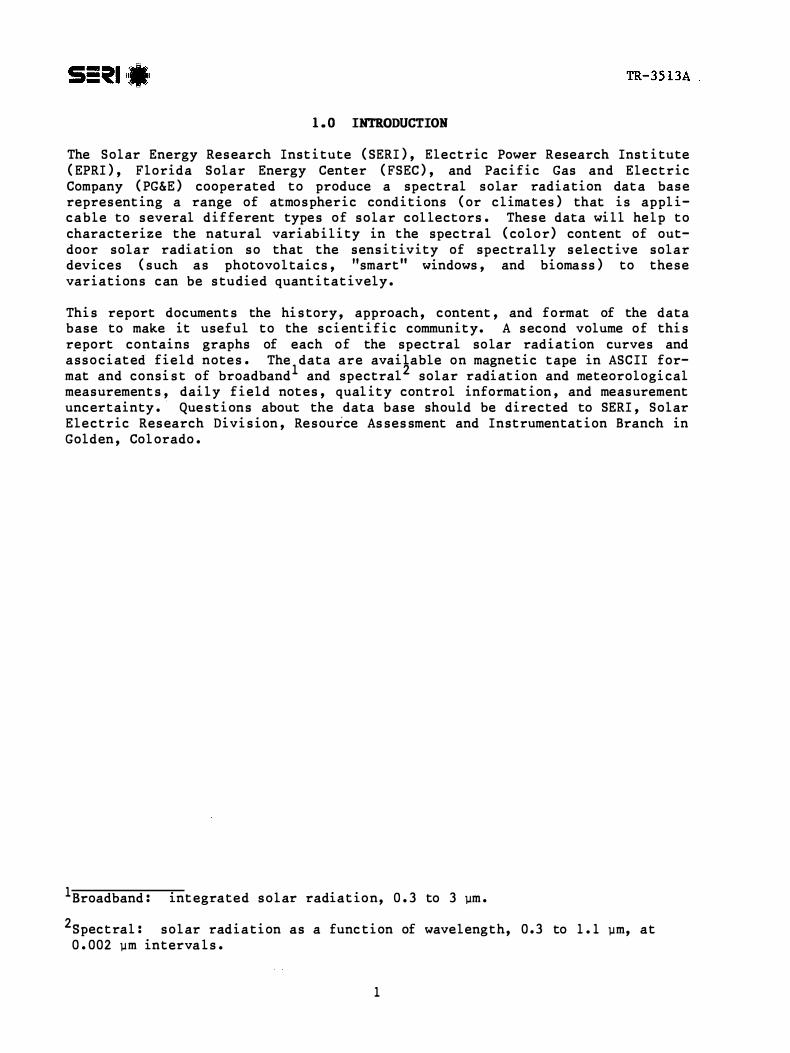
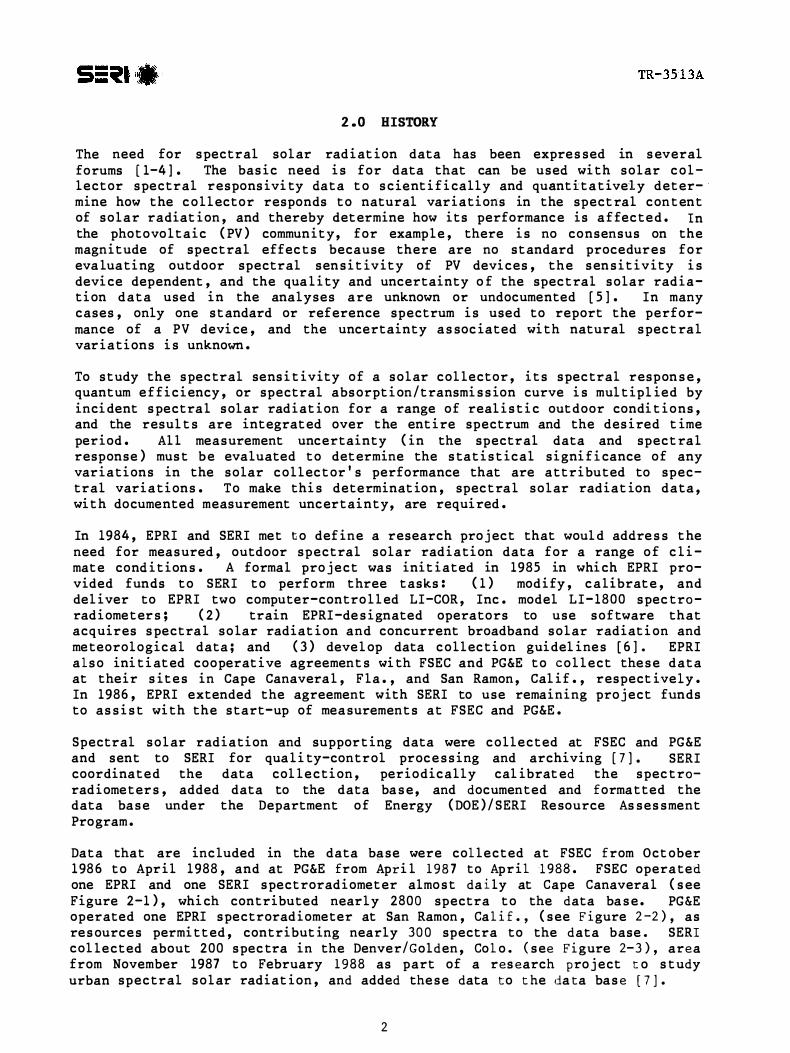
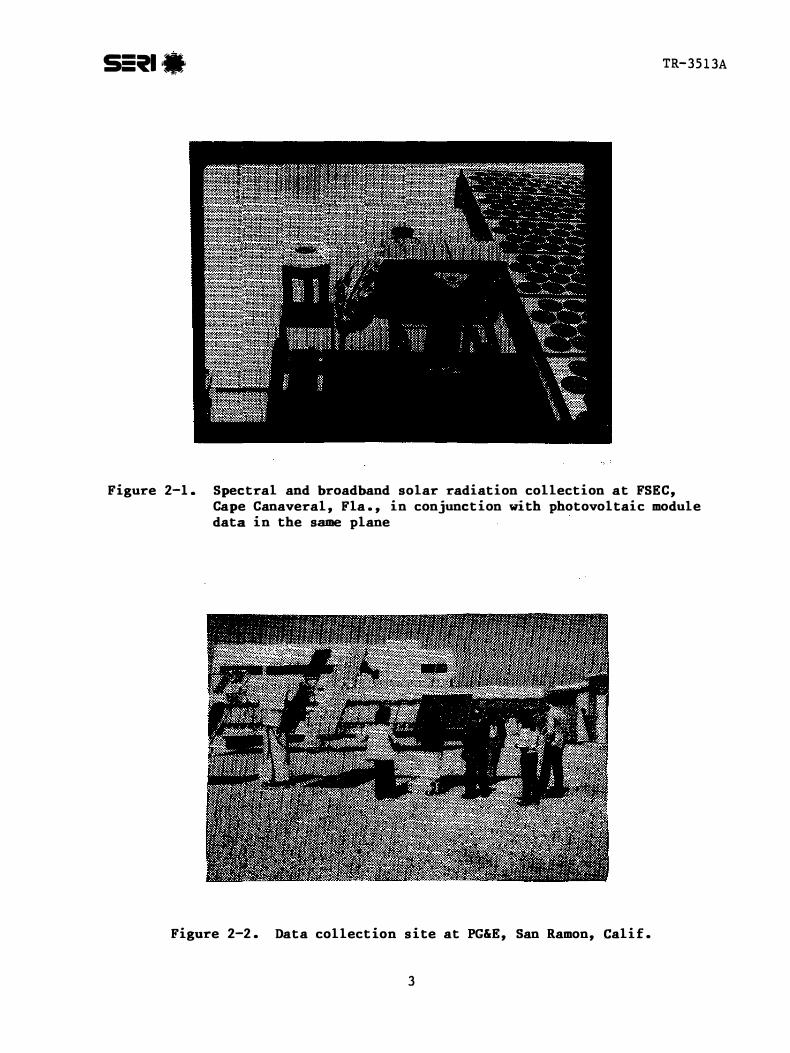
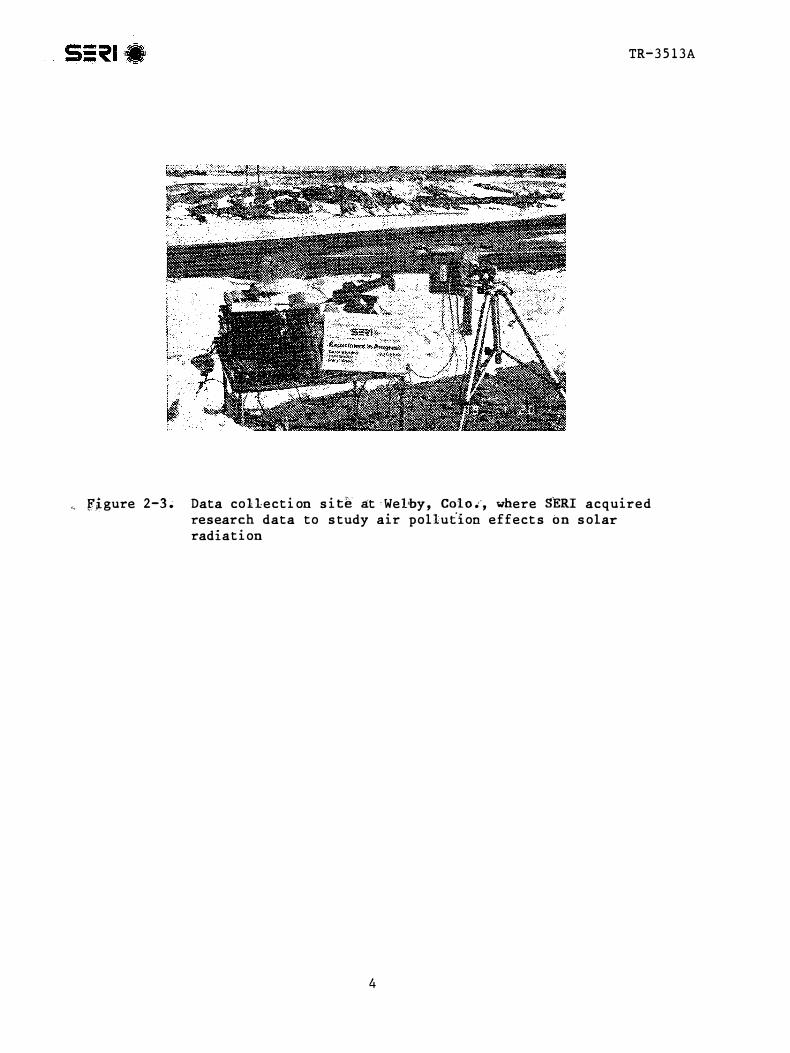
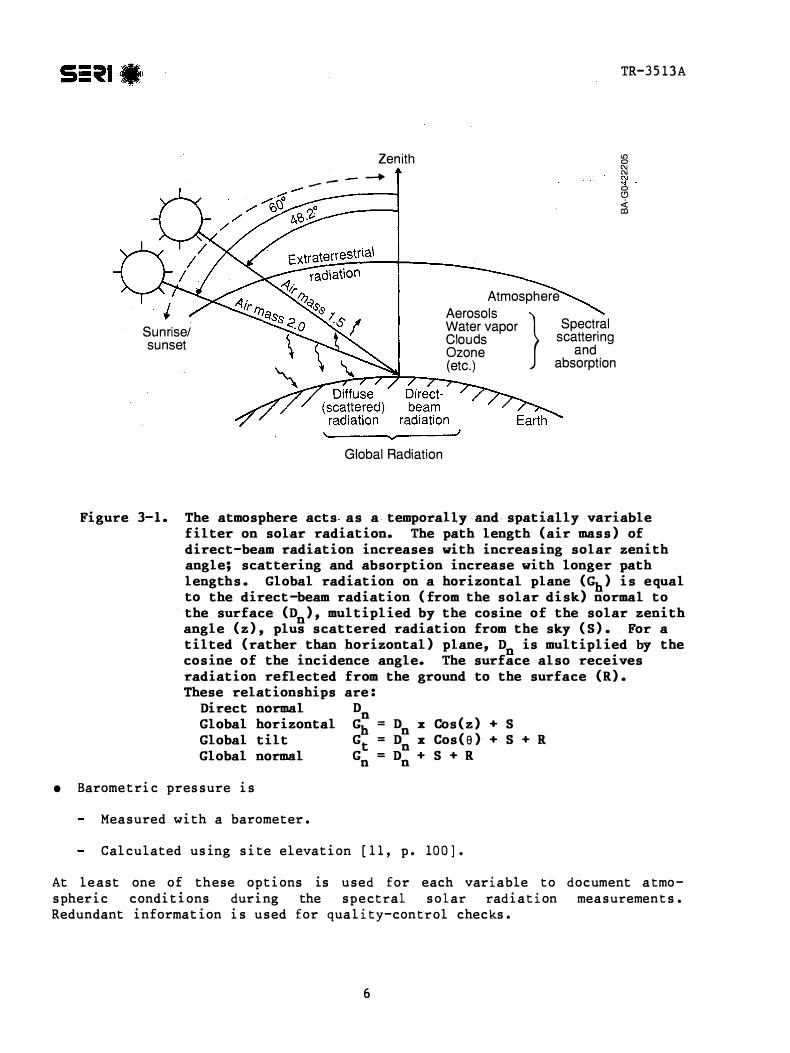
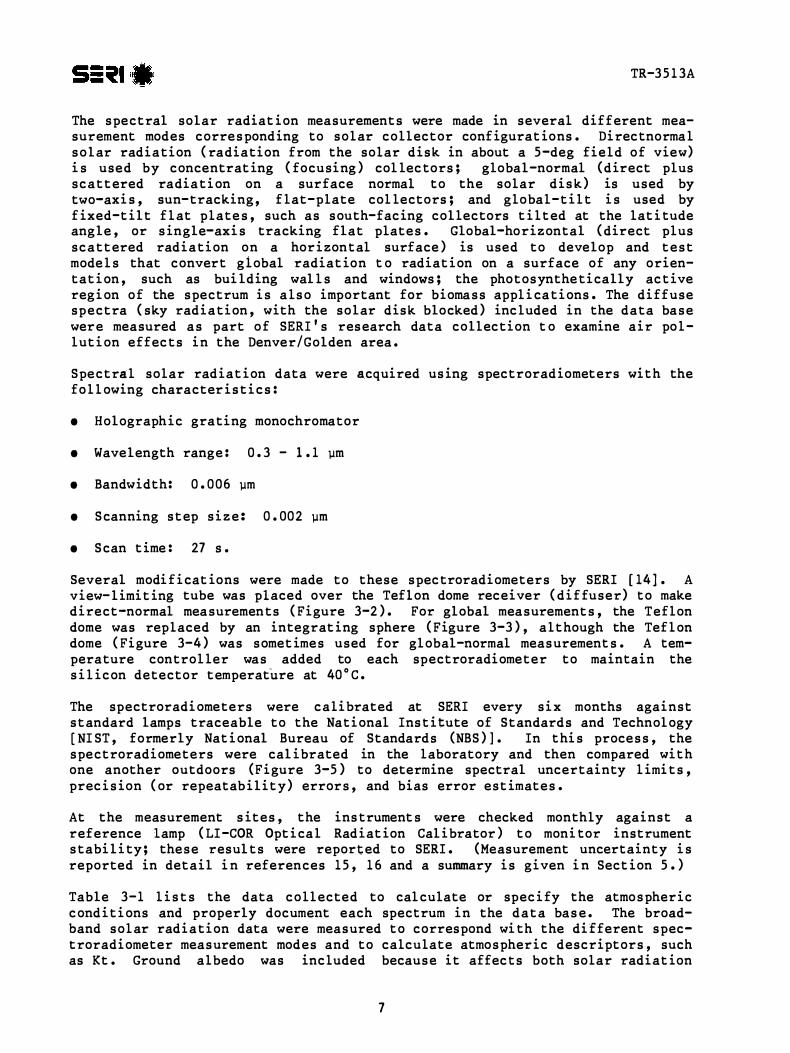
TR-3 5 1 3A
The spectral solar radiat ion measurement s were made in several different meashysurement modes corre s pond ing to solar collector conf igurations Di rectnorma l s o l ar radiation ( radiation from the solar d i sk in about a 5 -deg field of view) i s used by concentrat ing ( focusing ) col lectors global-normal ( d irect plus scatt ered radia t i on on a surface normal to the solar d i s k ) is used by two-axi s sun-tracking f lat-plate col lectors and global-t i l t i s used by f ixed-t i l t f l at plate s such as south-fac ing col lectors t i lted at the lat itude angle or s ingle-axi s tracking flat plate s Global-horizontal ( direct plus scatt ered radiation on a hor i zontal surface ) is used to develop and t e s t mode l s that convert global radiat ion t o radiat ion on a surface of any orienshytat i on such as bui lding wal l s and windows the photosynthe t i cally active reg i on of the spectrum i s a l s o important for bioma s s appl i ca t i ons The di ffuse spectra ( sky radiation with the solar disk blocked ) inc luded in the data ba s e were measured a s part o f SERIs res earch data collection t o examine air po l shylut i on effec t s i n the DenverGolden area
Spectral solar rad iat ion data were acquired us ing spectrorad iometers with the fo l l owing character i s t i c s
bull Holographic grating monochromator
bull Wavelength range 0 3 - 1 1 m
bull Bandwidth 0 006 m
bull S canning s t ep s i z e 0 002 m
bull S can t ime 27 s
Several modi f i cat ions were made to these spec troradiometers by SERI [14] A view- l imi t ing tube was placed over the Teflon dome receiver ( d i f fuser) to make direct-normal mea surements ( Figure 3-2 ) For global mea surement s the Teflon dome was replaced by an integrat ing sphere ( Figure 3-3 ) although the Tef l on dome ( Figure 3-4 ) was somet ime s used for gl obal-normal measurements A temshyperature control ler wa s added to each spectroradiometer to maintain the s i l icon detector temperature at 40degC
The spectroradi ometers were cali brated at SERI every s i x months against standard lamps traceable to the Nati onal Institute of Standard s and Technol ogy [ NI ST formerly Nati onal Bureau of Standard s (NBS ) ] In thi s proce s s the spectroradiometers were cal i brated in the laboratory and then compared with one another outdoors (Figure 3-5 ) to determine spectral uncertainty l imi t s prec i s ion ( or repeatab i l i t y ) error s and bias error est imate s
At the measurement s ites the instrument s were checked monthly against a reference lamp ( LI -COR Opt i ca l Rad iat ion Cal i brator ) t o monitor instrument s tabi l i ty these resul t s were reported to SERI (Measurement uncertainty i s reported in detail i n references 1 5 1 6 and a summary i s given i n Section 5 )
Table 3-1 l i s t s the data coll ected to cal culate or spec i fy the atmo s pheric c ond i t i ons and properly document each spectrum in the data ba s e The broadshyband sol ar radiation data were measured to correspond wi th the different specshyt roradiometer measurement modes and to calculate atmospheric descriptors such as Kt Ground albedo was inc luded becaus e it affects both solar radiation
7
SE Imiddot-middot TR-35 1 3A
Figure 3-2 Spectroradiometers equipped with view-limiting tubes to acquire 1direct-normal solar radiation Aluminum foil was placed over
the instruments to reflect radiation and keep the instruments from overheating
Figure 3-3 Spectroradiometers equipped with integrating spheres to measure global solar radiation
8
Fi gure 3-4 Spectroradi ometers equi pped wi th the Tefl on dome recei vers
Fi gure 3-5 Outdoor i ntercompari son of four spectroradi ometers
9
I
Table 3-1 Measurements and Documentation f or
bull Sit e identifiera
Four-l et ter code Longitude ( decimal) Latitude ( decimal)
bull Site
Dat e a elevation ( m)
Day number Year
bull Local standard timea
Hour Minutes
bull Col lection mode for spectral irradiance scan( s) t-0
Two-le tter code Gl obal horizontal - GH Gl obal normal - GN Gl obal til t - GT use
horizontal ( e g 30 Direct normal - DN
til t angle from deg) and azimuth
bull Direc t-no rmal irradiance va lue (Wm2)bull Global-normal irradiance value (Wm2)bull Global-horizontal irradiance value (Wm2)
IllN-Each File in the Spectral Solar Radiation Data Base -
bull Global-tilt pyranomet er value Til t angle o f pyranometer from horizontal
and azimuth Irradiance val ue ( Wm2)
bull I rradianc e-st abil ity check ( silicon pyrheliomet er)b
bull Irradiance-stability check (silicon pyranomet er )b
bull Spectroradiometer scan( s) ( 2-nm step size) ( Wm2-nm)
bull Repeat of broadband irradianc e measurement s b
bull Ambient t emperature (degC) bull Surface pressure (mb) bull Rel ative humidity ( ) bull Average wind speed (mph) bull Ground albedo (measured or estimated)c ( )bull Mul tiwavelength sunphot omet er measurements
( four-channel maximum)d
bull Opaque cl oud cover ( t en ths) bull National Weather Service water vapor
val ue ( em) bull Comment field (15 charact ers)
aLocation dat e and time are used t o calcul ate air mass
bThe silicon inc luded to
pyrhe liomet er1 silicon pyranometer and repeated broadband so lar radiation values allow eval uation of irradiance stability during the spectral irradiance scan
are
cValue s should be repres enta tive of the dominant land-cover type or mixture in the vicinity of t he s pect roradiomet er
dspectral m a surements at several wave leng ths are made using sunphot omet ers with narrow-band filters cal culate atmos pheric turbidity and water vapor
to
VJV1VJtgt
TR-35 1 3A
measured on til ted surfaces and ground-to-sky reflec tions ( especial ly under cl oud cover) Wind speed and ambient temperature were recorded because they may be useful along with the spectral data to predict collector perforshymance The broadband and met eorological sensors were maintained and calishybrat ed by the measurement sites as documented in Sec tion 5
Broadband solar radiation measurements were made immediately ( within 15 s) before and after the spec t ral solar radiation scan to allow evaluation of atmospheric stability at the time of the scan In addition the datashyacquisition software was designed so that global-horizontal solar radiation was sampl ed six times during the spectral scan using a silicon-detector pyrashynome t er if global solar radiation varied by more than 2 the spec tral scan was not recorded Three attempts were made to acquire a spectral scan during unstable c onditions ( such as partly cl oudy skies) I f a scan was not obtained after three t ries the broadband and meteorological data were recorded and then the data acquisition system waited until the next regularly scheduled data acquisition time ( usually an hour) to attempt another spectral scan Because o f the stability monitoring during the spectral scans wemiddot believe there are very few cases when the spectral scan was acquired during variable solar radiation conditions We found three examples of distorted spectra ( see Figure 3-6) that possibly were caused by unstabl e conditions
Software to test the atmospheric stability and acquire the data in a specific format was integrated into the field operations by FSEC and PGampE The format included fields for sit e identification date and time broadband solar radiashytion values atmospheric data spectral solar radiation data and comments In addition an instrument deampcription and configura tion file was stored for each data fil e
The data acquisition software was designed to accept manual ly entered data from sunphot ometers cl oud-cover estimates and Nat i onal Weather Service preshycipitable water vapor measurements However the personnel instruments and measurements were generally not available to enter these data each hour at the measurement sites
The schedule for dat a coll ection was fl exible to accommodate individual site requirements and constraints The goals which were accomplished were to collect data over at l east one year at each sit e t o capture seasonal variashytions and to cover a wide range of atmospheric conditions for each measurement configuration
Measured spec tra and supporting data were sent to SERI on fl oppy disks from PGampE and on magnetic tape from FSEC Daily log sheets that describe the specshytroradiomet er operation and operator comments were included with the data Al l-sky photographs c orresponding to many of the FSEC spectral data sets were provided by the FSEC Fenest ration Energy and Illumination Performance Research Program ( Figure 3-7) Al l-sky photographs were also taken for each of the SERI spec tral data sets ( Figure 3-8) A camera system was installed at PGampE late in the data col l ec tion period but no photographs are available
At SERI the data were processed through an interactive quality-control proshycedure during which the data were visually inspected for obvious probl ems First the inst rument configuration file ( see exampl e in Figure 3-9) was examined against a t emplate from the previous data set to check for any inst rument changes or a change in the mode of opera tion After the operator
l l
middot 400
01+--+----+--+--
U1Ill-25 0Day No 205 1987 (a) 1= 25 Day No 319 1987 (b)Oslash a -E c Nc
N 0 IDistorted direct-normal E CJ bull= m
E 15 Distorted direct-normal spectrum 15 spectrum at 10316 cl
Q)Q) 00 c co c 056 g 105
shy t -
300 500 700 900 1100 300 500 700 900 1100 Wavelength (nm)Oslash Wavelength (nm)
Day No 319 1987 Day No 319 1987 25 1200 (c) (d)Distorted global normal spectrum E ltilc at 10316 E_
N E 800 15 Q) 0 Q) c Direct0 Global tilt c normalco Global6 056 co
horizontal
300 500 700 900 1100 6 8 12 14 16 Wavelength (nm) Time
Figure 3-6 Examples of the very few distorted spectra in the data base (a b c) Broadband solar radiation data (d) corresponding with the spectra in b and c show that irradiance was decreasing at 1031 due to partly cloudy conditions JOIwU11-w
xgt
S5 llifl TR-3 5 1 3A
Figure 3-7 Example Qpound all-sky photographs acquired at FSEC These photog aphs proviGed evidence f rain possible condensation oa optics and ducls
Figure 3-8 Example of all-sky photograph acquired at SERI with a disk blocking sun to show diffuse sky conditions
13
---middot---------middot---------middot---------middot---------middot---------middot---middot --middot---------middot--------middot
TR-3 5 1 3A
t(OK P 11 buy this) Press [Helpl for help
CHN PARAHETER +-------INSTRUHENT----------+ +--CALIBRATION-+ OUTPUT rom NO TYPE HAICER TYPE SERIAL FACTOR- DATE --UNITS NOTES
1 Dir NorR Eppley NIP 17828E6 680 11-187 WRA2 2 Clo NorR EPPLEY PSPH 17863F3 811 11-187 WRA2 3 Glo Horz Eppley PSP 17863f3 811 11-187WfRA2 ltl Glo Tilt EPPLEY PSPT 17863F3 811 1-187 RA2 5 Dir N Si Unused Unused Unused -9900 -1-1-1 WRA2 6 ARb TeRp TAYLOR HGGLASS 00718C LOO 11-187 Deg C 7 Surf Pres OBSERVER ELEVATION RIORDAN -9900 -1-1-1 Hillibar atilde8 Rei HuR DC DIGITAL XXXXXC 100 -1-1 1 Percent 3 9 Wind Spd OBSERVER OBSERVD STOFFEL -9900 -1-1-1 KetersS 3
10 I Albedo Unused Unused Unused -9900 -1-1-1 Percent 11 Phot 380 S TEIC SUNPHOT SPH7624 66300 10-184 Countamp 3 12 Phot 500 SOHOTEIC SUNPHOT SPH7524 77500 10-184 Counts 3 13 Phot 860 SOHOTEIC SUHPHOT SPH7524 45700 10-184 Counts 3 14 Phot 942 SONOTEIC SUNPHOT Unused -9900 -1 1-1 Codnts 1 15 Opq Cloud OBSERVER OBSERVER STOFFEL 100 -1-1-1 Tenths 16 H20 NWS NWS SONDE STAPLETON 100 -1-1-1 CR 17 Spect 11 LICOR LI1800 PRS158 100 9-187 Wsq RlnR 2 18 Spect 12 Unused Unused Unused -9900 -1-1-1 Wsq RnR 19 Glo H Si LICOR SIPYRAN PY1245 811 11-187 WRA2
Figure 3-9 Example of the instrument configuration data -eeorded with the measured data J-middot middot
approved the configura t i on tabl e the template was updated and the informat ion was wri t ten to the data base
Figure 3-10 shows an-exampl e of the comput er terminal output dur ing the cond step o f the qua l i ty-control session
The informa t i on displayed ( see c i rcled nu bers in Figure 3-10) inc luded the foll owing
1` Si te dat e day number standard t ime lati tude l ongi tude and number o f attempts to acquite the spectrum as cont ro l l ed by the atmospher i c stab i l ity monitor
2 Plot o f the spectrum with the mode of operat ion printed bel ow the plot
3` Indicat ion o f stabi l i t y based on the before-scan and after-scan me iureshyment of gl obal-horizontal solar rad iat ion from the iil i con pyranome t er ( although the measurements by thi iiJtrument ciuring the _scaq are actual l y used to test f o r atmospheric stability)
4 Graphic descr i p t i on o f the az imuth and zenith angles of the sun
14
y I
r
ijn 2PR
1100300
II I -
38 50
94
-99
l
IlIllN
lt ltX) Softwa re by M Rymes 0
2 t N AFT BEF a DN 864 863
0 1K SN 852 852 reg A GH 1007 1005 8 SH 984 981 I GN 1089 1088
IL GT 924 920
DN SN GH SH GN GT T Azimuth Zenith reg T 27 c
679 9132 1019 mb V1 RH 73
0 reg ws 4 ms AL 136 Wm2
-99 Co -99 Co
86 -99 Co -99 Co
cc -99 wv
110 mm
300 Di r Norm Glo Norm 1100 FSEC 051387 (Day 133) 1030 2840N 8060W 1 tries G)
terminal output during a quality-control session o--3Figure 3-10 Example of the computer lt1 wV1 wgt
I
TR-3 5 1 3A
5 Bar graph of the before-scan broadband measurements of direct-normal ( thershymopile detec t o r ) DN direct-normal ( silicon detec t or ) SN global-horizontal ( thermopile ) GH gl obal-horizontal ( silicon ) SH gl obal-normal ( thermopi l e ) GN and global-til t ( thermopile ) GT solar radiation The darkened bar graphs show the integral of themiddot spectral middotso lar middotradiation llm))(0 3-11 which is printed under the bar graph Before-scan and after-scan broadband values are printed to the right of the bar graph
6 Listing of the supporting data The first five values are t emperature T pressure PR relative humidity RH wind speed WS and ground-reflected solar radiation AL used for albedo calculations The remaining fie l ds were not used for this data base and were included for future data col lecshytion projects
This quality-control process was performed short ly after the data arrived a t SERI to flag obvious field probl ems The operator could add comments to the data fil e after viewing the information in Figure 3-10 The software also calculated atmospheric descriptors such as Kt and then the data and descripshytors were writ t en to the data base Quantitative qua lity control was applied iu the post-processing of the data base ( described in detail in the appendix )
We chose to include all data in the data base and to be as specific as posshysible about the measurement uncertainty rather than set stringent criteria for excluding data sets This allows users to select data based on their specific application and accuracy requirements or to use portions of the damiddotta sets such as broadband datamiddot or spectral solar radiation segm(nts None of middot
the data should be used without referencing the measurement uncertainty
16
40 CONTENTS OF THE DATA BASE
A t otal of 3 364 spectral data sets ( 16 Mb) are included in the data base
bull 1 4 1 5 Direc t normal
bull 899 Global normal
bull 542 Gl obal horizontal
bull 455 Global tilt
bull 5 3 Dif fuse
I f the data acquisition systems were operating but the atmospheric conditions were too unstable to record a spectrum the broadband and meteorol ogical data were inc luded in the data base but no quality-control processing was applied
FSEC normally operated two spectroradiometers simultaneously one in the direct-normal mode and the other in one of the global modes PGampE operated one spectroradiometer and rotated through the different measurement modes SERI collected direct-normal global-horizontal and dif fuse-horizontal specshytra mostly during cl oudless-sky conditions
Examples of the spec tra are shown in Figures 4-1 through 4-5 Figshyure 4-1 ( a b) shows examples of spectra measured at FSEC in the direct-normal and global modes on a clear day As air mass increases the direct-normal spectra ( a) shift toward longer wavelengths ( the red end o f the spect rum) The global spectra ( b) are slight ly l ess affec ted by the red shift because the radiation scattered out of the direct beam is added back int o the gl obal spectra as diffuse radiation thus returning a portion of the short-wavel engt h ( blue) radiation Figure 4- l ( c) shows the broadband solar radiation corresponding to the spectra
Figure 4-2 shows exampl es of spectra measured under cloudy skies The directshynormal spectra ( a) are almost zero and the global-til t spectra (b ) have low values The graph o f corresponding broadband solar radiation ( c ) shows nearly zero direct normal the global values approach each other becausemiddot all of the irradiance is diffuse under cl oudy skies
Figure 4-3 shows examples of spectra measured on a partly cl oudy day The graph also shows an exampl e of data dropout during data transfer The shape of the spec t ral curve is quite diff erent for low-intensity spec tra measured under cl oud c over ( 10 3 1 air mass 1 88 13 3 1 air mass 1 7 3 ) versus the lowshyintensity spec t rum at higher air mass values ( 1 6 3 1 air mass 5 48 )
Figure 4-4 shows two exampl es of spectra that appear to correspond with sun reflections o f f of clouds which causes a bright spo t [ 1 7 ] and a focusing effect on the solar radiometers The broadband solar radiation values can actually approach or exceed the extraterrestrial value of about 1 3 3 8 on day number 1 3 2 1 3 3 The global solar radiation values approach each o ther while the direct-normal radiation drops indicating that the solar disk is partially blocked by c l ouds
1 7
25 Ec
C1E 1 5
Q)()cctS0 05ctS
Day No 53 1 988 1ico(a) Direct Normal Spectra 0931 to 1 631 ()lt(OJ
00 500 700 900 Wavelength (nm)
EcE
Q)()cctS
0ctS
25
1 5
05
Day No 53 1 988 Global Normal Spectra
931 to 1 631 (b)
300 500 700 900 1 1 00 Wavelength (nm)
1 200 Day No 53 1 988 (c)
cJE
800 Q)()cctS 4000ctS
Global tilt
Global horizontal
0 6 8 1 0 1 2 1 4 1 6 1 8
Time
Figure 4-1 Examples of a) direct-normal and b) global-normal spectra and c) broadband solar radiatio n measured at FSEC o n a clear day
18
0+-+--+-f=t-=F==F==t=P=T==t--+-===+----f
TR-35 13A
- 20 E
Clc E
1 0 Q)()sect 0
300 500
- 20 E
C1c E
1 0 Q)()c laquoS 0laquoS = 00
300 500
1 200
ClE
800 Q)()c -C 400 laquoS
0 6 8
Day No 273 1 987 Direct Normal Spectra
831 to 1 231 (a)
700 Wavelength (nm)
900 1 1 00
Day No 273 1 987 Global Tilt Spectra
831 to 1 231 (b)
700 Wavelength (nm)
900 1 1 00
Day No 273 (c)
middot Global no rmal Global tilt Global horizontal
1 0 1 2 Time
1 4 1 6 1 8
Fi gure 4-2 Examples of (a) direct-normal and (b) global-ti lt spectra and (c) broadband solar radi ation measured at FSEC on a cloudy day
19
I
EcCl
25
E 1 5
Q)()cctl 05
Day No 353 1 986 Global Normal Spectra
Wavelength (nm)
Day No 353 1 986
Fi gure 4-3 radi ati on (lower) measured at FSEC on a partly cloudy day The
-ClE Q)()cctl
1 200
800
400
0
Time
lilobal normal
8 1 0 1 2 1 4
Global horizontal
16 1 8
TR-3 5 1 3A
Examples of global-normal spectra (upper) and broadband solar
spectrum at 1631 shows data dropout duri ng data transfer
Figure 4-5 shows examples o f d i rect-normal gl obal-hor izontal and d i f fuseshyhorizontal spec t ra measured by SERI The di ffuse radi a t i on is most ly concenshytrated in the short-wavelength ( visible) region of the spect rum ( blue sky) The global-ho r i zontal spectrum is equal t o the direct-normal spec t rum mul t i shypl ied by the c osine o f the zenith angle plus the diffuse spec tral radiat i on
The cumula t i ve number o f these spec t ra versus air mass the atmospher i c descriptors Kt Kn DGH and rel at ive humi dity are shown 1n Figshyures 4-6 ( a-f ) The large number of spec t ra at low air mass values is caused by t he opera t i on of the spect roradiometers dur ing normal working hours at midshylat itudes and by the larger air mass values oc curring near sunr ise and sunset whi ch occupy a relat ively smal l frac t i on of the day The large number o f spec tra duri ng relat ively c l ear sky conditi ons i s due t o sdec t i on of clear days for the data taken at SERI the requirement for atmospheric stability during spectral scans and perhaps cl imate types at the three sites Figshyure 4-6 ( c ) shows tha t relat ive humi dity measurements were missing for about 25 global-normal spectra The dif fuse spec tra assoc iated wi th DGH rat i os near 1 0 indi cate very clear condi t i ons where dif fuse measurements are probably within the measurement uncertaint y
20
1200I -
u a
Wmmiddot2)1 I
v+--+--
˜
middot (a) (b) Global normal
(c) Global horizontal (1403
15
InIllDay No 132 19 7 Day No132 1987
Global Normal Spectra 900 to 1 63 0-- 25
clra -Ec bat horizontal Global tilt cJ
N E 800 15 - Q cbull
g 400ctl red - 0 5 ctl I
0 300 500 700 900 11 00 6 8 1 0 12 14 16 18
Wavelength (nm) Time
Day No133 1987 Day No 133 198V
Global normal Global Normal Spectra N 730to 1430 2 5middot Glob tilt
(d) Ec
E 1000
- 500 gctl ctlmiddot- 0 5 -g 1
300 500 700 900 11 00 6 8 1p 12 14 16 18
Wavelength (nm) Time
igure 4-4 Examples pound solar spectra enhanced by cloud bright spots (a) at 1031 on day 132 and (c) at 1230 on day 133 and correspondin [(b) and (d) re pectively] broadband solar radiation J
w111wgt
I
OlDay No 328 1987 0
(a) r1052to 1231 ltt-- 2 5 0
E CDc )E Direct Normal
1 5 Q)C)cro5 05ro
300 500 700 Wavelength (nmr
900 1100
- 25 Ec
E 15
Q)C)cro5 05ro=
Day No 334 1987 1222to 1508
Direct Normal
(b)
300 500 700 900 1100 Wavelength (nm)
Figure 4-5 Examples of direct-normal global-horizontal and diffuseshyhorizontal spectra measured by SERI on two days
Inc luded on the data tape are daily f i eld notes qua l i t y control informa t i on and measuremen t uncertainty Thi s informat i on alert s the user t o problems such as data dropout s ( a s seen in Figure 4-3) and noise in the spectrum (Figshyure 4-7 ) Thi s informa t i on should always be revi ewed when any s pectraL data s e t s are u sed
Phot ographs or s l i de s corre sponding to many of the spectral data s e t s are avai lable at ERI The daily f i eld no t e s that are inc luded wi th the dat a base document the exi s t ence and qual ity of the pho t o s slides
2 2
--------I-
J v l----
r
---
_rV I--
I v
f-
v
I II
I I
___ v -
---- --
I )
-I
v --- --------v f-----
40
TR-3 5 1 3A
LO Direct Normal Spectra vs Air Mass Global Normal Spectra vs Air Mass i40
30ct1E -
lt( 20
1 0 0 400 800 1 200 1 600
40 - -middot 30coE lt( 20
1 0 0 200 400 600 800
ltlil
Number of spectra Number of spectra
Global Horizontal Spectra vs Air Mass Global Tilt Spectra vs Air Mass
40
UJUJco_E -
30 bull
lt( 20
30 coE -
lt( 20
1 0 1 o
Diffuse Spectra vs Air Mass
0 1 00 200 300 400 5000 200 400 600 Number of spectra Number of spectra
40
coE lt(
30
20 bull
1 0 0 1 0 20 30 40
Number of spectra 50
23
I )
v 1-
I--v
( I
)
v --1------I--__
1 I
--l---
If 1
v 1---1-
-_ I---
l u
-----
v I I
----f--e--r-----
I If-
1--- middot
---
100
60
20
Direct Nermal Spectra vs Kn
0 400 800 1200 1600
100
60
0
Direct Normal Spectra vs Kt
400 800 1 200 1600
TR-35 13A
Number of spectra Number of spectra
Figure 4-6 (b) The cumulative number of spectra (horizontal axis) measured over a range of air mass and atmospheric descriptors (vertical axis)
100
60I
20
Direct Norma Spectra vs DirGH
400 soe 1200 160CJ Number of spectra
Direct Normal Spectra vs Rei Hum
6 100
- 60sQ)gt
g 20Q5a 0 400 800 1200 1 600
Number of spectra
c
100
60
20
0
Global Normal Spectra-vs Kn
300 600 900 Number of spectra
Globa Normal Spectm vs DirGHtOO
I 60
20
0 300 600 900 Number of spectra
Global Normal Spectra vs Kt 100
602
20-
0 300 600 900 Number of spectra
Global Normal Spectra vs Rei Hum 100
6E) 60s Q)gt
Q5 20a
a 300 600 900 Number of spectra
Figure 4-6 (c) The cumulative number of spectra (horizontal axis) measured over a range ofmiddot air mass and atmospheric descriptors (vertical axis)
24
f--f--
-I
lJ
1--f-- v
I 1
f--f-
v
1------
1--
( j
---
--
( I
J
1--- -
v
) -----
(
l) __---
v I
1 00
c 60
20
1 00
I 60Q0 20
Global Tilt Spectra vs Kn
0 1 00 200 300 400 500
Global Tilt Spectra vs Kt
Number of spectra
Global Tilt Spectra vs DirGH
Number of spectra
0 1 00 200 300 400 500 Number of spectra
0
1 00
60
20
0 1 00 200 300 400 500
1 00 2-5EE 60 Q)gt-Qi 20a
Global Tilt Spectra vs Rei Hum
1 00 200 300 400 500 Number of spectra
Figure 4-6 (d) The cumulat ive number of spectra (horizontal axis) over a range of air mass and atmospheric descriptors (vertical axis)
Global Horizontal Spectra vs Kn 1 00
c 60
20
0 200 400 600
1 00
60sz
20
Global Horizontal Spectra vs Kt
200 400 600
TR-35 13Amiddot
measured
Number of spectra Number of spectra
Global Horizontal Spectra vs Global Horizontal Spectra vs DirGH Relative Humidity
0
1 00
I 60G
20
0 200 400 600 Number of spectra
0
2-1 00 5EE 60 Q)gt
Qi 20 a
middot
200 400 600 Number of spectra
Figure 4-6 (e) The cumulative number of spectra (horiz ontal axis) measured over a range of a1 r mas s and atmospheric descriptors (vertical axis )
2 5
v-L-
1-----lr--f-
_ v
I
_J7 r
----
v -
_ 1----
___ ---f--
II (
I
r r-[--
r
v---
- 25
1 5
Diffuse Spectra vs Kn 80
70
c 60
50
0 1 0 20 30 40 50
TR-35 13A
Diffuse Spectra vs Kt 85
2 65
75
1 0 20 30 40 50
Number of spectra Number of spectra
Diffuse Spectra vs DirGH Diffuse Spectra vs Relative Humidity
0 1 0 20 30 40 50 0 1 0 20 30 40 50 Number of spectra_ Number of spectra
95 middotE 50
75 Qi 1 0
70
5J
c 30
secta -
Fi gure 4-6 f ) The cumulati ve number of spectra hori zontal axis) measured over a range of air mass and atmospheri c descri ptors verti cal axis)
1 05
r 85
EclE
Clluc m =g
300 500 700 900 1 1 00
05
Day No 2 1 6 1 987 Global Normal Spectra
730 to 1 5 30
Wavelength (nm)
Fi gure 4-7 Exampl es of spectra showi ng noisy data i n the ultravi olet 300shy400 nm) and near-inf rared 1000-1 100 nm) regions
26
5 0 MEASUREMENT UNCERTAINTY
( No t e Thi s s ec t ion contains only a brief summary o f the total uncertainty The deta i l ed reports [ 1 5 1 6 ] on the methods used to e s t imate tota l spect ra l measurement uncertainty should he consul ted- when using thi s datamiddot middot ba se )
The data set de scribed in thi s document i s the bes t set of measurement s posshys ible wi th the personnel equipment methods and cal i brat i on procedure s avai l able t o us We found that making continuous measurements wi th complex s ens i t ive equipment and account ing for all source s o f error in order to specify total mea surement uncertainty were not triviaL tasmiddotkamp oo
The e s t imat ed total uncertainty ( 95 confidence int erval ) for each of the spec troradi ometers and each of the measurement modes is shown in Figure 5-l The upper and l ower spec tral uncertainty limi t s are symmetrical except when gl obal-t i l t or gl obal-hori zontal s pectra were measured us ing the integrat ing sphere and when a s t rong direct-beam component wa s present ( Kt gt 6 0 ) We added an 8 maximum bias to the l ower uncertainty l imi t s for these cases based on resul t s o f experimen t s in whi ch we mapped the integrat ing sphere res ponse under bri ght sun wi th the image o f the sun in di f ferent locations on the ins ide of the sphere During the se exper iment s we observed variat i on s o f up to -8 compared t o the calibrat i on point
The high uncertainty in the abso lute value o f the spectral measurement s l e s s than 0 45 m wa s caused by l ow s pectra l irradiance for the calibrat i on l amp s which resul ted in a l ow s i gnal-t o-no i s e rat io for the spec troradiorriet er cal i shybrat ions ( F igure 5-2) In add i t ion we experienced a change ( i e l o s s o f respon s e ) i n the ultraviolet ( UV ) re sponse of the instruments when us ing the integrating sphere s
To tal uncert ainty i s a combinat i on o f an e s t imated total spectral bias error and to tal spec tral random error The f inal est imated total uncertainty for a 95 conf idence interval i s calculated as the
random (R) error root- sum-s quare of the bias ( B)
erro r plus two t ime s the
To eva luate instrument-to-instrument d i f ferences or variabi l i ty ( al s o called between-inst rument prec i s i on ) s imul t aneous spectral solar radiat i on s c an s were made wi th each ins t rument in each conf igurat i on The s tandard devi a t i on of the se mea surement s mul t i plied by three was converted to a percentage o f the mean Thi s percent age ind icates the expected instrument-to-instrument varibi l i t y or prec i s i on for thi s set of instrumen t s Fi gure S-3 shows the resul t s obtained for one o f these compari sons us ing the integrat ing s phere s Simi lar resul t s oc cur wi th the other conf igurations The between-inst rument prec i s i on above 0 4 m i s close to 5
Temperature control o f the spe ro adiorrieters with s i l icon detectors wa s import ant Figure 5-4 shows the change in the res pori se o f the instrumen t s espec i a l ly in the near- infrared when o perated at d i fferent control temperashyture s Uncertainty of l deg C in the set point resul t s in about a 2 uncertainty in the near-inf rared measurement s On ho t days we found that the t emperat ure
2 7
(
-Lower
r --
I IV
limityen(-)
-
A u1pp r li it +) f I II I
y 1 I rl ( I _ L
-
-
I I )
f--+- -+--+--1-+---+--1- r--J- Upper -c- A I u o t-iE $ == $= =$S y I I I I t (
1 --( -
----L---------------------- -_j_j_J__J__J__J
TR-35 1 3A
20
c(ij 0tQ)ucJ -20
Global (Sphere) 1 02 1 58 1 74
limit (-) Kt lt 60 Upper limit ( +)
Lower Kt gt 60
(a)
20
c(ij 0t
5 -20 L t )ower 1m1 -
300 500 700 900 1 1 00
Wavelength (nm)
Global Normal (Domes) 1 74 2 1 8 (b)
300 500 700 900 1 1 00 Wavelength (nm)
Direct Normal 1 58 1 72 1 74 (c) 20
limit ( +)gt- iQl u Lower 1m1 -) 5 -20
300 500 700 900 1 1 00 Wavelength (nm)
Figure 5-l Estimated total spectral measurement uncertainty f or global measurements with the i ntegrating spheres on (a) units number 102 158 and 174 (b) global-normal measurements with the Teflon dome receivers on units 174 and 218 and (c) directshynormal measurements with the view-limiting tubes on units 158 172 and 174 The measurement uncertainty is synmetrical except in (a) where a -8 bias is included in the lower limit f or global-horizontal and global-tilt cases due to nonunif orm sphere response when a str ong direct-beam component is present
28
I I
0
0 (J) ()
- 1 0
t U
TR 35l3A
Wavelength (nm)
Figure S-2 Comparison of the spectral intensity of an out door global-normal measurement and the NIST calibrationmiddotmiddot lamp source L ow lamp values below 400 nm result in high measurement uncertainty
20
1 5
R 1 0
X 5Q)0c c 0
-5 Q)_0
300 400 500 600 700 800 900 1 000 1 1 00 Wavelength (nm)
Figure S-3 Between-ins trument precis ion for glo bal-normal spectral solar radiation measurements us ing the integrating spheres
29
5 1 deg C N
ij0
()00- caQ)uc
1 000 Q)-Q) 8 0950 0ca
c 0900
0 300 500 700 900 1 1 00
Wavelength (nm)
Figure 5-4 Ratio of the spectroradiometer detector response at different temperatures to the response at 40deg C
o f the detectors ( contro l l er s ) somet imes exceeded the set point and we experienced runaway temperatures Thi s resul ted in ampl i f i er mi l l ivolt drift errors and no i s e in s ome o f the s pectra We achieved better t emperature conshytrol by shield ing the spectroradiometers with Mylar sheet s supported by foam offsets to allow air flow
Mea surement uncertainty for the broadband and meteorological data i s based on the cal ibration hi s tories provided by the mea surement s i t e s and charact ershyi s t i cs of the instrument s Thi s information is given in Tables 5-l through 5-3 and the values are included on the data-ba se tape
In these table s the measurement uncertainty for a 95 confi dence int erval was e s t imated by root-sum-s quaring the est imated bias errors a d by doubl ing the random errors in the cal i brat i on proce s s and measurement s [ 15 1 6 ] Radishyometers used at PGampE in 1987 were po st-cal i brated at SERI allowing e s t imate s of the random calibrat i on error component the radi ometers used i n 1988 were cal ibrated elsewhere so nominal e s t imated errors were used in the uncertainty analys i s Ins t rument s used at SERI were pre- and po st-cal ibrated at SERI Instrument s used at FSEC were cal i brated by FSEC and nominal values for random and bias errors for the s e types of radiometers were used in the uncershytainty analys i s Cal i brat i on informat ion for the meteorological instrument s i s included i n these tables but no mea surement uncertainty analys i s was performed
30
H 11 VI _ w
Jgt
--
IllIll
Tabl e 5- l FSEC Instrument Calibrat ion Hi story Ul d Estimated Meas urement Uncert ainty N-
Es timated Beg i nn ing Calibrat ion Measurement
Channe l iF Meas urement Instrument Comment s Time Stamp Date Uncertainty
( )
1 Direct normal 862961507 Eppley NIP 14306 E6 5-86 ( thermopi l e ) 863520931 Epp l ey NIP 23943E6 12-86 plusmn2 9
8801 2093 1 Eppl ey NIP 23943E6 12-87 1 32 change
2 Global normal 862961507 Eppl ey PSP 24185F3 Eppley PSP 24185F3 1 1-86 1 6 7 change plusmn3 8
872881032 Eppley PSP 18273F3 4-87 880120931 Eppley PSP 24185F3 1 2-87
3 Globa l hori zontal 862961507 Eppl ey PSP 1 43 2 1 F3 4-86 ( thermopi l e ) 8709 3 1 6 3 1 Eppl ey P S P 14322F3 1 2-87 -- plusmn3 8
w _ 872881032 Eppley PSP 143 18F3 4-87
4 G lobal t i l t 86329103 1 872881032
Eppley PSP 24183F3 Eppley PSP l4320F3
1 1-86 4-87 -- plusmn3 8
880120931 Eppley PSP 24183F3 1 2-87
5 D irec t normal 8629 6 1 507 Mat r ix NIP3826 9-86 ( si l i con) 88012093 1 Matrix NIP3826 12-87 1 32 change plusmn2 9
6 Temperature 862961507 Weathermeasure 1 7 7
1420A 6-86 3-87 8-88
smal l changes the cal ibratiqft factor was changed i software
7 Pressure 86296 1507 Weathermeasure 1 70 5 1-86 smal l c anges the 1 7 8 5-87 cal ibra t i on factor was
Hmiddot 6-88 changed i n software
8 Relat ive humi dity 8629 6 1 5 0 7 Weathermeasure 1 54 0 6-86 Cal culated from dew 175 point compared every
o ther week wi th another instrument
9 Wind speed 862961507 Weathermeasure 1 222 7-86 smal l chlnges the 1219 3-87 cal ibrat i o fac tor was ---
6-88 changed in software
J
-
Ill _-
bull I
Table 5-l FSEC Instrument Calibrat ion Hi stb y and Estimated Measurement Uncertainty (Concluded)
Channel Measurement Beginning Time Stamp ihsttument Cal ibrat ion
Date Comment s
Estimated Measurement Uncertainty
( )
INN
10 Albedo 86329103 1
87288103 2
Eppley PSP 1629 FJ Eppley PSP l 106Srl
1 1-86
4-87
-- plusmn3 8
19 Global hori zontal
( si l i con)
862961507
87 148143 1
LI-COR Py PY22J6 LI-COR yt PY2279
7-86
5-87
plusmn3 8 --
Mo wV11-wgt
I
--
p V1 1-
--
--
--
UlIllN-
Tabl e 5-2 PGampE Ins trument Calibrat ion Hi s ory and Estimated Measurement Uncertainty 1 _
Estimated Beginning Pre- Po st-Channe l if Measurement Instrument Comment s Mea surement
Time S tamp Cal ibra t i on Cal ibrati on Uncertainty ( )
l D irec t normal 87 1 100632 Eppl ey NIP 255 08E6 1-86 8-88 0 3 change plusmn2 8 ( thermopi l e ) 880190 752 Eppl ey NIP 255 10E6 12-8 7 -- plusmn3 6
2 G lobal normal 87 1 100632 Eppl ey PSP 2 32 02F3 1-86 8-88 1 7 change plusmn2 4 880190 7 5 2 Epp l ey PSP 23996F3 12-87 -- -- plusmn4 7
3 G lobal hori zontal 8 7 1 1 00632 Eppley PSP 23995E3 10-84 8-88 3 2 change plusmn2 8 w w
( thermopi l e ) 880190 752 Eppl ey PSP 25390F3 12-8 7 plusmn4 7
4 G lobal t i lt 8 7 1 1 00632 Epp l ey PSP 25387F3 12-84 8-88 0 2 change plusmn3 8 -- plusmn4 7 880190 752 Eppley PSP 23201F3 12-87
5 D irec t normal 8 7 1 100632 Matrix NIP 38Hi 5-86 7-88 2 7 change plusmn2 2 ( si li con)
6 Temperature 8 7 1 1 00632 Omega T-coupl e
7 Pres s ure 8 7 1 1 00632 Yel l ow Springs 2014-22 3 1 -HA- 1-WH 15593 3-84
8 Relat ive humi dity 87 1 100632 Hygr o 14276 2-85
9 Wind speed 8 7 1 1 00632 8804007 3 7
Weathert ronics Weathertron i c s
2301 230 1
184 184
9-82 2-88
10
19
Albedo 8 7 1 1 00632 Eppl ey PSP 2 1235F3
Globa l hori zont al 87 1 100632 LI-COR Pyr PY5558 ( s i l i con)
Beginning about 8 7 2 1 1 the s i l i con NI P va lues appear cons i s tent ly l ow
-- 8-88 2 4 change
1 1-83 8-88 1 9 change
may be an al ignment problem
plusmn2 6
plusmn2 6
gt-3 Iw
wgt
-- --
--
-- --
1ftIll -
Table 5-3 SERI Instrument Calibration Hi story and Estimated Measurement Uncertainty =
Estimated Beginning Pre- Post-Channel I Measurement Instrument Comment s Measurement Time S tamp Cal ibration Cal ibration Uncertainty ( )
1 Direct normal 87328 Eppley NIP 1 7828E6 11-87 2-88 1 5 7 change plusmn3 3 ( thermopil e )
2 Global normal None
3 bull Global horizontal 87328 Eppley PSP 1 78 63F3 1 1-87 2-88 2 22 change plusmn3 7 ( thermo pi l e ) a t Welby
w+- At SRRL 8805 7 Eppley PSP 200 79F3 7-87 8-88 0 7 3 change plusmn2 3
4 Global t i l t None
5 Direct normal None ( si li con)
6 Temperature 87328 Taylor Pocket 21430-1 10-86 (Due 10-9 1 )
7 Pressure Cal culated from elevat ion
plusmn0 2 (deg )
8 Relat ive humidity 87328 Dickson 86 100-1 9-87 10-88 -- plusmn2 ( counts )
9 Wind speed Observat ion
10 Albedo -- None
1 1-14 -- Sun photometer ( relative compari sons only)
15 Cloud c over Observed o-3-- lXlIw Global Ho rizontal -- LI-COR Pyr PY1245 11-87 2-88 3 67 change plusmn2 9 V119 ( si l icon) ( s tabi l i ty monitor only) wgt
TR-35 13A
We urge users of the data ba se to refer to the dai l y f i eld no tes for s pe c i a l c i rcumstances recorded b y the operator that may affect data uncertainty The s e no tes include references to the spectroradiometer t emperature c onshyt ro l l e r solar-tracking accuracy and weather cond i t i ons ( such as rain ) Included in the dai l y notes on tbe data-base tape are obs ervat i ons made in qual i t y-control processing as wel l as references to the exi s t ence and qual i t y o f pho t ographs or s l ides
Quant i tat ive pos t-proces s ing qual i ty-control informat i on i s al s o inc luded on t he data-bas e tape and a complete descript ion is given in the appendix o f thi s report Redundant measurement s ( such as before- smiddotcan andmiddot middot aft et-smiddotcan
broadband solar radiat i on direct-norma l and global-hor izont al mea surement s with both thermopile and s i l i con detectors ) and compar i s ons o f integrat ed s pectral so lar radiat ion wi th broadband s o lar radiat i on were used in the qual i ty-control procedure s Users are encouraged to perform the i r own qual i t y-cont rol proce s s ing on the data t o meet their par t i cular requiremen t s
3 5
6 0 FORMAT OF THE DATA TAPE
The meas ured dat a f i eld notes quali ty-control informa t i on and mea surement uncertainty are s t ored on magne t i c tape in 80-character l ines wi th the fi leshyname s given in Table 6- 1 The f i l enaming convent ion used for the mea sured data was
Filename Content
FLA8705 DAT FSEC data 1987 May PGE880 l DAT PGampE data 1988 January SER8 7 1 1 DAT SERI data 1987 November
Data were not acqui red in a l l months so the months may not be cont iguous
Qua l i t y-control informa t i on has the same f i l enaming conven t i on with QC extens ion ( for example FLA8 705 QC ) Dai ly notes are contained in the f i l e s FSEC NOTES PGE NOTES and SERI NOTES respec t i vely The mea surement uncershytainty is in the UNCERT f i l e s
c The DAT f i l e s contain two types of informa t i on D for data and for inst rument configurat ion The f i r s t l ine of a data or confi guration segment beg ins wi th a D or a c re spect ively in the f i r s t column followed by the s i t e year day and t ime stamp the number of l ines in the segment i s in column-s 76-80 so that the user can eas i ly skip the de s i red number of l ine s An example of the information in the conf iguration or 1 1C segment i s
c shown in Figure 6-1 I t begins wi th a followed b y the s i t e FSEC year 11 1 98 7 day 122 and t i me u0830 latitude longi tude and eleva t i on There are 19 channel s for mea surement s zero s pectra in the C segment and 40 l ine s in the segment The con f i gurat ion informa t i on appear s whenever the inst rument set-up or cal ibrat ion wa s changed or t he data acqui s i t ion sys t em wa s res tarted I f the configurat i on wa s not changed at the beginning of the month the configura t i on segment wi l l be in the previous mont h s DAT f i l e
An examp le of a D segment i s shown in Figure 6-2 Thi s segment contains the mea s ured me teoro logical dat a broadband and spectral solar rad i a t i on dat a and anc i l l ary data The data contained in each l ine and column and i t s format are as follows
POS ITION OF VARIABLES IN THE D SEGMENTS (ALL LINES ARE 80 CHARACTERS )
Line Column Cont ent s Format
a = character 1 = integer f = f l oat ing point
LINE 1 1 1 D ( for data ) ( a l ) 3 1 5 Site Year Day Number Time Stamp ( a 1 3 )
3 6 F SEC PGampE o r SERI ( a4 ) 7 8 Year (a2 or i 2 ) 9 1 1 Day Number ( a3 o r i 3 ) 1 2 15 Standard Time ( a4 o r i4 )
36
5-111 - il ll
Da i ly
Uncertainty
-
TR-35 13A -
Table 6 1 Namesmiddot of Files on the Data Tape
Measured and
FSEC
FLA8610 DAT FLA8 6 1 0 QC
FLAB 6 1 1 bull DAT FLA8 6 l l QC
FLA86 1 2 DAT FLA8 6 1 2 QC
FLA8 7 0 1 DAT FLA8 70 l QC
FLA8 704 DAT FLA8 704 QC
FLA8 705 DAT FLA8 7 05 QC
PGampE
PGE8 704 DAT PGE8 704 QC
PGE8 705 DAT PGE8 705 QC
PGE8 706 DAT PGE8 7 06 QC
PGE8 7 0 7- DAT PGE8 7 0 7 QC
SERI
SER87 l l DAT SER8 7 l l QC
S ER8 7 1 2 DAT SER8 7 1 2 QC
SER880 1 DAT SER880l QC
SER8802 DAT SER8802 QC
Ca lcui a t ed Data
FLA8 706 DAT FLA8 706 QA
FLA8 7 0 7 DAT FLA8 7 0 7 QC
FLA8 7 0 8 DAT FLA8 7 0 8 QC
FLA8 709 DAT FLA8 7 09 QC
FLA8 7 1 0 DAT FLA8 7 1 0 QC
FLA8 7 l l DAT FLA8 7 l l QC
PGE8 708 DAT middot
PGE8 708 QC
PGE8 7 0 9 DAT PGE8 709 QC
PGE8 7 l l DAT PGE8 7 l l QC
No t e s
FSEC NOTES PGampE NOTES SERI NOTES
Mea s urement
FSEC UNCERT PGamp E UNCERT SERI UNCERT
FLA8 7 1 2 DAT FLA8 7 1 2 QC
FLA880l DAT FLA880l QC
FLA8 802 DAT FLA8802 QC
FLA8803 DAT FLA8803 QC _
FLA8804 DAT FLA8804 QC
PGE_880l DAT PGE880l QC
PGE8802 DAT PGE8802 QC
PGE8803 DAT PGE8803 QC
3 7 _middot
1 3
1 7
55 1 1-1 TR-3 5 1 3A
0 G) 0 G)G) iC FSEC8 7 1 2 2 0 8 1 3 2 8 4 0 0 0N 80 6 0 0 0W 2M C = 8 7 1 2 2 0 8 1 3 8 7 1 2 2 0 8 1 3+0 0 0 0 0 0 1 9 0 4 0
CHN PARAMETER +- - - - - - - INSTRUMENT- - - - - - - - - -+ +- -CALIBRATION- + OUTPUT FOOT NO TYPE MAKER TYPE SERIAL FACTOR DATE UNITS NOTES
1 Di r- Nor-m Eppley NIP 2 3 9 4 3E6 6 08 1 2 - 186 Wm2 2 Glo Nor-m Eppley PSP 2 4 1 85F3 8 85 l l - 186 Wm2 3 G l o Hor-z Eppl ey PSP l 4 3 2 2F3 6 3 8 1 2 - 2 86 Wm 2 4 Glo Tilt Eppley PSP 2 4 1 83F3 8 9 9 l l - 186 Wm2 iacute5 Dir- N S i MATRIX SI NIP 3826 31 8 0 9 - 186 Wm2 6 Amb Temp WTHRMEAS PRT 1 7 7 l 0 0 3 - 1 8 7 Deq c 7 Sur-f Pr-es WTHRMEAS PIEZO 1 7 8 l 0 0 5 - 1 8 7 Mi l l ibar-8 Re1 Hum WTHRMEAS LiCl 1 7 5 l 0 0 6 - 1 86 Per-cent 9 Wind Spd WTHRMEAS OPT CHOP 1 2 1 9 l 0 0 3 - 1 8 7 Met e r- s i S
1 0 Albedo Epp ley PSP l 6 2 9 7F3 1 0 0 9 l l - 1 8 6 Per-cent l l hot 380 Unused Unused Unused - 9 9 0 0 - 1 - l - 1 Counts iacute1 2 hot 5 0 0 Unused Unused Unused - 9 9 0 0 - 1 - l - l Count s
14 hot 860 Unused Unused Unused - 9 9 0 0 - 1 - 1 - 1 Counts hot 942 Unused Unused Unused - 9 9 0 0 - 1 - l - l Counts
1 5 Opq C loud Unused Unused Unused - 9 9 0 0 - 1 - l - l Tenths 1 6 H2 0 NWS Unused Unused Unused - 9 9 0 0 - 1 - l - l em
Spect l LI -COR L I - 1 8 0 0 PRS - 1 7 2 l 0 0 2 - 1 8 7 W sq m nm l Spect 2 L I - COR L I - 1 800 PRS - 1 0 2 1 0 0 2 - 1 8 71 8 W sq m nm l
1 9 Glo H Si LI -COR L I - 2 0 0S PY2 276 8 4 5 7 - 1 86 Wm2 2 - 1 FIN
FOOTNOTES
1 - 1 7 = DN 18 = GT 2 - SERI l oan un i t
- 1 - FIN
Figure 6-1 Example of the instrument configuration data on the data base tape The numbers refer tmiddotO
1 c indicating configuration 2 FSEC 1987 Day 122 at 8 13 standard time 3 Latitude 4 Longitude 5 Ele vation 6 Reference to configuration file that will be f ound in the
data files 7 Starting data-acquisition time plus number of attempts to
acquire spectra (which would extend the data acquisition time)
8 Number of data channels 9 Number of spectra ( 0 f or configuration files 1 or 2 f or
data files) 10 Number of lines in this segment
38
TR35 1 3A
D FSEC8 7 1 2 2 0 8 1 3 2 8 4 0 0 0N 8 0 6 00 0W 2M C=871 2 2 0 8 1 3 8 7 1 220 814+0 0 0 1 0 0 1 9 2 1 0 0 gS e e Q N FSEC8 7 1 2 2 U PRS - 1 7 2 Col 2 ( + - ) U PRS - 1 0 2 Col 2 ( - ) Col 4 ( + ) 1 7 84 5 5 7 54 5 2 9 3 0 2 - 1 - 9 9 0 3 48 0 1 1 9 48 3 3 4 4 2 7 9 - 1 -9 9 0 1 7 85 0 5 7 5 5 7 2 9 3 0 4 - 1 - 9 9 0 3 4 8 1 1 1 9 4 85 3 4 43 0 1 - 1 - 9 9 0 2 8 4 1 80 0
1 0 9 5 4 1 5 - 99 0 7 1 0 1 7 8 6 2 0 7 8 7 5 8 9 1 5 - 1 - 9 9 0 - 1 - 9 9 0 iacute1 1 3 80 0 - 99 0 Co 1 2 5 0 0 0 - 99 0 Co 1 3 860 0 - 99 0 Co 1 4 942 0 - 9 9 0 Co iacute
- 1 6 0 7 1 5 8 5 7 8 5 6 7 1 58 3 86 9 1 9 9 1 8 7 - 9 0 0 - 9 0 0 - 9 0 0 - 9 0 0 - 9 0 - 9 0 3 1 1 7 4 0 1 3 0 0 1 1 0 0 2 0 57 9 8 9 4 0 0 DNT1 8 4 0 1 3 0 0 1 1 0 0 2 0 2 8 4 1 8 0 0 6 2 4 GTS - 1 0 0 0 0 0 0 0 0 0 0 0 - 1 0 0 0 o o 0 0 0 0 o o
1 3 0 0 0 0 0 0 0 0 3 5 0 0 0 4 0 0 2 1 0 02 5 0 0 14 0 04 1 0 02 1 0 0 5 7 0 0 3 8 amp 1 3 2 0 0 0 7 2 0 056 0 1 0 1 0 0 8 1 0 1 1 8 0 1 2 1 0 1 1 9 0 140 0 138 0 1 3 1 amp 1 340 0 1 4 9 0 16 1 0 162 0 1 5 5 0 16 0 0 1 6 3 0 1 8 5 0 1 9 5 0 1 9 8 0 1 9 9 amp 1 360 0 2 0 9 0 2 1 9 0 228 0 2 4 3 0 258 0 26 5 0 258 0 265 0 268 0 2 89 amp 1 380 0 2 8 0 0 2 7 9 0 26 7 0 2 7 3 0 3 0 1 0 3 08 0 3 1 7 0 326 0 349 0 4 0 2 amp 1 4 0 0 0 4 7 6 0 52 7 0 55 7 0 569 0 580 0 5 9 5 0 6 12 0 63 0 0 64 1 0 648 amp 1 4 2 0 0 652 0 6 54 0 6 58 0 649 0 6 36 0 6 3 2 0 646 0 67 8 0 7 1 8 0 746 amp 1 440 0 7 6 8 0 7 9 9 0 82 2 0 854 0 8 7 7 0 9 0 4 0 9 1 5 0 92 2 0 934 0 94 2 amp 1 460 0 9 6 0 0 964 0 9 7 0 0 9 7 3 0 96 9 0 9 74 0 9 9 0 0 9 9 9 1 0 1 7 1 028 amp 1 4 8 0 1 0 3 3 1 0 25 1 0 0 6 0 9 9 1 0 9 9 0 1 0 1 0 1 026 1 0 3 8 1 043 1 0 4 7 amp 1 500 1 0 3 8 1 034 1 038 1 0 5 1 1 0 58 1 058 1 0 5 1 1 0 3 5 1 0 1 7 1 0 0 7 amp 1 520 1 0 2 0 1 04 1 1 0 5 7 1 063 1 068 1 0 8 1 1 088 1 0 9 3 1 0 9 3 1 0 9 1 amp 1 540 1 0 8 9 1 0 84 1 088 1 0 9 5 1 0 9 7 1 0 9 5 1 0 9 8 1 1 0 2 1 094 1 0 8 7 amp 1 560 1 0 7 8 1 0 7 9 1 08 1 1 0 7 7 1 0 7 2 1 0 7 1 1 0 7 6 1 0 7 8 1 0 7 8 1 0 82 amp 1 580 1 0 9 0 1 0 9 8 1 1 0 1 1 088 1 0 7 4 1 062 1 06 1 1 06 7 1 0 7 4 1 0 80 amp 1 6 0 0 1 082 1 085 1 08 8 1 0 9 2 1 0 9 3 1 0 89 1 083 1 0 7 8 1 0 78 1 0 7 9 amp 1 620 1 0 8 2 1 083 1 0 7 6 1 065 1 0 5 9 1 056 1 06 1 1 0 7 3 1 0 8 0 1 085 amp 1 640 1 0 86 1 084 1 08 1 1 0 7 6 1 067 1 062 1 0 5 2 1 04 2 1 038 1 048 amp 1 660 1 0 7 0 1 086 1 0 9 4 1 0 9 7 1 0 96 1 096 1 09 2 1 0 9 3 1 0 9 1 1 0 89 amp 1 680 1 0 7 9 1 064 1 02 8 0 9 8 0 0 94 3 0 9 3 7 0 954 0 98 0 0 9 9 6 1 0 0 5 amp 1 7 0 0 1 0 0 8 1 0 0 9 1 0 1 3 1 0 1 9 1 0 2 5 1 0 2 2 1 0 0 3 0 9 7 3 0 924 0 8 74 amp 1 7 2 0 0 846 0 842 0 84 8 0 84 9 0 8 54 0 8 7 8 0 9 0 3 0 9 3 1 0 9 52 0 965 amp 1 740 0 9 6 9 0 9 7 7 0 98 3 0 989 0 988 0 9 8 2 0 9 7 6 0 95 0 0 8 81 0 7 6 7 amp 1 760 0 6 1 6 0 5 24 0 54 0 0 646 0 7 7 9 0 8 76 0 924 0 94 5 0 94 7 0 9 45 amp 1 7 8 0 0 94 2 0 94 2 0 9 3 7 0 9 2 6 0 9 1 6 0 9 0 7 0 89 9 0 894 0 8 9 1 0 89 0 amp 1 800 0 888 0 883 0 8 7 9 0 87 5 0 863 0 836 0 8 0 1 0 7 5 7 0 7 2 2 0 7 1 0 amp 1 820 0 7 1 0 0 7 1 9 0 7 3 3 0 74 1 0 7 4 9 0 7 5 7 0 76 3 0 7 7 7 0 7 9 7 0 8 1 0 amp 1 840 0 82 0 0 82 8 0 82 7 0 82 2 0 8 1 5 0 7 9 7 0 786 0 7 83 0 7 8 8 0 7 9 7 amp 1 860 0 80 4 0 8 0 0 0 7 8 8 0 7 8 0 0 7 7 5 0 7 8 0 0 7 8 7 0 786 0 785 0 7 81 amp 1 880 0 7 7 5 0 7 7 4 0 7 7 2 0 767 0 763 0 7 4 7 0 72 1 0 68 2 0 6 30 0 5 88 amp 1 9 0 0 0 57 1 0 5 7 3 0 58 9 0 584 0 568 0 549 0 53 4 0 53 3 0 5 38 0 5 56 amp 1 9 2 0 0 5 7 3 0 57 9 0 56 7 0 526 0 448 0 362 0 2 7 2 0 2 18 0 2 1 0 0 2 32 amp 1 940 0 254 0 262 0 2 5 7 0 253 0 25 7 0 266 0 2 7 5 0 2 85 0 29 9 0 3 1 7 amp 1 960 0 3 33 0 362 0 3 9 6 0 4 3 5 0 4 7 9 0 5 06 0 5 1 5 0 5 1 2 0 5 08 0 5 2 1 amp 1 9 8 0 0 53 7 0 560 0 5 84 0 5 9 7 0 6 0 9 0 6 1 7 0 6 1 8 0 6 2 3 0 62 1 0 6 1 9 amp 1 1 0 0 0 0 6 1 8 0 6 0 7 0 6 0 5 0 6 0 2 0 60 1 0 60 5 0 6 04 0 604 0 604 0 6 0 1 amp 1 1 0 2 0 0 60 1 0 59 5 0 5 9 5 0 5 93 0 589 0 59 0 0 584 0 5 82 0 580 0 5 75 amp 1 1 0 4 0 0 5 7 6 0 5 7 1 0 57 1 0 56 7 0 56 0 0 56 0 0 558 0 552 0 545 0 54 0 amp 1 1 0 6 0 0 5 36 0 53 2 0 5 2 9 0 5 2 5 0 5 1 9 0 5 1 5 0 5 1 2 0 51 1 0 50 9 0 5 08 amp 1 1 0 8 0 0 50 6 0 502 0 4 9 2 0 48 3 0 48 3 0 483 0 46 9 middot 0 4 5 2 0 447 0 3 1 amp 1 1 1 0 0 0 4 1 1 - 9 9 0 0 0 - 9 9 0 0 0 - 9 9 0 0 0 - 9 9 0 0 0 - 9 9 0 0 0 - 9 9 0 0 0 - 9 9 00 0 - 1 582 3 2 2 3 0 0 0 0 0 6 0 0 0 1 0 0 0 4 0 0 1 3 0 0 1 9 0 0 2 3 0 04 1 0 0 5 5 0 064 0 088 amp 2 3 2 0 0 1 0 5 0 1 3 9 0 1 7 9 0 1 8 9 0 2 2 4 0 2 38 0 26 2 0 252 0 261 0 2 64 amp 2 340 0 2 8 7 0 2 9 2 0 266 0 2 88 0 2 98 0 286 0 3 0 0 0 3 0 0 0 2 9 1 0 2 85 amp 2 360 0 296 0 3 1 0 0 3 36 0 367 0 3 9 0 0 3 7 2 0 3 56 0 356 0 3 7 3 0 3 88 amp
Figur e 6-2 Examples of the data on the data-base tape
3 9
TR-3 5 1 3A
16 2 3 24 24 2S 3 3 34 34 3S 3 9 40 40 4 1 S 2 S4 69
54 62
6 3 6 3
6 7 6 7
7 0 7 3
74 7 S
7 6 80
LINE 2
LINE 3
1 3 4 10
1 1 1 3 14 20 2 1 23 24 30 3 1 40 4 1 43 44 SO 5 1 5 3 54 60
Lat i tude ( deg ) N ( north) Longi t ude ( deg ) W ( we s t ) `Elevat i on (m) M (m) Reference t o Conf i guration Segment Start ing year day t ime for the spectral `scan s ) i f any and number of attempt s t o `acquire the s can ( which ind i cates po s s ible `t ime delay from the s tart ing t ime ) middot
Year Day Number Time
11+11 for plus number of attempt s to acquire a s pect rum
Number o f attempt s t o acquire a s pectrum
Po s s ible Number o f Measurement s ( 1 9 )
Number o f Spec tra i n thi s Segment ( 0 1 or 2 )
Number o f Lines in Segment
Pointer to the qua l i ty-cont rol dai ly f i e ld note s and measurement uncertainty informa t ion Qua l i ty-control informa t i on is in the QC f i l e of the same month wi th the same s i t e year day and t ime s t amp Dai l y field notes are i n the NOTES f i l e f o r the same s i t e wi th the same s i t e year and day s tamp Mea surement uncertainty i s in the f i l e s UNCERT under t h e instrument serial number ident i f i ed by PRS-xxx and the column s in the uncertainty f i le s for + and - uncertainty l imi t s
Broadband mea surement s before the spectral scan
Channel fH Direct Normal ( thermopi l e ) (Wm2 ) Channel ffoS Direct Normal ( s i l i con) (Wm2 ) Channel tn Global Normal ( Wm2 ) Channel not used Charinel ffo3 Globa l Hori zontal ( thermop i l e ) ( Wm2 ) Channel fH 9 Gl obal Horizontal ( s i l icon ) ( Wm2 )
( f 8 4 ) ( a 1 ) ( f 9 4 ) ( a l ) ( i S ) ( a l ) ( a l 2 )
( a9 o r i 9 )
( a 1 )
( i 1 )
( i4 )
( i 2 )
( i S )
( a8 0 )
( i 3 ) ( pound 7 2 ) ( i 3 ) ( pound 7 2 ) ( i 3 ) ( f 7 2 )
( i 3 ) ( pound 7 2 ) ( i 3 ) ( pound 7 2 )
40
TR-35 3A
6 1 6 3 64 7 0 7 1 80
LINE 4
LINE 5
1 6
7 1 2
1 3 80
LINE 6
1 3 4 1 0
1 1 1 3 1 4 20 2 1 23 24 3 0
3 1 3 3 34 40 4 1 43 44 5 0 5 1 5 3 5 4 6 0 6 1 6 3 64 7 0 7 1 7 3 7 4 8 0
LINE 7
LINE 8
1 5
6 1 2
Channe l 114 Gl obal Ti l t (Wm2 ) hellipChannel not used
Broad band mea suremen t s a f t e r t h e s p e c t ral s can same format a s beforeshy scan ( LINE 3 )
T i l t o f the f ixed- t i l t i n s t rument s hellipf rom the hor i z ont a l ( d eg )
Az i muth of the f i xed-t i l t ins t rumen t s ( de g ) ( 1 8 0 deg = s outh)
De s c r i p t i on o f any s pec i al i n s t rument ( fo r example d i ffu s e-hori zont a l mea s uremen t s a t SERI )
Channe l IFlOAl bedo (Wm2 ) hellipChannel IH5C l oud Cover ( t enths ) Channel fF7 Surface Pres sure ( mb ) Mea s ured at FSEC and PGampE c a l c u l ated from e l eva t i on a t S ERI [ 1 1 p 1 0 0 ]
Channel 116 Amb i en t Temperature ( deg C ) Channel fiB Rel a t i ve Humi d i t y ( ) Channe l ffo9 Wind S peed ( m s ) Add i t i onal channe l des cri bed 1n l i ne 5 Va l ue Add i t i onal channel descri bed 1n l ine 5 Va l u e
Sun Pho t ometer read ings ( only recorded for SERI dat a not u s ed except for re l a t i ve c ompar i s on s ) hellip
Earth-S un d i s tance c orrec t i on ( d e v i a t i on from 1 0 ) hellip
Ext ra t erre s t r i a l Rad i a t i on (Wm2 ) hellip
( i 3 ) ( pound 7 2 )
( f 6 1 )
( f 6 1 )
( a 8 8 )
( i 3 ) ( 7 1 ) ( i 3 ) ( 7 1 ) ( i 3 ) ( f 7 1 )
( i 3 ) ( pound 7 1 ) ( i 3 ) ( pound 7 1 ) ( i 3 ) ( pound 7 1 ) ( i 3 ) ( variabl e ) ( i 3 ) ( variabl e )
( f5 2 )
( f 7 1 )
4 1
9
42
TR-3S l 3A
1 3 1 8
1 9 24
25 30
3 1 36
3742
43 48
49 68
69 72
13 76
1780
LINE
I
3 6
7 1 1 1216 1 7 20 21 25
2631
3236
3839
40 40
41 42
43 46
Zen i t h Angl e ( deg ) ( f6 2 )
Kt ( ra t i o calculated from ( f6 1 ) thermo p i l e inst rument s )
Kn ( rat i o calculated from ( f6 1 ) thermo p i l e instrument s )
D GH ( ra t i o cal culated from thermopile instrument s ) ( f6 1 )
Albedo ( ) ( f6 1 )
Ai r Mas s ( f6 2 )
Res erved for Turbidi ty i f calculated
Precipi table Water Vapor i f calculated from sun photomet er
Precipi table Water Vapor from the ( f4 1 ) Nat ional Weather Servi ce
Prec i p i table Water Vapor Cal culated from Relative Humid i t y ( f4 1 )
Channel H7 Number o f Wave l engths Recorded by Spect roradi ometer 1
Beginning Wavelength ( nm ) Ending Wavel ength (nm) Wavelength Step Size (nm ) Spectroradi ometer 1 Ti l t from the Horizontal ( deg )
Spectroradiometer 1 Azimuth ( deg )
Angle o f Incidence o f the Direct Beam on Spectroradi ometer 1 ( deg )
Measurement Type ( DN GN GH GT DF )
Attachment ( Tef lon Dome D Integrat ing Sphere S View- l imit ing Tube T )
Channel H8 Number o f Wavel engths Recorded by Spectroradi ometer 2
( i2 )
( i4 )
( i S ) ( i S ) ( f4 1 )
( fS l )
( f6 1 )
( fS 1 )
( a2 )
( a l )
( i 2 )
(i4)
TR-3S l3A
4 7 S l Beginning Wavel ength (nm ) ( i S )
S 2 S 6` Ending Wavel ength ( nm ) ( i S )
S 7 60 Wavelength Step S i z e ( nm ) ( f4 bull 1 )
6 1 6S Spec troradi ometer 1 T i l t from the Hori zontal ( deg ) ( fS l )
6 6 7 1 ` Spect roradi ometer 2 Az imuth ( deg ) ( f6 1 )
7 2 76` Angle of Incidence o f the Direct Beam on Spect rorad i ometer 2 ( deg ) ( fS l )
7 8 7 9 Mea surement Type ( DN GN GH GT DF ) ( a2 )
8 0 80 At tachment ( Teflon Dome D Integrat ing Sphere s View-l imi t ing Tube T ) ( al )
LINE 10 Saved f o r extra spectroradi ometers i f needed
I f no spec tral data were recorded the number of l ines in the D s egment i s 1 0 the number of spectra i s 0 and there i s no corre sponding qual i ty-control information for thi s dat e t ime in the QC f i l e s No qual i ty c ontrol wa s performed because the atmo sphere was uns table I f the number o f spectra i s 1 there are 60 l ines in the D s egment i f there are two spectra t he number o f l ines i s 100
I f middot the number of spectra i s 1 or 2 the spectral data fol low after the f i r s t 1 0 l i nes o f the D segment There are 1 0 spectral measurement s per l ine wi th the number in the lef t-mo s t column indicat ing the f i r s t or second specshyt roradiometer ( 1 or 2 ) f o l l owed by the s tart ing wavelength ( in nanometers ) and t he 10 spectral mea surements ( in Wm2-nm) The 1 0 measurement s are at wave l ength inc rements of 2 nm There are 401 spect ral mea surement s from 300 t o 1 1 0 0 nm in 2-nm s teps with 10 measurement s per line for 40 l ine s and one measurement in the 4 1 s t l ine The l a s t number in the 4 1 s t l ine i s the specshytral integral I f a second s pectrorad i ometer wa s used the next 4 1 l ines folshylow t he same format Blank 1 ines follow the spec tral data t o f i l l the D segment to 60 or 100 l ines
An example of a QC f i l e i s shown in Figure 6-3 The f i r s t l ine o f each segment begins with a Q f o l l owed by the s i t e year day number and t ime s tamp with the number of l ines in the segment given in the l a s t col umn s o f the l ine Following the iden t i fier are me s sage s about var iables that were flagged by the automat i c qua l i ty-control proc e s s ing ( s ee appendi x ) noted by an operator at the measurement s i t e or noted dur ing inspec t i on at SERI The l a s t l ine of the segment shows the QC code for as DN ( direct normal thermopile detect o r ) SN ( d i rect normal detector ) AL
var iabl e s such s i l i con
( a lbedo ) and SP ( s pectrum) a s de s c r i bed in the appendi x Three qual i tyshycontrol code s ar8 used 1 = good 2 = suspec t see me s sages and dai ly not e s and 3 = poor or mi s s ing see me s s ages and da i l y no te s The broadband codes ( DN SN GN GH SH and GT ) have two value s the f i r s t is the before- scan measurement and the second is the after-s can mea surement
4 3
TR-35 13A
Q FSEC87 1 2 1 0 7 3 1 4 Noise in GH spectrum in UV QCDN1DN1SN1SN1GN1GN1GH1GH1SH1SH1GT1GT1AL1AP1PR1TC1RH1WV1WS1KT1KN1DG1SPl iN1SP2IN2
Q FSEC8 7 1 2 1 0 8 3 0 8 SN bef SN af t = 1 0 5 5 S H bef SH aft = 1 0 5 3 2nd Int BB b e f = 0 636 2nd Int BB aft = 0 6 5 1 Noise in GH spectrum i n UV QCDN1DN1SN2SN2GN1GN1GH1GH1SH2SH2GT1GT1AL1AP1PR1TC1RH1WV1WS1KT1KN1DG1SP1 IN1SP2IN2
Q FSEC8 7 1 2 1 1 0 3 1 3 QCDN1DN1SN1SN1GN1GN1GH1GH1SH1SH1GT1GT1AL1AP1PR1TC1RH1WV1WS1KT1KN1DG1SP1 IN1SPl iNl iacute
Q FSEC87 1 2 1 1 1 3 1 3 QCDN1DN1SN1 SN1GN1GN1GH1GH1SH1SH1GT1GT1AL 1AP1PR1TC1RH1WV1WS1KT1KH1DG1SP 1 IN1SP1 IN1
Q FSEC8 7 1 2 1 1 2 3 1 3 QCDN1DN 1SN1SN1GN1GN1GH1GH1SH1SH1GT1GT1AL1AP1PR1TC1RH1WV1WS1KT1KN1DG1 SP1 IN1SP 1 IN1
Q FSEC8 7 1 2 1 1 3 3 1 3 QCDN1DN1SNlSNlGNlGN1GH1GH1SH1SH1GTlGTlALlAPlPRlTClRHlWVlWSlKTlKNlDGlSP l iNlSPliNl
Q FSEC8 7 1 2 1 1 4 3 1 3QCDNlDNlSNlSNlGNlGNlGHlGHlSHlSHlGTlGTlALlAPlPRlTClRHlHVlHSlKTlKNlDGlSPl iN1SP1IN1 Q FSECB7 1 2 1 1 554 3 QCDNlDNlSNlSNlGNlGNlGHlGHlSHlSHlGTlGTlALlAPlPRlTClRHlWV1WSlKT1KN1DG1SP 1 IN1SP l iN1
Q FSEC8 7 1 2 1 16 3 0 3 QCDNlDNlSNlSNlGNlGNlGHlGHlSHlSHlGTlGTlALlAPlPRlTC1RH1WV1WSlKTlKNlDG1SP l iNlSPl iNl
Q FSECB 7 1 2 1 1 7 3 1 5 GH bef SH bef = 0 9 3 1 GH aft SH af t = 0 9 3 3 QCDN1DN1SN1SN1GN1GNlGH2GH2SH2SH2GTlGT1ALlAPlPRlTClRHlWVlWSlKTlKNlDGlSPl iNlSPl iNl
Q FSECB 7 1 2 2 0 7 3 1 3 QCDNlDNlSNlSNlGNlGNlGHlGHlSHlSHlGT1GTlALlAPlPRlTClRHlWVlWS 1KT1KNlDGlSP l iNlSPl iNl
Figure 6-3 Example of quali ty-control inf ormation on the data- base tape
Figure 6-4 shows an exampl e of a segment of the daily notes from the FSEC NOTES f i l e Each segment of the f i l e beg ins wi th an followed b y the s i t e year and day number s t amp with the number of l ines in the segment given in the last columns of the l i ne The next l ine contains the s i te operashytor log sheet number month day year day number spectroradi ometer serial number( s ) and mea surement mode( s ) The PGampE and SERI not e s do not include the dai ly l og sheet number The f i rst two l ines are followed by f i eld no te s No tes that were added after inspec t i on at SERI are s eparat d from the operator notes wi th ------- The exi s tence of s l ides or photographs i s ind i cat ed a s wel l a s their qua l i ty i e good ( G ) marginal ( M ) or poor ( P ) In the exampl e in thi s f i gure there were two log sheets for thi s day (number 1 1 6 and 1 1 7 ) because the mea surement mode changed from gl obal hor i z onshytal ( GH ) to global t i l t ( GT )
44
TR-3513A
N FSEC87 1 2 2 1 1 6 0 5 0 2 8 7 1 2 2 1 7 2 DN 1 0 2 GH Clear at 0 7 3 0 GH f o r f ir s t two s cans then GT S l i de s 0 6 3 2 G
0 7 3 3 G 0 8 3 3 G 0 9 3 3 H ( dark ) 1 0 3 3 p1 1 3 3 p1 2 3 3 p 1 3 3 3 p1433 H 1 5 3 3 G 1633 G 1733 G
1 1 7 0 5 0 2 87 1 2 2 1 7 2 DN 1 0 2 GT GT s tart ing at 0 8 0 0 iacuteC lear a t 0 8 0 0 iacuteS l ides S e e above
16 1 1 8 0 5 0 3 8 7 1 2 3 1 7 2 DN 1 0 2 GT Clear at 0830 S l i de s 0633 G
0733 G 0833 G 0933 H ( dark ) 1 0 3 3 p1 1 3 3 p 1233 p 1333 p1433 H 1533 G 1633 G 1733 G
N FSEC87 1 2 3
Figure 6-4 Examples of daily notes on the data-base tape
An example o f a segment of the measurement uncertainty file UNCERT CAL i s shown in Figure 6-5 The f i r s t l ine begins with a U followed by the serial number of the s pect rorad i ometer The upper and lower measurement uncertainty l imi t s are given in the co lumns fol lowing wavelength wi th the appropri a t e measur ement mode dat es and de script ion at the top o f the column The s econd l ine in each segment o f the DAT f i l e s is a pointer to the correct uncershytainty information in UNCERT CAL The broadband s o lar radiat i on and meteshyorolog ical instrument measurement uncertainty fol lows each spectra l measureshyment uncertainty segment in UNCERT CAL
The format o f thi s data ba se was es tabl i shed at SERI t o accommodat e expanded mul t i year long-term data collect ion Users can reformat the data t o suit their part icular needs We recommend the following s t eps for acce s s ing and document ing parti cular data set s
1 Se lect and extract the des ired spectral data from the DAT f i l e s us i ng in formation such as measurement mode day number t ime air mas s or a moshys pheric condi t ions depending on the de s i red attribut es
2 Ex trac t and review the corres ponding segment s of the qua l i ty-cont rol i n format i on from the QC f i l es
3 Ex trac t and review the corres pond ing field no tes from the NOTES f i l e s
4 5
+ I -
5 4
3 7
TR- 3 5 13A
U PRS - 1 0 2 L I -COR PRS - 1 0 2 i
1 2 3 4 5 Ill
Wav GHS GHS GHS GHS GTS GTS GTS GTS Kt gt 6 0 Kt gt 6 0 Kt gt 60 Kt gt 6 0 iacutel ower lower upper upper 2 8 7 - 8 8 7 -8 8 7 5 8 8 GNS GNS
upper upper lower l ower
+ 1 -
- GHS GHS GTS GTS Kt lt 60 Kt lt 6 0 upper uppe r l ower l ower + I - + I -2 8 7 - 8 8 7 -8 87 5 - 8 8
3 0 0 - 1 0 0 0 - 1 00 0 1 0 0 0 1 0 0 0 3 0 2 - 1 0 0 0 - 1 0 0 0 1 0 0 0 1 0 0 0
4 0 0 - 2 3 3 - 1 7 1 1 5 3 9 1 4 0 2 iacute -2 2 0 - 1 7 3 1 4 0 9 3
5 0 0 - 1 3 4 - 1 1 7 3 7 5 0 2 iacute - 1 3 3 - 1 1 7 5 3 3 7
6 0 0 - 1 1 8 - 1 1 1 3 8 3 1 6 0 2 - 1 1 9 - 1 1 1 3 9 3 1
7 0 0 - 1 1 5 - 1 0 7 3 5 2 7 7 0 2 - 1 1 3 - 1 0 7 3 3 2 7
8 0 0 - 1 1 6 - 1 0 6 3 6 2 6 8 0 2 - 11 7 - 1 0 6 3 7 2 6
9 0 0 - 1 1 2 - 1 0 5 3 2 2 5 9 0 2 - 1 1 4 - 1 0 8 3 4 2 8
1 0 0 0 - 1 1 7 - 1 0 8 2 8 1 0 0 2 - 1 1 8 - 1 0 8 3 8 2 8
1 1 0 0 - 1 2 9 - 12 2 4 9 4 2
Figure 6-5 Examples of spe ctral measurement uncertainty on the data-base tape A value of plusmn100 indi cates greater t han 100 measurement uncertainty
46
TR-35 13A
4 Extract the measurement uncertainty information from the 1 1 UNCERT f i l e s and quot e mea surement uncertainty for a l l data used
5 Examine the dai l y broadband and spec tral solar radiatio data graphs in the catalog ( Volume I I of thi s report [ 1 8 ] i f avai labl e These graphs provide informa t i on on atmo spheric condi t i ons during the day For exampl e Figure 4-3 shows dai l y broadband and spec tral plot s for part ly c loudy condi t i ons when s olar rad i a t i on i s changing rapidly throughout the day The sun i s obs cured when the direc t-normal values drop t o zero and the gl obal value s approach each o ther Figure 4-1 shows a clear daybull
No data should be used wi thout consult ing the qua l i ty-control informa t i on dai ly no tes and measurement uncertainty
4 7
Cel l s
Ce l l s
Energy
Meteorologi cal Society
Appl i ed Meteorol ogy
Energy
Radiat ion Topical Overview Solar Cel l s Vo l 1 8
of the Pho tovo l t a i c s and Insolat ion Mea sureshySolar Vol 1 8 1 986 pp 393-3 9 5
TR-35 1 3A
1 0 REFERENCES
1 Hul st rom R L Solar 1 986 PPbull 1 7 9- 1 8 7
2 Hul st rom R L A Summary ments Workshop Panel Resul t s
3 Hul strom R L Re sul t s of the Amorphous S i l i con Mea surement s Ta sk Force Solar Cel l s Vo l 18 1 986 pp 1 7 1-1 7 7
4 Hul strom R L and J M Ohi Resul t s of the SERI Mul t i junction Devi ce Efficiency Measurement Task Forc e pre sented at the 20th I EEE Photovo lshytaic Spec ial i s t s Conference September 1 988
5 Riordan c and R L Hul s t rom Summary of S tud i e s that Examine the Effec t s of Spect ral Solar Radition Vari at ions on PV Device Des ign and Pershyformance SERI-TR-2 15-343 7 Golden CO Solar Energy Research Ins t i tute 1989
6 Riordan c Joint EPRI-SERI Spectral Solar Rad i a t i on Database Pro j ec t
1
8
9
1 0
1 1
1 2
1 3
14
Solar Vol 2 1 1 98 7 pp 3 3 7-342
Riordan c D Myers M Rymes R Hul strom W Mar i on c Jenning s and c Whi taker Spectral Solar Radiat ion Data Bas e at SERI Solar Vol 42 No 1 1 989 PP bull 6 7-79
Riordan C J T L Stoffe l and R L Hul s trom The Effect s of Urban Air Pollut ion on Solar Radiat i on SERI-TR-2 15-3482 Golden CO Solar Energy Res arch I n s t i tute ( draft ) 1989
Riordan c and R Hul s t rom The SERI Re s ource As ses sment Project s Plan for Col l ect ing Spectral-Solar-I rradiance Data SERI -TR-21 5-2948 Gol den CO Solar Energy Re search Ins t i tut e 1986
Shaw G E Sun Pho tometry Bul letin Ameri can Vol 64 No 1 January 1983 pp 4-10
Iqbal M bull An Int roduction to Solar Radiation New York Academic Pre s s
1983
Bartel s R A Comment s on Prec ipi table Water Mea surement s with Sun Photometer s Journal of Cl imate and Vol 25 1 986 PP bull 1 788- 1 789
Leckner B The Spectral Distribution o f Solar Radiat ion at the Earth s Surface -- El ements of a Model Solar Vol 20 1 9 7 8 pp 143- 1 5 0
Cannon T W Spectral So lar Irradiance Instrumentat i on and Measurement Techniques Solar Cel l s Vol 1 8 1986 pp 2 3 3-24 1
48
Energy
Photogrammetric Engineering
TR 3 5 13A
1 5 Myers D R E s t imate s of Uncertainty for Measured Spec tra in the SERI Spectral Solar Radiat i on Data Base ac cepted by Solar 1 98 9
1 6 Myers D R E s t imates of Uncertainty for Measured Spectra in the SERI Spec tral Solar Radiat i on Data aa s e 11 SERI e_clmical Report Golden CO S o l ar Energy Res earch Ins t i tute ( draft ) 1989
middot
1 7 Hul s trom R L The Cl oud Bright Spo t 1 9 73 PP bull 3 7 0-3 7 6
18 Ri ordan c D Myer s and R Hul s t rom Spectral Scflar Raltfiation Data Base Documentat i on and User 1 s Manual Vo lume I I SERI-TR-2 15-3 5 1 3 Golden CO Solar Energy Re search Ins t i tut e 1989
49
TR- 3 5 1 3A
APPENDIX
QUALITY-CONTROL PROCESSING
Limi ted qua l i ty-control proces s ing wa s appl i ed to the data ba se as de s c r i bed below The resul t s are i n the QC f i l es on the data-base t ape by s i t e year and mont h For examp l e
FLA8705 QC i s FSEC 1 98 7 May PGE8 80 l QC i s PGampE 1 9 8 8 January SER8 7 l l QC i s SERI 1 98 7 November
These f i l e s correspond t o the 11 OAT f i les for the s ame s i t e year and month Each data segment that includes a spectrum wa s proces sed through thi s quali ty-control procedure I f the atmospheric cond i t i on s were uns tab l e and a spectrum was not acquired the broadband and meteorologi cal data were inc l uded on the data-base tape but no qua l i ty-contro l proc e s s ing wa s app l i ed
An example o f a segment of a 11 QC f i l e i s shown in F i gure 6-3 The f i r s t Q l ine beg ins wi th a fol l owed by the s i t e year day and t ime s tamp The
last columns give the number of l ines in the s egment so the user can skip to the next s egment Fo l l owing the f i r s t l ine are me s sages that were printed whenever the qua l i ty-control proce s s ing f lagged a suspect or poor value
Following the mes sages in an SO-character QC l ine l i s t ing the variables that were examined are one of three qua l i ty-control code s 1 good 2 marg inal or suspect and 3 mi s s ing or poor The QC l ine was prepared using an automa t i c ( computeri zed ) check of the variabl e s and manual edi t ing to include informashyt ion from correspondence l og sheet s and vi sual inspe ct i on Addi t i onal me sshysages were added above the QC l ine if appropriate
The two-charact er descriptors in the QC l ine are
DN Direct-normal ( thermopi l e ) solar radiat ion before the spectral s can DN Direct-normal ( thermopi l e ) so lar radiation after the spectra l scan SN Direct-normal ( s i l i c on ) before SN Direct-normal ( s i l i c on ) after GN Globa l-normal before GN Globa l-normal after GH Globa l -horizontal ( thermop i l e ) before
WS Wind Speed KT KKN K
t n
GH Global-hori zontal thermopil e ) after SH Global-hori zontal ( s i l i con ) before SH Global-hori zontal ( s i l icon ) after GT Global-t i l t before GT Gl obal- t i l t after AL Al bedo ( Wm ) AP Albedo ( ) PR Surface Pres sure TC Temperature ( deg C ) RH Relat ive Humi dity WV Water Vapor ( al culated from rel a t i ve humidity)
5 0
S- flllit = - ( middotmiddot middot
( e g Wm2 )
TR-3 5 1 3A
DG D GH SP F i r s t Sp qtrum I T Integral of t he F i r s t Spec t rum SP Second Spectrum IT I nt egral of the - Second SpecttUI11
The aut oma t i c tes t s that were performed to det ermine the QC code fol l owing each var iable were
( a ) Check for mi s s ing or negat ive values for the broadband solar radiashyt i on meteoro l og i cal or a tmo spheric dat a or the spec t ral integral s
lt 0 = Code 2 Mi s s ing ( - 9 or -9 9 ) = Code 3
( b ) Check for atmo spheric or broadband instrument instab i l i ty us ing the difference and rat i o o f the before- and aft er-scan values and redundant mea surement s if nei t her values are negat i ve or mi s s ing
DN before DN after if the abs lute d i fference SN before SN after i s gt10 Wm DN beforeSN before 5 of 200 DN before SN after and GH before GH after SH beforeSH after the rat io i s lt0 95 or gt1 05 each of the GH before SH before two var iables = GH afterSH after or middot GN beforeGN after the rat i o i s lt0 90 or gt1 10 each of the GT beforeGT after two var iable s = Code 3
Code 2
( c ) Check for DN gt GN or GN gt ETR ( extraterre s trial solar radiat i on ) us 1ng rat ios of the var iabl e s
DN before GN before gt0 95 each variable = Code 2 DN afterGN after gt 1 0 each var i able = Code 3 GN before ETR GN afterETR
( d ) Check for values o f Kt Kn and DGH tha t are too high
KT ( invo lves GH before and after and KT ) KN ( involves DN before and after and KN ) DG ( invo lves DN and GH before and after and DG )
gt0 9 5 each variable = Code 2 gt 1 0 each var iable = Code 3
( e ) Check the s pe c t ral integral s for unusual rat i o s to the corresponding broadband so lar radiat ion value
IT ( Broadband va lue before and after )
For d i rect s pe c t ra lt 0 6 or gt0 8 5 I T = Code 2 For gl obal s pe c t ra lt0 7 o r gt0 95 I T = Code 2
For d i rect and g l obal s pec t ra lt0 5 or gt l O IT = Code 3
5 1
TR-35 13A
We sugge s t that users of the data ba s e develop a computer program to acc e s s fields i n the Q C l ine and t o print the me s sages Thi s l imi ted qua l i ty cont rol wi l l not f lag a l l po s s ible errors and addi t i onal t e s t s should be applied depend ing on the users requi rement s and appl icat i on s
52
1 1 2
Document Control SEAl Report No
Page 4 Title and Subtitle
NTIS Accession No 3 Recipients Accession No SERI TR- 2 1 5-35 13A DE89009447
5 Publication Date
January 1990 Sp ectral Solar Radiation Data Base Documentation
6Vo lume I
7 Author(s) 8 Performing Organization Rept No
9 Performing Organization Name and Address 10 ProjectTaskWork Unit No
1 1 Contract (C) or Grant (G) No
(C)
(G)
1 2 Sponsoring Organization Name and Address 13 Type of Report amp Period Covered
Solar Energy Res ear ch Ins titute Technical Repor t 1 6 1 7 Col e Boulevard Golden Colorado 804 0 1-3393 1 4
1 5 Supplementary Notes
16 Abstract (Limit 200 words) The Solar Energy Research Ins titute ( SERI) Electric Power Research Ins titute Flor ida Solar Energy Center and Pacific Gas and Electric Company cooperated to produce a spec tral solar radiation data base representing a range of atmospheric conditions These data will help to characterize the natural variab ility in the spectral (color) content o f outdoor solar radiation so that the sensitivity of spec trally selective solar devices ( such as photovoltaics ) to these variations c n b e s tudied quant itatively Volume I o f this report documents the history approach content and format of the data base Volume II contains graphs and field no tes for each of the spectral data sets The data res ide on magnetic tape at SERI
1 7 Document Analysis
a Descriptors Spec tral solar radiation broadband solar radiation met eorological
data sp ectroradiometers
b IdentifiersOpen-Ended Terms
c UC Categories
233 234
18 Availabil ity Statement
National Technical Information U S Depar tment of Commerce 5 285 Port Royal Road Springfield Virginia 2 2 1 6 1
Service 19 No of Pages
60
20 Price
A04
Form No 0069 (6-30-87)
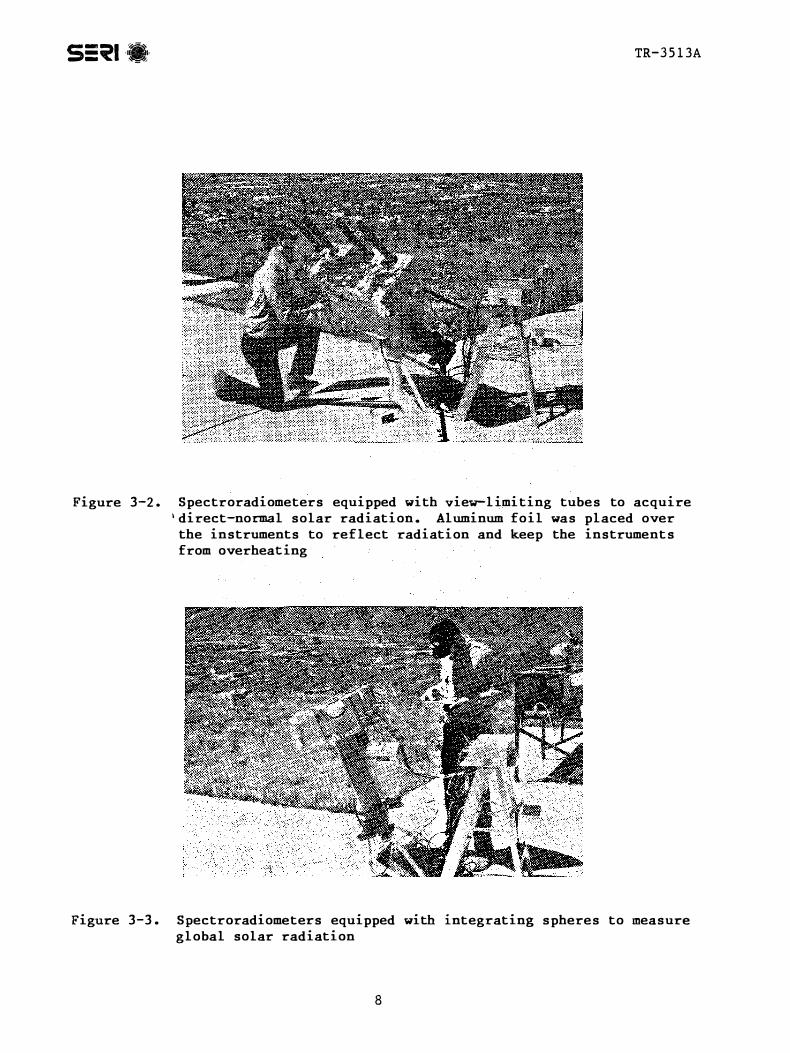
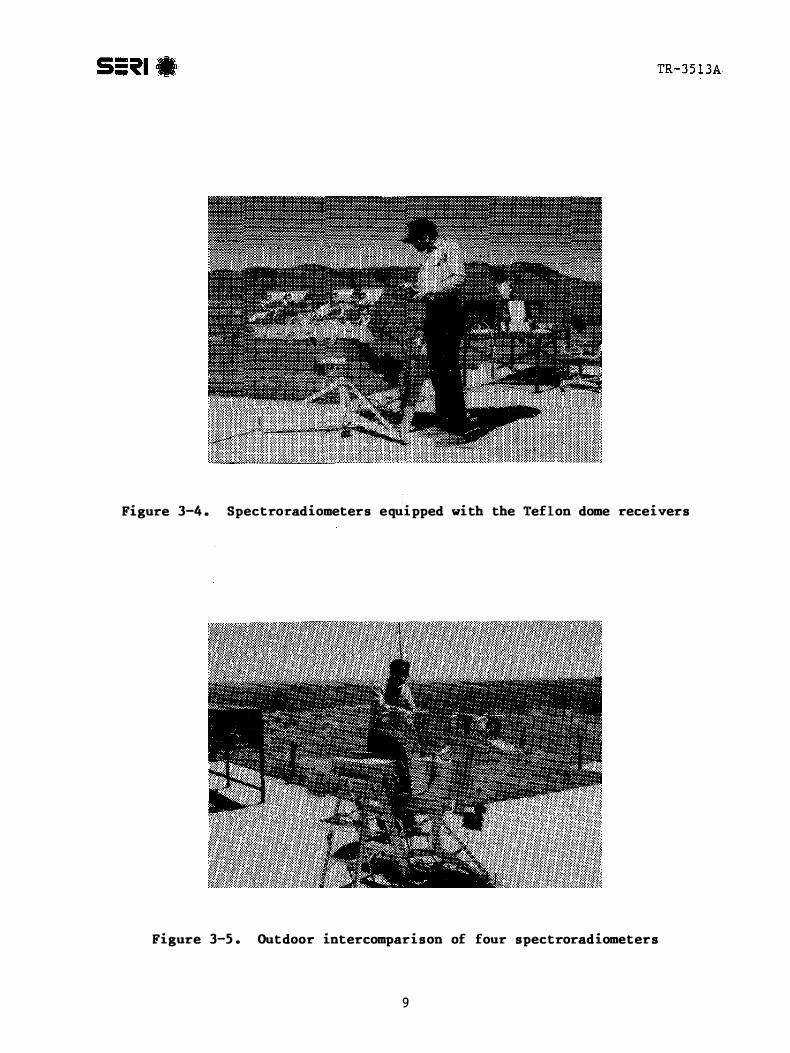
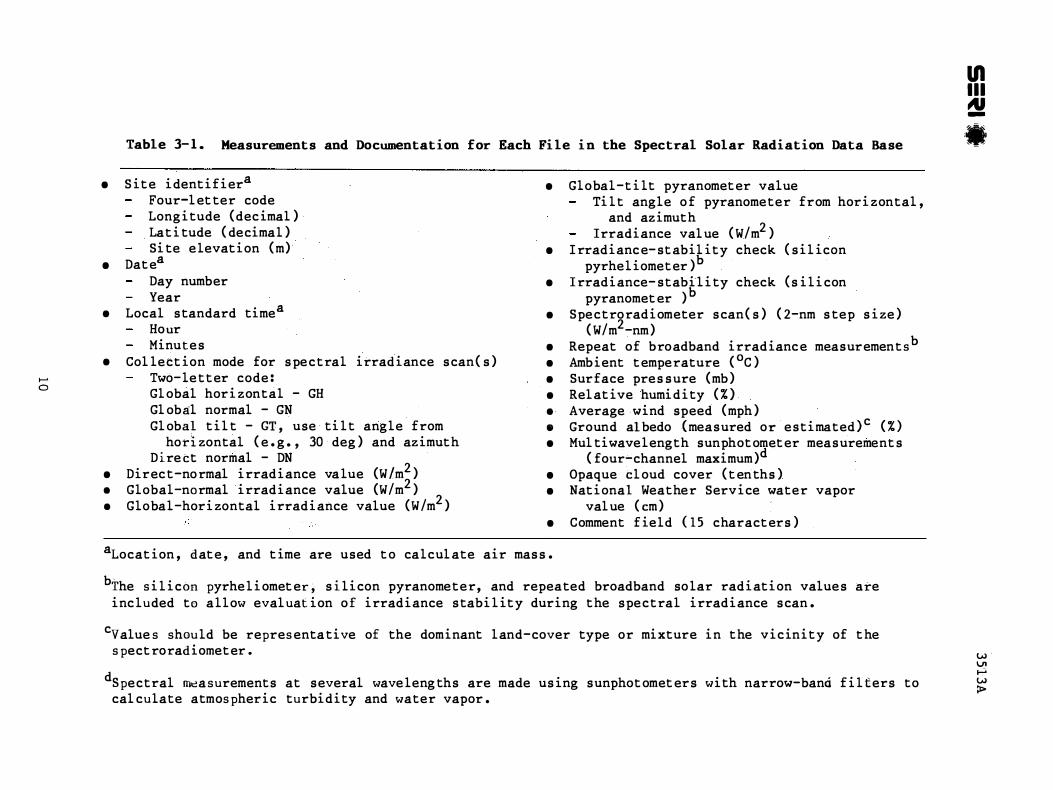
I
Table 3-1 Measurements and Documentation f or
bull Sit e identifiera
Four-l et ter code Longitude ( decimal) Latitude ( decimal)
bull Site
Dat e a elevation ( m)
Day number Year
bull Local standard timea
Hour Minutes
bull Col lection mode for spectral irradiance scan( s) t-0
Two-le tter code Gl obal horizontal - GH Gl obal normal - GN Gl obal til t - GT use
horizontal ( e g 30 Direct normal - DN
til t angle from deg) and azimuth
bull Direc t-no rmal irradiance va lue (Wm2)bull Global-normal irradiance value (Wm2)bull Global-horizontal irradiance value (Wm2)
IllN-Each File in the Spectral Solar Radiation Data Base -
bull Global-tilt pyranomet er value Til t angle o f pyranometer from horizontal
and azimuth Irradiance val ue ( Wm2)
bull I rradianc e-st abil ity check ( silicon pyrheliomet er)b
bull Irradiance-stability check (silicon pyranomet er )b
bull Spectroradiometer scan( s) ( 2-nm step size) ( Wm2-nm)
bull Repeat of broadband irradianc e measurement s b
bull Ambient t emperature (degC) bull Surface pressure (mb) bull Rel ative humidity ( ) bull Average wind speed (mph) bull Ground albedo (measured or estimated)c ( )bull Mul tiwavelength sunphot omet er measurements
( four-channel maximum)d
bull Opaque cl oud cover ( t en ths) bull National Weather Service water vapor
val ue ( em) bull Comment field (15 charact ers)
aLocation dat e and time are used t o calcul ate air mass
bThe silicon inc luded to
pyrhe liomet er1 silicon pyranometer and repeated broadband so lar radiation values allow eval uation of irradiance stability during the spectral irradiance scan
are
cValue s should be repres enta tive of the dominant land-cover type or mixture in the vicinity of t he s pect roradiomet er
dspectral m a surements at several wave leng ths are made using sunphot omet ers with narrow-band filters cal culate atmos pheric turbidity and water vapor
to
VJV1VJtgt
TR-35 1 3A
measured on til ted surfaces and ground-to-sky reflec tions ( especial ly under cl oud cover) Wind speed and ambient temperature were recorded because they may be useful along with the spectral data to predict collector perforshymance The broadband and met eorological sensors were maintained and calishybrat ed by the measurement sites as documented in Sec tion 5
Broadband solar radiation measurements were made immediately ( within 15 s) before and after the spec t ral solar radiation scan to allow evaluation of atmospheric stability at the time of the scan In addition the datashyacquisition software was designed so that global-horizontal solar radiation was sampl ed six times during the spectral scan using a silicon-detector pyrashynome t er if global solar radiation varied by more than 2 the spec tral scan was not recorded Three attempts were made to acquire a spectral scan during unstable c onditions ( such as partly cl oudy skies) I f a scan was not obtained after three t ries the broadband and meteorological data were recorded and then the data acquisition system waited until the next regularly scheduled data acquisition time ( usually an hour) to attempt another spectral scan Because o f the stability monitoring during the spectral scans wemiddot believe there are very few cases when the spectral scan was acquired during variable solar radiation conditions We found three examples of distorted spectra ( see Figure 3-6) that possibly were caused by unstabl e conditions
Software to test the atmospheric stability and acquire the data in a specific format was integrated into the field operations by FSEC and PGampE The format included fields for sit e identification date and time broadband solar radiashytion values atmospheric data spectral solar radiation data and comments In addition an instrument deampcription and configura tion file was stored for each data fil e
The data acquisition software was designed to accept manual ly entered data from sunphot ometers cl oud-cover estimates and Nat i onal Weather Service preshycipitable water vapor measurements However the personnel instruments and measurements were generally not available to enter these data each hour at the measurement sites
The schedule for dat a coll ection was fl exible to accommodate individual site requirements and constraints The goals which were accomplished were to collect data over at l east one year at each sit e t o capture seasonal variashytions and to cover a wide range of atmospheric conditions for each measurement configuration
Measured spec tra and supporting data were sent to SERI on fl oppy disks from PGampE and on magnetic tape from FSEC Daily log sheets that describe the specshytroradiomet er operation and operator comments were included with the data Al l-sky photographs c orresponding to many of the FSEC spectral data sets were provided by the FSEC Fenest ration Energy and Illumination Performance Research Program ( Figure 3-7) Al l-sky photographs were also taken for each of the SERI spec tral data sets ( Figure 3-8) A camera system was installed at PGampE late in the data col l ec tion period but no photographs are available
At SERI the data were processed through an interactive quality-control proshycedure during which the data were visually inspected for obvious probl ems First the inst rument configuration file ( see exampl e in Figure 3-9) was examined against a t emplate from the previous data set to check for any inst rument changes or a change in the mode of opera tion After the operator
l l
middot 400
01+--+----+--+--
U1Ill-25 0Day No 205 1987 (a) 1= 25 Day No 319 1987 (b)Oslash a -E c Nc
N 0 IDistorted direct-normal E CJ bull= m
E 15 Distorted direct-normal spectrum 15 spectrum at 10316 cl
Q)Q) 00 c co c 056 g 105
shy t -
300 500 700 900 1100 300 500 700 900 1100 Wavelength (nm)Oslash Wavelength (nm)
Day No 319 1987 Day No 319 1987 25 1200 (c) (d)Distorted global normal spectrum E ltilc at 10316 E_
N E 800 15 Q) 0 Q) c Direct0 Global tilt c normalco Global6 056 co
horizontal
300 500 700 900 1100 6 8 12 14 16 Wavelength (nm) Time
Figure 3-6 Examples of the very few distorted spectra in the data base (a b c) Broadband solar radiation data (d) corresponding with the spectra in b and c show that irradiance was decreasing at 1031 due to partly cloudy conditions JOIwU11-w
xgt
S5 llifl TR-3 5 1 3A
Figure 3-7 Example Qpound all-sky photographs acquired at FSEC These photog aphs proviGed evidence f rain possible condensation oa optics and ducls
Figure 3-8 Example of all-sky photograph acquired at SERI with a disk blocking sun to show diffuse sky conditions
13
---middot---------middot---------middot---------middot---------middot---------middot---middot --middot---------middot--------middot
TR-3 5 1 3A
t(OK P 11 buy this) Press [Helpl for help
CHN PARAHETER +-------INSTRUHENT----------+ +--CALIBRATION-+ OUTPUT rom NO TYPE HAICER TYPE SERIAL FACTOR- DATE --UNITS NOTES
1 Dir NorR Eppley NIP 17828E6 680 11-187 WRA2 2 Clo NorR EPPLEY PSPH 17863F3 811 11-187 WRA2 3 Glo Horz Eppley PSP 17863f3 811 11-187WfRA2 ltl Glo Tilt EPPLEY PSPT 17863F3 811 1-187 RA2 5 Dir N Si Unused Unused Unused -9900 -1-1-1 WRA2 6 ARb TeRp TAYLOR HGGLASS 00718C LOO 11-187 Deg C 7 Surf Pres OBSERVER ELEVATION RIORDAN -9900 -1-1-1 Hillibar atilde8 Rei HuR DC DIGITAL XXXXXC 100 -1-1 1 Percent 3 9 Wind Spd OBSERVER OBSERVD STOFFEL -9900 -1-1-1 KetersS 3
10 I Albedo Unused Unused Unused -9900 -1-1-1 Percent 11 Phot 380 S TEIC SUNPHOT SPH7624 66300 10-184 Countamp 3 12 Phot 500 SOHOTEIC SUNPHOT SPH7524 77500 10-184 Counts 3 13 Phot 860 SOHOTEIC SUHPHOT SPH7524 45700 10-184 Counts 3 14 Phot 942 SONOTEIC SUNPHOT Unused -9900 -1 1-1 Codnts 1 15 Opq Cloud OBSERVER OBSERVER STOFFEL 100 -1-1-1 Tenths 16 H20 NWS NWS SONDE STAPLETON 100 -1-1-1 CR 17 Spect 11 LICOR LI1800 PRS158 100 9-187 Wsq RlnR 2 18 Spect 12 Unused Unused Unused -9900 -1-1-1 Wsq RnR 19 Glo H Si LICOR SIPYRAN PY1245 811 11-187 WRA2
Figure 3-9 Example of the instrument configuration data -eeorded with the measured data J-middot middot
approved the configura t i on tabl e the template was updated and the informat ion was wri t ten to the data base
Figure 3-10 shows an-exampl e of the comput er terminal output dur ing the cond step o f the qua l i ty-control session
The informa t i on displayed ( see c i rcled nu bers in Figure 3-10) inc luded the foll owing
1` Si te dat e day number standard t ime lati tude l ongi tude and number o f attempts to acquite the spectrum as cont ro l l ed by the atmospher i c stab i l ity monitor
2 Plot o f the spectrum with the mode of operat ion printed bel ow the plot
3` Indicat ion o f stabi l i t y based on the before-scan and after-scan me iureshyment of gl obal-horizontal solar rad iat ion from the iil i con pyranome t er ( although the measurements by thi iiJtrument ciuring the _scaq are actual l y used to test f o r atmospheric stability)
4 Graphic descr i p t i on o f the az imuth and zenith angles of the sun
14
y I
r
ijn 2PR
1100300
II I -
38 50
94
-99
l
IlIllN
lt ltX) Softwa re by M Rymes 0
2 t N AFT BEF a DN 864 863
0 1K SN 852 852 reg A GH 1007 1005 8 SH 984 981 I GN 1089 1088
IL GT 924 920
DN SN GH SH GN GT T Azimuth Zenith reg T 27 c
679 9132 1019 mb V1 RH 73
0 reg ws 4 ms AL 136 Wm2
-99 Co -99 Co
86 -99 Co -99 Co
cc -99 wv
110 mm
300 Di r Norm Glo Norm 1100 FSEC 051387 (Day 133) 1030 2840N 8060W 1 tries G)
terminal output during a quality-control session o--3Figure 3-10 Example of the computer lt1 wV1 wgt
I
TR-3 5 1 3A
5 Bar graph of the before-scan broadband measurements of direct-normal ( thershymopile detec t o r ) DN direct-normal ( silicon detec t or ) SN global-horizontal ( thermopile ) GH gl obal-horizontal ( silicon ) SH gl obal-normal ( thermopi l e ) GN and global-til t ( thermopile ) GT solar radiation The darkened bar graphs show the integral of themiddot spectral middotso lar middotradiation llm))(0 3-11 which is printed under the bar graph Before-scan and after-scan broadband values are printed to the right of the bar graph
6 Listing of the supporting data The first five values are t emperature T pressure PR relative humidity RH wind speed WS and ground-reflected solar radiation AL used for albedo calculations The remaining fie l ds were not used for this data base and were included for future data col lecshytion projects
This quality-control process was performed short ly after the data arrived a t SERI to flag obvious field probl ems The operator could add comments to the data fil e after viewing the information in Figure 3-10 The software also calculated atmospheric descriptors such as Kt and then the data and descripshytors were writ t en to the data base Quantitative qua lity control was applied iu the post-processing of the data base ( described in detail in the appendix )
We chose to include all data in the data base and to be as specific as posshysible about the measurement uncertainty rather than set stringent criteria for excluding data sets This allows users to select data based on their specific application and accuracy requirements or to use portions of the damiddotta sets such as broadband datamiddot or spectral solar radiation segm(nts None of middot
the data should be used without referencing the measurement uncertainty
16
40 CONTENTS OF THE DATA BASE
A t otal of 3 364 spectral data sets ( 16 Mb) are included in the data base
bull 1 4 1 5 Direc t normal
bull 899 Global normal
bull 542 Gl obal horizontal
bull 455 Global tilt
bull 5 3 Dif fuse
I f the data acquisition systems were operating but the atmospheric conditions were too unstable to record a spectrum the broadband and meteorol ogical data were inc luded in the data base but no quality-control processing was applied
FSEC normally operated two spectroradiometers simultaneously one in the direct-normal mode and the other in one of the global modes PGampE operated one spectroradiometer and rotated through the different measurement modes SERI collected direct-normal global-horizontal and dif fuse-horizontal specshytra mostly during cl oudless-sky conditions
Examples of the spec tra are shown in Figures 4-1 through 4-5 Figshyure 4-1 ( a b) shows examples of spectra measured at FSEC in the direct-normal and global modes on a clear day As air mass increases the direct-normal spectra ( a) shift toward longer wavelengths ( the red end o f the spect rum) The global spectra ( b) are slight ly l ess affec ted by the red shift because the radiation scattered out of the direct beam is added back int o the gl obal spectra as diffuse radiation thus returning a portion of the short-wavel engt h ( blue) radiation Figure 4- l ( c) shows the broadband solar radiation corresponding to the spectra
Figure 4-2 shows exampl es of spectra measured under cloudy skies The directshynormal spectra ( a) are almost zero and the global-til t spectra (b ) have low values The graph o f corresponding broadband solar radiation ( c ) shows nearly zero direct normal the global values approach each other becausemiddot all of the irradiance is diffuse under cl oudy skies
Figure 4-3 shows examples of spectra measured on a partly cl oudy day The graph also shows an exampl e of data dropout during data transfer The shape of the spec t ral curve is quite diff erent for low-intensity spec tra measured under cl oud c over ( 10 3 1 air mass 1 88 13 3 1 air mass 1 7 3 ) versus the lowshyintensity spec t rum at higher air mass values ( 1 6 3 1 air mass 5 48 )
Figure 4-4 shows two exampl es of spectra that appear to correspond with sun reflections o f f of clouds which causes a bright spo t [ 1 7 ] and a focusing effect on the solar radiometers The broadband solar radiation values can actually approach or exceed the extraterrestrial value of about 1 3 3 8 on day number 1 3 2 1 3 3 The global solar radiation values approach each o ther while the direct-normal radiation drops indicating that the solar disk is partially blocked by c l ouds
1 7
25 Ec
C1E 1 5
Q)()cctS0 05ctS
Day No 53 1 988 1ico(a) Direct Normal Spectra 0931 to 1 631 ()lt(OJ
00 500 700 900 Wavelength (nm)
EcE
Q)()cctS
0ctS
25
1 5
05
Day No 53 1 988 Global Normal Spectra
931 to 1 631 (b)
300 500 700 900 1 1 00 Wavelength (nm)
1 200 Day No 53 1 988 (c)
cJE
800 Q)()cctS 4000ctS
Global tilt
Global horizontal
0 6 8 1 0 1 2 1 4 1 6 1 8
Time
Figure 4-1 Examples of a) direct-normal and b) global-normal spectra and c) broadband solar radiatio n measured at FSEC o n a clear day
18
0+-+--+-f=t-=F==F==t=P=T==t--+-===+----f
TR-35 13A
- 20 E
Clc E
1 0 Q)()sect 0
300 500
- 20 E
C1c E
1 0 Q)()c laquoS 0laquoS = 00
300 500
1 200
ClE
800 Q)()c -C 400 laquoS
0 6 8
Day No 273 1 987 Direct Normal Spectra
831 to 1 231 (a)
700 Wavelength (nm)
900 1 1 00
Day No 273 1 987 Global Tilt Spectra
831 to 1 231 (b)
700 Wavelength (nm)
900 1 1 00
Day No 273 (c)
middot Global no rmal Global tilt Global horizontal
1 0 1 2 Time
1 4 1 6 1 8
Fi gure 4-2 Examples of (a) direct-normal and (b) global-ti lt spectra and (c) broadband solar radi ation measured at FSEC on a cloudy day
19
I
EcCl
25
E 1 5
Q)()cctl 05
Day No 353 1 986 Global Normal Spectra
Wavelength (nm)
Day No 353 1 986
Fi gure 4-3 radi ati on (lower) measured at FSEC on a partly cloudy day The
-ClE Q)()cctl
1 200
800
400
0
Time
lilobal normal
8 1 0 1 2 1 4
Global horizontal
16 1 8
TR-3 5 1 3A
Examples of global-normal spectra (upper) and broadband solar
spectrum at 1631 shows data dropout duri ng data transfer
Figure 4-5 shows examples o f d i rect-normal gl obal-hor izontal and d i f fuseshyhorizontal spec t ra measured by SERI The di ffuse radi a t i on is most ly concenshytrated in the short-wavelength ( visible) region of the spect rum ( blue sky) The global-ho r i zontal spectrum is equal t o the direct-normal spec t rum mul t i shypl ied by the c osine o f the zenith angle plus the diffuse spec tral radiat i on
The cumula t i ve number o f these spec t ra versus air mass the atmospher i c descriptors Kt Kn DGH and rel at ive humi dity are shown 1n Figshyures 4-6 ( a-f ) The large number of spec t ra at low air mass values is caused by t he opera t i on of the spect roradiometers dur ing normal working hours at midshylat itudes and by the larger air mass values oc curring near sunr ise and sunset whi ch occupy a relat ively smal l frac t i on of the day The large number o f spec tra duri ng relat ively c l ear sky conditi ons i s due t o sdec t i on of clear days for the data taken at SERI the requirement for atmospheric stability during spectral scans and perhaps cl imate types at the three sites Figshyure 4-6 ( c ) shows tha t relat ive humi dity measurements were missing for about 25 global-normal spectra The dif fuse spec tra assoc iated wi th DGH rat i os near 1 0 indi cate very clear condi t i ons where dif fuse measurements are probably within the measurement uncertaint y
20
1200I -
u a
Wmmiddot2)1 I
v+--+--
˜
middot (a) (b) Global normal
(c) Global horizontal (1403
15
InIllDay No 132 19 7 Day No132 1987
Global Normal Spectra 900 to 1 63 0-- 25
clra -Ec bat horizontal Global tilt cJ
N E 800 15 - Q cbull
g 400ctl red - 0 5 ctl I
0 300 500 700 900 11 00 6 8 1 0 12 14 16 18
Wavelength (nm) Time
Day No133 1987 Day No 133 198V
Global normal Global Normal Spectra N 730to 1430 2 5middot Glob tilt
(d) Ec
E 1000
- 500 gctl ctlmiddot- 0 5 -g 1
300 500 700 900 11 00 6 8 1p 12 14 16 18
Wavelength (nm) Time
igure 4-4 Examples pound solar spectra enhanced by cloud bright spots (a) at 1031 on day 132 and (c) at 1230 on day 133 and correspondin [(b) and (d) re pectively] broadband solar radiation J
w111wgt
I
OlDay No 328 1987 0
(a) r1052to 1231 ltt-- 2 5 0
E CDc )E Direct Normal
1 5 Q)C)cro5 05ro
300 500 700 Wavelength (nmr
900 1100
- 25 Ec
E 15
Q)C)cro5 05ro=
Day No 334 1987 1222to 1508
Direct Normal
(b)
300 500 700 900 1100 Wavelength (nm)
Figure 4-5 Examples of direct-normal global-horizontal and diffuseshyhorizontal spectra measured by SERI on two days
Inc luded on the data tape are daily f i eld notes qua l i t y control informa t i on and measuremen t uncertainty Thi s informat i on alert s the user t o problems such as data dropout s ( a s seen in Figure 4-3) and noise in the spectrum (Figshyure 4-7 ) Thi s informa t i on should always be revi ewed when any s pectraL data s e t s are u sed
Phot ographs or s l i de s corre sponding to many of the spectral data s e t s are avai lable at ERI The daily f i eld no t e s that are inc luded wi th the dat a base document the exi s t ence and qual ity of the pho t o s slides
2 2
--------I-
J v l----
r
---
_rV I--
I v
f-
v
I II
I I
___ v -
---- --
I )
-I
v --- --------v f-----
40
TR-3 5 1 3A
LO Direct Normal Spectra vs Air Mass Global Normal Spectra vs Air Mass i40
30ct1E -
lt( 20
1 0 0 400 800 1 200 1 600
40 - -middot 30coE lt( 20
1 0 0 200 400 600 800
ltlil
Number of spectra Number of spectra
Global Horizontal Spectra vs Air Mass Global Tilt Spectra vs Air Mass
40
UJUJco_E -
30 bull
lt( 20
30 coE -
lt( 20
1 0 1 o
Diffuse Spectra vs Air Mass
0 1 00 200 300 400 5000 200 400 600 Number of spectra Number of spectra
40
coE lt(
30
20 bull
1 0 0 1 0 20 30 40
Number of spectra 50
23
I )
v 1-
I--v
( I
)
v --1------I--__
1 I
--l---
If 1
v 1---1-
-_ I---
l u
-----
v I I
----f--e--r-----
I If-
1--- middot
---
100
60
20
Direct Nermal Spectra vs Kn
0 400 800 1200 1600
100
60
0
Direct Normal Spectra vs Kt
400 800 1 200 1600
TR-35 13A
Number of spectra Number of spectra
Figure 4-6 (b) The cumulative number of spectra (horizontal axis) measured over a range of air mass and atmospheric descriptors (vertical axis)
100
60I
20
Direct Norma Spectra vs DirGH
400 soe 1200 160CJ Number of spectra
Direct Normal Spectra vs Rei Hum
6 100
- 60sQ)gt
g 20Q5a 0 400 800 1200 1 600
Number of spectra
c
100
60
20
0
Global Normal Spectra-vs Kn
300 600 900 Number of spectra
Globa Normal Spectm vs DirGHtOO
I 60
20
0 300 600 900 Number of spectra
Global Normal Spectra vs Kt 100
602
20-
0 300 600 900 Number of spectra
Global Normal Spectra vs Rei Hum 100
6E) 60s Q)gt
Q5 20a
a 300 600 900 Number of spectra
Figure 4-6 (c) The cumulative number of spectra (horizontal axis) measured over a range ofmiddot air mass and atmospheric descriptors (vertical axis)
24
f--f--
-I
lJ
1--f-- v
I 1
f--f-
v
1------
1--
( j
---
--
( I
J
1--- -
v
) -----
(
l) __---
v I
1 00
c 60
20
1 00
I 60Q0 20
Global Tilt Spectra vs Kn
0 1 00 200 300 400 500
Global Tilt Spectra vs Kt
Number of spectra
Global Tilt Spectra vs DirGH
Number of spectra
0 1 00 200 300 400 500 Number of spectra
0
1 00
60
20
0 1 00 200 300 400 500
1 00 2-5EE 60 Q)gt-Qi 20a
Global Tilt Spectra vs Rei Hum
1 00 200 300 400 500 Number of spectra
Figure 4-6 (d) The cumulat ive number of spectra (horizontal axis) over a range of air mass and atmospheric descriptors (vertical axis)
Global Horizontal Spectra vs Kn 1 00
c 60
20
0 200 400 600
1 00
60sz
20
Global Horizontal Spectra vs Kt
200 400 600
TR-35 13Amiddot
measured
Number of spectra Number of spectra
Global Horizontal Spectra vs Global Horizontal Spectra vs DirGH Relative Humidity
0
1 00
I 60G
20
0 200 400 600 Number of spectra
0
2-1 00 5EE 60 Q)gt
Qi 20 a
middot
200 400 600 Number of spectra
Figure 4-6 (e) The cumulative number of spectra (horiz ontal axis) measured over a range of a1 r mas s and atmospheric descriptors (vertical axis )
2 5
v-L-
1-----lr--f-
_ v
I
_J7 r
----
v -
_ 1----
___ ---f--
II (
I
r r-[--
r
v---
- 25
1 5
Diffuse Spectra vs Kn 80
70
c 60
50
0 1 0 20 30 40 50
TR-35 13A
Diffuse Spectra vs Kt 85
2 65
75
1 0 20 30 40 50
Number of spectra Number of spectra
Diffuse Spectra vs DirGH Diffuse Spectra vs Relative Humidity
0 1 0 20 30 40 50 0 1 0 20 30 40 50 Number of spectra_ Number of spectra
95 middotE 50
75 Qi 1 0
70
5J
c 30
secta -
Fi gure 4-6 f ) The cumulati ve number of spectra hori zontal axis) measured over a range of air mass and atmospheri c descri ptors verti cal axis)
1 05
r 85
EclE
Clluc m =g
300 500 700 900 1 1 00
05
Day No 2 1 6 1 987 Global Normal Spectra
730 to 1 5 30
Wavelength (nm)
Fi gure 4-7 Exampl es of spectra showi ng noisy data i n the ultravi olet 300shy400 nm) and near-inf rared 1000-1 100 nm) regions
26
5 0 MEASUREMENT UNCERTAINTY
( No t e Thi s s ec t ion contains only a brief summary o f the total uncertainty The deta i l ed reports [ 1 5 1 6 ] on the methods used to e s t imate tota l spect ra l measurement uncertainty should he consul ted- when using thi s datamiddot middot ba se )
The data set de scribed in thi s document i s the bes t set of measurement s posshys ible wi th the personnel equipment methods and cal i brat i on procedure s avai l able t o us We found that making continuous measurements wi th complex s ens i t ive equipment and account ing for all source s o f error in order to specify total mea surement uncertainty were not triviaL tasmiddotkamp oo
The e s t imat ed total uncertainty ( 95 confidence int erval ) for each of the spec troradi ometers and each of the measurement modes is shown in Figure 5-l The upper and l ower spec tral uncertainty limi t s are symmetrical except when gl obal-t i l t or gl obal-hori zontal s pectra were measured us ing the integrat ing sphere and when a s t rong direct-beam component wa s present ( Kt gt 6 0 ) We added an 8 maximum bias to the l ower uncertainty l imi t s for these cases based on resul t s o f experimen t s in whi ch we mapped the integrat ing sphere res ponse under bri ght sun wi th the image o f the sun in di f ferent locations on the ins ide of the sphere During the se exper iment s we observed variat i on s o f up to -8 compared t o the calibrat i on point
The high uncertainty in the abso lute value o f the spectral measurement s l e s s than 0 45 m wa s caused by l ow s pectra l irradiance for the calibrat i on l amp s which resul ted in a l ow s i gnal-t o-no i s e rat io for the spec troradiorriet er cal i shybrat ions ( F igure 5-2) In add i t ion we experienced a change ( i e l o s s o f respon s e ) i n the ultraviolet ( UV ) re sponse of the instruments when us ing the integrating sphere s
To tal uncert ainty i s a combinat i on o f an e s t imated total spectral bias error and to tal spec tral random error The f inal est imated total uncertainty for a 95 conf idence interval i s calculated as the
random (R) error root- sum-s quare of the bias ( B)
erro r plus two t ime s the
To eva luate instrument-to-instrument d i f ferences or variabi l i ty ( al s o called between-inst rument prec i s i on ) s imul t aneous spectral solar radiat i on s c an s were made wi th each ins t rument in each conf igurat i on The s tandard devi a t i on of the se mea surement s mul t i plied by three was converted to a percentage o f the mean Thi s percent age ind icates the expected instrument-to-instrument varibi l i t y or prec i s i on for thi s set of instrumen t s Fi gure S-3 shows the resul t s obtained for one o f these compari sons us ing the integrat ing s phere s Simi lar resul t s oc cur wi th the other conf igurations The between-inst rument prec i s i on above 0 4 m i s close to 5
Temperature control o f the spe ro adiorrieters with s i l icon detectors wa s import ant Figure 5-4 shows the change in the res pori se o f the instrumen t s espec i a l ly in the near- infrared when o perated at d i fferent control temperashyture s Uncertainty of l deg C in the set point resul t s in about a 2 uncertainty in the near-inf rared measurement s On ho t days we found that the t emperat ure
2 7
(
-Lower
r --
I IV
limityen(-)
-
A u1pp r li it +) f I II I
y 1 I rl ( I _ L
-
-
I I )
f--+- -+--+--1-+---+--1- r--J- Upper -c- A I u o t-iE $ == $= =$S y I I I I t (
1 --( -
----L---------------------- -_j_j_J__J__J__J
TR-35 1 3A
20
c(ij 0tQ)ucJ -20
Global (Sphere) 1 02 1 58 1 74
limit (-) Kt lt 60 Upper limit ( +)
Lower Kt gt 60
(a)
20
c(ij 0t
5 -20 L t )ower 1m1 -
300 500 700 900 1 1 00
Wavelength (nm)
Global Normal (Domes) 1 74 2 1 8 (b)
300 500 700 900 1 1 00 Wavelength (nm)
Direct Normal 1 58 1 72 1 74 (c) 20
limit ( +)gt- iQl u Lower 1m1 -) 5 -20
300 500 700 900 1 1 00 Wavelength (nm)
Figure 5-l Estimated total spectral measurement uncertainty f or global measurements with the i ntegrating spheres on (a) units number 102 158 and 174 (b) global-normal measurements with the Teflon dome receivers on units 174 and 218 and (c) directshynormal measurements with the view-limiting tubes on units 158 172 and 174 The measurement uncertainty is synmetrical except in (a) where a -8 bias is included in the lower limit f or global-horizontal and global-tilt cases due to nonunif orm sphere response when a str ong direct-beam component is present
28
I I
0
0 (J) ()
- 1 0
t U
TR 35l3A
Wavelength (nm)
Figure S-2 Comparison of the spectral intensity of an out door global-normal measurement and the NIST calibrationmiddotmiddot lamp source L ow lamp values below 400 nm result in high measurement uncertainty
20
1 5
R 1 0
X 5Q)0c c 0
-5 Q)_0
300 400 500 600 700 800 900 1 000 1 1 00 Wavelength (nm)
Figure S-3 Between-ins trument precis ion for glo bal-normal spectral solar radiation measurements us ing the integrating spheres
29
5 1 deg C N
ij0
()00- caQ)uc
1 000 Q)-Q) 8 0950 0ca
c 0900
0 300 500 700 900 1 1 00
Wavelength (nm)
Figure 5-4 Ratio of the spectroradiometer detector response at different temperatures to the response at 40deg C
o f the detectors ( contro l l er s ) somet imes exceeded the set point and we experienced runaway temperatures Thi s resul ted in ampl i f i er mi l l ivolt drift errors and no i s e in s ome o f the s pectra We achieved better t emperature conshytrol by shield ing the spectroradiometers with Mylar sheet s supported by foam offsets to allow air flow
Mea surement uncertainty for the broadband and meteorological data i s based on the cal ibration hi s tories provided by the mea surement s i t e s and charact ershyi s t i cs of the instrument s Thi s information is given in Tables 5-l through 5-3 and the values are included on the data-ba se tape
In these table s the measurement uncertainty for a 95 confi dence int erval was e s t imated by root-sum-s quaring the est imated bias errors a d by doubl ing the random errors in the cal i brat i on proce s s and measurement s [ 15 1 6 ] Radishyometers used at PGampE in 1987 were po st-cal i brated at SERI allowing e s t imate s of the random calibrat i on error component the radi ometers used i n 1988 were cal ibrated elsewhere so nominal e s t imated errors were used in the uncertainty analys i s Ins t rument s used at SERI were pre- and po st-cal ibrated at SERI Instrument s used at FSEC were cal i brated by FSEC and nominal values for random and bias errors for the s e types of radiometers were used in the uncershytainty analys i s Cal i brat i on informat ion for the meteorological instrument s i s included i n these tables but no mea surement uncertainty analys i s was performed
30
H 11 VI _ w
Jgt
--
IllIll
Tabl e 5- l FSEC Instrument Calibrat ion Hi story Ul d Estimated Meas urement Uncert ainty N-
Es timated Beg i nn ing Calibrat ion Measurement
Channe l iF Meas urement Instrument Comment s Time Stamp Date Uncertainty
( )
1 Direct normal 862961507 Eppley NIP 14306 E6 5-86 ( thermopi l e ) 863520931 Epp l ey NIP 23943E6 12-86 plusmn2 9
8801 2093 1 Eppl ey NIP 23943E6 12-87 1 32 change
2 Global normal 862961507 Eppl ey PSP 24185F3 Eppley PSP 24185F3 1 1-86 1 6 7 change plusmn3 8
872881032 Eppley PSP 18273F3 4-87 880120931 Eppley PSP 24185F3 1 2-87
3 Globa l hori zontal 862961507 Eppl ey PSP 1 43 2 1 F3 4-86 ( thermopi l e ) 8709 3 1 6 3 1 Eppl ey P S P 14322F3 1 2-87 -- plusmn3 8
w _ 872881032 Eppley PSP 143 18F3 4-87
4 G lobal t i l t 86329103 1 872881032
Eppley PSP 24183F3 Eppley PSP l4320F3
1 1-86 4-87 -- plusmn3 8
880120931 Eppley PSP 24183F3 1 2-87
5 D irec t normal 8629 6 1 507 Mat r ix NIP3826 9-86 ( si l i con) 88012093 1 Matrix NIP3826 12-87 1 32 change plusmn2 9
6 Temperature 862961507 Weathermeasure 1 7 7
1420A 6-86 3-87 8-88
smal l changes the cal ibratiqft factor was changed i software
7 Pressure 86296 1507 Weathermeasure 1 70 5 1-86 smal l c anges the 1 7 8 5-87 cal ibra t i on factor was
Hmiddot 6-88 changed i n software
8 Relat ive humi dity 8629 6 1 5 0 7 Weathermeasure 1 54 0 6-86 Cal culated from dew 175 point compared every
o ther week wi th another instrument
9 Wind speed 862961507 Weathermeasure 1 222 7-86 smal l chlnges the 1219 3-87 cal ibrat i o fac tor was ---
6-88 changed in software
J
-
Ill _-
bull I
Table 5-l FSEC Instrument Calibrat ion Hi stb y and Estimated Measurement Uncertainty (Concluded)
Channel Measurement Beginning Time Stamp ihsttument Cal ibrat ion
Date Comment s
Estimated Measurement Uncertainty
( )
INN
10 Albedo 86329103 1
87288103 2
Eppley PSP 1629 FJ Eppley PSP l 106Srl
1 1-86
4-87
-- plusmn3 8
19 Global hori zontal
( si l i con)
862961507
87 148143 1
LI-COR Py PY22J6 LI-COR yt PY2279
7-86
5-87
plusmn3 8 --
Mo wV11-wgt
I
--
p V1 1-
--
--
--
UlIllN-
Tabl e 5-2 PGampE Ins trument Calibrat ion Hi s ory and Estimated Measurement Uncertainty 1 _
Estimated Beginning Pre- Po st-Channe l if Measurement Instrument Comment s Mea surement
Time S tamp Cal ibra t i on Cal ibrati on Uncertainty ( )
l D irec t normal 87 1 100632 Eppl ey NIP 255 08E6 1-86 8-88 0 3 change plusmn2 8 ( thermopi l e ) 880190 752 Eppl ey NIP 255 10E6 12-8 7 -- plusmn3 6
2 G lobal normal 87 1 100632 Eppl ey PSP 2 32 02F3 1-86 8-88 1 7 change plusmn2 4 880190 7 5 2 Epp l ey PSP 23996F3 12-87 -- -- plusmn4 7
3 G lobal hori zontal 8 7 1 1 00632 Eppley PSP 23995E3 10-84 8-88 3 2 change plusmn2 8 w w
( thermopi l e ) 880190 752 Eppl ey PSP 25390F3 12-8 7 plusmn4 7
4 G lobal t i lt 8 7 1 1 00632 Epp l ey PSP 25387F3 12-84 8-88 0 2 change plusmn3 8 -- plusmn4 7 880190 752 Eppley PSP 23201F3 12-87
5 D irec t normal 8 7 1 100632 Matrix NIP 38Hi 5-86 7-88 2 7 change plusmn2 2 ( si li con)
6 Temperature 8 7 1 1 00632 Omega T-coupl e
7 Pres s ure 8 7 1 1 00632 Yel l ow Springs 2014-22 3 1 -HA- 1-WH 15593 3-84
8 Relat ive humi dity 87 1 100632 Hygr o 14276 2-85
9 Wind speed 8 7 1 1 00632 8804007 3 7
Weathert ronics Weathertron i c s
2301 230 1
184 184
9-82 2-88
10
19
Albedo 8 7 1 1 00632 Eppl ey PSP 2 1235F3
Globa l hori zont al 87 1 100632 LI-COR Pyr PY5558 ( s i l i con)
Beginning about 8 7 2 1 1 the s i l i con NI P va lues appear cons i s tent ly l ow
-- 8-88 2 4 change
1 1-83 8-88 1 9 change
may be an al ignment problem
plusmn2 6
plusmn2 6
gt-3 Iw
wgt
-- --
--
-- --
1ftIll -
Table 5-3 SERI Instrument Calibration Hi story and Estimated Measurement Uncertainty =
Estimated Beginning Pre- Post-Channel I Measurement Instrument Comment s Measurement Time S tamp Cal ibration Cal ibration Uncertainty ( )
1 Direct normal 87328 Eppley NIP 1 7828E6 11-87 2-88 1 5 7 change plusmn3 3 ( thermopil e )
2 Global normal None
3 bull Global horizontal 87328 Eppley PSP 1 78 63F3 1 1-87 2-88 2 22 change plusmn3 7 ( thermo pi l e ) a t Welby
w+- At SRRL 8805 7 Eppley PSP 200 79F3 7-87 8-88 0 7 3 change plusmn2 3
4 Global t i l t None
5 Direct normal None ( si li con)
6 Temperature 87328 Taylor Pocket 21430-1 10-86 (Due 10-9 1 )
7 Pressure Cal culated from elevat ion
plusmn0 2 (deg )
8 Relat ive humidity 87328 Dickson 86 100-1 9-87 10-88 -- plusmn2 ( counts )
9 Wind speed Observat ion
10 Albedo -- None
1 1-14 -- Sun photometer ( relative compari sons only)
15 Cloud c over Observed o-3-- lXlIw Global Ho rizontal -- LI-COR Pyr PY1245 11-87 2-88 3 67 change plusmn2 9 V119 ( si l icon) ( s tabi l i ty monitor only) wgt
TR-35 13A
We urge users of the data ba se to refer to the dai l y f i eld no tes for s pe c i a l c i rcumstances recorded b y the operator that may affect data uncertainty The s e no tes include references to the spectroradiometer t emperature c onshyt ro l l e r solar-tracking accuracy and weather cond i t i ons ( such as rain ) Included in the dai l y notes on tbe data-base tape are obs ervat i ons made in qual i t y-control processing as wel l as references to the exi s t ence and qual i t y o f pho t ographs or s l ides
Quant i tat ive pos t-proces s ing qual i ty-control informat i on i s al s o inc luded on t he data-bas e tape and a complete descript ion is given in the appendix o f thi s report Redundant measurement s ( such as before- smiddotcan andmiddot middot aft et-smiddotcan
broadband solar radiat i on direct-norma l and global-hor izont al mea surement s with both thermopile and s i l i con detectors ) and compar i s ons o f integrat ed s pectral so lar radiat ion wi th broadband s o lar radiat i on were used in the qual i ty-control procedure s Users are encouraged to perform the i r own qual i t y-cont rol proce s s ing on the data t o meet their par t i cular requiremen t s
3 5
6 0 FORMAT OF THE DATA TAPE
The meas ured dat a f i eld notes quali ty-control informa t i on and mea surement uncertainty are s t ored on magne t i c tape in 80-character l ines wi th the fi leshyname s given in Table 6- 1 The f i l enaming convent ion used for the mea sured data was
Filename Content
FLA8705 DAT FSEC data 1987 May PGE880 l DAT PGampE data 1988 January SER8 7 1 1 DAT SERI data 1987 November
Data were not acqui red in a l l months so the months may not be cont iguous
Qua l i t y-control informa t i on has the same f i l enaming conven t i on with QC extens ion ( for example FLA8 705 QC ) Dai ly notes are contained in the f i l e s FSEC NOTES PGE NOTES and SERI NOTES respec t i vely The mea surement uncershytainty is in the UNCERT f i l e s
c The DAT f i l e s contain two types of informa t i on D for data and for inst rument configurat ion The f i r s t l ine of a data or confi guration segment beg ins wi th a D or a c re spect ively in the f i r s t column followed by the s i t e year day and t ime stamp the number of l ines in the segment i s in column-s 76-80 so that the user can eas i ly skip the de s i red number of l ine s An example of the information in the conf iguration or 1 1C segment i s
c shown in Figure 6-1 I t begins wi th a followed b y the s i t e FSEC year 11 1 98 7 day 122 and t i me u0830 latitude longi tude and eleva t i on There are 19 channel s for mea surement s zero s pectra in the C segment and 40 l ine s in the segment The con f i gurat ion informa t i on appear s whenever the inst rument set-up or cal ibrat ion wa s changed or t he data acqui s i t ion sys t em wa s res tarted I f the configurat i on wa s not changed at the beginning of the month the configura t i on segment wi l l be in the previous mont h s DAT f i l e
An examp le of a D segment i s shown in Figure 6-2 Thi s segment contains the mea s ured me teoro logical dat a broadband and spectral solar rad i a t i on dat a and anc i l l ary data The data contained in each l ine and column and i t s format are as follows
POS ITION OF VARIABLES IN THE D SEGMENTS (ALL LINES ARE 80 CHARACTERS )
Line Column Cont ent s Format
a = character 1 = integer f = f l oat ing point
LINE 1 1 1 D ( for data ) ( a l ) 3 1 5 Site Year Day Number Time Stamp ( a 1 3 )
3 6 F SEC PGampE o r SERI ( a4 ) 7 8 Year (a2 or i 2 ) 9 1 1 Day Number ( a3 o r i 3 ) 1 2 15 Standard Time ( a4 o r i4 )
36
5-111 - il ll
Da i ly
Uncertainty
-
TR-35 13A -
Table 6 1 Namesmiddot of Files on the Data Tape
Measured and
FSEC
FLA8610 DAT FLA8 6 1 0 QC
FLAB 6 1 1 bull DAT FLA8 6 l l QC
FLA86 1 2 DAT FLA8 6 1 2 QC
FLA8 7 0 1 DAT FLA8 70 l QC
FLA8 704 DAT FLA8 704 QC
FLA8 705 DAT FLA8 7 05 QC
PGampE
PGE8 704 DAT PGE8 704 QC
PGE8 705 DAT PGE8 705 QC
PGE8 706 DAT PGE8 7 06 QC
PGE8 7 0 7- DAT PGE8 7 0 7 QC
SERI
SER87 l l DAT SER8 7 l l QC
S ER8 7 1 2 DAT SER8 7 1 2 QC
SER880 1 DAT SER880l QC
SER8802 DAT SER8802 QC
Ca lcui a t ed Data
FLA8 706 DAT FLA8 706 QA
FLA8 7 0 7 DAT FLA8 7 0 7 QC
FLA8 7 0 8 DAT FLA8 7 0 8 QC
FLA8 709 DAT FLA8 7 09 QC
FLA8 7 1 0 DAT FLA8 7 1 0 QC
FLA8 7 l l DAT FLA8 7 l l QC
PGE8 708 DAT middot
PGE8 708 QC
PGE8 7 0 9 DAT PGE8 709 QC
PGE8 7 l l DAT PGE8 7 l l QC
No t e s
FSEC NOTES PGampE NOTES SERI NOTES
Mea s urement
FSEC UNCERT PGamp E UNCERT SERI UNCERT
FLA8 7 1 2 DAT FLA8 7 1 2 QC
FLA880l DAT FLA880l QC
FLA8 802 DAT FLA8802 QC
FLA8803 DAT FLA8803 QC _
FLA8804 DAT FLA8804 QC
PGE_880l DAT PGE880l QC
PGE8802 DAT PGE8802 QC
PGE8803 DAT PGE8803 QC
3 7 _middot
1 3
1 7
55 1 1-1 TR-3 5 1 3A
0 G) 0 G)G) iC FSEC8 7 1 2 2 0 8 1 3 2 8 4 0 0 0N 80 6 0 0 0W 2M C = 8 7 1 2 2 0 8 1 3 8 7 1 2 2 0 8 1 3+0 0 0 0 0 0 1 9 0 4 0
CHN PARAMETER +- - - - - - - INSTRUMENT- - - - - - - - - -+ +- -CALIBRATION- + OUTPUT FOOT NO TYPE MAKER TYPE SERIAL FACTOR DATE UNITS NOTES
1 Di r- Nor-m Eppley NIP 2 3 9 4 3E6 6 08 1 2 - 186 Wm2 2 Glo Nor-m Eppley PSP 2 4 1 85F3 8 85 l l - 186 Wm2 3 G l o Hor-z Eppl ey PSP l 4 3 2 2F3 6 3 8 1 2 - 2 86 Wm 2 4 Glo Tilt Eppley PSP 2 4 1 83F3 8 9 9 l l - 186 Wm2 iacute5 Dir- N S i MATRIX SI NIP 3826 31 8 0 9 - 186 Wm2 6 Amb Temp WTHRMEAS PRT 1 7 7 l 0 0 3 - 1 8 7 Deq c 7 Sur-f Pr-es WTHRMEAS PIEZO 1 7 8 l 0 0 5 - 1 8 7 Mi l l ibar-8 Re1 Hum WTHRMEAS LiCl 1 7 5 l 0 0 6 - 1 86 Per-cent 9 Wind Spd WTHRMEAS OPT CHOP 1 2 1 9 l 0 0 3 - 1 8 7 Met e r- s i S
1 0 Albedo Epp ley PSP l 6 2 9 7F3 1 0 0 9 l l - 1 8 6 Per-cent l l hot 380 Unused Unused Unused - 9 9 0 0 - 1 - l - 1 Counts iacute1 2 hot 5 0 0 Unused Unused Unused - 9 9 0 0 - 1 - l - l Count s
14 hot 860 Unused Unused Unused - 9 9 0 0 - 1 - 1 - 1 Counts hot 942 Unused Unused Unused - 9 9 0 0 - 1 - l - l Counts
1 5 Opq C loud Unused Unused Unused - 9 9 0 0 - 1 - l - l Tenths 1 6 H2 0 NWS Unused Unused Unused - 9 9 0 0 - 1 - l - l em
Spect l LI -COR L I - 1 8 0 0 PRS - 1 7 2 l 0 0 2 - 1 8 7 W sq m nm l Spect 2 L I - COR L I - 1 800 PRS - 1 0 2 1 0 0 2 - 1 8 71 8 W sq m nm l
1 9 Glo H Si LI -COR L I - 2 0 0S PY2 276 8 4 5 7 - 1 86 Wm2 2 - 1 FIN
FOOTNOTES
1 - 1 7 = DN 18 = GT 2 - SERI l oan un i t
- 1 - FIN
Figure 6-1 Example of the instrument configuration data on the data base tape The numbers refer tmiddotO
1 c indicating configuration 2 FSEC 1987 Day 122 at 8 13 standard time 3 Latitude 4 Longitude 5 Ele vation 6 Reference to configuration file that will be f ound in the
data files 7 Starting data-acquisition time plus number of attempts to
acquire spectra (which would extend the data acquisition time)
8 Number of data channels 9 Number of spectra ( 0 f or configuration files 1 or 2 f or
data files) 10 Number of lines in this segment
38
TR35 1 3A
D FSEC8 7 1 2 2 0 8 1 3 2 8 4 0 0 0N 8 0 6 00 0W 2M C=871 2 2 0 8 1 3 8 7 1 220 814+0 0 0 1 0 0 1 9 2 1 0 0 gS e e Q N FSEC8 7 1 2 2 U PRS - 1 7 2 Col 2 ( + - ) U PRS - 1 0 2 Col 2 ( - ) Col 4 ( + ) 1 7 84 5 5 7 54 5 2 9 3 0 2 - 1 - 9 9 0 3 48 0 1 1 9 48 3 3 4 4 2 7 9 - 1 -9 9 0 1 7 85 0 5 7 5 5 7 2 9 3 0 4 - 1 - 9 9 0 3 4 8 1 1 1 9 4 85 3 4 43 0 1 - 1 - 9 9 0 2 8 4 1 80 0
1 0 9 5 4 1 5 - 99 0 7 1 0 1 7 8 6 2 0 7 8 7 5 8 9 1 5 - 1 - 9 9 0 - 1 - 9 9 0 iacute1 1 3 80 0 - 99 0 Co 1 2 5 0 0 0 - 99 0 Co 1 3 860 0 - 99 0 Co 1 4 942 0 - 9 9 0 Co iacute
- 1 6 0 7 1 5 8 5 7 8 5 6 7 1 58 3 86 9 1 9 9 1 8 7 - 9 0 0 - 9 0 0 - 9 0 0 - 9 0 0 - 9 0 - 9 0 3 1 1 7 4 0 1 3 0 0 1 1 0 0 2 0 57 9 8 9 4 0 0 DNT1 8 4 0 1 3 0 0 1 1 0 0 2 0 2 8 4 1 8 0 0 6 2 4 GTS - 1 0 0 0 0 0 0 0 0 0 0 0 - 1 0 0 0 o o 0 0 0 0 o o
1 3 0 0 0 0 0 0 0 0 3 5 0 0 0 4 0 0 2 1 0 02 5 0 0 14 0 04 1 0 02 1 0 0 5 7 0 0 3 8 amp 1 3 2 0 0 0 7 2 0 056 0 1 0 1 0 0 8 1 0 1 1 8 0 1 2 1 0 1 1 9 0 140 0 138 0 1 3 1 amp 1 340 0 1 4 9 0 16 1 0 162 0 1 5 5 0 16 0 0 1 6 3 0 1 8 5 0 1 9 5 0 1 9 8 0 1 9 9 amp 1 360 0 2 0 9 0 2 1 9 0 228 0 2 4 3 0 258 0 26 5 0 258 0 265 0 268 0 2 89 amp 1 380 0 2 8 0 0 2 7 9 0 26 7 0 2 7 3 0 3 0 1 0 3 08 0 3 1 7 0 326 0 349 0 4 0 2 amp 1 4 0 0 0 4 7 6 0 52 7 0 55 7 0 569 0 580 0 5 9 5 0 6 12 0 63 0 0 64 1 0 648 amp 1 4 2 0 0 652 0 6 54 0 6 58 0 649 0 6 36 0 6 3 2 0 646 0 67 8 0 7 1 8 0 746 amp 1 440 0 7 6 8 0 7 9 9 0 82 2 0 854 0 8 7 7 0 9 0 4 0 9 1 5 0 92 2 0 934 0 94 2 amp 1 460 0 9 6 0 0 964 0 9 7 0 0 9 7 3 0 96 9 0 9 74 0 9 9 0 0 9 9 9 1 0 1 7 1 028 amp 1 4 8 0 1 0 3 3 1 0 25 1 0 0 6 0 9 9 1 0 9 9 0 1 0 1 0 1 026 1 0 3 8 1 043 1 0 4 7 amp 1 500 1 0 3 8 1 034 1 038 1 0 5 1 1 0 58 1 058 1 0 5 1 1 0 3 5 1 0 1 7 1 0 0 7 amp 1 520 1 0 2 0 1 04 1 1 0 5 7 1 063 1 068 1 0 8 1 1 088 1 0 9 3 1 0 9 3 1 0 9 1 amp 1 540 1 0 8 9 1 0 84 1 088 1 0 9 5 1 0 9 7 1 0 9 5 1 0 9 8 1 1 0 2 1 094 1 0 8 7 amp 1 560 1 0 7 8 1 0 7 9 1 08 1 1 0 7 7 1 0 7 2 1 0 7 1 1 0 7 6 1 0 7 8 1 0 7 8 1 0 82 amp 1 580 1 0 9 0 1 0 9 8 1 1 0 1 1 088 1 0 7 4 1 062 1 06 1 1 06 7 1 0 7 4 1 0 80 amp 1 6 0 0 1 082 1 085 1 08 8 1 0 9 2 1 0 9 3 1 0 89 1 083 1 0 7 8 1 0 78 1 0 7 9 amp 1 620 1 0 8 2 1 083 1 0 7 6 1 065 1 0 5 9 1 056 1 06 1 1 0 7 3 1 0 8 0 1 085 amp 1 640 1 0 86 1 084 1 08 1 1 0 7 6 1 067 1 062 1 0 5 2 1 04 2 1 038 1 048 amp 1 660 1 0 7 0 1 086 1 0 9 4 1 0 9 7 1 0 96 1 096 1 09 2 1 0 9 3 1 0 9 1 1 0 89 amp 1 680 1 0 7 9 1 064 1 02 8 0 9 8 0 0 94 3 0 9 3 7 0 954 0 98 0 0 9 9 6 1 0 0 5 amp 1 7 0 0 1 0 0 8 1 0 0 9 1 0 1 3 1 0 1 9 1 0 2 5 1 0 2 2 1 0 0 3 0 9 7 3 0 924 0 8 74 amp 1 7 2 0 0 846 0 842 0 84 8 0 84 9 0 8 54 0 8 7 8 0 9 0 3 0 9 3 1 0 9 52 0 965 amp 1 740 0 9 6 9 0 9 7 7 0 98 3 0 989 0 988 0 9 8 2 0 9 7 6 0 95 0 0 8 81 0 7 6 7 amp 1 760 0 6 1 6 0 5 24 0 54 0 0 646 0 7 7 9 0 8 76 0 924 0 94 5 0 94 7 0 9 45 amp 1 7 8 0 0 94 2 0 94 2 0 9 3 7 0 9 2 6 0 9 1 6 0 9 0 7 0 89 9 0 894 0 8 9 1 0 89 0 amp 1 800 0 888 0 883 0 8 7 9 0 87 5 0 863 0 836 0 8 0 1 0 7 5 7 0 7 2 2 0 7 1 0 amp 1 820 0 7 1 0 0 7 1 9 0 7 3 3 0 74 1 0 7 4 9 0 7 5 7 0 76 3 0 7 7 7 0 7 9 7 0 8 1 0 amp 1 840 0 82 0 0 82 8 0 82 7 0 82 2 0 8 1 5 0 7 9 7 0 786 0 7 83 0 7 8 8 0 7 9 7 amp 1 860 0 80 4 0 8 0 0 0 7 8 8 0 7 8 0 0 7 7 5 0 7 8 0 0 7 8 7 0 786 0 785 0 7 81 amp 1 880 0 7 7 5 0 7 7 4 0 7 7 2 0 767 0 763 0 7 4 7 0 72 1 0 68 2 0 6 30 0 5 88 amp 1 9 0 0 0 57 1 0 5 7 3 0 58 9 0 584 0 568 0 549 0 53 4 0 53 3 0 5 38 0 5 56 amp 1 9 2 0 0 5 7 3 0 57 9 0 56 7 0 526 0 448 0 362 0 2 7 2 0 2 18 0 2 1 0 0 2 32 amp 1 940 0 254 0 262 0 2 5 7 0 253 0 25 7 0 266 0 2 7 5 0 2 85 0 29 9 0 3 1 7 amp 1 960 0 3 33 0 362 0 3 9 6 0 4 3 5 0 4 7 9 0 5 06 0 5 1 5 0 5 1 2 0 5 08 0 5 2 1 amp 1 9 8 0 0 53 7 0 560 0 5 84 0 5 9 7 0 6 0 9 0 6 1 7 0 6 1 8 0 6 2 3 0 62 1 0 6 1 9 amp 1 1 0 0 0 0 6 1 8 0 6 0 7 0 6 0 5 0 6 0 2 0 60 1 0 60 5 0 6 04 0 604 0 604 0 6 0 1 amp 1 1 0 2 0 0 60 1 0 59 5 0 5 9 5 0 5 93 0 589 0 59 0 0 584 0 5 82 0 580 0 5 75 amp 1 1 0 4 0 0 5 7 6 0 5 7 1 0 57 1 0 56 7 0 56 0 0 56 0 0 558 0 552 0 545 0 54 0 amp 1 1 0 6 0 0 5 36 0 53 2 0 5 2 9 0 5 2 5 0 5 1 9 0 5 1 5 0 5 1 2 0 51 1 0 50 9 0 5 08 amp 1 1 0 8 0 0 50 6 0 502 0 4 9 2 0 48 3 0 48 3 0 483 0 46 9 middot 0 4 5 2 0 447 0 3 1 amp 1 1 1 0 0 0 4 1 1 - 9 9 0 0 0 - 9 9 0 0 0 - 9 9 0 0 0 - 9 9 0 0 0 - 9 9 0 0 0 - 9 9 0 0 0 - 9 9 00 0 - 1 582 3 2 2 3 0 0 0 0 0 6 0 0 0 1 0 0 0 4 0 0 1 3 0 0 1 9 0 0 2 3 0 04 1 0 0 5 5 0 064 0 088 amp 2 3 2 0 0 1 0 5 0 1 3 9 0 1 7 9 0 1 8 9 0 2 2 4 0 2 38 0 26 2 0 252 0 261 0 2 64 amp 2 340 0 2 8 7 0 2 9 2 0 266 0 2 88 0 2 98 0 286 0 3 0 0 0 3 0 0 0 2 9 1 0 2 85 amp 2 360 0 296 0 3 1 0 0 3 36 0 367 0 3 9 0 0 3 7 2 0 3 56 0 356 0 3 7 3 0 3 88 amp
Figur e 6-2 Examples of the data on the data-base tape
3 9
TR-3 5 1 3A
16 2 3 24 24 2S 3 3 34 34 3S 3 9 40 40 4 1 S 2 S4 69
54 62
6 3 6 3
6 7 6 7
7 0 7 3
74 7 S
7 6 80
LINE 2
LINE 3
1 3 4 10
1 1 1 3 14 20 2 1 23 24 30 3 1 40 4 1 43 44 SO 5 1 5 3 54 60
Lat i tude ( deg ) N ( north) Longi t ude ( deg ) W ( we s t ) `Elevat i on (m) M (m) Reference t o Conf i guration Segment Start ing year day t ime for the spectral `scan s ) i f any and number of attempt s t o `acquire the s can ( which ind i cates po s s ible `t ime delay from the s tart ing t ime ) middot
Year Day Number Time
11+11 for plus number of attempt s to acquire a s pect rum
Number o f attempt s t o acquire a s pectrum
Po s s ible Number o f Measurement s ( 1 9 )
Number o f Spec tra i n thi s Segment ( 0 1 or 2 )
Number o f Lines in Segment
Pointer to the qua l i ty-cont rol dai ly f i e ld note s and measurement uncertainty informa t ion Qua l i ty-control informa t i on is in the QC f i l e of the same month wi th the same s i t e year day and t ime s t amp Dai l y field notes are i n the NOTES f i l e f o r the same s i t e wi th the same s i t e year and day s tamp Mea surement uncertainty i s in the f i l e s UNCERT under t h e instrument serial number ident i f i ed by PRS-xxx and the column s in the uncertainty f i le s for + and - uncertainty l imi t s
Broadband mea surement s before the spectral scan
Channel fH Direct Normal ( thermopi l e ) (Wm2 ) Channel ffoS Direct Normal ( s i l i con) (Wm2 ) Channel tn Global Normal ( Wm2 ) Channel not used Charinel ffo3 Globa l Hori zontal ( thermop i l e ) ( Wm2 ) Channel fH 9 Gl obal Horizontal ( s i l icon ) ( Wm2 )
( f 8 4 ) ( a 1 ) ( f 9 4 ) ( a l ) ( i S ) ( a l ) ( a l 2 )
( a9 o r i 9 )
( a 1 )
( i 1 )
( i4 )
( i 2 )
( i S )
( a8 0 )
( i 3 ) ( pound 7 2 ) ( i 3 ) ( pound 7 2 ) ( i 3 ) ( f 7 2 )
( i 3 ) ( pound 7 2 ) ( i 3 ) ( pound 7 2 )
40
TR-35 3A
6 1 6 3 64 7 0 7 1 80
LINE 4
LINE 5
1 6
7 1 2
1 3 80
LINE 6
1 3 4 1 0
1 1 1 3 1 4 20 2 1 23 24 3 0
3 1 3 3 34 40 4 1 43 44 5 0 5 1 5 3 5 4 6 0 6 1 6 3 64 7 0 7 1 7 3 7 4 8 0
LINE 7
LINE 8
1 5
6 1 2
Channe l 114 Gl obal Ti l t (Wm2 ) hellipChannel not used
Broad band mea suremen t s a f t e r t h e s p e c t ral s can same format a s beforeshy scan ( LINE 3 )
T i l t o f the f ixed- t i l t i n s t rument s hellipf rom the hor i z ont a l ( d eg )
Az i muth of the f i xed-t i l t ins t rumen t s ( de g ) ( 1 8 0 deg = s outh)
De s c r i p t i on o f any s pec i al i n s t rument ( fo r example d i ffu s e-hori zont a l mea s uremen t s a t SERI )
Channe l IFlOAl bedo (Wm2 ) hellipChannel IH5C l oud Cover ( t enths ) Channel fF7 Surface Pres sure ( mb ) Mea s ured at FSEC and PGampE c a l c u l ated from e l eva t i on a t S ERI [ 1 1 p 1 0 0 ]
Channel 116 Amb i en t Temperature ( deg C ) Channel fiB Rel a t i ve Humi d i t y ( ) Channe l ffo9 Wind S peed ( m s ) Add i t i onal channe l des cri bed 1n l i ne 5 Va l ue Add i t i onal channel descri bed 1n l ine 5 Va l u e
Sun Pho t ometer read ings ( only recorded for SERI dat a not u s ed except for re l a t i ve c ompar i s on s ) hellip
Earth-S un d i s tance c orrec t i on ( d e v i a t i on from 1 0 ) hellip
Ext ra t erre s t r i a l Rad i a t i on (Wm2 ) hellip
( i 3 ) ( pound 7 2 )
( f 6 1 )
( f 6 1 )
( a 8 8 )
( i 3 ) ( 7 1 ) ( i 3 ) ( 7 1 ) ( i 3 ) ( f 7 1 )
( i 3 ) ( pound 7 1 ) ( i 3 ) ( pound 7 1 ) ( i 3 ) ( pound 7 1 ) ( i 3 ) ( variabl e ) ( i 3 ) ( variabl e )
( f5 2 )
( f 7 1 )
4 1
9
42
TR-3S l 3A
1 3 1 8
1 9 24
25 30
3 1 36
3742
43 48
49 68
69 72
13 76
1780
LINE
I
3 6
7 1 1 1216 1 7 20 21 25
2631
3236
3839
40 40
41 42
43 46
Zen i t h Angl e ( deg ) ( f6 2 )
Kt ( ra t i o calculated from ( f6 1 ) thermo p i l e inst rument s )
Kn ( rat i o calculated from ( f6 1 ) thermo p i l e instrument s )
D GH ( ra t i o cal culated from thermopile instrument s ) ( f6 1 )
Albedo ( ) ( f6 1 )
Ai r Mas s ( f6 2 )
Res erved for Turbidi ty i f calculated
Precipi table Water Vapor i f calculated from sun photomet er
Precipi table Water Vapor from the ( f4 1 ) Nat ional Weather Servi ce
Prec i p i table Water Vapor Cal culated from Relative Humid i t y ( f4 1 )
Channel H7 Number o f Wave l engths Recorded by Spect roradi ometer 1
Beginning Wavelength ( nm ) Ending Wavel ength (nm) Wavelength Step Size (nm ) Spectroradi ometer 1 Ti l t from the Horizontal ( deg )
Spectroradiometer 1 Azimuth ( deg )
Angle o f Incidence o f the Direct Beam on Spectroradi ometer 1 ( deg )
Measurement Type ( DN GN GH GT DF )
Attachment ( Tef lon Dome D Integrat ing Sphere S View- l imit ing Tube T )
Channel H8 Number o f Wavel engths Recorded by Spectroradi ometer 2
( i2 )
( i4 )
( i S ) ( i S ) ( f4 1 )
( fS l )
( f6 1 )
( fS 1 )
( a2 )
( a l )
( i 2 )
(i4)
TR-3S l3A
4 7 S l Beginning Wavel ength (nm ) ( i S )
S 2 S 6` Ending Wavel ength ( nm ) ( i S )
S 7 60 Wavelength Step S i z e ( nm ) ( f4 bull 1 )
6 1 6S Spec troradi ometer 1 T i l t from the Hori zontal ( deg ) ( fS l )
6 6 7 1 ` Spect roradi ometer 2 Az imuth ( deg ) ( f6 1 )
7 2 76` Angle of Incidence o f the Direct Beam on Spect rorad i ometer 2 ( deg ) ( fS l )
7 8 7 9 Mea surement Type ( DN GN GH GT DF ) ( a2 )
8 0 80 At tachment ( Teflon Dome D Integrat ing Sphere s View-l imi t ing Tube T ) ( al )
LINE 10 Saved f o r extra spectroradi ometers i f needed
I f no spec tral data were recorded the number of l ines in the D s egment i s 1 0 the number of spectra i s 0 and there i s no corre sponding qual i ty-control information for thi s dat e t ime in the QC f i l e s No qual i ty c ontrol wa s performed because the atmo sphere was uns table I f the number o f spectra i s 1 there are 60 l ines in the D s egment i f there are two spectra t he number o f l ines i s 100
I f middot the number of spectra i s 1 or 2 the spectral data fol low after the f i r s t 1 0 l i nes o f the D segment There are 1 0 spectral measurement s per l ine wi th the number in the lef t-mo s t column indicat ing the f i r s t or second specshyt roradiometer ( 1 or 2 ) f o l l owed by the s tart ing wavelength ( in nanometers ) and t he 10 spectral mea surements ( in Wm2-nm) The 1 0 measurement s are at wave l ength inc rements of 2 nm There are 401 spect ral mea surement s from 300 t o 1 1 0 0 nm in 2-nm s teps with 10 measurement s per line for 40 l ine s and one measurement in the 4 1 s t l ine The l a s t number in the 4 1 s t l ine i s the specshytral integral I f a second s pectrorad i ometer wa s used the next 4 1 l ines folshylow t he same format Blank 1 ines follow the spec tral data t o f i l l the D segment to 60 or 100 l ines
An example of a QC f i l e i s shown in Figure 6-3 The f i r s t l ine o f each segment begins with a Q f o l l owed by the s i t e year day number and t ime s tamp with the number of l ines in the segment given in the l a s t col umn s o f the l ine Following the iden t i fier are me s sage s about var iables that were flagged by the automat i c qua l i ty-control proc e s s ing ( s ee appendi x ) noted by an operator at the measurement s i t e or noted dur ing inspec t i on at SERI The l a s t l ine of the segment shows the QC code for as DN ( direct normal thermopile detect o r ) SN ( d i rect normal detector ) AL
var iabl e s such s i l i con
( a lbedo ) and SP ( s pectrum) a s de s c r i bed in the appendi x Three qual i tyshycontrol code s ar8 used 1 = good 2 = suspec t see me s sages and dai ly not e s and 3 = poor or mi s s ing see me s s ages and da i l y no te s The broadband codes ( DN SN GN GH SH and GT ) have two value s the f i r s t is the before- scan measurement and the second is the after-s can mea surement
4 3
TR-35 13A
Q FSEC87 1 2 1 0 7 3 1 4 Noise in GH spectrum in UV QCDN1DN1SN1SN1GN1GN1GH1GH1SH1SH1GT1GT1AL1AP1PR1TC1RH1WV1WS1KT1KN1DG1SPl iN1SP2IN2
Q FSEC8 7 1 2 1 0 8 3 0 8 SN bef SN af t = 1 0 5 5 S H bef SH aft = 1 0 5 3 2nd Int BB b e f = 0 636 2nd Int BB aft = 0 6 5 1 Noise in GH spectrum i n UV QCDN1DN1SN2SN2GN1GN1GH1GH1SH2SH2GT1GT1AL1AP1PR1TC1RH1WV1WS1KT1KN1DG1SP1 IN1SP2IN2
Q FSEC8 7 1 2 1 1 0 3 1 3 QCDN1DN1SN1SN1GN1GN1GH1GH1SH1SH1GT1GT1AL1AP1PR1TC1RH1WV1WS1KT1KN1DG1SP1 IN1SPl iNl iacute
Q FSEC87 1 2 1 1 1 3 1 3 QCDN1DN1SN1 SN1GN1GN1GH1GH1SH1SH1GT1GT1AL 1AP1PR1TC1RH1WV1WS1KT1KH1DG1SP 1 IN1SP1 IN1
Q FSEC8 7 1 2 1 1 2 3 1 3 QCDN1DN 1SN1SN1GN1GN1GH1GH1SH1SH1GT1GT1AL1AP1PR1TC1RH1WV1WS1KT1KN1DG1 SP1 IN1SP 1 IN1
Q FSEC8 7 1 2 1 1 3 3 1 3 QCDN1DN1SNlSNlGNlGN1GH1GH1SH1SH1GTlGTlALlAPlPRlTClRHlWVlWSlKTlKNlDGlSP l iNlSPliNl
Q FSEC8 7 1 2 1 1 4 3 1 3QCDNlDNlSNlSNlGNlGNlGHlGHlSHlSHlGTlGTlALlAPlPRlTClRHlHVlHSlKTlKNlDGlSPl iN1SP1IN1 Q FSECB7 1 2 1 1 554 3 QCDNlDNlSNlSNlGNlGNlGHlGHlSHlSHlGTlGTlALlAPlPRlTClRHlWV1WSlKT1KN1DG1SP 1 IN1SP l iN1
Q FSEC8 7 1 2 1 16 3 0 3 QCDNlDNlSNlSNlGNlGNlGHlGHlSHlSHlGTlGTlALlAPlPRlTC1RH1WV1WSlKTlKNlDG1SP l iNlSPl iNl
Q FSECB 7 1 2 1 1 7 3 1 5 GH bef SH bef = 0 9 3 1 GH aft SH af t = 0 9 3 3 QCDN1DN1SN1SN1GN1GNlGH2GH2SH2SH2GTlGT1ALlAPlPRlTClRHlWVlWSlKTlKNlDGlSPl iNlSPl iNl
Q FSECB 7 1 2 2 0 7 3 1 3 QCDNlDNlSNlSNlGNlGNlGHlGHlSHlSHlGT1GTlALlAPlPRlTClRHlWVlWS 1KT1KNlDGlSP l iNlSPl iNl
Figure 6-3 Example of quali ty-control inf ormation on the data- base tape
Figure 6-4 shows an exampl e of a segment of the daily notes from the FSEC NOTES f i l e Each segment of the f i l e beg ins wi th an followed b y the s i t e year and day number s t amp with the number of l ines in the segment given in the last columns of the l i ne The next l ine contains the s i te operashytor log sheet number month day year day number spectroradi ometer serial number( s ) and mea surement mode( s ) The PGampE and SERI not e s do not include the dai ly l og sheet number The f i rst two l ines are followed by f i eld no te s No tes that were added after inspec t i on at SERI are s eparat d from the operator notes wi th ------- The exi s tence of s l ides or photographs i s ind i cat ed a s wel l a s their qua l i ty i e good ( G ) marginal ( M ) or poor ( P ) In the exampl e in thi s f i gure there were two log sheets for thi s day (number 1 1 6 and 1 1 7 ) because the mea surement mode changed from gl obal hor i z onshytal ( GH ) to global t i l t ( GT )
44
TR-3513A
N FSEC87 1 2 2 1 1 6 0 5 0 2 8 7 1 2 2 1 7 2 DN 1 0 2 GH Clear at 0 7 3 0 GH f o r f ir s t two s cans then GT S l i de s 0 6 3 2 G
0 7 3 3 G 0 8 3 3 G 0 9 3 3 H ( dark ) 1 0 3 3 p1 1 3 3 p1 2 3 3 p 1 3 3 3 p1433 H 1 5 3 3 G 1633 G 1733 G
1 1 7 0 5 0 2 87 1 2 2 1 7 2 DN 1 0 2 GT GT s tart ing at 0 8 0 0 iacuteC lear a t 0 8 0 0 iacuteS l ides S e e above
16 1 1 8 0 5 0 3 8 7 1 2 3 1 7 2 DN 1 0 2 GT Clear at 0830 S l i de s 0633 G
0733 G 0833 G 0933 H ( dark ) 1 0 3 3 p1 1 3 3 p 1233 p 1333 p1433 H 1533 G 1633 G 1733 G
N FSEC87 1 2 3
Figure 6-4 Examples of daily notes on the data-base tape
An example o f a segment of the measurement uncertainty file UNCERT CAL i s shown in Figure 6-5 The f i r s t l ine begins with a U followed by the serial number of the s pect rorad i ometer The upper and lower measurement uncertainty l imi t s are given in the co lumns fol lowing wavelength wi th the appropri a t e measur ement mode dat es and de script ion at the top o f the column The s econd l ine in each segment o f the DAT f i l e s is a pointer to the correct uncershytainty information in UNCERT CAL The broadband s o lar radiat i on and meteshyorolog ical instrument measurement uncertainty fol lows each spectra l measureshyment uncertainty segment in UNCERT CAL
The format o f thi s data ba se was es tabl i shed at SERI t o accommodat e expanded mul t i year long-term data collect ion Users can reformat the data t o suit their part icular needs We recommend the following s t eps for acce s s ing and document ing parti cular data set s
1 Se lect and extract the des ired spectral data from the DAT f i l e s us i ng in formation such as measurement mode day number t ime air mas s or a moshys pheric condi t ions depending on the de s i red attribut es
2 Ex trac t and review the corres ponding segment s of the qua l i ty-cont rol i n format i on from the QC f i l es
3 Ex trac t and review the corres pond ing field no tes from the NOTES f i l e s
4 5
+ I -
5 4
3 7
TR- 3 5 13A
U PRS - 1 0 2 L I -COR PRS - 1 0 2 i
1 2 3 4 5 Ill
Wav GHS GHS GHS GHS GTS GTS GTS GTS Kt gt 6 0 Kt gt 6 0 Kt gt 60 Kt gt 6 0 iacutel ower lower upper upper 2 8 7 - 8 8 7 -8 8 7 5 8 8 GNS GNS
upper upper lower l ower
+ 1 -
- GHS GHS GTS GTS Kt lt 60 Kt lt 6 0 upper uppe r l ower l ower + I - + I -2 8 7 - 8 8 7 -8 87 5 - 8 8
3 0 0 - 1 0 0 0 - 1 00 0 1 0 0 0 1 0 0 0 3 0 2 - 1 0 0 0 - 1 0 0 0 1 0 0 0 1 0 0 0
4 0 0 - 2 3 3 - 1 7 1 1 5 3 9 1 4 0 2 iacute -2 2 0 - 1 7 3 1 4 0 9 3
5 0 0 - 1 3 4 - 1 1 7 3 7 5 0 2 iacute - 1 3 3 - 1 1 7 5 3 3 7
6 0 0 - 1 1 8 - 1 1 1 3 8 3 1 6 0 2 - 1 1 9 - 1 1 1 3 9 3 1
7 0 0 - 1 1 5 - 1 0 7 3 5 2 7 7 0 2 - 1 1 3 - 1 0 7 3 3 2 7
8 0 0 - 1 1 6 - 1 0 6 3 6 2 6 8 0 2 - 11 7 - 1 0 6 3 7 2 6
9 0 0 - 1 1 2 - 1 0 5 3 2 2 5 9 0 2 - 1 1 4 - 1 0 8 3 4 2 8
1 0 0 0 - 1 1 7 - 1 0 8 2 8 1 0 0 2 - 1 1 8 - 1 0 8 3 8 2 8
1 1 0 0 - 1 2 9 - 12 2 4 9 4 2
Figure 6-5 Examples of spe ctral measurement uncertainty on the data-base tape A value of plusmn100 indi cates greater t han 100 measurement uncertainty
46
TR-35 13A
4 Extract the measurement uncertainty information from the 1 1 UNCERT f i l e s and quot e mea surement uncertainty for a l l data used
5 Examine the dai l y broadband and spec tral solar radiatio data graphs in the catalog ( Volume I I of thi s report [ 1 8 ] i f avai labl e These graphs provide informa t i on on atmo spheric condi t i ons during the day For exampl e Figure 4-3 shows dai l y broadband and spec tral plot s for part ly c loudy condi t i ons when s olar rad i a t i on i s changing rapidly throughout the day The sun i s obs cured when the direc t-normal values drop t o zero and the gl obal value s approach each o ther Figure 4-1 shows a clear daybull
No data should be used wi thout consult ing the qua l i ty-control informa t i on dai ly no tes and measurement uncertainty
4 7
Cel l s
Ce l l s
Energy
Meteorologi cal Society
Appl i ed Meteorol ogy
Energy
Radiat ion Topical Overview Solar Cel l s Vo l 1 8
of the Pho tovo l t a i c s and Insolat ion Mea sureshySolar Vol 1 8 1 986 pp 393-3 9 5
TR-35 1 3A
1 0 REFERENCES
1 Hul st rom R L Solar 1 986 PPbull 1 7 9- 1 8 7
2 Hul st rom R L A Summary ments Workshop Panel Resul t s
3 Hul strom R L Re sul t s of the Amorphous S i l i con Mea surement s Ta sk Force Solar Cel l s Vo l 18 1 986 pp 1 7 1-1 7 7
4 Hul strom R L and J M Ohi Resul t s of the SERI Mul t i junction Devi ce Efficiency Measurement Task Forc e pre sented at the 20th I EEE Photovo lshytaic Spec ial i s t s Conference September 1 988
5 Riordan c and R L Hul s t rom Summary of S tud i e s that Examine the Effec t s of Spect ral Solar Radition Vari at ions on PV Device Des ign and Pershyformance SERI-TR-2 15-343 7 Golden CO Solar Energy Research Ins t i tute 1989
6 Riordan c Joint EPRI-SERI Spectral Solar Rad i a t i on Database Pro j ec t
1
8
9
1 0
1 1
1 2
1 3
14
Solar Vol 2 1 1 98 7 pp 3 3 7-342
Riordan c D Myers M Rymes R Hul strom W Mar i on c Jenning s and c Whi taker Spectral Solar Radiat ion Data Bas e at SERI Solar Vol 42 No 1 1 989 PP bull 6 7-79
Riordan C J T L Stoffe l and R L Hul s trom The Effect s of Urban Air Pollut ion on Solar Radiat i on SERI-TR-2 15-3482 Golden CO Solar Energy Res arch I n s t i tute ( draft ) 1989
Riordan c and R Hul s t rom The SERI Re s ource As ses sment Project s Plan for Col l ect ing Spectral-Solar-I rradiance Data SERI -TR-21 5-2948 Gol den CO Solar Energy Re search Ins t i tut e 1986
Shaw G E Sun Pho tometry Bul letin Ameri can Vol 64 No 1 January 1983 pp 4-10
Iqbal M bull An Int roduction to Solar Radiation New York Academic Pre s s
1983
Bartel s R A Comment s on Prec ipi table Water Mea surement s with Sun Photometer s Journal of Cl imate and Vol 25 1 986 PP bull 1 788- 1 789
Leckner B The Spectral Distribution o f Solar Radiat ion at the Earth s Surface -- El ements of a Model Solar Vol 20 1 9 7 8 pp 143- 1 5 0
Cannon T W Spectral So lar Irradiance Instrumentat i on and Measurement Techniques Solar Cel l s Vol 1 8 1986 pp 2 3 3-24 1
48
Energy
Photogrammetric Engineering
TR 3 5 13A
1 5 Myers D R E s t imate s of Uncertainty for Measured Spec tra in the SERI Spectral Solar Radiat i on Data Base ac cepted by Solar 1 98 9
1 6 Myers D R E s t imates of Uncertainty for Measured Spectra in the SERI Spec tral Solar Radiat i on Data aa s e 11 SERI e_clmical Report Golden CO S o l ar Energy Res earch Ins t i tute ( draft ) 1989
middot
1 7 Hul s trom R L The Cl oud Bright Spo t 1 9 73 PP bull 3 7 0-3 7 6
18 Ri ordan c D Myer s and R Hul s t rom Spectral Scflar Raltfiation Data Base Documentat i on and User 1 s Manual Vo lume I I SERI-TR-2 15-3 5 1 3 Golden CO Solar Energy Re search Ins t i tut e 1989
49
TR- 3 5 1 3A
APPENDIX
QUALITY-CONTROL PROCESSING
Limi ted qua l i ty-control proces s ing wa s appl i ed to the data ba se as de s c r i bed below The resul t s are i n the QC f i l es on the data-base t ape by s i t e year and mont h For examp l e
FLA8705 QC i s FSEC 1 98 7 May PGE8 80 l QC i s PGampE 1 9 8 8 January SER8 7 l l QC i s SERI 1 98 7 November
These f i l e s correspond t o the 11 OAT f i les for the s ame s i t e year and month Each data segment that includes a spectrum wa s proces sed through thi s quali ty-control procedure I f the atmospheric cond i t i on s were uns tab l e and a spectrum was not acquired the broadband and meteorologi cal data were inc l uded on the data-base tape but no qua l i ty-contro l proc e s s ing wa s app l i ed
An example o f a segment of a 11 QC f i l e i s shown in F i gure 6-3 The f i r s t Q l ine beg ins wi th a fol l owed by the s i t e year day and t ime s tamp The
last columns give the number of l ines in the s egment so the user can skip to the next s egment Fo l l owing the f i r s t l ine are me s sages that were printed whenever the qua l i ty-control proce s s ing f lagged a suspect or poor value
Following the mes sages in an SO-character QC l ine l i s t ing the variables that were examined are one of three qua l i ty-control code s 1 good 2 marg inal or suspect and 3 mi s s ing or poor The QC l ine was prepared using an automa t i c ( computeri zed ) check of the variabl e s and manual edi t ing to include informashyt ion from correspondence l og sheet s and vi sual inspe ct i on Addi t i onal me sshysages were added above the QC l ine if appropriate
The two-charact er descriptors in the QC l ine are
DN Direct-normal ( thermopi l e ) solar radiat ion before the spectral s can DN Direct-normal ( thermopi l e ) so lar radiation after the spectra l scan SN Direct-normal ( s i l i c on ) before SN Direct-normal ( s i l i c on ) after GN Globa l-normal before GN Globa l-normal after GH Globa l -horizontal ( thermop i l e ) before
WS Wind Speed KT KKN K
t n
GH Global-hori zontal thermopil e ) after SH Global-hori zontal ( s i l i con ) before SH Global-hori zontal ( s i l icon ) after GT Global-t i l t before GT Gl obal- t i l t after AL Al bedo ( Wm ) AP Albedo ( ) PR Surface Pres sure TC Temperature ( deg C ) RH Relat ive Humi dity WV Water Vapor ( al culated from rel a t i ve humidity)
5 0
S- flllit = - ( middotmiddot middot
( e g Wm2 )
TR-3 5 1 3A
DG D GH SP F i r s t Sp qtrum I T Integral of t he F i r s t Spec t rum SP Second Spectrum IT I nt egral of the - Second SpecttUI11
The aut oma t i c tes t s that were performed to det ermine the QC code fol l owing each var iable were
( a ) Check for mi s s ing or negat ive values for the broadband solar radiashyt i on meteoro l og i cal or a tmo spheric dat a or the spec t ral integral s
lt 0 = Code 2 Mi s s ing ( - 9 or -9 9 ) = Code 3
( b ) Check for atmo spheric or broadband instrument instab i l i ty us ing the difference and rat i o o f the before- and aft er-scan values and redundant mea surement s if nei t her values are negat i ve or mi s s ing
DN before DN after if the abs lute d i fference SN before SN after i s gt10 Wm DN beforeSN before 5 of 200 DN before SN after and GH before GH after SH beforeSH after the rat io i s lt0 95 or gt1 05 each of the GH before SH before two var iables = GH afterSH after or middot GN beforeGN after the rat i o i s lt0 90 or gt1 10 each of the GT beforeGT after two var iable s = Code 3
Code 2
( c ) Check for DN gt GN or GN gt ETR ( extraterre s trial solar radiat i on ) us 1ng rat ios of the var iabl e s
DN before GN before gt0 95 each variable = Code 2 DN afterGN after gt 1 0 each var i able = Code 3 GN before ETR GN afterETR
( d ) Check for values o f Kt Kn and DGH tha t are too high
KT ( invo lves GH before and after and KT ) KN ( involves DN before and after and KN ) DG ( invo lves DN and GH before and after and DG )
gt0 9 5 each variable = Code 2 gt 1 0 each var iable = Code 3
( e ) Check the s pe c t ral integral s for unusual rat i o s to the corresponding broadband so lar radiat ion value
IT ( Broadband va lue before and after )
For d i rect s pe c t ra lt 0 6 or gt0 8 5 I T = Code 2 For gl obal s pe c t ra lt0 7 o r gt0 95 I T = Code 2
For d i rect and g l obal s pec t ra lt0 5 or gt l O IT = Code 3
5 1
TR-35 13A
We sugge s t that users of the data ba s e develop a computer program to acc e s s fields i n the Q C l ine and t o print the me s sages Thi s l imi ted qua l i ty cont rol wi l l not f lag a l l po s s ible errors and addi t i onal t e s t s should be applied depend ing on the users requi rement s and appl icat i on s
52
1 1 2
Document Control SEAl Report No
Page 4 Title and Subtitle
NTIS Accession No 3 Recipients Accession No SERI TR- 2 1 5-35 13A DE89009447
5 Publication Date
January 1990 Sp ectral Solar Radiation Data Base Documentation
6Vo lume I
7 Author(s) 8 Performing Organization Rept No
9 Performing Organization Name and Address 10 ProjectTaskWork Unit No
1 1 Contract (C) or Grant (G) No
(C)
(G)
1 2 Sponsoring Organization Name and Address 13 Type of Report amp Period Covered
Solar Energy Res ear ch Ins titute Technical Repor t 1 6 1 7 Col e Boulevard Golden Colorado 804 0 1-3393 1 4
1 5 Supplementary Notes
16 Abstract (Limit 200 words) The Solar Energy Research Ins titute ( SERI) Electric Power Research Ins titute Flor ida Solar Energy Center and Pacific Gas and Electric Company cooperated to produce a spec tral solar radiation data base representing a range of atmospheric conditions These data will help to characterize the natural variab ility in the spectral (color) content o f outdoor solar radiation so that the sensitivity of spec trally selective solar devices ( such as photovoltaics ) to these variations c n b e s tudied quant itatively Volume I o f this report documents the history approach content and format of the data base Volume II contains graphs and field no tes for each of the spectral data sets The data res ide on magnetic tape at SERI
1 7 Document Analysis
a Descriptors Spec tral solar radiation broadband solar radiation met eorological
data sp ectroradiometers
b IdentifiersOpen-Ended Terms
c UC Categories
233 234
18 Availabil ity Statement
National Technical Information U S Depar tment of Commerce 5 285 Port Royal Road Springfield Virginia 2 2 1 6 1
Service 19 No of Pages
60
20 Price
A04
Form No 0069 (6-30-87)
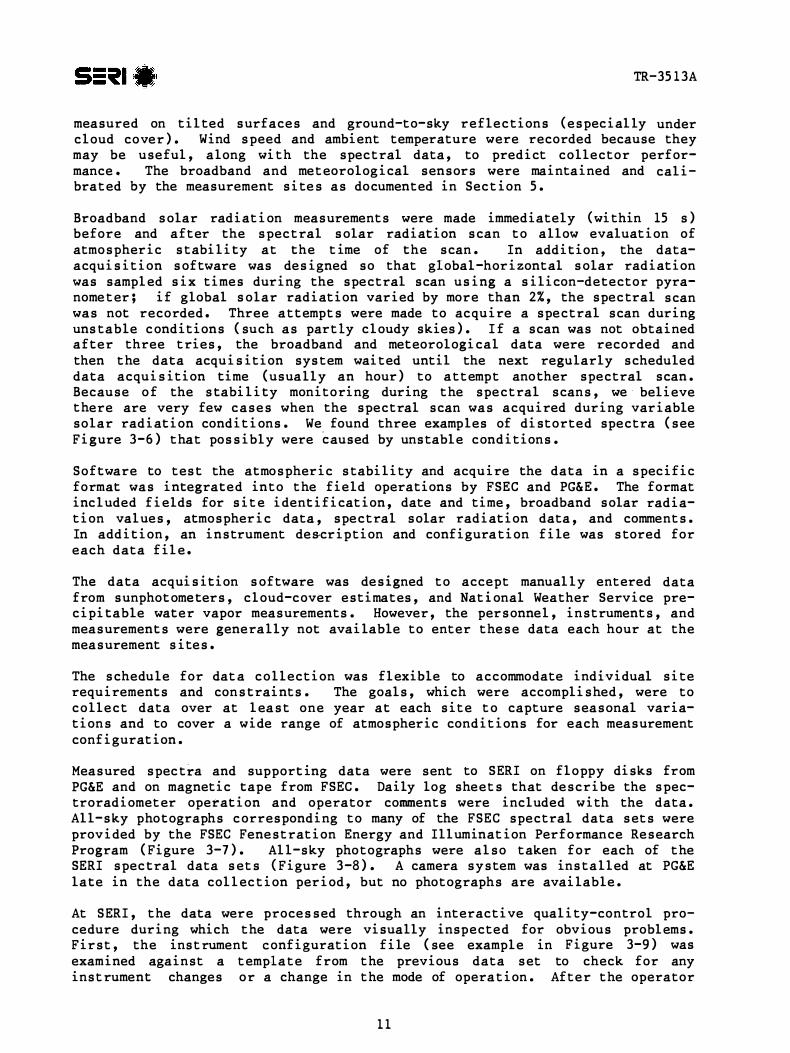
TR-35 1 3A
measured on til ted surfaces and ground-to-sky reflec tions ( especial ly under cl oud cover) Wind speed and ambient temperature were recorded because they may be useful along with the spectral data to predict collector perforshymance The broadband and met eorological sensors were maintained and calishybrat ed by the measurement sites as documented in Sec tion 5
Broadband solar radiation measurements were made immediately ( within 15 s) before and after the spec t ral solar radiation scan to allow evaluation of atmospheric stability at the time of the scan In addition the datashyacquisition software was designed so that global-horizontal solar radiation was sampl ed six times during the spectral scan using a silicon-detector pyrashynome t er if global solar radiation varied by more than 2 the spec tral scan was not recorded Three attempts were made to acquire a spectral scan during unstable c onditions ( such as partly cl oudy skies) I f a scan was not obtained after three t ries the broadband and meteorological data were recorded and then the data acquisition system waited until the next regularly scheduled data acquisition time ( usually an hour) to attempt another spectral scan Because o f the stability monitoring during the spectral scans wemiddot believe there are very few cases when the spectral scan was acquired during variable solar radiation conditions We found three examples of distorted spectra ( see Figure 3-6) that possibly were caused by unstabl e conditions
Software to test the atmospheric stability and acquire the data in a specific format was integrated into the field operations by FSEC and PGampE The format included fields for sit e identification date and time broadband solar radiashytion values atmospheric data spectral solar radiation data and comments In addition an instrument deampcription and configura tion file was stored for each data fil e
The data acquisition software was designed to accept manual ly entered data from sunphot ometers cl oud-cover estimates and Nat i onal Weather Service preshycipitable water vapor measurements However the personnel instruments and measurements were generally not available to enter these data each hour at the measurement sites
The schedule for dat a coll ection was fl exible to accommodate individual site requirements and constraints The goals which were accomplished were to collect data over at l east one year at each sit e t o capture seasonal variashytions and to cover a wide range of atmospheric conditions for each measurement configuration
Measured spec tra and supporting data were sent to SERI on fl oppy disks from PGampE and on magnetic tape from FSEC Daily log sheets that describe the specshytroradiomet er operation and operator comments were included with the data Al l-sky photographs c orresponding to many of the FSEC spectral data sets were provided by the FSEC Fenest ration Energy and Illumination Performance Research Program ( Figure 3-7) Al l-sky photographs were also taken for each of the SERI spec tral data sets ( Figure 3-8) A camera system was installed at PGampE late in the data col l ec tion period but no photographs are available
At SERI the data were processed through an interactive quality-control proshycedure during which the data were visually inspected for obvious probl ems First the inst rument configuration file ( see exampl e in Figure 3-9) was examined against a t emplate from the previous data set to check for any inst rument changes or a change in the mode of opera tion After the operator
l l
middot 400
01+--+----+--+--
U1Ill-25 0Day No 205 1987 (a) 1= 25 Day No 319 1987 (b)Oslash a -E c Nc
N 0 IDistorted direct-normal E CJ bull= m
E 15 Distorted direct-normal spectrum 15 spectrum at 10316 cl
Q)Q) 00 c co c 056 g 105
shy t -
300 500 700 900 1100 300 500 700 900 1100 Wavelength (nm)Oslash Wavelength (nm)
Day No 319 1987 Day No 319 1987 25 1200 (c) (d)Distorted global normal spectrum E ltilc at 10316 E_
N E 800 15 Q) 0 Q) c Direct0 Global tilt c normalco Global6 056 co
horizontal
300 500 700 900 1100 6 8 12 14 16 Wavelength (nm) Time
Figure 3-6 Examples of the very few distorted spectra in the data base (a b c) Broadband solar radiation data (d) corresponding with the spectra in b and c show that irradiance was decreasing at 1031 due to partly cloudy conditions JOIwU11-w
xgt
S5 llifl TR-3 5 1 3A
Figure 3-7 Example Qpound all-sky photographs acquired at FSEC These photog aphs proviGed evidence f rain possible condensation oa optics and ducls
Figure 3-8 Example of all-sky photograph acquired at SERI with a disk blocking sun to show diffuse sky conditions
13
---middot---------middot---------middot---------middot---------middot---------middot---middot --middot---------middot--------middot
TR-3 5 1 3A
t(OK P 11 buy this) Press [Helpl for help
CHN PARAHETER +-------INSTRUHENT----------+ +--CALIBRATION-+ OUTPUT rom NO TYPE HAICER TYPE SERIAL FACTOR- DATE --UNITS NOTES
1 Dir NorR Eppley NIP 17828E6 680 11-187 WRA2 2 Clo NorR EPPLEY PSPH 17863F3 811 11-187 WRA2 3 Glo Horz Eppley PSP 17863f3 811 11-187WfRA2 ltl Glo Tilt EPPLEY PSPT 17863F3 811 1-187 RA2 5 Dir N Si Unused Unused Unused -9900 -1-1-1 WRA2 6 ARb TeRp TAYLOR HGGLASS 00718C LOO 11-187 Deg C 7 Surf Pres OBSERVER ELEVATION RIORDAN -9900 -1-1-1 Hillibar atilde8 Rei HuR DC DIGITAL XXXXXC 100 -1-1 1 Percent 3 9 Wind Spd OBSERVER OBSERVD STOFFEL -9900 -1-1-1 KetersS 3
10 I Albedo Unused Unused Unused -9900 -1-1-1 Percent 11 Phot 380 S TEIC SUNPHOT SPH7624 66300 10-184 Countamp 3 12 Phot 500 SOHOTEIC SUNPHOT SPH7524 77500 10-184 Counts 3 13 Phot 860 SOHOTEIC SUHPHOT SPH7524 45700 10-184 Counts 3 14 Phot 942 SONOTEIC SUNPHOT Unused -9900 -1 1-1 Codnts 1 15 Opq Cloud OBSERVER OBSERVER STOFFEL 100 -1-1-1 Tenths 16 H20 NWS NWS SONDE STAPLETON 100 -1-1-1 CR 17 Spect 11 LICOR LI1800 PRS158 100 9-187 Wsq RlnR 2 18 Spect 12 Unused Unused Unused -9900 -1-1-1 Wsq RnR 19 Glo H Si LICOR SIPYRAN PY1245 811 11-187 WRA2
Figure 3-9 Example of the instrument configuration data -eeorded with the measured data J-middot middot
approved the configura t i on tabl e the template was updated and the informat ion was wri t ten to the data base
Figure 3-10 shows an-exampl e of the comput er terminal output dur ing the cond step o f the qua l i ty-control session
The informa t i on displayed ( see c i rcled nu bers in Figure 3-10) inc luded the foll owing
1` Si te dat e day number standard t ime lati tude l ongi tude and number o f attempts to acquite the spectrum as cont ro l l ed by the atmospher i c stab i l ity monitor
2 Plot o f the spectrum with the mode of operat ion printed bel ow the plot
3` Indicat ion o f stabi l i t y based on the before-scan and after-scan me iureshyment of gl obal-horizontal solar rad iat ion from the iil i con pyranome t er ( although the measurements by thi iiJtrument ciuring the _scaq are actual l y used to test f o r atmospheric stability)
4 Graphic descr i p t i on o f the az imuth and zenith angles of the sun
14
y I
r
ijn 2PR
1100300
II I -
38 50
94
-99
l
IlIllN
lt ltX) Softwa re by M Rymes 0
2 t N AFT BEF a DN 864 863
0 1K SN 852 852 reg A GH 1007 1005 8 SH 984 981 I GN 1089 1088
IL GT 924 920
DN SN GH SH GN GT T Azimuth Zenith reg T 27 c
679 9132 1019 mb V1 RH 73
0 reg ws 4 ms AL 136 Wm2
-99 Co -99 Co
86 -99 Co -99 Co
cc -99 wv
110 mm
300 Di r Norm Glo Norm 1100 FSEC 051387 (Day 133) 1030 2840N 8060W 1 tries G)
terminal output during a quality-control session o--3Figure 3-10 Example of the computer lt1 wV1 wgt
I
TR-3 5 1 3A
5 Bar graph of the before-scan broadband measurements of direct-normal ( thershymopile detec t o r ) DN direct-normal ( silicon detec t or ) SN global-horizontal ( thermopile ) GH gl obal-horizontal ( silicon ) SH gl obal-normal ( thermopi l e ) GN and global-til t ( thermopile ) GT solar radiation The darkened bar graphs show the integral of themiddot spectral middotso lar middotradiation llm))(0 3-11 which is printed under the bar graph Before-scan and after-scan broadband values are printed to the right of the bar graph
6 Listing of the supporting data The first five values are t emperature T pressure PR relative humidity RH wind speed WS and ground-reflected solar radiation AL used for albedo calculations The remaining fie l ds were not used for this data base and were included for future data col lecshytion projects
This quality-control process was performed short ly after the data arrived a t SERI to flag obvious field probl ems The operator could add comments to the data fil e after viewing the information in Figure 3-10 The software also calculated atmospheric descriptors such as Kt and then the data and descripshytors were writ t en to the data base Quantitative qua lity control was applied iu the post-processing of the data base ( described in detail in the appendix )
We chose to include all data in the data base and to be as specific as posshysible about the measurement uncertainty rather than set stringent criteria for excluding data sets This allows users to select data based on their specific application and accuracy requirements or to use portions of the damiddotta sets such as broadband datamiddot or spectral solar radiation segm(nts None of middot
the data should be used without referencing the measurement uncertainty
16
40 CONTENTS OF THE DATA BASE
A t otal of 3 364 spectral data sets ( 16 Mb) are included in the data base
bull 1 4 1 5 Direc t normal
bull 899 Global normal
bull 542 Gl obal horizontal
bull 455 Global tilt
bull 5 3 Dif fuse
I f the data acquisition systems were operating but the atmospheric conditions were too unstable to record a spectrum the broadband and meteorol ogical data were inc luded in the data base but no quality-control processing was applied
FSEC normally operated two spectroradiometers simultaneously one in the direct-normal mode and the other in one of the global modes PGampE operated one spectroradiometer and rotated through the different measurement modes SERI collected direct-normal global-horizontal and dif fuse-horizontal specshytra mostly during cl oudless-sky conditions
Examples of the spec tra are shown in Figures 4-1 through 4-5 Figshyure 4-1 ( a b) shows examples of spectra measured at FSEC in the direct-normal and global modes on a clear day As air mass increases the direct-normal spectra ( a) shift toward longer wavelengths ( the red end o f the spect rum) The global spectra ( b) are slight ly l ess affec ted by the red shift because the radiation scattered out of the direct beam is added back int o the gl obal spectra as diffuse radiation thus returning a portion of the short-wavel engt h ( blue) radiation Figure 4- l ( c) shows the broadband solar radiation corresponding to the spectra
Figure 4-2 shows exampl es of spectra measured under cloudy skies The directshynormal spectra ( a) are almost zero and the global-til t spectra (b ) have low values The graph o f corresponding broadband solar radiation ( c ) shows nearly zero direct normal the global values approach each other becausemiddot all of the irradiance is diffuse under cl oudy skies
Figure 4-3 shows examples of spectra measured on a partly cl oudy day The graph also shows an exampl e of data dropout during data transfer The shape of the spec t ral curve is quite diff erent for low-intensity spec tra measured under cl oud c over ( 10 3 1 air mass 1 88 13 3 1 air mass 1 7 3 ) versus the lowshyintensity spec t rum at higher air mass values ( 1 6 3 1 air mass 5 48 )
Figure 4-4 shows two exampl es of spectra that appear to correspond with sun reflections o f f of clouds which causes a bright spo t [ 1 7 ] and a focusing effect on the solar radiometers The broadband solar radiation values can actually approach or exceed the extraterrestrial value of about 1 3 3 8 on day number 1 3 2 1 3 3 The global solar radiation values approach each o ther while the direct-normal radiation drops indicating that the solar disk is partially blocked by c l ouds
1 7
25 Ec
C1E 1 5
Q)()cctS0 05ctS
Day No 53 1 988 1ico(a) Direct Normal Spectra 0931 to 1 631 ()lt(OJ
00 500 700 900 Wavelength (nm)
EcE
Q)()cctS
0ctS
25
1 5
05
Day No 53 1 988 Global Normal Spectra
931 to 1 631 (b)
300 500 700 900 1 1 00 Wavelength (nm)
1 200 Day No 53 1 988 (c)
cJE
800 Q)()cctS 4000ctS
Global tilt
Global horizontal
0 6 8 1 0 1 2 1 4 1 6 1 8
Time
Figure 4-1 Examples of a) direct-normal and b) global-normal spectra and c) broadband solar radiatio n measured at FSEC o n a clear day
18
0+-+--+-f=t-=F==F==t=P=T==t--+-===+----f
TR-35 13A
- 20 E
Clc E
1 0 Q)()sect 0
300 500
- 20 E
C1c E
1 0 Q)()c laquoS 0laquoS = 00
300 500
1 200
ClE
800 Q)()c -C 400 laquoS
0 6 8
Day No 273 1 987 Direct Normal Spectra
831 to 1 231 (a)
700 Wavelength (nm)
900 1 1 00
Day No 273 1 987 Global Tilt Spectra
831 to 1 231 (b)
700 Wavelength (nm)
900 1 1 00
Day No 273 (c)
middot Global no rmal Global tilt Global horizontal
1 0 1 2 Time
1 4 1 6 1 8
Fi gure 4-2 Examples of (a) direct-normal and (b) global-ti lt spectra and (c) broadband solar radi ation measured at FSEC on a cloudy day
19
I
EcCl
25
E 1 5
Q)()cctl 05
Day No 353 1 986 Global Normal Spectra
Wavelength (nm)
Day No 353 1 986
Fi gure 4-3 radi ati on (lower) measured at FSEC on a partly cloudy day The
-ClE Q)()cctl
1 200
800
400
0
Time
lilobal normal
8 1 0 1 2 1 4
Global horizontal
16 1 8
TR-3 5 1 3A
Examples of global-normal spectra (upper) and broadband solar
spectrum at 1631 shows data dropout duri ng data transfer
Figure 4-5 shows examples o f d i rect-normal gl obal-hor izontal and d i f fuseshyhorizontal spec t ra measured by SERI The di ffuse radi a t i on is most ly concenshytrated in the short-wavelength ( visible) region of the spect rum ( blue sky) The global-ho r i zontal spectrum is equal t o the direct-normal spec t rum mul t i shypl ied by the c osine o f the zenith angle plus the diffuse spec tral radiat i on
The cumula t i ve number o f these spec t ra versus air mass the atmospher i c descriptors Kt Kn DGH and rel at ive humi dity are shown 1n Figshyures 4-6 ( a-f ) The large number of spec t ra at low air mass values is caused by t he opera t i on of the spect roradiometers dur ing normal working hours at midshylat itudes and by the larger air mass values oc curring near sunr ise and sunset whi ch occupy a relat ively smal l frac t i on of the day The large number o f spec tra duri ng relat ively c l ear sky conditi ons i s due t o sdec t i on of clear days for the data taken at SERI the requirement for atmospheric stability during spectral scans and perhaps cl imate types at the three sites Figshyure 4-6 ( c ) shows tha t relat ive humi dity measurements were missing for about 25 global-normal spectra The dif fuse spec tra assoc iated wi th DGH rat i os near 1 0 indi cate very clear condi t i ons where dif fuse measurements are probably within the measurement uncertaint y
20
1200I -
u a
Wmmiddot2)1 I
v+--+--
˜
middot (a) (b) Global normal
(c) Global horizontal (1403
15
InIllDay No 132 19 7 Day No132 1987
Global Normal Spectra 900 to 1 63 0-- 25
clra -Ec bat horizontal Global tilt cJ
N E 800 15 - Q cbull
g 400ctl red - 0 5 ctl I
0 300 500 700 900 11 00 6 8 1 0 12 14 16 18
Wavelength (nm) Time
Day No133 1987 Day No 133 198V
Global normal Global Normal Spectra N 730to 1430 2 5middot Glob tilt
(d) Ec
E 1000
- 500 gctl ctlmiddot- 0 5 -g 1
300 500 700 900 11 00 6 8 1p 12 14 16 18
Wavelength (nm) Time
igure 4-4 Examples pound solar spectra enhanced by cloud bright spots (a) at 1031 on day 132 and (c) at 1230 on day 133 and correspondin [(b) and (d) re pectively] broadband solar radiation J
w111wgt
I
OlDay No 328 1987 0
(a) r1052to 1231 ltt-- 2 5 0
E CDc )E Direct Normal
1 5 Q)C)cro5 05ro
300 500 700 Wavelength (nmr
900 1100
- 25 Ec
E 15
Q)C)cro5 05ro=
Day No 334 1987 1222to 1508
Direct Normal
(b)
300 500 700 900 1100 Wavelength (nm)
Figure 4-5 Examples of direct-normal global-horizontal and diffuseshyhorizontal spectra measured by SERI on two days
Inc luded on the data tape are daily f i eld notes qua l i t y control informa t i on and measuremen t uncertainty Thi s informat i on alert s the user t o problems such as data dropout s ( a s seen in Figure 4-3) and noise in the spectrum (Figshyure 4-7 ) Thi s informa t i on should always be revi ewed when any s pectraL data s e t s are u sed
Phot ographs or s l i de s corre sponding to many of the spectral data s e t s are avai lable at ERI The daily f i eld no t e s that are inc luded wi th the dat a base document the exi s t ence and qual ity of the pho t o s slides
2 2
--------I-
J v l----
r
---
_rV I--
I v
f-
v
I II
I I
___ v -
---- --
I )
-I
v --- --------v f-----
40
TR-3 5 1 3A
LO Direct Normal Spectra vs Air Mass Global Normal Spectra vs Air Mass i40
30ct1E -
lt( 20
1 0 0 400 800 1 200 1 600
40 - -middot 30coE lt( 20
1 0 0 200 400 600 800
ltlil
Number of spectra Number of spectra
Global Horizontal Spectra vs Air Mass Global Tilt Spectra vs Air Mass
40
UJUJco_E -
30 bull
lt( 20
30 coE -
lt( 20
1 0 1 o
Diffuse Spectra vs Air Mass
0 1 00 200 300 400 5000 200 400 600 Number of spectra Number of spectra
40
coE lt(
30
20 bull
1 0 0 1 0 20 30 40
Number of spectra 50
23
I )
v 1-
I--v
( I
)
v --1------I--__
1 I
--l---
If 1
v 1---1-
-_ I---
l u
-----
v I I
----f--e--r-----
I If-
1--- middot
---
100
60
20
Direct Nermal Spectra vs Kn
0 400 800 1200 1600
100
60
0
Direct Normal Spectra vs Kt
400 800 1 200 1600
TR-35 13A
Number of spectra Number of spectra
Figure 4-6 (b) The cumulative number of spectra (horizontal axis) measured over a range of air mass and atmospheric descriptors (vertical axis)
100
60I
20
Direct Norma Spectra vs DirGH
400 soe 1200 160CJ Number of spectra
Direct Normal Spectra vs Rei Hum
6 100
- 60sQ)gt
g 20Q5a 0 400 800 1200 1 600
Number of spectra
c
100
60
20
0
Global Normal Spectra-vs Kn
300 600 900 Number of spectra
Globa Normal Spectm vs DirGHtOO
I 60
20
0 300 600 900 Number of spectra
Global Normal Spectra vs Kt 100
602
20-
0 300 600 900 Number of spectra
Global Normal Spectra vs Rei Hum 100
6E) 60s Q)gt
Q5 20a
a 300 600 900 Number of spectra
Figure 4-6 (c) The cumulative number of spectra (horizontal axis) measured over a range ofmiddot air mass and atmospheric descriptors (vertical axis)
24
f--f--
-I
lJ
1--f-- v
I 1
f--f-
v
1------
1--
( j
---
--
( I
J
1--- -
v
) -----
(
l) __---
v I
1 00
c 60
20
1 00
I 60Q0 20
Global Tilt Spectra vs Kn
0 1 00 200 300 400 500
Global Tilt Spectra vs Kt
Number of spectra
Global Tilt Spectra vs DirGH
Number of spectra
0 1 00 200 300 400 500 Number of spectra
0
1 00
60
20
0 1 00 200 300 400 500
1 00 2-5EE 60 Q)gt-Qi 20a
Global Tilt Spectra vs Rei Hum
1 00 200 300 400 500 Number of spectra
Figure 4-6 (d) The cumulat ive number of spectra (horizontal axis) over a range of air mass and atmospheric descriptors (vertical axis)
Global Horizontal Spectra vs Kn 1 00
c 60
20
0 200 400 600
1 00
60sz
20
Global Horizontal Spectra vs Kt
200 400 600
TR-35 13Amiddot
measured
Number of spectra Number of spectra
Global Horizontal Spectra vs Global Horizontal Spectra vs DirGH Relative Humidity
0
1 00
I 60G
20
0 200 400 600 Number of spectra
0
2-1 00 5EE 60 Q)gt
Qi 20 a
middot
200 400 600 Number of spectra
Figure 4-6 (e) The cumulative number of spectra (horiz ontal axis) measured over a range of a1 r mas s and atmospheric descriptors (vertical axis )
2 5
v-L-
1-----lr--f-
_ v
I
_J7 r
----
v -
_ 1----
___ ---f--
II (
I
r r-[--
r
v---
- 25
1 5
Diffuse Spectra vs Kn 80
70
c 60
50
0 1 0 20 30 40 50
TR-35 13A
Diffuse Spectra vs Kt 85
2 65
75
1 0 20 30 40 50
Number of spectra Number of spectra
Diffuse Spectra vs DirGH Diffuse Spectra vs Relative Humidity
0 1 0 20 30 40 50 0 1 0 20 30 40 50 Number of spectra_ Number of spectra
95 middotE 50
75 Qi 1 0
70
5J
c 30
secta -
Fi gure 4-6 f ) The cumulati ve number of spectra hori zontal axis) measured over a range of air mass and atmospheri c descri ptors verti cal axis)
1 05
r 85
EclE
Clluc m =g
300 500 700 900 1 1 00
05
Day No 2 1 6 1 987 Global Normal Spectra
730 to 1 5 30
Wavelength (nm)
Fi gure 4-7 Exampl es of spectra showi ng noisy data i n the ultravi olet 300shy400 nm) and near-inf rared 1000-1 100 nm) regions
26
5 0 MEASUREMENT UNCERTAINTY
( No t e Thi s s ec t ion contains only a brief summary o f the total uncertainty The deta i l ed reports [ 1 5 1 6 ] on the methods used to e s t imate tota l spect ra l measurement uncertainty should he consul ted- when using thi s datamiddot middot ba se )
The data set de scribed in thi s document i s the bes t set of measurement s posshys ible wi th the personnel equipment methods and cal i brat i on procedure s avai l able t o us We found that making continuous measurements wi th complex s ens i t ive equipment and account ing for all source s o f error in order to specify total mea surement uncertainty were not triviaL tasmiddotkamp oo
The e s t imat ed total uncertainty ( 95 confidence int erval ) for each of the spec troradi ometers and each of the measurement modes is shown in Figure 5-l The upper and l ower spec tral uncertainty limi t s are symmetrical except when gl obal-t i l t or gl obal-hori zontal s pectra were measured us ing the integrat ing sphere and when a s t rong direct-beam component wa s present ( Kt gt 6 0 ) We added an 8 maximum bias to the l ower uncertainty l imi t s for these cases based on resul t s o f experimen t s in whi ch we mapped the integrat ing sphere res ponse under bri ght sun wi th the image o f the sun in di f ferent locations on the ins ide of the sphere During the se exper iment s we observed variat i on s o f up to -8 compared t o the calibrat i on point
The high uncertainty in the abso lute value o f the spectral measurement s l e s s than 0 45 m wa s caused by l ow s pectra l irradiance for the calibrat i on l amp s which resul ted in a l ow s i gnal-t o-no i s e rat io for the spec troradiorriet er cal i shybrat ions ( F igure 5-2) In add i t ion we experienced a change ( i e l o s s o f respon s e ) i n the ultraviolet ( UV ) re sponse of the instruments when us ing the integrating sphere s
To tal uncert ainty i s a combinat i on o f an e s t imated total spectral bias error and to tal spec tral random error The f inal est imated total uncertainty for a 95 conf idence interval i s calculated as the
random (R) error root- sum-s quare of the bias ( B)
erro r plus two t ime s the
To eva luate instrument-to-instrument d i f ferences or variabi l i ty ( al s o called between-inst rument prec i s i on ) s imul t aneous spectral solar radiat i on s c an s were made wi th each ins t rument in each conf igurat i on The s tandard devi a t i on of the se mea surement s mul t i plied by three was converted to a percentage o f the mean Thi s percent age ind icates the expected instrument-to-instrument varibi l i t y or prec i s i on for thi s set of instrumen t s Fi gure S-3 shows the resul t s obtained for one o f these compari sons us ing the integrat ing s phere s Simi lar resul t s oc cur wi th the other conf igurations The between-inst rument prec i s i on above 0 4 m i s close to 5
Temperature control o f the spe ro adiorrieters with s i l icon detectors wa s import ant Figure 5-4 shows the change in the res pori se o f the instrumen t s espec i a l ly in the near- infrared when o perated at d i fferent control temperashyture s Uncertainty of l deg C in the set point resul t s in about a 2 uncertainty in the near-inf rared measurement s On ho t days we found that the t emperat ure
2 7
(
-Lower
r --
I IV
limityen(-)
-
A u1pp r li it +) f I II I
y 1 I rl ( I _ L
-
-
I I )
f--+- -+--+--1-+---+--1- r--J- Upper -c- A I u o t-iE $ == $= =$S y I I I I t (
1 --( -
----L---------------------- -_j_j_J__J__J__J
TR-35 1 3A
20
c(ij 0tQ)ucJ -20
Global (Sphere) 1 02 1 58 1 74
limit (-) Kt lt 60 Upper limit ( +)
Lower Kt gt 60
(a)
20
c(ij 0t
5 -20 L t )ower 1m1 -
300 500 700 900 1 1 00
Wavelength (nm)
Global Normal (Domes) 1 74 2 1 8 (b)
300 500 700 900 1 1 00 Wavelength (nm)
Direct Normal 1 58 1 72 1 74 (c) 20
limit ( +)gt- iQl u Lower 1m1 -) 5 -20
300 500 700 900 1 1 00 Wavelength (nm)
Figure 5-l Estimated total spectral measurement uncertainty f or global measurements with the i ntegrating spheres on (a) units number 102 158 and 174 (b) global-normal measurements with the Teflon dome receivers on units 174 and 218 and (c) directshynormal measurements with the view-limiting tubes on units 158 172 and 174 The measurement uncertainty is synmetrical except in (a) where a -8 bias is included in the lower limit f or global-horizontal and global-tilt cases due to nonunif orm sphere response when a str ong direct-beam component is present
28
I I
0
0 (J) ()
- 1 0
t U
TR 35l3A
Wavelength (nm)
Figure S-2 Comparison of the spectral intensity of an out door global-normal measurement and the NIST calibrationmiddotmiddot lamp source L ow lamp values below 400 nm result in high measurement uncertainty
20
1 5
R 1 0
X 5Q)0c c 0
-5 Q)_0
300 400 500 600 700 800 900 1 000 1 1 00 Wavelength (nm)
Figure S-3 Between-ins trument precis ion for glo bal-normal spectral solar radiation measurements us ing the integrating spheres
29
5 1 deg C N
ij0
()00- caQ)uc
1 000 Q)-Q) 8 0950 0ca
c 0900
0 300 500 700 900 1 1 00
Wavelength (nm)
Figure 5-4 Ratio of the spectroradiometer detector response at different temperatures to the response at 40deg C
o f the detectors ( contro l l er s ) somet imes exceeded the set point and we experienced runaway temperatures Thi s resul ted in ampl i f i er mi l l ivolt drift errors and no i s e in s ome o f the s pectra We achieved better t emperature conshytrol by shield ing the spectroradiometers with Mylar sheet s supported by foam offsets to allow air flow
Mea surement uncertainty for the broadband and meteorological data i s based on the cal ibration hi s tories provided by the mea surement s i t e s and charact ershyi s t i cs of the instrument s Thi s information is given in Tables 5-l through 5-3 and the values are included on the data-ba se tape
In these table s the measurement uncertainty for a 95 confi dence int erval was e s t imated by root-sum-s quaring the est imated bias errors a d by doubl ing the random errors in the cal i brat i on proce s s and measurement s [ 15 1 6 ] Radishyometers used at PGampE in 1987 were po st-cal i brated at SERI allowing e s t imate s of the random calibrat i on error component the radi ometers used i n 1988 were cal ibrated elsewhere so nominal e s t imated errors were used in the uncertainty analys i s Ins t rument s used at SERI were pre- and po st-cal ibrated at SERI Instrument s used at FSEC were cal i brated by FSEC and nominal values for random and bias errors for the s e types of radiometers were used in the uncershytainty analys i s Cal i brat i on informat ion for the meteorological instrument s i s included i n these tables but no mea surement uncertainty analys i s was performed
30
H 11 VI _ w
Jgt
--
IllIll
Tabl e 5- l FSEC Instrument Calibrat ion Hi story Ul d Estimated Meas urement Uncert ainty N-
Es timated Beg i nn ing Calibrat ion Measurement
Channe l iF Meas urement Instrument Comment s Time Stamp Date Uncertainty
( )
1 Direct normal 862961507 Eppley NIP 14306 E6 5-86 ( thermopi l e ) 863520931 Epp l ey NIP 23943E6 12-86 plusmn2 9
8801 2093 1 Eppl ey NIP 23943E6 12-87 1 32 change
2 Global normal 862961507 Eppl ey PSP 24185F3 Eppley PSP 24185F3 1 1-86 1 6 7 change plusmn3 8
872881032 Eppley PSP 18273F3 4-87 880120931 Eppley PSP 24185F3 1 2-87
3 Globa l hori zontal 862961507 Eppl ey PSP 1 43 2 1 F3 4-86 ( thermopi l e ) 8709 3 1 6 3 1 Eppl ey P S P 14322F3 1 2-87 -- plusmn3 8
w _ 872881032 Eppley PSP 143 18F3 4-87
4 G lobal t i l t 86329103 1 872881032
Eppley PSP 24183F3 Eppley PSP l4320F3
1 1-86 4-87 -- plusmn3 8
880120931 Eppley PSP 24183F3 1 2-87
5 D irec t normal 8629 6 1 507 Mat r ix NIP3826 9-86 ( si l i con) 88012093 1 Matrix NIP3826 12-87 1 32 change plusmn2 9
6 Temperature 862961507 Weathermeasure 1 7 7
1420A 6-86 3-87 8-88
smal l changes the cal ibratiqft factor was changed i software
7 Pressure 86296 1507 Weathermeasure 1 70 5 1-86 smal l c anges the 1 7 8 5-87 cal ibra t i on factor was
Hmiddot 6-88 changed i n software
8 Relat ive humi dity 8629 6 1 5 0 7 Weathermeasure 1 54 0 6-86 Cal culated from dew 175 point compared every
o ther week wi th another instrument
9 Wind speed 862961507 Weathermeasure 1 222 7-86 smal l chlnges the 1219 3-87 cal ibrat i o fac tor was ---
6-88 changed in software
J
-
Ill _-
bull I
Table 5-l FSEC Instrument Calibrat ion Hi stb y and Estimated Measurement Uncertainty (Concluded)
Channel Measurement Beginning Time Stamp ihsttument Cal ibrat ion
Date Comment s
Estimated Measurement Uncertainty
( )
INN
10 Albedo 86329103 1
87288103 2
Eppley PSP 1629 FJ Eppley PSP l 106Srl
1 1-86
4-87
-- plusmn3 8
19 Global hori zontal
( si l i con)
862961507
87 148143 1
LI-COR Py PY22J6 LI-COR yt PY2279
7-86
5-87
plusmn3 8 --
Mo wV11-wgt
I
--
p V1 1-
--
--
--
UlIllN-
Tabl e 5-2 PGampE Ins trument Calibrat ion Hi s ory and Estimated Measurement Uncertainty 1 _
Estimated Beginning Pre- Po st-Channe l if Measurement Instrument Comment s Mea surement
Time S tamp Cal ibra t i on Cal ibrati on Uncertainty ( )
l D irec t normal 87 1 100632 Eppl ey NIP 255 08E6 1-86 8-88 0 3 change plusmn2 8 ( thermopi l e ) 880190 752 Eppl ey NIP 255 10E6 12-8 7 -- plusmn3 6
2 G lobal normal 87 1 100632 Eppl ey PSP 2 32 02F3 1-86 8-88 1 7 change plusmn2 4 880190 7 5 2 Epp l ey PSP 23996F3 12-87 -- -- plusmn4 7
3 G lobal hori zontal 8 7 1 1 00632 Eppley PSP 23995E3 10-84 8-88 3 2 change plusmn2 8 w w
( thermopi l e ) 880190 752 Eppl ey PSP 25390F3 12-8 7 plusmn4 7
4 G lobal t i lt 8 7 1 1 00632 Epp l ey PSP 25387F3 12-84 8-88 0 2 change plusmn3 8 -- plusmn4 7 880190 752 Eppley PSP 23201F3 12-87
5 D irec t normal 8 7 1 100632 Matrix NIP 38Hi 5-86 7-88 2 7 change plusmn2 2 ( si li con)
6 Temperature 8 7 1 1 00632 Omega T-coupl e
7 Pres s ure 8 7 1 1 00632 Yel l ow Springs 2014-22 3 1 -HA- 1-WH 15593 3-84
8 Relat ive humi dity 87 1 100632 Hygr o 14276 2-85
9 Wind speed 8 7 1 1 00632 8804007 3 7
Weathert ronics Weathertron i c s
2301 230 1
184 184
9-82 2-88
10
19
Albedo 8 7 1 1 00632 Eppl ey PSP 2 1235F3
Globa l hori zont al 87 1 100632 LI-COR Pyr PY5558 ( s i l i con)
Beginning about 8 7 2 1 1 the s i l i con NI P va lues appear cons i s tent ly l ow
-- 8-88 2 4 change
1 1-83 8-88 1 9 change
may be an al ignment problem
plusmn2 6
plusmn2 6
gt-3 Iw
wgt
-- --
--
-- --
1ftIll -
Table 5-3 SERI Instrument Calibration Hi story and Estimated Measurement Uncertainty =
Estimated Beginning Pre- Post-Channel I Measurement Instrument Comment s Measurement Time S tamp Cal ibration Cal ibration Uncertainty ( )
1 Direct normal 87328 Eppley NIP 1 7828E6 11-87 2-88 1 5 7 change plusmn3 3 ( thermopil e )
2 Global normal None
3 bull Global horizontal 87328 Eppley PSP 1 78 63F3 1 1-87 2-88 2 22 change plusmn3 7 ( thermo pi l e ) a t Welby
w+- At SRRL 8805 7 Eppley PSP 200 79F3 7-87 8-88 0 7 3 change plusmn2 3
4 Global t i l t None
5 Direct normal None ( si li con)
6 Temperature 87328 Taylor Pocket 21430-1 10-86 (Due 10-9 1 )
7 Pressure Cal culated from elevat ion
plusmn0 2 (deg )
8 Relat ive humidity 87328 Dickson 86 100-1 9-87 10-88 -- plusmn2 ( counts )
9 Wind speed Observat ion
10 Albedo -- None
1 1-14 -- Sun photometer ( relative compari sons only)
15 Cloud c over Observed o-3-- lXlIw Global Ho rizontal -- LI-COR Pyr PY1245 11-87 2-88 3 67 change plusmn2 9 V119 ( si l icon) ( s tabi l i ty monitor only) wgt
TR-35 13A
We urge users of the data ba se to refer to the dai l y f i eld no tes for s pe c i a l c i rcumstances recorded b y the operator that may affect data uncertainty The s e no tes include references to the spectroradiometer t emperature c onshyt ro l l e r solar-tracking accuracy and weather cond i t i ons ( such as rain ) Included in the dai l y notes on tbe data-base tape are obs ervat i ons made in qual i t y-control processing as wel l as references to the exi s t ence and qual i t y o f pho t ographs or s l ides
Quant i tat ive pos t-proces s ing qual i ty-control informat i on i s al s o inc luded on t he data-bas e tape and a complete descript ion is given in the appendix o f thi s report Redundant measurement s ( such as before- smiddotcan andmiddot middot aft et-smiddotcan
broadband solar radiat i on direct-norma l and global-hor izont al mea surement s with both thermopile and s i l i con detectors ) and compar i s ons o f integrat ed s pectral so lar radiat ion wi th broadband s o lar radiat i on were used in the qual i ty-control procedure s Users are encouraged to perform the i r own qual i t y-cont rol proce s s ing on the data t o meet their par t i cular requiremen t s
3 5
6 0 FORMAT OF THE DATA TAPE
The meas ured dat a f i eld notes quali ty-control informa t i on and mea surement uncertainty are s t ored on magne t i c tape in 80-character l ines wi th the fi leshyname s given in Table 6- 1 The f i l enaming convent ion used for the mea sured data was
Filename Content
FLA8705 DAT FSEC data 1987 May PGE880 l DAT PGampE data 1988 January SER8 7 1 1 DAT SERI data 1987 November
Data were not acqui red in a l l months so the months may not be cont iguous
Qua l i t y-control informa t i on has the same f i l enaming conven t i on with QC extens ion ( for example FLA8 705 QC ) Dai ly notes are contained in the f i l e s FSEC NOTES PGE NOTES and SERI NOTES respec t i vely The mea surement uncershytainty is in the UNCERT f i l e s
c The DAT f i l e s contain two types of informa t i on D for data and for inst rument configurat ion The f i r s t l ine of a data or confi guration segment beg ins wi th a D or a c re spect ively in the f i r s t column followed by the s i t e year day and t ime stamp the number of l ines in the segment i s in column-s 76-80 so that the user can eas i ly skip the de s i red number of l ine s An example of the information in the conf iguration or 1 1C segment i s
c shown in Figure 6-1 I t begins wi th a followed b y the s i t e FSEC year 11 1 98 7 day 122 and t i me u0830 latitude longi tude and eleva t i on There are 19 channel s for mea surement s zero s pectra in the C segment and 40 l ine s in the segment The con f i gurat ion informa t i on appear s whenever the inst rument set-up or cal ibrat ion wa s changed or t he data acqui s i t ion sys t em wa s res tarted I f the configurat i on wa s not changed at the beginning of the month the configura t i on segment wi l l be in the previous mont h s DAT f i l e
An examp le of a D segment i s shown in Figure 6-2 Thi s segment contains the mea s ured me teoro logical dat a broadband and spectral solar rad i a t i on dat a and anc i l l ary data The data contained in each l ine and column and i t s format are as follows
POS ITION OF VARIABLES IN THE D SEGMENTS (ALL LINES ARE 80 CHARACTERS )
Line Column Cont ent s Format
a = character 1 = integer f = f l oat ing point
LINE 1 1 1 D ( for data ) ( a l ) 3 1 5 Site Year Day Number Time Stamp ( a 1 3 )
3 6 F SEC PGampE o r SERI ( a4 ) 7 8 Year (a2 or i 2 ) 9 1 1 Day Number ( a3 o r i 3 ) 1 2 15 Standard Time ( a4 o r i4 )
36
5-111 - il ll
Da i ly
Uncertainty
-
TR-35 13A -
Table 6 1 Namesmiddot of Files on the Data Tape
Measured and
FSEC
FLA8610 DAT FLA8 6 1 0 QC
FLAB 6 1 1 bull DAT FLA8 6 l l QC
FLA86 1 2 DAT FLA8 6 1 2 QC
FLA8 7 0 1 DAT FLA8 70 l QC
FLA8 704 DAT FLA8 704 QC
FLA8 705 DAT FLA8 7 05 QC
PGampE
PGE8 704 DAT PGE8 704 QC
PGE8 705 DAT PGE8 705 QC
PGE8 706 DAT PGE8 7 06 QC
PGE8 7 0 7- DAT PGE8 7 0 7 QC
SERI
SER87 l l DAT SER8 7 l l QC
S ER8 7 1 2 DAT SER8 7 1 2 QC
SER880 1 DAT SER880l QC
SER8802 DAT SER8802 QC
Ca lcui a t ed Data
FLA8 706 DAT FLA8 706 QA
FLA8 7 0 7 DAT FLA8 7 0 7 QC
FLA8 7 0 8 DAT FLA8 7 0 8 QC
FLA8 709 DAT FLA8 7 09 QC
FLA8 7 1 0 DAT FLA8 7 1 0 QC
FLA8 7 l l DAT FLA8 7 l l QC
PGE8 708 DAT middot
PGE8 708 QC
PGE8 7 0 9 DAT PGE8 709 QC
PGE8 7 l l DAT PGE8 7 l l QC
No t e s
FSEC NOTES PGampE NOTES SERI NOTES
Mea s urement
FSEC UNCERT PGamp E UNCERT SERI UNCERT
FLA8 7 1 2 DAT FLA8 7 1 2 QC
FLA880l DAT FLA880l QC
FLA8 802 DAT FLA8802 QC
FLA8803 DAT FLA8803 QC _
FLA8804 DAT FLA8804 QC
PGE_880l DAT PGE880l QC
PGE8802 DAT PGE8802 QC
PGE8803 DAT PGE8803 QC
3 7 _middot
1 3
1 7
55 1 1-1 TR-3 5 1 3A
0 G) 0 G)G) iC FSEC8 7 1 2 2 0 8 1 3 2 8 4 0 0 0N 80 6 0 0 0W 2M C = 8 7 1 2 2 0 8 1 3 8 7 1 2 2 0 8 1 3+0 0 0 0 0 0 1 9 0 4 0
CHN PARAMETER +- - - - - - - INSTRUMENT- - - - - - - - - -+ +- -CALIBRATION- + OUTPUT FOOT NO TYPE MAKER TYPE SERIAL FACTOR DATE UNITS NOTES
1 Di r- Nor-m Eppley NIP 2 3 9 4 3E6 6 08 1 2 - 186 Wm2 2 Glo Nor-m Eppley PSP 2 4 1 85F3 8 85 l l - 186 Wm2 3 G l o Hor-z Eppl ey PSP l 4 3 2 2F3 6 3 8 1 2 - 2 86 Wm 2 4 Glo Tilt Eppley PSP 2 4 1 83F3 8 9 9 l l - 186 Wm2 iacute5 Dir- N S i MATRIX SI NIP 3826 31 8 0 9 - 186 Wm2 6 Amb Temp WTHRMEAS PRT 1 7 7 l 0 0 3 - 1 8 7 Deq c 7 Sur-f Pr-es WTHRMEAS PIEZO 1 7 8 l 0 0 5 - 1 8 7 Mi l l ibar-8 Re1 Hum WTHRMEAS LiCl 1 7 5 l 0 0 6 - 1 86 Per-cent 9 Wind Spd WTHRMEAS OPT CHOP 1 2 1 9 l 0 0 3 - 1 8 7 Met e r- s i S
1 0 Albedo Epp ley PSP l 6 2 9 7F3 1 0 0 9 l l - 1 8 6 Per-cent l l hot 380 Unused Unused Unused - 9 9 0 0 - 1 - l - 1 Counts iacute1 2 hot 5 0 0 Unused Unused Unused - 9 9 0 0 - 1 - l - l Count s
14 hot 860 Unused Unused Unused - 9 9 0 0 - 1 - 1 - 1 Counts hot 942 Unused Unused Unused - 9 9 0 0 - 1 - l - l Counts
1 5 Opq C loud Unused Unused Unused - 9 9 0 0 - 1 - l - l Tenths 1 6 H2 0 NWS Unused Unused Unused - 9 9 0 0 - 1 - l - l em
Spect l LI -COR L I - 1 8 0 0 PRS - 1 7 2 l 0 0 2 - 1 8 7 W sq m nm l Spect 2 L I - COR L I - 1 800 PRS - 1 0 2 1 0 0 2 - 1 8 71 8 W sq m nm l
1 9 Glo H Si LI -COR L I - 2 0 0S PY2 276 8 4 5 7 - 1 86 Wm2 2 - 1 FIN
FOOTNOTES
1 - 1 7 = DN 18 = GT 2 - SERI l oan un i t
- 1 - FIN
Figure 6-1 Example of the instrument configuration data on the data base tape The numbers refer tmiddotO
1 c indicating configuration 2 FSEC 1987 Day 122 at 8 13 standard time 3 Latitude 4 Longitude 5 Ele vation 6 Reference to configuration file that will be f ound in the
data files 7 Starting data-acquisition time plus number of attempts to
acquire spectra (which would extend the data acquisition time)
8 Number of data channels 9 Number of spectra ( 0 f or configuration files 1 or 2 f or
data files) 10 Number of lines in this segment
38
TR35 1 3A
D FSEC8 7 1 2 2 0 8 1 3 2 8 4 0 0 0N 8 0 6 00 0W 2M C=871 2 2 0 8 1 3 8 7 1 220 814+0 0 0 1 0 0 1 9 2 1 0 0 gS e e Q N FSEC8 7 1 2 2 U PRS - 1 7 2 Col 2 ( + - ) U PRS - 1 0 2 Col 2 ( - ) Col 4 ( + ) 1 7 84 5 5 7 54 5 2 9 3 0 2 - 1 - 9 9 0 3 48 0 1 1 9 48 3 3 4 4 2 7 9 - 1 -9 9 0 1 7 85 0 5 7 5 5 7 2 9 3 0 4 - 1 - 9 9 0 3 4 8 1 1 1 9 4 85 3 4 43 0 1 - 1 - 9 9 0 2 8 4 1 80 0
1 0 9 5 4 1 5 - 99 0 7 1 0 1 7 8 6 2 0 7 8 7 5 8 9 1 5 - 1 - 9 9 0 - 1 - 9 9 0 iacute1 1 3 80 0 - 99 0 Co 1 2 5 0 0 0 - 99 0 Co 1 3 860 0 - 99 0 Co 1 4 942 0 - 9 9 0 Co iacute
- 1 6 0 7 1 5 8 5 7 8 5 6 7 1 58 3 86 9 1 9 9 1 8 7 - 9 0 0 - 9 0 0 - 9 0 0 - 9 0 0 - 9 0 - 9 0 3 1 1 7 4 0 1 3 0 0 1 1 0 0 2 0 57 9 8 9 4 0 0 DNT1 8 4 0 1 3 0 0 1 1 0 0 2 0 2 8 4 1 8 0 0 6 2 4 GTS - 1 0 0 0 0 0 0 0 0 0 0 0 - 1 0 0 0 o o 0 0 0 0 o o
1 3 0 0 0 0 0 0 0 0 3 5 0 0 0 4 0 0 2 1 0 02 5 0 0 14 0 04 1 0 02 1 0 0 5 7 0 0 3 8 amp 1 3 2 0 0 0 7 2 0 056 0 1 0 1 0 0 8 1 0 1 1 8 0 1 2 1 0 1 1 9 0 140 0 138 0 1 3 1 amp 1 340 0 1 4 9 0 16 1 0 162 0 1 5 5 0 16 0 0 1 6 3 0 1 8 5 0 1 9 5 0 1 9 8 0 1 9 9 amp 1 360 0 2 0 9 0 2 1 9 0 228 0 2 4 3 0 258 0 26 5 0 258 0 265 0 268 0 2 89 amp 1 380 0 2 8 0 0 2 7 9 0 26 7 0 2 7 3 0 3 0 1 0 3 08 0 3 1 7 0 326 0 349 0 4 0 2 amp 1 4 0 0 0 4 7 6 0 52 7 0 55 7 0 569 0 580 0 5 9 5 0 6 12 0 63 0 0 64 1 0 648 amp 1 4 2 0 0 652 0 6 54 0 6 58 0 649 0 6 36 0 6 3 2 0 646 0 67 8 0 7 1 8 0 746 amp 1 440 0 7 6 8 0 7 9 9 0 82 2 0 854 0 8 7 7 0 9 0 4 0 9 1 5 0 92 2 0 934 0 94 2 amp 1 460 0 9 6 0 0 964 0 9 7 0 0 9 7 3 0 96 9 0 9 74 0 9 9 0 0 9 9 9 1 0 1 7 1 028 amp 1 4 8 0 1 0 3 3 1 0 25 1 0 0 6 0 9 9 1 0 9 9 0 1 0 1 0 1 026 1 0 3 8 1 043 1 0 4 7 amp 1 500 1 0 3 8 1 034 1 038 1 0 5 1 1 0 58 1 058 1 0 5 1 1 0 3 5 1 0 1 7 1 0 0 7 amp 1 520 1 0 2 0 1 04 1 1 0 5 7 1 063 1 068 1 0 8 1 1 088 1 0 9 3 1 0 9 3 1 0 9 1 amp 1 540 1 0 8 9 1 0 84 1 088 1 0 9 5 1 0 9 7 1 0 9 5 1 0 9 8 1 1 0 2 1 094 1 0 8 7 amp 1 560 1 0 7 8 1 0 7 9 1 08 1 1 0 7 7 1 0 7 2 1 0 7 1 1 0 7 6 1 0 7 8 1 0 7 8 1 0 82 amp 1 580 1 0 9 0 1 0 9 8 1 1 0 1 1 088 1 0 7 4 1 062 1 06 1 1 06 7 1 0 7 4 1 0 80 amp 1 6 0 0 1 082 1 085 1 08 8 1 0 9 2 1 0 9 3 1 0 89 1 083 1 0 7 8 1 0 78 1 0 7 9 amp 1 620 1 0 8 2 1 083 1 0 7 6 1 065 1 0 5 9 1 056 1 06 1 1 0 7 3 1 0 8 0 1 085 amp 1 640 1 0 86 1 084 1 08 1 1 0 7 6 1 067 1 062 1 0 5 2 1 04 2 1 038 1 048 amp 1 660 1 0 7 0 1 086 1 0 9 4 1 0 9 7 1 0 96 1 096 1 09 2 1 0 9 3 1 0 9 1 1 0 89 amp 1 680 1 0 7 9 1 064 1 02 8 0 9 8 0 0 94 3 0 9 3 7 0 954 0 98 0 0 9 9 6 1 0 0 5 amp 1 7 0 0 1 0 0 8 1 0 0 9 1 0 1 3 1 0 1 9 1 0 2 5 1 0 2 2 1 0 0 3 0 9 7 3 0 924 0 8 74 amp 1 7 2 0 0 846 0 842 0 84 8 0 84 9 0 8 54 0 8 7 8 0 9 0 3 0 9 3 1 0 9 52 0 965 amp 1 740 0 9 6 9 0 9 7 7 0 98 3 0 989 0 988 0 9 8 2 0 9 7 6 0 95 0 0 8 81 0 7 6 7 amp 1 760 0 6 1 6 0 5 24 0 54 0 0 646 0 7 7 9 0 8 76 0 924 0 94 5 0 94 7 0 9 45 amp 1 7 8 0 0 94 2 0 94 2 0 9 3 7 0 9 2 6 0 9 1 6 0 9 0 7 0 89 9 0 894 0 8 9 1 0 89 0 amp 1 800 0 888 0 883 0 8 7 9 0 87 5 0 863 0 836 0 8 0 1 0 7 5 7 0 7 2 2 0 7 1 0 amp 1 820 0 7 1 0 0 7 1 9 0 7 3 3 0 74 1 0 7 4 9 0 7 5 7 0 76 3 0 7 7 7 0 7 9 7 0 8 1 0 amp 1 840 0 82 0 0 82 8 0 82 7 0 82 2 0 8 1 5 0 7 9 7 0 786 0 7 83 0 7 8 8 0 7 9 7 amp 1 860 0 80 4 0 8 0 0 0 7 8 8 0 7 8 0 0 7 7 5 0 7 8 0 0 7 8 7 0 786 0 785 0 7 81 amp 1 880 0 7 7 5 0 7 7 4 0 7 7 2 0 767 0 763 0 7 4 7 0 72 1 0 68 2 0 6 30 0 5 88 amp 1 9 0 0 0 57 1 0 5 7 3 0 58 9 0 584 0 568 0 549 0 53 4 0 53 3 0 5 38 0 5 56 amp 1 9 2 0 0 5 7 3 0 57 9 0 56 7 0 526 0 448 0 362 0 2 7 2 0 2 18 0 2 1 0 0 2 32 amp 1 940 0 254 0 262 0 2 5 7 0 253 0 25 7 0 266 0 2 7 5 0 2 85 0 29 9 0 3 1 7 amp 1 960 0 3 33 0 362 0 3 9 6 0 4 3 5 0 4 7 9 0 5 06 0 5 1 5 0 5 1 2 0 5 08 0 5 2 1 amp 1 9 8 0 0 53 7 0 560 0 5 84 0 5 9 7 0 6 0 9 0 6 1 7 0 6 1 8 0 6 2 3 0 62 1 0 6 1 9 amp 1 1 0 0 0 0 6 1 8 0 6 0 7 0 6 0 5 0 6 0 2 0 60 1 0 60 5 0 6 04 0 604 0 604 0 6 0 1 amp 1 1 0 2 0 0 60 1 0 59 5 0 5 9 5 0 5 93 0 589 0 59 0 0 584 0 5 82 0 580 0 5 75 amp 1 1 0 4 0 0 5 7 6 0 5 7 1 0 57 1 0 56 7 0 56 0 0 56 0 0 558 0 552 0 545 0 54 0 amp 1 1 0 6 0 0 5 36 0 53 2 0 5 2 9 0 5 2 5 0 5 1 9 0 5 1 5 0 5 1 2 0 51 1 0 50 9 0 5 08 amp 1 1 0 8 0 0 50 6 0 502 0 4 9 2 0 48 3 0 48 3 0 483 0 46 9 middot 0 4 5 2 0 447 0 3 1 amp 1 1 1 0 0 0 4 1 1 - 9 9 0 0 0 - 9 9 0 0 0 - 9 9 0 0 0 - 9 9 0 0 0 - 9 9 0 0 0 - 9 9 0 0 0 - 9 9 00 0 - 1 582 3 2 2 3 0 0 0 0 0 6 0 0 0 1 0 0 0 4 0 0 1 3 0 0 1 9 0 0 2 3 0 04 1 0 0 5 5 0 064 0 088 amp 2 3 2 0 0 1 0 5 0 1 3 9 0 1 7 9 0 1 8 9 0 2 2 4 0 2 38 0 26 2 0 252 0 261 0 2 64 amp 2 340 0 2 8 7 0 2 9 2 0 266 0 2 88 0 2 98 0 286 0 3 0 0 0 3 0 0 0 2 9 1 0 2 85 amp 2 360 0 296 0 3 1 0 0 3 36 0 367 0 3 9 0 0 3 7 2 0 3 56 0 356 0 3 7 3 0 3 88 amp
Figur e 6-2 Examples of the data on the data-base tape
3 9
TR-3 5 1 3A
16 2 3 24 24 2S 3 3 34 34 3S 3 9 40 40 4 1 S 2 S4 69
54 62
6 3 6 3
6 7 6 7
7 0 7 3
74 7 S
7 6 80
LINE 2
LINE 3
1 3 4 10
1 1 1 3 14 20 2 1 23 24 30 3 1 40 4 1 43 44 SO 5 1 5 3 54 60
Lat i tude ( deg ) N ( north) Longi t ude ( deg ) W ( we s t ) `Elevat i on (m) M (m) Reference t o Conf i guration Segment Start ing year day t ime for the spectral `scan s ) i f any and number of attempt s t o `acquire the s can ( which ind i cates po s s ible `t ime delay from the s tart ing t ime ) middot
Year Day Number Time
11+11 for plus number of attempt s to acquire a s pect rum
Number o f attempt s t o acquire a s pectrum
Po s s ible Number o f Measurement s ( 1 9 )
Number o f Spec tra i n thi s Segment ( 0 1 or 2 )
Number o f Lines in Segment
Pointer to the qua l i ty-cont rol dai ly f i e ld note s and measurement uncertainty informa t ion Qua l i ty-control informa t i on is in the QC f i l e of the same month wi th the same s i t e year day and t ime s t amp Dai l y field notes are i n the NOTES f i l e f o r the same s i t e wi th the same s i t e year and day s tamp Mea surement uncertainty i s in the f i l e s UNCERT under t h e instrument serial number ident i f i ed by PRS-xxx and the column s in the uncertainty f i le s for + and - uncertainty l imi t s
Broadband mea surement s before the spectral scan
Channel fH Direct Normal ( thermopi l e ) (Wm2 ) Channel ffoS Direct Normal ( s i l i con) (Wm2 ) Channel tn Global Normal ( Wm2 ) Channel not used Charinel ffo3 Globa l Hori zontal ( thermop i l e ) ( Wm2 ) Channel fH 9 Gl obal Horizontal ( s i l icon ) ( Wm2 )
( f 8 4 ) ( a 1 ) ( f 9 4 ) ( a l ) ( i S ) ( a l ) ( a l 2 )
( a9 o r i 9 )
( a 1 )
( i 1 )
( i4 )
( i 2 )
( i S )
( a8 0 )
( i 3 ) ( pound 7 2 ) ( i 3 ) ( pound 7 2 ) ( i 3 ) ( f 7 2 )
( i 3 ) ( pound 7 2 ) ( i 3 ) ( pound 7 2 )
40
TR-35 3A
6 1 6 3 64 7 0 7 1 80
LINE 4
LINE 5
1 6
7 1 2
1 3 80
LINE 6
1 3 4 1 0
1 1 1 3 1 4 20 2 1 23 24 3 0
3 1 3 3 34 40 4 1 43 44 5 0 5 1 5 3 5 4 6 0 6 1 6 3 64 7 0 7 1 7 3 7 4 8 0
LINE 7
LINE 8
1 5
6 1 2
Channe l 114 Gl obal Ti l t (Wm2 ) hellipChannel not used
Broad band mea suremen t s a f t e r t h e s p e c t ral s can same format a s beforeshy scan ( LINE 3 )
T i l t o f the f ixed- t i l t i n s t rument s hellipf rom the hor i z ont a l ( d eg )
Az i muth of the f i xed-t i l t ins t rumen t s ( de g ) ( 1 8 0 deg = s outh)
De s c r i p t i on o f any s pec i al i n s t rument ( fo r example d i ffu s e-hori zont a l mea s uremen t s a t SERI )
Channe l IFlOAl bedo (Wm2 ) hellipChannel IH5C l oud Cover ( t enths ) Channel fF7 Surface Pres sure ( mb ) Mea s ured at FSEC and PGampE c a l c u l ated from e l eva t i on a t S ERI [ 1 1 p 1 0 0 ]
Channel 116 Amb i en t Temperature ( deg C ) Channel fiB Rel a t i ve Humi d i t y ( ) Channe l ffo9 Wind S peed ( m s ) Add i t i onal channe l des cri bed 1n l i ne 5 Va l ue Add i t i onal channel descri bed 1n l ine 5 Va l u e
Sun Pho t ometer read ings ( only recorded for SERI dat a not u s ed except for re l a t i ve c ompar i s on s ) hellip
Earth-S un d i s tance c orrec t i on ( d e v i a t i on from 1 0 ) hellip
Ext ra t erre s t r i a l Rad i a t i on (Wm2 ) hellip
( i 3 ) ( pound 7 2 )
( f 6 1 )
( f 6 1 )
( a 8 8 )
( i 3 ) ( 7 1 ) ( i 3 ) ( 7 1 ) ( i 3 ) ( f 7 1 )
( i 3 ) ( pound 7 1 ) ( i 3 ) ( pound 7 1 ) ( i 3 ) ( pound 7 1 ) ( i 3 ) ( variabl e ) ( i 3 ) ( variabl e )
( f5 2 )
( f 7 1 )
4 1
9
42
TR-3S l 3A
1 3 1 8
1 9 24
25 30
3 1 36
3742
43 48
49 68
69 72
13 76
1780
LINE
I
3 6
7 1 1 1216 1 7 20 21 25
2631
3236
3839
40 40
41 42
43 46
Zen i t h Angl e ( deg ) ( f6 2 )
Kt ( ra t i o calculated from ( f6 1 ) thermo p i l e inst rument s )
Kn ( rat i o calculated from ( f6 1 ) thermo p i l e instrument s )
D GH ( ra t i o cal culated from thermopile instrument s ) ( f6 1 )
Albedo ( ) ( f6 1 )
Ai r Mas s ( f6 2 )
Res erved for Turbidi ty i f calculated
Precipi table Water Vapor i f calculated from sun photomet er
Precipi table Water Vapor from the ( f4 1 ) Nat ional Weather Servi ce
Prec i p i table Water Vapor Cal culated from Relative Humid i t y ( f4 1 )
Channel H7 Number o f Wave l engths Recorded by Spect roradi ometer 1
Beginning Wavelength ( nm ) Ending Wavel ength (nm) Wavelength Step Size (nm ) Spectroradi ometer 1 Ti l t from the Horizontal ( deg )
Spectroradiometer 1 Azimuth ( deg )
Angle o f Incidence o f the Direct Beam on Spectroradi ometer 1 ( deg )
Measurement Type ( DN GN GH GT DF )
Attachment ( Tef lon Dome D Integrat ing Sphere S View- l imit ing Tube T )
Channel H8 Number o f Wavel engths Recorded by Spectroradi ometer 2
( i2 )
( i4 )
( i S ) ( i S ) ( f4 1 )
( fS l )
( f6 1 )
( fS 1 )
( a2 )
( a l )
( i 2 )
(i4)
TR-3S l3A
4 7 S l Beginning Wavel ength (nm ) ( i S )
S 2 S 6` Ending Wavel ength ( nm ) ( i S )
S 7 60 Wavelength Step S i z e ( nm ) ( f4 bull 1 )
6 1 6S Spec troradi ometer 1 T i l t from the Hori zontal ( deg ) ( fS l )
6 6 7 1 ` Spect roradi ometer 2 Az imuth ( deg ) ( f6 1 )
7 2 76` Angle of Incidence o f the Direct Beam on Spect rorad i ometer 2 ( deg ) ( fS l )
7 8 7 9 Mea surement Type ( DN GN GH GT DF ) ( a2 )
8 0 80 At tachment ( Teflon Dome D Integrat ing Sphere s View-l imi t ing Tube T ) ( al )
LINE 10 Saved f o r extra spectroradi ometers i f needed
I f no spec tral data were recorded the number of l ines in the D s egment i s 1 0 the number of spectra i s 0 and there i s no corre sponding qual i ty-control information for thi s dat e t ime in the QC f i l e s No qual i ty c ontrol wa s performed because the atmo sphere was uns table I f the number o f spectra i s 1 there are 60 l ines in the D s egment i f there are two spectra t he number o f l ines i s 100
I f middot the number of spectra i s 1 or 2 the spectral data fol low after the f i r s t 1 0 l i nes o f the D segment There are 1 0 spectral measurement s per l ine wi th the number in the lef t-mo s t column indicat ing the f i r s t or second specshyt roradiometer ( 1 or 2 ) f o l l owed by the s tart ing wavelength ( in nanometers ) and t he 10 spectral mea surements ( in Wm2-nm) The 1 0 measurement s are at wave l ength inc rements of 2 nm There are 401 spect ral mea surement s from 300 t o 1 1 0 0 nm in 2-nm s teps with 10 measurement s per line for 40 l ine s and one measurement in the 4 1 s t l ine The l a s t number in the 4 1 s t l ine i s the specshytral integral I f a second s pectrorad i ometer wa s used the next 4 1 l ines folshylow t he same format Blank 1 ines follow the spec tral data t o f i l l the D segment to 60 or 100 l ines
An example of a QC f i l e i s shown in Figure 6-3 The f i r s t l ine o f each segment begins with a Q f o l l owed by the s i t e year day number and t ime s tamp with the number of l ines in the segment given in the l a s t col umn s o f the l ine Following the iden t i fier are me s sage s about var iables that were flagged by the automat i c qua l i ty-control proc e s s ing ( s ee appendi x ) noted by an operator at the measurement s i t e or noted dur ing inspec t i on at SERI The l a s t l ine of the segment shows the QC code for as DN ( direct normal thermopile detect o r ) SN ( d i rect normal detector ) AL
var iabl e s such s i l i con
( a lbedo ) and SP ( s pectrum) a s de s c r i bed in the appendi x Three qual i tyshycontrol code s ar8 used 1 = good 2 = suspec t see me s sages and dai ly not e s and 3 = poor or mi s s ing see me s s ages and da i l y no te s The broadband codes ( DN SN GN GH SH and GT ) have two value s the f i r s t is the before- scan measurement and the second is the after-s can mea surement
4 3
TR-35 13A
Q FSEC87 1 2 1 0 7 3 1 4 Noise in GH spectrum in UV QCDN1DN1SN1SN1GN1GN1GH1GH1SH1SH1GT1GT1AL1AP1PR1TC1RH1WV1WS1KT1KN1DG1SPl iN1SP2IN2
Q FSEC8 7 1 2 1 0 8 3 0 8 SN bef SN af t = 1 0 5 5 S H bef SH aft = 1 0 5 3 2nd Int BB b e f = 0 636 2nd Int BB aft = 0 6 5 1 Noise in GH spectrum i n UV QCDN1DN1SN2SN2GN1GN1GH1GH1SH2SH2GT1GT1AL1AP1PR1TC1RH1WV1WS1KT1KN1DG1SP1 IN1SP2IN2
Q FSEC8 7 1 2 1 1 0 3 1 3 QCDN1DN1SN1SN1GN1GN1GH1GH1SH1SH1GT1GT1AL1AP1PR1TC1RH1WV1WS1KT1KN1DG1SP1 IN1SPl iNl iacute
Q FSEC87 1 2 1 1 1 3 1 3 QCDN1DN1SN1 SN1GN1GN1GH1GH1SH1SH1GT1GT1AL 1AP1PR1TC1RH1WV1WS1KT1KH1DG1SP 1 IN1SP1 IN1
Q FSEC8 7 1 2 1 1 2 3 1 3 QCDN1DN 1SN1SN1GN1GN1GH1GH1SH1SH1GT1GT1AL1AP1PR1TC1RH1WV1WS1KT1KN1DG1 SP1 IN1SP 1 IN1
Q FSEC8 7 1 2 1 1 3 3 1 3 QCDN1DN1SNlSNlGNlGN1GH1GH1SH1SH1GTlGTlALlAPlPRlTClRHlWVlWSlKTlKNlDGlSP l iNlSPliNl
Q FSEC8 7 1 2 1 1 4 3 1 3QCDNlDNlSNlSNlGNlGNlGHlGHlSHlSHlGTlGTlALlAPlPRlTClRHlHVlHSlKTlKNlDGlSPl iN1SP1IN1 Q FSECB7 1 2 1 1 554 3 QCDNlDNlSNlSNlGNlGNlGHlGHlSHlSHlGTlGTlALlAPlPRlTClRHlWV1WSlKT1KN1DG1SP 1 IN1SP l iN1
Q FSEC8 7 1 2 1 16 3 0 3 QCDNlDNlSNlSNlGNlGNlGHlGHlSHlSHlGTlGTlALlAPlPRlTC1RH1WV1WSlKTlKNlDG1SP l iNlSPl iNl
Q FSECB 7 1 2 1 1 7 3 1 5 GH bef SH bef = 0 9 3 1 GH aft SH af t = 0 9 3 3 QCDN1DN1SN1SN1GN1GNlGH2GH2SH2SH2GTlGT1ALlAPlPRlTClRHlWVlWSlKTlKNlDGlSPl iNlSPl iNl
Q FSECB 7 1 2 2 0 7 3 1 3 QCDNlDNlSNlSNlGNlGNlGHlGHlSHlSHlGT1GTlALlAPlPRlTClRHlWVlWS 1KT1KNlDGlSP l iNlSPl iNl
Figure 6-3 Example of quali ty-control inf ormation on the data- base tape
Figure 6-4 shows an exampl e of a segment of the daily notes from the FSEC NOTES f i l e Each segment of the f i l e beg ins wi th an followed b y the s i t e year and day number s t amp with the number of l ines in the segment given in the last columns of the l i ne The next l ine contains the s i te operashytor log sheet number month day year day number spectroradi ometer serial number( s ) and mea surement mode( s ) The PGampE and SERI not e s do not include the dai ly l og sheet number The f i rst two l ines are followed by f i eld no te s No tes that were added after inspec t i on at SERI are s eparat d from the operator notes wi th ------- The exi s tence of s l ides or photographs i s ind i cat ed a s wel l a s their qua l i ty i e good ( G ) marginal ( M ) or poor ( P ) In the exampl e in thi s f i gure there were two log sheets for thi s day (number 1 1 6 and 1 1 7 ) because the mea surement mode changed from gl obal hor i z onshytal ( GH ) to global t i l t ( GT )
44
TR-3513A
N FSEC87 1 2 2 1 1 6 0 5 0 2 8 7 1 2 2 1 7 2 DN 1 0 2 GH Clear at 0 7 3 0 GH f o r f ir s t two s cans then GT S l i de s 0 6 3 2 G
0 7 3 3 G 0 8 3 3 G 0 9 3 3 H ( dark ) 1 0 3 3 p1 1 3 3 p1 2 3 3 p 1 3 3 3 p1433 H 1 5 3 3 G 1633 G 1733 G
1 1 7 0 5 0 2 87 1 2 2 1 7 2 DN 1 0 2 GT GT s tart ing at 0 8 0 0 iacuteC lear a t 0 8 0 0 iacuteS l ides S e e above
16 1 1 8 0 5 0 3 8 7 1 2 3 1 7 2 DN 1 0 2 GT Clear at 0830 S l i de s 0633 G
0733 G 0833 G 0933 H ( dark ) 1 0 3 3 p1 1 3 3 p 1233 p 1333 p1433 H 1533 G 1633 G 1733 G
N FSEC87 1 2 3
Figure 6-4 Examples of daily notes on the data-base tape
An example o f a segment of the measurement uncertainty file UNCERT CAL i s shown in Figure 6-5 The f i r s t l ine begins with a U followed by the serial number of the s pect rorad i ometer The upper and lower measurement uncertainty l imi t s are given in the co lumns fol lowing wavelength wi th the appropri a t e measur ement mode dat es and de script ion at the top o f the column The s econd l ine in each segment o f the DAT f i l e s is a pointer to the correct uncershytainty information in UNCERT CAL The broadband s o lar radiat i on and meteshyorolog ical instrument measurement uncertainty fol lows each spectra l measureshyment uncertainty segment in UNCERT CAL
The format o f thi s data ba se was es tabl i shed at SERI t o accommodat e expanded mul t i year long-term data collect ion Users can reformat the data t o suit their part icular needs We recommend the following s t eps for acce s s ing and document ing parti cular data set s
1 Se lect and extract the des ired spectral data from the DAT f i l e s us i ng in formation such as measurement mode day number t ime air mas s or a moshys pheric condi t ions depending on the de s i red attribut es
2 Ex trac t and review the corres ponding segment s of the qua l i ty-cont rol i n format i on from the QC f i l es
3 Ex trac t and review the corres pond ing field no tes from the NOTES f i l e s
4 5
+ I -
5 4
3 7
TR- 3 5 13A
U PRS - 1 0 2 L I -COR PRS - 1 0 2 i
1 2 3 4 5 Ill
Wav GHS GHS GHS GHS GTS GTS GTS GTS Kt gt 6 0 Kt gt 6 0 Kt gt 60 Kt gt 6 0 iacutel ower lower upper upper 2 8 7 - 8 8 7 -8 8 7 5 8 8 GNS GNS
upper upper lower l ower
+ 1 -
- GHS GHS GTS GTS Kt lt 60 Kt lt 6 0 upper uppe r l ower l ower + I - + I -2 8 7 - 8 8 7 -8 87 5 - 8 8
3 0 0 - 1 0 0 0 - 1 00 0 1 0 0 0 1 0 0 0 3 0 2 - 1 0 0 0 - 1 0 0 0 1 0 0 0 1 0 0 0
4 0 0 - 2 3 3 - 1 7 1 1 5 3 9 1 4 0 2 iacute -2 2 0 - 1 7 3 1 4 0 9 3
5 0 0 - 1 3 4 - 1 1 7 3 7 5 0 2 iacute - 1 3 3 - 1 1 7 5 3 3 7
6 0 0 - 1 1 8 - 1 1 1 3 8 3 1 6 0 2 - 1 1 9 - 1 1 1 3 9 3 1
7 0 0 - 1 1 5 - 1 0 7 3 5 2 7 7 0 2 - 1 1 3 - 1 0 7 3 3 2 7
8 0 0 - 1 1 6 - 1 0 6 3 6 2 6 8 0 2 - 11 7 - 1 0 6 3 7 2 6
9 0 0 - 1 1 2 - 1 0 5 3 2 2 5 9 0 2 - 1 1 4 - 1 0 8 3 4 2 8
1 0 0 0 - 1 1 7 - 1 0 8 2 8 1 0 0 2 - 1 1 8 - 1 0 8 3 8 2 8
1 1 0 0 - 1 2 9 - 12 2 4 9 4 2
Figure 6-5 Examples of spe ctral measurement uncertainty on the data-base tape A value of plusmn100 indi cates greater t han 100 measurement uncertainty
46
TR-35 13A
4 Extract the measurement uncertainty information from the 1 1 UNCERT f i l e s and quot e mea surement uncertainty for a l l data used
5 Examine the dai l y broadband and spec tral solar radiatio data graphs in the catalog ( Volume I I of thi s report [ 1 8 ] i f avai labl e These graphs provide informa t i on on atmo spheric condi t i ons during the day For exampl e Figure 4-3 shows dai l y broadband and spec tral plot s for part ly c loudy condi t i ons when s olar rad i a t i on i s changing rapidly throughout the day The sun i s obs cured when the direc t-normal values drop t o zero and the gl obal value s approach each o ther Figure 4-1 shows a clear daybull
No data should be used wi thout consult ing the qua l i ty-control informa t i on dai ly no tes and measurement uncertainty
4 7
Cel l s
Ce l l s
Energy
Meteorologi cal Society
Appl i ed Meteorol ogy
Energy
Radiat ion Topical Overview Solar Cel l s Vo l 1 8
of the Pho tovo l t a i c s and Insolat ion Mea sureshySolar Vol 1 8 1 986 pp 393-3 9 5
TR-35 1 3A
1 0 REFERENCES
1 Hul st rom R L Solar 1 986 PPbull 1 7 9- 1 8 7
2 Hul st rom R L A Summary ments Workshop Panel Resul t s
3 Hul strom R L Re sul t s of the Amorphous S i l i con Mea surement s Ta sk Force Solar Cel l s Vo l 18 1 986 pp 1 7 1-1 7 7
4 Hul strom R L and J M Ohi Resul t s of the SERI Mul t i junction Devi ce Efficiency Measurement Task Forc e pre sented at the 20th I EEE Photovo lshytaic Spec ial i s t s Conference September 1 988
5 Riordan c and R L Hul s t rom Summary of S tud i e s that Examine the Effec t s of Spect ral Solar Radition Vari at ions on PV Device Des ign and Pershyformance SERI-TR-2 15-343 7 Golden CO Solar Energy Research Ins t i tute 1989
6 Riordan c Joint EPRI-SERI Spectral Solar Rad i a t i on Database Pro j ec t
1
8
9
1 0
1 1
1 2
1 3
14
Solar Vol 2 1 1 98 7 pp 3 3 7-342
Riordan c D Myers M Rymes R Hul strom W Mar i on c Jenning s and c Whi taker Spectral Solar Radiat ion Data Bas e at SERI Solar Vol 42 No 1 1 989 PP bull 6 7-79
Riordan C J T L Stoffe l and R L Hul s trom The Effect s of Urban Air Pollut ion on Solar Radiat i on SERI-TR-2 15-3482 Golden CO Solar Energy Res arch I n s t i tute ( draft ) 1989
Riordan c and R Hul s t rom The SERI Re s ource As ses sment Project s Plan for Col l ect ing Spectral-Solar-I rradiance Data SERI -TR-21 5-2948 Gol den CO Solar Energy Re search Ins t i tut e 1986
Shaw G E Sun Pho tometry Bul letin Ameri can Vol 64 No 1 January 1983 pp 4-10
Iqbal M bull An Int roduction to Solar Radiation New York Academic Pre s s
1983
Bartel s R A Comment s on Prec ipi table Water Mea surement s with Sun Photometer s Journal of Cl imate and Vol 25 1 986 PP bull 1 788- 1 789
Leckner B The Spectral Distribution o f Solar Radiat ion at the Earth s Surface -- El ements of a Model Solar Vol 20 1 9 7 8 pp 143- 1 5 0
Cannon T W Spectral So lar Irradiance Instrumentat i on and Measurement Techniques Solar Cel l s Vol 1 8 1986 pp 2 3 3-24 1
48
Energy
Photogrammetric Engineering
TR 3 5 13A
1 5 Myers D R E s t imate s of Uncertainty for Measured Spec tra in the SERI Spectral Solar Radiat i on Data Base ac cepted by Solar 1 98 9
1 6 Myers D R E s t imates of Uncertainty for Measured Spectra in the SERI Spec tral Solar Radiat i on Data aa s e 11 SERI e_clmical Report Golden CO S o l ar Energy Res earch Ins t i tute ( draft ) 1989
middot
1 7 Hul s trom R L The Cl oud Bright Spo t 1 9 73 PP bull 3 7 0-3 7 6
18 Ri ordan c D Myer s and R Hul s t rom Spectral Scflar Raltfiation Data Base Documentat i on and User 1 s Manual Vo lume I I SERI-TR-2 15-3 5 1 3 Golden CO Solar Energy Re search Ins t i tut e 1989
49
TR- 3 5 1 3A
APPENDIX
QUALITY-CONTROL PROCESSING
Limi ted qua l i ty-control proces s ing wa s appl i ed to the data ba se as de s c r i bed below The resul t s are i n the QC f i l es on the data-base t ape by s i t e year and mont h For examp l e
FLA8705 QC i s FSEC 1 98 7 May PGE8 80 l QC i s PGampE 1 9 8 8 January SER8 7 l l QC i s SERI 1 98 7 November
These f i l e s correspond t o the 11 OAT f i les for the s ame s i t e year and month Each data segment that includes a spectrum wa s proces sed through thi s quali ty-control procedure I f the atmospheric cond i t i on s were uns tab l e and a spectrum was not acquired the broadband and meteorologi cal data were inc l uded on the data-base tape but no qua l i ty-contro l proc e s s ing wa s app l i ed
An example o f a segment of a 11 QC f i l e i s shown in F i gure 6-3 The f i r s t Q l ine beg ins wi th a fol l owed by the s i t e year day and t ime s tamp The
last columns give the number of l ines in the s egment so the user can skip to the next s egment Fo l l owing the f i r s t l ine are me s sages that were printed whenever the qua l i ty-control proce s s ing f lagged a suspect or poor value
Following the mes sages in an SO-character QC l ine l i s t ing the variables that were examined are one of three qua l i ty-control code s 1 good 2 marg inal or suspect and 3 mi s s ing or poor The QC l ine was prepared using an automa t i c ( computeri zed ) check of the variabl e s and manual edi t ing to include informashyt ion from correspondence l og sheet s and vi sual inspe ct i on Addi t i onal me sshysages were added above the QC l ine if appropriate
The two-charact er descriptors in the QC l ine are
DN Direct-normal ( thermopi l e ) solar radiat ion before the spectral s can DN Direct-normal ( thermopi l e ) so lar radiation after the spectra l scan SN Direct-normal ( s i l i c on ) before SN Direct-normal ( s i l i c on ) after GN Globa l-normal before GN Globa l-normal after GH Globa l -horizontal ( thermop i l e ) before
WS Wind Speed KT KKN K
t n
GH Global-hori zontal thermopil e ) after SH Global-hori zontal ( s i l i con ) before SH Global-hori zontal ( s i l icon ) after GT Global-t i l t before GT Gl obal- t i l t after AL Al bedo ( Wm ) AP Albedo ( ) PR Surface Pres sure TC Temperature ( deg C ) RH Relat ive Humi dity WV Water Vapor ( al culated from rel a t i ve humidity)
5 0
S- flllit = - ( middotmiddot middot
( e g Wm2 )
TR-3 5 1 3A
DG D GH SP F i r s t Sp qtrum I T Integral of t he F i r s t Spec t rum SP Second Spectrum IT I nt egral of the - Second SpecttUI11
The aut oma t i c tes t s that were performed to det ermine the QC code fol l owing each var iable were
( a ) Check for mi s s ing or negat ive values for the broadband solar radiashyt i on meteoro l og i cal or a tmo spheric dat a or the spec t ral integral s
lt 0 = Code 2 Mi s s ing ( - 9 or -9 9 ) = Code 3
( b ) Check for atmo spheric or broadband instrument instab i l i ty us ing the difference and rat i o o f the before- and aft er-scan values and redundant mea surement s if nei t her values are negat i ve or mi s s ing
DN before DN after if the abs lute d i fference SN before SN after i s gt10 Wm DN beforeSN before 5 of 200 DN before SN after and GH before GH after SH beforeSH after the rat io i s lt0 95 or gt1 05 each of the GH before SH before two var iables = GH afterSH after or middot GN beforeGN after the rat i o i s lt0 90 or gt1 10 each of the GT beforeGT after two var iable s = Code 3
Code 2
( c ) Check for DN gt GN or GN gt ETR ( extraterre s trial solar radiat i on ) us 1ng rat ios of the var iabl e s
DN before GN before gt0 95 each variable = Code 2 DN afterGN after gt 1 0 each var i able = Code 3 GN before ETR GN afterETR
( d ) Check for values o f Kt Kn and DGH tha t are too high
KT ( invo lves GH before and after and KT ) KN ( involves DN before and after and KN ) DG ( invo lves DN and GH before and after and DG )
gt0 9 5 each variable = Code 2 gt 1 0 each var iable = Code 3
( e ) Check the s pe c t ral integral s for unusual rat i o s to the corresponding broadband so lar radiat ion value
IT ( Broadband va lue before and after )
For d i rect s pe c t ra lt 0 6 or gt0 8 5 I T = Code 2 For gl obal s pe c t ra lt0 7 o r gt0 95 I T = Code 2
For d i rect and g l obal s pec t ra lt0 5 or gt l O IT = Code 3
5 1
TR-35 13A
We sugge s t that users of the data ba s e develop a computer program to acc e s s fields i n the Q C l ine and t o print the me s sages Thi s l imi ted qua l i ty cont rol wi l l not f lag a l l po s s ible errors and addi t i onal t e s t s should be applied depend ing on the users requi rement s and appl icat i on s
52
1 1 2
Document Control SEAl Report No
Page 4 Title and Subtitle
NTIS Accession No 3 Recipients Accession No SERI TR- 2 1 5-35 13A DE89009447
5 Publication Date
January 1990 Sp ectral Solar Radiation Data Base Documentation
6Vo lume I
7 Author(s) 8 Performing Organization Rept No
9 Performing Organization Name and Address 10 ProjectTaskWork Unit No
1 1 Contract (C) or Grant (G) No
(C)
(G)
1 2 Sponsoring Organization Name and Address 13 Type of Report amp Period Covered
Solar Energy Res ear ch Ins titute Technical Repor t 1 6 1 7 Col e Boulevard Golden Colorado 804 0 1-3393 1 4
1 5 Supplementary Notes
16 Abstract (Limit 200 words) The Solar Energy Research Ins titute ( SERI) Electric Power Research Ins titute Flor ida Solar Energy Center and Pacific Gas and Electric Company cooperated to produce a spec tral solar radiation data base representing a range of atmospheric conditions These data will help to characterize the natural variab ility in the spectral (color) content o f outdoor solar radiation so that the sensitivity of spec trally selective solar devices ( such as photovoltaics ) to these variations c n b e s tudied quant itatively Volume I o f this report documents the history approach content and format of the data base Volume II contains graphs and field no tes for each of the spectral data sets The data res ide on magnetic tape at SERI
1 7 Document Analysis
a Descriptors Spec tral solar radiation broadband solar radiation met eorological
data sp ectroradiometers
b IdentifiersOpen-Ended Terms
c UC Categories
233 234
18 Availabil ity Statement
National Technical Information U S Depar tment of Commerce 5 285 Port Royal Road Springfield Virginia 2 2 1 6 1
Service 19 No of Pages
60
20 Price
A04
Form No 0069 (6-30-87)
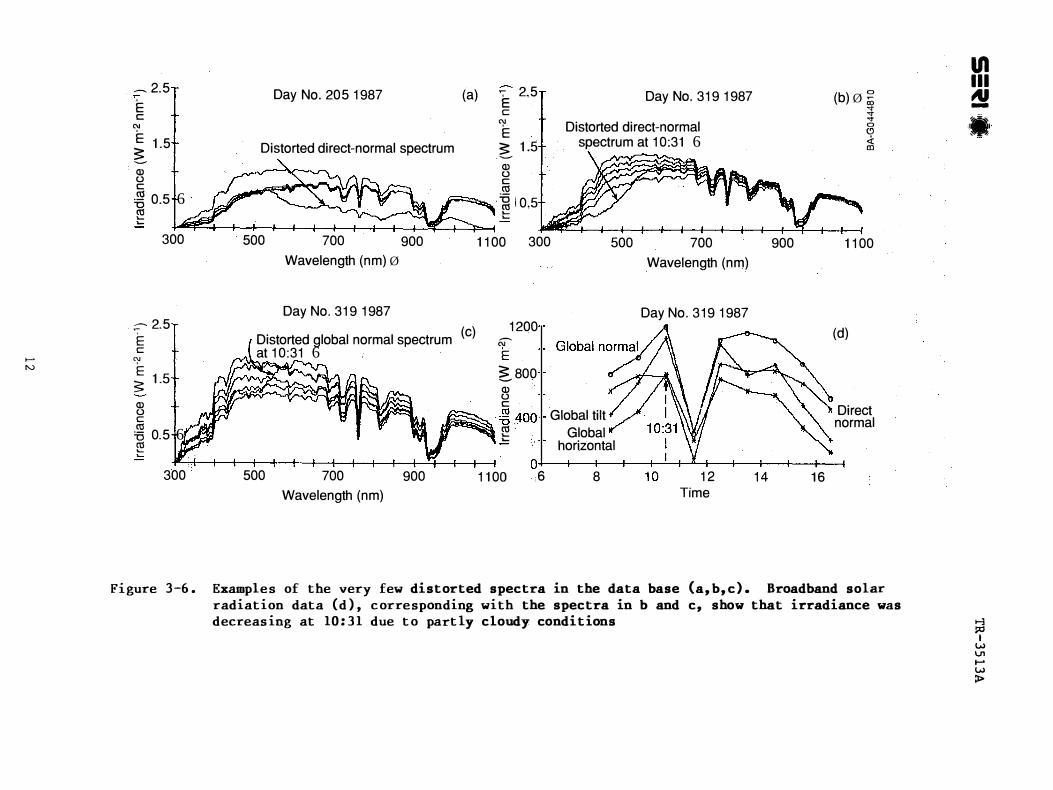
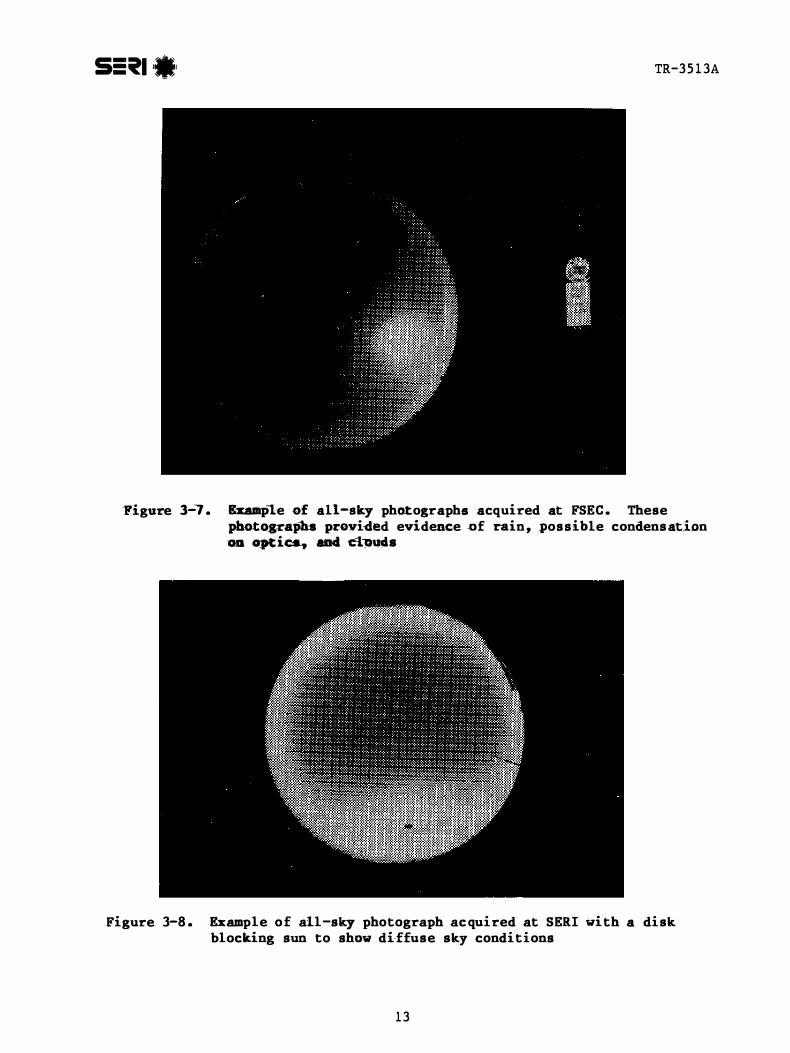
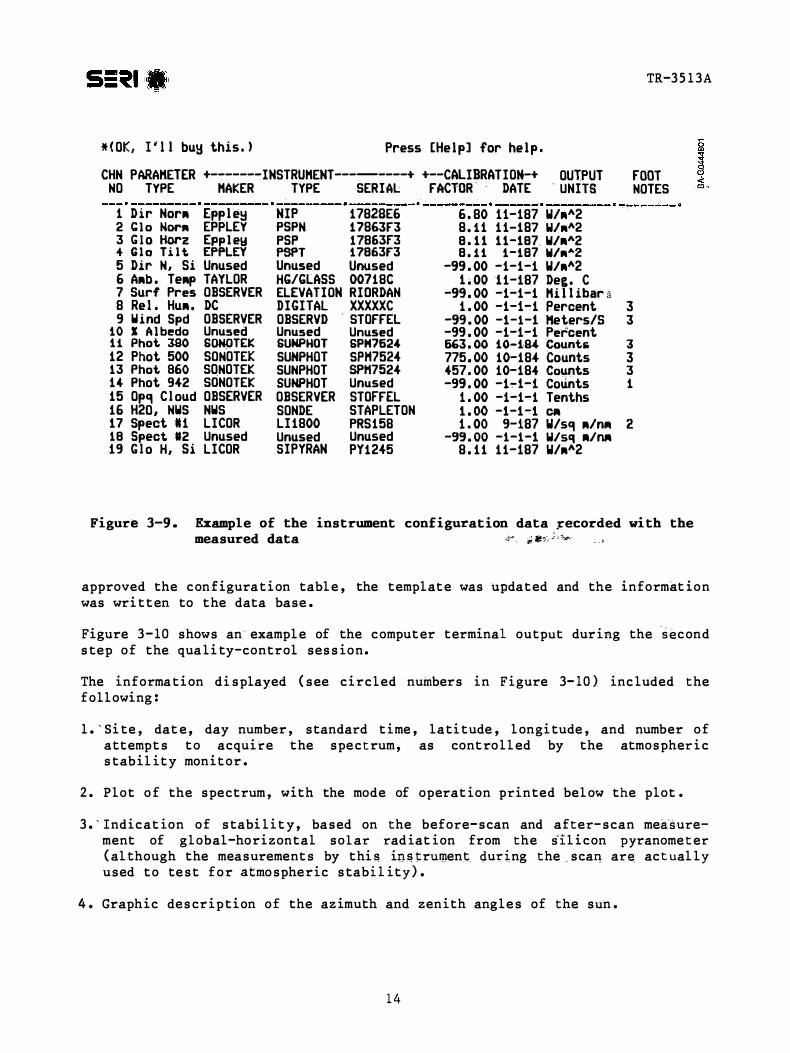
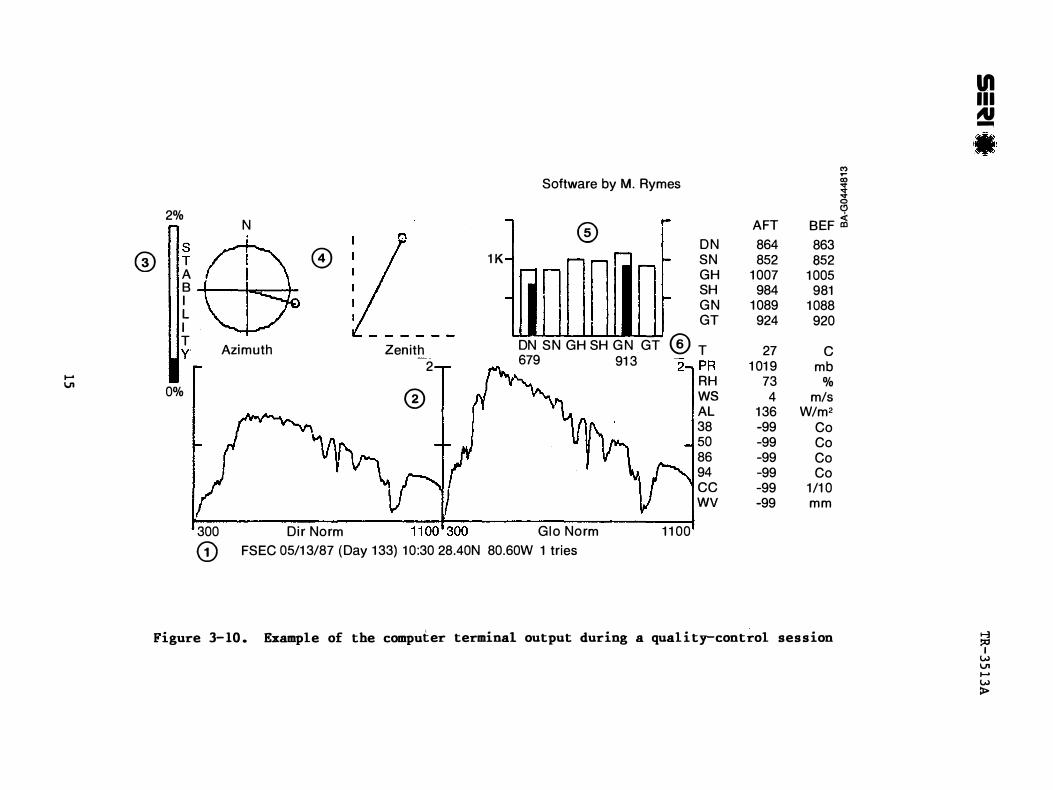
TR-3 5 1 3A
5 Bar graph of the before-scan broadband measurements of direct-normal ( thershymopile detec t o r ) DN direct-normal ( silicon detec t or ) SN global-horizontal ( thermopile ) GH gl obal-horizontal ( silicon ) SH gl obal-normal ( thermopi l e ) GN and global-til t ( thermopile ) GT solar radiation The darkened bar graphs show the integral of themiddot spectral middotso lar middotradiation llm))(0 3-11 which is printed under the bar graph Before-scan and after-scan broadband values are printed to the right of the bar graph
6 Listing of the supporting data The first five values are t emperature T pressure PR relative humidity RH wind speed WS and ground-reflected solar radiation AL used for albedo calculations The remaining fie l ds were not used for this data base and were included for future data col lecshytion projects
This quality-control process was performed short ly after the data arrived a t SERI to flag obvious field probl ems The operator could add comments to the data fil e after viewing the information in Figure 3-10 The software also calculated atmospheric descriptors such as Kt and then the data and descripshytors were writ t en to the data base Quantitative qua lity control was applied iu the post-processing of the data base ( described in detail in the appendix )
We chose to include all data in the data base and to be as specific as posshysible about the measurement uncertainty rather than set stringent criteria for excluding data sets This allows users to select data based on their specific application and accuracy requirements or to use portions of the damiddotta sets such as broadband datamiddot or spectral solar radiation segm(nts None of middot
the data should be used without referencing the measurement uncertainty
16
40 CONTENTS OF THE DATA BASE
A t otal of 3 364 spectral data sets ( 16 Mb) are included in the data base
bull 1 4 1 5 Direc t normal
bull 899 Global normal
bull 542 Gl obal horizontal
bull 455 Global tilt
bull 5 3 Dif fuse
I f the data acquisition systems were operating but the atmospheric conditions were too unstable to record a spectrum the broadband and meteorol ogical data were inc luded in the data base but no quality-control processing was applied
FSEC normally operated two spectroradiometers simultaneously one in the direct-normal mode and the other in one of the global modes PGampE operated one spectroradiometer and rotated through the different measurement modes SERI collected direct-normal global-horizontal and dif fuse-horizontal specshytra mostly during cl oudless-sky conditions
Examples of the spec tra are shown in Figures 4-1 through 4-5 Figshyure 4-1 ( a b) shows examples of spectra measured at FSEC in the direct-normal and global modes on a clear day As air mass increases the direct-normal spectra ( a) shift toward longer wavelengths ( the red end o f the spect rum) The global spectra ( b) are slight ly l ess affec ted by the red shift because the radiation scattered out of the direct beam is added back int o the gl obal spectra as diffuse radiation thus returning a portion of the short-wavel engt h ( blue) radiation Figure 4- l ( c) shows the broadband solar radiation corresponding to the spectra
Figure 4-2 shows exampl es of spectra measured under cloudy skies The directshynormal spectra ( a) are almost zero and the global-til t spectra (b ) have low values The graph o f corresponding broadband solar radiation ( c ) shows nearly zero direct normal the global values approach each other becausemiddot all of the irradiance is diffuse under cl oudy skies
Figure 4-3 shows examples of spectra measured on a partly cl oudy day The graph also shows an exampl e of data dropout during data transfer The shape of the spec t ral curve is quite diff erent for low-intensity spec tra measured under cl oud c over ( 10 3 1 air mass 1 88 13 3 1 air mass 1 7 3 ) versus the lowshyintensity spec t rum at higher air mass values ( 1 6 3 1 air mass 5 48 )
Figure 4-4 shows two exampl es of spectra that appear to correspond with sun reflections o f f of clouds which causes a bright spo t [ 1 7 ] and a focusing effect on the solar radiometers The broadband solar radiation values can actually approach or exceed the extraterrestrial value of about 1 3 3 8 on day number 1 3 2 1 3 3 The global solar radiation values approach each o ther while the direct-normal radiation drops indicating that the solar disk is partially blocked by c l ouds
1 7
25 Ec
C1E 1 5
Q)()cctS0 05ctS
Day No 53 1 988 1ico(a) Direct Normal Spectra 0931 to 1 631 ()lt(OJ
00 500 700 900 Wavelength (nm)
EcE
Q)()cctS
0ctS
25
1 5
05
Day No 53 1 988 Global Normal Spectra
931 to 1 631 (b)
300 500 700 900 1 1 00 Wavelength (nm)
1 200 Day No 53 1 988 (c)
cJE
800 Q)()cctS 4000ctS
Global tilt
Global horizontal
0 6 8 1 0 1 2 1 4 1 6 1 8
Time
Figure 4-1 Examples of a) direct-normal and b) global-normal spectra and c) broadband solar radiatio n measured at FSEC o n a clear day
18
0+-+--+-f=t-=F==F==t=P=T==t--+-===+----f
TR-35 13A
- 20 E
Clc E
1 0 Q)()sect 0
300 500
- 20 E
C1c E
1 0 Q)()c laquoS 0laquoS = 00
300 500
1 200
ClE
800 Q)()c -C 400 laquoS
0 6 8
Day No 273 1 987 Direct Normal Spectra
831 to 1 231 (a)
700 Wavelength (nm)
900 1 1 00
Day No 273 1 987 Global Tilt Spectra
831 to 1 231 (b)
700 Wavelength (nm)
900 1 1 00
Day No 273 (c)
middot Global no rmal Global tilt Global horizontal
1 0 1 2 Time
1 4 1 6 1 8
Fi gure 4-2 Examples of (a) direct-normal and (b) global-ti lt spectra and (c) broadband solar radi ation measured at FSEC on a cloudy day
19
I
EcCl
25
E 1 5
Q)()cctl 05
Day No 353 1 986 Global Normal Spectra
Wavelength (nm)
Day No 353 1 986
Fi gure 4-3 radi ati on (lower) measured at FSEC on a partly cloudy day The
-ClE Q)()cctl
1 200
800
400
0
Time
lilobal normal
8 1 0 1 2 1 4
Global horizontal
16 1 8
TR-3 5 1 3A
Examples of global-normal spectra (upper) and broadband solar
spectrum at 1631 shows data dropout duri ng data transfer
Figure 4-5 shows examples o f d i rect-normal gl obal-hor izontal and d i f fuseshyhorizontal spec t ra measured by SERI The di ffuse radi a t i on is most ly concenshytrated in the short-wavelength ( visible) region of the spect rum ( blue sky) The global-ho r i zontal spectrum is equal t o the direct-normal spec t rum mul t i shypl ied by the c osine o f the zenith angle plus the diffuse spec tral radiat i on
The cumula t i ve number o f these spec t ra versus air mass the atmospher i c descriptors Kt Kn DGH and rel at ive humi dity are shown 1n Figshyures 4-6 ( a-f ) The large number of spec t ra at low air mass values is caused by t he opera t i on of the spect roradiometers dur ing normal working hours at midshylat itudes and by the larger air mass values oc curring near sunr ise and sunset whi ch occupy a relat ively smal l frac t i on of the day The large number o f spec tra duri ng relat ively c l ear sky conditi ons i s due t o sdec t i on of clear days for the data taken at SERI the requirement for atmospheric stability during spectral scans and perhaps cl imate types at the three sites Figshyure 4-6 ( c ) shows tha t relat ive humi dity measurements were missing for about 25 global-normal spectra The dif fuse spec tra assoc iated wi th DGH rat i os near 1 0 indi cate very clear condi t i ons where dif fuse measurements are probably within the measurement uncertaint y
20
1200I -
u a
Wmmiddot2)1 I
v+--+--
˜
middot (a) (b) Global normal
(c) Global horizontal (1403
15
InIllDay No 132 19 7 Day No132 1987
Global Normal Spectra 900 to 1 63 0-- 25
clra -Ec bat horizontal Global tilt cJ
N E 800 15 - Q cbull
g 400ctl red - 0 5 ctl I
0 300 500 700 900 11 00 6 8 1 0 12 14 16 18
Wavelength (nm) Time
Day No133 1987 Day No 133 198V
Global normal Global Normal Spectra N 730to 1430 2 5middot Glob tilt
(d) Ec
E 1000
- 500 gctl ctlmiddot- 0 5 -g 1
300 500 700 900 11 00 6 8 1p 12 14 16 18
Wavelength (nm) Time
igure 4-4 Examples pound solar spectra enhanced by cloud bright spots (a) at 1031 on day 132 and (c) at 1230 on day 133 and correspondin [(b) and (d) re pectively] broadband solar radiation J
w111wgt
I
OlDay No 328 1987 0
(a) r1052to 1231 ltt-- 2 5 0
E CDc )E Direct Normal
1 5 Q)C)cro5 05ro
300 500 700 Wavelength (nmr
900 1100
- 25 Ec
E 15
Q)C)cro5 05ro=
Day No 334 1987 1222to 1508
Direct Normal
(b)
300 500 700 900 1100 Wavelength (nm)
Figure 4-5 Examples of direct-normal global-horizontal and diffuseshyhorizontal spectra measured by SERI on two days
Inc luded on the data tape are daily f i eld notes qua l i t y control informa t i on and measuremen t uncertainty Thi s informat i on alert s the user t o problems such as data dropout s ( a s seen in Figure 4-3) and noise in the spectrum (Figshyure 4-7 ) Thi s informa t i on should always be revi ewed when any s pectraL data s e t s are u sed
Phot ographs or s l i de s corre sponding to many of the spectral data s e t s are avai lable at ERI The daily f i eld no t e s that are inc luded wi th the dat a base document the exi s t ence and qual ity of the pho t o s slides
2 2
--------I-
J v l----
r
---
_rV I--
I v
f-
v
I II
I I
___ v -
---- --
I )
-I
v --- --------v f-----
40
TR-3 5 1 3A
LO Direct Normal Spectra vs Air Mass Global Normal Spectra vs Air Mass i40
30ct1E -
lt( 20
1 0 0 400 800 1 200 1 600
40 - -middot 30coE lt( 20
1 0 0 200 400 600 800
ltlil
Number of spectra Number of spectra
Global Horizontal Spectra vs Air Mass Global Tilt Spectra vs Air Mass
40
UJUJco_E -
30 bull
lt( 20
30 coE -
lt( 20
1 0 1 o
Diffuse Spectra vs Air Mass
0 1 00 200 300 400 5000 200 400 600 Number of spectra Number of spectra
40
coE lt(
30
20 bull
1 0 0 1 0 20 30 40
Number of spectra 50
23
I )
v 1-
I--v
( I
)
v --1------I--__
1 I
--l---
If 1
v 1---1-
-_ I---
l u
-----
v I I
----f--e--r-----
I If-
1--- middot
---
100
60
20
Direct Nermal Spectra vs Kn
0 400 800 1200 1600
100
60
0
Direct Normal Spectra vs Kt
400 800 1 200 1600
TR-35 13A
Number of spectra Number of spectra
Figure 4-6 (b) The cumulative number of spectra (horizontal axis) measured over a range of air mass and atmospheric descriptors (vertical axis)
100
60I
20
Direct Norma Spectra vs DirGH
400 soe 1200 160CJ Number of spectra
Direct Normal Spectra vs Rei Hum
6 100
- 60sQ)gt
g 20Q5a 0 400 800 1200 1 600
Number of spectra
c
100
60
20
0
Global Normal Spectra-vs Kn
300 600 900 Number of spectra
Globa Normal Spectm vs DirGHtOO
I 60
20
0 300 600 900 Number of spectra
Global Normal Spectra vs Kt 100
602
20-
0 300 600 900 Number of spectra
Global Normal Spectra vs Rei Hum 100
6E) 60s Q)gt
Q5 20a
a 300 600 900 Number of spectra
Figure 4-6 (c) The cumulative number of spectra (horizontal axis) measured over a range ofmiddot air mass and atmospheric descriptors (vertical axis)
24
f--f--
-I
lJ
1--f-- v
I 1
f--f-
v
1------
1--
( j
---
--
( I
J
1--- -
v
) -----
(
l) __---
v I
1 00
c 60
20
1 00
I 60Q0 20
Global Tilt Spectra vs Kn
0 1 00 200 300 400 500
Global Tilt Spectra vs Kt
Number of spectra
Global Tilt Spectra vs DirGH
Number of spectra
0 1 00 200 300 400 500 Number of spectra
0
1 00
60
20
0 1 00 200 300 400 500
1 00 2-5EE 60 Q)gt-Qi 20a
Global Tilt Spectra vs Rei Hum
1 00 200 300 400 500 Number of spectra
Figure 4-6 (d) The cumulat ive number of spectra (horizontal axis) over a range of air mass and atmospheric descriptors (vertical axis)
Global Horizontal Spectra vs Kn 1 00
c 60
20
0 200 400 600
1 00
60sz
20
Global Horizontal Spectra vs Kt
200 400 600
TR-35 13Amiddot
measured
Number of spectra Number of spectra
Global Horizontal Spectra vs Global Horizontal Spectra vs DirGH Relative Humidity
0
1 00
I 60G
20
0 200 400 600 Number of spectra
0
2-1 00 5EE 60 Q)gt
Qi 20 a
middot
200 400 600 Number of spectra
Figure 4-6 (e) The cumulative number of spectra (horiz ontal axis) measured over a range of a1 r mas s and atmospheric descriptors (vertical axis )
2 5
v-L-
1-----lr--f-
_ v
I
_J7 r
----
v -
_ 1----
___ ---f--
II (
I
r r-[--
r
v---
- 25
1 5
Diffuse Spectra vs Kn 80
70
c 60
50
0 1 0 20 30 40 50
TR-35 13A
Diffuse Spectra vs Kt 85
2 65
75
1 0 20 30 40 50
Number of spectra Number of spectra
Diffuse Spectra vs DirGH Diffuse Spectra vs Relative Humidity
0 1 0 20 30 40 50 0 1 0 20 30 40 50 Number of spectra_ Number of spectra
95 middotE 50
75 Qi 1 0
70
5J
c 30
secta -
Fi gure 4-6 f ) The cumulati ve number of spectra hori zontal axis) measured over a range of air mass and atmospheri c descri ptors verti cal axis)
1 05
r 85
EclE
Clluc m =g
300 500 700 900 1 1 00
05
Day No 2 1 6 1 987 Global Normal Spectra
730 to 1 5 30
Wavelength (nm)
Fi gure 4-7 Exampl es of spectra showi ng noisy data i n the ultravi olet 300shy400 nm) and near-inf rared 1000-1 100 nm) regions
26
5 0 MEASUREMENT UNCERTAINTY
( No t e Thi s s ec t ion contains only a brief summary o f the total uncertainty The deta i l ed reports [ 1 5 1 6 ] on the methods used to e s t imate tota l spect ra l measurement uncertainty should he consul ted- when using thi s datamiddot middot ba se )
The data set de scribed in thi s document i s the bes t set of measurement s posshys ible wi th the personnel equipment methods and cal i brat i on procedure s avai l able t o us We found that making continuous measurements wi th complex s ens i t ive equipment and account ing for all source s o f error in order to specify total mea surement uncertainty were not triviaL tasmiddotkamp oo
The e s t imat ed total uncertainty ( 95 confidence int erval ) for each of the spec troradi ometers and each of the measurement modes is shown in Figure 5-l The upper and l ower spec tral uncertainty limi t s are symmetrical except when gl obal-t i l t or gl obal-hori zontal s pectra were measured us ing the integrat ing sphere and when a s t rong direct-beam component wa s present ( Kt gt 6 0 ) We added an 8 maximum bias to the l ower uncertainty l imi t s for these cases based on resul t s o f experimen t s in whi ch we mapped the integrat ing sphere res ponse under bri ght sun wi th the image o f the sun in di f ferent locations on the ins ide of the sphere During the se exper iment s we observed variat i on s o f up to -8 compared t o the calibrat i on point
The high uncertainty in the abso lute value o f the spectral measurement s l e s s than 0 45 m wa s caused by l ow s pectra l irradiance for the calibrat i on l amp s which resul ted in a l ow s i gnal-t o-no i s e rat io for the spec troradiorriet er cal i shybrat ions ( F igure 5-2) In add i t ion we experienced a change ( i e l o s s o f respon s e ) i n the ultraviolet ( UV ) re sponse of the instruments when us ing the integrating sphere s
To tal uncert ainty i s a combinat i on o f an e s t imated total spectral bias error and to tal spec tral random error The f inal est imated total uncertainty for a 95 conf idence interval i s calculated as the
random (R) error root- sum-s quare of the bias ( B)
erro r plus two t ime s the
To eva luate instrument-to-instrument d i f ferences or variabi l i ty ( al s o called between-inst rument prec i s i on ) s imul t aneous spectral solar radiat i on s c an s were made wi th each ins t rument in each conf igurat i on The s tandard devi a t i on of the se mea surement s mul t i plied by three was converted to a percentage o f the mean Thi s percent age ind icates the expected instrument-to-instrument varibi l i t y or prec i s i on for thi s set of instrumen t s Fi gure S-3 shows the resul t s obtained for one o f these compari sons us ing the integrat ing s phere s Simi lar resul t s oc cur wi th the other conf igurations The between-inst rument prec i s i on above 0 4 m i s close to 5
Temperature control o f the spe ro adiorrieters with s i l icon detectors wa s import ant Figure 5-4 shows the change in the res pori se o f the instrumen t s espec i a l ly in the near- infrared when o perated at d i fferent control temperashyture s Uncertainty of l deg C in the set point resul t s in about a 2 uncertainty in the near-inf rared measurement s On ho t days we found that the t emperat ure
2 7
(
-Lower
r --
I IV
limityen(-)
-
A u1pp r li it +) f I II I
y 1 I rl ( I _ L
-
-
I I )
f--+- -+--+--1-+---+--1- r--J- Upper -c- A I u o t-iE $ == $= =$S y I I I I t (
1 --( -
----L---------------------- -_j_j_J__J__J__J
TR-35 1 3A
20
c(ij 0tQ)ucJ -20
Global (Sphere) 1 02 1 58 1 74
limit (-) Kt lt 60 Upper limit ( +)
Lower Kt gt 60
(a)
20
c(ij 0t
5 -20 L t )ower 1m1 -
300 500 700 900 1 1 00
Wavelength (nm)
Global Normal (Domes) 1 74 2 1 8 (b)
300 500 700 900 1 1 00 Wavelength (nm)
Direct Normal 1 58 1 72 1 74 (c) 20
limit ( +)gt- iQl u Lower 1m1 -) 5 -20
300 500 700 900 1 1 00 Wavelength (nm)
Figure 5-l Estimated total spectral measurement uncertainty f or global measurements with the i ntegrating spheres on (a) units number 102 158 and 174 (b) global-normal measurements with the Teflon dome receivers on units 174 and 218 and (c) directshynormal measurements with the view-limiting tubes on units 158 172 and 174 The measurement uncertainty is synmetrical except in (a) where a -8 bias is included in the lower limit f or global-horizontal and global-tilt cases due to nonunif orm sphere response when a str ong direct-beam component is present
28
I I
0
0 (J) ()
- 1 0
t U
TR 35l3A
Wavelength (nm)
Figure S-2 Comparison of the spectral intensity of an out door global-normal measurement and the NIST calibrationmiddotmiddot lamp source L ow lamp values below 400 nm result in high measurement uncertainty
20
1 5
R 1 0
X 5Q)0c c 0
-5 Q)_0
300 400 500 600 700 800 900 1 000 1 1 00 Wavelength (nm)
Figure S-3 Between-ins trument precis ion for glo bal-normal spectral solar radiation measurements us ing the integrating spheres
29
5 1 deg C N
ij0
()00- caQ)uc
1 000 Q)-Q) 8 0950 0ca
c 0900
0 300 500 700 900 1 1 00
Wavelength (nm)
Figure 5-4 Ratio of the spectroradiometer detector response at different temperatures to the response at 40deg C
o f the detectors ( contro l l er s ) somet imes exceeded the set point and we experienced runaway temperatures Thi s resul ted in ampl i f i er mi l l ivolt drift errors and no i s e in s ome o f the s pectra We achieved better t emperature conshytrol by shield ing the spectroradiometers with Mylar sheet s supported by foam offsets to allow air flow
Mea surement uncertainty for the broadband and meteorological data i s based on the cal ibration hi s tories provided by the mea surement s i t e s and charact ershyi s t i cs of the instrument s Thi s information is given in Tables 5-l through 5-3 and the values are included on the data-ba se tape
In these table s the measurement uncertainty for a 95 confi dence int erval was e s t imated by root-sum-s quaring the est imated bias errors a d by doubl ing the random errors in the cal i brat i on proce s s and measurement s [ 15 1 6 ] Radishyometers used at PGampE in 1987 were po st-cal i brated at SERI allowing e s t imate s of the random calibrat i on error component the radi ometers used i n 1988 were cal ibrated elsewhere so nominal e s t imated errors were used in the uncertainty analys i s Ins t rument s used at SERI were pre- and po st-cal ibrated at SERI Instrument s used at FSEC were cal i brated by FSEC and nominal values for random and bias errors for the s e types of radiometers were used in the uncershytainty analys i s Cal i brat i on informat ion for the meteorological instrument s i s included i n these tables but no mea surement uncertainty analys i s was performed
30
H 11 VI _ w
Jgt
--
IllIll
Tabl e 5- l FSEC Instrument Calibrat ion Hi story Ul d Estimated Meas urement Uncert ainty N-
Es timated Beg i nn ing Calibrat ion Measurement
Channe l iF Meas urement Instrument Comment s Time Stamp Date Uncertainty
( )
1 Direct normal 862961507 Eppley NIP 14306 E6 5-86 ( thermopi l e ) 863520931 Epp l ey NIP 23943E6 12-86 plusmn2 9
8801 2093 1 Eppl ey NIP 23943E6 12-87 1 32 change
2 Global normal 862961507 Eppl ey PSP 24185F3 Eppley PSP 24185F3 1 1-86 1 6 7 change plusmn3 8
872881032 Eppley PSP 18273F3 4-87 880120931 Eppley PSP 24185F3 1 2-87
3 Globa l hori zontal 862961507 Eppl ey PSP 1 43 2 1 F3 4-86 ( thermopi l e ) 8709 3 1 6 3 1 Eppl ey P S P 14322F3 1 2-87 -- plusmn3 8
w _ 872881032 Eppley PSP 143 18F3 4-87
4 G lobal t i l t 86329103 1 872881032
Eppley PSP 24183F3 Eppley PSP l4320F3
1 1-86 4-87 -- plusmn3 8
880120931 Eppley PSP 24183F3 1 2-87
5 D irec t normal 8629 6 1 507 Mat r ix NIP3826 9-86 ( si l i con) 88012093 1 Matrix NIP3826 12-87 1 32 change plusmn2 9
6 Temperature 862961507 Weathermeasure 1 7 7
1420A 6-86 3-87 8-88
smal l changes the cal ibratiqft factor was changed i software
7 Pressure 86296 1507 Weathermeasure 1 70 5 1-86 smal l c anges the 1 7 8 5-87 cal ibra t i on factor was
Hmiddot 6-88 changed i n software
8 Relat ive humi dity 8629 6 1 5 0 7 Weathermeasure 1 54 0 6-86 Cal culated from dew 175 point compared every
o ther week wi th another instrument
9 Wind speed 862961507 Weathermeasure 1 222 7-86 smal l chlnges the 1219 3-87 cal ibrat i o fac tor was ---
6-88 changed in software
J
-
Ill _-
bull I
Table 5-l FSEC Instrument Calibrat ion Hi stb y and Estimated Measurement Uncertainty (Concluded)
Channel Measurement Beginning Time Stamp ihsttument Cal ibrat ion
Date Comment s
Estimated Measurement Uncertainty
( )
INN
10 Albedo 86329103 1
87288103 2
Eppley PSP 1629 FJ Eppley PSP l 106Srl
1 1-86
4-87
-- plusmn3 8
19 Global hori zontal
( si l i con)
862961507
87 148143 1
LI-COR Py PY22J6 LI-COR yt PY2279
7-86
5-87
plusmn3 8 --
Mo wV11-wgt
I
--
p V1 1-
--
--
--
UlIllN-
Tabl e 5-2 PGampE Ins trument Calibrat ion Hi s ory and Estimated Measurement Uncertainty 1 _
Estimated Beginning Pre- Po st-Channe l if Measurement Instrument Comment s Mea surement
Time S tamp Cal ibra t i on Cal ibrati on Uncertainty ( )
l D irec t normal 87 1 100632 Eppl ey NIP 255 08E6 1-86 8-88 0 3 change plusmn2 8 ( thermopi l e ) 880190 752 Eppl ey NIP 255 10E6 12-8 7 -- plusmn3 6
2 G lobal normal 87 1 100632 Eppl ey PSP 2 32 02F3 1-86 8-88 1 7 change plusmn2 4 880190 7 5 2 Epp l ey PSP 23996F3 12-87 -- -- plusmn4 7
3 G lobal hori zontal 8 7 1 1 00632 Eppley PSP 23995E3 10-84 8-88 3 2 change plusmn2 8 w w
( thermopi l e ) 880190 752 Eppl ey PSP 25390F3 12-8 7 plusmn4 7
4 G lobal t i lt 8 7 1 1 00632 Epp l ey PSP 25387F3 12-84 8-88 0 2 change plusmn3 8 -- plusmn4 7 880190 752 Eppley PSP 23201F3 12-87
5 D irec t normal 8 7 1 100632 Matrix NIP 38Hi 5-86 7-88 2 7 change plusmn2 2 ( si li con)
6 Temperature 8 7 1 1 00632 Omega T-coupl e
7 Pres s ure 8 7 1 1 00632 Yel l ow Springs 2014-22 3 1 -HA- 1-WH 15593 3-84
8 Relat ive humi dity 87 1 100632 Hygr o 14276 2-85
9 Wind speed 8 7 1 1 00632 8804007 3 7
Weathert ronics Weathertron i c s
2301 230 1
184 184
9-82 2-88
10
19
Albedo 8 7 1 1 00632 Eppl ey PSP 2 1235F3
Globa l hori zont al 87 1 100632 LI-COR Pyr PY5558 ( s i l i con)
Beginning about 8 7 2 1 1 the s i l i con NI P va lues appear cons i s tent ly l ow
-- 8-88 2 4 change
1 1-83 8-88 1 9 change
may be an al ignment problem
plusmn2 6
plusmn2 6
gt-3 Iw
wgt
-- --
--
-- --
1ftIll -
Table 5-3 SERI Instrument Calibration Hi story and Estimated Measurement Uncertainty =
Estimated Beginning Pre- Post-Channel I Measurement Instrument Comment s Measurement Time S tamp Cal ibration Cal ibration Uncertainty ( )
1 Direct normal 87328 Eppley NIP 1 7828E6 11-87 2-88 1 5 7 change plusmn3 3 ( thermopil e )
2 Global normal None
3 bull Global horizontal 87328 Eppley PSP 1 78 63F3 1 1-87 2-88 2 22 change plusmn3 7 ( thermo pi l e ) a t Welby
w+- At SRRL 8805 7 Eppley PSP 200 79F3 7-87 8-88 0 7 3 change plusmn2 3
4 Global t i l t None
5 Direct normal None ( si li con)
6 Temperature 87328 Taylor Pocket 21430-1 10-86 (Due 10-9 1 )
7 Pressure Cal culated from elevat ion
plusmn0 2 (deg )
8 Relat ive humidity 87328 Dickson 86 100-1 9-87 10-88 -- plusmn2 ( counts )
9 Wind speed Observat ion
10 Albedo -- None
1 1-14 -- Sun photometer ( relative compari sons only)
15 Cloud c over Observed o-3-- lXlIw Global Ho rizontal -- LI-COR Pyr PY1245 11-87 2-88 3 67 change plusmn2 9 V119 ( si l icon) ( s tabi l i ty monitor only) wgt
TR-35 13A
We urge users of the data ba se to refer to the dai l y f i eld no tes for s pe c i a l c i rcumstances recorded b y the operator that may affect data uncertainty The s e no tes include references to the spectroradiometer t emperature c onshyt ro l l e r solar-tracking accuracy and weather cond i t i ons ( such as rain ) Included in the dai l y notes on tbe data-base tape are obs ervat i ons made in qual i t y-control processing as wel l as references to the exi s t ence and qual i t y o f pho t ographs or s l ides
Quant i tat ive pos t-proces s ing qual i ty-control informat i on i s al s o inc luded on t he data-bas e tape and a complete descript ion is given in the appendix o f thi s report Redundant measurement s ( such as before- smiddotcan andmiddot middot aft et-smiddotcan
broadband solar radiat i on direct-norma l and global-hor izont al mea surement s with both thermopile and s i l i con detectors ) and compar i s ons o f integrat ed s pectral so lar radiat ion wi th broadband s o lar radiat i on were used in the qual i ty-control procedure s Users are encouraged to perform the i r own qual i t y-cont rol proce s s ing on the data t o meet their par t i cular requiremen t s
3 5
6 0 FORMAT OF THE DATA TAPE
The meas ured dat a f i eld notes quali ty-control informa t i on and mea surement uncertainty are s t ored on magne t i c tape in 80-character l ines wi th the fi leshyname s given in Table 6- 1 The f i l enaming convent ion used for the mea sured data was
Filename Content
FLA8705 DAT FSEC data 1987 May PGE880 l DAT PGampE data 1988 January SER8 7 1 1 DAT SERI data 1987 November
Data were not acqui red in a l l months so the months may not be cont iguous
Qua l i t y-control informa t i on has the same f i l enaming conven t i on with QC extens ion ( for example FLA8 705 QC ) Dai ly notes are contained in the f i l e s FSEC NOTES PGE NOTES and SERI NOTES respec t i vely The mea surement uncershytainty is in the UNCERT f i l e s
c The DAT f i l e s contain two types of informa t i on D for data and for inst rument configurat ion The f i r s t l ine of a data or confi guration segment beg ins wi th a D or a c re spect ively in the f i r s t column followed by the s i t e year day and t ime stamp the number of l ines in the segment i s in column-s 76-80 so that the user can eas i ly skip the de s i red number of l ine s An example of the information in the conf iguration or 1 1C segment i s
c shown in Figure 6-1 I t begins wi th a followed b y the s i t e FSEC year 11 1 98 7 day 122 and t i me u0830 latitude longi tude and eleva t i on There are 19 channel s for mea surement s zero s pectra in the C segment and 40 l ine s in the segment The con f i gurat ion informa t i on appear s whenever the inst rument set-up or cal ibrat ion wa s changed or t he data acqui s i t ion sys t em wa s res tarted I f the configurat i on wa s not changed at the beginning of the month the configura t i on segment wi l l be in the previous mont h s DAT f i l e
An examp le of a D segment i s shown in Figure 6-2 Thi s segment contains the mea s ured me teoro logical dat a broadband and spectral solar rad i a t i on dat a and anc i l l ary data The data contained in each l ine and column and i t s format are as follows
POS ITION OF VARIABLES IN THE D SEGMENTS (ALL LINES ARE 80 CHARACTERS )
Line Column Cont ent s Format
a = character 1 = integer f = f l oat ing point
LINE 1 1 1 D ( for data ) ( a l ) 3 1 5 Site Year Day Number Time Stamp ( a 1 3 )
3 6 F SEC PGampE o r SERI ( a4 ) 7 8 Year (a2 or i 2 ) 9 1 1 Day Number ( a3 o r i 3 ) 1 2 15 Standard Time ( a4 o r i4 )
36
5-111 - il ll
Da i ly
Uncertainty
-
TR-35 13A -
Table 6 1 Namesmiddot of Files on the Data Tape
Measured and
FSEC
FLA8610 DAT FLA8 6 1 0 QC
FLAB 6 1 1 bull DAT FLA8 6 l l QC
FLA86 1 2 DAT FLA8 6 1 2 QC
FLA8 7 0 1 DAT FLA8 70 l QC
FLA8 704 DAT FLA8 704 QC
FLA8 705 DAT FLA8 7 05 QC
PGampE
PGE8 704 DAT PGE8 704 QC
PGE8 705 DAT PGE8 705 QC
PGE8 706 DAT PGE8 7 06 QC
PGE8 7 0 7- DAT PGE8 7 0 7 QC
SERI
SER87 l l DAT SER8 7 l l QC
S ER8 7 1 2 DAT SER8 7 1 2 QC
SER880 1 DAT SER880l QC
SER8802 DAT SER8802 QC
Ca lcui a t ed Data
FLA8 706 DAT FLA8 706 QA
FLA8 7 0 7 DAT FLA8 7 0 7 QC
FLA8 7 0 8 DAT FLA8 7 0 8 QC
FLA8 709 DAT FLA8 7 09 QC
FLA8 7 1 0 DAT FLA8 7 1 0 QC
FLA8 7 l l DAT FLA8 7 l l QC
PGE8 708 DAT middot
PGE8 708 QC
PGE8 7 0 9 DAT PGE8 709 QC
PGE8 7 l l DAT PGE8 7 l l QC
No t e s
FSEC NOTES PGampE NOTES SERI NOTES
Mea s urement
FSEC UNCERT PGamp E UNCERT SERI UNCERT
FLA8 7 1 2 DAT FLA8 7 1 2 QC
FLA880l DAT FLA880l QC
FLA8 802 DAT FLA8802 QC
FLA8803 DAT FLA8803 QC _
FLA8804 DAT FLA8804 QC
PGE_880l DAT PGE880l QC
PGE8802 DAT PGE8802 QC
PGE8803 DAT PGE8803 QC
3 7 _middot
1 3
1 7
55 1 1-1 TR-3 5 1 3A
0 G) 0 G)G) iC FSEC8 7 1 2 2 0 8 1 3 2 8 4 0 0 0N 80 6 0 0 0W 2M C = 8 7 1 2 2 0 8 1 3 8 7 1 2 2 0 8 1 3+0 0 0 0 0 0 1 9 0 4 0
CHN PARAMETER +- - - - - - - INSTRUMENT- - - - - - - - - -+ +- -CALIBRATION- + OUTPUT FOOT NO TYPE MAKER TYPE SERIAL FACTOR DATE UNITS NOTES
1 Di r- Nor-m Eppley NIP 2 3 9 4 3E6 6 08 1 2 - 186 Wm2 2 Glo Nor-m Eppley PSP 2 4 1 85F3 8 85 l l - 186 Wm2 3 G l o Hor-z Eppl ey PSP l 4 3 2 2F3 6 3 8 1 2 - 2 86 Wm 2 4 Glo Tilt Eppley PSP 2 4 1 83F3 8 9 9 l l - 186 Wm2 iacute5 Dir- N S i MATRIX SI NIP 3826 31 8 0 9 - 186 Wm2 6 Amb Temp WTHRMEAS PRT 1 7 7 l 0 0 3 - 1 8 7 Deq c 7 Sur-f Pr-es WTHRMEAS PIEZO 1 7 8 l 0 0 5 - 1 8 7 Mi l l ibar-8 Re1 Hum WTHRMEAS LiCl 1 7 5 l 0 0 6 - 1 86 Per-cent 9 Wind Spd WTHRMEAS OPT CHOP 1 2 1 9 l 0 0 3 - 1 8 7 Met e r- s i S
1 0 Albedo Epp ley PSP l 6 2 9 7F3 1 0 0 9 l l - 1 8 6 Per-cent l l hot 380 Unused Unused Unused - 9 9 0 0 - 1 - l - 1 Counts iacute1 2 hot 5 0 0 Unused Unused Unused - 9 9 0 0 - 1 - l - l Count s
14 hot 860 Unused Unused Unused - 9 9 0 0 - 1 - 1 - 1 Counts hot 942 Unused Unused Unused - 9 9 0 0 - 1 - l - l Counts
1 5 Opq C loud Unused Unused Unused - 9 9 0 0 - 1 - l - l Tenths 1 6 H2 0 NWS Unused Unused Unused - 9 9 0 0 - 1 - l - l em
Spect l LI -COR L I - 1 8 0 0 PRS - 1 7 2 l 0 0 2 - 1 8 7 W sq m nm l Spect 2 L I - COR L I - 1 800 PRS - 1 0 2 1 0 0 2 - 1 8 71 8 W sq m nm l
1 9 Glo H Si LI -COR L I - 2 0 0S PY2 276 8 4 5 7 - 1 86 Wm2 2 - 1 FIN
FOOTNOTES
1 - 1 7 = DN 18 = GT 2 - SERI l oan un i t
- 1 - FIN
Figure 6-1 Example of the instrument configuration data on the data base tape The numbers refer tmiddotO
1 c indicating configuration 2 FSEC 1987 Day 122 at 8 13 standard time 3 Latitude 4 Longitude 5 Ele vation 6 Reference to configuration file that will be f ound in the
data files 7 Starting data-acquisition time plus number of attempts to
acquire spectra (which would extend the data acquisition time)
8 Number of data channels 9 Number of spectra ( 0 f or configuration files 1 or 2 f or
data files) 10 Number of lines in this segment
38
TR35 1 3A
D FSEC8 7 1 2 2 0 8 1 3 2 8 4 0 0 0N 8 0 6 00 0W 2M C=871 2 2 0 8 1 3 8 7 1 220 814+0 0 0 1 0 0 1 9 2 1 0 0 gS e e Q N FSEC8 7 1 2 2 U PRS - 1 7 2 Col 2 ( + - ) U PRS - 1 0 2 Col 2 ( - ) Col 4 ( + ) 1 7 84 5 5 7 54 5 2 9 3 0 2 - 1 - 9 9 0 3 48 0 1 1 9 48 3 3 4 4 2 7 9 - 1 -9 9 0 1 7 85 0 5 7 5 5 7 2 9 3 0 4 - 1 - 9 9 0 3 4 8 1 1 1 9 4 85 3 4 43 0 1 - 1 - 9 9 0 2 8 4 1 80 0
1 0 9 5 4 1 5 - 99 0 7 1 0 1 7 8 6 2 0 7 8 7 5 8 9 1 5 - 1 - 9 9 0 - 1 - 9 9 0 iacute1 1 3 80 0 - 99 0 Co 1 2 5 0 0 0 - 99 0 Co 1 3 860 0 - 99 0 Co 1 4 942 0 - 9 9 0 Co iacute
- 1 6 0 7 1 5 8 5 7 8 5 6 7 1 58 3 86 9 1 9 9 1 8 7 - 9 0 0 - 9 0 0 - 9 0 0 - 9 0 0 - 9 0 - 9 0 3 1 1 7 4 0 1 3 0 0 1 1 0 0 2 0 57 9 8 9 4 0 0 DNT1 8 4 0 1 3 0 0 1 1 0 0 2 0 2 8 4 1 8 0 0 6 2 4 GTS - 1 0 0 0 0 0 0 0 0 0 0 0 - 1 0 0 0 o o 0 0 0 0 o o
1 3 0 0 0 0 0 0 0 0 3 5 0 0 0 4 0 0 2 1 0 02 5 0 0 14 0 04 1 0 02 1 0 0 5 7 0 0 3 8 amp 1 3 2 0 0 0 7 2 0 056 0 1 0 1 0 0 8 1 0 1 1 8 0 1 2 1 0 1 1 9 0 140 0 138 0 1 3 1 amp 1 340 0 1 4 9 0 16 1 0 162 0 1 5 5 0 16 0 0 1 6 3 0 1 8 5 0 1 9 5 0 1 9 8 0 1 9 9 amp 1 360 0 2 0 9 0 2 1 9 0 228 0 2 4 3 0 258 0 26 5 0 258 0 265 0 268 0 2 89 amp 1 380 0 2 8 0 0 2 7 9 0 26 7 0 2 7 3 0 3 0 1 0 3 08 0 3 1 7 0 326 0 349 0 4 0 2 amp 1 4 0 0 0 4 7 6 0 52 7 0 55 7 0 569 0 580 0 5 9 5 0 6 12 0 63 0 0 64 1 0 648 amp 1 4 2 0 0 652 0 6 54 0 6 58 0 649 0 6 36 0 6 3 2 0 646 0 67 8 0 7 1 8 0 746 amp 1 440 0 7 6 8 0 7 9 9 0 82 2 0 854 0 8 7 7 0 9 0 4 0 9 1 5 0 92 2 0 934 0 94 2 amp 1 460 0 9 6 0 0 964 0 9 7 0 0 9 7 3 0 96 9 0 9 74 0 9 9 0 0 9 9 9 1 0 1 7 1 028 amp 1 4 8 0 1 0 3 3 1 0 25 1 0 0 6 0 9 9 1 0 9 9 0 1 0 1 0 1 026 1 0 3 8 1 043 1 0 4 7 amp 1 500 1 0 3 8 1 034 1 038 1 0 5 1 1 0 58 1 058 1 0 5 1 1 0 3 5 1 0 1 7 1 0 0 7 amp 1 520 1 0 2 0 1 04 1 1 0 5 7 1 063 1 068 1 0 8 1 1 088 1 0 9 3 1 0 9 3 1 0 9 1 amp 1 540 1 0 8 9 1 0 84 1 088 1 0 9 5 1 0 9 7 1 0 9 5 1 0 9 8 1 1 0 2 1 094 1 0 8 7 amp 1 560 1 0 7 8 1 0 7 9 1 08 1 1 0 7 7 1 0 7 2 1 0 7 1 1 0 7 6 1 0 7 8 1 0 7 8 1 0 82 amp 1 580 1 0 9 0 1 0 9 8 1 1 0 1 1 088 1 0 7 4 1 062 1 06 1 1 06 7 1 0 7 4 1 0 80 amp 1 6 0 0 1 082 1 085 1 08 8 1 0 9 2 1 0 9 3 1 0 89 1 083 1 0 7 8 1 0 78 1 0 7 9 amp 1 620 1 0 8 2 1 083 1 0 7 6 1 065 1 0 5 9 1 056 1 06 1 1 0 7 3 1 0 8 0 1 085 amp 1 640 1 0 86 1 084 1 08 1 1 0 7 6 1 067 1 062 1 0 5 2 1 04 2 1 038 1 048 amp 1 660 1 0 7 0 1 086 1 0 9 4 1 0 9 7 1 0 96 1 096 1 09 2 1 0 9 3 1 0 9 1 1 0 89 amp 1 680 1 0 7 9 1 064 1 02 8 0 9 8 0 0 94 3 0 9 3 7 0 954 0 98 0 0 9 9 6 1 0 0 5 amp 1 7 0 0 1 0 0 8 1 0 0 9 1 0 1 3 1 0 1 9 1 0 2 5 1 0 2 2 1 0 0 3 0 9 7 3 0 924 0 8 74 amp 1 7 2 0 0 846 0 842 0 84 8 0 84 9 0 8 54 0 8 7 8 0 9 0 3 0 9 3 1 0 9 52 0 965 amp 1 740 0 9 6 9 0 9 7 7 0 98 3 0 989 0 988 0 9 8 2 0 9 7 6 0 95 0 0 8 81 0 7 6 7 amp 1 760 0 6 1 6 0 5 24 0 54 0 0 646 0 7 7 9 0 8 76 0 924 0 94 5 0 94 7 0 9 45 amp 1 7 8 0 0 94 2 0 94 2 0 9 3 7 0 9 2 6 0 9 1 6 0 9 0 7 0 89 9 0 894 0 8 9 1 0 89 0 amp 1 800 0 888 0 883 0 8 7 9 0 87 5 0 863 0 836 0 8 0 1 0 7 5 7 0 7 2 2 0 7 1 0 amp 1 820 0 7 1 0 0 7 1 9 0 7 3 3 0 74 1 0 7 4 9 0 7 5 7 0 76 3 0 7 7 7 0 7 9 7 0 8 1 0 amp 1 840 0 82 0 0 82 8 0 82 7 0 82 2 0 8 1 5 0 7 9 7 0 786 0 7 83 0 7 8 8 0 7 9 7 amp 1 860 0 80 4 0 8 0 0 0 7 8 8 0 7 8 0 0 7 7 5 0 7 8 0 0 7 8 7 0 786 0 785 0 7 81 amp 1 880 0 7 7 5 0 7 7 4 0 7 7 2 0 767 0 763 0 7 4 7 0 72 1 0 68 2 0 6 30 0 5 88 amp 1 9 0 0 0 57 1 0 5 7 3 0 58 9 0 584 0 568 0 549 0 53 4 0 53 3 0 5 38 0 5 56 amp 1 9 2 0 0 5 7 3 0 57 9 0 56 7 0 526 0 448 0 362 0 2 7 2 0 2 18 0 2 1 0 0 2 32 amp 1 940 0 254 0 262 0 2 5 7 0 253 0 25 7 0 266 0 2 7 5 0 2 85 0 29 9 0 3 1 7 amp 1 960 0 3 33 0 362 0 3 9 6 0 4 3 5 0 4 7 9 0 5 06 0 5 1 5 0 5 1 2 0 5 08 0 5 2 1 amp 1 9 8 0 0 53 7 0 560 0 5 84 0 5 9 7 0 6 0 9 0 6 1 7 0 6 1 8 0 6 2 3 0 62 1 0 6 1 9 amp 1 1 0 0 0 0 6 1 8 0 6 0 7 0 6 0 5 0 6 0 2 0 60 1 0 60 5 0 6 04 0 604 0 604 0 6 0 1 amp 1 1 0 2 0 0 60 1 0 59 5 0 5 9 5 0 5 93 0 589 0 59 0 0 584 0 5 82 0 580 0 5 75 amp 1 1 0 4 0 0 5 7 6 0 5 7 1 0 57 1 0 56 7 0 56 0 0 56 0 0 558 0 552 0 545 0 54 0 amp 1 1 0 6 0 0 5 36 0 53 2 0 5 2 9 0 5 2 5 0 5 1 9 0 5 1 5 0 5 1 2 0 51 1 0 50 9 0 5 08 amp 1 1 0 8 0 0 50 6 0 502 0 4 9 2 0 48 3 0 48 3 0 483 0 46 9 middot 0 4 5 2 0 447 0 3 1 amp 1 1 1 0 0 0 4 1 1 - 9 9 0 0 0 - 9 9 0 0 0 - 9 9 0 0 0 - 9 9 0 0 0 - 9 9 0 0 0 - 9 9 0 0 0 - 9 9 00 0 - 1 582 3 2 2 3 0 0 0 0 0 6 0 0 0 1 0 0 0 4 0 0 1 3 0 0 1 9 0 0 2 3 0 04 1 0 0 5 5 0 064 0 088 amp 2 3 2 0 0 1 0 5 0 1 3 9 0 1 7 9 0 1 8 9 0 2 2 4 0 2 38 0 26 2 0 252 0 261 0 2 64 amp 2 340 0 2 8 7 0 2 9 2 0 266 0 2 88 0 2 98 0 286 0 3 0 0 0 3 0 0 0 2 9 1 0 2 85 amp 2 360 0 296 0 3 1 0 0 3 36 0 367 0 3 9 0 0 3 7 2 0 3 56 0 356 0 3 7 3 0 3 88 amp
Figur e 6-2 Examples of the data on the data-base tape
3 9
TR-3 5 1 3A
16 2 3 24 24 2S 3 3 34 34 3S 3 9 40 40 4 1 S 2 S4 69
54 62
6 3 6 3
6 7 6 7
7 0 7 3
74 7 S
7 6 80
LINE 2
LINE 3
1 3 4 10
1 1 1 3 14 20 2 1 23 24 30 3 1 40 4 1 43 44 SO 5 1 5 3 54 60
Lat i tude ( deg ) N ( north) Longi t ude ( deg ) W ( we s t ) `Elevat i on (m) M (m) Reference t o Conf i guration Segment Start ing year day t ime for the spectral `scan s ) i f any and number of attempt s t o `acquire the s can ( which ind i cates po s s ible `t ime delay from the s tart ing t ime ) middot
Year Day Number Time
11+11 for plus number of attempt s to acquire a s pect rum
Number o f attempt s t o acquire a s pectrum
Po s s ible Number o f Measurement s ( 1 9 )
Number o f Spec tra i n thi s Segment ( 0 1 or 2 )
Number o f Lines in Segment
Pointer to the qua l i ty-cont rol dai ly f i e ld note s and measurement uncertainty informa t ion Qua l i ty-control informa t i on is in the QC f i l e of the same month wi th the same s i t e year day and t ime s t amp Dai l y field notes are i n the NOTES f i l e f o r the same s i t e wi th the same s i t e year and day s tamp Mea surement uncertainty i s in the f i l e s UNCERT under t h e instrument serial number ident i f i ed by PRS-xxx and the column s in the uncertainty f i le s for + and - uncertainty l imi t s
Broadband mea surement s before the spectral scan
Channel fH Direct Normal ( thermopi l e ) (Wm2 ) Channel ffoS Direct Normal ( s i l i con) (Wm2 ) Channel tn Global Normal ( Wm2 ) Channel not used Charinel ffo3 Globa l Hori zontal ( thermop i l e ) ( Wm2 ) Channel fH 9 Gl obal Horizontal ( s i l icon ) ( Wm2 )
( f 8 4 ) ( a 1 ) ( f 9 4 ) ( a l ) ( i S ) ( a l ) ( a l 2 )
( a9 o r i 9 )
( a 1 )
( i 1 )
( i4 )
( i 2 )
( i S )
( a8 0 )
( i 3 ) ( pound 7 2 ) ( i 3 ) ( pound 7 2 ) ( i 3 ) ( f 7 2 )
( i 3 ) ( pound 7 2 ) ( i 3 ) ( pound 7 2 )
40
TR-35 3A
6 1 6 3 64 7 0 7 1 80
LINE 4
LINE 5
1 6
7 1 2
1 3 80
LINE 6
1 3 4 1 0
1 1 1 3 1 4 20 2 1 23 24 3 0
3 1 3 3 34 40 4 1 43 44 5 0 5 1 5 3 5 4 6 0 6 1 6 3 64 7 0 7 1 7 3 7 4 8 0
LINE 7
LINE 8
1 5
6 1 2
Channe l 114 Gl obal Ti l t (Wm2 ) hellipChannel not used
Broad band mea suremen t s a f t e r t h e s p e c t ral s can same format a s beforeshy scan ( LINE 3 )
T i l t o f the f ixed- t i l t i n s t rument s hellipf rom the hor i z ont a l ( d eg )
Az i muth of the f i xed-t i l t ins t rumen t s ( de g ) ( 1 8 0 deg = s outh)
De s c r i p t i on o f any s pec i al i n s t rument ( fo r example d i ffu s e-hori zont a l mea s uremen t s a t SERI )
Channe l IFlOAl bedo (Wm2 ) hellipChannel IH5C l oud Cover ( t enths ) Channel fF7 Surface Pres sure ( mb ) Mea s ured at FSEC and PGampE c a l c u l ated from e l eva t i on a t S ERI [ 1 1 p 1 0 0 ]
Channel 116 Amb i en t Temperature ( deg C ) Channel fiB Rel a t i ve Humi d i t y ( ) Channe l ffo9 Wind S peed ( m s ) Add i t i onal channe l des cri bed 1n l i ne 5 Va l ue Add i t i onal channel descri bed 1n l ine 5 Va l u e
Sun Pho t ometer read ings ( only recorded for SERI dat a not u s ed except for re l a t i ve c ompar i s on s ) hellip
Earth-S un d i s tance c orrec t i on ( d e v i a t i on from 1 0 ) hellip
Ext ra t erre s t r i a l Rad i a t i on (Wm2 ) hellip
( i 3 ) ( pound 7 2 )
( f 6 1 )
( f 6 1 )
( a 8 8 )
( i 3 ) ( 7 1 ) ( i 3 ) ( 7 1 ) ( i 3 ) ( f 7 1 )
( i 3 ) ( pound 7 1 ) ( i 3 ) ( pound 7 1 ) ( i 3 ) ( pound 7 1 ) ( i 3 ) ( variabl e ) ( i 3 ) ( variabl e )
( f5 2 )
( f 7 1 )
4 1
9
42
TR-3S l 3A
1 3 1 8
1 9 24
25 30
3 1 36
3742
43 48
49 68
69 72
13 76
1780
LINE
I
3 6
7 1 1 1216 1 7 20 21 25
2631
3236
3839
40 40
41 42
43 46
Zen i t h Angl e ( deg ) ( f6 2 )
Kt ( ra t i o calculated from ( f6 1 ) thermo p i l e inst rument s )
Kn ( rat i o calculated from ( f6 1 ) thermo p i l e instrument s )
D GH ( ra t i o cal culated from thermopile instrument s ) ( f6 1 )
Albedo ( ) ( f6 1 )
Ai r Mas s ( f6 2 )
Res erved for Turbidi ty i f calculated
Precipi table Water Vapor i f calculated from sun photomet er
Precipi table Water Vapor from the ( f4 1 ) Nat ional Weather Servi ce
Prec i p i table Water Vapor Cal culated from Relative Humid i t y ( f4 1 )
Channel H7 Number o f Wave l engths Recorded by Spect roradi ometer 1
Beginning Wavelength ( nm ) Ending Wavel ength (nm) Wavelength Step Size (nm ) Spectroradi ometer 1 Ti l t from the Horizontal ( deg )
Spectroradiometer 1 Azimuth ( deg )
Angle o f Incidence o f the Direct Beam on Spectroradi ometer 1 ( deg )
Measurement Type ( DN GN GH GT DF )
Attachment ( Tef lon Dome D Integrat ing Sphere S View- l imit ing Tube T )
Channel H8 Number o f Wavel engths Recorded by Spectroradi ometer 2
( i2 )
( i4 )
( i S ) ( i S ) ( f4 1 )
( fS l )
( f6 1 )
( fS 1 )
( a2 )
( a l )
( i 2 )
(i4)
TR-3S l3A
4 7 S l Beginning Wavel ength (nm ) ( i S )
S 2 S 6` Ending Wavel ength ( nm ) ( i S )
S 7 60 Wavelength Step S i z e ( nm ) ( f4 bull 1 )
6 1 6S Spec troradi ometer 1 T i l t from the Hori zontal ( deg ) ( fS l )
6 6 7 1 ` Spect roradi ometer 2 Az imuth ( deg ) ( f6 1 )
7 2 76` Angle of Incidence o f the Direct Beam on Spect rorad i ometer 2 ( deg ) ( fS l )
7 8 7 9 Mea surement Type ( DN GN GH GT DF ) ( a2 )
8 0 80 At tachment ( Teflon Dome D Integrat ing Sphere s View-l imi t ing Tube T ) ( al )
LINE 10 Saved f o r extra spectroradi ometers i f needed
I f no spec tral data were recorded the number of l ines in the D s egment i s 1 0 the number of spectra i s 0 and there i s no corre sponding qual i ty-control information for thi s dat e t ime in the QC f i l e s No qual i ty c ontrol wa s performed because the atmo sphere was uns table I f the number o f spectra i s 1 there are 60 l ines in the D s egment i f there are two spectra t he number o f l ines i s 100
I f middot the number of spectra i s 1 or 2 the spectral data fol low after the f i r s t 1 0 l i nes o f the D segment There are 1 0 spectral measurement s per l ine wi th the number in the lef t-mo s t column indicat ing the f i r s t or second specshyt roradiometer ( 1 or 2 ) f o l l owed by the s tart ing wavelength ( in nanometers ) and t he 10 spectral mea surements ( in Wm2-nm) The 1 0 measurement s are at wave l ength inc rements of 2 nm There are 401 spect ral mea surement s from 300 t o 1 1 0 0 nm in 2-nm s teps with 10 measurement s per line for 40 l ine s and one measurement in the 4 1 s t l ine The l a s t number in the 4 1 s t l ine i s the specshytral integral I f a second s pectrorad i ometer wa s used the next 4 1 l ines folshylow t he same format Blank 1 ines follow the spec tral data t o f i l l the D segment to 60 or 100 l ines
An example of a QC f i l e i s shown in Figure 6-3 The f i r s t l ine o f each segment begins with a Q f o l l owed by the s i t e year day number and t ime s tamp with the number of l ines in the segment given in the l a s t col umn s o f the l ine Following the iden t i fier are me s sage s about var iables that were flagged by the automat i c qua l i ty-control proc e s s ing ( s ee appendi x ) noted by an operator at the measurement s i t e or noted dur ing inspec t i on at SERI The l a s t l ine of the segment shows the QC code for as DN ( direct normal thermopile detect o r ) SN ( d i rect normal detector ) AL
var iabl e s such s i l i con
( a lbedo ) and SP ( s pectrum) a s de s c r i bed in the appendi x Three qual i tyshycontrol code s ar8 used 1 = good 2 = suspec t see me s sages and dai ly not e s and 3 = poor or mi s s ing see me s s ages and da i l y no te s The broadband codes ( DN SN GN GH SH and GT ) have two value s the f i r s t is the before- scan measurement and the second is the after-s can mea surement
4 3
TR-35 13A
Q FSEC87 1 2 1 0 7 3 1 4 Noise in GH spectrum in UV QCDN1DN1SN1SN1GN1GN1GH1GH1SH1SH1GT1GT1AL1AP1PR1TC1RH1WV1WS1KT1KN1DG1SPl iN1SP2IN2
Q FSEC8 7 1 2 1 0 8 3 0 8 SN bef SN af t = 1 0 5 5 S H bef SH aft = 1 0 5 3 2nd Int BB b e f = 0 636 2nd Int BB aft = 0 6 5 1 Noise in GH spectrum i n UV QCDN1DN1SN2SN2GN1GN1GH1GH1SH2SH2GT1GT1AL1AP1PR1TC1RH1WV1WS1KT1KN1DG1SP1 IN1SP2IN2
Q FSEC8 7 1 2 1 1 0 3 1 3 QCDN1DN1SN1SN1GN1GN1GH1GH1SH1SH1GT1GT1AL1AP1PR1TC1RH1WV1WS1KT1KN1DG1SP1 IN1SPl iNl iacute
Q FSEC87 1 2 1 1 1 3 1 3 QCDN1DN1SN1 SN1GN1GN1GH1GH1SH1SH1GT1GT1AL 1AP1PR1TC1RH1WV1WS1KT1KH1DG1SP 1 IN1SP1 IN1
Q FSEC8 7 1 2 1 1 2 3 1 3 QCDN1DN 1SN1SN1GN1GN1GH1GH1SH1SH1GT1GT1AL1AP1PR1TC1RH1WV1WS1KT1KN1DG1 SP1 IN1SP 1 IN1
Q FSEC8 7 1 2 1 1 3 3 1 3 QCDN1DN1SNlSNlGNlGN1GH1GH1SH1SH1GTlGTlALlAPlPRlTClRHlWVlWSlKTlKNlDGlSP l iNlSPliNl
Q FSEC8 7 1 2 1 1 4 3 1 3QCDNlDNlSNlSNlGNlGNlGHlGHlSHlSHlGTlGTlALlAPlPRlTClRHlHVlHSlKTlKNlDGlSPl iN1SP1IN1 Q FSECB7 1 2 1 1 554 3 QCDNlDNlSNlSNlGNlGNlGHlGHlSHlSHlGTlGTlALlAPlPRlTClRHlWV1WSlKT1KN1DG1SP 1 IN1SP l iN1
Q FSEC8 7 1 2 1 16 3 0 3 QCDNlDNlSNlSNlGNlGNlGHlGHlSHlSHlGTlGTlALlAPlPRlTC1RH1WV1WSlKTlKNlDG1SP l iNlSPl iNl
Q FSECB 7 1 2 1 1 7 3 1 5 GH bef SH bef = 0 9 3 1 GH aft SH af t = 0 9 3 3 QCDN1DN1SN1SN1GN1GNlGH2GH2SH2SH2GTlGT1ALlAPlPRlTClRHlWVlWSlKTlKNlDGlSPl iNlSPl iNl
Q FSECB 7 1 2 2 0 7 3 1 3 QCDNlDNlSNlSNlGNlGNlGHlGHlSHlSHlGT1GTlALlAPlPRlTClRHlWVlWS 1KT1KNlDGlSP l iNlSPl iNl
Figure 6-3 Example of quali ty-control inf ormation on the data- base tape
Figure 6-4 shows an exampl e of a segment of the daily notes from the FSEC NOTES f i l e Each segment of the f i l e beg ins wi th an followed b y the s i t e year and day number s t amp with the number of l ines in the segment given in the last columns of the l i ne The next l ine contains the s i te operashytor log sheet number month day year day number spectroradi ometer serial number( s ) and mea surement mode( s ) The PGampE and SERI not e s do not include the dai ly l og sheet number The f i rst two l ines are followed by f i eld no te s No tes that were added after inspec t i on at SERI are s eparat d from the operator notes wi th ------- The exi s tence of s l ides or photographs i s ind i cat ed a s wel l a s their qua l i ty i e good ( G ) marginal ( M ) or poor ( P ) In the exampl e in thi s f i gure there were two log sheets for thi s day (number 1 1 6 and 1 1 7 ) because the mea surement mode changed from gl obal hor i z onshytal ( GH ) to global t i l t ( GT )
44
TR-3513A
N FSEC87 1 2 2 1 1 6 0 5 0 2 8 7 1 2 2 1 7 2 DN 1 0 2 GH Clear at 0 7 3 0 GH f o r f ir s t two s cans then GT S l i de s 0 6 3 2 G
0 7 3 3 G 0 8 3 3 G 0 9 3 3 H ( dark ) 1 0 3 3 p1 1 3 3 p1 2 3 3 p 1 3 3 3 p1433 H 1 5 3 3 G 1633 G 1733 G
1 1 7 0 5 0 2 87 1 2 2 1 7 2 DN 1 0 2 GT GT s tart ing at 0 8 0 0 iacuteC lear a t 0 8 0 0 iacuteS l ides S e e above
16 1 1 8 0 5 0 3 8 7 1 2 3 1 7 2 DN 1 0 2 GT Clear at 0830 S l i de s 0633 G
0733 G 0833 G 0933 H ( dark ) 1 0 3 3 p1 1 3 3 p 1233 p 1333 p1433 H 1533 G 1633 G 1733 G
N FSEC87 1 2 3
Figure 6-4 Examples of daily notes on the data-base tape
An example o f a segment of the measurement uncertainty file UNCERT CAL i s shown in Figure 6-5 The f i r s t l ine begins with a U followed by the serial number of the s pect rorad i ometer The upper and lower measurement uncertainty l imi t s are given in the co lumns fol lowing wavelength wi th the appropri a t e measur ement mode dat es and de script ion at the top o f the column The s econd l ine in each segment o f the DAT f i l e s is a pointer to the correct uncershytainty information in UNCERT CAL The broadband s o lar radiat i on and meteshyorolog ical instrument measurement uncertainty fol lows each spectra l measureshyment uncertainty segment in UNCERT CAL
The format o f thi s data ba se was es tabl i shed at SERI t o accommodat e expanded mul t i year long-term data collect ion Users can reformat the data t o suit their part icular needs We recommend the following s t eps for acce s s ing and document ing parti cular data set s
1 Se lect and extract the des ired spectral data from the DAT f i l e s us i ng in formation such as measurement mode day number t ime air mas s or a moshys pheric condi t ions depending on the de s i red attribut es
2 Ex trac t and review the corres ponding segment s of the qua l i ty-cont rol i n format i on from the QC f i l es
3 Ex trac t and review the corres pond ing field no tes from the NOTES f i l e s
4 5
+ I -
5 4
3 7
TR- 3 5 13A
U PRS - 1 0 2 L I -COR PRS - 1 0 2 i
1 2 3 4 5 Ill
Wav GHS GHS GHS GHS GTS GTS GTS GTS Kt gt 6 0 Kt gt 6 0 Kt gt 60 Kt gt 6 0 iacutel ower lower upper upper 2 8 7 - 8 8 7 -8 8 7 5 8 8 GNS GNS
upper upper lower l ower
+ 1 -
- GHS GHS GTS GTS Kt lt 60 Kt lt 6 0 upper uppe r l ower l ower + I - + I -2 8 7 - 8 8 7 -8 87 5 - 8 8
3 0 0 - 1 0 0 0 - 1 00 0 1 0 0 0 1 0 0 0 3 0 2 - 1 0 0 0 - 1 0 0 0 1 0 0 0 1 0 0 0
4 0 0 - 2 3 3 - 1 7 1 1 5 3 9 1 4 0 2 iacute -2 2 0 - 1 7 3 1 4 0 9 3
5 0 0 - 1 3 4 - 1 1 7 3 7 5 0 2 iacute - 1 3 3 - 1 1 7 5 3 3 7
6 0 0 - 1 1 8 - 1 1 1 3 8 3 1 6 0 2 - 1 1 9 - 1 1 1 3 9 3 1
7 0 0 - 1 1 5 - 1 0 7 3 5 2 7 7 0 2 - 1 1 3 - 1 0 7 3 3 2 7
8 0 0 - 1 1 6 - 1 0 6 3 6 2 6 8 0 2 - 11 7 - 1 0 6 3 7 2 6
9 0 0 - 1 1 2 - 1 0 5 3 2 2 5 9 0 2 - 1 1 4 - 1 0 8 3 4 2 8
1 0 0 0 - 1 1 7 - 1 0 8 2 8 1 0 0 2 - 1 1 8 - 1 0 8 3 8 2 8
1 1 0 0 - 1 2 9 - 12 2 4 9 4 2
Figure 6-5 Examples of spe ctral measurement uncertainty on the data-base tape A value of plusmn100 indi cates greater t han 100 measurement uncertainty
46
TR-35 13A
4 Extract the measurement uncertainty information from the 1 1 UNCERT f i l e s and quot e mea surement uncertainty for a l l data used
5 Examine the dai l y broadband and spec tral solar radiatio data graphs in the catalog ( Volume I I of thi s report [ 1 8 ] i f avai labl e These graphs provide informa t i on on atmo spheric condi t i ons during the day For exampl e Figure 4-3 shows dai l y broadband and spec tral plot s for part ly c loudy condi t i ons when s olar rad i a t i on i s changing rapidly throughout the day The sun i s obs cured when the direc t-normal values drop t o zero and the gl obal value s approach each o ther Figure 4-1 shows a clear daybull
No data should be used wi thout consult ing the qua l i ty-control informa t i on dai ly no tes and measurement uncertainty
4 7
Cel l s
Ce l l s
Energy
Meteorologi cal Society
Appl i ed Meteorol ogy
Energy
Radiat ion Topical Overview Solar Cel l s Vo l 1 8
of the Pho tovo l t a i c s and Insolat ion Mea sureshySolar Vol 1 8 1 986 pp 393-3 9 5
TR-35 1 3A
1 0 REFERENCES
1 Hul st rom R L Solar 1 986 PPbull 1 7 9- 1 8 7
2 Hul st rom R L A Summary ments Workshop Panel Resul t s
3 Hul strom R L Re sul t s of the Amorphous S i l i con Mea surement s Ta sk Force Solar Cel l s Vo l 18 1 986 pp 1 7 1-1 7 7
4 Hul strom R L and J M Ohi Resul t s of the SERI Mul t i junction Devi ce Efficiency Measurement Task Forc e pre sented at the 20th I EEE Photovo lshytaic Spec ial i s t s Conference September 1 988
5 Riordan c and R L Hul s t rom Summary of S tud i e s that Examine the Effec t s of Spect ral Solar Radition Vari at ions on PV Device Des ign and Pershyformance SERI-TR-2 15-343 7 Golden CO Solar Energy Research Ins t i tute 1989
6 Riordan c Joint EPRI-SERI Spectral Solar Rad i a t i on Database Pro j ec t
1
8
9
1 0
1 1
1 2
1 3
14
Solar Vol 2 1 1 98 7 pp 3 3 7-342
Riordan c D Myers M Rymes R Hul strom W Mar i on c Jenning s and c Whi taker Spectral Solar Radiat ion Data Bas e at SERI Solar Vol 42 No 1 1 989 PP bull 6 7-79
Riordan C J T L Stoffe l and R L Hul s trom The Effect s of Urban Air Pollut ion on Solar Radiat i on SERI-TR-2 15-3482 Golden CO Solar Energy Res arch I n s t i tute ( draft ) 1989
Riordan c and R Hul s t rom The SERI Re s ource As ses sment Project s Plan for Col l ect ing Spectral-Solar-I rradiance Data SERI -TR-21 5-2948 Gol den CO Solar Energy Re search Ins t i tut e 1986
Shaw G E Sun Pho tometry Bul letin Ameri can Vol 64 No 1 January 1983 pp 4-10
Iqbal M bull An Int roduction to Solar Radiation New York Academic Pre s s
1983
Bartel s R A Comment s on Prec ipi table Water Mea surement s with Sun Photometer s Journal of Cl imate and Vol 25 1 986 PP bull 1 788- 1 789
Leckner B The Spectral Distribution o f Solar Radiat ion at the Earth s Surface -- El ements of a Model Solar Vol 20 1 9 7 8 pp 143- 1 5 0
Cannon T W Spectral So lar Irradiance Instrumentat i on and Measurement Techniques Solar Cel l s Vol 1 8 1986 pp 2 3 3-24 1
48
Energy
Photogrammetric Engineering
TR 3 5 13A
1 5 Myers D R E s t imate s of Uncertainty for Measured Spec tra in the SERI Spectral Solar Radiat i on Data Base ac cepted by Solar 1 98 9
1 6 Myers D R E s t imates of Uncertainty for Measured Spectra in the SERI Spec tral Solar Radiat i on Data aa s e 11 SERI e_clmical Report Golden CO S o l ar Energy Res earch Ins t i tute ( draft ) 1989
middot
1 7 Hul s trom R L The Cl oud Bright Spo t 1 9 73 PP bull 3 7 0-3 7 6
18 Ri ordan c D Myer s and R Hul s t rom Spectral Scflar Raltfiation Data Base Documentat i on and User 1 s Manual Vo lume I I SERI-TR-2 15-3 5 1 3 Golden CO Solar Energy Re search Ins t i tut e 1989
49
TR- 3 5 1 3A
APPENDIX
QUALITY-CONTROL PROCESSING
Limi ted qua l i ty-control proces s ing wa s appl i ed to the data ba se as de s c r i bed below The resul t s are i n the QC f i l es on the data-base t ape by s i t e year and mont h For examp l e
FLA8705 QC i s FSEC 1 98 7 May PGE8 80 l QC i s PGampE 1 9 8 8 January SER8 7 l l QC i s SERI 1 98 7 November
These f i l e s correspond t o the 11 OAT f i les for the s ame s i t e year and month Each data segment that includes a spectrum wa s proces sed through thi s quali ty-control procedure I f the atmospheric cond i t i on s were uns tab l e and a spectrum was not acquired the broadband and meteorologi cal data were inc l uded on the data-base tape but no qua l i ty-contro l proc e s s ing wa s app l i ed
An example o f a segment of a 11 QC f i l e i s shown in F i gure 6-3 The f i r s t Q l ine beg ins wi th a fol l owed by the s i t e year day and t ime s tamp The
last columns give the number of l ines in the s egment so the user can skip to the next s egment Fo l l owing the f i r s t l ine are me s sages that were printed whenever the qua l i ty-control proce s s ing f lagged a suspect or poor value
Following the mes sages in an SO-character QC l ine l i s t ing the variables that were examined are one of three qua l i ty-control code s 1 good 2 marg inal or suspect and 3 mi s s ing or poor The QC l ine was prepared using an automa t i c ( computeri zed ) check of the variabl e s and manual edi t ing to include informashyt ion from correspondence l og sheet s and vi sual inspe ct i on Addi t i onal me sshysages were added above the QC l ine if appropriate
The two-charact er descriptors in the QC l ine are
DN Direct-normal ( thermopi l e ) solar radiat ion before the spectral s can DN Direct-normal ( thermopi l e ) so lar radiation after the spectra l scan SN Direct-normal ( s i l i c on ) before SN Direct-normal ( s i l i c on ) after GN Globa l-normal before GN Globa l-normal after GH Globa l -horizontal ( thermop i l e ) before
WS Wind Speed KT KKN K
t n
GH Global-hori zontal thermopil e ) after SH Global-hori zontal ( s i l i con ) before SH Global-hori zontal ( s i l icon ) after GT Global-t i l t before GT Gl obal- t i l t after AL Al bedo ( Wm ) AP Albedo ( ) PR Surface Pres sure TC Temperature ( deg C ) RH Relat ive Humi dity WV Water Vapor ( al culated from rel a t i ve humidity)
5 0
S- flllit = - ( middotmiddot middot
( e g Wm2 )
TR-3 5 1 3A
DG D GH SP F i r s t Sp qtrum I T Integral of t he F i r s t Spec t rum SP Second Spectrum IT I nt egral of the - Second SpecttUI11
The aut oma t i c tes t s that were performed to det ermine the QC code fol l owing each var iable were
( a ) Check for mi s s ing or negat ive values for the broadband solar radiashyt i on meteoro l og i cal or a tmo spheric dat a or the spec t ral integral s
lt 0 = Code 2 Mi s s ing ( - 9 or -9 9 ) = Code 3
( b ) Check for atmo spheric or broadband instrument instab i l i ty us ing the difference and rat i o o f the before- and aft er-scan values and redundant mea surement s if nei t her values are negat i ve or mi s s ing
DN before DN after if the abs lute d i fference SN before SN after i s gt10 Wm DN beforeSN before 5 of 200 DN before SN after and GH before GH after SH beforeSH after the rat io i s lt0 95 or gt1 05 each of the GH before SH before two var iables = GH afterSH after or middot GN beforeGN after the rat i o i s lt0 90 or gt1 10 each of the GT beforeGT after two var iable s = Code 3
Code 2
( c ) Check for DN gt GN or GN gt ETR ( extraterre s trial solar radiat i on ) us 1ng rat ios of the var iabl e s
DN before GN before gt0 95 each variable = Code 2 DN afterGN after gt 1 0 each var i able = Code 3 GN before ETR GN afterETR
( d ) Check for values o f Kt Kn and DGH tha t are too high
KT ( invo lves GH before and after and KT ) KN ( involves DN before and after and KN ) DG ( invo lves DN and GH before and after and DG )
gt0 9 5 each variable = Code 2 gt 1 0 each var iable = Code 3
( e ) Check the s pe c t ral integral s for unusual rat i o s to the corresponding broadband so lar radiat ion value
IT ( Broadband va lue before and after )
For d i rect s pe c t ra lt 0 6 or gt0 8 5 I T = Code 2 For gl obal s pe c t ra lt0 7 o r gt0 95 I T = Code 2
For d i rect and g l obal s pec t ra lt0 5 or gt l O IT = Code 3
5 1
TR-35 13A
We sugge s t that users of the data ba s e develop a computer program to acc e s s fields i n the Q C l ine and t o print the me s sages Thi s l imi ted qua l i ty cont rol wi l l not f lag a l l po s s ible errors and addi t i onal t e s t s should be applied depend ing on the users requi rement s and appl icat i on s
52
1 1 2
Document Control SEAl Report No
Page 4 Title and Subtitle
NTIS Accession No 3 Recipients Accession No SERI TR- 2 1 5-35 13A DE89009447
5 Publication Date
January 1990 Sp ectral Solar Radiation Data Base Documentation
6Vo lume I
7 Author(s) 8 Performing Organization Rept No
9 Performing Organization Name and Address 10 ProjectTaskWork Unit No
1 1 Contract (C) or Grant (G) No
(C)
(G)
1 2 Sponsoring Organization Name and Address 13 Type of Report amp Period Covered
Solar Energy Res ear ch Ins titute Technical Repor t 1 6 1 7 Col e Boulevard Golden Colorado 804 0 1-3393 1 4
1 5 Supplementary Notes
16 Abstract (Limit 200 words) The Solar Energy Research Ins titute ( SERI) Electric Power Research Ins titute Flor ida Solar Energy Center and Pacific Gas and Electric Company cooperated to produce a spec tral solar radiation data base representing a range of atmospheric conditions These data will help to characterize the natural variab ility in the spectral (color) content o f outdoor solar radiation so that the sensitivity of spec trally selective solar devices ( such as photovoltaics ) to these variations c n b e s tudied quant itatively Volume I o f this report documents the history approach content and format of the data base Volume II contains graphs and field no tes for each of the spectral data sets The data res ide on magnetic tape at SERI
1 7 Document Analysis
a Descriptors Spec tral solar radiation broadband solar radiation met eorological
data sp ectroradiometers
b IdentifiersOpen-Ended Terms
c UC Categories
233 234
18 Availabil ity Statement
National Technical Information U S Depar tment of Commerce 5 285 Port Royal Road Springfield Virginia 2 2 1 6 1
Service 19 No of Pages
60
20 Price
A04
Form No 0069 (6-30-87)
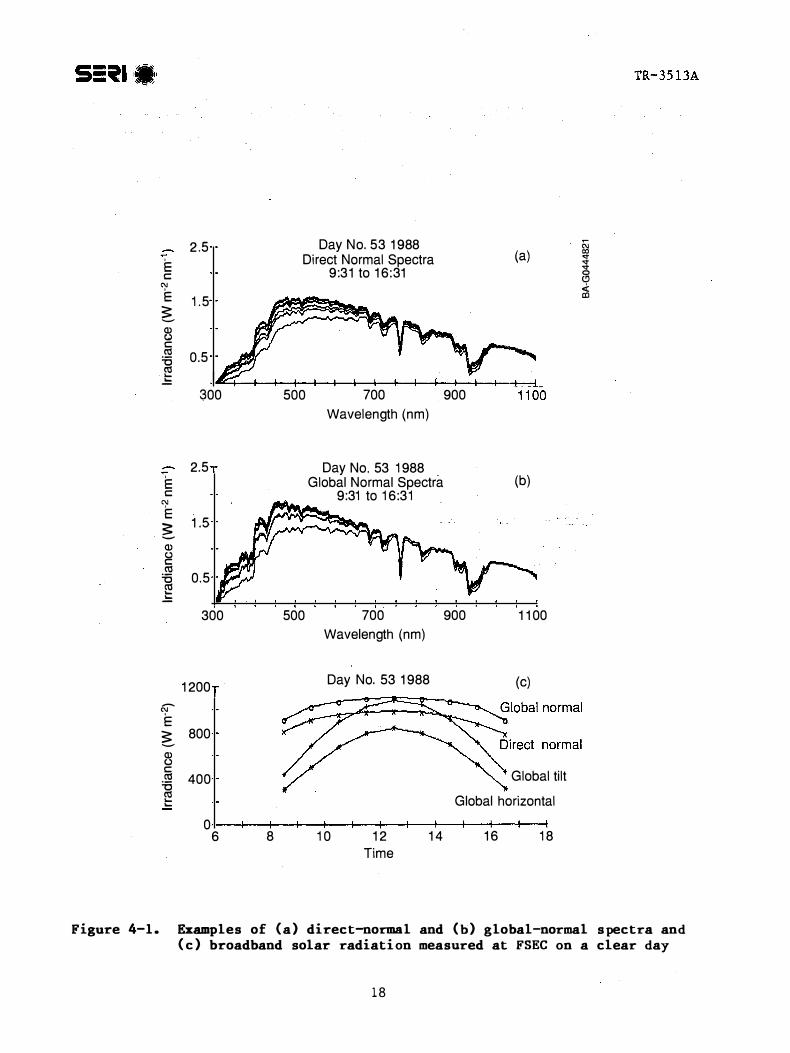
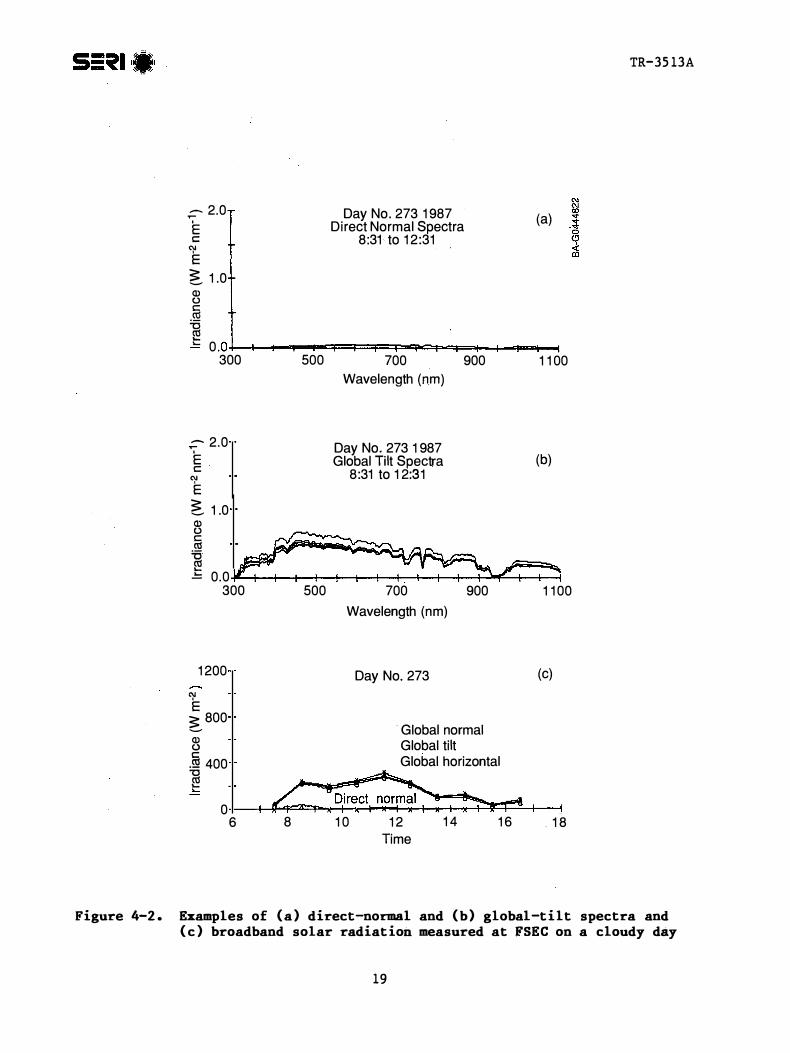
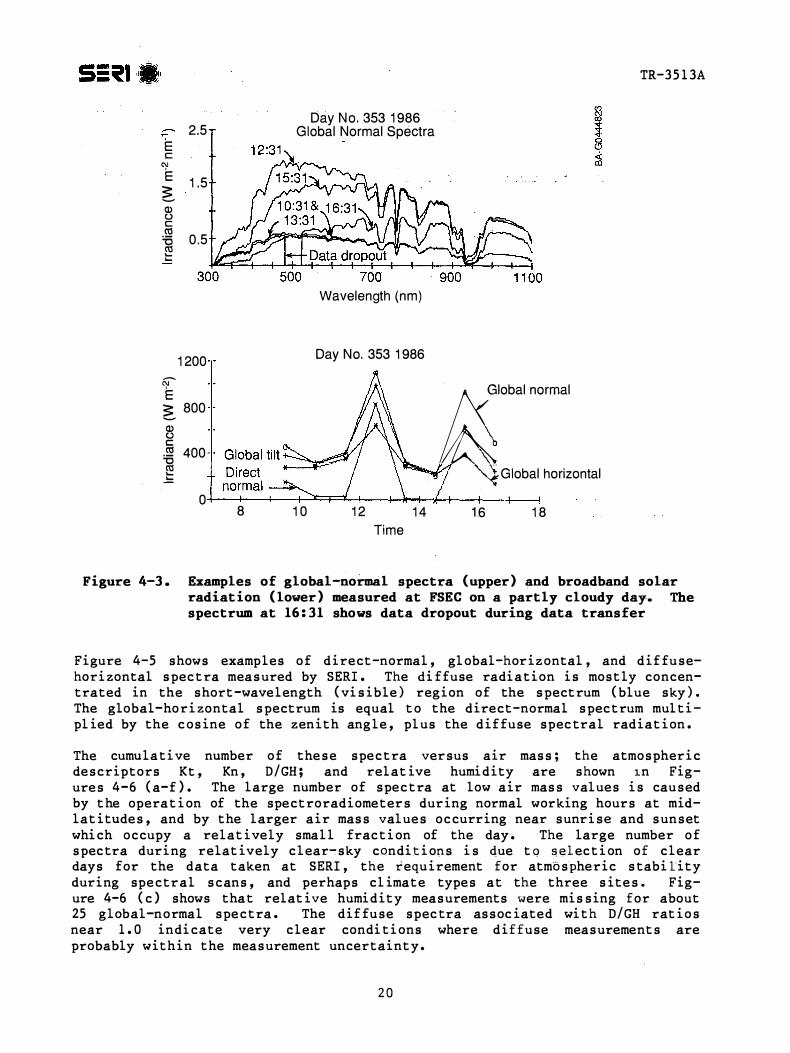
I
EcCl
25
E 1 5
Q)()cctl 05
Day No 353 1 986 Global Normal Spectra
Wavelength (nm)
Day No 353 1 986
Fi gure 4-3 radi ati on (lower) measured at FSEC on a partly cloudy day The
-ClE Q)()cctl
1 200
800
400
0
Time
lilobal normal
8 1 0 1 2 1 4
Global horizontal
16 1 8
TR-3 5 1 3A
Examples of global-normal spectra (upper) and broadband solar
spectrum at 1631 shows data dropout duri ng data transfer
Figure 4-5 shows examples o f d i rect-normal gl obal-hor izontal and d i f fuseshyhorizontal spec t ra measured by SERI The di ffuse radi a t i on is most ly concenshytrated in the short-wavelength ( visible) region of the spect rum ( blue sky) The global-ho r i zontal spectrum is equal t o the direct-normal spec t rum mul t i shypl ied by the c osine o f the zenith angle plus the diffuse spec tral radiat i on
The cumula t i ve number o f these spec t ra versus air mass the atmospher i c descriptors Kt Kn DGH and rel at ive humi dity are shown 1n Figshyures 4-6 ( a-f ) The large number of spec t ra at low air mass values is caused by t he opera t i on of the spect roradiometers dur ing normal working hours at midshylat itudes and by the larger air mass values oc curring near sunr ise and sunset whi ch occupy a relat ively smal l frac t i on of the day The large number o f spec tra duri ng relat ively c l ear sky conditi ons i s due t o sdec t i on of clear days for the data taken at SERI the requirement for atmospheric stability during spectral scans and perhaps cl imate types at the three sites Figshyure 4-6 ( c ) shows tha t relat ive humi dity measurements were missing for about 25 global-normal spectra The dif fuse spec tra assoc iated wi th DGH rat i os near 1 0 indi cate very clear condi t i ons where dif fuse measurements are probably within the measurement uncertaint y
20
1200I -
u a
Wmmiddot2)1 I
v+--+--
˜
middot (a) (b) Global normal
(c) Global horizontal (1403
15
InIllDay No 132 19 7 Day No132 1987
Global Normal Spectra 900 to 1 63 0-- 25
clra -Ec bat horizontal Global tilt cJ
N E 800 15 - Q cbull
g 400ctl red - 0 5 ctl I
0 300 500 700 900 11 00 6 8 1 0 12 14 16 18
Wavelength (nm) Time
Day No133 1987 Day No 133 198V
Global normal Global Normal Spectra N 730to 1430 2 5middot Glob tilt
(d) Ec
E 1000
- 500 gctl ctlmiddot- 0 5 -g 1
300 500 700 900 11 00 6 8 1p 12 14 16 18
Wavelength (nm) Time
igure 4-4 Examples pound solar spectra enhanced by cloud bright spots (a) at 1031 on day 132 and (c) at 1230 on day 133 and correspondin [(b) and (d) re pectively] broadband solar radiation J
w111wgt
I
OlDay No 328 1987 0
(a) r1052to 1231 ltt-- 2 5 0
E CDc )E Direct Normal
1 5 Q)C)cro5 05ro
300 500 700 Wavelength (nmr
900 1100
- 25 Ec
E 15
Q)C)cro5 05ro=
Day No 334 1987 1222to 1508
Direct Normal
(b)
300 500 700 900 1100 Wavelength (nm)
Figure 4-5 Examples of direct-normal global-horizontal and diffuseshyhorizontal spectra measured by SERI on two days
Inc luded on the data tape are daily f i eld notes qua l i t y control informa t i on and measuremen t uncertainty Thi s informat i on alert s the user t o problems such as data dropout s ( a s seen in Figure 4-3) and noise in the spectrum (Figshyure 4-7 ) Thi s informa t i on should always be revi ewed when any s pectraL data s e t s are u sed
Phot ographs or s l i de s corre sponding to many of the spectral data s e t s are avai lable at ERI The daily f i eld no t e s that are inc luded wi th the dat a base document the exi s t ence and qual ity of the pho t o s slides
2 2
--------I-
J v l----
r
---
_rV I--
I v
f-
v
I II
I I
___ v -
---- --
I )
-I
v --- --------v f-----
40
TR-3 5 1 3A
LO Direct Normal Spectra vs Air Mass Global Normal Spectra vs Air Mass i40
30ct1E -
lt( 20
1 0 0 400 800 1 200 1 600
40 - -middot 30coE lt( 20
1 0 0 200 400 600 800
ltlil
Number of spectra Number of spectra
Global Horizontal Spectra vs Air Mass Global Tilt Spectra vs Air Mass
40
UJUJco_E -
30 bull
lt( 20
30 coE -
lt( 20
1 0 1 o
Diffuse Spectra vs Air Mass
0 1 00 200 300 400 5000 200 400 600 Number of spectra Number of spectra
40
coE lt(
30
20 bull
1 0 0 1 0 20 30 40
Number of spectra 50
23
I )
v 1-
I--v
( I
)
v --1------I--__
1 I
--l---
If 1
v 1---1-
-_ I---
l u
-----
v I I
----f--e--r-----
I If-
1--- middot
---
100
60
20
Direct Nermal Spectra vs Kn
0 400 800 1200 1600
100
60
0
Direct Normal Spectra vs Kt
400 800 1 200 1600
TR-35 13A
Number of spectra Number of spectra
Figure 4-6 (b) The cumulative number of spectra (horizontal axis) measured over a range of air mass and atmospheric descriptors (vertical axis)
100
60I
20
Direct Norma Spectra vs DirGH
400 soe 1200 160CJ Number of spectra
Direct Normal Spectra vs Rei Hum
6 100
- 60sQ)gt
g 20Q5a 0 400 800 1200 1 600
Number of spectra
c
100
60
20
0
Global Normal Spectra-vs Kn
300 600 900 Number of spectra
Globa Normal Spectm vs DirGHtOO
I 60
20
0 300 600 900 Number of spectra
Global Normal Spectra vs Kt 100
602
20-
0 300 600 900 Number of spectra
Global Normal Spectra vs Rei Hum 100
6E) 60s Q)gt
Q5 20a
a 300 600 900 Number of spectra
Figure 4-6 (c) The cumulative number of spectra (horizontal axis) measured over a range ofmiddot air mass and atmospheric descriptors (vertical axis)
24
f--f--
-I
lJ
1--f-- v
I 1
f--f-
v
1------
1--
( j
---
--
( I
J
1--- -
v
) -----
(
l) __---
v I
1 00
c 60
20
1 00
I 60Q0 20
Global Tilt Spectra vs Kn
0 1 00 200 300 400 500
Global Tilt Spectra vs Kt
Number of spectra
Global Tilt Spectra vs DirGH
Number of spectra
0 1 00 200 300 400 500 Number of spectra
0
1 00
60
20
0 1 00 200 300 400 500
1 00 2-5EE 60 Q)gt-Qi 20a
Global Tilt Spectra vs Rei Hum
1 00 200 300 400 500 Number of spectra
Figure 4-6 (d) The cumulat ive number of spectra (horizontal axis) over a range of air mass and atmospheric descriptors (vertical axis)
Global Horizontal Spectra vs Kn 1 00
c 60
20
0 200 400 600
1 00
60sz
20
Global Horizontal Spectra vs Kt
200 400 600
TR-35 13Amiddot
measured
Number of spectra Number of spectra
Global Horizontal Spectra vs Global Horizontal Spectra vs DirGH Relative Humidity
0
1 00
I 60G
20
0 200 400 600 Number of spectra
0
2-1 00 5EE 60 Q)gt
Qi 20 a
middot
200 400 600 Number of spectra
Figure 4-6 (e) The cumulative number of spectra (horiz ontal axis) measured over a range of a1 r mas s and atmospheric descriptors (vertical axis )
2 5
v-L-
1-----lr--f-
_ v
I
_J7 r
----
v -
_ 1----
___ ---f--
II (
I
r r-[--
r
v---
- 25
1 5
Diffuse Spectra vs Kn 80
70
c 60
50
0 1 0 20 30 40 50
TR-35 13A
Diffuse Spectra vs Kt 85
2 65
75
1 0 20 30 40 50
Number of spectra Number of spectra
Diffuse Spectra vs DirGH Diffuse Spectra vs Relative Humidity
0 1 0 20 30 40 50 0 1 0 20 30 40 50 Number of spectra_ Number of spectra
95 middotE 50
75 Qi 1 0
70
5J
c 30
secta -
Fi gure 4-6 f ) The cumulati ve number of spectra hori zontal axis) measured over a range of air mass and atmospheri c descri ptors verti cal axis)
1 05
r 85
EclE
Clluc m =g
300 500 700 900 1 1 00
05
Day No 2 1 6 1 987 Global Normal Spectra
730 to 1 5 30
Wavelength (nm)
Fi gure 4-7 Exampl es of spectra showi ng noisy data i n the ultravi olet 300shy400 nm) and near-inf rared 1000-1 100 nm) regions
26
5 0 MEASUREMENT UNCERTAINTY
( No t e Thi s s ec t ion contains only a brief summary o f the total uncertainty The deta i l ed reports [ 1 5 1 6 ] on the methods used to e s t imate tota l spect ra l measurement uncertainty should he consul ted- when using thi s datamiddot middot ba se )
The data set de scribed in thi s document i s the bes t set of measurement s posshys ible wi th the personnel equipment methods and cal i brat i on procedure s avai l able t o us We found that making continuous measurements wi th complex s ens i t ive equipment and account ing for all source s o f error in order to specify total mea surement uncertainty were not triviaL tasmiddotkamp oo
The e s t imat ed total uncertainty ( 95 confidence int erval ) for each of the spec troradi ometers and each of the measurement modes is shown in Figure 5-l The upper and l ower spec tral uncertainty limi t s are symmetrical except when gl obal-t i l t or gl obal-hori zontal s pectra were measured us ing the integrat ing sphere and when a s t rong direct-beam component wa s present ( Kt gt 6 0 ) We added an 8 maximum bias to the l ower uncertainty l imi t s for these cases based on resul t s o f experimen t s in whi ch we mapped the integrat ing sphere res ponse under bri ght sun wi th the image o f the sun in di f ferent locations on the ins ide of the sphere During the se exper iment s we observed variat i on s o f up to -8 compared t o the calibrat i on point
The high uncertainty in the abso lute value o f the spectral measurement s l e s s than 0 45 m wa s caused by l ow s pectra l irradiance for the calibrat i on l amp s which resul ted in a l ow s i gnal-t o-no i s e rat io for the spec troradiorriet er cal i shybrat ions ( F igure 5-2) In add i t ion we experienced a change ( i e l o s s o f respon s e ) i n the ultraviolet ( UV ) re sponse of the instruments when us ing the integrating sphere s
To tal uncert ainty i s a combinat i on o f an e s t imated total spectral bias error and to tal spec tral random error The f inal est imated total uncertainty for a 95 conf idence interval i s calculated as the
random (R) error root- sum-s quare of the bias ( B)
erro r plus two t ime s the
To eva luate instrument-to-instrument d i f ferences or variabi l i ty ( al s o called between-inst rument prec i s i on ) s imul t aneous spectral solar radiat i on s c an s were made wi th each ins t rument in each conf igurat i on The s tandard devi a t i on of the se mea surement s mul t i plied by three was converted to a percentage o f the mean Thi s percent age ind icates the expected instrument-to-instrument varibi l i t y or prec i s i on for thi s set of instrumen t s Fi gure S-3 shows the resul t s obtained for one o f these compari sons us ing the integrat ing s phere s Simi lar resul t s oc cur wi th the other conf igurations The between-inst rument prec i s i on above 0 4 m i s close to 5
Temperature control o f the spe ro adiorrieters with s i l icon detectors wa s import ant Figure 5-4 shows the change in the res pori se o f the instrumen t s espec i a l ly in the near- infrared when o perated at d i fferent control temperashyture s Uncertainty of l deg C in the set point resul t s in about a 2 uncertainty in the near-inf rared measurement s On ho t days we found that the t emperat ure
2 7
(
-Lower
r --
I IV
limityen(-)
-
A u1pp r li it +) f I II I
y 1 I rl ( I _ L
-
-
I I )
f--+- -+--+--1-+---+--1- r--J- Upper -c- A I u o t-iE $ == $= =$S y I I I I t (
1 --( -
----L---------------------- -_j_j_J__J__J__J
TR-35 1 3A
20
c(ij 0tQ)ucJ -20
Global (Sphere) 1 02 1 58 1 74
limit (-) Kt lt 60 Upper limit ( +)
Lower Kt gt 60
(a)
20
c(ij 0t
5 -20 L t )ower 1m1 -
300 500 700 900 1 1 00
Wavelength (nm)
Global Normal (Domes) 1 74 2 1 8 (b)
300 500 700 900 1 1 00 Wavelength (nm)
Direct Normal 1 58 1 72 1 74 (c) 20
limit ( +)gt- iQl u Lower 1m1 -) 5 -20
300 500 700 900 1 1 00 Wavelength (nm)
Figure 5-l Estimated total spectral measurement uncertainty f or global measurements with the i ntegrating spheres on (a) units number 102 158 and 174 (b) global-normal measurements with the Teflon dome receivers on units 174 and 218 and (c) directshynormal measurements with the view-limiting tubes on units 158 172 and 174 The measurement uncertainty is synmetrical except in (a) where a -8 bias is included in the lower limit f or global-horizontal and global-tilt cases due to nonunif orm sphere response when a str ong direct-beam component is present
28
I I
0
0 (J) ()
- 1 0
t U
TR 35l3A
Wavelength (nm)
Figure S-2 Comparison of the spectral intensity of an out door global-normal measurement and the NIST calibrationmiddotmiddot lamp source L ow lamp values below 400 nm result in high measurement uncertainty
20
1 5
R 1 0
X 5Q)0c c 0
-5 Q)_0
300 400 500 600 700 800 900 1 000 1 1 00 Wavelength (nm)
Figure S-3 Between-ins trument precis ion for glo bal-normal spectral solar radiation measurements us ing the integrating spheres
29
5 1 deg C N
ij0
()00- caQ)uc
1 000 Q)-Q) 8 0950 0ca
c 0900
0 300 500 700 900 1 1 00
Wavelength (nm)
Figure 5-4 Ratio of the spectroradiometer detector response at different temperatures to the response at 40deg C
o f the detectors ( contro l l er s ) somet imes exceeded the set point and we experienced runaway temperatures Thi s resul ted in ampl i f i er mi l l ivolt drift errors and no i s e in s ome o f the s pectra We achieved better t emperature conshytrol by shield ing the spectroradiometers with Mylar sheet s supported by foam offsets to allow air flow
Mea surement uncertainty for the broadband and meteorological data i s based on the cal ibration hi s tories provided by the mea surement s i t e s and charact ershyi s t i cs of the instrument s Thi s information is given in Tables 5-l through 5-3 and the values are included on the data-ba se tape
In these table s the measurement uncertainty for a 95 confi dence int erval was e s t imated by root-sum-s quaring the est imated bias errors a d by doubl ing the random errors in the cal i brat i on proce s s and measurement s [ 15 1 6 ] Radishyometers used at PGampE in 1987 were po st-cal i brated at SERI allowing e s t imate s of the random calibrat i on error component the radi ometers used i n 1988 were cal ibrated elsewhere so nominal e s t imated errors were used in the uncertainty analys i s Ins t rument s used at SERI were pre- and po st-cal ibrated at SERI Instrument s used at FSEC were cal i brated by FSEC and nominal values for random and bias errors for the s e types of radiometers were used in the uncershytainty analys i s Cal i brat i on informat ion for the meteorological instrument s i s included i n these tables but no mea surement uncertainty analys i s was performed
30
H 11 VI _ w
Jgt
--
IllIll
Tabl e 5- l FSEC Instrument Calibrat ion Hi story Ul d Estimated Meas urement Uncert ainty N-
Es timated Beg i nn ing Calibrat ion Measurement
Channe l iF Meas urement Instrument Comment s Time Stamp Date Uncertainty
( )
1 Direct normal 862961507 Eppley NIP 14306 E6 5-86 ( thermopi l e ) 863520931 Epp l ey NIP 23943E6 12-86 plusmn2 9
8801 2093 1 Eppl ey NIP 23943E6 12-87 1 32 change
2 Global normal 862961507 Eppl ey PSP 24185F3 Eppley PSP 24185F3 1 1-86 1 6 7 change plusmn3 8
872881032 Eppley PSP 18273F3 4-87 880120931 Eppley PSP 24185F3 1 2-87
3 Globa l hori zontal 862961507 Eppl ey PSP 1 43 2 1 F3 4-86 ( thermopi l e ) 8709 3 1 6 3 1 Eppl ey P S P 14322F3 1 2-87 -- plusmn3 8
w _ 872881032 Eppley PSP 143 18F3 4-87
4 G lobal t i l t 86329103 1 872881032
Eppley PSP 24183F3 Eppley PSP l4320F3
1 1-86 4-87 -- plusmn3 8
880120931 Eppley PSP 24183F3 1 2-87
5 D irec t normal 8629 6 1 507 Mat r ix NIP3826 9-86 ( si l i con) 88012093 1 Matrix NIP3826 12-87 1 32 change plusmn2 9
6 Temperature 862961507 Weathermeasure 1 7 7
1420A 6-86 3-87 8-88
smal l changes the cal ibratiqft factor was changed i software
7 Pressure 86296 1507 Weathermeasure 1 70 5 1-86 smal l c anges the 1 7 8 5-87 cal ibra t i on factor was
Hmiddot 6-88 changed i n software
8 Relat ive humi dity 8629 6 1 5 0 7 Weathermeasure 1 54 0 6-86 Cal culated from dew 175 point compared every
o ther week wi th another instrument
9 Wind speed 862961507 Weathermeasure 1 222 7-86 smal l chlnges the 1219 3-87 cal ibrat i o fac tor was ---
6-88 changed in software
J
-
Ill _-
bull I
Table 5-l FSEC Instrument Calibrat ion Hi stb y and Estimated Measurement Uncertainty (Concluded)
Channel Measurement Beginning Time Stamp ihsttument Cal ibrat ion
Date Comment s
Estimated Measurement Uncertainty
( )
INN
10 Albedo 86329103 1
87288103 2
Eppley PSP 1629 FJ Eppley PSP l 106Srl
1 1-86
4-87
-- plusmn3 8
19 Global hori zontal
( si l i con)
862961507
87 148143 1
LI-COR Py PY22J6 LI-COR yt PY2279
7-86
5-87
plusmn3 8 --
Mo wV11-wgt
I
--
p V1 1-
--
--
--
UlIllN-
Tabl e 5-2 PGampE Ins trument Calibrat ion Hi s ory and Estimated Measurement Uncertainty 1 _
Estimated Beginning Pre- Po st-Channe l if Measurement Instrument Comment s Mea surement
Time S tamp Cal ibra t i on Cal ibrati on Uncertainty ( )
l D irec t normal 87 1 100632 Eppl ey NIP 255 08E6 1-86 8-88 0 3 change plusmn2 8 ( thermopi l e ) 880190 752 Eppl ey NIP 255 10E6 12-8 7 -- plusmn3 6
2 G lobal normal 87 1 100632 Eppl ey PSP 2 32 02F3 1-86 8-88 1 7 change plusmn2 4 880190 7 5 2 Epp l ey PSP 23996F3 12-87 -- -- plusmn4 7
3 G lobal hori zontal 8 7 1 1 00632 Eppley PSP 23995E3 10-84 8-88 3 2 change plusmn2 8 w w
( thermopi l e ) 880190 752 Eppl ey PSP 25390F3 12-8 7 plusmn4 7
4 G lobal t i lt 8 7 1 1 00632 Epp l ey PSP 25387F3 12-84 8-88 0 2 change plusmn3 8 -- plusmn4 7 880190 752 Eppley PSP 23201F3 12-87
5 D irec t normal 8 7 1 100632 Matrix NIP 38Hi 5-86 7-88 2 7 change plusmn2 2 ( si li con)
6 Temperature 8 7 1 1 00632 Omega T-coupl e
7 Pres s ure 8 7 1 1 00632 Yel l ow Springs 2014-22 3 1 -HA- 1-WH 15593 3-84
8 Relat ive humi dity 87 1 100632 Hygr o 14276 2-85
9 Wind speed 8 7 1 1 00632 8804007 3 7
Weathert ronics Weathertron i c s
2301 230 1
184 184
9-82 2-88
10
19
Albedo 8 7 1 1 00632 Eppl ey PSP 2 1235F3
Globa l hori zont al 87 1 100632 LI-COR Pyr PY5558 ( s i l i con)
Beginning about 8 7 2 1 1 the s i l i con NI P va lues appear cons i s tent ly l ow
-- 8-88 2 4 change
1 1-83 8-88 1 9 change
may be an al ignment problem
plusmn2 6
plusmn2 6
gt-3 Iw
wgt
-- --
--
-- --
1ftIll -
Table 5-3 SERI Instrument Calibration Hi story and Estimated Measurement Uncertainty =
Estimated Beginning Pre- Post-Channel I Measurement Instrument Comment s Measurement Time S tamp Cal ibration Cal ibration Uncertainty ( )
1 Direct normal 87328 Eppley NIP 1 7828E6 11-87 2-88 1 5 7 change plusmn3 3 ( thermopil e )
2 Global normal None
3 bull Global horizontal 87328 Eppley PSP 1 78 63F3 1 1-87 2-88 2 22 change plusmn3 7 ( thermo pi l e ) a t Welby
w+- At SRRL 8805 7 Eppley PSP 200 79F3 7-87 8-88 0 7 3 change plusmn2 3
4 Global t i l t None
5 Direct normal None ( si li con)
6 Temperature 87328 Taylor Pocket 21430-1 10-86 (Due 10-9 1 )
7 Pressure Cal culated from elevat ion
plusmn0 2 (deg )
8 Relat ive humidity 87328 Dickson 86 100-1 9-87 10-88 -- plusmn2 ( counts )
9 Wind speed Observat ion
10 Albedo -- None
1 1-14 -- Sun photometer ( relative compari sons only)
15 Cloud c over Observed o-3-- lXlIw Global Ho rizontal -- LI-COR Pyr PY1245 11-87 2-88 3 67 change plusmn2 9 V119 ( si l icon) ( s tabi l i ty monitor only) wgt
TR-35 13A
We urge users of the data ba se to refer to the dai l y f i eld no tes for s pe c i a l c i rcumstances recorded b y the operator that may affect data uncertainty The s e no tes include references to the spectroradiometer t emperature c onshyt ro l l e r solar-tracking accuracy and weather cond i t i ons ( such as rain ) Included in the dai l y notes on tbe data-base tape are obs ervat i ons made in qual i t y-control processing as wel l as references to the exi s t ence and qual i t y o f pho t ographs or s l ides
Quant i tat ive pos t-proces s ing qual i ty-control informat i on i s al s o inc luded on t he data-bas e tape and a complete descript ion is given in the appendix o f thi s report Redundant measurement s ( such as before- smiddotcan andmiddot middot aft et-smiddotcan
broadband solar radiat i on direct-norma l and global-hor izont al mea surement s with both thermopile and s i l i con detectors ) and compar i s ons o f integrat ed s pectral so lar radiat ion wi th broadband s o lar radiat i on were used in the qual i ty-control procedure s Users are encouraged to perform the i r own qual i t y-cont rol proce s s ing on the data t o meet their par t i cular requiremen t s
3 5
6 0 FORMAT OF THE DATA TAPE
The meas ured dat a f i eld notes quali ty-control informa t i on and mea surement uncertainty are s t ored on magne t i c tape in 80-character l ines wi th the fi leshyname s given in Table 6- 1 The f i l enaming convent ion used for the mea sured data was
Filename Content
FLA8705 DAT FSEC data 1987 May PGE880 l DAT PGampE data 1988 January SER8 7 1 1 DAT SERI data 1987 November
Data were not acqui red in a l l months so the months may not be cont iguous
Qua l i t y-control informa t i on has the same f i l enaming conven t i on with QC extens ion ( for example FLA8 705 QC ) Dai ly notes are contained in the f i l e s FSEC NOTES PGE NOTES and SERI NOTES respec t i vely The mea surement uncershytainty is in the UNCERT f i l e s
c The DAT f i l e s contain two types of informa t i on D for data and for inst rument configurat ion The f i r s t l ine of a data or confi guration segment beg ins wi th a D or a c re spect ively in the f i r s t column followed by the s i t e year day and t ime stamp the number of l ines in the segment i s in column-s 76-80 so that the user can eas i ly skip the de s i red number of l ine s An example of the information in the conf iguration or 1 1C segment i s
c shown in Figure 6-1 I t begins wi th a followed b y the s i t e FSEC year 11 1 98 7 day 122 and t i me u0830 latitude longi tude and eleva t i on There are 19 channel s for mea surement s zero s pectra in the C segment and 40 l ine s in the segment The con f i gurat ion informa t i on appear s whenever the inst rument set-up or cal ibrat ion wa s changed or t he data acqui s i t ion sys t em wa s res tarted I f the configurat i on wa s not changed at the beginning of the month the configura t i on segment wi l l be in the previous mont h s DAT f i l e
An examp le of a D segment i s shown in Figure 6-2 Thi s segment contains the mea s ured me teoro logical dat a broadband and spectral solar rad i a t i on dat a and anc i l l ary data The data contained in each l ine and column and i t s format are as follows
POS ITION OF VARIABLES IN THE D SEGMENTS (ALL LINES ARE 80 CHARACTERS )
Line Column Cont ent s Format
a = character 1 = integer f = f l oat ing point
LINE 1 1 1 D ( for data ) ( a l ) 3 1 5 Site Year Day Number Time Stamp ( a 1 3 )
3 6 F SEC PGampE o r SERI ( a4 ) 7 8 Year (a2 or i 2 ) 9 1 1 Day Number ( a3 o r i 3 ) 1 2 15 Standard Time ( a4 o r i4 )
36
5-111 - il ll
Da i ly
Uncertainty
-
TR-35 13A -
Table 6 1 Namesmiddot of Files on the Data Tape
Measured and
FSEC
FLA8610 DAT FLA8 6 1 0 QC
FLAB 6 1 1 bull DAT FLA8 6 l l QC
FLA86 1 2 DAT FLA8 6 1 2 QC
FLA8 7 0 1 DAT FLA8 70 l QC
FLA8 704 DAT FLA8 704 QC
FLA8 705 DAT FLA8 7 05 QC
PGampE
PGE8 704 DAT PGE8 704 QC
PGE8 705 DAT PGE8 705 QC
PGE8 706 DAT PGE8 7 06 QC
PGE8 7 0 7- DAT PGE8 7 0 7 QC
SERI
SER87 l l DAT SER8 7 l l QC
S ER8 7 1 2 DAT SER8 7 1 2 QC
SER880 1 DAT SER880l QC
SER8802 DAT SER8802 QC
Ca lcui a t ed Data
FLA8 706 DAT FLA8 706 QA
FLA8 7 0 7 DAT FLA8 7 0 7 QC
FLA8 7 0 8 DAT FLA8 7 0 8 QC
FLA8 709 DAT FLA8 7 09 QC
FLA8 7 1 0 DAT FLA8 7 1 0 QC
FLA8 7 l l DAT FLA8 7 l l QC
PGE8 708 DAT middot
PGE8 708 QC
PGE8 7 0 9 DAT PGE8 709 QC
PGE8 7 l l DAT PGE8 7 l l QC
No t e s
FSEC NOTES PGampE NOTES SERI NOTES
Mea s urement
FSEC UNCERT PGamp E UNCERT SERI UNCERT
FLA8 7 1 2 DAT FLA8 7 1 2 QC
FLA880l DAT FLA880l QC
FLA8 802 DAT FLA8802 QC
FLA8803 DAT FLA8803 QC _
FLA8804 DAT FLA8804 QC
PGE_880l DAT PGE880l QC
PGE8802 DAT PGE8802 QC
PGE8803 DAT PGE8803 QC
3 7 _middot
1 3
1 7
55 1 1-1 TR-3 5 1 3A
0 G) 0 G)G) iC FSEC8 7 1 2 2 0 8 1 3 2 8 4 0 0 0N 80 6 0 0 0W 2M C = 8 7 1 2 2 0 8 1 3 8 7 1 2 2 0 8 1 3+0 0 0 0 0 0 1 9 0 4 0
CHN PARAMETER +- - - - - - - INSTRUMENT- - - - - - - - - -+ +- -CALIBRATION- + OUTPUT FOOT NO TYPE MAKER TYPE SERIAL FACTOR DATE UNITS NOTES
1 Di r- Nor-m Eppley NIP 2 3 9 4 3E6 6 08 1 2 - 186 Wm2 2 Glo Nor-m Eppley PSP 2 4 1 85F3 8 85 l l - 186 Wm2 3 G l o Hor-z Eppl ey PSP l 4 3 2 2F3 6 3 8 1 2 - 2 86 Wm 2 4 Glo Tilt Eppley PSP 2 4 1 83F3 8 9 9 l l - 186 Wm2 iacute5 Dir- N S i MATRIX SI NIP 3826 31 8 0 9 - 186 Wm2 6 Amb Temp WTHRMEAS PRT 1 7 7 l 0 0 3 - 1 8 7 Deq c 7 Sur-f Pr-es WTHRMEAS PIEZO 1 7 8 l 0 0 5 - 1 8 7 Mi l l ibar-8 Re1 Hum WTHRMEAS LiCl 1 7 5 l 0 0 6 - 1 86 Per-cent 9 Wind Spd WTHRMEAS OPT CHOP 1 2 1 9 l 0 0 3 - 1 8 7 Met e r- s i S
1 0 Albedo Epp ley PSP l 6 2 9 7F3 1 0 0 9 l l - 1 8 6 Per-cent l l hot 380 Unused Unused Unused - 9 9 0 0 - 1 - l - 1 Counts iacute1 2 hot 5 0 0 Unused Unused Unused - 9 9 0 0 - 1 - l - l Count s
14 hot 860 Unused Unused Unused - 9 9 0 0 - 1 - 1 - 1 Counts hot 942 Unused Unused Unused - 9 9 0 0 - 1 - l - l Counts
1 5 Opq C loud Unused Unused Unused - 9 9 0 0 - 1 - l - l Tenths 1 6 H2 0 NWS Unused Unused Unused - 9 9 0 0 - 1 - l - l em
Spect l LI -COR L I - 1 8 0 0 PRS - 1 7 2 l 0 0 2 - 1 8 7 W sq m nm l Spect 2 L I - COR L I - 1 800 PRS - 1 0 2 1 0 0 2 - 1 8 71 8 W sq m nm l
1 9 Glo H Si LI -COR L I - 2 0 0S PY2 276 8 4 5 7 - 1 86 Wm2 2 - 1 FIN
FOOTNOTES
1 - 1 7 = DN 18 = GT 2 - SERI l oan un i t
- 1 - FIN
Figure 6-1 Example of the instrument configuration data on the data base tape The numbers refer tmiddotO
1 c indicating configuration 2 FSEC 1987 Day 122 at 8 13 standard time 3 Latitude 4 Longitude 5 Ele vation 6 Reference to configuration file that will be f ound in the
data files 7 Starting data-acquisition time plus number of attempts to
acquire spectra (which would extend the data acquisition time)
8 Number of data channels 9 Number of spectra ( 0 f or configuration files 1 or 2 f or
data files) 10 Number of lines in this segment
38
TR35 1 3A
D FSEC8 7 1 2 2 0 8 1 3 2 8 4 0 0 0N 8 0 6 00 0W 2M C=871 2 2 0 8 1 3 8 7 1 220 814+0 0 0 1 0 0 1 9 2 1 0 0 gS e e Q N FSEC8 7 1 2 2 U PRS - 1 7 2 Col 2 ( + - ) U PRS - 1 0 2 Col 2 ( - ) Col 4 ( + ) 1 7 84 5 5 7 54 5 2 9 3 0 2 - 1 - 9 9 0 3 48 0 1 1 9 48 3 3 4 4 2 7 9 - 1 -9 9 0 1 7 85 0 5 7 5 5 7 2 9 3 0 4 - 1 - 9 9 0 3 4 8 1 1 1 9 4 85 3 4 43 0 1 - 1 - 9 9 0 2 8 4 1 80 0
1 0 9 5 4 1 5 - 99 0 7 1 0 1 7 8 6 2 0 7 8 7 5 8 9 1 5 - 1 - 9 9 0 - 1 - 9 9 0 iacute1 1 3 80 0 - 99 0 Co 1 2 5 0 0 0 - 99 0 Co 1 3 860 0 - 99 0 Co 1 4 942 0 - 9 9 0 Co iacute
- 1 6 0 7 1 5 8 5 7 8 5 6 7 1 58 3 86 9 1 9 9 1 8 7 - 9 0 0 - 9 0 0 - 9 0 0 - 9 0 0 - 9 0 - 9 0 3 1 1 7 4 0 1 3 0 0 1 1 0 0 2 0 57 9 8 9 4 0 0 DNT1 8 4 0 1 3 0 0 1 1 0 0 2 0 2 8 4 1 8 0 0 6 2 4 GTS - 1 0 0 0 0 0 0 0 0 0 0 0 - 1 0 0 0 o o 0 0 0 0 o o
1 3 0 0 0 0 0 0 0 0 3 5 0 0 0 4 0 0 2 1 0 02 5 0 0 14 0 04 1 0 02 1 0 0 5 7 0 0 3 8 amp 1 3 2 0 0 0 7 2 0 056 0 1 0 1 0 0 8 1 0 1 1 8 0 1 2 1 0 1 1 9 0 140 0 138 0 1 3 1 amp 1 340 0 1 4 9 0 16 1 0 162 0 1 5 5 0 16 0 0 1 6 3 0 1 8 5 0 1 9 5 0 1 9 8 0 1 9 9 amp 1 360 0 2 0 9 0 2 1 9 0 228 0 2 4 3 0 258 0 26 5 0 258 0 265 0 268 0 2 89 amp 1 380 0 2 8 0 0 2 7 9 0 26 7 0 2 7 3 0 3 0 1 0 3 08 0 3 1 7 0 326 0 349 0 4 0 2 amp 1 4 0 0 0 4 7 6 0 52 7 0 55 7 0 569 0 580 0 5 9 5 0 6 12 0 63 0 0 64 1 0 648 amp 1 4 2 0 0 652 0 6 54 0 6 58 0 649 0 6 36 0 6 3 2 0 646 0 67 8 0 7 1 8 0 746 amp 1 440 0 7 6 8 0 7 9 9 0 82 2 0 854 0 8 7 7 0 9 0 4 0 9 1 5 0 92 2 0 934 0 94 2 amp 1 460 0 9 6 0 0 964 0 9 7 0 0 9 7 3 0 96 9 0 9 74 0 9 9 0 0 9 9 9 1 0 1 7 1 028 amp 1 4 8 0 1 0 3 3 1 0 25 1 0 0 6 0 9 9 1 0 9 9 0 1 0 1 0 1 026 1 0 3 8 1 043 1 0 4 7 amp 1 500 1 0 3 8 1 034 1 038 1 0 5 1 1 0 58 1 058 1 0 5 1 1 0 3 5 1 0 1 7 1 0 0 7 amp 1 520 1 0 2 0 1 04 1 1 0 5 7 1 063 1 068 1 0 8 1 1 088 1 0 9 3 1 0 9 3 1 0 9 1 amp 1 540 1 0 8 9 1 0 84 1 088 1 0 9 5 1 0 9 7 1 0 9 5 1 0 9 8 1 1 0 2 1 094 1 0 8 7 amp 1 560 1 0 7 8 1 0 7 9 1 08 1 1 0 7 7 1 0 7 2 1 0 7 1 1 0 7 6 1 0 7 8 1 0 7 8 1 0 82 amp 1 580 1 0 9 0 1 0 9 8 1 1 0 1 1 088 1 0 7 4 1 062 1 06 1 1 06 7 1 0 7 4 1 0 80 amp 1 6 0 0 1 082 1 085 1 08 8 1 0 9 2 1 0 9 3 1 0 89 1 083 1 0 7 8 1 0 78 1 0 7 9 amp 1 620 1 0 8 2 1 083 1 0 7 6 1 065 1 0 5 9 1 056 1 06 1 1 0 7 3 1 0 8 0 1 085 amp 1 640 1 0 86 1 084 1 08 1 1 0 7 6 1 067 1 062 1 0 5 2 1 04 2 1 038 1 048 amp 1 660 1 0 7 0 1 086 1 0 9 4 1 0 9 7 1 0 96 1 096 1 09 2 1 0 9 3 1 0 9 1 1 0 89 amp 1 680 1 0 7 9 1 064 1 02 8 0 9 8 0 0 94 3 0 9 3 7 0 954 0 98 0 0 9 9 6 1 0 0 5 amp 1 7 0 0 1 0 0 8 1 0 0 9 1 0 1 3 1 0 1 9 1 0 2 5 1 0 2 2 1 0 0 3 0 9 7 3 0 924 0 8 74 amp 1 7 2 0 0 846 0 842 0 84 8 0 84 9 0 8 54 0 8 7 8 0 9 0 3 0 9 3 1 0 9 52 0 965 amp 1 740 0 9 6 9 0 9 7 7 0 98 3 0 989 0 988 0 9 8 2 0 9 7 6 0 95 0 0 8 81 0 7 6 7 amp 1 760 0 6 1 6 0 5 24 0 54 0 0 646 0 7 7 9 0 8 76 0 924 0 94 5 0 94 7 0 9 45 amp 1 7 8 0 0 94 2 0 94 2 0 9 3 7 0 9 2 6 0 9 1 6 0 9 0 7 0 89 9 0 894 0 8 9 1 0 89 0 amp 1 800 0 888 0 883 0 8 7 9 0 87 5 0 863 0 836 0 8 0 1 0 7 5 7 0 7 2 2 0 7 1 0 amp 1 820 0 7 1 0 0 7 1 9 0 7 3 3 0 74 1 0 7 4 9 0 7 5 7 0 76 3 0 7 7 7 0 7 9 7 0 8 1 0 amp 1 840 0 82 0 0 82 8 0 82 7 0 82 2 0 8 1 5 0 7 9 7 0 786 0 7 83 0 7 8 8 0 7 9 7 amp 1 860 0 80 4 0 8 0 0 0 7 8 8 0 7 8 0 0 7 7 5 0 7 8 0 0 7 8 7 0 786 0 785 0 7 81 amp 1 880 0 7 7 5 0 7 7 4 0 7 7 2 0 767 0 763 0 7 4 7 0 72 1 0 68 2 0 6 30 0 5 88 amp 1 9 0 0 0 57 1 0 5 7 3 0 58 9 0 584 0 568 0 549 0 53 4 0 53 3 0 5 38 0 5 56 amp 1 9 2 0 0 5 7 3 0 57 9 0 56 7 0 526 0 448 0 362 0 2 7 2 0 2 18 0 2 1 0 0 2 32 amp 1 940 0 254 0 262 0 2 5 7 0 253 0 25 7 0 266 0 2 7 5 0 2 85 0 29 9 0 3 1 7 amp 1 960 0 3 33 0 362 0 3 9 6 0 4 3 5 0 4 7 9 0 5 06 0 5 1 5 0 5 1 2 0 5 08 0 5 2 1 amp 1 9 8 0 0 53 7 0 560 0 5 84 0 5 9 7 0 6 0 9 0 6 1 7 0 6 1 8 0 6 2 3 0 62 1 0 6 1 9 amp 1 1 0 0 0 0 6 1 8 0 6 0 7 0 6 0 5 0 6 0 2 0 60 1 0 60 5 0 6 04 0 604 0 604 0 6 0 1 amp 1 1 0 2 0 0 60 1 0 59 5 0 5 9 5 0 5 93 0 589 0 59 0 0 584 0 5 82 0 580 0 5 75 amp 1 1 0 4 0 0 5 7 6 0 5 7 1 0 57 1 0 56 7 0 56 0 0 56 0 0 558 0 552 0 545 0 54 0 amp 1 1 0 6 0 0 5 36 0 53 2 0 5 2 9 0 5 2 5 0 5 1 9 0 5 1 5 0 5 1 2 0 51 1 0 50 9 0 5 08 amp 1 1 0 8 0 0 50 6 0 502 0 4 9 2 0 48 3 0 48 3 0 483 0 46 9 middot 0 4 5 2 0 447 0 3 1 amp 1 1 1 0 0 0 4 1 1 - 9 9 0 0 0 - 9 9 0 0 0 - 9 9 0 0 0 - 9 9 0 0 0 - 9 9 0 0 0 - 9 9 0 0 0 - 9 9 00 0 - 1 582 3 2 2 3 0 0 0 0 0 6 0 0 0 1 0 0 0 4 0 0 1 3 0 0 1 9 0 0 2 3 0 04 1 0 0 5 5 0 064 0 088 amp 2 3 2 0 0 1 0 5 0 1 3 9 0 1 7 9 0 1 8 9 0 2 2 4 0 2 38 0 26 2 0 252 0 261 0 2 64 amp 2 340 0 2 8 7 0 2 9 2 0 266 0 2 88 0 2 98 0 286 0 3 0 0 0 3 0 0 0 2 9 1 0 2 85 amp 2 360 0 296 0 3 1 0 0 3 36 0 367 0 3 9 0 0 3 7 2 0 3 56 0 356 0 3 7 3 0 3 88 amp
Figur e 6-2 Examples of the data on the data-base tape
3 9
TR-3 5 1 3A
16 2 3 24 24 2S 3 3 34 34 3S 3 9 40 40 4 1 S 2 S4 69
54 62
6 3 6 3
6 7 6 7
7 0 7 3
74 7 S
7 6 80
LINE 2
LINE 3
1 3 4 10
1 1 1 3 14 20 2 1 23 24 30 3 1 40 4 1 43 44 SO 5 1 5 3 54 60
Lat i tude ( deg ) N ( north) Longi t ude ( deg ) W ( we s t ) `Elevat i on (m) M (m) Reference t o Conf i guration Segment Start ing year day t ime for the spectral `scan s ) i f any and number of attempt s t o `acquire the s can ( which ind i cates po s s ible `t ime delay from the s tart ing t ime ) middot
Year Day Number Time
11+11 for plus number of attempt s to acquire a s pect rum
Number o f attempt s t o acquire a s pectrum
Po s s ible Number o f Measurement s ( 1 9 )
Number o f Spec tra i n thi s Segment ( 0 1 or 2 )
Number o f Lines in Segment
Pointer to the qua l i ty-cont rol dai ly f i e ld note s and measurement uncertainty informa t ion Qua l i ty-control informa t i on is in the QC f i l e of the same month wi th the same s i t e year day and t ime s t amp Dai l y field notes are i n the NOTES f i l e f o r the same s i t e wi th the same s i t e year and day s tamp Mea surement uncertainty i s in the f i l e s UNCERT under t h e instrument serial number ident i f i ed by PRS-xxx and the column s in the uncertainty f i le s for + and - uncertainty l imi t s
Broadband mea surement s before the spectral scan
Channel fH Direct Normal ( thermopi l e ) (Wm2 ) Channel ffoS Direct Normal ( s i l i con) (Wm2 ) Channel tn Global Normal ( Wm2 ) Channel not used Charinel ffo3 Globa l Hori zontal ( thermop i l e ) ( Wm2 ) Channel fH 9 Gl obal Horizontal ( s i l icon ) ( Wm2 )
( f 8 4 ) ( a 1 ) ( f 9 4 ) ( a l ) ( i S ) ( a l ) ( a l 2 )
( a9 o r i 9 )
( a 1 )
( i 1 )
( i4 )
( i 2 )
( i S )
( a8 0 )
( i 3 ) ( pound 7 2 ) ( i 3 ) ( pound 7 2 ) ( i 3 ) ( f 7 2 )
( i 3 ) ( pound 7 2 ) ( i 3 ) ( pound 7 2 )
40
TR-35 3A
6 1 6 3 64 7 0 7 1 80
LINE 4
LINE 5
1 6
7 1 2
1 3 80
LINE 6
1 3 4 1 0
1 1 1 3 1 4 20 2 1 23 24 3 0
3 1 3 3 34 40 4 1 43 44 5 0 5 1 5 3 5 4 6 0 6 1 6 3 64 7 0 7 1 7 3 7 4 8 0
LINE 7
LINE 8
1 5
6 1 2
Channe l 114 Gl obal Ti l t (Wm2 ) hellipChannel not used
Broad band mea suremen t s a f t e r t h e s p e c t ral s can same format a s beforeshy scan ( LINE 3 )
T i l t o f the f ixed- t i l t i n s t rument s hellipf rom the hor i z ont a l ( d eg )
Az i muth of the f i xed-t i l t ins t rumen t s ( de g ) ( 1 8 0 deg = s outh)
De s c r i p t i on o f any s pec i al i n s t rument ( fo r example d i ffu s e-hori zont a l mea s uremen t s a t SERI )
Channe l IFlOAl bedo (Wm2 ) hellipChannel IH5C l oud Cover ( t enths ) Channel fF7 Surface Pres sure ( mb ) Mea s ured at FSEC and PGampE c a l c u l ated from e l eva t i on a t S ERI [ 1 1 p 1 0 0 ]
Channel 116 Amb i en t Temperature ( deg C ) Channel fiB Rel a t i ve Humi d i t y ( ) Channe l ffo9 Wind S peed ( m s ) Add i t i onal channe l des cri bed 1n l i ne 5 Va l ue Add i t i onal channel descri bed 1n l ine 5 Va l u e
Sun Pho t ometer read ings ( only recorded for SERI dat a not u s ed except for re l a t i ve c ompar i s on s ) hellip
Earth-S un d i s tance c orrec t i on ( d e v i a t i on from 1 0 ) hellip
Ext ra t erre s t r i a l Rad i a t i on (Wm2 ) hellip
( i 3 ) ( pound 7 2 )
( f 6 1 )
( f 6 1 )
( a 8 8 )
( i 3 ) ( 7 1 ) ( i 3 ) ( 7 1 ) ( i 3 ) ( f 7 1 )
( i 3 ) ( pound 7 1 ) ( i 3 ) ( pound 7 1 ) ( i 3 ) ( pound 7 1 ) ( i 3 ) ( variabl e ) ( i 3 ) ( variabl e )
( f5 2 )
( f 7 1 )
4 1
9
42
TR-3S l 3A
1 3 1 8
1 9 24
25 30
3 1 36
3742
43 48
49 68
69 72
13 76
1780
LINE
I
3 6
7 1 1 1216 1 7 20 21 25
2631
3236
3839
40 40
41 42
43 46
Zen i t h Angl e ( deg ) ( f6 2 )
Kt ( ra t i o calculated from ( f6 1 ) thermo p i l e inst rument s )
Kn ( rat i o calculated from ( f6 1 ) thermo p i l e instrument s )
D GH ( ra t i o cal culated from thermopile instrument s ) ( f6 1 )
Albedo ( ) ( f6 1 )
Ai r Mas s ( f6 2 )
Res erved for Turbidi ty i f calculated
Precipi table Water Vapor i f calculated from sun photomet er
Precipi table Water Vapor from the ( f4 1 ) Nat ional Weather Servi ce
Prec i p i table Water Vapor Cal culated from Relative Humid i t y ( f4 1 )
Channel H7 Number o f Wave l engths Recorded by Spect roradi ometer 1
Beginning Wavelength ( nm ) Ending Wavel ength (nm) Wavelength Step Size (nm ) Spectroradi ometer 1 Ti l t from the Horizontal ( deg )
Spectroradiometer 1 Azimuth ( deg )
Angle o f Incidence o f the Direct Beam on Spectroradi ometer 1 ( deg )
Measurement Type ( DN GN GH GT DF )
Attachment ( Tef lon Dome D Integrat ing Sphere S View- l imit ing Tube T )
Channel H8 Number o f Wavel engths Recorded by Spectroradi ometer 2
( i2 )
( i4 )
( i S ) ( i S ) ( f4 1 )
( fS l )
( f6 1 )
( fS 1 )
( a2 )
( a l )
( i 2 )
(i4)
TR-3S l3A
4 7 S l Beginning Wavel ength (nm ) ( i S )
S 2 S 6` Ending Wavel ength ( nm ) ( i S )
S 7 60 Wavelength Step S i z e ( nm ) ( f4 bull 1 )
6 1 6S Spec troradi ometer 1 T i l t from the Hori zontal ( deg ) ( fS l )
6 6 7 1 ` Spect roradi ometer 2 Az imuth ( deg ) ( f6 1 )
7 2 76` Angle of Incidence o f the Direct Beam on Spect rorad i ometer 2 ( deg ) ( fS l )
7 8 7 9 Mea surement Type ( DN GN GH GT DF ) ( a2 )
8 0 80 At tachment ( Teflon Dome D Integrat ing Sphere s View-l imi t ing Tube T ) ( al )
LINE 10 Saved f o r extra spectroradi ometers i f needed
I f no spec tral data were recorded the number of l ines in the D s egment i s 1 0 the number of spectra i s 0 and there i s no corre sponding qual i ty-control information for thi s dat e t ime in the QC f i l e s No qual i ty c ontrol wa s performed because the atmo sphere was uns table I f the number o f spectra i s 1 there are 60 l ines in the D s egment i f there are two spectra t he number o f l ines i s 100
I f middot the number of spectra i s 1 or 2 the spectral data fol low after the f i r s t 1 0 l i nes o f the D segment There are 1 0 spectral measurement s per l ine wi th the number in the lef t-mo s t column indicat ing the f i r s t or second specshyt roradiometer ( 1 or 2 ) f o l l owed by the s tart ing wavelength ( in nanometers ) and t he 10 spectral mea surements ( in Wm2-nm) The 1 0 measurement s are at wave l ength inc rements of 2 nm There are 401 spect ral mea surement s from 300 t o 1 1 0 0 nm in 2-nm s teps with 10 measurement s per line for 40 l ine s and one measurement in the 4 1 s t l ine The l a s t number in the 4 1 s t l ine i s the specshytral integral I f a second s pectrorad i ometer wa s used the next 4 1 l ines folshylow t he same format Blank 1 ines follow the spec tral data t o f i l l the D segment to 60 or 100 l ines
An example of a QC f i l e i s shown in Figure 6-3 The f i r s t l ine o f each segment begins with a Q f o l l owed by the s i t e year day number and t ime s tamp with the number of l ines in the segment given in the l a s t col umn s o f the l ine Following the iden t i fier are me s sage s about var iables that were flagged by the automat i c qua l i ty-control proc e s s ing ( s ee appendi x ) noted by an operator at the measurement s i t e or noted dur ing inspec t i on at SERI The l a s t l ine of the segment shows the QC code for as DN ( direct normal thermopile detect o r ) SN ( d i rect normal detector ) AL
var iabl e s such s i l i con
( a lbedo ) and SP ( s pectrum) a s de s c r i bed in the appendi x Three qual i tyshycontrol code s ar8 used 1 = good 2 = suspec t see me s sages and dai ly not e s and 3 = poor or mi s s ing see me s s ages and da i l y no te s The broadband codes ( DN SN GN GH SH and GT ) have two value s the f i r s t is the before- scan measurement and the second is the after-s can mea surement
4 3
TR-35 13A
Q FSEC87 1 2 1 0 7 3 1 4 Noise in GH spectrum in UV QCDN1DN1SN1SN1GN1GN1GH1GH1SH1SH1GT1GT1AL1AP1PR1TC1RH1WV1WS1KT1KN1DG1SPl iN1SP2IN2
Q FSEC8 7 1 2 1 0 8 3 0 8 SN bef SN af t = 1 0 5 5 S H bef SH aft = 1 0 5 3 2nd Int BB b e f = 0 636 2nd Int BB aft = 0 6 5 1 Noise in GH spectrum i n UV QCDN1DN1SN2SN2GN1GN1GH1GH1SH2SH2GT1GT1AL1AP1PR1TC1RH1WV1WS1KT1KN1DG1SP1 IN1SP2IN2
Q FSEC8 7 1 2 1 1 0 3 1 3 QCDN1DN1SN1SN1GN1GN1GH1GH1SH1SH1GT1GT1AL1AP1PR1TC1RH1WV1WS1KT1KN1DG1SP1 IN1SPl iNl iacute
Q FSEC87 1 2 1 1 1 3 1 3 QCDN1DN1SN1 SN1GN1GN1GH1GH1SH1SH1GT1GT1AL 1AP1PR1TC1RH1WV1WS1KT1KH1DG1SP 1 IN1SP1 IN1
Q FSEC8 7 1 2 1 1 2 3 1 3 QCDN1DN 1SN1SN1GN1GN1GH1GH1SH1SH1GT1GT1AL1AP1PR1TC1RH1WV1WS1KT1KN1DG1 SP1 IN1SP 1 IN1
Q FSEC8 7 1 2 1 1 3 3 1 3 QCDN1DN1SNlSNlGNlGN1GH1GH1SH1SH1GTlGTlALlAPlPRlTClRHlWVlWSlKTlKNlDGlSP l iNlSPliNl
Q FSEC8 7 1 2 1 1 4 3 1 3QCDNlDNlSNlSNlGNlGNlGHlGHlSHlSHlGTlGTlALlAPlPRlTClRHlHVlHSlKTlKNlDGlSPl iN1SP1IN1 Q FSECB7 1 2 1 1 554 3 QCDNlDNlSNlSNlGNlGNlGHlGHlSHlSHlGTlGTlALlAPlPRlTClRHlWV1WSlKT1KN1DG1SP 1 IN1SP l iN1
Q FSEC8 7 1 2 1 16 3 0 3 QCDNlDNlSNlSNlGNlGNlGHlGHlSHlSHlGTlGTlALlAPlPRlTC1RH1WV1WSlKTlKNlDG1SP l iNlSPl iNl
Q FSECB 7 1 2 1 1 7 3 1 5 GH bef SH bef = 0 9 3 1 GH aft SH af t = 0 9 3 3 QCDN1DN1SN1SN1GN1GNlGH2GH2SH2SH2GTlGT1ALlAPlPRlTClRHlWVlWSlKTlKNlDGlSPl iNlSPl iNl
Q FSECB 7 1 2 2 0 7 3 1 3 QCDNlDNlSNlSNlGNlGNlGHlGHlSHlSHlGT1GTlALlAPlPRlTClRHlWVlWS 1KT1KNlDGlSP l iNlSPl iNl
Figure 6-3 Example of quali ty-control inf ormation on the data- base tape
Figure 6-4 shows an exampl e of a segment of the daily notes from the FSEC NOTES f i l e Each segment of the f i l e beg ins wi th an followed b y the s i t e year and day number s t amp with the number of l ines in the segment given in the last columns of the l i ne The next l ine contains the s i te operashytor log sheet number month day year day number spectroradi ometer serial number( s ) and mea surement mode( s ) The PGampE and SERI not e s do not include the dai ly l og sheet number The f i rst two l ines are followed by f i eld no te s No tes that were added after inspec t i on at SERI are s eparat d from the operator notes wi th ------- The exi s tence of s l ides or photographs i s ind i cat ed a s wel l a s their qua l i ty i e good ( G ) marginal ( M ) or poor ( P ) In the exampl e in thi s f i gure there were two log sheets for thi s day (number 1 1 6 and 1 1 7 ) because the mea surement mode changed from gl obal hor i z onshytal ( GH ) to global t i l t ( GT )
44
TR-3513A
N FSEC87 1 2 2 1 1 6 0 5 0 2 8 7 1 2 2 1 7 2 DN 1 0 2 GH Clear at 0 7 3 0 GH f o r f ir s t two s cans then GT S l i de s 0 6 3 2 G
0 7 3 3 G 0 8 3 3 G 0 9 3 3 H ( dark ) 1 0 3 3 p1 1 3 3 p1 2 3 3 p 1 3 3 3 p1433 H 1 5 3 3 G 1633 G 1733 G
1 1 7 0 5 0 2 87 1 2 2 1 7 2 DN 1 0 2 GT GT s tart ing at 0 8 0 0 iacuteC lear a t 0 8 0 0 iacuteS l ides S e e above
16 1 1 8 0 5 0 3 8 7 1 2 3 1 7 2 DN 1 0 2 GT Clear at 0830 S l i de s 0633 G
0733 G 0833 G 0933 H ( dark ) 1 0 3 3 p1 1 3 3 p 1233 p 1333 p1433 H 1533 G 1633 G 1733 G
N FSEC87 1 2 3
Figure 6-4 Examples of daily notes on the data-base tape
An example o f a segment of the measurement uncertainty file UNCERT CAL i s shown in Figure 6-5 The f i r s t l ine begins with a U followed by the serial number of the s pect rorad i ometer The upper and lower measurement uncertainty l imi t s are given in the co lumns fol lowing wavelength wi th the appropri a t e measur ement mode dat es and de script ion at the top o f the column The s econd l ine in each segment o f the DAT f i l e s is a pointer to the correct uncershytainty information in UNCERT CAL The broadband s o lar radiat i on and meteshyorolog ical instrument measurement uncertainty fol lows each spectra l measureshyment uncertainty segment in UNCERT CAL
The format o f thi s data ba se was es tabl i shed at SERI t o accommodat e expanded mul t i year long-term data collect ion Users can reformat the data t o suit their part icular needs We recommend the following s t eps for acce s s ing and document ing parti cular data set s
1 Se lect and extract the des ired spectral data from the DAT f i l e s us i ng in formation such as measurement mode day number t ime air mas s or a moshys pheric condi t ions depending on the de s i red attribut es
2 Ex trac t and review the corres ponding segment s of the qua l i ty-cont rol i n format i on from the QC f i l es
3 Ex trac t and review the corres pond ing field no tes from the NOTES f i l e s
4 5
+ I -
5 4
3 7
TR- 3 5 13A
U PRS - 1 0 2 L I -COR PRS - 1 0 2 i
1 2 3 4 5 Ill
Wav GHS GHS GHS GHS GTS GTS GTS GTS Kt gt 6 0 Kt gt 6 0 Kt gt 60 Kt gt 6 0 iacutel ower lower upper upper 2 8 7 - 8 8 7 -8 8 7 5 8 8 GNS GNS
upper upper lower l ower
+ 1 -
- GHS GHS GTS GTS Kt lt 60 Kt lt 6 0 upper uppe r l ower l ower + I - + I -2 8 7 - 8 8 7 -8 87 5 - 8 8
3 0 0 - 1 0 0 0 - 1 00 0 1 0 0 0 1 0 0 0 3 0 2 - 1 0 0 0 - 1 0 0 0 1 0 0 0 1 0 0 0
4 0 0 - 2 3 3 - 1 7 1 1 5 3 9 1 4 0 2 iacute -2 2 0 - 1 7 3 1 4 0 9 3
5 0 0 - 1 3 4 - 1 1 7 3 7 5 0 2 iacute - 1 3 3 - 1 1 7 5 3 3 7
6 0 0 - 1 1 8 - 1 1 1 3 8 3 1 6 0 2 - 1 1 9 - 1 1 1 3 9 3 1
7 0 0 - 1 1 5 - 1 0 7 3 5 2 7 7 0 2 - 1 1 3 - 1 0 7 3 3 2 7
8 0 0 - 1 1 6 - 1 0 6 3 6 2 6 8 0 2 - 11 7 - 1 0 6 3 7 2 6
9 0 0 - 1 1 2 - 1 0 5 3 2 2 5 9 0 2 - 1 1 4 - 1 0 8 3 4 2 8
1 0 0 0 - 1 1 7 - 1 0 8 2 8 1 0 0 2 - 1 1 8 - 1 0 8 3 8 2 8
1 1 0 0 - 1 2 9 - 12 2 4 9 4 2
Figure 6-5 Examples of spe ctral measurement uncertainty on the data-base tape A value of plusmn100 indi cates greater t han 100 measurement uncertainty
46
TR-35 13A
4 Extract the measurement uncertainty information from the 1 1 UNCERT f i l e s and quot e mea surement uncertainty for a l l data used
5 Examine the dai l y broadband and spec tral solar radiatio data graphs in the catalog ( Volume I I of thi s report [ 1 8 ] i f avai labl e These graphs provide informa t i on on atmo spheric condi t i ons during the day For exampl e Figure 4-3 shows dai l y broadband and spec tral plot s for part ly c loudy condi t i ons when s olar rad i a t i on i s changing rapidly throughout the day The sun i s obs cured when the direc t-normal values drop t o zero and the gl obal value s approach each o ther Figure 4-1 shows a clear daybull
No data should be used wi thout consult ing the qua l i ty-control informa t i on dai ly no tes and measurement uncertainty
4 7
Cel l s
Ce l l s
Energy
Meteorologi cal Society
Appl i ed Meteorol ogy
Energy
Radiat ion Topical Overview Solar Cel l s Vo l 1 8
of the Pho tovo l t a i c s and Insolat ion Mea sureshySolar Vol 1 8 1 986 pp 393-3 9 5
TR-35 1 3A
1 0 REFERENCES
1 Hul st rom R L Solar 1 986 PPbull 1 7 9- 1 8 7
2 Hul st rom R L A Summary ments Workshop Panel Resul t s
3 Hul strom R L Re sul t s of the Amorphous S i l i con Mea surement s Ta sk Force Solar Cel l s Vo l 18 1 986 pp 1 7 1-1 7 7
4 Hul strom R L and J M Ohi Resul t s of the SERI Mul t i junction Devi ce Efficiency Measurement Task Forc e pre sented at the 20th I EEE Photovo lshytaic Spec ial i s t s Conference September 1 988
5 Riordan c and R L Hul s t rom Summary of S tud i e s that Examine the Effec t s of Spect ral Solar Radition Vari at ions on PV Device Des ign and Pershyformance SERI-TR-2 15-343 7 Golden CO Solar Energy Research Ins t i tute 1989
6 Riordan c Joint EPRI-SERI Spectral Solar Rad i a t i on Database Pro j ec t
1
8
9
1 0
1 1
1 2
1 3
14
Solar Vol 2 1 1 98 7 pp 3 3 7-342
Riordan c D Myers M Rymes R Hul strom W Mar i on c Jenning s and c Whi taker Spectral Solar Radiat ion Data Bas e at SERI Solar Vol 42 No 1 1 989 PP bull 6 7-79
Riordan C J T L Stoffe l and R L Hul s trom The Effect s of Urban Air Pollut ion on Solar Radiat i on SERI-TR-2 15-3482 Golden CO Solar Energy Res arch I n s t i tute ( draft ) 1989
Riordan c and R Hul s t rom The SERI Re s ource As ses sment Project s Plan for Col l ect ing Spectral-Solar-I rradiance Data SERI -TR-21 5-2948 Gol den CO Solar Energy Re search Ins t i tut e 1986
Shaw G E Sun Pho tometry Bul letin Ameri can Vol 64 No 1 January 1983 pp 4-10
Iqbal M bull An Int roduction to Solar Radiation New York Academic Pre s s
1983
Bartel s R A Comment s on Prec ipi table Water Mea surement s with Sun Photometer s Journal of Cl imate and Vol 25 1 986 PP bull 1 788- 1 789
Leckner B The Spectral Distribution o f Solar Radiat ion at the Earth s Surface -- El ements of a Model Solar Vol 20 1 9 7 8 pp 143- 1 5 0
Cannon T W Spectral So lar Irradiance Instrumentat i on and Measurement Techniques Solar Cel l s Vol 1 8 1986 pp 2 3 3-24 1
48
Energy
Photogrammetric Engineering
TR 3 5 13A
1 5 Myers D R E s t imate s of Uncertainty for Measured Spec tra in the SERI Spectral Solar Radiat i on Data Base ac cepted by Solar 1 98 9
1 6 Myers D R E s t imates of Uncertainty for Measured Spectra in the SERI Spec tral Solar Radiat i on Data aa s e 11 SERI e_clmical Report Golden CO S o l ar Energy Res earch Ins t i tute ( draft ) 1989
middot
1 7 Hul s trom R L The Cl oud Bright Spo t 1 9 73 PP bull 3 7 0-3 7 6
18 Ri ordan c D Myer s and R Hul s t rom Spectral Scflar Raltfiation Data Base Documentat i on and User 1 s Manual Vo lume I I SERI-TR-2 15-3 5 1 3 Golden CO Solar Energy Re search Ins t i tut e 1989
49
TR- 3 5 1 3A
APPENDIX
QUALITY-CONTROL PROCESSING
Limi ted qua l i ty-control proces s ing wa s appl i ed to the data ba se as de s c r i bed below The resul t s are i n the QC f i l es on the data-base t ape by s i t e year and mont h For examp l e
FLA8705 QC i s FSEC 1 98 7 May PGE8 80 l QC i s PGampE 1 9 8 8 January SER8 7 l l QC i s SERI 1 98 7 November
These f i l e s correspond t o the 11 OAT f i les for the s ame s i t e year and month Each data segment that includes a spectrum wa s proces sed through thi s quali ty-control procedure I f the atmospheric cond i t i on s were uns tab l e and a spectrum was not acquired the broadband and meteorologi cal data were inc l uded on the data-base tape but no qua l i ty-contro l proc e s s ing wa s app l i ed
An example o f a segment of a 11 QC f i l e i s shown in F i gure 6-3 The f i r s t Q l ine beg ins wi th a fol l owed by the s i t e year day and t ime s tamp The
last columns give the number of l ines in the s egment so the user can skip to the next s egment Fo l l owing the f i r s t l ine are me s sages that were printed whenever the qua l i ty-control proce s s ing f lagged a suspect or poor value
Following the mes sages in an SO-character QC l ine l i s t ing the variables that were examined are one of three qua l i ty-control code s 1 good 2 marg inal or suspect and 3 mi s s ing or poor The QC l ine was prepared using an automa t i c ( computeri zed ) check of the variabl e s and manual edi t ing to include informashyt ion from correspondence l og sheet s and vi sual inspe ct i on Addi t i onal me sshysages were added above the QC l ine if appropriate
The two-charact er descriptors in the QC l ine are
DN Direct-normal ( thermopi l e ) solar radiat ion before the spectral s can DN Direct-normal ( thermopi l e ) so lar radiation after the spectra l scan SN Direct-normal ( s i l i c on ) before SN Direct-normal ( s i l i c on ) after GN Globa l-normal before GN Globa l-normal after GH Globa l -horizontal ( thermop i l e ) before
WS Wind Speed KT KKN K
t n
GH Global-hori zontal thermopil e ) after SH Global-hori zontal ( s i l i con ) before SH Global-hori zontal ( s i l icon ) after GT Global-t i l t before GT Gl obal- t i l t after AL Al bedo ( Wm ) AP Albedo ( ) PR Surface Pres sure TC Temperature ( deg C ) RH Relat ive Humi dity WV Water Vapor ( al culated from rel a t i ve humidity)
5 0
S- flllit = - ( middotmiddot middot
( e g Wm2 )
TR-3 5 1 3A
DG D GH SP F i r s t Sp qtrum I T Integral of t he F i r s t Spec t rum SP Second Spectrum IT I nt egral of the - Second SpecttUI11
The aut oma t i c tes t s that were performed to det ermine the QC code fol l owing each var iable were
( a ) Check for mi s s ing or negat ive values for the broadband solar radiashyt i on meteoro l og i cal or a tmo spheric dat a or the spec t ral integral s
lt 0 = Code 2 Mi s s ing ( - 9 or -9 9 ) = Code 3
( b ) Check for atmo spheric or broadband instrument instab i l i ty us ing the difference and rat i o o f the before- and aft er-scan values and redundant mea surement s if nei t her values are negat i ve or mi s s ing
DN before DN after if the abs lute d i fference SN before SN after i s gt10 Wm DN beforeSN before 5 of 200 DN before SN after and GH before GH after SH beforeSH after the rat io i s lt0 95 or gt1 05 each of the GH before SH before two var iables = GH afterSH after or middot GN beforeGN after the rat i o i s lt0 90 or gt1 10 each of the GT beforeGT after two var iable s = Code 3
Code 2
( c ) Check for DN gt GN or GN gt ETR ( extraterre s trial solar radiat i on ) us 1ng rat ios of the var iabl e s
DN before GN before gt0 95 each variable = Code 2 DN afterGN after gt 1 0 each var i able = Code 3 GN before ETR GN afterETR
( d ) Check for values o f Kt Kn and DGH tha t are too high
KT ( invo lves GH before and after and KT ) KN ( involves DN before and after and KN ) DG ( invo lves DN and GH before and after and DG )
gt0 9 5 each variable = Code 2 gt 1 0 each var iable = Code 3
( e ) Check the s pe c t ral integral s for unusual rat i o s to the corresponding broadband so lar radiat ion value
IT ( Broadband va lue before and after )
For d i rect s pe c t ra lt 0 6 or gt0 8 5 I T = Code 2 For gl obal s pe c t ra lt0 7 o r gt0 95 I T = Code 2
For d i rect and g l obal s pec t ra lt0 5 or gt l O IT = Code 3
5 1
TR-35 13A
We sugge s t that users of the data ba s e develop a computer program to acc e s s fields i n the Q C l ine and t o print the me s sages Thi s l imi ted qua l i ty cont rol wi l l not f lag a l l po s s ible errors and addi t i onal t e s t s should be applied depend ing on the users requi rement s and appl icat i on s
52
1 1 2
Document Control SEAl Report No
Page 4 Title and Subtitle
NTIS Accession No 3 Recipients Accession No SERI TR- 2 1 5-35 13A DE89009447
5 Publication Date
January 1990 Sp ectral Solar Radiation Data Base Documentation
6Vo lume I
7 Author(s) 8 Performing Organization Rept No
9 Performing Organization Name and Address 10 ProjectTaskWork Unit No
1 1 Contract (C) or Grant (G) No
(C)
(G)
1 2 Sponsoring Organization Name and Address 13 Type of Report amp Period Covered
Solar Energy Res ear ch Ins titute Technical Repor t 1 6 1 7 Col e Boulevard Golden Colorado 804 0 1-3393 1 4
1 5 Supplementary Notes
16 Abstract (Limit 200 words) The Solar Energy Research Ins titute ( SERI) Electric Power Research Ins titute Flor ida Solar Energy Center and Pacific Gas and Electric Company cooperated to produce a spec tral solar radiation data base representing a range of atmospheric conditions These data will help to characterize the natural variab ility in the spectral (color) content o f outdoor solar radiation so that the sensitivity of spec trally selective solar devices ( such as photovoltaics ) to these variations c n b e s tudied quant itatively Volume I o f this report documents the history approach content and format of the data base Volume II contains graphs and field no tes for each of the spectral data sets The data res ide on magnetic tape at SERI
1 7 Document Analysis
a Descriptors Spec tral solar radiation broadband solar radiation met eorological
data sp ectroradiometers
b IdentifiersOpen-Ended Terms
c UC Categories
233 234
18 Availabil ity Statement
National Technical Information U S Depar tment of Commerce 5 285 Port Royal Road Springfield Virginia 2 2 1 6 1
Service 19 No of Pages
60
20 Price
A04
Form No 0069 (6-30-87)
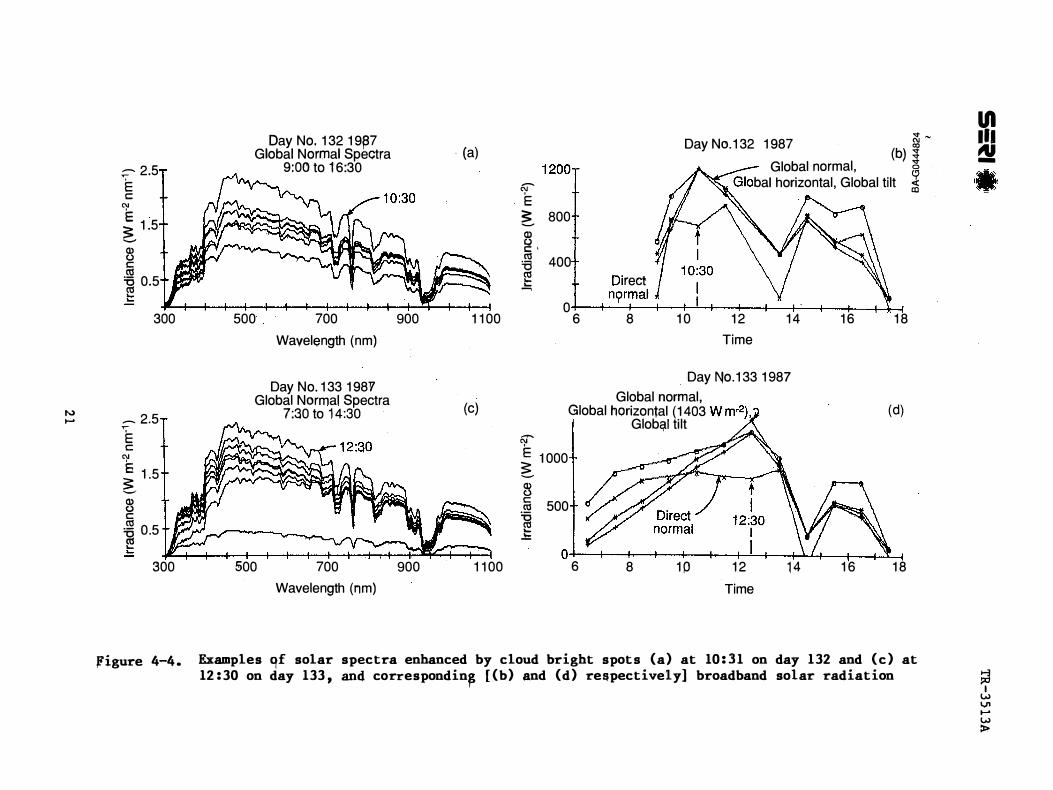
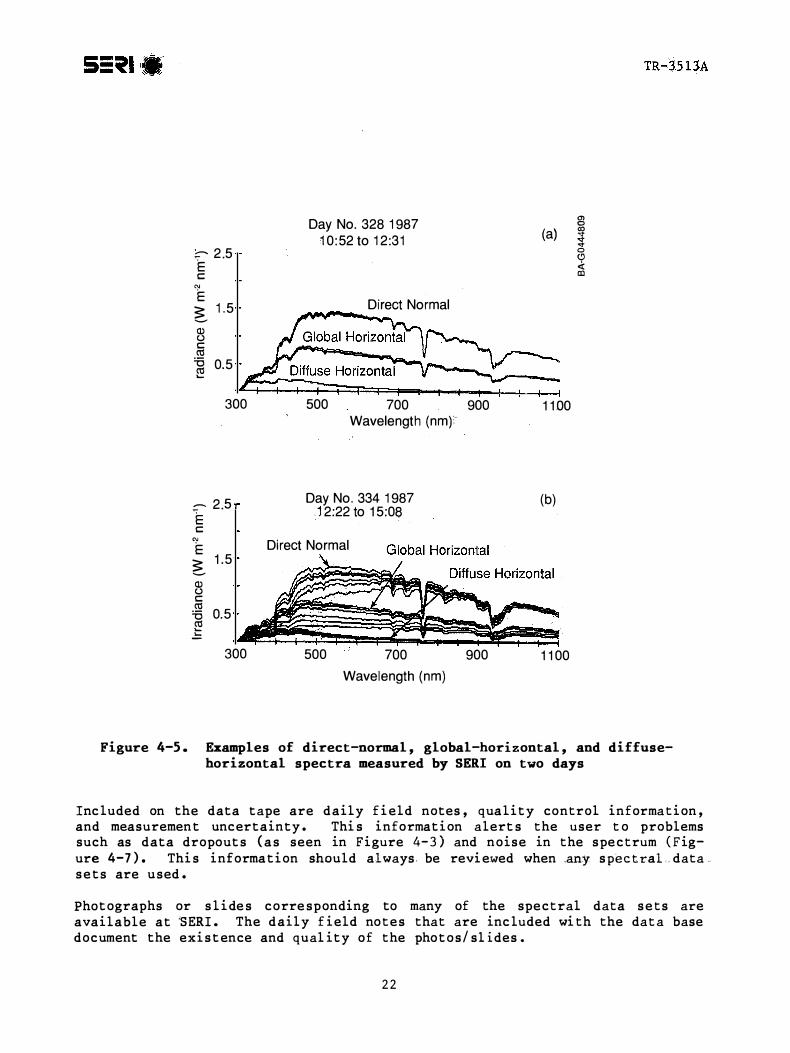
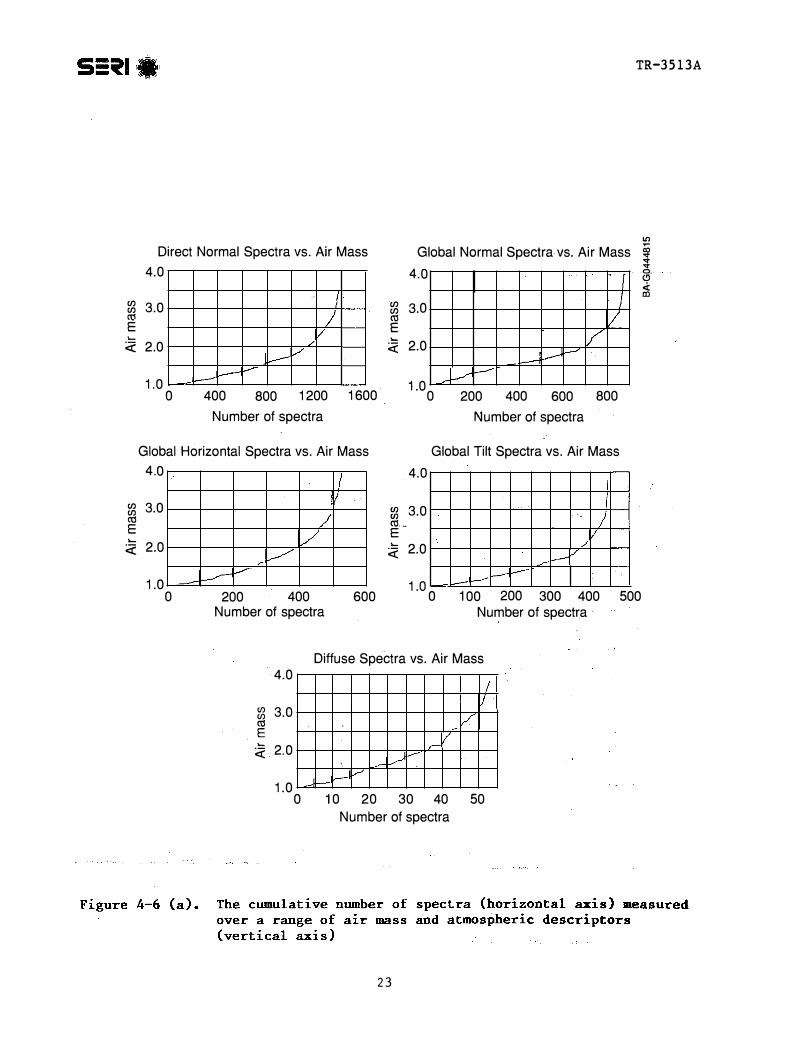
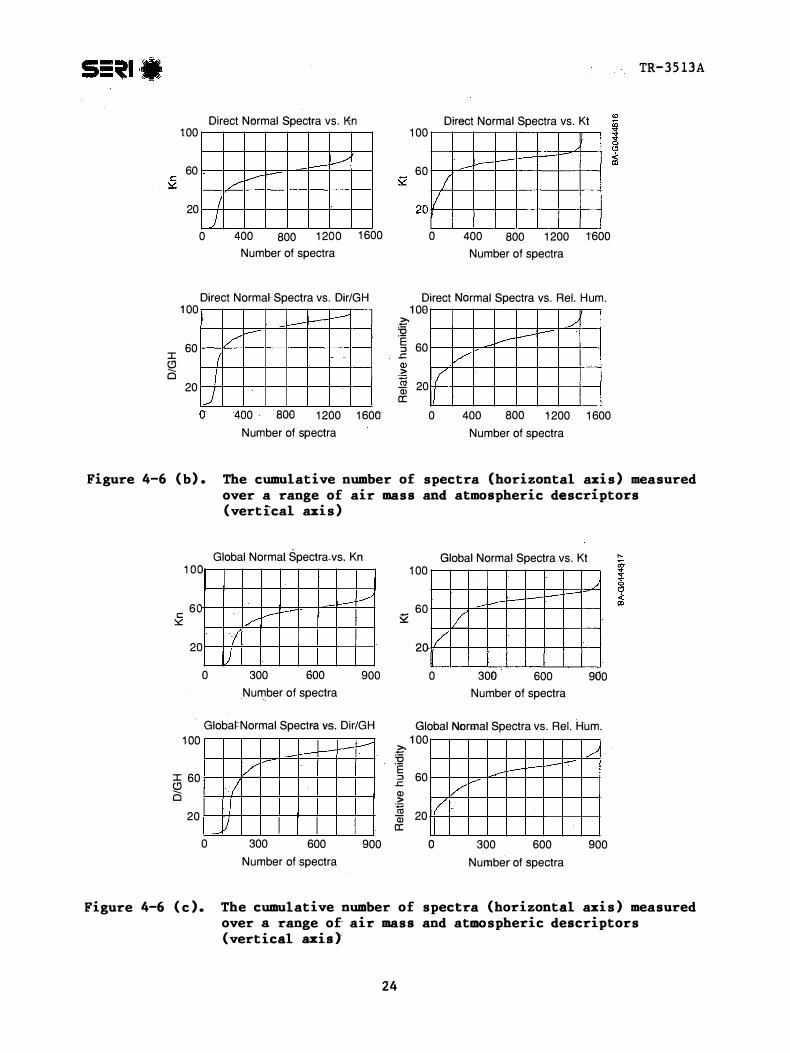
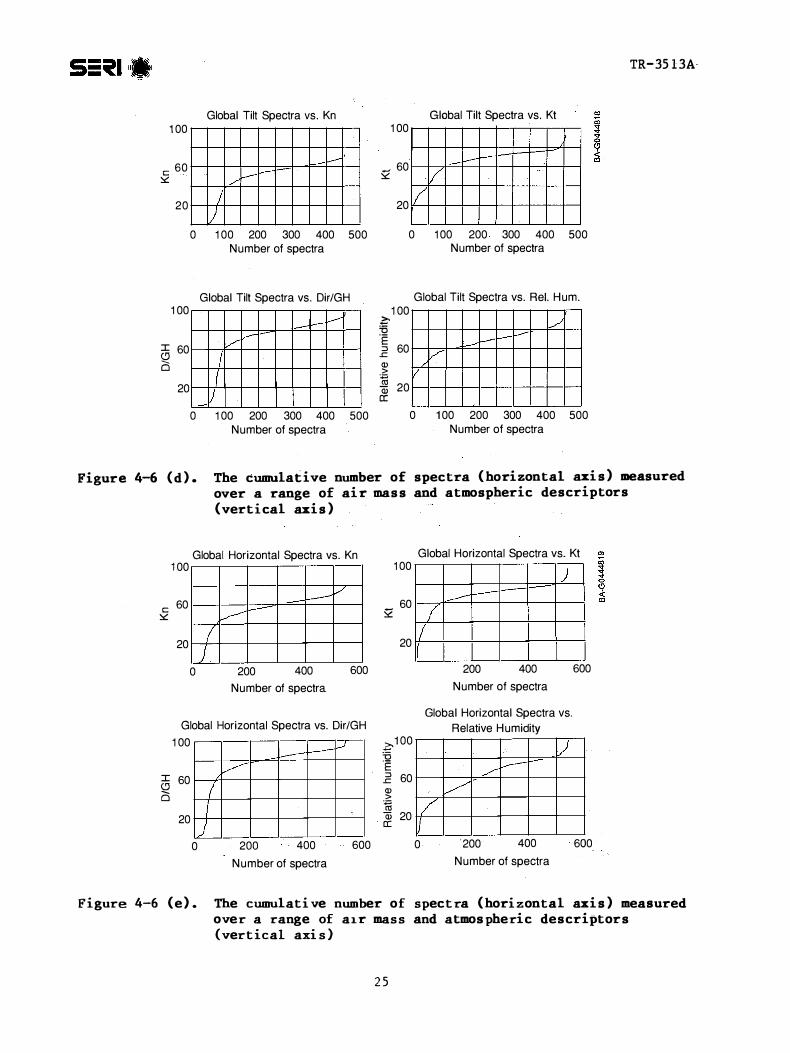
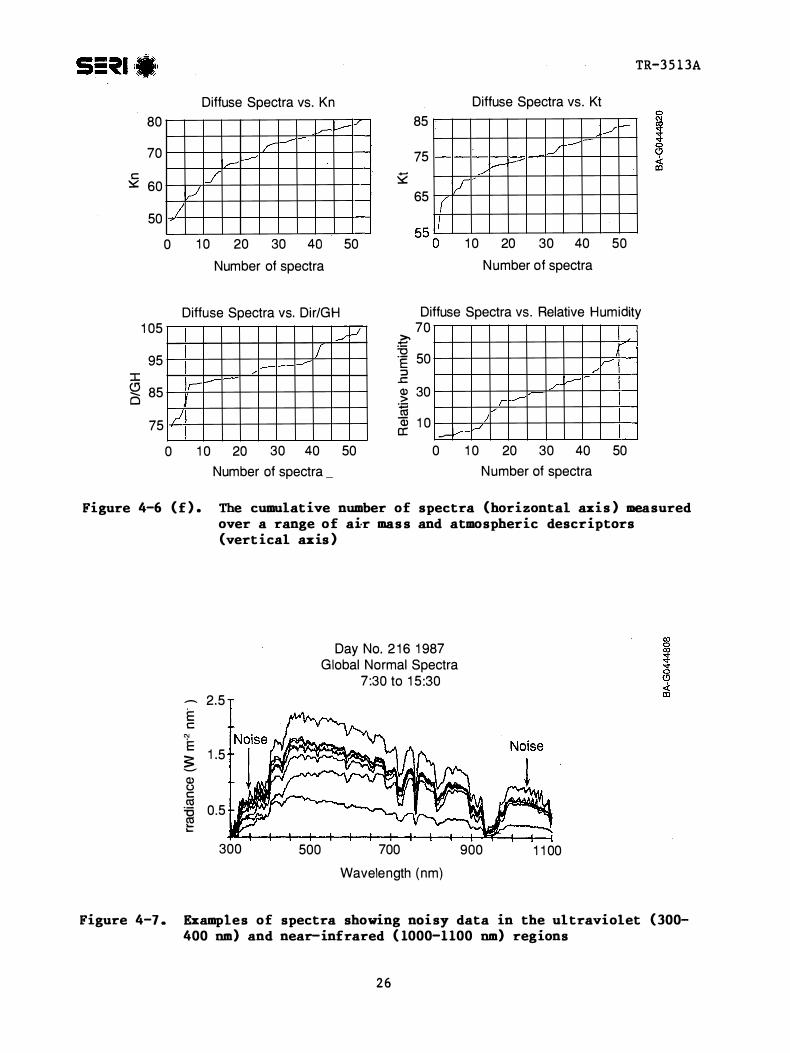
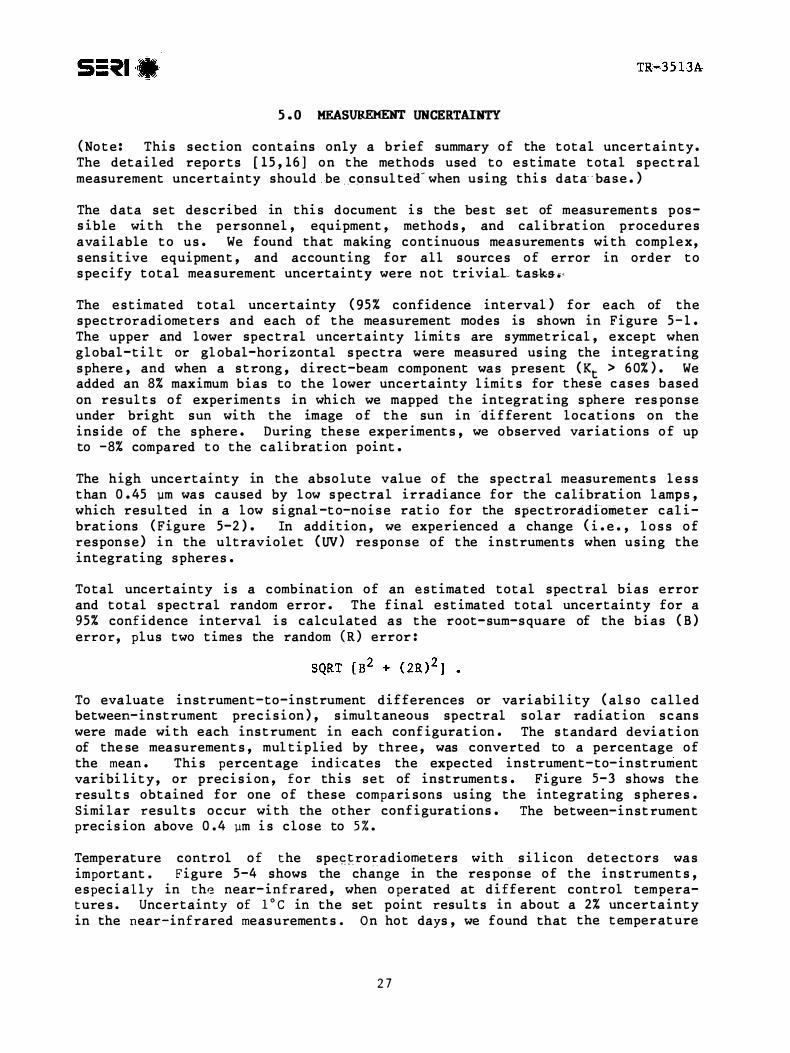
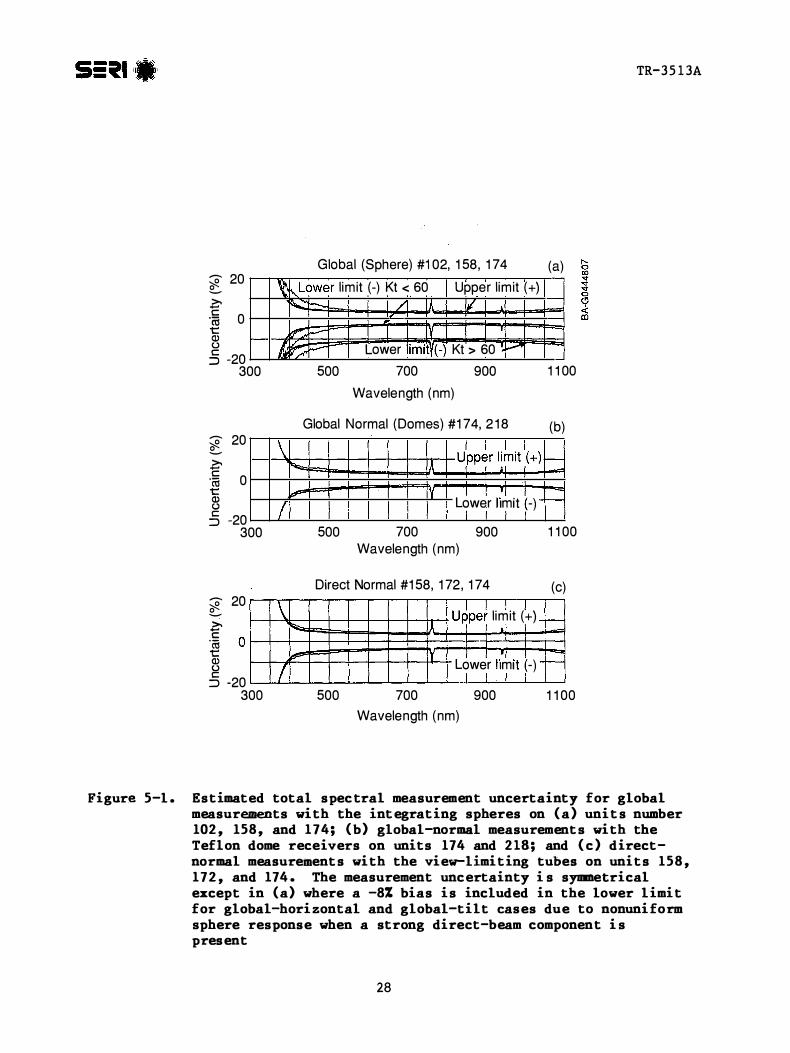
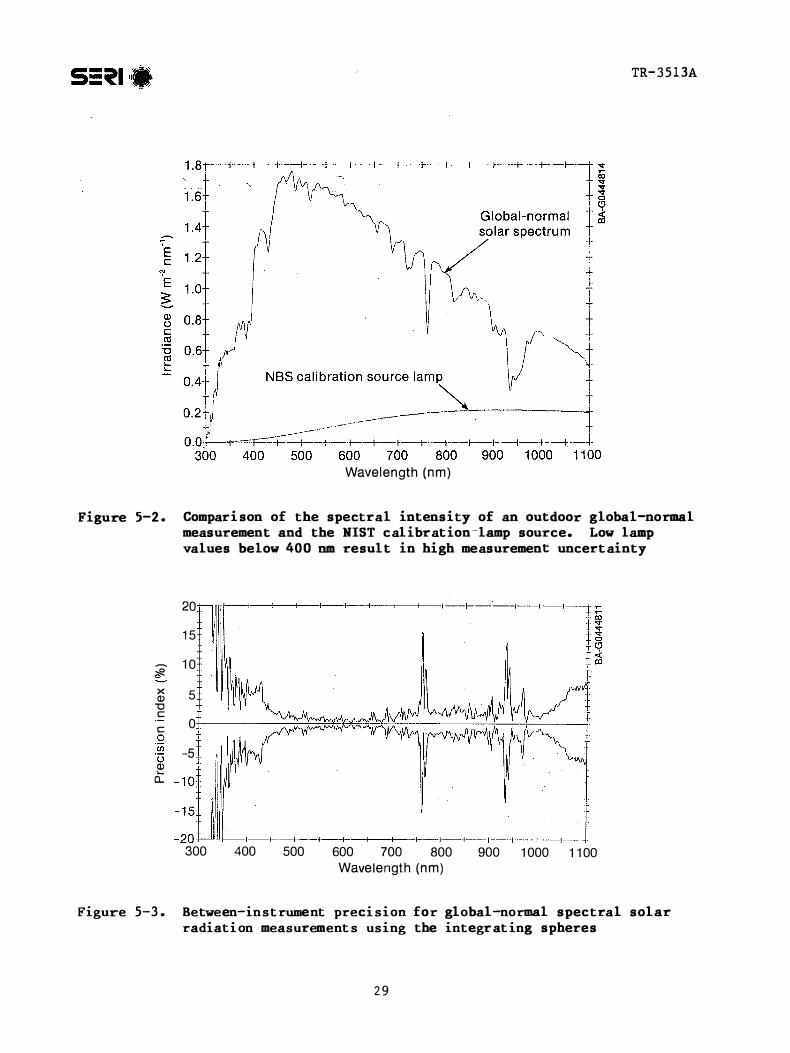
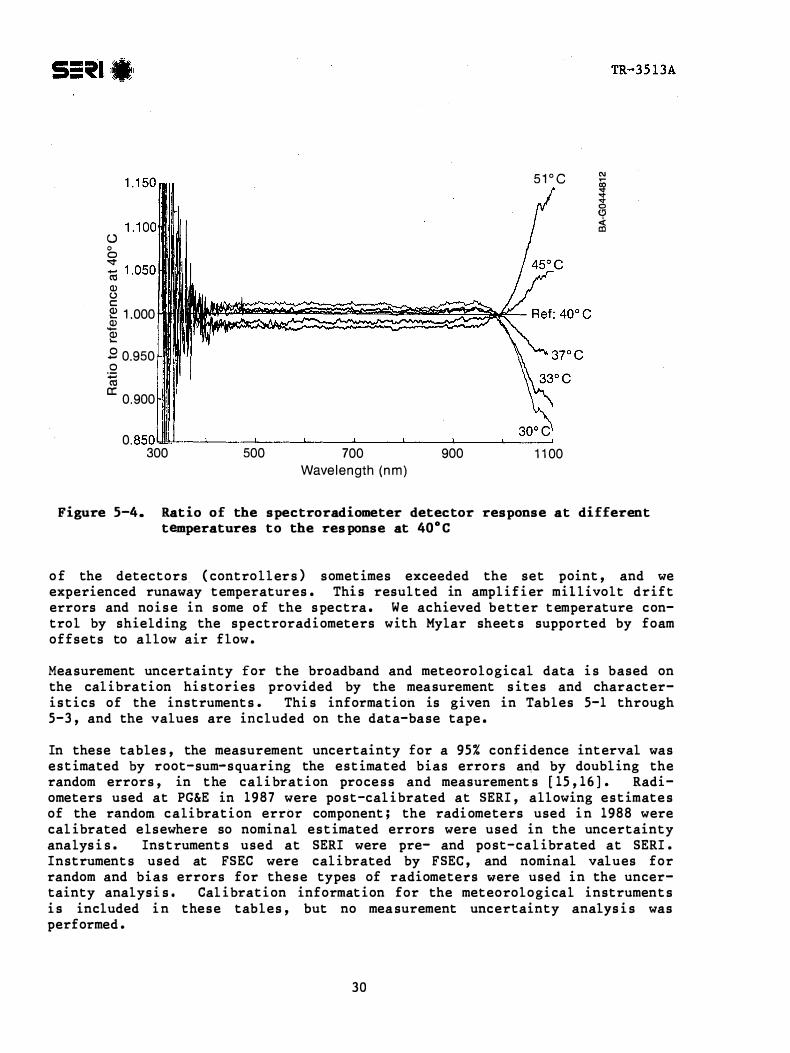
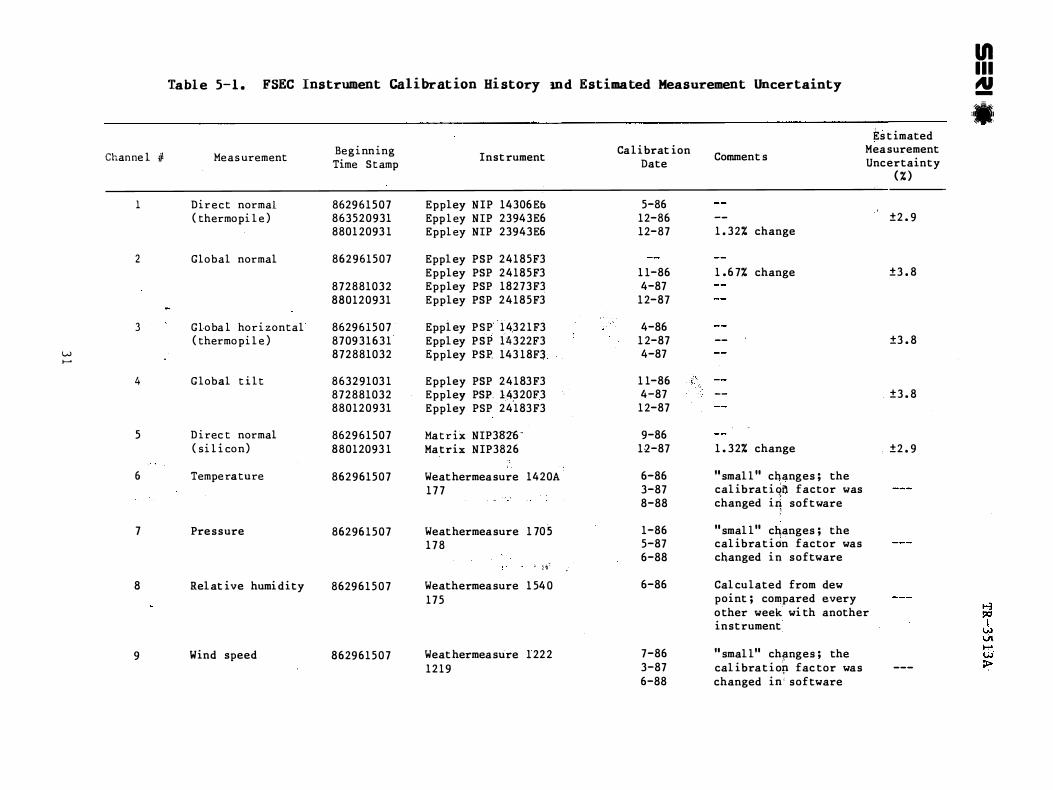
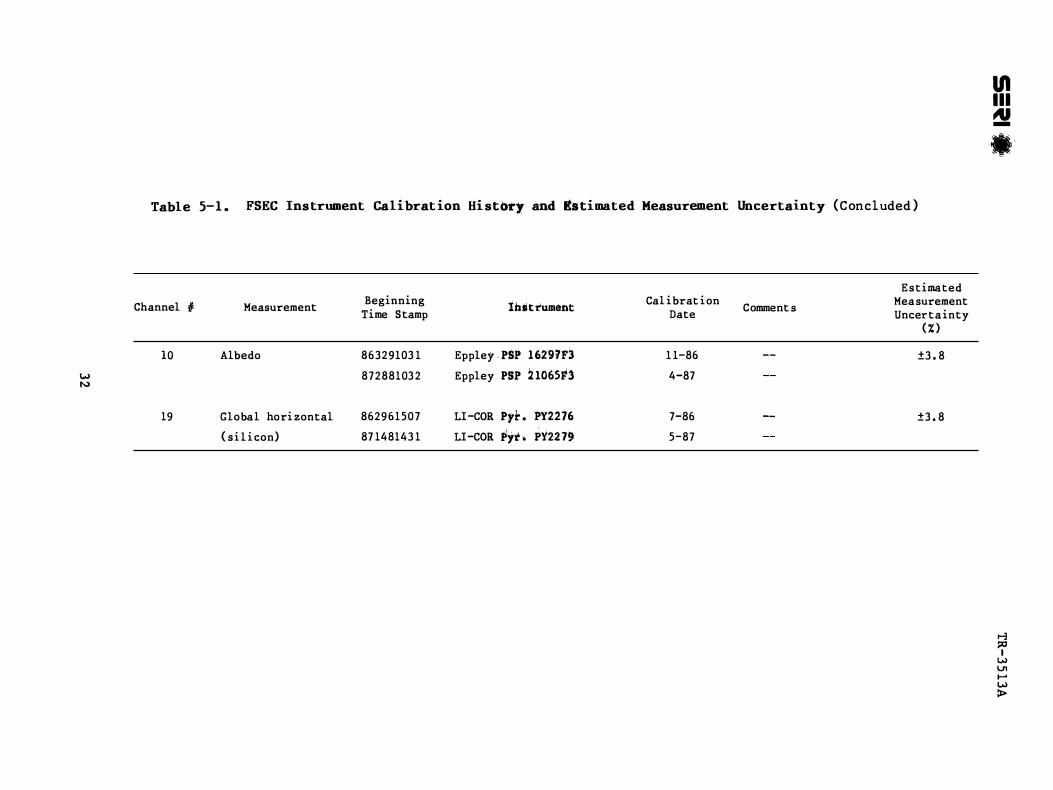
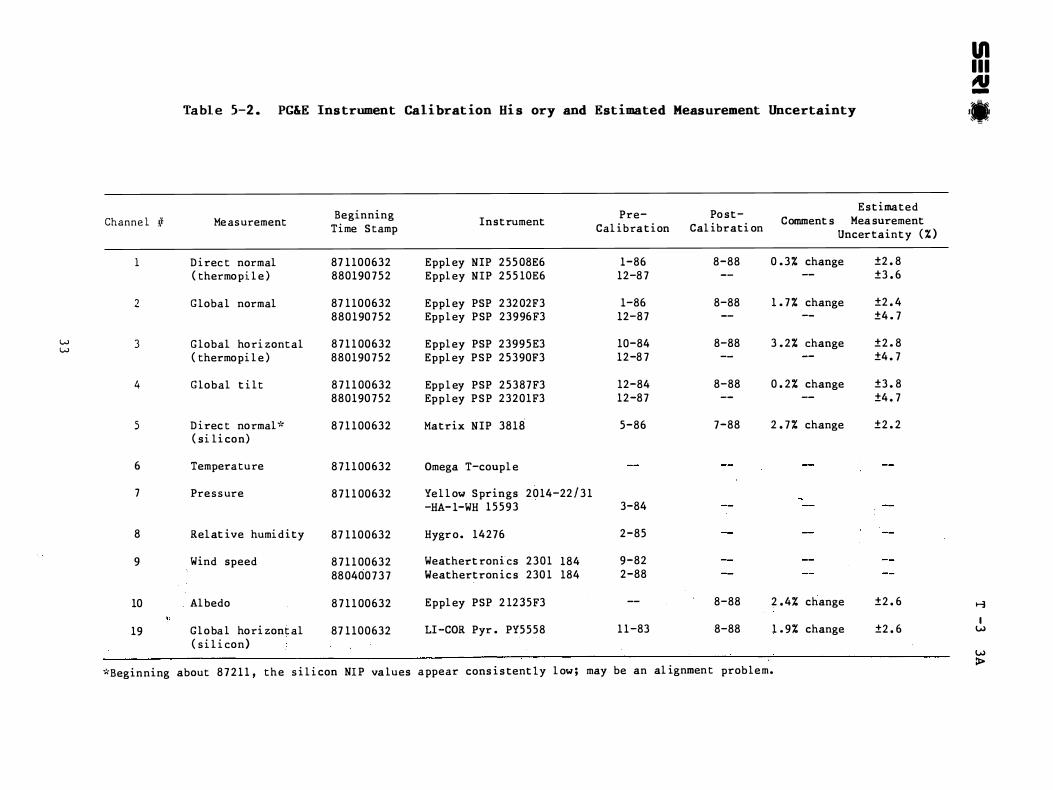
--
p V1 1-
--
--
--
UlIllN-
Tabl e 5-2 PGampE Ins trument Calibrat ion Hi s ory and Estimated Measurement Uncertainty 1 _
Estimated Beginning Pre- Po st-Channe l if Measurement Instrument Comment s Mea surement
Time S tamp Cal ibra t i on Cal ibrati on Uncertainty ( )
l D irec t normal 87 1 100632 Eppl ey NIP 255 08E6 1-86 8-88 0 3 change plusmn2 8 ( thermopi l e ) 880190 752 Eppl ey NIP 255 10E6 12-8 7 -- plusmn3 6
2 G lobal normal 87 1 100632 Eppl ey PSP 2 32 02F3 1-86 8-88 1 7 change plusmn2 4 880190 7 5 2 Epp l ey PSP 23996F3 12-87 -- -- plusmn4 7
3 G lobal hori zontal 8 7 1 1 00632 Eppley PSP 23995E3 10-84 8-88 3 2 change plusmn2 8 w w
( thermopi l e ) 880190 752 Eppl ey PSP 25390F3 12-8 7 plusmn4 7
4 G lobal t i lt 8 7 1 1 00632 Epp l ey PSP 25387F3 12-84 8-88 0 2 change plusmn3 8 -- plusmn4 7 880190 752 Eppley PSP 23201F3 12-87
5 D irec t normal 8 7 1 100632 Matrix NIP 38Hi 5-86 7-88 2 7 change plusmn2 2 ( si li con)
6 Temperature 8 7 1 1 00632 Omega T-coupl e
7 Pres s ure 8 7 1 1 00632 Yel l ow Springs 2014-22 3 1 -HA- 1-WH 15593 3-84
8 Relat ive humi dity 87 1 100632 Hygr o 14276 2-85
9 Wind speed 8 7 1 1 00632 8804007 3 7
Weathert ronics Weathertron i c s
2301 230 1
184 184
9-82 2-88
10
19
Albedo 8 7 1 1 00632 Eppl ey PSP 2 1235F3
Globa l hori zont al 87 1 100632 LI-COR Pyr PY5558 ( s i l i con)
Beginning about 8 7 2 1 1 the s i l i con NI P va lues appear cons i s tent ly l ow
-- 8-88 2 4 change
1 1-83 8-88 1 9 change
may be an al ignment problem
plusmn2 6
plusmn2 6
gt-3 Iw
wgt
-- --
--
-- --
1ftIll -
Table 5-3 SERI Instrument Calibration Hi story and Estimated Measurement Uncertainty =
Estimated Beginning Pre- Post-Channel I Measurement Instrument Comment s Measurement Time S tamp Cal ibration Cal ibration Uncertainty ( )
1 Direct normal 87328 Eppley NIP 1 7828E6 11-87 2-88 1 5 7 change plusmn3 3 ( thermopil e )
2 Global normal None
3 bull Global horizontal 87328 Eppley PSP 1 78 63F3 1 1-87 2-88 2 22 change plusmn3 7 ( thermo pi l e ) a t Welby
w+- At SRRL 8805 7 Eppley PSP 200 79F3 7-87 8-88 0 7 3 change plusmn2 3
4 Global t i l t None
5 Direct normal None ( si li con)
6 Temperature 87328 Taylor Pocket 21430-1 10-86 (Due 10-9 1 )
7 Pressure Cal culated from elevat ion
plusmn0 2 (deg )
8 Relat ive humidity 87328 Dickson 86 100-1 9-87 10-88 -- plusmn2 ( counts )
9 Wind speed Observat ion
10 Albedo -- None
1 1-14 -- Sun photometer ( relative compari sons only)
15 Cloud c over Observed o-3-- lXlIw Global Ho rizontal -- LI-COR Pyr PY1245 11-87 2-88 3 67 change plusmn2 9 V119 ( si l icon) ( s tabi l i ty monitor only) wgt
TR-35 13A
We urge users of the data ba se to refer to the dai l y f i eld no tes for s pe c i a l c i rcumstances recorded b y the operator that may affect data uncertainty The s e no tes include references to the spectroradiometer t emperature c onshyt ro l l e r solar-tracking accuracy and weather cond i t i ons ( such as rain ) Included in the dai l y notes on tbe data-base tape are obs ervat i ons made in qual i t y-control processing as wel l as references to the exi s t ence and qual i t y o f pho t ographs or s l ides
Quant i tat ive pos t-proces s ing qual i ty-control informat i on i s al s o inc luded on t he data-bas e tape and a complete descript ion is given in the appendix o f thi s report Redundant measurement s ( such as before- smiddotcan andmiddot middot aft et-smiddotcan
broadband solar radiat i on direct-norma l and global-hor izont al mea surement s with both thermopile and s i l i con detectors ) and compar i s ons o f integrat ed s pectral so lar radiat ion wi th broadband s o lar radiat i on were used in the qual i ty-control procedure s Users are encouraged to perform the i r own qual i t y-cont rol proce s s ing on the data t o meet their par t i cular requiremen t s
3 5
6 0 FORMAT OF THE DATA TAPE
The meas ured dat a f i eld notes quali ty-control informa t i on and mea surement uncertainty are s t ored on magne t i c tape in 80-character l ines wi th the fi leshyname s given in Table 6- 1 The f i l enaming convent ion used for the mea sured data was
Filename Content
FLA8705 DAT FSEC data 1987 May PGE880 l DAT PGampE data 1988 January SER8 7 1 1 DAT SERI data 1987 November
Data were not acqui red in a l l months so the months may not be cont iguous
Qua l i t y-control informa t i on has the same f i l enaming conven t i on with QC extens ion ( for example FLA8 705 QC ) Dai ly notes are contained in the f i l e s FSEC NOTES PGE NOTES and SERI NOTES respec t i vely The mea surement uncershytainty is in the UNCERT f i l e s
c The DAT f i l e s contain two types of informa t i on D for data and for inst rument configurat ion The f i r s t l ine of a data or confi guration segment beg ins wi th a D or a c re spect ively in the f i r s t column followed by the s i t e year day and t ime stamp the number of l ines in the segment i s in column-s 76-80 so that the user can eas i ly skip the de s i red number of l ine s An example of the information in the conf iguration or 1 1C segment i s
c shown in Figure 6-1 I t begins wi th a followed b y the s i t e FSEC year 11 1 98 7 day 122 and t i me u0830 latitude longi tude and eleva t i on There are 19 channel s for mea surement s zero s pectra in the C segment and 40 l ine s in the segment The con f i gurat ion informa t i on appear s whenever the inst rument set-up or cal ibrat ion wa s changed or t he data acqui s i t ion sys t em wa s res tarted I f the configurat i on wa s not changed at the beginning of the month the configura t i on segment wi l l be in the previous mont h s DAT f i l e
An examp le of a D segment i s shown in Figure 6-2 Thi s segment contains the mea s ured me teoro logical dat a broadband and spectral solar rad i a t i on dat a and anc i l l ary data The data contained in each l ine and column and i t s format are as follows
POS ITION OF VARIABLES IN THE D SEGMENTS (ALL LINES ARE 80 CHARACTERS )
Line Column Cont ent s Format
a = character 1 = integer f = f l oat ing point
LINE 1 1 1 D ( for data ) ( a l ) 3 1 5 Site Year Day Number Time Stamp ( a 1 3 )
3 6 F SEC PGampE o r SERI ( a4 ) 7 8 Year (a2 or i 2 ) 9 1 1 Day Number ( a3 o r i 3 ) 1 2 15 Standard Time ( a4 o r i4 )
36
5-111 - il ll
Da i ly
Uncertainty
-
TR-35 13A -
Table 6 1 Namesmiddot of Files on the Data Tape
Measured and
FSEC
FLA8610 DAT FLA8 6 1 0 QC
FLAB 6 1 1 bull DAT FLA8 6 l l QC
FLA86 1 2 DAT FLA8 6 1 2 QC
FLA8 7 0 1 DAT FLA8 70 l QC
FLA8 704 DAT FLA8 704 QC
FLA8 705 DAT FLA8 7 05 QC
PGampE
PGE8 704 DAT PGE8 704 QC
PGE8 705 DAT PGE8 705 QC
PGE8 706 DAT PGE8 7 06 QC
PGE8 7 0 7- DAT PGE8 7 0 7 QC
SERI
SER87 l l DAT SER8 7 l l QC
S ER8 7 1 2 DAT SER8 7 1 2 QC
SER880 1 DAT SER880l QC
SER8802 DAT SER8802 QC
Ca lcui a t ed Data
FLA8 706 DAT FLA8 706 QA
FLA8 7 0 7 DAT FLA8 7 0 7 QC
FLA8 7 0 8 DAT FLA8 7 0 8 QC
FLA8 709 DAT FLA8 7 09 QC
FLA8 7 1 0 DAT FLA8 7 1 0 QC
FLA8 7 l l DAT FLA8 7 l l QC
PGE8 708 DAT middot
PGE8 708 QC
PGE8 7 0 9 DAT PGE8 709 QC
PGE8 7 l l DAT PGE8 7 l l QC
No t e s
FSEC NOTES PGampE NOTES SERI NOTES
Mea s urement
FSEC UNCERT PGamp E UNCERT SERI UNCERT
FLA8 7 1 2 DAT FLA8 7 1 2 QC
FLA880l DAT FLA880l QC
FLA8 802 DAT FLA8802 QC
FLA8803 DAT FLA8803 QC _
FLA8804 DAT FLA8804 QC
PGE_880l DAT PGE880l QC
PGE8802 DAT PGE8802 QC
PGE8803 DAT PGE8803 QC
3 7 _middot
1 3
1 7
55 1 1-1 TR-3 5 1 3A
0 G) 0 G)G) iC FSEC8 7 1 2 2 0 8 1 3 2 8 4 0 0 0N 80 6 0 0 0W 2M C = 8 7 1 2 2 0 8 1 3 8 7 1 2 2 0 8 1 3+0 0 0 0 0 0 1 9 0 4 0
CHN PARAMETER +- - - - - - - INSTRUMENT- - - - - - - - - -+ +- -CALIBRATION- + OUTPUT FOOT NO TYPE MAKER TYPE SERIAL FACTOR DATE UNITS NOTES
1 Di r- Nor-m Eppley NIP 2 3 9 4 3E6 6 08 1 2 - 186 Wm2 2 Glo Nor-m Eppley PSP 2 4 1 85F3 8 85 l l - 186 Wm2 3 G l o Hor-z Eppl ey PSP l 4 3 2 2F3 6 3 8 1 2 - 2 86 Wm 2 4 Glo Tilt Eppley PSP 2 4 1 83F3 8 9 9 l l - 186 Wm2 iacute5 Dir- N S i MATRIX SI NIP 3826 31 8 0 9 - 186 Wm2 6 Amb Temp WTHRMEAS PRT 1 7 7 l 0 0 3 - 1 8 7 Deq c 7 Sur-f Pr-es WTHRMEAS PIEZO 1 7 8 l 0 0 5 - 1 8 7 Mi l l ibar-8 Re1 Hum WTHRMEAS LiCl 1 7 5 l 0 0 6 - 1 86 Per-cent 9 Wind Spd WTHRMEAS OPT CHOP 1 2 1 9 l 0 0 3 - 1 8 7 Met e r- s i S
1 0 Albedo Epp ley PSP l 6 2 9 7F3 1 0 0 9 l l - 1 8 6 Per-cent l l hot 380 Unused Unused Unused - 9 9 0 0 - 1 - l - 1 Counts iacute1 2 hot 5 0 0 Unused Unused Unused - 9 9 0 0 - 1 - l - l Count s
14 hot 860 Unused Unused Unused - 9 9 0 0 - 1 - 1 - 1 Counts hot 942 Unused Unused Unused - 9 9 0 0 - 1 - l - l Counts
1 5 Opq C loud Unused Unused Unused - 9 9 0 0 - 1 - l - l Tenths 1 6 H2 0 NWS Unused Unused Unused - 9 9 0 0 - 1 - l - l em
Spect l LI -COR L I - 1 8 0 0 PRS - 1 7 2 l 0 0 2 - 1 8 7 W sq m nm l Spect 2 L I - COR L I - 1 800 PRS - 1 0 2 1 0 0 2 - 1 8 71 8 W sq m nm l
1 9 Glo H Si LI -COR L I - 2 0 0S PY2 276 8 4 5 7 - 1 86 Wm2 2 - 1 FIN
FOOTNOTES
1 - 1 7 = DN 18 = GT 2 - SERI l oan un i t
- 1 - FIN
Figure 6-1 Example of the instrument configuration data on the data base tape The numbers refer tmiddotO
1 c indicating configuration 2 FSEC 1987 Day 122 at 8 13 standard time 3 Latitude 4 Longitude 5 Ele vation 6 Reference to configuration file that will be f ound in the
data files 7 Starting data-acquisition time plus number of attempts to
acquire spectra (which would extend the data acquisition time)
8 Number of data channels 9 Number of spectra ( 0 f or configuration files 1 or 2 f or
data files) 10 Number of lines in this segment
38
TR35 1 3A
D FSEC8 7 1 2 2 0 8 1 3 2 8 4 0 0 0N 8 0 6 00 0W 2M C=871 2 2 0 8 1 3 8 7 1 220 814+0 0 0 1 0 0 1 9 2 1 0 0 gS e e Q N FSEC8 7 1 2 2 U PRS - 1 7 2 Col 2 ( + - ) U PRS - 1 0 2 Col 2 ( - ) Col 4 ( + ) 1 7 84 5 5 7 54 5 2 9 3 0 2 - 1 - 9 9 0 3 48 0 1 1 9 48 3 3 4 4 2 7 9 - 1 -9 9 0 1 7 85 0 5 7 5 5 7 2 9 3 0 4 - 1 - 9 9 0 3 4 8 1 1 1 9 4 85 3 4 43 0 1 - 1 - 9 9 0 2 8 4 1 80 0
1 0 9 5 4 1 5 - 99 0 7 1 0 1 7 8 6 2 0 7 8 7 5 8 9 1 5 - 1 - 9 9 0 - 1 - 9 9 0 iacute1 1 3 80 0 - 99 0 Co 1 2 5 0 0 0 - 99 0 Co 1 3 860 0 - 99 0 Co 1 4 942 0 - 9 9 0 Co iacute
- 1 6 0 7 1 5 8 5 7 8 5 6 7 1 58 3 86 9 1 9 9 1 8 7 - 9 0 0 - 9 0 0 - 9 0 0 - 9 0 0 - 9 0 - 9 0 3 1 1 7 4 0 1 3 0 0 1 1 0 0 2 0 57 9 8 9 4 0 0 DNT1 8 4 0 1 3 0 0 1 1 0 0 2 0 2 8 4 1 8 0 0 6 2 4 GTS - 1 0 0 0 0 0 0 0 0 0 0 0 - 1 0 0 0 o o 0 0 0 0 o o
1 3 0 0 0 0 0 0 0 0 3 5 0 0 0 4 0 0 2 1 0 02 5 0 0 14 0 04 1 0 02 1 0 0 5 7 0 0 3 8 amp 1 3 2 0 0 0 7 2 0 056 0 1 0 1 0 0 8 1 0 1 1 8 0 1 2 1 0 1 1 9 0 140 0 138 0 1 3 1 amp 1 340 0 1 4 9 0 16 1 0 162 0 1 5 5 0 16 0 0 1 6 3 0 1 8 5 0 1 9 5 0 1 9 8 0 1 9 9 amp 1 360 0 2 0 9 0 2 1 9 0 228 0 2 4 3 0 258 0 26 5 0 258 0 265 0 268 0 2 89 amp 1 380 0 2 8 0 0 2 7 9 0 26 7 0 2 7 3 0 3 0 1 0 3 08 0 3 1 7 0 326 0 349 0 4 0 2 amp 1 4 0 0 0 4 7 6 0 52 7 0 55 7 0 569 0 580 0 5 9 5 0 6 12 0 63 0 0 64 1 0 648 amp 1 4 2 0 0 652 0 6 54 0 6 58 0 649 0 6 36 0 6 3 2 0 646 0 67 8 0 7 1 8 0 746 amp 1 440 0 7 6 8 0 7 9 9 0 82 2 0 854 0 8 7 7 0 9 0 4 0 9 1 5 0 92 2 0 934 0 94 2 amp 1 460 0 9 6 0 0 964 0 9 7 0 0 9 7 3 0 96 9 0 9 74 0 9 9 0 0 9 9 9 1 0 1 7 1 028 amp 1 4 8 0 1 0 3 3 1 0 25 1 0 0 6 0 9 9 1 0 9 9 0 1 0 1 0 1 026 1 0 3 8 1 043 1 0 4 7 amp 1 500 1 0 3 8 1 034 1 038 1 0 5 1 1 0 58 1 058 1 0 5 1 1 0 3 5 1 0 1 7 1 0 0 7 amp 1 520 1 0 2 0 1 04 1 1 0 5 7 1 063 1 068 1 0 8 1 1 088 1 0 9 3 1 0 9 3 1 0 9 1 amp 1 540 1 0 8 9 1 0 84 1 088 1 0 9 5 1 0 9 7 1 0 9 5 1 0 9 8 1 1 0 2 1 094 1 0 8 7 amp 1 560 1 0 7 8 1 0 7 9 1 08 1 1 0 7 7 1 0 7 2 1 0 7 1 1 0 7 6 1 0 7 8 1 0 7 8 1 0 82 amp 1 580 1 0 9 0 1 0 9 8 1 1 0 1 1 088 1 0 7 4 1 062 1 06 1 1 06 7 1 0 7 4 1 0 80 amp 1 6 0 0 1 082 1 085 1 08 8 1 0 9 2 1 0 9 3 1 0 89 1 083 1 0 7 8 1 0 78 1 0 7 9 amp 1 620 1 0 8 2 1 083 1 0 7 6 1 065 1 0 5 9 1 056 1 06 1 1 0 7 3 1 0 8 0 1 085 amp 1 640 1 0 86 1 084 1 08 1 1 0 7 6 1 067 1 062 1 0 5 2 1 04 2 1 038 1 048 amp 1 660 1 0 7 0 1 086 1 0 9 4 1 0 9 7 1 0 96 1 096 1 09 2 1 0 9 3 1 0 9 1 1 0 89 amp 1 680 1 0 7 9 1 064 1 02 8 0 9 8 0 0 94 3 0 9 3 7 0 954 0 98 0 0 9 9 6 1 0 0 5 amp 1 7 0 0 1 0 0 8 1 0 0 9 1 0 1 3 1 0 1 9 1 0 2 5 1 0 2 2 1 0 0 3 0 9 7 3 0 924 0 8 74 amp 1 7 2 0 0 846 0 842 0 84 8 0 84 9 0 8 54 0 8 7 8 0 9 0 3 0 9 3 1 0 9 52 0 965 amp 1 740 0 9 6 9 0 9 7 7 0 98 3 0 989 0 988 0 9 8 2 0 9 7 6 0 95 0 0 8 81 0 7 6 7 amp 1 760 0 6 1 6 0 5 24 0 54 0 0 646 0 7 7 9 0 8 76 0 924 0 94 5 0 94 7 0 9 45 amp 1 7 8 0 0 94 2 0 94 2 0 9 3 7 0 9 2 6 0 9 1 6 0 9 0 7 0 89 9 0 894 0 8 9 1 0 89 0 amp 1 800 0 888 0 883 0 8 7 9 0 87 5 0 863 0 836 0 8 0 1 0 7 5 7 0 7 2 2 0 7 1 0 amp 1 820 0 7 1 0 0 7 1 9 0 7 3 3 0 74 1 0 7 4 9 0 7 5 7 0 76 3 0 7 7 7 0 7 9 7 0 8 1 0 amp 1 840 0 82 0 0 82 8 0 82 7 0 82 2 0 8 1 5 0 7 9 7 0 786 0 7 83 0 7 8 8 0 7 9 7 amp 1 860 0 80 4 0 8 0 0 0 7 8 8 0 7 8 0 0 7 7 5 0 7 8 0 0 7 8 7 0 786 0 785 0 7 81 amp 1 880 0 7 7 5 0 7 7 4 0 7 7 2 0 767 0 763 0 7 4 7 0 72 1 0 68 2 0 6 30 0 5 88 amp 1 9 0 0 0 57 1 0 5 7 3 0 58 9 0 584 0 568 0 549 0 53 4 0 53 3 0 5 38 0 5 56 amp 1 9 2 0 0 5 7 3 0 57 9 0 56 7 0 526 0 448 0 362 0 2 7 2 0 2 18 0 2 1 0 0 2 32 amp 1 940 0 254 0 262 0 2 5 7 0 253 0 25 7 0 266 0 2 7 5 0 2 85 0 29 9 0 3 1 7 amp 1 960 0 3 33 0 362 0 3 9 6 0 4 3 5 0 4 7 9 0 5 06 0 5 1 5 0 5 1 2 0 5 08 0 5 2 1 amp 1 9 8 0 0 53 7 0 560 0 5 84 0 5 9 7 0 6 0 9 0 6 1 7 0 6 1 8 0 6 2 3 0 62 1 0 6 1 9 amp 1 1 0 0 0 0 6 1 8 0 6 0 7 0 6 0 5 0 6 0 2 0 60 1 0 60 5 0 6 04 0 604 0 604 0 6 0 1 amp 1 1 0 2 0 0 60 1 0 59 5 0 5 9 5 0 5 93 0 589 0 59 0 0 584 0 5 82 0 580 0 5 75 amp 1 1 0 4 0 0 5 7 6 0 5 7 1 0 57 1 0 56 7 0 56 0 0 56 0 0 558 0 552 0 545 0 54 0 amp 1 1 0 6 0 0 5 36 0 53 2 0 5 2 9 0 5 2 5 0 5 1 9 0 5 1 5 0 5 1 2 0 51 1 0 50 9 0 5 08 amp 1 1 0 8 0 0 50 6 0 502 0 4 9 2 0 48 3 0 48 3 0 483 0 46 9 middot 0 4 5 2 0 447 0 3 1 amp 1 1 1 0 0 0 4 1 1 - 9 9 0 0 0 - 9 9 0 0 0 - 9 9 0 0 0 - 9 9 0 0 0 - 9 9 0 0 0 - 9 9 0 0 0 - 9 9 00 0 - 1 582 3 2 2 3 0 0 0 0 0 6 0 0 0 1 0 0 0 4 0 0 1 3 0 0 1 9 0 0 2 3 0 04 1 0 0 5 5 0 064 0 088 amp 2 3 2 0 0 1 0 5 0 1 3 9 0 1 7 9 0 1 8 9 0 2 2 4 0 2 38 0 26 2 0 252 0 261 0 2 64 amp 2 340 0 2 8 7 0 2 9 2 0 266 0 2 88 0 2 98 0 286 0 3 0 0 0 3 0 0 0 2 9 1 0 2 85 amp 2 360 0 296 0 3 1 0 0 3 36 0 367 0 3 9 0 0 3 7 2 0 3 56 0 356 0 3 7 3 0 3 88 amp
Figur e 6-2 Examples of the data on the data-base tape
3 9
TR-3 5 1 3A
16 2 3 24 24 2S 3 3 34 34 3S 3 9 40 40 4 1 S 2 S4 69
54 62
6 3 6 3
6 7 6 7
7 0 7 3
74 7 S
7 6 80
LINE 2
LINE 3
1 3 4 10
1 1 1 3 14 20 2 1 23 24 30 3 1 40 4 1 43 44 SO 5 1 5 3 54 60
Lat i tude ( deg ) N ( north) Longi t ude ( deg ) W ( we s t ) `Elevat i on (m) M (m) Reference t o Conf i guration Segment Start ing year day t ime for the spectral `scan s ) i f any and number of attempt s t o `acquire the s can ( which ind i cates po s s ible `t ime delay from the s tart ing t ime ) middot
Year Day Number Time
11+11 for plus number of attempt s to acquire a s pect rum
Number o f attempt s t o acquire a s pectrum
Po s s ible Number o f Measurement s ( 1 9 )
Number o f Spec tra i n thi s Segment ( 0 1 or 2 )
Number o f Lines in Segment
Pointer to the qua l i ty-cont rol dai ly f i e ld note s and measurement uncertainty informa t ion Qua l i ty-control informa t i on is in the QC f i l e of the same month wi th the same s i t e year day and t ime s t amp Dai l y field notes are i n the NOTES f i l e f o r the same s i t e wi th the same s i t e year and day s tamp Mea surement uncertainty i s in the f i l e s UNCERT under t h e instrument serial number ident i f i ed by PRS-xxx and the column s in the uncertainty f i le s for + and - uncertainty l imi t s
Broadband mea surement s before the spectral scan
Channel fH Direct Normal ( thermopi l e ) (Wm2 ) Channel ffoS Direct Normal ( s i l i con) (Wm2 ) Channel tn Global Normal ( Wm2 ) Channel not used Charinel ffo3 Globa l Hori zontal ( thermop i l e ) ( Wm2 ) Channel fH 9 Gl obal Horizontal ( s i l icon ) ( Wm2 )
( f 8 4 ) ( a 1 ) ( f 9 4 ) ( a l ) ( i S ) ( a l ) ( a l 2 )
( a9 o r i 9 )
( a 1 )
( i 1 )
( i4 )
( i 2 )
( i S )
( a8 0 )
( i 3 ) ( pound 7 2 ) ( i 3 ) ( pound 7 2 ) ( i 3 ) ( f 7 2 )
( i 3 ) ( pound 7 2 ) ( i 3 ) ( pound 7 2 )
40
TR-35 3A
6 1 6 3 64 7 0 7 1 80
LINE 4
LINE 5
1 6
7 1 2
1 3 80
LINE 6
1 3 4 1 0
1 1 1 3 1 4 20 2 1 23 24 3 0
3 1 3 3 34 40 4 1 43 44 5 0 5 1 5 3 5 4 6 0 6 1 6 3 64 7 0 7 1 7 3 7 4 8 0
LINE 7
LINE 8
1 5
6 1 2
Channe l 114 Gl obal Ti l t (Wm2 ) hellipChannel not used
Broad band mea suremen t s a f t e r t h e s p e c t ral s can same format a s beforeshy scan ( LINE 3 )
T i l t o f the f ixed- t i l t i n s t rument s hellipf rom the hor i z ont a l ( d eg )
Az i muth of the f i xed-t i l t ins t rumen t s ( de g ) ( 1 8 0 deg = s outh)
De s c r i p t i on o f any s pec i al i n s t rument ( fo r example d i ffu s e-hori zont a l mea s uremen t s a t SERI )
Channe l IFlOAl bedo (Wm2 ) hellipChannel IH5C l oud Cover ( t enths ) Channel fF7 Surface Pres sure ( mb ) Mea s ured at FSEC and PGampE c a l c u l ated from e l eva t i on a t S ERI [ 1 1 p 1 0 0 ]
Channel 116 Amb i en t Temperature ( deg C ) Channel fiB Rel a t i ve Humi d i t y ( ) Channe l ffo9 Wind S peed ( m s ) Add i t i onal channe l des cri bed 1n l i ne 5 Va l ue Add i t i onal channel descri bed 1n l ine 5 Va l u e
Sun Pho t ometer read ings ( only recorded for SERI dat a not u s ed except for re l a t i ve c ompar i s on s ) hellip
Earth-S un d i s tance c orrec t i on ( d e v i a t i on from 1 0 ) hellip
Ext ra t erre s t r i a l Rad i a t i on (Wm2 ) hellip
( i 3 ) ( pound 7 2 )
( f 6 1 )
( f 6 1 )
( a 8 8 )
( i 3 ) ( 7 1 ) ( i 3 ) ( 7 1 ) ( i 3 ) ( f 7 1 )
( i 3 ) ( pound 7 1 ) ( i 3 ) ( pound 7 1 ) ( i 3 ) ( pound 7 1 ) ( i 3 ) ( variabl e ) ( i 3 ) ( variabl e )
( f5 2 )
( f 7 1 )
4 1
9
42
TR-3S l 3A
1 3 1 8
1 9 24
25 30
3 1 36
3742
43 48
49 68
69 72
13 76
1780
LINE
I
3 6
7 1 1 1216 1 7 20 21 25
2631
3236
3839
40 40
41 42
43 46
Zen i t h Angl e ( deg ) ( f6 2 )
Kt ( ra t i o calculated from ( f6 1 ) thermo p i l e inst rument s )
Kn ( rat i o calculated from ( f6 1 ) thermo p i l e instrument s )
D GH ( ra t i o cal culated from thermopile instrument s ) ( f6 1 )
Albedo ( ) ( f6 1 )
Ai r Mas s ( f6 2 )
Res erved for Turbidi ty i f calculated
Precipi table Water Vapor i f calculated from sun photomet er
Precipi table Water Vapor from the ( f4 1 ) Nat ional Weather Servi ce
Prec i p i table Water Vapor Cal culated from Relative Humid i t y ( f4 1 )
Channel H7 Number o f Wave l engths Recorded by Spect roradi ometer 1
Beginning Wavelength ( nm ) Ending Wavel ength (nm) Wavelength Step Size (nm ) Spectroradi ometer 1 Ti l t from the Horizontal ( deg )
Spectroradiometer 1 Azimuth ( deg )
Angle o f Incidence o f the Direct Beam on Spectroradi ometer 1 ( deg )
Measurement Type ( DN GN GH GT DF )
Attachment ( Tef lon Dome D Integrat ing Sphere S View- l imit ing Tube T )
Channel H8 Number o f Wavel engths Recorded by Spectroradi ometer 2
( i2 )
( i4 )
( i S ) ( i S ) ( f4 1 )
( fS l )
( f6 1 )
( fS 1 )
( a2 )
( a l )
( i 2 )
(i4)
TR-3S l3A
4 7 S l Beginning Wavel ength (nm ) ( i S )
S 2 S 6` Ending Wavel ength ( nm ) ( i S )
S 7 60 Wavelength Step S i z e ( nm ) ( f4 bull 1 )
6 1 6S Spec troradi ometer 1 T i l t from the Hori zontal ( deg ) ( fS l )
6 6 7 1 ` Spect roradi ometer 2 Az imuth ( deg ) ( f6 1 )
7 2 76` Angle of Incidence o f the Direct Beam on Spect rorad i ometer 2 ( deg ) ( fS l )
7 8 7 9 Mea surement Type ( DN GN GH GT DF ) ( a2 )
8 0 80 At tachment ( Teflon Dome D Integrat ing Sphere s View-l imi t ing Tube T ) ( al )
LINE 10 Saved f o r extra spectroradi ometers i f needed
I f no spec tral data were recorded the number of l ines in the D s egment i s 1 0 the number of spectra i s 0 and there i s no corre sponding qual i ty-control information for thi s dat e t ime in the QC f i l e s No qual i ty c ontrol wa s performed because the atmo sphere was uns table I f the number o f spectra i s 1 there are 60 l ines in the D s egment i f there are two spectra t he number o f l ines i s 100
I f middot the number of spectra i s 1 or 2 the spectral data fol low after the f i r s t 1 0 l i nes o f the D segment There are 1 0 spectral measurement s per l ine wi th the number in the lef t-mo s t column indicat ing the f i r s t or second specshyt roradiometer ( 1 or 2 ) f o l l owed by the s tart ing wavelength ( in nanometers ) and t he 10 spectral mea surements ( in Wm2-nm) The 1 0 measurement s are at wave l ength inc rements of 2 nm There are 401 spect ral mea surement s from 300 t o 1 1 0 0 nm in 2-nm s teps with 10 measurement s per line for 40 l ine s and one measurement in the 4 1 s t l ine The l a s t number in the 4 1 s t l ine i s the specshytral integral I f a second s pectrorad i ometer wa s used the next 4 1 l ines folshylow t he same format Blank 1 ines follow the spec tral data t o f i l l the D segment to 60 or 100 l ines
An example of a QC f i l e i s shown in Figure 6-3 The f i r s t l ine o f each segment begins with a Q f o l l owed by the s i t e year day number and t ime s tamp with the number of l ines in the segment given in the l a s t col umn s o f the l ine Following the iden t i fier are me s sage s about var iables that were flagged by the automat i c qua l i ty-control proc e s s ing ( s ee appendi x ) noted by an operator at the measurement s i t e or noted dur ing inspec t i on at SERI The l a s t l ine of the segment shows the QC code for as DN ( direct normal thermopile detect o r ) SN ( d i rect normal detector ) AL
var iabl e s such s i l i con
( a lbedo ) and SP ( s pectrum) a s de s c r i bed in the appendi x Three qual i tyshycontrol code s ar8 used 1 = good 2 = suspec t see me s sages and dai ly not e s and 3 = poor or mi s s ing see me s s ages and da i l y no te s The broadband codes ( DN SN GN GH SH and GT ) have two value s the f i r s t is the before- scan measurement and the second is the after-s can mea surement
4 3
TR-35 13A
Q FSEC87 1 2 1 0 7 3 1 4 Noise in GH spectrum in UV QCDN1DN1SN1SN1GN1GN1GH1GH1SH1SH1GT1GT1AL1AP1PR1TC1RH1WV1WS1KT1KN1DG1SPl iN1SP2IN2
Q FSEC8 7 1 2 1 0 8 3 0 8 SN bef SN af t = 1 0 5 5 S H bef SH aft = 1 0 5 3 2nd Int BB b e f = 0 636 2nd Int BB aft = 0 6 5 1 Noise in GH spectrum i n UV QCDN1DN1SN2SN2GN1GN1GH1GH1SH2SH2GT1GT1AL1AP1PR1TC1RH1WV1WS1KT1KN1DG1SP1 IN1SP2IN2
Q FSEC8 7 1 2 1 1 0 3 1 3 QCDN1DN1SN1SN1GN1GN1GH1GH1SH1SH1GT1GT1AL1AP1PR1TC1RH1WV1WS1KT1KN1DG1SP1 IN1SPl iNl iacute
Q FSEC87 1 2 1 1 1 3 1 3 QCDN1DN1SN1 SN1GN1GN1GH1GH1SH1SH1GT1GT1AL 1AP1PR1TC1RH1WV1WS1KT1KH1DG1SP 1 IN1SP1 IN1
Q FSEC8 7 1 2 1 1 2 3 1 3 QCDN1DN 1SN1SN1GN1GN1GH1GH1SH1SH1GT1GT1AL1AP1PR1TC1RH1WV1WS1KT1KN1DG1 SP1 IN1SP 1 IN1
Q FSEC8 7 1 2 1 1 3 3 1 3 QCDN1DN1SNlSNlGNlGN1GH1GH1SH1SH1GTlGTlALlAPlPRlTClRHlWVlWSlKTlKNlDGlSP l iNlSPliNl
Q FSEC8 7 1 2 1 1 4 3 1 3QCDNlDNlSNlSNlGNlGNlGHlGHlSHlSHlGTlGTlALlAPlPRlTClRHlHVlHSlKTlKNlDGlSPl iN1SP1IN1 Q FSECB7 1 2 1 1 554 3 QCDNlDNlSNlSNlGNlGNlGHlGHlSHlSHlGTlGTlALlAPlPRlTClRHlWV1WSlKT1KN1DG1SP 1 IN1SP l iN1
Q FSEC8 7 1 2 1 16 3 0 3 QCDNlDNlSNlSNlGNlGNlGHlGHlSHlSHlGTlGTlALlAPlPRlTC1RH1WV1WSlKTlKNlDG1SP l iNlSPl iNl
Q FSECB 7 1 2 1 1 7 3 1 5 GH bef SH bef = 0 9 3 1 GH aft SH af t = 0 9 3 3 QCDN1DN1SN1SN1GN1GNlGH2GH2SH2SH2GTlGT1ALlAPlPRlTClRHlWVlWSlKTlKNlDGlSPl iNlSPl iNl
Q FSECB 7 1 2 2 0 7 3 1 3 QCDNlDNlSNlSNlGNlGNlGHlGHlSHlSHlGT1GTlALlAPlPRlTClRHlWVlWS 1KT1KNlDGlSP l iNlSPl iNl
Figure 6-3 Example of quali ty-control inf ormation on the data- base tape
Figure 6-4 shows an exampl e of a segment of the daily notes from the FSEC NOTES f i l e Each segment of the f i l e beg ins wi th an followed b y the s i t e year and day number s t amp with the number of l ines in the segment given in the last columns of the l i ne The next l ine contains the s i te operashytor log sheet number month day year day number spectroradi ometer serial number( s ) and mea surement mode( s ) The PGampE and SERI not e s do not include the dai ly l og sheet number The f i rst two l ines are followed by f i eld no te s No tes that were added after inspec t i on at SERI are s eparat d from the operator notes wi th ------- The exi s tence of s l ides or photographs i s ind i cat ed a s wel l a s their qua l i ty i e good ( G ) marginal ( M ) or poor ( P ) In the exampl e in thi s f i gure there were two log sheets for thi s day (number 1 1 6 and 1 1 7 ) because the mea surement mode changed from gl obal hor i z onshytal ( GH ) to global t i l t ( GT )
44
TR-3513A
N FSEC87 1 2 2 1 1 6 0 5 0 2 8 7 1 2 2 1 7 2 DN 1 0 2 GH Clear at 0 7 3 0 GH f o r f ir s t two s cans then GT S l i de s 0 6 3 2 G
0 7 3 3 G 0 8 3 3 G 0 9 3 3 H ( dark ) 1 0 3 3 p1 1 3 3 p1 2 3 3 p 1 3 3 3 p1433 H 1 5 3 3 G 1633 G 1733 G
1 1 7 0 5 0 2 87 1 2 2 1 7 2 DN 1 0 2 GT GT s tart ing at 0 8 0 0 iacuteC lear a t 0 8 0 0 iacuteS l ides S e e above
16 1 1 8 0 5 0 3 8 7 1 2 3 1 7 2 DN 1 0 2 GT Clear at 0830 S l i de s 0633 G
0733 G 0833 G 0933 H ( dark ) 1 0 3 3 p1 1 3 3 p 1233 p 1333 p1433 H 1533 G 1633 G 1733 G
N FSEC87 1 2 3
Figure 6-4 Examples of daily notes on the data-base tape
An example o f a segment of the measurement uncertainty file UNCERT CAL i s shown in Figure 6-5 The f i r s t l ine begins with a U followed by the serial number of the s pect rorad i ometer The upper and lower measurement uncertainty l imi t s are given in the co lumns fol lowing wavelength wi th the appropri a t e measur ement mode dat es and de script ion at the top o f the column The s econd l ine in each segment o f the DAT f i l e s is a pointer to the correct uncershytainty information in UNCERT CAL The broadband s o lar radiat i on and meteshyorolog ical instrument measurement uncertainty fol lows each spectra l measureshyment uncertainty segment in UNCERT CAL
The format o f thi s data ba se was es tabl i shed at SERI t o accommodat e expanded mul t i year long-term data collect ion Users can reformat the data t o suit their part icular needs We recommend the following s t eps for acce s s ing and document ing parti cular data set s
1 Se lect and extract the des ired spectral data from the DAT f i l e s us i ng in formation such as measurement mode day number t ime air mas s or a moshys pheric condi t ions depending on the de s i red attribut es
2 Ex trac t and review the corres ponding segment s of the qua l i ty-cont rol i n format i on from the QC f i l es
3 Ex trac t and review the corres pond ing field no tes from the NOTES f i l e s
4 5
+ I -
5 4
3 7
TR- 3 5 13A
U PRS - 1 0 2 L I -COR PRS - 1 0 2 i
1 2 3 4 5 Ill
Wav GHS GHS GHS GHS GTS GTS GTS GTS Kt gt 6 0 Kt gt 6 0 Kt gt 60 Kt gt 6 0 iacutel ower lower upper upper 2 8 7 - 8 8 7 -8 8 7 5 8 8 GNS GNS
upper upper lower l ower
+ 1 -
- GHS GHS GTS GTS Kt lt 60 Kt lt 6 0 upper uppe r l ower l ower + I - + I -2 8 7 - 8 8 7 -8 87 5 - 8 8
3 0 0 - 1 0 0 0 - 1 00 0 1 0 0 0 1 0 0 0 3 0 2 - 1 0 0 0 - 1 0 0 0 1 0 0 0 1 0 0 0
4 0 0 - 2 3 3 - 1 7 1 1 5 3 9 1 4 0 2 iacute -2 2 0 - 1 7 3 1 4 0 9 3
5 0 0 - 1 3 4 - 1 1 7 3 7 5 0 2 iacute - 1 3 3 - 1 1 7 5 3 3 7
6 0 0 - 1 1 8 - 1 1 1 3 8 3 1 6 0 2 - 1 1 9 - 1 1 1 3 9 3 1
7 0 0 - 1 1 5 - 1 0 7 3 5 2 7 7 0 2 - 1 1 3 - 1 0 7 3 3 2 7
8 0 0 - 1 1 6 - 1 0 6 3 6 2 6 8 0 2 - 11 7 - 1 0 6 3 7 2 6
9 0 0 - 1 1 2 - 1 0 5 3 2 2 5 9 0 2 - 1 1 4 - 1 0 8 3 4 2 8
1 0 0 0 - 1 1 7 - 1 0 8 2 8 1 0 0 2 - 1 1 8 - 1 0 8 3 8 2 8
1 1 0 0 - 1 2 9 - 12 2 4 9 4 2
Figure 6-5 Examples of spe ctral measurement uncertainty on the data-base tape A value of plusmn100 indi cates greater t han 100 measurement uncertainty
46
TR-35 13A
4 Extract the measurement uncertainty information from the 1 1 UNCERT f i l e s and quot e mea surement uncertainty for a l l data used
5 Examine the dai l y broadband and spec tral solar radiatio data graphs in the catalog ( Volume I I of thi s report [ 1 8 ] i f avai labl e These graphs provide informa t i on on atmo spheric condi t i ons during the day For exampl e Figure 4-3 shows dai l y broadband and spec tral plot s for part ly c loudy condi t i ons when s olar rad i a t i on i s changing rapidly throughout the day The sun i s obs cured when the direc t-normal values drop t o zero and the gl obal value s approach each o ther Figure 4-1 shows a clear daybull
No data should be used wi thout consult ing the qua l i ty-control informa t i on dai ly no tes and measurement uncertainty
4 7
Cel l s
Ce l l s
Energy
Meteorologi cal Society
Appl i ed Meteorol ogy
Energy
Radiat ion Topical Overview Solar Cel l s Vo l 1 8
of the Pho tovo l t a i c s and Insolat ion Mea sureshySolar Vol 1 8 1 986 pp 393-3 9 5
TR-35 1 3A
1 0 REFERENCES
1 Hul st rom R L Solar 1 986 PPbull 1 7 9- 1 8 7
2 Hul st rom R L A Summary ments Workshop Panel Resul t s
3 Hul strom R L Re sul t s of the Amorphous S i l i con Mea surement s Ta sk Force Solar Cel l s Vo l 18 1 986 pp 1 7 1-1 7 7
4 Hul strom R L and J M Ohi Resul t s of the SERI Mul t i junction Devi ce Efficiency Measurement Task Forc e pre sented at the 20th I EEE Photovo lshytaic Spec ial i s t s Conference September 1 988
5 Riordan c and R L Hul s t rom Summary of S tud i e s that Examine the Effec t s of Spect ral Solar Radition Vari at ions on PV Device Des ign and Pershyformance SERI-TR-2 15-343 7 Golden CO Solar Energy Research Ins t i tute 1989
6 Riordan c Joint EPRI-SERI Spectral Solar Rad i a t i on Database Pro j ec t
1
8
9
1 0
1 1
1 2
1 3
14
Solar Vol 2 1 1 98 7 pp 3 3 7-342
Riordan c D Myers M Rymes R Hul strom W Mar i on c Jenning s and c Whi taker Spectral Solar Radiat ion Data Bas e at SERI Solar Vol 42 No 1 1 989 PP bull 6 7-79
Riordan C J T L Stoffe l and R L Hul s trom The Effect s of Urban Air Pollut ion on Solar Radiat i on SERI-TR-2 15-3482 Golden CO Solar Energy Res arch I n s t i tute ( draft ) 1989
Riordan c and R Hul s t rom The SERI Re s ource As ses sment Project s Plan for Col l ect ing Spectral-Solar-I rradiance Data SERI -TR-21 5-2948 Gol den CO Solar Energy Re search Ins t i tut e 1986
Shaw G E Sun Pho tometry Bul letin Ameri can Vol 64 No 1 January 1983 pp 4-10
Iqbal M bull An Int roduction to Solar Radiation New York Academic Pre s s
1983
Bartel s R A Comment s on Prec ipi table Water Mea surement s with Sun Photometer s Journal of Cl imate and Vol 25 1 986 PP bull 1 788- 1 789
Leckner B The Spectral Distribution o f Solar Radiat ion at the Earth s Surface -- El ements of a Model Solar Vol 20 1 9 7 8 pp 143- 1 5 0
Cannon T W Spectral So lar Irradiance Instrumentat i on and Measurement Techniques Solar Cel l s Vol 1 8 1986 pp 2 3 3-24 1
48
Energy
Photogrammetric Engineering
TR 3 5 13A
1 5 Myers D R E s t imate s of Uncertainty for Measured Spec tra in the SERI Spectral Solar Radiat i on Data Base ac cepted by Solar 1 98 9
1 6 Myers D R E s t imates of Uncertainty for Measured Spectra in the SERI Spec tral Solar Radiat i on Data aa s e 11 SERI e_clmical Report Golden CO S o l ar Energy Res earch Ins t i tute ( draft ) 1989
middot
1 7 Hul s trom R L The Cl oud Bright Spo t 1 9 73 PP bull 3 7 0-3 7 6
18 Ri ordan c D Myer s and R Hul s t rom Spectral Scflar Raltfiation Data Base Documentat i on and User 1 s Manual Vo lume I I SERI-TR-2 15-3 5 1 3 Golden CO Solar Energy Re search Ins t i tut e 1989
49
TR- 3 5 1 3A
APPENDIX
QUALITY-CONTROL PROCESSING
Limi ted qua l i ty-control proces s ing wa s appl i ed to the data ba se as de s c r i bed below The resul t s are i n the QC f i l es on the data-base t ape by s i t e year and mont h For examp l e
FLA8705 QC i s FSEC 1 98 7 May PGE8 80 l QC i s PGampE 1 9 8 8 January SER8 7 l l QC i s SERI 1 98 7 November
These f i l e s correspond t o the 11 OAT f i les for the s ame s i t e year and month Each data segment that includes a spectrum wa s proces sed through thi s quali ty-control procedure I f the atmospheric cond i t i on s were uns tab l e and a spectrum was not acquired the broadband and meteorologi cal data were inc l uded on the data-base tape but no qua l i ty-contro l proc e s s ing wa s app l i ed
An example o f a segment of a 11 QC f i l e i s shown in F i gure 6-3 The f i r s t Q l ine beg ins wi th a fol l owed by the s i t e year day and t ime s tamp The
last columns give the number of l ines in the s egment so the user can skip to the next s egment Fo l l owing the f i r s t l ine are me s sages that were printed whenever the qua l i ty-control proce s s ing f lagged a suspect or poor value
Following the mes sages in an SO-character QC l ine l i s t ing the variables that were examined are one of three qua l i ty-control code s 1 good 2 marg inal or suspect and 3 mi s s ing or poor The QC l ine was prepared using an automa t i c ( computeri zed ) check of the variabl e s and manual edi t ing to include informashyt ion from correspondence l og sheet s and vi sual inspe ct i on Addi t i onal me sshysages were added above the QC l ine if appropriate
The two-charact er descriptors in the QC l ine are
DN Direct-normal ( thermopi l e ) solar radiat ion before the spectral s can DN Direct-normal ( thermopi l e ) so lar radiation after the spectra l scan SN Direct-normal ( s i l i c on ) before SN Direct-normal ( s i l i c on ) after GN Globa l-normal before GN Globa l-normal after GH Globa l -horizontal ( thermop i l e ) before
WS Wind Speed KT KKN K
t n
GH Global-hori zontal thermopil e ) after SH Global-hori zontal ( s i l i con ) before SH Global-hori zontal ( s i l icon ) after GT Global-t i l t before GT Gl obal- t i l t after AL Al bedo ( Wm ) AP Albedo ( ) PR Surface Pres sure TC Temperature ( deg C ) RH Relat ive Humi dity WV Water Vapor ( al culated from rel a t i ve humidity)
5 0
S- flllit = - ( middotmiddot middot
( e g Wm2 )
TR-3 5 1 3A
DG D GH SP F i r s t Sp qtrum I T Integral of t he F i r s t Spec t rum SP Second Spectrum IT I nt egral of the - Second SpecttUI11
The aut oma t i c tes t s that were performed to det ermine the QC code fol l owing each var iable were
( a ) Check for mi s s ing or negat ive values for the broadband solar radiashyt i on meteoro l og i cal or a tmo spheric dat a or the spec t ral integral s
lt 0 = Code 2 Mi s s ing ( - 9 or -9 9 ) = Code 3
( b ) Check for atmo spheric or broadband instrument instab i l i ty us ing the difference and rat i o o f the before- and aft er-scan values and redundant mea surement s if nei t her values are negat i ve or mi s s ing
DN before DN after if the abs lute d i fference SN before SN after i s gt10 Wm DN beforeSN before 5 of 200 DN before SN after and GH before GH after SH beforeSH after the rat io i s lt0 95 or gt1 05 each of the GH before SH before two var iables = GH afterSH after or middot GN beforeGN after the rat i o i s lt0 90 or gt1 10 each of the GT beforeGT after two var iable s = Code 3
Code 2
( c ) Check for DN gt GN or GN gt ETR ( extraterre s trial solar radiat i on ) us 1ng rat ios of the var iabl e s
DN before GN before gt0 95 each variable = Code 2 DN afterGN after gt 1 0 each var i able = Code 3 GN before ETR GN afterETR
( d ) Check for values o f Kt Kn and DGH tha t are too high
KT ( invo lves GH before and after and KT ) KN ( involves DN before and after and KN ) DG ( invo lves DN and GH before and after and DG )
gt0 9 5 each variable = Code 2 gt 1 0 each var iable = Code 3
( e ) Check the s pe c t ral integral s for unusual rat i o s to the corresponding broadband so lar radiat ion value
IT ( Broadband va lue before and after )
For d i rect s pe c t ra lt 0 6 or gt0 8 5 I T = Code 2 For gl obal s pe c t ra lt0 7 o r gt0 95 I T = Code 2
For d i rect and g l obal s pec t ra lt0 5 or gt l O IT = Code 3
5 1
TR-35 13A
We sugge s t that users of the data ba s e develop a computer program to acc e s s fields i n the Q C l ine and t o print the me s sages Thi s l imi ted qua l i ty cont rol wi l l not f lag a l l po s s ible errors and addi t i onal t e s t s should be applied depend ing on the users requi rement s and appl icat i on s
52
1 1 2
Document Control SEAl Report No
Page 4 Title and Subtitle
NTIS Accession No 3 Recipients Accession No SERI TR- 2 1 5-35 13A DE89009447
5 Publication Date
January 1990 Sp ectral Solar Radiation Data Base Documentation
6Vo lume I
7 Author(s) 8 Performing Organization Rept No
9 Performing Organization Name and Address 10 ProjectTaskWork Unit No
1 1 Contract (C) or Grant (G) No
(C)
(G)
1 2 Sponsoring Organization Name and Address 13 Type of Report amp Period Covered
Solar Energy Res ear ch Ins titute Technical Repor t 1 6 1 7 Col e Boulevard Golden Colorado 804 0 1-3393 1 4
1 5 Supplementary Notes
16 Abstract (Limit 200 words) The Solar Energy Research Ins titute ( SERI) Electric Power Research Ins titute Flor ida Solar Energy Center and Pacific Gas and Electric Company cooperated to produce a spec tral solar radiation data base representing a range of atmospheric conditions These data will help to characterize the natural variab ility in the spectral (color) content o f outdoor solar radiation so that the sensitivity of spec trally selective solar devices ( such as photovoltaics ) to these variations c n b e s tudied quant itatively Volume I o f this report documents the history approach content and format of the data base Volume II contains graphs and field no tes for each of the spectral data sets The data res ide on magnetic tape at SERI
1 7 Document Analysis
a Descriptors Spec tral solar radiation broadband solar radiation met eorological
data sp ectroradiometers
b IdentifiersOpen-Ended Terms
c UC Categories
233 234
18 Availabil ity Statement
National Technical Information U S Depar tment of Commerce 5 285 Port Royal Road Springfield Virginia 2 2 1 6 1
Service 19 No of Pages
60
20 Price
A04
Form No 0069 (6-30-87)
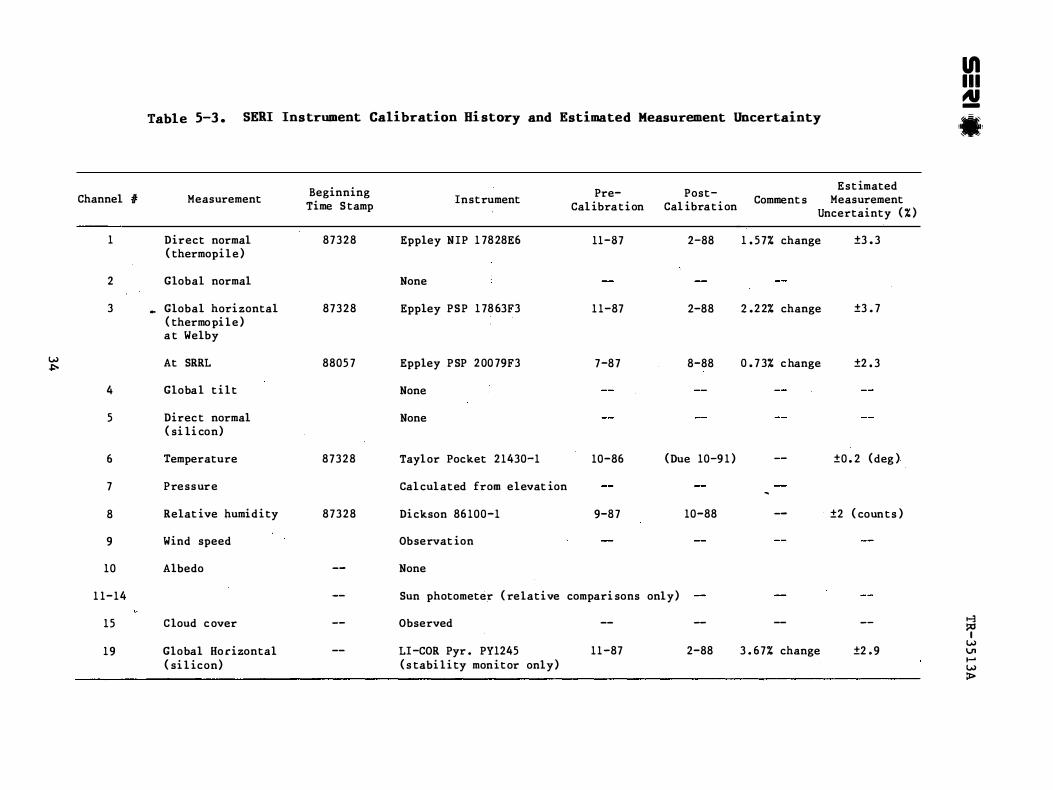
-- --
--
-- --
1ftIll -
Table 5-3 SERI Instrument Calibration Hi story and Estimated Measurement Uncertainty =
Estimated Beginning Pre- Post-Channel I Measurement Instrument Comment s Measurement Time S tamp Cal ibration Cal ibration Uncertainty ( )
1 Direct normal 87328 Eppley NIP 1 7828E6 11-87 2-88 1 5 7 change plusmn3 3 ( thermopil e )
2 Global normal None
3 bull Global horizontal 87328 Eppley PSP 1 78 63F3 1 1-87 2-88 2 22 change plusmn3 7 ( thermo pi l e ) a t Welby
w+- At SRRL 8805 7 Eppley PSP 200 79F3 7-87 8-88 0 7 3 change plusmn2 3
4 Global t i l t None
5 Direct normal None ( si li con)
6 Temperature 87328 Taylor Pocket 21430-1 10-86 (Due 10-9 1 )
7 Pressure Cal culated from elevat ion
plusmn0 2 (deg )
8 Relat ive humidity 87328 Dickson 86 100-1 9-87 10-88 -- plusmn2 ( counts )
9 Wind speed Observat ion
10 Albedo -- None
1 1-14 -- Sun photometer ( relative compari sons only)
15 Cloud c over Observed o-3-- lXlIw Global Ho rizontal -- LI-COR Pyr PY1245 11-87 2-88 3 67 change plusmn2 9 V119 ( si l icon) ( s tabi l i ty monitor only) wgt
TR-35 13A
We urge users of the data ba se to refer to the dai l y f i eld no tes for s pe c i a l c i rcumstances recorded b y the operator that may affect data uncertainty The s e no tes include references to the spectroradiometer t emperature c onshyt ro l l e r solar-tracking accuracy and weather cond i t i ons ( such as rain ) Included in the dai l y notes on tbe data-base tape are obs ervat i ons made in qual i t y-control processing as wel l as references to the exi s t ence and qual i t y o f pho t ographs or s l ides
Quant i tat ive pos t-proces s ing qual i ty-control informat i on i s al s o inc luded on t he data-bas e tape and a complete descript ion is given in the appendix o f thi s report Redundant measurement s ( such as before- smiddotcan andmiddot middot aft et-smiddotcan
broadband solar radiat i on direct-norma l and global-hor izont al mea surement s with both thermopile and s i l i con detectors ) and compar i s ons o f integrat ed s pectral so lar radiat ion wi th broadband s o lar radiat i on were used in the qual i ty-control procedure s Users are encouraged to perform the i r own qual i t y-cont rol proce s s ing on the data t o meet their par t i cular requiremen t s
3 5
6 0 FORMAT OF THE DATA TAPE
The meas ured dat a f i eld notes quali ty-control informa t i on and mea surement uncertainty are s t ored on magne t i c tape in 80-character l ines wi th the fi leshyname s given in Table 6- 1 The f i l enaming convent ion used for the mea sured data was
Filename Content
FLA8705 DAT FSEC data 1987 May PGE880 l DAT PGampE data 1988 January SER8 7 1 1 DAT SERI data 1987 November
Data were not acqui red in a l l months so the months may not be cont iguous
Qua l i t y-control informa t i on has the same f i l enaming conven t i on with QC extens ion ( for example FLA8 705 QC ) Dai ly notes are contained in the f i l e s FSEC NOTES PGE NOTES and SERI NOTES respec t i vely The mea surement uncershytainty is in the UNCERT f i l e s
c The DAT f i l e s contain two types of informa t i on D for data and for inst rument configurat ion The f i r s t l ine of a data or confi guration segment beg ins wi th a D or a c re spect ively in the f i r s t column followed by the s i t e year day and t ime stamp the number of l ines in the segment i s in column-s 76-80 so that the user can eas i ly skip the de s i red number of l ine s An example of the information in the conf iguration or 1 1C segment i s
c shown in Figure 6-1 I t begins wi th a followed b y the s i t e FSEC year 11 1 98 7 day 122 and t i me u0830 latitude longi tude and eleva t i on There are 19 channel s for mea surement s zero s pectra in the C segment and 40 l ine s in the segment The con f i gurat ion informa t i on appear s whenever the inst rument set-up or cal ibrat ion wa s changed or t he data acqui s i t ion sys t em wa s res tarted I f the configurat i on wa s not changed at the beginning of the month the configura t i on segment wi l l be in the previous mont h s DAT f i l e
An examp le of a D segment i s shown in Figure 6-2 Thi s segment contains the mea s ured me teoro logical dat a broadband and spectral solar rad i a t i on dat a and anc i l l ary data The data contained in each l ine and column and i t s format are as follows
POS ITION OF VARIABLES IN THE D SEGMENTS (ALL LINES ARE 80 CHARACTERS )
Line Column Cont ent s Format
a = character 1 = integer f = f l oat ing point
LINE 1 1 1 D ( for data ) ( a l ) 3 1 5 Site Year Day Number Time Stamp ( a 1 3 )
3 6 F SEC PGampE o r SERI ( a4 ) 7 8 Year (a2 or i 2 ) 9 1 1 Day Number ( a3 o r i 3 ) 1 2 15 Standard Time ( a4 o r i4 )
36
5-111 - il ll
Da i ly
Uncertainty
-
TR-35 13A -
Table 6 1 Namesmiddot of Files on the Data Tape
Measured and
FSEC
FLA8610 DAT FLA8 6 1 0 QC
FLAB 6 1 1 bull DAT FLA8 6 l l QC
FLA86 1 2 DAT FLA8 6 1 2 QC
FLA8 7 0 1 DAT FLA8 70 l QC
FLA8 704 DAT FLA8 704 QC
FLA8 705 DAT FLA8 7 05 QC
PGampE
PGE8 704 DAT PGE8 704 QC
PGE8 705 DAT PGE8 705 QC
PGE8 706 DAT PGE8 7 06 QC
PGE8 7 0 7- DAT PGE8 7 0 7 QC
SERI
SER87 l l DAT SER8 7 l l QC
S ER8 7 1 2 DAT SER8 7 1 2 QC
SER880 1 DAT SER880l QC
SER8802 DAT SER8802 QC
Ca lcui a t ed Data
FLA8 706 DAT FLA8 706 QA
FLA8 7 0 7 DAT FLA8 7 0 7 QC
FLA8 7 0 8 DAT FLA8 7 0 8 QC
FLA8 709 DAT FLA8 7 09 QC
FLA8 7 1 0 DAT FLA8 7 1 0 QC
FLA8 7 l l DAT FLA8 7 l l QC
PGE8 708 DAT middot
PGE8 708 QC
PGE8 7 0 9 DAT PGE8 709 QC
PGE8 7 l l DAT PGE8 7 l l QC
No t e s
FSEC NOTES PGampE NOTES SERI NOTES
Mea s urement
FSEC UNCERT PGamp E UNCERT SERI UNCERT
FLA8 7 1 2 DAT FLA8 7 1 2 QC
FLA880l DAT FLA880l QC
FLA8 802 DAT FLA8802 QC
FLA8803 DAT FLA8803 QC _
FLA8804 DAT FLA8804 QC
PGE_880l DAT PGE880l QC
PGE8802 DAT PGE8802 QC
PGE8803 DAT PGE8803 QC
3 7 _middot
1 3
1 7
55 1 1-1 TR-3 5 1 3A
0 G) 0 G)G) iC FSEC8 7 1 2 2 0 8 1 3 2 8 4 0 0 0N 80 6 0 0 0W 2M C = 8 7 1 2 2 0 8 1 3 8 7 1 2 2 0 8 1 3+0 0 0 0 0 0 1 9 0 4 0
CHN PARAMETER +- - - - - - - INSTRUMENT- - - - - - - - - -+ +- -CALIBRATION- + OUTPUT FOOT NO TYPE MAKER TYPE SERIAL FACTOR DATE UNITS NOTES
1 Di r- Nor-m Eppley NIP 2 3 9 4 3E6 6 08 1 2 - 186 Wm2 2 Glo Nor-m Eppley PSP 2 4 1 85F3 8 85 l l - 186 Wm2 3 G l o Hor-z Eppl ey PSP l 4 3 2 2F3 6 3 8 1 2 - 2 86 Wm 2 4 Glo Tilt Eppley PSP 2 4 1 83F3 8 9 9 l l - 186 Wm2 iacute5 Dir- N S i MATRIX SI NIP 3826 31 8 0 9 - 186 Wm2 6 Amb Temp WTHRMEAS PRT 1 7 7 l 0 0 3 - 1 8 7 Deq c 7 Sur-f Pr-es WTHRMEAS PIEZO 1 7 8 l 0 0 5 - 1 8 7 Mi l l ibar-8 Re1 Hum WTHRMEAS LiCl 1 7 5 l 0 0 6 - 1 86 Per-cent 9 Wind Spd WTHRMEAS OPT CHOP 1 2 1 9 l 0 0 3 - 1 8 7 Met e r- s i S
1 0 Albedo Epp ley PSP l 6 2 9 7F3 1 0 0 9 l l - 1 8 6 Per-cent l l hot 380 Unused Unused Unused - 9 9 0 0 - 1 - l - 1 Counts iacute1 2 hot 5 0 0 Unused Unused Unused - 9 9 0 0 - 1 - l - l Count s
14 hot 860 Unused Unused Unused - 9 9 0 0 - 1 - 1 - 1 Counts hot 942 Unused Unused Unused - 9 9 0 0 - 1 - l - l Counts
1 5 Opq C loud Unused Unused Unused - 9 9 0 0 - 1 - l - l Tenths 1 6 H2 0 NWS Unused Unused Unused - 9 9 0 0 - 1 - l - l em
Spect l LI -COR L I - 1 8 0 0 PRS - 1 7 2 l 0 0 2 - 1 8 7 W sq m nm l Spect 2 L I - COR L I - 1 800 PRS - 1 0 2 1 0 0 2 - 1 8 71 8 W sq m nm l
1 9 Glo H Si LI -COR L I - 2 0 0S PY2 276 8 4 5 7 - 1 86 Wm2 2 - 1 FIN
FOOTNOTES
1 - 1 7 = DN 18 = GT 2 - SERI l oan un i t
- 1 - FIN
Figure 6-1 Example of the instrument configuration data on the data base tape The numbers refer tmiddotO
1 c indicating configuration 2 FSEC 1987 Day 122 at 8 13 standard time 3 Latitude 4 Longitude 5 Ele vation 6 Reference to configuration file that will be f ound in the
data files 7 Starting data-acquisition time plus number of attempts to
acquire spectra (which would extend the data acquisition time)
8 Number of data channels 9 Number of spectra ( 0 f or configuration files 1 or 2 f or
data files) 10 Number of lines in this segment
38
TR35 1 3A
D FSEC8 7 1 2 2 0 8 1 3 2 8 4 0 0 0N 8 0 6 00 0W 2M C=871 2 2 0 8 1 3 8 7 1 220 814+0 0 0 1 0 0 1 9 2 1 0 0 gS e e Q N FSEC8 7 1 2 2 U PRS - 1 7 2 Col 2 ( + - ) U PRS - 1 0 2 Col 2 ( - ) Col 4 ( + ) 1 7 84 5 5 7 54 5 2 9 3 0 2 - 1 - 9 9 0 3 48 0 1 1 9 48 3 3 4 4 2 7 9 - 1 -9 9 0 1 7 85 0 5 7 5 5 7 2 9 3 0 4 - 1 - 9 9 0 3 4 8 1 1 1 9 4 85 3 4 43 0 1 - 1 - 9 9 0 2 8 4 1 80 0
1 0 9 5 4 1 5 - 99 0 7 1 0 1 7 8 6 2 0 7 8 7 5 8 9 1 5 - 1 - 9 9 0 - 1 - 9 9 0 iacute1 1 3 80 0 - 99 0 Co 1 2 5 0 0 0 - 99 0 Co 1 3 860 0 - 99 0 Co 1 4 942 0 - 9 9 0 Co iacute
- 1 6 0 7 1 5 8 5 7 8 5 6 7 1 58 3 86 9 1 9 9 1 8 7 - 9 0 0 - 9 0 0 - 9 0 0 - 9 0 0 - 9 0 - 9 0 3 1 1 7 4 0 1 3 0 0 1 1 0 0 2 0 57 9 8 9 4 0 0 DNT1 8 4 0 1 3 0 0 1 1 0 0 2 0 2 8 4 1 8 0 0 6 2 4 GTS - 1 0 0 0 0 0 0 0 0 0 0 0 - 1 0 0 0 o o 0 0 0 0 o o
1 3 0 0 0 0 0 0 0 0 3 5 0 0 0 4 0 0 2 1 0 02 5 0 0 14 0 04 1 0 02 1 0 0 5 7 0 0 3 8 amp 1 3 2 0 0 0 7 2 0 056 0 1 0 1 0 0 8 1 0 1 1 8 0 1 2 1 0 1 1 9 0 140 0 138 0 1 3 1 amp 1 340 0 1 4 9 0 16 1 0 162 0 1 5 5 0 16 0 0 1 6 3 0 1 8 5 0 1 9 5 0 1 9 8 0 1 9 9 amp 1 360 0 2 0 9 0 2 1 9 0 228 0 2 4 3 0 258 0 26 5 0 258 0 265 0 268 0 2 89 amp 1 380 0 2 8 0 0 2 7 9 0 26 7 0 2 7 3 0 3 0 1 0 3 08 0 3 1 7 0 326 0 349 0 4 0 2 amp 1 4 0 0 0 4 7 6 0 52 7 0 55 7 0 569 0 580 0 5 9 5 0 6 12 0 63 0 0 64 1 0 648 amp 1 4 2 0 0 652 0 6 54 0 6 58 0 649 0 6 36 0 6 3 2 0 646 0 67 8 0 7 1 8 0 746 amp 1 440 0 7 6 8 0 7 9 9 0 82 2 0 854 0 8 7 7 0 9 0 4 0 9 1 5 0 92 2 0 934 0 94 2 amp 1 460 0 9 6 0 0 964 0 9 7 0 0 9 7 3 0 96 9 0 9 74 0 9 9 0 0 9 9 9 1 0 1 7 1 028 amp 1 4 8 0 1 0 3 3 1 0 25 1 0 0 6 0 9 9 1 0 9 9 0 1 0 1 0 1 026 1 0 3 8 1 043 1 0 4 7 amp 1 500 1 0 3 8 1 034 1 038 1 0 5 1 1 0 58 1 058 1 0 5 1 1 0 3 5 1 0 1 7 1 0 0 7 amp 1 520 1 0 2 0 1 04 1 1 0 5 7 1 063 1 068 1 0 8 1 1 088 1 0 9 3 1 0 9 3 1 0 9 1 amp 1 540 1 0 8 9 1 0 84 1 088 1 0 9 5 1 0 9 7 1 0 9 5 1 0 9 8 1 1 0 2 1 094 1 0 8 7 amp 1 560 1 0 7 8 1 0 7 9 1 08 1 1 0 7 7 1 0 7 2 1 0 7 1 1 0 7 6 1 0 7 8 1 0 7 8 1 0 82 amp 1 580 1 0 9 0 1 0 9 8 1 1 0 1 1 088 1 0 7 4 1 062 1 06 1 1 06 7 1 0 7 4 1 0 80 amp 1 6 0 0 1 082 1 085 1 08 8 1 0 9 2 1 0 9 3 1 0 89 1 083 1 0 7 8 1 0 78 1 0 7 9 amp 1 620 1 0 8 2 1 083 1 0 7 6 1 065 1 0 5 9 1 056 1 06 1 1 0 7 3 1 0 8 0 1 085 amp 1 640 1 0 86 1 084 1 08 1 1 0 7 6 1 067 1 062 1 0 5 2 1 04 2 1 038 1 048 amp 1 660 1 0 7 0 1 086 1 0 9 4 1 0 9 7 1 0 96 1 096 1 09 2 1 0 9 3 1 0 9 1 1 0 89 amp 1 680 1 0 7 9 1 064 1 02 8 0 9 8 0 0 94 3 0 9 3 7 0 954 0 98 0 0 9 9 6 1 0 0 5 amp 1 7 0 0 1 0 0 8 1 0 0 9 1 0 1 3 1 0 1 9 1 0 2 5 1 0 2 2 1 0 0 3 0 9 7 3 0 924 0 8 74 amp 1 7 2 0 0 846 0 842 0 84 8 0 84 9 0 8 54 0 8 7 8 0 9 0 3 0 9 3 1 0 9 52 0 965 amp 1 740 0 9 6 9 0 9 7 7 0 98 3 0 989 0 988 0 9 8 2 0 9 7 6 0 95 0 0 8 81 0 7 6 7 amp 1 760 0 6 1 6 0 5 24 0 54 0 0 646 0 7 7 9 0 8 76 0 924 0 94 5 0 94 7 0 9 45 amp 1 7 8 0 0 94 2 0 94 2 0 9 3 7 0 9 2 6 0 9 1 6 0 9 0 7 0 89 9 0 894 0 8 9 1 0 89 0 amp 1 800 0 888 0 883 0 8 7 9 0 87 5 0 863 0 836 0 8 0 1 0 7 5 7 0 7 2 2 0 7 1 0 amp 1 820 0 7 1 0 0 7 1 9 0 7 3 3 0 74 1 0 7 4 9 0 7 5 7 0 76 3 0 7 7 7 0 7 9 7 0 8 1 0 amp 1 840 0 82 0 0 82 8 0 82 7 0 82 2 0 8 1 5 0 7 9 7 0 786 0 7 83 0 7 8 8 0 7 9 7 amp 1 860 0 80 4 0 8 0 0 0 7 8 8 0 7 8 0 0 7 7 5 0 7 8 0 0 7 8 7 0 786 0 785 0 7 81 amp 1 880 0 7 7 5 0 7 7 4 0 7 7 2 0 767 0 763 0 7 4 7 0 72 1 0 68 2 0 6 30 0 5 88 amp 1 9 0 0 0 57 1 0 5 7 3 0 58 9 0 584 0 568 0 549 0 53 4 0 53 3 0 5 38 0 5 56 amp 1 9 2 0 0 5 7 3 0 57 9 0 56 7 0 526 0 448 0 362 0 2 7 2 0 2 18 0 2 1 0 0 2 32 amp 1 940 0 254 0 262 0 2 5 7 0 253 0 25 7 0 266 0 2 7 5 0 2 85 0 29 9 0 3 1 7 amp 1 960 0 3 33 0 362 0 3 9 6 0 4 3 5 0 4 7 9 0 5 06 0 5 1 5 0 5 1 2 0 5 08 0 5 2 1 amp 1 9 8 0 0 53 7 0 560 0 5 84 0 5 9 7 0 6 0 9 0 6 1 7 0 6 1 8 0 6 2 3 0 62 1 0 6 1 9 amp 1 1 0 0 0 0 6 1 8 0 6 0 7 0 6 0 5 0 6 0 2 0 60 1 0 60 5 0 6 04 0 604 0 604 0 6 0 1 amp 1 1 0 2 0 0 60 1 0 59 5 0 5 9 5 0 5 93 0 589 0 59 0 0 584 0 5 82 0 580 0 5 75 amp 1 1 0 4 0 0 5 7 6 0 5 7 1 0 57 1 0 56 7 0 56 0 0 56 0 0 558 0 552 0 545 0 54 0 amp 1 1 0 6 0 0 5 36 0 53 2 0 5 2 9 0 5 2 5 0 5 1 9 0 5 1 5 0 5 1 2 0 51 1 0 50 9 0 5 08 amp 1 1 0 8 0 0 50 6 0 502 0 4 9 2 0 48 3 0 48 3 0 483 0 46 9 middot 0 4 5 2 0 447 0 3 1 amp 1 1 1 0 0 0 4 1 1 - 9 9 0 0 0 - 9 9 0 0 0 - 9 9 0 0 0 - 9 9 0 0 0 - 9 9 0 0 0 - 9 9 0 0 0 - 9 9 00 0 - 1 582 3 2 2 3 0 0 0 0 0 6 0 0 0 1 0 0 0 4 0 0 1 3 0 0 1 9 0 0 2 3 0 04 1 0 0 5 5 0 064 0 088 amp 2 3 2 0 0 1 0 5 0 1 3 9 0 1 7 9 0 1 8 9 0 2 2 4 0 2 38 0 26 2 0 252 0 261 0 2 64 amp 2 340 0 2 8 7 0 2 9 2 0 266 0 2 88 0 2 98 0 286 0 3 0 0 0 3 0 0 0 2 9 1 0 2 85 amp 2 360 0 296 0 3 1 0 0 3 36 0 367 0 3 9 0 0 3 7 2 0 3 56 0 356 0 3 7 3 0 3 88 amp
Figur e 6-2 Examples of the data on the data-base tape
3 9
TR-3 5 1 3A
16 2 3 24 24 2S 3 3 34 34 3S 3 9 40 40 4 1 S 2 S4 69
54 62
6 3 6 3
6 7 6 7
7 0 7 3
74 7 S
7 6 80
LINE 2
LINE 3
1 3 4 10
1 1 1 3 14 20 2 1 23 24 30 3 1 40 4 1 43 44 SO 5 1 5 3 54 60
Lat i tude ( deg ) N ( north) Longi t ude ( deg ) W ( we s t ) `Elevat i on (m) M (m) Reference t o Conf i guration Segment Start ing year day t ime for the spectral `scan s ) i f any and number of attempt s t o `acquire the s can ( which ind i cates po s s ible `t ime delay from the s tart ing t ime ) middot
Year Day Number Time
11+11 for plus number of attempt s to acquire a s pect rum
Number o f attempt s t o acquire a s pectrum
Po s s ible Number o f Measurement s ( 1 9 )
Number o f Spec tra i n thi s Segment ( 0 1 or 2 )
Number o f Lines in Segment
Pointer to the qua l i ty-cont rol dai ly f i e ld note s and measurement uncertainty informa t ion Qua l i ty-control informa t i on is in the QC f i l e of the same month wi th the same s i t e year day and t ime s t amp Dai l y field notes are i n the NOTES f i l e f o r the same s i t e wi th the same s i t e year and day s tamp Mea surement uncertainty i s in the f i l e s UNCERT under t h e instrument serial number ident i f i ed by PRS-xxx and the column s in the uncertainty f i le s for + and - uncertainty l imi t s
Broadband mea surement s before the spectral scan
Channel fH Direct Normal ( thermopi l e ) (Wm2 ) Channel ffoS Direct Normal ( s i l i con) (Wm2 ) Channel tn Global Normal ( Wm2 ) Channel not used Charinel ffo3 Globa l Hori zontal ( thermop i l e ) ( Wm2 ) Channel fH 9 Gl obal Horizontal ( s i l icon ) ( Wm2 )
( f 8 4 ) ( a 1 ) ( f 9 4 ) ( a l ) ( i S ) ( a l ) ( a l 2 )
( a9 o r i 9 )
( a 1 )
( i 1 )
( i4 )
( i 2 )
( i S )
( a8 0 )
( i 3 ) ( pound 7 2 ) ( i 3 ) ( pound 7 2 ) ( i 3 ) ( f 7 2 )
( i 3 ) ( pound 7 2 ) ( i 3 ) ( pound 7 2 )
40
TR-35 3A
6 1 6 3 64 7 0 7 1 80
LINE 4
LINE 5
1 6
7 1 2
1 3 80
LINE 6
1 3 4 1 0
1 1 1 3 1 4 20 2 1 23 24 3 0
3 1 3 3 34 40 4 1 43 44 5 0 5 1 5 3 5 4 6 0 6 1 6 3 64 7 0 7 1 7 3 7 4 8 0
LINE 7
LINE 8
1 5
6 1 2
Channe l 114 Gl obal Ti l t (Wm2 ) hellipChannel not used
Broad band mea suremen t s a f t e r t h e s p e c t ral s can same format a s beforeshy scan ( LINE 3 )
T i l t o f the f ixed- t i l t i n s t rument s hellipf rom the hor i z ont a l ( d eg )
Az i muth of the f i xed-t i l t ins t rumen t s ( de g ) ( 1 8 0 deg = s outh)
De s c r i p t i on o f any s pec i al i n s t rument ( fo r example d i ffu s e-hori zont a l mea s uremen t s a t SERI )
Channe l IFlOAl bedo (Wm2 ) hellipChannel IH5C l oud Cover ( t enths ) Channel fF7 Surface Pres sure ( mb ) Mea s ured at FSEC and PGampE c a l c u l ated from e l eva t i on a t S ERI [ 1 1 p 1 0 0 ]
Channel 116 Amb i en t Temperature ( deg C ) Channel fiB Rel a t i ve Humi d i t y ( ) Channe l ffo9 Wind S peed ( m s ) Add i t i onal channe l des cri bed 1n l i ne 5 Va l ue Add i t i onal channel descri bed 1n l ine 5 Va l u e
Sun Pho t ometer read ings ( only recorded for SERI dat a not u s ed except for re l a t i ve c ompar i s on s ) hellip
Earth-S un d i s tance c orrec t i on ( d e v i a t i on from 1 0 ) hellip
Ext ra t erre s t r i a l Rad i a t i on (Wm2 ) hellip
( i 3 ) ( pound 7 2 )
( f 6 1 )
( f 6 1 )
( a 8 8 )
( i 3 ) ( 7 1 ) ( i 3 ) ( 7 1 ) ( i 3 ) ( f 7 1 )
( i 3 ) ( pound 7 1 ) ( i 3 ) ( pound 7 1 ) ( i 3 ) ( pound 7 1 ) ( i 3 ) ( variabl e ) ( i 3 ) ( variabl e )
( f5 2 )
( f 7 1 )
4 1
9
42
TR-3S l 3A
1 3 1 8
1 9 24
25 30
3 1 36
3742
43 48
49 68
69 72
13 76
1780
LINE
I
3 6
7 1 1 1216 1 7 20 21 25
2631
3236
3839
40 40
41 42
43 46
Zen i t h Angl e ( deg ) ( f6 2 )
Kt ( ra t i o calculated from ( f6 1 ) thermo p i l e inst rument s )
Kn ( rat i o calculated from ( f6 1 ) thermo p i l e instrument s )
D GH ( ra t i o cal culated from thermopile instrument s ) ( f6 1 )
Albedo ( ) ( f6 1 )
Ai r Mas s ( f6 2 )
Res erved for Turbidi ty i f calculated
Precipi table Water Vapor i f calculated from sun photomet er
Precipi table Water Vapor from the ( f4 1 ) Nat ional Weather Servi ce
Prec i p i table Water Vapor Cal culated from Relative Humid i t y ( f4 1 )
Channel H7 Number o f Wave l engths Recorded by Spect roradi ometer 1
Beginning Wavelength ( nm ) Ending Wavel ength (nm) Wavelength Step Size (nm ) Spectroradi ometer 1 Ti l t from the Horizontal ( deg )
Spectroradiometer 1 Azimuth ( deg )
Angle o f Incidence o f the Direct Beam on Spectroradi ometer 1 ( deg )
Measurement Type ( DN GN GH GT DF )
Attachment ( Tef lon Dome D Integrat ing Sphere S View- l imit ing Tube T )
Channel H8 Number o f Wavel engths Recorded by Spectroradi ometer 2
( i2 )
( i4 )
( i S ) ( i S ) ( f4 1 )
( fS l )
( f6 1 )
( fS 1 )
( a2 )
( a l )
( i 2 )
(i4)
TR-3S l3A
4 7 S l Beginning Wavel ength (nm ) ( i S )
S 2 S 6` Ending Wavel ength ( nm ) ( i S )
S 7 60 Wavelength Step S i z e ( nm ) ( f4 bull 1 )
6 1 6S Spec troradi ometer 1 T i l t from the Hori zontal ( deg ) ( fS l )
6 6 7 1 ` Spect roradi ometer 2 Az imuth ( deg ) ( f6 1 )
7 2 76` Angle of Incidence o f the Direct Beam on Spect rorad i ometer 2 ( deg ) ( fS l )
7 8 7 9 Mea surement Type ( DN GN GH GT DF ) ( a2 )
8 0 80 At tachment ( Teflon Dome D Integrat ing Sphere s View-l imi t ing Tube T ) ( al )
LINE 10 Saved f o r extra spectroradi ometers i f needed
I f no spec tral data were recorded the number of l ines in the D s egment i s 1 0 the number of spectra i s 0 and there i s no corre sponding qual i ty-control information for thi s dat e t ime in the QC f i l e s No qual i ty c ontrol wa s performed because the atmo sphere was uns table I f the number o f spectra i s 1 there are 60 l ines in the D s egment i f there are two spectra t he number o f l ines i s 100
I f middot the number of spectra i s 1 or 2 the spectral data fol low after the f i r s t 1 0 l i nes o f the D segment There are 1 0 spectral measurement s per l ine wi th the number in the lef t-mo s t column indicat ing the f i r s t or second specshyt roradiometer ( 1 or 2 ) f o l l owed by the s tart ing wavelength ( in nanometers ) and t he 10 spectral mea surements ( in Wm2-nm) The 1 0 measurement s are at wave l ength inc rements of 2 nm There are 401 spect ral mea surement s from 300 t o 1 1 0 0 nm in 2-nm s teps with 10 measurement s per line for 40 l ine s and one measurement in the 4 1 s t l ine The l a s t number in the 4 1 s t l ine i s the specshytral integral I f a second s pectrorad i ometer wa s used the next 4 1 l ines folshylow t he same format Blank 1 ines follow the spec tral data t o f i l l the D segment to 60 or 100 l ines
An example of a QC f i l e i s shown in Figure 6-3 The f i r s t l ine o f each segment begins with a Q f o l l owed by the s i t e year day number and t ime s tamp with the number of l ines in the segment given in the l a s t col umn s o f the l ine Following the iden t i fier are me s sage s about var iables that were flagged by the automat i c qua l i ty-control proc e s s ing ( s ee appendi x ) noted by an operator at the measurement s i t e or noted dur ing inspec t i on at SERI The l a s t l ine of the segment shows the QC code for as DN ( direct normal thermopile detect o r ) SN ( d i rect normal detector ) AL
var iabl e s such s i l i con
( a lbedo ) and SP ( s pectrum) a s de s c r i bed in the appendi x Three qual i tyshycontrol code s ar8 used 1 = good 2 = suspec t see me s sages and dai ly not e s and 3 = poor or mi s s ing see me s s ages and da i l y no te s The broadband codes ( DN SN GN GH SH and GT ) have two value s the f i r s t is the before- scan measurement and the second is the after-s can mea surement
4 3
TR-35 13A
Q FSEC87 1 2 1 0 7 3 1 4 Noise in GH spectrum in UV QCDN1DN1SN1SN1GN1GN1GH1GH1SH1SH1GT1GT1AL1AP1PR1TC1RH1WV1WS1KT1KN1DG1SPl iN1SP2IN2
Q FSEC8 7 1 2 1 0 8 3 0 8 SN bef SN af t = 1 0 5 5 S H bef SH aft = 1 0 5 3 2nd Int BB b e f = 0 636 2nd Int BB aft = 0 6 5 1 Noise in GH spectrum i n UV QCDN1DN1SN2SN2GN1GN1GH1GH1SH2SH2GT1GT1AL1AP1PR1TC1RH1WV1WS1KT1KN1DG1SP1 IN1SP2IN2
Q FSEC8 7 1 2 1 1 0 3 1 3 QCDN1DN1SN1SN1GN1GN1GH1GH1SH1SH1GT1GT1AL1AP1PR1TC1RH1WV1WS1KT1KN1DG1SP1 IN1SPl iNl iacute
Q FSEC87 1 2 1 1 1 3 1 3 QCDN1DN1SN1 SN1GN1GN1GH1GH1SH1SH1GT1GT1AL 1AP1PR1TC1RH1WV1WS1KT1KH1DG1SP 1 IN1SP1 IN1
Q FSEC8 7 1 2 1 1 2 3 1 3 QCDN1DN 1SN1SN1GN1GN1GH1GH1SH1SH1GT1GT1AL1AP1PR1TC1RH1WV1WS1KT1KN1DG1 SP1 IN1SP 1 IN1
Q FSEC8 7 1 2 1 1 3 3 1 3 QCDN1DN1SNlSNlGNlGN1GH1GH1SH1SH1GTlGTlALlAPlPRlTClRHlWVlWSlKTlKNlDGlSP l iNlSPliNl
Q FSEC8 7 1 2 1 1 4 3 1 3QCDNlDNlSNlSNlGNlGNlGHlGHlSHlSHlGTlGTlALlAPlPRlTClRHlHVlHSlKTlKNlDGlSPl iN1SP1IN1 Q FSECB7 1 2 1 1 554 3 QCDNlDNlSNlSNlGNlGNlGHlGHlSHlSHlGTlGTlALlAPlPRlTClRHlWV1WSlKT1KN1DG1SP 1 IN1SP l iN1
Q FSEC8 7 1 2 1 16 3 0 3 QCDNlDNlSNlSNlGNlGNlGHlGHlSHlSHlGTlGTlALlAPlPRlTC1RH1WV1WSlKTlKNlDG1SP l iNlSPl iNl
Q FSECB 7 1 2 1 1 7 3 1 5 GH bef SH bef = 0 9 3 1 GH aft SH af t = 0 9 3 3 QCDN1DN1SN1SN1GN1GNlGH2GH2SH2SH2GTlGT1ALlAPlPRlTClRHlWVlWSlKTlKNlDGlSPl iNlSPl iNl
Q FSECB 7 1 2 2 0 7 3 1 3 QCDNlDNlSNlSNlGNlGNlGHlGHlSHlSHlGT1GTlALlAPlPRlTClRHlWVlWS 1KT1KNlDGlSP l iNlSPl iNl
Figure 6-3 Example of quali ty-control inf ormation on the data- base tape
Figure 6-4 shows an exampl e of a segment of the daily notes from the FSEC NOTES f i l e Each segment of the f i l e beg ins wi th an followed b y the s i t e year and day number s t amp with the number of l ines in the segment given in the last columns of the l i ne The next l ine contains the s i te operashytor log sheet number month day year day number spectroradi ometer serial number( s ) and mea surement mode( s ) The PGampE and SERI not e s do not include the dai ly l og sheet number The f i rst two l ines are followed by f i eld no te s No tes that were added after inspec t i on at SERI are s eparat d from the operator notes wi th ------- The exi s tence of s l ides or photographs i s ind i cat ed a s wel l a s their qua l i ty i e good ( G ) marginal ( M ) or poor ( P ) In the exampl e in thi s f i gure there were two log sheets for thi s day (number 1 1 6 and 1 1 7 ) because the mea surement mode changed from gl obal hor i z onshytal ( GH ) to global t i l t ( GT )
44
TR-3513A
N FSEC87 1 2 2 1 1 6 0 5 0 2 8 7 1 2 2 1 7 2 DN 1 0 2 GH Clear at 0 7 3 0 GH f o r f ir s t two s cans then GT S l i de s 0 6 3 2 G
0 7 3 3 G 0 8 3 3 G 0 9 3 3 H ( dark ) 1 0 3 3 p1 1 3 3 p1 2 3 3 p 1 3 3 3 p1433 H 1 5 3 3 G 1633 G 1733 G
1 1 7 0 5 0 2 87 1 2 2 1 7 2 DN 1 0 2 GT GT s tart ing at 0 8 0 0 iacuteC lear a t 0 8 0 0 iacuteS l ides S e e above
16 1 1 8 0 5 0 3 8 7 1 2 3 1 7 2 DN 1 0 2 GT Clear at 0830 S l i de s 0633 G
0733 G 0833 G 0933 H ( dark ) 1 0 3 3 p1 1 3 3 p 1233 p 1333 p1433 H 1533 G 1633 G 1733 G
N FSEC87 1 2 3
Figure 6-4 Examples of daily notes on the data-base tape
An example o f a segment of the measurement uncertainty file UNCERT CAL i s shown in Figure 6-5 The f i r s t l ine begins with a U followed by the serial number of the s pect rorad i ometer The upper and lower measurement uncertainty l imi t s are given in the co lumns fol lowing wavelength wi th the appropri a t e measur ement mode dat es and de script ion at the top o f the column The s econd l ine in each segment o f the DAT f i l e s is a pointer to the correct uncershytainty information in UNCERT CAL The broadband s o lar radiat i on and meteshyorolog ical instrument measurement uncertainty fol lows each spectra l measureshyment uncertainty segment in UNCERT CAL
The format o f thi s data ba se was es tabl i shed at SERI t o accommodat e expanded mul t i year long-term data collect ion Users can reformat the data t o suit their part icular needs We recommend the following s t eps for acce s s ing and document ing parti cular data set s
1 Se lect and extract the des ired spectral data from the DAT f i l e s us i ng in formation such as measurement mode day number t ime air mas s or a moshys pheric condi t ions depending on the de s i red attribut es
2 Ex trac t and review the corres ponding segment s of the qua l i ty-cont rol i n format i on from the QC f i l es
3 Ex trac t and review the corres pond ing field no tes from the NOTES f i l e s
4 5
+ I -
5 4
3 7
TR- 3 5 13A
U PRS - 1 0 2 L I -COR PRS - 1 0 2 i
1 2 3 4 5 Ill
Wav GHS GHS GHS GHS GTS GTS GTS GTS Kt gt 6 0 Kt gt 6 0 Kt gt 60 Kt gt 6 0 iacutel ower lower upper upper 2 8 7 - 8 8 7 -8 8 7 5 8 8 GNS GNS
upper upper lower l ower
+ 1 -
- GHS GHS GTS GTS Kt lt 60 Kt lt 6 0 upper uppe r l ower l ower + I - + I -2 8 7 - 8 8 7 -8 87 5 - 8 8
3 0 0 - 1 0 0 0 - 1 00 0 1 0 0 0 1 0 0 0 3 0 2 - 1 0 0 0 - 1 0 0 0 1 0 0 0 1 0 0 0
4 0 0 - 2 3 3 - 1 7 1 1 5 3 9 1 4 0 2 iacute -2 2 0 - 1 7 3 1 4 0 9 3
5 0 0 - 1 3 4 - 1 1 7 3 7 5 0 2 iacute - 1 3 3 - 1 1 7 5 3 3 7
6 0 0 - 1 1 8 - 1 1 1 3 8 3 1 6 0 2 - 1 1 9 - 1 1 1 3 9 3 1
7 0 0 - 1 1 5 - 1 0 7 3 5 2 7 7 0 2 - 1 1 3 - 1 0 7 3 3 2 7
8 0 0 - 1 1 6 - 1 0 6 3 6 2 6 8 0 2 - 11 7 - 1 0 6 3 7 2 6
9 0 0 - 1 1 2 - 1 0 5 3 2 2 5 9 0 2 - 1 1 4 - 1 0 8 3 4 2 8
1 0 0 0 - 1 1 7 - 1 0 8 2 8 1 0 0 2 - 1 1 8 - 1 0 8 3 8 2 8
1 1 0 0 - 1 2 9 - 12 2 4 9 4 2
Figure 6-5 Examples of spe ctral measurement uncertainty on the data-base tape A value of plusmn100 indi cates greater t han 100 measurement uncertainty
46
TR-35 13A
4 Extract the measurement uncertainty information from the 1 1 UNCERT f i l e s and quot e mea surement uncertainty for a l l data used
5 Examine the dai l y broadband and spec tral solar radiatio data graphs in the catalog ( Volume I I of thi s report [ 1 8 ] i f avai labl e These graphs provide informa t i on on atmo spheric condi t i ons during the day For exampl e Figure 4-3 shows dai l y broadband and spec tral plot s for part ly c loudy condi t i ons when s olar rad i a t i on i s changing rapidly throughout the day The sun i s obs cured when the direc t-normal values drop t o zero and the gl obal value s approach each o ther Figure 4-1 shows a clear daybull
No data should be used wi thout consult ing the qua l i ty-control informa t i on dai ly no tes and measurement uncertainty
4 7
Cel l s
Ce l l s
Energy
Meteorologi cal Society
Appl i ed Meteorol ogy
Energy
Radiat ion Topical Overview Solar Cel l s Vo l 1 8
of the Pho tovo l t a i c s and Insolat ion Mea sureshySolar Vol 1 8 1 986 pp 393-3 9 5
TR-35 1 3A
1 0 REFERENCES
1 Hul st rom R L Solar 1 986 PPbull 1 7 9- 1 8 7
2 Hul st rom R L A Summary ments Workshop Panel Resul t s
3 Hul strom R L Re sul t s of the Amorphous S i l i con Mea surement s Ta sk Force Solar Cel l s Vo l 18 1 986 pp 1 7 1-1 7 7
4 Hul strom R L and J M Ohi Resul t s of the SERI Mul t i junction Devi ce Efficiency Measurement Task Forc e pre sented at the 20th I EEE Photovo lshytaic Spec ial i s t s Conference September 1 988
5 Riordan c and R L Hul s t rom Summary of S tud i e s that Examine the Effec t s of Spect ral Solar Radition Vari at ions on PV Device Des ign and Pershyformance SERI-TR-2 15-343 7 Golden CO Solar Energy Research Ins t i tute 1989
6 Riordan c Joint EPRI-SERI Spectral Solar Rad i a t i on Database Pro j ec t
1
8
9
1 0
1 1
1 2
1 3
14
Solar Vol 2 1 1 98 7 pp 3 3 7-342
Riordan c D Myers M Rymes R Hul strom W Mar i on c Jenning s and c Whi taker Spectral Solar Radiat ion Data Bas e at SERI Solar Vol 42 No 1 1 989 PP bull 6 7-79
Riordan C J T L Stoffe l and R L Hul s trom The Effect s of Urban Air Pollut ion on Solar Radiat i on SERI-TR-2 15-3482 Golden CO Solar Energy Res arch I n s t i tute ( draft ) 1989
Riordan c and R Hul s t rom The SERI Re s ource As ses sment Project s Plan for Col l ect ing Spectral-Solar-I rradiance Data SERI -TR-21 5-2948 Gol den CO Solar Energy Re search Ins t i tut e 1986
Shaw G E Sun Pho tometry Bul letin Ameri can Vol 64 No 1 January 1983 pp 4-10
Iqbal M bull An Int roduction to Solar Radiation New York Academic Pre s s
1983
Bartel s R A Comment s on Prec ipi table Water Mea surement s with Sun Photometer s Journal of Cl imate and Vol 25 1 986 PP bull 1 788- 1 789
Leckner B The Spectral Distribution o f Solar Radiat ion at the Earth s Surface -- El ements of a Model Solar Vol 20 1 9 7 8 pp 143- 1 5 0
Cannon T W Spectral So lar Irradiance Instrumentat i on and Measurement Techniques Solar Cel l s Vol 1 8 1986 pp 2 3 3-24 1
48
Energy
Photogrammetric Engineering
TR 3 5 13A
1 5 Myers D R E s t imate s of Uncertainty for Measured Spec tra in the SERI Spectral Solar Radiat i on Data Base ac cepted by Solar 1 98 9
1 6 Myers D R E s t imates of Uncertainty for Measured Spectra in the SERI Spec tral Solar Radiat i on Data aa s e 11 SERI e_clmical Report Golden CO S o l ar Energy Res earch Ins t i tute ( draft ) 1989
middot
1 7 Hul s trom R L The Cl oud Bright Spo t 1 9 73 PP bull 3 7 0-3 7 6
18 Ri ordan c D Myer s and R Hul s t rom Spectral Scflar Raltfiation Data Base Documentat i on and User 1 s Manual Vo lume I I SERI-TR-2 15-3 5 1 3 Golden CO Solar Energy Re search Ins t i tut e 1989
49
TR- 3 5 1 3A
APPENDIX
QUALITY-CONTROL PROCESSING
Limi ted qua l i ty-control proces s ing wa s appl i ed to the data ba se as de s c r i bed below The resul t s are i n the QC f i l es on the data-base t ape by s i t e year and mont h For examp l e
FLA8705 QC i s FSEC 1 98 7 May PGE8 80 l QC i s PGampE 1 9 8 8 January SER8 7 l l QC i s SERI 1 98 7 November
These f i l e s correspond t o the 11 OAT f i les for the s ame s i t e year and month Each data segment that includes a spectrum wa s proces sed through thi s quali ty-control procedure I f the atmospheric cond i t i on s were uns tab l e and a spectrum was not acquired the broadband and meteorologi cal data were inc l uded on the data-base tape but no qua l i ty-contro l proc e s s ing wa s app l i ed
An example o f a segment of a 11 QC f i l e i s shown in F i gure 6-3 The f i r s t Q l ine beg ins wi th a fol l owed by the s i t e year day and t ime s tamp The
last columns give the number of l ines in the s egment so the user can skip to the next s egment Fo l l owing the f i r s t l ine are me s sages that were printed whenever the qua l i ty-control proce s s ing f lagged a suspect or poor value
Following the mes sages in an SO-character QC l ine l i s t ing the variables that were examined are one of three qua l i ty-control code s 1 good 2 marg inal or suspect and 3 mi s s ing or poor The QC l ine was prepared using an automa t i c ( computeri zed ) check of the variabl e s and manual edi t ing to include informashyt ion from correspondence l og sheet s and vi sual inspe ct i on Addi t i onal me sshysages were added above the QC l ine if appropriate
The two-charact er descriptors in the QC l ine are
DN Direct-normal ( thermopi l e ) solar radiat ion before the spectral s can DN Direct-normal ( thermopi l e ) so lar radiation after the spectra l scan SN Direct-normal ( s i l i c on ) before SN Direct-normal ( s i l i c on ) after GN Globa l-normal before GN Globa l-normal after GH Globa l -horizontal ( thermop i l e ) before
WS Wind Speed KT KKN K
t n
GH Global-hori zontal thermopil e ) after SH Global-hori zontal ( s i l i con ) before SH Global-hori zontal ( s i l icon ) after GT Global-t i l t before GT Gl obal- t i l t after AL Al bedo ( Wm ) AP Albedo ( ) PR Surface Pres sure TC Temperature ( deg C ) RH Relat ive Humi dity WV Water Vapor ( al culated from rel a t i ve humidity)
5 0
S- flllit = - ( middotmiddot middot
( e g Wm2 )
TR-3 5 1 3A
DG D GH SP F i r s t Sp qtrum I T Integral of t he F i r s t Spec t rum SP Second Spectrum IT I nt egral of the - Second SpecttUI11
The aut oma t i c tes t s that were performed to det ermine the QC code fol l owing each var iable were
( a ) Check for mi s s ing or negat ive values for the broadband solar radiashyt i on meteoro l og i cal or a tmo spheric dat a or the spec t ral integral s
lt 0 = Code 2 Mi s s ing ( - 9 or -9 9 ) = Code 3
( b ) Check for atmo spheric or broadband instrument instab i l i ty us ing the difference and rat i o o f the before- and aft er-scan values and redundant mea surement s if nei t her values are negat i ve or mi s s ing
DN before DN after if the abs lute d i fference SN before SN after i s gt10 Wm DN beforeSN before 5 of 200 DN before SN after and GH before GH after SH beforeSH after the rat io i s lt0 95 or gt1 05 each of the GH before SH before two var iables = GH afterSH after or middot GN beforeGN after the rat i o i s lt0 90 or gt1 10 each of the GT beforeGT after two var iable s = Code 3
Code 2
( c ) Check for DN gt GN or GN gt ETR ( extraterre s trial solar radiat i on ) us 1ng rat ios of the var iabl e s
DN before GN before gt0 95 each variable = Code 2 DN afterGN after gt 1 0 each var i able = Code 3 GN before ETR GN afterETR
( d ) Check for values o f Kt Kn and DGH tha t are too high
KT ( invo lves GH before and after and KT ) KN ( involves DN before and after and KN ) DG ( invo lves DN and GH before and after and DG )
gt0 9 5 each variable = Code 2 gt 1 0 each var iable = Code 3
( e ) Check the s pe c t ral integral s for unusual rat i o s to the corresponding broadband so lar radiat ion value
IT ( Broadband va lue before and after )
For d i rect s pe c t ra lt 0 6 or gt0 8 5 I T = Code 2 For gl obal s pe c t ra lt0 7 o r gt0 95 I T = Code 2
For d i rect and g l obal s pec t ra lt0 5 or gt l O IT = Code 3
5 1
TR-35 13A
We sugge s t that users of the data ba s e develop a computer program to acc e s s fields i n the Q C l ine and t o print the me s sages Thi s l imi ted qua l i ty cont rol wi l l not f lag a l l po s s ible errors and addi t i onal t e s t s should be applied depend ing on the users requi rement s and appl icat i on s
52
1 1 2
Document Control SEAl Report No
Page 4 Title and Subtitle
NTIS Accession No 3 Recipients Accession No SERI TR- 2 1 5-35 13A DE89009447
5 Publication Date
January 1990 Sp ectral Solar Radiation Data Base Documentation
6Vo lume I
7 Author(s) 8 Performing Organization Rept No
9 Performing Organization Name and Address 10 ProjectTaskWork Unit No
1 1 Contract (C) or Grant (G) No
(C)
(G)
1 2 Sponsoring Organization Name and Address 13 Type of Report amp Period Covered
Solar Energy Res ear ch Ins titute Technical Repor t 1 6 1 7 Col e Boulevard Golden Colorado 804 0 1-3393 1 4
1 5 Supplementary Notes
16 Abstract (Limit 200 words) The Solar Energy Research Ins titute ( SERI) Electric Power Research Ins titute Flor ida Solar Energy Center and Pacific Gas and Electric Company cooperated to produce a spec tral solar radiation data base representing a range of atmospheric conditions These data will help to characterize the natural variab ility in the spectral (color) content o f outdoor solar radiation so that the sensitivity of spec trally selective solar devices ( such as photovoltaics ) to these variations c n b e s tudied quant itatively Volume I o f this report documents the history approach content and format of the data base Volume II contains graphs and field no tes for each of the spectral data sets The data res ide on magnetic tape at SERI
1 7 Document Analysis
a Descriptors Spec tral solar radiation broadband solar radiation met eorological
data sp ectroradiometers
b IdentifiersOpen-Ended Terms
c UC Categories
233 234
18 Availabil ity Statement
National Technical Information U S Depar tment of Commerce 5 285 Port Royal Road Springfield Virginia 2 2 1 6 1
Service 19 No of Pages
60
20 Price
A04
Form No 0069 (6-30-87)
TR-35 13A
We urge users of the data ba se to refer to the dai l y f i eld no tes for s pe c i a l c i rcumstances recorded b y the operator that may affect data uncertainty The s e no tes include references to the spectroradiometer t emperature c onshyt ro l l e r solar-tracking accuracy and weather cond i t i ons ( such as rain ) Included in the dai l y notes on tbe data-base tape are obs ervat i ons made in qual i t y-control processing as wel l as references to the exi s t ence and qual i t y o f pho t ographs or s l ides
Quant i tat ive pos t-proces s ing qual i ty-control informat i on i s al s o inc luded on t he data-bas e tape and a complete descript ion is given in the appendix o f thi s report Redundant measurement s ( such as before- smiddotcan andmiddot middot aft et-smiddotcan
broadband solar radiat i on direct-norma l and global-hor izont al mea surement s with both thermopile and s i l i con detectors ) and compar i s ons o f integrat ed s pectral so lar radiat ion wi th broadband s o lar radiat i on were used in the qual i ty-control procedure s Users are encouraged to perform the i r own qual i t y-cont rol proce s s ing on the data t o meet their par t i cular requiremen t s
3 5
6 0 FORMAT OF THE DATA TAPE
The meas ured dat a f i eld notes quali ty-control informa t i on and mea surement uncertainty are s t ored on magne t i c tape in 80-character l ines wi th the fi leshyname s given in Table 6- 1 The f i l enaming convent ion used for the mea sured data was
Filename Content
FLA8705 DAT FSEC data 1987 May PGE880 l DAT PGampE data 1988 January SER8 7 1 1 DAT SERI data 1987 November
Data were not acqui red in a l l months so the months may not be cont iguous
Qua l i t y-control informa t i on has the same f i l enaming conven t i on with QC extens ion ( for example FLA8 705 QC ) Dai ly notes are contained in the f i l e s FSEC NOTES PGE NOTES and SERI NOTES respec t i vely The mea surement uncershytainty is in the UNCERT f i l e s
c The DAT f i l e s contain two types of informa t i on D for data and for inst rument configurat ion The f i r s t l ine of a data or confi guration segment beg ins wi th a D or a c re spect ively in the f i r s t column followed by the s i t e year day and t ime stamp the number of l ines in the segment i s in column-s 76-80 so that the user can eas i ly skip the de s i red number of l ine s An example of the information in the conf iguration or 1 1C segment i s
c shown in Figure 6-1 I t begins wi th a followed b y the s i t e FSEC year 11 1 98 7 day 122 and t i me u0830 latitude longi tude and eleva t i on There are 19 channel s for mea surement s zero s pectra in the C segment and 40 l ine s in the segment The con f i gurat ion informa t i on appear s whenever the inst rument set-up or cal ibrat ion wa s changed or t he data acqui s i t ion sys t em wa s res tarted I f the configurat i on wa s not changed at the beginning of the month the configura t i on segment wi l l be in the previous mont h s DAT f i l e
An examp le of a D segment i s shown in Figure 6-2 Thi s segment contains the mea s ured me teoro logical dat a broadband and spectral solar rad i a t i on dat a and anc i l l ary data The data contained in each l ine and column and i t s format are as follows
POS ITION OF VARIABLES IN THE D SEGMENTS (ALL LINES ARE 80 CHARACTERS )
Line Column Cont ent s Format
a = character 1 = integer f = f l oat ing point
LINE 1 1 1 D ( for data ) ( a l ) 3 1 5 Site Year Day Number Time Stamp ( a 1 3 )
3 6 F SEC PGampE o r SERI ( a4 ) 7 8 Year (a2 or i 2 ) 9 1 1 Day Number ( a3 o r i 3 ) 1 2 15 Standard Time ( a4 o r i4 )
36
5-111 - il ll
Da i ly
Uncertainty
-
TR-35 13A -
Table 6 1 Namesmiddot of Files on the Data Tape
Measured and
FSEC
FLA8610 DAT FLA8 6 1 0 QC
FLAB 6 1 1 bull DAT FLA8 6 l l QC
FLA86 1 2 DAT FLA8 6 1 2 QC
FLA8 7 0 1 DAT FLA8 70 l QC
FLA8 704 DAT FLA8 704 QC
FLA8 705 DAT FLA8 7 05 QC
PGampE
PGE8 704 DAT PGE8 704 QC
PGE8 705 DAT PGE8 705 QC
PGE8 706 DAT PGE8 7 06 QC
PGE8 7 0 7- DAT PGE8 7 0 7 QC
SERI
SER87 l l DAT SER8 7 l l QC
S ER8 7 1 2 DAT SER8 7 1 2 QC
SER880 1 DAT SER880l QC
SER8802 DAT SER8802 QC
Ca lcui a t ed Data
FLA8 706 DAT FLA8 706 QA
FLA8 7 0 7 DAT FLA8 7 0 7 QC
FLA8 7 0 8 DAT FLA8 7 0 8 QC
FLA8 709 DAT FLA8 7 09 QC
FLA8 7 1 0 DAT FLA8 7 1 0 QC
FLA8 7 l l DAT FLA8 7 l l QC
PGE8 708 DAT middot
PGE8 708 QC
PGE8 7 0 9 DAT PGE8 709 QC
PGE8 7 l l DAT PGE8 7 l l QC
No t e s
FSEC NOTES PGampE NOTES SERI NOTES
Mea s urement
FSEC UNCERT PGamp E UNCERT SERI UNCERT
FLA8 7 1 2 DAT FLA8 7 1 2 QC
FLA880l DAT FLA880l QC
FLA8 802 DAT FLA8802 QC
FLA8803 DAT FLA8803 QC _
FLA8804 DAT FLA8804 QC
PGE_880l DAT PGE880l QC
PGE8802 DAT PGE8802 QC
PGE8803 DAT PGE8803 QC
3 7 _middot
1 3
1 7
55 1 1-1 TR-3 5 1 3A
0 G) 0 G)G) iC FSEC8 7 1 2 2 0 8 1 3 2 8 4 0 0 0N 80 6 0 0 0W 2M C = 8 7 1 2 2 0 8 1 3 8 7 1 2 2 0 8 1 3+0 0 0 0 0 0 1 9 0 4 0
CHN PARAMETER +- - - - - - - INSTRUMENT- - - - - - - - - -+ +- -CALIBRATION- + OUTPUT FOOT NO TYPE MAKER TYPE SERIAL FACTOR DATE UNITS NOTES
1 Di r- Nor-m Eppley NIP 2 3 9 4 3E6 6 08 1 2 - 186 Wm2 2 Glo Nor-m Eppley PSP 2 4 1 85F3 8 85 l l - 186 Wm2 3 G l o Hor-z Eppl ey PSP l 4 3 2 2F3 6 3 8 1 2 - 2 86 Wm 2 4 Glo Tilt Eppley PSP 2 4 1 83F3 8 9 9 l l - 186 Wm2 iacute5 Dir- N S i MATRIX SI NIP 3826 31 8 0 9 - 186 Wm2 6 Amb Temp WTHRMEAS PRT 1 7 7 l 0 0 3 - 1 8 7 Deq c 7 Sur-f Pr-es WTHRMEAS PIEZO 1 7 8 l 0 0 5 - 1 8 7 Mi l l ibar-8 Re1 Hum WTHRMEAS LiCl 1 7 5 l 0 0 6 - 1 86 Per-cent 9 Wind Spd WTHRMEAS OPT CHOP 1 2 1 9 l 0 0 3 - 1 8 7 Met e r- s i S
1 0 Albedo Epp ley PSP l 6 2 9 7F3 1 0 0 9 l l - 1 8 6 Per-cent l l hot 380 Unused Unused Unused - 9 9 0 0 - 1 - l - 1 Counts iacute1 2 hot 5 0 0 Unused Unused Unused - 9 9 0 0 - 1 - l - l Count s
14 hot 860 Unused Unused Unused - 9 9 0 0 - 1 - 1 - 1 Counts hot 942 Unused Unused Unused - 9 9 0 0 - 1 - l - l Counts
1 5 Opq C loud Unused Unused Unused - 9 9 0 0 - 1 - l - l Tenths 1 6 H2 0 NWS Unused Unused Unused - 9 9 0 0 - 1 - l - l em
Spect l LI -COR L I - 1 8 0 0 PRS - 1 7 2 l 0 0 2 - 1 8 7 W sq m nm l Spect 2 L I - COR L I - 1 800 PRS - 1 0 2 1 0 0 2 - 1 8 71 8 W sq m nm l
1 9 Glo H Si LI -COR L I - 2 0 0S PY2 276 8 4 5 7 - 1 86 Wm2 2 - 1 FIN
FOOTNOTES
1 - 1 7 = DN 18 = GT 2 - SERI l oan un i t
- 1 - FIN
Figure 6-1 Example of the instrument configuration data on the data base tape The numbers refer tmiddotO
1 c indicating configuration 2 FSEC 1987 Day 122 at 8 13 standard time 3 Latitude 4 Longitude 5 Ele vation 6 Reference to configuration file that will be f ound in the
data files 7 Starting data-acquisition time plus number of attempts to
acquire spectra (which would extend the data acquisition time)
8 Number of data channels 9 Number of spectra ( 0 f or configuration files 1 or 2 f or
data files) 10 Number of lines in this segment
38
TR35 1 3A
D FSEC8 7 1 2 2 0 8 1 3 2 8 4 0 0 0N 8 0 6 00 0W 2M C=871 2 2 0 8 1 3 8 7 1 220 814+0 0 0 1 0 0 1 9 2 1 0 0 gS e e Q N FSEC8 7 1 2 2 U PRS - 1 7 2 Col 2 ( + - ) U PRS - 1 0 2 Col 2 ( - ) Col 4 ( + ) 1 7 84 5 5 7 54 5 2 9 3 0 2 - 1 - 9 9 0 3 48 0 1 1 9 48 3 3 4 4 2 7 9 - 1 -9 9 0 1 7 85 0 5 7 5 5 7 2 9 3 0 4 - 1 - 9 9 0 3 4 8 1 1 1 9 4 85 3 4 43 0 1 - 1 - 9 9 0 2 8 4 1 80 0
1 0 9 5 4 1 5 - 99 0 7 1 0 1 7 8 6 2 0 7 8 7 5 8 9 1 5 - 1 - 9 9 0 - 1 - 9 9 0 iacute1 1 3 80 0 - 99 0 Co 1 2 5 0 0 0 - 99 0 Co 1 3 860 0 - 99 0 Co 1 4 942 0 - 9 9 0 Co iacute
- 1 6 0 7 1 5 8 5 7 8 5 6 7 1 58 3 86 9 1 9 9 1 8 7 - 9 0 0 - 9 0 0 - 9 0 0 - 9 0 0 - 9 0 - 9 0 3 1 1 7 4 0 1 3 0 0 1 1 0 0 2 0 57 9 8 9 4 0 0 DNT1 8 4 0 1 3 0 0 1 1 0 0 2 0 2 8 4 1 8 0 0 6 2 4 GTS - 1 0 0 0 0 0 0 0 0 0 0 0 - 1 0 0 0 o o 0 0 0 0 o o
1 3 0 0 0 0 0 0 0 0 3 5 0 0 0 4 0 0 2 1 0 02 5 0 0 14 0 04 1 0 02 1 0 0 5 7 0 0 3 8 amp 1 3 2 0 0 0 7 2 0 056 0 1 0 1 0 0 8 1 0 1 1 8 0 1 2 1 0 1 1 9 0 140 0 138 0 1 3 1 amp 1 340 0 1 4 9 0 16 1 0 162 0 1 5 5 0 16 0 0 1 6 3 0 1 8 5 0 1 9 5 0 1 9 8 0 1 9 9 amp 1 360 0 2 0 9 0 2 1 9 0 228 0 2 4 3 0 258 0 26 5 0 258 0 265 0 268 0 2 89 amp 1 380 0 2 8 0 0 2 7 9 0 26 7 0 2 7 3 0 3 0 1 0 3 08 0 3 1 7 0 326 0 349 0 4 0 2 amp 1 4 0 0 0 4 7 6 0 52 7 0 55 7 0 569 0 580 0 5 9 5 0 6 12 0 63 0 0 64 1 0 648 amp 1 4 2 0 0 652 0 6 54 0 6 58 0 649 0 6 36 0 6 3 2 0 646 0 67 8 0 7 1 8 0 746 amp 1 440 0 7 6 8 0 7 9 9 0 82 2 0 854 0 8 7 7 0 9 0 4 0 9 1 5 0 92 2 0 934 0 94 2 amp 1 460 0 9 6 0 0 964 0 9 7 0 0 9 7 3 0 96 9 0 9 74 0 9 9 0 0 9 9 9 1 0 1 7 1 028 amp 1 4 8 0 1 0 3 3 1 0 25 1 0 0 6 0 9 9 1 0 9 9 0 1 0 1 0 1 026 1 0 3 8 1 043 1 0 4 7 amp 1 500 1 0 3 8 1 034 1 038 1 0 5 1 1 0 58 1 058 1 0 5 1 1 0 3 5 1 0 1 7 1 0 0 7 amp 1 520 1 0 2 0 1 04 1 1 0 5 7 1 063 1 068 1 0 8 1 1 088 1 0 9 3 1 0 9 3 1 0 9 1 amp 1 540 1 0 8 9 1 0 84 1 088 1 0 9 5 1 0 9 7 1 0 9 5 1 0 9 8 1 1 0 2 1 094 1 0 8 7 amp 1 560 1 0 7 8 1 0 7 9 1 08 1 1 0 7 7 1 0 7 2 1 0 7 1 1 0 7 6 1 0 7 8 1 0 7 8 1 0 82 amp 1 580 1 0 9 0 1 0 9 8 1 1 0 1 1 088 1 0 7 4 1 062 1 06 1 1 06 7 1 0 7 4 1 0 80 amp 1 6 0 0 1 082 1 085 1 08 8 1 0 9 2 1 0 9 3 1 0 89 1 083 1 0 7 8 1 0 78 1 0 7 9 amp 1 620 1 0 8 2 1 083 1 0 7 6 1 065 1 0 5 9 1 056 1 06 1 1 0 7 3 1 0 8 0 1 085 amp 1 640 1 0 86 1 084 1 08 1 1 0 7 6 1 067 1 062 1 0 5 2 1 04 2 1 038 1 048 amp 1 660 1 0 7 0 1 086 1 0 9 4 1 0 9 7 1 0 96 1 096 1 09 2 1 0 9 3 1 0 9 1 1 0 89 amp 1 680 1 0 7 9 1 064 1 02 8 0 9 8 0 0 94 3 0 9 3 7 0 954 0 98 0 0 9 9 6 1 0 0 5 amp 1 7 0 0 1 0 0 8 1 0 0 9 1 0 1 3 1 0 1 9 1 0 2 5 1 0 2 2 1 0 0 3 0 9 7 3 0 924 0 8 74 amp 1 7 2 0 0 846 0 842 0 84 8 0 84 9 0 8 54 0 8 7 8 0 9 0 3 0 9 3 1 0 9 52 0 965 amp 1 740 0 9 6 9 0 9 7 7 0 98 3 0 989 0 988 0 9 8 2 0 9 7 6 0 95 0 0 8 81 0 7 6 7 amp 1 760 0 6 1 6 0 5 24 0 54 0 0 646 0 7 7 9 0 8 76 0 924 0 94 5 0 94 7 0 9 45 amp 1 7 8 0 0 94 2 0 94 2 0 9 3 7 0 9 2 6 0 9 1 6 0 9 0 7 0 89 9 0 894 0 8 9 1 0 89 0 amp 1 800 0 888 0 883 0 8 7 9 0 87 5 0 863 0 836 0 8 0 1 0 7 5 7 0 7 2 2 0 7 1 0 amp 1 820 0 7 1 0 0 7 1 9 0 7 3 3 0 74 1 0 7 4 9 0 7 5 7 0 76 3 0 7 7 7 0 7 9 7 0 8 1 0 amp 1 840 0 82 0 0 82 8 0 82 7 0 82 2 0 8 1 5 0 7 9 7 0 786 0 7 83 0 7 8 8 0 7 9 7 amp 1 860 0 80 4 0 8 0 0 0 7 8 8 0 7 8 0 0 7 7 5 0 7 8 0 0 7 8 7 0 786 0 785 0 7 81 amp 1 880 0 7 7 5 0 7 7 4 0 7 7 2 0 767 0 763 0 7 4 7 0 72 1 0 68 2 0 6 30 0 5 88 amp 1 9 0 0 0 57 1 0 5 7 3 0 58 9 0 584 0 568 0 549 0 53 4 0 53 3 0 5 38 0 5 56 amp 1 9 2 0 0 5 7 3 0 57 9 0 56 7 0 526 0 448 0 362 0 2 7 2 0 2 18 0 2 1 0 0 2 32 amp 1 940 0 254 0 262 0 2 5 7 0 253 0 25 7 0 266 0 2 7 5 0 2 85 0 29 9 0 3 1 7 amp 1 960 0 3 33 0 362 0 3 9 6 0 4 3 5 0 4 7 9 0 5 06 0 5 1 5 0 5 1 2 0 5 08 0 5 2 1 amp 1 9 8 0 0 53 7 0 560 0 5 84 0 5 9 7 0 6 0 9 0 6 1 7 0 6 1 8 0 6 2 3 0 62 1 0 6 1 9 amp 1 1 0 0 0 0 6 1 8 0 6 0 7 0 6 0 5 0 6 0 2 0 60 1 0 60 5 0 6 04 0 604 0 604 0 6 0 1 amp 1 1 0 2 0 0 60 1 0 59 5 0 5 9 5 0 5 93 0 589 0 59 0 0 584 0 5 82 0 580 0 5 75 amp 1 1 0 4 0 0 5 7 6 0 5 7 1 0 57 1 0 56 7 0 56 0 0 56 0 0 558 0 552 0 545 0 54 0 amp 1 1 0 6 0 0 5 36 0 53 2 0 5 2 9 0 5 2 5 0 5 1 9 0 5 1 5 0 5 1 2 0 51 1 0 50 9 0 5 08 amp 1 1 0 8 0 0 50 6 0 502 0 4 9 2 0 48 3 0 48 3 0 483 0 46 9 middot 0 4 5 2 0 447 0 3 1 amp 1 1 1 0 0 0 4 1 1 - 9 9 0 0 0 - 9 9 0 0 0 - 9 9 0 0 0 - 9 9 0 0 0 - 9 9 0 0 0 - 9 9 0 0 0 - 9 9 00 0 - 1 582 3 2 2 3 0 0 0 0 0 6 0 0 0 1 0 0 0 4 0 0 1 3 0 0 1 9 0 0 2 3 0 04 1 0 0 5 5 0 064 0 088 amp 2 3 2 0 0 1 0 5 0 1 3 9 0 1 7 9 0 1 8 9 0 2 2 4 0 2 38 0 26 2 0 252 0 261 0 2 64 amp 2 340 0 2 8 7 0 2 9 2 0 266 0 2 88 0 2 98 0 286 0 3 0 0 0 3 0 0 0 2 9 1 0 2 85 amp 2 360 0 296 0 3 1 0 0 3 36 0 367 0 3 9 0 0 3 7 2 0 3 56 0 356 0 3 7 3 0 3 88 amp
Figur e 6-2 Examples of the data on the data-base tape
3 9
TR-3 5 1 3A
16 2 3 24 24 2S 3 3 34 34 3S 3 9 40 40 4 1 S 2 S4 69
54 62
6 3 6 3
6 7 6 7
7 0 7 3
74 7 S
7 6 80
LINE 2
LINE 3
1 3 4 10
1 1 1 3 14 20 2 1 23 24 30 3 1 40 4 1 43 44 SO 5 1 5 3 54 60
Lat i tude ( deg ) N ( north) Longi t ude ( deg ) W ( we s t ) `Elevat i on (m) M (m) Reference t o Conf i guration Segment Start ing year day t ime for the spectral `scan s ) i f any and number of attempt s t o `acquire the s can ( which ind i cates po s s ible `t ime delay from the s tart ing t ime ) middot
Year Day Number Time
11+11 for plus number of attempt s to acquire a s pect rum
Number o f attempt s t o acquire a s pectrum
Po s s ible Number o f Measurement s ( 1 9 )
Number o f Spec tra i n thi s Segment ( 0 1 or 2 )
Number o f Lines in Segment
Pointer to the qua l i ty-cont rol dai ly f i e ld note s and measurement uncertainty informa t ion Qua l i ty-control informa t i on is in the QC f i l e of the same month wi th the same s i t e year day and t ime s t amp Dai l y field notes are i n the NOTES f i l e f o r the same s i t e wi th the same s i t e year and day s tamp Mea surement uncertainty i s in the f i l e s UNCERT under t h e instrument serial number ident i f i ed by PRS-xxx and the column s in the uncertainty f i le s for + and - uncertainty l imi t s
Broadband mea surement s before the spectral scan
Channel fH Direct Normal ( thermopi l e ) (Wm2 ) Channel ffoS Direct Normal ( s i l i con) (Wm2 ) Channel tn Global Normal ( Wm2 ) Channel not used Charinel ffo3 Globa l Hori zontal ( thermop i l e ) ( Wm2 ) Channel fH 9 Gl obal Horizontal ( s i l icon ) ( Wm2 )
( f 8 4 ) ( a 1 ) ( f 9 4 ) ( a l ) ( i S ) ( a l ) ( a l 2 )
( a9 o r i 9 )
( a 1 )
( i 1 )
( i4 )
( i 2 )
( i S )
( a8 0 )
( i 3 ) ( pound 7 2 ) ( i 3 ) ( pound 7 2 ) ( i 3 ) ( f 7 2 )
( i 3 ) ( pound 7 2 ) ( i 3 ) ( pound 7 2 )
40
TR-35 3A
6 1 6 3 64 7 0 7 1 80
LINE 4
LINE 5
1 6
7 1 2
1 3 80
LINE 6
1 3 4 1 0
1 1 1 3 1 4 20 2 1 23 24 3 0
3 1 3 3 34 40 4 1 43 44 5 0 5 1 5 3 5 4 6 0 6 1 6 3 64 7 0 7 1 7 3 7 4 8 0
LINE 7
LINE 8
1 5
6 1 2
Channe l 114 Gl obal Ti l t (Wm2 ) hellipChannel not used
Broad band mea suremen t s a f t e r t h e s p e c t ral s can same format a s beforeshy scan ( LINE 3 )
T i l t o f the f ixed- t i l t i n s t rument s hellipf rom the hor i z ont a l ( d eg )
Az i muth of the f i xed-t i l t ins t rumen t s ( de g ) ( 1 8 0 deg = s outh)
De s c r i p t i on o f any s pec i al i n s t rument ( fo r example d i ffu s e-hori zont a l mea s uremen t s a t SERI )
Channe l IFlOAl bedo (Wm2 ) hellipChannel IH5C l oud Cover ( t enths ) Channel fF7 Surface Pres sure ( mb ) Mea s ured at FSEC and PGampE c a l c u l ated from e l eva t i on a t S ERI [ 1 1 p 1 0 0 ]
Channel 116 Amb i en t Temperature ( deg C ) Channel fiB Rel a t i ve Humi d i t y ( ) Channe l ffo9 Wind S peed ( m s ) Add i t i onal channe l des cri bed 1n l i ne 5 Va l ue Add i t i onal channel descri bed 1n l ine 5 Va l u e
Sun Pho t ometer read ings ( only recorded for SERI dat a not u s ed except for re l a t i ve c ompar i s on s ) hellip
Earth-S un d i s tance c orrec t i on ( d e v i a t i on from 1 0 ) hellip
Ext ra t erre s t r i a l Rad i a t i on (Wm2 ) hellip
( i 3 ) ( pound 7 2 )
( f 6 1 )
( f 6 1 )
( a 8 8 )
( i 3 ) ( 7 1 ) ( i 3 ) ( 7 1 ) ( i 3 ) ( f 7 1 )
( i 3 ) ( pound 7 1 ) ( i 3 ) ( pound 7 1 ) ( i 3 ) ( pound 7 1 ) ( i 3 ) ( variabl e ) ( i 3 ) ( variabl e )
( f5 2 )
( f 7 1 )
4 1
9
42
TR-3S l 3A
1 3 1 8
1 9 24
25 30
3 1 36
3742
43 48
49 68
69 72
13 76
1780
LINE
I
3 6
7 1 1 1216 1 7 20 21 25
2631
3236
3839
40 40
41 42
43 46
Zen i t h Angl e ( deg ) ( f6 2 )
Kt ( ra t i o calculated from ( f6 1 ) thermo p i l e inst rument s )
Kn ( rat i o calculated from ( f6 1 ) thermo p i l e instrument s )
D GH ( ra t i o cal culated from thermopile instrument s ) ( f6 1 )
Albedo ( ) ( f6 1 )
Ai r Mas s ( f6 2 )
Res erved for Turbidi ty i f calculated
Precipi table Water Vapor i f calculated from sun photomet er
Precipi table Water Vapor from the ( f4 1 ) Nat ional Weather Servi ce
Prec i p i table Water Vapor Cal culated from Relative Humid i t y ( f4 1 )
Channel H7 Number o f Wave l engths Recorded by Spect roradi ometer 1
Beginning Wavelength ( nm ) Ending Wavel ength (nm) Wavelength Step Size (nm ) Spectroradi ometer 1 Ti l t from the Horizontal ( deg )
Spectroradiometer 1 Azimuth ( deg )
Angle o f Incidence o f the Direct Beam on Spectroradi ometer 1 ( deg )
Measurement Type ( DN GN GH GT DF )
Attachment ( Tef lon Dome D Integrat ing Sphere S View- l imit ing Tube T )
Channel H8 Number o f Wavel engths Recorded by Spectroradi ometer 2
( i2 )
( i4 )
( i S ) ( i S ) ( f4 1 )
( fS l )
( f6 1 )
( fS 1 )
( a2 )
( a l )
( i 2 )
(i4)
TR-3S l3A
4 7 S l Beginning Wavel ength (nm ) ( i S )
S 2 S 6` Ending Wavel ength ( nm ) ( i S )
S 7 60 Wavelength Step S i z e ( nm ) ( f4 bull 1 )
6 1 6S Spec troradi ometer 1 T i l t from the Hori zontal ( deg ) ( fS l )
6 6 7 1 ` Spect roradi ometer 2 Az imuth ( deg ) ( f6 1 )
7 2 76` Angle of Incidence o f the Direct Beam on Spect rorad i ometer 2 ( deg ) ( fS l )
7 8 7 9 Mea surement Type ( DN GN GH GT DF ) ( a2 )
8 0 80 At tachment ( Teflon Dome D Integrat ing Sphere s View-l imi t ing Tube T ) ( al )
LINE 10 Saved f o r extra spectroradi ometers i f needed
I f no spec tral data were recorded the number of l ines in the D s egment i s 1 0 the number of spectra i s 0 and there i s no corre sponding qual i ty-control information for thi s dat e t ime in the QC f i l e s No qual i ty c ontrol wa s performed because the atmo sphere was uns table I f the number o f spectra i s 1 there are 60 l ines in the D s egment i f there are two spectra t he number o f l ines i s 100
I f middot the number of spectra i s 1 or 2 the spectral data fol low after the f i r s t 1 0 l i nes o f the D segment There are 1 0 spectral measurement s per l ine wi th the number in the lef t-mo s t column indicat ing the f i r s t or second specshyt roradiometer ( 1 or 2 ) f o l l owed by the s tart ing wavelength ( in nanometers ) and t he 10 spectral mea surements ( in Wm2-nm) The 1 0 measurement s are at wave l ength inc rements of 2 nm There are 401 spect ral mea surement s from 300 t o 1 1 0 0 nm in 2-nm s teps with 10 measurement s per line for 40 l ine s and one measurement in the 4 1 s t l ine The l a s t number in the 4 1 s t l ine i s the specshytral integral I f a second s pectrorad i ometer wa s used the next 4 1 l ines folshylow t he same format Blank 1 ines follow the spec tral data t o f i l l the D segment to 60 or 100 l ines
An example of a QC f i l e i s shown in Figure 6-3 The f i r s t l ine o f each segment begins with a Q f o l l owed by the s i t e year day number and t ime s tamp with the number of l ines in the segment given in the l a s t col umn s o f the l ine Following the iden t i fier are me s sage s about var iables that were flagged by the automat i c qua l i ty-control proc e s s ing ( s ee appendi x ) noted by an operator at the measurement s i t e or noted dur ing inspec t i on at SERI The l a s t l ine of the segment shows the QC code for as DN ( direct normal thermopile detect o r ) SN ( d i rect normal detector ) AL
var iabl e s such s i l i con
( a lbedo ) and SP ( s pectrum) a s de s c r i bed in the appendi x Three qual i tyshycontrol code s ar8 used 1 = good 2 = suspec t see me s sages and dai ly not e s and 3 = poor or mi s s ing see me s s ages and da i l y no te s The broadband codes ( DN SN GN GH SH and GT ) have two value s the f i r s t is the before- scan measurement and the second is the after-s can mea surement
4 3
TR-35 13A
Q FSEC87 1 2 1 0 7 3 1 4 Noise in GH spectrum in UV QCDN1DN1SN1SN1GN1GN1GH1GH1SH1SH1GT1GT1AL1AP1PR1TC1RH1WV1WS1KT1KN1DG1SPl iN1SP2IN2
Q FSEC8 7 1 2 1 0 8 3 0 8 SN bef SN af t = 1 0 5 5 S H bef SH aft = 1 0 5 3 2nd Int BB b e f = 0 636 2nd Int BB aft = 0 6 5 1 Noise in GH spectrum i n UV QCDN1DN1SN2SN2GN1GN1GH1GH1SH2SH2GT1GT1AL1AP1PR1TC1RH1WV1WS1KT1KN1DG1SP1 IN1SP2IN2
Q FSEC8 7 1 2 1 1 0 3 1 3 QCDN1DN1SN1SN1GN1GN1GH1GH1SH1SH1GT1GT1AL1AP1PR1TC1RH1WV1WS1KT1KN1DG1SP1 IN1SPl iNl iacute
Q FSEC87 1 2 1 1 1 3 1 3 QCDN1DN1SN1 SN1GN1GN1GH1GH1SH1SH1GT1GT1AL 1AP1PR1TC1RH1WV1WS1KT1KH1DG1SP 1 IN1SP1 IN1
Q FSEC8 7 1 2 1 1 2 3 1 3 QCDN1DN 1SN1SN1GN1GN1GH1GH1SH1SH1GT1GT1AL1AP1PR1TC1RH1WV1WS1KT1KN1DG1 SP1 IN1SP 1 IN1
Q FSEC8 7 1 2 1 1 3 3 1 3 QCDN1DN1SNlSNlGNlGN1GH1GH1SH1SH1GTlGTlALlAPlPRlTClRHlWVlWSlKTlKNlDGlSP l iNlSPliNl
Q FSEC8 7 1 2 1 1 4 3 1 3QCDNlDNlSNlSNlGNlGNlGHlGHlSHlSHlGTlGTlALlAPlPRlTClRHlHVlHSlKTlKNlDGlSPl iN1SP1IN1 Q FSECB7 1 2 1 1 554 3 QCDNlDNlSNlSNlGNlGNlGHlGHlSHlSHlGTlGTlALlAPlPRlTClRHlWV1WSlKT1KN1DG1SP 1 IN1SP l iN1
Q FSEC8 7 1 2 1 16 3 0 3 QCDNlDNlSNlSNlGNlGNlGHlGHlSHlSHlGTlGTlALlAPlPRlTC1RH1WV1WSlKTlKNlDG1SP l iNlSPl iNl
Q FSECB 7 1 2 1 1 7 3 1 5 GH bef SH bef = 0 9 3 1 GH aft SH af t = 0 9 3 3 QCDN1DN1SN1SN1GN1GNlGH2GH2SH2SH2GTlGT1ALlAPlPRlTClRHlWVlWSlKTlKNlDGlSPl iNlSPl iNl
Q FSECB 7 1 2 2 0 7 3 1 3 QCDNlDNlSNlSNlGNlGNlGHlGHlSHlSHlGT1GTlALlAPlPRlTClRHlWVlWS 1KT1KNlDGlSP l iNlSPl iNl
Figure 6-3 Example of quali ty-control inf ormation on the data- base tape
Figure 6-4 shows an exampl e of a segment of the daily notes from the FSEC NOTES f i l e Each segment of the f i l e beg ins wi th an followed b y the s i t e year and day number s t amp with the number of l ines in the segment given in the last columns of the l i ne The next l ine contains the s i te operashytor log sheet number month day year day number spectroradi ometer serial number( s ) and mea surement mode( s ) The PGampE and SERI not e s do not include the dai ly l og sheet number The f i rst two l ines are followed by f i eld no te s No tes that were added after inspec t i on at SERI are s eparat d from the operator notes wi th ------- The exi s tence of s l ides or photographs i s ind i cat ed a s wel l a s their qua l i ty i e good ( G ) marginal ( M ) or poor ( P ) In the exampl e in thi s f i gure there were two log sheets for thi s day (number 1 1 6 and 1 1 7 ) because the mea surement mode changed from gl obal hor i z onshytal ( GH ) to global t i l t ( GT )
44
TR-3513A
N FSEC87 1 2 2 1 1 6 0 5 0 2 8 7 1 2 2 1 7 2 DN 1 0 2 GH Clear at 0 7 3 0 GH f o r f ir s t two s cans then GT S l i de s 0 6 3 2 G
0 7 3 3 G 0 8 3 3 G 0 9 3 3 H ( dark ) 1 0 3 3 p1 1 3 3 p1 2 3 3 p 1 3 3 3 p1433 H 1 5 3 3 G 1633 G 1733 G
1 1 7 0 5 0 2 87 1 2 2 1 7 2 DN 1 0 2 GT GT s tart ing at 0 8 0 0 iacuteC lear a t 0 8 0 0 iacuteS l ides S e e above
16 1 1 8 0 5 0 3 8 7 1 2 3 1 7 2 DN 1 0 2 GT Clear at 0830 S l i de s 0633 G
0733 G 0833 G 0933 H ( dark ) 1 0 3 3 p1 1 3 3 p 1233 p 1333 p1433 H 1533 G 1633 G 1733 G
N FSEC87 1 2 3
Figure 6-4 Examples of daily notes on the data-base tape
An example o f a segment of the measurement uncertainty file UNCERT CAL i s shown in Figure 6-5 The f i r s t l ine begins with a U followed by the serial number of the s pect rorad i ometer The upper and lower measurement uncertainty l imi t s are given in the co lumns fol lowing wavelength wi th the appropri a t e measur ement mode dat es and de script ion at the top o f the column The s econd l ine in each segment o f the DAT f i l e s is a pointer to the correct uncershytainty information in UNCERT CAL The broadband s o lar radiat i on and meteshyorolog ical instrument measurement uncertainty fol lows each spectra l measureshyment uncertainty segment in UNCERT CAL
The format o f thi s data ba se was es tabl i shed at SERI t o accommodat e expanded mul t i year long-term data collect ion Users can reformat the data t o suit their part icular needs We recommend the following s t eps for acce s s ing and document ing parti cular data set s
1 Se lect and extract the des ired spectral data from the DAT f i l e s us i ng in formation such as measurement mode day number t ime air mas s or a moshys pheric condi t ions depending on the de s i red attribut es
2 Ex trac t and review the corres ponding segment s of the qua l i ty-cont rol i n format i on from the QC f i l es
3 Ex trac t and review the corres pond ing field no tes from the NOTES f i l e s
4 5
+ I -
5 4
3 7
TR- 3 5 13A
U PRS - 1 0 2 L I -COR PRS - 1 0 2 i
1 2 3 4 5 Ill
Wav GHS GHS GHS GHS GTS GTS GTS GTS Kt gt 6 0 Kt gt 6 0 Kt gt 60 Kt gt 6 0 iacutel ower lower upper upper 2 8 7 - 8 8 7 -8 8 7 5 8 8 GNS GNS
upper upper lower l ower
+ 1 -
- GHS GHS GTS GTS Kt lt 60 Kt lt 6 0 upper uppe r l ower l ower + I - + I -2 8 7 - 8 8 7 -8 87 5 - 8 8
3 0 0 - 1 0 0 0 - 1 00 0 1 0 0 0 1 0 0 0 3 0 2 - 1 0 0 0 - 1 0 0 0 1 0 0 0 1 0 0 0
4 0 0 - 2 3 3 - 1 7 1 1 5 3 9 1 4 0 2 iacute -2 2 0 - 1 7 3 1 4 0 9 3
5 0 0 - 1 3 4 - 1 1 7 3 7 5 0 2 iacute - 1 3 3 - 1 1 7 5 3 3 7
6 0 0 - 1 1 8 - 1 1 1 3 8 3 1 6 0 2 - 1 1 9 - 1 1 1 3 9 3 1
7 0 0 - 1 1 5 - 1 0 7 3 5 2 7 7 0 2 - 1 1 3 - 1 0 7 3 3 2 7
8 0 0 - 1 1 6 - 1 0 6 3 6 2 6 8 0 2 - 11 7 - 1 0 6 3 7 2 6
9 0 0 - 1 1 2 - 1 0 5 3 2 2 5 9 0 2 - 1 1 4 - 1 0 8 3 4 2 8
1 0 0 0 - 1 1 7 - 1 0 8 2 8 1 0 0 2 - 1 1 8 - 1 0 8 3 8 2 8
1 1 0 0 - 1 2 9 - 12 2 4 9 4 2
Figure 6-5 Examples of spe ctral measurement uncertainty on the data-base tape A value of plusmn100 indi cates greater t han 100 measurement uncertainty
46
TR-35 13A
4 Extract the measurement uncertainty information from the 1 1 UNCERT f i l e s and quot e mea surement uncertainty for a l l data used
5 Examine the dai l y broadband and spec tral solar radiatio data graphs in the catalog ( Volume I I of thi s report [ 1 8 ] i f avai labl e These graphs provide informa t i on on atmo spheric condi t i ons during the day For exampl e Figure 4-3 shows dai l y broadband and spec tral plot s for part ly c loudy condi t i ons when s olar rad i a t i on i s changing rapidly throughout the day The sun i s obs cured when the direc t-normal values drop t o zero and the gl obal value s approach each o ther Figure 4-1 shows a clear daybull
No data should be used wi thout consult ing the qua l i ty-control informa t i on dai ly no tes and measurement uncertainty
4 7
Cel l s
Ce l l s
Energy
Meteorologi cal Society
Appl i ed Meteorol ogy
Energy
Radiat ion Topical Overview Solar Cel l s Vo l 1 8
of the Pho tovo l t a i c s and Insolat ion Mea sureshySolar Vol 1 8 1 986 pp 393-3 9 5
TR-35 1 3A
1 0 REFERENCES
1 Hul st rom R L Solar 1 986 PPbull 1 7 9- 1 8 7
2 Hul st rom R L A Summary ments Workshop Panel Resul t s
3 Hul strom R L Re sul t s of the Amorphous S i l i con Mea surement s Ta sk Force Solar Cel l s Vo l 18 1 986 pp 1 7 1-1 7 7
4 Hul strom R L and J M Ohi Resul t s of the SERI Mul t i junction Devi ce Efficiency Measurement Task Forc e pre sented at the 20th I EEE Photovo lshytaic Spec ial i s t s Conference September 1 988
5 Riordan c and R L Hul s t rom Summary of S tud i e s that Examine the Effec t s of Spect ral Solar Radition Vari at ions on PV Device Des ign and Pershyformance SERI-TR-2 15-343 7 Golden CO Solar Energy Research Ins t i tute 1989
6 Riordan c Joint EPRI-SERI Spectral Solar Rad i a t i on Database Pro j ec t
1
8
9
1 0
1 1
1 2
1 3
14
Solar Vol 2 1 1 98 7 pp 3 3 7-342
Riordan c D Myers M Rymes R Hul strom W Mar i on c Jenning s and c Whi taker Spectral Solar Radiat ion Data Bas e at SERI Solar Vol 42 No 1 1 989 PP bull 6 7-79
Riordan C J T L Stoffe l and R L Hul s trom The Effect s of Urban Air Pollut ion on Solar Radiat i on SERI-TR-2 15-3482 Golden CO Solar Energy Res arch I n s t i tute ( draft ) 1989
Riordan c and R Hul s t rom The SERI Re s ource As ses sment Project s Plan for Col l ect ing Spectral-Solar-I rradiance Data SERI -TR-21 5-2948 Gol den CO Solar Energy Re search Ins t i tut e 1986
Shaw G E Sun Pho tometry Bul letin Ameri can Vol 64 No 1 January 1983 pp 4-10
Iqbal M bull An Int roduction to Solar Radiation New York Academic Pre s s
1983
Bartel s R A Comment s on Prec ipi table Water Mea surement s with Sun Photometer s Journal of Cl imate and Vol 25 1 986 PP bull 1 788- 1 789
Leckner B The Spectral Distribution o f Solar Radiat ion at the Earth s Surface -- El ements of a Model Solar Vol 20 1 9 7 8 pp 143- 1 5 0
Cannon T W Spectral So lar Irradiance Instrumentat i on and Measurement Techniques Solar Cel l s Vol 1 8 1986 pp 2 3 3-24 1
48
Energy
Photogrammetric Engineering
TR 3 5 13A
1 5 Myers D R E s t imate s of Uncertainty for Measured Spec tra in the SERI Spectral Solar Radiat i on Data Base ac cepted by Solar 1 98 9
1 6 Myers D R E s t imates of Uncertainty for Measured Spectra in the SERI Spec tral Solar Radiat i on Data aa s e 11 SERI e_clmical Report Golden CO S o l ar Energy Res earch Ins t i tute ( draft ) 1989
middot
1 7 Hul s trom R L The Cl oud Bright Spo t 1 9 73 PP bull 3 7 0-3 7 6
18 Ri ordan c D Myer s and R Hul s t rom Spectral Scflar Raltfiation Data Base Documentat i on and User 1 s Manual Vo lume I I SERI-TR-2 15-3 5 1 3 Golden CO Solar Energy Re search Ins t i tut e 1989
49
TR- 3 5 1 3A
APPENDIX
QUALITY-CONTROL PROCESSING
Limi ted qua l i ty-control proces s ing wa s appl i ed to the data ba se as de s c r i bed below The resul t s are i n the QC f i l es on the data-base t ape by s i t e year and mont h For examp l e
FLA8705 QC i s FSEC 1 98 7 May PGE8 80 l QC i s PGampE 1 9 8 8 January SER8 7 l l QC i s SERI 1 98 7 November
These f i l e s correspond t o the 11 OAT f i les for the s ame s i t e year and month Each data segment that includes a spectrum wa s proces sed through thi s quali ty-control procedure I f the atmospheric cond i t i on s were uns tab l e and a spectrum was not acquired the broadband and meteorologi cal data were inc l uded on the data-base tape but no qua l i ty-contro l proc e s s ing wa s app l i ed
An example o f a segment of a 11 QC f i l e i s shown in F i gure 6-3 The f i r s t Q l ine beg ins wi th a fol l owed by the s i t e year day and t ime s tamp The
last columns give the number of l ines in the s egment so the user can skip to the next s egment Fo l l owing the f i r s t l ine are me s sages that were printed whenever the qua l i ty-control proce s s ing f lagged a suspect or poor value
Following the mes sages in an SO-character QC l ine l i s t ing the variables that were examined are one of three qua l i ty-control code s 1 good 2 marg inal or suspect and 3 mi s s ing or poor The QC l ine was prepared using an automa t i c ( computeri zed ) check of the variabl e s and manual edi t ing to include informashyt ion from correspondence l og sheet s and vi sual inspe ct i on Addi t i onal me sshysages were added above the QC l ine if appropriate
The two-charact er descriptors in the QC l ine are
DN Direct-normal ( thermopi l e ) solar radiat ion before the spectral s can DN Direct-normal ( thermopi l e ) so lar radiation after the spectra l scan SN Direct-normal ( s i l i c on ) before SN Direct-normal ( s i l i c on ) after GN Globa l-normal before GN Globa l-normal after GH Globa l -horizontal ( thermop i l e ) before
WS Wind Speed KT KKN K
t n
GH Global-hori zontal thermopil e ) after SH Global-hori zontal ( s i l i con ) before SH Global-hori zontal ( s i l icon ) after GT Global-t i l t before GT Gl obal- t i l t after AL Al bedo ( Wm ) AP Albedo ( ) PR Surface Pres sure TC Temperature ( deg C ) RH Relat ive Humi dity WV Water Vapor ( al culated from rel a t i ve humidity)
5 0
S- flllit = - ( middotmiddot middot
( e g Wm2 )
TR-3 5 1 3A
DG D GH SP F i r s t Sp qtrum I T Integral of t he F i r s t Spec t rum SP Second Spectrum IT I nt egral of the - Second SpecttUI11
The aut oma t i c tes t s that were performed to det ermine the QC code fol l owing each var iable were
( a ) Check for mi s s ing or negat ive values for the broadband solar radiashyt i on meteoro l og i cal or a tmo spheric dat a or the spec t ral integral s
lt 0 = Code 2 Mi s s ing ( - 9 or -9 9 ) = Code 3
( b ) Check for atmo spheric or broadband instrument instab i l i ty us ing the difference and rat i o o f the before- and aft er-scan values and redundant mea surement s if nei t her values are negat i ve or mi s s ing
DN before DN after if the abs lute d i fference SN before SN after i s gt10 Wm DN beforeSN before 5 of 200 DN before SN after and GH before GH after SH beforeSH after the rat io i s lt0 95 or gt1 05 each of the GH before SH before two var iables = GH afterSH after or middot GN beforeGN after the rat i o i s lt0 90 or gt1 10 each of the GT beforeGT after two var iable s = Code 3
Code 2
( c ) Check for DN gt GN or GN gt ETR ( extraterre s trial solar radiat i on ) us 1ng rat ios of the var iabl e s
DN before GN before gt0 95 each variable = Code 2 DN afterGN after gt 1 0 each var i able = Code 3 GN before ETR GN afterETR
( d ) Check for values o f Kt Kn and DGH tha t are too high
KT ( invo lves GH before and after and KT ) KN ( involves DN before and after and KN ) DG ( invo lves DN and GH before and after and DG )
gt0 9 5 each variable = Code 2 gt 1 0 each var iable = Code 3
( e ) Check the s pe c t ral integral s for unusual rat i o s to the corresponding broadband so lar radiat ion value
IT ( Broadband va lue before and after )
For d i rect s pe c t ra lt 0 6 or gt0 8 5 I T = Code 2 For gl obal s pe c t ra lt0 7 o r gt0 95 I T = Code 2
For d i rect and g l obal s pec t ra lt0 5 or gt l O IT = Code 3
5 1
TR-35 13A
We sugge s t that users of the data ba s e develop a computer program to acc e s s fields i n the Q C l ine and t o print the me s sages Thi s l imi ted qua l i ty cont rol wi l l not f lag a l l po s s ible errors and addi t i onal t e s t s should be applied depend ing on the users requi rement s and appl icat i on s
52
1 1 2
Document Control SEAl Report No
Page 4 Title and Subtitle
NTIS Accession No 3 Recipients Accession No SERI TR- 2 1 5-35 13A DE89009447
5 Publication Date
January 1990 Sp ectral Solar Radiation Data Base Documentation
6Vo lume I
7 Author(s) 8 Performing Organization Rept No
9 Performing Organization Name and Address 10 ProjectTaskWork Unit No
1 1 Contract (C) or Grant (G) No
(C)
(G)
1 2 Sponsoring Organization Name and Address 13 Type of Report amp Period Covered
Solar Energy Res ear ch Ins titute Technical Repor t 1 6 1 7 Col e Boulevard Golden Colorado 804 0 1-3393 1 4
1 5 Supplementary Notes
16 Abstract (Limit 200 words) The Solar Energy Research Ins titute ( SERI) Electric Power Research Ins titute Flor ida Solar Energy Center and Pacific Gas and Electric Company cooperated to produce a spec tral solar radiation data base representing a range of atmospheric conditions These data will help to characterize the natural variab ility in the spectral (color) content o f outdoor solar radiation so that the sensitivity of spec trally selective solar devices ( such as photovoltaics ) to these variations c n b e s tudied quant itatively Volume I o f this report documents the history approach content and format of the data base Volume II contains graphs and field no tes for each of the spectral data sets The data res ide on magnetic tape at SERI
1 7 Document Analysis
a Descriptors Spec tral solar radiation broadband solar radiation met eorological
data sp ectroradiometers
b IdentifiersOpen-Ended Terms
c UC Categories
233 234
18 Availabil ity Statement
National Technical Information U S Depar tment of Commerce 5 285 Port Royal Road Springfield Virginia 2 2 1 6 1
Service 19 No of Pages
60
20 Price
A04
Form No 0069 (6-30-87)
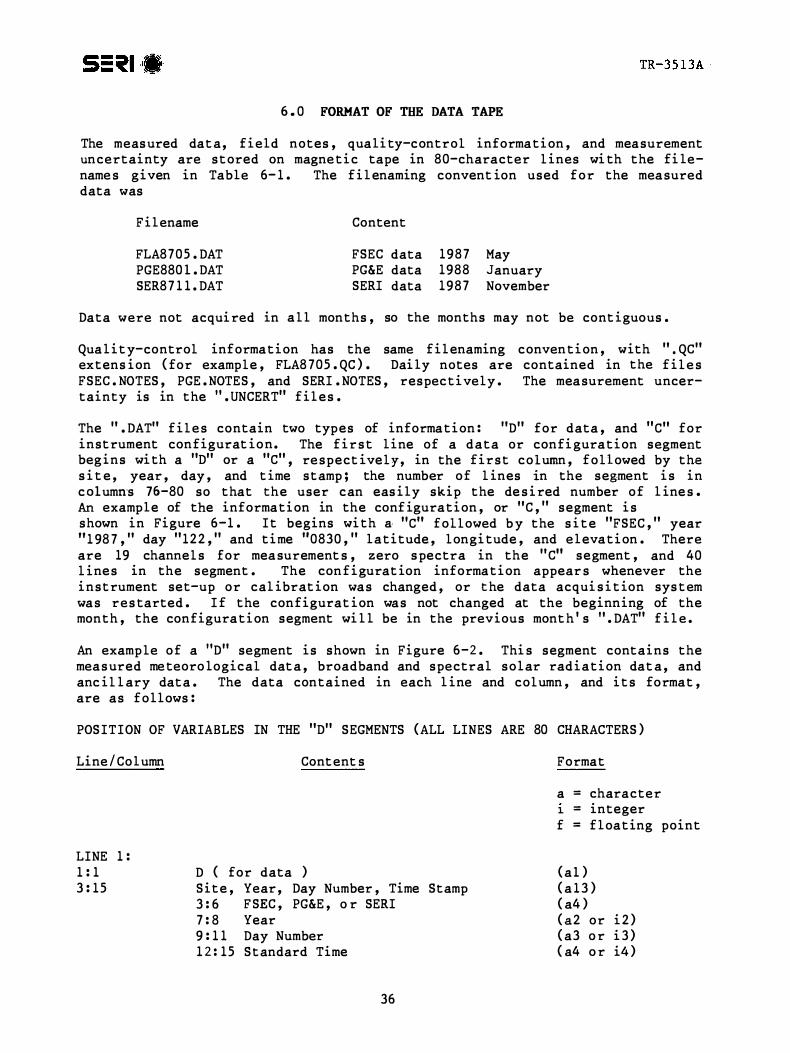
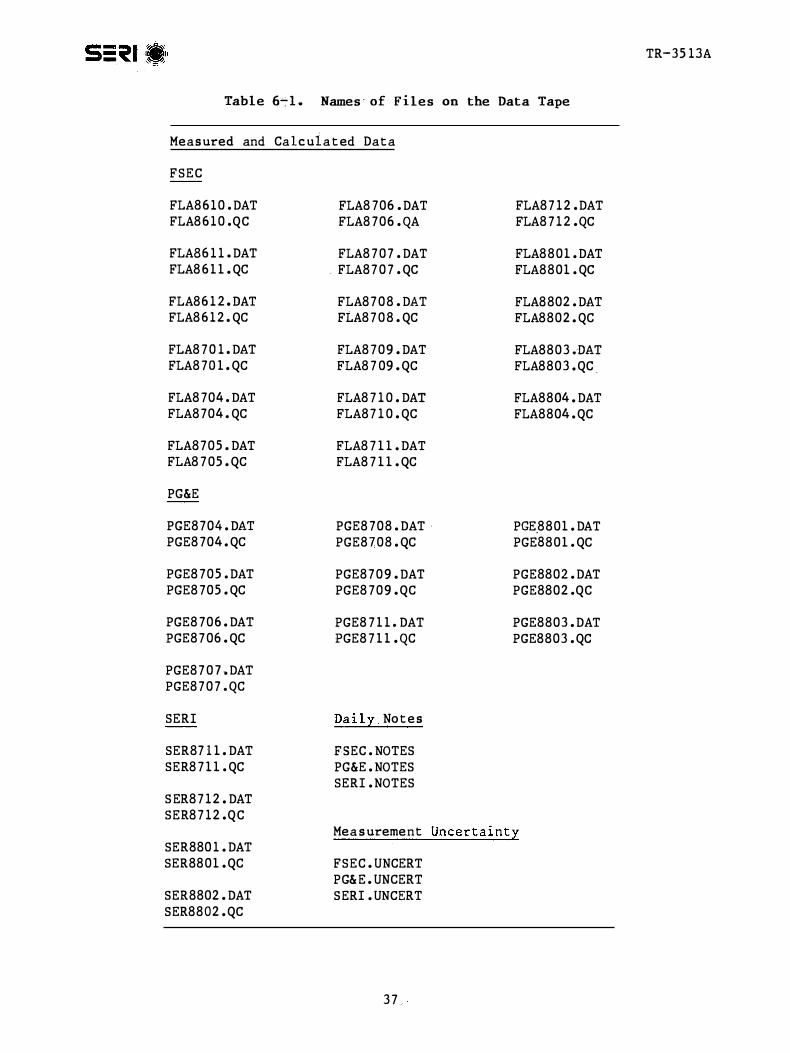
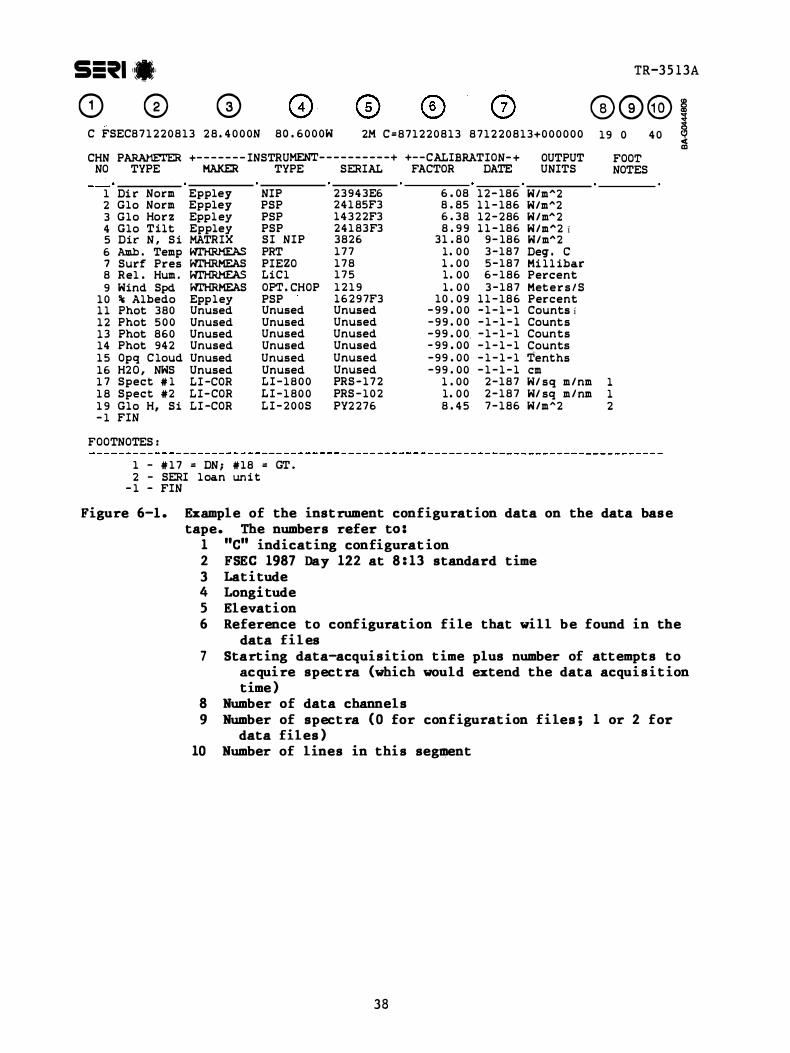
1 3
1 7
55 1 1-1 TR-3 5 1 3A
0 G) 0 G)G) iC FSEC8 7 1 2 2 0 8 1 3 2 8 4 0 0 0N 80 6 0 0 0W 2M C = 8 7 1 2 2 0 8 1 3 8 7 1 2 2 0 8 1 3+0 0 0 0 0 0 1 9 0 4 0
CHN PARAMETER +- - - - - - - INSTRUMENT- - - - - - - - - -+ +- -CALIBRATION- + OUTPUT FOOT NO TYPE MAKER TYPE SERIAL FACTOR DATE UNITS NOTES
1 Di r- Nor-m Eppley NIP 2 3 9 4 3E6 6 08 1 2 - 186 Wm2 2 Glo Nor-m Eppley PSP 2 4 1 85F3 8 85 l l - 186 Wm2 3 G l o Hor-z Eppl ey PSP l 4 3 2 2F3 6 3 8 1 2 - 2 86 Wm 2 4 Glo Tilt Eppley PSP 2 4 1 83F3 8 9 9 l l - 186 Wm2 iacute5 Dir- N S i MATRIX SI NIP 3826 31 8 0 9 - 186 Wm2 6 Amb Temp WTHRMEAS PRT 1 7 7 l 0 0 3 - 1 8 7 Deq c 7 Sur-f Pr-es WTHRMEAS PIEZO 1 7 8 l 0 0 5 - 1 8 7 Mi l l ibar-8 Re1 Hum WTHRMEAS LiCl 1 7 5 l 0 0 6 - 1 86 Per-cent 9 Wind Spd WTHRMEAS OPT CHOP 1 2 1 9 l 0 0 3 - 1 8 7 Met e r- s i S
1 0 Albedo Epp ley PSP l 6 2 9 7F3 1 0 0 9 l l - 1 8 6 Per-cent l l hot 380 Unused Unused Unused - 9 9 0 0 - 1 - l - 1 Counts iacute1 2 hot 5 0 0 Unused Unused Unused - 9 9 0 0 - 1 - l - l Count s
14 hot 860 Unused Unused Unused - 9 9 0 0 - 1 - 1 - 1 Counts hot 942 Unused Unused Unused - 9 9 0 0 - 1 - l - l Counts
1 5 Opq C loud Unused Unused Unused - 9 9 0 0 - 1 - l - l Tenths 1 6 H2 0 NWS Unused Unused Unused - 9 9 0 0 - 1 - l - l em
Spect l LI -COR L I - 1 8 0 0 PRS - 1 7 2 l 0 0 2 - 1 8 7 W sq m nm l Spect 2 L I - COR L I - 1 800 PRS - 1 0 2 1 0 0 2 - 1 8 71 8 W sq m nm l
1 9 Glo H Si LI -COR L I - 2 0 0S PY2 276 8 4 5 7 - 1 86 Wm2 2 - 1 FIN
FOOTNOTES
1 - 1 7 = DN 18 = GT 2 - SERI l oan un i t
- 1 - FIN
Figure 6-1 Example of the instrument configuration data on the data base tape The numbers refer tmiddotO
1 c indicating configuration 2 FSEC 1987 Day 122 at 8 13 standard time 3 Latitude 4 Longitude 5 Ele vation 6 Reference to configuration file that will be f ound in the
data files 7 Starting data-acquisition time plus number of attempts to
acquire spectra (which would extend the data acquisition time)
8 Number of data channels 9 Number of spectra ( 0 f or configuration files 1 or 2 f or
data files) 10 Number of lines in this segment
38
TR35 1 3A
D FSEC8 7 1 2 2 0 8 1 3 2 8 4 0 0 0N 8 0 6 00 0W 2M C=871 2 2 0 8 1 3 8 7 1 220 814+0 0 0 1 0 0 1 9 2 1 0 0 gS e e Q N FSEC8 7 1 2 2 U PRS - 1 7 2 Col 2 ( + - ) U PRS - 1 0 2 Col 2 ( - ) Col 4 ( + ) 1 7 84 5 5 7 54 5 2 9 3 0 2 - 1 - 9 9 0 3 48 0 1 1 9 48 3 3 4 4 2 7 9 - 1 -9 9 0 1 7 85 0 5 7 5 5 7 2 9 3 0 4 - 1 - 9 9 0 3 4 8 1 1 1 9 4 85 3 4 43 0 1 - 1 - 9 9 0 2 8 4 1 80 0
1 0 9 5 4 1 5 - 99 0 7 1 0 1 7 8 6 2 0 7 8 7 5 8 9 1 5 - 1 - 9 9 0 - 1 - 9 9 0 iacute1 1 3 80 0 - 99 0 Co 1 2 5 0 0 0 - 99 0 Co 1 3 860 0 - 99 0 Co 1 4 942 0 - 9 9 0 Co iacute
- 1 6 0 7 1 5 8 5 7 8 5 6 7 1 58 3 86 9 1 9 9 1 8 7 - 9 0 0 - 9 0 0 - 9 0 0 - 9 0 0 - 9 0 - 9 0 3 1 1 7 4 0 1 3 0 0 1 1 0 0 2 0 57 9 8 9 4 0 0 DNT1 8 4 0 1 3 0 0 1 1 0 0 2 0 2 8 4 1 8 0 0 6 2 4 GTS - 1 0 0 0 0 0 0 0 0 0 0 0 - 1 0 0 0 o o 0 0 0 0 o o
1 3 0 0 0 0 0 0 0 0 3 5 0 0 0 4 0 0 2 1 0 02 5 0 0 14 0 04 1 0 02 1 0 0 5 7 0 0 3 8 amp 1 3 2 0 0 0 7 2 0 056 0 1 0 1 0 0 8 1 0 1 1 8 0 1 2 1 0 1 1 9 0 140 0 138 0 1 3 1 amp 1 340 0 1 4 9 0 16 1 0 162 0 1 5 5 0 16 0 0 1 6 3 0 1 8 5 0 1 9 5 0 1 9 8 0 1 9 9 amp 1 360 0 2 0 9 0 2 1 9 0 228 0 2 4 3 0 258 0 26 5 0 258 0 265 0 268 0 2 89 amp 1 380 0 2 8 0 0 2 7 9 0 26 7 0 2 7 3 0 3 0 1 0 3 08 0 3 1 7 0 326 0 349 0 4 0 2 amp 1 4 0 0 0 4 7 6 0 52 7 0 55 7 0 569 0 580 0 5 9 5 0 6 12 0 63 0 0 64 1 0 648 amp 1 4 2 0 0 652 0 6 54 0 6 58 0 649 0 6 36 0 6 3 2 0 646 0 67 8 0 7 1 8 0 746 amp 1 440 0 7 6 8 0 7 9 9 0 82 2 0 854 0 8 7 7 0 9 0 4 0 9 1 5 0 92 2 0 934 0 94 2 amp 1 460 0 9 6 0 0 964 0 9 7 0 0 9 7 3 0 96 9 0 9 74 0 9 9 0 0 9 9 9 1 0 1 7 1 028 amp 1 4 8 0 1 0 3 3 1 0 25 1 0 0 6 0 9 9 1 0 9 9 0 1 0 1 0 1 026 1 0 3 8 1 043 1 0 4 7 amp 1 500 1 0 3 8 1 034 1 038 1 0 5 1 1 0 58 1 058 1 0 5 1 1 0 3 5 1 0 1 7 1 0 0 7 amp 1 520 1 0 2 0 1 04 1 1 0 5 7 1 063 1 068 1 0 8 1 1 088 1 0 9 3 1 0 9 3 1 0 9 1 amp 1 540 1 0 8 9 1 0 84 1 088 1 0 9 5 1 0 9 7 1 0 9 5 1 0 9 8 1 1 0 2 1 094 1 0 8 7 amp 1 560 1 0 7 8 1 0 7 9 1 08 1 1 0 7 7 1 0 7 2 1 0 7 1 1 0 7 6 1 0 7 8 1 0 7 8 1 0 82 amp 1 580 1 0 9 0 1 0 9 8 1 1 0 1 1 088 1 0 7 4 1 062 1 06 1 1 06 7 1 0 7 4 1 0 80 amp 1 6 0 0 1 082 1 085 1 08 8 1 0 9 2 1 0 9 3 1 0 89 1 083 1 0 7 8 1 0 78 1 0 7 9 amp 1 620 1 0 8 2 1 083 1 0 7 6 1 065 1 0 5 9 1 056 1 06 1 1 0 7 3 1 0 8 0 1 085 amp 1 640 1 0 86 1 084 1 08 1 1 0 7 6 1 067 1 062 1 0 5 2 1 04 2 1 038 1 048 amp 1 660 1 0 7 0 1 086 1 0 9 4 1 0 9 7 1 0 96 1 096 1 09 2 1 0 9 3 1 0 9 1 1 0 89 amp 1 680 1 0 7 9 1 064 1 02 8 0 9 8 0 0 94 3 0 9 3 7 0 954 0 98 0 0 9 9 6 1 0 0 5 amp 1 7 0 0 1 0 0 8 1 0 0 9 1 0 1 3 1 0 1 9 1 0 2 5 1 0 2 2 1 0 0 3 0 9 7 3 0 924 0 8 74 amp 1 7 2 0 0 846 0 842 0 84 8 0 84 9 0 8 54 0 8 7 8 0 9 0 3 0 9 3 1 0 9 52 0 965 amp 1 740 0 9 6 9 0 9 7 7 0 98 3 0 989 0 988 0 9 8 2 0 9 7 6 0 95 0 0 8 81 0 7 6 7 amp 1 760 0 6 1 6 0 5 24 0 54 0 0 646 0 7 7 9 0 8 76 0 924 0 94 5 0 94 7 0 9 45 amp 1 7 8 0 0 94 2 0 94 2 0 9 3 7 0 9 2 6 0 9 1 6 0 9 0 7 0 89 9 0 894 0 8 9 1 0 89 0 amp 1 800 0 888 0 883 0 8 7 9 0 87 5 0 863 0 836 0 8 0 1 0 7 5 7 0 7 2 2 0 7 1 0 amp 1 820 0 7 1 0 0 7 1 9 0 7 3 3 0 74 1 0 7 4 9 0 7 5 7 0 76 3 0 7 7 7 0 7 9 7 0 8 1 0 amp 1 840 0 82 0 0 82 8 0 82 7 0 82 2 0 8 1 5 0 7 9 7 0 786 0 7 83 0 7 8 8 0 7 9 7 amp 1 860 0 80 4 0 8 0 0 0 7 8 8 0 7 8 0 0 7 7 5 0 7 8 0 0 7 8 7 0 786 0 785 0 7 81 amp 1 880 0 7 7 5 0 7 7 4 0 7 7 2 0 767 0 763 0 7 4 7 0 72 1 0 68 2 0 6 30 0 5 88 amp 1 9 0 0 0 57 1 0 5 7 3 0 58 9 0 584 0 568 0 549 0 53 4 0 53 3 0 5 38 0 5 56 amp 1 9 2 0 0 5 7 3 0 57 9 0 56 7 0 526 0 448 0 362 0 2 7 2 0 2 18 0 2 1 0 0 2 32 amp 1 940 0 254 0 262 0 2 5 7 0 253 0 25 7 0 266 0 2 7 5 0 2 85 0 29 9 0 3 1 7 amp 1 960 0 3 33 0 362 0 3 9 6 0 4 3 5 0 4 7 9 0 5 06 0 5 1 5 0 5 1 2 0 5 08 0 5 2 1 amp 1 9 8 0 0 53 7 0 560 0 5 84 0 5 9 7 0 6 0 9 0 6 1 7 0 6 1 8 0 6 2 3 0 62 1 0 6 1 9 amp 1 1 0 0 0 0 6 1 8 0 6 0 7 0 6 0 5 0 6 0 2 0 60 1 0 60 5 0 6 04 0 604 0 604 0 6 0 1 amp 1 1 0 2 0 0 60 1 0 59 5 0 5 9 5 0 5 93 0 589 0 59 0 0 584 0 5 82 0 580 0 5 75 amp 1 1 0 4 0 0 5 7 6 0 5 7 1 0 57 1 0 56 7 0 56 0 0 56 0 0 558 0 552 0 545 0 54 0 amp 1 1 0 6 0 0 5 36 0 53 2 0 5 2 9 0 5 2 5 0 5 1 9 0 5 1 5 0 5 1 2 0 51 1 0 50 9 0 5 08 amp 1 1 0 8 0 0 50 6 0 502 0 4 9 2 0 48 3 0 48 3 0 483 0 46 9 middot 0 4 5 2 0 447 0 3 1 amp 1 1 1 0 0 0 4 1 1 - 9 9 0 0 0 - 9 9 0 0 0 - 9 9 0 0 0 - 9 9 0 0 0 - 9 9 0 0 0 - 9 9 0 0 0 - 9 9 00 0 - 1 582 3 2 2 3 0 0 0 0 0 6 0 0 0 1 0 0 0 4 0 0 1 3 0 0 1 9 0 0 2 3 0 04 1 0 0 5 5 0 064 0 088 amp 2 3 2 0 0 1 0 5 0 1 3 9 0 1 7 9 0 1 8 9 0 2 2 4 0 2 38 0 26 2 0 252 0 261 0 2 64 amp 2 340 0 2 8 7 0 2 9 2 0 266 0 2 88 0 2 98 0 286 0 3 0 0 0 3 0 0 0 2 9 1 0 2 85 amp 2 360 0 296 0 3 1 0 0 3 36 0 367 0 3 9 0 0 3 7 2 0 3 56 0 356 0 3 7 3 0 3 88 amp
Figur e 6-2 Examples of the data on the data-base tape
3 9
TR-3 5 1 3A
16 2 3 24 24 2S 3 3 34 34 3S 3 9 40 40 4 1 S 2 S4 69
54 62
6 3 6 3
6 7 6 7
7 0 7 3
74 7 S
7 6 80
LINE 2
LINE 3
1 3 4 10
1 1 1 3 14 20 2 1 23 24 30 3 1 40 4 1 43 44 SO 5 1 5 3 54 60
Lat i tude ( deg ) N ( north) Longi t ude ( deg ) W ( we s t ) `Elevat i on (m) M (m) Reference t o Conf i guration Segment Start ing year day t ime for the spectral `scan s ) i f any and number of attempt s t o `acquire the s can ( which ind i cates po s s ible `t ime delay from the s tart ing t ime ) middot
Year Day Number Time
11+11 for plus number of attempt s to acquire a s pect rum
Number o f attempt s t o acquire a s pectrum
Po s s ible Number o f Measurement s ( 1 9 )
Number o f Spec tra i n thi s Segment ( 0 1 or 2 )
Number o f Lines in Segment
Pointer to the qua l i ty-cont rol dai ly f i e ld note s and measurement uncertainty informa t ion Qua l i ty-control informa t i on is in the QC f i l e of the same month wi th the same s i t e year day and t ime s t amp Dai l y field notes are i n the NOTES f i l e f o r the same s i t e wi th the same s i t e year and day s tamp Mea surement uncertainty i s in the f i l e s UNCERT under t h e instrument serial number ident i f i ed by PRS-xxx and the column s in the uncertainty f i le s for + and - uncertainty l imi t s
Broadband mea surement s before the spectral scan
Channel fH Direct Normal ( thermopi l e ) (Wm2 ) Channel ffoS Direct Normal ( s i l i con) (Wm2 ) Channel tn Global Normal ( Wm2 ) Channel not used Charinel ffo3 Globa l Hori zontal ( thermop i l e ) ( Wm2 ) Channel fH 9 Gl obal Horizontal ( s i l icon ) ( Wm2 )
( f 8 4 ) ( a 1 ) ( f 9 4 ) ( a l ) ( i S ) ( a l ) ( a l 2 )
( a9 o r i 9 )
( a 1 )
( i 1 )
( i4 )
( i 2 )
( i S )
( a8 0 )
( i 3 ) ( pound 7 2 ) ( i 3 ) ( pound 7 2 ) ( i 3 ) ( f 7 2 )
( i 3 ) ( pound 7 2 ) ( i 3 ) ( pound 7 2 )
40
TR-35 3A
6 1 6 3 64 7 0 7 1 80
LINE 4
LINE 5
1 6
7 1 2
1 3 80
LINE 6
1 3 4 1 0
1 1 1 3 1 4 20 2 1 23 24 3 0
3 1 3 3 34 40 4 1 43 44 5 0 5 1 5 3 5 4 6 0 6 1 6 3 64 7 0 7 1 7 3 7 4 8 0
LINE 7
LINE 8
1 5
6 1 2
Channe l 114 Gl obal Ti l t (Wm2 ) hellipChannel not used
Broad band mea suremen t s a f t e r t h e s p e c t ral s can same format a s beforeshy scan ( LINE 3 )
T i l t o f the f ixed- t i l t i n s t rument s hellipf rom the hor i z ont a l ( d eg )
Az i muth of the f i xed-t i l t ins t rumen t s ( de g ) ( 1 8 0 deg = s outh)
De s c r i p t i on o f any s pec i al i n s t rument ( fo r example d i ffu s e-hori zont a l mea s uremen t s a t SERI )
Channe l IFlOAl bedo (Wm2 ) hellipChannel IH5C l oud Cover ( t enths ) Channel fF7 Surface Pres sure ( mb ) Mea s ured at FSEC and PGampE c a l c u l ated from e l eva t i on a t S ERI [ 1 1 p 1 0 0 ]
Channel 116 Amb i en t Temperature ( deg C ) Channel fiB Rel a t i ve Humi d i t y ( ) Channe l ffo9 Wind S peed ( m s ) Add i t i onal channe l des cri bed 1n l i ne 5 Va l ue Add i t i onal channel descri bed 1n l ine 5 Va l u e
Sun Pho t ometer read ings ( only recorded for SERI dat a not u s ed except for re l a t i ve c ompar i s on s ) hellip
Earth-S un d i s tance c orrec t i on ( d e v i a t i on from 1 0 ) hellip
Ext ra t erre s t r i a l Rad i a t i on (Wm2 ) hellip
( i 3 ) ( pound 7 2 )
( f 6 1 )
( f 6 1 )
( a 8 8 )
( i 3 ) ( 7 1 ) ( i 3 ) ( 7 1 ) ( i 3 ) ( f 7 1 )
( i 3 ) ( pound 7 1 ) ( i 3 ) ( pound 7 1 ) ( i 3 ) ( pound 7 1 ) ( i 3 ) ( variabl e ) ( i 3 ) ( variabl e )
( f5 2 )
( f 7 1 )
4 1
9
42
TR-3S l 3A
1 3 1 8
1 9 24
25 30
3 1 36
3742
43 48
49 68
69 72
13 76
1780
LINE
I
3 6
7 1 1 1216 1 7 20 21 25
2631
3236
3839
40 40
41 42
43 46
Zen i t h Angl e ( deg ) ( f6 2 )
Kt ( ra t i o calculated from ( f6 1 ) thermo p i l e inst rument s )
Kn ( rat i o calculated from ( f6 1 ) thermo p i l e instrument s )
D GH ( ra t i o cal culated from thermopile instrument s ) ( f6 1 )
Albedo ( ) ( f6 1 )
Ai r Mas s ( f6 2 )
Res erved for Turbidi ty i f calculated
Precipi table Water Vapor i f calculated from sun photomet er
Precipi table Water Vapor from the ( f4 1 ) Nat ional Weather Servi ce
Prec i p i table Water Vapor Cal culated from Relative Humid i t y ( f4 1 )
Channel H7 Number o f Wave l engths Recorded by Spect roradi ometer 1
Beginning Wavelength ( nm ) Ending Wavel ength (nm) Wavelength Step Size (nm ) Spectroradi ometer 1 Ti l t from the Horizontal ( deg )
Spectroradiometer 1 Azimuth ( deg )
Angle o f Incidence o f the Direct Beam on Spectroradi ometer 1 ( deg )
Measurement Type ( DN GN GH GT DF )
Attachment ( Tef lon Dome D Integrat ing Sphere S View- l imit ing Tube T )
Channel H8 Number o f Wavel engths Recorded by Spectroradi ometer 2
( i2 )
( i4 )
( i S ) ( i S ) ( f4 1 )
( fS l )
( f6 1 )
( fS 1 )
( a2 )
( a l )
( i 2 )
(i4)
TR-3S l3A
4 7 S l Beginning Wavel ength (nm ) ( i S )
S 2 S 6` Ending Wavel ength ( nm ) ( i S )
S 7 60 Wavelength Step S i z e ( nm ) ( f4 bull 1 )
6 1 6S Spec troradi ometer 1 T i l t from the Hori zontal ( deg ) ( fS l )
6 6 7 1 ` Spect roradi ometer 2 Az imuth ( deg ) ( f6 1 )
7 2 76` Angle of Incidence o f the Direct Beam on Spect rorad i ometer 2 ( deg ) ( fS l )
7 8 7 9 Mea surement Type ( DN GN GH GT DF ) ( a2 )
8 0 80 At tachment ( Teflon Dome D Integrat ing Sphere s View-l imi t ing Tube T ) ( al )
LINE 10 Saved f o r extra spectroradi ometers i f needed
I f no spec tral data were recorded the number of l ines in the D s egment i s 1 0 the number of spectra i s 0 and there i s no corre sponding qual i ty-control information for thi s dat e t ime in the QC f i l e s No qual i ty c ontrol wa s performed because the atmo sphere was uns table I f the number o f spectra i s 1 there are 60 l ines in the D s egment i f there are two spectra t he number o f l ines i s 100
I f middot the number of spectra i s 1 or 2 the spectral data fol low after the f i r s t 1 0 l i nes o f the D segment There are 1 0 spectral measurement s per l ine wi th the number in the lef t-mo s t column indicat ing the f i r s t or second specshyt roradiometer ( 1 or 2 ) f o l l owed by the s tart ing wavelength ( in nanometers ) and t he 10 spectral mea surements ( in Wm2-nm) The 1 0 measurement s are at wave l ength inc rements of 2 nm There are 401 spect ral mea surement s from 300 t o 1 1 0 0 nm in 2-nm s teps with 10 measurement s per line for 40 l ine s and one measurement in the 4 1 s t l ine The l a s t number in the 4 1 s t l ine i s the specshytral integral I f a second s pectrorad i ometer wa s used the next 4 1 l ines folshylow t he same format Blank 1 ines follow the spec tral data t o f i l l the D segment to 60 or 100 l ines
An example of a QC f i l e i s shown in Figure 6-3 The f i r s t l ine o f each segment begins with a Q f o l l owed by the s i t e year day number and t ime s tamp with the number of l ines in the segment given in the l a s t col umn s o f the l ine Following the iden t i fier are me s sage s about var iables that were flagged by the automat i c qua l i ty-control proc e s s ing ( s ee appendi x ) noted by an operator at the measurement s i t e or noted dur ing inspec t i on at SERI The l a s t l ine of the segment shows the QC code for as DN ( direct normal thermopile detect o r ) SN ( d i rect normal detector ) AL
var iabl e s such s i l i con
( a lbedo ) and SP ( s pectrum) a s de s c r i bed in the appendi x Three qual i tyshycontrol code s ar8 used 1 = good 2 = suspec t see me s sages and dai ly not e s and 3 = poor or mi s s ing see me s s ages and da i l y no te s The broadband codes ( DN SN GN GH SH and GT ) have two value s the f i r s t is the before- scan measurement and the second is the after-s can mea surement
4 3
TR-35 13A
Q FSEC87 1 2 1 0 7 3 1 4 Noise in GH spectrum in UV QCDN1DN1SN1SN1GN1GN1GH1GH1SH1SH1GT1GT1AL1AP1PR1TC1RH1WV1WS1KT1KN1DG1SPl iN1SP2IN2
Q FSEC8 7 1 2 1 0 8 3 0 8 SN bef SN af t = 1 0 5 5 S H bef SH aft = 1 0 5 3 2nd Int BB b e f = 0 636 2nd Int BB aft = 0 6 5 1 Noise in GH spectrum i n UV QCDN1DN1SN2SN2GN1GN1GH1GH1SH2SH2GT1GT1AL1AP1PR1TC1RH1WV1WS1KT1KN1DG1SP1 IN1SP2IN2
Q FSEC8 7 1 2 1 1 0 3 1 3 QCDN1DN1SN1SN1GN1GN1GH1GH1SH1SH1GT1GT1AL1AP1PR1TC1RH1WV1WS1KT1KN1DG1SP1 IN1SPl iNl iacute
Q FSEC87 1 2 1 1 1 3 1 3 QCDN1DN1SN1 SN1GN1GN1GH1GH1SH1SH1GT1GT1AL 1AP1PR1TC1RH1WV1WS1KT1KH1DG1SP 1 IN1SP1 IN1
Q FSEC8 7 1 2 1 1 2 3 1 3 QCDN1DN 1SN1SN1GN1GN1GH1GH1SH1SH1GT1GT1AL1AP1PR1TC1RH1WV1WS1KT1KN1DG1 SP1 IN1SP 1 IN1
Q FSEC8 7 1 2 1 1 3 3 1 3 QCDN1DN1SNlSNlGNlGN1GH1GH1SH1SH1GTlGTlALlAPlPRlTClRHlWVlWSlKTlKNlDGlSP l iNlSPliNl
Q FSEC8 7 1 2 1 1 4 3 1 3QCDNlDNlSNlSNlGNlGNlGHlGHlSHlSHlGTlGTlALlAPlPRlTClRHlHVlHSlKTlKNlDGlSPl iN1SP1IN1 Q FSECB7 1 2 1 1 554 3 QCDNlDNlSNlSNlGNlGNlGHlGHlSHlSHlGTlGTlALlAPlPRlTClRHlWV1WSlKT1KN1DG1SP 1 IN1SP l iN1
Q FSEC8 7 1 2 1 16 3 0 3 QCDNlDNlSNlSNlGNlGNlGHlGHlSHlSHlGTlGTlALlAPlPRlTC1RH1WV1WSlKTlKNlDG1SP l iNlSPl iNl
Q FSECB 7 1 2 1 1 7 3 1 5 GH bef SH bef = 0 9 3 1 GH aft SH af t = 0 9 3 3 QCDN1DN1SN1SN1GN1GNlGH2GH2SH2SH2GTlGT1ALlAPlPRlTClRHlWVlWSlKTlKNlDGlSPl iNlSPl iNl
Q FSECB 7 1 2 2 0 7 3 1 3 QCDNlDNlSNlSNlGNlGNlGHlGHlSHlSHlGT1GTlALlAPlPRlTClRHlWVlWS 1KT1KNlDGlSP l iNlSPl iNl
Figure 6-3 Example of quali ty-control inf ormation on the data- base tape
Figure 6-4 shows an exampl e of a segment of the daily notes from the FSEC NOTES f i l e Each segment of the f i l e beg ins wi th an followed b y the s i t e year and day number s t amp with the number of l ines in the segment given in the last columns of the l i ne The next l ine contains the s i te operashytor log sheet number month day year day number spectroradi ometer serial number( s ) and mea surement mode( s ) The PGampE and SERI not e s do not include the dai ly l og sheet number The f i rst two l ines are followed by f i eld no te s No tes that were added after inspec t i on at SERI are s eparat d from the operator notes wi th ------- The exi s tence of s l ides or photographs i s ind i cat ed a s wel l a s their qua l i ty i e good ( G ) marginal ( M ) or poor ( P ) In the exampl e in thi s f i gure there were two log sheets for thi s day (number 1 1 6 and 1 1 7 ) because the mea surement mode changed from gl obal hor i z onshytal ( GH ) to global t i l t ( GT )
44
TR-3513A
N FSEC87 1 2 2 1 1 6 0 5 0 2 8 7 1 2 2 1 7 2 DN 1 0 2 GH Clear at 0 7 3 0 GH f o r f ir s t two s cans then GT S l i de s 0 6 3 2 G
0 7 3 3 G 0 8 3 3 G 0 9 3 3 H ( dark ) 1 0 3 3 p1 1 3 3 p1 2 3 3 p 1 3 3 3 p1433 H 1 5 3 3 G 1633 G 1733 G
1 1 7 0 5 0 2 87 1 2 2 1 7 2 DN 1 0 2 GT GT s tart ing at 0 8 0 0 iacuteC lear a t 0 8 0 0 iacuteS l ides S e e above
16 1 1 8 0 5 0 3 8 7 1 2 3 1 7 2 DN 1 0 2 GT Clear at 0830 S l i de s 0633 G
0733 G 0833 G 0933 H ( dark ) 1 0 3 3 p1 1 3 3 p 1233 p 1333 p1433 H 1533 G 1633 G 1733 G
N FSEC87 1 2 3
Figure 6-4 Examples of daily notes on the data-base tape
An example o f a segment of the measurement uncertainty file UNCERT CAL i s shown in Figure 6-5 The f i r s t l ine begins with a U followed by the serial number of the s pect rorad i ometer The upper and lower measurement uncertainty l imi t s are given in the co lumns fol lowing wavelength wi th the appropri a t e measur ement mode dat es and de script ion at the top o f the column The s econd l ine in each segment o f the DAT f i l e s is a pointer to the correct uncershytainty information in UNCERT CAL The broadband s o lar radiat i on and meteshyorolog ical instrument measurement uncertainty fol lows each spectra l measureshyment uncertainty segment in UNCERT CAL
The format o f thi s data ba se was es tabl i shed at SERI t o accommodat e expanded mul t i year long-term data collect ion Users can reformat the data t o suit their part icular needs We recommend the following s t eps for acce s s ing and document ing parti cular data set s
1 Se lect and extract the des ired spectral data from the DAT f i l e s us i ng in formation such as measurement mode day number t ime air mas s or a moshys pheric condi t ions depending on the de s i red attribut es
2 Ex trac t and review the corres ponding segment s of the qua l i ty-cont rol i n format i on from the QC f i l es
3 Ex trac t and review the corres pond ing field no tes from the NOTES f i l e s
4 5
+ I -
5 4
3 7
TR- 3 5 13A
U PRS - 1 0 2 L I -COR PRS - 1 0 2 i
1 2 3 4 5 Ill
Wav GHS GHS GHS GHS GTS GTS GTS GTS Kt gt 6 0 Kt gt 6 0 Kt gt 60 Kt gt 6 0 iacutel ower lower upper upper 2 8 7 - 8 8 7 -8 8 7 5 8 8 GNS GNS
upper upper lower l ower
+ 1 -
- GHS GHS GTS GTS Kt lt 60 Kt lt 6 0 upper uppe r l ower l ower + I - + I -2 8 7 - 8 8 7 -8 87 5 - 8 8
3 0 0 - 1 0 0 0 - 1 00 0 1 0 0 0 1 0 0 0 3 0 2 - 1 0 0 0 - 1 0 0 0 1 0 0 0 1 0 0 0
4 0 0 - 2 3 3 - 1 7 1 1 5 3 9 1 4 0 2 iacute -2 2 0 - 1 7 3 1 4 0 9 3
5 0 0 - 1 3 4 - 1 1 7 3 7 5 0 2 iacute - 1 3 3 - 1 1 7 5 3 3 7
6 0 0 - 1 1 8 - 1 1 1 3 8 3 1 6 0 2 - 1 1 9 - 1 1 1 3 9 3 1
7 0 0 - 1 1 5 - 1 0 7 3 5 2 7 7 0 2 - 1 1 3 - 1 0 7 3 3 2 7
8 0 0 - 1 1 6 - 1 0 6 3 6 2 6 8 0 2 - 11 7 - 1 0 6 3 7 2 6
9 0 0 - 1 1 2 - 1 0 5 3 2 2 5 9 0 2 - 1 1 4 - 1 0 8 3 4 2 8
1 0 0 0 - 1 1 7 - 1 0 8 2 8 1 0 0 2 - 1 1 8 - 1 0 8 3 8 2 8
1 1 0 0 - 1 2 9 - 12 2 4 9 4 2
Figure 6-5 Examples of spe ctral measurement uncertainty on the data-base tape A value of plusmn100 indi cates greater t han 100 measurement uncertainty
46
TR-35 13A
4 Extract the measurement uncertainty information from the 1 1 UNCERT f i l e s and quot e mea surement uncertainty for a l l data used
5 Examine the dai l y broadband and spec tral solar radiatio data graphs in the catalog ( Volume I I of thi s report [ 1 8 ] i f avai labl e These graphs provide informa t i on on atmo spheric condi t i ons during the day For exampl e Figure 4-3 shows dai l y broadband and spec tral plot s for part ly c loudy condi t i ons when s olar rad i a t i on i s changing rapidly throughout the day The sun i s obs cured when the direc t-normal values drop t o zero and the gl obal value s approach each o ther Figure 4-1 shows a clear daybull
No data should be used wi thout consult ing the qua l i ty-control informa t i on dai ly no tes and measurement uncertainty
4 7
Cel l s
Ce l l s
Energy
Meteorologi cal Society
Appl i ed Meteorol ogy
Energy
Radiat ion Topical Overview Solar Cel l s Vo l 1 8
of the Pho tovo l t a i c s and Insolat ion Mea sureshySolar Vol 1 8 1 986 pp 393-3 9 5
TR-35 1 3A
1 0 REFERENCES
1 Hul st rom R L Solar 1 986 PPbull 1 7 9- 1 8 7
2 Hul st rom R L A Summary ments Workshop Panel Resul t s
3 Hul strom R L Re sul t s of the Amorphous S i l i con Mea surement s Ta sk Force Solar Cel l s Vo l 18 1 986 pp 1 7 1-1 7 7
4 Hul strom R L and J M Ohi Resul t s of the SERI Mul t i junction Devi ce Efficiency Measurement Task Forc e pre sented at the 20th I EEE Photovo lshytaic Spec ial i s t s Conference September 1 988
5 Riordan c and R L Hul s t rom Summary of S tud i e s that Examine the Effec t s of Spect ral Solar Radition Vari at ions on PV Device Des ign and Pershyformance SERI-TR-2 15-343 7 Golden CO Solar Energy Research Ins t i tute 1989
6 Riordan c Joint EPRI-SERI Spectral Solar Rad i a t i on Database Pro j ec t
1
8
9
1 0
1 1
1 2
1 3
14
Solar Vol 2 1 1 98 7 pp 3 3 7-342
Riordan c D Myers M Rymes R Hul strom W Mar i on c Jenning s and c Whi taker Spectral Solar Radiat ion Data Bas e at SERI Solar Vol 42 No 1 1 989 PP bull 6 7-79
Riordan C J T L Stoffe l and R L Hul s trom The Effect s of Urban Air Pollut ion on Solar Radiat i on SERI-TR-2 15-3482 Golden CO Solar Energy Res arch I n s t i tute ( draft ) 1989
Riordan c and R Hul s t rom The SERI Re s ource As ses sment Project s Plan for Col l ect ing Spectral-Solar-I rradiance Data SERI -TR-21 5-2948 Gol den CO Solar Energy Re search Ins t i tut e 1986
Shaw G E Sun Pho tometry Bul letin Ameri can Vol 64 No 1 January 1983 pp 4-10
Iqbal M bull An Int roduction to Solar Radiation New York Academic Pre s s
1983
Bartel s R A Comment s on Prec ipi table Water Mea surement s with Sun Photometer s Journal of Cl imate and Vol 25 1 986 PP bull 1 788- 1 789
Leckner B The Spectral Distribution o f Solar Radiat ion at the Earth s Surface -- El ements of a Model Solar Vol 20 1 9 7 8 pp 143- 1 5 0
Cannon T W Spectral So lar Irradiance Instrumentat i on and Measurement Techniques Solar Cel l s Vol 1 8 1986 pp 2 3 3-24 1
48
Energy
Photogrammetric Engineering
TR 3 5 13A
1 5 Myers D R E s t imate s of Uncertainty for Measured Spec tra in the SERI Spectral Solar Radiat i on Data Base ac cepted by Solar 1 98 9
1 6 Myers D R E s t imates of Uncertainty for Measured Spectra in the SERI Spec tral Solar Radiat i on Data aa s e 11 SERI e_clmical Report Golden CO S o l ar Energy Res earch Ins t i tute ( draft ) 1989
middot
1 7 Hul s trom R L The Cl oud Bright Spo t 1 9 73 PP bull 3 7 0-3 7 6
18 Ri ordan c D Myer s and R Hul s t rom Spectral Scflar Raltfiation Data Base Documentat i on and User 1 s Manual Vo lume I I SERI-TR-2 15-3 5 1 3 Golden CO Solar Energy Re search Ins t i tut e 1989
49
TR- 3 5 1 3A
APPENDIX
QUALITY-CONTROL PROCESSING
Limi ted qua l i ty-control proces s ing wa s appl i ed to the data ba se as de s c r i bed below The resul t s are i n the QC f i l es on the data-base t ape by s i t e year and mont h For examp l e
FLA8705 QC i s FSEC 1 98 7 May PGE8 80 l QC i s PGampE 1 9 8 8 January SER8 7 l l QC i s SERI 1 98 7 November
These f i l e s correspond t o the 11 OAT f i les for the s ame s i t e year and month Each data segment that includes a spectrum wa s proces sed through thi s quali ty-control procedure I f the atmospheric cond i t i on s were uns tab l e and a spectrum was not acquired the broadband and meteorologi cal data were inc l uded on the data-base tape but no qua l i ty-contro l proc e s s ing wa s app l i ed
An example o f a segment of a 11 QC f i l e i s shown in F i gure 6-3 The f i r s t Q l ine beg ins wi th a fol l owed by the s i t e year day and t ime s tamp The
last columns give the number of l ines in the s egment so the user can skip to the next s egment Fo l l owing the f i r s t l ine are me s sages that were printed whenever the qua l i ty-control proce s s ing f lagged a suspect or poor value
Following the mes sages in an SO-character QC l ine l i s t ing the variables that were examined are one of three qua l i ty-control code s 1 good 2 marg inal or suspect and 3 mi s s ing or poor The QC l ine was prepared using an automa t i c ( computeri zed ) check of the variabl e s and manual edi t ing to include informashyt ion from correspondence l og sheet s and vi sual inspe ct i on Addi t i onal me sshysages were added above the QC l ine if appropriate
The two-charact er descriptors in the QC l ine are
DN Direct-normal ( thermopi l e ) solar radiat ion before the spectral s can DN Direct-normal ( thermopi l e ) so lar radiation after the spectra l scan SN Direct-normal ( s i l i c on ) before SN Direct-normal ( s i l i c on ) after GN Globa l-normal before GN Globa l-normal after GH Globa l -horizontal ( thermop i l e ) before
WS Wind Speed KT KKN K
t n
GH Global-hori zontal thermopil e ) after SH Global-hori zontal ( s i l i con ) before SH Global-hori zontal ( s i l icon ) after GT Global-t i l t before GT Gl obal- t i l t after AL Al bedo ( Wm ) AP Albedo ( ) PR Surface Pres sure TC Temperature ( deg C ) RH Relat ive Humi dity WV Water Vapor ( al culated from rel a t i ve humidity)
5 0
S- flllit = - ( middotmiddot middot
( e g Wm2 )
TR-3 5 1 3A
DG D GH SP F i r s t Sp qtrum I T Integral of t he F i r s t Spec t rum SP Second Spectrum IT I nt egral of the - Second SpecttUI11
The aut oma t i c tes t s that were performed to det ermine the QC code fol l owing each var iable were
( a ) Check for mi s s ing or negat ive values for the broadband solar radiashyt i on meteoro l og i cal or a tmo spheric dat a or the spec t ral integral s
lt 0 = Code 2 Mi s s ing ( - 9 or -9 9 ) = Code 3
( b ) Check for atmo spheric or broadband instrument instab i l i ty us ing the difference and rat i o o f the before- and aft er-scan values and redundant mea surement s if nei t her values are negat i ve or mi s s ing
DN before DN after if the abs lute d i fference SN before SN after i s gt10 Wm DN beforeSN before 5 of 200 DN before SN after and GH before GH after SH beforeSH after the rat io i s lt0 95 or gt1 05 each of the GH before SH before two var iables = GH afterSH after or middot GN beforeGN after the rat i o i s lt0 90 or gt1 10 each of the GT beforeGT after two var iable s = Code 3
Code 2
( c ) Check for DN gt GN or GN gt ETR ( extraterre s trial solar radiat i on ) us 1ng rat ios of the var iabl e s
DN before GN before gt0 95 each variable = Code 2 DN afterGN after gt 1 0 each var i able = Code 3 GN before ETR GN afterETR
( d ) Check for values o f Kt Kn and DGH tha t are too high
KT ( invo lves GH before and after and KT ) KN ( involves DN before and after and KN ) DG ( invo lves DN and GH before and after and DG )
gt0 9 5 each variable = Code 2 gt 1 0 each var iable = Code 3
( e ) Check the s pe c t ral integral s for unusual rat i o s to the corresponding broadband so lar radiat ion value
IT ( Broadband va lue before and after )
For d i rect s pe c t ra lt 0 6 or gt0 8 5 I T = Code 2 For gl obal s pe c t ra lt0 7 o r gt0 95 I T = Code 2
For d i rect and g l obal s pec t ra lt0 5 or gt l O IT = Code 3
5 1
TR-35 13A
We sugge s t that users of the data ba s e develop a computer program to acc e s s fields i n the Q C l ine and t o print the me s sages Thi s l imi ted qua l i ty cont rol wi l l not f lag a l l po s s ible errors and addi t i onal t e s t s should be applied depend ing on the users requi rement s and appl icat i on s
52
1 1 2
Document Control SEAl Report No
Page 4 Title and Subtitle
NTIS Accession No 3 Recipients Accession No SERI TR- 2 1 5-35 13A DE89009447
5 Publication Date
January 1990 Sp ectral Solar Radiation Data Base Documentation
6Vo lume I
7 Author(s) 8 Performing Organization Rept No
9 Performing Organization Name and Address 10 ProjectTaskWork Unit No
1 1 Contract (C) or Grant (G) No
(C)
(G)
1 2 Sponsoring Organization Name and Address 13 Type of Report amp Period Covered
Solar Energy Res ear ch Ins titute Technical Repor t 1 6 1 7 Col e Boulevard Golden Colorado 804 0 1-3393 1 4
1 5 Supplementary Notes
16 Abstract (Limit 200 words) The Solar Energy Research Ins titute ( SERI) Electric Power Research Ins titute Flor ida Solar Energy Center and Pacific Gas and Electric Company cooperated to produce a spec tral solar radiation data base representing a range of atmospheric conditions These data will help to characterize the natural variab ility in the spectral (color) content o f outdoor solar radiation so that the sensitivity of spec trally selective solar devices ( such as photovoltaics ) to these variations c n b e s tudied quant itatively Volume I o f this report documents the history approach content and format of the data base Volume II contains graphs and field no tes for each of the spectral data sets The data res ide on magnetic tape at SERI
1 7 Document Analysis
a Descriptors Spec tral solar radiation broadband solar radiation met eorological
data sp ectroradiometers
b IdentifiersOpen-Ended Terms
c UC Categories
233 234
18 Availabil ity Statement
National Technical Information U S Depar tment of Commerce 5 285 Port Royal Road Springfield Virginia 2 2 1 6 1
Service 19 No of Pages
60
20 Price
A04
Form No 0069 (6-30-87)
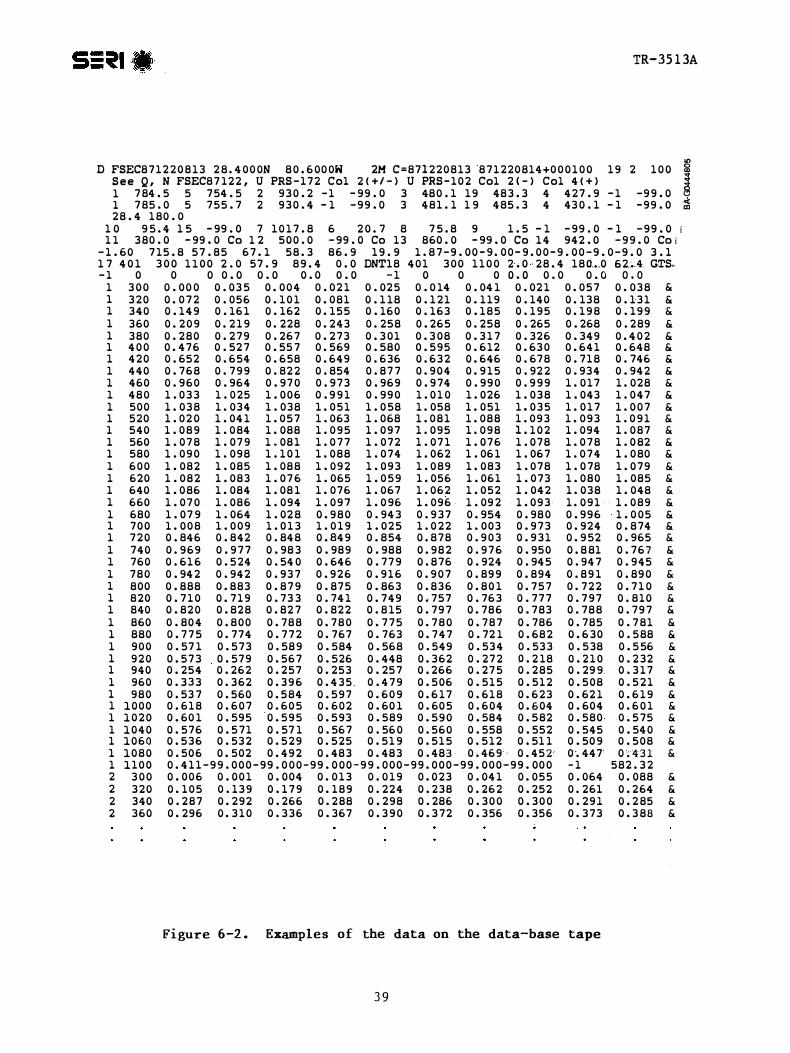
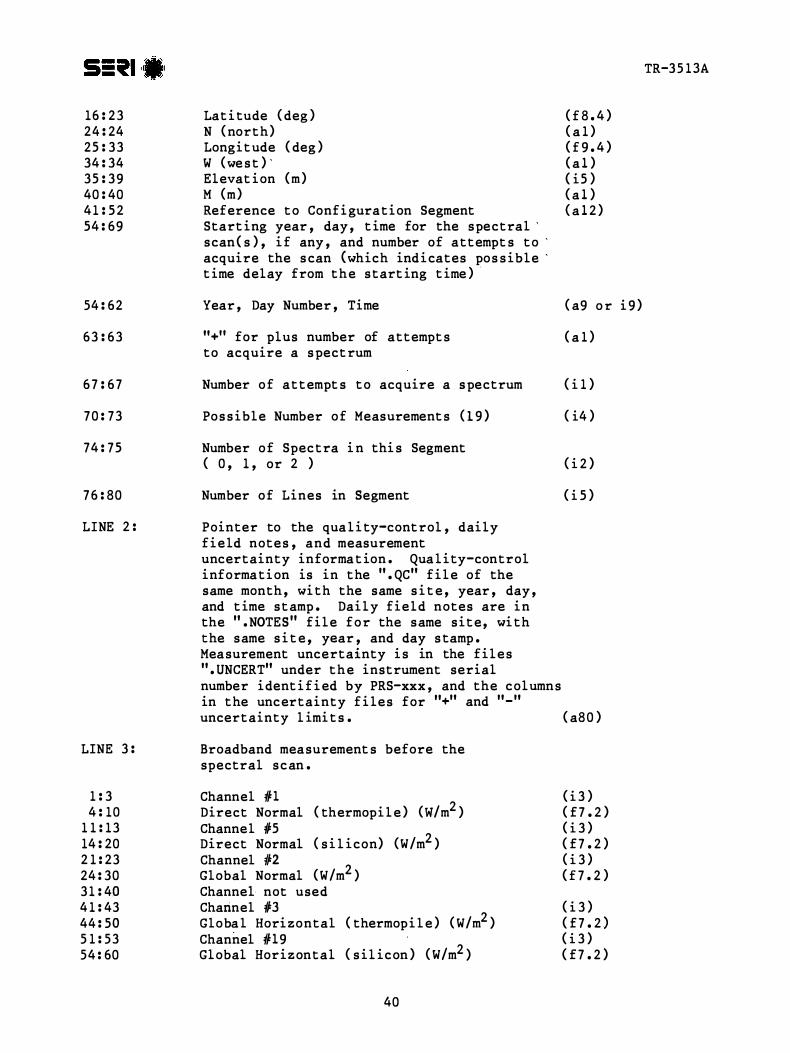
TR-3 5 1 3A
16 2 3 24 24 2S 3 3 34 34 3S 3 9 40 40 4 1 S 2 S4 69
54 62
6 3 6 3
6 7 6 7
7 0 7 3
74 7 S
7 6 80
LINE 2
LINE 3
1 3 4 10
1 1 1 3 14 20 2 1 23 24 30 3 1 40 4 1 43 44 SO 5 1 5 3 54 60
Lat i tude ( deg ) N ( north) Longi t ude ( deg ) W ( we s t ) `Elevat i on (m) M (m) Reference t o Conf i guration Segment Start ing year day t ime for the spectral `scan s ) i f any and number of attempt s t o `acquire the s can ( which ind i cates po s s ible `t ime delay from the s tart ing t ime ) middot
Year Day Number Time
11+11 for plus number of attempt s to acquire a s pect rum
Number o f attempt s t o acquire a s pectrum
Po s s ible Number o f Measurement s ( 1 9 )
Number o f Spec tra i n thi s Segment ( 0 1 or 2 )
Number o f Lines in Segment
Pointer to the qua l i ty-cont rol dai ly f i e ld note s and measurement uncertainty informa t ion Qua l i ty-control informa t i on is in the QC f i l e of the same month wi th the same s i t e year day and t ime s t amp Dai l y field notes are i n the NOTES f i l e f o r the same s i t e wi th the same s i t e year and day s tamp Mea surement uncertainty i s in the f i l e s UNCERT under t h e instrument serial number ident i f i ed by PRS-xxx and the column s in the uncertainty f i le s for + and - uncertainty l imi t s
Broadband mea surement s before the spectral scan
Channel fH Direct Normal ( thermopi l e ) (Wm2 ) Channel ffoS Direct Normal ( s i l i con) (Wm2 ) Channel tn Global Normal ( Wm2 ) Channel not used Charinel ffo3 Globa l Hori zontal ( thermop i l e ) ( Wm2 ) Channel fH 9 Gl obal Horizontal ( s i l icon ) ( Wm2 )
( f 8 4 ) ( a 1 ) ( f 9 4 ) ( a l ) ( i S ) ( a l ) ( a l 2 )
( a9 o r i 9 )
( a 1 )
( i 1 )
( i4 )
( i 2 )
( i S )
( a8 0 )
( i 3 ) ( pound 7 2 ) ( i 3 ) ( pound 7 2 ) ( i 3 ) ( f 7 2 )
( i 3 ) ( pound 7 2 ) ( i 3 ) ( pound 7 2 )
40
TR-35 3A
6 1 6 3 64 7 0 7 1 80
LINE 4
LINE 5
1 6
7 1 2
1 3 80
LINE 6
1 3 4 1 0
1 1 1 3 1 4 20 2 1 23 24 3 0
3 1 3 3 34 40 4 1 43 44 5 0 5 1 5 3 5 4 6 0 6 1 6 3 64 7 0 7 1 7 3 7 4 8 0
LINE 7
LINE 8
1 5
6 1 2
Channe l 114 Gl obal Ti l t (Wm2 ) hellipChannel not used
Broad band mea suremen t s a f t e r t h e s p e c t ral s can same format a s beforeshy scan ( LINE 3 )
T i l t o f the f ixed- t i l t i n s t rument s hellipf rom the hor i z ont a l ( d eg )
Az i muth of the f i xed-t i l t ins t rumen t s ( de g ) ( 1 8 0 deg = s outh)
De s c r i p t i on o f any s pec i al i n s t rument ( fo r example d i ffu s e-hori zont a l mea s uremen t s a t SERI )
Channe l IFlOAl bedo (Wm2 ) hellipChannel IH5C l oud Cover ( t enths ) Channel fF7 Surface Pres sure ( mb ) Mea s ured at FSEC and PGampE c a l c u l ated from e l eva t i on a t S ERI [ 1 1 p 1 0 0 ]
Channel 116 Amb i en t Temperature ( deg C ) Channel fiB Rel a t i ve Humi d i t y ( ) Channe l ffo9 Wind S peed ( m s ) Add i t i onal channe l des cri bed 1n l i ne 5 Va l ue Add i t i onal channel descri bed 1n l ine 5 Va l u e
Sun Pho t ometer read ings ( only recorded for SERI dat a not u s ed except for re l a t i ve c ompar i s on s ) hellip
Earth-S un d i s tance c orrec t i on ( d e v i a t i on from 1 0 ) hellip
Ext ra t erre s t r i a l Rad i a t i on (Wm2 ) hellip
( i 3 ) ( pound 7 2 )
( f 6 1 )
( f 6 1 )
( a 8 8 )
( i 3 ) ( 7 1 ) ( i 3 ) ( 7 1 ) ( i 3 ) ( f 7 1 )
( i 3 ) ( pound 7 1 ) ( i 3 ) ( pound 7 1 ) ( i 3 ) ( pound 7 1 ) ( i 3 ) ( variabl e ) ( i 3 ) ( variabl e )
( f5 2 )
( f 7 1 )
4 1
9
42
TR-3S l 3A
1 3 1 8
1 9 24
25 30
3 1 36
3742
43 48
49 68
69 72
13 76
1780
LINE
I
3 6
7 1 1 1216 1 7 20 21 25
2631
3236
3839
40 40
41 42
43 46
Zen i t h Angl e ( deg ) ( f6 2 )
Kt ( ra t i o calculated from ( f6 1 ) thermo p i l e inst rument s )
Kn ( rat i o calculated from ( f6 1 ) thermo p i l e instrument s )
D GH ( ra t i o cal culated from thermopile instrument s ) ( f6 1 )
Albedo ( ) ( f6 1 )
Ai r Mas s ( f6 2 )
Res erved for Turbidi ty i f calculated
Precipi table Water Vapor i f calculated from sun photomet er
Precipi table Water Vapor from the ( f4 1 ) Nat ional Weather Servi ce
Prec i p i table Water Vapor Cal culated from Relative Humid i t y ( f4 1 )
Channel H7 Number o f Wave l engths Recorded by Spect roradi ometer 1
Beginning Wavelength ( nm ) Ending Wavel ength (nm) Wavelength Step Size (nm ) Spectroradi ometer 1 Ti l t from the Horizontal ( deg )
Spectroradiometer 1 Azimuth ( deg )
Angle o f Incidence o f the Direct Beam on Spectroradi ometer 1 ( deg )
Measurement Type ( DN GN GH GT DF )
Attachment ( Tef lon Dome D Integrat ing Sphere S View- l imit ing Tube T )
Channel H8 Number o f Wavel engths Recorded by Spectroradi ometer 2
( i2 )
( i4 )
( i S ) ( i S ) ( f4 1 )
( fS l )
( f6 1 )
( fS 1 )
( a2 )
( a l )
( i 2 )
(i4)
TR-3S l3A
4 7 S l Beginning Wavel ength (nm ) ( i S )
S 2 S 6` Ending Wavel ength ( nm ) ( i S )
S 7 60 Wavelength Step S i z e ( nm ) ( f4 bull 1 )
6 1 6S Spec troradi ometer 1 T i l t from the Hori zontal ( deg ) ( fS l )
6 6 7 1 ` Spect roradi ometer 2 Az imuth ( deg ) ( f6 1 )
7 2 76` Angle of Incidence o f the Direct Beam on Spect rorad i ometer 2 ( deg ) ( fS l )
7 8 7 9 Mea surement Type ( DN GN GH GT DF ) ( a2 )
8 0 80 At tachment ( Teflon Dome D Integrat ing Sphere s View-l imi t ing Tube T ) ( al )
LINE 10 Saved f o r extra spectroradi ometers i f needed
I f no spec tral data were recorded the number of l ines in the D s egment i s 1 0 the number of spectra i s 0 and there i s no corre sponding qual i ty-control information for thi s dat e t ime in the QC f i l e s No qual i ty c ontrol wa s performed because the atmo sphere was uns table I f the number o f spectra i s 1 there are 60 l ines in the D s egment i f there are two spectra t he number o f l ines i s 100
I f middot the number of spectra i s 1 or 2 the spectral data fol low after the f i r s t 1 0 l i nes o f the D segment There are 1 0 spectral measurement s per l ine wi th the number in the lef t-mo s t column indicat ing the f i r s t or second specshyt roradiometer ( 1 or 2 ) f o l l owed by the s tart ing wavelength ( in nanometers ) and t he 10 spectral mea surements ( in Wm2-nm) The 1 0 measurement s are at wave l ength inc rements of 2 nm There are 401 spect ral mea surement s from 300 t o 1 1 0 0 nm in 2-nm s teps with 10 measurement s per line for 40 l ine s and one measurement in the 4 1 s t l ine The l a s t number in the 4 1 s t l ine i s the specshytral integral I f a second s pectrorad i ometer wa s used the next 4 1 l ines folshylow t he same format Blank 1 ines follow the spec tral data t o f i l l the D segment to 60 or 100 l ines
An example of a QC f i l e i s shown in Figure 6-3 The f i r s t l ine o f each segment begins with a Q f o l l owed by the s i t e year day number and t ime s tamp with the number of l ines in the segment given in the l a s t col umn s o f the l ine Following the iden t i fier are me s sage s about var iables that were flagged by the automat i c qua l i ty-control proc e s s ing ( s ee appendi x ) noted by an operator at the measurement s i t e or noted dur ing inspec t i on at SERI The l a s t l ine of the segment shows the QC code for as DN ( direct normal thermopile detect o r ) SN ( d i rect normal detector ) AL
var iabl e s such s i l i con
( a lbedo ) and SP ( s pectrum) a s de s c r i bed in the appendi x Three qual i tyshycontrol code s ar8 used 1 = good 2 = suspec t see me s sages and dai ly not e s and 3 = poor or mi s s ing see me s s ages and da i l y no te s The broadband codes ( DN SN GN GH SH and GT ) have two value s the f i r s t is the before- scan measurement and the second is the after-s can mea surement
4 3
TR-35 13A
Q FSEC87 1 2 1 0 7 3 1 4 Noise in GH spectrum in UV QCDN1DN1SN1SN1GN1GN1GH1GH1SH1SH1GT1GT1AL1AP1PR1TC1RH1WV1WS1KT1KN1DG1SPl iN1SP2IN2
Q FSEC8 7 1 2 1 0 8 3 0 8 SN bef SN af t = 1 0 5 5 S H bef SH aft = 1 0 5 3 2nd Int BB b e f = 0 636 2nd Int BB aft = 0 6 5 1 Noise in GH spectrum i n UV QCDN1DN1SN2SN2GN1GN1GH1GH1SH2SH2GT1GT1AL1AP1PR1TC1RH1WV1WS1KT1KN1DG1SP1 IN1SP2IN2
Q FSEC8 7 1 2 1 1 0 3 1 3 QCDN1DN1SN1SN1GN1GN1GH1GH1SH1SH1GT1GT1AL1AP1PR1TC1RH1WV1WS1KT1KN1DG1SP1 IN1SPl iNl iacute
Q FSEC87 1 2 1 1 1 3 1 3 QCDN1DN1SN1 SN1GN1GN1GH1GH1SH1SH1GT1GT1AL 1AP1PR1TC1RH1WV1WS1KT1KH1DG1SP 1 IN1SP1 IN1
Q FSEC8 7 1 2 1 1 2 3 1 3 QCDN1DN 1SN1SN1GN1GN1GH1GH1SH1SH1GT1GT1AL1AP1PR1TC1RH1WV1WS1KT1KN1DG1 SP1 IN1SP 1 IN1
Q FSEC8 7 1 2 1 1 3 3 1 3 QCDN1DN1SNlSNlGNlGN1GH1GH1SH1SH1GTlGTlALlAPlPRlTClRHlWVlWSlKTlKNlDGlSP l iNlSPliNl
Q FSEC8 7 1 2 1 1 4 3 1 3QCDNlDNlSNlSNlGNlGNlGHlGHlSHlSHlGTlGTlALlAPlPRlTClRHlHVlHSlKTlKNlDGlSPl iN1SP1IN1 Q FSECB7 1 2 1 1 554 3 QCDNlDNlSNlSNlGNlGNlGHlGHlSHlSHlGTlGTlALlAPlPRlTClRHlWV1WSlKT1KN1DG1SP 1 IN1SP l iN1
Q FSEC8 7 1 2 1 16 3 0 3 QCDNlDNlSNlSNlGNlGNlGHlGHlSHlSHlGTlGTlALlAPlPRlTC1RH1WV1WSlKTlKNlDG1SP l iNlSPl iNl
Q FSECB 7 1 2 1 1 7 3 1 5 GH bef SH bef = 0 9 3 1 GH aft SH af t = 0 9 3 3 QCDN1DN1SN1SN1GN1GNlGH2GH2SH2SH2GTlGT1ALlAPlPRlTClRHlWVlWSlKTlKNlDGlSPl iNlSPl iNl
Q FSECB 7 1 2 2 0 7 3 1 3 QCDNlDNlSNlSNlGNlGNlGHlGHlSHlSHlGT1GTlALlAPlPRlTClRHlWVlWS 1KT1KNlDGlSP l iNlSPl iNl
Figure 6-3 Example of quali ty-control inf ormation on the data- base tape
Figure 6-4 shows an exampl e of a segment of the daily notes from the FSEC NOTES f i l e Each segment of the f i l e beg ins wi th an followed b y the s i t e year and day number s t amp with the number of l ines in the segment given in the last columns of the l i ne The next l ine contains the s i te operashytor log sheet number month day year day number spectroradi ometer serial number( s ) and mea surement mode( s ) The PGampE and SERI not e s do not include the dai ly l og sheet number The f i rst two l ines are followed by f i eld no te s No tes that were added after inspec t i on at SERI are s eparat d from the operator notes wi th ------- The exi s tence of s l ides or photographs i s ind i cat ed a s wel l a s their qua l i ty i e good ( G ) marginal ( M ) or poor ( P ) In the exampl e in thi s f i gure there were two log sheets for thi s day (number 1 1 6 and 1 1 7 ) because the mea surement mode changed from gl obal hor i z onshytal ( GH ) to global t i l t ( GT )
44
TR-3513A
N FSEC87 1 2 2 1 1 6 0 5 0 2 8 7 1 2 2 1 7 2 DN 1 0 2 GH Clear at 0 7 3 0 GH f o r f ir s t two s cans then GT S l i de s 0 6 3 2 G
0 7 3 3 G 0 8 3 3 G 0 9 3 3 H ( dark ) 1 0 3 3 p1 1 3 3 p1 2 3 3 p 1 3 3 3 p1433 H 1 5 3 3 G 1633 G 1733 G
1 1 7 0 5 0 2 87 1 2 2 1 7 2 DN 1 0 2 GT GT s tart ing at 0 8 0 0 iacuteC lear a t 0 8 0 0 iacuteS l ides S e e above
16 1 1 8 0 5 0 3 8 7 1 2 3 1 7 2 DN 1 0 2 GT Clear at 0830 S l i de s 0633 G
0733 G 0833 G 0933 H ( dark ) 1 0 3 3 p1 1 3 3 p 1233 p 1333 p1433 H 1533 G 1633 G 1733 G
N FSEC87 1 2 3
Figure 6-4 Examples of daily notes on the data-base tape
An example o f a segment of the measurement uncertainty file UNCERT CAL i s shown in Figure 6-5 The f i r s t l ine begins with a U followed by the serial number of the s pect rorad i ometer The upper and lower measurement uncertainty l imi t s are given in the co lumns fol lowing wavelength wi th the appropri a t e measur ement mode dat es and de script ion at the top o f the column The s econd l ine in each segment o f the DAT f i l e s is a pointer to the correct uncershytainty information in UNCERT CAL The broadband s o lar radiat i on and meteshyorolog ical instrument measurement uncertainty fol lows each spectra l measureshyment uncertainty segment in UNCERT CAL
The format o f thi s data ba se was es tabl i shed at SERI t o accommodat e expanded mul t i year long-term data collect ion Users can reformat the data t o suit their part icular needs We recommend the following s t eps for acce s s ing and document ing parti cular data set s
1 Se lect and extract the des ired spectral data from the DAT f i l e s us i ng in formation such as measurement mode day number t ime air mas s or a moshys pheric condi t ions depending on the de s i red attribut es
2 Ex trac t and review the corres ponding segment s of the qua l i ty-cont rol i n format i on from the QC f i l es
3 Ex trac t and review the corres pond ing field no tes from the NOTES f i l e s
4 5
+ I -
5 4
3 7
TR- 3 5 13A
U PRS - 1 0 2 L I -COR PRS - 1 0 2 i
1 2 3 4 5 Ill
Wav GHS GHS GHS GHS GTS GTS GTS GTS Kt gt 6 0 Kt gt 6 0 Kt gt 60 Kt gt 6 0 iacutel ower lower upper upper 2 8 7 - 8 8 7 -8 8 7 5 8 8 GNS GNS
upper upper lower l ower
+ 1 -
- GHS GHS GTS GTS Kt lt 60 Kt lt 6 0 upper uppe r l ower l ower + I - + I -2 8 7 - 8 8 7 -8 87 5 - 8 8
3 0 0 - 1 0 0 0 - 1 00 0 1 0 0 0 1 0 0 0 3 0 2 - 1 0 0 0 - 1 0 0 0 1 0 0 0 1 0 0 0
4 0 0 - 2 3 3 - 1 7 1 1 5 3 9 1 4 0 2 iacute -2 2 0 - 1 7 3 1 4 0 9 3
5 0 0 - 1 3 4 - 1 1 7 3 7 5 0 2 iacute - 1 3 3 - 1 1 7 5 3 3 7
6 0 0 - 1 1 8 - 1 1 1 3 8 3 1 6 0 2 - 1 1 9 - 1 1 1 3 9 3 1
7 0 0 - 1 1 5 - 1 0 7 3 5 2 7 7 0 2 - 1 1 3 - 1 0 7 3 3 2 7
8 0 0 - 1 1 6 - 1 0 6 3 6 2 6 8 0 2 - 11 7 - 1 0 6 3 7 2 6
9 0 0 - 1 1 2 - 1 0 5 3 2 2 5 9 0 2 - 1 1 4 - 1 0 8 3 4 2 8
1 0 0 0 - 1 1 7 - 1 0 8 2 8 1 0 0 2 - 1 1 8 - 1 0 8 3 8 2 8
1 1 0 0 - 1 2 9 - 12 2 4 9 4 2
Figure 6-5 Examples of spe ctral measurement uncertainty on the data-base tape A value of plusmn100 indi cates greater t han 100 measurement uncertainty
46
TR-35 13A
4 Extract the measurement uncertainty information from the 1 1 UNCERT f i l e s and quot e mea surement uncertainty for a l l data used
5 Examine the dai l y broadband and spec tral solar radiatio data graphs in the catalog ( Volume I I of thi s report [ 1 8 ] i f avai labl e These graphs provide informa t i on on atmo spheric condi t i ons during the day For exampl e Figure 4-3 shows dai l y broadband and spec tral plot s for part ly c loudy condi t i ons when s olar rad i a t i on i s changing rapidly throughout the day The sun i s obs cured when the direc t-normal values drop t o zero and the gl obal value s approach each o ther Figure 4-1 shows a clear daybull
No data should be used wi thout consult ing the qua l i ty-control informa t i on dai ly no tes and measurement uncertainty
4 7
Cel l s
Ce l l s
Energy
Meteorologi cal Society
Appl i ed Meteorol ogy
Energy
Radiat ion Topical Overview Solar Cel l s Vo l 1 8
of the Pho tovo l t a i c s and Insolat ion Mea sureshySolar Vol 1 8 1 986 pp 393-3 9 5
TR-35 1 3A
1 0 REFERENCES
1 Hul st rom R L Solar 1 986 PPbull 1 7 9- 1 8 7
2 Hul st rom R L A Summary ments Workshop Panel Resul t s
3 Hul strom R L Re sul t s of the Amorphous S i l i con Mea surement s Ta sk Force Solar Cel l s Vo l 18 1 986 pp 1 7 1-1 7 7
4 Hul strom R L and J M Ohi Resul t s of the SERI Mul t i junction Devi ce Efficiency Measurement Task Forc e pre sented at the 20th I EEE Photovo lshytaic Spec ial i s t s Conference September 1 988
5 Riordan c and R L Hul s t rom Summary of S tud i e s that Examine the Effec t s of Spect ral Solar Radition Vari at ions on PV Device Des ign and Pershyformance SERI-TR-2 15-343 7 Golden CO Solar Energy Research Ins t i tute 1989
6 Riordan c Joint EPRI-SERI Spectral Solar Rad i a t i on Database Pro j ec t
1
8
9
1 0
1 1
1 2
1 3
14
Solar Vol 2 1 1 98 7 pp 3 3 7-342
Riordan c D Myers M Rymes R Hul strom W Mar i on c Jenning s and c Whi taker Spectral Solar Radiat ion Data Bas e at SERI Solar Vol 42 No 1 1 989 PP bull 6 7-79
Riordan C J T L Stoffe l and R L Hul s trom The Effect s of Urban Air Pollut ion on Solar Radiat i on SERI-TR-2 15-3482 Golden CO Solar Energy Res arch I n s t i tute ( draft ) 1989
Riordan c and R Hul s t rom The SERI Re s ource As ses sment Project s Plan for Col l ect ing Spectral-Solar-I rradiance Data SERI -TR-21 5-2948 Gol den CO Solar Energy Re search Ins t i tut e 1986
Shaw G E Sun Pho tometry Bul letin Ameri can Vol 64 No 1 January 1983 pp 4-10
Iqbal M bull An Int roduction to Solar Radiation New York Academic Pre s s
1983
Bartel s R A Comment s on Prec ipi table Water Mea surement s with Sun Photometer s Journal of Cl imate and Vol 25 1 986 PP bull 1 788- 1 789
Leckner B The Spectral Distribution o f Solar Radiat ion at the Earth s Surface -- El ements of a Model Solar Vol 20 1 9 7 8 pp 143- 1 5 0
Cannon T W Spectral So lar Irradiance Instrumentat i on and Measurement Techniques Solar Cel l s Vol 1 8 1986 pp 2 3 3-24 1
48
Energy
Photogrammetric Engineering
TR 3 5 13A
1 5 Myers D R E s t imate s of Uncertainty for Measured Spec tra in the SERI Spectral Solar Radiat i on Data Base ac cepted by Solar 1 98 9
1 6 Myers D R E s t imates of Uncertainty for Measured Spectra in the SERI Spec tral Solar Radiat i on Data aa s e 11 SERI e_clmical Report Golden CO S o l ar Energy Res earch Ins t i tute ( draft ) 1989
middot
1 7 Hul s trom R L The Cl oud Bright Spo t 1 9 73 PP bull 3 7 0-3 7 6
18 Ri ordan c D Myer s and R Hul s t rom Spectral Scflar Raltfiation Data Base Documentat i on and User 1 s Manual Vo lume I I SERI-TR-2 15-3 5 1 3 Golden CO Solar Energy Re search Ins t i tut e 1989
49
TR- 3 5 1 3A
APPENDIX
QUALITY-CONTROL PROCESSING
Limi ted qua l i ty-control proces s ing wa s appl i ed to the data ba se as de s c r i bed below The resul t s are i n the QC f i l es on the data-base t ape by s i t e year and mont h For examp l e
FLA8705 QC i s FSEC 1 98 7 May PGE8 80 l QC i s PGampE 1 9 8 8 January SER8 7 l l QC i s SERI 1 98 7 November
These f i l e s correspond t o the 11 OAT f i les for the s ame s i t e year and month Each data segment that includes a spectrum wa s proces sed through thi s quali ty-control procedure I f the atmospheric cond i t i on s were uns tab l e and a spectrum was not acquired the broadband and meteorologi cal data were inc l uded on the data-base tape but no qua l i ty-contro l proc e s s ing wa s app l i ed
An example o f a segment of a 11 QC f i l e i s shown in F i gure 6-3 The f i r s t Q l ine beg ins wi th a fol l owed by the s i t e year day and t ime s tamp The
last columns give the number of l ines in the s egment so the user can skip to the next s egment Fo l l owing the f i r s t l ine are me s sages that were printed whenever the qua l i ty-control proce s s ing f lagged a suspect or poor value
Following the mes sages in an SO-character QC l ine l i s t ing the variables that were examined are one of three qua l i ty-control code s 1 good 2 marg inal or suspect and 3 mi s s ing or poor The QC l ine was prepared using an automa t i c ( computeri zed ) check of the variabl e s and manual edi t ing to include informashyt ion from correspondence l og sheet s and vi sual inspe ct i on Addi t i onal me sshysages were added above the QC l ine if appropriate
The two-charact er descriptors in the QC l ine are
DN Direct-normal ( thermopi l e ) solar radiat ion before the spectral s can DN Direct-normal ( thermopi l e ) so lar radiation after the spectra l scan SN Direct-normal ( s i l i c on ) before SN Direct-normal ( s i l i c on ) after GN Globa l-normal before GN Globa l-normal after GH Globa l -horizontal ( thermop i l e ) before
WS Wind Speed KT KKN K
t n
GH Global-hori zontal thermopil e ) after SH Global-hori zontal ( s i l i con ) before SH Global-hori zontal ( s i l icon ) after GT Global-t i l t before GT Gl obal- t i l t after AL Al bedo ( Wm ) AP Albedo ( ) PR Surface Pres sure TC Temperature ( deg C ) RH Relat ive Humi dity WV Water Vapor ( al culated from rel a t i ve humidity)
5 0
S- flllit = - ( middotmiddot middot
( e g Wm2 )
TR-3 5 1 3A
DG D GH SP F i r s t Sp qtrum I T Integral of t he F i r s t Spec t rum SP Second Spectrum IT I nt egral of the - Second SpecttUI11
The aut oma t i c tes t s that were performed to det ermine the QC code fol l owing each var iable were
( a ) Check for mi s s ing or negat ive values for the broadband solar radiashyt i on meteoro l og i cal or a tmo spheric dat a or the spec t ral integral s
lt 0 = Code 2 Mi s s ing ( - 9 or -9 9 ) = Code 3
( b ) Check for atmo spheric or broadband instrument instab i l i ty us ing the difference and rat i o o f the before- and aft er-scan values and redundant mea surement s if nei t her values are negat i ve or mi s s ing
DN before DN after if the abs lute d i fference SN before SN after i s gt10 Wm DN beforeSN before 5 of 200 DN before SN after and GH before GH after SH beforeSH after the rat io i s lt0 95 or gt1 05 each of the GH before SH before two var iables = GH afterSH after or middot GN beforeGN after the rat i o i s lt0 90 or gt1 10 each of the GT beforeGT after two var iable s = Code 3
Code 2
( c ) Check for DN gt GN or GN gt ETR ( extraterre s trial solar radiat i on ) us 1ng rat ios of the var iabl e s
DN before GN before gt0 95 each variable = Code 2 DN afterGN after gt 1 0 each var i able = Code 3 GN before ETR GN afterETR
( d ) Check for values o f Kt Kn and DGH tha t are too high
KT ( invo lves GH before and after and KT ) KN ( involves DN before and after and KN ) DG ( invo lves DN and GH before and after and DG )
gt0 9 5 each variable = Code 2 gt 1 0 each var iable = Code 3
( e ) Check the s pe c t ral integral s for unusual rat i o s to the corresponding broadband so lar radiat ion value
IT ( Broadband va lue before and after )
For d i rect s pe c t ra lt 0 6 or gt0 8 5 I T = Code 2 For gl obal s pe c t ra lt0 7 o r gt0 95 I T = Code 2
For d i rect and g l obal s pec t ra lt0 5 or gt l O IT = Code 3
5 1
TR-35 13A
We sugge s t that users of the data ba s e develop a computer program to acc e s s fields i n the Q C l ine and t o print the me s sages Thi s l imi ted qua l i ty cont rol wi l l not f lag a l l po s s ible errors and addi t i onal t e s t s should be applied depend ing on the users requi rement s and appl icat i on s
52
1 1 2
Document Control SEAl Report No
Page 4 Title and Subtitle
NTIS Accession No 3 Recipients Accession No SERI TR- 2 1 5-35 13A DE89009447
5 Publication Date
January 1990 Sp ectral Solar Radiation Data Base Documentation
6Vo lume I
7 Author(s) 8 Performing Organization Rept No
9 Performing Organization Name and Address 10 ProjectTaskWork Unit No
1 1 Contract (C) or Grant (G) No
(C)
(G)
1 2 Sponsoring Organization Name and Address 13 Type of Report amp Period Covered
Solar Energy Res ear ch Ins titute Technical Repor t 1 6 1 7 Col e Boulevard Golden Colorado 804 0 1-3393 1 4
1 5 Supplementary Notes
16 Abstract (Limit 200 words) The Solar Energy Research Ins titute ( SERI) Electric Power Research Ins titute Flor ida Solar Energy Center and Pacific Gas and Electric Company cooperated to produce a spec tral solar radiation data base representing a range of atmospheric conditions These data will help to characterize the natural variab ility in the spectral (color) content o f outdoor solar radiation so that the sensitivity of spec trally selective solar devices ( such as photovoltaics ) to these variations c n b e s tudied quant itatively Volume I o f this report documents the history approach content and format of the data base Volume II contains graphs and field no tes for each of the spectral data sets The data res ide on magnetic tape at SERI
1 7 Document Analysis
a Descriptors Spec tral solar radiation broadband solar radiation met eorological
data sp ectroradiometers
b IdentifiersOpen-Ended Terms
c UC Categories
233 234
18 Availabil ity Statement
National Technical Information U S Depar tment of Commerce 5 285 Port Royal Road Springfield Virginia 2 2 1 6 1
Service 19 No of Pages
60
20 Price
A04
Form No 0069 (6-30-87)
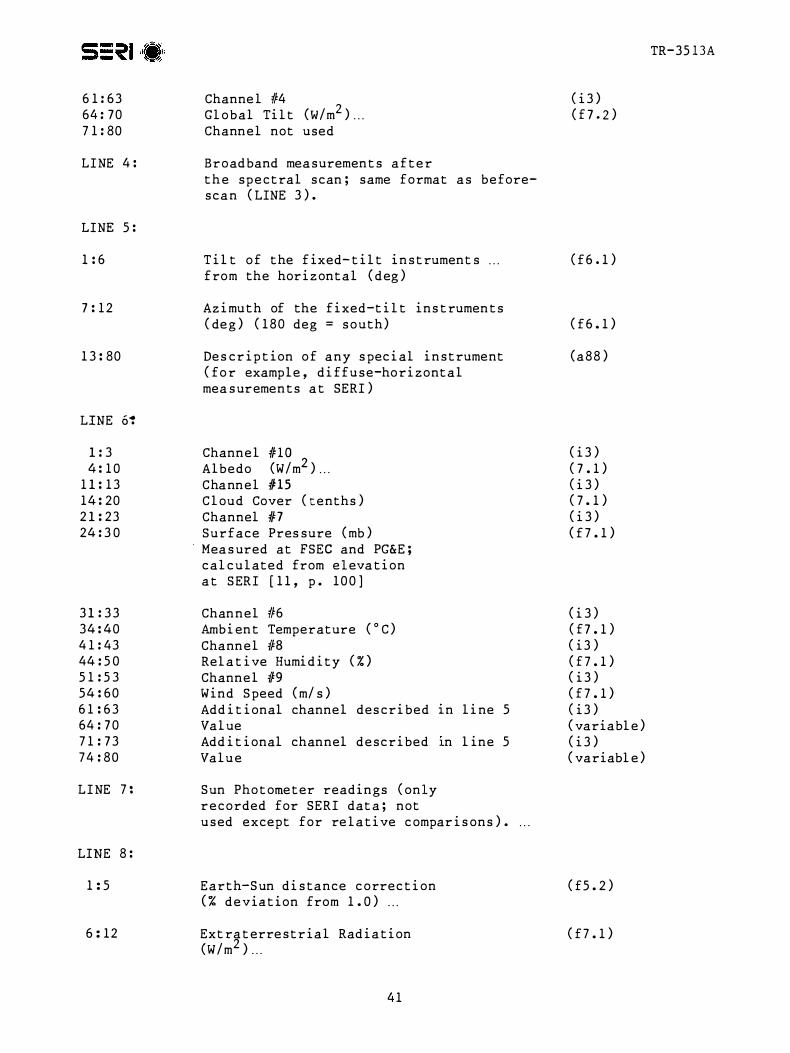
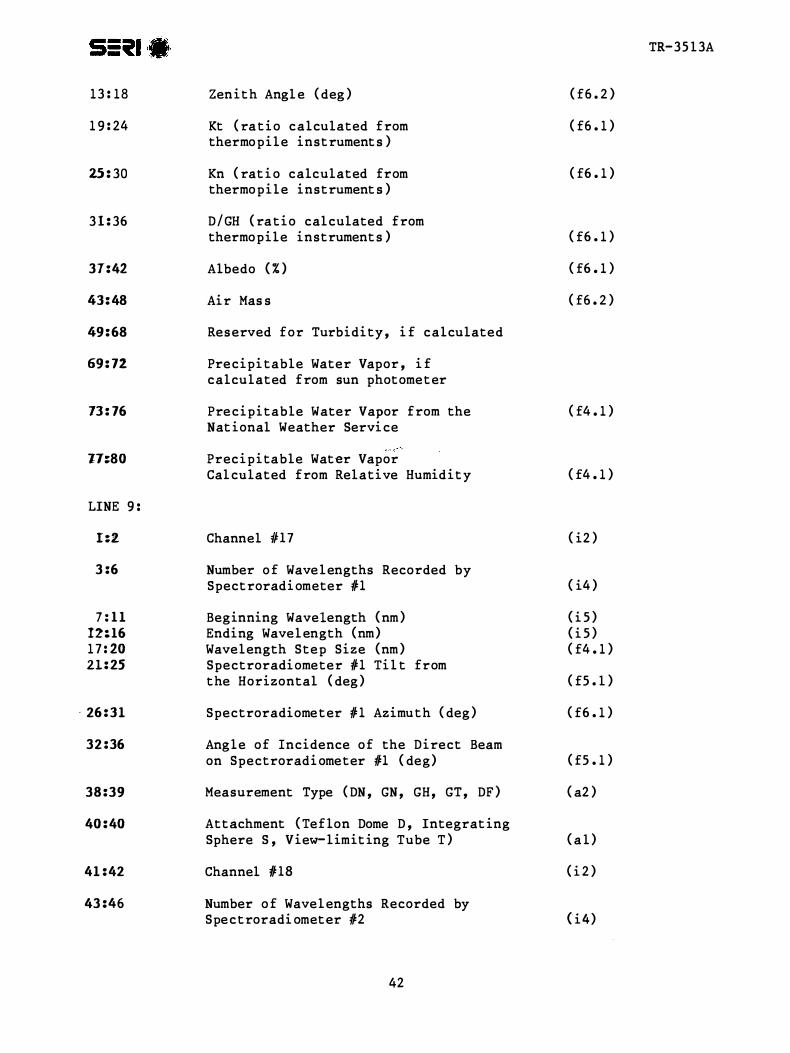
9
42
TR-3S l 3A
1 3 1 8
1 9 24
25 30
3 1 36
3742
43 48
49 68
69 72
13 76
1780
LINE
I
3 6
7 1 1 1216 1 7 20 21 25
2631
3236
3839
40 40
41 42
43 46
Zen i t h Angl e ( deg ) ( f6 2 )
Kt ( ra t i o calculated from ( f6 1 ) thermo p i l e inst rument s )
Kn ( rat i o calculated from ( f6 1 ) thermo p i l e instrument s )
D GH ( ra t i o cal culated from thermopile instrument s ) ( f6 1 )
Albedo ( ) ( f6 1 )
Ai r Mas s ( f6 2 )
Res erved for Turbidi ty i f calculated
Precipi table Water Vapor i f calculated from sun photomet er
Precipi table Water Vapor from the ( f4 1 ) Nat ional Weather Servi ce
Prec i p i table Water Vapor Cal culated from Relative Humid i t y ( f4 1 )
Channel H7 Number o f Wave l engths Recorded by Spect roradi ometer 1
Beginning Wavelength ( nm ) Ending Wavel ength (nm) Wavelength Step Size (nm ) Spectroradi ometer 1 Ti l t from the Horizontal ( deg )
Spectroradiometer 1 Azimuth ( deg )
Angle o f Incidence o f the Direct Beam on Spectroradi ometer 1 ( deg )
Measurement Type ( DN GN GH GT DF )
Attachment ( Tef lon Dome D Integrat ing Sphere S View- l imit ing Tube T )
Channel H8 Number o f Wavel engths Recorded by Spectroradi ometer 2
( i2 )
( i4 )
( i S ) ( i S ) ( f4 1 )
( fS l )
( f6 1 )
( fS 1 )
( a2 )
( a l )
( i 2 )
(i4)
TR-3S l3A
4 7 S l Beginning Wavel ength (nm ) ( i S )
S 2 S 6` Ending Wavel ength ( nm ) ( i S )
S 7 60 Wavelength Step S i z e ( nm ) ( f4 bull 1 )
6 1 6S Spec troradi ometer 1 T i l t from the Hori zontal ( deg ) ( fS l )
6 6 7 1 ` Spect roradi ometer 2 Az imuth ( deg ) ( f6 1 )
7 2 76` Angle of Incidence o f the Direct Beam on Spect rorad i ometer 2 ( deg ) ( fS l )
7 8 7 9 Mea surement Type ( DN GN GH GT DF ) ( a2 )
8 0 80 At tachment ( Teflon Dome D Integrat ing Sphere s View-l imi t ing Tube T ) ( al )
LINE 10 Saved f o r extra spectroradi ometers i f needed
I f no spec tral data were recorded the number of l ines in the D s egment i s 1 0 the number of spectra i s 0 and there i s no corre sponding qual i ty-control information for thi s dat e t ime in the QC f i l e s No qual i ty c ontrol wa s performed because the atmo sphere was uns table I f the number o f spectra i s 1 there are 60 l ines in the D s egment i f there are two spectra t he number o f l ines i s 100
I f middot the number of spectra i s 1 or 2 the spectral data fol low after the f i r s t 1 0 l i nes o f the D segment There are 1 0 spectral measurement s per l ine wi th the number in the lef t-mo s t column indicat ing the f i r s t or second specshyt roradiometer ( 1 or 2 ) f o l l owed by the s tart ing wavelength ( in nanometers ) and t he 10 spectral mea surements ( in Wm2-nm) The 1 0 measurement s are at wave l ength inc rements of 2 nm There are 401 spect ral mea surement s from 300 t o 1 1 0 0 nm in 2-nm s teps with 10 measurement s per line for 40 l ine s and one measurement in the 4 1 s t l ine The l a s t number in the 4 1 s t l ine i s the specshytral integral I f a second s pectrorad i ometer wa s used the next 4 1 l ines folshylow t he same format Blank 1 ines follow the spec tral data t o f i l l the D segment to 60 or 100 l ines
An example of a QC f i l e i s shown in Figure 6-3 The f i r s t l ine o f each segment begins with a Q f o l l owed by the s i t e year day number and t ime s tamp with the number of l ines in the segment given in the l a s t col umn s o f the l ine Following the iden t i fier are me s sage s about var iables that were flagged by the automat i c qua l i ty-control proc e s s ing ( s ee appendi x ) noted by an operator at the measurement s i t e or noted dur ing inspec t i on at SERI The l a s t l ine of the segment shows the QC code for as DN ( direct normal thermopile detect o r ) SN ( d i rect normal detector ) AL
var iabl e s such s i l i con
( a lbedo ) and SP ( s pectrum) a s de s c r i bed in the appendi x Three qual i tyshycontrol code s ar8 used 1 = good 2 = suspec t see me s sages and dai ly not e s and 3 = poor or mi s s ing see me s s ages and da i l y no te s The broadband codes ( DN SN GN GH SH and GT ) have two value s the f i r s t is the before- scan measurement and the second is the after-s can mea surement
4 3
TR-35 13A
Q FSEC87 1 2 1 0 7 3 1 4 Noise in GH spectrum in UV QCDN1DN1SN1SN1GN1GN1GH1GH1SH1SH1GT1GT1AL1AP1PR1TC1RH1WV1WS1KT1KN1DG1SPl iN1SP2IN2
Q FSEC8 7 1 2 1 0 8 3 0 8 SN bef SN af t = 1 0 5 5 S H bef SH aft = 1 0 5 3 2nd Int BB b e f = 0 636 2nd Int BB aft = 0 6 5 1 Noise in GH spectrum i n UV QCDN1DN1SN2SN2GN1GN1GH1GH1SH2SH2GT1GT1AL1AP1PR1TC1RH1WV1WS1KT1KN1DG1SP1 IN1SP2IN2
Q FSEC8 7 1 2 1 1 0 3 1 3 QCDN1DN1SN1SN1GN1GN1GH1GH1SH1SH1GT1GT1AL1AP1PR1TC1RH1WV1WS1KT1KN1DG1SP1 IN1SPl iNl iacute
Q FSEC87 1 2 1 1 1 3 1 3 QCDN1DN1SN1 SN1GN1GN1GH1GH1SH1SH1GT1GT1AL 1AP1PR1TC1RH1WV1WS1KT1KH1DG1SP 1 IN1SP1 IN1
Q FSEC8 7 1 2 1 1 2 3 1 3 QCDN1DN 1SN1SN1GN1GN1GH1GH1SH1SH1GT1GT1AL1AP1PR1TC1RH1WV1WS1KT1KN1DG1 SP1 IN1SP 1 IN1
Q FSEC8 7 1 2 1 1 3 3 1 3 QCDN1DN1SNlSNlGNlGN1GH1GH1SH1SH1GTlGTlALlAPlPRlTClRHlWVlWSlKTlKNlDGlSP l iNlSPliNl
Q FSEC8 7 1 2 1 1 4 3 1 3QCDNlDNlSNlSNlGNlGNlGHlGHlSHlSHlGTlGTlALlAPlPRlTClRHlHVlHSlKTlKNlDGlSPl iN1SP1IN1 Q FSECB7 1 2 1 1 554 3 QCDNlDNlSNlSNlGNlGNlGHlGHlSHlSHlGTlGTlALlAPlPRlTClRHlWV1WSlKT1KN1DG1SP 1 IN1SP l iN1
Q FSEC8 7 1 2 1 16 3 0 3 QCDNlDNlSNlSNlGNlGNlGHlGHlSHlSHlGTlGTlALlAPlPRlTC1RH1WV1WSlKTlKNlDG1SP l iNlSPl iNl
Q FSECB 7 1 2 1 1 7 3 1 5 GH bef SH bef = 0 9 3 1 GH aft SH af t = 0 9 3 3 QCDN1DN1SN1SN1GN1GNlGH2GH2SH2SH2GTlGT1ALlAPlPRlTClRHlWVlWSlKTlKNlDGlSPl iNlSPl iNl
Q FSECB 7 1 2 2 0 7 3 1 3 QCDNlDNlSNlSNlGNlGNlGHlGHlSHlSHlGT1GTlALlAPlPRlTClRHlWVlWS 1KT1KNlDGlSP l iNlSPl iNl
Figure 6-3 Example of quali ty-control inf ormation on the data- base tape
Figure 6-4 shows an exampl e of a segment of the daily notes from the FSEC NOTES f i l e Each segment of the f i l e beg ins wi th an followed b y the s i t e year and day number s t amp with the number of l ines in the segment given in the last columns of the l i ne The next l ine contains the s i te operashytor log sheet number month day year day number spectroradi ometer serial number( s ) and mea surement mode( s ) The PGampE and SERI not e s do not include the dai ly l og sheet number The f i rst two l ines are followed by f i eld no te s No tes that were added after inspec t i on at SERI are s eparat d from the operator notes wi th ------- The exi s tence of s l ides or photographs i s ind i cat ed a s wel l a s their qua l i ty i e good ( G ) marginal ( M ) or poor ( P ) In the exampl e in thi s f i gure there were two log sheets for thi s day (number 1 1 6 and 1 1 7 ) because the mea surement mode changed from gl obal hor i z onshytal ( GH ) to global t i l t ( GT )
44
TR-3513A
N FSEC87 1 2 2 1 1 6 0 5 0 2 8 7 1 2 2 1 7 2 DN 1 0 2 GH Clear at 0 7 3 0 GH f o r f ir s t two s cans then GT S l i de s 0 6 3 2 G
0 7 3 3 G 0 8 3 3 G 0 9 3 3 H ( dark ) 1 0 3 3 p1 1 3 3 p1 2 3 3 p 1 3 3 3 p1433 H 1 5 3 3 G 1633 G 1733 G
1 1 7 0 5 0 2 87 1 2 2 1 7 2 DN 1 0 2 GT GT s tart ing at 0 8 0 0 iacuteC lear a t 0 8 0 0 iacuteS l ides S e e above
16 1 1 8 0 5 0 3 8 7 1 2 3 1 7 2 DN 1 0 2 GT Clear at 0830 S l i de s 0633 G
0733 G 0833 G 0933 H ( dark ) 1 0 3 3 p1 1 3 3 p 1233 p 1333 p1433 H 1533 G 1633 G 1733 G
N FSEC87 1 2 3
Figure 6-4 Examples of daily notes on the data-base tape
An example o f a segment of the measurement uncertainty file UNCERT CAL i s shown in Figure 6-5 The f i r s t l ine begins with a U followed by the serial number of the s pect rorad i ometer The upper and lower measurement uncertainty l imi t s are given in the co lumns fol lowing wavelength wi th the appropri a t e measur ement mode dat es and de script ion at the top o f the column The s econd l ine in each segment o f the DAT f i l e s is a pointer to the correct uncershytainty information in UNCERT CAL The broadband s o lar radiat i on and meteshyorolog ical instrument measurement uncertainty fol lows each spectra l measureshyment uncertainty segment in UNCERT CAL
The format o f thi s data ba se was es tabl i shed at SERI t o accommodat e expanded mul t i year long-term data collect ion Users can reformat the data t o suit their part icular needs We recommend the following s t eps for acce s s ing and document ing parti cular data set s
1 Se lect and extract the des ired spectral data from the DAT f i l e s us i ng in formation such as measurement mode day number t ime air mas s or a moshys pheric condi t ions depending on the de s i red attribut es
2 Ex trac t and review the corres ponding segment s of the qua l i ty-cont rol i n format i on from the QC f i l es
3 Ex trac t and review the corres pond ing field no tes from the NOTES f i l e s
4 5
+ I -
5 4
3 7
TR- 3 5 13A
U PRS - 1 0 2 L I -COR PRS - 1 0 2 i
1 2 3 4 5 Ill
Wav GHS GHS GHS GHS GTS GTS GTS GTS Kt gt 6 0 Kt gt 6 0 Kt gt 60 Kt gt 6 0 iacutel ower lower upper upper 2 8 7 - 8 8 7 -8 8 7 5 8 8 GNS GNS
upper upper lower l ower
+ 1 -
- GHS GHS GTS GTS Kt lt 60 Kt lt 6 0 upper uppe r l ower l ower + I - + I -2 8 7 - 8 8 7 -8 87 5 - 8 8
3 0 0 - 1 0 0 0 - 1 00 0 1 0 0 0 1 0 0 0 3 0 2 - 1 0 0 0 - 1 0 0 0 1 0 0 0 1 0 0 0
4 0 0 - 2 3 3 - 1 7 1 1 5 3 9 1 4 0 2 iacute -2 2 0 - 1 7 3 1 4 0 9 3
5 0 0 - 1 3 4 - 1 1 7 3 7 5 0 2 iacute - 1 3 3 - 1 1 7 5 3 3 7
6 0 0 - 1 1 8 - 1 1 1 3 8 3 1 6 0 2 - 1 1 9 - 1 1 1 3 9 3 1
7 0 0 - 1 1 5 - 1 0 7 3 5 2 7 7 0 2 - 1 1 3 - 1 0 7 3 3 2 7
8 0 0 - 1 1 6 - 1 0 6 3 6 2 6 8 0 2 - 11 7 - 1 0 6 3 7 2 6
9 0 0 - 1 1 2 - 1 0 5 3 2 2 5 9 0 2 - 1 1 4 - 1 0 8 3 4 2 8
1 0 0 0 - 1 1 7 - 1 0 8 2 8 1 0 0 2 - 1 1 8 - 1 0 8 3 8 2 8
1 1 0 0 - 1 2 9 - 12 2 4 9 4 2
Figure 6-5 Examples of spe ctral measurement uncertainty on the data-base tape A value of plusmn100 indi cates greater t han 100 measurement uncertainty
46
TR-35 13A
4 Extract the measurement uncertainty information from the 1 1 UNCERT f i l e s and quot e mea surement uncertainty for a l l data used
5 Examine the dai l y broadband and spec tral solar radiatio data graphs in the catalog ( Volume I I of thi s report [ 1 8 ] i f avai labl e These graphs provide informa t i on on atmo spheric condi t i ons during the day For exampl e Figure 4-3 shows dai l y broadband and spec tral plot s for part ly c loudy condi t i ons when s olar rad i a t i on i s changing rapidly throughout the day The sun i s obs cured when the direc t-normal values drop t o zero and the gl obal value s approach each o ther Figure 4-1 shows a clear daybull
No data should be used wi thout consult ing the qua l i ty-control informa t i on dai ly no tes and measurement uncertainty
4 7
Cel l s
Ce l l s
Energy
Meteorologi cal Society
Appl i ed Meteorol ogy
Energy
Radiat ion Topical Overview Solar Cel l s Vo l 1 8
of the Pho tovo l t a i c s and Insolat ion Mea sureshySolar Vol 1 8 1 986 pp 393-3 9 5
TR-35 1 3A
1 0 REFERENCES
1 Hul st rom R L Solar 1 986 PPbull 1 7 9- 1 8 7
2 Hul st rom R L A Summary ments Workshop Panel Resul t s
3 Hul strom R L Re sul t s of the Amorphous S i l i con Mea surement s Ta sk Force Solar Cel l s Vo l 18 1 986 pp 1 7 1-1 7 7
4 Hul strom R L and J M Ohi Resul t s of the SERI Mul t i junction Devi ce Efficiency Measurement Task Forc e pre sented at the 20th I EEE Photovo lshytaic Spec ial i s t s Conference September 1 988
5 Riordan c and R L Hul s t rom Summary of S tud i e s that Examine the Effec t s of Spect ral Solar Radition Vari at ions on PV Device Des ign and Pershyformance SERI-TR-2 15-343 7 Golden CO Solar Energy Research Ins t i tute 1989
6 Riordan c Joint EPRI-SERI Spectral Solar Rad i a t i on Database Pro j ec t
1
8
9
1 0
1 1
1 2
1 3
14
Solar Vol 2 1 1 98 7 pp 3 3 7-342
Riordan c D Myers M Rymes R Hul strom W Mar i on c Jenning s and c Whi taker Spectral Solar Radiat ion Data Bas e at SERI Solar Vol 42 No 1 1 989 PP bull 6 7-79
Riordan C J T L Stoffe l and R L Hul s trom The Effect s of Urban Air Pollut ion on Solar Radiat i on SERI-TR-2 15-3482 Golden CO Solar Energy Res arch I n s t i tute ( draft ) 1989
Riordan c and R Hul s t rom The SERI Re s ource As ses sment Project s Plan for Col l ect ing Spectral-Solar-I rradiance Data SERI -TR-21 5-2948 Gol den CO Solar Energy Re search Ins t i tut e 1986
Shaw G E Sun Pho tometry Bul letin Ameri can Vol 64 No 1 January 1983 pp 4-10
Iqbal M bull An Int roduction to Solar Radiation New York Academic Pre s s
1983
Bartel s R A Comment s on Prec ipi table Water Mea surement s with Sun Photometer s Journal of Cl imate and Vol 25 1 986 PP bull 1 788- 1 789
Leckner B The Spectral Distribution o f Solar Radiat ion at the Earth s Surface -- El ements of a Model Solar Vol 20 1 9 7 8 pp 143- 1 5 0
Cannon T W Spectral So lar Irradiance Instrumentat i on and Measurement Techniques Solar Cel l s Vol 1 8 1986 pp 2 3 3-24 1
48
Energy
Photogrammetric Engineering
TR 3 5 13A
1 5 Myers D R E s t imate s of Uncertainty for Measured Spec tra in the SERI Spectral Solar Radiat i on Data Base ac cepted by Solar 1 98 9
1 6 Myers D R E s t imates of Uncertainty for Measured Spectra in the SERI Spec tral Solar Radiat i on Data aa s e 11 SERI e_clmical Report Golden CO S o l ar Energy Res earch Ins t i tute ( draft ) 1989
middot
1 7 Hul s trom R L The Cl oud Bright Spo t 1 9 73 PP bull 3 7 0-3 7 6
18 Ri ordan c D Myer s and R Hul s t rom Spectral Scflar Raltfiation Data Base Documentat i on and User 1 s Manual Vo lume I I SERI-TR-2 15-3 5 1 3 Golden CO Solar Energy Re search Ins t i tut e 1989
49
TR- 3 5 1 3A
APPENDIX
QUALITY-CONTROL PROCESSING
Limi ted qua l i ty-control proces s ing wa s appl i ed to the data ba se as de s c r i bed below The resul t s are i n the QC f i l es on the data-base t ape by s i t e year and mont h For examp l e
FLA8705 QC i s FSEC 1 98 7 May PGE8 80 l QC i s PGampE 1 9 8 8 January SER8 7 l l QC i s SERI 1 98 7 November
These f i l e s correspond t o the 11 OAT f i les for the s ame s i t e year and month Each data segment that includes a spectrum wa s proces sed through thi s quali ty-control procedure I f the atmospheric cond i t i on s were uns tab l e and a spectrum was not acquired the broadband and meteorologi cal data were inc l uded on the data-base tape but no qua l i ty-contro l proc e s s ing wa s app l i ed
An example o f a segment of a 11 QC f i l e i s shown in F i gure 6-3 The f i r s t Q l ine beg ins wi th a fol l owed by the s i t e year day and t ime s tamp The
last columns give the number of l ines in the s egment so the user can skip to the next s egment Fo l l owing the f i r s t l ine are me s sages that were printed whenever the qua l i ty-control proce s s ing f lagged a suspect or poor value
Following the mes sages in an SO-character QC l ine l i s t ing the variables that were examined are one of three qua l i ty-control code s 1 good 2 marg inal or suspect and 3 mi s s ing or poor The QC l ine was prepared using an automa t i c ( computeri zed ) check of the variabl e s and manual edi t ing to include informashyt ion from correspondence l og sheet s and vi sual inspe ct i on Addi t i onal me sshysages were added above the QC l ine if appropriate
The two-charact er descriptors in the QC l ine are
DN Direct-normal ( thermopi l e ) solar radiat ion before the spectral s can DN Direct-normal ( thermopi l e ) so lar radiation after the spectra l scan SN Direct-normal ( s i l i c on ) before SN Direct-normal ( s i l i c on ) after GN Globa l-normal before GN Globa l-normal after GH Globa l -horizontal ( thermop i l e ) before
WS Wind Speed KT KKN K
t n
GH Global-hori zontal thermopil e ) after SH Global-hori zontal ( s i l i con ) before SH Global-hori zontal ( s i l icon ) after GT Global-t i l t before GT Gl obal- t i l t after AL Al bedo ( Wm ) AP Albedo ( ) PR Surface Pres sure TC Temperature ( deg C ) RH Relat ive Humi dity WV Water Vapor ( al culated from rel a t i ve humidity)
5 0
S- flllit = - ( middotmiddot middot
( e g Wm2 )
TR-3 5 1 3A
DG D GH SP F i r s t Sp qtrum I T Integral of t he F i r s t Spec t rum SP Second Spectrum IT I nt egral of the - Second SpecttUI11
The aut oma t i c tes t s that were performed to det ermine the QC code fol l owing each var iable were
( a ) Check for mi s s ing or negat ive values for the broadband solar radiashyt i on meteoro l og i cal or a tmo spheric dat a or the spec t ral integral s
lt 0 = Code 2 Mi s s ing ( - 9 or -9 9 ) = Code 3
( b ) Check for atmo spheric or broadband instrument instab i l i ty us ing the difference and rat i o o f the before- and aft er-scan values and redundant mea surement s if nei t her values are negat i ve or mi s s ing
DN before DN after if the abs lute d i fference SN before SN after i s gt10 Wm DN beforeSN before 5 of 200 DN before SN after and GH before GH after SH beforeSH after the rat io i s lt0 95 or gt1 05 each of the GH before SH before two var iables = GH afterSH after or middot GN beforeGN after the rat i o i s lt0 90 or gt1 10 each of the GT beforeGT after two var iable s = Code 3
Code 2
( c ) Check for DN gt GN or GN gt ETR ( extraterre s trial solar radiat i on ) us 1ng rat ios of the var iabl e s
DN before GN before gt0 95 each variable = Code 2 DN afterGN after gt 1 0 each var i able = Code 3 GN before ETR GN afterETR
( d ) Check for values o f Kt Kn and DGH tha t are too high
KT ( invo lves GH before and after and KT ) KN ( involves DN before and after and KN ) DG ( invo lves DN and GH before and after and DG )
gt0 9 5 each variable = Code 2 gt 1 0 each var iable = Code 3
( e ) Check the s pe c t ral integral s for unusual rat i o s to the corresponding broadband so lar radiat ion value
IT ( Broadband va lue before and after )
For d i rect s pe c t ra lt 0 6 or gt0 8 5 I T = Code 2 For gl obal s pe c t ra lt0 7 o r gt0 95 I T = Code 2
For d i rect and g l obal s pec t ra lt0 5 or gt l O IT = Code 3
5 1
TR-35 13A
We sugge s t that users of the data ba s e develop a computer program to acc e s s fields i n the Q C l ine and t o print the me s sages Thi s l imi ted qua l i ty cont rol wi l l not f lag a l l po s s ible errors and addi t i onal t e s t s should be applied depend ing on the users requi rement s and appl icat i on s
52
1 1 2
Document Control SEAl Report No
Page 4 Title and Subtitle
NTIS Accession No 3 Recipients Accession No SERI TR- 2 1 5-35 13A DE89009447
5 Publication Date
January 1990 Sp ectral Solar Radiation Data Base Documentation
6Vo lume I
7 Author(s) 8 Performing Organization Rept No
9 Performing Organization Name and Address 10 ProjectTaskWork Unit No
1 1 Contract (C) or Grant (G) No
(C)
(G)
1 2 Sponsoring Organization Name and Address 13 Type of Report amp Period Covered
Solar Energy Res ear ch Ins titute Technical Repor t 1 6 1 7 Col e Boulevard Golden Colorado 804 0 1-3393 1 4
1 5 Supplementary Notes
16 Abstract (Limit 200 words) The Solar Energy Research Ins titute ( SERI) Electric Power Research Ins titute Flor ida Solar Energy Center and Pacific Gas and Electric Company cooperated to produce a spec tral solar radiation data base representing a range of atmospheric conditions These data will help to characterize the natural variab ility in the spectral (color) content o f outdoor solar radiation so that the sensitivity of spec trally selective solar devices ( such as photovoltaics ) to these variations c n b e s tudied quant itatively Volume I o f this report documents the history approach content and format of the data base Volume II contains graphs and field no tes for each of the spectral data sets The data res ide on magnetic tape at SERI
1 7 Document Analysis
a Descriptors Spec tral solar radiation broadband solar radiation met eorological
data sp ectroradiometers
b IdentifiersOpen-Ended Terms
c UC Categories
233 234
18 Availabil ity Statement
National Technical Information U S Depar tment of Commerce 5 285 Port Royal Road Springfield Virginia 2 2 1 6 1
Service 19 No of Pages
60
20 Price
A04
Form No 0069 (6-30-87)
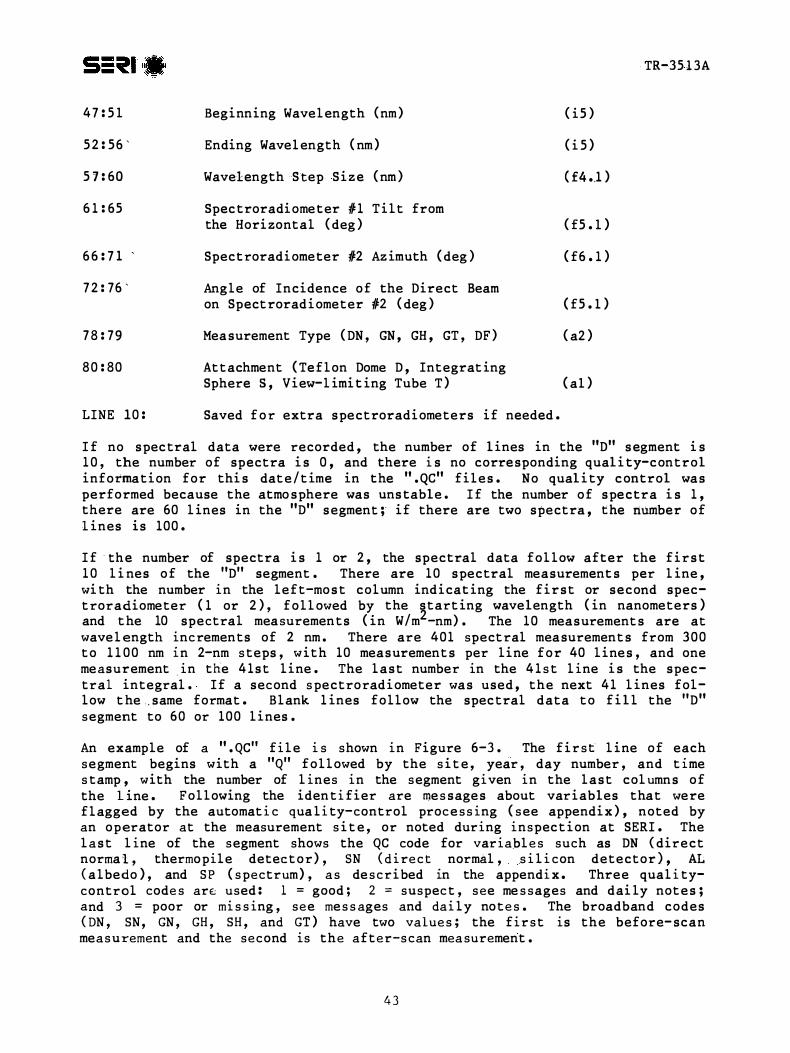
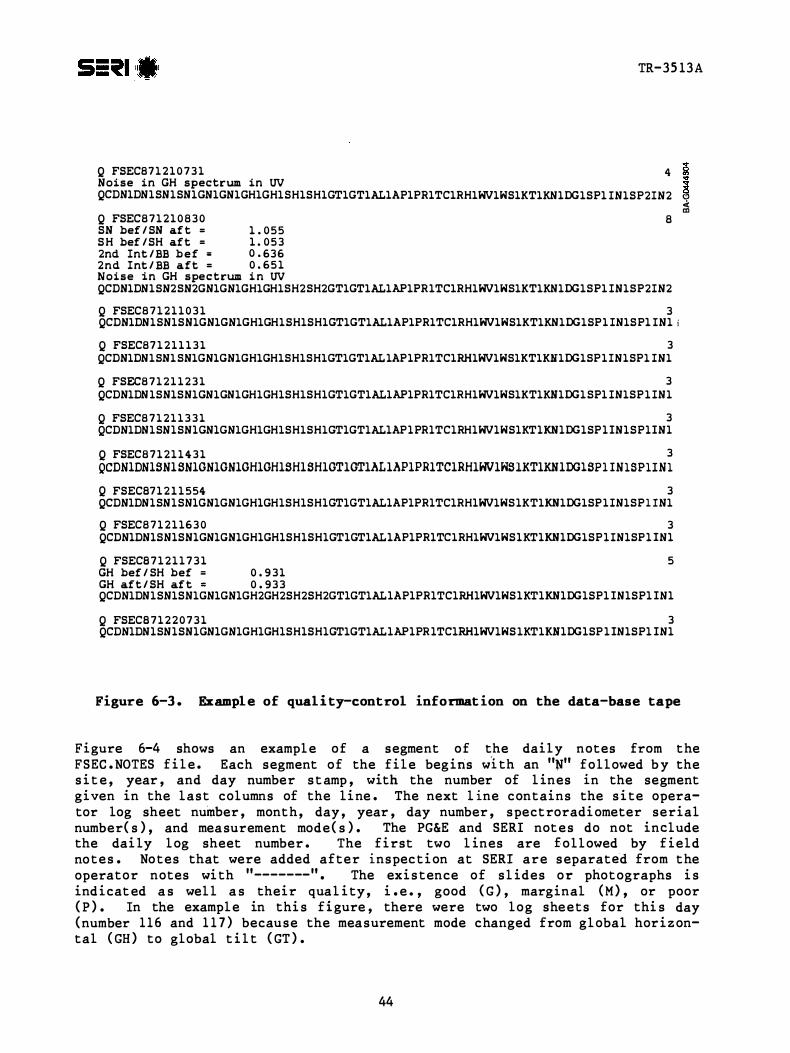
TR-35 13A
Q FSEC87 1 2 1 0 7 3 1 4 Noise in GH spectrum in UV QCDN1DN1SN1SN1GN1GN1GH1GH1SH1SH1GT1GT1AL1AP1PR1TC1RH1WV1WS1KT1KN1DG1SPl iN1SP2IN2
Q FSEC8 7 1 2 1 0 8 3 0 8 SN bef SN af t = 1 0 5 5 S H bef SH aft = 1 0 5 3 2nd Int BB b e f = 0 636 2nd Int BB aft = 0 6 5 1 Noise in GH spectrum i n UV QCDN1DN1SN2SN2GN1GN1GH1GH1SH2SH2GT1GT1AL1AP1PR1TC1RH1WV1WS1KT1KN1DG1SP1 IN1SP2IN2
Q FSEC8 7 1 2 1 1 0 3 1 3 QCDN1DN1SN1SN1GN1GN1GH1GH1SH1SH1GT1GT1AL1AP1PR1TC1RH1WV1WS1KT1KN1DG1SP1 IN1SPl iNl iacute
Q FSEC87 1 2 1 1 1 3 1 3 QCDN1DN1SN1 SN1GN1GN1GH1GH1SH1SH1GT1GT1AL 1AP1PR1TC1RH1WV1WS1KT1KH1DG1SP 1 IN1SP1 IN1
Q FSEC8 7 1 2 1 1 2 3 1 3 QCDN1DN 1SN1SN1GN1GN1GH1GH1SH1SH1GT1GT1AL1AP1PR1TC1RH1WV1WS1KT1KN1DG1 SP1 IN1SP 1 IN1
Q FSEC8 7 1 2 1 1 3 3 1 3 QCDN1DN1SNlSNlGNlGN1GH1GH1SH1SH1GTlGTlALlAPlPRlTClRHlWVlWSlKTlKNlDGlSP l iNlSPliNl
Q FSEC8 7 1 2 1 1 4 3 1 3QCDNlDNlSNlSNlGNlGNlGHlGHlSHlSHlGTlGTlALlAPlPRlTClRHlHVlHSlKTlKNlDGlSPl iN1SP1IN1 Q FSECB7 1 2 1 1 554 3 QCDNlDNlSNlSNlGNlGNlGHlGHlSHlSHlGTlGTlALlAPlPRlTClRHlWV1WSlKT1KN1DG1SP 1 IN1SP l iN1
Q FSEC8 7 1 2 1 16 3 0 3 QCDNlDNlSNlSNlGNlGNlGHlGHlSHlSHlGTlGTlALlAPlPRlTC1RH1WV1WSlKTlKNlDG1SP l iNlSPl iNl
Q FSECB 7 1 2 1 1 7 3 1 5 GH bef SH bef = 0 9 3 1 GH aft SH af t = 0 9 3 3 QCDN1DN1SN1SN1GN1GNlGH2GH2SH2SH2GTlGT1ALlAPlPRlTClRHlWVlWSlKTlKNlDGlSPl iNlSPl iNl
Q FSECB 7 1 2 2 0 7 3 1 3 QCDNlDNlSNlSNlGNlGNlGHlGHlSHlSHlGT1GTlALlAPlPRlTClRHlWVlWS 1KT1KNlDGlSP l iNlSPl iNl
Figure 6-3 Example of quali ty-control inf ormation on the data- base tape
Figure 6-4 shows an exampl e of a segment of the daily notes from the FSEC NOTES f i l e Each segment of the f i l e beg ins wi th an followed b y the s i t e year and day number s t amp with the number of l ines in the segment given in the last columns of the l i ne The next l ine contains the s i te operashytor log sheet number month day year day number spectroradi ometer serial number( s ) and mea surement mode( s ) The PGampE and SERI not e s do not include the dai ly l og sheet number The f i rst two l ines are followed by f i eld no te s No tes that were added after inspec t i on at SERI are s eparat d from the operator notes wi th ------- The exi s tence of s l ides or photographs i s ind i cat ed a s wel l a s their qua l i ty i e good ( G ) marginal ( M ) or poor ( P ) In the exampl e in thi s f i gure there were two log sheets for thi s day (number 1 1 6 and 1 1 7 ) because the mea surement mode changed from gl obal hor i z onshytal ( GH ) to global t i l t ( GT )
44
TR-3513A
N FSEC87 1 2 2 1 1 6 0 5 0 2 8 7 1 2 2 1 7 2 DN 1 0 2 GH Clear at 0 7 3 0 GH f o r f ir s t two s cans then GT S l i de s 0 6 3 2 G
0 7 3 3 G 0 8 3 3 G 0 9 3 3 H ( dark ) 1 0 3 3 p1 1 3 3 p1 2 3 3 p 1 3 3 3 p1433 H 1 5 3 3 G 1633 G 1733 G
1 1 7 0 5 0 2 87 1 2 2 1 7 2 DN 1 0 2 GT GT s tart ing at 0 8 0 0 iacuteC lear a t 0 8 0 0 iacuteS l ides S e e above
16 1 1 8 0 5 0 3 8 7 1 2 3 1 7 2 DN 1 0 2 GT Clear at 0830 S l i de s 0633 G
0733 G 0833 G 0933 H ( dark ) 1 0 3 3 p1 1 3 3 p 1233 p 1333 p1433 H 1533 G 1633 G 1733 G
N FSEC87 1 2 3
Figure 6-4 Examples of daily notes on the data-base tape
An example o f a segment of the measurement uncertainty file UNCERT CAL i s shown in Figure 6-5 The f i r s t l ine begins with a U followed by the serial number of the s pect rorad i ometer The upper and lower measurement uncertainty l imi t s are given in the co lumns fol lowing wavelength wi th the appropri a t e measur ement mode dat es and de script ion at the top o f the column The s econd l ine in each segment o f the DAT f i l e s is a pointer to the correct uncershytainty information in UNCERT CAL The broadband s o lar radiat i on and meteshyorolog ical instrument measurement uncertainty fol lows each spectra l measureshyment uncertainty segment in UNCERT CAL
The format o f thi s data ba se was es tabl i shed at SERI t o accommodat e expanded mul t i year long-term data collect ion Users can reformat the data t o suit their part icular needs We recommend the following s t eps for acce s s ing and document ing parti cular data set s
1 Se lect and extract the des ired spectral data from the DAT f i l e s us i ng in formation such as measurement mode day number t ime air mas s or a moshys pheric condi t ions depending on the de s i red attribut es
2 Ex trac t and review the corres ponding segment s of the qua l i ty-cont rol i n format i on from the QC f i l es
3 Ex trac t and review the corres pond ing field no tes from the NOTES f i l e s
4 5
+ I -
5 4
3 7
TR- 3 5 13A
U PRS - 1 0 2 L I -COR PRS - 1 0 2 i
1 2 3 4 5 Ill
Wav GHS GHS GHS GHS GTS GTS GTS GTS Kt gt 6 0 Kt gt 6 0 Kt gt 60 Kt gt 6 0 iacutel ower lower upper upper 2 8 7 - 8 8 7 -8 8 7 5 8 8 GNS GNS
upper upper lower l ower
+ 1 -
- GHS GHS GTS GTS Kt lt 60 Kt lt 6 0 upper uppe r l ower l ower + I - + I -2 8 7 - 8 8 7 -8 87 5 - 8 8
3 0 0 - 1 0 0 0 - 1 00 0 1 0 0 0 1 0 0 0 3 0 2 - 1 0 0 0 - 1 0 0 0 1 0 0 0 1 0 0 0
4 0 0 - 2 3 3 - 1 7 1 1 5 3 9 1 4 0 2 iacute -2 2 0 - 1 7 3 1 4 0 9 3
5 0 0 - 1 3 4 - 1 1 7 3 7 5 0 2 iacute - 1 3 3 - 1 1 7 5 3 3 7
6 0 0 - 1 1 8 - 1 1 1 3 8 3 1 6 0 2 - 1 1 9 - 1 1 1 3 9 3 1
7 0 0 - 1 1 5 - 1 0 7 3 5 2 7 7 0 2 - 1 1 3 - 1 0 7 3 3 2 7
8 0 0 - 1 1 6 - 1 0 6 3 6 2 6 8 0 2 - 11 7 - 1 0 6 3 7 2 6
9 0 0 - 1 1 2 - 1 0 5 3 2 2 5 9 0 2 - 1 1 4 - 1 0 8 3 4 2 8
1 0 0 0 - 1 1 7 - 1 0 8 2 8 1 0 0 2 - 1 1 8 - 1 0 8 3 8 2 8
1 1 0 0 - 1 2 9 - 12 2 4 9 4 2
Figure 6-5 Examples of spe ctral measurement uncertainty on the data-base tape A value of plusmn100 indi cates greater t han 100 measurement uncertainty
46
TR-35 13A
4 Extract the measurement uncertainty information from the 1 1 UNCERT f i l e s and quot e mea surement uncertainty for a l l data used
5 Examine the dai l y broadband and spec tral solar radiatio data graphs in the catalog ( Volume I I of thi s report [ 1 8 ] i f avai labl e These graphs provide informa t i on on atmo spheric condi t i ons during the day For exampl e Figure 4-3 shows dai l y broadband and spec tral plot s for part ly c loudy condi t i ons when s olar rad i a t i on i s changing rapidly throughout the day The sun i s obs cured when the direc t-normal values drop t o zero and the gl obal value s approach each o ther Figure 4-1 shows a clear daybull
No data should be used wi thout consult ing the qua l i ty-control informa t i on dai ly no tes and measurement uncertainty
4 7
Cel l s
Ce l l s
Energy
Meteorologi cal Society
Appl i ed Meteorol ogy
Energy
Radiat ion Topical Overview Solar Cel l s Vo l 1 8
of the Pho tovo l t a i c s and Insolat ion Mea sureshySolar Vol 1 8 1 986 pp 393-3 9 5
TR-35 1 3A
1 0 REFERENCES
1 Hul st rom R L Solar 1 986 PPbull 1 7 9- 1 8 7
2 Hul st rom R L A Summary ments Workshop Panel Resul t s
3 Hul strom R L Re sul t s of the Amorphous S i l i con Mea surement s Ta sk Force Solar Cel l s Vo l 18 1 986 pp 1 7 1-1 7 7
4 Hul strom R L and J M Ohi Resul t s of the SERI Mul t i junction Devi ce Efficiency Measurement Task Forc e pre sented at the 20th I EEE Photovo lshytaic Spec ial i s t s Conference September 1 988
5 Riordan c and R L Hul s t rom Summary of S tud i e s that Examine the Effec t s of Spect ral Solar Radition Vari at ions on PV Device Des ign and Pershyformance SERI-TR-2 15-343 7 Golden CO Solar Energy Research Ins t i tute 1989
6 Riordan c Joint EPRI-SERI Spectral Solar Rad i a t i on Database Pro j ec t
1
8
9
1 0
1 1
1 2
1 3
14
Solar Vol 2 1 1 98 7 pp 3 3 7-342
Riordan c D Myers M Rymes R Hul strom W Mar i on c Jenning s and c Whi taker Spectral Solar Radiat ion Data Bas e at SERI Solar Vol 42 No 1 1 989 PP bull 6 7-79
Riordan C J T L Stoffe l and R L Hul s trom The Effect s of Urban Air Pollut ion on Solar Radiat i on SERI-TR-2 15-3482 Golden CO Solar Energy Res arch I n s t i tute ( draft ) 1989
Riordan c and R Hul s t rom The SERI Re s ource As ses sment Project s Plan for Col l ect ing Spectral-Solar-I rradiance Data SERI -TR-21 5-2948 Gol den CO Solar Energy Re search Ins t i tut e 1986
Shaw G E Sun Pho tometry Bul letin Ameri can Vol 64 No 1 January 1983 pp 4-10
Iqbal M bull An Int roduction to Solar Radiation New York Academic Pre s s
1983
Bartel s R A Comment s on Prec ipi table Water Mea surement s with Sun Photometer s Journal of Cl imate and Vol 25 1 986 PP bull 1 788- 1 789
Leckner B The Spectral Distribution o f Solar Radiat ion at the Earth s Surface -- El ements of a Model Solar Vol 20 1 9 7 8 pp 143- 1 5 0
Cannon T W Spectral So lar Irradiance Instrumentat i on and Measurement Techniques Solar Cel l s Vol 1 8 1986 pp 2 3 3-24 1
48
Energy
Photogrammetric Engineering
TR 3 5 13A
1 5 Myers D R E s t imate s of Uncertainty for Measured Spec tra in the SERI Spectral Solar Radiat i on Data Base ac cepted by Solar 1 98 9
1 6 Myers D R E s t imates of Uncertainty for Measured Spectra in the SERI Spec tral Solar Radiat i on Data aa s e 11 SERI e_clmical Report Golden CO S o l ar Energy Res earch Ins t i tute ( draft ) 1989
middot
1 7 Hul s trom R L The Cl oud Bright Spo t 1 9 73 PP bull 3 7 0-3 7 6
18 Ri ordan c D Myer s and R Hul s t rom Spectral Scflar Raltfiation Data Base Documentat i on and User 1 s Manual Vo lume I I SERI-TR-2 15-3 5 1 3 Golden CO Solar Energy Re search Ins t i tut e 1989
49
TR- 3 5 1 3A
APPENDIX
QUALITY-CONTROL PROCESSING
Limi ted qua l i ty-control proces s ing wa s appl i ed to the data ba se as de s c r i bed below The resul t s are i n the QC f i l es on the data-base t ape by s i t e year and mont h For examp l e
FLA8705 QC i s FSEC 1 98 7 May PGE8 80 l QC i s PGampE 1 9 8 8 January SER8 7 l l QC i s SERI 1 98 7 November
These f i l e s correspond t o the 11 OAT f i les for the s ame s i t e year and month Each data segment that includes a spectrum wa s proces sed through thi s quali ty-control procedure I f the atmospheric cond i t i on s were uns tab l e and a spectrum was not acquired the broadband and meteorologi cal data were inc l uded on the data-base tape but no qua l i ty-contro l proc e s s ing wa s app l i ed
An example o f a segment of a 11 QC f i l e i s shown in F i gure 6-3 The f i r s t Q l ine beg ins wi th a fol l owed by the s i t e year day and t ime s tamp The
last columns give the number of l ines in the s egment so the user can skip to the next s egment Fo l l owing the f i r s t l ine are me s sages that were printed whenever the qua l i ty-control proce s s ing f lagged a suspect or poor value
Following the mes sages in an SO-character QC l ine l i s t ing the variables that were examined are one of three qua l i ty-control code s 1 good 2 marg inal or suspect and 3 mi s s ing or poor The QC l ine was prepared using an automa t i c ( computeri zed ) check of the variabl e s and manual edi t ing to include informashyt ion from correspondence l og sheet s and vi sual inspe ct i on Addi t i onal me sshysages were added above the QC l ine if appropriate
The two-charact er descriptors in the QC l ine are
DN Direct-normal ( thermopi l e ) solar radiat ion before the spectral s can DN Direct-normal ( thermopi l e ) so lar radiation after the spectra l scan SN Direct-normal ( s i l i c on ) before SN Direct-normal ( s i l i c on ) after GN Globa l-normal before GN Globa l-normal after GH Globa l -horizontal ( thermop i l e ) before
WS Wind Speed KT KKN K
t n
GH Global-hori zontal thermopil e ) after SH Global-hori zontal ( s i l i con ) before SH Global-hori zontal ( s i l icon ) after GT Global-t i l t before GT Gl obal- t i l t after AL Al bedo ( Wm ) AP Albedo ( ) PR Surface Pres sure TC Temperature ( deg C ) RH Relat ive Humi dity WV Water Vapor ( al culated from rel a t i ve humidity)
5 0
S- flllit = - ( middotmiddot middot
( e g Wm2 )
TR-3 5 1 3A
DG D GH SP F i r s t Sp qtrum I T Integral of t he F i r s t Spec t rum SP Second Spectrum IT I nt egral of the - Second SpecttUI11
The aut oma t i c tes t s that were performed to det ermine the QC code fol l owing each var iable were
( a ) Check for mi s s ing or negat ive values for the broadband solar radiashyt i on meteoro l og i cal or a tmo spheric dat a or the spec t ral integral s
lt 0 = Code 2 Mi s s ing ( - 9 or -9 9 ) = Code 3
( b ) Check for atmo spheric or broadband instrument instab i l i ty us ing the difference and rat i o o f the before- and aft er-scan values and redundant mea surement s if nei t her values are negat i ve or mi s s ing
DN before DN after if the abs lute d i fference SN before SN after i s gt10 Wm DN beforeSN before 5 of 200 DN before SN after and GH before GH after SH beforeSH after the rat io i s lt0 95 or gt1 05 each of the GH before SH before two var iables = GH afterSH after or middot GN beforeGN after the rat i o i s lt0 90 or gt1 10 each of the GT beforeGT after two var iable s = Code 3
Code 2
( c ) Check for DN gt GN or GN gt ETR ( extraterre s trial solar radiat i on ) us 1ng rat ios of the var iabl e s
DN before GN before gt0 95 each variable = Code 2 DN afterGN after gt 1 0 each var i able = Code 3 GN before ETR GN afterETR
( d ) Check for values o f Kt Kn and DGH tha t are too high
KT ( invo lves GH before and after and KT ) KN ( involves DN before and after and KN ) DG ( invo lves DN and GH before and after and DG )
gt0 9 5 each variable = Code 2 gt 1 0 each var iable = Code 3
( e ) Check the s pe c t ral integral s for unusual rat i o s to the corresponding broadband so lar radiat ion value
IT ( Broadband va lue before and after )
For d i rect s pe c t ra lt 0 6 or gt0 8 5 I T = Code 2 For gl obal s pe c t ra lt0 7 o r gt0 95 I T = Code 2
For d i rect and g l obal s pec t ra lt0 5 or gt l O IT = Code 3
5 1
TR-35 13A
We sugge s t that users of the data ba s e develop a computer program to acc e s s fields i n the Q C l ine and t o print the me s sages Thi s l imi ted qua l i ty cont rol wi l l not f lag a l l po s s ible errors and addi t i onal t e s t s should be applied depend ing on the users requi rement s and appl icat i on s
52
1 1 2
Document Control SEAl Report No
Page 4 Title and Subtitle
NTIS Accession No 3 Recipients Accession No SERI TR- 2 1 5-35 13A DE89009447
5 Publication Date
January 1990 Sp ectral Solar Radiation Data Base Documentation
6Vo lume I
7 Author(s) 8 Performing Organization Rept No
9 Performing Organization Name and Address 10 ProjectTaskWork Unit No
1 1 Contract (C) or Grant (G) No
(C)
(G)
1 2 Sponsoring Organization Name and Address 13 Type of Report amp Period Covered
Solar Energy Res ear ch Ins titute Technical Repor t 1 6 1 7 Col e Boulevard Golden Colorado 804 0 1-3393 1 4
1 5 Supplementary Notes
16 Abstract (Limit 200 words) The Solar Energy Research Ins titute ( SERI) Electric Power Research Ins titute Flor ida Solar Energy Center and Pacific Gas and Electric Company cooperated to produce a spec tral solar radiation data base representing a range of atmospheric conditions These data will help to characterize the natural variab ility in the spectral (color) content o f outdoor solar radiation so that the sensitivity of spec trally selective solar devices ( such as photovoltaics ) to these variations c n b e s tudied quant itatively Volume I o f this report documents the history approach content and format of the data base Volume II contains graphs and field no tes for each of the spectral data sets The data res ide on magnetic tape at SERI
1 7 Document Analysis
a Descriptors Spec tral solar radiation broadband solar radiation met eorological
data sp ectroradiometers
b IdentifiersOpen-Ended Terms
c UC Categories
233 234
18 Availabil ity Statement
National Technical Information U S Depar tment of Commerce 5 285 Port Royal Road Springfield Virginia 2 2 1 6 1
Service 19 No of Pages
60
20 Price
A04
Form No 0069 (6-30-87)
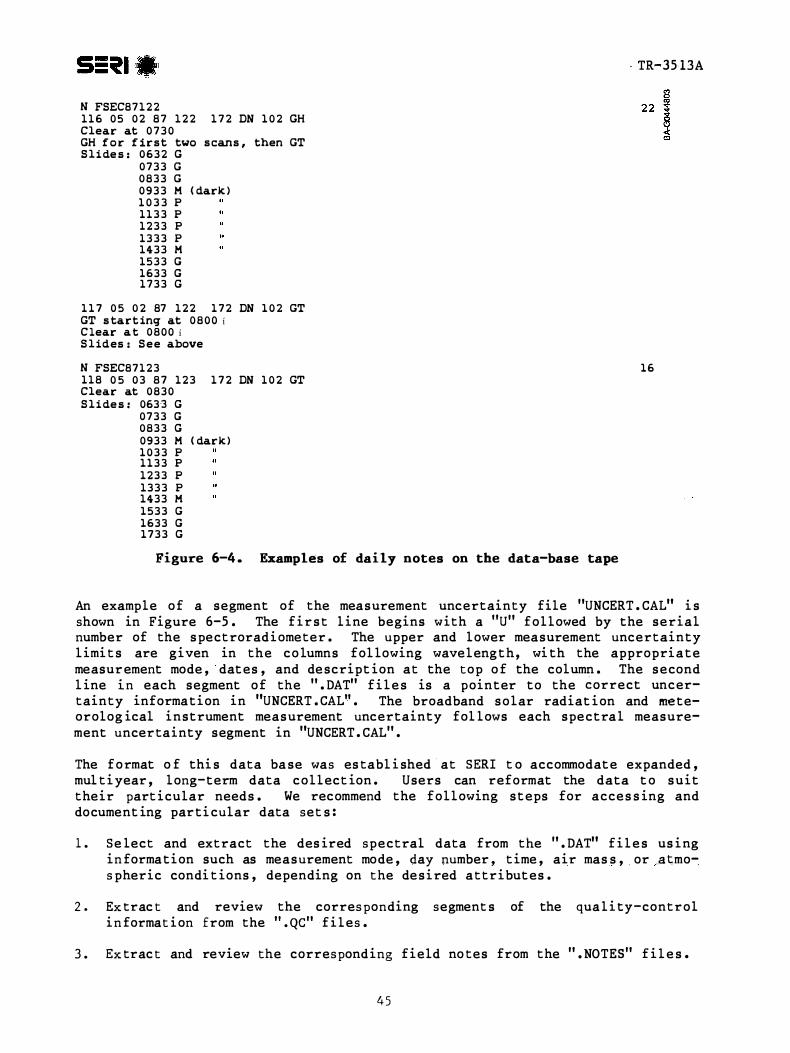
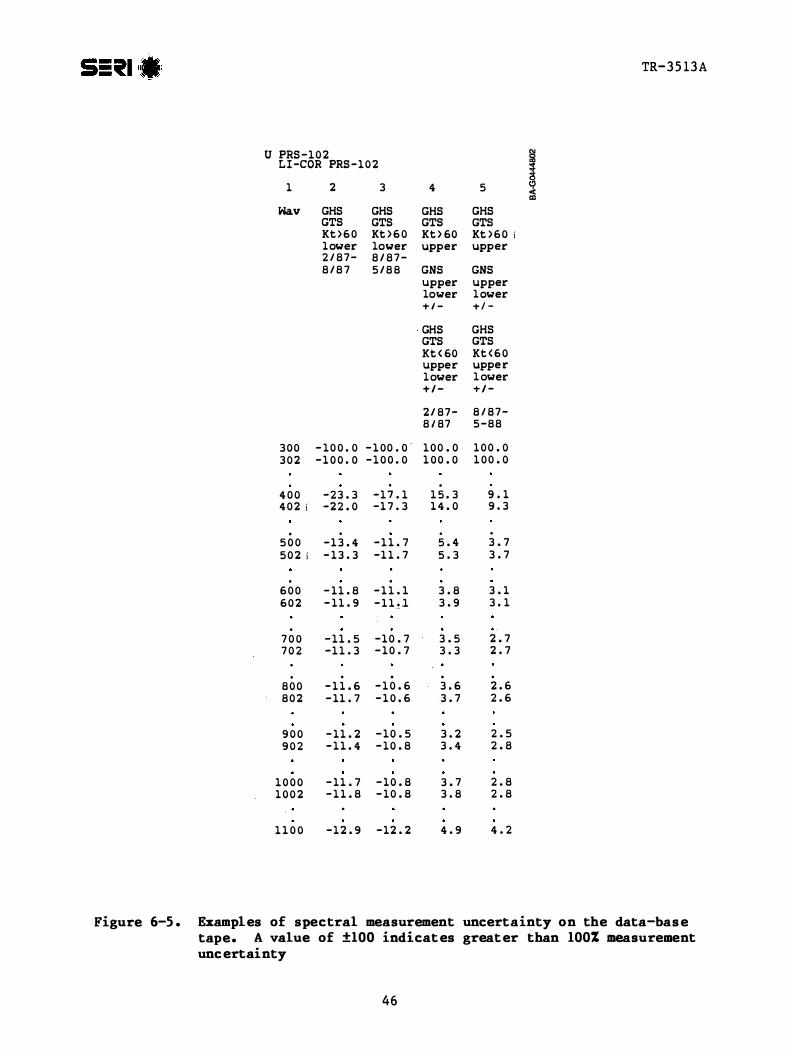
TR-35 13A
4 Extract the measurement uncertainty information from the 1 1 UNCERT f i l e s and quot e mea surement uncertainty for a l l data used
5 Examine the dai l y broadband and spec tral solar radiatio data graphs in the catalog ( Volume I I of thi s report [ 1 8 ] i f avai labl e These graphs provide informa t i on on atmo spheric condi t i ons during the day For exampl e Figure 4-3 shows dai l y broadband and spec tral plot s for part ly c loudy condi t i ons when s olar rad i a t i on i s changing rapidly throughout the day The sun i s obs cured when the direc t-normal values drop t o zero and the gl obal value s approach each o ther Figure 4-1 shows a clear daybull
No data should be used wi thout consult ing the qua l i ty-control informa t i on dai ly no tes and measurement uncertainty
4 7
Cel l s
Ce l l s
Energy
Meteorologi cal Society
Appl i ed Meteorol ogy
Energy
Radiat ion Topical Overview Solar Cel l s Vo l 1 8
of the Pho tovo l t a i c s and Insolat ion Mea sureshySolar Vol 1 8 1 986 pp 393-3 9 5
TR-35 1 3A
1 0 REFERENCES
1 Hul st rom R L Solar 1 986 PPbull 1 7 9- 1 8 7
2 Hul st rom R L A Summary ments Workshop Panel Resul t s
3 Hul strom R L Re sul t s of the Amorphous S i l i con Mea surement s Ta sk Force Solar Cel l s Vo l 18 1 986 pp 1 7 1-1 7 7
4 Hul strom R L and J M Ohi Resul t s of the SERI Mul t i junction Devi ce Efficiency Measurement Task Forc e pre sented at the 20th I EEE Photovo lshytaic Spec ial i s t s Conference September 1 988
5 Riordan c and R L Hul s t rom Summary of S tud i e s that Examine the Effec t s of Spect ral Solar Radition Vari at ions on PV Device Des ign and Pershyformance SERI-TR-2 15-343 7 Golden CO Solar Energy Research Ins t i tute 1989
6 Riordan c Joint EPRI-SERI Spectral Solar Rad i a t i on Database Pro j ec t
1
8
9
1 0
1 1
1 2
1 3
14
Solar Vol 2 1 1 98 7 pp 3 3 7-342
Riordan c D Myers M Rymes R Hul strom W Mar i on c Jenning s and c Whi taker Spectral Solar Radiat ion Data Bas e at SERI Solar Vol 42 No 1 1 989 PP bull 6 7-79
Riordan C J T L Stoffe l and R L Hul s trom The Effect s of Urban Air Pollut ion on Solar Radiat i on SERI-TR-2 15-3482 Golden CO Solar Energy Res arch I n s t i tute ( draft ) 1989
Riordan c and R Hul s t rom The SERI Re s ource As ses sment Project s Plan for Col l ect ing Spectral-Solar-I rradiance Data SERI -TR-21 5-2948 Gol den CO Solar Energy Re search Ins t i tut e 1986
Shaw G E Sun Pho tometry Bul letin Ameri can Vol 64 No 1 January 1983 pp 4-10
Iqbal M bull An Int roduction to Solar Radiation New York Academic Pre s s
1983
Bartel s R A Comment s on Prec ipi table Water Mea surement s with Sun Photometer s Journal of Cl imate and Vol 25 1 986 PP bull 1 788- 1 789
Leckner B The Spectral Distribution o f Solar Radiat ion at the Earth s Surface -- El ements of a Model Solar Vol 20 1 9 7 8 pp 143- 1 5 0
Cannon T W Spectral So lar Irradiance Instrumentat i on and Measurement Techniques Solar Cel l s Vol 1 8 1986 pp 2 3 3-24 1
48
Energy
Photogrammetric Engineering
TR 3 5 13A
1 5 Myers D R E s t imate s of Uncertainty for Measured Spec tra in the SERI Spectral Solar Radiat i on Data Base ac cepted by Solar 1 98 9
1 6 Myers D R E s t imates of Uncertainty for Measured Spectra in the SERI Spec tral Solar Radiat i on Data aa s e 11 SERI e_clmical Report Golden CO S o l ar Energy Res earch Ins t i tute ( draft ) 1989
middot
1 7 Hul s trom R L The Cl oud Bright Spo t 1 9 73 PP bull 3 7 0-3 7 6
18 Ri ordan c D Myer s and R Hul s t rom Spectral Scflar Raltfiation Data Base Documentat i on and User 1 s Manual Vo lume I I SERI-TR-2 15-3 5 1 3 Golden CO Solar Energy Re search Ins t i tut e 1989
49
TR- 3 5 1 3A
APPENDIX
QUALITY-CONTROL PROCESSING
Limi ted qua l i ty-control proces s ing wa s appl i ed to the data ba se as de s c r i bed below The resul t s are i n the QC f i l es on the data-base t ape by s i t e year and mont h For examp l e
FLA8705 QC i s FSEC 1 98 7 May PGE8 80 l QC i s PGampE 1 9 8 8 January SER8 7 l l QC i s SERI 1 98 7 November
These f i l e s correspond t o the 11 OAT f i les for the s ame s i t e year and month Each data segment that includes a spectrum wa s proces sed through thi s quali ty-control procedure I f the atmospheric cond i t i on s were uns tab l e and a spectrum was not acquired the broadband and meteorologi cal data were inc l uded on the data-base tape but no qua l i ty-contro l proc e s s ing wa s app l i ed
An example o f a segment of a 11 QC f i l e i s shown in F i gure 6-3 The f i r s t Q l ine beg ins wi th a fol l owed by the s i t e year day and t ime s tamp The
last columns give the number of l ines in the s egment so the user can skip to the next s egment Fo l l owing the f i r s t l ine are me s sages that were printed whenever the qua l i ty-control proce s s ing f lagged a suspect or poor value
Following the mes sages in an SO-character QC l ine l i s t ing the variables that were examined are one of three qua l i ty-control code s 1 good 2 marg inal or suspect and 3 mi s s ing or poor The QC l ine was prepared using an automa t i c ( computeri zed ) check of the variabl e s and manual edi t ing to include informashyt ion from correspondence l og sheet s and vi sual inspe ct i on Addi t i onal me sshysages were added above the QC l ine if appropriate
The two-charact er descriptors in the QC l ine are
DN Direct-normal ( thermopi l e ) solar radiat ion before the spectral s can DN Direct-normal ( thermopi l e ) so lar radiation after the spectra l scan SN Direct-normal ( s i l i c on ) before SN Direct-normal ( s i l i c on ) after GN Globa l-normal before GN Globa l-normal after GH Globa l -horizontal ( thermop i l e ) before
WS Wind Speed KT KKN K
t n
GH Global-hori zontal thermopil e ) after SH Global-hori zontal ( s i l i con ) before SH Global-hori zontal ( s i l icon ) after GT Global-t i l t before GT Gl obal- t i l t after AL Al bedo ( Wm ) AP Albedo ( ) PR Surface Pres sure TC Temperature ( deg C ) RH Relat ive Humi dity WV Water Vapor ( al culated from rel a t i ve humidity)
5 0
S- flllit = - ( middotmiddot middot
( e g Wm2 )
TR-3 5 1 3A
DG D GH SP F i r s t Sp qtrum I T Integral of t he F i r s t Spec t rum SP Second Spectrum IT I nt egral of the - Second SpecttUI11
The aut oma t i c tes t s that were performed to det ermine the QC code fol l owing each var iable were
( a ) Check for mi s s ing or negat ive values for the broadband solar radiashyt i on meteoro l og i cal or a tmo spheric dat a or the spec t ral integral s
lt 0 = Code 2 Mi s s ing ( - 9 or -9 9 ) = Code 3
( b ) Check for atmo spheric or broadband instrument instab i l i ty us ing the difference and rat i o o f the before- and aft er-scan values and redundant mea surement s if nei t her values are negat i ve or mi s s ing
DN before DN after if the abs lute d i fference SN before SN after i s gt10 Wm DN beforeSN before 5 of 200 DN before SN after and GH before GH after SH beforeSH after the rat io i s lt0 95 or gt1 05 each of the GH before SH before two var iables = GH afterSH after or middot GN beforeGN after the rat i o i s lt0 90 or gt1 10 each of the GT beforeGT after two var iable s = Code 3
Code 2
( c ) Check for DN gt GN or GN gt ETR ( extraterre s trial solar radiat i on ) us 1ng rat ios of the var iabl e s
DN before GN before gt0 95 each variable = Code 2 DN afterGN after gt 1 0 each var i able = Code 3 GN before ETR GN afterETR
( d ) Check for values o f Kt Kn and DGH tha t are too high
KT ( invo lves GH before and after and KT ) KN ( involves DN before and after and KN ) DG ( invo lves DN and GH before and after and DG )
gt0 9 5 each variable = Code 2 gt 1 0 each var iable = Code 3
( e ) Check the s pe c t ral integral s for unusual rat i o s to the corresponding broadband so lar radiat ion value
IT ( Broadband va lue before and after )
For d i rect s pe c t ra lt 0 6 or gt0 8 5 I T = Code 2 For gl obal s pe c t ra lt0 7 o r gt0 95 I T = Code 2
For d i rect and g l obal s pec t ra lt0 5 or gt l O IT = Code 3
5 1
TR-35 13A
We sugge s t that users of the data ba s e develop a computer program to acc e s s fields i n the Q C l ine and t o print the me s sages Thi s l imi ted qua l i ty cont rol wi l l not f lag a l l po s s ible errors and addi t i onal t e s t s should be applied depend ing on the users requi rement s and appl icat i on s
52
1 1 2
Document Control SEAl Report No
Page 4 Title and Subtitle
NTIS Accession No 3 Recipients Accession No SERI TR- 2 1 5-35 13A DE89009447
5 Publication Date
January 1990 Sp ectral Solar Radiation Data Base Documentation
6Vo lume I
7 Author(s) 8 Performing Organization Rept No
9 Performing Organization Name and Address 10 ProjectTaskWork Unit No
1 1 Contract (C) or Grant (G) No
(C)
(G)
1 2 Sponsoring Organization Name and Address 13 Type of Report amp Period Covered
Solar Energy Res ear ch Ins titute Technical Repor t 1 6 1 7 Col e Boulevard Golden Colorado 804 0 1-3393 1 4
1 5 Supplementary Notes
16 Abstract (Limit 200 words) The Solar Energy Research Ins titute ( SERI) Electric Power Research Ins titute Flor ida Solar Energy Center and Pacific Gas and Electric Company cooperated to produce a spec tral solar radiation data base representing a range of atmospheric conditions These data will help to characterize the natural variab ility in the spectral (color) content o f outdoor solar radiation so that the sensitivity of spec trally selective solar devices ( such as photovoltaics ) to these variations c n b e s tudied quant itatively Volume I o f this report documents the history approach content and format of the data base Volume II contains graphs and field no tes for each of the spectral data sets The data res ide on magnetic tape at SERI
1 7 Document Analysis
a Descriptors Spec tral solar radiation broadband solar radiation met eorological
data sp ectroradiometers
b IdentifiersOpen-Ended Terms
c UC Categories
233 234
18 Availabil ity Statement
National Technical Information U S Depar tment of Commerce 5 285 Port Royal Road Springfield Virginia 2 2 1 6 1
Service 19 No of Pages
60
20 Price
A04
Form No 0069 (6-30-87)
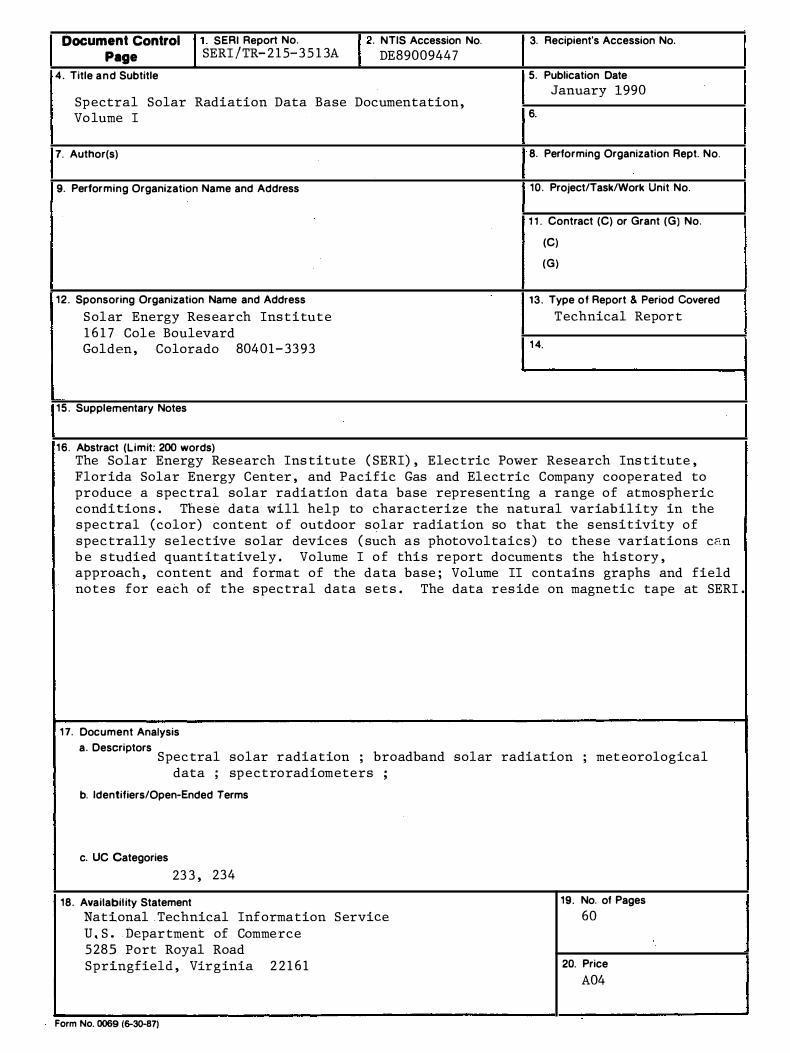