Embed Size (px)
Citation preview
Spectrally resolved fluorescent lifetime imaging
by Quentin S Hanley
InterfaceVolume 6(Suppl 1):S83-S92
February 6, 2009
©2009 by The Royal Society

The first known SFLIM system as reported by Vereb et al.
Quentin S Hanley J. R. Soc. Interface 2009;6:S83-S92
©2009 by The Royal Society

Comparison of the SFLIM data presented as either (a) lifetime spectra or (b) plotted in the AB-space.
Quentin S Hanley J. R. Soc. Interface 2009;6:S83-S92
©2009 by The Royal Society
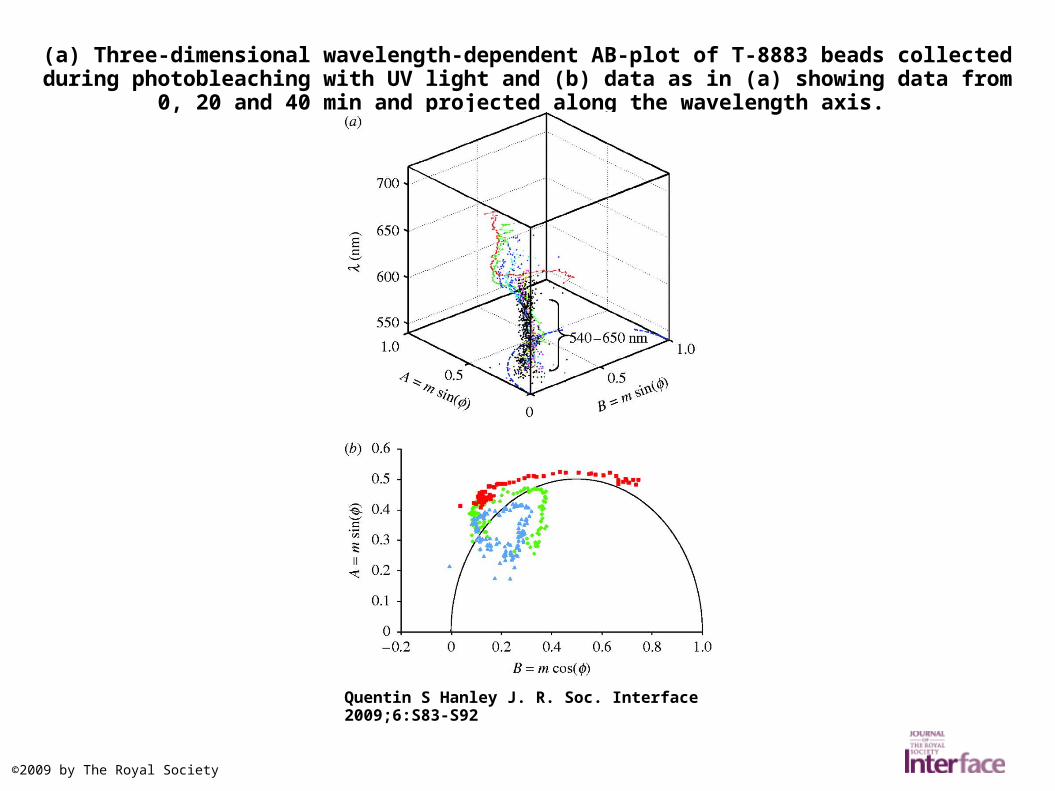
(a) Three-dimensional wavelength-dependent AB-plot of T-8883 beads collected during photobleaching with UV light and (b) data as in (a) showing data from 0, 20 and 40 min and
projected along the wavelength axis.
Quentin S Hanley J. R. Soc. Interface 2009;6:S83-S92
©2009 by The Royal Society
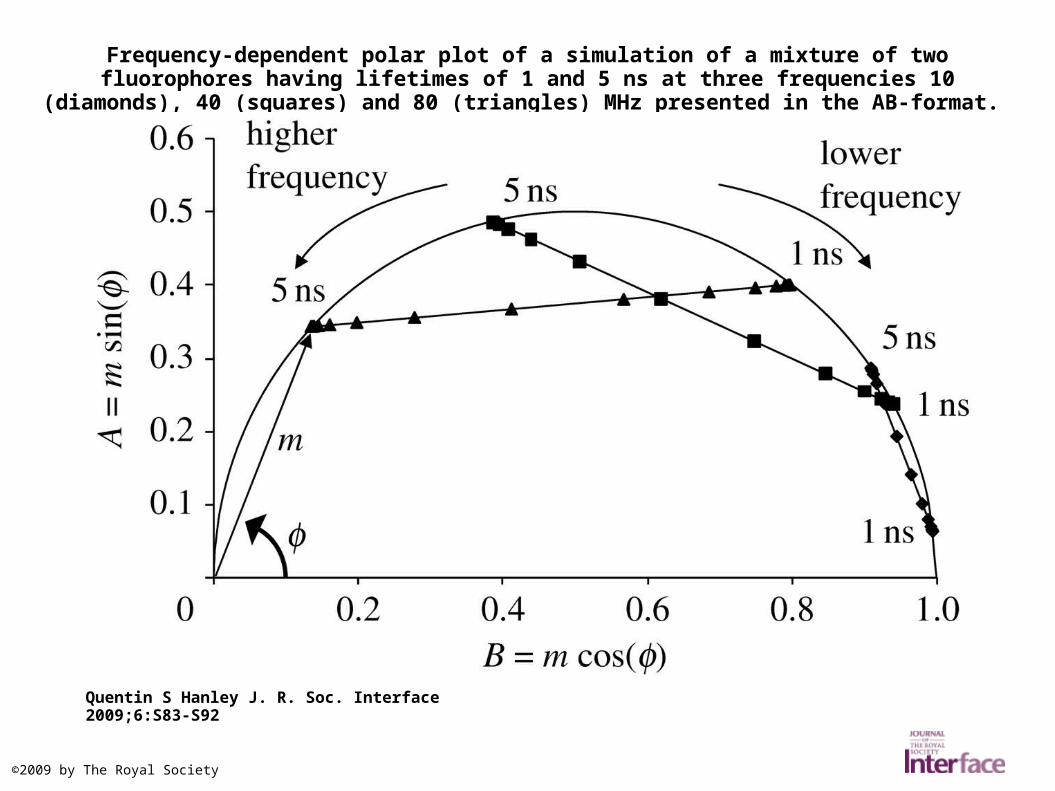
Frequency-dependent polar plot of a simulation of a mixture of two fluorophores having lifetimes of 1 and 5 ns at three frequencies 10 (diamonds), 40 (squares) and 80 (triangles) MHz presented
in the AB-format.
Quentin S Hanley J. R. Soc. Interface 2009;6:S83-S92
©2009 by The Royal Society

AB-space simulation of a donor–acceptor system consisting of two fluorophores.
Quentin S Hanley J. R. Soc. Interface 2009;6:S83-S92
©2009 by The Royal Society

An AB-plot of the SFLIM data collected while photobleaching Molecular Probes T-8869 fluorescent 40 nm microspheres with primarily the 546 nm line of a Hg arc lamp.
Quentin S Hanley J. R. Soc. Interface 2009;6:S83-S92
©2009 by The Royal Society
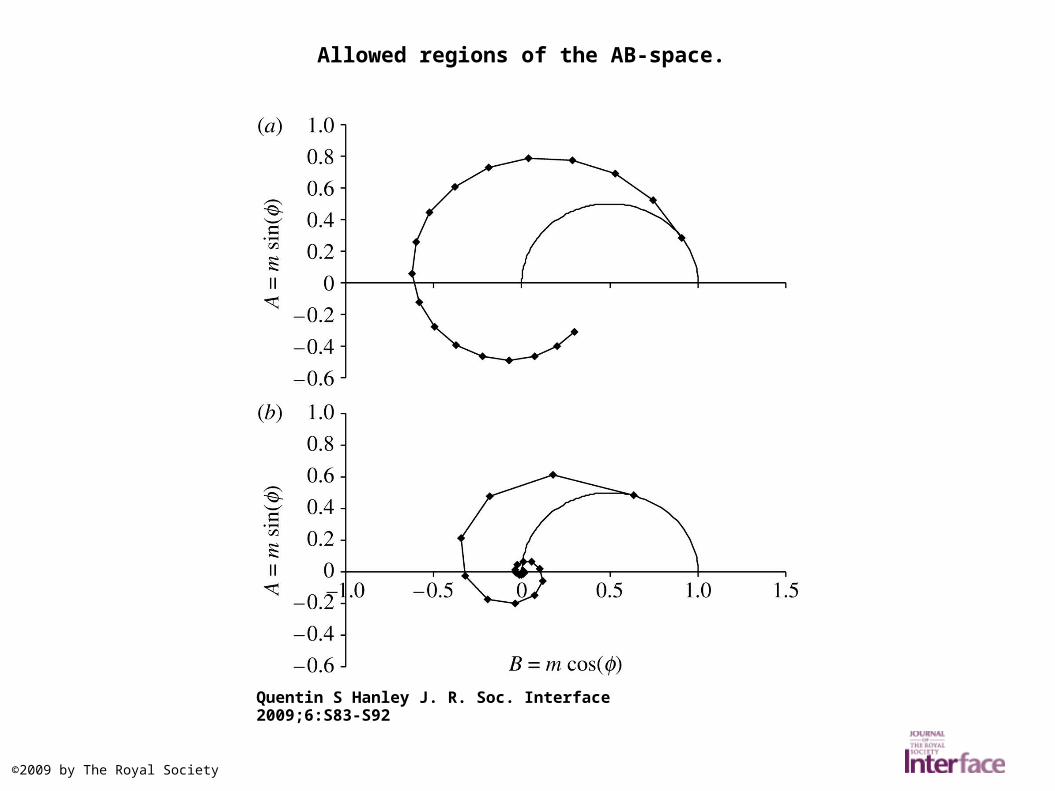
Allowed regions of the AB-space.
Quentin S Hanley J. R. Soc. Interface 2009;6:S83-S92
©2009 by The Royal Society

Drosophila salivary gland explant expressing an EGFP histone and stained with PI. This set of images illustrates the power of SFLIM. Images show (a) a sum over all wavelengths, (b) an
intensity slice at 518 nm showing the localization of EGFP, (c) an intens...
Quentin S Hanley J. R. Soc. Interface 2009;6:S83-S92
©2009 by The Royal Society