Embed Size (px)
DESCRIPTION
Spectrometric oil analysis is applicable to any closed loop lubricating system, such as those found in gas turbines, diesel and gasoline engines, transmissions,gearboxes, compressors and hydraulic systems.
Citation preview

Operations & User Maintenance Manual
(Modifications 6 & 7, Serial Numbers Starting with 6001)
160 Ayer Road Littleton, MA 01460 U.S.A. • Tel. 978.486.0123 • Fax 978.486.0030email: [email protected] • web page: www.spectroinc.com
Detailed instructions for:
• Spectroil M/N-WMilitary Oil Analysis Spectrometer
• Spectroil M/C-WCommercial Configuration
& CE Versions of the Spectroil M
Manual Part No. M96110
Excitation
Source
Graphite
Rod and Disc
Electrodes
Oil Sample & Holder
Grating
Ana
log
to D
igita
l Con
verter
Rowland Circle
Entrance
Slit
Fiber
Optic
Cable
Readout & Control
CCD Detectors
Controller


Table of Contents1.0 INTRODUCTION / THEORY OF OPERATION ................................................................ 11.1 INTRODUCTION ................................................................................................................ 11.2 APPLICATIONS.................................................................................................................... 21.2.1 Predictive Maintenance ........................................................................................................ 21.2.2 Fuel Analysis ........................................................................................................................ 41.3 OPTICAL EMISSION SPECTROSCOPY, THEORY OF OPERATION ............................ 51.4 EXCITATION SOURCE ....................................................................................................... 61.5 OPTICAL SYSTEM ............................................................................................................... 61.6 READOUT SYSTEM ............................................................................................................. 7
2.0 SITE SELECTION AND INSTALLATION REQUIREMENTS .......................................... 92.1 RECOMMENDATIONS FOR LABORATORY OPERATIONS ........................................... 92.1.1 Transporting and Uncrating ................................................................................................ 92.1.2 Location in the Laboratory ................................................................................................ 102.1.3 Initial Setup ...................................................................................................................... 102.1.4 Input Power Requirements ............................................................................................... 122.1.5 Initial Power Application .................................................................................................. 132.1.6 Exhaust Ventilation ........................................................................................................... 152.2 RECOMMENDATIONS FOR MOBILE OPERATION ..................................................... 152.2.1 Preparing the Spectroil M for Shipment ............................................................................ 162.2.2 Transporting and Uncrating .............................................................................................. 172.2.3 Selecting a Suitable Location for Short Term Analysis ........................................................ 172.2.4 Operation from Light Carts and Portable Generators ....................................................... 172.2.5 Exhaust Ventilation ........................................................................................................... 182.2.6 Power Application and Stabilization ................................................................................... 182.3 ENVIRONMENTAL CONDITIONS ................................................................................. 19
3.0 SYSTEM DESCRIPTION .................................................................................................... 213.1 INTRODUCTION ............................................................................................................. 213.2 EXCITATION SOURCE .................................................................................................... 213.3 SAMPLE STAND ................................................................................................................. 233.4 OPTICAL SYSTEM ............................................................................................................ 273.5 COMPUTER & READOUT SYSTEMS ............................................................................. 283.5.1 Control Panel .................................................................................................................... 293.5.2 Sequential Analytical and Background Measurement ....................................................... 303.6 ACCESSORIES AND OPTIONAL PARTS ........................................................................ 303.6.1 Printer ............................................................................................................................... 303.6.2 Standards ........................................................................................................................... 313.6.2.1 Wear Metal Standards .................................................................................................... 313.6.2.1.1 Commercial Wear Metal Standards ............................................................................. 313.6.2.1.2 Military Wear Metal Standards ................................................................................... 313.6.2.2 Fuel Analysis Standards ................................................................................................... 323.6.3 Graphite Electrodes, Disc and Rod ................................................................................... 323.6.4 Rod Electrode Sharpener .................................................................................................... 33
24 October 2007 / version 3.1
Operation & User Maintenance Manual | i

ii | Table of Contents
3.6.5 Disposable Polyethylene Sample Holders .......................................................................... 343.6.6 Reusable Sample Holders and Covers ................................................................................ 343.6.7 External Keyboard, Video and Mouse ................................................................................ 353.6.8 Source Frequency Test Meter ............................................................................................. 353.6.9 Transit Case ....................................................................................................................... 353.6.10 Maintenance Spare Parts Kits .......................................................................................... 36
4.0 OPERATING INSTRUCTIONS ......................................................................................... 374.1 GENERAL OPERATING REQUIREMENTS ..................................................................... 374.1.1 Power Application and Systematic Power Removal ............................................................ 374.1.2 Rod Electrode Sharpening ................................................................................................. 394.1.3 Installing the Disc Electrode ............................................................................................. 394.1.4 Installing the Rod Electrode and Setting the Gap .............................................................. 414.1.5 Installing and Positioning the Sample Holder ................................................................... 414.1.5.1 Disposable Sample Holder ............................................................................................. 414.1.5.2 Reusable Sample Holder ................................................................................................. 424.1.5.3 Sample Holder Cover ..................................................................................................... 424.1.6 Cleaning the Sample Stand ............................................................................................... 434.1.6.1 Cleaning After Each Burn Cycle ..................................................................................... 434.1.6.2 Cleaning After Each Operating Shift .............................................................................. 434.1.6.3 Cleaning the Quartz Window ........................................................................................ 434.1.6.4 Cleaning Solutions ......................................................................................................... 444.1.7 Paper Tissue for Operating and Paper Towels for Cleaning .............................................. 444.1.8 Waste Oil Disposal Container ........................................................................................... 444.2 DAILY OPERATION .......................................................................................................... 444.2.1 Daily Routine Prior to Use ................................................................................................ 444.2.2 Warm-Up Procedure ......................................................................................................... 464.2.3 Routine Sample Analysis ................................................................................................... 464.2.4 Daily Standardization Check ............................................................................................. 474.2.5 Complete Standardization ................................................................................................. 484.2.6 Daily Routine Prior to Securing ........................................................................................ 524.2.7 Optical Profiling ............................................................................................................... 524.3 PERFORMING CALIBRATION CURVE VERIFICATION ............................................. 534.4 REPEATABILITY TESTING ............................................................................................. 544.4.1 Repeatability Specifications ............................................................................................... 544.4.2 Repeatability Test ............................................................................................................. 544.4.3 Factors Affecting Repeatability .......................................................................................... 544.5 ACCURACY TESTING ...................................................................................................... 564.6 DISC ELECTRODE OFFSET PROCEDURE .................................................................... 564.7 BACKUP OF COMPLETE OILMWINDOWS SOFTWARE ............................................. 58
5.0 OilM WINDOWS SOFTWARE DESCRIPTION ............................................................... 615.1 INTRODUCTION .............................................................................................................. 615.2 ICONS ................................................................................................................................. 615.2.1 OilMWindows Icon ........................................................................................................... 615.2.2 Cut Icon ............................................................................................................................ 625.2.3 Copy Icon .......................................................................................................................... 62
24 October 2007 / version 3.1
5.2.4 Print Icon .......................................................................................................................... 625.2.5 Profile Icon ........................................................................................................................ 635.2.6 Offsets Icon ....................................................................................................................... 635.2.7 Standardization Icon .......................................................................................................... 635.2.8 Average Icon ...................................................................................................................... 635.2.9 Statistics Icon ..................................................................................................................... 645.2.10 Sample Identification (ID) Icon ....................................................................................... 645.2.11 Data Transmit Icon .......................................................................................................... 645.2.12 Burn Icon ........................................................................................................................ 645.3 WINDOWS® DIALOG CONVENTIONS .......................................................................... 645.3.1 OK Button......................................................................................................................... 655.3.2 Cancel Button .................................................................................................................... 655.4 WINDOWS® PULL DOWN MENU OPTIONS ................................................................ 655.4.1 Analysis Program Screen .................................................................................................... 655.4.2 File ..................................................................................................................................... 665.4.2.1 File/New ......................................................................................................................... 665.4.2.2 File/Open ....................................................................................................................... 665.4.2.3 File/SaveAs ...................................................................................................................... 675.4.2.4 File/Delete ...................................................................................................................... 675.4.2.5 File/Print Setup .............................................................................................................. 675.4.2.6 File/Print ........................................................................................................................ 675.4.2.7 File/Print Cached Burns F11........................................................................................... 675.4.2.8 File/Discard Cached Burns F12 ...................................................................................... 685.4.2.9 File/Password .................................................................................................................. 685.4.2.10 File/Exit ........................................................................................................................ 685.4.3 Edit .................................................................................................................................... 695.4.3.1 Edit/Cut ......................................................................................................................... 695.4.3.2 Edit/Copy ....................................................................................................................... 695.4.3.3 Edit/Delete ..................................................................................................................... 695.4.4 View .................................................................................................................................. 705.4.4.1 View/Toolbar .................................................................................................................. 705.4.4.2 View/Status Bar .............................................................................................................. 705.4.4.3 View/PPM ...................................................................................................................... 705.4.4.4 View/IEC PPM ............................................................................................................... 715.4.4.5 View/Uncorrected PPM .................................................................................................. 715.4.4.6 View/IEC Ratio .............................................................................................................. 715.4.4.7 View/Standardized Ratio ................................................................................................. 715.4.4.8 View/Intensity Ratio ....................................................................................................... 725.4.4.9 View/Intensity ................................................................................................................ 735.4.4.10 View/Other Views ......................................................................................................... 735.4.4.11 View/Other Views/System Data .................................................................................... 735.4.4.12 View/Other Views/Program Data ................................................................................. 735.4.4.13 View/Other Views/Graph ............................................................................................. 745.4.4.14 View/Other Views/Composite ...................................................................................... 745.4.4.15 View/Other Views/Log ................................................................................................. 745.4.5 SetUp ................................................................................................................................. 755.4.5.1 SetUp/Interlocks On ....................................................................................................... 75
24 October 2007 / version 3.1
Operation & User Maintenance Manual | iii
iv | Table of Contents
5.4.5.2 SetUp/CCD Controller Config ....................................................................................... 755.4.6 System ............................................................................................................................... 755.4.6.1 System/Hardware ............................................................................................................ 765.4.6.1.1 System/Hardware/Optical ............................................................................................ 765.4.6.1.2 System/Hardware/Computer ....................................................................................... 765.4.6.1.3 System/Hardware/Printer ............................................................................................ 765.4.6.2 System/System Parameters .............................................................................................. 765.4.6.4 System/Remote Computer .............................................................................................. 775.4.6.5 System/Sample ID .......................................................................................................... 795.4.6.6 System/Standardization Samples ..................................................................................... 805.4.6.7 System/Status ................................................................................................................. 805.4.7 Program ............................................................................................................................. 815.4.7.1 Program/Program Parameters ......................................................................................... 815.4.7.2 Program/Channels/Sequence .......................................................................................... 825.4.7.3 Program/Channels/Format ............................................................................................. 825.4.7.4 Program/Channels/Parameters ....................................................................................... 835.4.7.5 Program/CCD Burn Parameters ..................................................................................... 835.4.7.6 Program/Reference Values ............................................................................................... 845.4.7.7 Program/Standardization Samples/Standardization Names ............................................. 845.4.7.8 Program/Standardization Samples/Standardization Values .............................................. 855.4.7.9 Program/Standardization Samples/Standardization Factors ............................................. 855.4.7.10 Program/Calibration Curves ......................................................................................... 855.4.7.11 Program/Crossovers ...................................................................................................... 865.4.7.12 Program/Inter Element Corrections .............................................................................. 875.4.7.13 Program/Display Profile ............................................................................................... 875.4.8 Operations ......................................................................................................................... 875.4.8.1 Operations/Multiple Display .......................................................................................... 885.4.8.2 Operations/Start Burn F9 ............................................................................................... 885.4.8.3 Operations/Offsets/Perform Disc Offsets F10 ................................................................. 885.4.8.4 Operations/Offsets/Display Offset Values ....................................................................... 885.4.8.5 Operations/Profile F4 ..................................................................................................... 895.4.8.6 Operations/Standardize F7 ............................................................................................. 895.4.8.7 Operations/Sample I.D. F3 ............................................................................................. 895.4.8.8 Operations/Average F6 ................................................................................................... 895.4.8.9 Operations/Statistics F5 .................................................................................................. 905.4.8.10 Operations/Utilities/BEC F8 ........................................................................................ 905.4.8.11 Operations/Utilities/Dark Current ............................................................................... 905.4.8.12 Operations/Utilities/Timed Burns ................................................................................ 905.4.8.13 Operations/Transmit F2 ............................................................................................... 915.4.8.14 Operations/Retransmit ................................................................................................. 915.4.8.15 Operations/User Functions ........................................................................................... 915.4.8.16 Operations/Recalculate ................................................................................................. 925.4.9 Databases ........................................................................................................................... 925.4.9.1 Databases/AETC ............................................................................................................ 925.4.9.2 Databases/Generic .......................................................................................................... 935.4.9.3 Sample Identification Driven (SID) Database ................................................................. 94SID Setup ................................................................................................................................... 94
24 October 2007 / version 3.1
SID Configuration ...................................................................................................................... 95SID Database Routine Use ......................................................................................................... 965.4.9.4 Databases/PinPoint ........................................................................................................ 975.4.10 Tools ................................................................................................................................ 975.4.10 Help ................................................................................................................................ 975.4.10.1 Help/Help Topics ......................................................................................................... 985.4.10.2 Help/About OilMWindows .......................................................................................... 98
6.0 FUNCTIONAL ENHANCEMENT ..................................................................................... 996.1 ACTIVATING FUNCTIONAL ENHANCEMENT FEATURES ........................................ 996.2 PINPOINT AND PINPOINT PLUS .................................................................................. 996.2.1 Setting-up Databases / PinPoint ...................................................................................... 1006.2.1.1 Databases/PinPoint / ON (OFF) .................................................................................. 1006.2.1.2 Databases/PinPoint /Limits Files .................................................................................. 1016.2.1.3 Databases/PinPoint /Units Files .................................................................................... 1025.2.1.4 Databases/PinPoint /History ........................................................................................ 1026.2.1.5 Databases/PinPoint /Strip ............................................................................................. 1046.2.1.6 Databases/PinPoint /Graph .......................................................................................... 1046.2.1.7 Databases/PinPoint /Import ......................................................................................... 1056.2.1.8 Databases/PinPoint /Export .......................................................................................... 1066.2.1.9 Databases/PinPoint /Codes ........................................................................................... 1066.2.2 Routine Operating Instructions for PinPoint and PinPoint PLUS Software. .................... 1066.3 CONDUCTIVITY .............................................................................................................. 1086.3.1 Introduction .................................................................................................................... 1086.3.2 Background ..................................................................................................................... 1096.3.3 The TCT System ............................................................................................................. 1096.3.4 TCT Benefits ................................................................................................................... 110
7.0 MAINTENANCE AND SERVICING INSTRUCTIONS .................................................. 1117.1 DAILY OPERATOR MAINTENANCE ............................................................................. 1127.2 PERIODIC MAINTENANCE INSPECTIONS ................................................................. 1137.3 FAULT ISOLATION ........................................................................................................... 1177.3.1 Possible Sample Stand Faults .......................................................................................... 1187.3.2 Possible Excitation Source Faults ..................................................................................... 1237.3.3 Possible Optical Assembly Faults .................................................................................... 1287.3.4 Possible Computer Controller/Measurement Electronic Assembly Faults ........................ 1307.3.5 Possible Main Power and Power Distribution Faults ....................................................... 1337.3.6 Possible Printer Faults ..................................................................................................... 1367.4 PROCEDURE TO CHECK THE FREQUENCY OF THE EXCITATION SOURCE ..... 1387.4.1. Auxiliary Gap Optical Fiber View ................................................................................... 1387.4.2 Auxiliary Gap Direct View ............................................................................................. 1407.4.3 Detailed Description of Excitation Source Frequency ...................................................... 1427.5 DARK CURRENT ELECTRONIC STABILITY TEST .................................................... 1457.6 REPAIR AND REPLACEMENT PROCEDURES ............................................................ 1457.6.1 Sample Stand ................................................................................................................... 1457.6.1.1 Procedure to Adjust Rod Electrode Holder Slide Mechanism ........................................ 1457.6.1.2 Procedure to Replace Disc Electrode Shaft, M32408 and Tracking Test ........................ 146
24 October 2007 / version 3.1
Operation & User Maintenance Manual | v
vi | Table of Contents
7.6.1.3 Procedure to Align Disc Electrode to Rod Electrode ...................................................... 1467.6.1.4 Procedure to Adjust Sample Stand Interlock Monitor Sensitivity .................................. 1477.6.1.5 Procedure to Replace Rod Electrode Holder and Gap Setting Mechanism, M31200 ..... 1497.6.1.6 Procedure to Replace Disc Electrode Motor, M32101 ................................................... 1507.6.1.7 Procedure to Replace Sample Stand Exhaust Fan, M33002 ........................................... 1507.6.1.8 Procedure to Replace Disc Electrode Drive Belt, M32303 ............................................. 1507.6.1.9 Procedure to Replace Sample Stand Door Interlock, M33006 ....................................... 1517.6.2 Excitation Source ............................................................................................................. 1517.6.2.1 Procedure to Remove Combined Solid State Source Assembly, M99962 ....................... 1527.6.2.2 Procedure to Replace Auxiliary Gap Tungsten Electrodes, M42004 .............................. 1537.6.3 Optical System ................................................................................................................. 1537.6.4 Computer and Readout System ....................................................................................... 1567.6.4.1 Procedure to Replace Controller Cards ......................................................................... 1567.6.4.2 Procedure to Remove M68155 Windows Readout Assembly ........................................ 1567.6.4.3 Procedure to Remove the Panel PC M68150 from Windows Readout Assembly .......... 1567.6.4.4 Procedure to Replace START or STOP Switchs, M68119/M68120 ............................. 1577.6.4.5 Procedure to Measure Lambda Power Supply Voltages .................................................. 1587.6.4.6 Procedure to Correct System File Paths ......................................................................... 1587.6.5 Input Power Distribution and Accessories ........................................................................ 1587.6.5.1 Procedure to Replace Electrode Sharpener Cutter Blade, M90102 ................................ 1587.6.5.2 Procedure to Replace Electrode Sharpener Timer .......................................................... 1597.6.5.3 Procedure to Replace Contactor Relay, M21002 and Aux. Contact Module, M21005 . 1597.7 SOFTWARE RESTORATION ........................................................................................... 1617.7.1 Reinstalling Microsoft® Windows ® XP PRO .................................................................... 1617.7.2 Reinstalling Touch Panel Driver ...................................................................................... 1667.7.3 Updating Windows® XP Settings ..................................................................................... 1697.7.4 Roxio Easy CD Creator Installation ................................................................................. 1707.7.5 Iomegaware Installation ................................................................................................... 1717.7.6 Epson printer Driver Installation ..................................................................................... 172
8.0 ASSEMBLY PARTS LIST ................................................................................................... 1758.1 PARTS LIST ILLUSTRATIONS ....................................................................................... 175Figure 8-1, Housing Assembly, M10000 ................................................................................... 176Figure 8-2, Housing Assembly, Rear View ................................................................................. 177Figure 8-3, Housing Assembly, Interior Access Panels ............................................................... 178Figure 8-4, Sample Excitation Housing ..................................................................................... 179Figure 8-5, Sample Excitation Stand, M30000 .......................................................................... 180Figure 8-6, Sample Excitation Stand, Component Mounting Plate, M31000 ........................... 182Figure 8-7, Sample Excitation Stand, Rod Electrode Holder and Gap Setting Mechanism, M31200 .................................................................................................................................... 183Figure 8-8, Sample Excitation Stand, Sample Table Assembly, M31700 ................................... 185Figure 8-9, Sample Excitation Stand, Optic and Stand Sensor Mounts, M31800 ...................... 186Figure 8-10, Sample Excitation Stand, Disc Electrode Motor Drive Assembly........................... 187Figure, 8-11Sample Excitation Stand, Idler Adjustment Assembly, Disc Drive Belt, M32300 ... 188Figure 8-12, Sample Excitation Stand, Disc Electrode Shaft Mounting Assembly, M32400 and Electrical Contact Brush Assembly, M32500 ............................................................................ 189Figure 8-13, Source, Solid State, Combined M99966 ............................................................... 190
24 October 2007 / version 3.1

Figure 8-14, Sample Excitation Source ..................................................................................... 191Figure 8-15, OilM Windows® Readout and Data Management System ..................................... 192Figure 8-16, OilM Windows® Readout System Panel Open ...................................................... 193Figure 8-17, OilM Windows® Readout System, Top View ......................................................... 194Figure 8-18 Controller Assembly, Top View ............................................................................. 195Figure 8-19, Circuit Board, Interlock Monitor Assembly .......................................................... 196Figure 8-20, Optical Fiber and Entrance Slit (With & Without Cover)) ................................... 197Figure 8-21a, Input Power Distribution Assembly, Panel , Standard Spectroil M ...................... 198Figure 8-21a, Input Power Distribution Assembly, Panel, CE Version of Spectroil M ............... 199Figure 8-22, Accessory Panel and Signal Plate Connections, Standard Spectroil M and CE Version of Spectroil M ........................................................................................................................... 200Figure 8-23a, Input Power Distribution Assembly, Internal View, Standard Spectroil M ........... 201Figure 8-23b, Input Power Distribution Assembly, Internal View, CE Version of Spectroil M ... 202
9.0 OPERATIONAL AND MAINTENANCE ILLUSTRATIONS .......................................... 2039.1 INTRODUCTION ............................................................................................................ 2039.2.1 Simplified Block Diagram ................................................................................................ 2059.2.2 Interconnection Wiring Block Diagram ........................................................................... 2069.2.3a. Input Power Distribution Block Diagram, Standard Spectroil M .................................. 2079.2.3b. Input Power Distribution Block Diagram, CE Version of the Spectroil M ..................... 2089.2.4a. Input Power Distribution Diagram, Standard Spectroil M ............................................ 2099.2.4b. Input Power Distribution Diagram, CE Version of the Spectroil M .............................. 2109.2.5.a. Placement of Power Switching Contactor Assembly, Standard Spectroil M .................. 2119.2.5.b. Placement of Power Switching Contactor Assembly, CE Version of the Spectroil M..... 2129.2.6.a. Regulating Power Transformer Assembly Wiring, Standard Spectroil M ...................... 2139.2.6.b. Regulating Power Transformer Assembly Wiring, CE Version of the Spectroil M ........ 2149.2.7 Sample Stand Block Diagram ........................................................................................... 2159.2.8 Excitation Source Block Diagram ..................................................................................... 2169.2.9 Excitation Source with DC Capability for RFS Analysis Block Diagram .......................... 2179.2.10 Excitation Source / Sample Stand Schematic Diagram ................................................... 2189.2.11 Excitation Source with DC Capability for RFS Analysis / Sample Stand Schematic ....... 2199.2.12 Control Panel Assembly Block Diagram ........................................................................ 2209.2.13 Control Panel Assembly Schematic Diagram ................................................................. 2219.2.14 Connector Position for M59205 Measurement & Control Circuit Card ........................ 2229.2.15 Connector Position for M59210 Interlock & Power Monitor Circuit Card.................... 2239.2.16 Terminal Board 2 Wiring Diagram ................................................................................ 2249.2.17 Computer Controller Block Diagram............................................................................. 2259.2.18 Computer Controller Wiring Diagram .......................................................................... 2269.2.19 Polychromator Optic Block Diagram ............................................................................. 2279.2.20 External Data Transmission Cable for External Computer with 9 Pin Serial Port ......... 2289.2.21 External Data Transmission Cable for External Computer with 25 Pin Serial Port ........ 2299.2.22 Spectroil M Dimensions and Mounting Details ............................................................. 230
24 October 2007 / version 3.1
Operation & User Maintenance Manual | vii

viii | Table of Contents
This Page is Intentionally Left Blank
24 October 2007 / version 3.1
List of Effective Pages
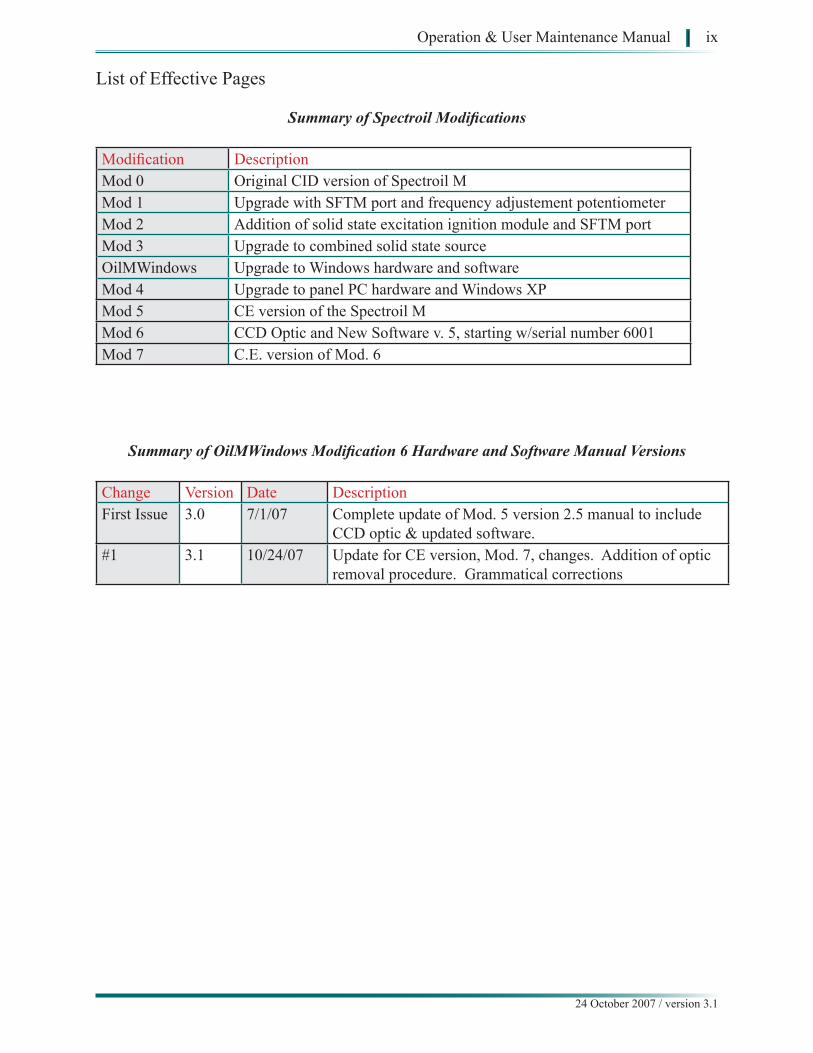
Summary of Spectroil Modifications
Modification DescriptionMod 0 Original CID version of Spectroil MMod 1 Upgrade with SFTM port and frequency adjustement potentiometerMod 2 Addition of solid state excitation ignition module and SFTM portMod 3 Upgrade to combined solid state sourceOilMWindows Upgrade to Windows hardware and softwareMod 4 Upgrade to panel PC hardware and Windows XPMod 5 CE version of the Spectroil MMod 6 CCD Optic and New Software v. 5, starting w/serial number 6001Mod 7 C.E. version of Mod. 6
Summary of OilMWindows Modification 6 Hardware and Software Manual Versions
Change Version Date DescriptionFirst Issue 3.0 7/1/07 Complete update of Mod. 5 version 2.5 manual to include
CCD optic & updated software.#1 3.1 10/24/07 Update for CE version, Mod. 7, changes. Addition of optic
removal procedure. Grammatical corrections
24 October 2007 / version 3.1
Operation & User Maintenance Manual | ix

x | List of Effective Pages
Total Number of pages in this manual is 243 consisting of the following:
Section Page NumbersCoverTable of Contents i - viiiList of Effective Pages ix - xiiChapter 1 1 - 8Chapter 2 9-20Chapter 3 21 - 36Chapter 4 37-60Chapter 5 61 - 98Chapter 6 99-110Chapter 7 111-174Chapter 8 175-202Chapter 9 203-230
WARNING!!!High Voltages are Present During the Operation of the
Spectroil M!
Observe all Safety Precautions!
Turn OFF the Main Power Switch and unplug the SPEC-TROIL M before any work is performed.
24 October 2007 / version 3.1
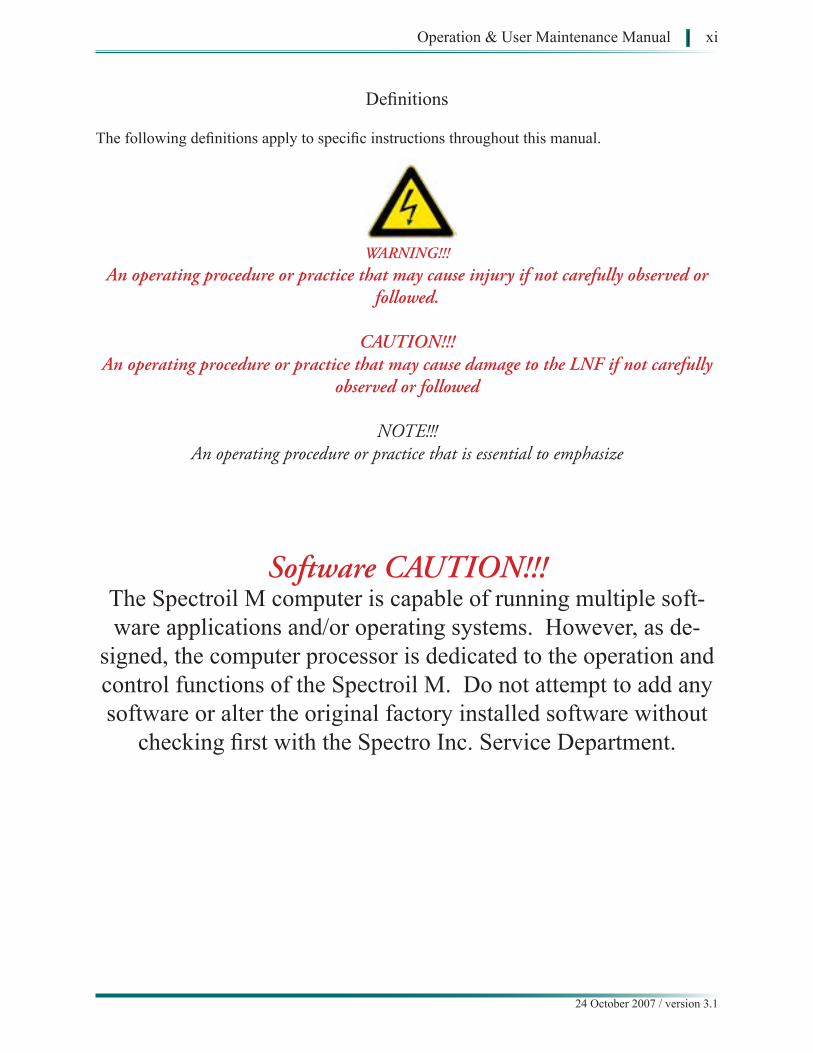
Definitions
The following definitions apply to specific instructions throughout this manual.
WARNING!!!An operating procedure or practice that may cause injury if not carefully observed or
followed.
CAUTION!!! An operating procedure or practice that may cause damage to the LNF if not carefully
observed or followed
NOTE!!!An operating procedure or practice that is essential to emphasize
Software CAUTION!!!The Spectroil M computer is capable of running multiple soft-ware applications and/or operating systems. However, as de-
signed, the computer processor is dedicated to the operation and control functions of the Spectroil M. Do not attempt to add any software or alter the original factory installed software without
checking first with the Spectro Inc. Service Department.
24 October 2007 / version 3.1
Operation & User Maintenance Manual | xi
xii | List of Effective Pages
WARRANTY
The warranty period of the Spectroil M family of spectrometers is twelve (12) months from date of installation or fifteen (15) months from date of shipment,
whichever occurs first. Spectro warrants the Spectroil under conditions of opera-tion against defects of materials and workmanship. All defective material will be replaced providing damage was not caused by improper use. Warranty applies to
parts and labor only.
Note on Oil Standards
The Spectroil M series of spectrometers can be calibrated for military or commercial applications. As a rule, the Spectroil M/N-W is calibrated and standardized with D-19, D-12 and D-3 series of standards, and the Spectroil M/C-W with V-21 or S-21 series of calibration standards.
Although this manual frequently refers to the military “D” series of stan-dards, the operator procedures are identical for all types of Spectroil M spectrometers. Commercial customers should substitute their equivalent “V” or “S” series of standards throughout this manual
24 October 2007 / version 3.1
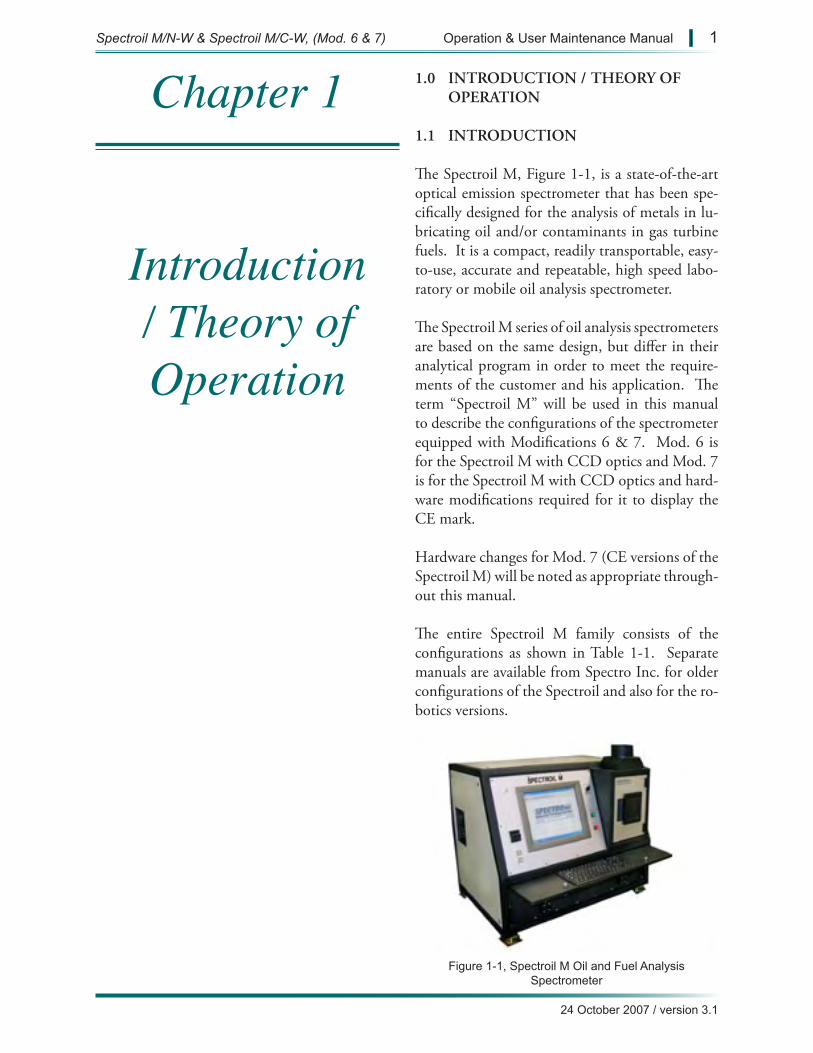
Figure 1-1, Spectroil M Oil and Fuel Analysis Spectrometer
1.0 INTRODUCTION / THEORY OF OPERATION
1.1 INTRODUCTION
The Spectroil M, Figure 1-1, is a state-of-the-art optical emission spectrometer that has been spe-cifically designed for the analysis of metals in lu-bricating oil and/or contaminants in gas turbine fuels. It is a compact, readily transportable, easy-to-use, accurate and repeatable, high speed labo-ratory or mobile oil analysis spectrometer.
The Spectroil M series of oil analysis spectrometers are based on the same design, but differ in their analytical program in order to meet the require-ments of the customer and his application. The term “Spectroil M” will be used in this manual to describe the configurations of the spectrometer equipped with Modifications 6 & 7. Mod. 6 is for the Spectroil M with CCD optics and Mod. 7 is for the Spectroil M with CCD optics and hard-ware modifications required for it to display the CE mark.
Hardware changes for Mod. 7 (CE versions of the Spectroil M) will be noted as appropriate through-out this manual.
The entire Spectroil M family consists of the configurations as shown in Table 1-1. Separate manuals are available from Spectro Inc. for older configurations of the Spectroil and also for the ro-botics versions.
Chapter 1
Introduction / Theory of Operation
Spectroil M/N-W & Spectroil M/C-W, (Mod. 6 & 7) Operation & User Maintenance Manual | 1
24 October 2007 / version 3.1
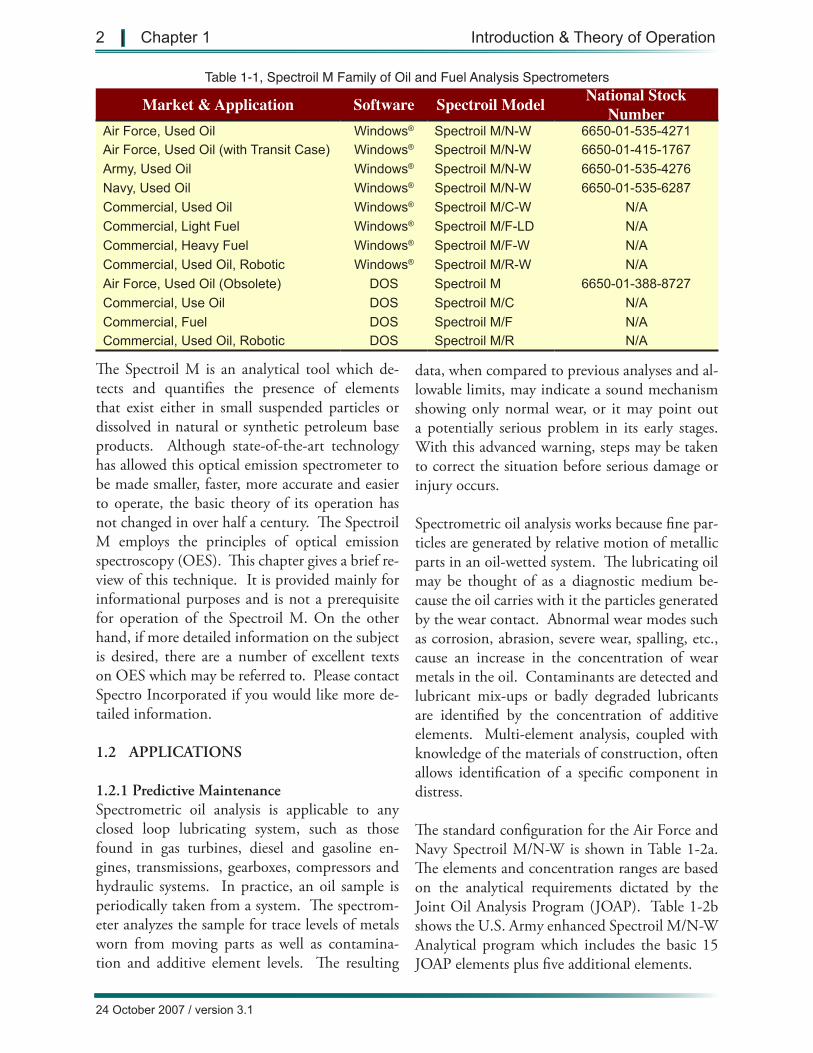
Table 1-1, Spectroil M Family of Oil and Fuel Analysis Spectrometers
Market & Application Software Spectroil Model National Stock Number
Air Force, Used Oil Windows® Spectroil M/N-W 6650-01-535-4271Air Force, Used Oil (with Transit Case) Windows® Spectroil M/N-W 6650-01-415-1767Army, Used Oil Windows® Spectroil M/N-W 6650-01-535-4276Navy, Used Oil Windows® Spectroil M/N-W 6650-01-535-6287Commercial, Used Oil Windows® Spectroil M/C-W N/ACommercial, Light Fuel Windows® Spectroil M/F-LD N/ACommercial, Heavy Fuel Windows® Spectroil M/F-W N/ACommercial, Used Oil, Robotic Windows® Spectroil M/R-W N/AAir Force, Used Oil (Obsolete) DOS Spectroil M 6650-01-388-8727Commercial, Use Oil DOS Spectroil M/C N/ACommercial, Fuel DOS Spectroil M/F N/ACommercial, Used Oil, Robotic DOS Spectroil M/R N/A
2 | Chapter 1 Introduction & Theory of Operation
The Spectroil M is an analytical tool which de-tects and quantifies the presence of elements that exist either in small suspended particles or dissolved in natural or synthetic petroleum base products. Although state-of-the-art technology has allowed this optical emission spectrometer to be made smaller, faster, more accurate and easier to operate, the basic theory of its operation has not changed in over half a century. The Spectroil M employs the principles of optical emission spectroscopy (OES). This chapter gives a brief re-view of this technique. It is provided mainly for informational purposes and is not a prerequisite for operation of the Spectroil M. On the other hand, if more detailed information on the subject is desired, there are a number of excellent texts on OES which may be referred to. Please contact Spectro Incorporated if you would like more de-tailed information.
1.2 APPLICATIONS
1.2.1 Predictive MaintenanceSpectrometric oil analysis is applicable to any closed loop lubricating system, such as those found in gas turbines, diesel and gasoline en-gines, transmissions, gearboxes, compressors and hydraulic systems. In practice, an oil sample is periodically taken from a system. The spectrom-eter analyzes the sample for trace levels of metals worn from moving parts as well as contamina-tion and additive element levels. The resulting
data, when compared to previous analyses and al-lowable limits, may indicate a sound mechanism showing only normal wear, or it may point out a potentially serious problem in its early stages. With this advanced warning, steps may be taken to correct the situation before serious damage or injury occurs.
Spectrometric oil analysis works because fine par-ticles are generated by relative motion of metallic parts in an oil-wetted system. The lubricating oil may be thought of as a diagnostic medium be-cause the oil carries with it the particles generated by the wear contact. Abnormal wear modes such as corrosion, abrasion, severe wear, spalling, etc., cause an increase in the concentration of wear metals in the oil. Contaminants are detected and lubricant mix-ups or badly degraded lubricants are identified by the concentration of additive elements. Multi-element analysis, coupled with knowledge of the materials of construction, often allows identification of a specific component in distress.
The standard configuration for the Air Force and Navy Spectroil M/N-W is shown in Table 1-2a. The elements and concentration ranges are based on the analytical requirements dictated by the Joint Oil Analysis Program (JOAP). Table 1-2b shows the U.S. Army enhanced Spectroil M/N-W Analytical program which includes the basic 15 JOAP elements plus five additional elements.
24 October 2007 / version 3.1

Table 1-2a, Spectroil M/N-W Analytical Program
Element Concentration
1 Iron 0-1,0002 Silver 0-1,0003 Aluminum 0-1,0004 Chromium 0-1,0005 Copper 0-1,0006 Magnesium 0-1,0007 Sodium 0-1,0008 Nickel 0-1,0009 Lead 0-1,000
10 Silicon 0-1,00011 Tin 0-1,00012 Titanium 0-1,00013 Boron 0-1,00014 Molybdenum 0-1,00015 Zinc 0-1,000
Element Concentration
1 Iron 0-1,0002 Silver 0-1,0003 Aluminum 0-1,0004 Chromium 0-1,0005 Copper 0-1,0006 Magnesium 0-1,0007 Sodium 0-1,0008 Nickel 0-1,0009 Lead 0-1,000
10 Silicon 0-1,00011 Tin 0-1,00012 Titanium 0-1,00013 Boron 0-1,00014 Molybdenum 0-1,00015 Zinc 0-1,00016 Barium 5-10,00017 Phosphorous 5-10,00018 Calcium 10-10,00019 Cadmium 1-1,00020 Potassium 1-1,000
Table 1-2b, U.S. Army Enhanced Spectroil M/N-W Analytical Program
NOTE: For JOAP correlation requirements, the Spectroil M/N-W must be factory calibrated with D-19 calibration standards supplied by the Techni-cal Support Center - JOAP, Pensacola, Florida.
Commercial oil analysis and machine condition monitoring has experienced rapid growth in the last decade. The market is more diverse than the military application, and machine condition monitoring based on oil analysis can be found in all of the following industries:
• Commercial Laboratories • Chemical Processing• Electric Power Generating Companies• Railroads • Refineries• Airlines • Mining Operations• Public Transportation Companies • Steel Mills• Manufacturing • Marine Fleets
Commercial laboratories typically have a larger variety of oil wetted systems to support and their analytical layout can be more demanding. Ap-plications are not limited to a few systems but in-clude almost anything that uses oil as a lubricant. Typical requirements include generators, turbines, gear boxes, engines, compressors, transmissions and even hydraulic systems.
A standard configuration for the Spectroil M/C-W that meets the majority of commercial oil analysis requirements is shown in Table 1-3. It includes wear metals, contaminants and additive elements.
NOTE: The standard configuration of the Spectroil M/C-W consists of 21 elements and reference channels. Additional elements can be added upon request.
Regardless of the application, a well implemented and managed oil analysis program will provide cost savings and efficiency savings to the user.
Spectroil M/N-W & Spectroil M/C-W, (Mod. 6 & 7) Operation & User Maintenance Manual | 3
24 October 2007 / version 3.1
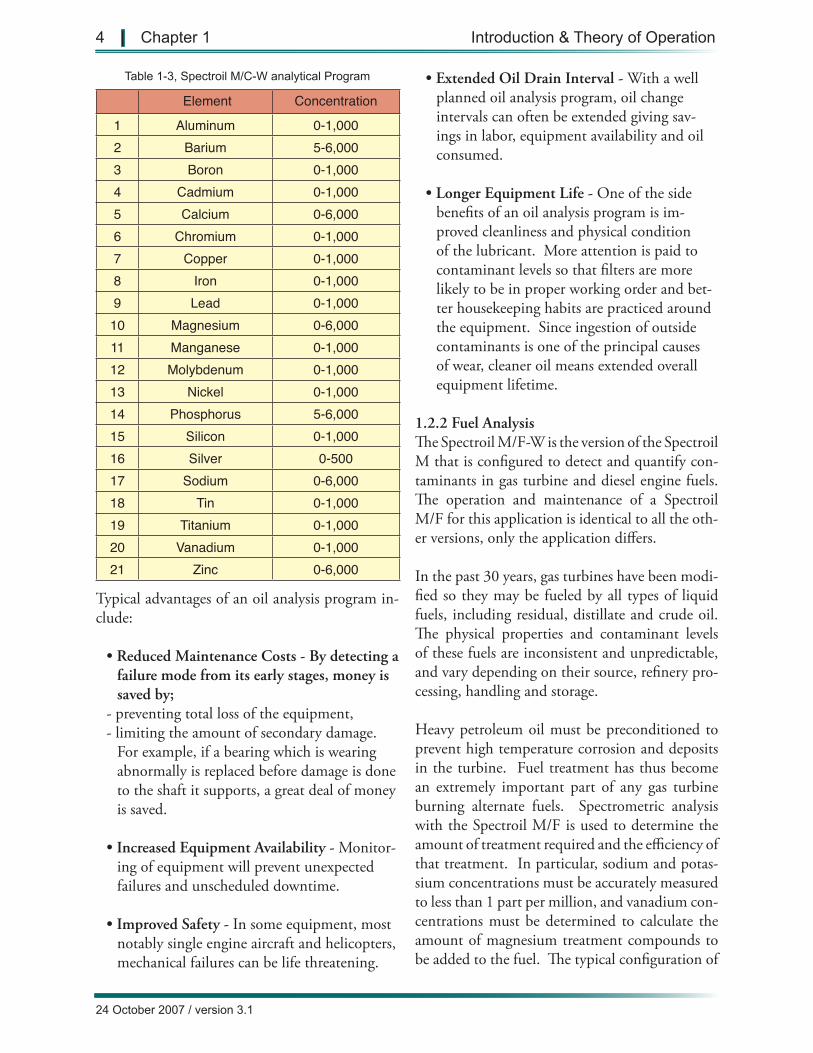
Table 1-3, Spectroil M/C-W analytical Program
Element Concentration
1 Aluminum 0-1,0002 Barium 5-6,0003 Boron 0-1,0004 Cadmium 0-1,0005 Calcium 0-6,0006 Chromium 0-1,0007 Copper 0-1,0008 Iron 0-1,0009 Lead 0-1,00010 Magnesium 0-6,00011 Manganese 0-1,00012 Molybdenum 0-1,00013 Nickel 0-1,00014 Phosphorus 5-6,00015 Silicon 0-1,00016 Silver 0-50017 Sodium 0-6,00018 Tin 0-1,00019 Titanium 0-1,00020 Vanadium 0-1,00021 Zinc 0-6,000
4 | Chapter 1 Introduction & Theory of Operation
Typical advantages of an oil analysis program in-clude:
• Reduced Maintenance Costs - By detecting a failure mode from its early stages, money is saved by;
- preventing total loss of the equipment,- limiting the amount of secondary damage.
For example, if a bearing which is wearing abnormally is replaced before damage is done to the shaft it supports, a great deal of money is saved.
• Increased Equipment Availability - Monitor-ing of equipment will prevent unexpected failures and unscheduled downtime.
• Improved Safety - In some equipment, most notably single engine aircraft and helicopters, mechanical failures can be life threatening.
• Extended Oil Drain Interval - With a well planned oil analysis program, oil change intervals can often be extended giving sav-ings in labor, equipment availability and oil consumed.
• Longer Equipment Life - One of the side benefits of an oil analysis program is im-proved cleanliness and physical condition of the lubricant. More attention is paid to contaminant levels so that filters are more likely to be in proper working order and bet-ter housekeeping habits are practiced around the equipment. Since ingestion of outside contaminants is one of the principal causes of wear, cleaner oil means extended overall equipment lifetime.
1.2.2 Fuel AnalysisThe Spectroil M/F-W is the version of the Spectroil M that is configured to detect and quantify con-taminants in gas turbine and diesel engine fuels. The operation and maintenance of a Spectroil M/F for this application is identical to all the oth-er versions, only the application differs.
In the past 30 years, gas turbines have been modi-fied so they may be fueled by all types of liquid fuels, including residual, distillate and crude oil. The physical properties and contaminant levels of these fuels are inconsistent and unpredictable, and vary depending on their source, refinery pro-cessing, handling and storage.
Heavy petroleum oil must be preconditioned to prevent high temperature corrosion and deposits in the turbine. Fuel treatment has thus become an extremely important part of any gas turbine burning alternate fuels. Spectrometric analysis with the Spectroil M/F is used to determine the amount of treatment required and the efficiency of that treatment. In particular, sodium and potas-sium concentrations must be accurately measured to less than 1 part per million, and vanadium con-centrations must be determined to calculate the amount of magnesium treatment compounds to be added to the fuel. The typical configuration of
24 October 2007 / version 3.1
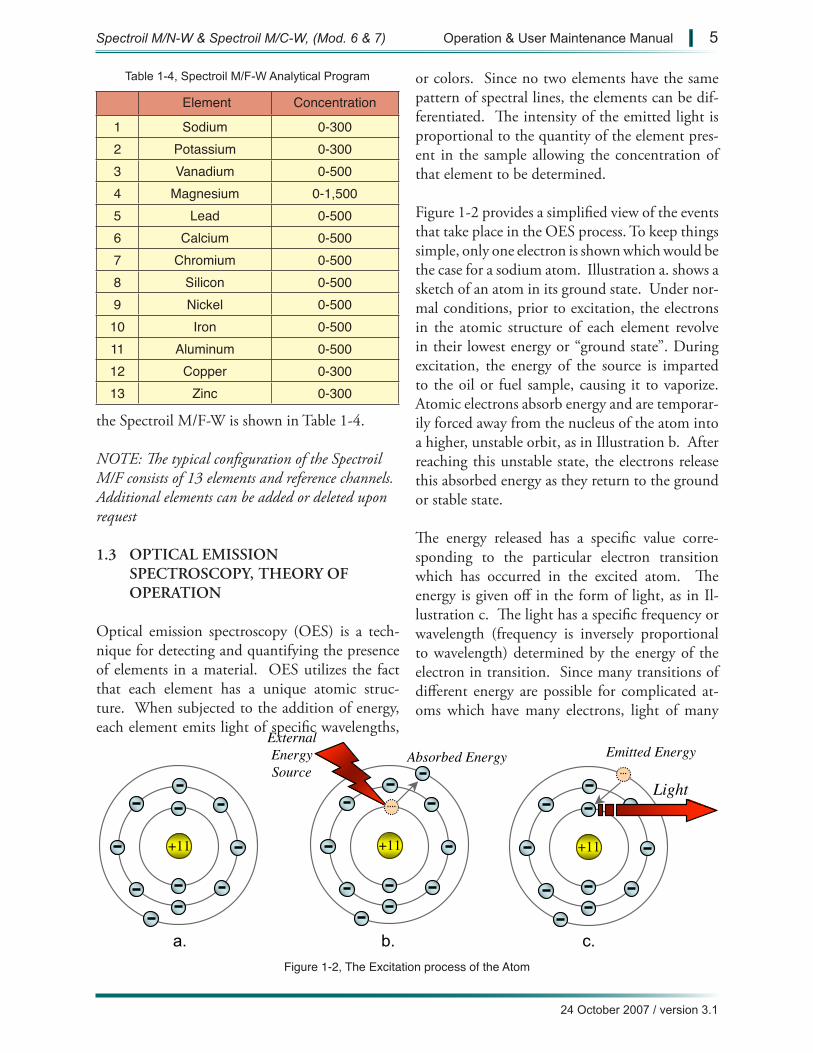
Table 1-4, Spectroil M/F-W Analytical Program
Element Concentration
1 Sodium 0-3002 Potassium 0-3003 Vanadium 0-5004 Magnesium 0-1,5005 Lead 0-5006 Calcium 0-5007 Chromium 0-5008 Silicon 0-5009 Nickel 0-500
10 Iron 0-50011 Aluminum 0-50012 Copper 0-30013 Zinc 0-300
Figure 1-2, The Excitation process of the Atom
+11 +11
ExternalEnergySource
Absorbed Energy
+11
Emitted Energy
Light
a. b. c.
the Spectroil M/F-W is shown in Table 1-4.
NOTE: The typical configuration of the Spectroil M/F consists of 13 elements and reference channels. Additional elements can be added or deleted upon request
1.3 OPTICAL EMISSION SPECTROSCOPY, THEORY OF OPERATION
Optical emission spectroscopy (OES) is a tech-nique for detecting and quantifying the presence of elements in a material. OES utilizes the fact that each element has a unique atomic struc-ture. When subjected to the addition of energy, each element emits light of specific wavelengths,
or colors. Since no two elements have the same pattern of spectral lines, the elements can be dif-ferentiated. The intensity of the emitted light is proportional to the quantity of the element pres-ent in the sample allowing the concentration of that element to be determined.
Figure 1-2 provides a simplified view of the events that take place in the OES process. To keep things simple, only one electron is shown which would be the case for a sodium atom. Illustration a. shows a sketch of an atom in its ground state. Under nor-mal conditions, prior to excitation, the electrons in the atomic structure of each element revolve in their lowest energy or “ground state”. During excitation, the energy of the source is imparted to the oil or fuel sample, causing it to vaporize. Atomic electrons absorb energy and are temporar-ily forced away from the nucleus of the atom into a higher, unstable orbit, as in Illustration b. After reaching this unstable state, the electrons release this absorbed energy as they return to the ground or stable state.
The energy released has a specific value corre-sponding to the particular electron transition which has occurred in the excited atom. The energy is given off in the form of light, as in Il-lustration c. The light has a specific frequency or wavelength (frequency is inversely proportional to wavelength) determined by the energy of the electron in transition. Since many transitions of different energy are possible for complicated at-oms which have many electrons, light of many
Spectroil M/N-W & Spectroil M/C-W, (Mod. 6 & 7) Operation & User Maintenance Manual | 5
24 October 2007 / version 3.1
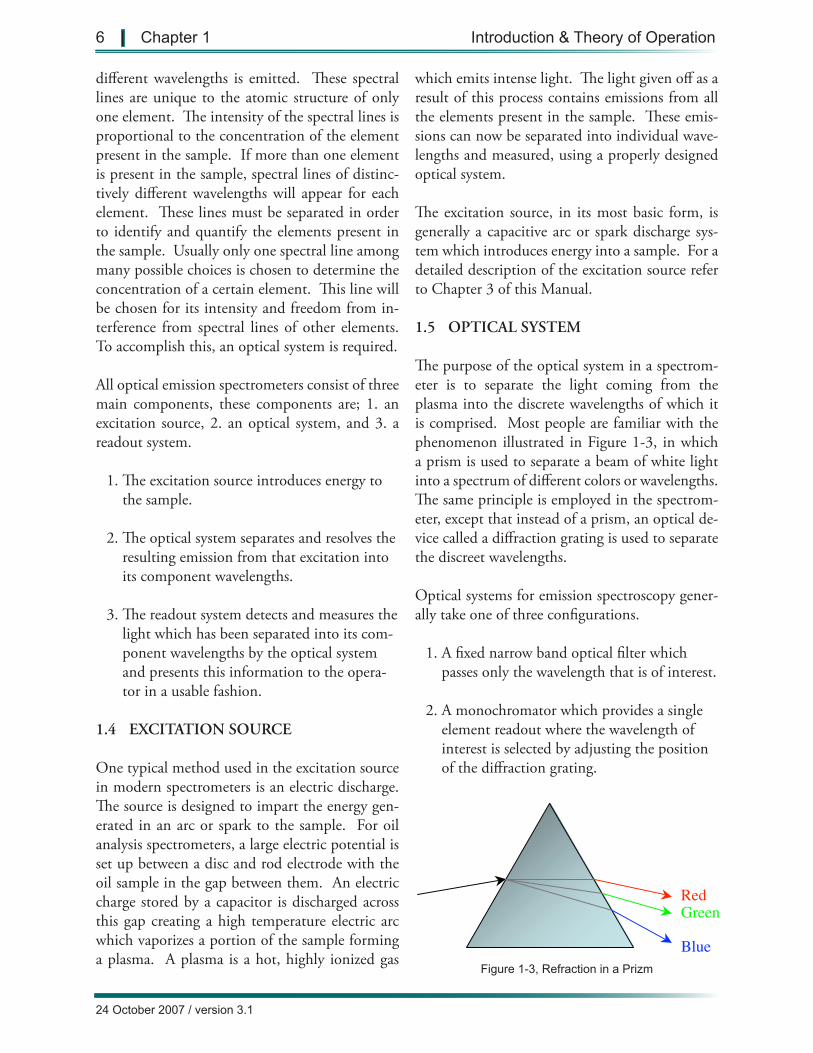
Figure 1-3, Refraction in a Prizm
GreenRed
Blue
6 | Chapter 1 Introduction & Theory of Operation
different wavelengths is emitted. These spectral lines are unique to the atomic structure of only one element. The intensity of the spectral lines is proportional to the concentration of the element present in the sample. If more than one element is present in the sample, spectral lines of distinc-tively different wavelengths will appear for each element. These lines must be separated in order to identify and quantify the elements present in the sample. Usually only one spectral line among many possible choices is chosen to determine the concentration of a certain element. This line will be chosen for its intensity and freedom from in-terference from spectral lines of other elements. To accomplish this, an optical system is required.
All optical emission spectrometers consist of three main components, these components are; 1. an excitation source, 2. an optical system, and 3. a readout system.
1. The excitation source introduces energy to the sample.
2. The optical system separates and resolves the resulting emission from that excitation into its component wavelengths.
3. The readout system detects and measures the light which has been separated into its com-ponent wavelengths by the optical system and presents this information to the opera-tor in a usable fashion.
1.4 EXCITATION SOURCE
One typical method used in the excitation source in modern spectrometers is an electric discharge. The source is designed to impart the energy gen-erated in an arc or spark to the sample. For oil analysis spectrometers, a large electric potential is set up between a disc and rod electrode with the oil sample in the gap between them. An electric charge stored by a capacitor is discharged across this gap creating a high temperature electric arc which vaporizes a portion of the sample forming a plasma. A plasma is a hot, highly ionized gas
which emits intense light. The light given off as a result of this process contains emissions from all the elements present in the sample. These emis-sions can now be separated into individual wave-lengths and measured, using a properly designed optical system.
The excitation source, in its most basic form, is generally a capacitive arc or spark discharge sys-tem which introduces energy into a sample. For a detailed description of the excitation source refer to Chapter 3 of this Manual.
1.5 OPTICAL SYSTEM
The purpose of the optical system in a spectrom-eter is to separate the light coming from the plasma into the discrete wavelengths of which it is comprised. Most people are familiar with the phenomenon illustrated in Figure 1-3, in which a prism is used to separate a beam of white light into a spectrum of different colors or wavelengths. The same principle is employed in the spectrom-eter, except that instead of a prism, an optical de-vice called a diffraction grating is used to separate the discreet wavelengths.
Optical systems for emission spectroscopy gener-ally take one of three configurations.
1. A fixed narrow band optical filter which passes only the wavelength that is of interest.
2. A monochromator which provides a single element readout where the wavelength of interest is selected by adjusting the position of the diffraction grating.
24 October 2007 / version 3.1
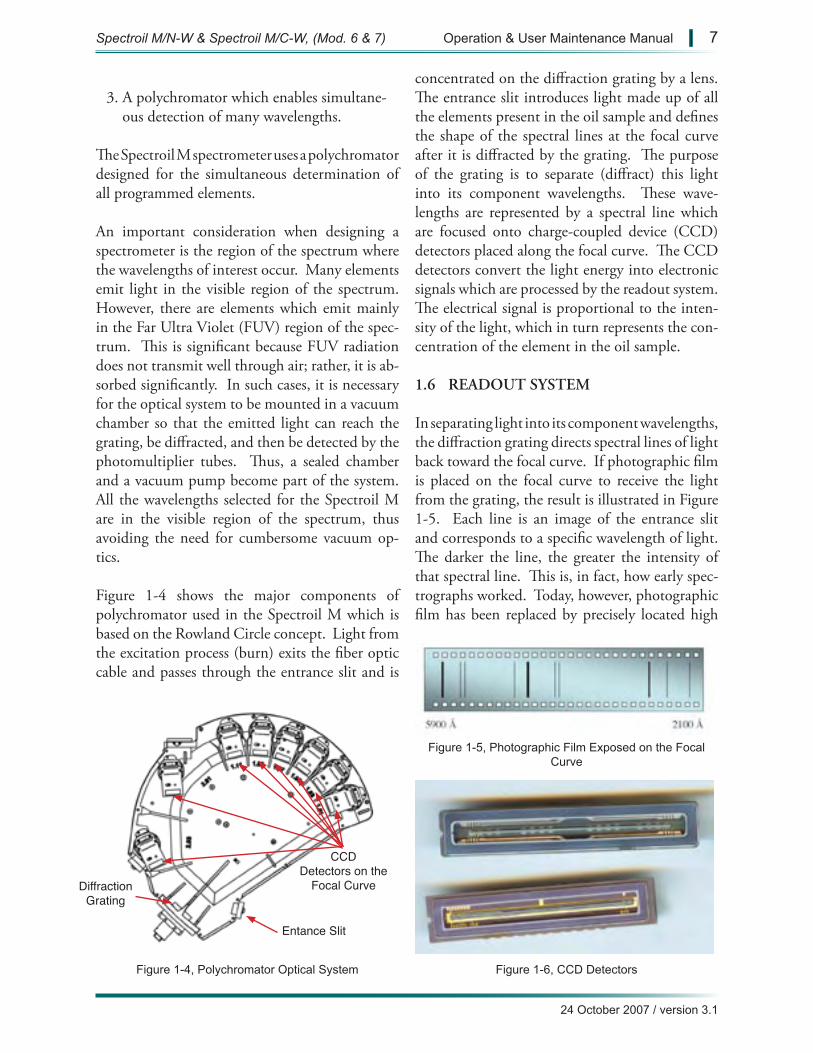
Figure 1-4, Polychromator Optical System
DiffractionGrating
Entance Slit
CCD Detectors on the
Focal Curve
Figure 1-5, Photographic Film Exposed on the Focal Curve
Figure 1-6, CCD Detectors
3. A polychromator which enables simultane-ous detection of many wavelengths.
The Spectroil M spectrometer uses a polychromator designed for the simultaneous determination of all programmed elements.
An important consideration when designing a spectrometer is the region of the spectrum where the wavelengths of interest occur. Many elements emit light in the visible region of the spectrum. However, there are elements which emit mainly in the Far Ultra Violet (FUV) region of the spec-trum. This is significant because FUV radiation does not transmit well through air; rather, it is ab-sorbed significantly. In such cases, it is necessary for the optical system to be mounted in a vacuum chamber so that the emitted light can reach the grating, be diffracted, and then be detected by the photomultiplier tubes. Thus, a sealed chamber and a vacuum pump become part of the system. All the wavelengths selected for the Spectroil M are in the visible region of the spectrum, thus avoiding the need for cumbersome vacuum op-tics.
Figure 1-4 shows the major components of polychromator used in the Spectroil M which is based on the Rowland Circle concept. Light from the excitation process (burn) exits the fiber optic cable and passes through the entrance slit and is
concentrated on the diffraction grating by a lens. The entrance slit introduces light made up of all the elements present in the oil sample and defines the shape of the spectral lines at the focal curve after it is diffracted by the grating. The purpose of the grating is to separate (diffract) this light into its component wavelengths. These wave-lengths are represented by a spectral line which are focused onto charge-coupled device (CCD) detectors placed along the focal curve. The CCD detectors convert the light energy into electronic signals which are processed by the readout system. The electrical signal is proportional to the inten-sity of the light, which in turn represents the con-centration of the element in the oil sample.
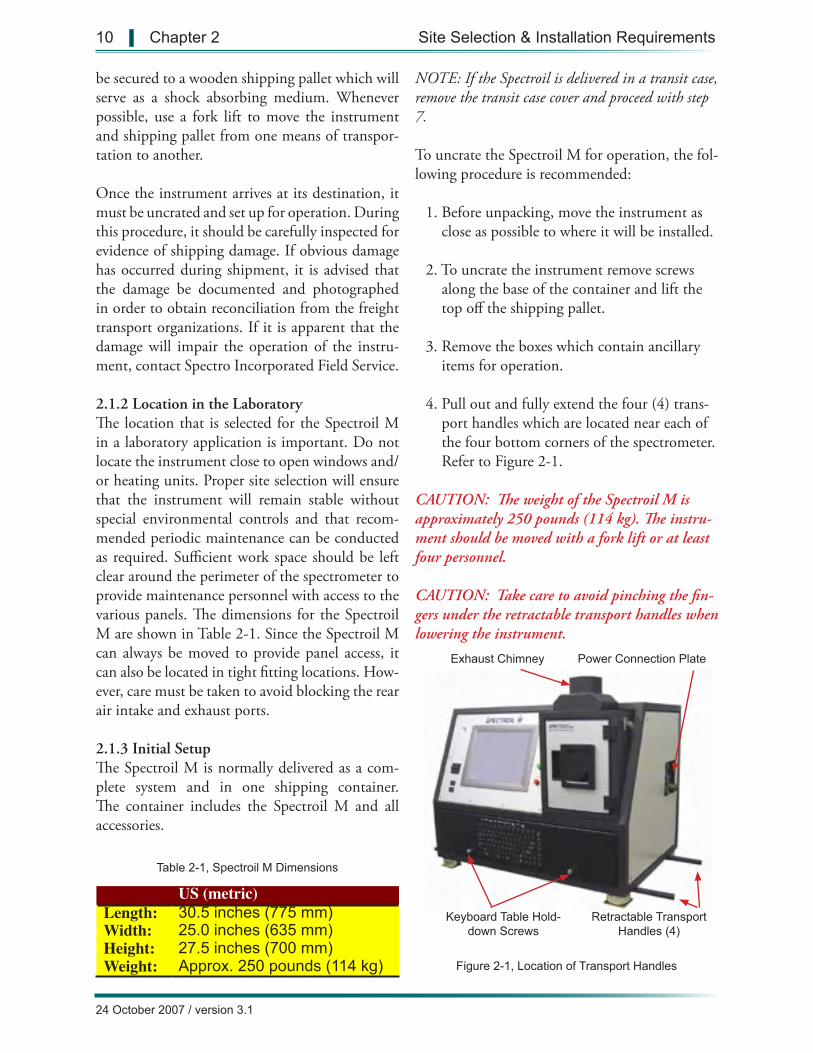
1.6 READOUT SYSTEM
In separating light into its component wavelengths, the diffraction grating directs spectral lines of light back toward the focal curve. If photographic film is placed on the focal curve to receive the light from the grating, the result is illustrated in Figure 1-5. Each line is an image of the entrance slit and corresponds to a specific wavelength of light. The darker the line, the greater the intensity of that spectral line. This is, in fact, how early spec-trographs worked. Today, however, photographic film has been replaced by precisely located high
Spectroil M/N-W & Spectroil M/C-W, (Mod. 6 & 7) Operation & User Maintenance Manual | 7
24 October 2007 / version 3.1

8 | Chapter 1 Introduction & Theory of Operation
resolution CCD detectors, Figure 1-6.
A CCD detector is a semiconductor chip which is sensitive to light. The Spectroil M optic has 15 such CCD detectors which are mounted on the focal plane to cover the wavelength range of the analytical program. The chips are rectangular in shape and subdivided into a grid of 2048 pixels. When light from the excitation process by way of the entrance slit and grating strikes a pixel, it generates a small electrical charge which is stored for later read-out. The size of the charge increases cumulatively as more light strikes the surface, and the greater the brighter the light, the greater the charge. The CCD’s are connected to electronic circuitry to power it, control it and read it out.
The readout system of the Spectroil M is controlled by an industrial grade processor and software. A clocking circuit and amplifier periodically reads the charge on a CCD chip and converts it from an analog to digital (ADC) signal to measure the light that has fallen on a pixel. The charge ac-cumulated on a pixel is converted to an arbitrary number defined as “intensity” units.
At the end of the analysis, the total intensities for each element are compared to calibration curves stored in memory and are converted to the con-centration of the element present in the sample. Concentration is usually expressed in parts per million (ppm). This information is displayed on a video screen, or can be printed out on a printer. Once the analysis is completed and the results recorded, the system is ready for the next analy-sis. The analysis results may be left on the screen, stored on the hard disk, or can be sent to an ex-ternal computer.
User friendly software enables simple operation with automatic recalibration, while providing sta-tistical functions for averaging and repeatability. For a detailed description of the computer elec-tronics and readout system, refer to Chapter 1 of the Spectroil M/N and Spectroil M/C-W Mainte-nance Manual. For a detailed description of the software dialog and features, refer to Chapter 5 of
this manual.
This has been a greatly simplified description of Optical Emission Spectroscopy to provide an overview of the process for those unfamiliar with it. A detailed study of this technique is much more complex. For example, each element emits light at a number of different wavelengths, mak-ing it necessary for the spectroscopist to choose the best wavelength for the measurement being made; one with sufficient intensity, lack of inter-ferences from other elements’ spectra, etc. Luck-ily, thanks to advances in technology, the state-of-the-art in spectroscopy has advanced to the point where it has become a readily available and easy-to-use tool for material analysis, as the Spectroil M demonstrates.
24 October 2007 / version 3.1

2.0 SITE SELECTION AND INSTALLATION REQUIREMENTS
2.1 RECOMMENDATIONS FOR LABORATORY OPERATIONS
There are several considerations that should be taken into account regarding the installation of any analytical instrument. Careful consideration of the site selection and prior knowledge of instal-lation requirements will expedite the installation of the Spectroil M and establish an efficient ana-lytical environment. The following items in the specified sections must be considered before com-missioning the Spectroil M.
2.1.1 Transporting and Uncrating 2.1.2 Location in the Laboratory2.1.3 Initial Setup2.1.4 Input Power Requirements 2.1.5 Initial Power Application2.1.6 Exhaust Ventilation2.3 Environmental Operating Conditions
2.1.1 Transporting and Uncrating Transporting any instrument from one location to another requires thoughtful attention in advance of the actual shipment if the instrument is to ar-rive at its destination in good working condition. The Spectroil M is ruggedly designed and con-structed to be insensitive to typical transportation shock and vibration. It is, however, an analytical instrument that contains assemblies which are optically aligned and subject to damage or mis-alignment if abused. For this reason it is recom-mended that whenever possible, the instrument be air freighted from location to location. Once the instrument arrives at an air freight terminal, the normal means of forwarding transportation is by truck. Statistically, if damage to the instrument will occur, it most probably will happen during ground transportation. For this reason it is rec-ommended that the instrument be shipped in a transit case such as the one described in Section 3.6.9. The transit case has wheels for movement or it can be relocated using a fork lift. If a proper transit case is not available, the Spectroil M can
Chapter 2
Site Selection & Installation Requirements
Spectroil M/N-W & Spectroil M/C-W, (Mod. 6 & 7) Operations & User Maintenance Manual | 9
24 October 2007 / version 3.1
US (metric)Length: 30.5 inches (775 mm)Width: 25.0 inches (635 mm)Height: 27.5 inches (700 mm)Weight: Approx. 250 pounds (114 kg)
Table 2-1, Spectroil M Dimensions
Retractable Transport Handles (4)
Exhaust Chimney Power Connection Plate
Figure 2-1, Location of Transport Handles
Keyboard Table Hold-down Screws
be secured to a wooden shipping pallet which will serve as a shock absorbing medium. Whenever possible, use a fork lift to move the instrument and shipping pallet from one means of transpor-tation to another.
Once the instrument arrives at its destination, it must be uncrated and set up for operation. During this procedure, it should be carefully inspected for evidence of shipping damage. If obvious damage has occurred during shipment, it is advised that the damage be documented and photographed in order to obtain reconciliation from the freight transport organizations. If it is apparent that the damage will impair the operation of the instru-ment, contact Spectro Incorporated Field Service.
2.1.2 Location in the Laboratory The location that is selected for the Spectroil M in a laboratory application is important. Do not locate the instrument close to open windows and/or heating units. Proper site selection will ensure that the instrument will remain stable without special environmental controls and that recom-mended periodic maintenance can be conducted as required. Sufficient work space should be left clear around the perimeter of the spectrometer to provide maintenance personnel with access to the various panels. The dimensions for the Spectroil M are shown in Table 2-1. Since the Spectroil M can always be moved to provide panel access, it can also be located in tight fitting locations. How-ever, care must be taken to avoid blocking the rear air intake and exhaust ports.
2.1.3 Initial Setup The Spectroil M is normally delivered as a com-plete system and in one shipping container. The container includes the Spectroil M and all accessories.
NOTE: If the Spectroil is delivered in a transit case, remove the transit case cover and proceed with step 7. To uncrate the Spectroil M for operation, the fol-lowing procedure is recommended:
1. Before unpacking, move the instrument as close as possible to where it will be installed.
2. To uncrate the instrument remove screws along the base of the container and lift the top off the shipping pallet.
3. Remove the boxes which contain ancillary items for operation.
4. Pull out and fully extend the four (4) trans-port handles which are located near each of the four bottom corners of the spectrometer. Refer to Figure 2-1.
CAUTION: The weight of the Spectroil M is approximately 250 pounds (114 kg). The instru-ment should be moved with a fork lift or at least four personnel.
CAUTION: Take care to avoid pinching the fin-gers under the retractable transport handles when lowering the instrument.
10 | Chapter 2 Site Selection & Installation Requirements
24 October 2007 / version 3.1
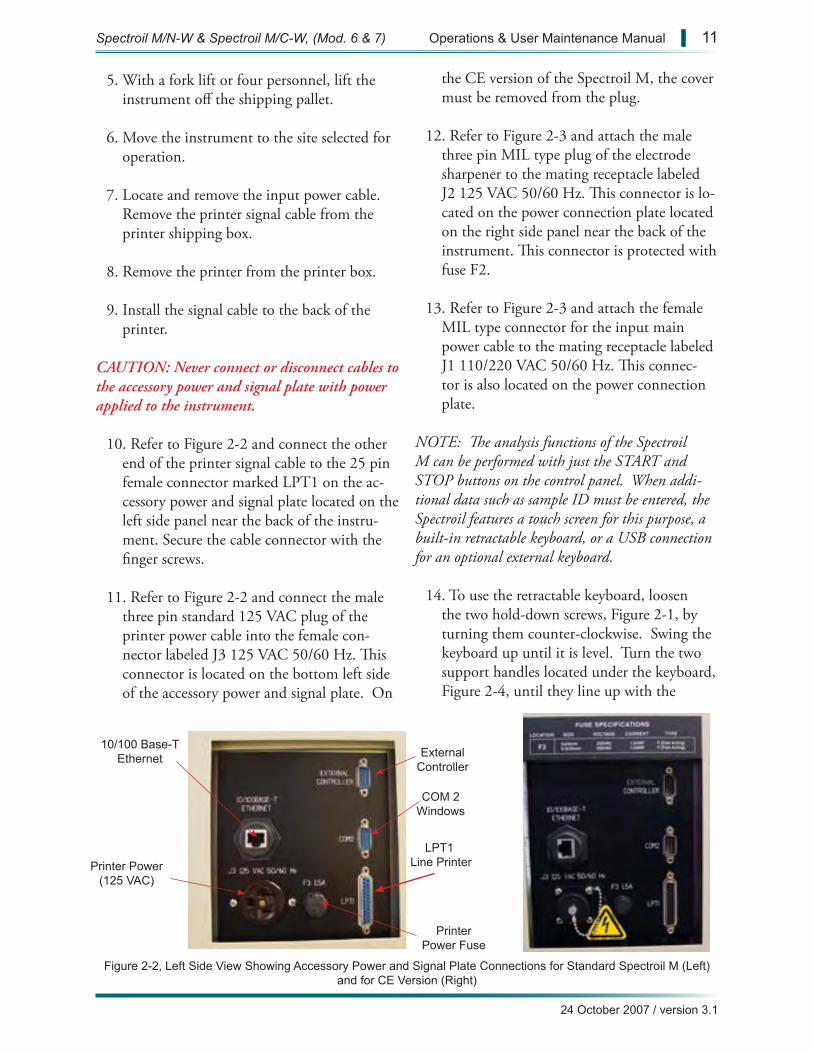
Figure 2-2, Left Side View Showing Accessory Power and Signal Plate Connections for Standard Spectroil M (Left) and for CE Version (Right)
COM 2Windows
External Controller
LPT1 Line Printer
Printer Power Fuse
10/100 Base-TEthernet
Printer Power(125 VAC)
5. With a fork lift or four personnel, lift the instrument off the shipping pallet.
6. Move the instrument to the site selected for operation.
7. Locate and remove the input power cable. Remove the printer signal cable from the printer shipping box.
8. Remove the printer from the printer box.
9. Install the signal cable to the back of the printer.
CAUTION: Never connect or disconnect cables to the accessory power and signal plate with power applied to the instrument.
10. Refer to Figure 2-2 and connect the other end of the printer signal cable to the 25 pin female connector marked LPT1 on the ac-cessory power and signal plate located on the left side panel near the back of the instru-ment. Secure the cable connector with the finger screws.
11. Refer to Figure 2-2 and connect the male three pin standard 125 VAC plug of the printer power cable into the female con-nector labeled J3 125 VAC 50/60 Hz. This connector is located on the bottom left side of the accessory power and signal plate. On
the CE version of the Spectroil M, the cover must be removed from the plug.
12. Refer to Figure 2-3 and attach the male three pin MIL type plug of the electrode sharpener to the mating receptacle labeled J2 125 VAC 50/60 Hz. This connector is lo-cated on the power connection plate located on the right side panel near the back of the instrument. This connector is protected with fuse F2.
13. Refer to Figure 2-3 and attach the female MIL type connector for the input main power cable to the mating receptacle labeled J1 110/220 VAC 50/60 Hz. This connec-tor is also located on the power connection plate.
NOTE: The analysis functions of the Spectroil M can be performed with just the START and STOP buttons on the control panel. When addi-tional data such as sample ID must be entered, the Spectroil features a touch screen for this purpose, a built-in retractable keyboard, or a USB connection for an optional external keyboard.
14. To use the retractable keyboard, loosen the two hold-down screws, Figure 2-1, by turning them counter-clockwise. Swing the keyboard up until it is level. Turn the two support handles located under the keyboard, Figure 2-4, until they line up with the
Spectroil M/N-W & Spectroil M/C-W, (Mod. 6 & 7) Operations & User Maintenance Manual | 11
24 October 2007 / version 3.1
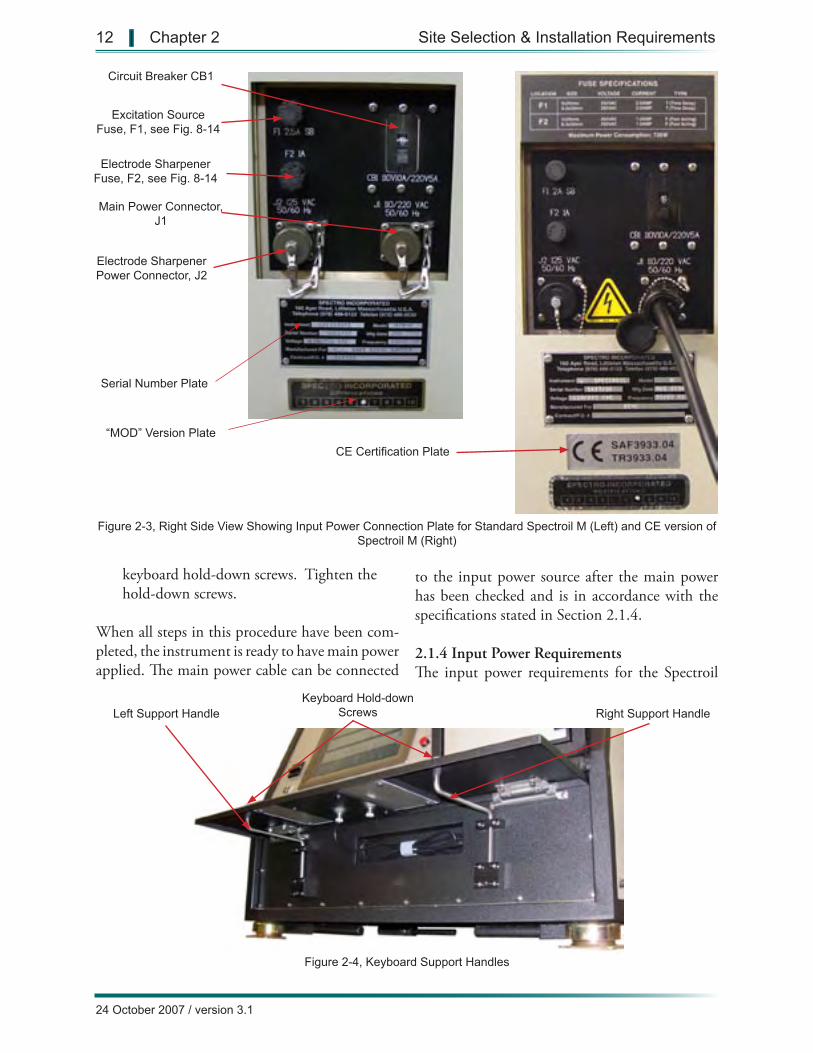
Figure 2-3, Right Side View Showing Input Power Connection Plate for Standard Spectroil M (Left) and CE version of Spectroil M (Right)
Circuit Breaker CB1
Main Power Connector, J1
Excitation Source Fuse, F1, see Fig. 8-14
Electrode SharpenerFuse, F2, see Fig. 8-14
Electrode Sharpener Power Connector, J2
Serial Number Plate
CE Certification Plate“MOD” Version Plate
Figure 2-4, Keyboard Support Handles
Left Support HandleKeyboard Hold-down
Screws Right Support Handle
keyboard hold-down screws. Tighten the hold-down screws.
When all steps in this procedure have been com-pleted, the instrument is ready to have main power applied. The main power cable can be connected
to the input power source after the main power has been checked and is in accordance with the specifications stated in Section 2.1.4.
2.1.4 Input Power Requirements The input power requirements for the Spectroil
12 | Chapter 2 Site Selection & Installation Requirements
24 October 2007 / version 3.1
ItemInput Voltage: 85-125 VAC, Single Phase or 208-265 VAC, Single PhaseFrequency: 50 or 60 HertzCurrent: 15 AmperesPower Consumption: Maximum 735 Watts
Table 2-2, Input Power Specifications
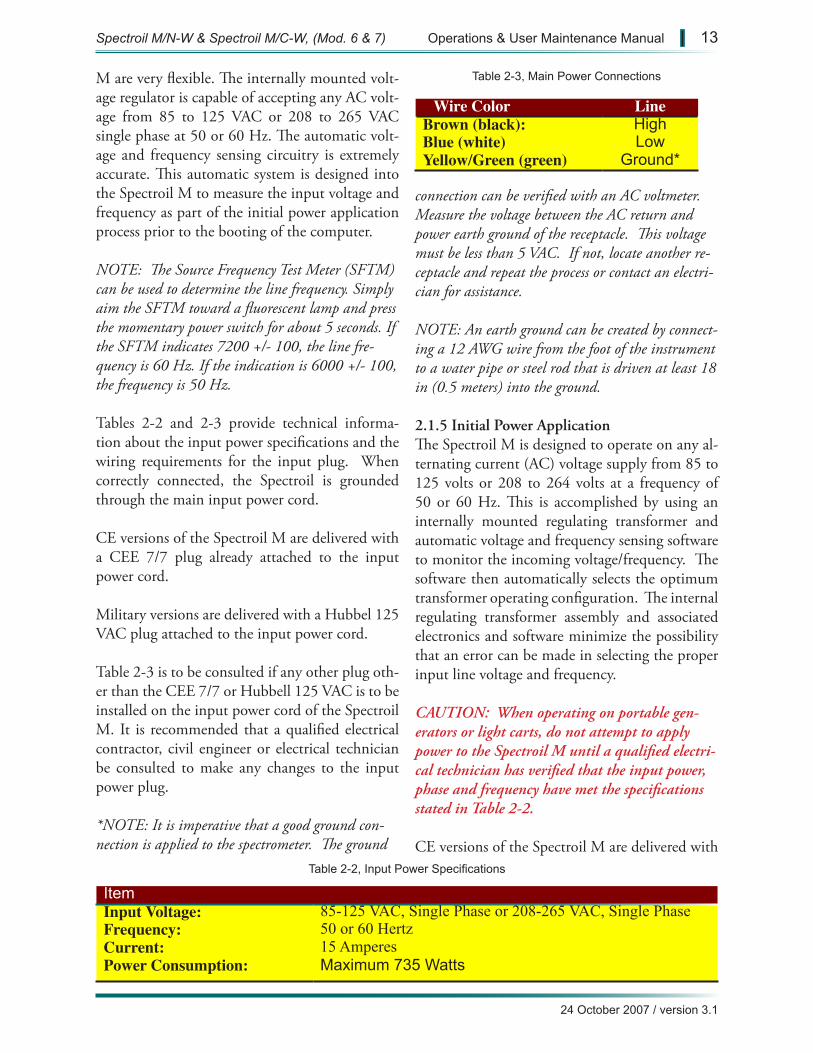
Wire Color LineBrown (black): HighBlue (white) LowYellow/Green (green) Ground*
Table 2-3, Main Power ConnectionsM are very flexible. The internally mounted volt-age regulator is capable of accepting any AC volt-age from 85 to 125 VAC or 208 to 265 VAC single phase at 50 or 60 Hz. The automatic volt-age and frequency sensing circuitry is extremely accurate. This automatic system is designed into the Spectroil M to measure the input voltage and frequency as part of the initial power application process prior to the booting of the computer.
NOTE: The Source Frequency Test Meter (SFTM) can be used to determine the line frequency. Simply aim the SFTM toward a fluorescent lamp and press the momentary power switch for about 5 seconds. If the SFTM indicates 7200 +/- 100, the line fre-quency is 60 Hz. If the indication is 6000 +/- 100, the frequency is 50 Hz.
Tables 2-2 and 2-3 provide technical informa-tion about the input power specifications and the wiring requirements for the input plug. When correctly connected, the Spectroil is grounded through the main input power cord.
CE versions of the Spectroil M are delivered with a CEE 7/7 plug already attached to the input power cord.
Military versions are delivered with a Hubbel 125 VAC plug attached to the input power cord.
Table 2-3 is to be consulted if any other plug oth-er than the CEE 7/7 or Hubbell 125 VAC is to be installed on the input power cord of the Spectroil M. It is recommended that a qualified electrical contractor, civil engineer or electrical technician be consulted to make any changes to the input power plug.
*NOTE: It is imperative that a good ground con-nection is applied to the spectrometer. The ground
connection can be verified with an AC voltmeter. Measure the voltage between the AC return and power earth ground of the receptacle. This voltage must be less than 5 VAC. If not, locate another re-ceptacle and repeat the process or contact an electri-cian for assistance.
NOTE: An earth ground can be created by connect-ing a 12 AWG wire from the foot of the instrument to a water pipe or steel rod that is driven at least 18 in (0.5 meters) into the ground.
2.1.5 Initial Power Application The Spectroil M is designed to operate on any al-ternating current (AC) voltage supply from 85 to 125 volts or 208 to 264 volts at a frequency of 50 or 60 Hz. This is accomplished by using an internally mounted regulating transformer and automatic voltage and frequency sensing software to monitor the incoming voltage/frequency. The software then automatically selects the optimum transformer operating configuration. The internal regulating transformer assembly and associated electronics and software minimize the possibility that an error can be made in selecting the proper input line voltage and frequency.
CAUTION: When operating on portable gen-erators or light carts, do not attempt to apply power to the Spectroil M until a qualified electri-cal technician has verified that the input power, phase and frequency have met the specifications stated in Table 2-2.
CE versions of the Spectroil M are delivered with
Spectroil M/N-W & Spectroil M/C-W, (Mod. 6 & 7) Operations & User Maintenance Manual | 13
24 October 2007 / version 3.1
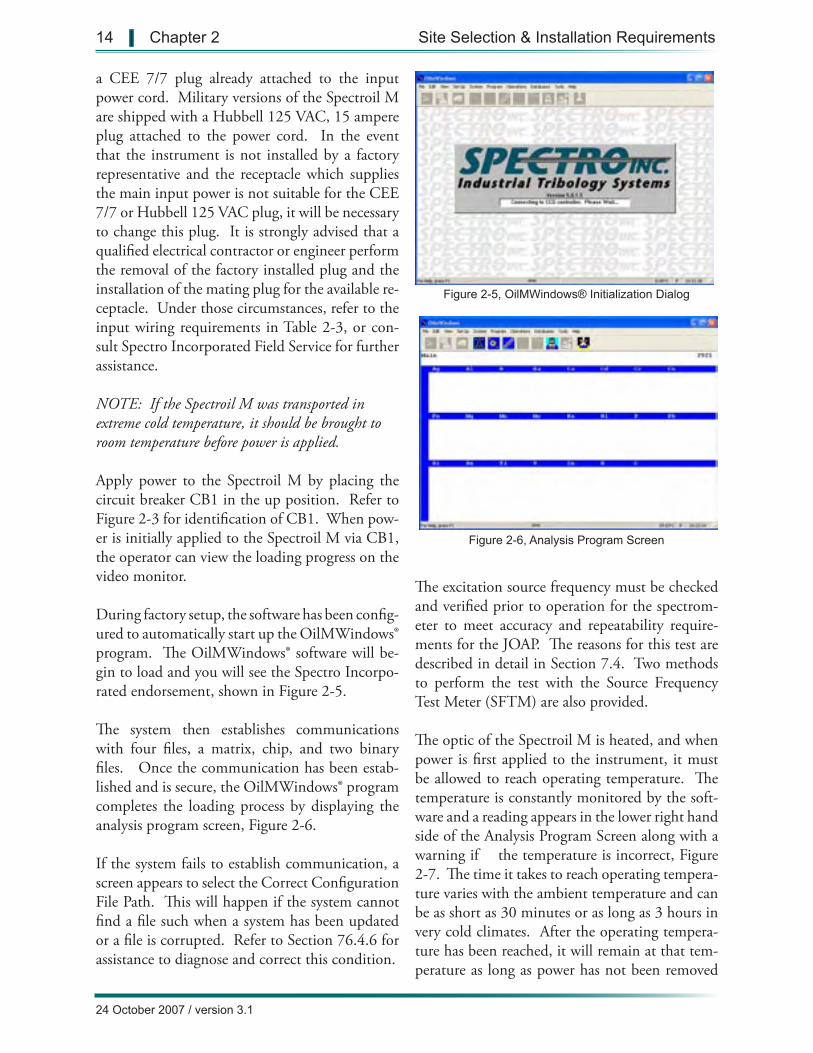
Figure 2-5, OilMWindows® Initialization Dialog
Figure 2-6, Analysis Program Screen
a CEE 7/7 plug already attached to the input power cord. Military versions of the Spectroil M are shipped with a Hubbell 125 VAC, 15 ampere plug attached to the power cord. In the event that the instrument is not installed by a factory representative and the receptacle which supplies the main input power is not suitable for the CEE 7/7 or Hubbell 125 VAC plug, it will be necessary to change this plug. It is strongly advised that a qualified electrical contractor or engineer perform the removal of the factory installed plug and the installation of the mating plug for the available re-ceptacle. Under those circumstances, refer to the input wiring requirements in Table 2-3, or con-sult Spectro Incorporated Field Service for further assistance.
NOTE: If the Spectroil M was transported in extreme cold temperature, it should be brought to room temperature before power is applied.
Apply power to the Spectroil M by placing the circuit breaker CB1 in the up position. Refer to Figure 2-3 for identification of CB1. When pow-er is initially applied to the Spectroil M via CB1, the operator can view the loading progress on the video monitor.
During factory setup, the software has been config-ured to automatically start up the OilMWindows® program. The OilMWindows® software will be-gin to load and you will see the Spectro Incorpo-rated endorsement, shown in Figure 2-5.
The system then establishes communications with four files, a matrix, chip, and two binary files. Once the communication has been estab-lished and is secure, the OilMWindows® program completes the loading process by displaying the analysis program screen, Figure 2-6.
If the system fails to establish communication, a screen appears to select the Correct Configuration File Path. This will happen if the system cannot find a file such when a system has been updated or a file is corrupted. Refer to Section 76.4.6 for assistance to diagnose and correct this condition.
The excitation source frequency must be checked and verified prior to operation for the spectrom-eter to meet accuracy and repeatability require-ments for the JOAP. The reasons for this test are described in detail in Section 7.4. Two methods to perform the test with the Source Frequency Test Meter (SFTM) are also provided.
The optic of the Spectroil M is heated, and when power is first applied to the instrument, it must be allowed to reach operating temperature. The temperature is constantly monitored by the soft-ware and a reading appears in the lower right hand side of the Analysis Program Screen along with a warning if the temperature is incorrect, Figure 2-7. The time it takes to reach operating tempera-ture varies with the ambient temperature and can be as short as 30 minutes or as long as 3 hours in very cold climates. After the operating tempera-ture has been reached, it will remain at that tem-perature as long as power has not been removed
14 | Chapter 2 Site Selection & Installation Requirements
24 October 2007 / version 3.1
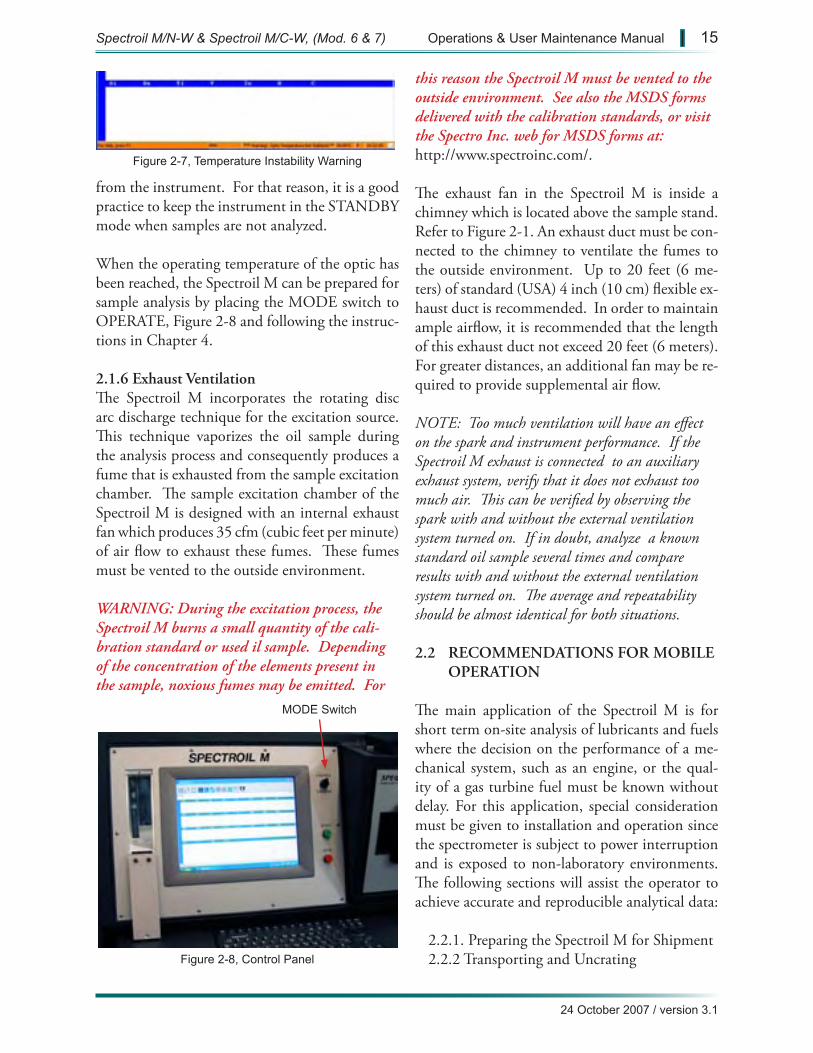
Figure 2-7, Temperature Instability Warning
Figure 2-8, Control Panel
MODE Switch
from the instrument. For that reason, it is a good practice to keep the instrument in the STANDBY mode when samples are not analyzed.
When the operating temperature of the optic has been reached, the Spectroil M can be prepared for sample analysis by placing the MODE switch to OPERATE, Figure 2-8 and following the instruc-tions in Chapter 4.
2.1.6 Exhaust Ventilation The Spectroil M incorporates the rotating disc arc discharge technique for the excitation source. This technique vaporizes the oil sample during the analysis process and consequently produces a fume that is exhausted from the sample excitation chamber. The sample excitation chamber of the Spectroil M is designed with an internal exhaust fan which produces 35 cfm (cubic feet per minute) of air flow to exhaust these fumes. These fumes must be vented to the outside environment.
WARNING: During the excitation process, the Spectroil M burns a small quantity of the cali-bration standard or used il sample. Depending of the concentration of the elements present in the sample, noxious fumes may be emitted. For
this reason the Spectroil M must be vented to the outside environment. See also the MSDS forms delivered with the calibration standards, or visit the Spectro Inc. web for MSDS forms at: http://www.spectroinc.com/.
The exhaust fan in the Spectroil M is inside a chimney which is located above the sample stand. Refer to Figure 2-1. An exhaust duct must be con-nected to the chimney to ventilate the fumes to the outside environment. Up to 20 feet (6 me-ters) of standard (USA) 4 inch (10 cm) flexible ex-haust duct is recommended. In order to maintain ample airflow, it is recommended that the length of this exhaust duct not exceed 20 feet (6 meters). For greater distances, an additional fan may be re-quired to provide supplemental air flow.
NOTE: Too much ventilation will have an effect on the spark and instrument performance. If the Spectroil M exhaust is connected to an auxiliary exhaust system, verify that it does not exhaust too much air. This can be verified by observing the spark with and without the external ventilation system turned on. If in doubt, analyze a known standard oil sample several times and compare results with and without the external ventilation system turned on. The average and repeatability should be almost identical for both situations. 2.2 RECOMMENDATIONS FOR MOBILE
OPERATION
The main application of the Spectroil M is for short term on-site analysis of lubricants and fuels where the decision on the performance of a me-chanical system, such as an engine, or the qual-ity of a gas turbine fuel must be known without delay. For this application, special consideration must be given to installation and operation since the spectrometer is subject to power interruption and is exposed to non-laboratory environments. The following sections will assist the operator to achieve accurate and reproducible analytical data:
2.2.1. Preparing the Spectroil M for Shipment 2.2.2 Transporting and Uncrating
Spectroil M/N-W & Spectroil M/C-W, (Mod. 6 & 7) Operations & User Maintenance Manual | 15
24 October 2007 / version 3.1

2.2.3. Selecting a Suitable Location for Short Term Analysis
2.2.4. Operation from Light Carts and Por-table Generators
2.2.5. Exhaust Ventilation 2.2.6. Power Application and Stabilization2.3 Environmental Operating Conditions
Careful attention to the preparation of the Spectroil M in advance of shipment will ensure a successful mobile operation upon its arrival at the installation site.
2.2.1 Preparing the Spectroil M for Shipment Although the mobile Spectroil M is designed and constructed to be rugged and capable of operating in harsh environments, careful attention must be paid to the preparation of the instrument prior to shipment. The recommended procedure is as follows:
1. Place the MODE switch located on the operator’s control panel to the STANDBY position, refer to Figure 2-7.
2. Refer to Figure 2-3 and remove power from the instrument by placing the main circuit breaker CB1 located on the input power circuit breaker panel to the down (OFF) position.
3. Refer to Figure 2-3 and disconnect the input power plug from the voltage source and disconnect the cable from the connector labeled J1 located on the input power circuit breaker panel. Attach the protective cover to J1.
4. Refer to Figure 2-2 and disconnect the male three pin power plug from the female con-nector labeled J3 which supplies power to the printer. The connector is located on the bottom left side of the accessory power and signal plate.
5. Refer to Figure 2-2 and disconnect the signal cable labeled LPT1 on the accessory power
and signal plate located on the left side panel near the back of the instrument. Remove the connector from the receptacle on the back of the printer. If used, remove any external USB devices and external data signal cable.
6. Carefully wrap the two cables (main power and printer signal) together. These should be packed inside the printer box along with the printer.
7. Re-pack the printer in its original box. If the original box and packing material are not available, obtain a suitable replacement and carefully pack the printer for transit.
8. Refer to Figure 2-3 and disconnect the MIL connector labeled J2 which provides power to the electrode sharpener. Attach the pro-tective cover to J2. Wrap the cable around the electrode sharpener and pack in a sepa-rate cardboard box.
9. Close the sample excitation stand door and verify that the latch is engaged to be sure that it will not open in transit.
CAUTION: The weight of the Spectroil M is approximately 250 pounds (114 Kg). The instru-ment should be moved with a fork lift or at least four personnel.
10. Secure the keyboard by loosening the two keyboard hold-down screws, Figure 2-4, swing the support handles towards the outside of the instrument, fold down the keyboard and tighten the hold-down screws.
11. Extend the four transport handles located beneath the instrument and with a forklift or four personnel, lift the Spectroil M off its table and center the instrument on its original shipping pallet. If the original ship-ping pallet is not available, be sure that the replacement pallet is capable of being moved by a forklift.
16 | Chapter 2 Site Selection & Installation Requirements
24 October 2007 / version 3.1
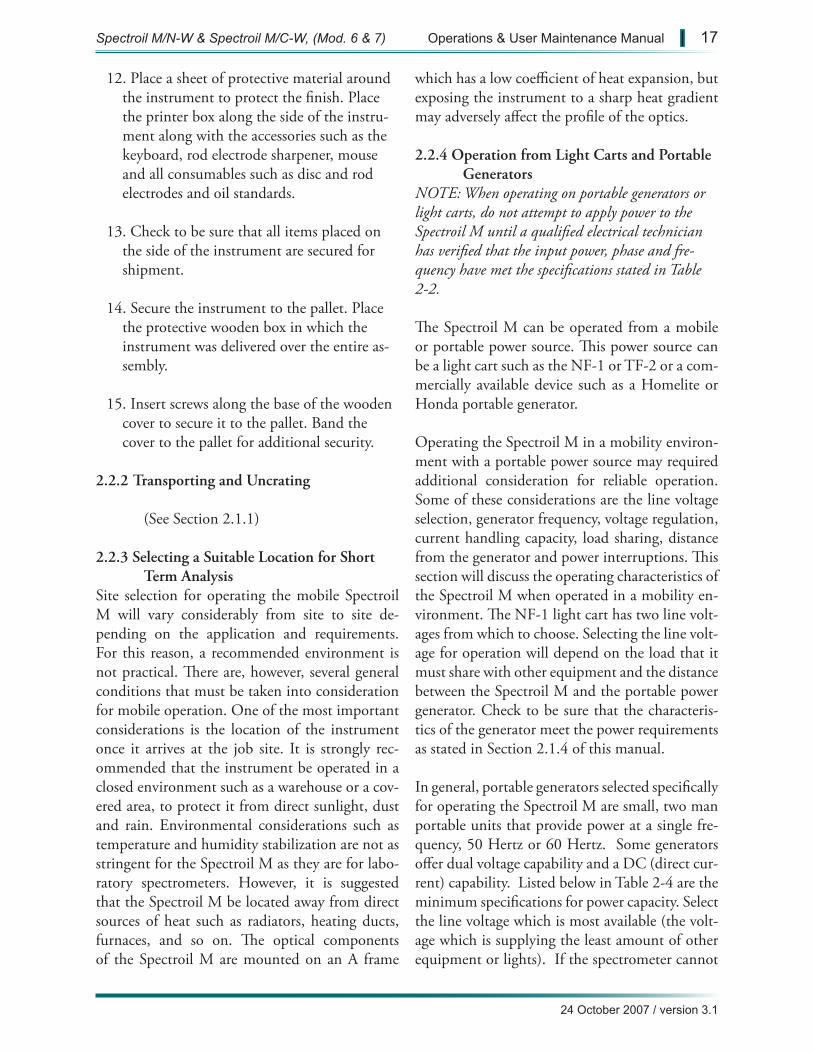
12. Place a sheet of protective material around the instrument to protect the finish. Place the printer box along the side of the instru-ment along with the accessories such as the keyboard, rod electrode sharpener, mouse and all consumables such as disc and rod electrodes and oil standards.
13. Check to be sure that all items placed on the side of the instrument are secured for shipment.
14. Secure the instrument to the pallet. Place the protective wooden box in which the instrument was delivered over the entire as-sembly.
15. Insert screws along the base of the wooden cover to secure it to the pallet. Band the cover to the pallet for additional security.
2.2.2 Transporting and Uncrating
(See Section 2.1.1)
2.2.3 Selecting a Suitable Location for Short Term Analysis
Site selection for operating the mobile Spectroil M will vary considerably from site to site de-pending on the application and requirements. For this reason, a recommended environment is not practical. There are, however, several general conditions that must be taken into consideration for mobile operation. One of the most important considerations is the location of the instrument once it arrives at the job site. It is strongly rec-ommended that the instrument be operated in a closed environment such as a warehouse or a cov-ered area, to protect it from direct sunlight, dust and rain. Environmental considerations such as temperature and humidity stabilization are not as stringent for the Spectroil M as they are for labo-ratory spectrometers. However, it is suggested that the Spectroil M be located away from direct sources of heat such as radiators, heating ducts, furnaces, and so on. The optical components of the Spectroil M are mounted on an A frame
which has a low coefficient of heat expansion, but exposing the instrument to a sharp heat gradient may adversely affect the profile of the optics.
2.2.4 Operation from Light Carts and Portable Generators
NOTE: When operating on portable generators or light carts, do not attempt to apply power to the Spectroil M until a qualified electrical technician has verified that the input power, phase and fre-quency have met the specifications stated in Table 2-2.
The Spectroil M can be operated from a mobile or portable power source. This power source can be a light cart such as the NF-1 or TF-2 or a com-mercially available device such as a Homelite or Honda portable generator.
Operating the Spectroil M in a mobility environ-ment with a portable power source may required additional consideration for reliable operation. Some of these considerations are the line voltage selection, generator frequency, voltage regulation, current handling capacity, load sharing, distance from the generator and power interruptions. This section will discuss the operating characteristics of the Spectroil M when operated in a mobility en-vironment. The NF-1 light cart has two line volt-ages from which to choose. Selecting the line volt-age for operation will depend on the load that it must share with other equipment and the distance between the Spectroil M and the portable power generator. Check to be sure that the characteris-tics of the generator meet the power requirements as stated in Section 2.1.4 of this manual.
In general, portable generators selected specifically for operating the Spectroil M are small, two man portable units that provide power at a single fre-quency, 50 Hertz or 60 Hertz. Some generators offer dual voltage capability and a DC (direct cur-rent) capability. Listed below in Table 2-4 are the minimum specifications for power capacity. Select the line voltage which is most available (the volt-age which is supplying the least amount of other equipment or lights). If the spectrometer cannot
Spectroil M/N-W & Spectroil M/C-W, (Mod. 6 & 7) Operations & User Maintenance Manual | 17
24 October 2007 / version 3.1
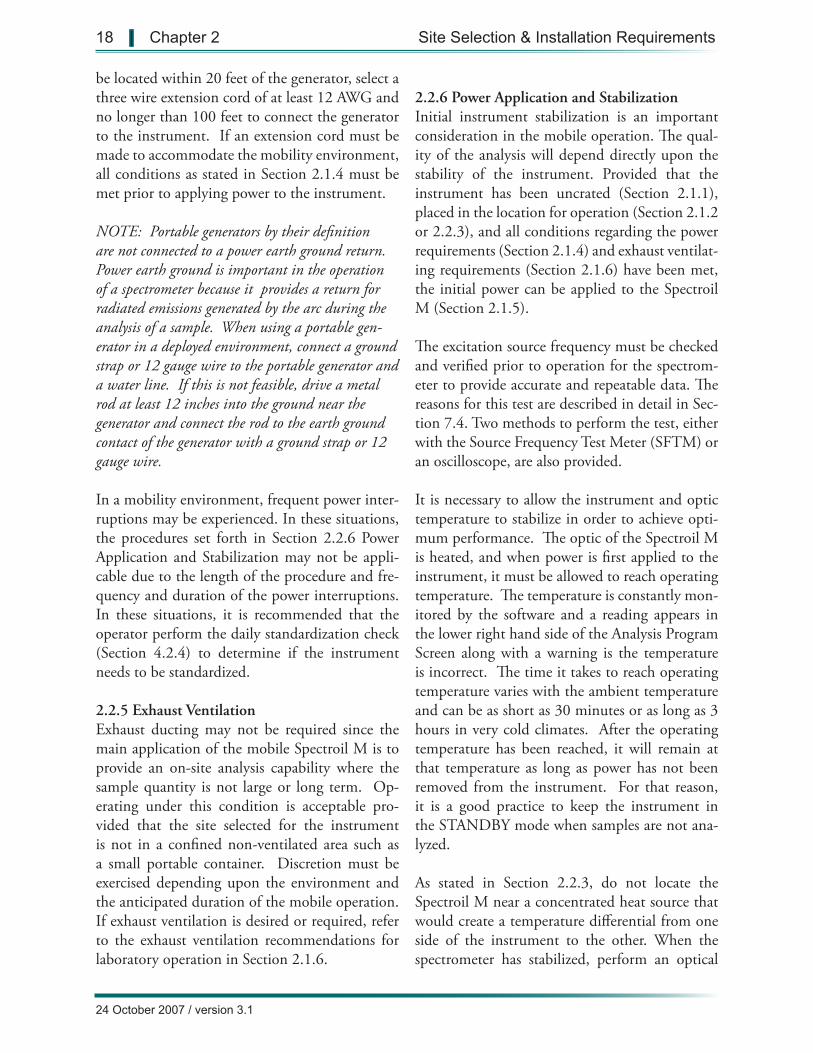
be located within 20 feet of the generator, select a three wire extension cord of at least 12 AWG and no longer than 100 feet to connect the generator to the instrument. If an extension cord must be made to accommodate the mobility environment, all conditions as stated in Section 2.1.4 must be met prior to applying power to the instrument.
NOTE: Portable generators by their definition are not connected to a power earth ground return. Power earth ground is important in the operation of a spectrometer because it provides a return for radiated emissions generated by the arc during the analysis of a sample. When using a portable gen-erator in a deployed environment, connect a ground strap or 12 gauge wire to the portable generator and a water line. If this is not feasible, drive a metal rod at least 12 inches into the ground near the generator and connect the rod to the earth ground contact of the generator with a ground strap or 12 gauge wire.
In a mobility environment, frequent power inter-ruptions may be experienced. In these situations, the procedures set forth in Section 2.2.6 Power Application and Stabilization may not be appli-cable due to the length of the procedure and fre-quency and duration of the power interruptions. In these situations, it is recommended that the operator perform the daily standardization check (Section 4.2.4) to determine if the instrument needs to be standardized.
2.2.5 Exhaust Ventilation Exhaust ducting may not be required since the main application of the mobile Spectroil M is to provide an on-site analysis capability where the sample quantity is not large or long term. Op-erating under this condition is acceptable pro-vided that the site selected for the instrument is not in a confined non-ventilated area such as a small portable container. Discretion must be exercised depending upon the environment and the anticipated duration of the mobile operation. If exhaust ventilation is desired or required, refer to the exhaust ventilation recommendations for laboratory operation in Section 2.1.6.
2.2.6 Power Application and StabilizationInitial instrument stabilization is an important consideration in the mobile operation. The qual-ity of the analysis will depend directly upon the stability of the instrument. Provided that the instrument has been uncrated (Section 2.1.1), placed in the location for operation (Section 2.1.2 or 2.2.3), and all conditions regarding the power requirements (Section 2.1.4) and exhaust ventilat-ing requirements (Section 2.1.6) have been met, the initial power can be applied to the Spectroil M (Section 2.1.5).
The excitation source frequency must be checked and verified prior to operation for the spectrom-eter to provide accurate and repeatable data. The reasons for this test are described in detail in Sec-tion 7.4. Two methods to perform the test, either with the Source Frequency Test Meter (SFTM) or an oscilloscope, are also provided.
It is necessary to allow the instrument and optic temperature to stabilize in order to achieve opti-mum performance. The optic of the Spectroil M is heated, and when power is first applied to the instrument, it must be allowed to reach operating temperature. The temperature is constantly mon-itored by the software and a reading appears in the lower right hand side of the Analysis Program Screen along with a warning is the temperature is incorrect. The time it takes to reach operating temperature varies with the ambient temperature and can be as short as 30 minutes or as long as 3 hours in very cold climates. After the operating temperature has been reached, it will remain at that temperature as long as power has not been removed from the instrument. For that reason, it is a good practice to keep the instrument in the STANDBY mode when samples are not ana-lyzed.
As stated in Section 2.2.3, do not locate the Spectroil M near a concentrated heat source that would create a temperature differential from one side of the instrument to the other. When the spectrometer has stabilized, perform an optical
18 | Chapter 2 Site Selection & Installation Requirements
24 October 2007 / version 3.1

profile as described in Section 4.2.7, followed by a standardization as described in Section 4.2.5. Af-ter standardization and the daily standardization check, the instrument is ready to run samples.
It is possible that stability will be reached in much less time than one-half hour. If the instrument must be used soon after power is applied where it is questionable whether internal operating tem-perature has stabilized, it is recommended that the standardization be checked once or twice more during the first few hours of operation.
2.3 ENVIRONMENTAL CONDITIONS
The environmental conditions of the Spectroil family of spectrometers are:
• Indoor or covered (under roof) use only• Altitude: up to 2,000 meters (6,562 feet)• Operating Temperature Range: 5 to 43°C
(40 to 110°F)• Maximum Relative Humidity: 90%• Pollution Degree: 2• Over Voltage Category: 2
• Prolonged Storage: - Military Preservation Method 52
Spectroil M/N-W & Spectroil M/C-W, (Mod. 6 & 7) Operations & User Maintenance Manual | 19
24 October 2007 / version 3.1

This Page is Intentionally Left Blank
20 | Chapter 2 Site Selection & Installation Requirements
24 October 2007 / version 3.1
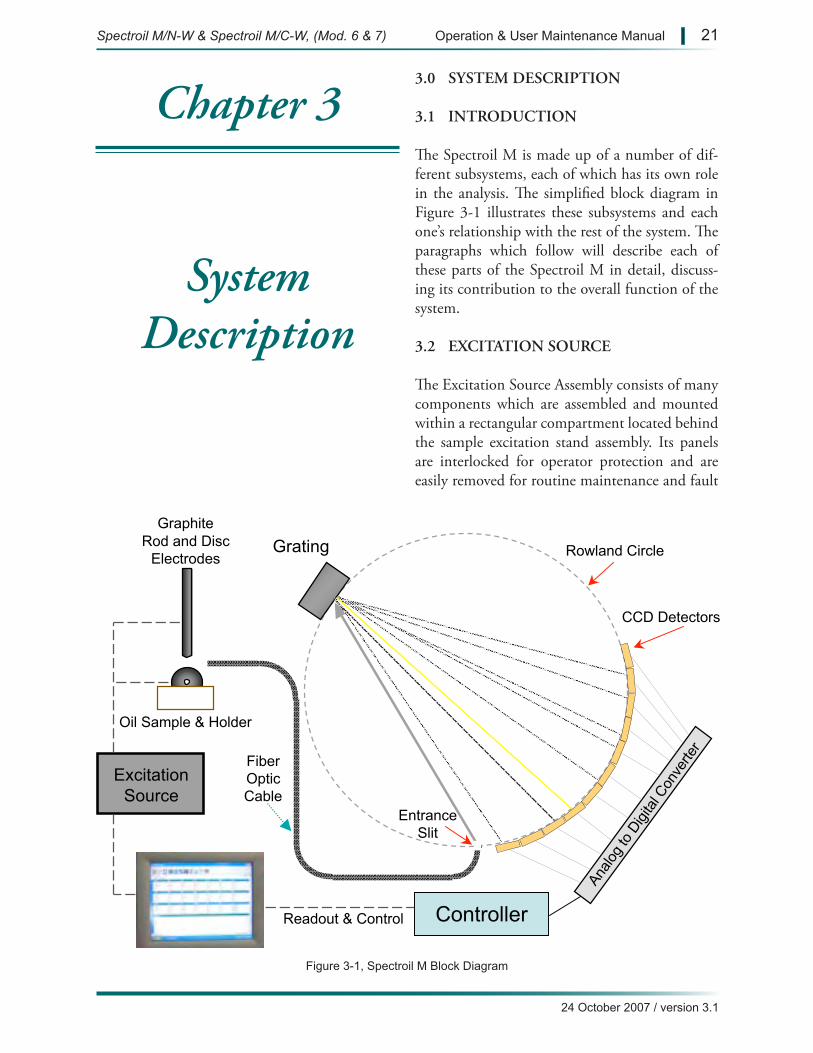
Figure 3-1, Spectroil M Block Diagram
Excitation
Source
Graphite
Rod and Disc
Electrodes
Oil Sample & Holder
Grating
Ana
log
to D
igita
l Con
verter
Rowland Circle
Entrance
Slit
Fiber
Optic
Cable
Readout & Control
CCD Detectors
Controller
3.0 SYSTEM DESCRIPTION
3.1 INTRODUCTION
The Spectroil M is made up of a number of dif-ferent subsystems, each of which has its own role in the analysis. The simplified block diagram in Figure 3-1 illustrates these subsystems and each one’s relationship with the rest of the system. The paragraphs which follow will describe each of these parts of the Spectroil M in detail, discuss-ing its contribution to the overall function of the system.
3.2 EXCITATION SOURCE
The Excitation Source Assembly consists of many components which are assembled and mounted within a rectangular compartment located behind the sample excitation stand assembly. Its panels are interlocked for operator protection and are easily removed for routine maintenance and fault
Chapter 3
System Description
Spectroil M/N-W & Spectroil M/C-W, (Mod. 6 & 7) Operation & User Maintenance Manual | 21
24 October 2007 / version 3.1
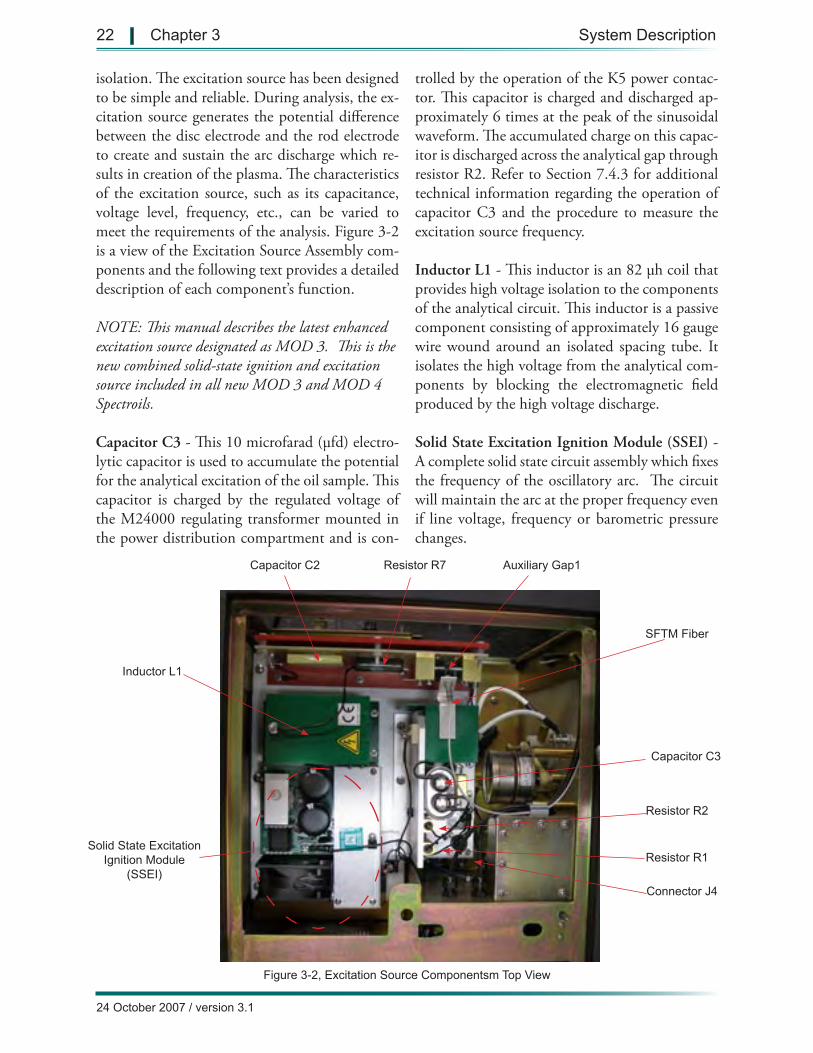
Auxiliary Gap1
SFTM Fiber
Capacitor C3
Resistor R2
Resistor R1
Connector J4
Inductor L1
Capacitor C2 Resistor R7
Solid State ExcitationIgnition Module
(SSEI)
Figure 3-2, Excitation Source Componentsm Top View
isolation. The excitation source has been designed to be simple and reliable. During analysis, the ex-citation source generates the potential difference between the disc electrode and the rod electrode to create and sustain the arc discharge which re-sults in creation of the plasma. The characteristics of the excitation source, such as its capacitance, voltage level, frequency, etc., can be varied to meet the requirements of the analysis. Figure 3-2 is a view of the Excitation Source Assembly com-ponents and the following text provides a detailed description of each component’s function.
NOTE: This manual describes the latest enhanced excitation source designated as MOD 3. This is the new combined solid-state ignition and excitation source included in all new MOD 3 and MOD 4 Spectroils.
Capacitor C3 - This 10 microfarad (µfd) electro-lytic capacitor is used to accumulate the potential for the analytical excitation of the oil sample. This capacitor is charged by the regulated voltage of the M24000 regulating transformer mounted in the power distribution compartment and is con-
trolled by the operation of the K5 power contac-tor. This capacitor is charged and discharged ap-proximately 6 times at the peak of the sinusoidal waveform. The accumulated charge on this capac-itor is discharged across the analytical gap through resistor R2. Refer to Section 7.4.3 for additional technical information regarding the operation of capacitor C3 and the procedure to measure the excitation source frequency.
Inductor L1 - This inductor is an 82 µh coil that provides high voltage isolation to the components of the analytical circuit. This inductor is a passive component consisting of approximately 16 gauge wire wound around an isolated spacing tube. It isolates the high voltage from the analytical com-ponents by blocking the electromagnetic field produced by the high voltage discharge.
Solid State Excitation Ignition Module (SSEI) - A complete solid state circuit assembly which fixes the frequency of the oscillatory arc. The circuit will maintain the arc at the proper frequency even if line voltage, frequency or barometric pressure changes.
22 | Chapter 3 System Description
24 October 2007 / version 3.1
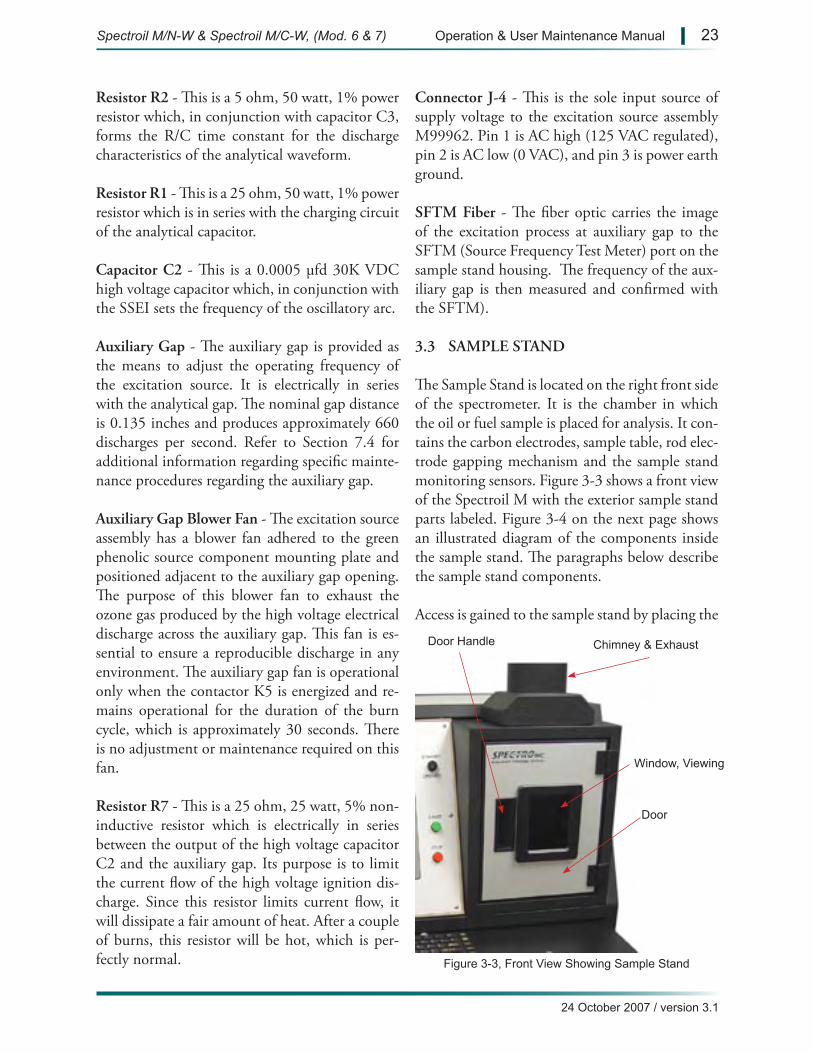
Figure 3-3, Front View Showing Sample Stand
Door Handle Chimney & Exhaust
Door
Window, Viewing
Resistor R2 - This is a 5 ohm, 50 watt, 1% power resistor which, in conjunction with capacitor C3, forms the R/C time constant for the discharge characteristics of the analytical waveform.
Resistor R1 - This is a 25 ohm, 50 watt, 1% power resistor which is in series with the charging circuit of the analytical capacitor.
Capacitor C2 - This is a 0.0005 µfd 30K VDC high voltage capacitor which, in conjunction with the SSEI sets the frequency of the oscillatory arc.
Auxiliary Gap - The auxiliary gap is provided as the means to adjust the operating frequency of the excitation source. It is electrically in series with the analytical gap. The nominal gap distance is 0.135 inches and produces approximately 660 discharges per second. Refer to Section 7.4 for additional information regarding specific mainte-nance procedures regarding the auxiliary gap.
Auxiliary Gap Blower Fan - The excitation source assembly has a blower fan adhered to the green phenolic source component mounting plate and positioned adjacent to the auxiliary gap opening. The purpose of this blower fan to exhaust the ozone gas produced by the high voltage electrical discharge across the auxiliary gap. This fan is es-sential to ensure a reproducible discharge in any environment. The auxiliary gap fan is operational only when the contactor K5 is energized and re-mains operational for the duration of the burn cycle, which is approximately 30 seconds. There is no adjustment or maintenance required on this fan.
Resistor R7 - This is a 25 ohm, 25 watt, 5% non-inductive resistor which is electrically in series between the output of the high voltage capacitor C2 and the auxiliary gap. Its purpose is to limit the current flow of the high voltage ignition dis-charge. Since this resistor limits current flow, it will dissipate a fair amount of heat. After a couple of burns, this resistor will be hot, which is per-fectly normal.
Connector J-4 - This is the sole input source of supply voltage to the excitation source assembly M99962. Pin 1 is AC high (125 VAC regulated), pin 2 is AC low (0 VAC), and pin 3 is power earth ground.
SFTM Fiber - The fiber optic carries the image of the excitation process at auxiliary gap to the SFTM (Source Frequency Test Meter) port on the sample stand housing. The frequency of the aux-iliary gap is then measured and confirmed with the SFTM).
3.3 SAMPLE STAND
The Sample Stand is located on the right front side of the spectrometer. It is the chamber in which the oil or fuel sample is placed for analysis. It con-tains the carbon electrodes, sample table, rod elec-trode gapping mechanism and the sample stand monitoring sensors. Figure 3-3 shows a front view of the Spectroil M with the exterior sample stand parts labeled. Figure 3-4 on the next page shows an illustrated diagram of the components inside the sample stand. The paragraphs below describe the sample stand components.
Access is gained to the sample stand by placing the
Spectroil M/N-W & Spectroil M/C-W, (Mod. 6 & 7) Operation & User Maintenance Manual | 23
24 October 2007 / version 3.1
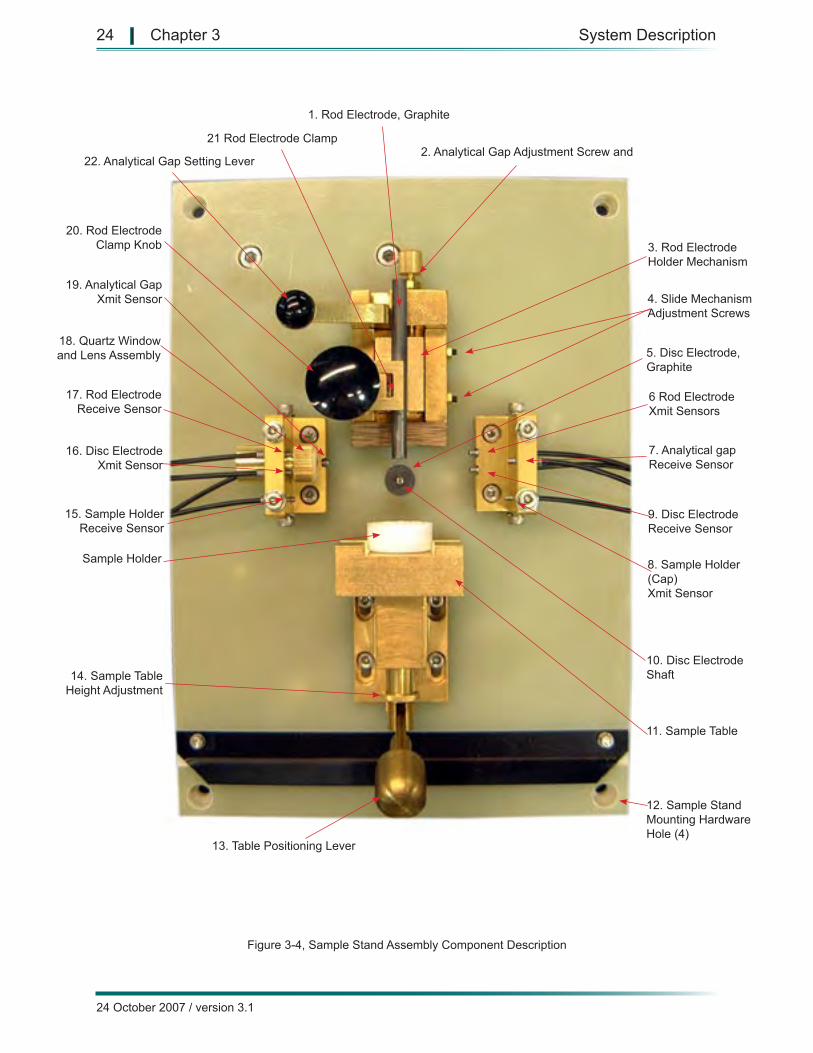
Figure 3-4, Sample Stand Assembly Component Description
1. Rod Electrode, Graphite
2. Analytical Gap Adjustment Screw and
5. Disc Electrode, Graphite
4. Slide Mechanism Adjustment Screws
3. Rod Electrode Holder Mechanism
6 Rod Electrode Xmit Sensors
7. Analytical gap Receive Sensor
8. Sample Holder (Cap) Xmit Sensor
9. Disc Electrode Receive Sensor
10. Disc Electrode Shaft
11. Sample Table
12. Sample Stand Mounting Hardware Hole (4)
20. Rod Electrode Clamp Knob
22. Analytical Gap Setting Lever
21 Rod Electrode Clamp
19. Analytical Gap Xmit Sensor
18. Quartz Window and Lens Assembly
17. Rod Electrode Receive Sensor
16. Disc Electrode Xmit Sensor
15. Sample Holder Receive Sensor
Sample Holder
14. Sample Table Height Adjustment
13. Table Positioning Lever
24 | Chapter 3 System Description
24 October 2007 / version 3.1
right hand inside the door handle and pulling the door towards you. An interlock switch prevents the excitation from taking place while the door is open. The exhaust fan expels fumes from around the sample area and operates when the MODE switch is placed in the OPERATE position. The remaining components inside the sample stand are described below.
1. Rod Electrode (Graphite) - The graphite rod electrode develops an arc discharge from the tip of the rod electrode to the circumference of the disc electrode and alternately receives an arc discharge from the disc electrode surface to the tip of the rod. This is called an oscillating arc discharge. The rod is 0.243 inches (0.617 cm) in diameter and 6 inches (15.24 cm) long. Length decreases as the rod is sharpened.
2. Analytical Gap Adjustment Screw and Lock The screw is adjusted and locked to limit the up-ward travel of the slide mechanism which pro-duces an analytical gap distance of 0.090 inches between the rod and disc electrodes when the ana-lytical gap setting lever is raised and lowered to its rest position. The gap is set during factory calibra-tion to maximize light intensity. The gap should not be reset under routine circumstances.
3. Rod Electrode Holder and Slide Mechanism - The rod electrode holder clamps the rod electrode in a “V” positioning channel. This mechanism slides along the vertical axis when the analytical gap setting lever is activated thereby accurately setting the analytical gap. Its upward travel is lim-ited by the analytical gap adjustment screw.
4. Slide Mechanism Adjustment Screws - The slide mechanism must move freely along a verti-cal axis. See Section 7.6.1.1 for adjustment of the slide mechanism.
5. Disc Electrode (Graphite) - The high purity graphite disc electrode rotates through the oil sample to introduce the sample into the analyti-cal gap for excitation. The disc is type ASTM D-2, 0.492 inches (1.25 cm) in diameter and 0.200
inches (0.508 cm) thick.
6. Rod Electrode XMIT Sensor - The presence of the rod electrode is monitored at all times to pre-vent an analytical discharge from occurring in the event that the operator fails to install and properly position the rod electrode. This monitoring sys-tem is accomplished by passing a focused beam of incandescent light from the transmitter (XMIT) to the receiver (RECEIVE). If the rod electrode is installed and properly positioned, it will inter-rupt this beam of light, confirming its presence. This component is the transmit (XMIT) sensor. This monitoring system is basically passive and does not require any alignment or adjustment, however as in all light activated systems, it should be kept clean to avoid an erroneous indication. To clean the sensors, use an ammonia-based win-dow cleaner or an optical lens cleaning solution. Clean the sensors daily, or as required depending on sample volume.
7. Analytical Gap Receive Sensor - The analyti-cal gap is monitored at all times to prevent an analytical discharge from occurring in the event that the operator fails to set a gap distance be-tween the disc and rod electrodes. This monitor-ing system is accomplished by passing a focused beam of incandescent light from the transmitter (XMIT) through the analytical gap to the receiver (RECEIVE). This component is the receive (RE-CEIVE) sensor. This monitoring system is basi-cally passive and does not require any alignment or adjustment, however as in all light activated systems, it should be kept clean to avoid an er-roneous indication. To clean the sensors, use an ammonia-based window cleaner or an optical lens cleaning solution. Clean the sensors daily, or as required depending on sample volume.
8. Sample Holder XMIT Sensor - The presence of the sample holder is monitored at all times to prevent an analytical discharge from occurring in the event that the sample holder has not been el-evated into position. This monitoring system is accomplished by passing a focused beam of in-candescent light from the transmitter (XMIT)
Spectroil M/N-W & Spectroil M/C-W, (Mod. 6 & 7) Operation & User Maintenance Manual | 25
24 October 2007 / version 3.1
through the sample holder to the receiver (RE-CEIVE). If the sample holder is installed and properly positioned, it will interrupt this beam of light confirming its presence. This component is the transmit (XMIT) sensor. This monitoring sys-tem is basically passive and does not require any alignment or adjustment, however as in all light activated systems, it should be kept clean to avoid an erroneous indication. To clean the sensors, use an ammonia-based window cleaner or an optical lens cleaning solution. Clean the sensors daily, or as required depending on sample volume.
9. Disc Electrode Receive Sensor - The presence of the disc electrode is monitored at all times to pre-vent an analytical discharge from occurring in the event that the operator fails to install and properly position the disc electrode. This monitoring sys-tem is accomplished by passing a focused beam of incandescent light from the transmitter (XMIT) to the receiver (RECEIVE). If the disc electrode is installed and properly positioned, it will inter-rupt this beam of light confirming its presence. This component is the receive (RECEIVE) sensor. This monitoring system is basically passive and does not require any alignment or adjustment, however as in all light activated systems, it should be kept clean to avoid an erroneous indication. To clean the sensors, use an ammonia-based win-dow cleaner or an optical lens cleaning solution. Clean the sensors daily, or as required depending on sample volume.
10. Disc Electrode Shaft - The disc electrode shaft secures and rotates the disc electrode during the analysis. This shaft has been designed to be re-placed at the operator level. Occasionally, a disc electrode shaft will be bent through mishandling, or unable to securely mount a disc electrode be-cause of erosion of the outer diameter due to pre-vious arcing between the outer diameter of the shaft and the inner diameter of the disc electrode. In these situations, this shaft can easily be replaced by inserting a small jeweler’s screwdriver into the slotted end and turning the shaft counterclockwise until it can be pulled out of the bearing mount. Replace this shaft in the reverse of this procedure.
Check to be sure that the disc electrode is aligned to the rod by checking the tracking. Refer to Sec-tion 7.6.1.2 for a detailed description of this pro-cedure. 11. Sample Table - The sample table holds the oil sample holder, and when raised, immerses the disc electrode in the oil.
12. Sample Stand Mounting Hardware - The sample stand mounting hardware secures the sample stand to the sample excitation chamber.
13. Table Positioning Lever - The table position-ing lever raises and lowers the sample table.
14. Sample Table Height Adjustment - This threaded ring adjustment is positioned to contact the bottom of the sample stand block when the sample table is raised to the detent position. Its function is to prevent the table from being over-driven. The four 3 mm cap screws that secure the assembly can also be used for minor adjustments.
15. Sample Holder Receive Sensor - The presence of the sample holder is monitored at all times to be sure that an arc discharge will not be gener-ated across the analytical gap in the event that the sample holder has not been elevated into position. This monitoring system is accomplished by pass-ing a focused beam of incandescent light from the transmitter (XMIT) through the sample holder to the receiver (RECEIVE). This component is the receive (RECEIVE) sensor. This monitoring sys-tem is basically passive and does not require any alignment or adjustment, however as in all light activated systems, it should be kept clean to avoid an erroneous indication. To clean the sensors, use an ammonia-based window cleaner or an optical lens cleaning solution. Clean the sensors daily, or as required depending on sample volume.
16. Disc Electrode XMIT Sensor - The presence of the disc electrode is monitored at all times to pre-vent an analytical discharge from occurring in the event that the operator fails to install and properly position the disc electrode. This monitoring sys-tem is accomplished by passing a focused beam of
26 | Chapter 3 System Description
24 October 2007 / version 3.1
incandescent light from the transmitter (XMIT) to the receiver (RECEIVE). If the disc electrode is installed and properly positioned, it will inter-rupt this beam of light confirming its presence. This component is the transmit (XMIT) sensor. This monitoring system is basically passive and does not require any alignment or adjustment, however as in all light activated systems, it should be kept clean to avoid an erroneous indication. To clean the sensors, use an ammonia-based win-dow cleaner or an optical lens cleaning solution. Clean the sensors daily, or as required depending on sample volume.
17. Rod Electrode Receive Sensor - The presence of the rod electrode is monitored at all times to prevent an analytical discharge from occurring in the event that the operator fails to install and properly position the rod electrode. This monitor-ing system is accomplished by passing a focused beam of incandescent light from the transmitter (XMIT) to the receiver (RECEIVE). If the rod electrode is installed and properly positioned, it will interrupt this beam of light confirming its presence. This component is the receive (RE-CEIVE) sensor. This monitoring system is basi-cally passive and does not require any alignment or adjustment, however as in all light activated systems, it should be kept clean to avoid an er-roneous indication. To clean the sensors, use an ammonia-based window cleaner or an optical lens cleaning solution. Clean the sensors daily, or as required depending on sample volume.
18. Quartz Window and Lens Assembly - The quartz window is epoxied to the brass lens holder for ease of cleaning, and is installed to prevent oil and carbon from coating the lens. The lens col-lects light from the plasma and focuses it on the end of the optical fiber.
19. Analytical Gap Xmit Sensor - The analytical gap is monitored at all times to prevent an ana-lytical discharge from occurring in the event that the operator fails to set a gap distance between the disc and rod electrodes. This monitoring sys-tem is accomplished by passing a focused beam of
incandescent light from the transmitter (XMIT) through the analytical gap to the receiver (RE-CEIVE). This component is the transmit (XMIT) sensor. This monitoring system is basically passive and does not require any alignment or adjustment, however as in all light activated systems, it should be kept clean to avoid an erroneous indication. To clean the sensors, use an ammonia-based win-dow cleaner or an optical lens cleaning solution. Clean the sensors daily, or as required depending on sample volume.
20. Rod Electrode Clamp Knob - The black plas-tic knob is pressed to open the clamp to allow the rod electrode to be exchanged and provides insulation from the heat generated by the arc dis-charge.
21. Rod Electrode Clamp - The rod electrode clamp is held against the rod electrode holder and slide mechanism by a compression spring. Its function is to clamp the rod electrode in the po-sitioning channel of the rod electrode holder and slide mechanism. The spring is compressed when the rod electrode clamp knob is pushed inward to load the rod.
22. Analytical Gap Setting Lever - This lever is used to drive the rod electrode holder and slide mechanism downward in a vertical position. When the lever is raised to its maximum posi-tion, the slide mechanism is driven to its lowest vertical travel. At this position, the rod and disc electrodes are driven to contact each other. When the lever is lowered to the bottom of its travel, the slide mechanism with the rod electrode clamped in the positioning channel raises until its travel is stopped by the analytical gap adjustment screw. This sets the analytical gap to 0.090 inches.
3.4 OPTICAL SYSTEM
The Optical System is mounted in a light-sealed and environmentally protected temperature-sta-bilized compartment located in the bottom of the Spectroil M. The optic is a polychromator which is capable of simultaneous analysis of all the pro-
Spectroil M/N-W & Spectroil M/C-W, (Mod. 6 & 7) Operation & User Maintenance Manual | 27
24 October 2007 / version 3.1
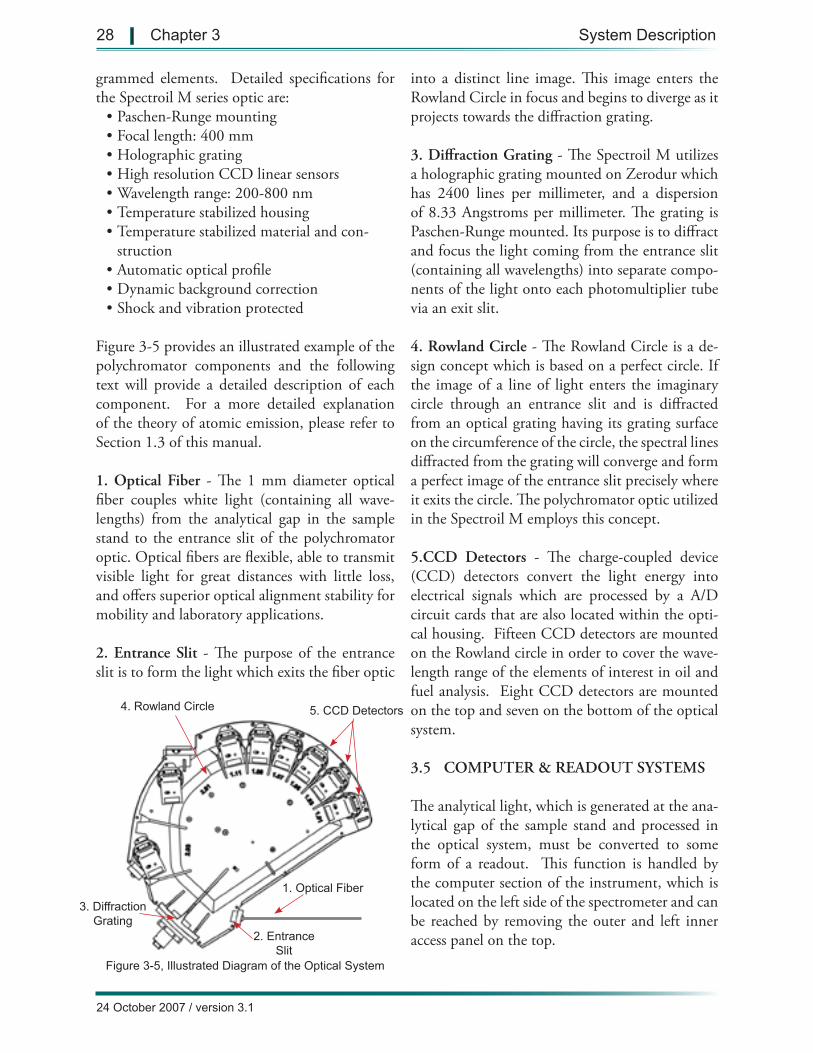
Figure 3-5, Illustrated Diagram of the Optical System
3. Diffraction Grating
4. Rowland Circle
1. Optical Fiber
2. EntranceSlit
5. CCD Detectors
grammed elements. Detailed specifications for the Spectroil M series optic are:
• Paschen-Runge mounting• Focal length: 400 mm• Holographic grating• High resolution CCD linear sensors• Wavelength range: 200-800 nm• Temperature stabilized housing• Temperature stabilized material and con-
struction• Automatic optical profile• Dynamic background correction• Shock and vibration protected
Figure 3-5 provides an illustrated example of the polychromator components and the following text will provide a detailed description of each component. For a more detailed explanation of the theory of atomic emission, please refer to Section 1.3 of this manual.
1. Optical Fiber - The 1 mm diameter optical fiber couples white light (containing all wave-lengths) from the analytical gap in the sample stand to the entrance slit of the polychromator optic. Optical fibers are flexible, able to transmit visible light for great distances with little loss, and offers superior optical alignment stability for mobility and laboratory applications.
2. Entrance Slit - The purpose of the entrance slit is to form the light which exits the fiber optic
into a distinct line image. This image enters the Rowland Circle in focus and begins to diverge as it projects towards the diffraction grating.
3. Diffraction Grating - The Spectroil M utilizes a holographic grating mounted on Zerodur which has 2400 lines per millimeter, and a dispersion of 8.33 Angstroms per millimeter. The grating is Paschen-Runge mounted. Its purpose is to diffract and focus the light coming from the entrance slit (containing all wavelengths) into separate compo-nents of the light onto each photomultiplier tube via an exit slit.
4. Rowland Circle - The Rowland Circle is a de-sign concept which is based on a perfect circle. If the image of a line of light enters the imaginary circle through an entrance slit and is diffracted from an optical grating having its grating surface on the circumference of the circle, the spectral lines diffracted from the grating will converge and form a perfect image of the entrance slit precisely where it exits the circle. The polychromator optic utilized in the Spectroil M employs this concept.
5.CCD Detectors - The charge-coupled device (CCD) detectors convert the light energy into electrical signals which are processed by a A/D circuit cards that are also located within the opti-cal housing. Fifteen CCD detectors are mounted on the Rowland circle in order to cover the wave-length range of the elements of interest in oil and fuel analysis. Eight CCD detectors are mounted on the top and seven on the bottom of the optical system.
3.5 COMPUTER & READOUT SYSTEMS
The analytical light, which is generated at the ana-lytical gap of the sample stand and processed in the optical system, must be converted to some form of a readout. This function is handled by the computer section of the instrument, which is located on the left side of the spectrometer and can be reached by removing the outer and left inner access panel on the top.
28 | Chapter 3 System Description
24 October 2007 / version 3.1
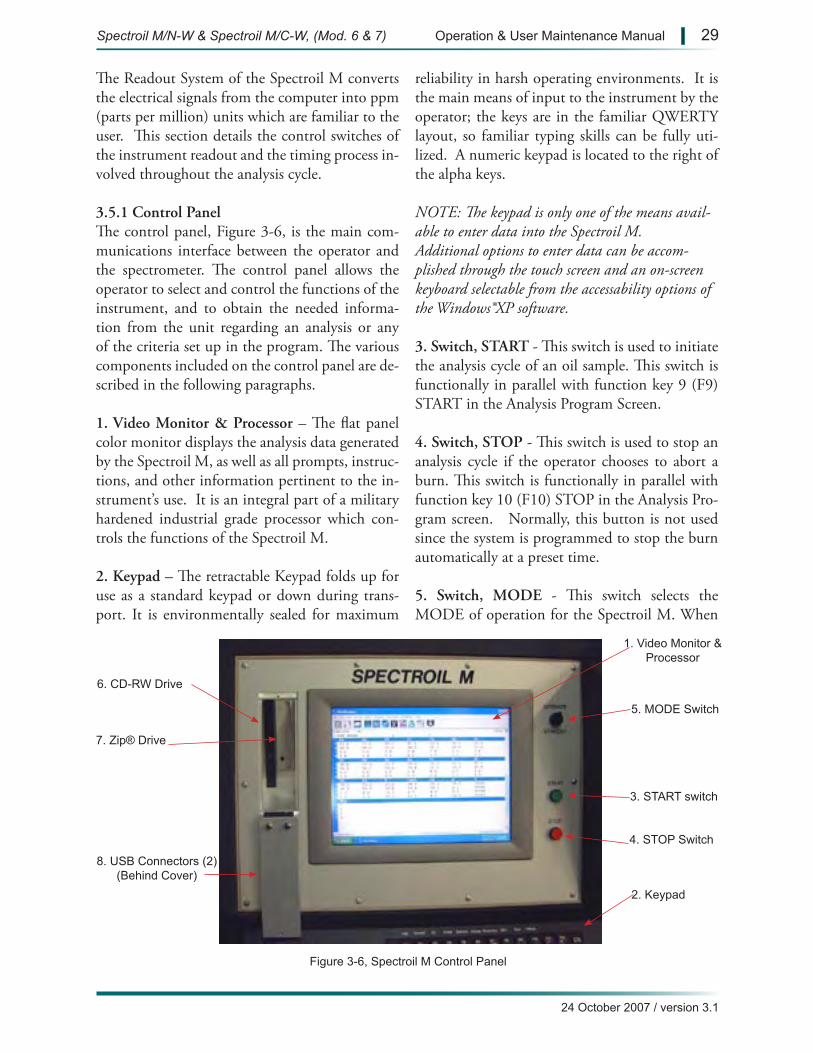
Figure 3-6, Spectroil M Control Panel
5. MODE Switch
1. Video Monitor & Processor
2. Keypad
7. Zip® Drive
6. CD-RW Drive
4. STOP Switch
3. START switch
8. USB Connectors (2)(Behind Cover)
The Readout System of the Spectroil M converts the electrical signals from the computer into ppm (parts per million) units which are familiar to the user. This section details the control switches of the instrument readout and the timing process in-volved throughout the analysis cycle.
3.5.1 Control Panel The control panel, Figure 3-6, is the main com-munications interface between the operator and the spectrometer. The control panel allows the operator to select and control the functions of the instrument, and to obtain the needed informa-tion from the unit regarding an analysis or any of the criteria set up in the program. The various components included on the control panel are de-scribed in the following paragraphs.
1. Video Monitor & Processor – The flat panel color monitor displays the analysis data generated by the Spectroil M, as well as all prompts, instruc-tions, and other information pertinent to the in-strument’s use. It is an integral part of a military hardened industrial grade processor which con-trols the functions of the Spectroil M.
2. Keypad – The retractable Keypad folds up for use as a standard keypad or down during trans-port. It is environmentally sealed for maximum
reliability in harsh operating environments. It is the main means of input to the instrument by the operator; the keys are in the familiar QWERTY layout, so familiar typing skills can be fully uti-lized. A numeric keypad is located to the right of the alpha keys. NOTE: The keypad is only one of the means avail-able to enter data into the Spectroil M. Additional options to enter data can be accom-plished through the touch screen and an on-screen keyboard selectable from the accessability options of the Windows®XP software.
3. Switch, START - This switch is used to initiate the analysis cycle of an oil sample. This switch is functionally in parallel with function key 9 (F9) START in the Analysis Program Screen.
4. Switch, STOP - This switch is used to stop an analysis cycle if the operator chooses to abort a burn. This switch is functionally in parallel with function key 10 (F10) STOP in the Analysis Pro-gram screen. Normally, this button is not used since the system is programmed to stop the burn automatically at a preset time.
5. Switch, MODE - This switch selects the MODE of operation for the Spectroil M. When
Spectroil M/N-W & Spectroil M/C-W, (Mod. 6 & 7) Operation & User Maintenance Manual | 29
24 October 2007 / version 3.1
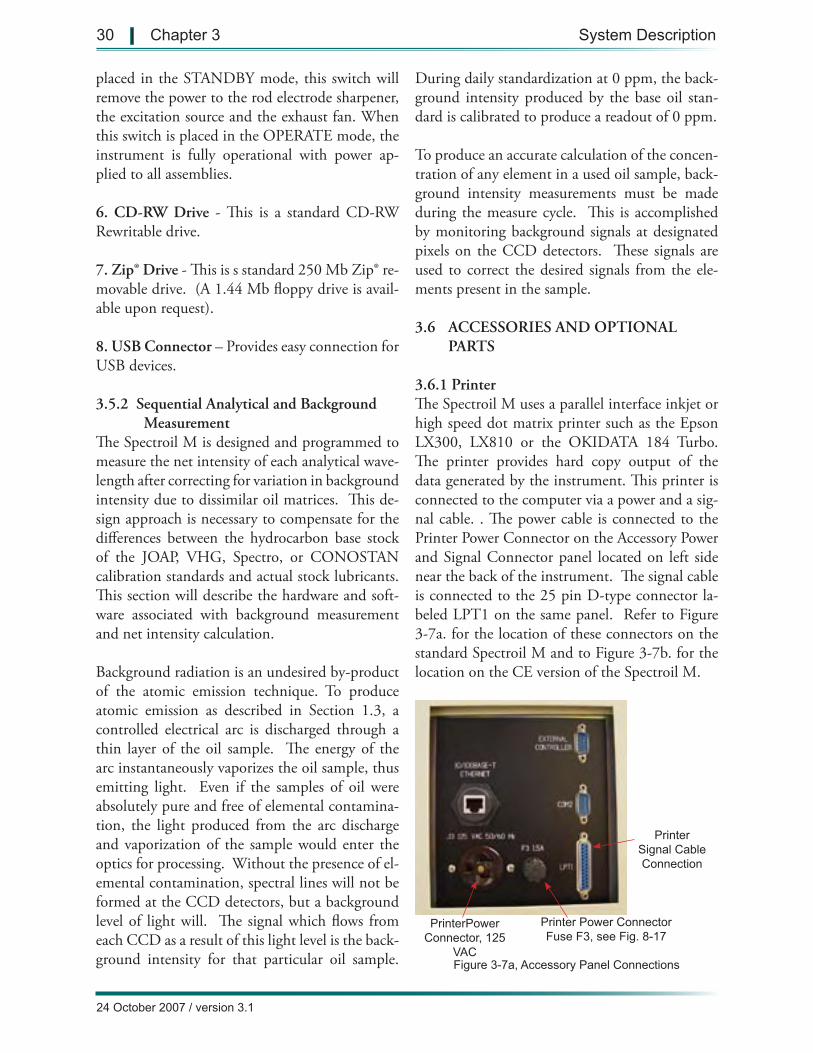
Figure 3-7a, Accessory Panel Connections
Printer Signal Cable Connection
Printer Power Connector Fuse F3, see Fig. 8-17
PrinterPower Connector, 125
VAC
placed in the STANDBY mode, this switch will remove the power to the rod electrode sharpener, the excitation source and the exhaust fan. When this switch is placed in the OPERATE mode, the instrument is fully operational with power ap-plied to all assemblies.
6. CD-RW Drive - This is a standard CD-RW Rewritable drive.
7. Zip® Drive - This is s standard 250 Mb Zip® re-movable drive. (A 1.44 Mb floppy drive is avail-able upon request).
8. USB Connector – Provides easy connection for USB devices.
3.5.2 Sequential Analytical and Background Measurement
The Spectroil M is designed and programmed to measure the net intensity of each analytical wave-length after correcting for variation in background intensity due to dissimilar oil matrices. This de-sign approach is necessary to compensate for the differences between the hydrocarbon base stock of the JOAP, VHG, Spectro, or CONOSTAN calibration standards and actual stock lubricants. This section will describe the hardware and soft-ware associated with background measurement and net intensity calculation.
Background radiation is an undesired by-product of the atomic emission technique. To produce atomic emission as described in Section 1.3, a controlled electrical arc is discharged through a thin layer of the oil sample. The energy of the arc instantaneously vaporizes the oil sample, thus emitting light. Even if the samples of oil were absolutely pure and free of elemental contamina-tion, the light produced from the arc discharge and vaporization of the sample would enter the optics for processing. Without the presence of el-emental contamination, spectral lines will not be formed at the CCD detectors, but a background level of light will. The signal which flows from each CCD as a result of this light level is the back-ground intensity for that particular oil sample.
During daily standardization at 0 ppm, the back-ground intensity produced by the base oil stan-dard is calibrated to produce a readout of 0 ppm.
To produce an accurate calculation of the concen-tration of any element in a used oil sample, back-ground intensity measurements must be made during the measure cycle. This is accomplished by monitoring background signals at designated pixels on the CCD detectors. These signals are used to correct the desired signals from the ele-ments present in the sample.
3.6 ACCESSORIES AND OPTIONAL PARTS
3.6.1 PrinterThe Spectroil M uses a parallel interface inkjet or high speed dot matrix printer such as the Epson LX300, LX810 or the OKIDATA 184 Turbo. The printer provides hard copy output of the data generated by the instrument. This printer is connected to the computer via a power and a sig-nal cable. . The power cable is connected to the Printer Power Connector on the Accessory Power and Signal Connector panel located on left side near the back of the instrument. The signal cable is connected to the 25 pin D-type connector la-beled LPT1 on the same panel. Refer to Figure 3-7a. for the location of these connectors on the standard Spectroil M and to Figure 3-7b. for the location on the CE version of the Spectroil M.
30 | Chapter 3 System Description
24 October 2007 / version 3.1
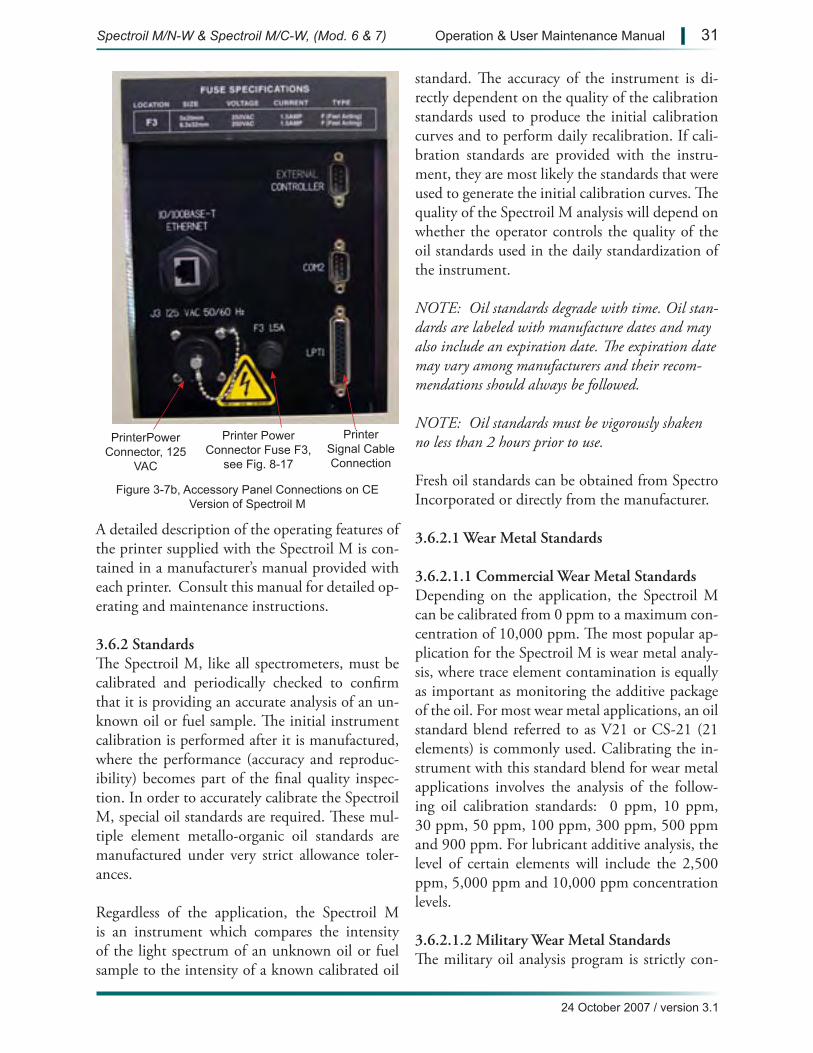
Figure 3-7b, Accessory Panel Connections on CE Version of Spectroil M
Printer Signal Cable Connection
Printer Power Connector Fuse F3,
see Fig. 8-17
PrinterPower Connector, 125
VAC
A detailed description of the operating features of the printer supplied with the Spectroil M is con-tained in a manufacturer’s manual provided with each printer. Consult this manual for detailed op-erating and maintenance instructions.
3.6.2 StandardsThe Spectroil M, like all spectrometers, must be calibrated and periodically checked to confirm that it is providing an accurate analysis of an un-known oil or fuel sample. The initial instrument calibration is performed after it is manufactured, where the performance (accuracy and reproduc-ibility) becomes part of the final quality inspec-tion. In order to accurately calibrate the Spectroil M, special oil standards are required. These mul-tiple element metallo-organic oil standards are manufactured under very strict allowance toler-ances.
Regardless of the application, the Spectroil M is an instrument which compares the intensity of the light spectrum of an unknown oil or fuel sample to the intensity of a known calibrated oil
standard. The accuracy of the instrument is di-rectly dependent on the quality of the calibration standards used to produce the initial calibration curves and to perform daily recalibration. If cali-bration standards are provided with the instru-ment, they are most likely the standards that were used to generate the initial calibration curves. The quality of the Spectroil M analysis will depend on whether the operator controls the quality of the oil standards used in the daily standardization of the instrument.
NOTE: Oil standards degrade with time. Oil stan-dards are labeled with manufacture dates and may also include an expiration date. The expiration date may vary among manufacturers and their recom-mendations should always be followed.
NOTE: Oil standards must be vigorously shaken no less than 2 hours prior to use.
Fresh oil standards can be obtained from Spectro Incorporated or directly from the manufacturer.
3.6.2.1 Wear Metal Standards
3.6.2.1.1 Commercial Wear Metal Standards Depending on the application, the Spectroil M can be calibrated from 0 ppm to a maximum con-centration of 10,000 ppm. The most popular ap-plication for the Spectroil M is wear metal analy-sis, where trace element contamination is equally as important as monitoring the additive package of the oil. For most wear metal applications, an oil standard blend referred to as V21 or CS-21 (21 elements) is commonly used. Calibrating the in-strument with this standard blend for wear metal applications involves the analysis of the follow-ing oil calibration standards: 0 ppm, 10 ppm, 30 ppm, 50 ppm, 100 ppm, 300 ppm, 500 ppm and 900 ppm. For lubricant additive analysis, the level of certain elements will include the 2,500 ppm, 5,000 ppm and 10,000 ppm concentration levels.
3.6.2.1.2 Military Wear Metal Standards The military oil analysis program is strictly con-
Spectroil M/N-W & Spectroil M/C-W, (Mod. 6 & 7) Operation & User Maintenance Manual | 31
24 October 2007 / version 3.1
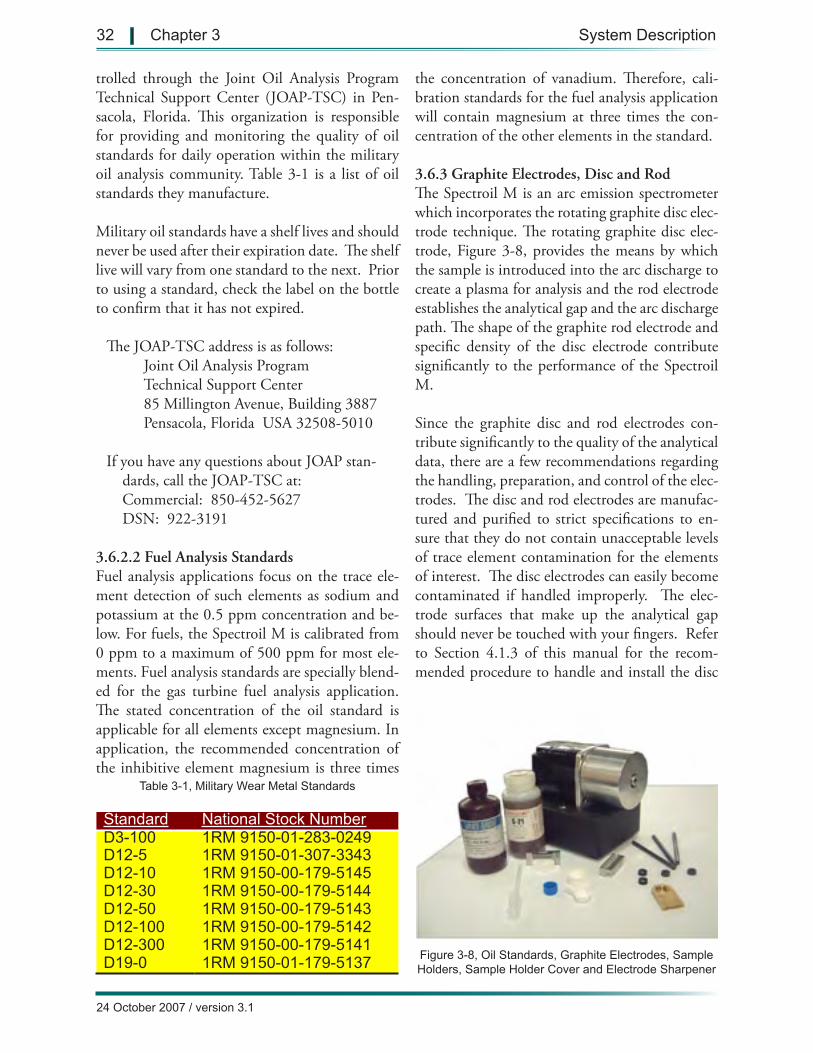
Figure 3-8, Oil Standards, Graphite Electrodes, Sample Holders, Sample Holder Cover and Electrode Sharpener
Standard National Stock Number D3-100 1RM 9150-01-283-0249D12-5 1RM 9150-01-307-3343 D12-10 1RM 9150-00-179-5145D12-30 1RM 9150-00-179-5144D12-50 1RM 9150-00-179-5143D12-100 1RM 9150-00-179-5142D12-300 1RM 9150-00-179-5141D19-0 1RM 9150-01-179-5137
Table 3-1, Military Wear Metal Standards
trolled through the Joint Oil Analysis Program Technical Support Center (JOAP-TSC) in Pen-sacola, Florida. This organization is responsible for providing and monitoring the quality of oil standards for daily operation within the military oil analysis community. Table 3-1 is a list of oil standards they manufacture.
Military oil standards have a shelf lives and should never be used after their expiration date. The shelf live will vary from one standard to the next. Prior to using a standard, check the label on the bottle to confirm that it has not expired.
The JOAP-TSC address is as follows: Joint Oil Analysis Program Technical Support Center 85 Millington Avenue, Building 3887 Pensacola, Florida USA 32508-5010
If you have any questions about JOAP stan-dards, call the JOAP-TSC at:
Commercial: 850-452-5627 DSN: 922-3191
3.6.2.2 Fuel Analysis StandardsFuel analysis applications focus on the trace ele-ment detection of such elements as sodium and potassium at the 0.5 ppm concentration and be-low. For fuels, the Spectroil M is calibrated from 0 ppm to a maximum of 500 ppm for most ele-ments. Fuel analysis standards are specially blend-ed for the gas turbine fuel analysis application. The stated concentration of the oil standard is applicable for all elements except magnesium. In application, the recommended concentration of the inhibitive element magnesium is three times
the concentration of vanadium. Therefore, cali-bration standards for the fuel analysis application will contain magnesium at three times the con-centration of the other elements in the standard.
3.6.3 Graphite Electrodes, Disc and Rod The Spectroil M is an arc emission spectrometer which incorporates the rotating graphite disc elec-trode technique. The rotating graphite disc elec-trode, Figure 3-8, provides the means by which the sample is introduced into the arc discharge to create a plasma for analysis and the rod electrode establishes the analytical gap and the arc discharge path. The shape of the graphite rod electrode and specific density of the disc electrode contribute significantly to the performance of the Spectroil M.
Since the graphite disc and rod electrodes con-tribute significantly to the quality of the analytical data, there are a few recommendations regarding the handling, preparation, and control of the elec-trodes. The disc and rod electrodes are manufac-tured and purified to strict specifications to en-sure that they do not contain unacceptable levels of trace element contamination for the elements of interest. The disc electrodes can easily become contaminated if handled improperly. The elec-trode surfaces that make up the analytical gap should never be touched with your fingers. Refer to Section 4.1.3 of this manual for the recom-mended procedure to handle and install the disc
32 | Chapter 3 System Description
24 October 2007 / version 3.1
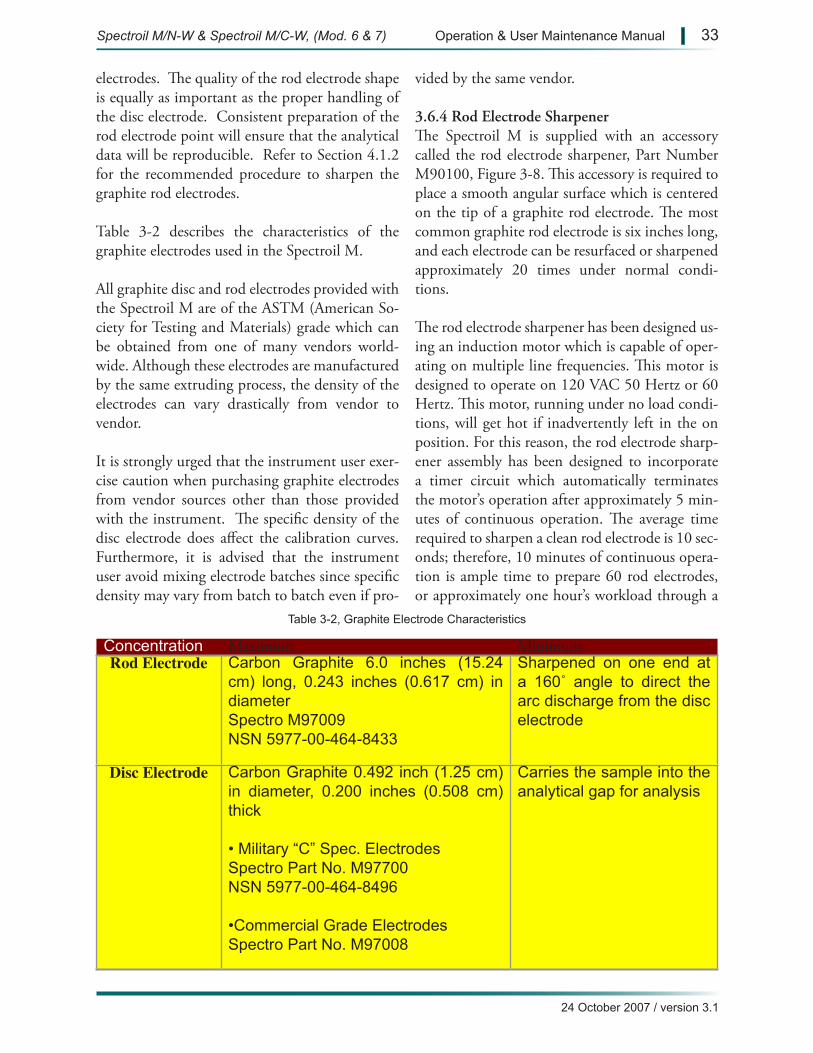
Concentration Maximum MinimumRod Electrode Carbon Graphite 6.0 inches (15.24
cm) long, 0.243 inches (0.617 cm) in diameter Spectro M97009NSN 5977-00-464-8433
Sharpened on one end at a 160˚ angle to direct the arc discharge from the disc electrode
Disc Electrode Carbon Graphite 0.492 inch (1.25 cm) in diameter, 0.200 inches (0.508 cm) thick
• Military “C” Spec. Electrodes Spectro Part No. M97700 NSN 5977-00-464-8496
•Commercial Grade ElectrodesSpectro Part No. M97008
Carries the sample into the analytical gap for analysis
Table 3-2, Graphite Electrode Characteristics
electrodes. The quality of the rod electrode shape is equally as important as the proper handling of the disc electrode. Consistent preparation of the rod electrode point will ensure that the analytical data will be reproducible. Refer to Section 4.1.2 for the recommended procedure to sharpen the graphite rod electrodes.
Table 3-2 describes the characteristics of the graphite electrodes used in the Spectroil M.
All graphite disc and rod electrodes provided with the Spectroil M are of the ASTM (American So-ciety for Testing and Materials) grade which can be obtained from one of many vendors world-wide. Although these electrodes are manufactured by the same extruding process, the density of the electrodes can vary drastically from vendor to vendor.
It is strongly urged that the instrument user exer-cise caution when purchasing graphite electrodes from vendor sources other than those provided with the instrument. The specific density of the disc electrode does affect the calibration curves. Furthermore, it is advised that the instrument user avoid mixing electrode batches since specific density may vary from batch to batch even if pro-
vided by the same vendor.
3.6.4 Rod Electrode SharpenerThe Spectroil M is supplied with an accessory called the rod electrode sharpener, Part Number M90100, Figure 3-8. This accessory is required to place a smooth angular surface which is centered on the tip of a graphite rod electrode. The most common graphite rod electrode is six inches long, and each electrode can be resurfaced or sharpened approximately 20 times under normal condi-tions.
The rod electrode sharpener has been designed us-ing an induction motor which is capable of oper-ating on multiple line frequencies. This motor is designed to operate on 120 VAC 50 Hertz or 60 Hertz. This motor, running under no load condi-tions, will get hot if inadvertently left in the on position. For this reason, the rod electrode sharp-ener assembly has been designed to incorporate a timer circuit which automatically terminates the motor’s operation after approximately 5 min-utes of continuous operation. The average time required to sharpen a clean rod electrode is 10 sec-onds; therefore, 10 minutes of continuous opera-tion is ample time to prepare 60 rod electrodes, or approximately one hour’s workload through a
Spectroil M/N-W & Spectroil M/C-W, (Mod. 6 & 7) Operation & User Maintenance Manual | 33
24 October 2007 / version 3.1

normal laboratory operation.
Operation of the rod electrode sharpener is sim-ple. Located on the side of the motor is a mo-mentary contact push-button switch. Pressing this switch one time will activate the timer circuit that in turn supplies operating voltage to the mo-tor. The motor will continue to operate for the full time period (approximately 3-5 minutes) and after this period has timed out, the supply voltage to the motor will automatically be removed. This operation can be repeated once more in succession without the motor reaching a temperature where it is uncomfortable to touch the motor. After two consecutive 3-5 minute operations, allow the mo-tor to cool down to room temperature (approxi-mately 10 minutes). The automatic timed opera-tion of electrode sharpener can be terminated by momentarily placing the standby/operate MODE switch in the standby position.
NOTE: Do not switch to Standby while a sample is burning.
The rod electrode sharpener has a graphite collec-tor barrel assembly which is secured to the motor mount and face plate by a rubber o-ring. After approximately 250 sharpenings, this graphite col-lector will need to be emptied. To remove this barrel assembly, locate the sharpener over a waste basket with the collector barrel pointing down-ward. Grasp the barrel with the opposite hand and rotate it while pulling it away from the motor mount and face plate. Once the o-ring disengages from the collector barrel, it will be easy to separate and empty.
While the collector barrel assembly is removed, check the rod electrode cutter head and blade. There should not be an accumulation of oil or car-bon in this area. If an oily residue is present, this is an indication that the rod electrodes are not being adequately cleaned before insertion into the elec-trode sharpener. To clean this assembly, remove the cutter blade and use general purpose spray and wipe detergent. Reassemble the cutter blade and the graphite collector barrel assembly.
The cutter blade, part number M90102, for the rod electrode sharpener is a three-sided tungsten cutter tool commonly used in machining opera-tions. One side is capable of approximately 1000 sharpenings. The edge of a cutter is worn when the initial cut of the electrode requires an abnor-mal amount of inward pressure, and/or a smooth reflective surface cannot be achieved on the tip of the rod electrode. Refer to Section 4.1.2 on sharp-ening the rod electrode. Refer to Section 7.6.5.1 for the procedure to replace the cutter blade.
3.6.5 Disposable Polyethylene Sample Holders All instruments used for military applications have a sample stand table that has been modified to accommodate the white plastic cap from the oil sample bottle, plus the channeled aluminum boat for special applications. For those instruments that are not part of the JOAP program, a sample stand adapter is provided. Spectro Incorporated offers disposable sample holders with each Spectroil M. These sample holders are made of polyethylene plastic and are intended to be disposed of after each use. Disposable sample holders are clean and free of contamination, provided they are kept in a sealed container and are handled properly. When removing sample containers from the sealed bag, it is recommended that the operator scoop the re-quired amount of sample holders with a box or cup to avoid contaminating the inside of the sam-ple holders with the finger tips. The part number for the sample holders is M90200 and they can be reordered directly from Spectro Incorporated.
3.6.6 Reusable Sample Holders and Covers The Spectroil M is capable of analyzing low flash point samples such as light distillates and hydraulic fluids without combustion. This is accomplished by using a special sample holder made of Teflon® which is extremely dense to prevent absorption of the sample material and provides ease of clean-ing. An aluminum cover is also available. This cover will minimize the exposure of fuel vapors to oxygen and thus prevent fuel ignition during fuel analysis. These sample holders are not routinely
34 | Chapter 3 System Description
24 October 2007 / version 3.1

Figure 3-9, Source Frequency Test Meter (SFTM)
Figure 3-10, Spectroil M Transit Case
Figure 3-11, Spectroil with Transit Case Accessories and Consumables Compartment, Ready for Operation
supplied with the instrument but can be ordered directly from Spectro Incorporated. The sample holder part number is M90202 and the sample cover part number is M90204.
3.6.7 External Keyboard, Video and MouseThe Spectroil M is a self-contained and complete spectrometer system. In some operating environ-ments, such as a central laboratory or applications with extensive data entry requirements, external data output and input devices can be connected to operate with the spectrometer’s internal com-puter. A USB connector is provided on the Spec-trpoil M control panel for this purpose. See figure 3-6 for a location of the USB connectors.
3.6.8 Source Frequency Test MeterAn optional Source Frequency Test Meter (SFTM), Figure 3-9, is available to check and/or adjust the excitation source of the Spectroil M. The part number for the SFTM is N90300, NSN 6625-01-419-5538 and the need to check and/or set the excitation source frequency is detailed in Section 7.4.
3.6.9 Transit CaseAn optional reusable transit case, Figures 3-10 and 3-11, is available to protect the Spectroil M during transport and to keep all the consumables and accessories together in one system.
The transit case is a complete oil analysis labo-
ratory in a deployable container. It has a shock mounted cradle design for the spectrometer and is mounted on four casters; two fixed and two that swivel and have locking brakes. The part number for the transit case is M94012. The national stock number is NSN 8145-01-434-5786.
The transit case is manufactured from a formula-tion of polyethylene for high impact strength and has outstanding resistance to high and low tem-peratures. The design provides protection from fungus, water, solvents and abrasion. Handles are provided for the removal of the cover, tie downs around the perimeter facilitate securing the case
Spectroil M/N-W & Spectroil M/C-W, (Mod. 6 & 7) Operation & User Maintenance Manual | 35
24 October 2007 / version 3.1
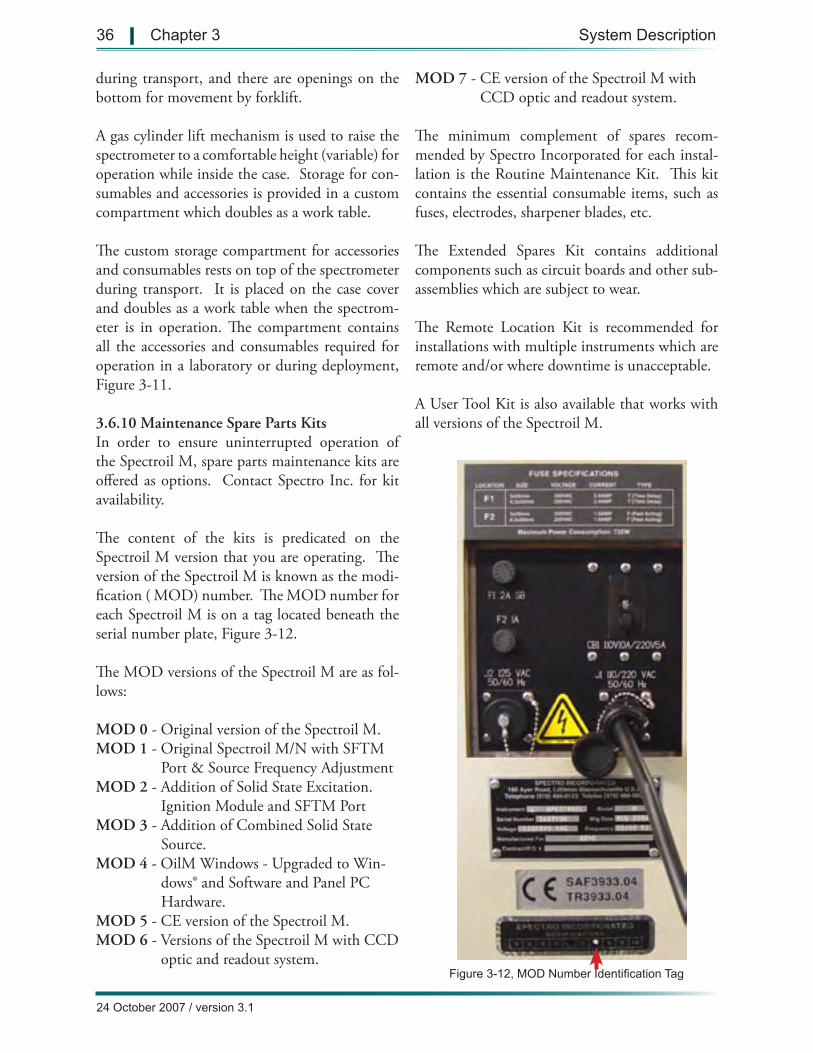
Figure 3-12, MOD Number Identification Tag
during transport, and there are openings on the bottom for movement by forklift.
A gas cylinder lift mechanism is used to raise the spectrometer to a comfortable height (variable) for operation while inside the case. Storage for con-sumables and accessories is provided in a custom compartment which doubles as a work table.
The custom storage compartment for accessories and consumables rests on top of the spectrometer during transport. It is placed on the case cover and doubles as a work table when the spectrom-eter is in operation. The compartment contains all the accessories and consumables required for operation in a laboratory or during deployment, Figure 3-11.
3.6.10 Maintenance Spare Parts Kits In order to ensure uninterrupted operation of the Spectroil M, spare parts maintenance kits are offered as options. Contact Spectro Inc. for kit availability.
The content of the kits is predicated on the Spectroil M version that you are operating. The version of the Spectroil M is known as the modi-fication ( MOD) number. The MOD number for each Spectroil M is on a tag located beneath the serial number plate, Figure 3-12.
The MOD versions of the Spectroil M are as fol-lows:
MOD 0 - Original version of the Spectroil M. MOD 1 - Original Spectroil M/N with SFTM
Port & Source Frequency Adjustment MOD 2 - Addition of Solid State Excitation.
Ignition Module and SFTM PortMOD 3 - Addition of Combined Solid State
Source. MOD 4 - OilM Windows - Upgraded to Win-
dows® and Software and Panel PC Hardware.
MOD 5 - CE version of the Spectroil M.MOD 6 - Versions of the Spectroil M with CCD
optic and readout system.
MOD 7 - CE version of the Spectroil M with CCD optic and readout system.
The minimum complement of spares recom-mended by Spectro Incorporated for each instal-lation is the Routine Maintenance Kit. This kit contains the essential consumable items, such as fuses, electrodes, sharpener blades, etc.
The Extended Spares Kit contains additional components such as circuit boards and other sub-assemblies which are subject to wear.
The Remote Location Kit is recommended for installations with multiple instruments which are remote and/or where downtime is unacceptable.
A User Tool Kit is also available that works with all versions of the Spectroil M.
36 | Chapter 3 System Description
24 October 2007 / version 3.1

Figure 4-1, Right Side View Showing Circuit Breaker CB1
Circuit Breaker, CB1
Main Input Power Connection
Electrode Sharpener Power Connection
Spectroil M/N-W & Spectroil M/C-W, (Mod. 6 & 7) Operation & User Maintenance Manual | 37
24 October 2007 / version 3.1
4.0 OPERATING INSTRUCTIONS
4.1 GENERAL OPERATING REQUIREMENTS
4.1.1 Power Application and Systematic Power RemovalThe Spectroil M consists of the subsystems de-tailed in Chapter 3 of this manual. Each subas-sembly requires specific voltages to perform as a system. These voltages are generated within each subassembly and originate from the main power distribution assembly. Main power for these subas-semblies is fused with a 10 ampere circuit breaker CB1 which is mounted on the Power Connection Plate located on the right side near the back of the instrument. Power should not be applied to the instrument unless all specifications of Section 2.1.4 Input Power Requirements have been met.
To apply power to the instrument, place circuit breaker CB1 in the upright ON position, Figure 4-1.
Chapter 4
Operating Instructions
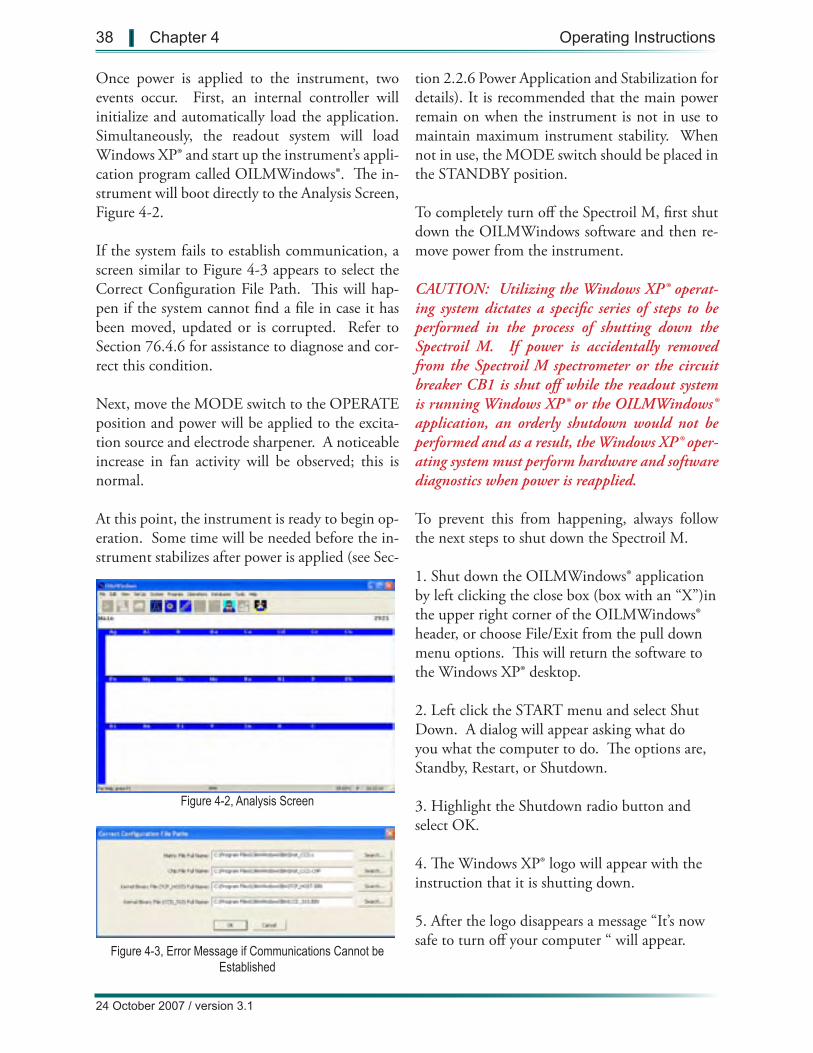
Figure 4-2, Analysis Screen
Figure 4-3, Error Message if Communications Cannot be Established
38 | Chapter 4 Operating Instructions
24 October 2007 / version 3.1
Once power is applied to the instrument, two events occur. First, an internal controller will initialize and automatically load the application. Simultaneously, the readout system will load Windows XP® and start up the instrument’s appli-cation program called OILMWindows®. The in-strument will boot directly to the Analysis Screen, Figure 4-2.
If the system fails to establish communication, a screen similar to Figure 4-3 appears to select the Correct Configuration File Path. This will hap-pen if the system cannot find a file in case it has been moved, updated or is corrupted. Refer to Section 76.4.6 for assistance to diagnose and cor-rect this condition.
Next, move the MODE switch to the OPERATE position and power will be applied to the excita-tion source and electrode sharpener. A noticeable increase in fan activity will be observed; this is normal.
At this point, the instrument is ready to begin op-eration. Some time will be needed before the in-strument stabilizes after power is applied (see Sec-
tion 2.2.6 Power Application and Stabilization for details). It is recommended that the main power remain on when the instrument is not in use to maintain maximum instrument stability. When not in use, the MODE switch should be placed in the STANDBY position.
To completely turn off the Spectroil M, first shut down the OILMWindows software and then re-move power from the instrument.
CAUTION: Utilizing the Windows XP® operat-ing system dictates a specific series of steps to be performed in the process of shutting down the Spectroil M. If power is accidentally removed from the Spectroil M spectrometer or the circuit breaker CB1 is shut off while the readout system is running Windows XP® or the OILMWindows® application, an orderly shutdown would not be performed and as a result, the Windows XP® oper-ating system must perform hardware and software diagnostics when power is reapplied.
To prevent this from happening, always follow the next steps to shut down the Spectroil M.
1. Shut down the OILMWindows® application by left clicking the close box (box with an “X”)in the upper right corner of the OILMWindows® header, or choose File/Exit from the pull down menu options. This will return the software to the Windows XP® desktop.
2. Left click the START menu and select Shut Down. A dialog will appear asking what do you what the computer to do. The options are, Standby, Restart, or Shutdown.
3. Highlight the Shutdown radio button and select OK.
4. The Windows XP® logo will appear with the instruction that it is shutting down.
5. After the logo disappears a message “It’s now safe to turn off your computer “ will appear.

Spectroil M/N-W & Spectroil M/C-W, (Mod. 6 & 7) Operation & User Maintenance Manual | 39
24 October 2007 / version 3.1
6. It is now safe to place the main circuit breaker CB1 in the down position to remove all power from the instrument.
If, by accident, power was removed from the in-strument, a series of diagnostics will automati-cally be performed when power is reapplied. It is extremely important to allow these diagnostics to complete in their entirety before loading any ap-plication software. If problems are experienced during the process of running these diagnos-tics, contact the technical service department of Spectro Incorporated for instructions on how to recover and proceed with normal operation.
To restore power to the instrument, follow the in-structions given above.
4.1.2 Rod Electrode Sharpening The rod electrode, along with the disc electrode, form the analytical gap through which the oil or fuel sample are passed for analysis. An alternat-ing current discharge will occur between the disc and rod electrode and vaporize the sample and the metallic components in it. This is the basis of the arc emission technique.
The preparation of the tip of the rod electrode plays a significant role in obtaining repeatable analytical data. The rod electrode must be cleaned prior to inserting it into the electrode sharpen-er. This is accomplished by taking a clean paper towel and removing the components of the burn residue from the previous analysis. Remove all residue from the tip and sides of the electrode by rotating the rod in the paper towel while applying pressure with the fingers of the opposite hand.
NOTE: The paper towel should be laboratory grade and free of silicon.
With the spectrometer on, turn the MODE switch to OPERATE. This applies power to J2, the elec-trode sharpener power connector. Momentarily press the power switch located on the base of the electrode sharpener. The sound of the electric mo-tor should be heard and a slight vibration should
be felt through the motor. The motor will contin-ue to run on a self-timed cycle for approximately 3 to 5 minutes. To sharpen the rod electrode, in-sert the rod into the rotating electrode guide hole until it comes in contact with the cutter blade. Apply inward pressure until approximately 1/8 to 3/16 inch (3 to 5 mm) is cut from the end of the rod. Slightly decrease the inward pressure on the rod electrode, but still maintain its contact with the cutter blade. This will polish the rod electrode tip.
Remove the rod electrode and visually inspect the tip. It should have a clean cut with no ap-parent chipping around the circumference of the rod. The surface should be very smooth and have a polished mirrored looking surface. If the qual-ity of the surface is not as described, insert the rod into the sharpener and repeat the cutting and polishing procedure. Remove the rod, inspect the surface quality and if acceptable, place the rod electrode into the original box for storage un-til ready for use. To prevent contamination of a sharpened rod electrode, do not touch the tip or edge of the tip of the sharpened electrode with the fingers or metallic surfaces or anything but a fresh, clean laboratory grade paper towel. Do not use a rod electrode for analysis if the surface appears to have been damaged. Refer to Section 7.6.5.1 for the procedure to change/rotate the cutter blade.
The electrode sharpener power is on a timing circuit and will turn off after approximately 3 to 5 minutes. The electrode sharpener can also be turned off by placing the MODE switch in the STANDBY position.
4.1.3 Installing the Disc Electrode The disc electrode is the most significant con-tributor to the accuracy and repeatability of the instrument. They are manufactured and then pu-rified to strict specifications to ensure that they do not contain unacceptable levels of trace element contamination for the elements of interest. The care taken to properly install the disc on the shaft will help to ensure that excitation parameters will be kept as constant as possible, thus resulting in
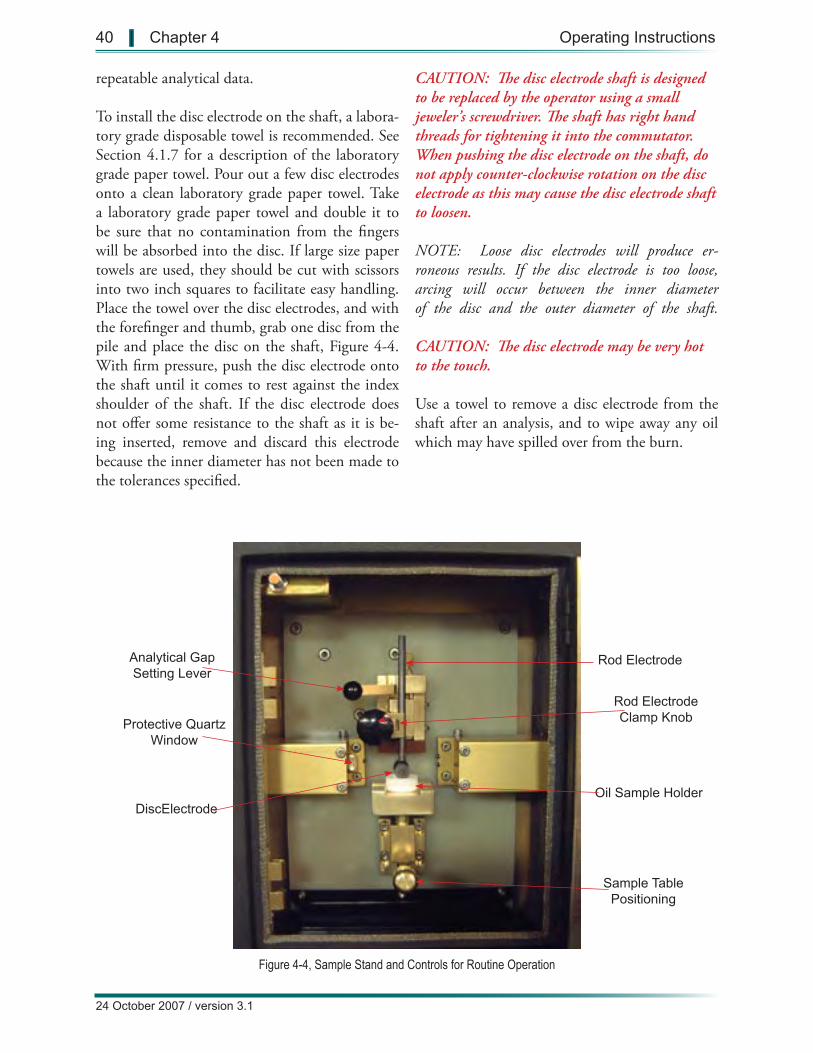
Figure 4-4, Sample Stand and Controls for Routine Operation
Rod Electrode
Rod Electrode Clamp Knob
Oil Sample Holder
Sample Table Positioning
Analytical Gap Setting Lever
Protective Quartz Window
DiscElectrode
40 | Chapter 4 Operating Instructions
24 October 2007 / version 3.1
repeatable analytical data.
To install the disc electrode on the shaft, a labora-tory grade disposable towel is recommended. See Section 4.1.7 for a description of the laboratory grade paper towel. Pour out a few disc electrodes onto a clean laboratory grade paper towel. Take a laboratory grade paper towel and double it to be sure that no contamination from the fingers will be absorbed into the disc. If large size paper towels are used, they should be cut with scissors into two inch squares to facilitate easy handling. Place the towel over the disc electrodes, and with the forefinger and thumb, grab one disc from the pile and place the disc on the shaft, Figure 4-4. With firm pressure, push the disc electrode onto the shaft until it comes to rest against the index shoulder of the shaft. If the disc electrode does not offer some resistance to the shaft as it is be-ing inserted, remove and discard this electrode because the inner diameter has not been made to the tolerances specified.
CAUTION: The disc electrode shaft is designed to be replaced by the operator using a small jeweler’s screwdriver. The shaft has right hand threads for tightening it into the commutator. When pushing the disc electrode on the shaft, do not apply counter-clockwise rotation on the disc electrode as this may cause the disc electrode shaft to loosen.
NOTE: Loose disc electrodes will produce er-roneous results. If the disc electrode is too loose, arcing will occur between the inner diameter of the disc and the outer diameter of the shaft.
CAUTION: The disc electrode may be very hot to the touch.
Use a towel to remove a disc electrode from the shaft after an analysis, and to wipe away any oil which may have spilled over from the burn.

Spectroil M/N-W & Spectroil M/C-W, (Mod. 6 & 7) Operation & User Maintenance Manual | 41
24 October 2007 / version 3.1
4.1.4 Installing the Rod Electrode and Setting the Gap The rod electrode is installed after the disc elec-trode is already in place. To install the rod elec-trode, take the rod in the fingers of the right hand and with the left hand apply inward pressure to the round black rod electrode clamp knob, Figure 4-4. This will open the clamp door approximately 3/8 inch (9.5 mm).
Insert the rod electrode into the vertical “v” shaped channel until the sharpened tip can be seen pro-truding from the bottom of the rod holder and gap setting device. Release the rod clamp knob and the rod electrode will be pinched between the back of the rod clamp knob and the centering “v” channel. Press and then release the rod clamp knob again and the rod electrode will drop by gravity and come to rest on the disc electrode.
Raise the analytical gap setting lever. This ac-tion will drive the rod electrode holder and slide mechanism downward along the vertical axis. As the slide mechanism moves downward, the rod electrode remains in the installed position, be-cause there is zero clearance between the disc and rod electrodes. The analytical gap setting lever will reach the end of its travel when it is raised to the full upward position. Return the analytical gap setting lever to the lowered position. As the lever begins to return to the lowered position, the rod electrode holder and slide mechanism begins to raise upward along the vertical axis until it is stopped by the analytical gap adjustment screw. This time the rod electrode, which is clamped in the rod electrode holder and slide mechanism, will travel upward with the slide mechanism. An analytical gap distance of 0.090 inches has now been precisely set.
NOTE: Care must be taken not to touch the brass block with the tip of the carbon rod in order to avoid false copper readings.
The analytical gap distance has been set during factory calibration and should not be readjusted during routine operation.
4.1.5 Installing and Positioning the Sample Holder The Spectroil M can accommodate several differ-ent types of sample holders and a sample holder cover. The following paragraphs describe the pro-cedure to install disposable and reusable sample holders and the sample holder cover.
4.1.5.1 Disposable Sample Holder Installing the oil or fuel sample to be analyzed should be the last step in loading the sample stand for analysis. When performing fluid analysis, an important consideration which has an effect on the reproducibility of the analysis is the quantity of the sample introduced into the analytical gap. This parameter is one for which the instrument cannot adjust. Proper level of oil in the sample holder is, therefore, part of any good operator technique. Standards and samples are analyzed either in disposable plastic sample holders or a reusable sample holder. In either case, it is recom-mended that the sample holder be filled level with the top.
NOTE: An adapter may be required with some of the commercially available disposable sample holders.
With the forefinger and thumb, pick up the sam-ple holder and place it in the slot at the top of the sample table. Push the sample holder towards the back of the sample table until the sample holder comes to a stop. It is now properly positioned in the sample table. Lift the table positioning lever, located on the bottom of the sample table, up-ward until the table reaches the end of its travel. The bottom of the disc electrode should now be immersed in the sample. The sample is now ready for analysis. Close the door of the sample stand and press the START button located on the oper-ator’s control panel or function key 9 (F9) on the keyboard, or the burn icon.
Upon completion of the analysis, open the sample stand door, lower the table and remove the sample holder. Please note that proper oil disposal proce-dures must be followed as dictated by local regula-
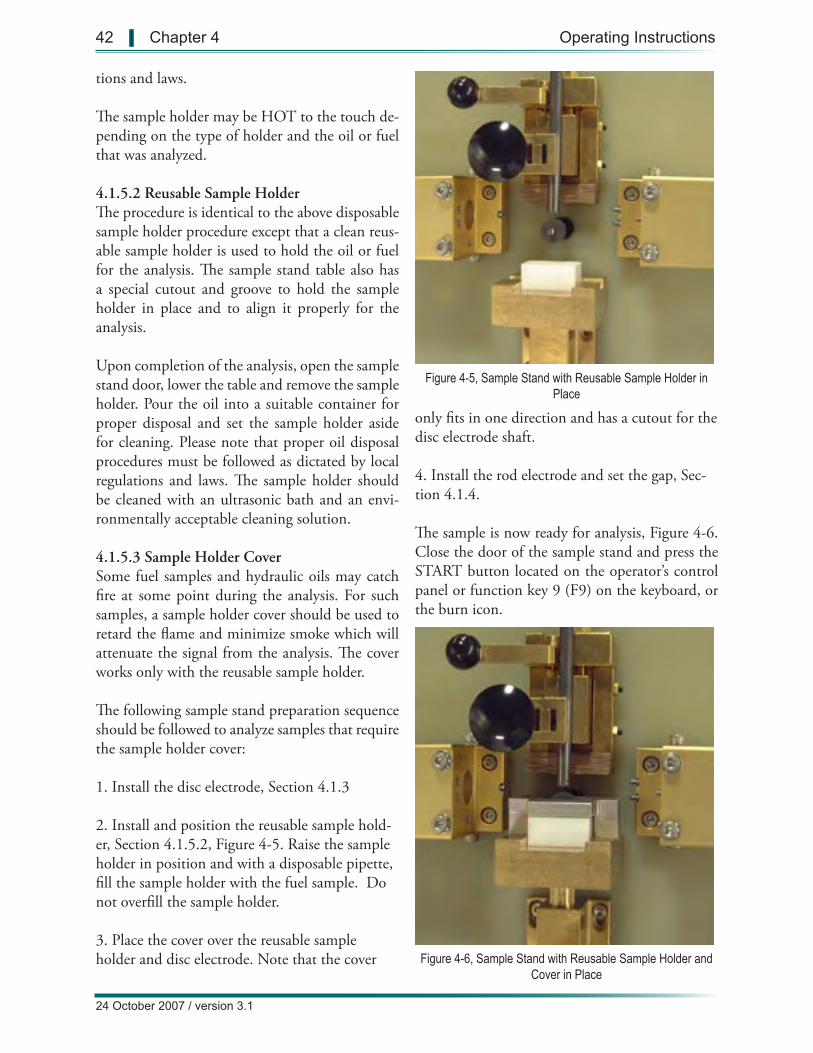
Figure 4-5, Sample Stand with Reusable Sample Holder in Place
Figure 4-6, Sample Stand with Reusable Sample Holder and Cover in Place
42 | Chapter 4 Operating Instructions
24 October 2007 / version 3.1
tions and laws.
The sample holder may be HOT to the touch de-pending on the type of holder and the oil or fuel that was analyzed.
4.1.5.2 Reusable Sample HolderThe procedure is identical to the above disposable sample holder procedure except that a clean reus-able sample holder is used to hold the oil or fuel for the analysis. The sample stand table also has a special cutout and groove to hold the sample holder in place and to align it properly for the analysis.
Upon completion of the analysis, open the sample stand door, lower the table and remove the sample holder. Pour the oil into a suitable container for proper disposal and set the sample holder aside for cleaning. Please note that proper oil disposal procedures must be followed as dictated by local regulations and laws. The sample holder should be cleaned with an ultrasonic bath and an envi-ronmentally acceptable cleaning solution.
4.1.5.3 Sample Holder Cover Some fuel samples and hydraulic oils may catch fire at some point during the analysis. For such samples, a sample holder cover should be used to retard the flame and minimize smoke which will attenuate the signal from the analysis. The cover works only with the reusable sample holder.
The following sample stand preparation sequence should be followed to analyze samples that require the sample holder cover:
1. Install the disc electrode, Section 4.1.3
2. Install and position the reusable sample hold-er, Section 4.1.5.2, Figure 4-5. Raise the sample holder in position and with a disposable pipette, fill the sample holder with the fuel sample. Do not overfill the sample holder.
3. Place the cover over the reusable sample holder and disc electrode. Note that the cover
only fits in one direction and has a cutout for the disc electrode shaft.
4. Install the rod electrode and set the gap, Sec-tion 4.1.4.
The sample is now ready for analysis, Figure 4-6. Close the door of the sample stand and press the START button located on the operator’s control panel or function key 9 (F9) on the keyboard, or the burn icon.
Spectroil M/N-W & Spectroil M/C-W, (Mod. 6 & 7) Operation & User Maintenance Manual | 43
24 October 2007 / version 3.1
When the analysis is complete, open the sample stand door, remove the rod electrode, remove the cover, lower the sample table, remove the sample, and remove the disc electrode. The sample stand is now ready for the next analysis.
4.1.6 Cleaning the Sample Stand The Spectroil M incorporates the rotating disc arc emission technique for excitation of the fluid sample. This technique produces a fine carbon residue which, when combined with oil droplets, produces an oil coating over the sample stand and door area. If allowed to accumulate, this coating will collect the carbon particles and eventually produce a lower resistance path than the analytical gap. If this occurs, the high voltage will not dis-charge across the analytical gap, but will discharge along the lower resistance path causing damage to the sample stand components.
To prevent arc-over, it is recommended that the operator perform the simple cleaning procedures outlined below.
WARNINGPROLONGED CONTACT WITH SOME SOL-VENTS AND OILS MAY CAUSE CANCER!
WARNINGDO NOT USE ANY CHLORINATED SOL-VENTS INTERNALLY OR EXTERNALLY ON THE INSTRUMENT!
CAUTION: All chemicals should be used in ac-cordance with good laboratory practice. Proper ventilation is required when using any solvent. Skin contact and prolonged exposure to fumes produced by any solvent may be hazardous.
4.1.6.1 Cleaning After Each Burn Cycle Take the paper towel used to remove the disc elec-trode from the shaft and clean the shaft, the sam-
ple table, and the sample plate area between the disc electrode shaft and the rod electrode clamp.
4.1.6.2 Cleaning After Each Operating Shift After 8 hours of operation, the complete sample stand area must be wiped clean of the oil film buildup created by the burn cycles. If performed routinely, the sample stand can be cleaned simply with paper towels and moderate rubbing. How-ever, if this procedure is performed sporadically or inadequately, an oil dispersant may be required to remove the buildup. A general purpose foam type spray detergent is recommended to dissolve the oil film buildup. A spray detergent is capable of contacting those areas which are hard to reach. Remove all detergent by wiping dry with paper towel.
4.1.6.3 Cleaning the Quartz Window The quartz window that protects the lens and fiber optic must be cleaned frequently depending upon the type of fluid being analyzed. In general, this should be done at least every 5 burn cycles. To clean the protective quartz window, take a clean, soft, disposable laboratory tissue and wet one cor-ner of the towel with isopropyl rubbing alcohol or ammonia based window cleaner. With the fore-finger, rub the wetted portion of the paper towel along the surface of the window while applying moderate clockwise pressure on the window. This will disperse the oil film. Now take the dry por-tion of the paper towel and repeat this procedure until no oil can be seen on the tissue paper. A cotton swab can also be used for this purpose. A diluted solution of ammonia and water may be used.
CAUTION: The lens protected by the window does not require cleaning and should only be disassembled by a qualified engineer.
CAUTION: Do not use solvents to clean this window as they may selectively block or attenu-ate the passage of light necessary to determine the presence and concentration of the elements in the oil samples.

44 | Chapter 4 Operating Instructions
24 October 2007 / version 3.1
4.1.6.4 Cleaning Solutions The Spectroil M is designed to analyze petro-leum and synthetic base products. In operation, the handling and actual analysis of these prod-ucts create spillage and often leave an oily film on the instrument. In general, these spills can be adequately cleaned simply by wiping the surface with paper towels. There are occasions, however, where the petroleum/synthetic product may re-quire a detergent to dissolve the petroleum base. For these occasions and for routine cleaning, a general purpose spray and wipe detergent is rec-ommended for internal and external instrument components.
4.1.7 Paper Tissue for Operating and Paper Towels for Cleaning Disposable paper tissues and towels are recom-mended for use in the daily operation of the Spectroil M. The type of paper tissue used to handle the disc electrodes is very important. Most household tissue paper is treated with certain el-ements to make it softer or more absorbent. If used to handle the disc electrodes, these elements will contaminate the electrodes and produce er-ratic results, especially for silicon. Therefore, it is recommended that a laboratory grade paper tis-sue be used for this operation.
Paper towels are useful to clean the sample stand components and wipe spills which occur during routine operation. The type of paper towel used for this function is not critical. Typical household towels or C-fold janitorial towels work best for this function because of their absorbent charac-teristics.
4.1.8 Waste Oil Disposal Container A waste oil container for oil analysis applica-tions is required to properly dispose of the re-maining oil sample after the analysis cycle. It is recommended that this waste oil container be in the form of a rectangular pan approximately 6 inches long, 4 inches wide, and 1 inch deep, with a screened cover to permit the remaining oil to drain through the screen. If a drain tube is in-stalled on the bottom of the waste oil container,
the waste oil container can continuously empty into a large capacity reservoir for proper disposal. Good laboratory procedures should be exercised in the disposition of all waste oils.
4.2 DAILY OPERATION
This section details those procedures that will be routinely used in the day-to-day operation of the Spectroil M. The operator must be familiar with the general operating requirements described in Section 4.1. A flow chart of the normal daily rou-tines is shown on the next page in Figure 4-7.
For convenience, the parentheses after each step in the chart refer to the corresponding sections in this chapter. The various procedures are explained in brief, easy to follow step-by-step instructions.
4.2.1 Daily Routine Prior to Use 1. Place the MODE switch on the operator’s con-trol panel to the OPERATE position, Figure 2-8. Power will be applied to the electrode sharpener and exhaust fans when MODE switch is in the OPERATE position.
2. Verify positive action from the sample stand exhaust system. With the sample stand door open, hold a piece of tissue paper up to the exhaust filter. It should be sucked up and held in place against the filter. Remove the tissue.
3. Turn printer ON and check to see that suffi-cient paper is available. If the printer has an ON LINE light, it should be illuminated.
4. Ensure that an ample supply of sample holders, sharpened electrodes and discs are on hand.
5. Select standards for daily use and shake vigor-ously for at least 30 seconds.
6. Have an oil waste container on hand (Section 4.1.8).
7. Have cotton swabs, contaminant free tissue paper and paper towels on hand (Section 4.1.7).
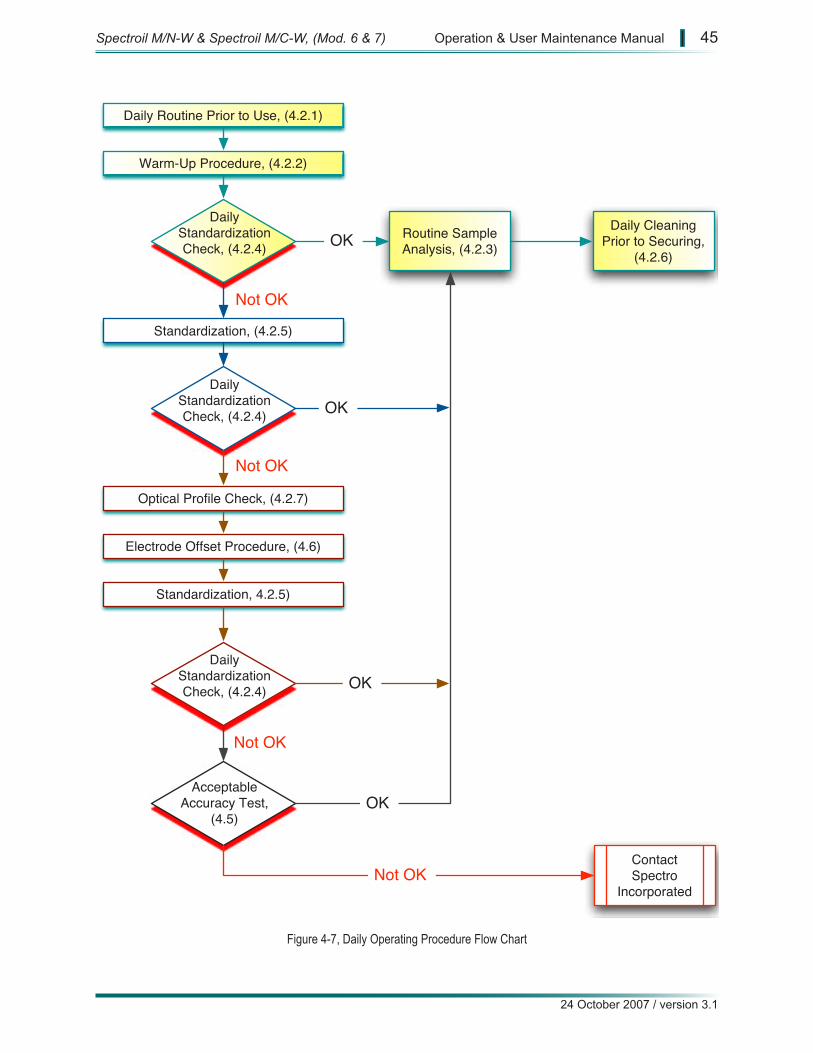
Daily Routine Prior to Use, (4.2.1)
Warm-Up Procedure, (4.2.2)
Daily Standardization Check, (4.2.4)
Standardization, (4.2.5)
Daily Standardization Check, (4.2.4)
Optical Profile Check, (4.2.7)
Electrode Offset Procedure, (4.6)
Standardization, 4.2.5)
Daily Standardization Check, (4.2.4)
Acceptable Accuracy Test,
(4.5)
Not OK
Not OK
Not OK
Routine Sample Analysis, (4.2.3)
Daily Cleaning Prior to Securing,
(4.2.6)OK
OK
OK
OK
Contact Spectro
IncorporatedNot OK
Figure 4-7, Daily Operating Procedure Flow Chart
Spectroil M/N-W & Spectroil M/C-W, (Mod. 6 & 7) Operation & User Maintenance Manual | 45
24 October 2007 / version 3.1
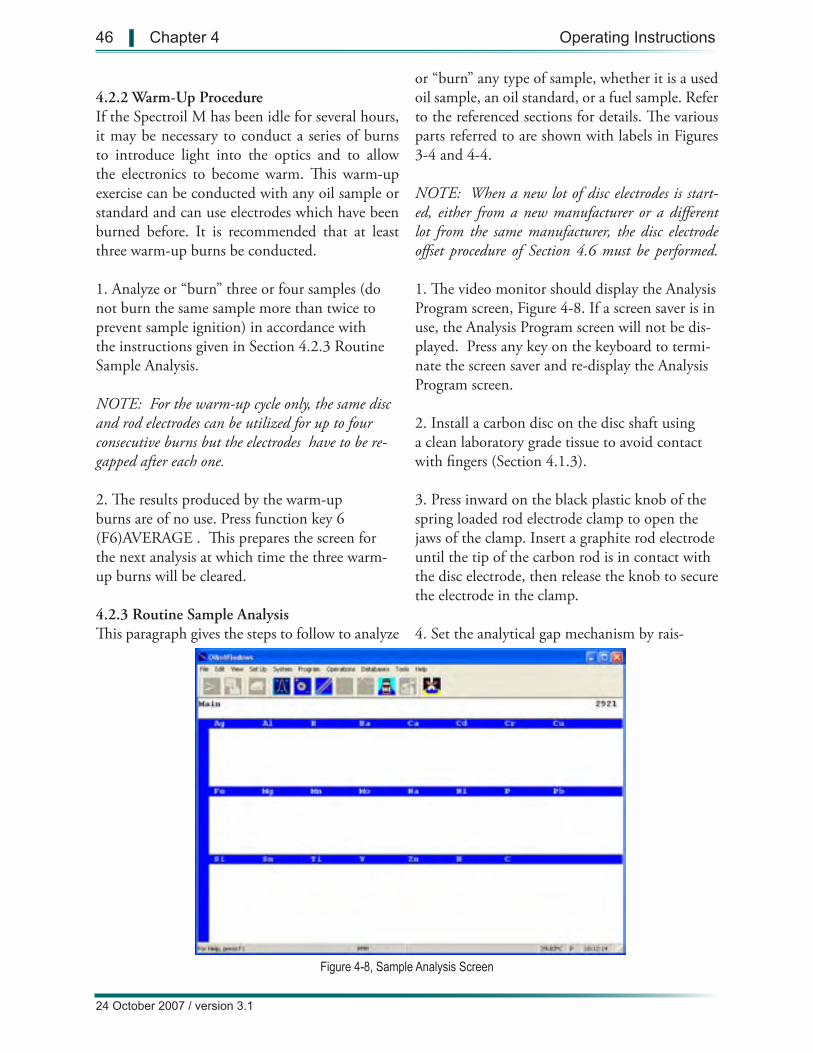
Figure 4-8, Sample Analysis Screen
46 | Chapter 4 Operating Instructions
24 October 2007 / version 3.1
4.2.2 Warm-Up Procedure If the Spectroil M has been idle for several hours, it may be necessary to conduct a series of burns to introduce light into the optics and to allow the electronics to become warm. This warm-up exercise can be conducted with any oil sample or standard and can use electrodes which have been burned before. It is recommended that at least three warm-up burns be conducted.
1. Analyze or “burn” three or four samples (do not burn the same sample more than twice to prevent sample ignition) in accordance with the instructions given in Section 4.2.3 Routine Sample Analysis.
NOTE: For the warm-up cycle only, the same disc and rod electrodes can be utilized for up to four consecutive burns but the electrodes have to be re-gapped after each one.
2. The results produced by the warm-up burns are of no use. Press function key 6 (F6)AVERAGE . This prepares the screen for the next analysis at which time the three warm-up burns will be cleared.
4.2.3 Routine Sample Analysis This paragraph gives the steps to follow to analyze
or “burn” any type of sample, whether it is a used oil sample, an oil standard, or a fuel sample. Refer to the referenced sections for details. The various parts referred to are shown with labels in Figures 3-4 and 4-4.
NOTE: When a new lot of disc electrodes is start-ed, either from a new manufacturer or a different lot from the same manufacturer, the disc electrode offset procedure of Section 4.6 must be performed.
1. The video monitor should display the Analysis Program screen, Figure 4-8. If a screen saver is in use, the Analysis Program screen will not be dis-played. Press any key on the keyboard to termi-nate the screen saver and re-display the Analysis Program screen.
2. Install a carbon disc on the disc shaft using a clean laboratory grade tissue to avoid contact with fingers (Section 4.1.3).
3. Press inward on the black plastic knob of the spring loaded rod electrode clamp to open the jaws of the clamp. Insert a graphite rod electrode until the tip of the carbon rod is in contact with the disc electrode, then release the knob to secure the electrode in the clamp.
4. Set the analytical gap mechanism by rais-

Spectroil M/N-W & Spectroil M/C-W, (Mod. 6 & 7) Operation & User Maintenance Manual | 47
24 October 2007 / version 3.1
ing and then lowering the analytical gap setting lever. This will set a gap distance of 0.090 inches between the disc and rod electrodes (Section 4.1.4).
5. Fill a sample holder with sample to be ana-lyzed. Be sure to always fill sample holders to the rim (Section 4.1.5).
NOTE: When light fuel samples are analyzed, reusable sample holders and sample holder cov-ers must be used to prevent sample ignition.
6. Place the filled sample holder on the table and slide it back to the end of the groove on the table (Section 4.1.5).
7. Raise the sample table using the sample table positioning lever (sample fluid will contact bot-tom of disc) (Section 4.1.5). See section 5.4.6.5 if Sample ID’s are to be entered.
8. Close the sample stand door and press the START button or function key 9 (F9) START.
9. After the burn is complete, results will appear on the video screen.
10. After the burn is complete, open the sample stand door and remove the rod electrode. Set it aside for subsequent re-sharpening before it is used again.
11. Lower the sample table, remove and discard the sample holder.
CAUTION: The disc electrode will be hot to the touch.
12. Using a paper towel to protect fingers from the hot disc, remove and discard disc electrode.
13. Using a tissue or paper towel, wipe excess, spilled or splattered sample fluid from sample table and disc electrode shaft.
NOTE: The quartz protective window should be
cleaned at least every 5 burns.
The Spectroil M is now ready to analyze another sample by again following the above 13 steps.
4.2.4 Daily Standardization Check The standardization check is performed to verify that the instrument has remained in calibration. It is a quick method of verifying that the instru-ment can give accurate results without conduct-ing a full standardization.
This procedure requires that the operator analyze at least three different levels of calibration stan-dard. One of the standards should be a base oil or 0 ppm standard, the next standard should be at the high end of the concentration range expected in the unknown samples, and the third standard should be some concentration between the 0 ppm and the high standard. For example, if the sam-ples to be analyzed are used oils which normally have iron concentrations as high at 100 ppm and silver concentrations as low as 1.0 ppm or less, the recommended standards for the daily standardiza-tion check should be the base oil (0 ppm) and the 100 ppm standard. These two standards will cover the complete calibrated range from 0 ppm to 100 ppm for all elements. The third standard may be 10 or 30 ppm.
For military aircraft applications, the 0, 5, 10 and 30 ppm standards generally cover the complete range of expected concentrations. If it is a fuel sample with very low contamination, the rec-ommended standards are the base oil and the 10 ppm standard oil. The following steps should be conducted only after the warm-up procedure has been completed and the window has been cleaned in accordance with Section 4.1.6.3.
1. Prepare sample stand in accordance with Daily Routine Prior to Use, Section 4.2.1.
2. Make 3-4 warmup burns of D12-100 PPM standard.
3. Choose three standards in the expected range
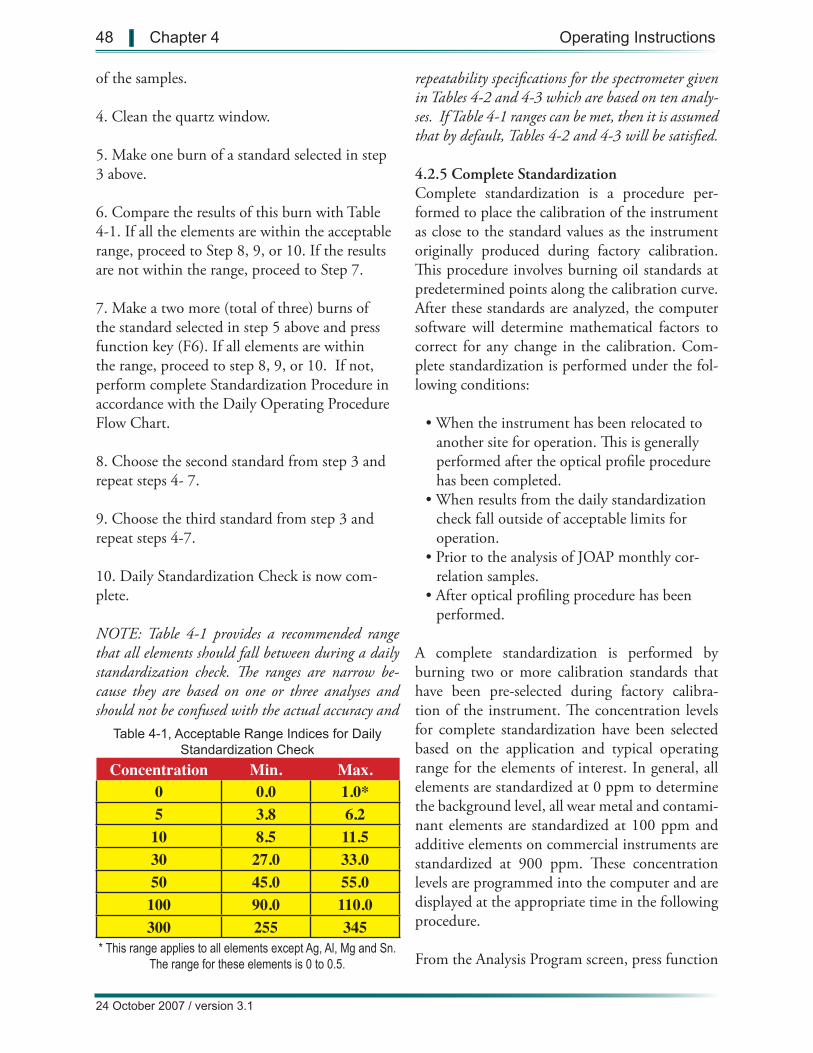
Table 4-1, Acceptable Range Indices for Daily Standardization Check
* This range applies to all elements except Ag, Al, Mg and Sn. The range for these elements is 0 to 0.5.
Concentration Min. Max.0 0.0 1.0*5 3.8 6.2
10 8.5 11.530 27.0 33.050 45.0 55.0
100 90.0 110.0300 255 345
48 | Chapter 4 Operating Instructions
24 October 2007 / version 3.1
of the samples.
4. Clean the quartz window.
5. Make one burn of a standard selected in step 3 above.
6. Compare the results of this burn with Table 4-1. If all the elements are within the acceptable range, proceed to Step 8, 9, or 10. If the results are not within the range, proceed to Step 7.
7. Make a two more (total of three) burns of the standard selected in step 5 above and press function key (F6). If all elements are within the range, proceed to step 8, 9, or 10. If not, perform complete Standardization Procedure in accordance with the Daily Operating Procedure Flow Chart.
8. Choose the second standard from step 3 and repeat steps 4- 7.
9. Choose the third standard from step 3 and repeat steps 4-7.
10. Daily Standardization Check is now com-plete.
NOTE: Table 4-1 provides a recommended range that all elements should fall between during a daily standardization check. The ranges are narrow be-cause they are based on one or three analyses and should not be confused with the actual accuracy and
repeatability specifications for the spectrometer given in Tables 4-2 and 4-3 which are based on ten analy-ses. If Table 4-1 ranges can be met, then it is assumed that by default, Tables 4-2 and 4-3 will be satisfied.
4.2.5 Complete Standardization Complete standardization is a procedure per-formed to place the calibration of the instrument as close to the standard values as the instrument originally produced during factory calibration. This procedure involves burning oil standards at predetermined points along the calibration curve. After these standards are analyzed, the computer software will determine mathematical factors to correct for any change in the calibration. Com-plete standardization is performed under the fol-lowing conditions:
• When the instrument has been relocated to another site for operation. This is generally performed after the optical profile procedure has been completed.
• When results from the daily standardization check fall outside of acceptable limits for operation.
• Prior to the analysis of JOAP monthly cor-relation samples.
• After optical profiling procedure has been performed.
A complete standardization is performed by burning two or more calibration standards that have been pre-selected during factory calibra-tion of the instrument. The concentration levels for complete standardization have been selected based on the application and typical operating range for the elements of interest. In general, all elements are standardized at 0 ppm to determine the background level, all wear metal and contami-nant elements are standardized at 100 ppm and additive elements on commercial instruments are standardized at 900 ppm. These concentration levels are programmed into the computer and are displayed at the appropriate time in the following procedure.
From the Analysis Program screen, press function
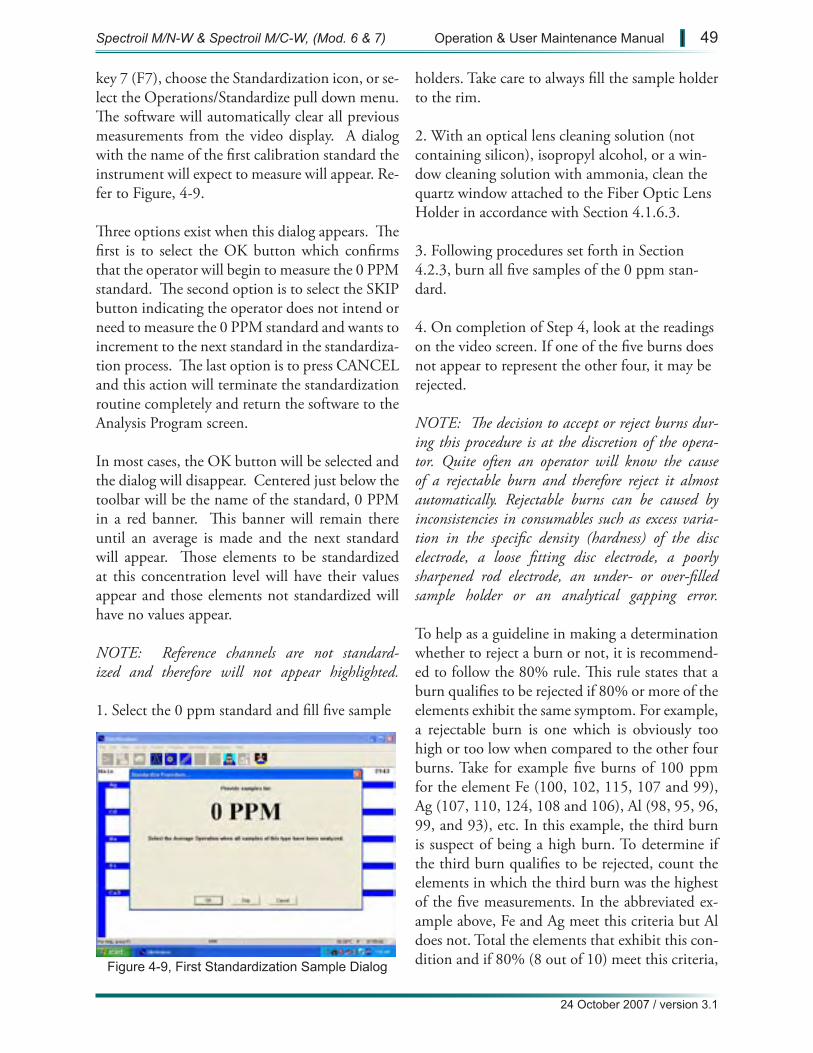
Figure 4-9, First Standardization Sample Dialog
Spectroil M/N-W & Spectroil M/C-W, (Mod. 6 & 7) Operation & User Maintenance Manual | 49
24 October 2007 / version 3.1
key 7 (F7), choose the Standardization icon, or se-lect the Operations/Standardize pull down menu. The software will automatically clear all previous measurements from the video display. A dialog with the name of the first calibration standard the instrument will expect to measure will appear. Re-fer to Figure, 4-9. Three options exist when this dialog appears. The first is to select the OK button which confirms that the operator will begin to measure the 0 PPM standard. The second option is to select the SKIP button indicating the operator does not intend or need to measure the 0 PPM standard and wants to increment to the next standard in the standardiza-tion process. The last option is to press CANCEL and this action will terminate the standardization routine completely and return the software to the Analysis Program screen.
In most cases, the OK button will be selected and the dialog will disappear. Centered just below the toolbar will be the name of the standard, 0 PPM in a red banner. This banner will remain there until an average is made and the next standard will appear. Those elements to be standardized at this concentration level will have their values appear and those elements not standardized will have no values appear.
NOTE: Reference channels are not standard-ized and therefore will not appear highlighted.
1. Select the 0 ppm standard and fill five sample
holders. Take care to always fill the sample holder to the rim.
2. With an optical lens cleaning solution (not containing silicon), isopropyl alcohol, or a win-dow cleaning solution with ammonia, clean the quartz window attached to the Fiber Optic Lens Holder in accordance with Section 4.1.6.3.
3. Following procedures set forth in Section 4.2.3, burn all five samples of the 0 ppm stan-dard.
4. On completion of Step 4, look at the readings on the video screen. If one of the five burns does not appear to represent the other four, it may be rejected.
NOTE: The decision to accept or reject burns dur-ing this procedure is at the discretion of the opera-tor. Quite often an operator will know the cause of a rejectable burn and therefore reject it almost automatically. Rejectable burns can be caused by inconsistencies in consumables such as excess varia-tion in the specific density (hardness) of the disc electrode, a loose fitting disc electrode, a poorly sharpened rod electrode, an under- or over-filled sample holder or an analytical gapping error.
To help as a guideline in making a determination whether to reject a burn or not, it is recommend-ed to follow the 80% rule. This rule states that a burn qualifies to be rejected if 80% or more of the elements exhibit the same symptom. For example, a rejectable burn is one which is obviously too high or too low when compared to the other four burns. Take for example five burns of 100 ppm for the element Fe (100, 102, 115, 107 and 99), Ag (107, 110, 124, 108 and 106), Al (98, 95, 96, 99, and 93), etc. In this example, the third burn is suspect of being a high burn. To determine if the third burn qualifies to be rejected, count the elements in which the third burn was the highest of the five measurements. In the abbreviated ex-ample above, Fe and Ag meet this criteria but Al does not. Total the elements that exhibit this con-dition and if 80% (8 out of 10) meet this criteria,
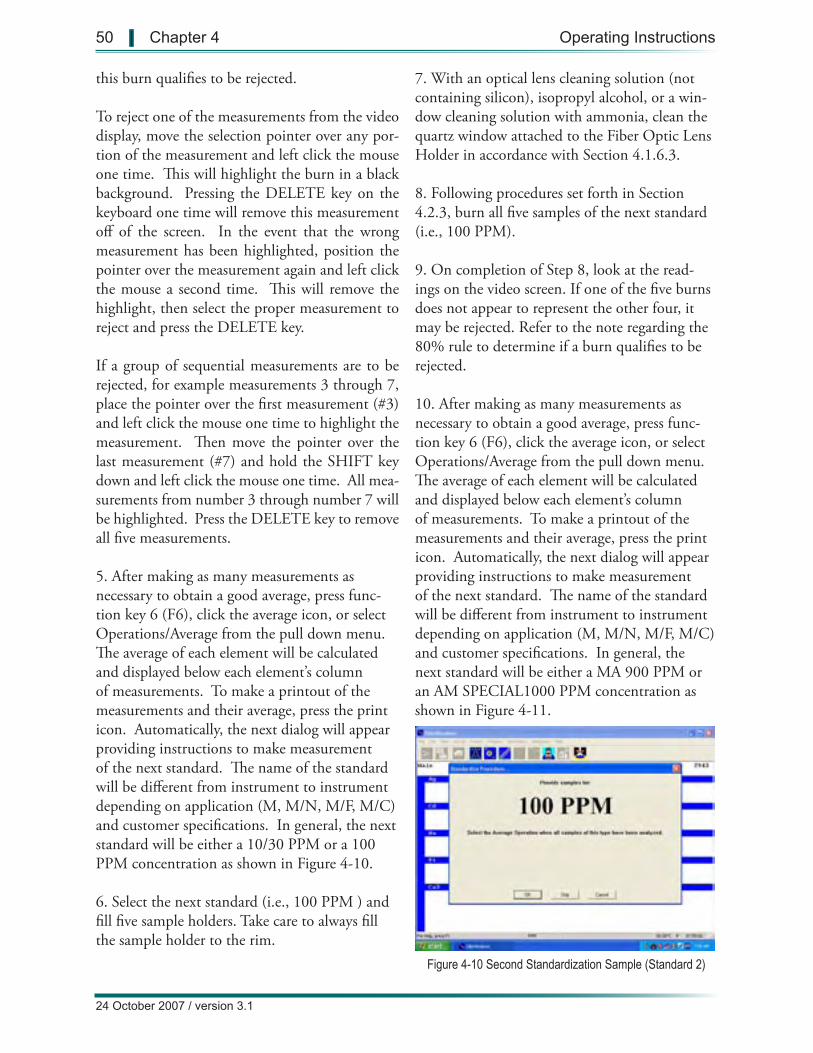
Figure 4-10 Second Standardization Sample (Standard 2)
50 | Chapter 4 Operating Instructions
24 October 2007 / version 3.1
this burn qualifies to be rejected.
To reject one of the measurements from the video display, move the selection pointer over any por-tion of the measurement and left click the mouse one time. This will highlight the burn in a black background. Pressing the DELETE key on the keyboard one time will remove this measurement off of the screen. In the event that the wrong measurement has been highlighted, position the pointer over the measurement again and left click the mouse a second time. This will remove the highlight, then select the proper measurement to reject and press the DELETE key.
If a group of sequential measurements are to be rejected, for example measurements 3 through 7, place the pointer over the first measurement (#3) and left click the mouse one time to highlight the measurement. Then move the pointer over the last measurement (#7) and hold the SHIFT key down and left click the mouse one time. All mea-surements from number 3 through number 7 will be highlighted. Press the DELETE key to remove all five measurements.
5. After making as many measurements as necessary to obtain a good average, press func-tion key 6 (F6), click the average icon, or select Operations/Average from the pull down menu. The average of each element will be calculated and displayed below each element’s column of measurements. To make a printout of the measurements and their average, press the print icon. Automatically, the next dialog will appear providing instructions to make measurement of the next standard. The name of the standard will be different from instrument to instrument depending on application (M, M/N, M/F, M/C) and customer specifications. In general, the next standard will be either a 10/30 PPM or a 100 PPM concentration as shown in Figure 4-10.
6. Select the next standard (i.e., 100 PPM ) and fill five sample holders. Take care to always fill the sample holder to the rim.
7. With an optical lens cleaning solution (not containing silicon), isopropyl alcohol, or a win-dow cleaning solution with ammonia, clean the quartz window attached to the Fiber Optic Lens Holder in accordance with Section 4.1.6.3.
8. Following procedures set forth in Section 4.2.3, burn all five samples of the next standard (i.e., 100 PPM).
9. On completion of Step 8, look at the read-ings on the video screen. If one of the five burns does not appear to represent the other four, it may be rejected. Refer to the note regarding the 80% rule to determine if a burn qualifies to be rejected.
10. After making as many measurements as necessary to obtain a good average, press func-tion key 6 (F6), click the average icon, or select Operations/Average from the pull down menu. The average of each element will be calculated and displayed below each element’s column of measurements. To make a printout of the measurements and their average, press the print icon. Automatically, the next dialog will appear providing instructions to make measurement of the next standard. The name of the standard will be different from instrument to instrument depending on application (M, M/N, M/F, M/C) and customer specifications. In general, the next standard will be either a MA 900 PPM or an AM SPECIAL1000 PPM concentration as shown in Figure 4-11.
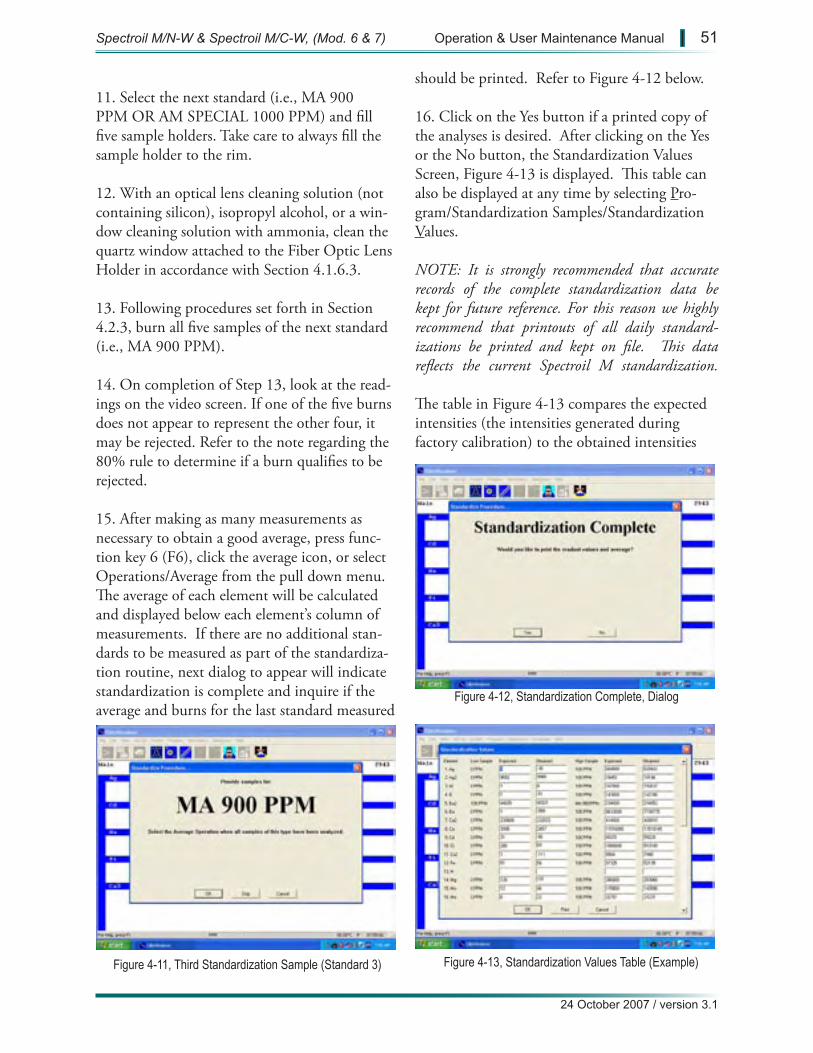
Figure 4-11, Third Standardization Sample (Standard 3)
Figure 4-12, Standardization Complete, Dialog
Figure 4-13, Standardization Values Table (Example)
Spectroil M/N-W & Spectroil M/C-W, (Mod. 6 & 7) Operation & User Maintenance Manual | 51
24 October 2007 / version 3.1
11. Select the next standard (i.e., MA 900 PPM OR AM SPECIAL 1000 PPM) and fill five sample holders. Take care to always fill the sample holder to the rim.
12. With an optical lens cleaning solution (not containing silicon), isopropyl alcohol, or a win-dow cleaning solution with ammonia, clean the quartz window attached to the Fiber Optic Lens Holder in accordance with Section 4.1.6.3.
13. Following procedures set forth in Section 4.2.3, burn all five samples of the next standard (i.e., MA 900 PPM).
14. On completion of Step 13, look at the read-ings on the video screen. If one of the five burns does not appear to represent the other four, it may be rejected. Refer to the note regarding the 80% rule to determine if a burn qualifies to be rejected.
15. After making as many measurements as necessary to obtain a good average, press func-tion key 6 (F6), click the average icon, or select Operations/Average from the pull down menu. The average of each element will be calculated and displayed below each element’s column of measurements. If there are no additional stan-dards to be measured as part of the standardiza-tion routine, next dialog to appear will indicate standardization is complete and inquire if the average and burns for the last standard measured
should be printed. Refer to Figure 4-12 below.
16. Click on the Yes button if a printed copy of the analyses is desired. After clicking on the Yes or the No button, the Standardization Values Screen, Figure 4-13 is displayed. This table can also be displayed at any time by selecting Pro-gram/Standardization Samples/Standardization Values.
NOTE: It is strongly recommended that accurate records of the complete standardization data be kept for future reference. For this reason we highly recommend that printouts of all daily standard-izations be printed and kept on file. This data reflects the current Spectroil M standardization.
The table in Figure 4-13 compares the expected intensities (the intensities generated during factory calibration) to the obtained intensities
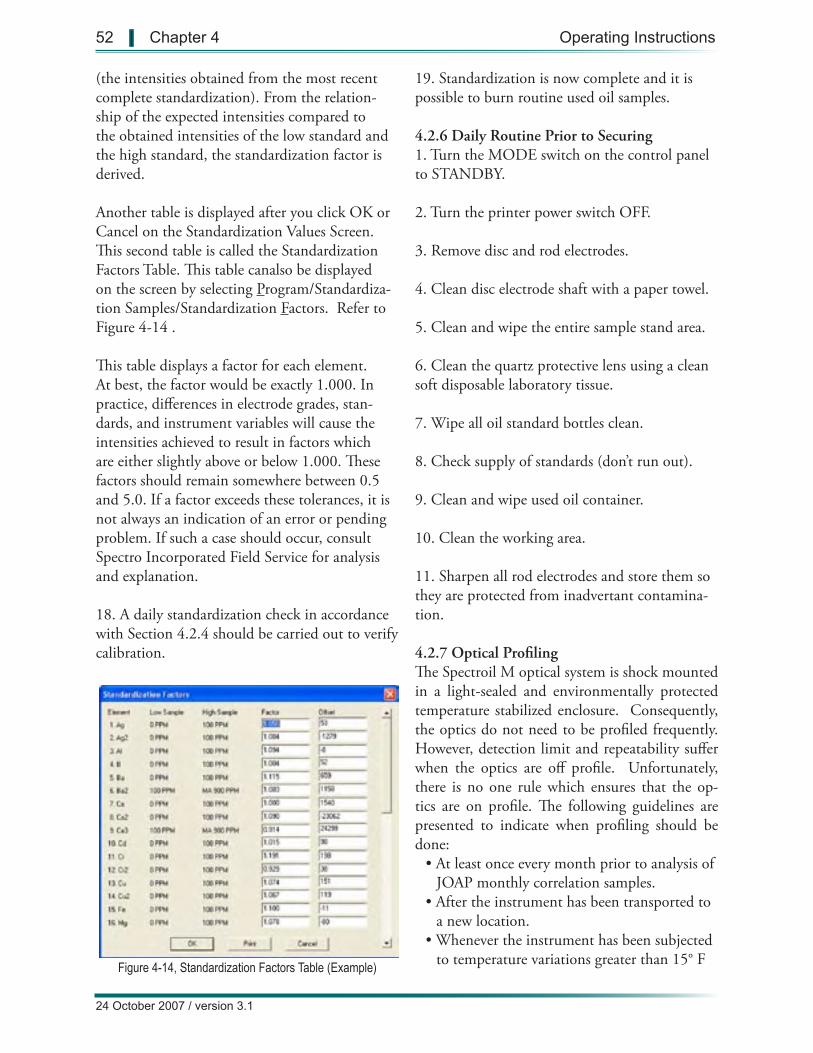
Figure 4-14, Standardization Factors Table (Example)
52 | Chapter 4 Operating Instructions
24 October 2007 / version 3.1
(the intensities obtained from the most recent complete standardization). From the relation-ship of the expected intensities compared to the obtained intensities of the low standard and the high standard, the standardization factor is derived.
Another table is displayed after you click OK or Cancel on the Standardization Values Screen. This second table is called the Standardization Factors Table. This table canalso be displayed on the screen by selecting Program/Standardiza-tion Samples/Standardization Factors. Refer to Figure 4-14 .
This table displays a factor for each element. At best, the factor would be exactly 1.000. In practice, differences in electrode grades, stan-dards, and instrument variables will cause the intensities achieved to result in factors which are either slightly above or below 1.000. These factors should remain somewhere between 0.5 and 5.0. If a factor exceeds these tolerances, it is not always an indication of an error or pending problem. If such a case should occur, consult Spectro Incorporated Field Service for analysis and explanation.
18. A daily standardization check in accordance with Section 4.2.4 should be carried out to verify calibration.
19. Standardization is now complete and it is possible to burn routine used oil samples.
4.2.6 Daily Routine Prior to Securing 1. Turn the MODE switch on the control panel to STANDBY.
2. Turn the printer power switch OFF.
3. Remove disc and rod electrodes.
4. Clean disc electrode shaft with a paper towel.
5. Clean and wipe the entire sample stand area.
6. Clean the quartz protective lens using a clean soft disposable laboratory tissue.
7. Wipe all oil standard bottles clean.
8. Check supply of standards (don’t run out).
9. Clean and wipe used oil container.
10. Clean the working area.
11. Sharpen all rod electrodes and store them so they are protected from inadvertant contamina-tion.
4.2.7 Optical Profiling The Spectroil M optical system is shock mounted in a light-sealed and environmentally protected temperature stabilized enclosure. Consequently, the optics do not need to be profiled frequently. However, detection limit and repeatability suffer when the optics are off profile. Unfortunately, there is no one rule which ensures that the op-tics are on profile. The following guidelines are presented to indicate when profiling should be done:
• At least once every month prior to analysis of JOAP monthly correlation samples.
• After the instrument has been transported to a new location.
• Whenever the instrument has been subjected to temperature variations greater than 15° F
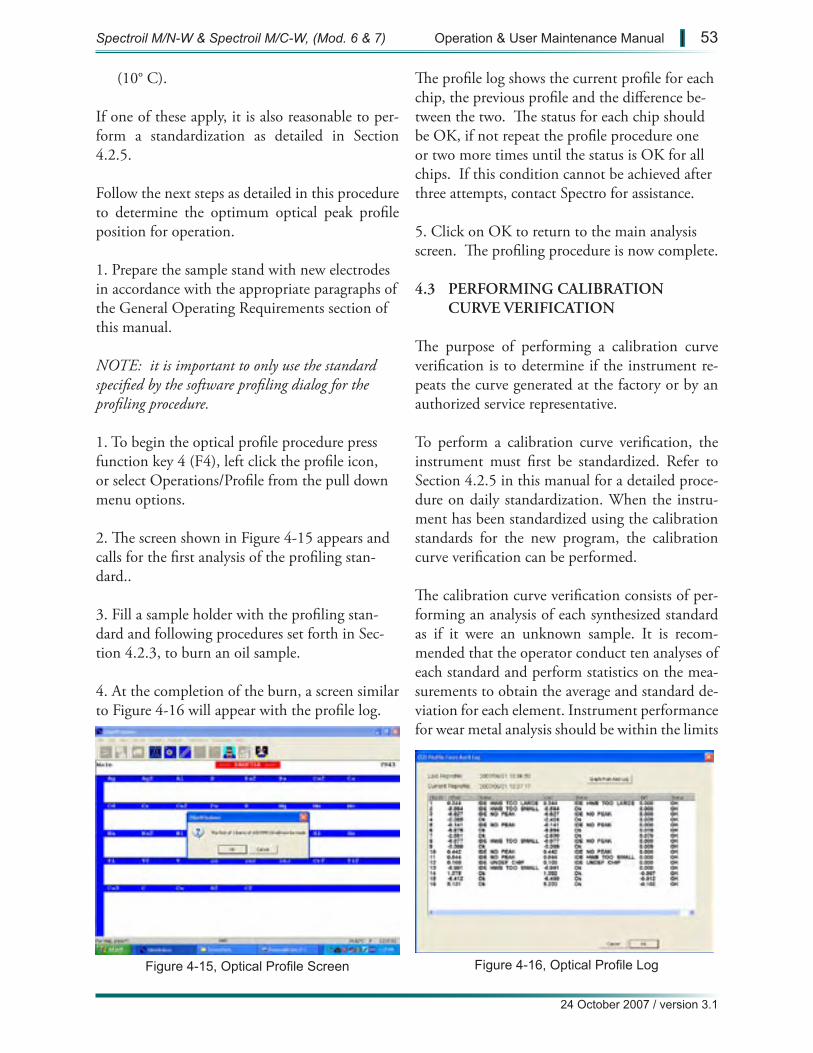
Figure 4-15, Optical Profile Screen Figure 4-16, Optical Profile Log
Spectroil M/N-W & Spectroil M/C-W, (Mod. 6 & 7) Operation & User Maintenance Manual | 53
24 October 2007 / version 3.1
(10° C).
If one of these apply, it is also reasonable to per-form a standardization as detailed in Section 4.2.5.
Follow the next steps as detailed in this procedure to determine the optimum optical peak profile position for operation.
1. Prepare the sample stand with new electrodes in accordance with the appropriate paragraphs of the General Operating Requirements section of this manual.
NOTE: it is important to only use the standard specified by the software profiling dialog for the profiling procedure.
1. To begin the optical profile procedure press function key 4 (F4), left click the profile icon, or select Operations/Profile from the pull down menu options.
2. The screen shown in Figure 4-15 appears and calls for the first analysis of the profiling stan-dard..
3. Fill a sample holder with the profiling stan-dard and following procedures set forth in Sec-tion 4.2.3, to burn an oil sample.
4. At the completion of the burn, a screen similar to Figure 4-16 will appear with the profile log.
The profile log shows the current profile for each chip, the previous profile and the difference be-tween the two. The status for each chip should be OK, if not repeat the profile procedure one or two more times until the status is OK for all chips. If this condition cannot be achieved after three attempts, contact Spectro for assistance.
5. Click on OK to return to the main analysis screen. The profiling procedure is now complete.
4.3 PERFORMING CALIBRATION CURVE VERIFICATION
The purpose of performing a calibration curve verification is to determine if the instrument re-peats the curve generated at the factory or by an authorized service representative.
To perform a calibration curve verification, the instrument must first be standardized. Refer to Section 4.2.5 in this manual for a detailed proce-dure on daily standardization. When the instru-ment has been standardized using the calibration standards for the new program, the calibration curve verification can be performed.
The calibration curve verification consists of per-forming an analysis of each synthesized standard as if it were an unknown sample. It is recom-mended that the operator conduct ten analyses of each standard and perform statistics on the mea-surements to obtain the average and standard de-viation for each element. Instrument performance for wear metal analysis should be within the limits
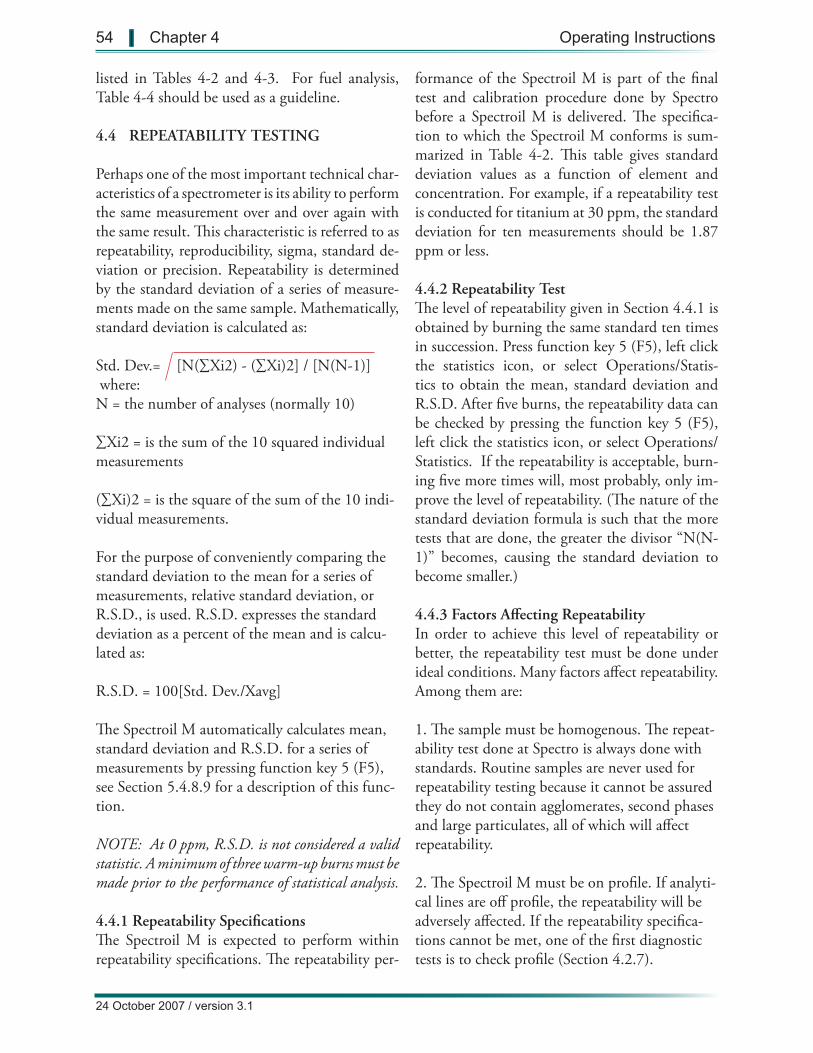
54 | Chapter 4 Operating Instructions
24 October 2007 / version 3.1
listed in Tables 4-2 and 4-3. For fuel analysis, Table 4-4 should be used as a guideline.
4.4 REPEATABILITY TESTING
Perhaps one of the most important technical char-acteristics of a spectrometer is its ability to perform the same measurement over and over again with the same result. This characteristic is referred to as repeatability, reproducibility, sigma, standard de-viation or precision. Repeatability is determined by the standard deviation of a series of measure-ments made on the same sample. Mathematically, standard deviation is calculated as:
Std. Dev.= [N(∑Xi2) - (∑Xi)2] / [N(N-1)] where: N = the number of analyses (normally 10)
∑Xi2 = is the sum of the 10 squared individual measurements
(∑Xi)2 = is the square of the sum of the 10 indi-vidual measurements.
For the purpose of conveniently comparing the standard deviation to the mean for a series of measurements, relative standard deviation, or R.S.D., is used. R.S.D. expresses the standard deviation as a percent of the mean and is calcu-lated as:
R.S.D. = 100[Std. Dev./Xavg]
The Spectroil M automatically calculates mean, standard deviation and R.S.D. for a series of measurements by pressing function key 5 (F5), see Section 5.4.8.9 for a description of this func-tion.
NOTE: At 0 ppm, R.S.D. is not considered a valid statistic. A minimum of three warm-up burns must be made prior to the performance of statistical analysis.
4.4.1 Repeatability Specifications The Spectroil M is expected to perform within repeatability specifications. The repeatability per-
formance of the Spectroil M is part of the final test and calibration procedure done by Spectro before a Spectroil M is delivered. The specifica-tion to which the Spectroil M conforms is sum-marized in Table 4-2. This table gives standard deviation values as a function of element and concentration. For example, if a repeatability test is conducted for titanium at 30 ppm, the standard deviation for ten measurements should be 1.87 ppm or less.
4.4.2 Repeatability Test The level of repeatability given in Section 4.4.1 is obtained by burning the same standard ten times in succession. Press function key 5 (F5), left click the statistics icon, or select Operations/Statis-tics to obtain the mean, standard deviation and R.S.D. After five burns, the repeatability data can be checked by pressing the function key 5 (F5), left click the statistics icon, or select Operations/Statistics. If the repeatability is acceptable, burn-ing five more times will, most probably, only im-prove the level of repeatability. (The nature of the standard deviation formula is such that the more tests that are done, the greater the divisor “N(N-1)” becomes, causing the standard deviation to become smaller.)
4.4.3 Factors Affecting Repeatability In order to achieve this level of repeatability or better, the repeatability test must be done under ideal conditions. Many factors affect repeatability. Among them are:
1. The sample must be homogenous. The repeat-ability test done at Spectro is always done with standards. Routine samples are never used for repeatability testing because it cannot be assured they do not contain agglomerates, second phases and large particulates, all of which will affect repeatability.
2. The Spectroil M must be on profile. If analyti-cal lines are off profile, the repeatability will be adversely affected. If the repeatability specifica-tions cannot be met, one of the first diagnostic tests is to check profile (Section 4.2.7).
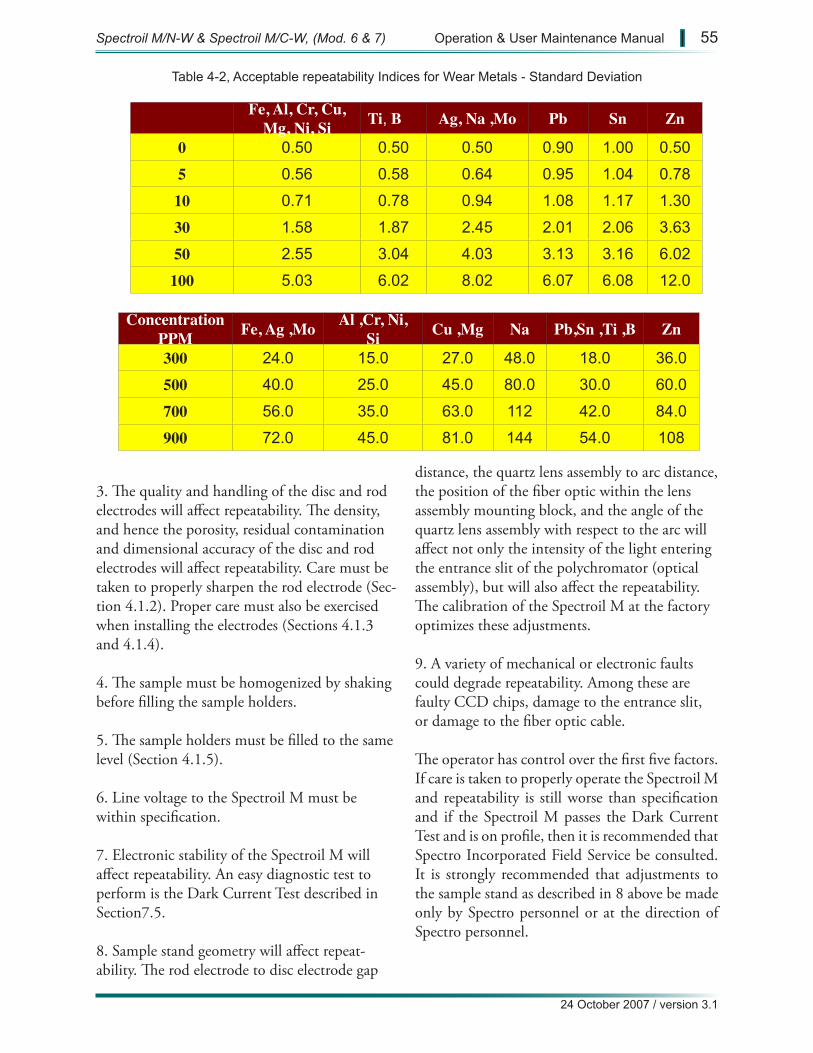
Fe, Al, Cr, Cu, Mg, Ni, Si Ti, B Ag, Na ,Mo Pb Sn Zn
0 0.50 0.50 0.50 0.90 1.00 0.50
5 0.56 0.58 0.64 0.95 1.04 0.78
10 0.71 0.78 0.94 1.08 1.17 1.30
30 1.58 1.87 2.45 2.01 2.06 3.63
50 2.55 3.04 4.03 3.13 3.16 6.02
100 5.03 6.02 8.02 6.07 6.08 12.0
ConcentrationPPM Fe, Ag ,Mo Al ,Cr, Ni,
Si Cu ,Mg Na Pb,Sn ,Ti ,B Zn
300 24.0 15.0 27.0 48.0 18.0 36.0
500 40.0 25.0 45.0 80.0 30.0 60.0
700 56.0 35.0 63.0 112 42.0 84.0
900 72.0 45.0 81.0 144 54.0 108
Table 4-2, Acceptable repeatability Indices for Wear Metals - Standard Deviation
Spectroil M/N-W & Spectroil M/C-W, (Mod. 6 & 7) Operation & User Maintenance Manual | 55
24 October 2007 / version 3.1
3. The quality and handling of the disc and rod electrodes will affect repeatability. The density, and hence the porosity, residual contamination and dimensional accuracy of the disc and rod electrodes will affect repeatability. Care must be taken to properly sharpen the rod electrode (Sec-tion 4.1.2). Proper care must also be exercised when installing the electrodes (Sections 4.1.3 and 4.1.4).
4. The sample must be homogenized by shaking before filling the sample holders.
5. The sample holders must be filled to the same level (Section 4.1.5).
6. Line voltage to the Spectroil M must be within specification.
7. Electronic stability of the Spectroil M will affect repeatability. An easy diagnostic test to perform is the Dark Current Test described in Section7.5.
8. Sample stand geometry will affect repeat-ability. The rod electrode to disc electrode gap
distance, the quartz lens assembly to arc distance, the position of the fiber optic within the lens assembly mounting block, and the angle of the quartz lens assembly with respect to the arc will affect not only the intensity of the light entering the entrance slit of the polychromator (optical assembly), but will also affect the repeatability. The calibration of the Spectroil M at the factory optimizes these adjustments.
9. A variety of mechanical or electronic faults could degrade repeatability. Among these are faulty CCD chips, damage to the entrance slit, or damage to the fiber optic cable.
The operator has control over the first five factors. If care is taken to properly operate the Spectroil M and repeatability is still worse than specification and if the Spectroil M passes the Dark Current Test and is on profile, then it is recommended that Spectro Incorporated Field Service be consulted. It is strongly recommended that adjustments to the sample stand as described in 8 above be made only by Spectro personnel or at the direction of Spectro personnel.
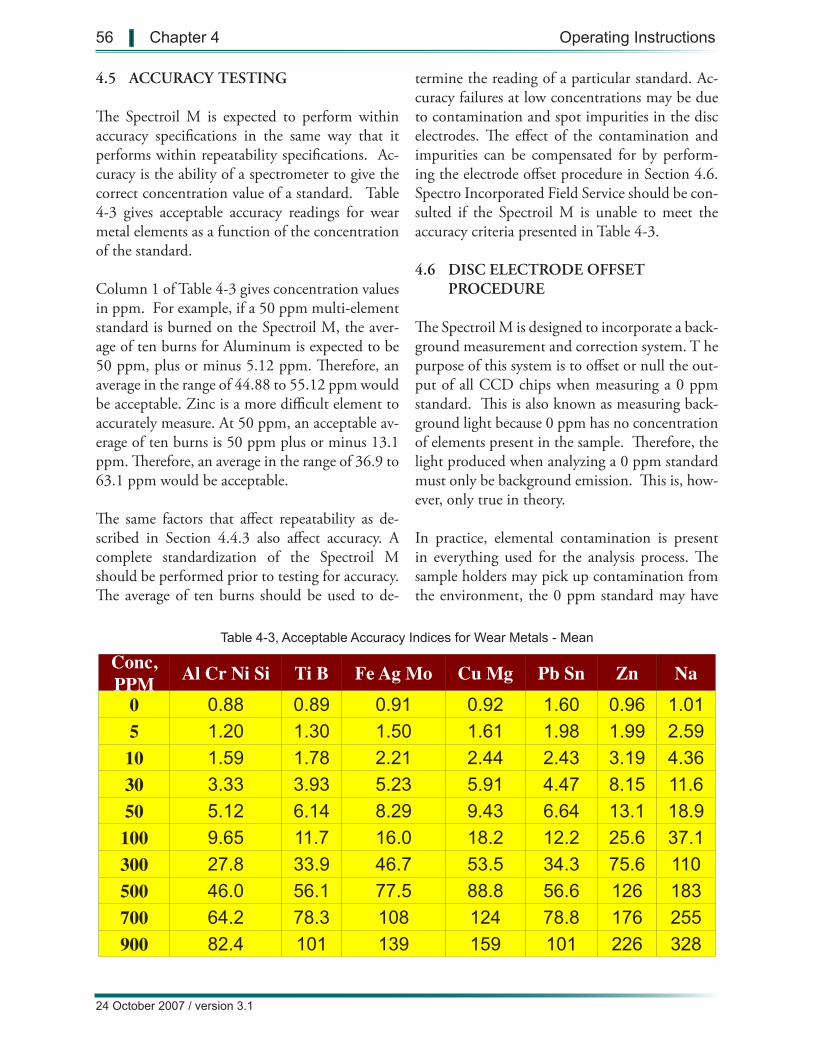
Conc,PPM Al Cr Ni Si Ti B Fe Ag Mo Cu Mg Pb Sn Zn Na
0 0.88 0.89 0.91 0.92 1.60 0.96 1.015 1.20 1.30 1.50 1.61 1.98 1.99 2.5910 1.59 1.78 2.21 2.44 2.43 3.19 4.3630 3.33 3.93 5.23 5.91 4.47 8.15 11.650 5.12 6.14 8.29 9.43 6.64 13.1 18.9100 9.65 11.7 16.0 18.2 12.2 25.6 37.1300 27.8 33.9 46.7 53.5 34.3 75.6 110500 46.0 56.1 77.5 88.8 56.6 126 183700 64.2 78.3 108 124 78.8 176 255900 82.4 101 139 159 101 226 328
Table 4-3, Acceptable Accuracy Indices for Wear Metals - Mean
56 | Chapter 4 Operating Instructions
24 October 2007 / version 3.1
4.5 ACCURACY TESTING
The Spectroil M is expected to perform within accuracy specifications in the same way that it performs within repeatability specifications. Ac-curacy is the ability of a spectrometer to give the correct concentration value of a standard. Table 4-3 gives acceptable accuracy readings for wear metal elements as a function of the concentration of the standard.
Column 1 of Table 4-3 gives concentration values in ppm. For example, if a 50 ppm multi-element standard is burned on the Spectroil M, the aver-age of ten burns for Aluminum is expected to be 50 ppm, plus or minus 5.12 ppm. Therefore, an average in the range of 44.88 to 55.12 ppm would be acceptable. Zinc is a more difficult element to accurately measure. At 50 ppm, an acceptable av-erage of ten burns is 50 ppm plus or minus 13.1 ppm. Therefore, an average in the range of 36.9 to 63.1 ppm would be acceptable.
The same factors that affect repeatability as de-scribed in Section 4.4.3 also affect accuracy. A complete standardization of the Spectroil M should be performed prior to testing for accuracy. The average of ten burns should be used to de-
termine the reading of a particular standard. Ac-curacy failures at low concentrations may be due to contamination and spot impurities in the disc electrodes. The effect of the contamination and impurities can be compensated for by perform-ing the electrode offset procedure in Section 4.6. Spectro Incorporated Field Service should be con-sulted if the Spectroil M is unable to meet the accuracy criteria presented in Table 4-3.
4.6 DISC ELECTRODE OFFSET PROCEDURE
The Spectroil M is designed to incorporate a back-ground measurement and correction system. T he purpose of this system is to offset or null the out-put of all CCD chips when measuring a 0 ppm standard. This is also known as measuring back-ground light because 0 ppm has no concentration of elements present in the sample. Therefore, the light produced when analyzing a 0 ppm standard must only be background emission. This is, how-ever, only true in theory.
In practice, elemental contamination is present in everything used for the analysis process. The sample holders may pick up contamination from the environment, the 0 ppm standard may have
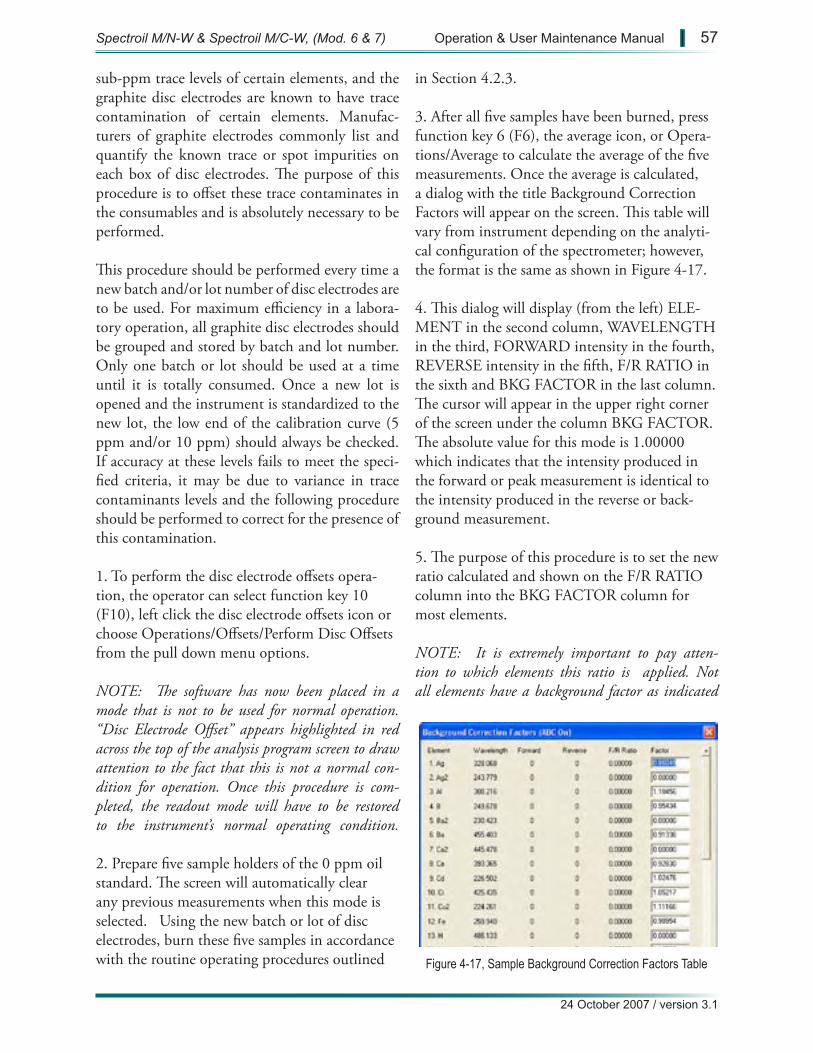
Figure 4-17, Sample Background Correction Factors Table
Spectroil M/N-W & Spectroil M/C-W, (Mod. 6 & 7) Operation & User Maintenance Manual | 57
24 October 2007 / version 3.1
sub-ppm trace levels of certain elements, and the graphite disc electrodes are known to have trace contamination of certain elements. Manufac-turers of graphite electrodes commonly list and quantify the known trace or spot impurities on each box of disc electrodes. The purpose of this procedure is to offset these trace contaminates in the consumables and is absolutely necessary to be performed.
This procedure should be performed every time a new batch and/or lot number of disc electrodes are to be used. For maximum efficiency in a labora-tory operation, all graphite disc electrodes should be grouped and stored by batch and lot number. Only one batch or lot should be used at a time until it is totally consumed. Once a new lot is opened and the instrument is standardized to the new lot, the low end of the calibration curve (5 ppm and/or 10 ppm) should always be checked. If accuracy at these levels fails to meet the speci-fied criteria, it may be due to variance in trace contaminants levels and the following procedure should be performed to correct for the presence of this contamination.
1. To perform the disc electrode offsets opera-tion, the operator can select function key 10 (F10), left click the disc electrode offsets icon or choose Operations/Offsets/Perform Disc Offsets from the pull down menu options.
NOTE: The software has now been placed in a mode that is not to be used for normal operation. “Disc Electrode Offset” appears highlighted in red across the top of the analysis program screen to draw attention to the fact that this is not a normal con-dition for operation. Once this procedure is com-pleted, the readout mode will have to be restored to the instrument’s normal operating condition.
2. Prepare five sample holders of the 0 ppm oil standard. The screen will automatically clear any previous measurements when this mode is selected. Using the new batch or lot of disc electrodes, burn these five samples in accordance with the routine operating procedures outlined
in Section 4.2.3.
3. After all five samples have been burned, press function key 6 (F6), the average icon, or Opera-tions/Average to calculate the average of the five measurements. Once the average is calculated, a dialog with the title Background Correction Factors will appear on the screen. This table will vary from instrument depending on the analyti-cal configuration of the spectrometer; however, the format is the same as shown in Figure 4-17.
4. This dialog will display (from the left) ELE-MENT in the second column, WAVELENGTH in the third, FORWARD intensity in the fourth, REVERSE intensity in the fifth, F/R RATIO in the sixth and BKG FACTOR in the last column. The cursor will appear in the upper right corner of the screen under the column BKG FACTOR. The absolute value for this mode is 1.00000 which indicates that the intensity produced in the forward or peak measurement is identical to the intensity produced in the reverse or back-ground measurement.
5. The purpose of this procedure is to set the new ratio calculated and shown on the F/R RATIO column into the BKG FACTOR column for most elements.
NOTE: It is extremely important to pay atten-tion to which elements this ratio is applied. Not all elements have a background factor as indicated
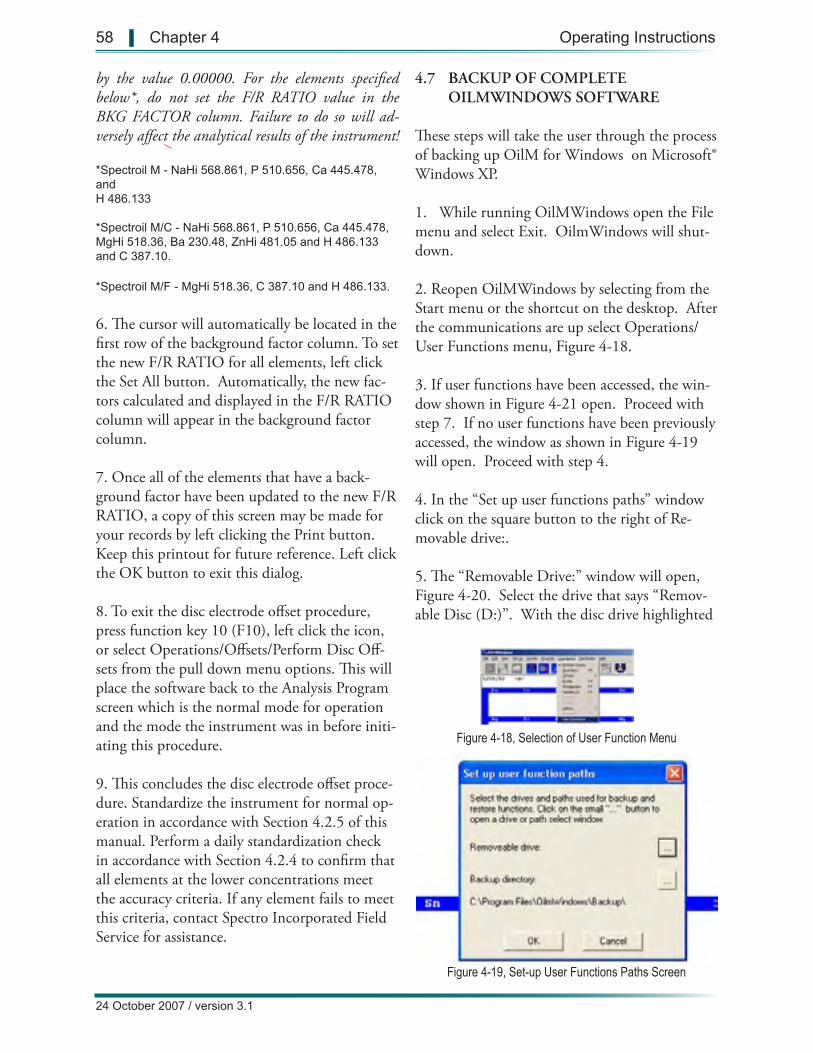
Figure 4-18, Selection of User Function Menu
Figure 4-19, Set-up User Functions Paths Screen
58 | Chapter 4 Operating Instructions
24 October 2007 / version 3.1
by the value 0.00000. For the elements specified below*, do not set the F/R RATIO value in the BKG FACTOR column. Failure to do so will ad-versely affect the analytical results of the instrument!
*Spectroil M - NaHi 568.861, P 510.656, Ca 445.478, and H 486.133
*Spectroil M/C - NaHi 568.861, P 510.656, Ca 445.478, MgHi 518.36, Ba 230.48, ZnHi 481.05 and H 486.133 and C 387.10.
*Spectroil M/F - MgHi 518.36, C 387.10 and H 486.133.
6. The cursor will automatically be located in the first row of the background factor column. To set the new F/R RATIO for all elements, left click the Set All button. Automatically, the new fac-tors calculated and displayed in the F/R RATIO column will appear in the background factor column.
7. Once all of the elements that have a back-ground factor have been updated to the new F/R RATIO, a copy of this screen may be made for your records by left clicking the Print button. Keep this printout for future reference. Left click the OK button to exit this dialog.
8. To exit the disc electrode offset procedure, press function key 10 (F10), left click the icon, or select Operations/Offsets/Perform Disc Off-sets from the pull down menu options. This will place the software back to the Analysis Program screen which is the normal mode for operation and the mode the instrument was in before initi-ating this procedure.
9. This concludes the disc electrode offset proce-dure. Standardize the instrument for normal op-eration in accordance with Section 4.2.5 of this manual. Perform a daily standardization check in accordance with Section 4.2.4 to confirm that all elements at the lower concentrations meet the accuracy criteria. If any element fails to meet this criteria, contact Spectro Incorporated Field Service for assistance.
4.7 BACKUP OF COMPLETE OILMWINDOWS SOFTWARE
These steps will take the user through the process of backing up OilM for Windows on Microsoft® Windows XP.
1. While running OilMWindows open the File menu and select Exit. OilmWindows will shut-down.
2. Reopen OilMWindows by selecting from the Start menu or the shortcut on the desktop. After the communications are up select Operations/User Functions menu, Figure 4-18.
3. If user functions have been accessed, the win-dow shown in Figure 4-21 open. Proceed with step 7. If no user functions have been previously accessed, the window as shown in Figure 4-19 will open. Proceed with step 4.
4. In the “Set up user functions paths” window click on the square button to the right of Re-movable drive:.
5. The “Removable Drive:” window will open, Figure 4-20. Select the drive that says “Remov-able Disc (D:)”. With the disc drive highlighted
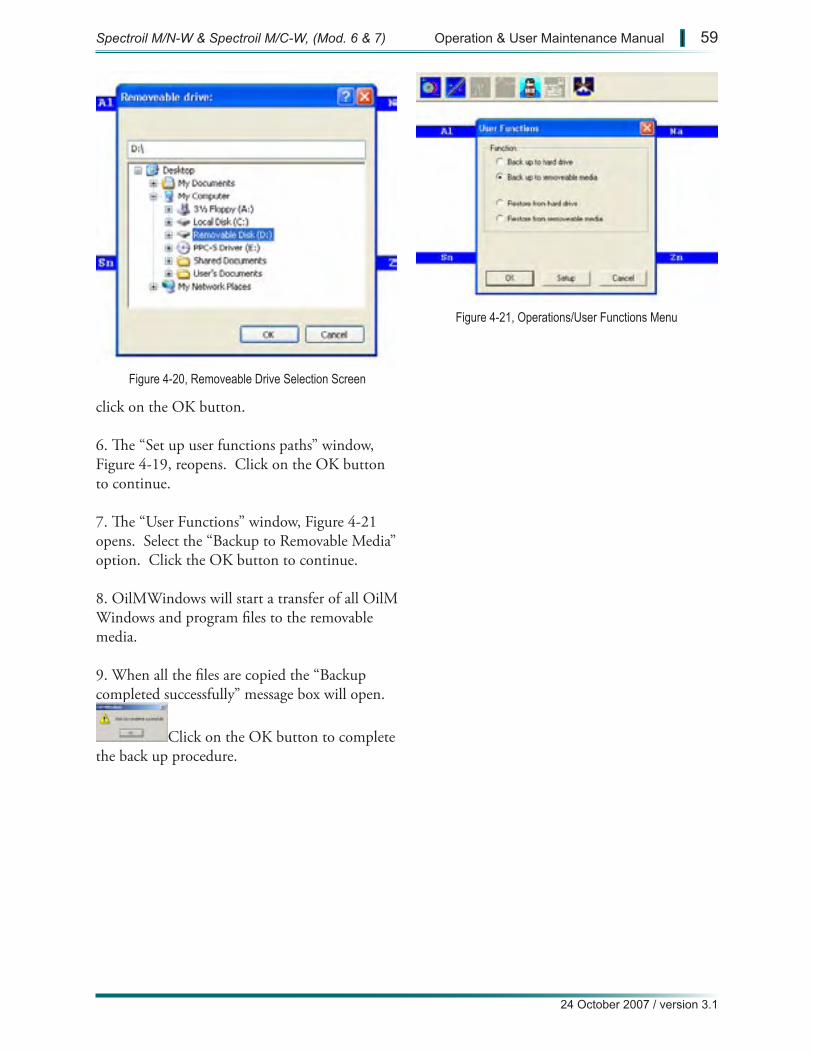
Figure 4-20, Removeable Drive Selection Screen
Figure 4-21, Operations/User Functions Menu
Spectroil M/N-W & Spectroil M/C-W, (Mod. 6 & 7) Operation & User Maintenance Manual | 59
24 October 2007 / version 3.1
click on the OK button.
6. The “Set up user functions paths” window, Figure 4-19, reopens. Click on the OK button to continue.
7. The “User Functions” window, Figure 4-21 opens. Select the “Backup to Removable Media” option. Click the OK button to continue.
8. OilMWindows will start a transfer of all OilM Windows and program files to the removable media.
9. When all the files are copied the “Backup completed successfully” message box will open.
Click on the OK button to complete the back up procedure.

This Page is Intentionally Left Blank
60 | Chapter 4 Operating Instructions
24 October 2007 / version 3.1
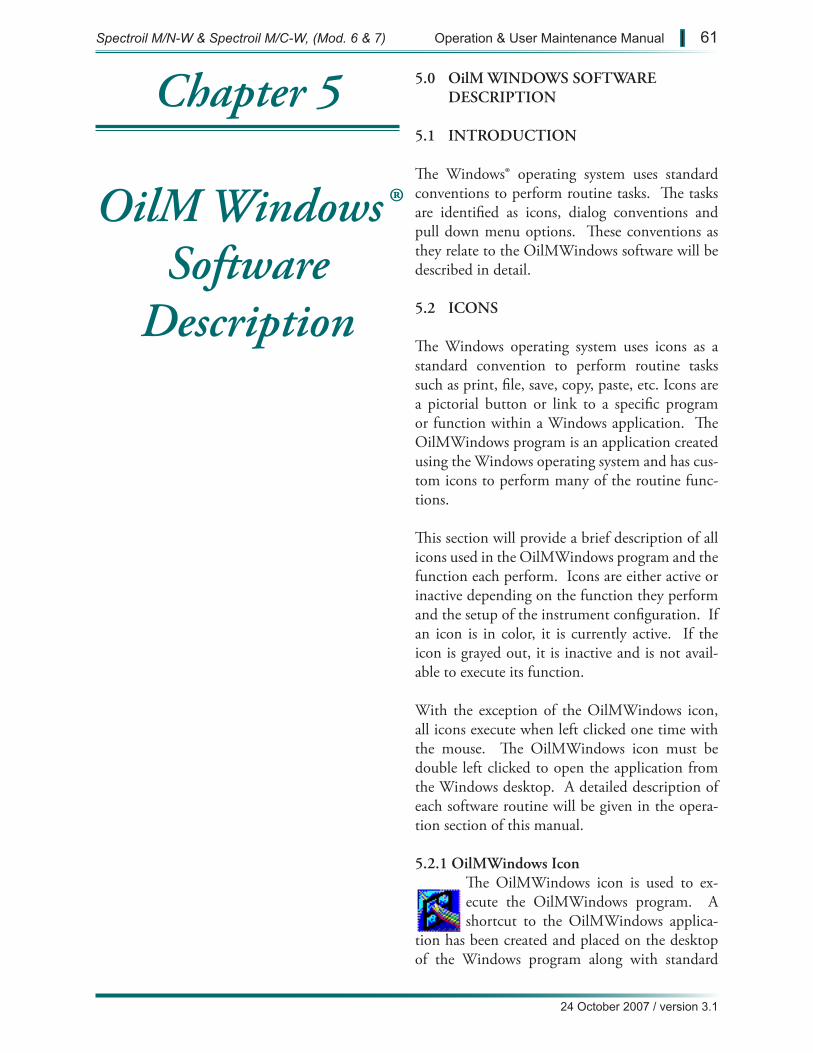
24 October 2007 / version 3.1
Spectroil M/N-W & Spectroil M/C-W, (Mod. 6 & 7) Operation & User Maintenance Manual | 61
5.0 OilM WINDOWS SOFTWARE DESCRIPTION
5.1 INTRODUCTION
The Windows® operating system uses standard conventions to perform routine tasks. The tasks are identified as icons, dialog conventions and pull down menu options. These conventions as they relate to the OilMWindows software will be described in detail.
5.2 ICONS
The Windows operating system uses icons as a standard convention to perform routine tasks such as print, file, save, copy, paste, etc. Icons are a pictorial button or link to a specific program or function within a Windows application. The OilMWindows program is an application created using the Windows operating system and has cus-tom icons to perform many of the routine func-tions.
This section will provide a brief description of all icons used in the OilMWindows program and the function each perform. Icons are either active or inactive depending on the function they perform and the setup of the instrument configuration. If an icon is in color, it is currently active. If the icon is grayed out, it is inactive and is not avail-able to execute its function.
With the exception of the OilMWindows icon, all icons execute when left clicked one time with the mouse. The OilMWindows icon must be double left clicked to open the application from the Windows desktop. A detailed description of each software routine will be given in the opera-tion section of this manual.
5.2.1 OilMWindows IconThe OilMWindows icon is used to ex-ecute the OilMWindows program. A shortcut to the OilMWindows applica-
tion has been created and placed on the desktop of the Windows program along with standard
Chapter 5
OilM Windows® Software
Description
62 | Chapter 5 OilM Windows Software Description
24 October 2007 / version 3.1
icons such as My Computer, My Documents, the Recycle Bin, etc. Whenever power is applied to the Spectroil (M/N, M/C, or M/F), the soft-ware is configured to automatically execute the OilMWindows application, and upon comple-tion of the loading process, the instrument and software will be in the main analysis program screen. From this screen all operating functions can be performed as described in Chapter 4 Op-erating Instructions
5.2.2 Cut IconThe cut icon is the first icon that ap-pears from the left on the tool bar on the OilMWindows analysis program screen.
This icon becomes active once a measurement or burn is made and appears highlighted on the screen. To use the cut icon, the burn to be cut must be highlighted by placing the pointer over any portion of the burn and left clicking the mouse. Once the burn is highlighted left clicking the mouse on the icon will cut the highlighted burn and place it in the clipboard. It will remain on the clipboard until it is pasted into another ap-plication such as a word processing or spreadsheet document or deleted by performing another clip-board function such as cut or copy. Once a burn has been cut from the analysis program screen, it cannot be pasted back to the analysis program screen.
5.2.3 Copy IconThe copy icon is the second icon that ap-pears from the left on the tool bar on the OilMWindows analysis program screen.
This icon becomes active once a measurement or burn is made and appears highlighted on the screen. To use the copy icon, the burn to be cop-ied must be highlighted by placing the pointer over any portion of the burn and left clicking the mouse. Once the burn is highlighted, left click-ing the mouse on the icon will take a copy of the measurement and place it into the clipboard. The burn or burns will remain on the clipboard until it is pasted into another application such as a word processing or spreadsheet document or deleted by performing another clipboard function such
as cut or copy. Unlike the operation of the cut icon, once a measurement has been copied from the analysis program screen, the original remains on the analysis program screen.
5.2.4 Print IconThe print icon is the third icon that ap-pears from the left on the tool bar on the OilMWindows analysis program screen.
This icon becomes active once a measurement or burn is made and appears on the screen. The print function operates on command but the print function has two different modes that are defined by the configuration of the System Parameters of the OilMWindows program and/or the Windows operating system itself.
In the System Parameters dialog, the parameter “Print Each Individual Burn” appears. See Sec-tion 5.4.6.3 for a detailed description of this dia-log. If this parameter is selected, each individual burn is printed when:
• automatically when print cache is full (ap-proximately 8 measurements),
• the print icon is selected, or • when a print dialog (such as Standardization
Values) is selected.
In the example where a full page of individual burns are cached for printing, the print function will be automatically executed by the Windows operating system and the printout will consist of each individual burn with individual sample identification, and time and date in the header. Completing this action will clear the print cache and any additional measurements will begin to accumulate until either the print icon is selected or the cache becomes full again.
When the operator chooses to print less than a full page of individual burns, selecting the print icon will printout only those individual measurements in cache. This action will clear the print cache and any additional measurements will begin to accumulate until either the print icon is selected again, or the cache becomes full again.

24 October 2007 / version 3.1
Spectroil M/N-W & Spectroil M/C-W, (Mod. 6 & 7) Operation & User Maintenance Manual | 63
If a series of measurements has been made as part of a diagnostic function such as Offsets or Profile and results in a dialog which has a print button, pressing the print button will result in a print-out of the measurements in the printer cache and then a printout of the dialog from the diagnostic function.
In the Windows operating system, print functions are automatically controlled at the system level. This means that an instruction to print generally executes automatically only when the print buf-fer area for a standard page becomes completely full. The OilMWindows application has been modified to override the system print function to enable the operator to choose on command when to make a printout. The printout function of OilMWindows has two distinctly different for-mats. Which format is used for print functions is determined at the System Parameters level. See Section 5.4.2.7 of this manual for a detailed de-scription of the “Print Individual Burns” func-tion.
When “Print Individual Burns” is not selected in the System Parameters dialog, the print func-tion is totally under the operator’s control. If a series of measurements has been made and is cur-rently displayed on the screen with or without an average, the operator may print theses measure-ments on demand. This can be accomplished at any point by left clicking the print icon. At that point, whatever measurements are accumulated on the screen will be printed out in the format that has a look similar to a screen print.
5.2.5 Profile IconThe profile icon is the fourth icon from the left on the tool bar on the OilMWindows analysis program screen.
The profile icon is active under most operating conditions except diagnostics such as BEC, Off-sets, etc. When active, left clicking the profile icon will initiate a series of screen dialogs that will confirm the current profile dial setting and lead the operator through a step by step series of mea-surements that will ultimately result in the calcu-
lation of the new optical profile dial position. For a detailed description of the optical profile opera-tion, refer to Section 4.2.7 of this manual.
5.2.6 Offsets IconThe disc offsets icon is the fifth icon from the left on the tool bar on the OilMWindows analysis program screen.
The offsets icon is a diagnostic function that is generally active under most operating conditions. This icon is used to perform the disc electrode off-set function and is the only icon that when left clicked one time, will initiate the function and when left clicked a second time will terminate the function. Refer to Section 4.6 in this manual for a detailed description of this function.
5.2.7 Standardization IconThe standardization icon is the sixth icon from the left on the tool bar on the OilMWindows analysis program screen.
The solid line at 45 degrees represents the factory established calibration curve and the dotted lines to the right and left portray the current intensity possibilities for the elements of interest. This icon is used to perform a standardization of pre-select-ed calibration standards and compares the inten-sities produced by each element to the original intensities produced during factory calibration. One left click of the mouse will initiate the stan-dardization routine where a set of dialogs step the operator through each pre-selected standard and results in the calculation of new standardization values and factors. Refer to Section 4.2.5 of this manual for a detailed description of the standard-ization function.
5.2.8 Average IconThe average icon is the seventh icon from the left on the tool bar on the OilMWindows analysis program screen.
The letter x with a bar overhead is the mathemati-cal symbol of the average function. This icon be-comes active when one or more measurements are made and remains active until all measurements are cleared from the screen. To calculate the aver-age of a series of measurements, left click the
64 | Chapter 5 OilM Windows Software Description
24 October 2007 / version 3.1
mouse one time on the average icon and the aver-age of the measurements will be calculated and displayed on the screen.
5.2.9 Statistics IconThe statistics icon is the eighth icon from the left on the tool bar on the OilMWindows analysis program screen.
This icon represents mathematical calculations of a group of data displayed statistically. This icon becomes active only when there are three or more measurements on the display. It is used primarily to calculate the average, mean, and relative stan-dard deviation of a population of measurements. To perform the statistics, left click the mouse on the statistics icon and a dialog will appear. This dialog can be printed for record keeping by press-ing the print button on the statistics dialog box. Refer to Section 5.4.8.9 of this manual for a de-tailed description of the statistics function.
5.2.10 Sample Identification (ID) IconThe sample identification icon is the ninth icon from the left on the tool bar on the OilMWindows analysis program
screen. This icon represents an oil sample bottle that requires a sample ID. This icon is active any time a measurement can be made in any operat-ing mode except diagnostics such as profile, off-sets, etc. The format the sample identification can appear is determined by the Sample Identification dialog which can be found under the System pull down menu screen. This icon can be made ac-tive by left clicking the mouse. When activated, a dialog box will appear to permit entry of a single sample ID. A multiple button is available and if selected, will open a second dialog that will per-mit up to 50 sample identifications to be pre-en-tered. Refer to Section 5.4.6.5 of this manual for a detailed description of the sample identification function.
5.2.11 Data Transmit IconThe data transmit icon is the tenth icon from the left on the tool bar on the OilMWindows analysis program screen.
This icon represents data being electronically
transmitted to an external computer for data stor-age and management. This icon becomes active when:
• the computer is selected under System/Hard-ware pull down screen,
• the Transmit Remote is selected under the System/System Parameters dialog, and
• elements have been selected for remote trans-mission in the Program/Channels/Channel Parameters dialog.
Once the remote data transmission capability has been properly setup, the format and destination that the data is to be transmitted or stored is de-termined. This is accomplished by selecting the System/Remote Computer pull down menu op-tion. Left clicking the icon with the mouse will transmit either single or multiple measurements on command to a waiting remote computer. Re-fer to the Section 5.4.6.4 of this manual for a detailed description of the System/Remote Com-puter pull down menu. Refer to Section 5.4.6.3 of this manual for a detailed description of the System/System Parameters pull down menu, and refer to Section 5.4.7.4 for a detailed description of the Program/Channels/Channel Parameters pull down menu.
5.2.12 Burn IconThe burn icon is the last icon on the right of the tool bar on the OilMWindows analysis program screen. This icon repre-
sents the rod and disc electrode with a sample cap of oil and an arc occurring across the analytical gap. This icon is active in all modes of operation including all test modes. Left clicking once with the mouse on this icon will initiate the burn cycle which consists of preburn time and measure time. Under normal operating conditions this time will be equal to approximately 30 seconds.
5.3 WINDOWS® DIALOG CONVENTIONS
The Windows® operating system uses two conven-tions that can easily be misinterpreted depending
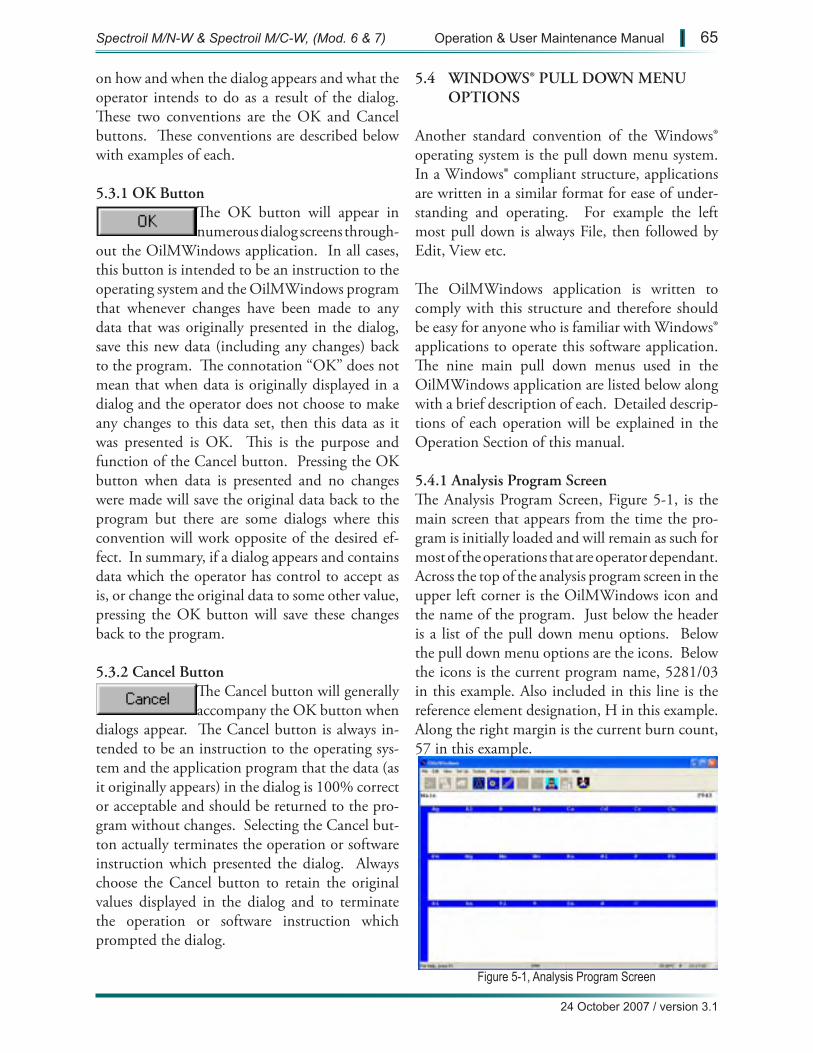
Figure 5-1, Analysis Program Screen
24 October 2007 / version 3.1
Spectroil M/N-W & Spectroil M/C-W, (Mod. 6 & 7) Operation & User Maintenance Manual | 65
on how and when the dialog appears and what the operator intends to do as a result of the dialog. These two conventions are the OK and Cancel buttons. These conventions are described below with examples of each.
5.3.1 OK ButtonThe OK button will appear in numerous dialog screens through-
out the OilMWindows application. In all cases, this button is intended to be an instruction to the operating system and the OilMWindows program that whenever changes have been made to any data that was originally presented in the dialog, save this new data (including any changes) back to the program. The connotation “OK” does not mean that when data is originally displayed in a dialog and the operator does not choose to make any changes to this data set, then this data as it was presented is OK. This is the purpose and function of the Cancel button. Pressing the OK button when data is presented and no changes were made will save the original data back to the program but there are some dialogs where this convention will work opposite of the desired ef-fect. In summary, if a dialog appears and contains data which the operator has control to accept as is, or change the original data to some other value, pressing the OK button will save these changes back to the program.
5.3.2 Cancel ButtonThe Cancel button will generally accompany the OK button when
dialogs appear. The Cancel button is always in-tended to be an instruction to the operating sys-tem and the application program that the data (as it originally appears) in the dialog is 100% correct or acceptable and should be returned to the pro-gram without changes. Selecting the Cancel but-ton actually terminates the operation or software instruction which presented the dialog. Always choose the Cancel button to retain the original values displayed in the dialog and to terminate the operation or software instruction which prompted the dialog.
5.4 WINDOWS® PULL DOWN MENU OPTIONS
Another standard convention of the Windows® operating system is the pull down menu system. In a Windows® compliant structure, applications are written in a similar format for ease of under-standing and operating. For example the left most pull down is always File, then followed by Edit, View etc.
The OilMWindows application is written to comply with this structure and therefore should be easy for anyone who is familiar with Windows® applications to operate this software application. The nine main pull down menus used in the OilMWindows application are listed below along with a brief description of each. Detailed descrip-tions of each operation will be explained in the Operation Section of this manual.
5.4.1 Analysis Program ScreenThe Analysis Program Screen, Figure 5-1, is the main screen that appears from the time the pro-gram is initially loaded and will remain as such for most of the operations that are operator dependant. Across the top of the analysis program screen in the upper left corner is the OilMWindows icon and the name of the program. Just below the header is a list of the pull down menu options. Below the pull down menu options are the icons. Below the icons is the current program name, 5281/03 in this example. Also included in this line is the reference element designation, H in this example. Along the right margin is the current burn count, 57 in this example.
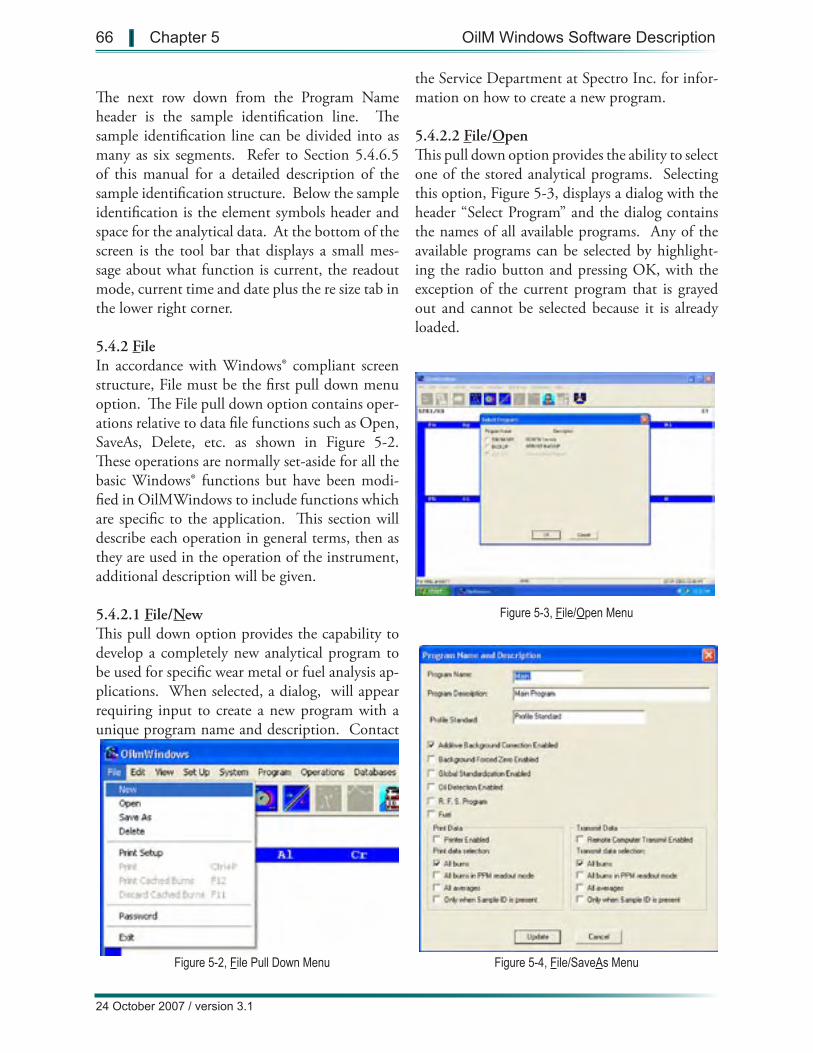
Figure 5-3, File/Open Menu
Figure 5-4, File/SaveAs MenuFigure 5-2, File Pull Down Menu
66 | Chapter 5 OilM Windows Software Description
24 October 2007 / version 3.1
The next row down from the Program Name header is the sample identification line. The sample identification line can be divided into as many as six segments. Refer to Section 5.4.6.5 of this manual for a detailed description of the sample identification structure. Below the sample identification is the element symbols header and space for the analytical data. At the bottom of the screen is the tool bar that displays a small mes-sage about what function is current, the readout mode, current time and date plus the re size tab in the lower right corner.
5.4.2 FileIn accordance with Windows® compliant screen structure, File must be the first pull down menu option. The File pull down option contains oper-ations relative to data file functions such as Open, SaveAs, Delete, etc. as shown in Figure 5-2. These operations are normally set-aside for all the basic Windows® functions but have been modi-fied in OilMWindows to include functions which are specific to the application. This section will describe each operation in general terms, then as they are used in the operation of the instrument, additional description will be given.
5.4.2.1 File/NewThis pull down option provides the capability to develop a completely new analytical program to be used for specific wear metal or fuel analysis ap-plications. When selected, a dialog, will appear requiring input to create a new program with a unique program name and description. Contact
the Service Department at Spectro Inc. for infor-mation on how to create a new program.
5.4.2.2 File/OpenThis pull down option provides the ability to select one of the stored analytical programs. Selecting this option, Figure 5-3, displays a dialog with the header “Select Program” and the dialog contains the names of all available programs. Any of the available programs can be selected by highlight-ing the radio button and pressing OK, with the exception of the current program that is grayed out and cannot be selected because it is already loaded.
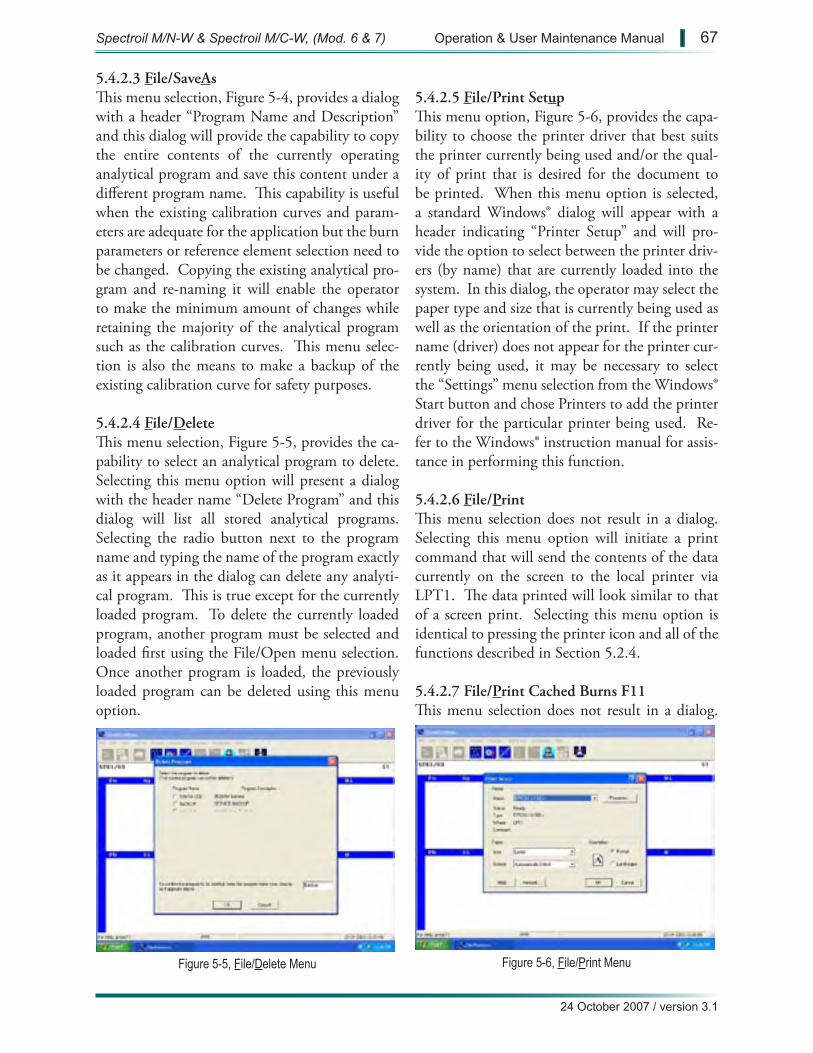
Figure 5-5, File/Delete Menu Figure 5-6, File/Print Menu
24 October 2007 / version 3.1
Spectroil M/N-W & Spectroil M/C-W, (Mod. 6 & 7) Operation & User Maintenance Manual | 67
5.4.2.3 File/SaveAsThis menu selection, Figure 5-4, provides a dialog with a header “Program Name and Description” and this dialog will provide the capability to copy the entire contents of the currently operating analytical program and save this content under a different program name. This capability is useful when the existing calibration curves and param-eters are adequate for the application but the burn parameters or reference element selection need to be changed. Copying the existing analytical pro-gram and re-naming it will enable the operator to make the minimum amount of changes while retaining the majority of the analytical program such as the calibration curves. This menu selec-tion is also the means to make a backup of the existing calibration curve for safety purposes.
5.4.2.4 File/DeleteThis menu selection, Figure 5-5, provides the ca-pability to select an analytical program to delete. Selecting this menu option will present a dialog with the header name “Delete Program” and this dialog will list all stored analytical programs. Selecting the radio button next to the program name and typing the name of the program exactly as it appears in the dialog can delete any analyti-cal program. This is true except for the currently loaded program. To delete the currently loaded program, another program must be selected and loaded first using the File/Open menu selection. Once another program is loaded, the previously loaded program can be deleted using this menu option.
5.4.2.5 File/Print SetupThis menu option, Figure 5-6, provides the capa-bility to choose the printer driver that best suits the printer currently being used and/or the qual-ity of print that is desired for the document to be printed. When this menu option is selected, a standard Windows® dialog will appear with a header indicating “Printer Setup” and will pro-vide the option to select between the printer driv-ers (by name) that are currently loaded into the system. In this dialog, the operator may select the paper type and size that is currently being used as well as the orientation of the print. If the printer name (driver) does not appear for the printer cur-rently being used, it may be necessary to select the “Settings” menu selection from the Windows® Start button and chose Printers to add the printer driver for the particular printer being used. Re-fer to the Windows® instruction manual for assis-tance in performing this function.
5.4.2.6 File/PrintThis menu selection does not result in a dialog. Selecting this menu option will initiate a print command that will send the contents of the data currently on the screen to the local printer via LPT1. The data printed will look similar to that of a screen print. Selecting this menu option is identical to pressing the printer icon and all of the functions described in Section 5.2.4.
5.4.2.7 File/Print Cached Burns F11This menu selection does not result in a dialog.
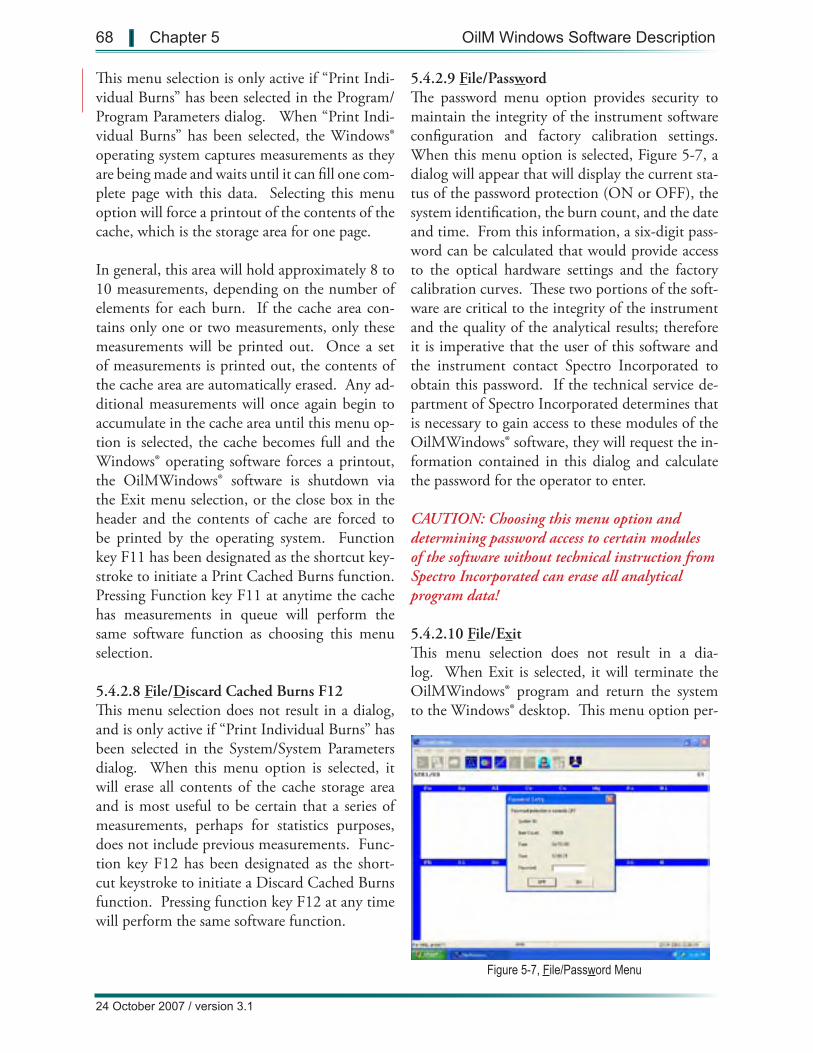
Figure 5-7, File/Password Menu
68 | Chapter 5 OilM Windows Software Description
24 October 2007 / version 3.1
This menu selection is only active if “Print Indi-vidual Burns” has been selected in the Program/Program Parameters dialog. When “Print Indi-vidual Burns” has been selected, the Windows® operating system captures measurements as they are being made and waits until it can fill one com-plete page with this data. Selecting this menu option will force a printout of the contents of the cache, which is the storage area for one page.
In general, this area will hold approximately 8 to 10 measurements, depending on the number of elements for each burn. If the cache area con-tains only one or two measurements, only these measurements will be printed out. Once a set of measurements is printed out, the contents of the cache area are automatically erased. Any ad-ditional measurements will once again begin to accumulate in the cache area until this menu op-tion is selected, the cache becomes full and the Windows® operating software forces a printout, the OilMWindows® software is shutdown via the Exit menu selection, or the close box in the header and the contents of cache are forced to be printed by the operating system. Function key F11 has been designated as the shortcut key-stroke to initiate a Print Cached Burns function. Pressing Function key F11 at anytime the cache has measurements in queue will perform the same software function as choosing this menu selection.
5.4.2.8 File/Discard Cached Burns F12This menu selection does not result in a dialog, and is only active if “Print Individual Burns” has been selected in the System/System Parameters dialog. When this menu option is selected, it will erase all contents of the cache storage area and is most useful to be certain that a series of measurements, perhaps for statistics purposes, does not include previous measurements. Func-tion key F12 has been designated as the short-cut keystroke to initiate a Discard Cached Burns function. Pressing function key F12 at any time will perform the same software function.
5.4.2.9 File/PasswordThe password menu option provides security to maintain the integrity of the instrument software configuration and factory calibration settings. When this menu option is selected, Figure 5-7, a dialog will appear that will display the current sta-tus of the password protection (ON or OFF), the system identification, the burn count, and the date and time. From this information, a six-digit pass-word can be calculated that would provide access to the optical hardware settings and the factory calibration curves. These two portions of the soft-ware are critical to the integrity of the instrument and the quality of the analytical results; therefore it is imperative that the user of this software and the instrument contact Spectro Incorporated to obtain this password. If the technical service de-partment of Spectro Incorporated determines that is necessary to gain access to these modules of the OilMWindows® software, they will request the in-formation contained in this dialog and calculate the password for the operator to enter.
CAUTION: Choosing this menu option and determining password access to certain modules of the software without technical instruction from Spectro Incorporated can erase all analytical program data!
5.4.2.10 File/ExitThis menu selection does not result in a dia-log. When Exit is selected, it will terminate the OilMWindows® program and return the system to the Windows® desktop. This menu option per-
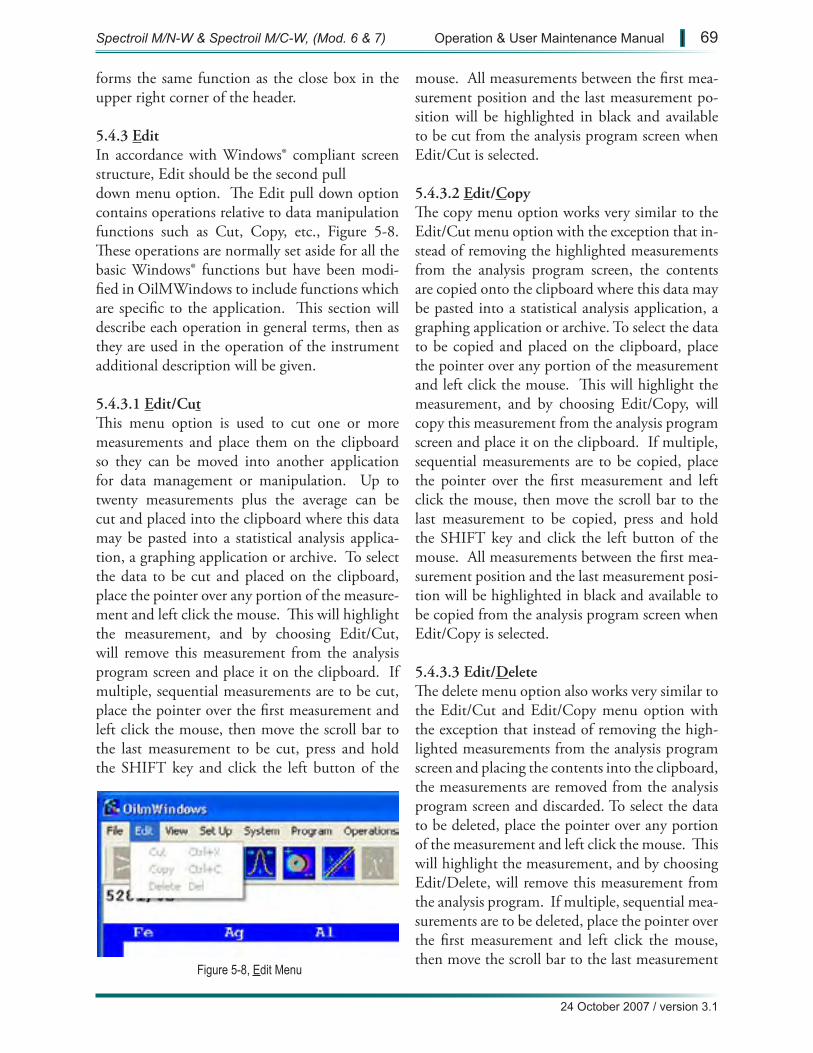
Figure 5-8, Edit Menu
24 October 2007 / version 3.1
Spectroil M/N-W & Spectroil M/C-W, (Mod. 6 & 7) Operation & User Maintenance Manual | 69
forms the same function as the close box in the upper right corner of the header.
5.4.3 EditIn accordance with Windows® compliant screen structure, Edit should be the second pulldown menu option. The Edit pull down option contains operations relative to data manipulation functions such as Cut, Copy, etc., Figure 5-8. These operations are normally set aside for all the basic Windows® functions but have been modi-fied in OilMWindows to include functions which are specific to the application. This section will describe each operation in general terms, then as they are used in the operation of the instrument additional description will be given.
5.4.3.1 Edit/CutThis menu option is used to cut one or more measurements and place them on the clipboard so they can be moved into another application for data management or manipulation. Up to twenty measurements plus the average can be cut and placed into the clipboard where this data may be pasted into a statistical analysis applica-tion, a graphing application or archive. To select the data to be cut and placed on the clipboard, place the pointer over any portion of the measure-ment and left click the mouse. This will highlight the measurement, and by choosing Edit/Cut, will remove this measurement from the analysis program screen and place it on the clipboard. If multiple, sequential measurements are to be cut, place the pointer over the first measurement and left click the mouse, then move the scroll bar to the last measurement to be cut, press and hold the SHIFT key and click the left button of the
mouse. All measurements between the first mea-surement position and the last measurement po-sition will be highlighted in black and available to be cut from the analysis program screen when Edit/Cut is selected.
5.4.3.2 Edit/CopyThe copy menu option works very similar to the Edit/Cut menu option with the exception that in-stead of removing the highlighted measurements from the analysis program screen, the contents are copied onto the clipboard where this data may be pasted into a statistical analysis application, a graphing application or archive. To select the data to be copied and placed on the clipboard, place the pointer over any portion of the measurement and left click the mouse. This will highlight the measurement, and by choosing Edit/Copy, will copy this measurement from the analysis program screen and place it on the clipboard. If multiple, sequential measurements are to be copied, place the pointer over the first measurement and left click the mouse, then move the scroll bar to the last measurement to be copied, press and hold the SHIFT key and click the left button of the mouse. All measurements between the first mea-surement position and the last measurement posi-tion will be highlighted in black and available to be copied from the analysis program screen when Edit/Copy is selected.
5.4.3.3 Edit/DeleteThe delete menu option also works very similar to the Edit/Cut and Edit/Copy menu option with the exception that instead of removing the high-lighted measurements from the analysis program screen and placing the contents into the clipboard, the measurements are removed from the analysis program screen and discarded. To select the data to be deleted, place the pointer over any portion of the measurement and left click the mouse. This will highlight the measurement, and by choosing Edit/Delete, will remove this measurement from the analysis program. If multiple, sequential mea-surements are to be deleted, place the pointer over the first measurement and left click the mouse, then move the scroll bar to the last measurement
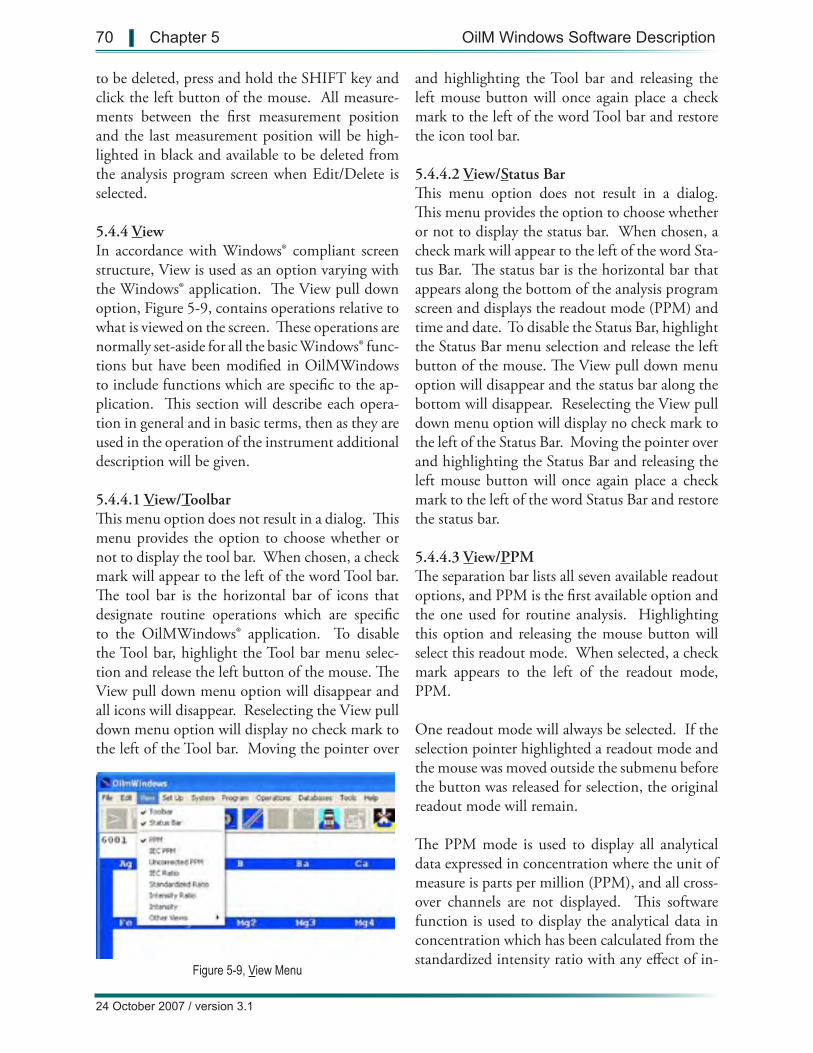
Figure 5-9, View Menu
70 | Chapter 5 OilM Windows Software Description
24 October 2007 / version 3.1
to be deleted, press and hold the SHIFT key and click the left button of the mouse. All measure-ments between the first measurement position and the last measurement position will be high-lighted in black and available to be deleted from the analysis program screen when Edit/Delete is selected.
5.4.4 ViewIn accordance with Windows® compliant screen structure, View is used as an option varying with the Windows® application. The View pull down option, Figure 5-9, contains operations relative to what is viewed on the screen. These operations are normally set-aside for all the basic Windows® func-tions but have been modified in OilMWindows to include functions which are specific to the ap-plication. This section will describe each opera-tion in general and in basic terms, then as they are used in the operation of the instrument additional description will be given.
5.4.4.1 View/ToolbarThis menu option does not result in a dialog. This menu provides the option to choose whether or not to display the tool bar. When chosen, a check mark will appear to the left of the word Tool bar. The tool bar is the horizontal bar of icons that designate routine operations which are specific to the OilMWindows® application. To disable the Tool bar, highlight the Tool bar menu selec-tion and release the left button of the mouse. The View pull down menu option will disappear and all icons will disappear. Reselecting the View pull down menu option will display no check mark to the left of the Tool bar. Moving the pointer over
and highlighting the Tool bar and releasing the left mouse button will once again place a check mark to the left of the word Tool bar and restore the icon tool bar.
5.4.4.2 View/Status BarThis menu option does not result in a dialog. This menu provides the option to choose whether or not to display the status bar. When chosen, a check mark will appear to the left of the word Sta-tus Bar. The status bar is the horizontal bar that appears along the bottom of the analysis program screen and displays the readout mode (PPM) and time and date. To disable the Status Bar, highlight the Status Bar menu selection and release the left button of the mouse. The View pull down menu option will disappear and the status bar along the bottom will disappear. Reselecting the View pull down menu option will display no check mark to the left of the Status Bar. Moving the pointer over and highlighting the Status Bar and releasing the left mouse button will once again place a check mark to the left of the word Status Bar and restore the status bar.
5.4.4.3 View/PPMThe separation bar lists all seven available readout options, and PPM is the first available option and the one used for routine analysis. Highlighting this option and releasing the mouse button will select this readout mode. When selected, a check mark appears to the left of the readout mode, PPM.
One readout mode will always be selected. If the selection pointer highlighted a readout mode and the mouse was moved outside the submenu before the button was released for selection, the original readout mode will remain.
The PPM mode is used to display all analytical data expressed in concentration where the unit of measure is parts per million (PPM), and all cross-over channels are not displayed. This software function is used to display the analytical data in concentration which has been calculated from the standardized intensity ratio with any effect of in-
24 October 2007 / version 3.1
Spectroil M/N-W & Spectroil M/C-W, (Mod. 6 & 7) Operation & User Maintenance Manual | 71
terelement correction factors applied. This stan-dardized interelement corrected intensity ratio is applied to the calibration curve that has been gen-erated from a calibration that normally has been performed at the factory before the instrument has been delivered. This is the mode of readout in which normal instruments operation will be performed.
5.4.4.4 View/IEC PPMHighlighting this option and releasing the mouse button will select this readout mode. When se-lected, a check mark appears to the left of the readout mode, IEC PPM.
The IEC PPM mode is used to display all analyti-cal data expressed in concentration where the unit of measure is an interelement corrected concen-tration or (IEC PPM). The difference with this readout display and that of the PPM mode is that all selected element channels are shown with any and all interelement corrections. Comparing the results of Uncorrected PPM and IEC PPM data will confirm that an interelement correction is be-ing applied and in the correct ratio. This mode of readout is generally used to observe the effect of the crossover logic and interelement correction factors. This is not a standard readout mode for normal operation.
5.4.4.5 View/Uncorrected PPMHighlighting this option and releasing the mouse button will select this readout mode. When se-lected, a check mark appears to the left of the readout mode, Uncorrected PPM.
The Uncorrected PPM mode is used to display all analytical data expressed in concentration that has not yet been corrected as a result of the influences of other elements present in the sample or stan-dard. This software function is used to display the analytical data in concentration (ppm) which has been calculated from the standardized intensity ratio without the affect of any interelement cor-rection. This mode of readout is generally used to observe and determine if an interelement correc-tion is required, and if so, the amount of interele-
ment correction which is necessary to make the true concentration correct. This is not a standard readout mode for normal operation.
5.4.4.6 View/IEC RatioHighlighting this option and releasing the mouse button will select this readout mode. When se-lected, a check mark appears to the left of the readout mode, IEC Ratio.
Interelement correction factors are sometimes necessary when a large concentration of one ele-ment produces a spectral interference on another element, or the presence of a large concentration of one element suppresses the emission of another element. This is called additive and multiplica-tive interelement interference which increases or decreases the concentration output of the inter-fered element. These factors are determined by the ratio of interference caused by the interfering element on the interfered element.
The IEC Ratio mode is used to display all ana-lytical data expressed in intensities ratios that have been corrected from intensity ratios by a factor derived from the result of the influences of other elements present in the sample or standard. This software function is used to display the analyti-cal data in intensity ratios that have been calcu-lated from the standardized intensity ratio with the affect of interelement corrections. This mode of readout is generally used to observe and deter-mine if an interelement correction is required, and if so, the amount of interelement correction which is necessary to make the true intensity ratio correct.
This is not a standard readout mode for normal operation.
5.4.4.7 View/Standardized RatioHighlighting this option and releasing the mouse button will select this readout mode. When se-lected, a check mark appears to the left of the readout mode, Standardized Ratio.
Standardized intensity ratios are the same inten-
72 | Chapter 5 OilM Windows Software Description
24 October 2007 / version 3.1
sity ratios which have been produced from an analytical measurement, but are adjusted by a standardization factor derived during the stan-dardization procedure. The intensity ratios are then multiplied by a standardization factor which has been derived by comparing the current cali-bration curve intensities to those originally pro-duced during factory calibration.
In an ideal example, if the intensity ratios pro-duced during the last standardization match the original intensity ratios produced during factory calibration, the standardization factor would be 1.00. In this example, the intensity ratio values and the standardized intensity ratio values are identical. In practice, this would almost never happen, therefore the standardization factor gen-erally ranges +/- 0.5 from 5.00. Shown below is the formula which is used to calculate the stan-dardized intensity ratio factor for each element.
ISiR = IRi x Fi + Ai
where:
ISiR = Standardized intensity ratio of element I
IRi = Intensity ratio of element I
Fi = Standardization factor of reference ele-ment
Ai = Standardization offset of reference ele-ment
The formula ISiR = IRi x Fi + Ai can be ap-plied as follows: IRi = I x FInt Std
Fi = Low Sample Expected - High Sample Expected Low Sample Obtained - High Sample Obtained
Ai = (HSE x LSO) - (HSO x LSE) LSO - HSO
The purpose of the standardized intensity ratio is to compensate for variations in the intensities
produced during standardization. These variations come from a variety of sources such as consum-ables, optical alignment and environment. It is important to periodically monitor this standard-ization factor to be sure that these variations do not exceed 0.5 to 5.0. Once the standardization factor is determined during the standardization procedure, this factor is applied to all measure-ments until the next standardization procedure is performed. The standardized intensity ratio will be used in the calibration curve to determine the concentration (ppm) equivalent. This is not a standard readout mode for normal operation.
5.4.4.8 View/Intensity RatioHighlighting this option and releasing the mouse button will select this readout mode. When se-lected, a check mark appears to the left of the readout mode, Intensity Ratio.
Intensity ratios are the same intensities which have been produced from an analytical measurement then ratioed or multiplied by a reference factor which has been derived by dividing a nominal or fixed reference intensity value by the actual inten-sity produced by the reference element (Hydro-gen or Carbon) for that measurement.
In an ideal example, if the fixed reference intensity value is 10,000 and the intensity produced by one analytical measurement was also 10,000, the ref-erence factor calculation would produce a factor of 1.00. In this example, the intensity values and the intensity ratio values would be identical. In practice, this would almost never happen, there-fore the reference factor generally ranges +/- 0.3 of the nominal reference intensity value.
The purpose of the intensity ratio is to monitor a reference other than those elements present in the sample. In this case, Hydrogen or Carbon are the most common reference elements in oil analysis applications. If a series of measurements are made on the same sample, a certain amount of varia-tion in the measurement is to be expected due to variations in consumables, etc. Monitoring a ref-erence channel and adjusting the intensity values
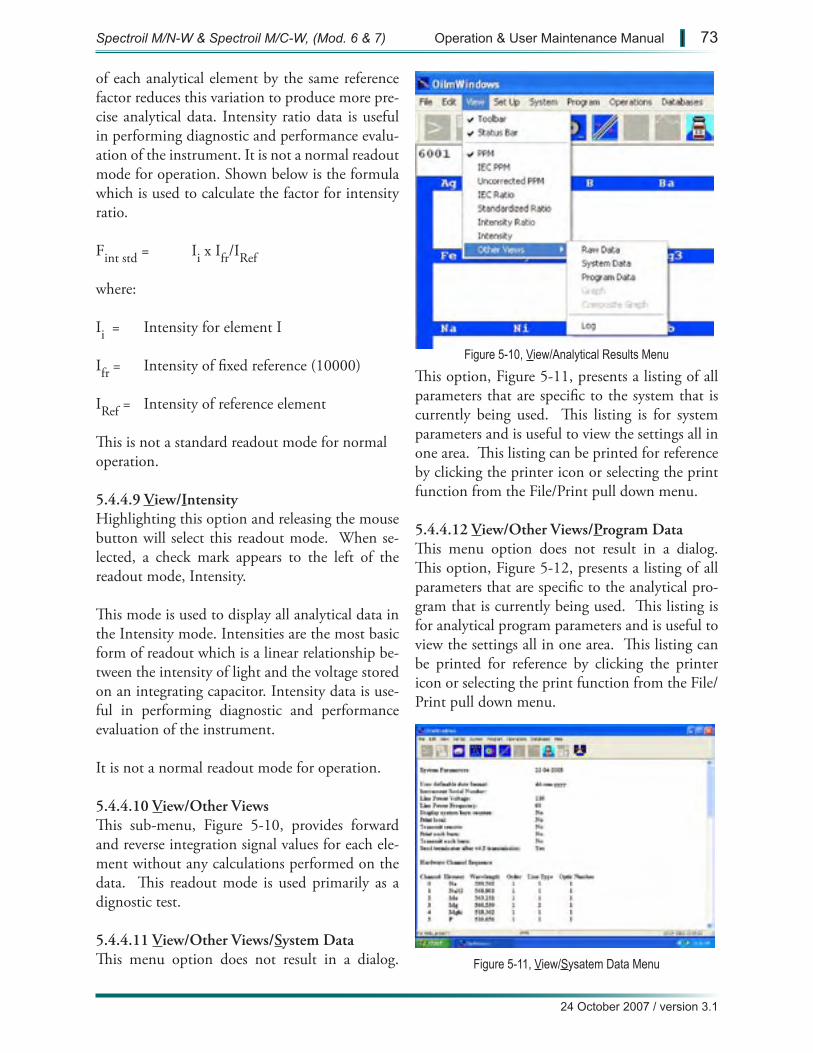
Figure 5-11, View/Sysatem Data Menu
Figure 5-10, View/Analytical Results Menu
24 October 2007 / version 3.1
Spectroil M/N-W & Spectroil M/C-W, (Mod. 6 & 7) Operation & User Maintenance Manual | 73
of each analytical element by the same reference factor reduces this variation to produce more pre-cise analytical data. Intensity ratio data is useful in performing diagnostic and performance evalu-ation of the instrument. It is not a normal readout mode for operation. Shown below is the formula which is used to calculate the factor for intensity ratio.
Fint std = Ii x Ifr/IRef
where:
Ii = Intensity for element I
Ifr = Intensity of fixed reference (10000)
IRef = Intensity of reference element
This is not a standard readout mode for normal operation.
5.4.4.9 View/IntensityHighlighting this option and releasing the mouse button will select this readout mode. When se-lected, a check mark appears to the left of the readout mode, Intensity.
This mode is used to display all analytical data in the Intensity mode. Intensities are the most basic form of readout which is a linear relationship be-tween the intensity of light and the voltage stored on an integrating capacitor. Intensity data is use-ful in performing diagnostic and performance evaluation of the instrument.
It is not a normal readout mode for operation.
5.4.4.10 View/Other ViewsThis sub-menu, Figure 5-10, provides forward and reverse integration signal values for each ele-ment without any calculations performed on the data. This readout mode is used primarily as a dignostic test.
5.4.4.11 View/Other Views/System DataThis menu option does not result in a dialog.
This option, Figure 5-11, presents a listing of all parameters that are specific to the system that is currently being used. This listing is for system parameters and is useful to view the settings all in one area. This listing can be printed for reference by clicking the printer icon or selecting the print function from the File/Print pull down menu.
5.4.4.12 View/Other Views/Program DataThis menu option does not result in a dialog. This option, Figure 5-12, presents a listing of all parameters that are specific to the analytical pro-gram that is currently being used. This listing is for analytical program parameters and is useful to view the settings all in one area. This listing can be printed for reference by clicking the printer icon or selecting the print function from the File/Print pull down menu.
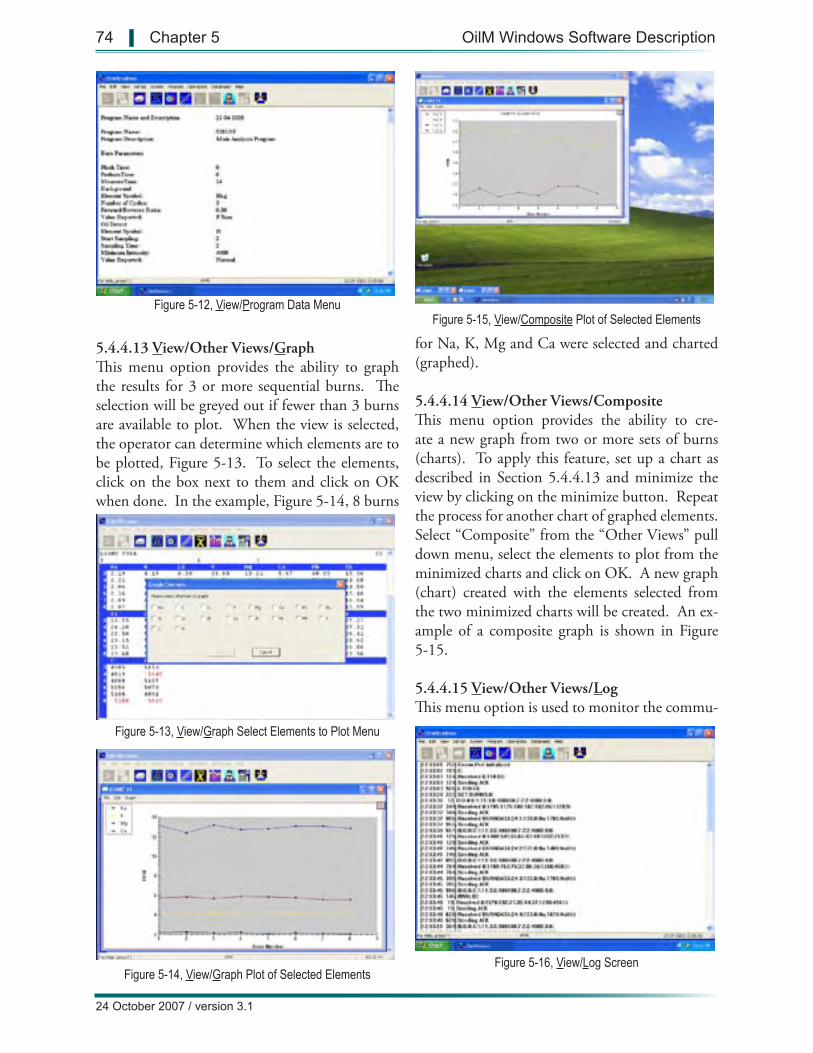
Figure 5-13, View/Graph Select Elements to Plot Menu
Figure 5-16, View/Log ScreenFigure 5-14, View/Graph Plot of Selected Elements
Figure 5-15, View/Composite Plot of Selected ElementsFigure 5-12, View/Program Data Menu
74 | Chapter 5 OilM Windows Software Description
24 October 2007 / version 3.1
5.4.4.13 View/Other Views/GraphThis menu option provides the ability to graph the results for 3 or more sequential burns. The selection will be greyed out if fewer than 3 burns are available to plot. When the view is selected, the operator can determine which elements are to be plotted, Figure 5-13. To select the elements, click on the box next to them and click on OK when done. In the example, Figure 5-14, 8 burns
for Na, K, Mg and Ca were selected and charted (graphed).
5.4.4.14 View/Other Views/CompositeThis menu option provides the ability to cre-ate a new graph from two or more sets of burns (charts). To apply this feature, set up a chart as described in Section 5.4.4.13 and minimize the view by clicking on the minimize button. Repeat the process for another chart of graphed elements. Select “Composite” from the “Other Views” pull down menu, select the elements to plot from the minimized charts and click on OK. A new graph (chart) created with the elements selected from the two minimized charts will be created. An ex-ample of a composite graph is shown in Figure 5-15.
5.4.4.15 View/Other Views/LogThis menu option is used to monitor the commu-
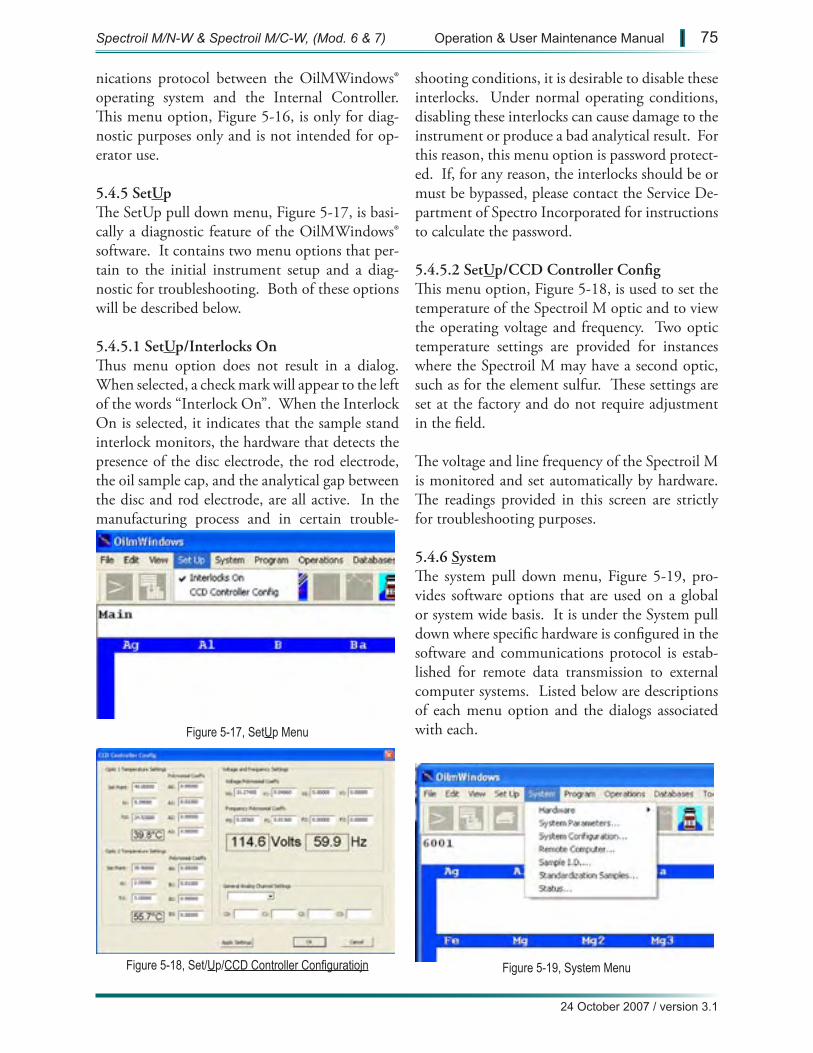
Figure 5-17, SetUp Menu
Figure 5-18, Set/Up/CCD Controller Configuratiojn Figure 5-19, System Menu
24 October 2007 / version 3.1
Spectroil M/N-W & Spectroil M/C-W, (Mod. 6 & 7) Operation & User Maintenance Manual | 75
nications protocol between the OilMWindows® operating system and the Internal Controller. This menu option, Figure 5-16, is only for diag-nostic purposes only and is not intended for op-erator use.
5.4.5 SetUpThe SetUp pull down menu, Figure 5-17, is basi-cally a diagnostic feature of the OilMWindows® software. It contains two menu options that per-tain to the initial instrument setup and a diag-nostic for troubleshooting. Both of these options will be described below.
5.4.5.1 SetUp/Interlocks OnThus menu option does not result in a dialog. When selected, a check mark will appear to the left of the words “Interlock On”. When the Interlock On is selected, it indicates that the sample stand interlock monitors, the hardware that detects the presence of the disc electrode, the rod electrode, the oil sample cap, and the analytical gap between the disc and rod electrode, are all active. In the manufacturing process and in certain trouble-
shooting conditions, it is desirable to disable these interlocks. Under normal operating conditions, disabling these interlocks can cause damage to the instrument or produce a bad analytical result. For this reason, this menu option is password protect-ed. If, for any reason, the interlocks should be or must be bypassed, please contact the Service De-partment of Spectro Incorporated for instructions to calculate the password.
5.4.5.2 SetUp/CCD Controller ConfigThis menu option, Figure 5-18, is used to set the temperature of the Spectroil M optic and to view the operating voltage and frequency. Two optic temperature settings are provided for instances where the Spectroil M may have a second optic, such as for the element sulfur. These settings are set at the factory and do not require adjustment in the field.
The voltage and line frequency of the Spectroil M is monitored and set automatically by hardware. The readings provided in this screen are strictly for troubleshooting purposes.
5.4.6 SystemThe system pull down menu, Figure 5-19, pro-vides software options that are used on a global or system wide basis. It is under the System pull down where specific hardware is configured in the software and communications protocol is estab-lished for remote data transmission to external computer systems. Listed below are descriptions of each menu option and the dialogs associated with each.
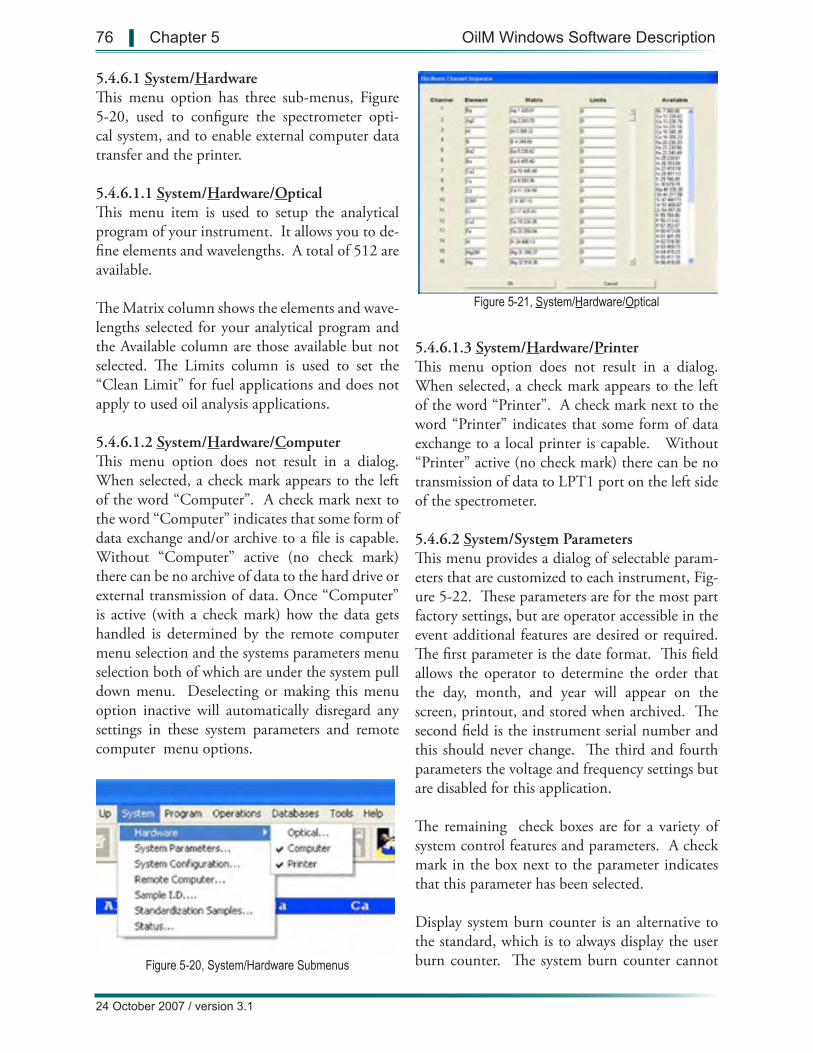
Figure 5-20, System/Hardware Submenus
Figure 5-21, System/Hardware/Optical
76 | Chapter 5 OilM Windows Software Description
24 October 2007 / version 3.1
5.4.6.1 System/HardwareThis menu option has three sub-menus, Figure 5-20, used to configure the spectrometer opti-cal system, and to enable external computer data transfer and the printer.
5.4.6.1.1 System/Hardware/OpticalThis menu item is used to setup the analytical program of your instrument. It allows you to de-fine elements and wavelengths. A total of 512 are available.
The Matrix column shows the elements and wave-lengths selected for your analytical program and the Available column are those available but not selected. The Limits column is used to set the “Clean Limit” for fuel applications and does not apply to used oil analysis applications.
5.4.6.1.2 System/Hardware/ComputerThis menu option does not result in a dialog. When selected, a check mark appears to the left of the word “Computer”. A check mark next to the word “Computer” indicates that some form of data exchange and/or archive to a file is capable. Without “Computer” active (no check mark) there can be no archive of data to the hard drive or external transmission of data. Once “Computer” is active (with a check mark) how the data gets handled is determined by the remote computer menu selection and the systems parameters menu selection both of which are under the system pull down menu. Deselecting or making this menu option inactive will automatically disregard any settings in these system parameters and remote computer menu options.
5.4.6.1.3 System/Hardware/PrinterThis menu option does not result in a dialog. When selected, a check mark appears to the left of the word “Printer”. A check mark next to the word “Printer” indicates that some form of data exchange to a local printer is capable. Without “Printer” active (no check mark) there can be no transmission of data to LPT1 port on the left side of the spectrometer.
5.4.6.2 System/System ParametersThis menu provides a dialog of selectable param-eters that are customized to each instrument, Fig-ure 5-22. These parameters are for the most part factory settings, but are operator accessible in the event additional features are desired or required. The first parameter is the date format. This field allows the operator to determine the order that the day, month, and year will appear on the screen, printout, and stored when archived. The second field is the instrument serial number and this should never change. The third and fourth parameters the voltage and frequency settings but are disabled for this application.
The remaining check boxes are for a variety of system control features and parameters. A check mark in the box next to the parameter indicates that this parameter has been selected. Display system burn counter is an alternative to the standard, which is to always display the user burn counter. The system burn counter cannot
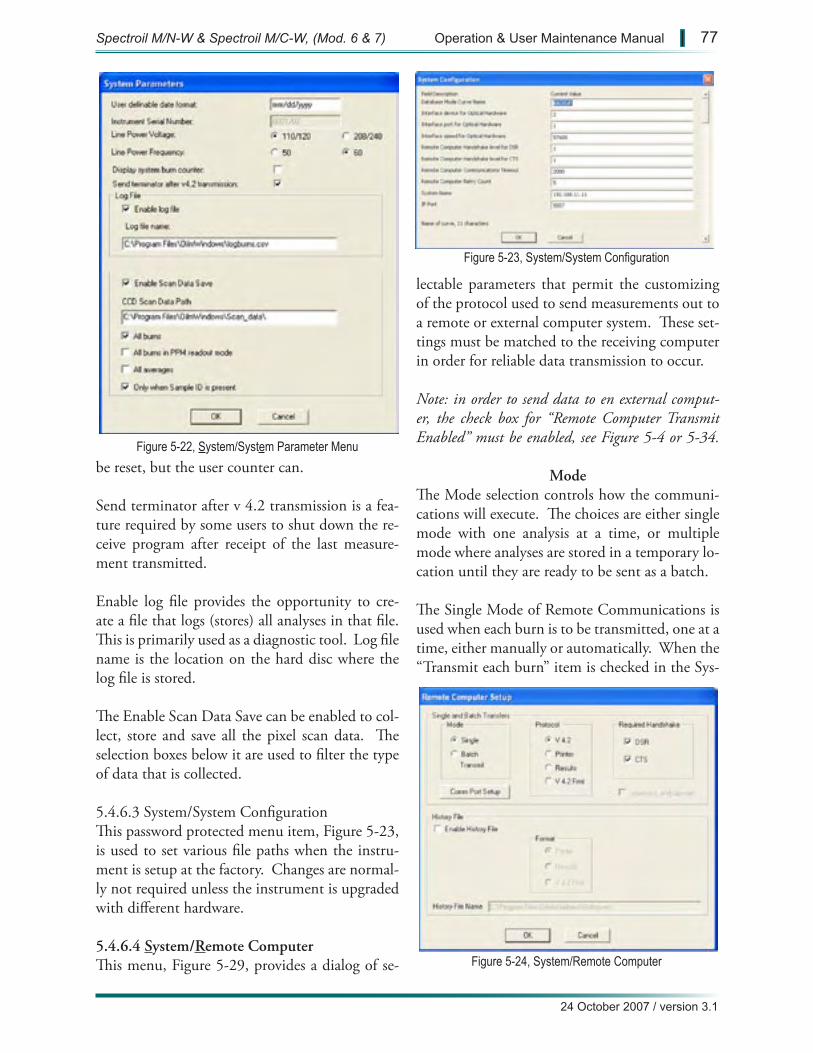
Figure 5-23, System/System Configuration
Figure 5-24, System/Remote Computer
Figure 5-22, System/System Parameter Menu
24 October 2007 / version 3.1
Spectroil M/N-W & Spectroil M/C-W, (Mod. 6 & 7) Operation & User Maintenance Manual | 77
be reset, but the user counter can.
Send terminator after v 4.2 transmission is a fea-ture required by some users to shut down the re-ceive program after receipt of the last measure-ment transmitted.
Enable log file provides the opportunity to cre-ate a file that logs (stores) all analyses in that file. This is primarily used as a diagnostic tool. Log file name is the location on the hard disc where the log file is stored.
The Enable Scan Data Save can be enabled to col-lect, store and save all the pixel scan data. The selection boxes below it are used to filter the type of data that is collected.
5.4.6.3 System/System ConfigurationThis password protected menu item, Figure 5-23, is used to set various file paths when the instru-ment is setup at the factory. Changes are normal-ly not required unless the instrument is upgraded with different hardware.
5.4.6.4 System/Remote ComputerThis menu, Figure 5-29, provides a dialog of se-
lectable parameters that permit the customizing of the protocol used to send measurements out to a remote or external computer system. These set-tings must be matched to the receiving computer in order for reliable data transmission to occur.
Note: in order to send data to en external comput-er, the check box for “Remote Computer Transmit Enabled” must be enabled, see Figure 5-4 or 5-34.
ModeThe Mode selection controls how the communi-cations will execute. The choices are either single mode with one analysis at a time, or multiple mode where analyses are stored in a temporary lo-cation until they are ready to be sent as a batch.
The Single Mode of Remote Communications is used when each burn is to be transmitted, one at a time, either manually or automatically. When the “Transmit each burn” item is checked in the Sys-
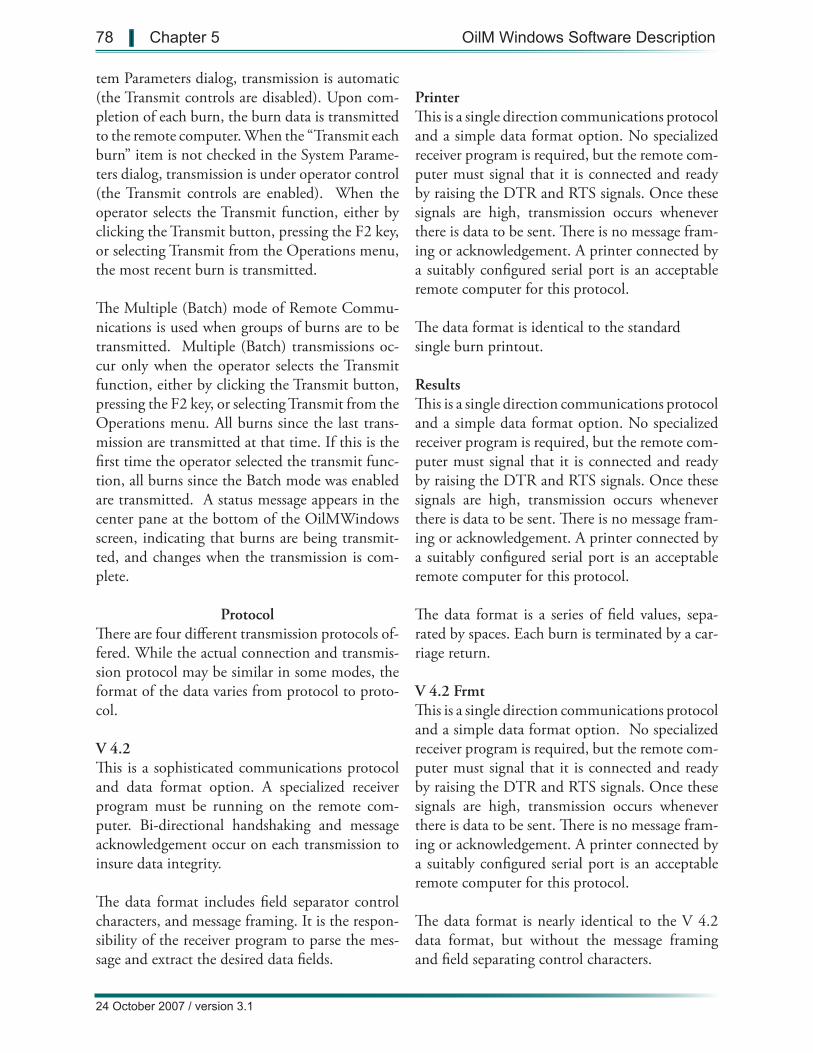
78 | Chapter 5 OilM Windows Software Description
24 October 2007 / version 3.1
tem Parameters dialog, transmission is automatic (the Transmit controls are disabled). Upon com-pletion of each burn, the burn data is transmitted to the remote computer. When the “Transmit each burn” item is not checked in the System Parame-ters dialog, transmission is under operator control (the Transmit controls are enabled). When the operator selects the Transmit function, either by clicking the Transmit button, pressing the F2 key, or selecting Transmit from the Operations menu, the most recent burn is transmitted.
The Multiple (Batch) mode of Remote Commu-nications is used when groups of burns are to be transmitted. Multiple (Batch) transmissions oc-cur only when the operator selects the Transmit function, either by clicking the Transmit button, pressing the F2 key, or selecting Transmit from the Operations menu. All burns since the last trans-mission are transmitted at that time. If this is the first time the operator selected the transmit func-tion, all burns since the Batch mode was enabled are transmitted. A status message appears in the center pane at the bottom of the OilMWindows screen, indicating that burns are being transmit-ted, and changes when the transmission is com-plete.
ProtocolThere are four different transmission protocols of-fered. While the actual connection and transmis-sion protocol may be similar in some modes, the format of the data varies from protocol to proto-col.
V 4.2This is a sophisticated communications protocol and data format option. A specialized receiver program must be running on the remote com-puter. Bi-directional handshaking and message acknowledgement occur on each transmission to insure data integrity.
The data format includes field separator control characters, and message framing. It is the respon-sibility of the receiver program to parse the mes-sage and extract the desired data fields.
PrinterThis is a single direction communications protocol and a simple data format option. No specialized receiver program is required, but the remote com-puter must signal that it is connected and ready by raising the DTR and RTS signals. Once these signals are high, transmission occurs whenever there is data to be sent. There is no message fram-ing or acknowledgement. A printer connected by a suitably configured serial port is an acceptable remote computer for this protocol.
The data format is identical to the standard single burn printout.
ResultsThis is a single direction communications protocol and a simple data format option. No specialized receiver program is required, but the remote com-puter must signal that it is connected and ready by raising the DTR and RTS signals. Once these signals are high, transmission occurs whenever there is data to be sent. There is no message fram-ing or acknowledgement. A printer connected by a suitably configured serial port is an acceptable remote computer for this protocol.
The data format is a series of field values, sepa-rated by spaces. Each burn is terminated by a car-riage return.
V 4.2 FrmtThis is a single direction communications protocol and a simple data format option. No specialized receiver program is required, but the remote com-puter must signal that it is connected and ready by raising the DTR and RTS signals. Once these signals are high, transmission occurs whenever there is data to be sent. There is no message fram-ing or acknowledgement. A printer connected by a suitably configured serial port is an acceptable remote computer for this protocol.
The data format is nearly identical to the V 4.2 data format, but without the message framing and field separating control characters.
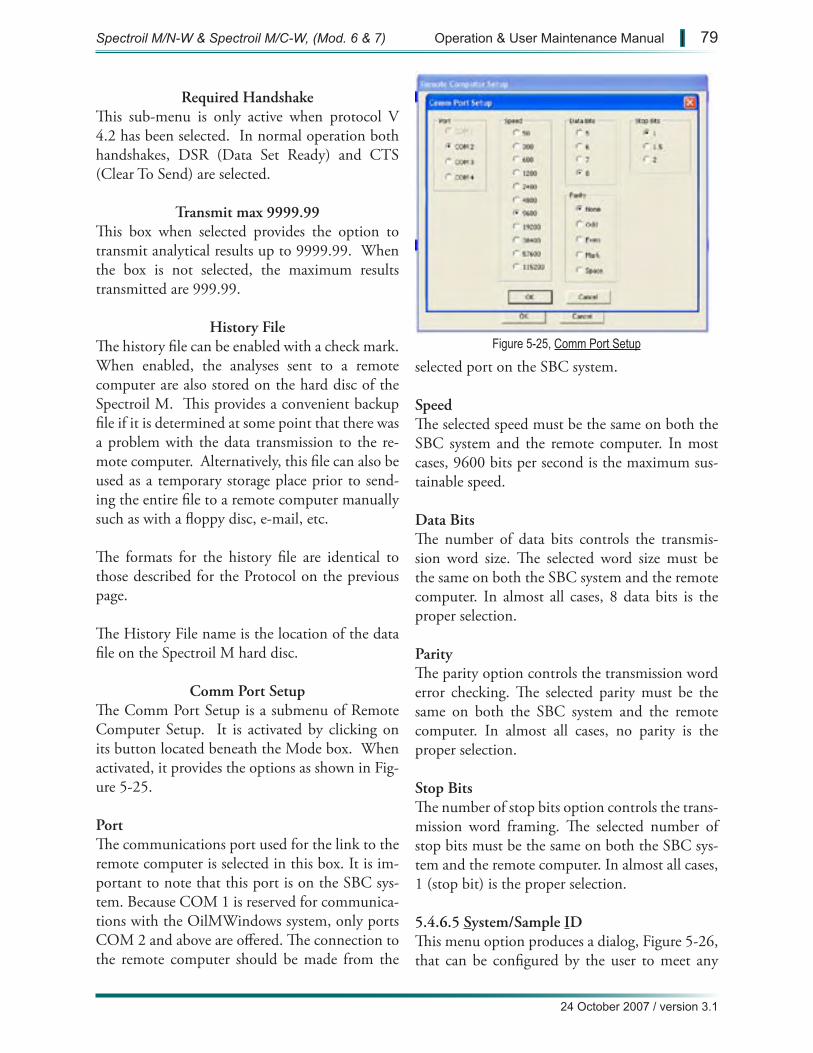
Figure 5-25, Comm Port Setup
24 October 2007 / version 3.1
Spectroil M/N-W & Spectroil M/C-W, (Mod. 6 & 7) Operation & User Maintenance Manual | 79
Required HandshakeThis sub-menu is only active when protocol V 4.2 has been selected. In normal operation both handshakes, DSR (Data Set Ready) and CTS (Clear To Send) are selected.
Transmit max 9999.99This box when selected provides the option to transmit analytical results up to 9999.99. When the box is not selected, the maximum results transmitted are 999.99.
History FileThe history file can be enabled with a check mark. When enabled, the analyses sent to a remote computer are also stored on the hard disc of the Spectroil M. This provides a convenient backup file if it is determined at some point that there was a problem with the data transmission to the re-mote computer. Alternatively, this file can also be used as a temporary storage place prior to send-ing the entire file to a remote computer manually such as with a floppy disc, e-mail, etc.
The formats for the history file are identical to those described for the Protocol on the previous page.
The History File name is the location of the data file on the Spectroil M hard disc.
Comm Port SetupThe Comm Port Setup is a submenu of Remote Computer Setup. It is activated by clicking on its button located beneath the Mode box. When activated, it provides the options as shown in Fig-ure 5-25.
PortThe communications port used for the link to the remote computer is selected in this box. It is im-portant to note that this port is on the SBC sys-tem. Because COM 1 is reserved for communica-tions with the OilMWindows system, only ports COM 2 and above are offered. The connection to the remote computer should be made from the
selected port on the SBC system.
SpeedThe selected speed must be the same on both the SBC system and the remote computer. In most cases, 9600 bits per second is the maximum sus-tainable speed.
Data BitsThe number of data bits controls the transmis-sion word size. The selected word size must be the same on both the SBC system and the remote computer. In almost all cases, 8 data bits is the proper selection.
ParityThe parity option controls the transmission word error checking. The selected parity must be the same on both the SBC system and the remote computer. In almost all cases, no parity is the proper selection.
Stop BitsThe number of stop bits option controls the trans-mission word framing. The selected number of stop bits must be the same on both the SBC sys-tem and the remote computer. In almost all cases, 1 (stop bit) is the proper selection.
5.4.6.5 System/Sample IDThis menu option produces a dialog, Figure 5-26, that can be configured by the user to meet any
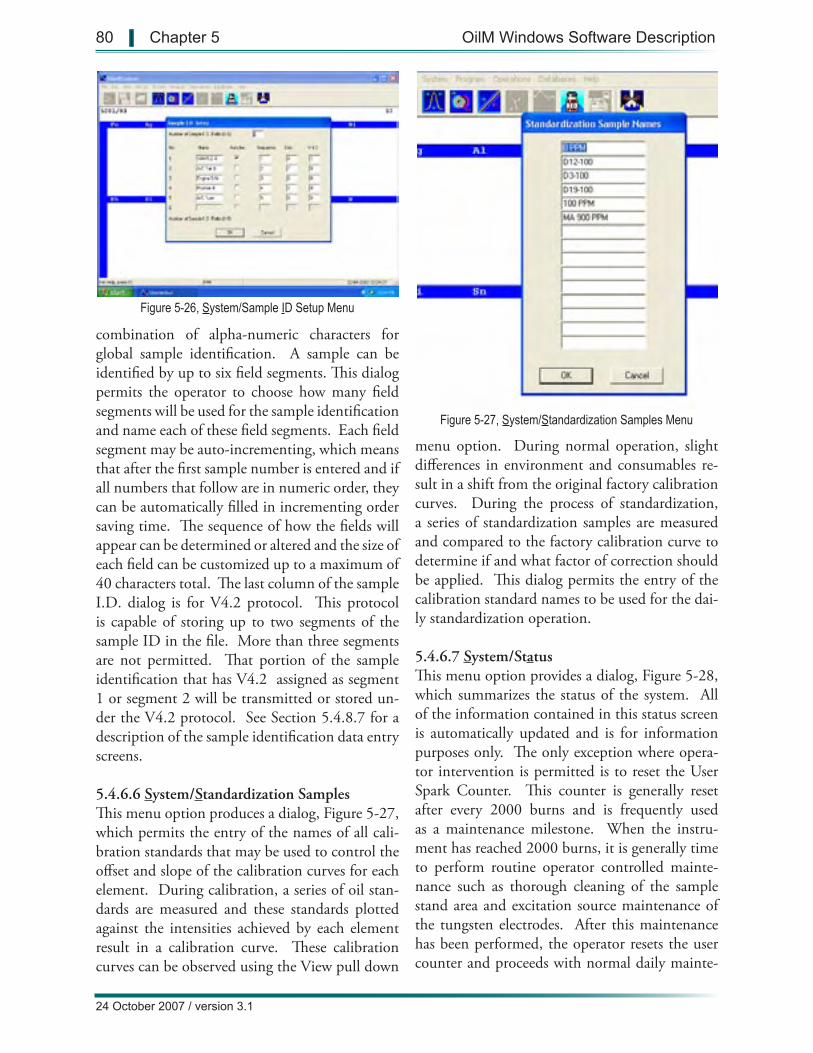
Figure 5-27, System/Standardization Samples Menu
Figure 5-26, System/Sample ID Setup Menu
80 | Chapter 5 OilM Windows Software Description
24 October 2007 / version 3.1
combination of alpha-numeric characters for global sample identification. A sample can be identified by up to six field segments. This dialog permits the operator to choose how many field segments will be used for the sample identification and name each of these field segments. Each field segment may be auto-incrementing, which means that after the first sample number is entered and if all numbers that follow are in numeric order, they can be automatically filled in incrementing order saving time. The sequence of how the fields will appear can be determined or altered and the size of each field can be customized up to a maximum of 40 characters total. The last column of the sample I.D. dialog is for V4.2 protocol. This protocol is capable of storing up to two segments of the sample ID in the file. More than three segments are not permitted. That portion of the sample identification that has V4.2 assigned as segment 1 or segment 2 will be transmitted or stored un-der the V4.2 protocol. See Section 5.4.8.7 for a description of the sample identification data entry screens.
5.4.6.6 System/Standardization SamplesThis menu option produces a dialog, Figure 5-27, which permits the entry of the names of all cali-bration standards that may be used to control the offset and slope of the calibration curves for each element. During calibration, a series of oil stan-dards are measured and these standards plotted against the intensities achieved by each element result in a calibration curve. These calibration curves can be observed using the View pull down
menu option. During normal operation, slight differences in environment and consumables re-sult in a shift from the original factory calibration curves. During the process of standardization, a series of standardization samples are measured and compared to the factory calibration curve to determine if and what factor of correction should be applied. This dialog permits the entry of the calibration standard names to be used for the dai-ly standardization operation.
5.4.6.7 System/StatusThis menu option provides a dialog, Figure 5-28, which summarizes the status of the system. All of the information contained in this status screen is automatically updated and is for information purposes only. The only exception where opera-tor intervention is permitted is to reset the User Spark Counter. This counter is generally reset after every 2000 burns and is frequently used as a maintenance milestone. When the instru-ment has reached 2000 burns, it is generally time to perform routine operator controlled mainte-nance such as thorough cleaning of the sample stand area and excitation source maintenance of the tungsten electrodes. After this maintenance has been performed, the operator resets the user counter and proceeds with normal daily mainte-
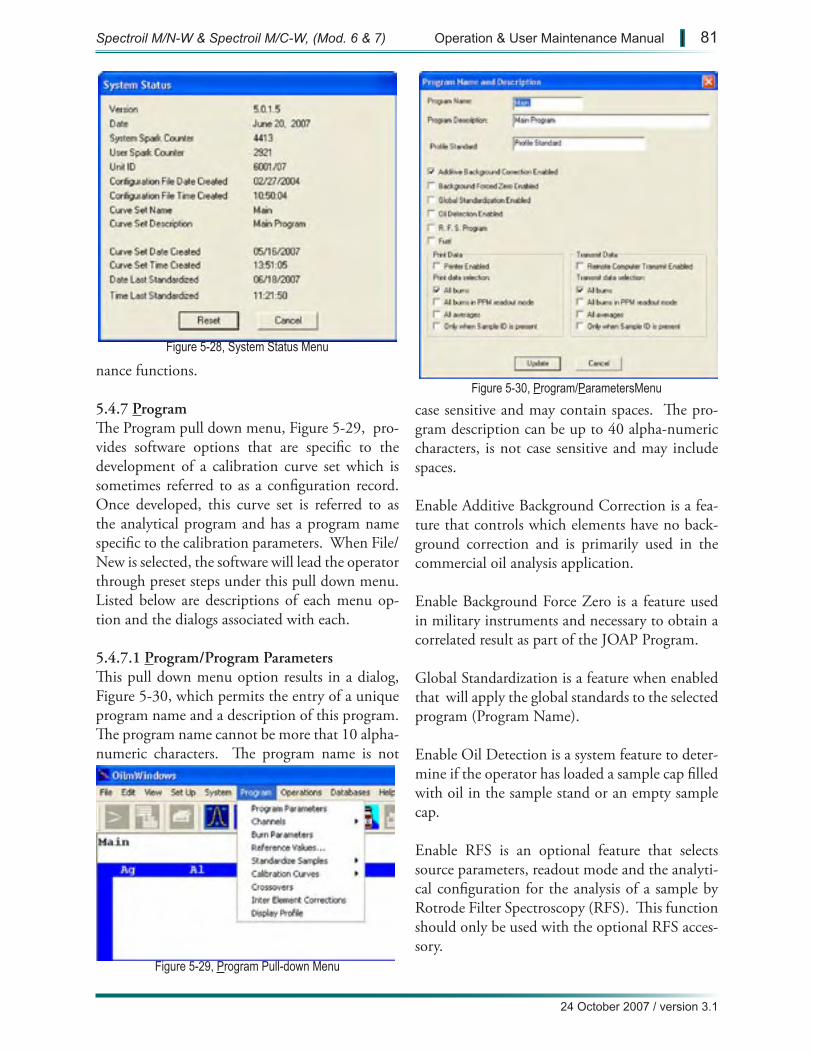
Figure 5-28, System Status Menu
Figure 5-29, Program Pull-down Menu
Figure 5-30, Program/ParametersMenu
24 October 2007 / version 3.1
Spectroil M/N-W & Spectroil M/C-W, (Mod. 6 & 7) Operation & User Maintenance Manual | 81
nance functions.
5.4.7 ProgramThe Program pull down menu, Figure 5-29, pro-vides software options that are specific to the development of a calibration curve set which is sometimes referred to as a configuration record. Once developed, this curve set is referred to as the analytical program and has a program name specific to the calibration parameters. When File/New is selected, the software will lead the operator through preset steps under this pull down menu. Listed below are descriptions of each menu op-tion and the dialogs associated with each.
5.4.7.1 Program/Program ParametersThis pull down menu option results in a dialog, Figure 5-30, which permits the entry of a unique program name and a description of this program. The program name cannot be more that 10 alpha-numeric characters. The program name is not
case sensitive and may contain spaces. The pro-gram description can be up to 40 alpha-numeric characters, is not case sensitive and may include spaces.
Enable Additive Background Correction is a fea-ture that controls which elements have no back-ground correction and is primarily used in the commercial oil analysis application.
Enable Background Force Zero is a feature used in military instruments and necessary to obtain a correlated result as part of the JOAP Program.
Global Standardization is a feature when enabled that will apply the global standards to the selected program (Program Name).
Enable Oil Detection is a system feature to deter-mine if the operator has loaded a sample cap filled with oil in the sample stand or an empty sample cap.
Enable RFS is an optional feature that selects source parameters, readout mode and the analyti-cal configuration for the analysis of a sample by Rotrode Filter Spectroscopy (RFS). This function should only be used with the optional RFS acces-sory.
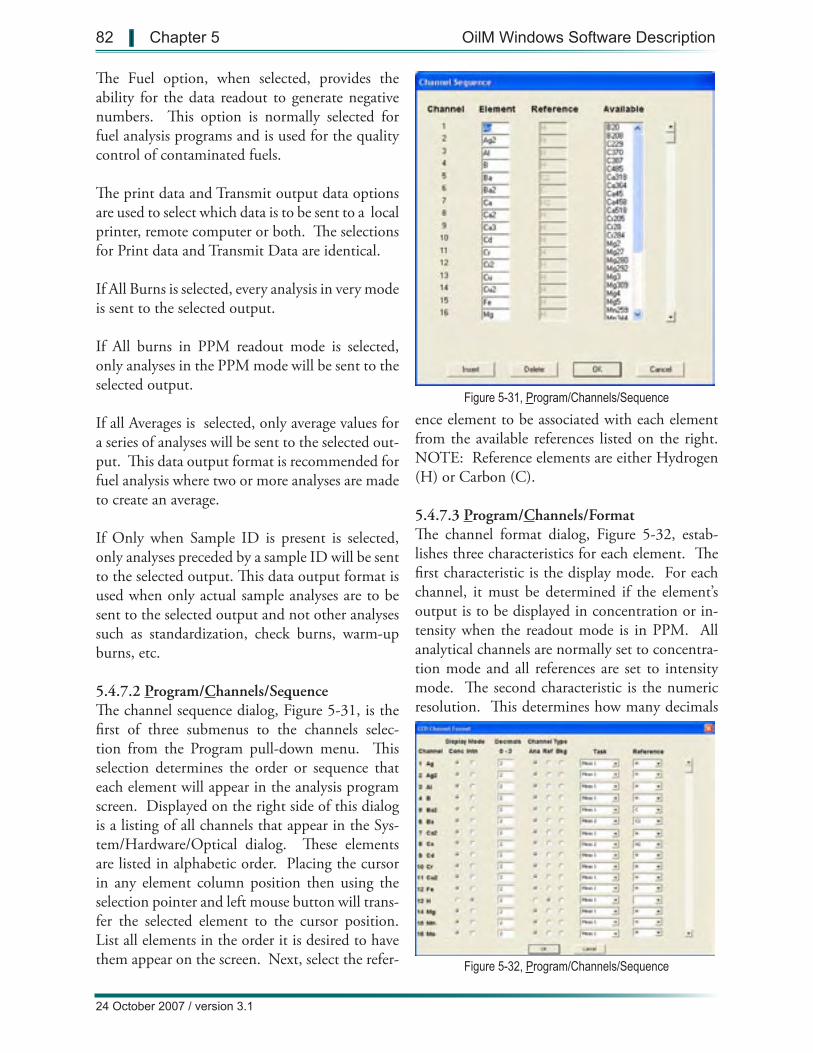
Figure 5-31, Program/Channels/Sequence
Figure 5-32, Program/Channels/Sequence
82 | Chapter 5 OilM Windows Software Description
24 October 2007 / version 3.1
The Fuel option, when selected, provides the ability for the data readout to generate negative numbers. This option is normally selected for fuel analysis programs and is used for the quality control of contaminated fuels.
The print data and Transmit output data options are used to select which data is to be sent to a local printer, remote computer or both. The selections for Print data and Transmit Data are identical.
If All Burns is selected, every analysis in very mode is sent to the selected output.
If All burns in PPM readout mode is selected, only analyses in the PPM mode will be sent to the selected output.
If all Averages is selected, only average values for a series of analyses will be sent to the selected out-put. This data output format is recommended for fuel analysis where two or more analyses are made to create an average.
If Only when Sample ID is present is selected, only analyses preceded by a sample ID will be sent to the selected output. This data output format is used when only actual sample analyses are to be sent to the selected output and not other analyses such as standardization, check burns, warm-up burns, etc.
5.4.7.2 Program/Channels/SequenceThe channel sequence dialog, Figure 5-31, is the first of three submenus to the channels selec-tion from the Program pull-down menu. This selection determines the order or sequence that each element will appear in the analysis program screen. Displayed on the right side of this dialog is a listing of all channels that appear in the Sys-tem/Hardware/Optical dialog. These elements are listed in alphabetic order. Placing the cursor in any element column position then using the selection pointer and left mouse button will trans-fer the selected element to the cursor position. List all elements in the order it is desired to have them appear on the screen. Next, select the refer-
ence element to be associated with each element from the available references listed on the right. NOTE: Reference elements are either Hydrogen (H) or Carbon (C).
5.4.7.3 Program/Channels/FormatThe channel format dialog, Figure 5-32, estab-lishes three characteristics for each element. The first characteristic is the display mode. For each channel, it must be determined if the element’s output is to be displayed in concentration or in-tensity when the readout mode is in PPM. All analytical channels are normally set to concentra-tion mode and all references are set to intensity mode. The second characteristic is the numeric resolution. This determines how many decimals
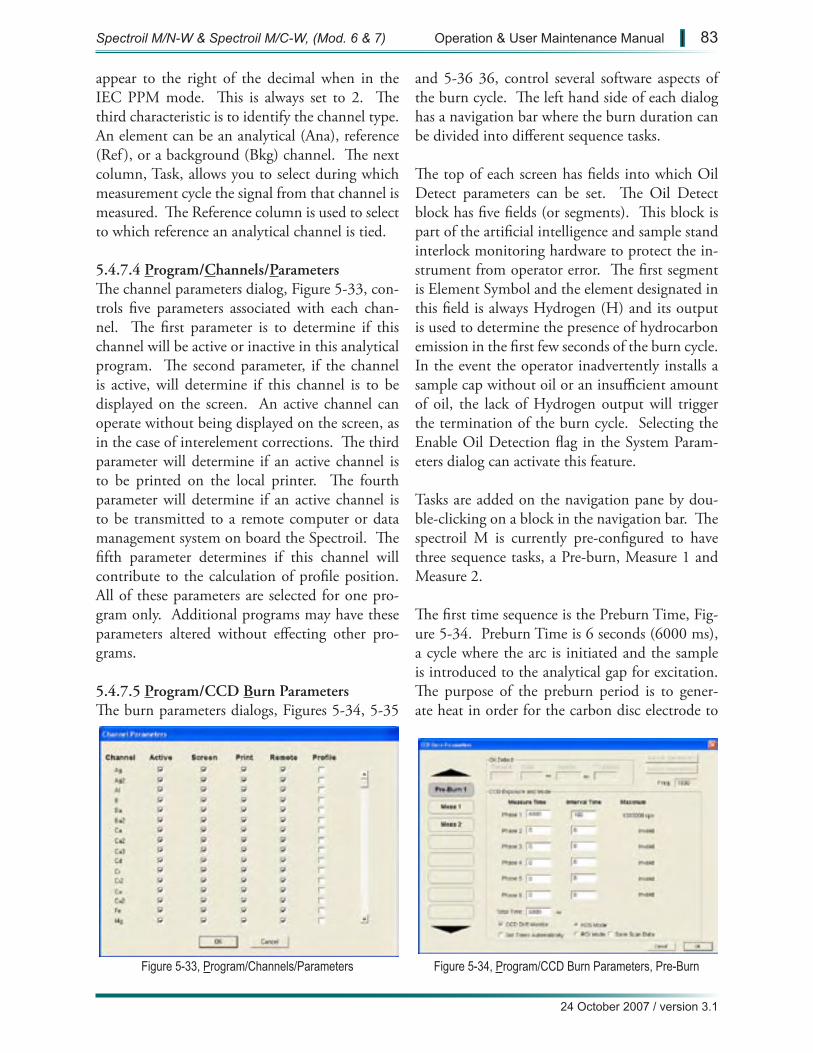
Figure 5-33, Program/Channels/Parameters Figure 5-34, Program/CCD Burn Parameters, Pre-Burn
24 October 2007 / version 3.1
Spectroil M/N-W & Spectroil M/C-W, (Mod. 6 & 7) Operation & User Maintenance Manual | 83
appear to the right of the decimal when in the IEC PPM mode. This is always set to 2. The third characteristic is to identify the channel type. An element can be an analytical (Ana), reference (Ref ), or a background (Bkg) channel. The next column, Task, allows you to select during which measurement cycle the signal from that channel is measured. The Reference column is used to select to which reference an analytical channel is tied.
5.4.7.4 Program/Channels/ParametersThe channel parameters dialog, Figure 5-33, con-trols five parameters associated with each chan-nel. The first parameter is to determine if this channel will be active or inactive in this analytical program. The second parameter, if the channel is active, will determine if this channel is to be displayed on the screen. An active channel can operate without being displayed on the screen, as in the case of interelement corrections. The third parameter will determine if an active channel is to be printed on the local printer. The fourth parameter will determine if an active channel is to be transmitted to a remote computer or data management system on board the Spectroil. The fifth parameter determines if this channel will contribute to the calculation of profile position. All of these parameters are selected for one pro-gram only. Additional programs may have these parameters altered without effecting other pro-grams.
5.4.7.5 Program/CCD Burn ParametersThe burn parameters dialogs, Figures 5-34, 5-35
and 5-36 36, control several software aspects of the burn cycle. The left hand side of each dialog has a navigation bar where the burn duration can be divided into different sequence tasks.
The top of each screen has fields into which Oil Detect parameters can be set. The Oil Detect block has five fields (or segments). This block is part of the artificial intelligence and sample stand interlock monitoring hardware to protect the in-strument from operator error. The first segment is Element Symbol and the element designated in this field is always Hydrogen (H) and its output is used to determine the presence of hydrocarbon emission in the first few seconds of the burn cycle. In the event the operator inadvertently installs a sample cap without oil or an insufficient amount of oil, the lack of Hydrogen output will trigger the termination of the burn cycle. Selecting the Enable Oil Detection flag in the System Param-eters dialog can activate this feature.
Tasks are added on the navigation pane by dou-ble-clicking on a block in the navigation bar. The spectroil M is currently pre-configured to have three sequence tasks, a Pre-burn, Measure 1 and Measure 2.
The first time sequence is the Preburn Time, Fig-ure 5-34. Preburn Time is 6 seconds (6000 ms), a cycle where the arc is initiated and the sample is introduced to the analytical gap for excitation. The purpose of the preburn period is to gener-ate heat in order for the carbon disc electrode to
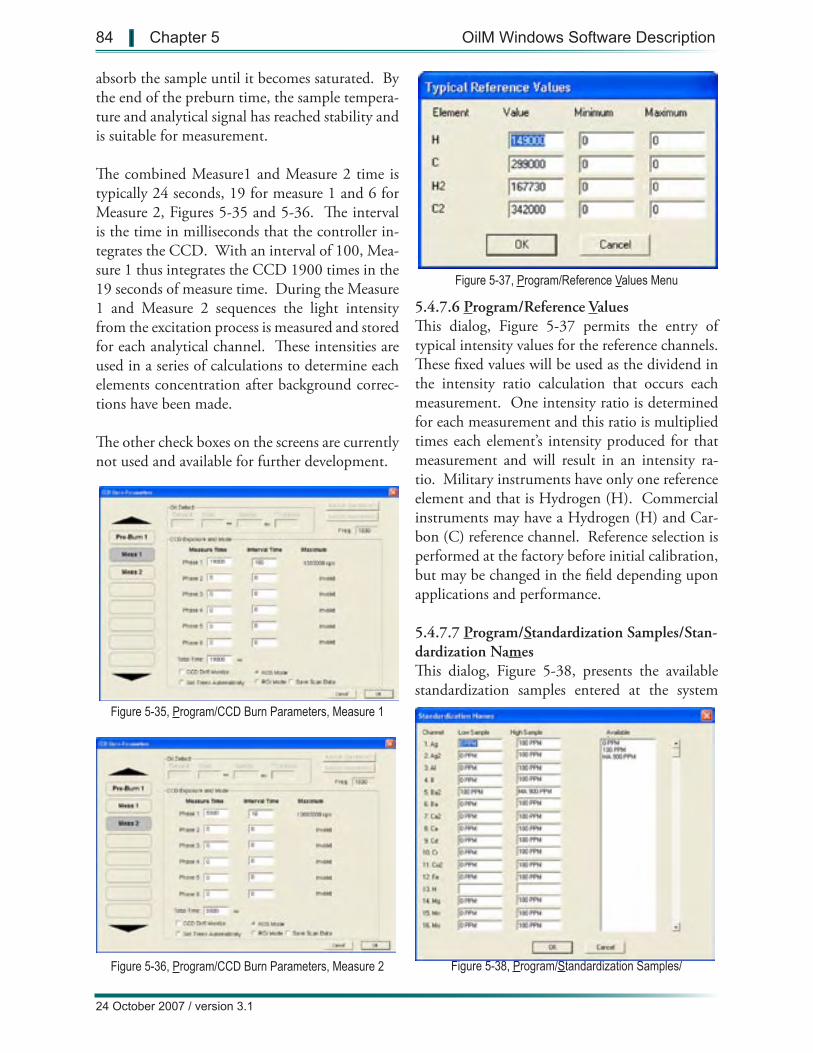
Figure 5-36, Program/CCD Burn Parameters, Measure 2
Figure 5-35, Program/CCD Burn Parameters, Measure 1
Figure 5-37, Program/Reference Values Menu
Figure 5-38, Program/Standardization Samples/
84 | Chapter 5 OilM Windows Software Description
24 October 2007 / version 3.1
absorb the sample until it becomes saturated. By the end of the preburn time, the sample tempera-ture and analytical signal has reached stability and is suitable for measurement.
The combined Measure1 and Measure 2 time is typically 24 seconds, 19 for measure 1 and 6 for Measure 2, Figures 5-35 and 5-36. The interval is the time in milliseconds that the controller in-tegrates the CCD. With an interval of 100, Mea-sure 1 thus integrates the CCD 1900 times in the 19 seconds of measure time. During the Measure 1 and Measure 2 sequences the light intensity from the excitation process is measured and stored for each analytical channel. These intensities are used in a series of calculations to determine each elements concentration after background correc-tions have been made.
The other check boxes on the screens are currently not used and available for further development.
5.4.7.6 Program/Reference ValuesThis dialog, Figure 5-37 permits the entry of typical intensity values for the reference channels. These fixed values will be used as the dividend in the intensity ratio calculation that occurs each measurement. One intensity ratio is determined for each measurement and this ratio is multiplied times each element’s intensity produced for that measurement and will result in an intensity ra-tio. Military instruments have only one reference element and that is Hydrogen (H). Commercial instruments may have a Hydrogen (H) and Car-bon (C) reference channel. Reference selection is performed at the factory before initial calibration, but may be changed in the field depending upon applications and performance.
5.4.7.7 Program/Standardization Samples/Stan-dardization NamesThis dialog, Figure 5-38, presents the available standardization samples entered at the system
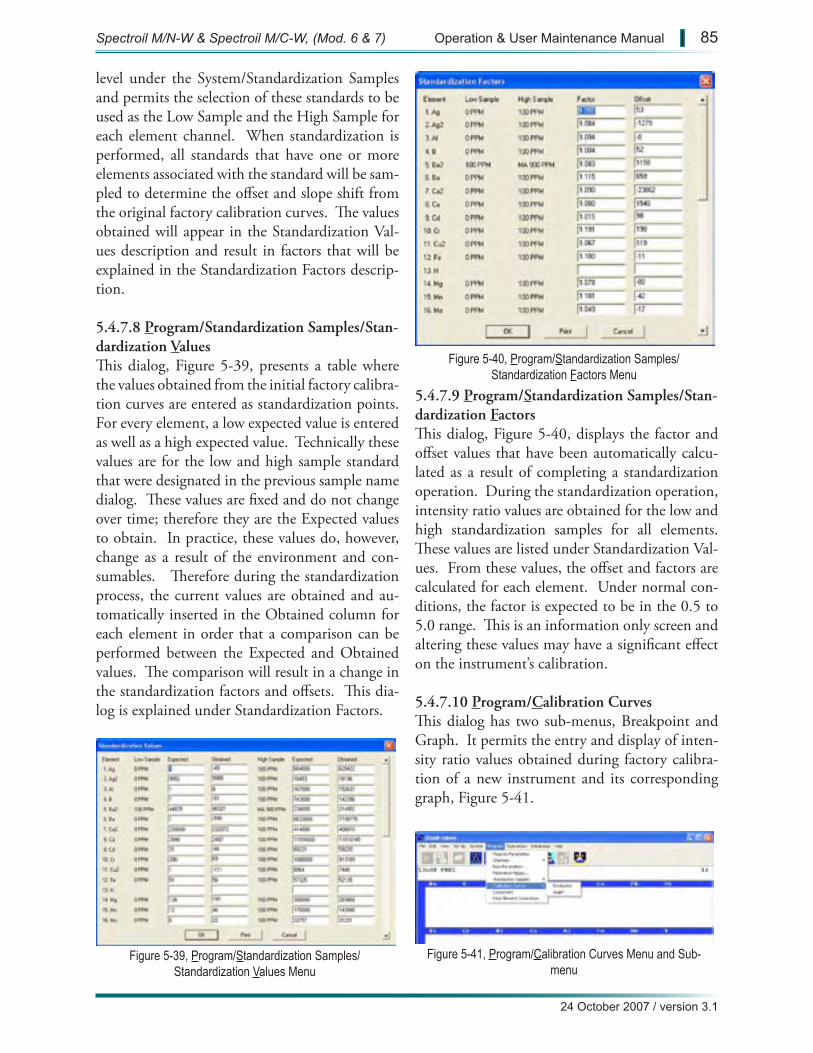
Figure 5-39, Program/Standardization Samples/Standardization Values Menu
Figure 5-40, Program/Standardization Samples/Standardization Factors Menu
Figure 5-41, Program/Calibration Curves Menu and Sub-menu
24 October 2007 / version 3.1
Spectroil M/N-W & Spectroil M/C-W, (Mod. 6 & 7) Operation & User Maintenance Manual | 85
level under the System/Standardization Samples and permits the selection of these standards to be used as the Low Sample and the High Sample for each element channel. When standardization is performed, all standards that have one or more elements associated with the standard will be sam-pled to determine the offset and slope shift from the original factory calibration curves. The values obtained will appear in the Standardization Val-ues description and result in factors that will be explained in the Standardization Factors descrip-tion.
5.4.7.8 Program/Standardization Samples/Stan-dardization ValuesThis dialog, Figure 5-39, presents a table where the values obtained from the initial factory calibra-tion curves are entered as standardization points. For every element, a low expected value is entered as well as a high expected value. Technically these values are for the low and high sample standard that were designated in the previous sample name dialog. These values are fixed and do not change over time; therefore they are the Expected values to obtain. In practice, these values do, however, change as a result of the environment and con-sumables. Therefore during the standardization process, the current values are obtained and au-tomatically inserted in the Obtained column for each element in order that a comparison can be performed between the Expected and Obtained values. The comparison will result in a change in the standardization factors and offsets. This dia-log is explained under Standardization Factors.
5.4.7.9 Program/Standardization Samples/Stan-dardization FactorsThis dialog, Figure 5-40, displays the factor and offset values that have been automatically calcu-lated as a result of completing a standardization operation. During the standardization operation, intensity ratio values are obtained for the low and high standardization samples for all elements. These values are listed under Standardization Val-ues. From these values, the offset and factors are calculated for each element. Under normal con-ditions, the factor is expected to be in the 0.5 to 5.0 range. This is an information only screen and altering these values may have a significant effect on the instrument’s calibration.
5.4.7.10 Program/Calibration CurvesThis dialog has two sub-menus, Breakpoint and Graph. It permits the entry and display of inten-sity ratio values obtained during factory calibra-tion of a new instrument and its corresponding graph, Figure 5-41.
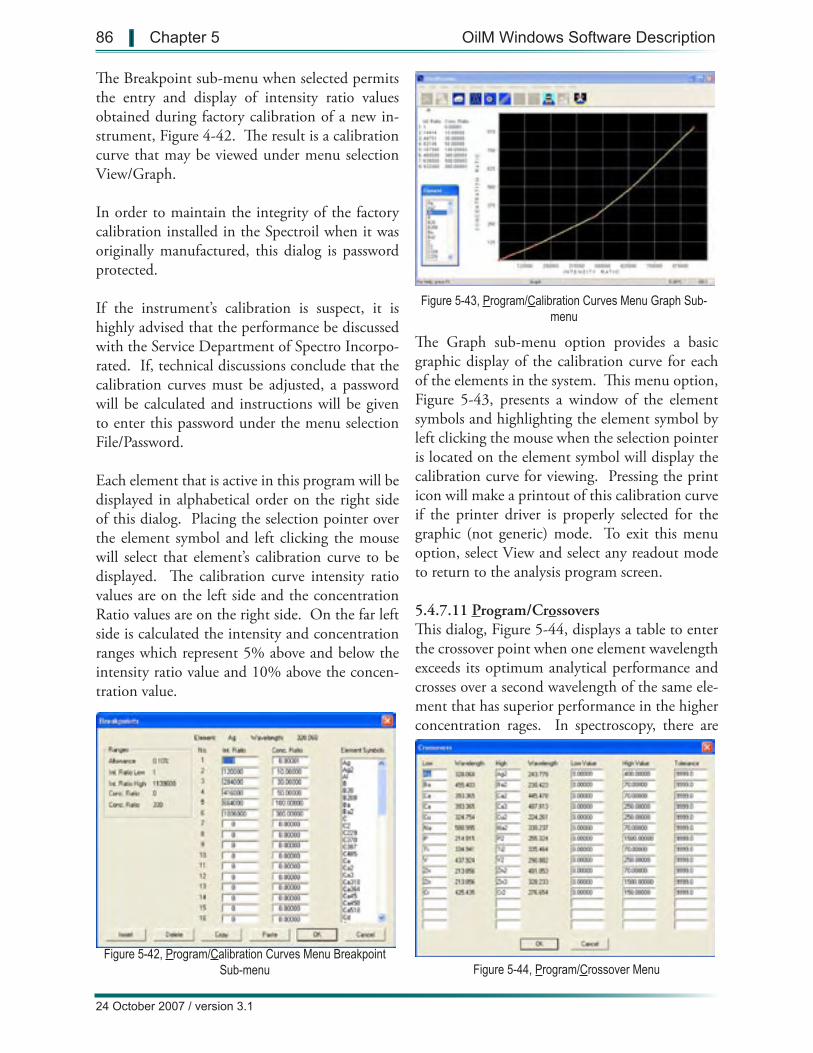
Figure 5-42, Program/Calibration Curves Menu Breakpoint Sub-menu
Figure 5-43, Program/Calibration Curves Menu Graph Sub-menu
Figure 5-44, Program/Crossover Menu
86 | Chapter 5 OilM Windows Software Description
24 October 2007 / version 3.1
The Breakpoint sub-menu when selected permits the entry and display of intensity ratio values obtained during factory calibration of a new in-strument, Figure 4-42. The result is a calibration curve that may be viewed under menu selection View/Graph.
In order to maintain the integrity of the factory calibration installed in the Spectroil when it was originally manufactured, this dialog is password protected.
If the instrument’s calibration is suspect, it is highly advised that the performance be discussed with the Service Department of Spectro Incorpo-rated. If, technical discussions conclude that the calibration curves must be adjusted, a password will be calculated and instructions will be given to enter this password under the menu selection File/Password.
Each element that is active in this program will be displayed in alphabetical order on the right side of this dialog. Placing the selection pointer over the element symbol and left clicking the mouse will select that element’s calibration curve to be displayed. The calibration curve intensity ratio values are on the left side and the concentration Ratio values are on the right side. On the far left side is calculated the intensity and concentration ranges which represent 5% above and below the intensity ratio value and 10% above the concen-tration value.
The Graph sub-menu option provides a basic graphic display of the calibration curve for each of the elements in the system. This menu option, Figure 5-43, presents a window of the element symbols and highlighting the element symbol by left clicking the mouse when the selection pointer is located on the element symbol will display the calibration curve for viewing. Pressing the print icon will make a printout of this calibration curve if the printer driver is properly selected for the graphic (not generic) mode. To exit this menu option, select View and select any readout mode to return to the analysis program screen.
5.4.7.11 Program/CrossoversThis dialog, Figure 5-44, displays a table to enter the crossover point when one element wavelength exceeds its optimum analytical performance and crosses over a second wavelength of the same ele-ment that has superior performance in the higher concentration rages. In spectroscopy, there are
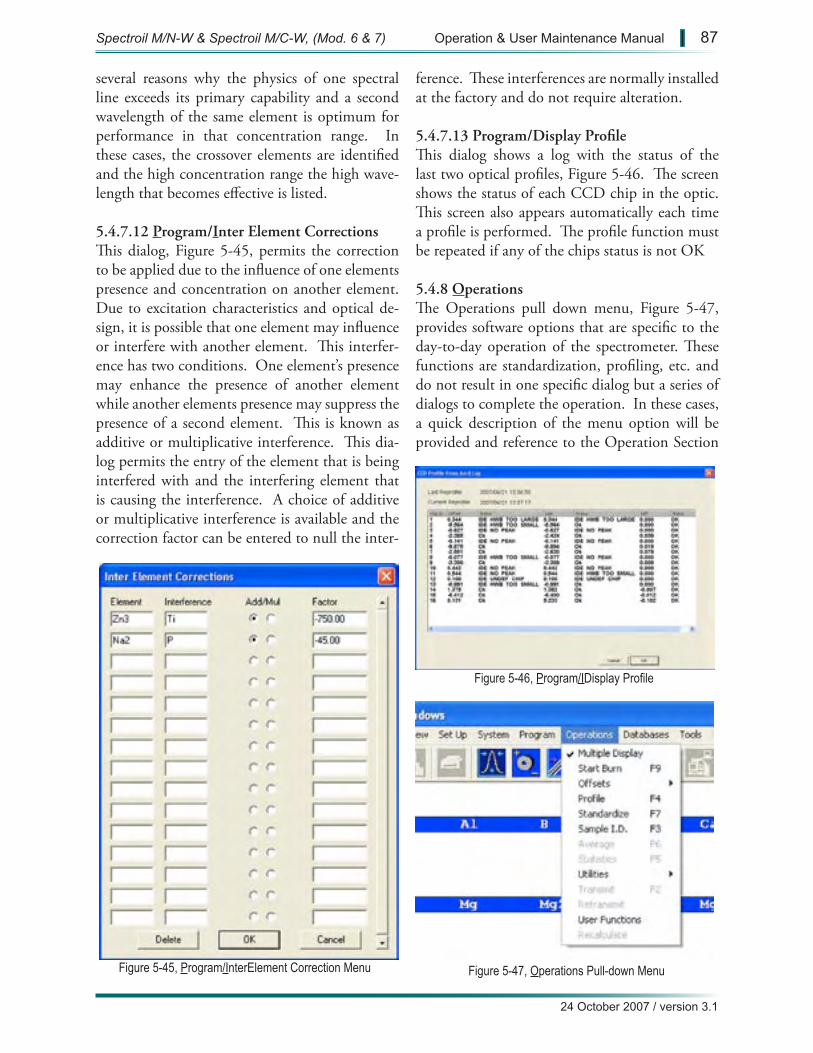
Figure 5-45, Program/InterElement Correction Menu
Figure 5-46, Program/IDisplay Profile
Figure 5-47, Operations Pull-down Menu
24 October 2007 / version 3.1
Spectroil M/N-W & Spectroil M/C-W, (Mod. 6 & 7) Operation & User Maintenance Manual | 87
several reasons why the physics of one spectral line exceeds its primary capability and a second wavelength of the same element is optimum for performance in that concentration range. In these cases, the crossover elements are identified and the high concentration range the high wave-length that becomes effective is listed.
5.4.7.12 Program/Inter Element CorrectionsThis dialog, Figure 5-45, permits the correction to be applied due to the influence of one elements presence and concentration on another element. Due to excitation characteristics and optical de-sign, it is possible that one element may influence or interfere with another element. This interfer-ence has two conditions. One element’s presence may enhance the presence of another element while another elements presence may suppress the presence of a second element. This is known as additive or multiplicative interference. This dia-log permits the entry of the element that is being interfered with and the interfering element that is causing the interference. A choice of additive or multiplicative interference is available and the correction factor can be entered to null the inter-
ference. These interferences are normally installed at the factory and do not require alteration.
5.4.7.13 Program/Display ProfileThis dialog shows a log with the status of the last two optical profiles, Figure 5-46. The screen shows the status of each CCD chip in the optic. This screen also appears automatically each time a profile is performed. The profile function must be repeated if any of the chips status is not OK
5.4.8 OperationsThe Operations pull down menu, Figure 5-47, provides software options that are specific to the day-to-day operation of the spectrometer. These functions are standardization, profiling, etc. and do not result in one specific dialog but a series of dialogs to complete the operation. In these cases, a quick description of the menu option will be provided and reference to the Operation Section
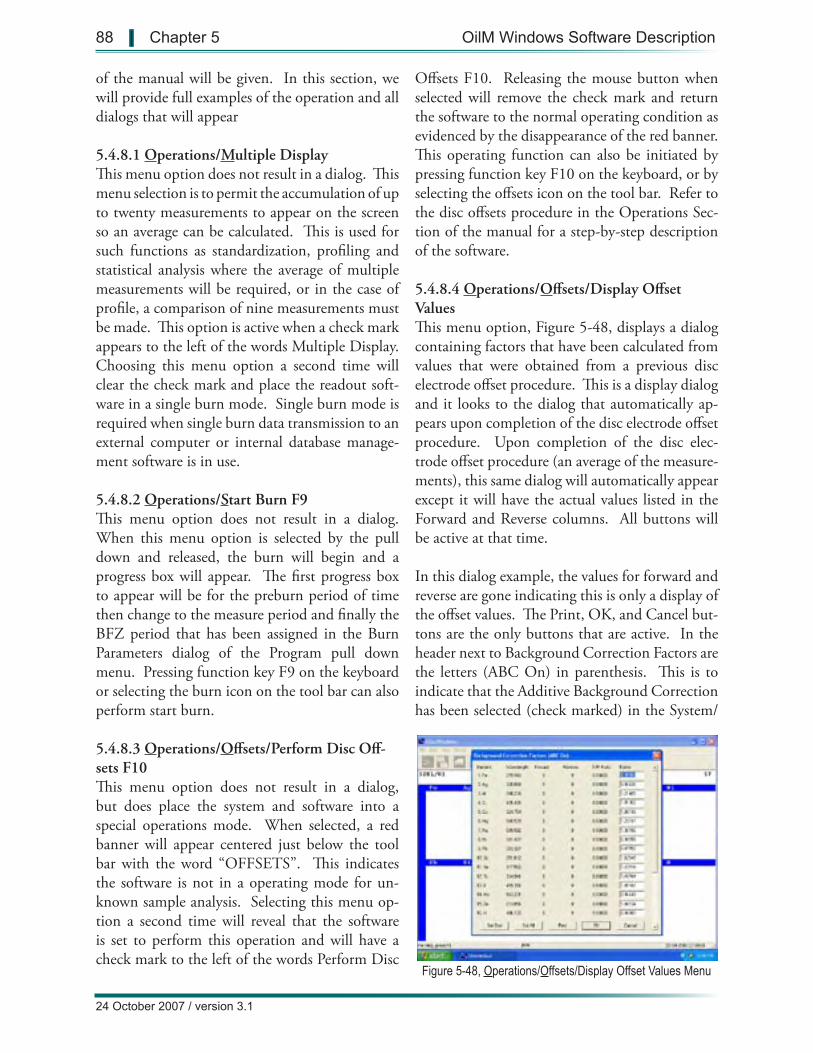
Figure 5-48, Operations/Offsets/Display Offset Values Menu
88 | Chapter 5 OilM Windows Software Description
24 October 2007 / version 3.1
Offsets F10. Releasing the mouse button when selected will remove the check mark and return the software to the normal operating condition as evidenced by the disappearance of the red banner. This operating function can also be initiated by pressing function key F10 on the keyboard, or by selecting the offsets icon on the tool bar. Refer to the disc offsets procedure in the Operations Sec-tion of the manual for a step-by-step description of the software.
5.4.8.4 Operations/Offsets/Display Offset ValuesThis menu option, Figure 5-48, displays a dialog containing factors that have been calculated from values that were obtained from a previous disc electrode offset procedure. This is a display dialog and it looks to the dialog that automatically ap-pears upon completion of the disc electrode offset procedure. Upon completion of the disc elec-trode offset procedure (an average of the measure-ments), this same dialog will automatically appear except it will have the actual values listed in the Forward and Reverse columns. All buttons will be active at that time.
In this dialog example, the values for forward and reverse are gone indicating this is only a display of the offset values. The Print, OK, and Cancel but-tons are the only buttons that are active. In the header next to Background Correction Factors are the letters (ABC On) in parenthesis. This is to indicate that the Additive Background Correction has been selected (check marked) in the System/
of the manual will be given. In this section, we will provide full examples of the operation and all dialogs that will appear
5.4.8.1 Operations/Multiple DisplayThis menu option does not result in a dialog. This menu selection is to permit the accumulation of up to twenty measurements to appear on the screen so an average can be calculated. This is used for such functions as standardization, profiling and statistical analysis where the average of multiple measurements will be required, or in the case of profile, a comparison of nine measurements must be made. This option is active when a check mark appears to the left of the words Multiple Display. Choosing this menu option a second time will clear the check mark and place the readout soft-ware in a single burn mode. Single burn mode is required when single burn data transmission to an external computer or internal database manage-ment software is in use.
5.4.8.2 Operations/Start Burn F9This menu option does not result in a dialog. When this menu option is selected by the pull down and released, the burn will begin and a progress box will appear. The first progress box to appear will be for the preburn period of time then change to the measure period and finally the BFZ period that has been assigned in the Burn Parameters dialog of the Program pull down menu. Pressing function key F9 on the keyboard or selecting the burn icon on the tool bar can also perform start burn.
5.4.8.3 Operations/Offsets/Perform Disc Off-sets F10This menu option does not result in a dialog, but does place the system and software into a special operations mode. When selected, a red banner will appear centered just below the tool bar with the word “OFFSETS”. This indicates the software is not in a operating mode for un-known sample analysis. Selecting this menu op-tion a second time will reveal that the software is set to perform this operation and will have a check mark to the left of the words Perform Disc
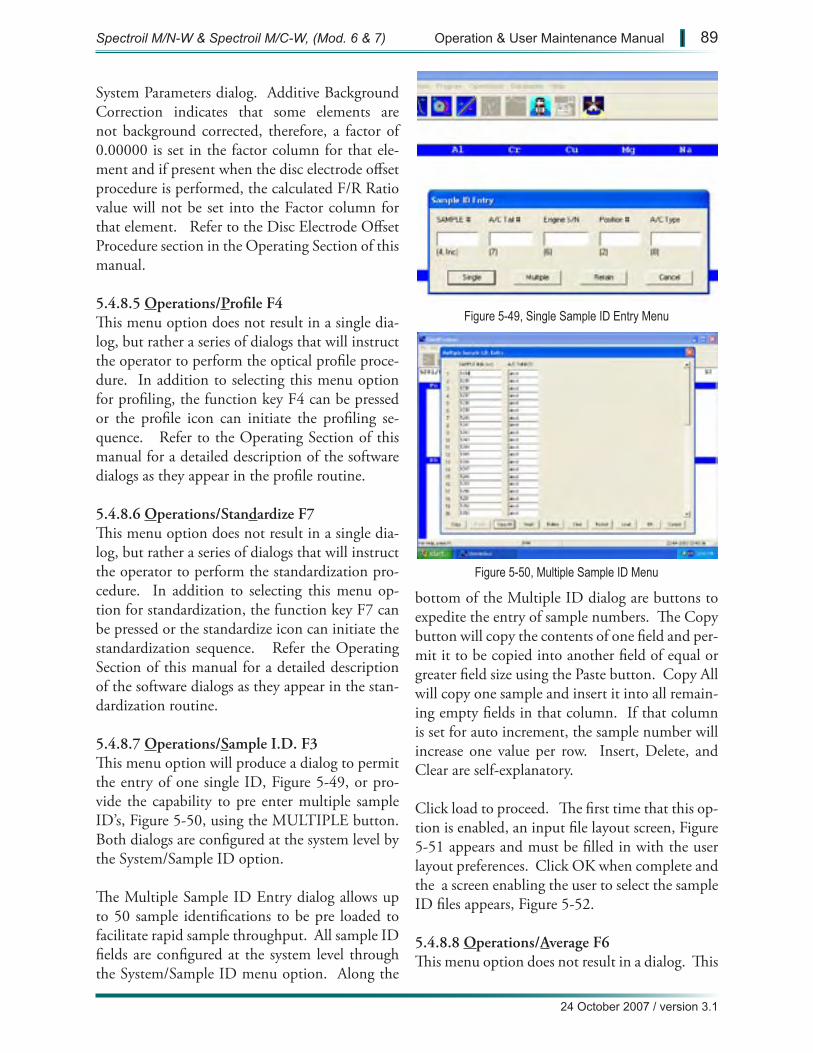
Figure 5-50, Multiple Sample ID Menu
Figure 5-49, Single Sample ID Entry Menu
24 October 2007 / version 3.1
Spectroil M/N-W & Spectroil M/C-W, (Mod. 6 & 7) Operation & User Maintenance Manual | 89
System Parameters dialog. Additive Background Correction indicates that some elements are not background corrected, therefore, a factor of 0.00000 is set in the factor column for that ele-ment and if present when the disc electrode offset procedure is performed, the calculated F/R Ratio value will not be set into the Factor column for that element. Refer to the Disc Electrode Offset Procedure section in the Operating Section of this manual.
5.4.8.5 Operations/Profile F4This menu option does not result in a single dia-log, but rather a series of dialogs that will instruct the operator to perform the optical profile proce-dure. In addition to selecting this menu option for profiling, the function key F4 can be pressed or the profile icon can initiate the profiling se-quence. Refer to the Operating Section of this manual for a detailed description of the software dialogs as they appear in the profile routine.
5.4.8.6 Operations/Standardize F7This menu option does not result in a single dia-log, but rather a series of dialogs that will instruct the operator to perform the standardization pro-cedure. In addition to selecting this menu op-tion for standardization, the function key F7 can be pressed or the standardize icon can initiate the standardization sequence. Refer the Operating Section of this manual for a detailed description of the software dialogs as they appear in the stan-dardization routine.
5.4.8.7 Operations/Sample I.D. F3This menu option will produce a dialog to permit the entry of one single ID, Figure 5-49, or pro-vide the capability to pre enter multiple sample ID’s, Figure 5-50, using the MULTIPLE button. Both dialogs are configured at the system level by the System/Sample ID option.
The Multiple Sample ID Entry dialog allows up to 50 sample identifications to be pre loaded to facilitate rapid sample throughput. All sample ID fields are configured at the system level through the System/Sample ID menu option. Along the
bottom of the Multiple ID dialog are buttons to expedite the entry of sample numbers. The Copy button will copy the contents of one field and per-mit it to be copied into another field of equal or greater field size using the Paste button. Copy All will copy one sample and insert it into all remain-ing empty fields in that column. If that column is set for auto increment, the sample number will increase one value per row. Insert, Delete, and Clear are self-explanatory.
Click load to proceed. The first time that this op-tion is enabled, an input file layout screen, Figure 5-51 appears and must be filled in with the user layout preferences. Click OK when complete and the a screen enabling the user to select the sample ID files appears, Figure 5-52.
5.4.8.8 Operations/Average F6This menu option does not result in a dialog. This
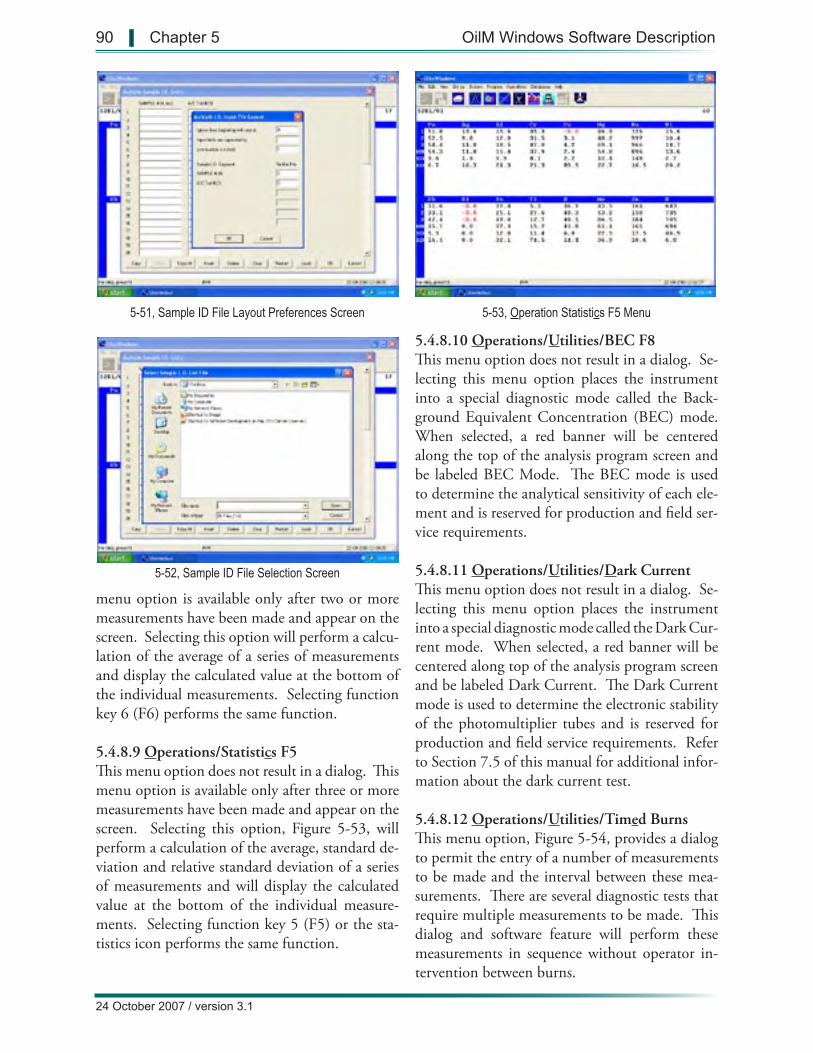
5-51, Sample ID File Layout Preferences Screen
5-52, Sample ID File Selection Screen
5-53, Operation Statistics F5 Menu
90 | Chapter 5 OilM Windows Software Description
24 October 2007 / version 3.1
menu option is available only after two or more measurements have been made and appear on the screen. Selecting this option will perform a calcu-lation of the average of a series of measurements and display the calculated value at the bottom of the individual measurements. Selecting function key 6 (F6) performs the same function.
5.4.8.9 Operations/Statistics F5This menu option does not result in a dialog. This menu option is available only after three or more measurements have been made and appear on the screen. Selecting this option, Figure 5-53, will perform a calculation of the average, standard de-viation and relative standard deviation of a series of measurements and will display the calculated value at the bottom of the individual measure-ments. Selecting function key 5 (F5) or the sta-tistics icon performs the same function.
5.4.8.10 Operations/Utilities/BEC F8This menu option does not result in a dialog. Se-lecting this menu option places the instrument into a special diagnostic mode called the Back-ground Equivalent Concentration (BEC) mode. When selected, a red banner will be centered along the top of the analysis program screen and be labeled BEC Mode. The BEC mode is used to determine the analytical sensitivity of each ele-ment and is reserved for production and field ser-vice requirements.
5.4.8.11 Operations/Utilities/Dark CurrentThis menu option does not result in a dialog. Se-lecting this menu option places the instrument into a special diagnostic mode called the Dark Cur-rent mode. When selected, a red banner will be centered along top of the analysis program screen and be labeled Dark Current. The Dark Current mode is used to determine the electronic stability of the photomultiplier tubes and is reserved for production and field service requirements. Refer to Section 7.5 of this manual for additional infor-mation about the dark current test.
5.4.8.12 Operations/Utilities/Timed BurnsThis menu option, Figure 5-54, provides a dialog to permit the entry of a number of measurements to be made and the interval between these mea-surements. There are several diagnostic tests that require multiple measurements to be made. This dialog and software feature will perform these measurements in sequence without operator in-tervention between burns.
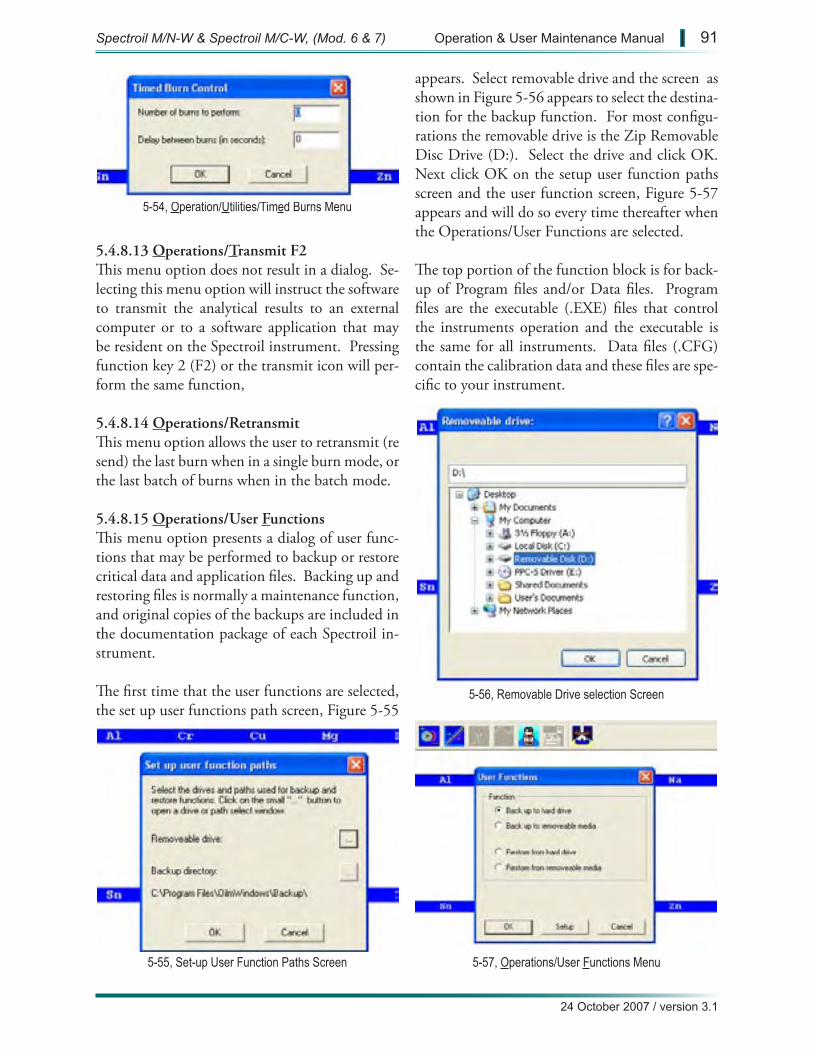
5-54, Operation/Utilities/Timed Burns Menu
5-55, Set-up User Function Paths Screen
5-56, Removable Drive selection Screen
5-57, Operations/User Functions Menu
24 October 2007 / version 3.1
Spectroil M/N-W & Spectroil M/C-W, (Mod. 6 & 7) Operation & User Maintenance Manual | 91
5.4.8.13 Operations/Transmit F2This menu option does not result in a dialog. Se-lecting this menu option will instruct the software to transmit the analytical results to an external computer or to a software application that may be resident on the Spectroil instrument. Pressing function key 2 (F2) or the transmit icon will per-form the same function,
5.4.8.14 Operations/RetransmitThis menu option allows the user to retransmit (re send) the last burn when in a single burn mode, or the last batch of burns when in the batch mode.
5.4.8.15 Operations/User FunctionsThis menu option presents a dialog of user func-tions that may be performed to backup or restore critical data and application files. Backing up and restoring files is normally a maintenance function, and original copies of the backups are included in the documentation package of each Spectroil in-strument.
The first time that the user functions are selected, the set up user functions path screen, Figure 5-55
appears. Select removable drive and the screen as shown in Figure 5-56 appears to select the destina-tion for the backup function. For most configu-rations the removable drive is the Zip Removable Disc Drive (D:). Select the drive and click OK. Next click OK on the setup user function paths screen and the user function screen, Figure 5-57 appears and will do so every time thereafter when the Operations/User Functions are selected.
The top portion of the function block is for back-up of Program files and/or Data files. Program files are the executable (.EXE) files that control the instruments operation and the executable is the same for all instruments. Data files (.CFG) contain the calibration data and these files are spe-cific to your instrument.
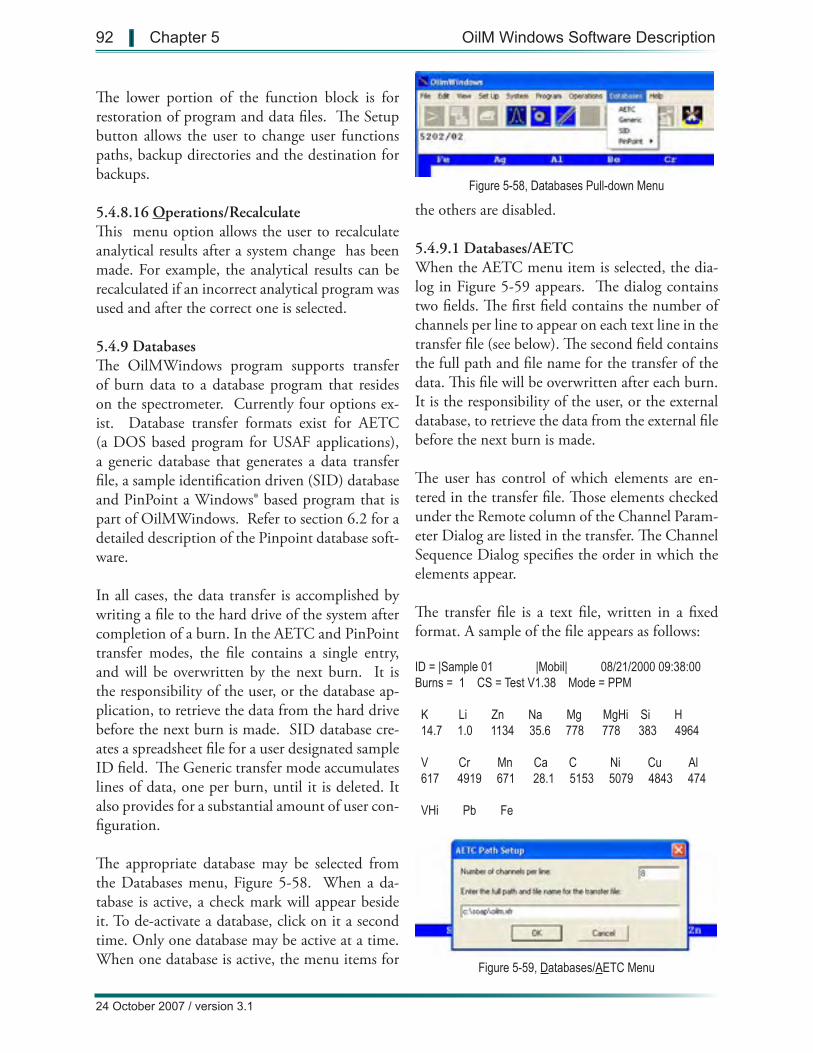
Figure 5-58, Databases Pull-down Menu
Figure 5-59, Databases/AETC Menu
92 | Chapter 5 OilM Windows Software Description
24 October 2007 / version 3.1
The lower portion of the function block is for restoration of program and data files. The Setup button allows the user to change user functions paths, backup directories and the destination for backups.
5.4.8.16 Operations/RecalculateThis menu option allows the user to recalculate analytical results after a system change has been made. For example, the analytical results can be recalculated if an incorrect analytical program was used and after the correct one is selected.
5.4.9 DatabasesThe OilMWindows program supports transfer of burn data to a database program that resides on the spectrometer. Currently four options ex-ist. Database transfer formats exist for AETC (a DOS based program for USAF applications), a generic database that generates a data transfer file, a sample identification driven (SID) database and PinPoint a Windows® based program that is part of OilMWindows. Refer to section 6.2 for a detailed description of the Pinpoint database soft-ware.
In all cases, the data transfer is accomplished by writing a file to the hard drive of the system after completion of a burn. In the AETC and PinPoint transfer modes, the file contains a single entry, and will be overwritten by the next burn. It is the responsibility of the user, or the database ap-plication, to retrieve the data from the hard drive before the next burn is made. SID database cre-ates a spreadsheet file for a user designated sample ID field. The Generic transfer mode accumulates lines of data, one per burn, until it is deleted. It also provides for a substantial amount of user con-figuration.
The appropriate database may be selected from the Databases menu, Figure 5-58. When a da-tabase is active, a check mark will appear beside it. To de-activate a database, click on it a second time. Only one database may be active at a time. When one database is active, the menu items for
the others are disabled. 5.4.9.1 Databases/AETCWhen the AETC menu item is selected, the dia-log in Figure 5-59 appears. The dialog contains two fields. The first field contains the number of channels per line to appear on each text line in the transfer file (see below). The second field contains the full path and file name for the transfer of the data. This file will be overwritten after each burn. It is the responsibility of the user, or the external database, to retrieve the data from the external file before the next burn is made.
The user has control of which elements are en-tered in the transfer file. Those elements checked under the Remote column of the Channel Param-eter Dialog are listed in the transfer. The Channel Sequence Dialog specifies the order in which the elements appear.
The transfer file is a text file, written in a fixed format. A sample of the file appears as follows:
ID = |Sample 01 |Mobil| 08/21/2000 09:38:00Burns = 1 CS = Test V1.38 Mode = PPM
K Li Zn Na Mg MgHi Si H 14.7 1.0 1134 35.6 778 778 383 4964
V Cr Mn Ca C Ni Cu Al 617 4919 671 28.1 5153 5079 4843 474
VHi Pb Fe
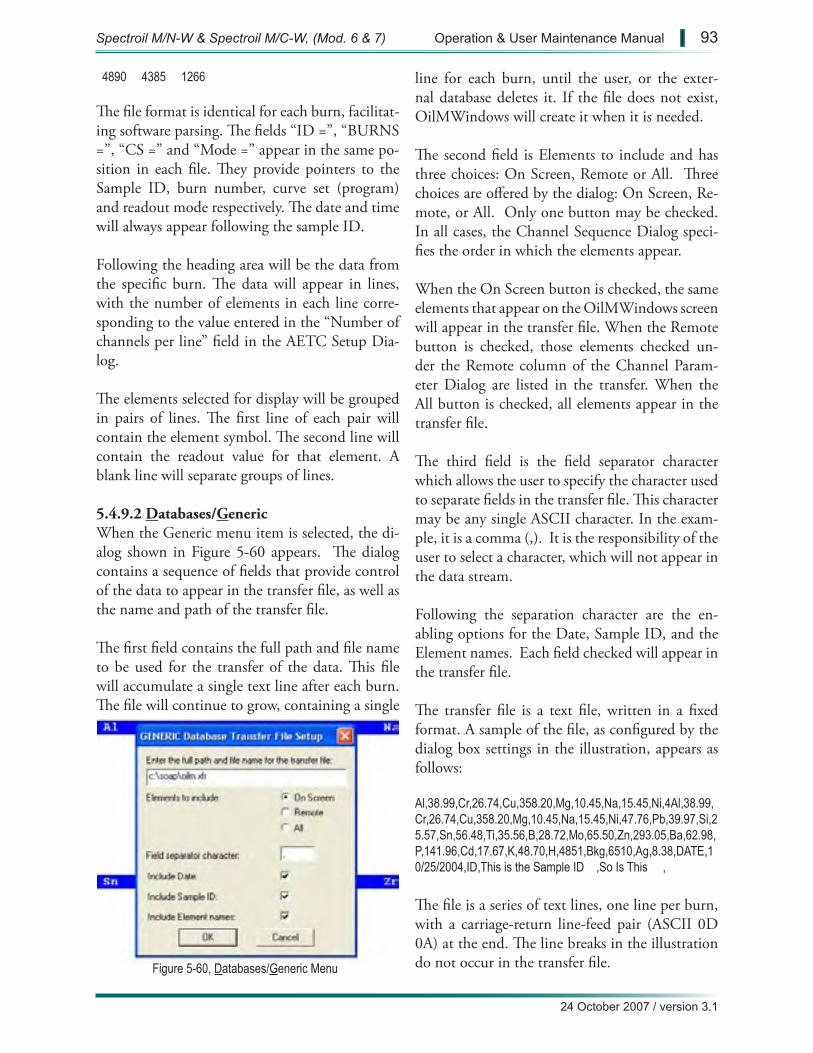
Figure 5-60, Databases/Generic Menu
24 October 2007 / version 3.1
Spectroil M/N-W & Spectroil M/C-W, (Mod. 6 & 7) Operation & User Maintenance Manual | 93
4890 4385 1266
The file format is identical for each burn, facilitat-ing software parsing. The fields “ID =”, “BURNS =”, “CS =” and “Mode =” appear in the same po-sition in each file. They provide pointers to the Sample ID, burn number, curve set (program) and readout mode respectively. The date and time will always appear following the sample ID.
Following the heading area will be the data from the specific burn. The data will appear in lines, with the number of elements in each line corre-sponding to the value entered in the “Number of channels per line” field in the AETC Setup Dia-log.
The elements selected for display will be grouped in pairs of lines. The first line of each pair will contain the element symbol. The second line will contain the readout value for that element. A blank line will separate groups of lines.
5.4.9.2 Databases/GenericWhen the Generic menu item is selected, the di-alog shown in Figure 5-60 appears. The dialog contains a sequence of fields that provide control of the data to appear in the transfer file, as well as the name and path of the transfer file.
The first field contains the full path and file name to be used for the transfer of the data. This file will accumulate a single text line after each burn. The file will continue to grow, containing a single
line for each burn, until the user, or the exter-nal database deletes it. If the file does not exist, OilMWindows will create it when it is needed.
The second field is Elements to include and has three choices: On Screen, Remote or All. Three choices are offered by the dialog: On Screen, Re-mote, or All. Only one button may be checked. In all cases, the Channel Sequence Dialog speci-fies the order in which the elements appear.
When the On Screen button is checked, the same elements that appear on the OilMWindows screen will appear in the transfer file. When the Remote button is checked, those elements checked un-der the Remote column of the Channel Param-eter Dialog are listed in the transfer. When the All button is checked, all elements appear in the transfer file.
The third field is the field separator character which allows the user to specify the character used to separate fields in the transfer file. This character may be any single ASCII character. In the exam-ple, it is a comma (,). It is the responsibility of the user to select a character, which will not appear in the data stream.
Following the separation character are the en-abling options for the Date, Sample ID, and the Element names. Each field checked will appear in the transfer file.
The transfer file is a text file, written in a fixed format. A sample of the file, as configured by the dialog box settings in the illustration, appears as follows:
Al,38.99,Cr,26.74,Cu,358.20,Mg,10.45,Na,15.45,Ni,4Al,38.99,Cr,26.74,Cu,358.20,Mg,10.45,Na,15.45,Ni,47.76,Pb,39.97,Si,25.57,Sn,56.48,Ti,35.56,B,28.72,Mo,65.50,Zn,293.05,Ba,62.98,P,141.96,Cd,17.67,K,48.70,H,4851,Bkg,6510,Ag,8.38,DATE,10/25/2004,ID,This is the Sample ID ,So Is This ,
The file is a series of text lines, one line per burn, with a carriage-return line-feed pair (ASCII 0D 0A) at the end. The line breaks in the illustration do not occur in the transfer file.
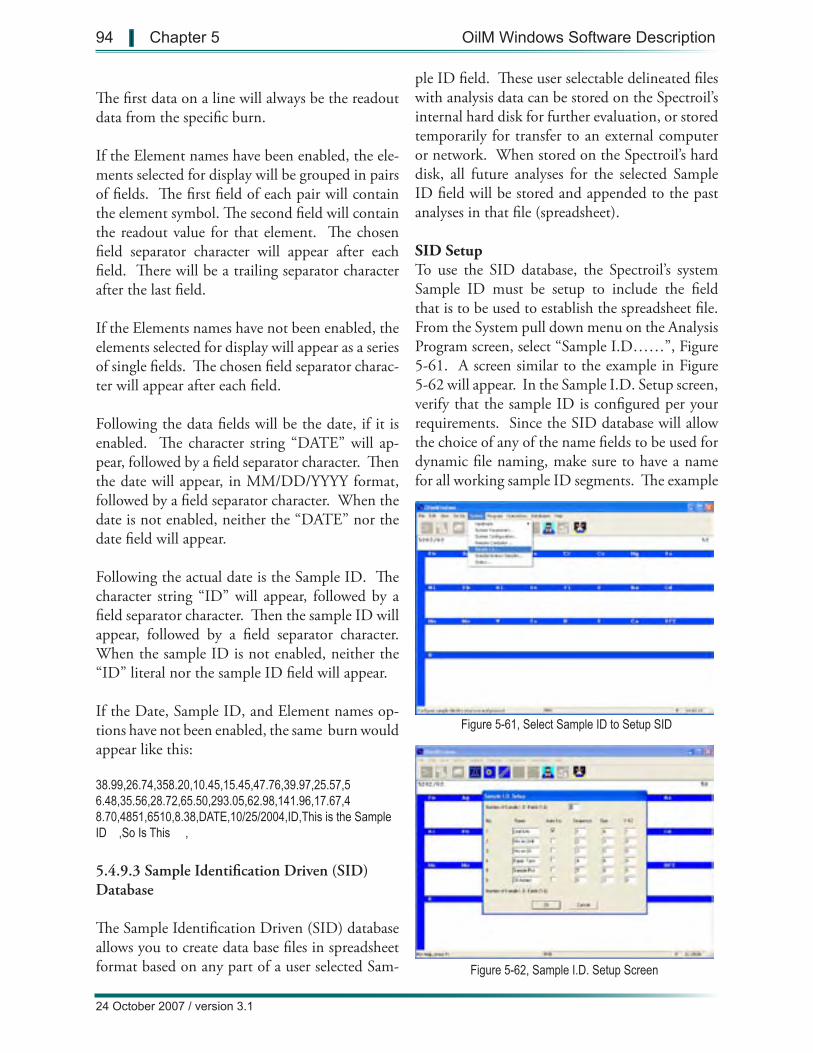
Figure 5-61, Select Sample ID to Setup SID
Figure 5-62, Sample I.D. Setup Screen
94 | Chapter 5 OilM Windows Software Description
24 October 2007 / version 3.1
The first data on a line will always be the readout data from the specific burn.
If the Element names have been enabled, the ele-ments selected for display will be grouped in pairs of fields. The first field of each pair will contain the element symbol. The second field will contain the readout value for that element. The chosen field separator character will appear after each field. There will be a trailing separator character after the last field.
If the Elements names have not been enabled, the elements selected for display will appear as a series of single fields. The chosen field separator charac-ter will appear after each field.
Following the data fields will be the date, if it is enabled. The character string “DATE” will ap-pear, followed by a field separator character. Then the date will appear, in MM/DD/YYYY format, followed by a field separator character. When the date is not enabled, neither the “DATE” nor the date field will appear.
Following the actual date is the Sample ID. The character string “ID” will appear, followed by a field separator character. Then the sample ID will appear, followed by a field separator character. When the sample ID is not enabled, neither the “ID” literal nor the sample ID field will appear.
If the Date, Sample ID, and Element names op-tions have not been enabled, the same burn would appear like this:
38.99,26.74,358.20,10.45,15.45,47.76,39.97,25.57,56.48,35.56,28.72,65.50,293.05,62.98,141.96,17.67,48.70,4851,6510,8.38,DATE,10/25/2004,ID,This is the Sample ID ,So Is This ,
5.4.9.3 Sample Identification Driven (SID) Database
The Sample Identification Driven (SID) database allows you to create data base files in spreadsheet format based on any part of a user selected Sam-
ple ID field. These user selectable delineated files with analysis data can be stored on the Spectroil’s internal hard disk for further evaluation, or stored temporarily for transfer to an external computer or network. When stored on the Spectroil’s hard disk, all future analyses for the selected Sample ID field will be stored and appended to the past analyses in that file (spreadsheet).
SID SetupTo use the SID database, the Spectroil’s system Sample ID must be setup to include the field that is to be used to establish the spreadsheet file. From the System pull down menu on the Analysis Program screen, select “Sample I.D……”, Figure 5-61. A screen similar to the example in Figure 5-62 will appear. In the Sample I.D. Setup screen, verify that the sample ID is configured per your requirements. Since the SID database will allow the choice of any of the name fields to be used for dynamic file naming, make sure to have a name for all working sample ID segments. The example
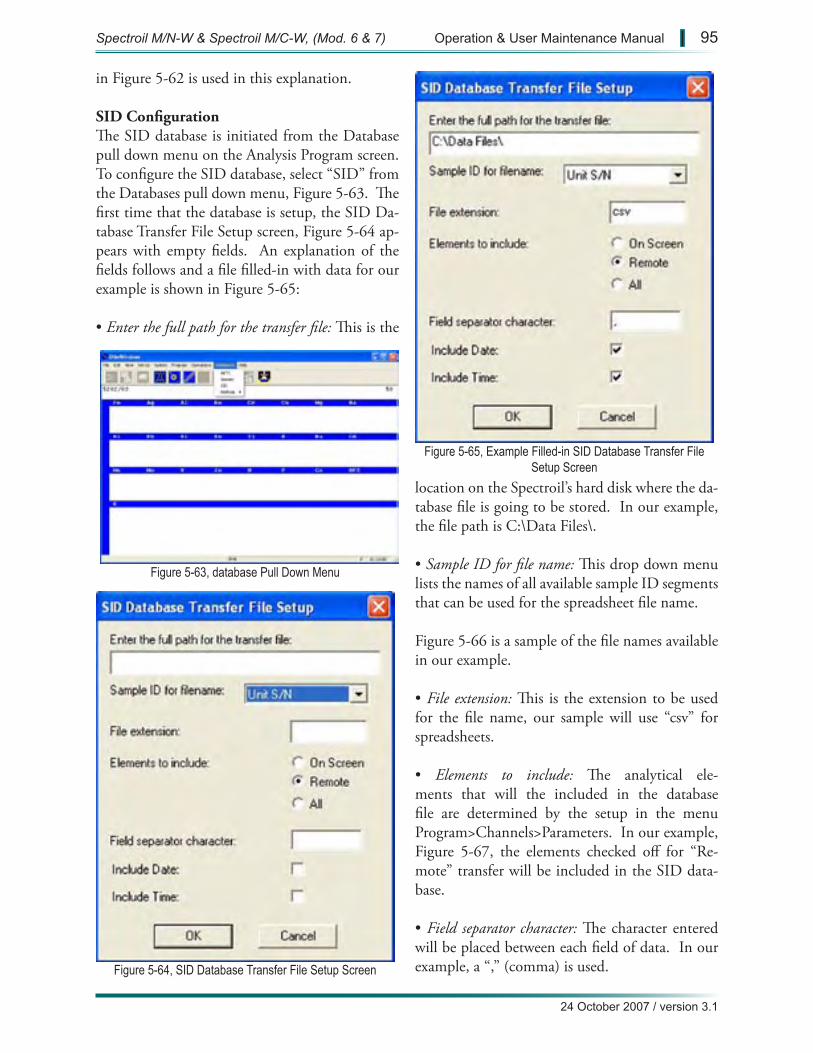
Figure 5-63, database Pull Down Menu
Figure 5-64, SID Database Transfer File Setup Screen
Figure 5-65, Example Filled-in SID Database Transfer File Setup Screen
24 October 2007 / version 3.1
Spectroil M/N-W & Spectroil M/C-W, (Mod. 6 & 7) Operation & User Maintenance Manual | 95
in Figure 5-62 is used in this explanation.
SID ConfigurationThe SID database is initiated from the Database pull down menu on the Analysis Program screen. To configure the SID database, select “SID” from the Databases pull down menu, Figure 5-63. The first time that the database is setup, the SID Da-tabase Transfer File Setup screen, Figure 5-64 ap-pears with empty fields. An explanation of the fields follows and a file filled-in with data for our example is shown in Figure 5-65:
• Enter the full path for the transfer file: This is the
location on the Spectroil’s hard disk where the da-tabase file is going to be stored. In our example, the file path is C:\Data Files\.
• Sample ID for file name: This drop down menu lists the names of all available sample ID segments that can be used for the spreadsheet file name.
Figure 5-66 is a sample of the file names available in our example.
• File extension: This is the extension to be used for the file name, our sample will use “csv” for spreadsheets.
• Elements to include: The analytical ele-ments that will the included in the database file are determined by the setup in the menu Program>Channels>Parameters. In our example, Figure 5-67, the elements checked off for “Re-mote” transfer will be included in the SID data-base.
• Field separator character: The character entered will be placed between each field of data. In our example, a “,” (comma) is used.
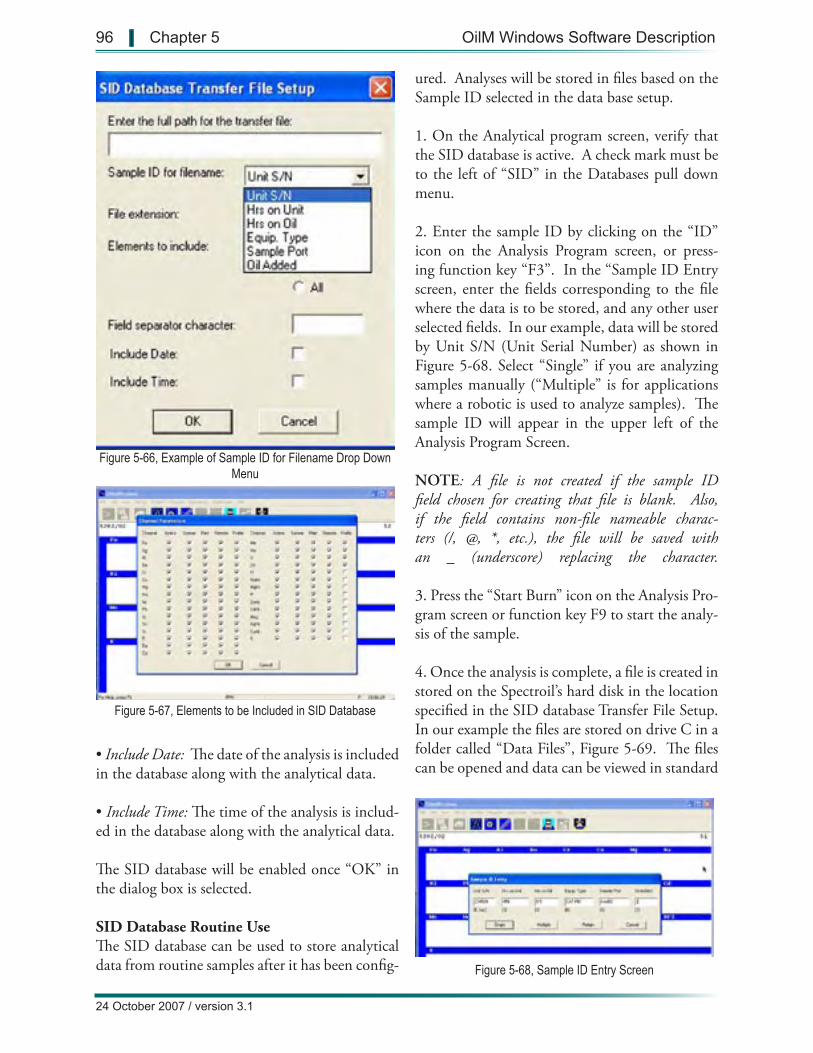
Figure 5-66, Example of Sample ID for Filename Drop Down Menu
Figure 5-67, Elements to be Included in SID Database
Figure 5-68, Sample ID Entry Screen
96 | Chapter 5 OilM Windows Software Description
24 October 2007 / version 3.1
• Include Date: The date of the analysis is included in the database along with the analytical data.
• Include Time: The time of the analysis is includ-ed in the database along with the analytical data.
The SID database will be enabled once “OK” in the dialog box is selected.
SID Database Routine UseThe SID database can be used to store analytical data from routine samples after it has been config-
ured. Analyses will be stored in files based on the Sample ID selected in the data base setup.
1. On the Analytical program screen, verify that the SID database is active. A check mark must be to the left of “SID” in the Databases pull down menu.
2. Enter the sample ID by clicking on the “ID” icon on the Analysis Program screen, or press-ing function key “F3”. In the “Sample ID Entry screen, enter the fields corresponding to the file where the data is to be stored, and any other user selected fields. In our example, data will be stored by Unit S/N (Unit Serial Number) as shown in Figure 5-68. Select “Single” if you are analyzing samples manually (“Multiple” is for applications where a robotic is used to analyze samples). The sample ID will appear in the upper left of the Analysis Program Screen.
NOTE: A file is not created if the sample ID field chosen for creating that file is blank. Also, if the field contains non-file nameable charac-ters (/, @, *, etc.), the file will be saved with an _ (underscore) replacing the character.
3. Press the “Start Burn” icon on the Analysis Pro-gram screen or function key F9 to start the analy-sis of the sample.
4. Once the analysis is complete, a file is created in stored on the Spectroil’s hard disk in the location specified in the SID database Transfer File Setup. In our example the files are stored on drive C in a folder called “Data Files”, Figure 5-69. The files can be opened and data can be viewed in standard
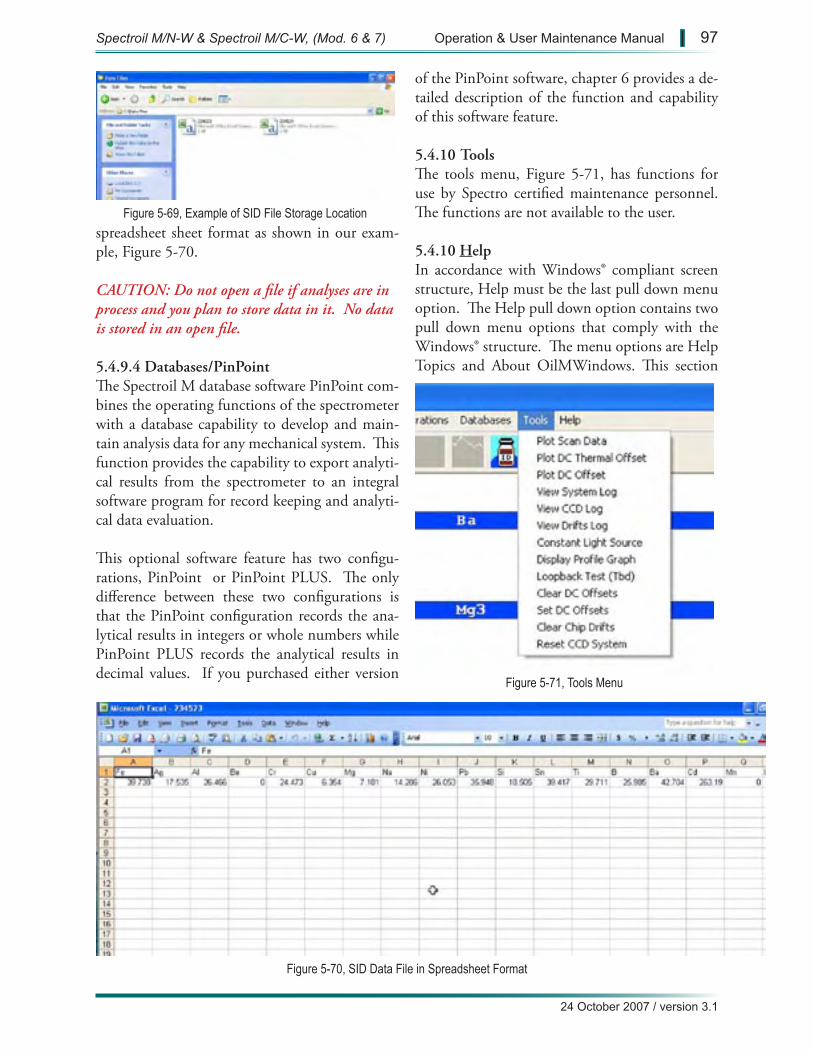
Figure 5-69, Example of SID File Storage Location
Figure 5-71, Tools Menu
Figure 5-70, SID Data File in Spreadsheet Format
24 October 2007 / version 3.1
Spectroil M/N-W & Spectroil M/C-W, (Mod. 6 & 7) Operation & User Maintenance Manual | 97
spreadsheet sheet format as shown in our exam-ple, Figure 5-70.
CAUTION: Do not open a file if analyses are in process and you plan to store data in it. No data is stored in an open file.
5.4.9.4 Databases/PinPointThe Spectroil M database software PinPoint com-bines the operating functions of the spectrometer with a database capability to develop and main-tain analysis data for any mechanical system. This function provides the capability to export analyti-cal results from the spectrometer to an integral software program for record keeping and analyti-cal data evaluation.
This optional software feature has two configu-rations, PinPoint or PinPoint PLUS. The only difference between these two configurations is that the PinPoint configuration records the ana-lytical results in integers or whole numbers while PinPoint PLUS records the analytical results in decimal values. If you purchased either version
of the PinPoint software, chapter 6 provides a de-tailed description of the function and capability of this software feature.
5.4.10 ToolsThe tools menu, Figure 5-71, has functions for use by Spectro certified maintenance personnel. The functions are not available to the user.
5.4.10 HelpIn accordance with Windows® compliant screen structure, Help must be the last pull down menu option. The Help pull down option contains two pull down menu options that comply with the Windows® structure. The menu options are Help Topics and About OilMWindows. This section
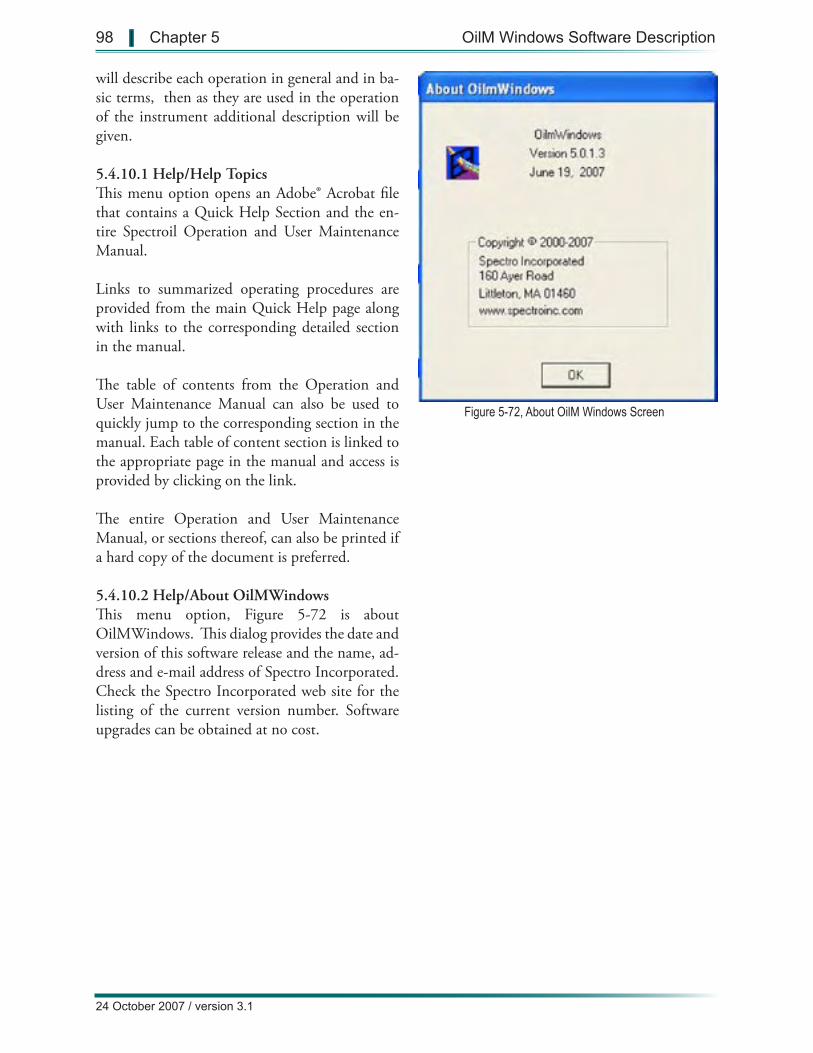
Figure 5-72, About OilM Windows Screen
98 | Chapter 5 OilM Windows Software Description
24 October 2007 / version 3.1
will describe each operation in general and in ba-sic terms, then as they are used in the operation of the instrument additional description will be given.
5.4.10.1 Help/Help TopicsThis menu option opens an Adobe® Acrobat file that contains a Quick Help Section and the en-tire Spectroil Operation and User Maintenance Manual.
Links to summarized operating procedures are provided from the main Quick Help page along with links to the corresponding detailed section in the manual.
The table of contents from the Operation and User Maintenance Manual can also be used to quickly jump to the corresponding section in the manual. Each table of content section is linked to the appropriate page in the manual and access is provided by clicking on the link.
The entire Operation and User Maintenance Manual, or sections thereof, can also be printed if a hard copy of the document is preferred.
5.4.10.2 Help/About OilMWindowsThis menu option, Figure 5-72 is about OilMWindows. This dialog provides the date and version of this software release and the name, ad-dress and e-mail address of Spectro Incorporated. Check the Spectro Incorporated web site for the listing of the current version number. Software upgrades can be obtained at no cost.
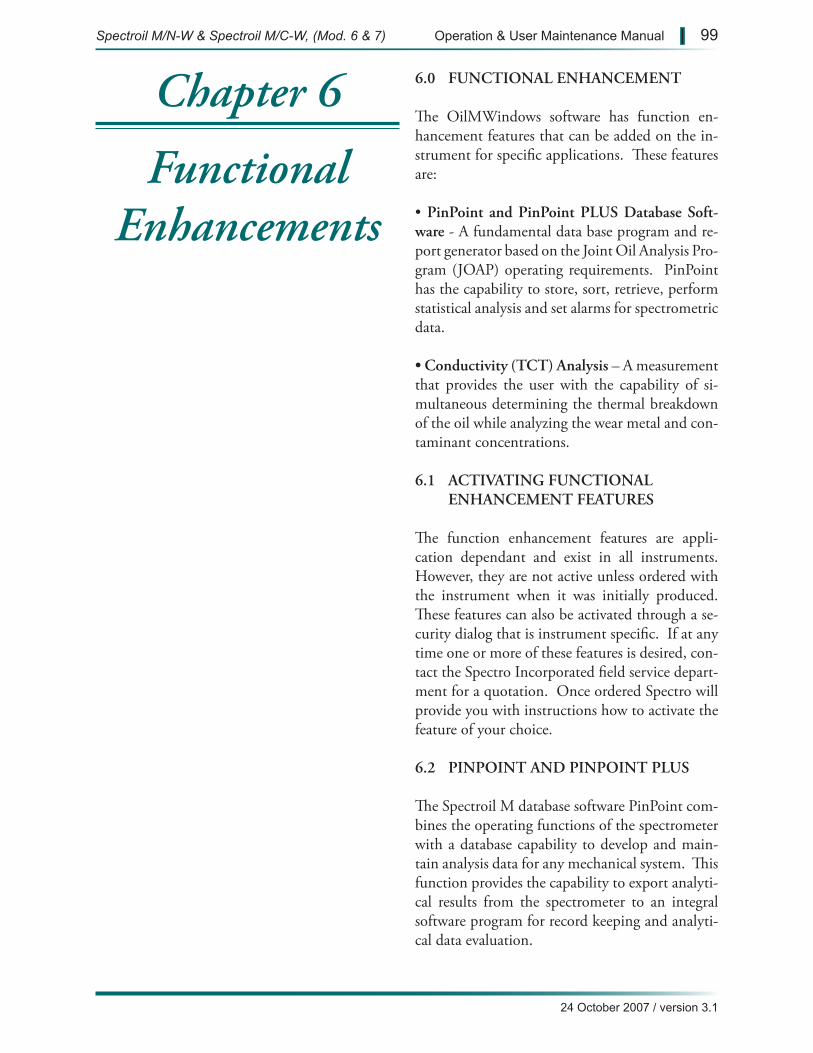
6.0 FUNCTIONAL ENHANCEMENT
The OilMWindows software has function en-hancement features that can be added on the in-strument for specific applications. These features are:
• PinPoint and PinPoint PLUS Database Soft-ware - A fundamental data base program and re-port generator based on the Joint Oil Analysis Pro-gram (JOAP) operating requirements. PinPoint has the capability to store, sort, retrieve, perform statistical analysis and set alarms for spectrometric data.
• Conductivity (TCT) Analysis – A measurement that provides the user with the capability of si-multaneous determining the thermal breakdown of the oil while analyzing the wear metal and con-taminant concentrations.
6.1 ACTIVATING FUNCTIONAL ENHANCEMENT FEATURES
The function enhancement features are appli-cation dependant and exist in all instruments. However, they are not active unless ordered with the instrument when it was initially produced. These features can also be activated through a se-curity dialog that is instrument specific. If at any time one or more of these features is desired, con-tact the Spectro Incorporated field service depart-ment for a quotation. Once ordered Spectro will provide you with instructions how to activate the feature of your choice.
6.2 PINPOINT AND PINPOINT PLUS
The Spectroil M database software PinPoint com-bines the operating functions of the spectrometer with a database capability to develop and main-tain analysis data for any mechanical system. This function provides the capability to export analyti-cal results from the spectrometer to an integral software program for record keeping and analyti-cal data evaluation.
Chapter 6
Functional Enhancements
Spectroil M/N-W & Spectroil M/C-W, (Mod. 6 & 7) Operation & User Maintenance Manual | 99
24 October 2007 / version 3.1
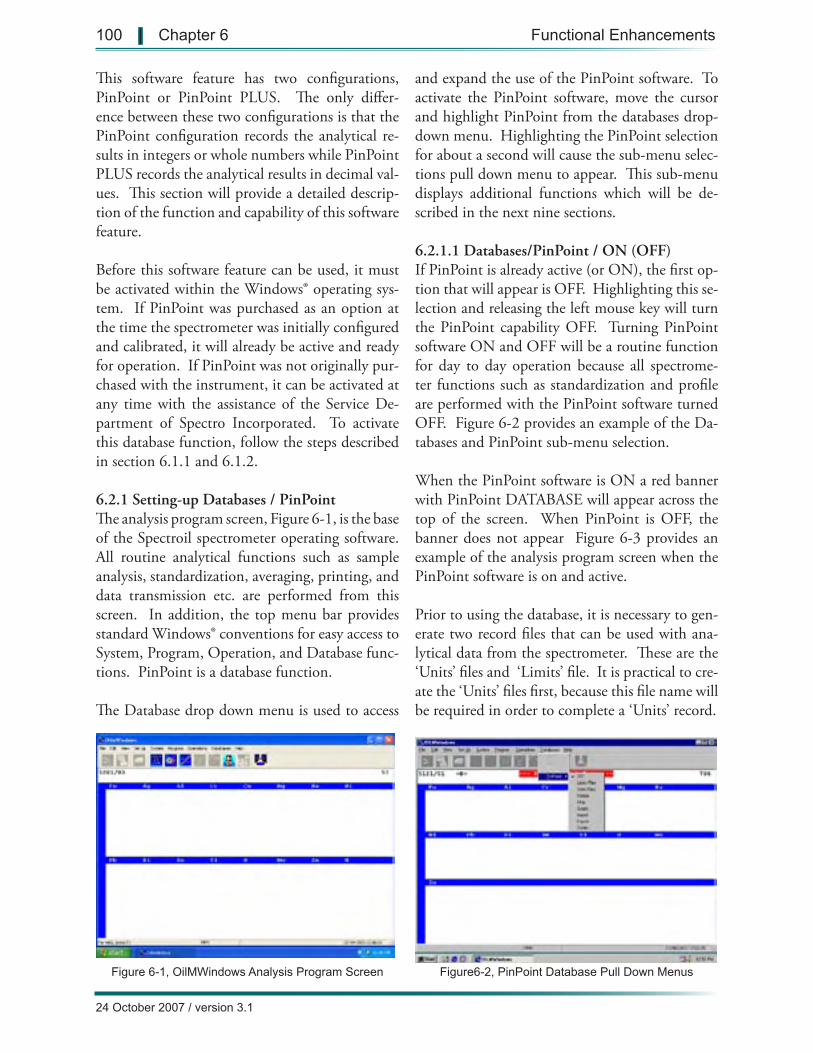
Figure 6-1, OilMWindows Analysis Program Screen Figure6-2, PinPoint Database Pull Down Menus
This software feature has two configurations, PinPoint or PinPoint PLUS. The only differ-ence between these two configurations is that the PinPoint configuration records the analytical re-sults in integers or whole numbers while PinPoint PLUS records the analytical results in decimal val-ues. This section will provide a detailed descrip-tion of the function and capability of this software feature.
Before this software feature can be used, it must be activated within the Windows® operating sys-tem. If PinPoint was purchased as an option at the time the spectrometer was initially configured and calibrated, it will already be active and ready for operation. If PinPoint was not originally pur-chased with the instrument, it can be activated at any time with the assistance of the Service De-partment of Spectro Incorporated. To activate this database function, follow the steps described in section 6.1.1 and 6.1.2.
6.2.1 Setting-up Databases / PinPointThe analysis program screen, Figure 6-1, is the base of the Spectroil spectrometer operating software. All routine analytical functions such as sample analysis, standardization, averaging, printing, and data transmission etc. are performed from this screen. In addition, the top menu bar provides standard Windows® conventions for easy access to System, Program, Operation, and Database func-tions. PinPoint is a database function.
The Database drop down menu is used to access
and expand the use of the PinPoint software. To activate the PinPoint software, move the cursor and highlight PinPoint from the databases drop-down menu. Highlighting the PinPoint selection for about a second will cause the sub-menu selec-tions pull down menu to appear. This sub-menu displays additional functions which will be de-scribed in the next nine sections.
6.2.1.1 Databases/PinPoint / ON (OFF)If PinPoint is already active (or ON), the first op-tion that will appear is OFF. Highlighting this se-lection and releasing the left mouse key will turn the PinPoint capability OFF. Turning PinPoint software ON and OFF will be a routine function for day to day operation because all spectrome-ter functions such as standardization and profile are performed with the PinPoint software turned OFF. Figure 6-2 provides an example of the Da-tabases and PinPoint sub-menu selection.
When the PinPoint software is ON a red banner with PinPoint DATABASE will appear across the top of the screen. When PinPoint is OFF, the banner does not appear Figure 6-3 provides an example of the analysis program screen when the PinPoint software is on and active.
Prior to using the database, it is necessary to gen-erate two record files that can be used with ana-lytical data from the spectrometer. These are the ‘Units’ files and ‘Limits’ file. It is practical to cre-ate the ‘Units’ files first, because this file name will be required in order to complete a ‘Units’ record.
100 | Chapter 6 Functional Enhancements
24 October 2007 / version 3.1
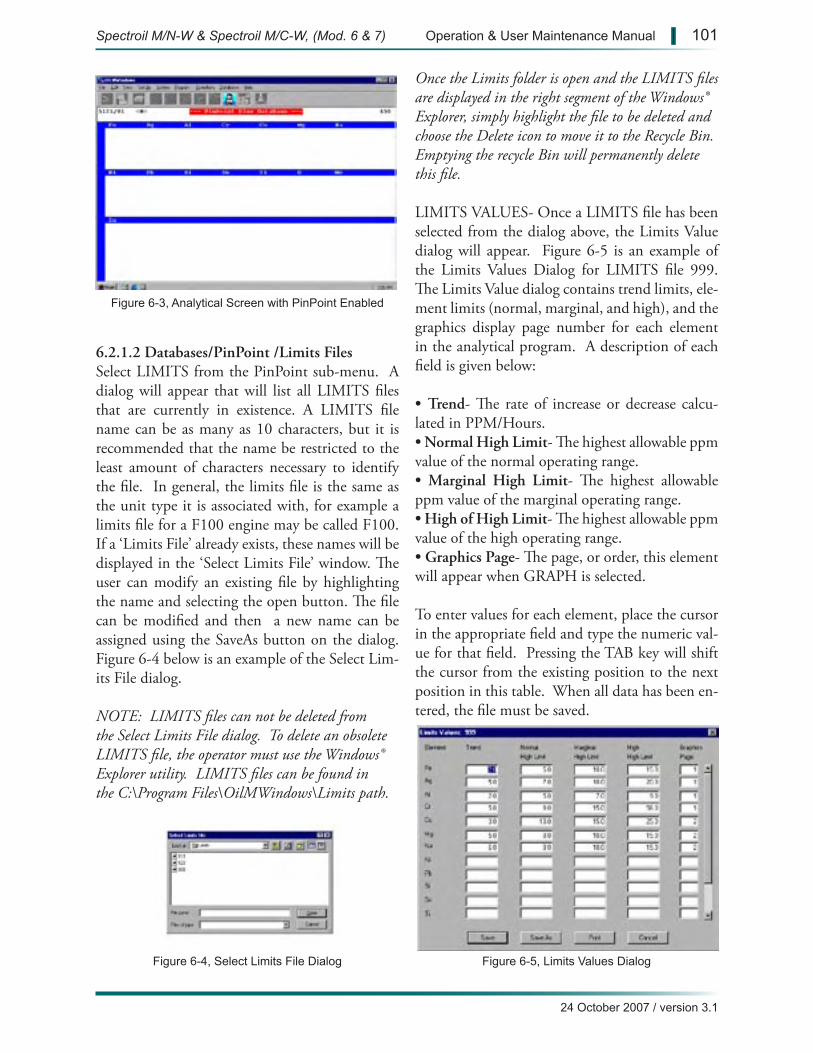
Figure 6-3, Analytical Screen with PinPoint Enabled
Figure 6-5, Limits Values DialogFigure 6-4, Select Limits File Dialog
6.2.1.2 Databases/PinPoint /Limits FilesSelect LIMITS from the PinPoint sub-menu. A dialog will appear that will list all LIMITS files that are currently in existence. A LIMITS file name can be as many as 10 characters, but it is recommended that the name be restricted to the least amount of characters necessary to identify the file. In general, the limits file is the same as the unit type it is associated with, for example a limits file for a F100 engine may be called F100. If a ‘Limits File’ already exists, these names will be displayed in the ‘Select Limits File’ window. The user can modify an existing file by highlighting the name and selecting the open button. The file can be modified and then a new name can be assigned using the SaveAs button on the dialog. Figure 6-4 below is an example of the Select Lim-its File dialog.
NOTE: LIMITS files can not be deleted from the Select Limits File dialog. To delete an obsolete LIMITS file, the operator must use the Windows® Explorer utility. LIMITS files can be found in the C:\Program Files\OilMWindows\Limits path.
Once the Limits folder is open and the LIMITS files are displayed in the right segment of the Windows® Explorer, simply highlight the file to be deleted and choose the Delete icon to move it to the Recycle Bin. Emptying the recycle Bin will permanently delete this file.
LIMITS VALUES- Once a LIMITS file has been selected from the dialog above, the Limits Value dialog will appear. Figure 6-5 is an example of the Limits Values Dialog for LIMITS file 999. The Limits Value dialog contains trend limits, ele-ment limits (normal, marginal, and high), and the graphics display page number for each element in the analytical program. A description of each field is given below:
• Trend- The rate of increase or decrease calcu-lated in PPM/Hours.• Normal High Limit- The highest allowable ppm value of the normal operating range.• Marginal High Limit- The highest allowable ppm value of the marginal operating range.• High of High Limit- The highest allowable ppm value of the high operating range.• Graphics Page- The page, or order, this element will appear when GRAPH is selected.
To enter values for each element, place the cursor in the appropriate field and type the numeric val-ue for that field. Pressing the TAB key will shift the cursor from the existing position to the next position in this table. When all data has been en-tered, the file must be saved.
Spectroil M/N-W & Spectroil M/C-W, (Mod. 6 & 7) Operation & User Maintenance Manual | 101
24 October 2007 / version 3.1
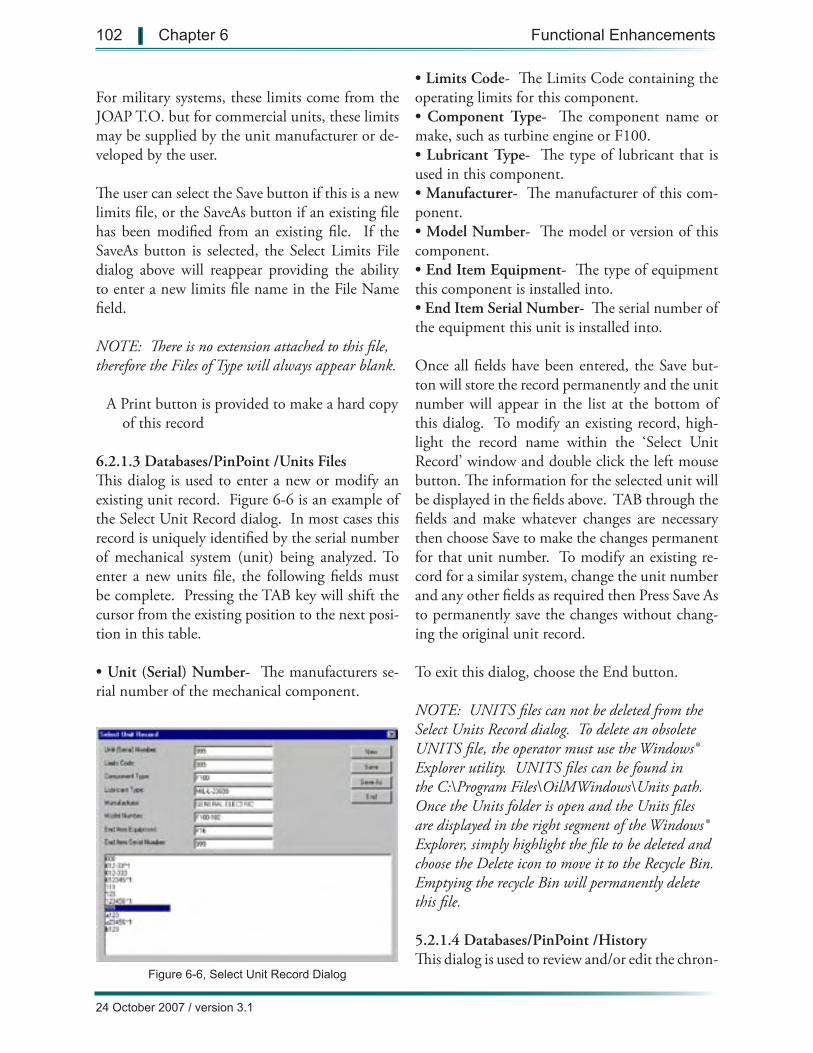
Figure 6-6, Select Unit Record Dialog
For military systems, these limits come from the JOAP T.O. but for commercial units, these limits may be supplied by the unit manufacturer or de-veloped by the user.
The user can select the Save button if this is a new limits file, or the SaveAs button if an existing file has been modified from an existing file. If the SaveAs button is selected, the Select Limits File dialog above will reappear providing the ability to enter a new limits file name in the File Name field.
NOTE: There is no extension attached to this file, therefore the Files of Type will always appear blank.
A Print button is provided to make a hard copy of this record
6.2.1.3 Databases/PinPoint /Units FilesThis dialog is used to enter a new or modify an existing unit record. Figure 6-6 is an example of the Select Unit Record dialog. In most cases this record is uniquely identified by the serial number of mechanical system (unit) being analyzed. To enter a new units file, the following fields must be complete. Pressing the TAB key will shift the cursor from the existing position to the next posi-tion in this table.
• Unit (Serial) Number- The manufacturers se-rial number of the mechanical component.
• Limits Code- The Limits Code containing the operating limits for this component.• Component Type- The component name or make, such as turbine engine or F100.• Lubricant Type- The type of lubricant that is used in this component.• Manufacturer- The manufacturer of this com-ponent.• Model Number- The model or version of this component.• End Item Equipment- The type of equipment this component is installed into.• End Item Serial Number- The serial number of the equipment this unit is installed into.
Once all fields have been entered, the Save but-ton will store the record permanently and the unit number will appear in the list at the bottom of this dialog. To modify an existing record, high-light the record name within the ‘Select Unit Record’ window and double click the left mouse button. The information for the selected unit will be displayed in the fields above. TAB through the fields and make whatever changes are necessary then choose Save to make the changes permanent for that unit number. To modify an existing re-cord for a similar system, change the unit number and any other fields as required then Press Save As to permanently save the changes without chang-ing the original unit record.
To exit this dialog, choose the End button.
NOTE: UNITS files can not be deleted from the Select Units Record dialog. To delete an obsolete UNITS file, the operator must use the Windows® Explorer utility. UNITS files can be found in the C:\Program Files\OilMWindows\Units path. Once the Units folder is open and the Units files are displayed in the right segment of the Windows® Explorer, simply highlight the file to be deleted and choose the Delete icon to move it to the Recycle Bin. Emptying the recycle Bin will permanently delete this file.
5.2.1.4 Databases/PinPoint /HistoryThis dialog is used to review and/or edit the chron-
102 | Chapter 6 Functional Enhancements
24 October 2007 / version 3.1
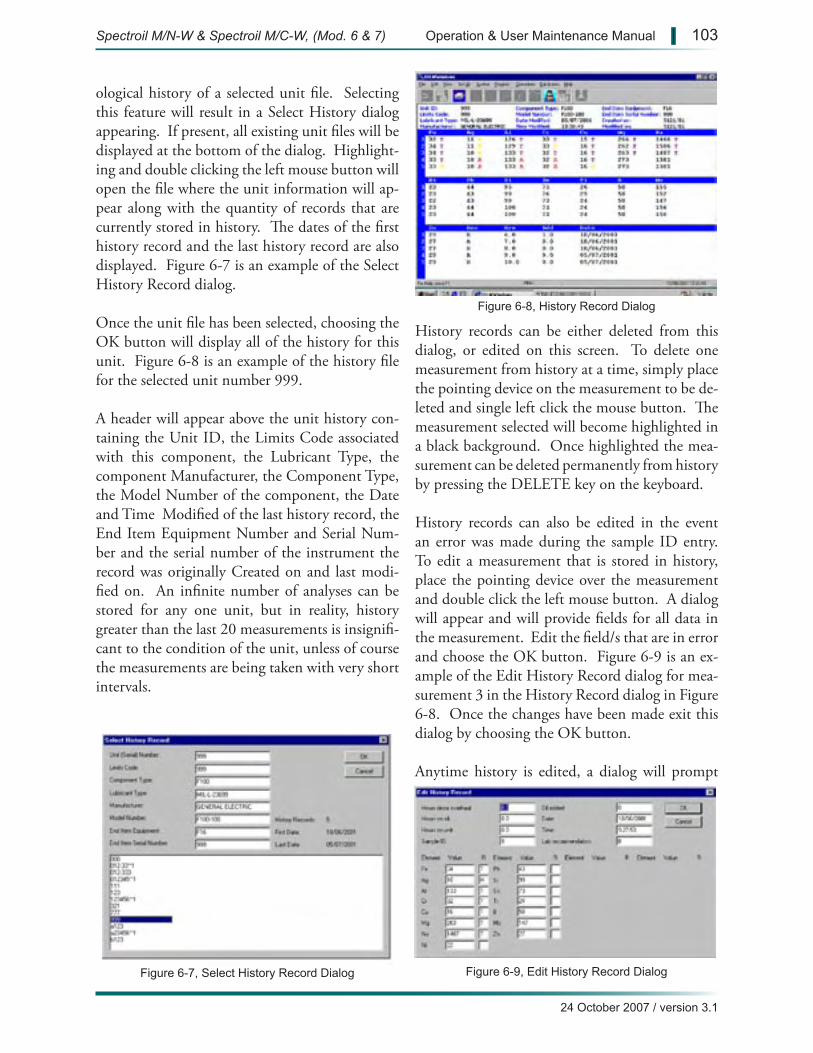
Figure 6-8, History Record Dialog
Figure 6-7, Select History Record Dialog Figure 6-9, Edit History Record Dialog
ological history of a selected unit file. Selecting this feature will result in a Select History dialog appearing. If present, all existing unit files will be displayed at the bottom of the dialog. Highlight-ing and double clicking the left mouse button will open the file where the unit information will ap-pear along with the quantity of records that are currently stored in history. The dates of the first history record and the last history record are also displayed. Figure 6-7 is an example of the Select History Record dialog.
Once the unit file has been selected, choosing the OK button will display all of the history for this unit. Figure 6-8 is an example of the history file for the selected unit number 999.
A header will appear above the unit history con-taining the Unit ID, the Limits Code associated with this component, the Lubricant Type, the component Manufacturer, the Component Type, the Model Number of the component, the Date and Time Modified of the last history record, the End Item Equipment Number and Serial Num-ber and the serial number of the instrument the record was originally Created on and last modi-fied on. An infinite number of analyses can be stored for any one unit, but in reality, history greater than the last 20 measurements is insignifi-cant to the condition of the unit, unless of course the measurements are being taken with very short intervals.
History records can be either deleted from this dialog, or edited on this screen. To delete one measurement from history at a time, simply place the pointing device on the measurement to be de-leted and single left click the mouse button. The measurement selected will become highlighted in a black background. Once highlighted the mea-surement can be deleted permanently from history by pressing the DELETE key on the keyboard.
History records can also be edited in the event an error was made during the sample ID entry. To edit a measurement that is stored in history, place the pointing device over the measurement and double click the left mouse button. A dialog will appear and will provide fields for all data in the measurement. Edit the field/s that are in error and choose the OK button. Figure 6-9 is an ex-ample of the Edit History Record dialog for mea-surement 3 in the History Record dialog in Figure 6-8. Once the changes have been made exit this dialog by choosing the OK button.
Anytime history is edited, a dialog will prompt
Spectroil M/N-W & Spectroil M/C-W, (Mod. 6 & 7) Operation & User Maintenance Manual | 103
24 October 2007 / version 3.1
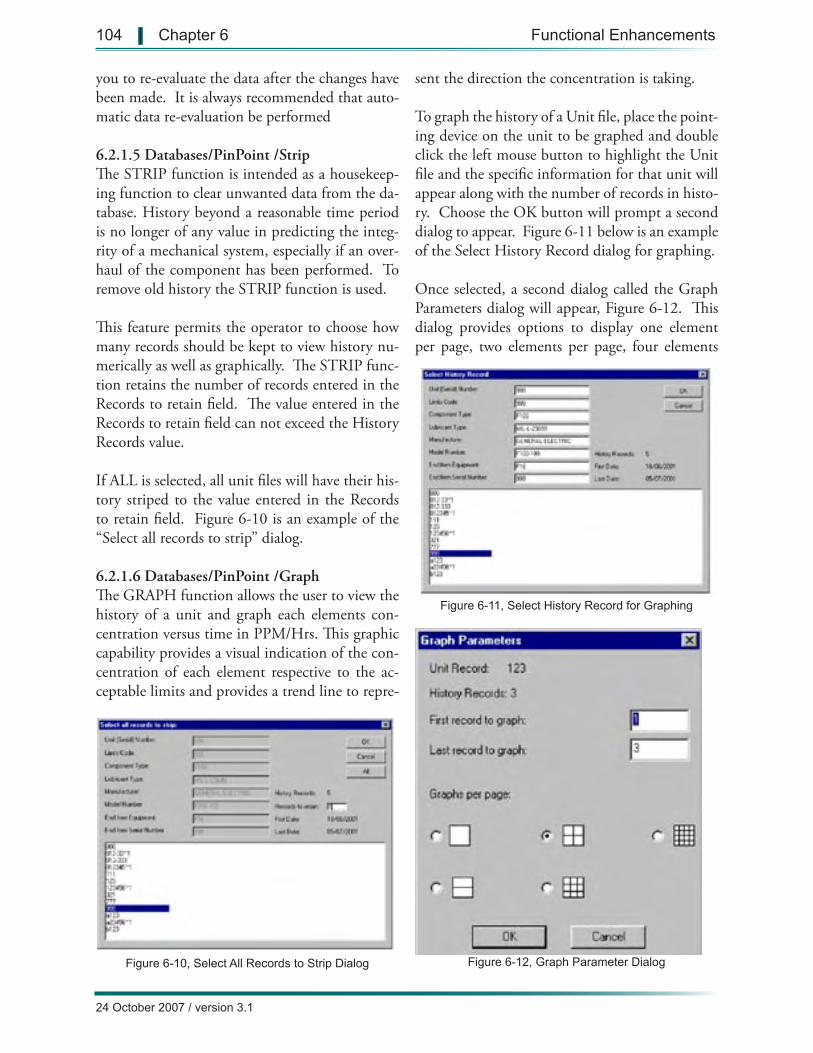
Figure 6-10, Select All Records to Strip Dialog Figure 6-12, Graph Parameter Dialog
Figure 6-11, Select History Record for Graphing
you to re-evaluate the data after the changes have been made. It is always recommended that auto-matic data re-evaluation be performed
6.2.1.5 Databases/PinPoint /StripThe STRIP function is intended as a housekeep-ing function to clear unwanted data from the da-tabase. History beyond a reasonable time period is no longer of any value in predicting the integ-rity of a mechanical system, especially if an over-haul of the component has been performed. To remove old history the STRIP function is used.
This feature permits the operator to choose how many records should be kept to view history nu-merically as well as graphically. The STRIP func-tion retains the number of records entered in the Records to retain field. The value entered in the Records to retain field can not exceed the History Records value.
If ALL is selected, all unit files will have their his-tory striped to the value entered in the Records to retain field. Figure 6-10 is an example of the “Select all records to strip” dialog.
6.2.1.6 Databases/PinPoint /GraphThe GRAPH function allows the user to view the history of a unit and graph each elements con-centration versus time in PPM/Hrs. This graphic capability provides a visual indication of the con-centration of each element respective to the ac-ceptable limits and provides a trend line to repre-
sent the direction the concentration is taking.
To graph the history of a Unit file, place the point-ing device on the unit to be graphed and double click the left mouse button to highlight the Unit file and the specific information for that unit will appear along with the number of records in histo-ry. Choose the OK button will prompt a second dialog to appear. Figure 6-11 below is an example of the Select History Record dialog for graphing.
Once selected, a second dialog called the Graph Parameters dialog will appear, Figure 6-12. This dialog provides options to display one element per page, two elements per page, four elements
104 | Chapter 6 Functional Enhancements
24 October 2007 / version 3.1
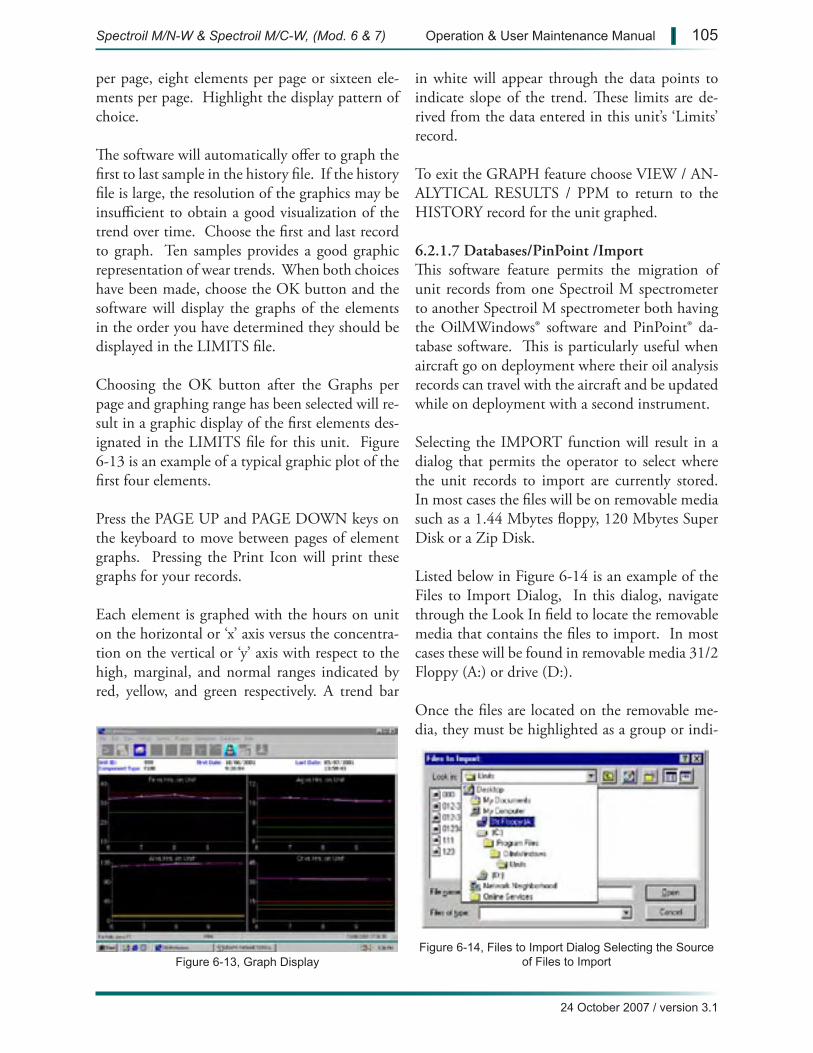
Figure 6-13, Graph DisplayFigure 6-14, Files to Import Dialog Selecting the Source
of Files to Import
per page, eight elements per page or sixteen ele-ments per page. Highlight the display pattern of choice.
The software will automatically offer to graph the first to last sample in the history file. If the history file is large, the resolution of the graphics may be insufficient to obtain a good visualization of the trend over time. Choose the first and last record to graph. Ten samples provides a good graphic representation of wear trends. When both choices have been made, choose the OK button and the software will display the graphs of the elements in the order you have determined they should be displayed in the LIMITS file.
Choosing the OK button after the Graphs per page and graphing range has been selected will re-sult in a graphic display of the first elements des-ignated in the LIMITS file for this unit. Figure 6-13 is an example of a typical graphic plot of the first four elements.
Press the PAGE UP and PAGE DOWN keys on the keyboard to move between pages of element graphs. Pressing the Print Icon will print these graphs for your records.
Each element is graphed with the hours on unit on the horizontal or ‘x’ axis versus the concentra-tion on the vertical or ‘y’ axis with respect to the high, marginal, and normal ranges indicated by red, yellow, and green respectively. A trend bar
in white will appear through the data points to indicate slope of the trend. These limits are de-rived from the data entered in this unit’s ‘Limits’ record.
To exit the GRAPH feature choose VIEW / AN-ALYTICAL RESULTS / PPM to return to the HISTORY record for the unit graphed.
6.2.1.7 Databases/PinPoint /ImportThis software feature permits the migration of unit records from one Spectroil M spectrometer to another Spectroil M spectrometer both having the OilMWindows® software and PinPoint® da-tabase software. This is particularly useful when aircraft go on deployment where their oil analysis records can travel with the aircraft and be updated while on deployment with a second instrument.
Selecting the IMPORT function will result in a dialog that permits the operator to select where the unit records to import are currently stored. In most cases the files will be on removable media such as a 1.44 Mbytes floppy, 120 Mbytes Super Disk or a Zip Disk.
Listed below in Figure 6-14 is an example of the Files to Import Dialog, In this dialog, navigate through the Look In field to locate the removable media that contains the files to import. In most cases these will be found in removable media 31/2 Floppy (A:) or drive (D:).
Once the files are located on the removable me-dia, they must be highlighted as a group or indi-
Spectroil M/N-W & Spectroil M/C-W, (Mod. 6 & 7) Operation & User Maintenance Manual | 105
24 October 2007 / version 3.1
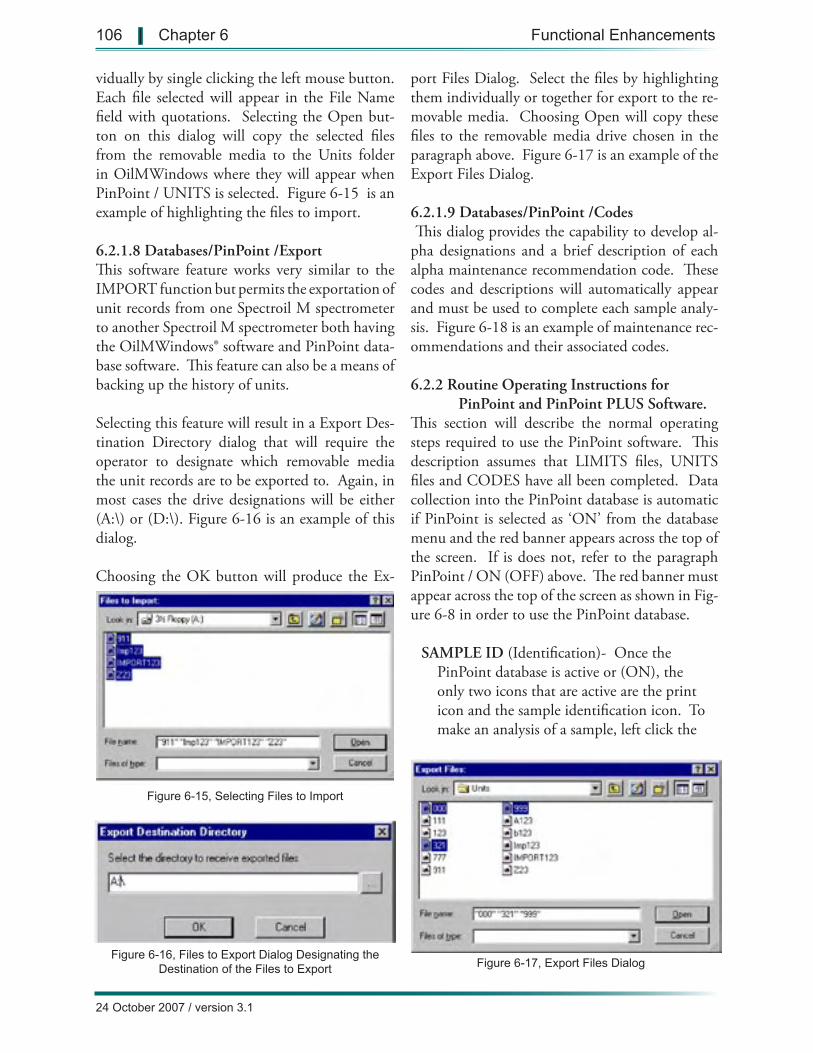
Figure 6-16, Files to Export Dialog Designating the Destination of the Files to Export
Figure 6-15, Selecting Files to Import
Figure 6-17, Export Files Dialog
vidually by single clicking the left mouse button. Each file selected will appear in the File Name field with quotations. Selecting the Open but-ton on this dialog will copy the selected files from the removable media to the Units folder in OilMWindows where they will appear when PinPoint / UNITS is selected. Figure 6-15 is an example of highlighting the files to import.
6.2.1.8 Databases/PinPoint /ExportThis software feature works very similar to the IMPORT function but permits the exportation of unit records from one Spectroil M spectrometer to another Spectroil M spectrometer both having the OilMWindows® software and PinPoint data-base software. This feature can also be a means of backing up the history of units.
Selecting this feature will result in a Export Des-tination Directory dialog that will require the operator to designate which removable media the unit records are to be exported to. Again, in most cases the drive designations will be either (A:\) or (D:\). Figure 6-16 is an example of this dialog.
Choosing the OK button will produce the Ex-
port Files Dialog. Select the files by highlighting them individually or together for export to the re-movable media. Choosing Open will copy these files to the removable media drive chosen in the paragraph above. Figure 6-17 is an example of the Export Files Dialog.
6.2.1.9 Databases/PinPoint /Codes This dialog provides the capability to develop al-pha designations and a brief description of each alpha maintenance recommendation code. These codes and descriptions will automatically appear and must be used to complete each sample analy-sis. Figure 6-18 is an example of maintenance rec-ommendations and their associated codes.
6.2.2 Routine Operating Instructions for PinPoint and PinPoint PLUS Software.
This section will describe the normal operating steps required to use the PinPoint software. This description assumes that LIMITS files, UNITS files and CODES have all been completed. Data collection into the PinPoint database is automatic if PinPoint is selected as ‘ON’ from the database menu and the red banner appears across the top of the screen. If is does not, refer to the paragraph PinPoint / ON (OFF) above. The red banner must appear across the top of the screen as shown in Fig-ure 6-8 in order to use the PinPoint database.
SAMPLE ID (Identification)- Once the PinPoint database is active or (ON), the only two icons that are active are the print icon and the sample identification icon. To make an analysis of a sample, left click the
106 | Chapter 6 Functional Enhancements
24 October 2007 / version 3.1
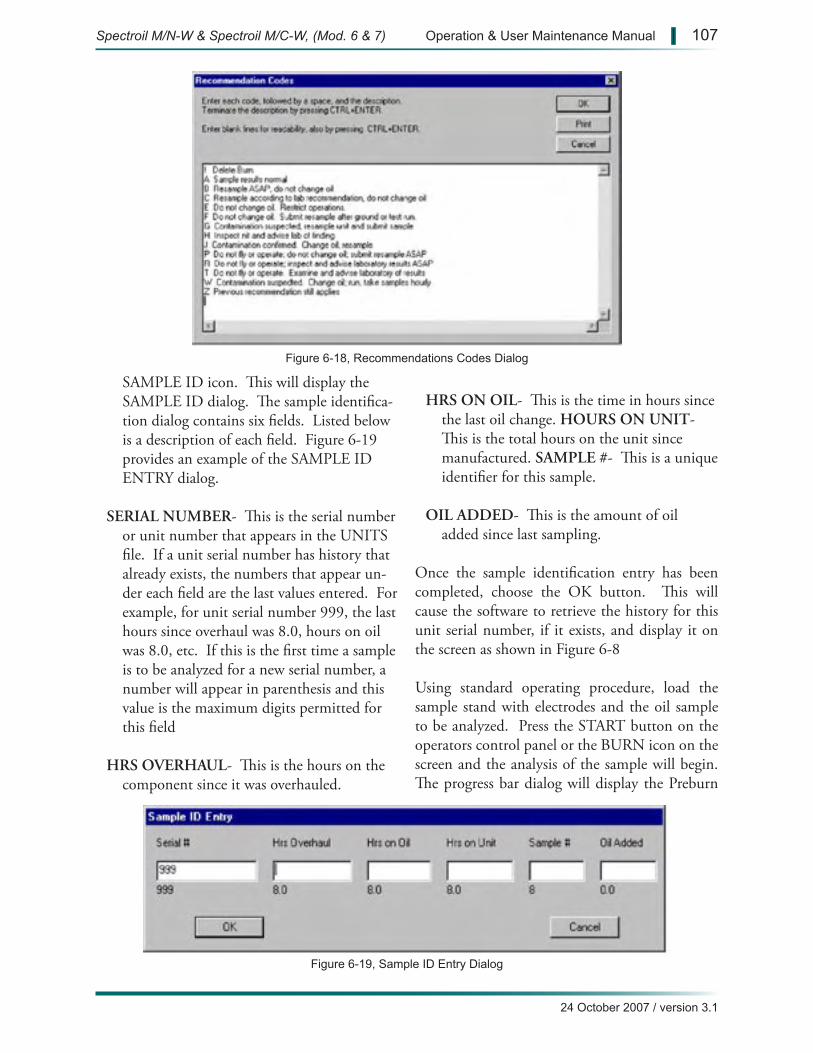
Figure 6-18, Recommendations Codes Dialog
Figure 6-19, Sample ID Entry Dialog
SAMPLE ID icon. This will display the SAMPLE ID dialog. The sample identifica-tion dialog contains six fields. Listed below is a description of each field. Figure 6-19 provides an example of the SAMPLE ID ENTRY dialog.
SERIAL NUMBER- This is the serial number or unit number that appears in the UNITS file. If a unit serial number has history that already exists, the numbers that appear un-der each field are the last values entered. For example, for unit serial number 999, the last hours since overhaul was 8.0, hours on oil was 8.0, etc. If this is the first time a sample is to be analyzed for a new serial number, a number will appear in parenthesis and this value is the maximum digits permitted for this field
HRS OVERHAUL- This is the hours on the component since it was overhauled.
HRS ON OIL- This is the time in hours since the last oil change. HOURS ON UNIT- This is the total hours on the unit since manufactured. SAMPLE #- This is a unique identifier for this sample.
OIL ADDED- This is the amount of oil added since last sampling.
Once the sample identification entry has been completed, choose the OK button. This will cause the software to retrieve the history for this unit serial number, if it exists, and display it on the screen as shown in Figure 6-8
Using standard operating procedure, load the sample stand with electrodes and the oil sample to be analyzed. Press the START button on the operators control panel or the BURN icon on the screen and the analysis of the sample will begin. The progress bar dialog will display the Preburn
Spectroil M/N-W & Spectroil M/C-W, (Mod. 6 & 7) Operation & User Maintenance Manual | 107
24 October 2007 / version 3.1
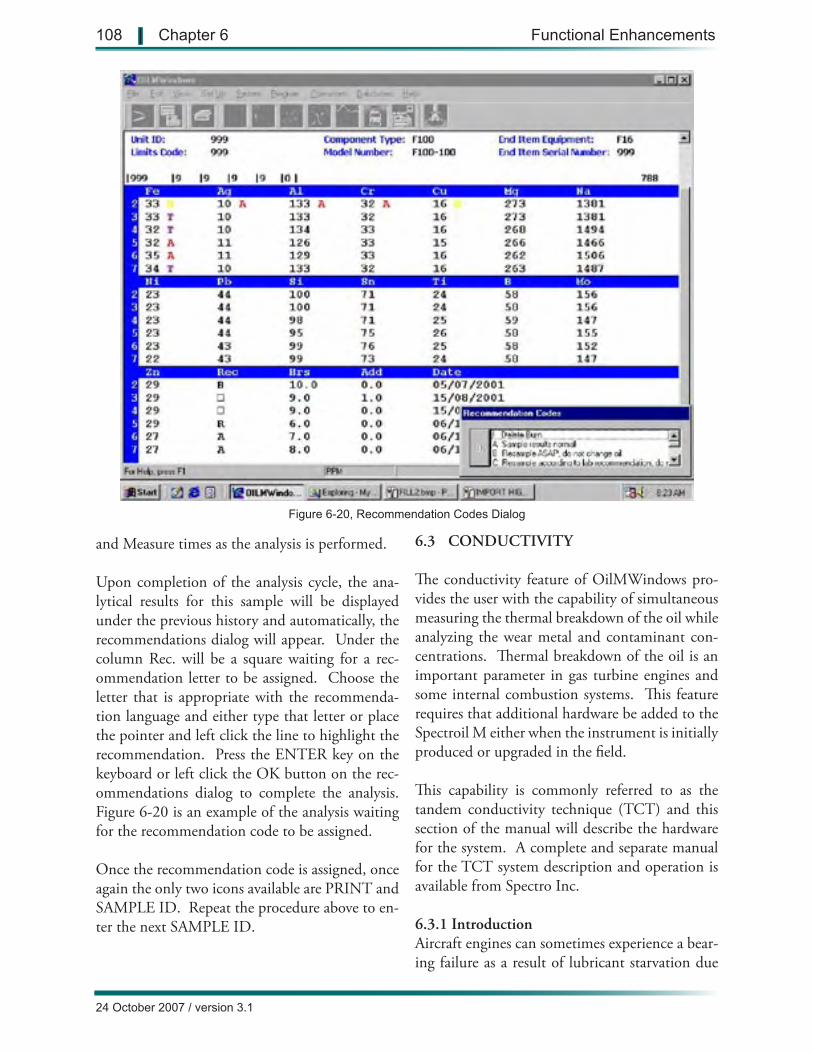
Figure 6-20, Recommendation Codes Dialog
and Measure times as the analysis is performed.
Upon completion of the analysis cycle, the ana-lytical results for this sample will be displayed under the previous history and automatically, the recommendations dialog will appear. Under the column Rec. will be a square waiting for a rec-ommendation letter to be assigned. Choose the letter that is appropriate with the recommenda-tion language and either type that letter or place the pointer and left click the line to highlight the recommendation. Press the ENTER key on the keyboard or left click the OK button on the rec-ommendations dialog to complete the analysis. Figure 6-20 is an example of the analysis waiting for the recommendation code to be assigned.
Once the recommendation code is assigned, once again the only two icons available are PRINT and SAMPLE ID. Repeat the procedure above to en-ter the next SAMPLE ID.
6.3 CONDUCTIVITY
The conductivity feature of OilMWindows pro-vides the user with the capability of simultaneous measuring the thermal breakdown of the oil while analyzing the wear metal and contaminant con-centrations. Thermal breakdown of the oil is an important parameter in gas turbine engines and some internal combustion systems. This feature requires that additional hardware be added to the Spectroil M either when the instrument is initially produced or upgraded in the field.
This capability is commonly referred to as the tandem conductivity technique (TCT) and this section of the manual will describe the hardware for the system. A complete and separate manual for the TCT system description and operation is available from Spectro Inc.
6.3.1 IntroductionAircraft engines can sometimes experience a bear-ing failure as a result of lubricant starvation due
108 | Chapter 6 Functional Enhancements
24 October 2007 / version 3.1

6-21, TCT Sample Holder in TCT Sample Table
to scavenge tube blockage by heavily coked oil. Oil samples prior to, and after the problem initia-tion, usually exhibit a blackened appearance and burnt odor. The condition has been called “Burnt Oil”.
The DOS or Windows® versions of the Spectroil M/N or M/C Oil Analysis Spectrometer equipped with the optional TCT technique can detect this condition so that corrective action can be taken prior to a major failure.
The Spectro TCT consists of a hardware and soft-ware upgrade to the standard Spectroil M/N or M/C. It can be installed in new spectrometers prior to delivery, or as an upgrade in the field to an existing Spectroil. The conductivity feature of the Spectroil M/N or M/C provides the user with the capability of simultaneously measuring the thermal breakdown of the oil while analyzing the wear metal and contaminant concentrations. The Tandem Conductivity Technique (TCT) performs a conductance measurement on a used oil sample to measure thermal breakdown. Con-ductance or (Electrochemical Conductivity) is defined as the ability of a substance to conduct electrical current, the reciprocal of resistance.
Conductance measurements of oil provide values proportional to the magnitude of oil degradation. A calibration is created using a precise zero base-line using a clean sample, and a known sample of specific degraded qualities. With this calibration, an unknown sample can be evaluated for devia-tion from the base line. Deviation is indicative of thermal and oxidative stressing of the oil.
6.3.2 BackgroundThe Tandem Conductivity Technique (TCT) was developed initially to help in early detection of “burnt oil” in F100-PW-100/200/220/229 en-gines. TCT is based on a technique developed by the University of Dayton and Wright Laboratories, WL/POSL*** and integrated into the Spectroil as an operational system by Spectro Inc.
* Centers, Phillip, Costandy Saba, James Wolf, “Tandem Tech-nique for Fluid Testing”, University of Dayton Invention Disclo-
sure #205.
6.3.3 The TCT SystemThe Spectroil M/N or Spectroil M/C spectrom-eter sample table, Figure 6-21, is modified to in-corporate the electrical connection of a TCT sam-ple vessel. When the sample table begins it’s travel in the upward or raised position, a spring loaded subassembly of the sample table lowers the spring contacts to engage the sample vessel tabs. The spring contacts compress on top of the tabs until the extension spring tension of the subassembly comes to equilibrium. This keeps the spring load of the contacts pressing on the tabs for good elec-trical contact as the table continues to be raised to the full indexed position for spectrometric mea-surement. The electrical wires are routed through insulating blocks on either side of the table.
The sample vessel, Figure 6-22, contains a sensor designed for high sensitivity. It uses coplanar elec-trodes of highly conductive copper with a large surface area sheathed in a protective alloy mate-rial and mounted on a non-conductive substrate. The sensor covers a rectangular area about 4 cm2, with electrodes that are about 300 micrometers in
Spectroil M/N-W & Spectroil M/C-W, (Mod. 6 & 7) Operation & User Maintenance Manual | 109
24 October 2007 / version 3.1

6-23, TCT Relay Card
6-24, TCT Circuit Board M561006-22, Sample Holder for TCT Analysis
width and positioned very closely so that the dis-tances between them are on the order of half their width. Any small changes in the conductance of the oil sample can be easily detected. The elec-trodes are connected to a circuit where the signal is amplified, integrated and displayed at the end of a normal spectrometric analysis.
The sample table is connected through the sample compartment bulkhead to a relay card, Figure 6-23. The relay card provides the TCT circuitry with electrical isolation during the sample burn process. The relay card is powered from a connec-tion to the interlock monitor and power board. There is a signal cable connection on the card that connects to the TCT circuit board.
The TCT circuitry is located on the TCT circuit board, Figure 5-24, which is mounted onto the second integrator board of the spectrometer elec-tronics. The TCT circuitry generates a waveform that is transmitted through grids in the sample
vessel. This waveform is then received on the other set of grids in the sample vessel. Through an amplification and comparative process, a con-ductivity voltage is generated. This voltage is then interpreted through the spectrometer analog to digital converter and read by the software.
6.3.4 TCT BenefitsTCT, when integrated with the Spectroil, pro-vides a one step solution for the analysis of wear metals, contaminants and sample conductivity in a used oil sample. The combination of the two tests, wear metals and “burnt oil” into one test reduces equipment needs, training, maintenance, and time.
Key features of the TCT are:
• Provides early detection of “Burnt Oil”• Conductivity measurement is part of routine
spectrometric analysis output data• Adds only 4 seconds to analysis time• Replaces the COBRA analysis• Can be installed as a field upgrade
110 | Chapter 6 Functional Enhancements
24 October 2007 / version 3.1
7.0 MAINTENANCE AND SERVICING INSTRUCTIONS
This chapter on maintenance and service instruc-tions for the Spectroil M is divided into seven sections.
Each section of this chapter is a stand-alone de-scription of tasks to be performed by personnel trained in the operation and preventive mainte-nance on the Spectroil M Oil and Fuel Analysis Spectrometer. The tasks include daily routine maintenance, periodic inspections, troubleshoot-ing fault isolation, repair and replacement and software restoration procedures. The seven main sections of this chapter are as follows:
7.1 Daily Operator Maintenance - Mainte-nance actions required by the operator on a daily basis.
7.2 Periodic Maintenance Inspections - Main-tenance required on the Spectroil M on a scheduled basis.
7.3 Fault Isolation - Troubleshooting charts to assist the technician in quickly locating a malfunction and making repairs or replacing components.
7.4 Procedure to Check the Frequency of the Excitation Source - Two test methods to check the excitation source frequency using the Source Frequency test Meter (SFTM).
7.5 Dark Current Electronic Stability Test - A diagnostic test to assure that the Spectroil M has achieved electronic stability.
7.6 Repair and Replacement Procedures - Step-by-step procedures for the repair, replacement, and alignment of spare parts included in maintenance kits.
7.7 Software Restoration - Instructions on replacing the original software delivered with the Spectroil M including reinstalling Windows® XP PRO, the touch panel driver and the process of configuring Windows® XP PRO for the best performance with the Spectroil M.
Chapter 7
Maintenance and Servicing Instructions
Spectroil M/N-W & Spectroil M/C-W, (Mod. 6 & 7) Operation & User Maintenance Manual | 111
24 October 2007 / version 3.1

7.1 DAILY OPERATOR MAINTENANCE
This section details the maintenance actions required of the operator on a daily basis. These mainte-nance actions pertain mainly to the operator accessible assemblies such as the sample stand, the read-out and control panel, and the automatic printer. Any maintenance that is required to be performed in the excitation source, optics, or computer electronics is strictly limited to technically skilled personnel. Table 7-1 lists each maintenance action that is authorized and required of the operator.
TABLE 7-1, DAILY OPERATOR MAINTENANCE
CAUTION: Do not use alcohol or Chlorinated Solvents to clean plastic or painted surfaces.
Component Required Maintenance Frequency Maintenance Level
Plate, Mounting, Sample Stand Component
Clean to remove oil and carbon buildup especialy between disc elec-trode shaft and rod electrode holder.
refer to Section 4.1.6.
Every 5 burns Operator
Window, Quartz, Protec-tive
Clean to remove oil and carbon splashes with isopropyl alcohol or
an ammonia based window cleaner. Refer to Section 4.1.6.3.
Every 5 burns Operator
Sensors, Sample Stand
Using a Q-tip, clean to remove oil and carbon splashes with isopro-pyl alcohol or an ammonia based
window cleaner. Refer to Section 3.3 and Figure 3-4.
Daily Operator
Sample Stand AreaClean complete sample chamber to remove oil splashes and carbon buildup. Refer to Section 4.1.6.2.
Twice Daily Operator
Door, Sample StandClean complete door to remove oil splashes and carbon buildup. Refer to Section 4.1.6.
Twice Daily Operator
Electrode Sharpener
Rotate cutting blade to new edge. (Can be performed until all three edges have been used.) Refer to Section 7.6.5.1.
As Required Operator
Panel, Readout and Control
Inspect for oil splashes and carbon residue. If present, remove with mild cleaning detergent.
Daily Operator
Frame and Exterior Panels
Inspect for oil splashes and dust buildup. If present, remove with mild detergent.CAUTION: DO NOT USE ALCO-HOL OR CHLORINATED SOL-VENTS TO CLEAN PLASTIC OR PAINTED SURFACES.
Daily Operator
Printer
Inspect for worn ribbon, loose cable connectors, and dirt and dust build-up. Replace worn ribbon, tighten loose connections and clean accord-ingly. Refer to printer operation and maintenance manual.
Daily Operator
24 October 2007 / version 3.1
112 | Chapter 7 Maintenance and Servicing Instructions
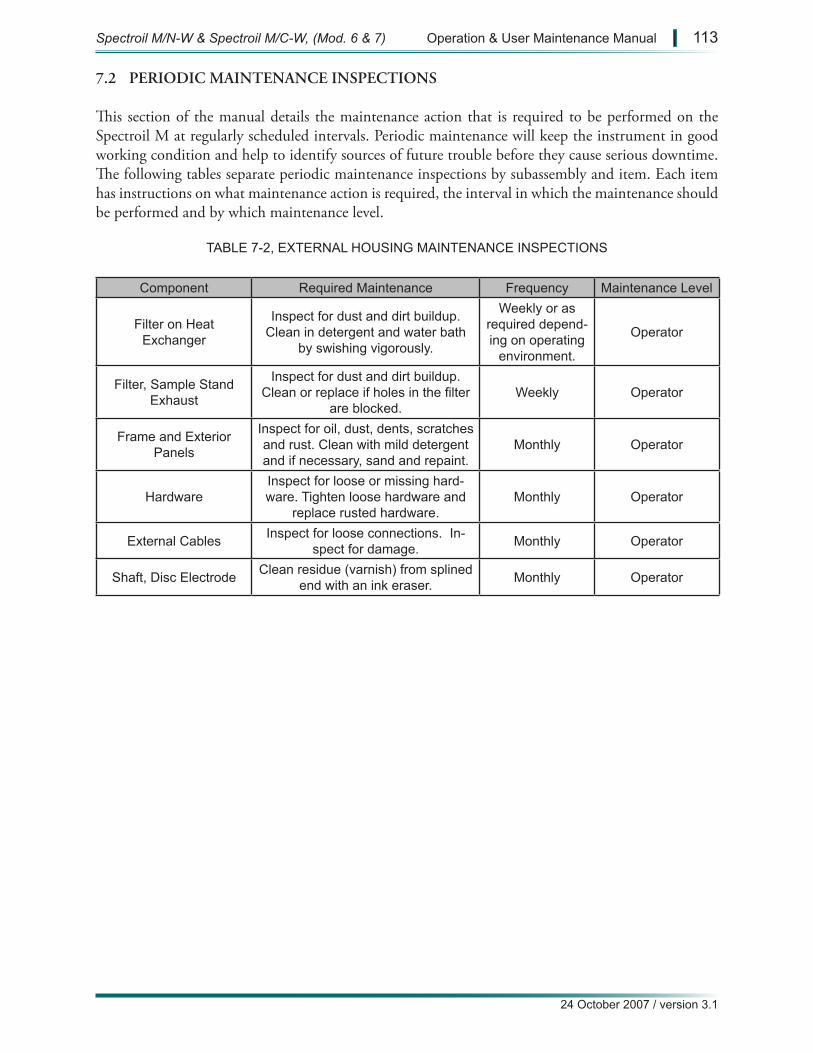
7.2 PERIODIC MAINTENANCE INSPECTIONS
This section of the manual details the maintenance action that is required to be performed on the Spectroil M at regularly scheduled intervals. Periodic maintenance will keep the instrument in good working condition and help to identify sources of future trouble before they cause serious downtime. The following tables separate periodic maintenance inspections by subassembly and item. Each item has instructions on what maintenance action is required, the interval in which the maintenance should be performed and by which maintenance level.
TABLE 7-2, EXTERNAL HOUSING MAINTENANCE INSPECTIONS
Component Required Maintenance Frequency Maintenance Level
Filter on Heat Exchanger
Inspect for dust and dirt buildup. Clean in detergent and water bath
by swishing vigorously.
Weekly or as required depend-ing on operating
environment.
Operator
Filter, Sample Stand Exhaust
Inspect for dust and dirt buildup. Clean or replace if holes in the filter
are blocked.Weekly Operator
Frame and Exterior Panels
Inspect for oil, dust, dents, scratches and rust. Clean with mild detergent and if necessary, sand and repaint.
Monthly Operator
HardwareInspect for loose or missing hard-ware. Tighten loose hardware and
replace rusted hardware.Monthly Operator
External Cables Inspect for loose connections. In-spect for damage. Monthly Operator
Shaft, Disc Electrode Clean residue (varnish) from splined end with an ink eraser. Monthly Operator
Spectroil M/N-W & Spectroil M/C-W, (Mod. 6 & 7) Operation & User Maintenance Manual | 113
24 October 2007 / version 3.1

TABLE 7-3, INTERNAL HOUSING MAINTENANCE INSPECTIONS
Component Required Maintenance Frequency Maintenance Level
Fans
Inspect for smooth rotation. Check for dust and dirt buildup on blades. Replace if binding is evident. Clean
blades if necessary. Frequency - Six months
Six Months Operator
WiringInspect for broken or bent wiring connections. Inspect for frayed or
burned insulation.Six Months Operator
Fuses Inspect for open or over rated fuse usage. Replace as required.
Six Months or as Required Operator
Transformers Inspect for good electrical connec-tion and signs of overheating.
Six Months or as Required Operator
Video Monitor Inspect for dust and dirt buildup.With a soft cloth, wipe clean if necessary. Six Months Operator
Signal Connectors
Inspect all connectors for proper seating in sockets.
CAUTION: Do not remove or connect any signal cables with the power on.
Six Months Operator
24 October 2007 / version 3.1
114 | Chapter 7 Maintenance and Servicing Instructions
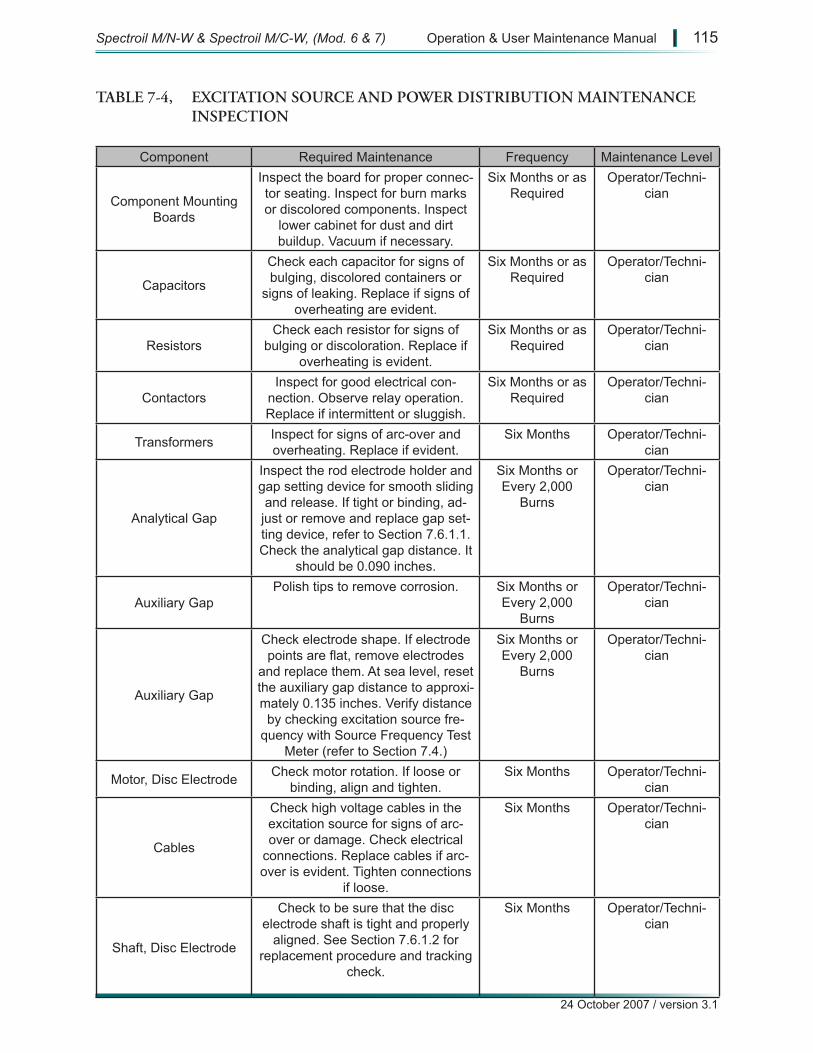
TABLE 7-4, EXCITATION SOURCE AND POWER DISTRIBUTION MAINTENANCE INSPECTION
Component Required Maintenance Frequency Maintenance Level
Component Mounting Boards
Inspect the board for proper connec-tor seating. Inspect for burn marks or discolored components. Inspect
lower cabinet for dust and dirt buildup. Vacuum if necessary.
Six Months or as Required
Operator/Techni-cian
Capacitors
Check each capacitor for signs of bulging, discolored containers or
signs of leaking. Replace if signs of overheating are evident.
Six Months or as Required
Operator/Techni-cian
ResistorsCheck each resistor for signs of
bulging or discoloration. Replace if overheating is evident.
Six Months or as Required
Operator/Techni-cian
ContactorsInspect for good electrical con-
nection. Observe relay operation. Replace if intermittent or sluggish.
Six Months or as Required
Operator/Techni-cian
Transformers Inspect for signs of arc-over and overheating. Replace if evident.
Six Months Operator/Techni-cian
Analytical Gap
Inspect the rod electrode holder and gap setting device for smooth sliding and release. If tight or binding, ad-just or remove and replace gap set-ting device, refer to Section 7.6.1.1. Check the analytical gap distance. It
should be 0.090 inches.
Six Months or Every 2,000
Burns
Operator/Techni-cian
Auxiliary GapPolish tips to remove corrosion. Six Months or
Every 2,000 Burns
Operator/Techni-cian
Auxiliary Gap
Check electrode shape. If electrode points are flat, remove electrodes
and replace them. At sea level, reset the auxiliary gap distance to approxi-mately 0.135 inches. Verify distance by checking excitation source fre-
quency with Source Frequency Test Meter (refer to Section 7.4.)
Six Months or Every 2,000
Burns
Operator/Techni-cian
Motor, Disc Electrode Check motor rotation. If loose or binding, align and tighten.
Six Months Operator/Techni-cian
Cables
Check high voltage cables in the excitation source for signs of arc-over or damage. Check electrical
connections. Replace cables if arc-over is evident. Tighten connections
if loose.
Six Months Operator/Techni-cian
Shaft, Disc Electrode
Check to be sure that the disc electrode shaft is tight and properly
aligned. See Section 7.6.1.2 for replacement procedure and tracking
check.
Six Months Operator/Techni-cian
Spectroil M/N-W & Spectroil M/C-W, (Mod. 6 & 7) Operation & User Maintenance Manual | 115
24 October 2007 / version 3.1
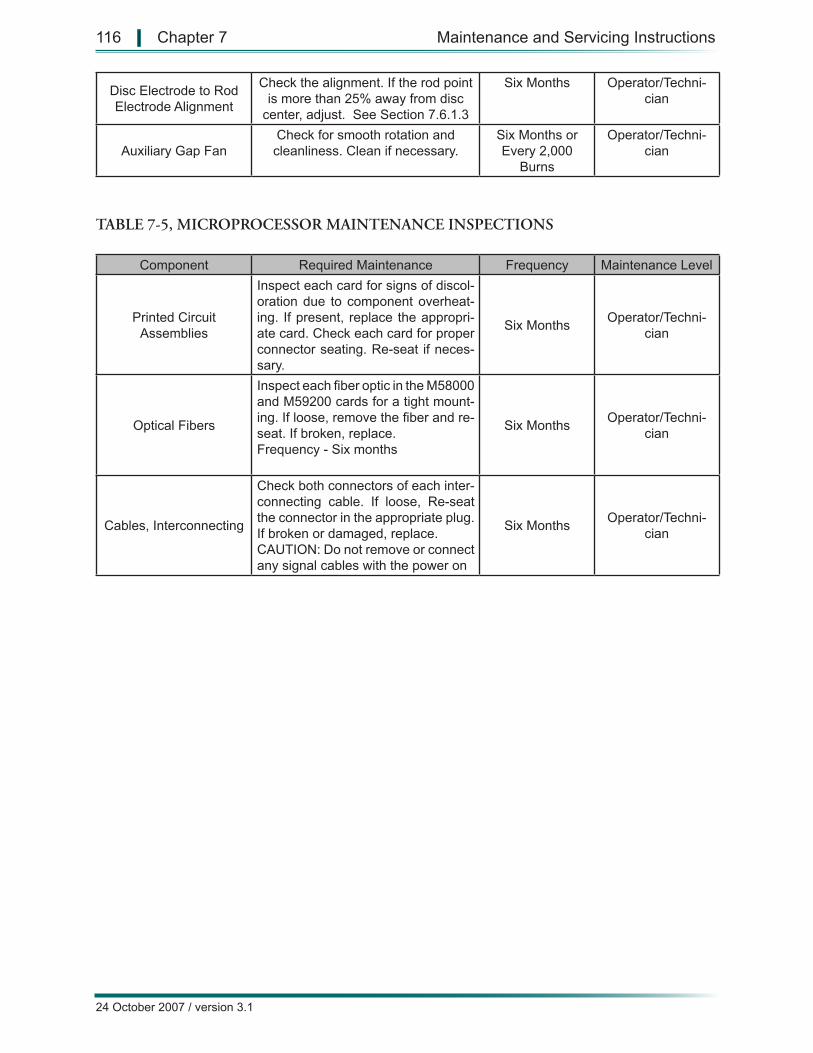
Disc Electrode to Rod Electrode Alignment
Check the alignment. If the rod point is more than 25% away from disc
center, adjust. See Section 7.6.1.3
Six Months Operator/Techni-cian
Auxiliary Gap FanCheck for smooth rotation and cleanliness. Clean if necessary.
Six Months or Every 2,000
Burns
Operator/Techni-cian
TABLE 7-5, MICROPROCESSOR MAINTENANCE INSPECTIONS
Component Required Maintenance Frequency Maintenance Level
Printed Circuit Assemblies
Inspect each card for signs of discol-oration due to component overheat-ing. If present, replace the appropri-ate card. Check each card for proper connector seating. Re-seat if neces-sary.
Six Months Operator/Techni-cian
Optical Fibers
Inspect each fiber optic in the M58000 and M59200 cards for a tight mount-ing. If loose, remove the fiber and re-seat. If broken, replace. Frequency - Six months
Six Months Operator/Techni-cian
Cables, Interconnecting
Check both connectors of each inter-connecting cable. If loose, Re-seat the connector in the appropriate plug. If broken or damaged, replace.CAUTION: Do not remove or connect any signal cables with the power on
Six Months Operator/Techni-cian
24 October 2007 / version 3.1
116 | Chapter 7 Maintenance and Servicing Instructions

7.3 FAULT ISOLATION
This section contains troubleshooting charts to assist the technicians in quickly locating a malfunc-tion and making repairs or replacing components. The charts are divided into the main spectrometer assemblies as follows:
7.3.1 Possible Sample Stand Faults 7.3.2 Possible Excitation Source Faults 7.3.3 Possible Optical Assembly Faults 7.3.4 Possible Computer Controller / Measurement Electronic Assembly Faults 7.3.5 Possible Main Power and Power Distribution Faults 7.3.6 Possible Printer Faults
The charts should be consulted based on the suspected location of a malfunction. Symptoms are listed in each section followed by several probable causes. Checks and tests that can be performed are followed by alternatives based on the test results.
WARNING: Only trained service technicians should perform some of the tests described in this sec-tion. High voltages may be present while conducting some of these tests. Observe all safety precautions.
Spectroil M/N-W & Spectroil M/C-W, (Mod. 6 & 7) Operation & User Maintenance Manual | 117
24 October 2007 / version 3.1

7.3.1 Possible Sample Stand Faults
Symptom:1. The instrument will not burn when the START button is pressed. 2. The instrument burns, but disc electrode does not rotate. 3. The sample stand exhaust fan does not operate. 4. An interlock error appears on screen. 5. The rod electrode slide mechanism does not operate smoothly. Sample Stand Symptom 1: The instrument will not burn when START button is pressed.
Probable Cause Check If Normal If Abnormal
MODE Switch is in STANDBY Mode
Check if MODE switch is in OPERATE position
The sample stand exhaust fan should be operating. Proceed to next probable cause.
Turn MODE switch to OPERATE
The software is not properly set to make a burn.
Check the bottom of the dispaly to make sure it says PPM in the Status Bar.
Proceed to next probable cause.
If the software is in a mode other than Analysis Program, refer to Chapter 5 to correct.
Sample stand monitor detects an improperly installed component in sample stand.
Interlock error will be displayed on screen. Press enter to display which sample stand component is causing the problem. This will be displayed in the upper right hand corner of the display.
Correct fault by reloading sample stand and closing the door. If interlock error still exists, refer to Symptom 4 for further fault isolation.
Proceed to next probable cause.
F1 (2.0 slo-blo fuse) on the power connection plate of the instrument is open.
Check F1 on the power connection plate on the right side of the instrument with a multimeter.
Proceed to next probable cause.
Replace fuse with 2.0 amp slo-blo fuse, see Figure 8-16.
START switch is defective.
Press F9 (START) on the keypad or the burn icon on the display.
If the burn starts, the START switch is defective or disconnected. See Section 7.6.4.11.
If Abnormal - Proceed to next probable cause.
F4 (5.0 amp fuse) is defective.
With a multimeter, check F4 on TB2.
Proceed to next probable cause.
Replace fuse with 5.0 amp fuse.
125 volts regu-lated AC is miss-ing or low.
Check the output on J2 on the power connection plate on the right side of the instrument with a multimeter. The voltage from pins A to B should be 125 volts AC.
Proceed to next probable cause.
If Abnormal - Refer to Section 7.3.5 for further fault isolation.
24 October 2007 / version 3.1
118 | Chapter 7 Maintenance and Servicing Instructions
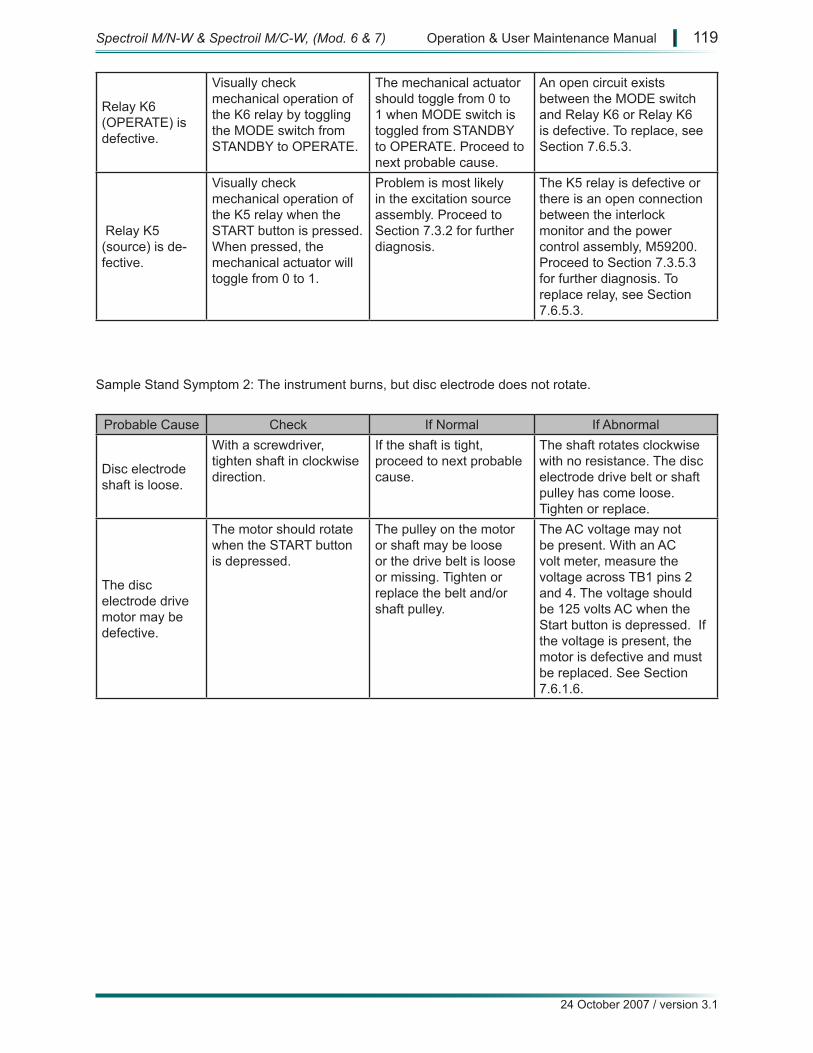
Relay K6 (OPERATE) is defective.
Visually check mechanical operation of the K6 relay by toggling the MODE switch from STANDBY to OPERATE.
The mechanical actuator should toggle from 0 to 1 when MODE switch is toggled from STANDBY to OPERATE. Proceed to next probable cause.
An open circuit exists between the MODE switch and Relay K6 or Relay K6 is defective. To replace, see Section 7.6.5.3.
Relay K5 (source) is de-fective.
Visually check mechanical operation of the K5 relay when the START button is pressed. When pressed, the mechanical actuator will toggle from 0 to 1.
Problem is most likely in the excitation source assembly. Proceed to Section 7.3.2 for further diagnosis.
The K5 relay is defective or there is an open connection between the interlock monitor and the power control assembly, M59200. Proceed to Section 7.3.5.3 for further diagnosis. To replace relay, see Section 7.6.5.3.
Sample Stand Symptom 2: The instrument burns, but disc electrode does not rotate.
Probable Cause Check If Normal If Abnormal
Disc electrode shaft is loose.
With a screwdriver, tighten shaft in clockwise direction.
If the shaft is tight, proceed to next probable cause.
The shaft rotates clockwise with no resistance. The disc electrode drive belt or shaft pulley has come loose. Tighten or replace.
The disc electrode drive motor may be defective.
The motor should rotate when the START button is depressed.
The pulley on the motor or shaft may be loose or the drive belt is loose or missing. Tighten or replace the belt and/or shaft pulley.
The AC voltage may not be present. With an AC volt meter, measure the voltage across TB1 pins 2 and 4. The voltage should be 125 volts AC when the Start button is depressed. If the voltage is present, the motor is defective and must be replaced. See Section 7.6.1.6.
Spectroil M/N-W & Spectroil M/C-W, (Mod. 6 & 7) Operation & User Maintenance Manual | 119
24 October 2007 / version 3.1
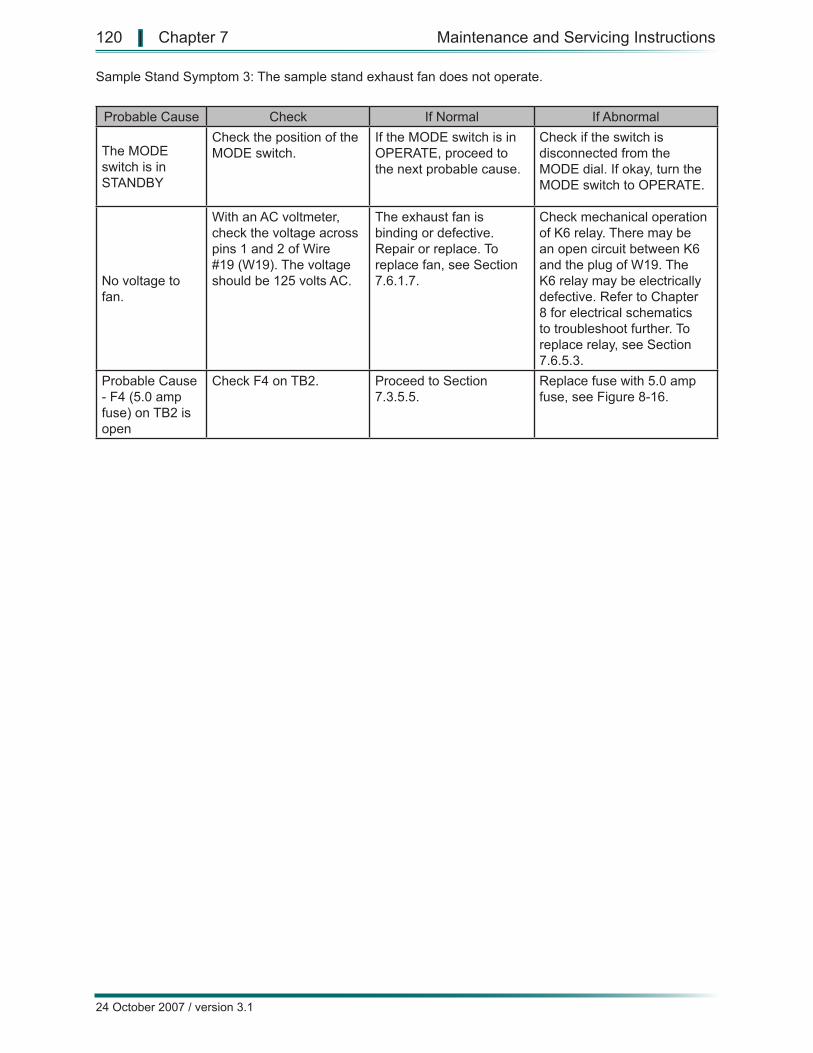
Sample Stand Symptom 3: The sample stand exhaust fan does not operate.
Probable Cause Check If Normal If Abnormal
The MODE switch is in STANDBY
Check the position of the MODE switch.
If the MODE switch is in OPERATE, proceed to the next probable cause.
Check if the switch is disconnected from the MODE dial. If okay, turn the MODE switch to OPERATE.
No voltage to fan.
With an AC voltmeter, check the voltage across pins 1 and 2 of Wire #19 (W19). The voltage should be 125 volts AC.
The exhaust fan is binding or defective. Repair or replace. To replace fan, see Section 7.6.1.7.
Check mechanical operation of K6 relay. There may be an open circuit between K6 and the plug of W19. The K6 relay may be electrically defective. Refer to Chapter 8 for electrical schematics to troubleshoot further. To replace relay, see Section 7.6.5.3.
Probable Cause - F4 (5.0 amp fuse) on TB2 is open
Check F4 on TB2. Proceed to Section 7.3.5.5.
Replace fuse with 5.0 amp fuse, see Figure 8-16.
24 October 2007 / version 3.1
120 | Chapter 7 Maintenance and Servicing Instructions
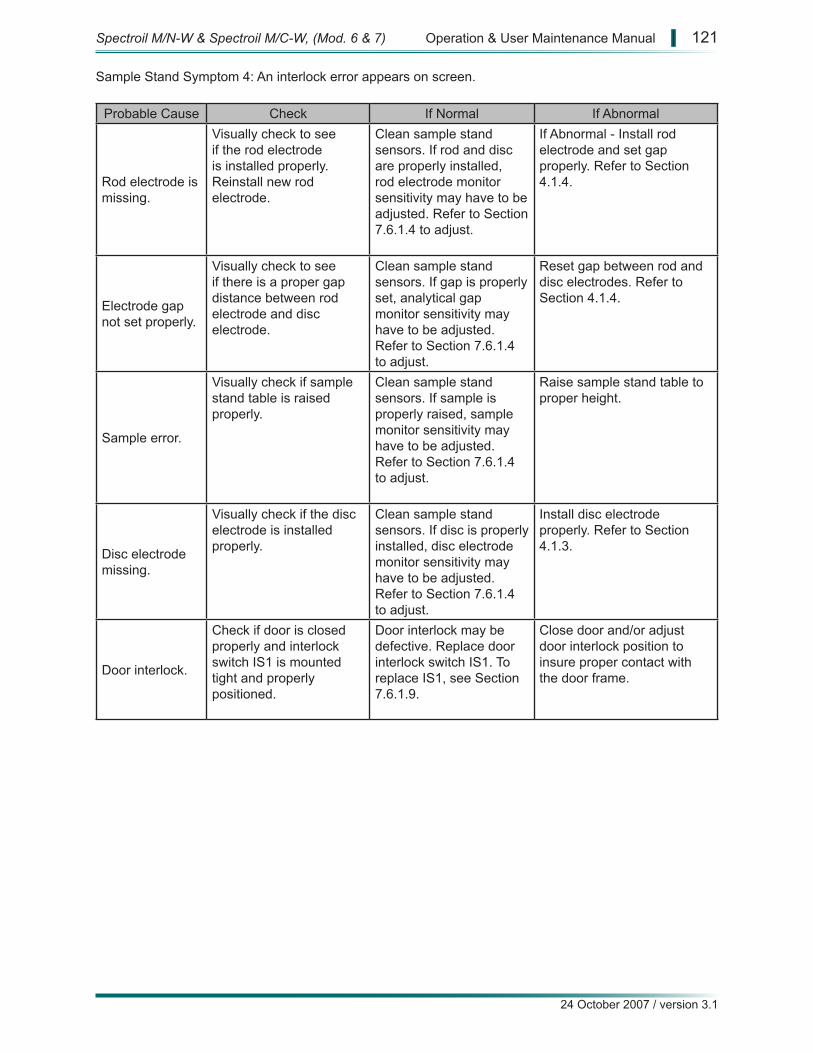
Sample Stand Symptom 4: An interlock error appears on screen.
Probable Cause Check If Normal If Abnormal
Rod electrode is missing.
Visually check to see if the rod electrode is installed properly. Reinstall new rod electrode.
Clean sample stand sensors. If rod and disc are properly installed, rod electrode monitor sensitivity may have to be adjusted. Refer to Section 7.6.1.4 to adjust.
If Abnormal - Install rod electrode and set gap properly. Refer to Section 4.1.4.
Electrode gap not set properly.
Visually check to see if there is a proper gap distance between rod electrode and disc electrode.
Clean sample stand sensors. If gap is properly set, analytical gap monitor sensitivity may have to be adjusted. Refer to Section 7.6.1.4 to adjust.
Reset gap between rod and disc electrodes. Refer to Section 4.1.4.
Sample error.
Visually check if sample stand table is raised properly.
Clean sample stand sensors. If sample is properly raised, sample monitor sensitivity may have to be adjusted. Refer to Section 7.6.1.4 to adjust.
Raise sample stand table to proper height.
Disc electrode missing.
Visually check if the disc electrode is installed properly.
Clean sample stand sensors. If disc is properly installed, disc electrode monitor sensitivity may have to be adjusted. Refer to Section 7.6.1.4 to adjust.
Install disc electrode properly. Refer to Section 4.1.3.
Door interlock.
Check if door is closed properly and interlock switch IS1 is mounted tight and properly positioned.
Door interlock may be defective. Replace door interlock switch IS1. To replace IS1, see Section 7.6.1.9.
Close door and/or adjust door interlock position to insure proper contact with the door frame.
Spectroil M/N-W & Spectroil M/C-W, (Mod. 6 & 7) Operation & User Maintenance Manual | 121
24 October 2007 / version 3.1
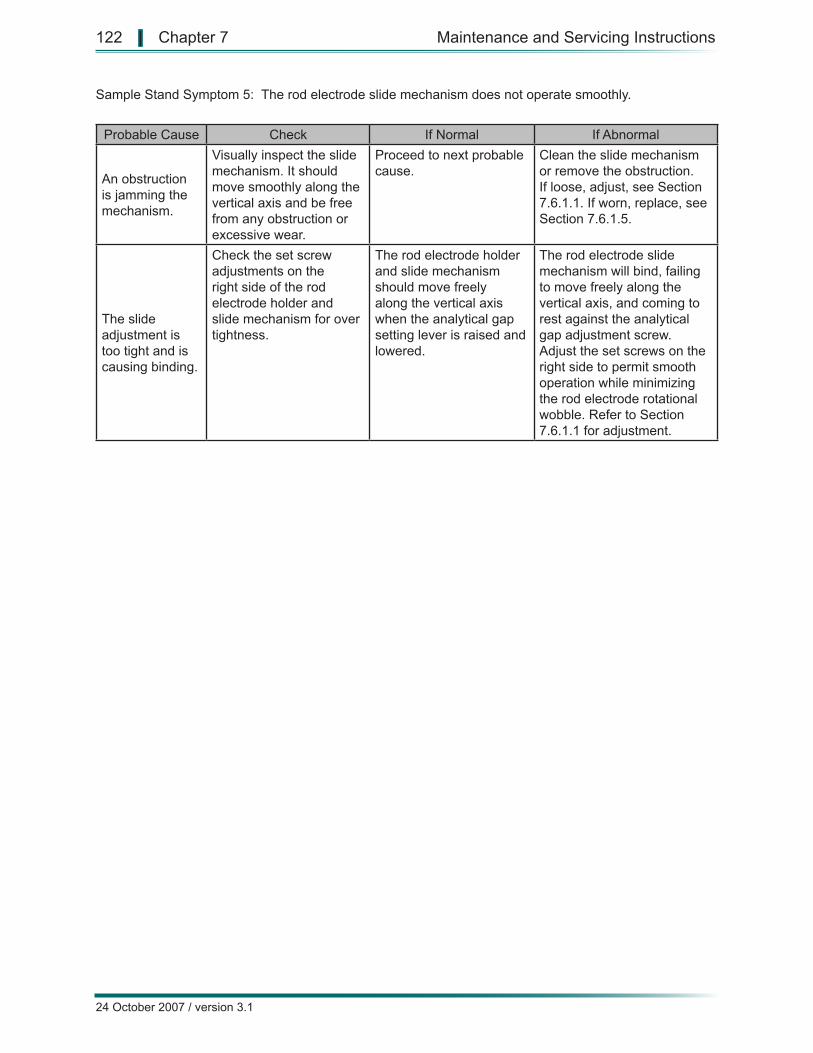
Sample Stand Symptom 5: The rod electrode slide mechanism does not operate smoothly.
Probable Cause Check If Normal If Abnormal
An obstruction is jamming the mechanism.
Visually inspect the slide mechanism. It should move smoothly along the vertical axis and be free from any obstruction or excessive wear.
Proceed to next probable cause.
Clean the slide mechanism or remove the obstruction. If loose, adjust, see Section 7.6.1.1. If worn, replace, see Section 7.6.1.5.
The slide adjustment is too tight and is causing binding.
Check the set screw adjustments on the right side of the rod electrode holder and slide mechanism for over tightness.
The rod electrode holder and slide mechanism should move freely along the vertical axis when the analytical gap setting lever is raised and lowered.
The rod electrode slide mechanism will bind, failing to move freely along the vertical axis, and coming to rest against the analytical gap adjustment screw. Adjust the set screws on the right side to permit smooth operation while minimizing the rod electrode rotational wobble. Refer to Section 7.6.1.1 for adjustment.
24 October 2007 / version 3.1
122 | Chapter 7 Maintenance and Servicing Instructions

7.3.2 Possible Excitation Source Faults
Symptom:1. The excitation source will not arc across the analytical gap.2. An arc occurs across the analytical gap but is very weak. 3. An arc occurs across the analytical gap but holds off or is intermittent. 4. An intermittent snapping sound can be heard from the excitation source. 6. All elements have poor repeatability in all readout modes.7. The excitation source fuse F1 blows.
Excitation Source Symptom 1: The excitation source will not arc across the analytical gap.
Probable Cause Check If Normal If AbnormalThe MODE switch is in the STANDBY position.
Visually check the position of the MODE switch. It should be in the OPERATE position.
The sample stand exhaust fan should be operating. Proceed to next probable cause.
Place the MODE switch in the OPERATE position.
The software is not properly set to make a burn
Check the bottom of the display to make sure it says PPM in the status bar.
Proceed to next probable cause.
If the software is in a mode other than PPM, refer to Section 5.4.4.3 to correct.
F1 (2.0 amp slo-blo fuse) is open.
Check F1 on the power connection plate on the right side of the instrument.
Proceed to next probable cause.
Replace fuse with 2.0 amp slo-blo fuse, see Figure 8-14.
Sample stand monitor detects an improperly installed component.
Check for proper installation and positioning of sample stand components. Correct the sample stand installation and positioning error.
Clean sample stand sensors or adjust appropriate sample stand monitor. Proceed to next probable cause.
Correct the sample stand installation and positioning error.
125 Volts AC is missing or low.
Measure the voltage on J2 from pins A to B with a multimeter set to measure AC voltage.
The voltage should be 125 volts AC. Proceed to next probable cause.
Refer to Section 7.3.5 for additional troubleshooting tips.
K5 may not be electronically activating.
Visually inspect the mechanical activation of Relay K5 in the input power distribution assembly. Refer to Input Power Distribution Diagrams in Section 9.2.3 and 9.2.4 for further circuit analysis. When the START button is pressed, the mechanical actuator should move from the 0 position to the 1 position and measure the AC voltage on TB-3 on the schematic in Section 9.2.10 or 9.2.11. If the voltages on TB-3 and TB-4 are present, the problem must be within the excitation source assembly. Refer to 9.2.10 or 9.2.11 for further circuit analysis and proceed to next probable cause.
The actuator is magnetically activated, but the contacts of K5 may be defective and must be replaced or a fault may exist in the excitation source circuitry. Refer to Sample Stand Schematic Diagram on page 9-11 for further circuit analysis. Proceed to Section 7.3.4 for further fault isolation.
The energizing coil of the contactor may be defective or the energizing voltage may be missing (24 volts DC). Measure DC voltage across A1 and A2 on Relay K5 when the START button is depressed. If the voltage is present, the coil is defective and K5 should be replaced, see Section 7.6.5.3. If voltage is missing, refer to Section 7.3.4.3 for additional troubleshooting tips.
Spectroil M/N-W & Spectroil M/C-W, (Mod. 6 & 7) Operation & User Maintenance Manual | 123
24 October 2007 / version 3.1
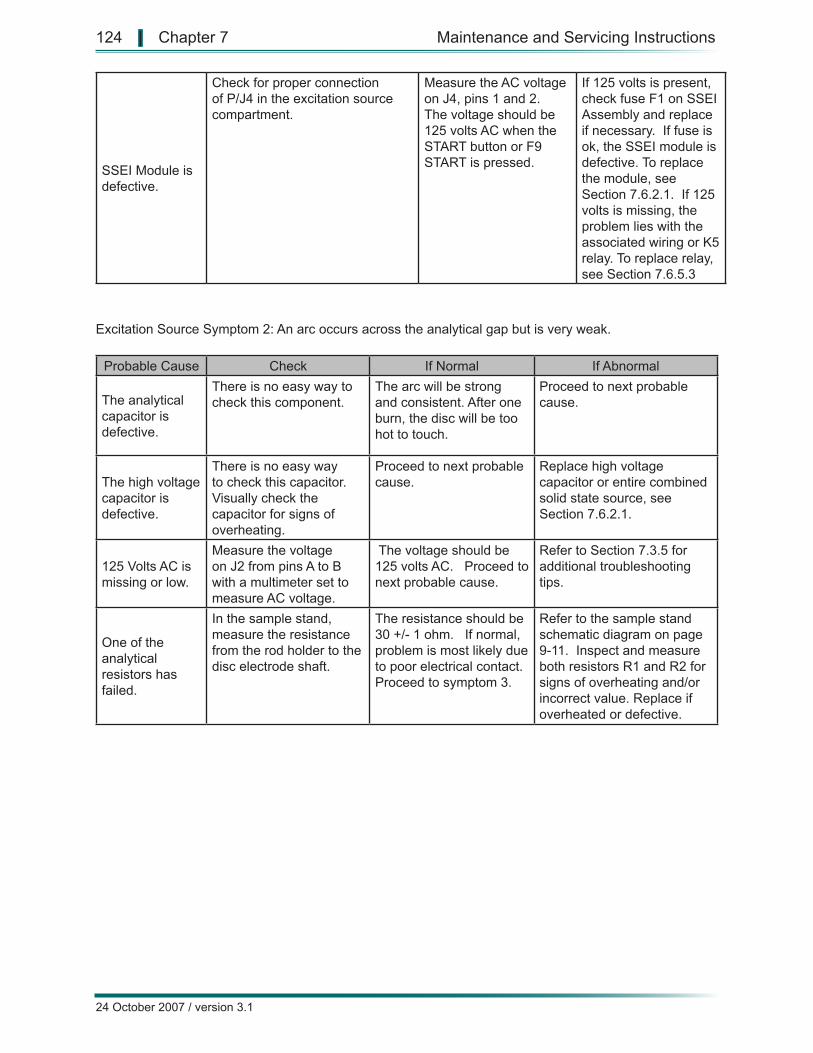
SSEI Module is defective.
Check for proper connection of P/J4 in the excitation source compartment.
Measure the AC voltage on J4, pins 1 and 2. The voltage should be 125 volts AC when the START button or F9 START is pressed.
If 125 volts is present, check fuse F1 on SSEI Assembly and replace if necessary. If fuse is ok, the SSEI module is defective. To replace the module, see Section 7.6.2.1. If 125 volts is missing, the problem lies with the associated wiring or K5 relay. To replace relay, see Section 7.6.5.3
Excitation Source Symptom 2: An arc occurs across the analytical gap but is very weak.
Probable Cause Check If Normal If Abnormal
The analytical capacitor is defective.
There is no easy way to check this component.
The arc will be strong and consistent. After one burn, the disc will be too hot to touch.
Proceed to next probable cause.
The high voltage capacitor is defective.
There is no easy way to check this capacitor. Visually check the capacitor for signs of overheating.
Proceed to next probable cause.
Replace high voltage capacitor or entire combined solid state source, see Section 7.6.2.1.
125 Volts AC is missing or low.
Measure the voltage on J2 from pins A to B with a multimeter set to measure AC voltage.
The voltage should be 125 volts AC. Proceed to next probable cause.
Refer to Section 7.3.5 for additional troubleshooting tips.
One of the analytical resistors has failed.
In the sample stand, measure the resistance from the rod holder to the disc electrode shaft.
The resistance should be 30 +/- 1 ohm. If normal, problem is most likely due to poor electrical contact. Proceed to symptom 3.
Refer to the sample stand schematic diagram on page 9-11. Inspect and measure both resistors R1 and R2 for signs of overheating and/or incorrect value. Replace if overheated or defective.
24 October 2007 / version 3.1
124 | Chapter 7 Maintenance and Servicing Instructions
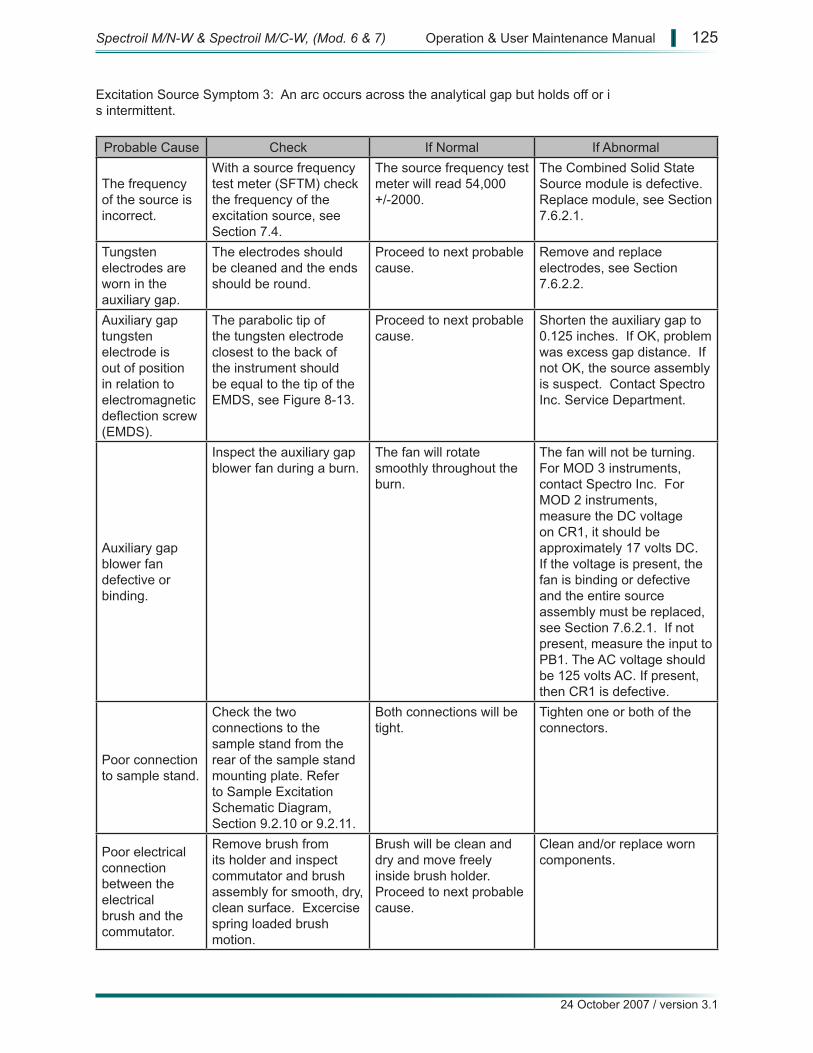
Excitation Source Symptom 3: An arc occurs across the analytical gap but holds off or is intermittent.
Probable Cause Check If Normal If Abnormal
The frequency of the source is incorrect.
With a source frequency test meter (SFTM) check the frequency of the excitation source, see Section 7.4.
The source frequency test meter will read 54,000 +/-2000.
The Combined Solid State Source module is defective. Replace module, see Section 7.6.2.1.
Tungsten electrodes are worn in the auxiliary gap.
The electrodes should be cleaned and the ends should be round.
Proceed to next probable cause.
Remove and replace electrodes, see Section 7.6.2.2.
Auxiliary gap tungsten electrode is out of position in relation to electromagnetic deflection screw (EMDS).
The parabolic tip of the tungsten electrode closest to the back of the instrument should be equal to the tip of the EMDS, see Figure 8-13.
Proceed to next probable cause.
Shorten the auxiliary gap to 0.125 inches. If OK, problem was excess gap distance. If not OK, the source assembly is suspect. Contact Spectro Inc. Service Department.
Auxiliary gap blower fan defective or binding.
Inspect the auxiliary gap blower fan during a burn.
The fan will rotate smoothly throughout the burn.
The fan will not be turning. For MOD 3 instruments, contact Spectro Inc. For MOD 2 instruments, measure the DC voltage on CR1, it should be approximately 17 volts DC. If the voltage is present, the fan is binding or defective and the entire source assembly must be replaced, see Section 7.6.2.1. If not present, measure the input to PB1. The AC voltage should be 125 volts AC. If present, then CR1 is defective.
Poor connection to sample stand.
Check the two connections to the sample stand from the rear of the sample stand mounting plate. Refer to Sample Excitation Schematic Diagram, Section 9.2.10 or 9.2.11.
Both connections will be tight.
Tighten one or both of the connectors.
Poor electrical connection between the electrical brush and the commutator.
Remove brush from its holder and inspect commutator and brush assembly for smooth, dry, clean surface. Excercise spring loaded brush motion.
Brush will be clean and dry and move freely inside brush holder. Proceed to next probable cause.
Clean and/or replace worn components.
Spectroil M/N-W & Spectroil M/C-W, (Mod. 6 & 7) Operation & User Maintenance Manual | 125
24 October 2007 / version 3.1
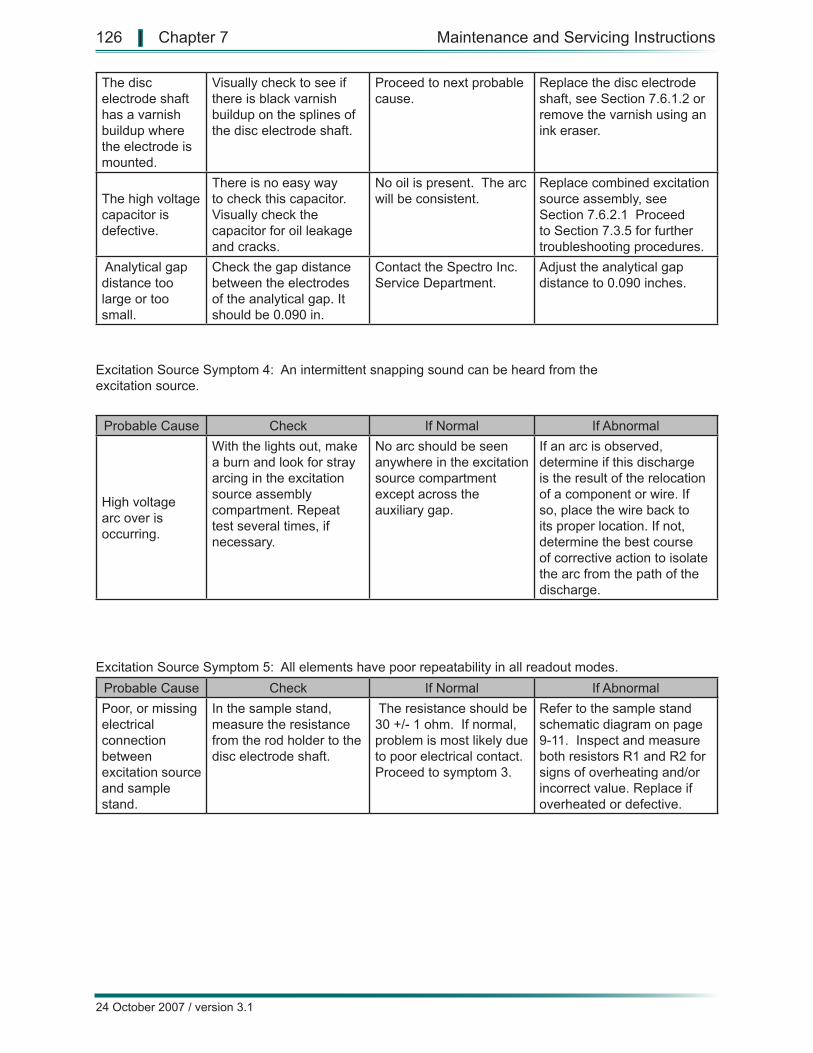
The disc electrode shaft has a varnish buildup where the electrode is mounted.
Visually check to see if there is black varnish buildup on the splines of the disc electrode shaft.
Proceed to next probable cause.
Replace the disc electrode shaft, see Section 7.6.1.2 or remove the varnish using an ink eraser.
The high voltage capacitor is defective.
There is no easy way to check this capacitor. Visually check the capacitor for oil leakage and cracks.
No oil is present. The arc will be consistent.
Replace combined excitation source assembly, see Section 7.6.2.1 Proceed to Section 7.3.5 for further troubleshooting procedures.
Analytical gap distance too large or too small.
Check the gap distance between the electrodes of the analytical gap. It should be 0.090 in.
Contact the Spectro Inc. Service Department.
Adjust the analytical gap distance to 0.090 inches.
Excitation Source Symptom 4: An intermittent snapping sound can be heard from the excitation source.
Probable Cause Check If Normal If Abnormal
High voltage arc over is occurring.
With the lights out, make a burn and look for stray arcing in the excitation source assembly compartment. Repeat test several times, if necessary.
No arc should be seen anywhere in the excitation source compartment except across the auxiliary gap.
If an arc is observed, determine if this discharge is the result of the relocation of a component or wire. If so, place the wire back to its proper location. If not, determine the best course of corrective action to isolate the arc from the path of the discharge.
Excitation Source Symptom 5: All elements have poor repeatability in all readout modes. Probable Cause Check If Normal If AbnormalPoor, or missing electrical connection between excitation source and sample stand.
In the sample stand, measure the resistance from the rod holder to the disc electrode shaft.
The resistance should be 30 +/- 1 ohm. If normal, problem is most likely due to poor electrical contact. Proceed to symptom 3.
Refer to the sample stand schematic diagram on page 9-11. Inspect and measure both resistors R1 and R2 for signs of overheating and/or incorrect value. Replace if overheated or defective.
24 October 2007 / version 3.1
126 | Chapter 7 Maintenance and Servicing Instructions
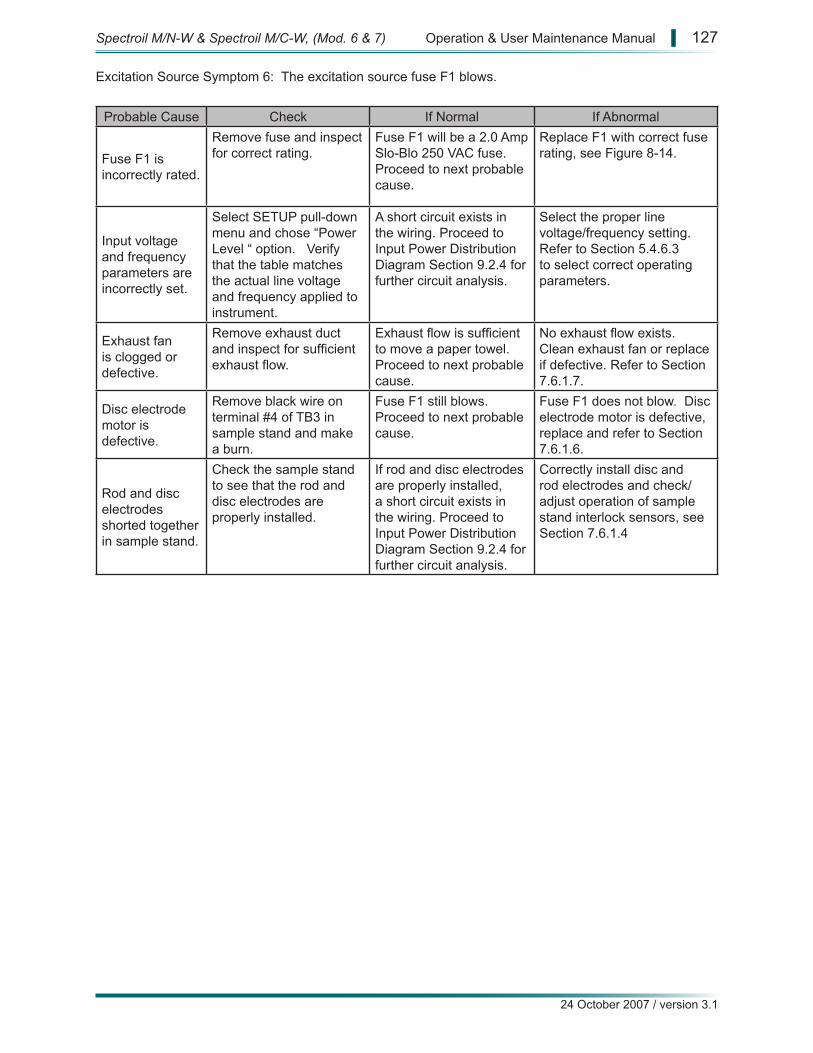
Excitation Source Symptom 6: The excitation source fuse F1 blows.
Probable Cause Check If Normal If Abnormal
Fuse F1 is incorrectly rated.
Remove fuse and inspect for correct rating.
Fuse F1 will be a 2.0 Amp Slo-Blo 250 VAC fuse. Proceed to next probable cause.
Replace F1 with correct fuse rating, see Figure 8-14.
Input voltage and frequency parameters are incorrectly set.
Select SETUP pull-down menu and chose “Power Level “ option. Verify that the table matches the actual line voltage and frequency applied to instrument.
A short circuit exists in the wiring. Proceed to Input Power Distribution Diagram Section 9.2.4 for further circuit analysis.
Select the proper line voltage/frequency setting. Refer to Section 5.4.6.3 to select correct operating parameters.
Exhaust fan is clogged or defective.
Remove exhaust duct and inspect for sufficient exhaust flow.
Exhaust flow is sufficient to move a paper towel. Proceed to next probable cause.
No exhaust flow exists. Clean exhaust fan or replace if defective. Refer to Section 7.6.1.7.
Disc electrode motor is defective.
Remove black wire on terminal #4 of TB3 in sample stand and make a burn.
Fuse F1 still blows. Proceed to next probable cause.
Fuse F1 does not blow. Disc electrode motor is defective, replace and refer to Section 7.6.1.6.
Rod and disc electrodes shorted together in sample stand.
Check the sample stand to see that the rod and disc electrodes are properly installed.
If rod and disc electrodes are properly installed, a short circuit exists in the wiring. Proceed to Input Power Distribution Diagram Section 9.2.4 for further circuit analysis.
Correctly install disc and rod electrodes and check/adjust operation of sample stand interlock sensors, see Section 7.6.1.4
Spectroil M/N-W & Spectroil M/C-W, (Mod. 6 & 7) Operation & User Maintenance Manual | 127
24 October 2007 / version 3.1
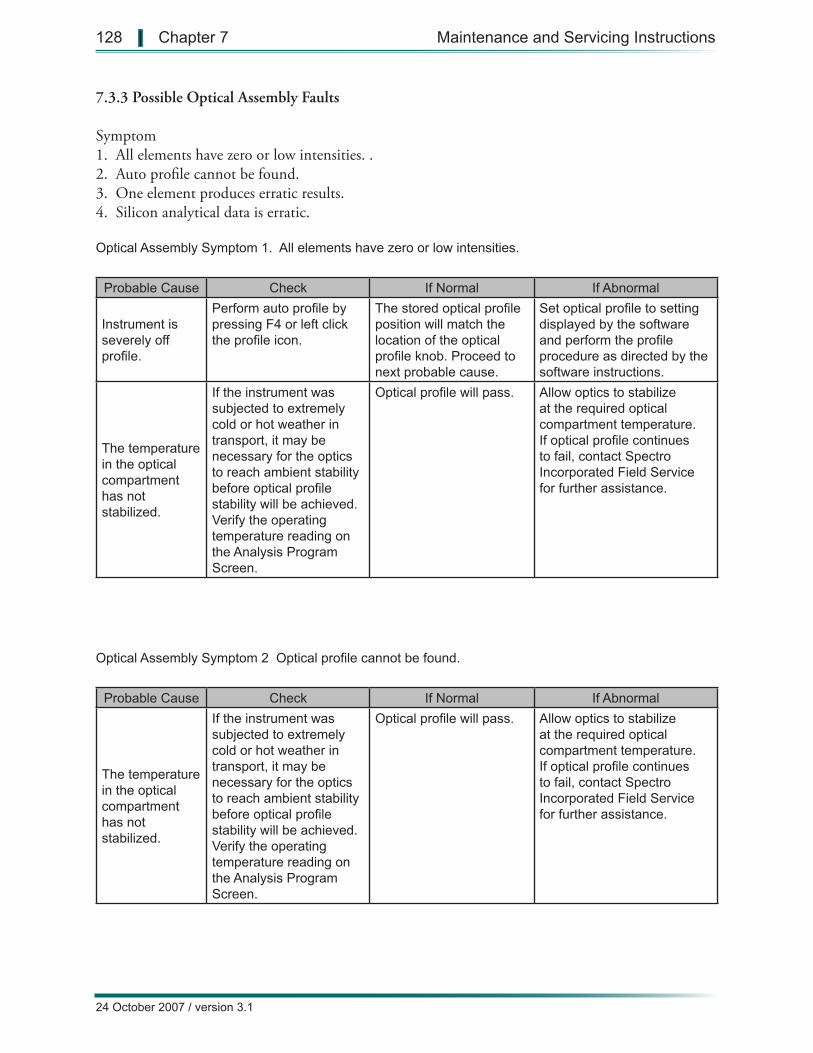
7.3.3 Possible Optical Assembly Faults
Symptom1. All elements have zero or low intensities. . 2. Auto profile cannot be found. 3. One element produces erratic results. 4. Silicon analytical data is erratic.
Optical Assembly Symptom 1. All elements have zero or low intensities.
Probable Cause Check If Normal If Abnormal
Instrument is severely off profile.
Perform auto profile by pressing F4 or left click the profile icon.
The stored optical profile position will match the location of the optical profile knob. Proceed to next probable cause.
Set optical profile to setting displayed by the software and perform the profile procedure as directed by the software instructions.
The temperature in the optical compartment has not stabilized.
If the instrument was subjected to extremely cold or hot weather in transport, it may be necessary for the optics to reach ambient stability before optical profile stability will be achieved. Verify the operating temperature reading on the Analysis Program Screen.
Optical profile will pass. Allow optics to stabilize at the required optical compartment temperature. If optical profile continues to fail, contact Spectro Incorporated Field Service for further assistance.
Optical Assembly Symptom 2 Optical profile cannot be found.
Probable Cause Check If Normal If Abnormal
The temperature in the optical compartment has not stabilized.
If the instrument was subjected to extremely cold or hot weather in transport, it may be necessary for the optics to reach ambient stability before optical profile stability will be achieved. Verify the operating temperature reading on the Analysis Program Screen.
Optical profile will pass. Allow optics to stabilize at the required optical compartment temperature. If optical profile continues to fail, contact Spectro Incorporated Field Service for further assistance.
24 October 2007 / version 3.1
128 | Chapter 7 Maintenance and Servicing Instructions
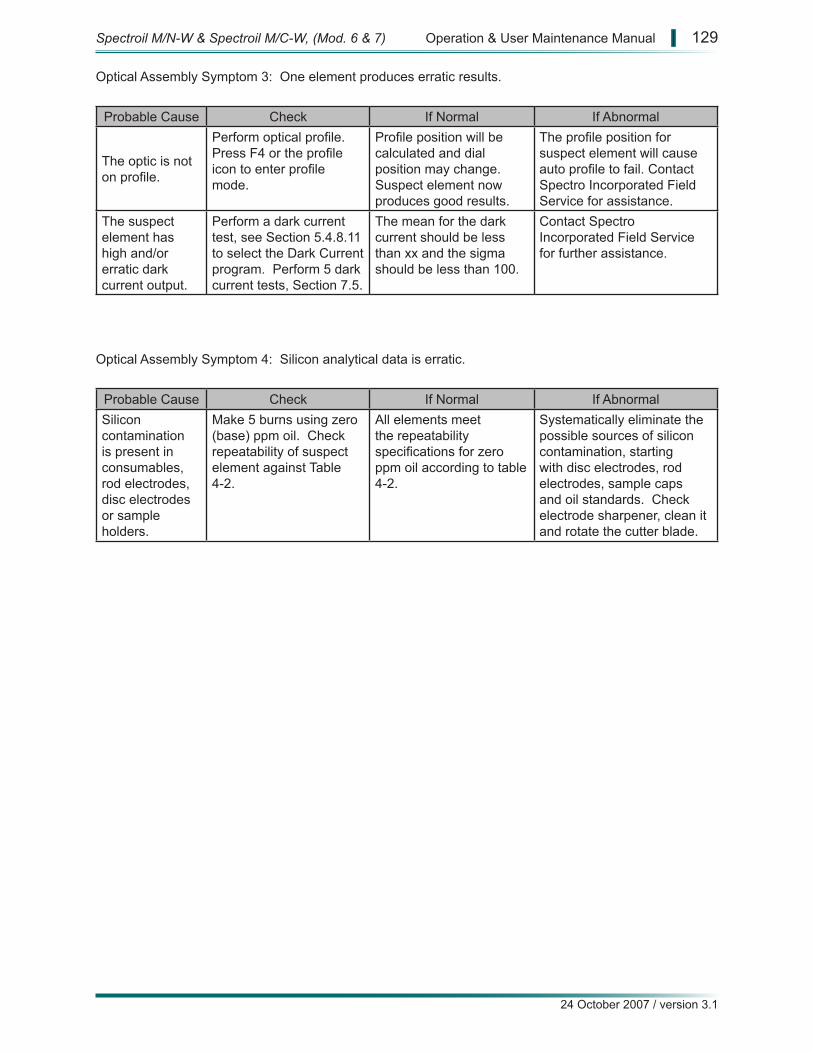
Optical Assembly Symptom 3: One element produces erratic results.
Probable Cause Check If Normal If Abnormal
The optic is not on profile.
Perform optical profile. Press F4 or the profile icon to enter profile mode.
Profile position will be calculated and dial position may change. Suspect element now produces good results.
The profile position for suspect element will cause auto profile to fail. Contact Spectro Incorporated Field Service for assistance.
The suspect element has high and/or erratic dark current output.
Perform a dark current test, see Section 5.4.8.11 to select the Dark Current program. Perform 5 dark current tests, Section 7.5.
The mean for the dark current should be less than xx and the sigma should be less than 100.
Contact Spectro Incorporated Field Service for further assistance.
Optical Assembly Symptom 4: Silicon analytical data is erratic.
Probable Cause Check If Normal If AbnormalSilicon contamination is present in consumables, rod electrodes, disc electrodes or sample holders.
Make 5 burns using zero (base) ppm oil. Check repeatability of suspect element against Table 4-2.
All elements meet the repeatability specifications for zero ppm oil according to table 4-2.
Systematically eliminate the possible sources of silicon contamination, starting with disc electrodes, rod electrodes, sample caps and oil standards. Check electrode sharpener, clean it and rotate the cutter blade.
Spectroil M/N-W & Spectroil M/C-W, (Mod. 6 & 7) Operation & User Maintenance Manual | 129
24 October 2007 / version 3.1

7.3.4 Possible Computer Controller/Measurement Electronic Assembly Faults
Symptom:1. The excitation source will not operate. 2. There is no video on the display; the TFT display is constantly white.3. There is no video on the display; the TFT display is constantly black.4. The keyboard/mouse will not work properly. 5. The start up sequence fails. 6. Certain numbers appear when alpha characters are pressed.
Electronic Assembly Symptom 1: The excitation source will not operate.
Probable Cause Check If Normal If Abnormal
The MODE switch is in Standby.
Visually check the position of the MODE switch.
The MODE switch will be in OPERATE.
Set the MODE switch to OPERATE position.
F1 on power connection plate is defective.
Check the 2.0 amp slo-blo fuse on the power connection plate.
Proceed to next probable cause.
Replace fuse with 2.0 amp slo-blo fuse, see Figure 8-14.
START switch is defective.
Press F9 (START) on the keypad to initiate the burn sequence.
The burn cycle will begin and the source will operate. This indicates that the green START switch is defective. To replace, see Section 7.6.4.11.
The burn does not initiate and sequence counter (preburn/burn) does not count down. The fault is in the communications between the computer controller and the excitation source and not with the START switch. The software may not be in the correct state to make a burn. Shut down Windows, turn power to the instrument off with CB1 and reapply power after 30 seconds. After the software loads, repeat the test and if the excitation source burns, the problem was with the software. If the source still does not burn, proceed to the next probable cause, or the problem may be in the excitation source itself, refer to Section 7.3.2 to continue fault isolation.
24 October 2007 / version 3.1
130 | Chapter 7 Maintenance and Servicing Instructions
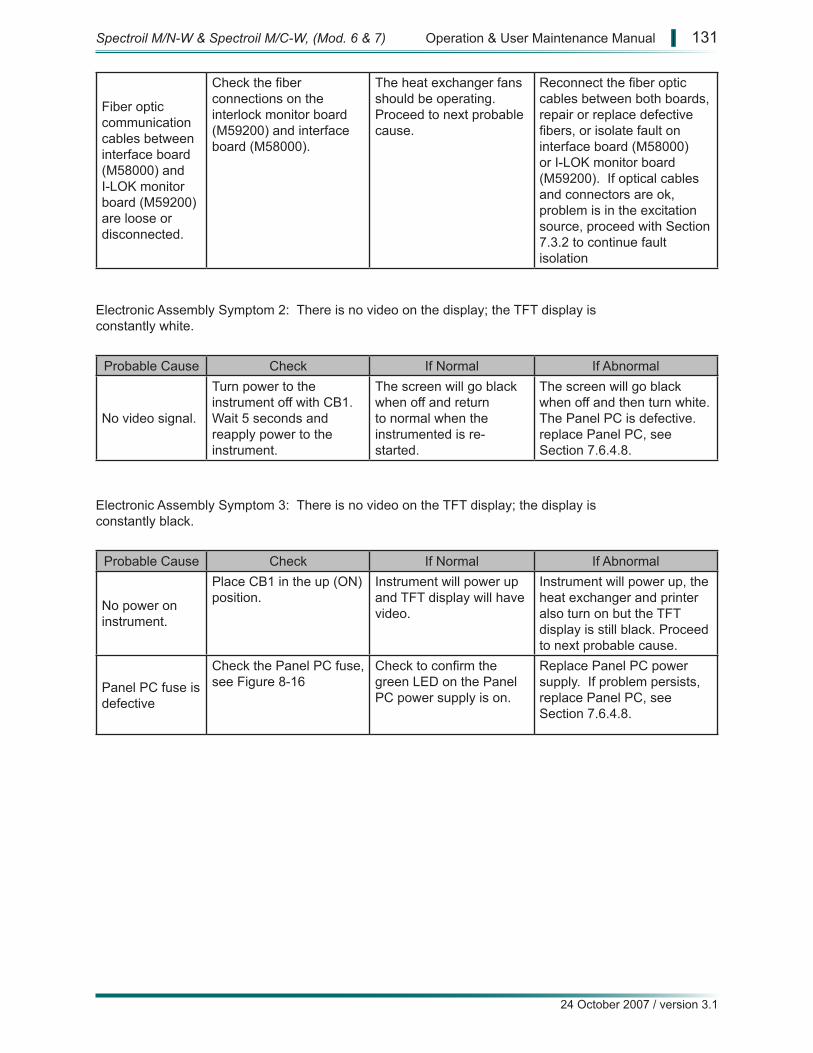
Fiber optic communication cables between interface board (M58000) and I-LOK monitor board (M59200) are loose or disconnected.
Check the fiber connections on the interlock monitor board (M59200) and interface board (M58000).
The heat exchanger fans should be operating. Proceed to next probable cause.
Reconnect the fiber optic cables between both boards, repair or replace defective fibers, or isolate fault on interface board (M58000) or I-LOK monitor board (M59200). If optical cables and connectors are ok, problem is in the excitation source, proceed with Section 7.3.2 to continue fault isolation
Electronic Assembly Symptom 2: There is no video on the display; the TFT display is constantly white.
Probable Cause Check If Normal If Abnormal
No video signal.
Turn power to the instrument off with CB1. Wait 5 seconds and reapply power to the instrument.
The screen will go black when off and return to normal when the instrumented is re-started.
The screen will go black when off and then turn white. The Panel PC is defective. replace Panel PC, see Section 7.6.4.8.
Electronic Assembly Symptom 3: There is no video on the TFT display; the display is constantly black.
Probable Cause Check If Normal If Abnormal
No power on instrument.
Place CB1 in the up (ON) position.
Instrument will power up and TFT display will have video.
Instrument will power up, the heat exchanger and printer also turn on but the TFT display is still black. Proceed to next probable cause.
Panel PC fuse is defective
Check the Panel PC fuse, see Figure 8-16
Check to confirm the green LED on the Panel PC power supply is on.
Replace Panel PC power supply. If problem persists, replace Panel PC, see Section 7.6.4.8.
Spectroil M/N-W & Spectroil M/C-W, (Mod. 6 & 7) Operation & User Maintenance Manual | 131
24 October 2007 / version 3.1
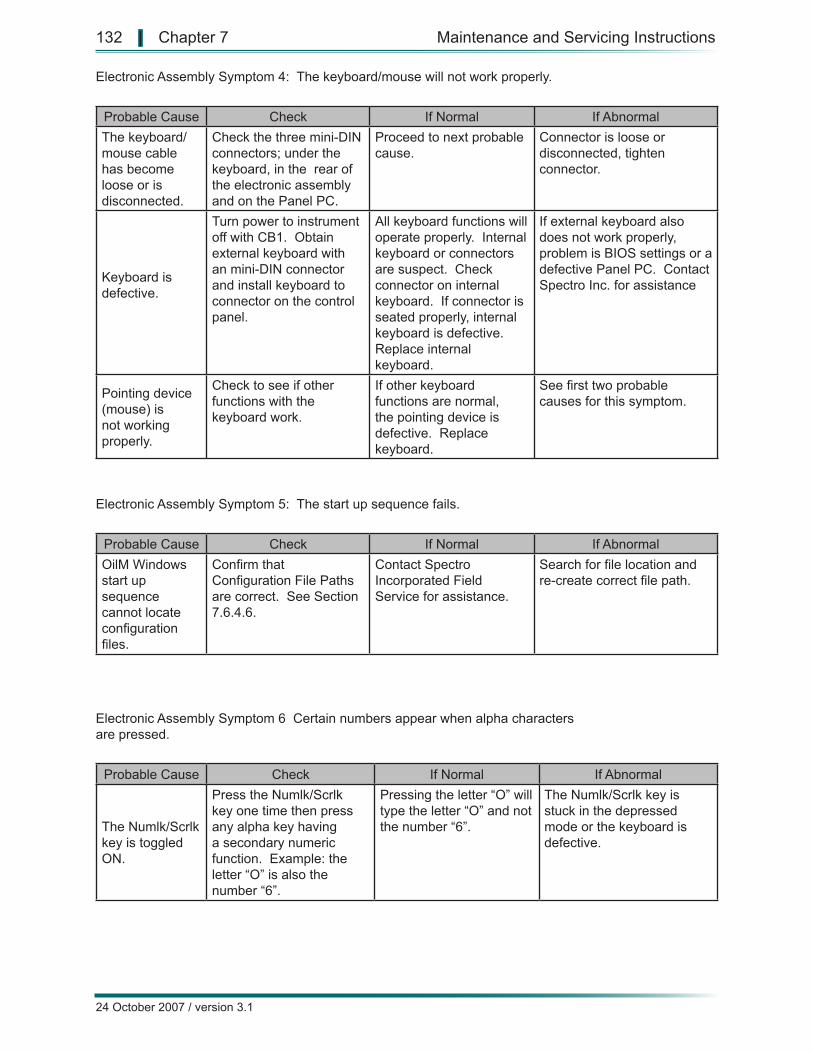
Electronic Assembly Symptom 4: The keyboard/mouse will not work properly.
Probable Cause Check If Normal If AbnormalThe keyboard/mouse cable has become loose or is disconnected.
Check the three mini-DIN connectors; under the keyboard, in the rear of the electronic assembly and on the Panel PC.
Proceed to next probable cause.
Connector is loose or disconnected, tighten connector.
Keyboard is defective.
Turn power to instrument off with CB1. Obtain external keyboard with an mini-DIN connector and install keyboard to connector on the control panel.
All keyboard functions will operate properly. Internal keyboard or connectors are suspect. Check connector on internal keyboard. If connector is seated properly, internal keyboard is defective. Replace internal keyboard.
If external keyboard also does not work properly, problem is BIOS settings or a defective Panel PC. Contact Spectro Inc. for assistance
Pointing device (mouse) is not working properly.
Check to see if other functions with the keyboard work.
If other keyboard functions are normal, the pointing device is defective. Replace keyboard.
See first two probable causes for this symptom.
Electronic Assembly Symptom 5: The start up sequence fails.
Probable Cause Check If Normal If AbnormalOilM Windows start up sequence cannot locate configuration files.
Confirm that Configuration File Paths are correct. See Section 7.6.4.6.
Contact Spectro Incorporated Field Service for assistance.
Search for file location and re-create correct file path.
Electronic Assembly Symptom 6 Certain numbers appear when alpha characters are pressed.
Probable Cause Check If Normal If Abnormal
The Numlk/Scrlk key is toggled ON.
Press the Numlk/Scrlk key one time then press any alpha key having a secondary numeric function. Example: the letter “O” is also the number “6”.
Pressing the letter “O” will type the letter “O” and not the number “6”.
The Numlk/Scrlk key is stuck in the depressed mode or the keyboard is defective.
24 October 2007 / version 3.1
132 | Chapter 7 Maintenance and Servicing Instructions
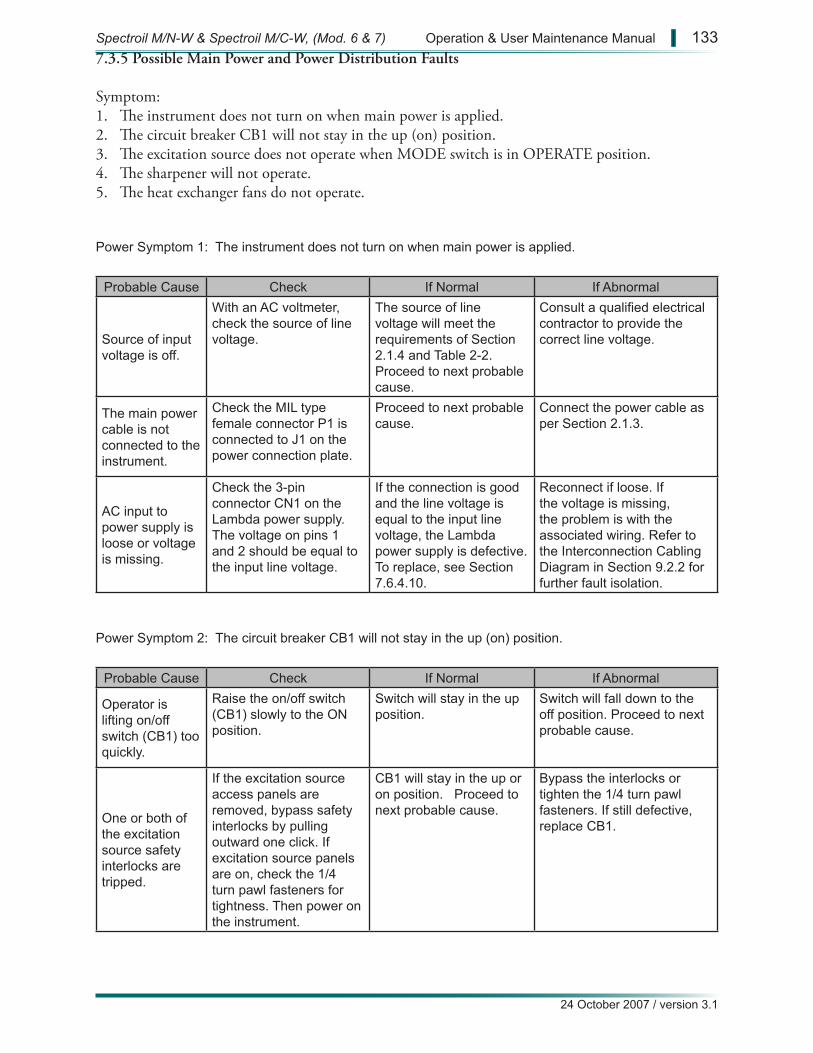
7.3.5 Possible Main Power and Power Distribution Faults
Symptom:1. The instrument does not turn on when main power is applied. 2. The circuit breaker CB1 will not stay in the up (on) position. 3. The excitation source does not operate when MODE switch is in OPERATE position. 4. The sharpener will not operate. 5. The heat exchanger fans do not operate.
Power Symptom 1: The instrument does not turn on when main power is applied.
Probable Cause Check If Normal If Abnormal
Source of input voltage is off.
With an AC voltmeter, check the source of line voltage.
The source of line voltage will meet the requirements of Section 2.1.4 and Table 2-2. Proceed to next probable cause.
Consult a qualified electrical contractor to provide the correct line voltage.
The main power cable is not connected to the instrument.
Check the MIL type female connector P1 is connected to J1 on the power connection plate.
Proceed to next probable cause.
Connect the power cable as per Section 2.1.3.
AC input to power supply is loose or voltage is missing.
Check the 3-pin connector CN1 on the Lambda power supply. The voltage on pins 1 and 2 should be equal to the input line voltage.
If the connection is good and the line voltage is equal to the input line voltage, the Lambda power supply is defective. To replace, see Section 7.6.4.10.
Reconnect if loose. If the voltage is missing, the problem is with the associated wiring. Refer to the Interconnection Cabling Diagram in Section 9.2.2 for further fault isolation.
Power Symptom 2: The circuit breaker CB1 will not stay in the up (on) position.
Probable Cause Check If Normal If Abnormal
Operator is lifting on/off switch (CB1) too quickly.
Raise the on/off switch (CB1) slowly to the ON position.
Switch will stay in the up position.
Switch will fall down to the off position. Proceed to next probable cause.
One or both of the excitation source safety interlocks are tripped.
If the excitation source access panels are removed, bypass safety interlocks by pulling outward one click. If excitation source panels are on, check the 1/4 turn pawl fasteners for tightness. Then power on the instrument.
CB1 will stay in the up or on position. Proceed to next probable cause.
Bypass the interlocks or tighten the 1/4 turn pawl fasteners. If still defective, replace CB1.
Spectroil M/N-W & Spectroil M/C-W, (Mod. 6 & 7) Operation & User Maintenance Manual | 133
24 October 2007 / version 3.1
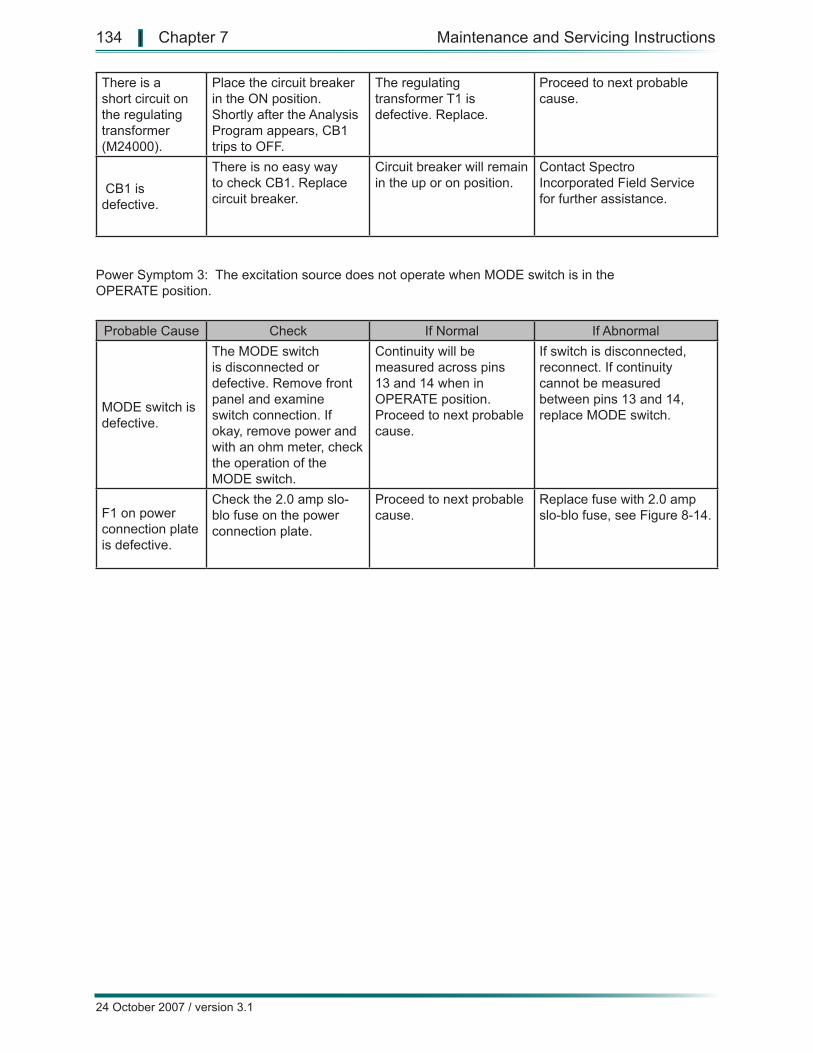
There is a short circuit on the regulating transformer (M24000).
Place the circuit breaker in the ON position. Shortly after the Analysis Program appears, CB1 trips to OFF.
The regulating transformer T1 is defective. Replace.
Proceed to next probable cause.
CB1 is defective.
There is no easy way to check CB1. Replace circuit breaker.
Circuit breaker will remain in the up or on position.
Contact Spectro Incorporated Field Service for further assistance.
Power Symptom 3: The excitation source does not operate when MODE switch is in the OPERATE position.
Probable Cause Check If Normal If Abnormal
MODE switch is defective.
The MODE switch is disconnected or defective. Remove front panel and examine switch connection. If okay, remove power and with an ohm meter, check the operation of the MODE switch.
Continuity will be measured across pins 13 and 14 when in OPERATE position. Proceed to next probable cause.
If switch is disconnected, reconnect. If continuity cannot be measured between pins 13 and 14, replace MODE switch.
F1 on power connection plate is defective.
Check the 2.0 amp slo-blo fuse on the power connection plate.
Proceed to next probable cause.
Replace fuse with 2.0 amp slo-blo fuse, see Figure 8-14.
24 October 2007 / version 3.1
134 | Chapter 7 Maintenance and Servicing Instructions
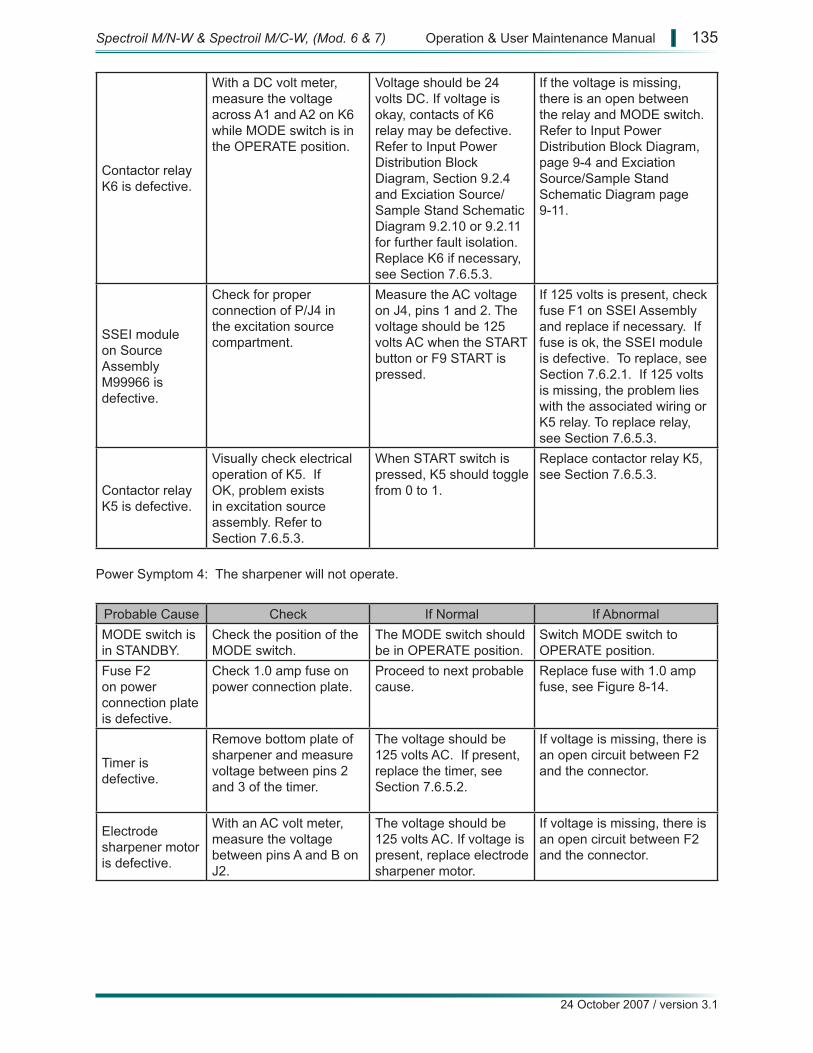
Contactor relay K6 is defective.
With a DC volt meter, measure the voltage across A1 and A2 on K6 while MODE switch is in the OPERATE position.
Voltage should be 24 volts DC. If voltage is okay, contacts of K6 relay may be defective. Refer to Input Power Distribution Block Diagram, Section 9.2.4 and Exciation Source/Sample Stand Schematic Diagram 9.2.10 or 9.2.11 for further fault isolation. Replace K6 if necessary, see Section 7.6.5.3.
If the voltage is missing, there is an open between the relay and MODE switch. Refer to Input Power Distribution Block Diagram, page 9-4 and Exciation Source/Sample Stand Schematic Diagram page 9-11.
SSEI module on Source Assembly M99966 is defective.
Check for proper connection of P/J4 in the excitation source compartment.
Measure the AC voltage on J4, pins 1 and 2. The voltage should be 125 volts AC when the START button or F9 START is pressed.
If 125 volts is present, check fuse F1 on SSEI Assembly and replace if necessary. If fuse is ok, the SSEI module is defective. To replace, see Section 7.6.2.1. If 125 volts is missing, the problem lies with the associated wiring or K5 relay. To replace relay, see Section 7.6.5.3.
Contactor relay K5 is defective.
Visually check electrical operation of K5. If OK, problem exists in excitation source assembly. Refer to Section 7.6.5.3.
When START switch is pressed, K5 should toggle from 0 to 1.
Replace contactor relay K5, see Section 7.6.5.3.
Power Symptom 4: The sharpener will not operate.
Probable Cause Check If Normal If AbnormalMODE switch is in STANDBY.
Check the position of the MODE switch.
The MODE switch should be in OPERATE position.
Switch MODE switch to OPERATE position.
Fuse F2 on power connection plate is defective.
Check 1.0 amp fuse on power connection plate.
Proceed to next probable cause.
Replace fuse with 1.0 amp fuse, see Figure 8-14.
Timer is defective.
Remove bottom plate of sharpener and measure voltage between pins 2 and 3 of the timer.
The voltage should be 125 volts AC. If present, replace the timer, see Section 7.6.5.2.
If voltage is missing, there is an open circuit between F2 and the connector.
Electrode sharpener motor is defective.
With an AC volt meter, measure the voltage between pins A and B on J2.
The voltage should be 125 volts AC. If voltage is present, replace electrode sharpener motor.
If voltage is missing, there is an open circuit between F2 and the connector.
Spectroil M/N-W & Spectroil M/C-W, (Mod. 6 & 7) Operation & User Maintenance Manual | 135
24 October 2007 / version 3.1
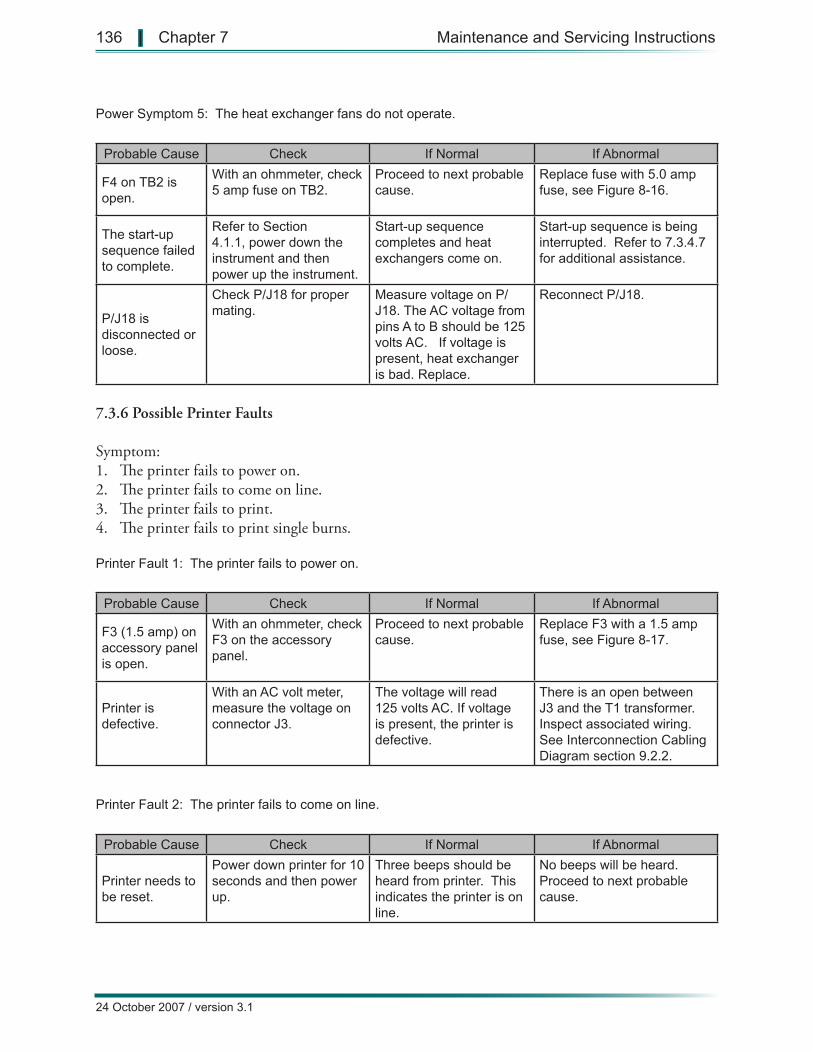
Power Symptom 5: The heat exchanger fans do not operate.
Probable Cause Check If Normal If Abnormal
F4 on TB2 is open.
With an ohmmeter, check 5 amp fuse on TB2.
Proceed to next probable cause.
Replace fuse with 5.0 amp fuse, see Figure 8-16.
The start-up sequence failed to complete.
Refer to Section 4.1.1, power down the instrument and then power up the instrument.
Start-up sequence completes and heat exchangers come on.
Start-up sequence is being interrupted. Refer to 7.3.4.7 for additional assistance.
P/J18 is disconnected or loose.
Check P/J18 for proper mating.
Measure voltage on P/J18. The AC voltage from pins A to B should be 125 volts AC. If voltage is present, heat exchanger is bad. Replace.
Reconnect P/J18.
7.3.6 Possible Printer Faults
Symptom:1. The printer fails to power on. 2. The printer fails to come on line. 3. The printer fails to print. 4. The printer fails to print single burns.
Printer Fault 1: The printer fails to power on.
Probable Cause Check If Normal If Abnormal
F3 (1.5 amp) on accessory panel is open.
With an ohmmeter, check F3 on the accessory panel.
Proceed to next probable cause.
Replace F3 with a 1.5 amp fuse, see Figure 8-17.
Printer is defective.
With an AC volt meter, measure the voltage on connector J3.
The voltage will read 125 volts AC. If voltage is present, the printer is defective.
There is an open between J3 and the T1 transformer. Inspect associated wiring. See Interconnection Cabling Diagram section 9.2.2.
Printer Fault 2: The printer fails to come on line.
Probable Cause Check If Normal If Abnormal
Printer needs to be reset.
Power down printer for 10 seconds and then power up.
Three beeps should be heard from printer. This indicates the printer is on line.
No beeps will be heard. Proceed to next probable cause.
24 October 2007 / version 3.1
136 | Chapter 7 Maintenance and Servicing Instructions
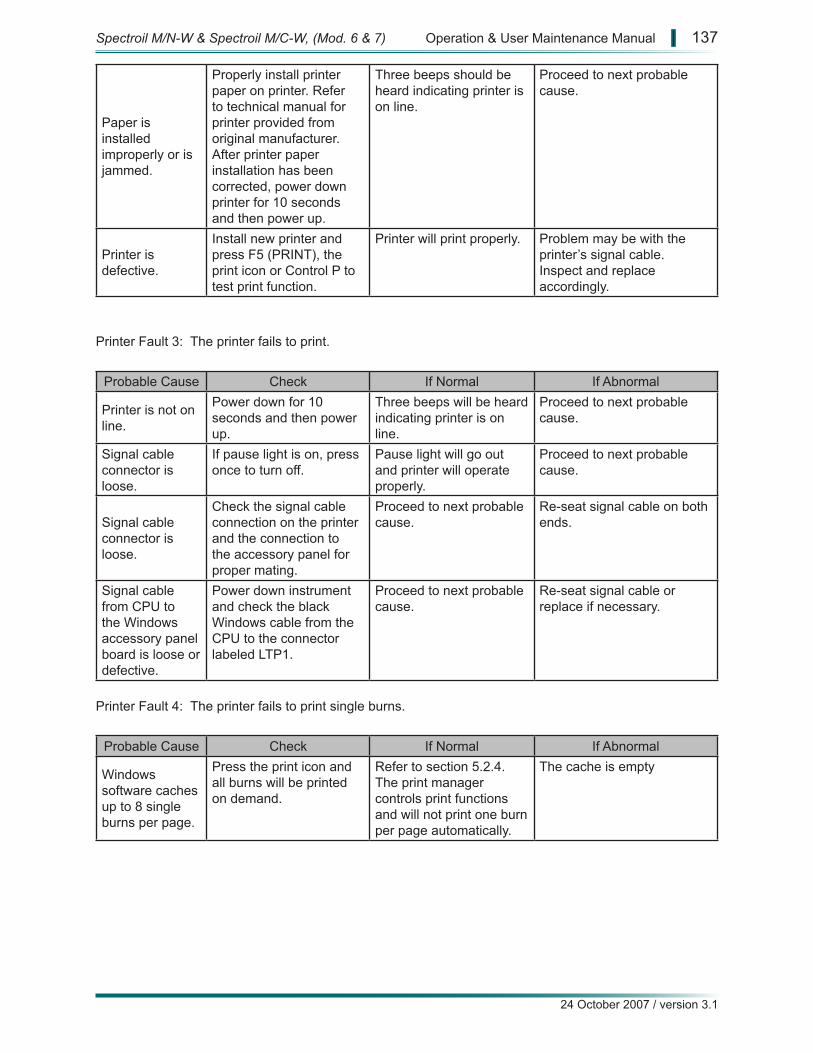
Paper is installed improperly or is jammed.
Properly install printer paper on printer. Refer to technical manual for printer provided from original manufacturer. After printer paper installation has been corrected, power down printer for 10 seconds and then power up.
Three beeps should be heard indicating printer is on line.
Proceed to next probable cause.
Printer is defective.
Install new printer and press F5 (PRINT), the print icon or Control P to test print function.
Printer will print properly. Problem may be with the printer’s signal cable. Inspect and replace accordingly.
Printer Fault 3: The printer fails to print.
Probable Cause Check If Normal If Abnormal
Printer is not on line.
Power down for 10 seconds and then power up.
Three beeps will be heard indicating printer is on line.
Proceed to next probable cause.
Signal cable connector is loose.
If pause light is on, press once to turn off.
Pause light will go out and printer will operate properly.
Proceed to next probable cause.
Signal cable connector is loose.
Check the signal cable connection on the printer and the connection to the accessory panel for proper mating.
Proceed to next probable cause.
Re-seat signal cable on both ends.
Signal cable from CPU to the Windows accessory panel board is loose or defective.
Power down instrument and check the black Windows cable from the CPU to the connector labeled LTP1.
Proceed to next probable cause.
Re-seat signal cable or replace if necessary.
Printer Fault 4: The printer fails to print single burns.
Probable Cause Check If Normal If Abnormal
Windows software caches up to 8 single burns per page.
Press the print icon and all burns will be printed on demand.
Refer to section 5.2.4. The print manager controls print functions and will not print one burn per page automatically.
The cache is empty
Spectroil M/N-W & Spectroil M/C-W, (Mod. 6 & 7) Operation & User Maintenance Manual | 137
24 October 2007 / version 3.1
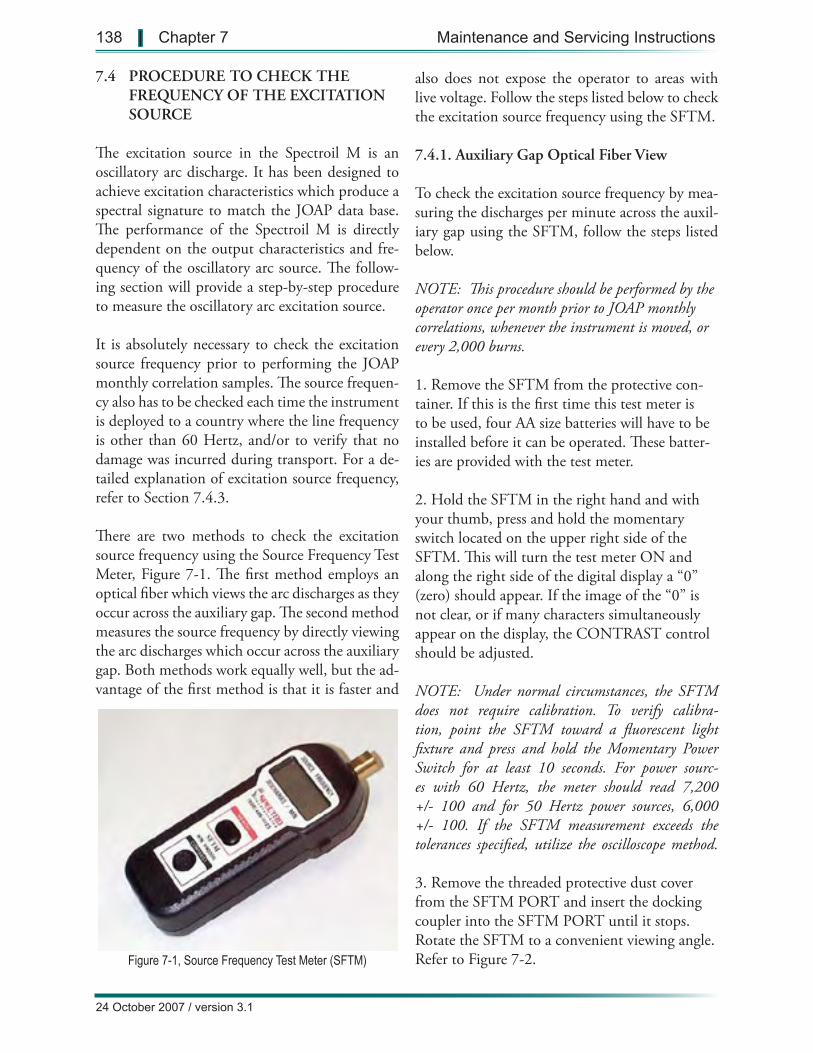
Figure 7-1, Source Frequency Test Meter (SFTM)
7.4 PROCEDURE TO CHECK THE FREQUENCY OF THE EXCITATION SOURCE
The excitation source in the Spectroil M is an oscillatory arc discharge. It has been designed to achieve excitation characteristics which produce a spectral signature to match the JOAP data base. The performance of the Spectroil M is directly dependent on the output characteristics and fre-quency of the oscillatory arc source. The follow-ing section will provide a step-by-step procedure to measure the oscillatory arc excitation source.
It is absolutely necessary to check the excitation source frequency prior to performing the JOAP monthly correlation samples. The source frequen-cy also has to be checked each time the instrument is deployed to a country where the line frequency is other than 60 Hertz, and/or to verify that no damage was incurred during transport. For a de-tailed explanation of excitation source frequency, refer to Section 7.4.3.
There are two methods to check the excitation source frequency using the Source Frequency Test Meter, Figure 7-1. The first method employs an optical fiber which views the arc discharges as they occur across the auxiliary gap. The second method measures the source frequency by directly viewing the arc discharges which occur across the auxiliary gap. Both methods work equally well, but the ad-vantage of the first method is that it is faster and
also does not expose the operator to areas with live voltage. Follow the steps listed below to check the excitation source frequency using the SFTM.
7.4.1. Auxiliary Gap Optical Fiber View
To check the excitation source frequency by mea-suring the discharges per minute across the auxil-iary gap using the SFTM, follow the steps listed below.
NOTE: This procedure should be performed by the operator once per month prior to JOAP monthly correlations, whenever the instrument is moved, or every 2,000 burns.
1. Remove the SFTM from the protective con-tainer. If this is the first time this test meter is to be used, four AA size batteries will have to be installed before it can be operated. These batter-ies are provided with the test meter.
2. Hold the SFTM in the right hand and with your thumb, press and hold the momentary switch located on the upper right side of the SFTM. This will turn the test meter ON and along the right side of the digital display a “0” (zero) should appear. If the image of the “0” is not clear, or if many characters simultaneously appear on the display, the CONTRAST control should be adjusted.
NOTE: Under normal circumstances, the SFTM does not require calibration. To verify calibra-tion, point the SFTM toward a fluorescent light fixture and press and hold the Momentary Power Switch for at least 10 seconds. For power sourc-es with 60 Hertz, the meter should read 7,200 +/- 100 and for 50 Hertz power sources, 6,000 +/- 100. If the SFTM measurement exceeds the tolerances specified, utilize the oscilloscope method.
3. Remove the threaded protective dust cover from the SFTM PORT and insert the docking coupler into the SFTM PORT until it stops. Rotate the SFTM to a convenient viewing angle. Refer to Figure 7-2.
138 | Chapter 7 Maintenance and Servicing Instructions
24 October 2007 / version 3.1
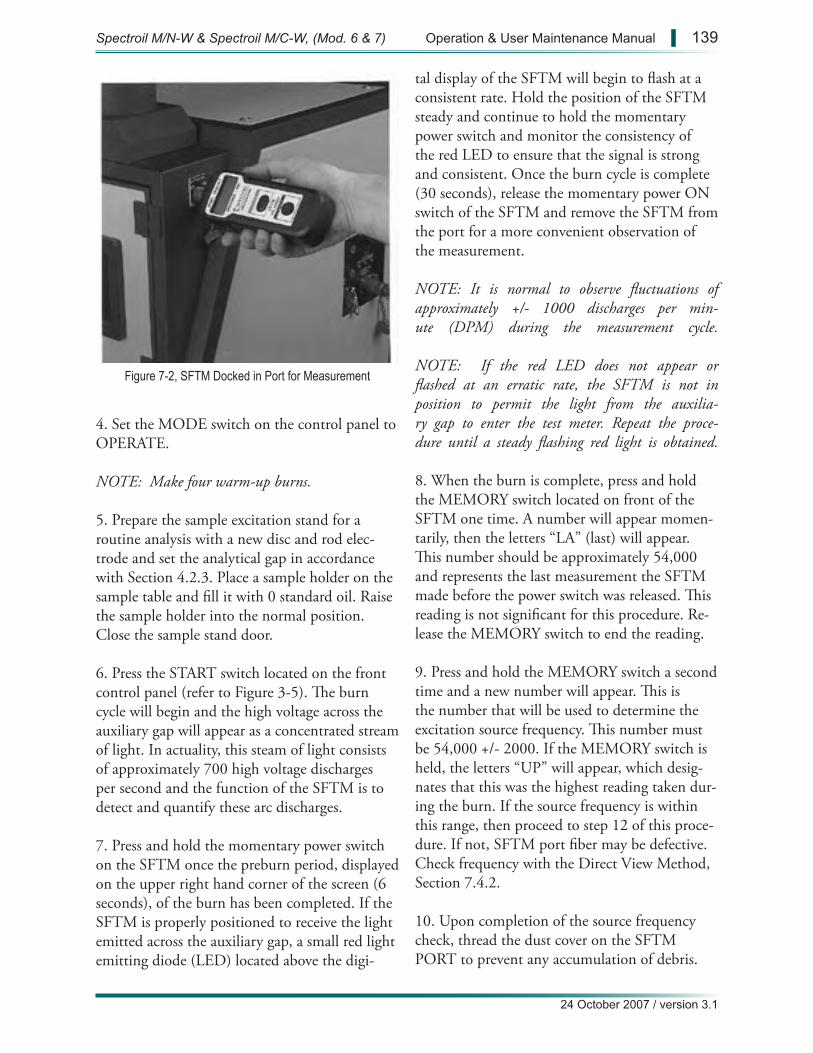
Figure 7-2, SFTM Docked in Port for Measurement
4. Set the MODE switch on the control panel to OPERATE.
NOTE: Make four warm-up burns.
5. Prepare the sample excitation stand for a routine analysis with a new disc and rod elec-trode and set the analytical gap in accordance with Section 4.2.3. Place a sample holder on the sample table and fill it with 0 standard oil. Raise the sample holder into the normal position. Close the sample stand door.
6. Press the START switch located on the front control panel (refer to Figure 3-5). The burn cycle will begin and the high voltage across the auxiliary gap will appear as a concentrated stream of light. In actuality, this steam of light consists of approximately 700 high voltage discharges per second and the function of the SFTM is to detect and quantify these arc discharges.
7. Press and hold the momentary power switch on the SFTM once the preburn period, displayed on the upper right hand corner of the screen (6 seconds), of the burn has been completed. If the SFTM is properly positioned to receive the light emitted across the auxiliary gap, a small red light emitting diode (LED) located above the digi-
tal display of the SFTM will begin to flash at a consistent rate. Hold the position of the SFTM steady and continue to hold the momentary power switch and monitor the consistency of the red LED to ensure that the signal is strong and consistent. Once the burn cycle is complete (30 seconds), release the momentary power ON switch of the SFTM and remove the SFTM from the port for a more convenient observation of the measurement.
NOTE: It is normal to observe fluctuations of approximately +/- 1000 discharges per min-ute (DPM) during the measurement cycle.
NOTE: If the red LED does not appear or flashed at an erratic rate, the SFTM is not in position to permit the light from the auxilia-ry gap to enter the test meter. Repeat the proce-dure until a steady flashing red light is obtained.
8. When the burn is complete, press and hold the MEMORY switch located on front of the SFTM one time. A number will appear momen-tarily, then the letters “LA” (last) will appear. This number should be approximately 54,000 and represents the last measurement the SFTM made before the power switch was released. This reading is not significant for this procedure. Re-lease the MEMORY switch to end the reading.
9. Press and hold the MEMORY switch a second time and a new number will appear. This is the number that will be used to determine the excitation source frequency. This number must be 54,000 +/- 2000. If the MEMORY switch is held, the letters “UP” will appear, which desig-nates that this was the highest reading taken dur-ing the burn. If the source frequency is within this range, then proceed to step 12 of this proce-dure. If not, SFTM port fiber may be defective. Check frequency with the Direct View Method, Section 7.4.2.
10. Upon completion of the source frequency check, thread the dust cover on the SFTM PORT to prevent any accumulation of debris.
Spectroil M/N-W & Spectroil M/C-W, (Mod. 6 & 7) Operation & User Maintenance Manual | 139
24 October 2007 / version 3.1
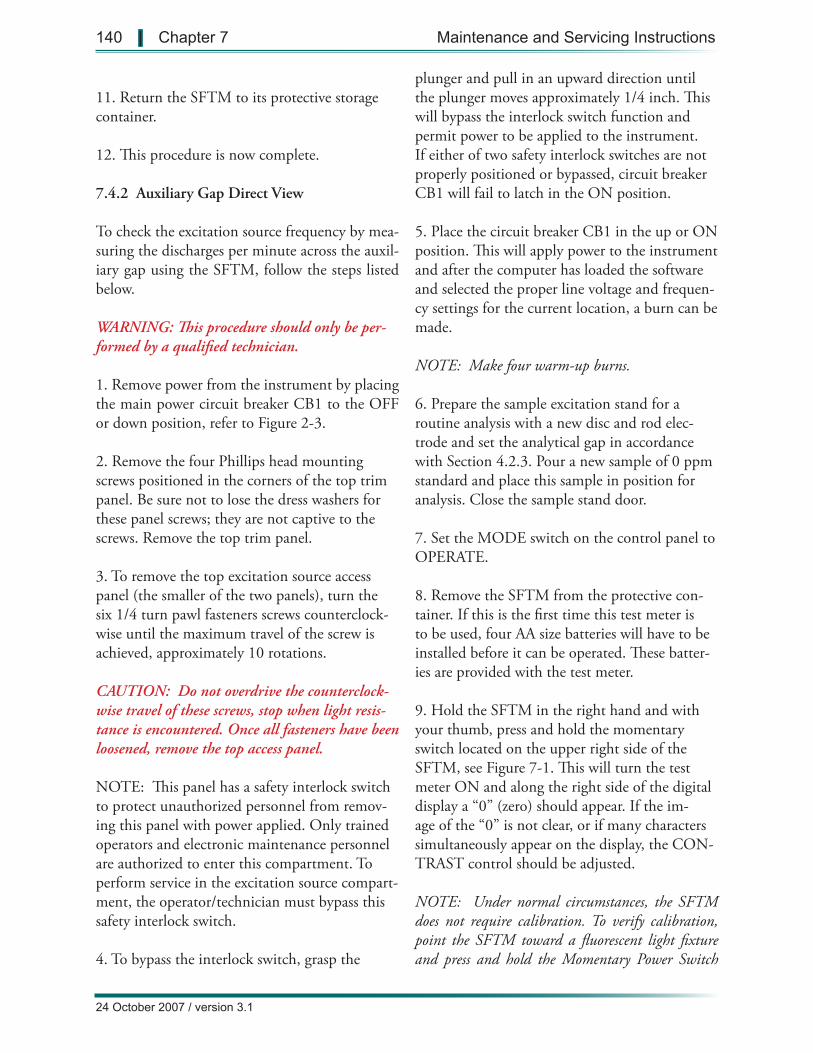
11. Return the SFTM to its protective storage container.
12. This procedure is now complete.
7.4.2 Auxiliary Gap Direct View
To check the excitation source frequency by mea-suring the discharges per minute across the auxil-iary gap using the SFTM, follow the steps listed below.
WARNING: This procedure should only be per-formed by a qualified technician.
1. Remove power from the instrument by placing the main power circuit breaker CB1 to the OFF or down position, refer to Figure 2-3.
2. Remove the four Phillips head mounting screws positioned in the corners of the top trim panel. Be sure not to lose the dress washers for these panel screws; they are not captive to the screws. Remove the top trim panel.
3. To remove the top excitation source access panel (the smaller of the two panels), turn the six 1/4 turn pawl fasteners screws counterclock-wise until the maximum travel of the screw is achieved, approximately 10 rotations.
CAUTION: Do not overdrive the counterclock-wise travel of these screws, stop when light resis-tance is encountered. Once all fasteners have been loosened, remove the top access panel.
NOTE: This panel has a safety interlock switch to protect unauthorized personnel from remov-ing this panel with power applied. Only trained operators and electronic maintenance personnel are authorized to enter this compartment. To perform service in the excitation source compart-ment, the operator/technician must bypass this safety interlock switch.
4. To bypass the interlock switch, grasp the
plunger and pull in an upward direction until the plunger moves approximately 1/4 inch. This will bypass the interlock switch function and permit power to be applied to the instrument. If either of two safety interlock switches are not properly positioned or bypassed, circuit breaker CB1 will fail to latch in the ON position.
5. Place the circuit breaker CB1 in the up or ON position. This will apply power to the instrument and after the computer has loaded the software and selected the proper line voltage and frequen-cy settings for the current location, a burn can be made.
NOTE: Make four warm-up burns.
6. Prepare the sample excitation stand for a routine analysis with a new disc and rod elec-trode and set the analytical gap in accordance with Section 4.2.3. Pour a new sample of 0 ppm standard and place this sample in position for analysis. Close the sample stand door.
7. Set the MODE switch on the control panel to OPERATE.
8. Remove the SFTM from the protective con-tainer. If this is the first time this test meter is to be used, four AA size batteries will have to be installed before it can be operated. These batter-ies are provided with the test meter.
9. Hold the SFTM in the right hand and with your thumb, press and hold the momentary switch located on the upper right side of the SFTM, see Figure 7-1. This will turn the test meter ON and along the right side of the digital display a “0” (zero) should appear. If the im-age of the “0” is not clear, or if many characters simultaneously appear on the display, the CON-TRAST control should be adjusted.
NOTE: Under normal circumstances, the SFTM does not require calibration. To verify calibration, point the SFTM toward a fluorescent light fixture and press and hold the Momentary Power Switch
140 | Chapter 7 Maintenance and Servicing Instructions
24 October 2007 / version 3.1

Figure 7-3, Auxiliary Gap Assembly and Ideal Position for Source Frequency Test
for at least 10 seconds. For power sources with 60 Hertz, the meter should read 7,200 +/- 100 and for 50 Hertz power sources, 6,000 +/- 100.
10. Locate the auxiliary gap on the excitation source component board, refer to Figure 7-4 for the location. Hold the SFTM approximately 10 inches (25 cm) above the auxiliary gap with the input coupler pointing downwards towards the auxiliary gap as shown in Figure 7-3.
Once the burn cycle begins, high voltage will be generated and distributed throughout the excita-tion source. Do not touch any components of the excitation source assembly while the excita-tion source is operating. Wait until the burn cycle terminates before attempting to make any adjustments. Always turn the MODE switch to STANDBY before making any adjustments.
Wear safety glasses or do not look directly at the spark. The spark from the auxiliary gap could harm your eyes if stared at for prolonged periods of time.
Only trained personnel should carry out this procedure. It is performed in an area of the Spectroil M where high voltage potentials are present.
11. Press the START switch located on the front
control panel, refer to Figure 3-6. The burn cycle will begin and the high voltage across the aux-iliary gap will appear as a concentrated stream of light. In actuality, this steam of light consists of approximately 700 high voltage discharges per second and the function of the SFTM is to detect and quantify these arc discharges.
12. Press and hold the momentary power switch on the SFTM once the preburn period, displayed on the upper right hand corner of the screen (6 seconds), of the burn has been completed. If the SFTM is properly positioned to receive the light emitted across the auxiliary gap, a small red light emitting diode (LED) located above the digi-tal display of the SFTM will begin to flash at a consistent rate. Hold the position of the SFTM steady and continue to hold the momentary power switch and monitor the consistency of the red LED to ensure that the signal is strong and consistent. Once the burn cycle is complete (30 seconds), release the momentary power ON switch of the SFTM and position it so it can be easily read.
NOTE: It is normal to observe fluctuations of approximately +/- 1000 discharges per minute (DPM) during the measurement cycle.
If the red LED does not appear or flashed at an erratic rate, the SFTM is not in position to per-
Spectroil M/N-W & Spectroil M/C-W, (Mod. 6 & 7) Operation & User Maintenance Manual | 141
24 October 2007 / version 3.1
mit the light from the auxiliary gap to enter the test meter. Repeat the procedure until a steady flashing red light is obtained.
13. When the burn is complete, press and hold the MEMORY switch located on front of the SFTM one time. A number will appear momen-tarily, then the letters “LA” (last) will appear. This number should be approximately 54,000 and represents the last measurement the SFTM made before the power switch was released. This reading is not significant for this procedure. Re-lease the MEMORY switch to end the reading.
14. Press and hold the MEMORY switch a second time and a new number will appear. This is the number that will be used to determine the excitation source frequency. This number must be 54,000 +/- 2000. If the MEMORY switch is held, the letters “UP” will appear, which des-ignates that this was the highest reading taken during the burn. If it is within this range, the procedure is complete and proceed with step 15. If not, the solid state ignition circuit or high voltage capacitor may be defective, see Section 7.3.2.
NOTE: If you press and hold the MEMORY switch a third time, the number will be the lowest measured value “DN” for the burn. This reading is not significant for this procedure.
15. Place the MODE switch to the STANDBY position. Shut down Windows and place the circuit breaker CB1 to the down position to remove power to the instrument. Remove the main power input cable by disconnecting the MIL-type connector from the mating receptacle.
16. Press the interlock actuator inward to reset the normal operation of the switch. This inter-lock should activate when the actuator is pressed inward to its maximum travel. Place the envi-ronmental sealing panel in position and start the six 1/4 turn pawl fasteners. Once all screws have been started, tighten all screws until they are snug, compressing the sealing gasket.
17. Install the exterior panel and secure it in position with the four Phillips head screws and dress washers.
18. Attach the main power input cable to the instrument, and plug the cable into the source of line voltage. Apply power to the instrument in accordance with all steps detailed in Section 2.1.3.
19. This procedure is now complete.
7.4.3 Detailed Description of Excitation Source Frequency
The excitation source of the Spectroil M is an oscillating alternate current (AC) electric arc dis-charge which has been optimized for oil matrices and the JOAP data base. The excitation source is the most important subassembly of the spectrom-eter with regard to analytical performance (accu-racy, repeatability, and JOAP data correlation). The following paragraphs will describe the func-tion of the excitation source and explain factors which affect its performance.
The excitation source has two basic functions: 1) to provide a high voltage potential to overcome the resistance offered by the air and oil between the graphite rod and disc electrodes which make up the analytical gap, and 2) to provide an ana-lytical potential capable of instantaneously vapor-izing the oil and any particles suspended in the oil medium. This is accomplished with a solid-state excitation ignition circuit (SSEI) to charge a high voltage capacitor C2 until its potential is high enough to ionize the air between the graph-ite electrodes. This ionization will appear as a high voltage arc across the analytical gap. Once the high voltage has ionized the air across the ana-lytical gap, the resistance between the gap is ef-fectively zero ohms or a short circuit to ground. This momentary (approximately 3 microsecond) short circuit to ground is all that is necessary to discharge the potential which is stored on the ana-lytical capacitor C3. This potential will instanta-neously vaporize the oil and any particles which
142 | Chapter 7 Maintenance and Servicing Instructions
24 October 2007 / version 3.1
are suspended in the oil at that one moment in time. This vaporization potential will raise the en-ergy level of the valence electron(s) of the particles and when this energy is released as it returns to the ground state, it will create atomic emission which is the basis of this technique.
This process occurs approximately 700 times per second and is referred to as the excitation source frequency. The main reasons for the relatively high excitation source frequency are twofold: 1) to provide a good statistical sampling of the particles spread across the disc electrode which is approximately 1/4 inch by 1/4 inch and 2) to raise the vaporization temperature sufficiently to vaporize the refractory elements such as Si, Al and Ti. This excitation frequency is regulated or elec-tronically controlled to ensure that the frequency remains constant over the complete burn cycle or from one oil type to the next. In order to allow the measurement of this excitation source frequency and still maintain optical alignment between the analytical gap and the optical processing assembly, a second gap called the auxiliary gap is designed into the excitation source and this gap is in series with the analytical gap.
This excitation source frequency has become the standard for wear metal analysis, particularly in the United States Department of Defense (DoD) Joint Oil Analysis Program (JOAP). Over the last two decades, an extensive database of wear trends and maintenance guidelines have been established based on this excitation source characteristic and certain parameters, such as frequency. This da-tabase has been derived based on the results of approximately 300 fixed laboratory sites where actual mechanical system failures have been de-tected and the trend data leading up to the detec-tion of the impending failure have been analyzed to determine guidelines for appropriate corrective maintenance action. These stationary laboratories participate in a monthly data correlation program operated by the Technical Support Center of the Joint Oil Analysis Program in Pensacola, Florida. Prior to each monthly correlation data sampling or every 2000 burns, the laboratory normally has
to check the excitation source frequency by us-ing an oscilloscope or SFTM. This procedure has been referred to as checking the breaks per half cycle.
The effects of the physical and environmental characteristics have virtually beeneliminated by the design of the solid-state excita-tion ignition circuit (SSEI). This is accomplished by incorporating an internally mounted ferro-magnetic regulating transformer T1 which can stabilize the nominal (120 or 240 VAC) input line voltage having +/- 10% deviation to an output of 125 VAC within +/- 3%. However, since the high voltage transformer is simply a step-up voltage de-vice having an 80:1 ratio, it is understandable that an unstable line voltage will cause the high volt-age transformer output to vary. If this occurs, the charge stored on the high voltage capacitor will also vary thus resulting in an unstable excitation source frequency. The frequency of the line volt-age is the second physical parameter which must be compensated for. Since the excitation source frequency is modulated from the line frequency, if the line frequency changes then the excitation source frequency will automatically change. Of course, if the components which make up the high voltage ignition circuitry were to fatigue, this will change or cause an unstable excitation source fre-quency. Last to be mentioned, but most probable to occur in application is erosion of the two 3/16” tungsten electrodes which together make the aux-iliary gap. The auxiliary gap electrodes have ap-proximately 27,000 arc discharges during each 30 second analysis which originate from the parabol-ic tips. This function is slowly removing tungsten material from the tips of these electrodes, which in effect is enlarging the gap distance. As the gap distance gets larger, the resistance of the air gap is increasing and the net result is a decrease in the excitation source frequency. This is the main rea-son that the standard operating procedure in the U.S. DoD laboratories is to perform a 2000 burn check of the excitation source frequency and reset the source frequency accordingly.
The second parameter which can affect the excita-
Spectroil M/N-W & Spectroil M/C-W, (Mod. 6 & 7) Operation & User Maintenance Manual | 143
24 October 2007 / version 3.1
tion source frequency is the environment in which the instrument must operate. These parameters are altitude and relative humidity, and their affect are not easily remedied by design. In both cases, altitude and relative humidity, the resistance to current flow offered by the air across the auxiliary and analytical gaps can cause the excitation source to holdoff.
Holdoff occurs when the auxiliary gap has diffi-culty breaking down. This phenomenon is usu-ally identifiable by a pause in the time between the start of the burn and the countdown of the burn counter. While it is difficult to identify the actual cause of this phenomenon, it is believed to be influenced by environmental conditions. To minimize this phenomenon, a set screw has been added to the auxiliary gap, Figure 8-13, to assist in breaking down its magnetic field. Holdoff does not have an effect on analytical results unless it ex-ceeds 2 seconds. Please refer to the troubleshoot-ing section of this manual if your instrument is experiencing holdoff that exceeds two 2 seconds.
When the instrument is factory calibrated at near sea level, the excitation source is set using an oscil-loscope or the Spectro Incorporated Source Fre-quency Test Meter to the prescribed frequency. If the instrument is deployed to a higher altitude, the resistances across the gaps are reduced. With lowered resistance, the high voltage capacitor can discharge across these gaps more easily and more often within a fixed time period. The result is an increase in excitation source frequency.
When an instrument is exposed to high relative humidity, nearly the same effect occurs, how-ever, for a different reason. The percentage of moisture in the environment makes the density of air higher and therefore offers lower resistance to current flow. This allows the high voltage to conduct through the air more easily thus result-ing in an increase in excitation source frequency. This is somewhat controlled in the Spectroil M with the incorporation of a heat exchanger which stabilizes the internal environment of the instru-ment. However, there is no humidity control in
the sample excitation stand.
Maintaining the correct excitation source fre-quency is the most influential parameter to achieving good JOAP data correlation. For sake of discussion, let’s assume that the excitation source frequency of instrument #1 is set exactly correct in accordance with Section 7.4.1 or 7.4.2, and instrument #2 is operating 20% lower than specification. Both of these instruments will stan-dardize without any problem because the com-puter will adjust the calibration curves to make all the standards from 0 to 100 ppm read cor-rectly. Now assume that we have an oil sample containing iron wear particles. These particles range from 1 to 40 microns in size and are evenly distributed throughout the sample. Instrument #1 will totally vaporize all particles of iron from 0.1 to 5 microns but when a 30 or 50 micron particle reaches the analytical gap, only 10% will be vaporized because of the excitation source fre-quency and the resident time in the analytical gap. The analytical result for instrument #1 may be 100 ppm. Instrument #2 will also vaporize all particles from 0.1 to 5 microns, but will only va-porize 2% of the particles in the 30 to 40 micron range. The analytical result for instrument #2 can be perhaps as low as 70 ppm. Both instruments standardize correctly, and all standards read cor-rectly, but they do not correlate on used oil sam-ples because of the differences in the excitation source frequency.
It is absolutely necessary to check and/or adjust the excitation source frequency prior to perform-ing the JOAP monthly correlation samples. It is also essential to check and/or adjust the excita-tion source frequency each and every time the in-strument is deployed to a country where the line frequency is other than 60 Hertz and/or the el-evation or environment is different from the last time the frequency was set.
144 | Chapter 7 Maintenance and Servicing Instructions
24 October 2007 / version 3.1
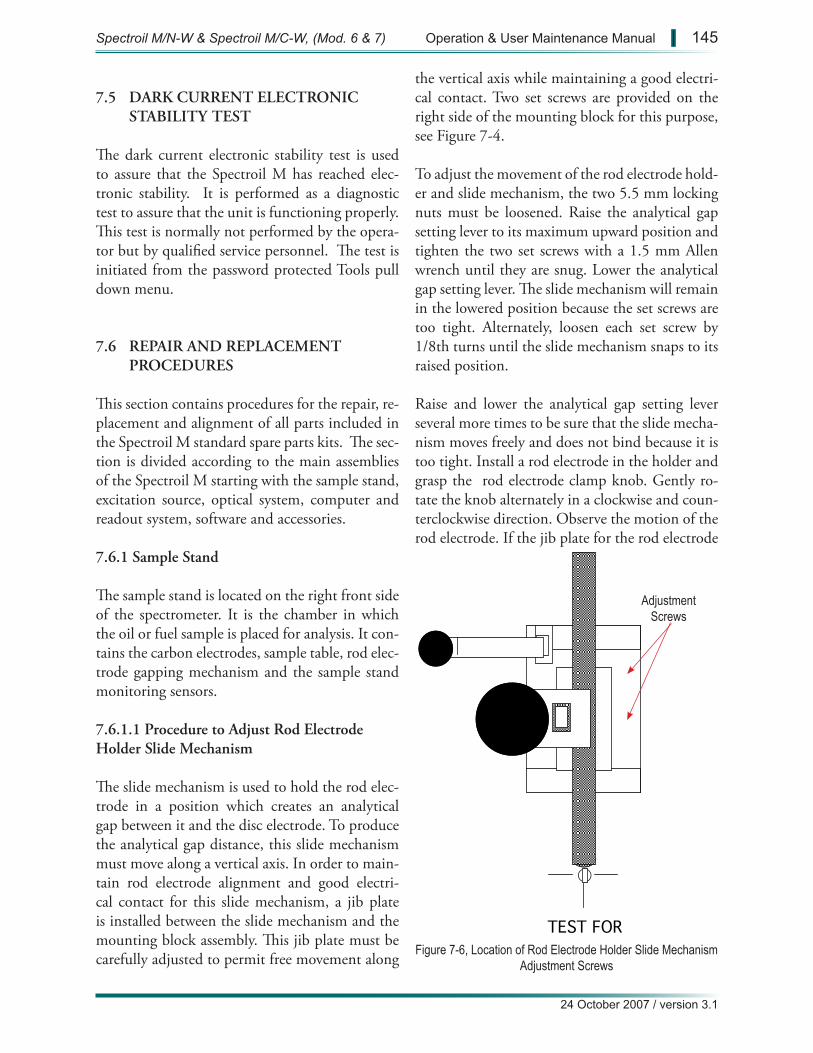
TEST FOR ROD TO DISC
SHAFT ALIGNMENT
Figure 7-6, Location of Rod Electrode Holder Slide Mechanism Adjustment Screws
Adjustment Screws
7.5 DARK CURRENT ELECTRONIC STABILITY TEST
The dark current electronic stability test is used to assure that the Spectroil M has reached elec-tronic stability. It is performed as a diagnostic test to assure that the unit is functioning properly. This test is normally not performed by the opera-tor but by qualified service personnel. The test is initiated from the password protected Tools pull down menu.
7.6 REPAIR AND REPLACEMENT PROCEDURES
This section contains procedures for the repair, re-placement and alignment of all parts included in the Spectroil M standard spare parts kits. The sec-tion is divided according to the main assemblies of the Spectroil M starting with the sample stand, excitation source, optical system, computer and readout system, software and accessories.
7.6.1 Sample Stand
The sample stand is located on the right front side of the spectrometer. It is the chamber in which the oil or fuel sample is placed for analysis. It con-tains the carbon electrodes, sample table, rod elec-trode gapping mechanism and the sample stand monitoring sensors.
7.6.1.1 Procedure to Adjust Rod Electrode Holder Slide Mechanism
The slide mechanism is used to hold the rod elec-trode in a position which creates an analytical gap between it and the disc electrode. To produce the analytical gap distance, this slide mechanism must move along a vertical axis. In order to main-tain rod electrode alignment and good electri-cal contact for this slide mechanism, a jib plate is installed between the slide mechanism and the mounting block assembly. This jib plate must be carefully adjusted to permit free movement along
the vertical axis while maintaining a good electri-cal contact. Two set screws are provided on the right side of the mounting block for this purpose, see Figure 7-4.
To adjust the movement of the rod electrode hold-er and slide mechanism, the two 5.5 mm locking nuts must be loosened. Raise the analytical gap setting lever to its maximum upward position and tighten the two set screws with a 1.5 mm Allen wrench until they are snug. Lower the analytical gap setting lever. The slide mechanism will remain in the lowered position because the set screws are too tight. Alternately, loosen each set screw by 1/8th turns until the slide mechanism snaps to its raised position.
Raise and lower the analytical gap setting lever several more times to be sure that the slide mecha-nism moves freely and does not bind because it is too tight. Install a rod electrode in the holder and grasp the rod electrode clamp knob. Gently ro-tate the knob alternately in a clockwise and coun-terclockwise direction. Observe the motion of the rod electrode. If the jib plate for the rod electrode
Spectroil M/N-W & Spectroil M/C-W, (Mod. 6 & 7) Operation & User Maintenance Manual | 145
24 October 2007 / version 3.1
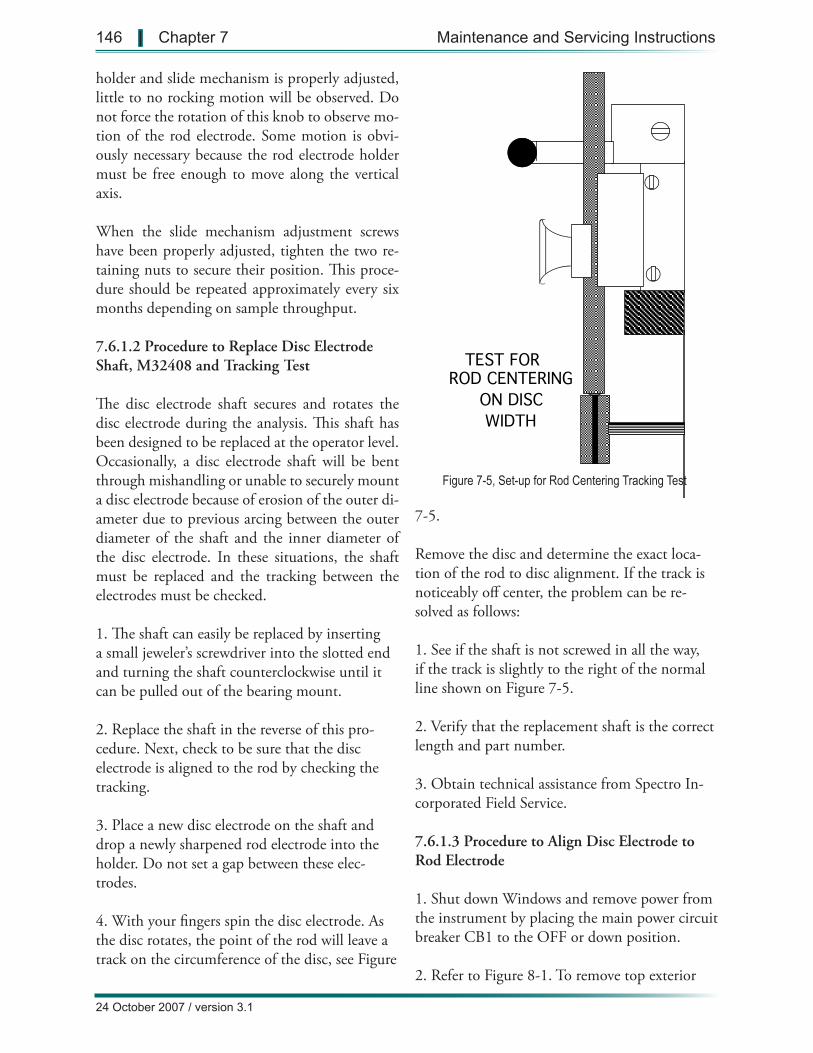
Figure 7-5, Set-up for Rod Centering Tracking Test
TEST FORROD CENTERING
ON DISCWIDTH
holder and slide mechanism is properly adjusted, little to no rocking motion will be observed. Do not force the rotation of this knob to observe mo-tion of the rod electrode. Some motion is obvi-ously necessary because the rod electrode holder must be free enough to move along the vertical axis.
When the slide mechanism adjustment screws have been properly adjusted, tighten the two re-taining nuts to secure their position. This proce-dure should be repeated approximately every six months depending on sample throughput.
7.6.1.2 Procedure to Replace Disc Electrode Shaft, M32408 and Tracking Test
The disc electrode shaft secures and rotates the disc electrode during the analysis. This shaft has been designed to be replaced at the operator level. Occasionally, a disc electrode shaft will be bent through mishandling or unable to securely mount a disc electrode because of erosion of the outer di-ameter due to previous arcing between the outer diameter of the shaft and the inner diameter of the disc electrode. In these situations, the shaft must be replaced and the tracking between the electrodes must be checked.
1. The shaft can easily be replaced by inserting a small jeweler’s screwdriver into the slotted end and turning the shaft counterclockwise until it can be pulled out of the bearing mount.
2. Replace the shaft in the reverse of this pro-cedure. Next, check to be sure that the disc electrode is aligned to the rod by checking the tracking.
3. Place a new disc electrode on the shaft and drop a newly sharpened rod electrode into the holder. Do not set a gap between these elec-trodes.
4. With your fingers spin the disc electrode. As the disc rotates, the point of the rod will leave a track on the circumference of the disc, see Figure
7-5.
Remove the disc and determine the exact loca-tion of the rod to disc alignment. If the track is noticeably off center, the problem can be re-solved as follows:
1. See if the shaft is not screwed in all the way, if the track is slightly to the right of the normal line shown on Figure 7-5.
2. Verify that the replacement shaft is the correct length and part number.
3. Obtain technical assistance from Spectro In-corporated Field Service.
7.6.1.3 Procedure to Align Disc Electrode to Rod Electrode
1. Shut down Windows and remove power from the instrument by placing the main power circuit breaker CB1 to the OFF or down position.
2. Refer to Figure 8-1. To remove top exterior
146 | Chapter 7 Maintenance and Servicing Instructions
24 October 2007 / version 3.1
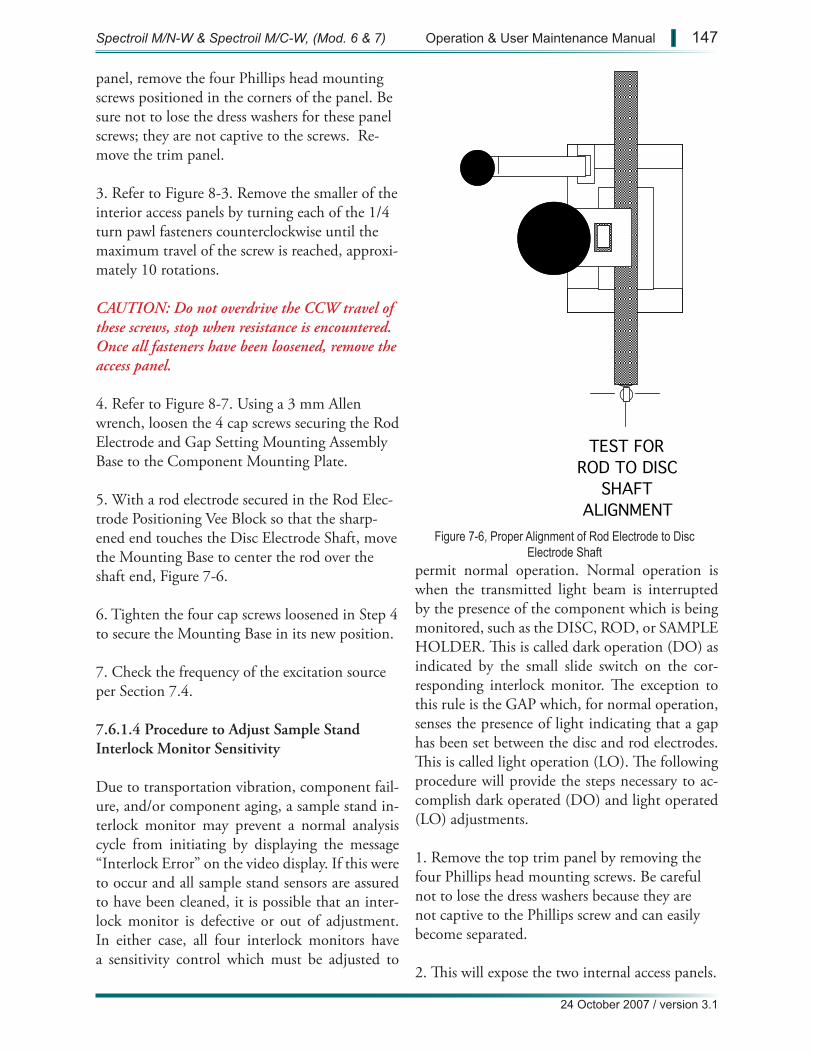
Figure 7-6, Proper Alignment of Rod Electrode to Disc Electrode Shaft
TEST FOR ROD TO DISC
SHAFT ALIGNMENT
panel, remove the four Phillips head mounting screws positioned in the corners of the panel. Be sure not to lose the dress washers for these panel screws; they are not captive to the screws. Re-move the trim panel.
3. Refer to Figure 8-3. Remove the smaller of the interior access panels by turning each of the 1/4 turn pawl fasteners counterclockwise until the maximum travel of the screw is reached, approxi-mately 10 rotations.
CAUTION: Do not overdrive the CCW travel of these screws, stop when resistance is encountered. Once all fasteners have been loosened, remove the access panel.
4. Refer to Figure 8-7. Using a 3 mm Allen wrench, loosen the 4 cap screws securing the Rod Electrode and Gap Setting Mounting Assembly Base to the Component Mounting Plate.
5. With a rod electrode secured in the Rod Elec-trode Positioning Vee Block so that the sharp-ened end touches the Disc Electrode Shaft, move the Mounting Base to center the rod over the shaft end, Figure 7-6.
6. Tighten the four cap screws loosened in Step 4 to secure the Mounting Base in its new position.
7. Check the frequency of the excitation source per Section 7.4.
7.6.1.4 Procedure to Adjust Sample Stand Interlock Monitor Sensitivity
Due to transportation vibration, component fail-ure, and/or component aging, a sample stand in-terlock monitor may prevent a normal analysis cycle from initiating by displaying the message “Interlock Error” on the video display. If this were to occur and all sample stand sensors are assured to have been cleaned, it is possible that an inter-lock monitor is defective or out of adjustment. In either case, all four interlock monitors have a sensitivity control which must be adjusted to
permit normal operation. Normal operation is when the transmitted light beam is interrupted by the presence of the component which is being monitored, such as the DISC, ROD, or SAMPLE HOLDER. This is called dark operation (DO) as indicated by the small slide switch on the cor-responding interlock monitor. The exception to this rule is the GAP which, for normal operation, senses the presence of light indicating that a gap has been set between the disc and rod electrodes. This is called light operation (LO). The following procedure will provide the steps necessary to ac-complish dark operated (DO) and light operated (LO) adjustments.
1. Remove the top trim panel by removing the four Phillips head mounting screws. Be careful not to lose the dress washers because they are not captive to the Phillips screw and can easily become separated.
2. This will expose the two internal access panels.
Spectroil M/N-W & Spectroil M/C-W, (Mod. 6 & 7) Operation & User Maintenance Manual | 147
24 October 2007 / version 3.1
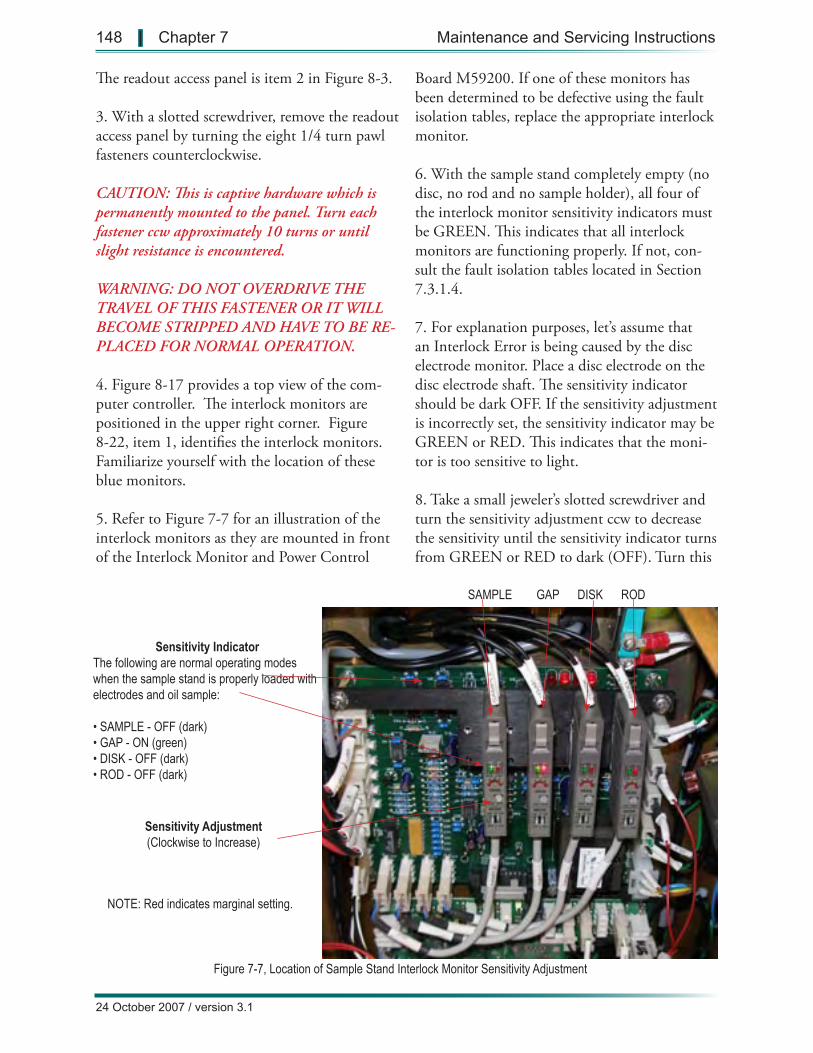
Figure 7-7, Location of Sample Stand Interlock Monitor Sensitivity Adjustment
SAMPLE GAP DISK ROD
Sensitivity Adjustment(Clockwise to Increase)
Sensitivity IndicatorThe following are normal operating modes when the sample stand is properly loaded with electrodes and oil sample:
• SAMPLE - OFF (dark)• GAP - ON (green)• DISK - OFF (dark)• ROD - OFF (dark)
NOTE: Red indicates marginal setting.
The readout access panel is item 2 in Figure 8-3.
3. With a slotted screwdriver, remove the readout access panel by turning the eight 1/4 turn pawl fasteners counterclockwise.
CAUTION: This is captive hardware which is permanently mounted to the panel. Turn each fastener ccw approximately 10 turns or until slight resistance is encountered.
WARNING: DO NOT OVERDRIVE THE TRAVEL OF THIS FASTENER OR IT WILL BECOME STRIPPED AND HAVE TO BE RE-PLACED FOR NORMAL OPERATION.
4. Figure 8-17 provides a top view of the com-puter controller. The interlock monitors are positioned in the upper right corner. Figure 8-22, item 1, identifies the interlock monitors. Familiarize yourself with the location of these blue monitors.
5. Refer to Figure 7-7 for an illustration of the interlock monitors as they are mounted in front of the Interlock Monitor and Power Control
Board M59200. If one of these monitors has been determined to be defective using the fault isolation tables, replace the appropriate interlock monitor.
6. With the sample stand completely empty (no disc, no rod and no sample holder), all four of the interlock monitor sensitivity indicators must be GREEN. This indicates that all interlock monitors are functioning properly. If not, con-sult the fault isolation tables located in Section 7.3.1.4.
7. For explanation purposes, let’s assume that an Interlock Error is being caused by the disc electrode monitor. Place a disc electrode on the disc electrode shaft. The sensitivity indicator should be dark OFF. If the sensitivity adjustment is incorrectly set, the sensitivity indicator may be GREEN or RED. This indicates that the moni-tor is too sensitive to light.
8. Take a small jeweler’s slotted screwdriver and turn the sensitivity adjustment ccw to decrease the sensitivity until the sensitivity indicator turns from GREEN or RED to dark (OFF). Turn this
148 | Chapter 7 Maintenance and Servicing Instructions
24 October 2007 / version 3.1

sensitivity an additional 1/8 turn from the point where the sensitivity indicator changes from the RED (marginal setting) to a solid dark (OFF). Remove the disc electrode and confirm that the sensitivity indicator turns to GREEN. If the sensitivity indicator is RED (marginal), turn the sensitivity adjustment CW to slightly increase the sensitivity until it is solid GREEN.
9. Remove the disc electrode and install another disc electrode and observe the sensitivity indica-tor. It must be dark (OFF). Remove the disc electrode and confirm that the color of the sen-sitivity indicator changes to GREEN. If OK, the sensitivity adjustment has been correctly set.
10. For the GAP interlock monitor which is light operated (LO), place a disc and rod electrode in position and set the analytical gap. Observe the sensitivity indicator on the GAP interlock monitor. It should be GREEN. It not, increase the sensitivity adjustment until the sensitivity indicator changes from RED to GREEN and then turn the adjustment approximately 1/8 turn beyond. Short the disc and rod electrode and ob-serve the sensitivity indicator. It should be dark (OFF). If not, decrease the sensitivity adjustment until it is dark (OFF). Reset the analytical gap several times to confirm operation both in the gapped and shorted positions.
11. Check the operation of all four interlock monitors. Remember, the GAP is light oper-ated (LO) and should be the only indicator to be GREEN when the sample stand is properly loaded for operation. Press the START switch and confirm that an Interlock Error does not inhibit the burn from initiating. If all interlock monitors are operational and adjusted properly, the burn will begin. Press STOP to terminate the burn and reload the sample stand with a new disc, rod, and sample holder. Repeat this pro-cess until satisfied that all interlock monitors are working properly.
12. Take the readout access panel and confirm that all eight 1/4 turn pawl fasteners are in their
maximum counterclockwise direction. If not, use a slotted screwdriver and insure that all pawls are against their maximum counterclockwise stop. Center the readout panel access panel within the frame and tighten all fasteners until the panel under each fastener begins to depress indicating that the panel is sufficiently fitted to the frame.
13. Take the top trim panel and install the four Phillips screws and dress washers. Tighten all hardware until firm but do not torque such that it deforms the dress washers.
14. The instrument is now ready to resume nor-mal operation.
7.6.1.5 Procedure to Replace Rod Electrode Holder and Gap Setting Mechanism, M31200
1. Shut down Windows and remove power from the instrument by placing the main power circuit breaker CB1 to the OFF or down position.
2. Refer to Figure 8-1. To remove top exterior panel, remove the four Phillips head mounting screws positioned in the corners of the panel. Be sure not to lose the dress washers for these panel screws; they are not captive to the screws. Re-move the trim panel.
3. Refer to Figure 8-3. Remove the smaller of the interior access panels by turning each of the 1/4 turn pawl fasteners counterclockwise until the maximum travel of the screw is reached, approxi-mately 10 rotations.
CAUTION: Do not overdrive the counterclock-wise travel of these screws, stop when resistance is encountered. Once all fasteners have been loos-ened, remove the access panel.
4. Refer to Figure 8-7. Using a 1.5 mm Allen wrench, loosen the set screw securing the Electri-cal Contact Pin to the Analytical Gap Adjust-ment and Pivot Plate.
5. Refer to Figure 8-7. Using a 3 mm Allen
Spectroil M/N-W & Spectroil M/C-W, (Mod. 6 & 7) Operation & User Maintenance Manual | 149
24 October 2007 / version 3.1

wrench, remove the four cap screws securing the Rod Electrode and Gap Setting Mounting As-sembly Base to the Component Mounting Plate.
6. Remove the Rod Electrode Holder and Gap Setting Mechanism by pulling it away from the Sample Excitation Stand.
7. Attach the new Rod Electrode Holder Gap Setting Mechanism by installing the four cap screws removed in Step 5. Do not fully tighten these screws at this time.
8. Grasp the knurled thumb nut and push the Electrical Contact Pin fully into the Analytical Gap Adjustment and Pivot Plate. Tighten the set screw loosened in Step 4.
9. Follow the steps in Section 7.6.1.3 to com-plete this installation.
7.6.1.6 Procedure to Replace Disc Electrode Motor, M32101
1. Shut down Windows and remove power from the instrument by placing the main power circuit breaker CB1 to the OFF or down position.
2. Refer to Figure 8-1. To remove top exterior panel, remove the four Phillips head mounting screws positioned in the corners of the panel. Be sure not to lose the dress washers for these panel screws; they are not captive to the screws. Re-move the trim panel.
3. Refer to Figure 8-3. Remove the smaller of the interior access panels by turning each of the 1/4 turn pawl fasteners counterclockwise until the maximum travel of the screw is reached, approxi-mately 10 rotations.
CAUTION: Do not overdrive the counterclock-wise travel of these screws, stop when resistance is encountered. Once all fasteners have been loos-ened, remove the access panel.
4. Refer to Figure 8-10. Using a 3 mm Allen
wrench, remove the three cap screws securing the Disc Electrode Drive Motor to its brass stand-offs.
5. Using a Phillips head screwdriver, loosen the three screws on TB-3 securing the motor wires. Note the orientation of the wires to ensure the new motor is correctly connected.
6. Remove the old motor from the instrument. Using a 1.5 mm Allen wrench, loosen the set screw securing the toothed sprocket to the motor shaft and remove the sprocket.
7. Attach the sprocket to the shaft of the new Disc Electrode Motor. The end of the motor shaft should be flush with the shoulder of the sprocket.
8. Install the new motor in the reverse of Steps 2-5.
7.6.1.7 Procedure to Replace Sample Stand Exhaust Fan, M33002
1. Shut down Windows and remove power from the instrument by placing the main power circuit breaker CB1 to the OFF or down position.
2. Refer to Figure 8-5. Remove the four Phil-lips head screws positioned inside the top of the Sample Excitation Stand. Remove the Exhaust Duct Mounting Housing.
3. Remove the three Phillips head screws that secure the top exhaust fan guard to the fan.
4. Remove the four Phillips head screws that secure the exhaust fan to the frame. Unplug the black wire from the side of the fan.
5. Install the new fan in the reverse of steps 2-4.
7.6.1.8 Procedure to Replace Disc Electrode Drive Belt, M32303
1. Shut down Windows and remove power from
150 | Chapter 7 Maintenance and Servicing Instructions
24 October 2007 / version 3.1
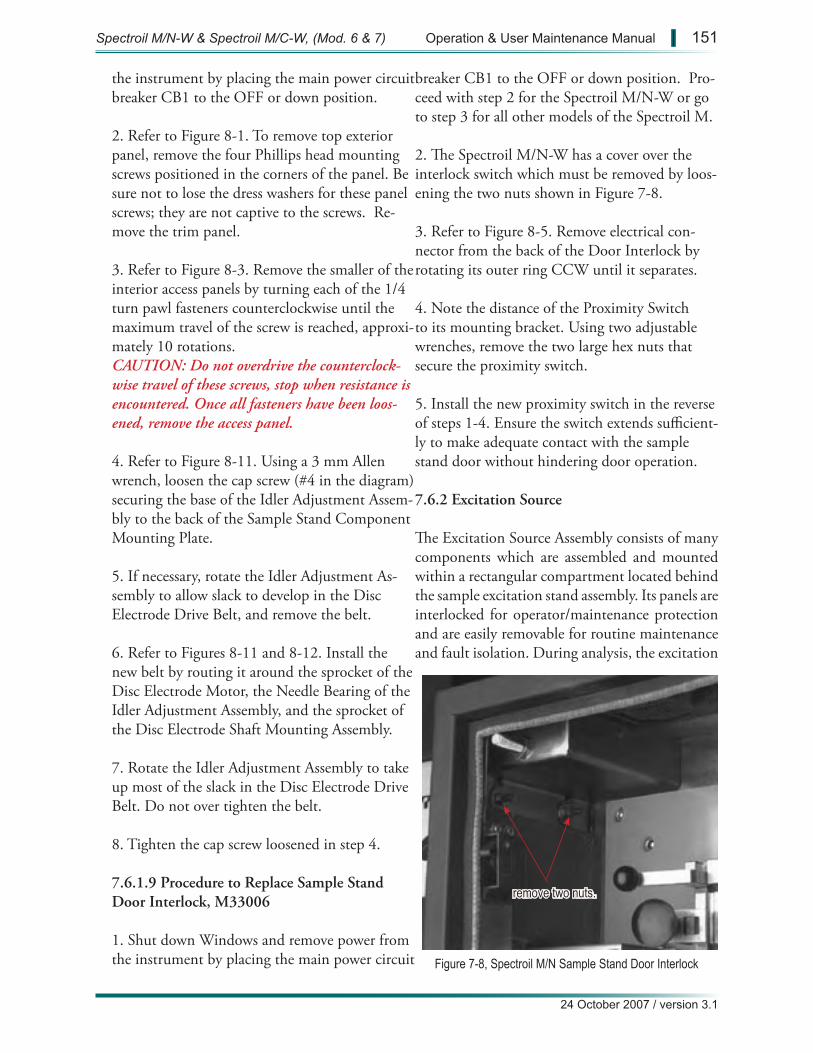
Figure 7-8, Spectroil M/N Sample Stand Door Interlock
remove two nuts.
the instrument by placing the main power circuit breaker CB1 to the OFF or down position.
2. Refer to Figure 8-1. To remove top exterior panel, remove the four Phillips head mounting screws positioned in the corners of the panel. Be sure not to lose the dress washers for these panel screws; they are not captive to the screws. Re-move the trim panel.
3. Refer to Figure 8-3. Remove the smaller of the interior access panels by turning each of the 1/4 turn pawl fasteners counterclockwise until the maximum travel of the screw is reached, approxi-mately 10 rotations. CAUTION: Do not overdrive the counterclock-wise travel of these screws, stop when resistance is encountered. Once all fasteners have been loos-ened, remove the access panel.
4. Refer to Figure 8-11. Using a 3 mm Allen wrench, loosen the cap screw (#4 in the diagram) securing the base of the Idler Adjustment Assem-bly to the back of the Sample Stand Component Mounting Plate.
5. If necessary, rotate the Idler Adjustment As-sembly to allow slack to develop in the Disc Electrode Drive Belt, and remove the belt.
6. Refer to Figures 8-11 and 8-12. Install the new belt by routing it around the sprocket of the Disc Electrode Motor, the Needle Bearing of the Idler Adjustment Assembly, and the sprocket of the Disc Electrode Shaft Mounting Assembly.
7. Rotate the Idler Adjustment Assembly to take up most of the slack in the Disc Electrode Drive Belt. Do not over tighten the belt.
8. Tighten the cap screw loosened in step 4.
7.6.1.9 Procedure to Replace Sample Stand Door Interlock, M33006
1. Shut down Windows and remove power from the instrument by placing the main power circuit
breaker CB1 to the OFF or down position. Pro-ceed with step 2 for the Spectroil M/N-W or go to step 3 for all other models of the Spectroil M.
2. The Spectroil M/N-W has a cover over the interlock switch which must be removed by loos-ening the two nuts shown in Figure 7-8.
3. Refer to Figure 8-5. Remove electrical con-nector from the back of the Door Interlock by rotating its outer ring CCW until it separates.
4. Note the distance of the Proximity Switch to its mounting bracket. Using two adjustable wrenches, remove the two large hex nuts that secure the proximity switch. 5. Install the new proximity switch in the reverse of steps 1-4. Ensure the switch extends sufficient-ly to make adequate contact with the sample stand door without hindering door operation.
7.6.2 Excitation Source
The Excitation Source Assembly consists of many components which are assembled and mounted within a rectangular compartment located behind the sample excitation stand assembly. Its panels are interlocked for operator/maintenance protection and are easily removable for routine maintenance and fault isolation. During analysis, the excitation
Spectroil M/N-W & Spectroil M/C-W, (Mod. 6 & 7) Operation & User Maintenance Manual | 151
24 October 2007 / version 3.1
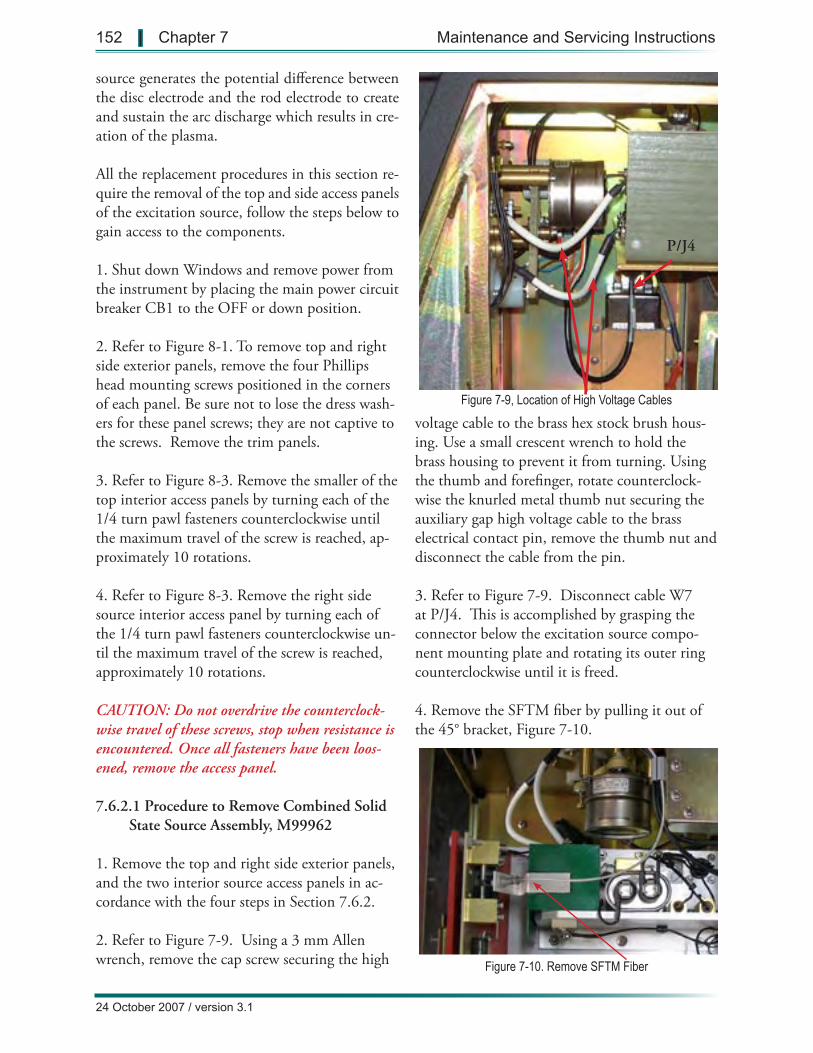
Figure 7-9, Location of High Voltage Cables
Figure 7-10. Remove SFTM Fiber
source generates the potential difference between the disc electrode and the rod electrode to create and sustain the arc discharge which results in cre-ation of the plasma.
All the replacement procedures in this section re-quire the removal of the top and side access panels of the excitation source, follow the steps below to gain access to the components.
1. Shut down Windows and remove power from the instrument by placing the main power circuit breaker CB1 to the OFF or down position.
2. Refer to Figure 8-1. To remove top and right side exterior panels, remove the four Phillips head mounting screws positioned in the corners of each panel. Be sure not to lose the dress wash-ers for these panel screws; they are not captive to the screws. Remove the trim panels.
3. Refer to Figure 8-3. Remove the smaller of the top interior access panels by turning each of the 1/4 turn pawl fasteners counterclockwise until the maximum travel of the screw is reached, ap-proximately 10 rotations.
4. Refer to Figure 8-3. Remove the right side source interior access panel by turning each of the 1/4 turn pawl fasteners counterclockwise un-til the maximum travel of the screw is reached, approximately 10 rotations.
CAUTION: Do not overdrive the counterclock-wise travel of these screws, stop when resistance is encountered. Once all fasteners have been loos-ened, remove the access panel.
7.6.2.1 Procedure to Remove Combined Solid State Source Assembly, M99962
1. Remove the top and right side exterior panels, and the two interior source access panels in ac-cordance with the four steps in Section 7.6.2.
2. Refer to Figure 7-9. Using a 3 mm Allen wrench, remove the cap screw securing the high
voltage cable to the brass hex stock brush hous-ing. Use a small crescent wrench to hold the brass housing to prevent it from turning. Using the thumb and forefinger, rotate counterclock-wise the knurled metal thumb nut securing the auxiliary gap high voltage cable to the brass electrical contact pin, remove the thumb nut and disconnect the cable from the pin.
3. Refer to Figure 7-9. Disconnect cable W7 at P/J4. This is accomplished by grasping the connector below the excitation source compo-nent mounting plate and rotating its outer ring counterclockwise until it is freed.
4. Remove the SFTM fiber by pulling it out of the 45° bracket, Figure 7-10.
P/J4
152 | Chapter 7 Maintenance and Servicing Instructions
24 October 2007 / version 3.1

5. Using a Phillips screwdriver, remove the four 5 mm stainless steel screws from the Excitation Source Component Mounting Plate. Using a standard screwdriver, remove the two 5 mm nylon screws from the plate.
NOTE: The longer plastic screw feeds through a clear plastic standoff before threading into the EMI Shield Plate. This standoff is not cap-tive to either plate. Be careful not to lose it.
6. Carefully remove the entire Excitation Source Assembly from the instrument. This can most easily be accomplished by standing at the right side of the instrument, pulling the Excitation Source towards you approximately 2 inches, then tipping and sliding it forward slightly as you continue pulling it towards you. Use care to avoid catching any wires or components on the frame.
7. Install the Excitation Source Assembly in the reverse of steps 2-6.
8. Check the frequency of the excitation source per Section 7.4.
7.6.2.2 Procedure to Replace Auxiliary Gap Tungsten Electrodes, M42004
1. Shut down Windows and remove the top exterior panel, and the top interior source access panel in accordance with the four steps in Sec-tion 7.6.2.
2. Refer to Figure 8-13. Using a 7 mm open end ignition wrench loosen the nut on each brass block. This will allow you to loosen the set screw with a 2 mm Allen wrench.
3. The two 1 in. tungsten electrodes, one in each auxiliary brass block can now be easily removed.
4. Replace the electrodes using the reverse of the steps above.
5. Using a feeler gage set the auxiliary gap dis-tance to 0.135”. Unplug the optical fiber from the 45 degree bracket mounted on the black box inductor of the excitation source. Insert the 2 mm Allen wrench into the fiber holder to indicate the view path of the fiber. Ensure the fiber would be aimed directly at the center of the auxiliary gap. When the gap is centered and set at 0.135”.
6. Plug the optical fiber into the 45 degree bracket. Reinstall the interior and exterior panels removed in Step 1.
7. Check the frequency of the excitation source per Section 7.4.
7.6.3 Optical System
The optical system is mounted in a light sealed container located in the bottom of the Spectroil M. There are no components that can be repaired or replaced in the field. Contact Spectro for as-sistance in troubleshooting the optical system.
If it is determined that the optical system is de-fective, it must be returned to Spectro Inc. to be repaired. To gain access to the optical system, the keyboard, front and rear lower protective panels, four connectors and four nuts and screws have to be removed.
Perform the following steps to remove the optical system:
1. Shut down Windows and remove power from the instrument by placing the main power circuit breaker CB1 to the OFF and down position.
2. Remove the Keyboard Panel, Figures 7-11a and 7-11b..
3. Remove Access Panels. a. With a Phillips screwdriver, remove the bottom front access panel. Disconnect the keyboard cable from the inside of the panel, Figure 7-11c.
Spectroil M/N-W & Spectroil M/C-W, (Mod. 6 & 7) Operation & User Maintenance Manual | 153
24 October 2007 / version 3.1
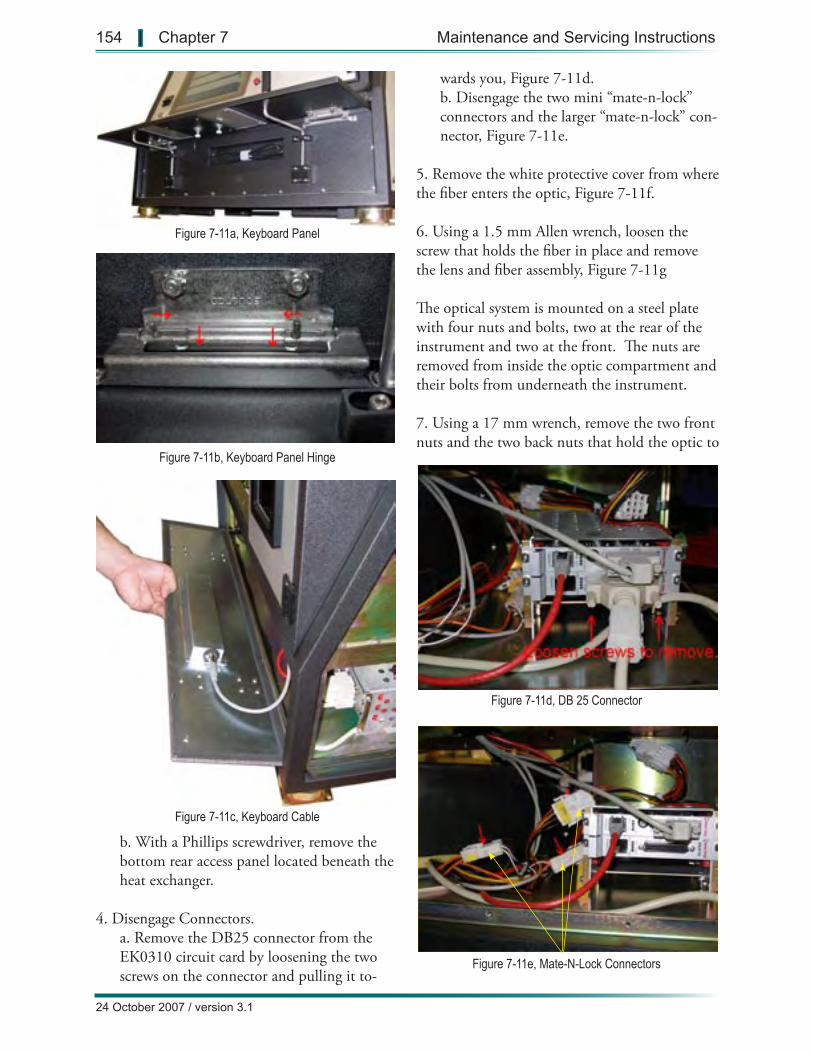
Figure 7-11a, Keyboard Panel
Figure 7-11b, Keyboard Panel Hinge
Figure 7-11e, Mate-N-Lock Connectors
Figure 7-11c, Keyboard Cable
Figure 7-11d, DB 25 Connector
b. With a Phillips screwdriver, remove the bottom rear access panel located beneath the heat exchanger.
4. Disengage Connectors.a. Remove the DB25 connector from the EK0310 circuit card by loosening the two screws on the connector and pulling it to-
wards you, Figure 7-11d.b. Disengage the two mini “mate-n-lock” connectors and the larger “mate-n-lock” con-nector, Figure 7-11e.
5. Remove the white protective cover from where the fiber enters the optic, Figure 7-11f.
6. Using a 1.5 mm Allen wrench, loosen the screw that holds the fiber in place and remove the lens and fiber assembly, Figure 7-11g
The optical system is mounted on a steel plate with four nuts and bolts, two at the rear of the instrument and two at the front. The nuts are removed from inside the optic compartment and their bolts from underneath the instrument.
7. Using a 17 mm wrench, remove the two front nuts and the two back nuts that hold the optic to
154 | Chapter 7 Maintenance and Servicing Instructions
24 October 2007 / version 3.1
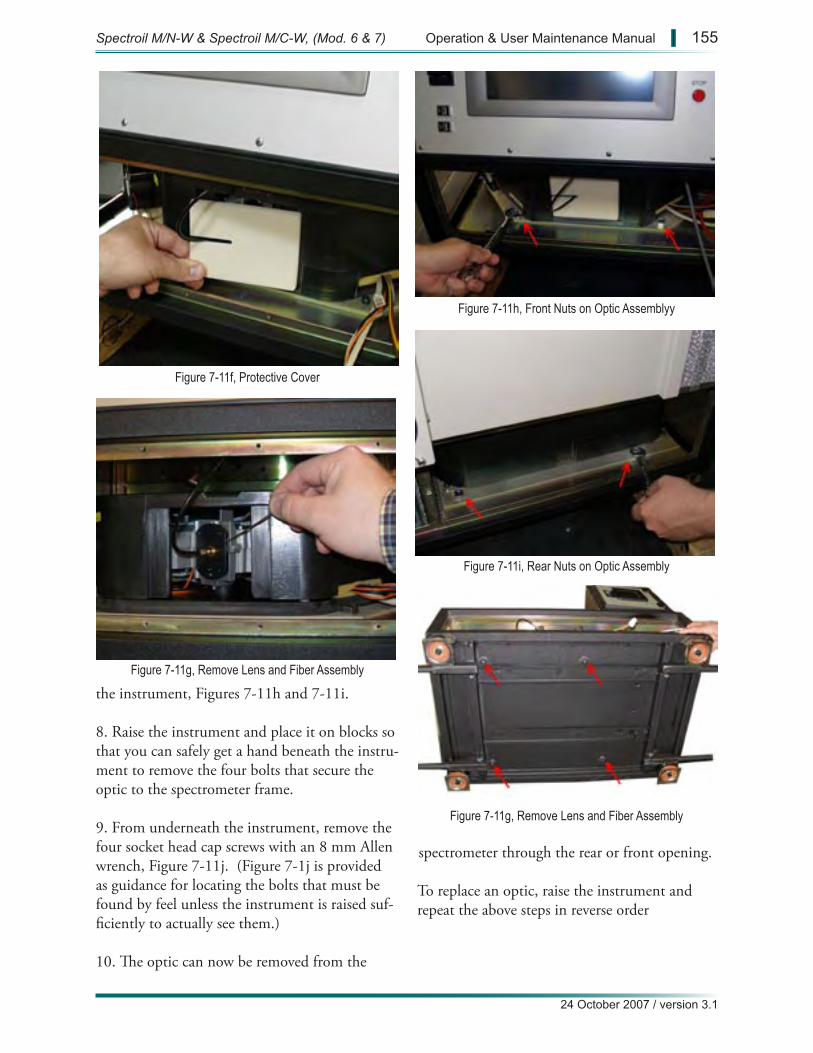
Figure 7-11f, Protective Cover
Figure 7-11g, Remove Lens and Fiber Assembly
Figure 7-11h, Front Nuts on Optic Assemblyy
Figure 7-11i, Rear Nuts on Optic Assembly
Figure 7-11g, Remove Lens and Fiber Assembly
the instrument, Figures 7-11h and 7-11i.
8. Raise the instrument and place it on blocks so that you can safely get a hand beneath the instru-ment to remove the four bolts that secure the optic to the spectrometer frame.
9. From underneath the instrument, remove the four socket head cap screws with an 8 mm Allen wrench, Figure 7-11j. (Figure 7-1j is provided as guidance for locating the bolts that must be found by feel unless the instrument is raised suf-ficiently to actually see them.)
10. The optic can now be removed from the
spectrometer through the rear or front opening.
To replace an optic, raise the instrument and repeat the above steps in reverse order
Spectroil M/N-W & Spectroil M/C-W, (Mod. 6 & 7) Operation & User Maintenance Manual | 155
24 October 2007 / version 3.1

7.6.4 Computer and Readout System
The computer and readout system consist of the OilM software, the readout assembly (panel PC) and the data acquisition and Ethernet controller circuit cards.
7.6.4.1 Procedure to Replace Controller Cards
The two controller circuit cards, EK0011 and EK0310 are physically located next to the Spec-troil’s optic. To remove and replace either card:
1. Shut down Windows and remove power from the instrument by placing the main power circuit breaker CB1 to the OFF and down position.
2. Remove the Keyboard Panel, Figures 7-11a and 7-11b..
3. Remove Access Panels. a. With a Phillips screwdriver, remove the bottom front access panel. Disconnect the keyboard cable from the inside of the panel, Figure 7-11c.b. With a Phillips screwdriver, remove the bottom rear access panel located beneath the heat exchanger.
4. Remove the connectors from the card you wish to replace. The EK0310 has a DB 25 con-nector attached to it and the EK0011 has a DB 15 connector and an Ethernet cable attached to it.
5. Slide the circuit card towards you and out of its holder.
To replace a controller circuit card, reverse the above procedure.
7.6.4.2 Procedure to Remove M68155 Win-dows Readout Assembly
1. The instrument must be turned OFF for this procedure. Shut down Windows and wait for the message “It is now safe to turn off the instru-
ment” message before turning the circuit breaker, CB1, to the OFF position.
2. Refer to Figure 8-15. Remove the ten phillips head screws securing the Windows Readout As-sembly (control panel) to the instrument.
3. Gently and carefully start to pull the readout assembly towards you and out of the instrument.
4. Slowly pull the top of the assembly forward until it is approximately level, while the bottom is resting on the frame of the instrument. It is not necessary, but it helps to have someone assist by holding the assembly in place.
5. Refer to Figure 7-12 and disconnect power cable from the Panel PC assembly.
6. Disconnect P8 connector by twisting apart.
7. Disconnect the two COM port cables from the Panel PC assembly.
8. Disconnect the parallel LPT input connector by squeezing its sides and pulling away from the Panel PC assembly.
9. Disconnect the keyboard/mouse connector.
10. Remove the ethernet cable by squeezing on the tap at the bottom of the connector and pull-ing it away from the Panel PC assembly.
11. It is now possible to remove the complete Windows Readout assembly from the Spectroil. Carefully set it on a smooth surface to protect the video monitor.
7.6.4.3 Procedure to Remove the Panel PC M68150 from Windows Readout Assembly
1. Performs steps 1 through 10 in procedure 7.6.4.2 to remove the Windows Readout assem-bly (control panel) from the instrument.
2. Remove the two USB connectors from the
156 | Chapter 7 Maintenance and Servicing Instructions
24 October 2007 / version 3.1
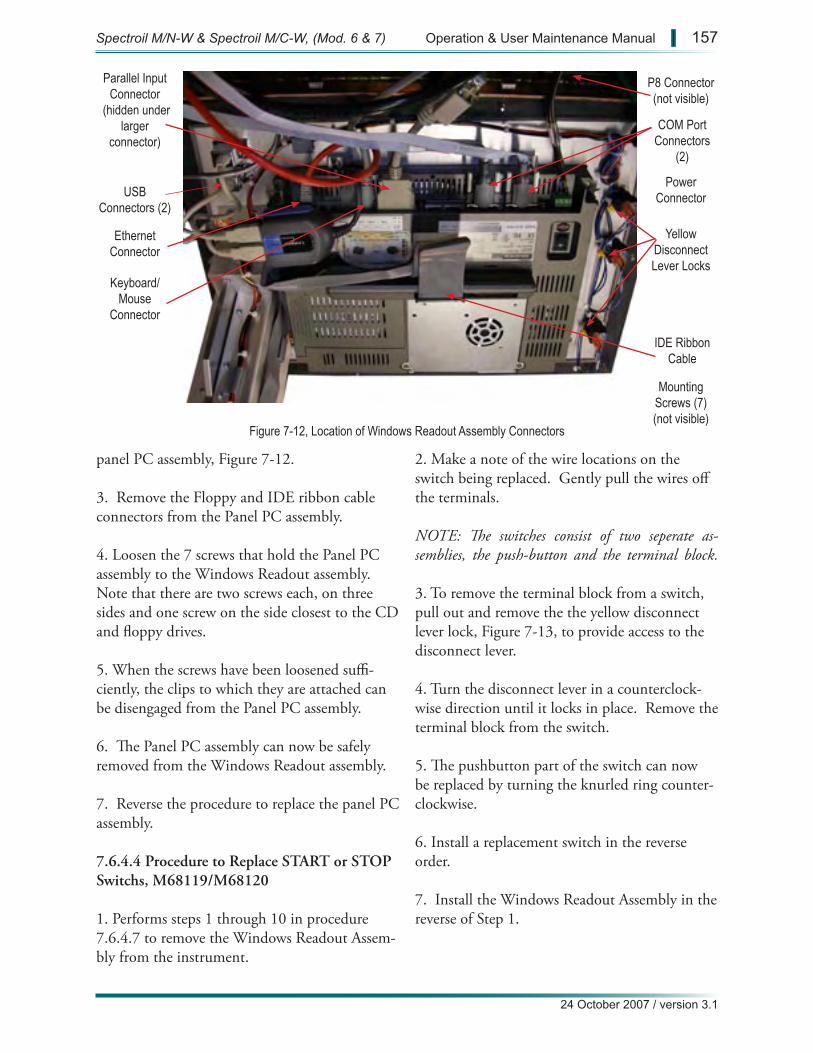
Figure 7-12, Location of Windows Readout Assembly Connectors
Parallel Input Connector
(hidden under larger
connector)
Keyboard/Mouse
Connector
USB Connectors (2)
Ethernet Connector
P8 Connector(not visible)
COM Port Connectors
(2)
PowerConnector
Mounting Screws (7)(not visible)
IDE Ribbon Cable
Yellow Disconnect Lever Locks
panel PC assembly, Figure 7-12.
3. Remove the Floppy and IDE ribbon cable connectors from the Panel PC assembly.
4. Loosen the 7 screws that hold the Panel PC assembly to the Windows Readout assembly. Note that there are two screws each, on three sides and one screw on the side closest to the CD and floppy drives.
5. When the screws have been loosened suffi-ciently, the clips to which they are attached can be disengaged from the Panel PC assembly.
6. The Panel PC assembly can now be safely removed from the Windows Readout assembly.
7. Reverse the procedure to replace the panel PC assembly.
7.6.4.4 Procedure to Replace START or STOP Switchs, M68119/M68120
1. Performs steps 1 through 10 in procedure 7.6.4.7 to remove the Windows Readout Assem-bly from the instrument.
2. Make a note of the wire locations on the switch being replaced. Gently pull the wires off the terminals.
NOTE: The switches consist of two seperate as-semblies, the push-button and the terminal block.
3. To remove the terminal block from a switch, pull out and remove the the yellow disconnect lever lock, Figure 7-13, to provide access to the disconnect lever.
4. Turn the disconnect lever in a counterclock-wise direction until it locks in place. Remove the terminal block from the switch.
5. The pushbutton part of the switch can now be replaced by turning the knurled ring counter-clockwise.
6. Install a replacement switch in the reverse order.
7. Install the Windows Readout Assembly in the reverse of Step 1.
Spectroil M/N-W & Spectroil M/C-W, (Mod. 6 & 7) Operation & User Maintenance Manual | 157
24 October 2007 / version 3.1
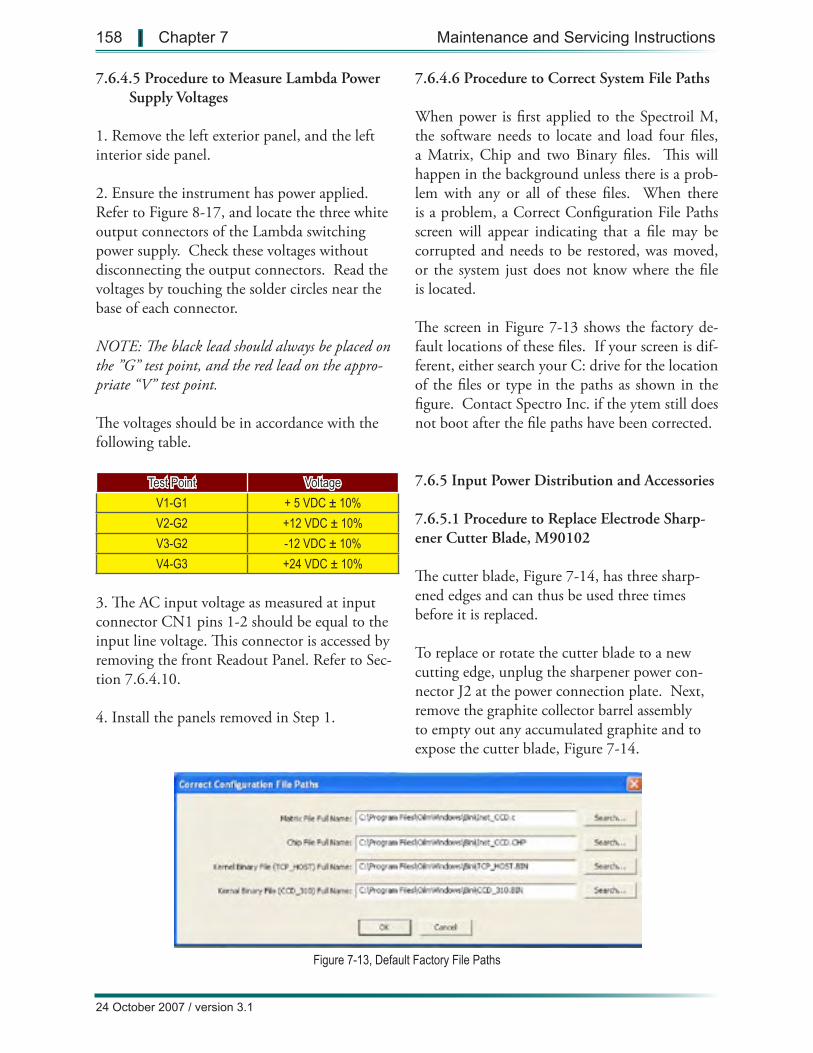
Figure 7-13, Default Factory File Paths
7.6.4.5 Procedure to Measure Lambda Power Supply Voltages
1. Remove the left exterior panel, and the left interior side panel.
2. Ensure the instrument has power applied. Refer to Figure 8-17, and locate the three white output connectors of the Lambda switching power supply. Check these voltages without disconnecting the output connectors. Read the voltages by touching the solder circles near the base of each connector.
NOTE: The black lead should always be placed on the ”G” test point, and the red lead on the appro-priate “V” test point.
The voltages should be in accordance with the following table.
Test Point Voltage
V1-G1 + 5 VDC ± 10%
V2-G2 +12 VDC ± 10%
V3-G2 -12 VDC ± 10%
V4-G3 +24 VDC ± 10%
3. The AC input voltage as measured at input connector CN1 pins 1-2 should be equal to the input line voltage. This connector is accessed by removing the front Readout Panel. Refer to Sec-tion 7.6.4.10.
4. Install the panels removed in Step 1.
7.6.4.6 Procedure to Correct System File Paths
When power is first applied to the Spectroil M, the software needs to locate and load four files, a Matrix, Chip and two Binary files. This will happen in the background unless there is a prob-lem with any or all of these files. When there is a problem, a Correct Configuration File Paths screen will appear indicating that a file may be corrupted and needs to be restored, was moved, or the system just does not know where the file is located.
The screen in Figure 7-13 shows the factory de-fault locations of these files. If your screen is dif-ferent, either search your C: drive for the location of the files or type in the paths as shown in the figure. Contact Spectro Inc. if the ytem still does not boot after the file paths have been corrected.
7.6.5 Input Power Distribution and Accessories
7.6.5.1 Procedure to Replace Electrode Sharp-ener Cutter Blade, M90102
The cutter blade, Figure 7-14, has three sharp-ened edges and can thus be used three times before it is replaced.
To replace or rotate the cutter blade to a new cutting edge, unplug the sharpener power con-nector J2 at the power connection plate. Next, remove the graphite collector barrel assembly to empty out any accumulated graphite and to expose the cutter blade, Figure 7-14.
158 | Chapter 7 Maintenance and Servicing Instructions
24 October 2007 / version 3.1
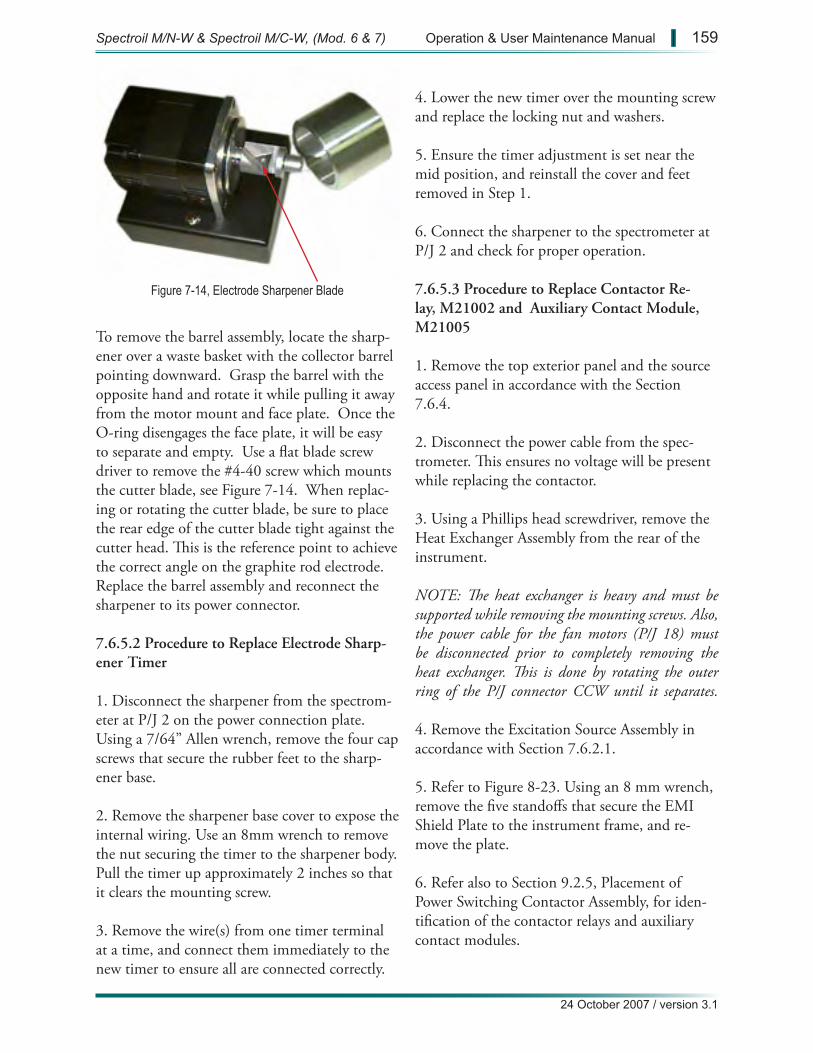
Figure 7-14, Electrode Sharpener Blade
To remove the barrel assembly, locate the sharp-ener over a waste basket with the collector barrel pointing downward. Grasp the barrel with the opposite hand and rotate it while pulling it away from the motor mount and face plate. Once the O-ring disengages the face plate, it will be easy to separate and empty. Use a flat blade screw driver to remove the #4-40 screw which mounts the cutter blade, see Figure 7-14. When replac-ing or rotating the cutter blade, be sure to place the rear edge of the cutter blade tight against the cutter head. This is the reference point to achieve the correct angle on the graphite rod electrode. Replace the barrel assembly and reconnect the sharpener to its power connector.
7.6.5.2 Procedure to Replace Electrode Sharp-ener Timer
1. Disconnect the sharpener from the spectrom-eter at P/J 2 on the power connection plate. Using a 7/64” Allen wrench, remove the four cap screws that secure the rubber feet to the sharp-ener base.
2. Remove the sharpener base cover to expose the internal wiring. Use an 8mm wrench to remove the nut securing the timer to the sharpener body. Pull the timer up approximately 2 inches so that it clears the mounting screw.
3. Remove the wire(s) from one timer terminal at a time, and connect them immediately to the new timer to ensure all are connected correctly.
4. Lower the new timer over the mounting screw and replace the locking nut and washers.
5. Ensure the timer adjustment is set near the mid position, and reinstall the cover and feet removed in Step 1.
6. Connect the sharpener to the spectrometer at P/J 2 and check for proper operation.
7.6.5.3 Procedure to Replace Contactor Re-lay, M21002 and Auxiliary Contact Module, M21005
1. Remove the top exterior panel and the source access panel in accordance with the Section 7.6.4.
2. Disconnect the power cable from the spec-trometer. This ensures no voltage will be present while replacing the contactor.
3. Using a Phillips head screwdriver, remove the Heat Exchanger Assembly from the rear of the instrument.
NOTE: The heat exchanger is heavy and must be supported while removing the mounting screws. Also, the power cable for the fan motors (P/J 18) must be disconnected prior to completely removing the heat exchanger. This is done by rotating the outer ring of the P/J connector CCW until it separates.
4. Remove the Excitation Source Assembly in accordance with Section 7.6.2.1.
5. Refer to Figure 8-23. Using an 8 mm wrench, remove the five standoffs that secure the EMI Shield Plate to the instrument frame, and re-move the plate.
6. Refer also to Section 9.2.5, Placement of Power Switching Contactor Assembly, for iden-tification of the contactor relays and auxiliary contact modules.
Spectroil M/N-W & Spectroil M/C-W, (Mod. 6 & 7) Operation & User Maintenance Manual | 159
24 October 2007 / version 3.1
7. Each contactor relay, auxiliary contact mod-ule, and their associated wires should be indi-vidually labeled. If each wire connected to the component being replaced does not have a wire marker, label each wire before removing it to facilitate installation of the new component.
8. To replace an auxiliary contactor module:
a. Using a Phillips screwdriver, loosen the clamps securing each wire connected to the module, and gently pull all wires out of the module.
b. Using the thumb and forefinger to straddle the contactor, squeeze the tabs located midway along the bottom length of the module. This will allow the module to be pulled upward and removed.
c. Carefully pry out the rectangular white label on the old contactor and install it on the new one.
d. Orient the new contactor module over its associated Contactor Relay. One end will have two alignment pins, the other only one.
e. Reconnect all wires removed in step 8.a.
f. Firmly push down on the auxiliary contactor module until it clicks into place.
g. Install the Heat Exchanger, EMI Shield Plate, and Excitation Source Assembly.
9. To replace a Contactor Relay:
a. If the contactor relay being replaced is K1 or K2, first remove the mechanical interlock by grasping it firmly with two hands and wiggling it while pulling upward. Set it aside.
b. If the contactor relay being replaced is K3 or K4, first remove the auxiliary contactor module mounted on top of it by following step 8.b. There should be enough slack in the wires to
allow access to the relay.
c. Using a flat bladed screwdriver, pry outward the clip located midway along the bottom of the relay. The relay can now be tilted back and removed from the track it is secured to.
d. Using a Phillips screwdriver, loosen the clamps securing each wire connected to the relay, and gently pull all wires out of the relay.
e. Carefully pry out the rectangular white label on the old relay and install it on the new one.
f. Reconnect all wires removed in step 9.d.
g. Orient the new relay over the track. Tilt it backward slightly, pushing downward as you then tilt it forward and it clicks into place.
h. Install the Heat Exchanger, EMI Shield Plate, and Excitation Source Assembly.
10. Reconnect the power cable and apply power to the instrument in accordance with Section 2.1.5.
160 | Chapter 7 Maintenance and Servicing Instructions
24 October 2007 / version 3.1
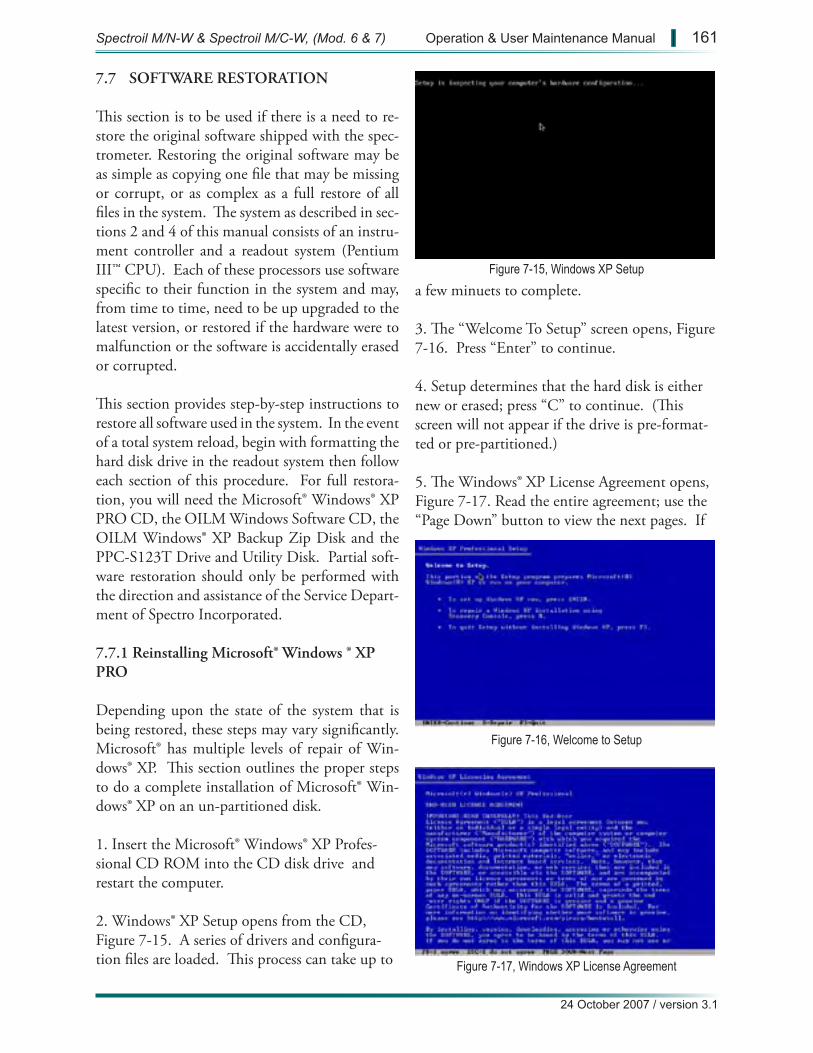
Figure 7-15, Windows XP Setup
Figure 7-16, Welcome to Setup
Figure 7-17, Windows XP License Agreement
7.7 SOFTWARE RESTORATION
This section is to be used if there is a need to re-store the original software shipped with the spec-trometer. Restoring the original software may be as simple as copying one file that may be missing or corrupt, or as complex as a full restore of all files in the system. The system as described in sec-tions 2 and 4 of this manual consists of an instru-ment controller and a readout system (Pentium III™ CPU). Each of these processors use software specific to their function in the system and may, from time to time, need to be up upgraded to the latest version, or restored if the hardware were to malfunction or the software is accidentally erased or corrupted.
This section provides step-by-step instructions to restore all software used in the system. In the event of a total system reload, begin with formatting the hard disk drive in the readout system then follow each section of this procedure. For full restora-tion, you will need the Microsoft® Windows® XP PRO CD, the OILM Windows Software CD, the OILM Windows® XP Backup Zip Disk and the PPC-S123T Drive and Utility Disk. Partial soft-ware restoration should only be performed with the direction and assistance of the Service Depart-ment of Spectro Incorporated.
7.7.1 Reinstalling Microsoft® Windows ® XP PRO
Depending upon the state of the system that is being restored, these steps may vary significantly. Microsoft® has multiple levels of repair of Win-dows® XP. This section outlines the proper steps to do a complete installation of Microsoft® Win-dows® XP on an un-partitioned disk.
1. Insert the Microsoft® Windows® XP Profes-sional CD ROM into the CD disk drive and restart the computer.
2. Windows® XP Setup opens from the CD, Figure 7-15. A series of drivers and configura-tion files are loaded. This process can take up to
a few minuets to complete.
3. The “Welcome To Setup” screen opens, Figure 7-16. Press “Enter” to continue.
4. Setup determines that the hard disk is either new or erased; press “C” to continue. (This screen will not appear if the drive is pre-format-ted or pre-partitioned.)
5. The Windows® XP License Agreement opens, Figure 7-17. Read the entire agreement; use the “Page Down” button to view the next pages. If
Spectroil M/N-W & Spectroil M/C-W, (Mod. 6 & 7) Operation & User Maintenance Manual | 161
24 October 2007 / version 3.1
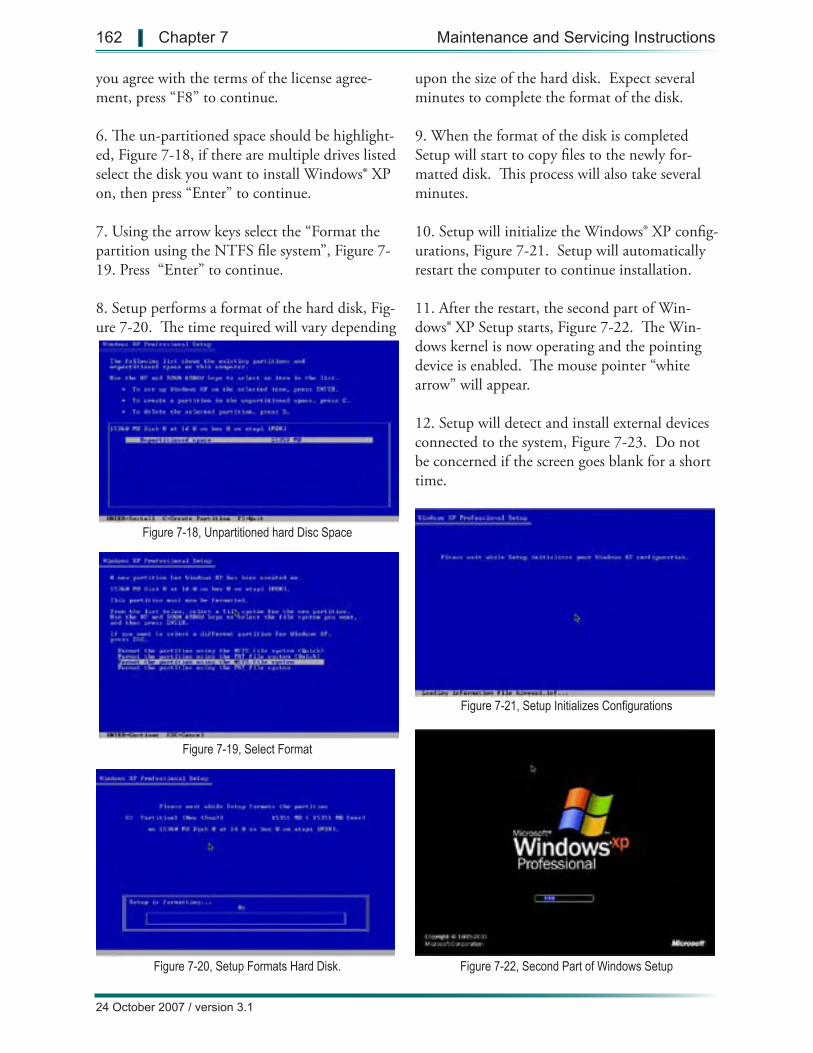
Figure 7-19, Select Format
Figure 7-18, Unpartitioned hard Disc Space
Figure 7-20, Setup Formats Hard Disk. Figure 7-22, Second Part of Windows Setup
Figure 7-21, Setup Initializes Configurations
you agree with the terms of the license agree-ment, press “F8” to continue.
6. The un-partitioned space should be highlight-ed, Figure 7-18, if there are multiple drives listed select the disk you want to install Windows® XP on, then press “Enter” to continue.
7. Using the arrow keys select the “Format the partition using the NTFS file system”, Figure 7-19. Press “Enter” to continue.
8. Setup performs a format of the hard disk, Fig-ure 7-20. The time required will vary depending
upon the size of the hard disk. Expect several minutes to complete the format of the disk.
9. When the format of the disk is completed Setup will start to copy files to the newly for-matted disk. This process will also take several minutes.
10. Setup will initialize the Windows® XP config-urations, Figure 7-21. Setup will automatically restart the computer to continue installation.
11. After the restart, the second part of Win-dows® XP Setup starts, Figure 7-22. The Win-dows kernel is now operating and the pointing device is enabled. The mouse pointer “white arrow” will appear.
12. Setup will detect and install external devices connected to the system, Figure 7-23. Do not be concerned if the screen goes blank for a short time.
162 | Chapter 7 Maintenance and Servicing Instructions
24 October 2007 / version 3.1
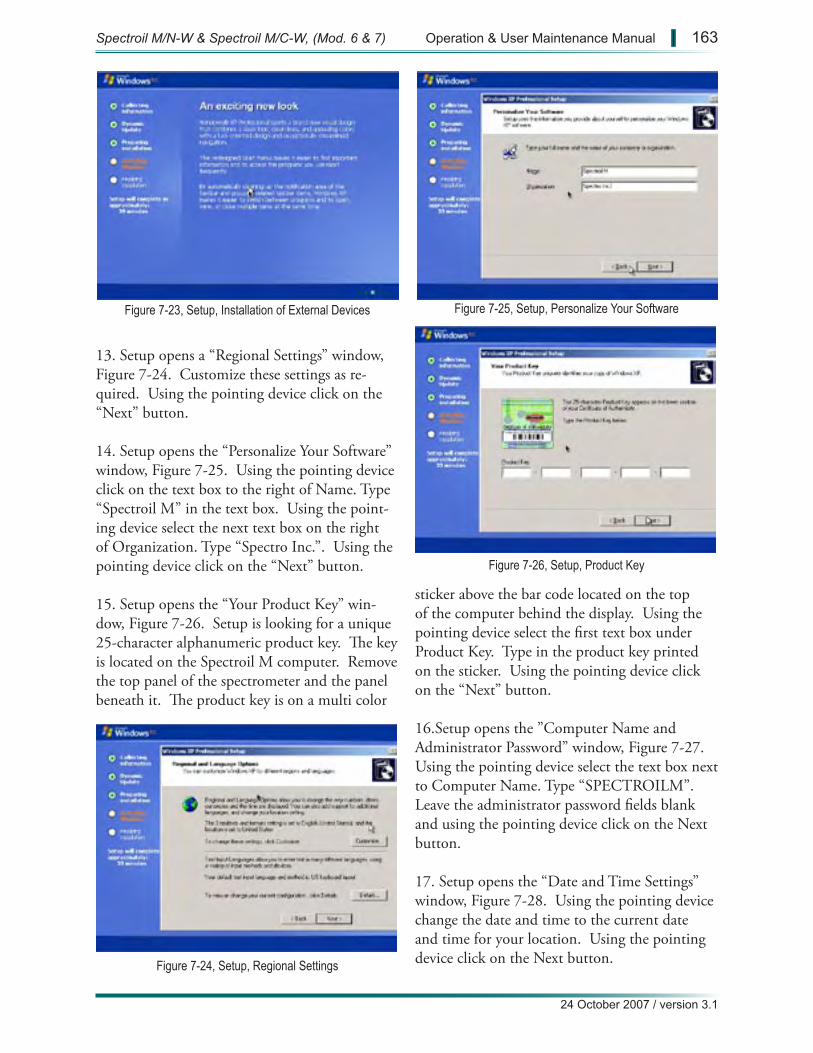
Figure 7-23, Setup, Installation of External Devices
Figure 7-24, Setup, Regional Settings
Figure 7-25, Setup, Personalize Your Software
Figure 7-26, Setup, Product Key
13. Setup opens a “Regional Settings” window, Figure 7-24. Customize these settings as re-quired. Using the pointing device click on the “Next” button.
14. Setup opens the “Personalize Your Software” window, Figure 7-25. Using the pointing device click on the text box to the right of Name. Type “Spectroil M” in the text box. Using the point-ing device select the next text box on the right of Organization. Type “Spectro Inc.”. Using the pointing device click on the “Next” button.
15. Setup opens the “Your Product Key” win-dow, Figure 7-26. Setup is looking for a unique 25-character alphanumeric product key. The key is located on the Spectroil M computer. Remove the top panel of the spectrometer and the panel beneath it. The product key is on a multi color
sticker above the bar code located on the top of the computer behind the display. Using the pointing device select the first text box under Product Key. Type in the product key printed on the sticker. Using the pointing device click on the “Next” button.
16.Setup opens the ”Computer Name and Administrator Password” window, Figure 7-27. Using the pointing device select the text box next to Computer Name. Type “SPECTROILM”. Leave the administrator password fields blank and using the pointing device click on the Next button.
17. Setup opens the “Date and Time Settings” window, Figure 7-28. Using the pointing device change the date and time to the current date and time for your location. Using the pointing device click on the Next button.
Spectroil M/N-W & Spectroil M/C-W, (Mod. 6 & 7) Operation & User Maintenance Manual | 163
24 October 2007 / version 3.1
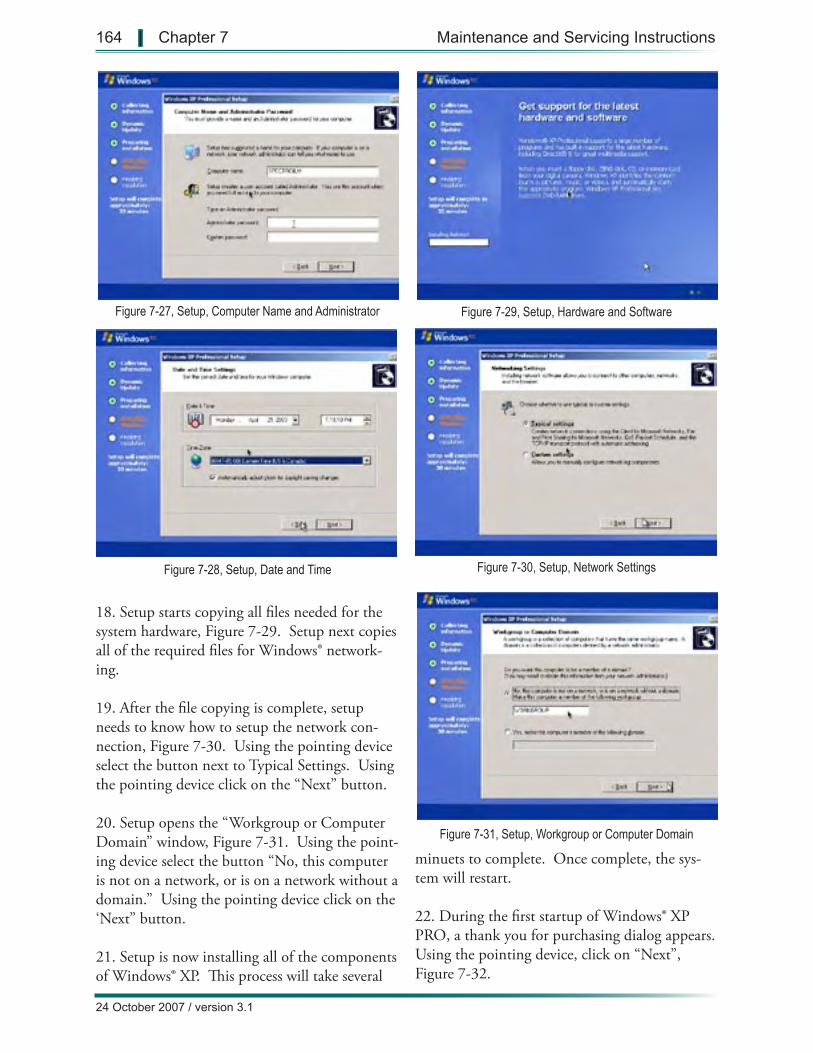
Figure 7-27, Setup, Computer Name and Administrator
Figure 7-28, Setup, Date and Time
Figure 7-29, Setup, Hardware and Software
Figure 7-30, Setup, Network Settings
Figure 7-31, Setup, Workgroup or Computer Domain
18. Setup starts copying all files needed for the system hardware, Figure 7-29. Setup next copies all of the required files for Windows® network-ing.
19. After the file copying is complete, setup needs to know how to setup the network con-nection, Figure 7-30. Using the pointing device select the button next to Typical Settings. Using the pointing device click on the “Next” button.
20. Setup opens the “Workgroup or Computer Domain” window, Figure 7-31. Using the point-ing device select the button “No, this computer is not on a network, or is on a network without a domain.” Using the pointing device click on the ‘Next” button.
21. Setup is now installing all of the components of Windows® XP. This process will take several
minuets to complete. Once complete, the sys-tem will restart.
22. During the first startup of Windows® XP PRO, a thank you for purchasing dialog appears. Using the pointing device, click on “Next”, Figure 7-32.
164 | Chapter 7 Maintenance and Servicing Instructions
24 October 2007 / version 3.1
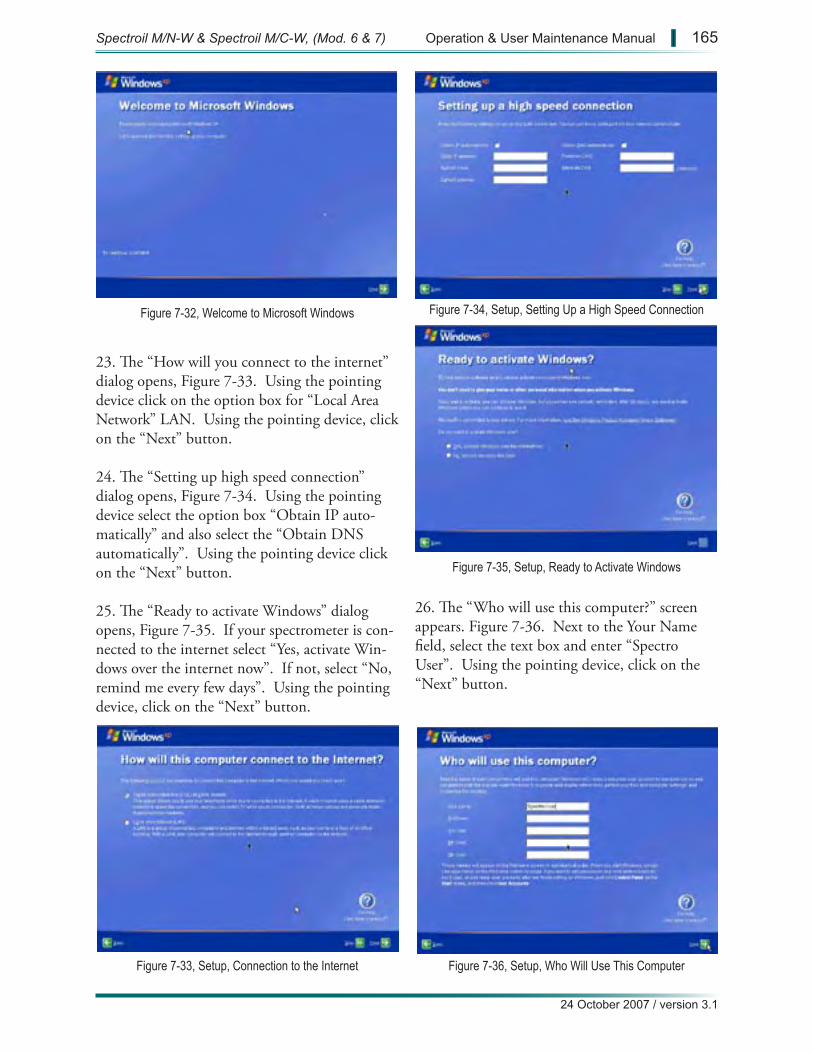
Figure 7-33, Setup, Connection to the Internet
Figure 7-32, Welcome to Microsoft Windows Figure 7-34, Setup, Setting Up a High Speed Connection
Figure 7-35, Setup, Ready to Activate Windows
Figure 7-36, Setup, Who Will Use This Computer
23. The “How will you connect to the internet” dialog opens, Figure 7-33. Using the pointing device click on the option box for “Local Area Network” LAN. Using the pointing device, click on the “Next” button.
24. The “Setting up high speed connection” dialog opens, Figure 7-34. Using the pointing device select the option box “Obtain IP auto-matically” and also select the “Obtain DNS automatically”. Using the pointing device click on the “Next” button.
25. The “Ready to activate Windows” dialog opens, Figure 7-35. If your spectrometer is con-nected to the internet select “Yes, activate Win-dows over the internet now”. If not, select “No, remind me every few days”. Using the pointing device, click on the “Next” button.
26. The “Who will use this computer?” screen appears. Figure 7-36. Next to the Your Name field, select the text box and enter “Spectro User”. Using the pointing device, click on the “Next” button.
Spectroil M/N-W & Spectroil M/C-W, (Mod. 6 & 7) Operation & User Maintenance Manual | 165
24 October 2007 / version 3.1
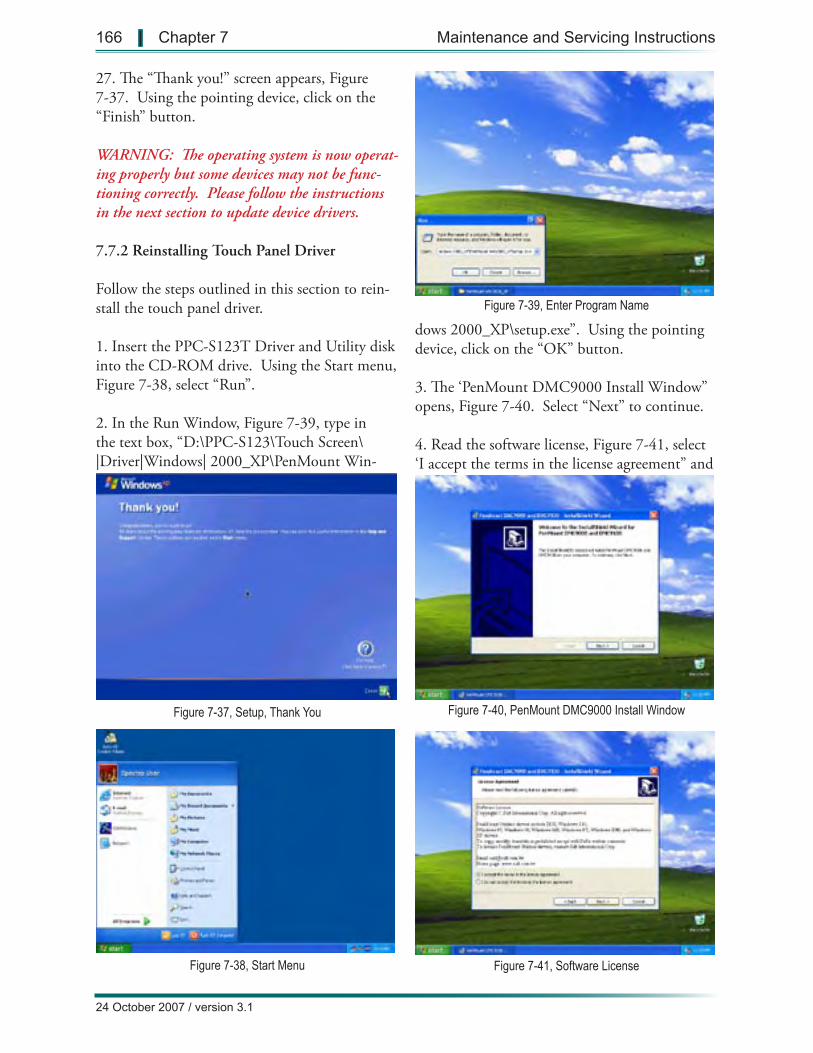
Figure 7-37, Setup, Thank You
Figure 7-38, Start Menu
Figure 7-40, PenMount DMC9000 Install Window
Figure 7-39, Enter Program Name
Figure 7-41, Software License
27. The “Thank you!” screen appears, Figure 7-37. Using the pointing device, click on the “Finish” button.
WARNING: The operating system is now operat-ing properly but some devices may not be func-tioning correctly. Please follow the instructions in the next section to update device drivers.
7.7.2 Reinstalling Touch Panel Driver
Follow the steps outlined in this section to rein-stall the touch panel driver.
1. Insert the PPC-S123T Driver and Utility disk into the CD-ROM drive. Using the Start menu, Figure 7-38, select “Run”.
2. In the Run Window, Figure 7-39, type in the text box, “D:\PPC-S123\Touch Screen\|Driver|Windows| 2000_XP\PenMount Win-
dows 2000_XP\setup.exe”. Using the pointing device, click on the “OK” button.
3. The ‘PenMount DMC9000 Install Window” opens, Figure 7-40. Select “Next” to continue.
4. Read the software license, Figure 7-41, select ‘I accept the terms in the license agreement” and
166 | Chapter 7 Maintenance and Servicing Instructions
24 October 2007 / version 3.1
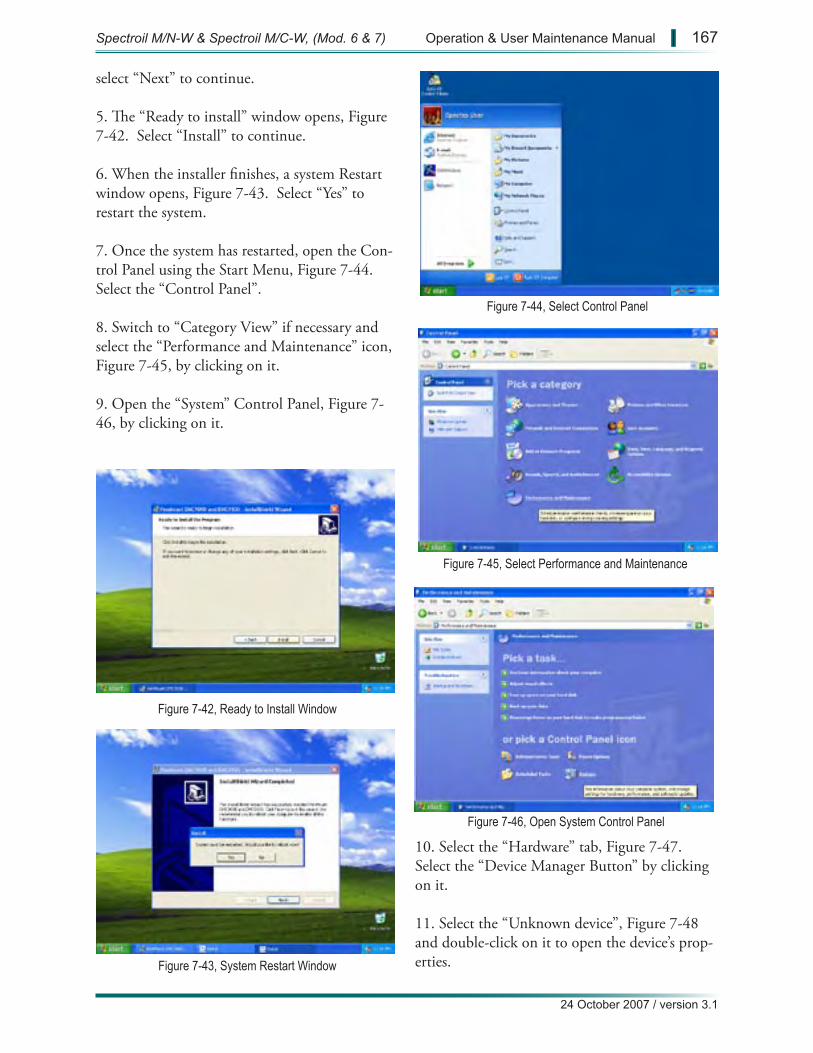
Figure 7-42, Ready to Install Window
Figure 7-43, System Restart Window
Figure 7-44, Select Control Panel
Figure 7-45, Select Performance and Maintenance
Figure 7-46, Open System Control Panel
select “Next” to continue.
5. The “Ready to install” window opens, Figure 7-42. Select “Install” to continue.
6. When the installer finishes, a system Restart window opens, Figure 7-43. Select “Yes” to restart the system.
7. Once the system has restarted, open the Con-trol Panel using the Start Menu, Figure 7-44. Select the “Control Panel”.
8. Switch to “Category View” if necessary and select the “Performance and Maintenance” icon, Figure 7-45, by clicking on it.
9. Open the “System” Control Panel, Figure 7-46, by clicking on it.
10. Select the “Hardware” tab, Figure 7-47. Select the “Device Manager Button” by clicking on it.
11. Select the “Unknown device”, Figure 7-48 and double-click on it to open the device’s prop-erties.
Spectroil M/N-W & Spectroil M/C-W, (Mod. 6 & 7) Operation & User Maintenance Manual | 167
24 October 2007 / version 3.1
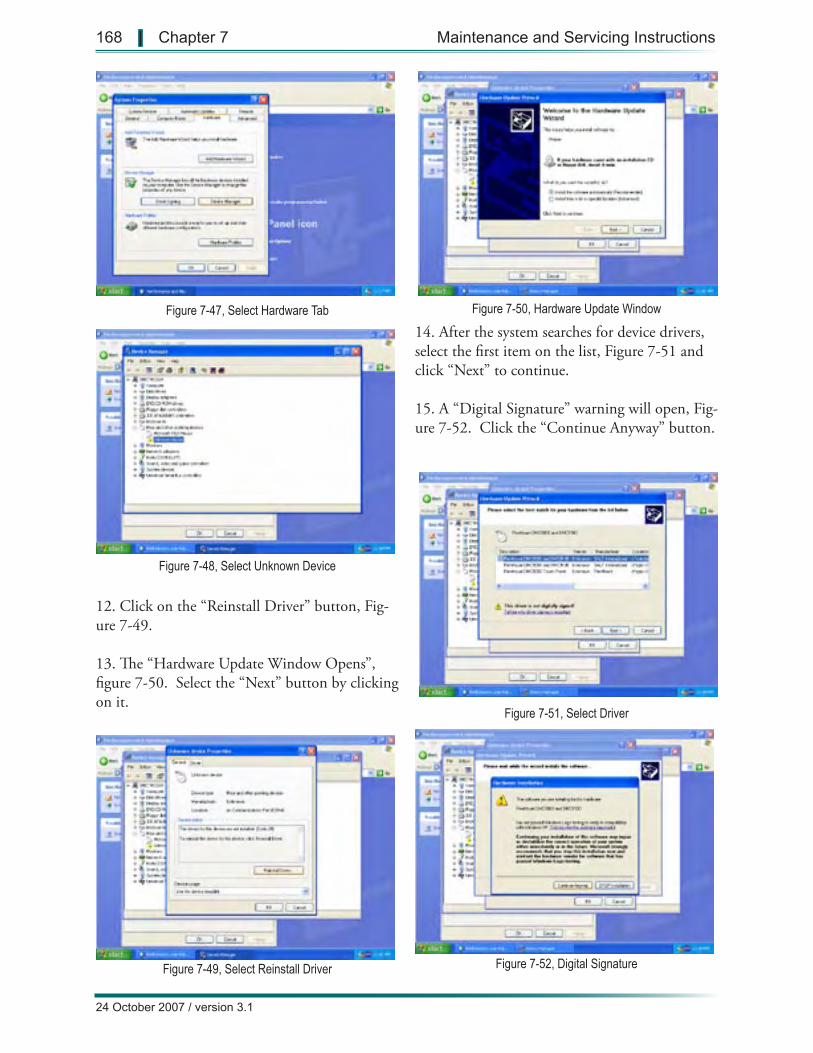
Figure 7-47, Select Hardware Tab
Figure 7-48, Select Unknown Device
Figure 7-51, Select Driver
Figure 7-50, Hardware Update Window
Figure 7-49, Select Reinstall Driver Figure 7-52, Digital Signature
12. Click on the “Reinstall Driver” button, Fig-ure 7-49.
13. The “Hardware Update Window Opens”, figure 7-50. Select the “Next” button by clicking on it.
14. After the system searches for device drivers, select the first item on the list, Figure 7-51 and click “Next” to continue.
15. A “Digital Signature” warning will open, Fig-ure 7-52. Click the “Continue Anyway” button.
168 | Chapter 7 Maintenance and Servicing Instructions
24 October 2007 / version 3.1
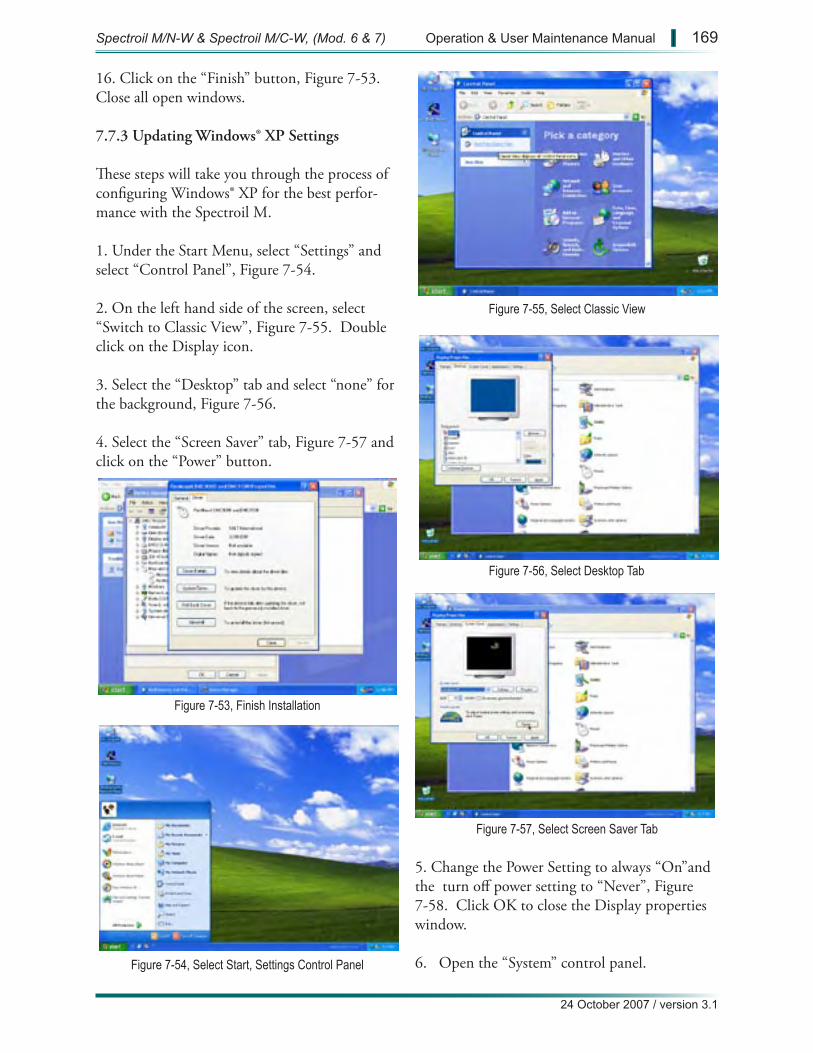
Figure 7-53, Finish Installation
Figure 7-54, Select Start, Settings Control Panel
Figure 7-56, Select Desktop Tab
Figure 7-55, Select Classic View
Figure 7-57, Select Screen Saver Tab
16. Click on the “Finish” button, Figure 7-53. Close all open windows.
7.7.3 Updating Windows® XP Settings
These steps will take you through the process of configuring Windows® XP for the best perfor-mance with the Spectroil M.
1. Under the Start Menu, select “Settings” and select “Control Panel”, Figure 7-54.
2. On the left hand side of the screen, select “Switch to Classic View”, Figure 7-55. Double click on the Display icon.
3. Select the “Desktop” tab and select “none” for the background, Figure 7-56.
4. Select the “Screen Saver” tab, Figure 7-57 and click on the “Power” button.
5. Change the Power Setting to always “On”and the turn off power setting to “Never”, Figure 7-58. Click OK to close the Display properties window.
6. Open the “System” control panel.
Spectroil M/N-W & Spectroil M/C-W, (Mod. 6 & 7) Operation & User Maintenance Manual | 169
24 October 2007 / version 3.1
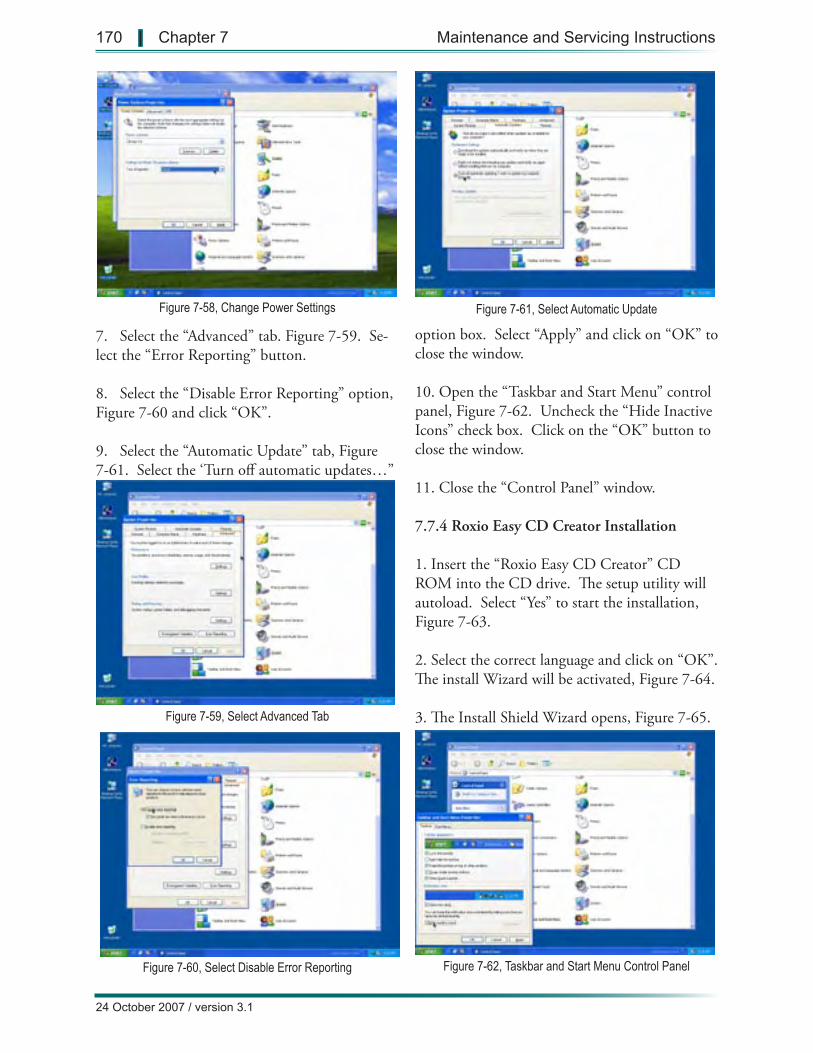
Figure 7-58, Change Power Settings
Figure 7-59, Select Advanced Tab
Figure 7-62, Taskbar and Start Menu Control Panel
Figure 7-61, Select Automatic Update
Figure 7-60, Select Disable Error Reporting
7. Select the “Advanced” tab. Figure 7-59. Se-lect the “Error Reporting” button.
8. Select the “Disable Error Reporting” option, Figure 7-60 and click “OK”.
9. Select the “Automatic Update” tab, Figure 7-61. Select the ‘Turn off automatic updates…”
option box. Select “Apply” and click on “OK” to close the window.
10. Open the “Taskbar and Start Menu” control panel, Figure 7-62. Uncheck the “Hide Inactive Icons” check box. Click on the “OK” button to close the window.
11. Close the “Control Panel” window.
7.7.4 Roxio Easy CD Creator Installation
1. Insert the “Roxio Easy CD Creator” CD ROM into the CD drive. The setup utility will autoload. Select “Yes” to start the installation, Figure 7-63.
2. Select the correct language and click on “OK”. The install Wizard will be activated, Figure 7-64.
3. The Install Shield Wizard opens, Figure 7-65.
170 | Chapter 7 Maintenance and Servicing Instructions
24 October 2007 / version 3.1
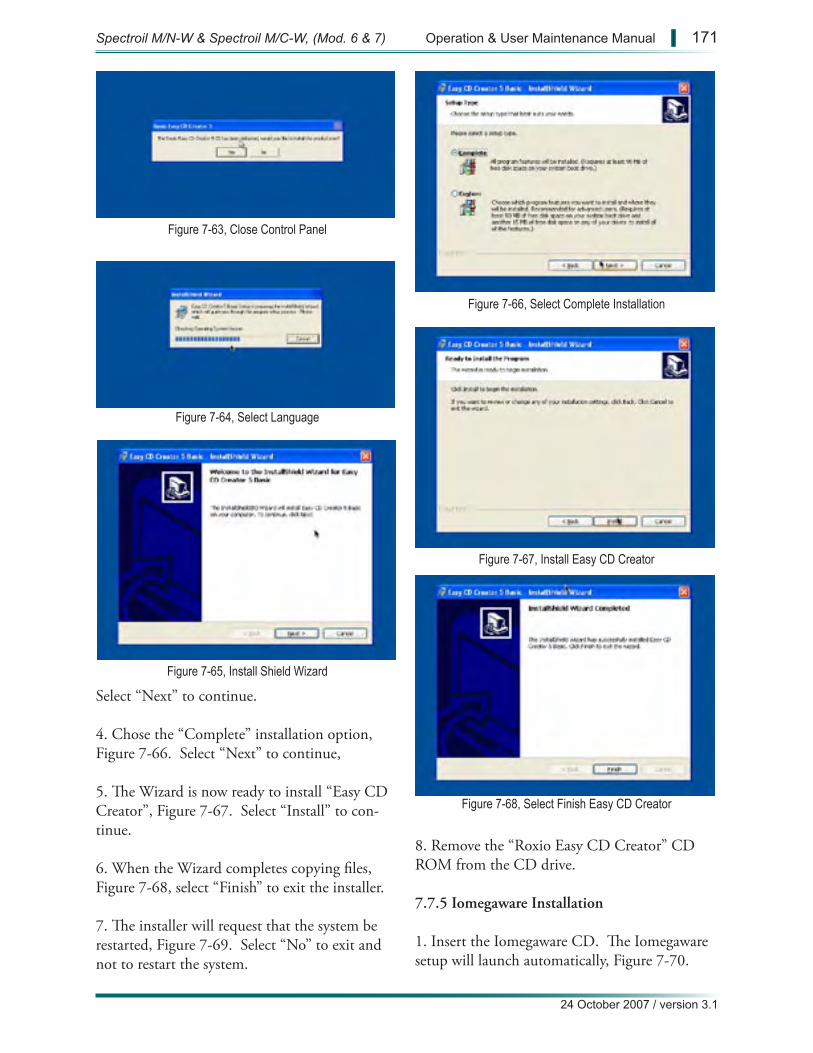
Figure 7-65, Install Shield Wizard
Figure 7-64, Select Language
Figure 7-63, Close Control Panel
Figure 7-67, Install Easy CD Creator
Figure 7-66, Select Complete Installation
Figure 7-68, Select Finish Easy CD Creator
Select “Next” to continue.
4. Chose the “Complete” installation option, Figure 7-66. Select “Next” to continue,
5. The Wizard is now ready to install “Easy CD Creator”, Figure 7-67. Select “Install” to con-tinue.
6. When the Wizard completes copying files, Figure 7-68, select “Finish” to exit the installer.
7. The installer will request that the system be restarted, Figure 7-69. Select “No” to exit and not to restart the system.
8. Remove the “Roxio Easy CD Creator” CD ROM from the CD drive.
7.7.5 Iomegaware Installation
1. Insert the Iomegaware CD. The Iomegaware setup will launch automatically, Figure 7-70.
Spectroil M/N-W & Spectroil M/C-W, (Mod. 6 & 7) Operation & User Maintenance Manual | 171
24 October 2007 / version 3.1
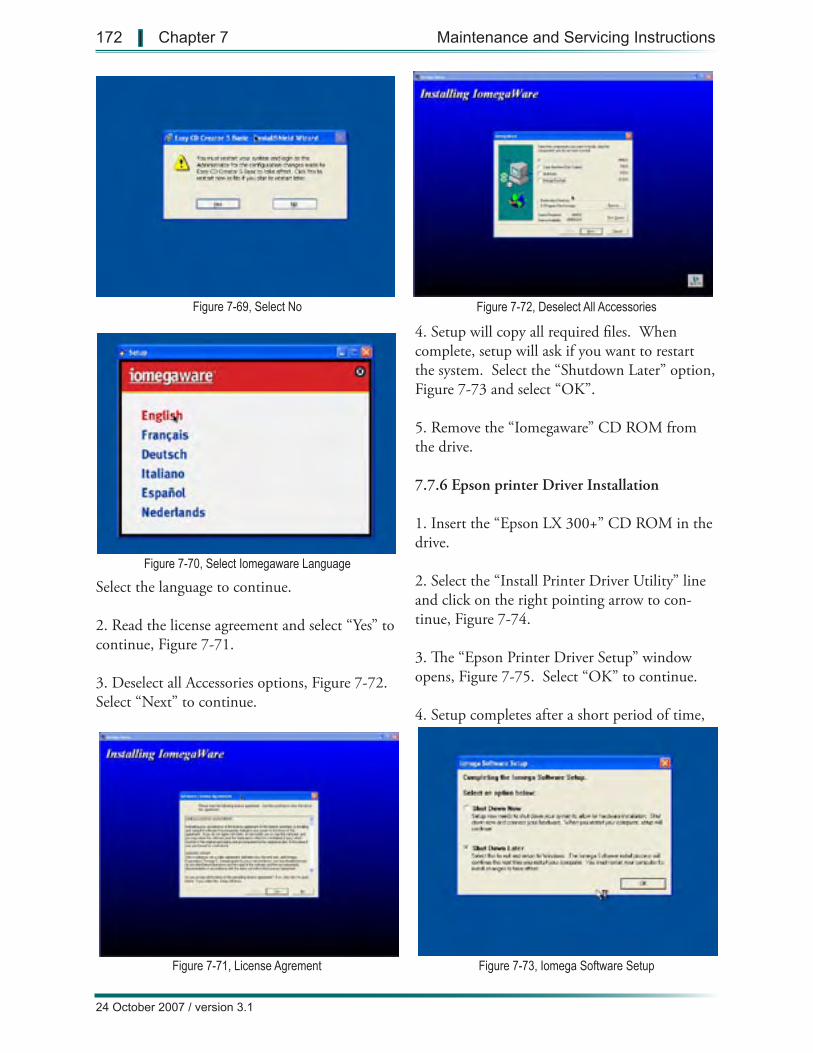
Figure 7-70, Select Iomegaware Language
Figure 7-69, Select No
Figure 7-71, License Agrement
Figure 7-72, Deselect All Accessories
Figure 7-73, Iomega Software Setup
Select the language to continue.
2. Read the license agreement and select “Yes” to continue, Figure 7-71.
3. Deselect all Accessories options, Figure 7-72. Select “Next” to continue.
4. Setup will copy all required files. When complete, setup will ask if you want to restart the system. Select the “Shutdown Later” option, Figure 7-73 and select “OK”.
5. Remove the “Iomegaware” CD ROM from the drive.
7.7.6 Epson printer Driver Installation
1. Insert the “Epson LX 300+” CD ROM in the drive.
2. Select the “Install Printer Driver Utility” line and click on the right pointing arrow to con-tinue, Figure 7-74.
3. The “Epson Printer Driver Setup” window opens, Figure 7-75. Select “OK” to continue.
4. Setup completes after a short period of time,
172 | Chapter 7 Maintenance and Servicing Instructions
24 October 2007 / version 3.1
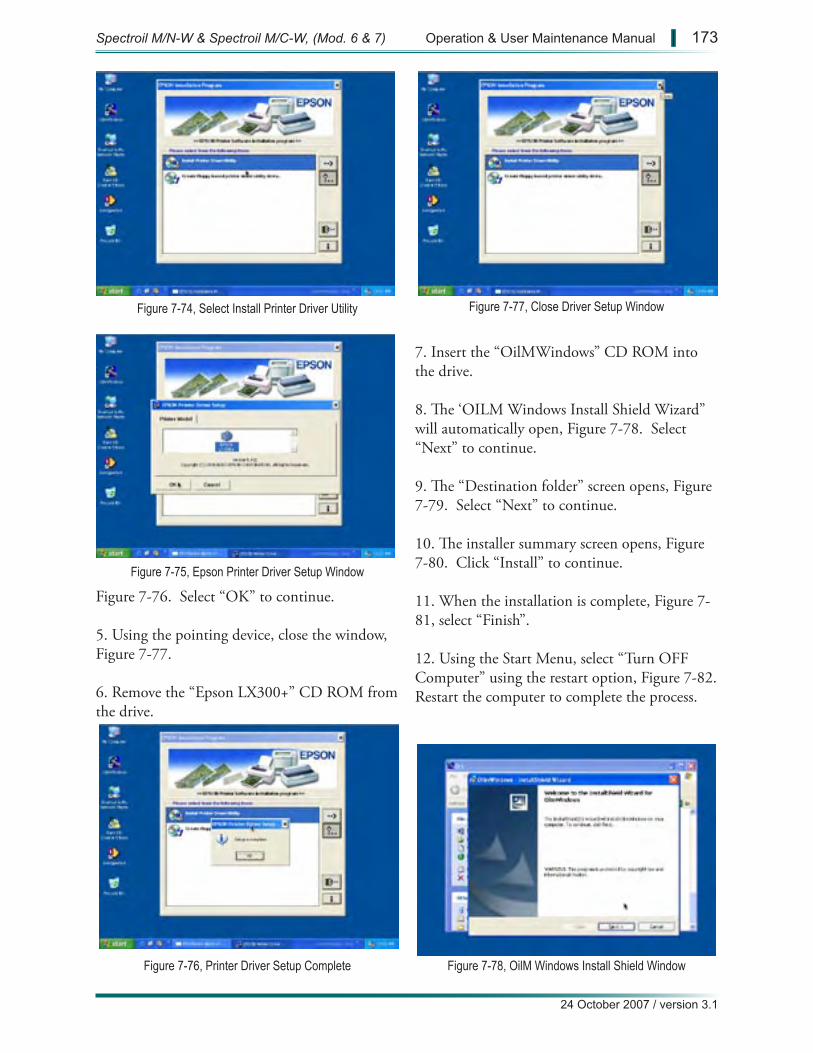
Figure 7-75, Epson Printer Driver Setup Window
Figure 7-74, Select Install Printer Driver Utility
Figure 7-76, Printer Driver Setup Complete
Figure 7-77, Close Driver Setup Window
Figure 7-78, OilM Windows Install Shield Window
Figure 7-76. Select “OK” to continue.
5. Using the pointing device, close the window, Figure 7-77.
6. Remove the “Epson LX300+” CD ROM from the drive.
7. Insert the “OilMWindows” CD ROM into the drive.
8. The ‘OILM Windows Install Shield Wizard” will automatically open, Figure 7-78. Select “Next” to continue.
9. The “Destination folder” screen opens, Figure 7-79. Select “Next” to continue.
10. The installer summary screen opens, Figure 7-80. Click “Install” to continue.
11. When the installation is complete, Figure 7-81, select “Finish”.
12. Using the Start Menu, select “Turn OFF Computer” using the restart option, Figure 7-82. Restart the computer to complete the process.
Spectroil M/N-W & Spectroil M/C-W, (Mod. 6 & 7) Operation & User Maintenance Manual | 173
24 October 2007 / version 3.1
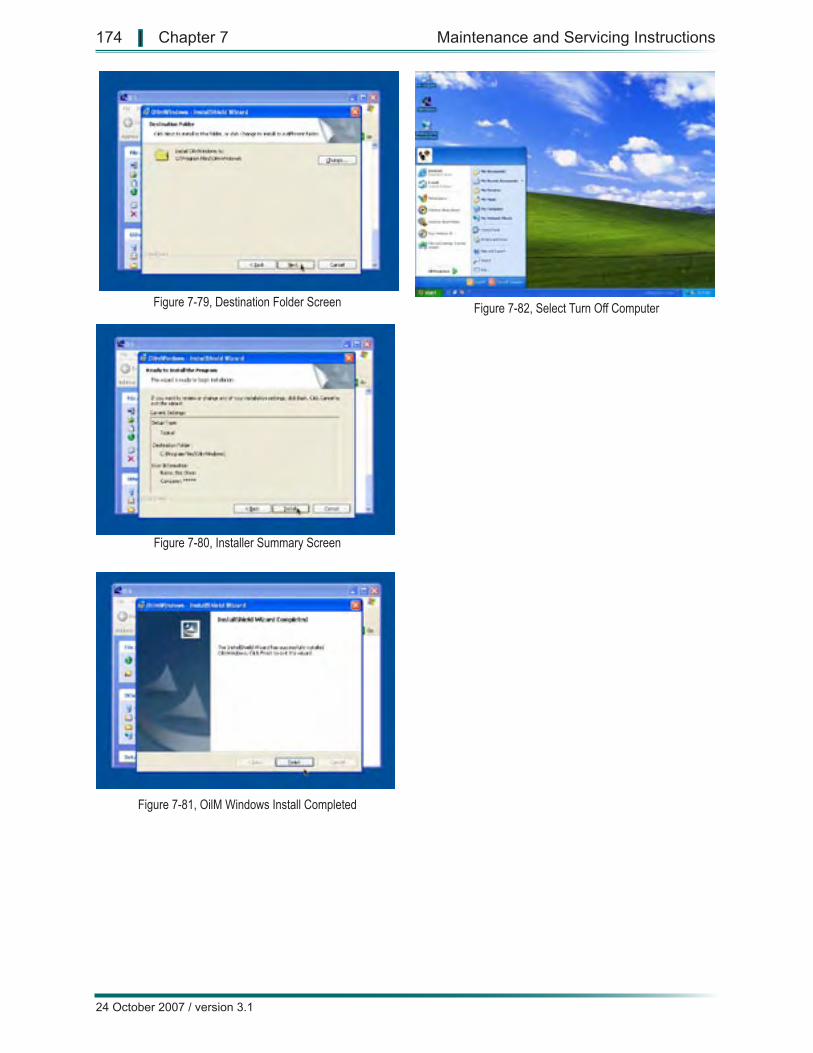
Figure 7-81, OilM Windows Install Completed
Figure 7-82, Select Turn Off Computer
Figure 7-80, Installer Summary Screen
Figure 7-79, Destination Folder Screen
174 | Chapter 7 Maintenance and Servicing Instructions
24 October 2007 / version 3.1

8.0 ASSEMBLY PARTS LIST
8.1 PARTS LIST ILLUSTRATIONS
This section lists those components which are readily identifiable and can be replaced at the user level of maintenance. If parts are required, order by figure and item number, nomenclature and date of instruction manual.
Figures are listed according to assemblies start-ing with the housing, excitation source, control panel, readout electronics, optics and power distribution.
Chapter 8
Assembly Parts List
24 October 2007 / version 3.1
Spectroil M/N-W & Spectroil M/C-W, Mod. 6 & 7) Operation & User Maintenance Manual | 175
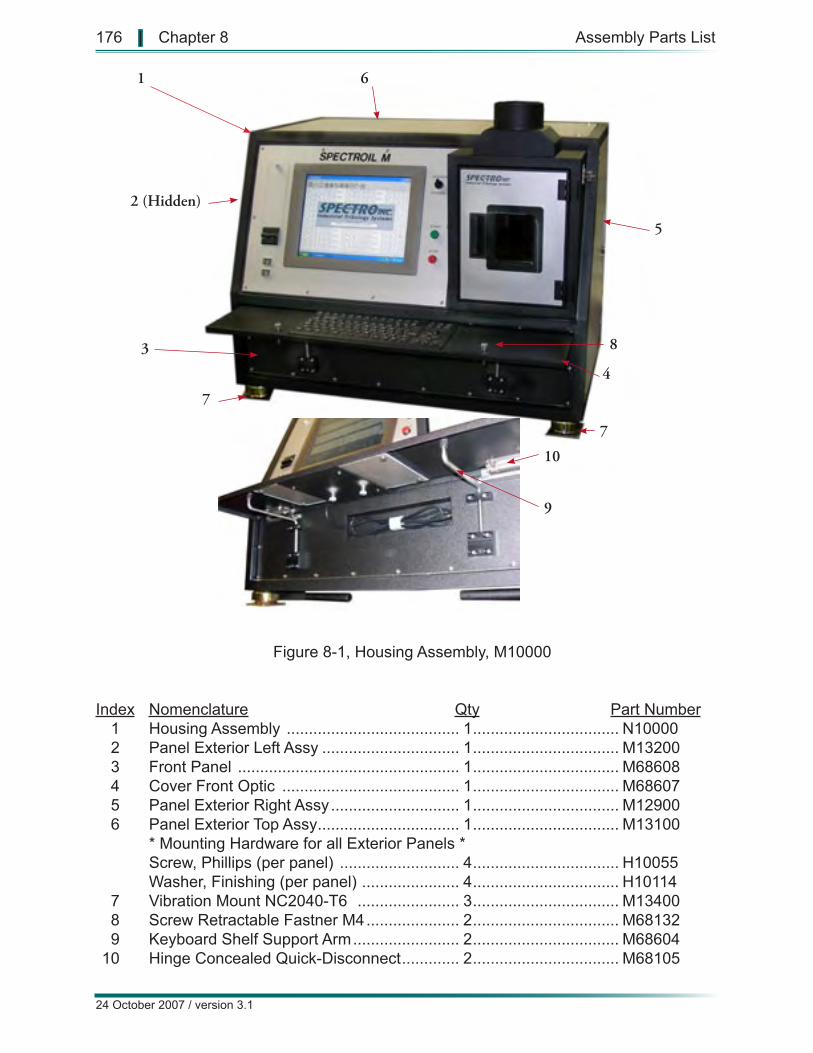
1
5
3
4
6
2 (Hidden)
9
10
8
7
7
Figure 8-1, Housing Assembly, M10000
Index Nomenclature Qty Part Number 1 Housing Assembly ....................................... 1 ................................. N10000 2 Panel Exterior Left Assy ............................... 1 ................................. M13200 3 Front Panel .................................................. 1 ................................. M68608 4 Cover Front Optic ........................................ 1 ................................. M68607 5 Panel Exterior Right Assy ............................. 1 ................................. M12900 6 Panel Exterior Top Assy ................................ 1 ................................. M13100 * Mounting Hardware for all Exterior Panels * Screw, Phillips (per panel) ........................... 4 ................................. H10055 Washer, Finishing (per panel) ...................... 4 ................................. H10114 7 Vibration Mount NC2040-T6 ....................... 3 ................................. M13400 8 Screw Retractable Fastner M4 ..................... 2 ................................. M68132 9 Keyboard Shelf Support Arm ........................ 2 ................................. M68604 10 Hinge Concealed Quick-Disconnect ............. 2 ................................. M68105
24 October 2007 / version 3.1
176 | Chapter 8 Assembly Parts List
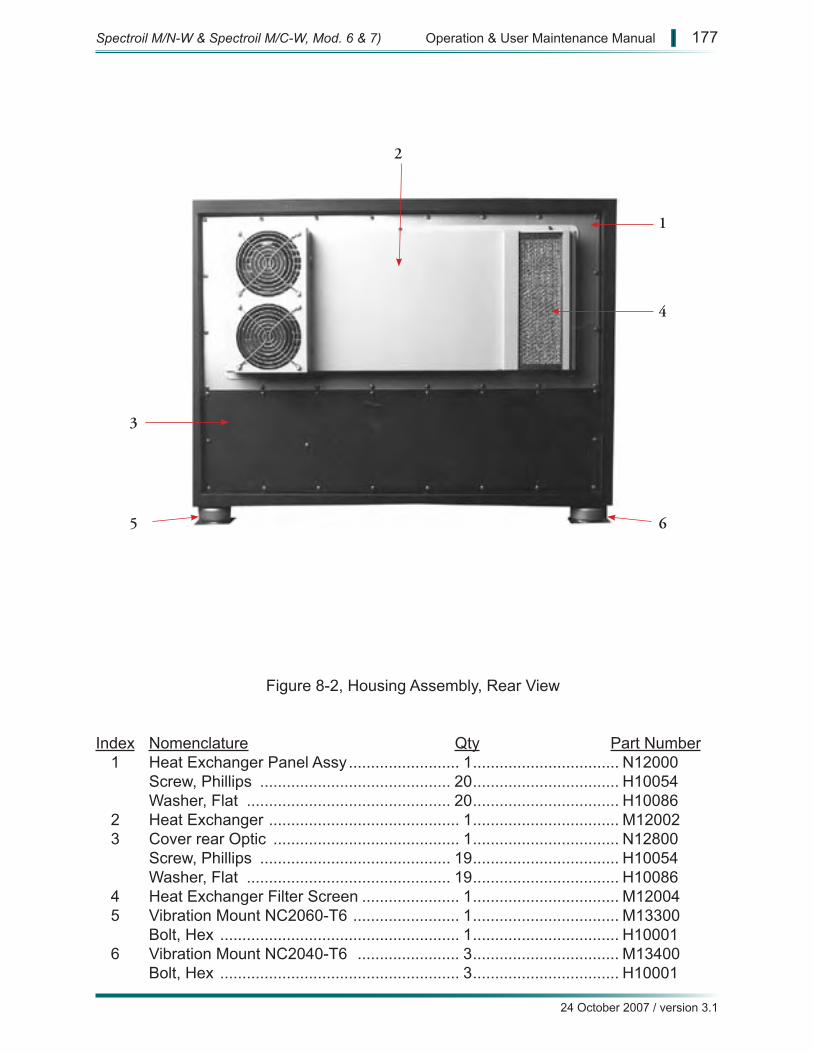
1
2
3
4
5 6
Figure 8-2, Housing Assembly, Rear View
Index Nomenclature Qty Part Number 1 Heat Exchanger Panel Assy ......................... 1 ................................. N12000 Screw, Phillips ........................................... 20 ................................. H10054 Washer, Flat .............................................. 20 ................................. H10086 2 Heat Exchanger ........................................... 1 ................................. M12002 3 Cover rear Optic .......................................... 1 ................................. N12800 Screw, Phillips ........................................... 19 ................................. H10054 Washer, Flat .............................................. 19 ................................. H10086 4 Heat Exchanger Filter Screen ...................... 1 ................................. M12004 5 Vibration Mount NC2060-T6 ........................ 1 ................................. M13300 Bolt, Hex ...................................................... 1 ................................. H10001 6 Vibration Mount NC2040-T6 ....................... 3 ................................. M13400 Bolt, Hex ...................................................... 3 ................................. H10001
24 October 2007 / version 3.1
Spectroil M/N-W & Spectroil M/C-W, Mod. 6 & 7) Operation & User Maintenance Manual | 177
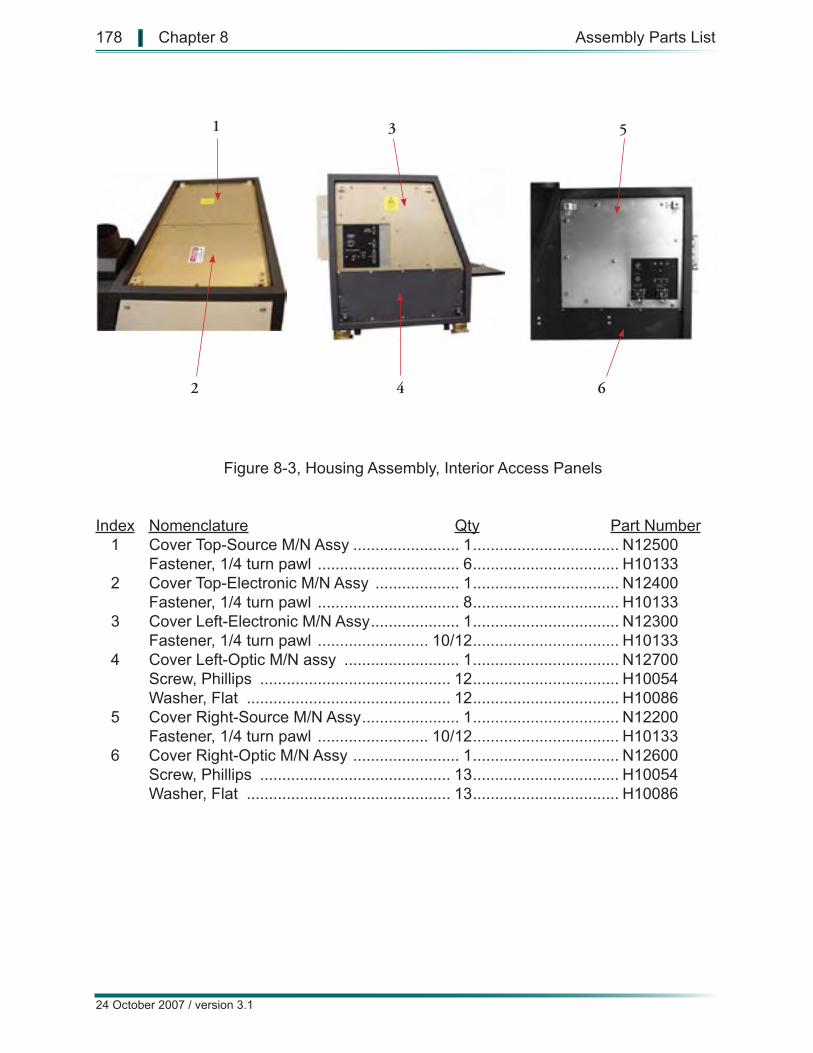
1
2
3
4
5
6
Figure 8-3, Housing Assembly, Interior Access Panels
Index Nomenclature Qty Part Number 1 Cover Top-Source M/N Assy ........................ 1 ................................. N12500 Fastener, 1/4 turn pawl ................................ 6 ................................. H10133 2 Cover Top-Electronic M/N Assy ................... 1 ................................. N12400 Fastener, 1/4 turn pawl ................................ 8 ................................. H10133 3 Cover Left-Electronic M/N Assy .................... 1 ................................. N12300 Fastener, 1/4 turn pawl ......................... 10/12 ................................. H10133 4 Cover Left-Optic M/N assy .......................... 1 ................................. N12700 Screw, Phillips ........................................... 12 ................................. H10054 Washer, Flat .............................................. 12 ................................. H10086 5 Cover Right-Source M/N Assy ...................... 1 ................................. N12200 Fastener, 1/4 turn pawl ......................... 10/12 ................................. H10133 6 Cover Right-Optic M/N Assy ........................ 1 ................................. N12600 Screw, Phillips ........................................... 13 ................................. H10054 Washer, Flat .............................................. 13 ................................. H10086
24 October 2007 / version 3.1
178 | Chapter 8 Assembly Parts List
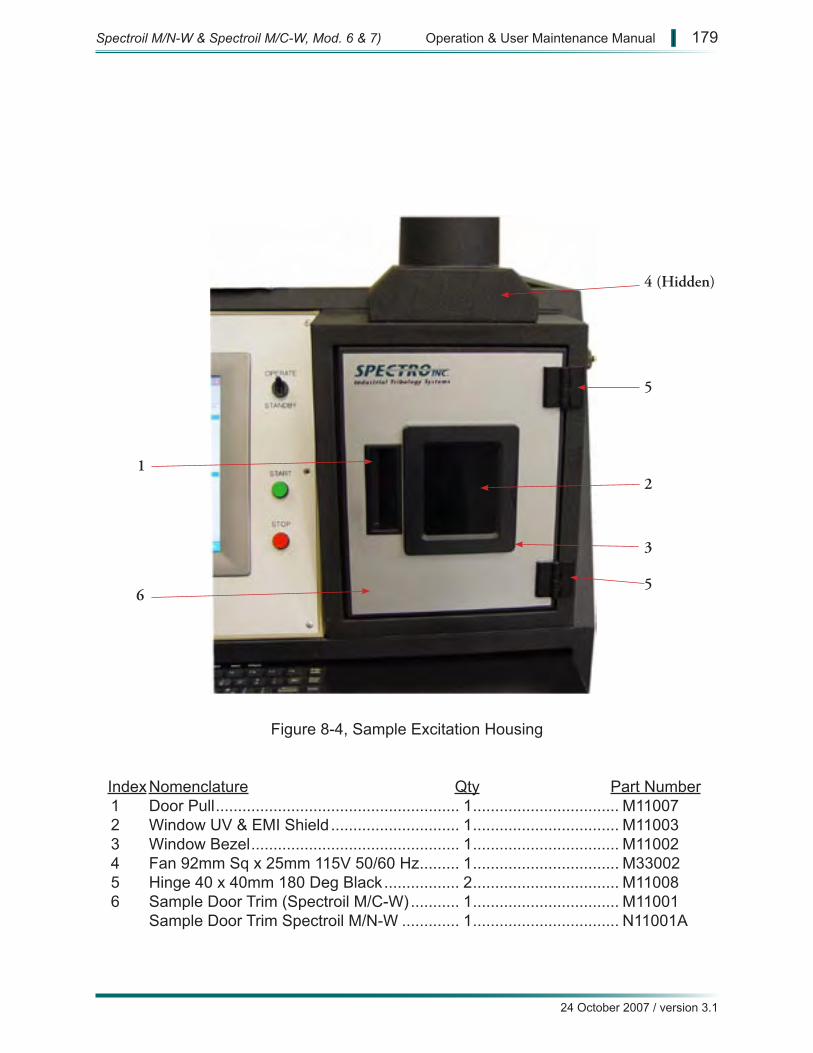
12
3
4 (Hidden)
5
56
Figure 8-4, Sample Excitation Housing
Index Nomenclature Qty Part Number 1 Door Pull ....................................................... 1 ................................. M11007 2 Window UV & EMI Shield ............................. 1 ................................. M11003 3 Window Bezel ............................................... 1 ................................. M11002 4 Fan 92mm Sq x 25mm 115V 50/60 Hz ......... 1 ................................. M33002 5 Hinge 40 x 40mm 180 Deg Black ................. 2 ................................. M11008 6 Sample Door Trim (Spectroil M/C-W) ........... 1 ................................. M11001 Sample Door Trim Spectroil M/N-W ............. 1 ................................. N11001A
24 October 2007 / version 3.1
Spectroil M/N-W & Spectroil M/C-W, Mod. 6 & 7) Operation & User Maintenance Manual | 179
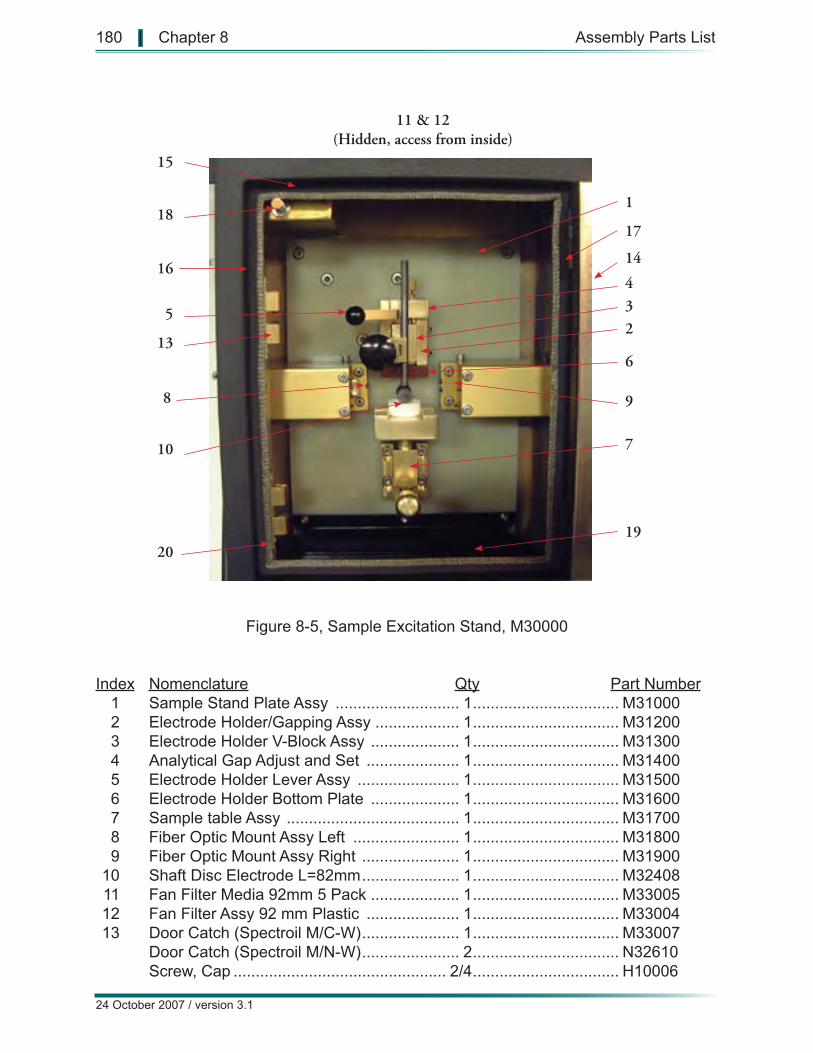
1
234
5
6
7
8 9
10
11 & 12(Hidden, access from inside)
13
14
15
16
1718
1920
Figure 8-5, Sample Excitation Stand, M30000
Index Nomenclature Qty Part Number 1 Sample Stand Plate Assy ............................ 1 ................................. M31000 2 Electrode Holder/Gapping Assy ................... 1 ................................. M31200 3 Electrode Holder V-Block Assy .................... 1 ................................. M31300 4 Analytical Gap Adjust and Set ..................... 1 ................................. M31400 5 Electrode Holder Lever Assy ....................... 1 ................................. M31500 6 Electrode Holder Bottom Plate .................... 1 ................................. M31600 7 Sample table Assy ....................................... 1 ................................. M31700 8 Fiber Optic Mount Assy Left ........................ 1 ................................. M31800 9 Fiber Optic Mount Assy Right ...................... 1 ................................. M31900 10 Shaft Disc Electrode L=82mm ...................... 1 ................................. M32408 11 Fan Filter Media 92mm 5 Pack .................... 1 ................................. M33005 12 Fan Filter Assy 92 mm Plastic ..................... 1 ................................. M33004 13 Door Catch (Spectroil M/C-W) ...................... 1 ................................. M33007 Door Catch (Spectroil M/N-W) ...................... 2 ................................. N32610 Screw, Cap ................................................ 2/4 ................................. H10006
24 October 2007 / version 3.1
180 | Chapter 8 Assembly Parts List
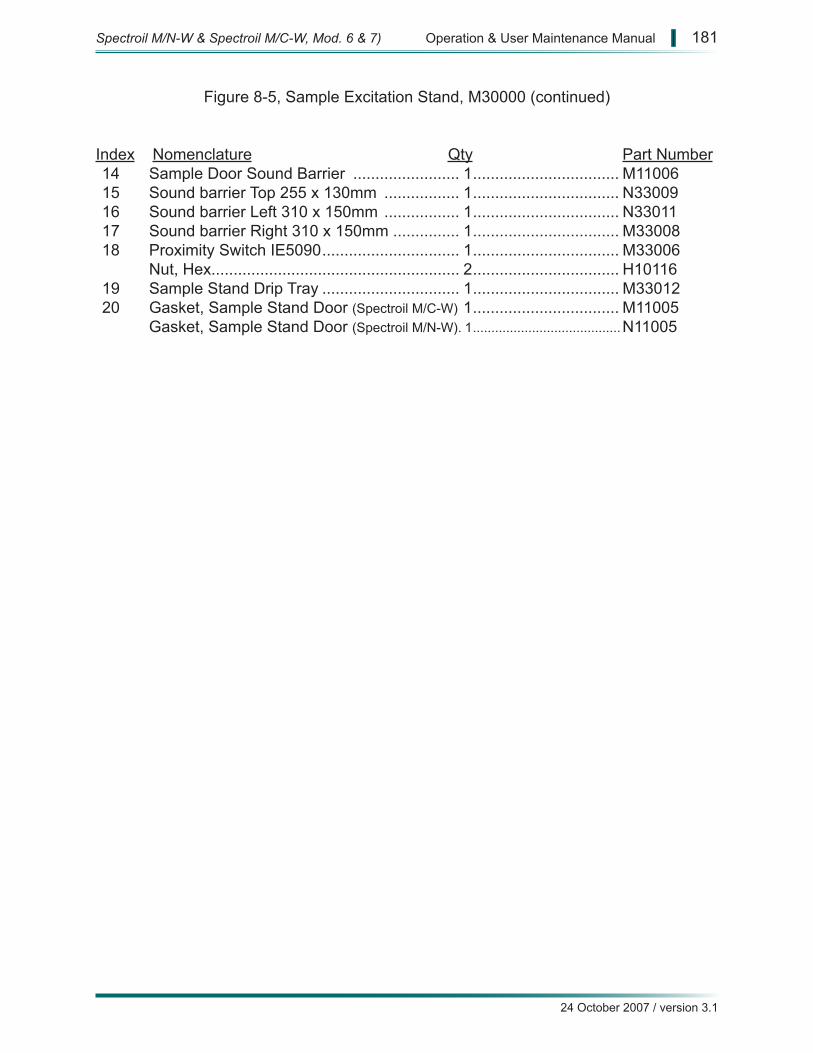
Figure 8-5, Sample Excitation Stand, M30000 (continued)
Index Nomenclature Qty Part Number 14 Sample Door Sound Barrier ........................ 1 ................................. M11006 15 Sound barrier Top 255 x 130mm ................. 1 ................................. N33009 16 Sound barrier Left 310 x 150mm ................. 1 ................................. N33011 17 Sound barrier Right 310 x 150mm ............... 1 ................................. M33008 18 Proximity Switch IE5090 ............................... 1 ................................. M33006 Nut, Hex ........................................................ 2 ................................. H10116 19 Sample Stand Drip Tray ............................... 1 ................................. M33012 20 Gasket, Sample Stand Door (Spectroil M/C-W) 1 ................................. M11005 Gasket, Sample Stand Door (Spectroil M/N-W) . 1 ........................................N11005
24 October 2007 / version 3.1
Spectroil M/N-W & Spectroil M/C-W, Mod. 6 & 7) Operation & User Maintenance Manual | 181
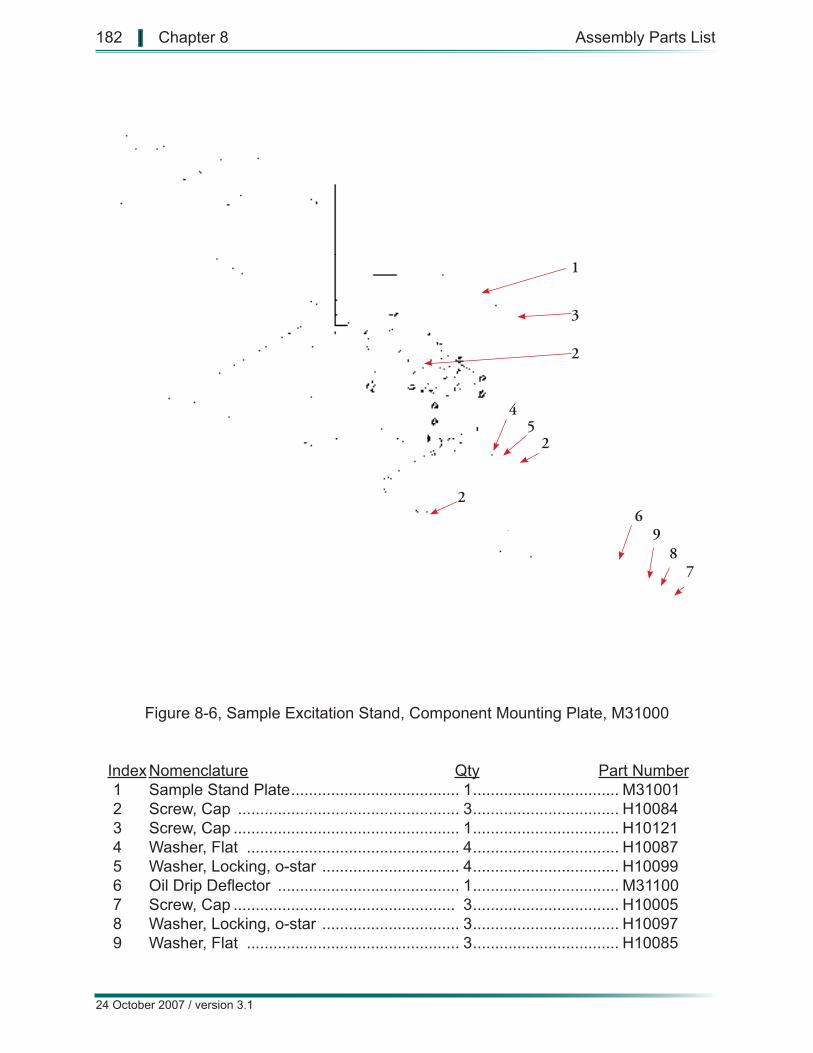
1
2
3
45
6
78
9
2
2
Figure 8-6, Sample Excitation Stand, Component Mounting Plate, M31000
Index Nomenclature Qty Part Number 1 Sample Stand Plate ...................................... 1 ................................. M31001 2 Screw, Cap .................................................. 3 ................................. H10084 3 Screw, Cap ................................................... 1 ................................. H10121 4 Washer, Flat ................................................ 4 ................................. H10087 5 Washer, Locking, o-star ............................... 4 ................................. H10099 6 Oil Drip Deflector ......................................... 1 ................................. M31100 7 Screw, Cap .................................................. 3 ................................. H10005 8 Washer, Locking, o-star ............................... 3 ................................. H10097 9 Washer, Flat ................................................ 3 ................................. H10085
24 October 2007 / version 3.1
182 | Chapter 8 Assembly Parts List
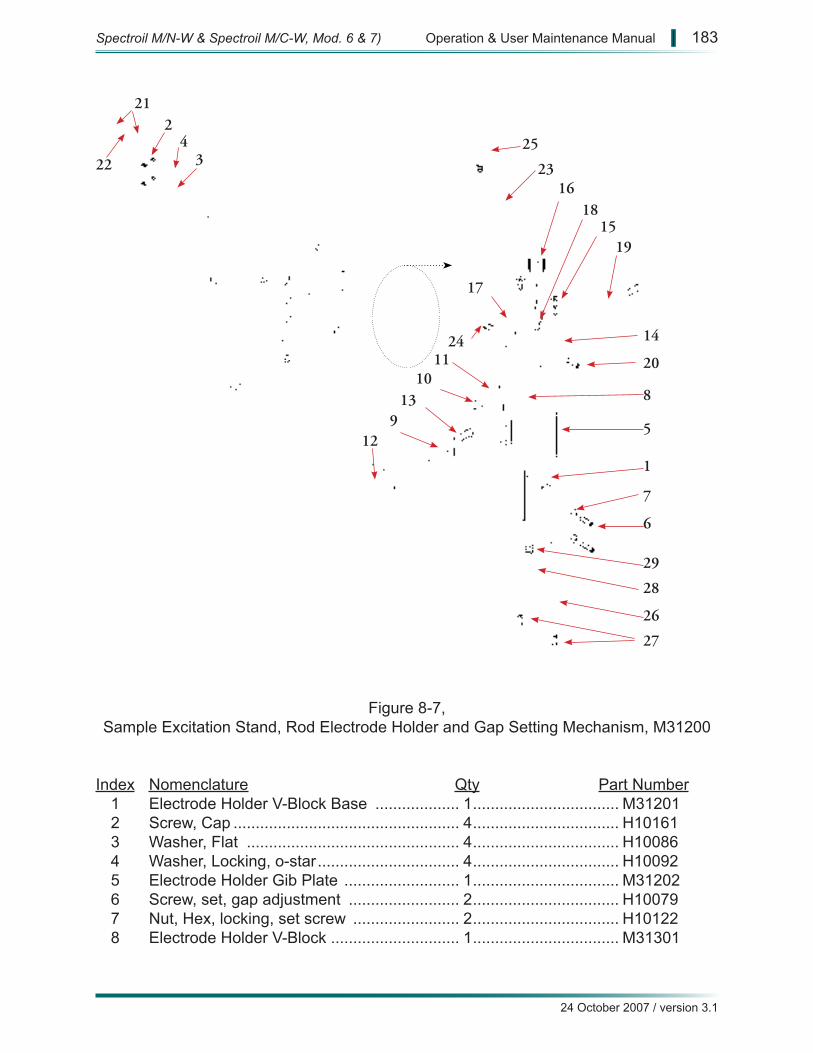
1011
13
14
15
16
17
18
19
20
21
22 23
1
2
34
5
6
7
8
912
24
25
26
27
28
29
Figure 8-7,Sample Excitation Stand, Rod Electrode Holder and Gap Setting Mechanism, M31200
Index Nomenclature Qty Part Number 1 Electrode Holder V-Block Base ................... 1 ................................. M31201 2 Screw, Cap ................................................... 4 ................................. H10161 3 Washer, Flat ................................................ 4 ................................. H10086 4 Washer, Locking, o-star ................................ 4 ................................. H10092 5 Electrode Holder Gib Plate .......................... 1 ................................. M31202 6 Screw, set, gap adjustment ......................... 2 ................................. H10079 7 Nut, Hex, locking, set screw ........................ 2 ................................. H10122 8 Electrode Holder V-Block ............................. 1 ................................. M31301
24 October 2007 / version 3.1
Spectroil M/N-W & Spectroil M/C-W, Mod. 6 & 7) Operation & User Maintenance Manual | 183
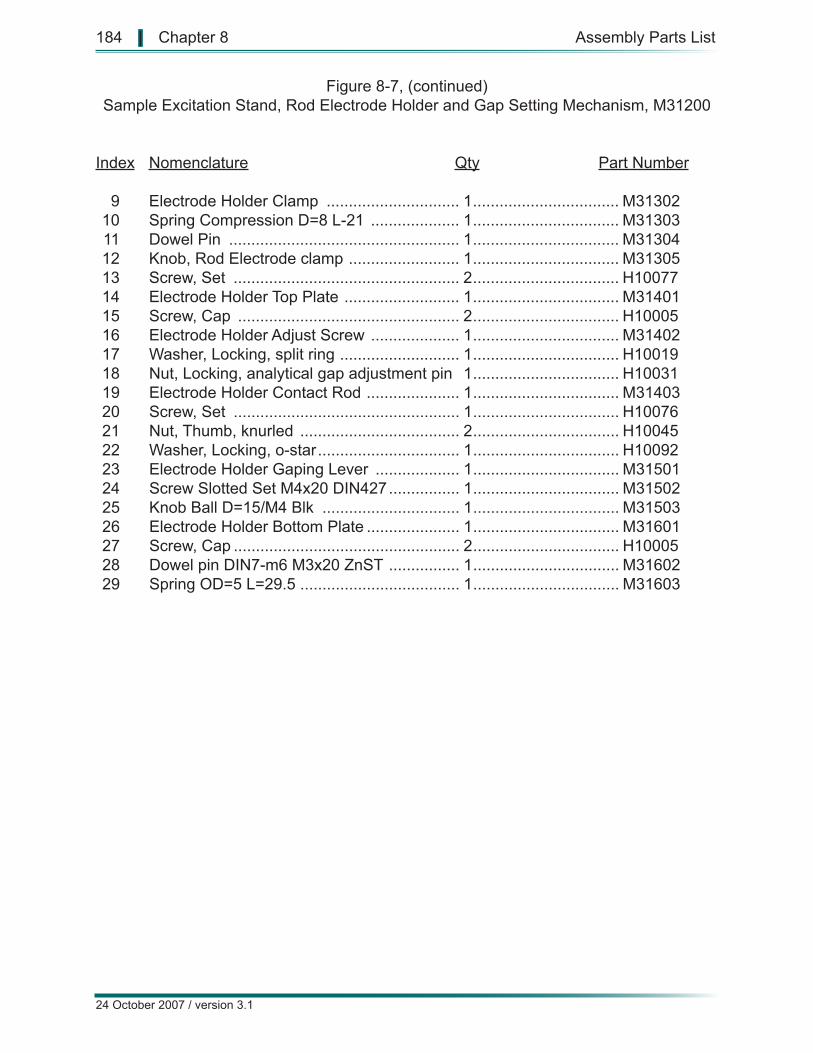
Figure 8-7, (continued)Sample Excitation Stand, Rod Electrode Holder and Gap Setting Mechanism, M31200
Index Nomenclature Qty Part Number
9 Electrode Holder Clamp .............................. 1 ................................. M31302 10 Spring Compression D=8 L-21 .................... 1 ................................. M31303 11 Dowel Pin .................................................... 1 ................................. M31304 12 Knob, Rod Electrode clamp ......................... 1 ................................. M31305 13 Screw, Set ................................................... 2 ................................. H10077 14 Electrode Holder Top Plate .......................... 1 ................................. M31401 15 Screw, Cap .................................................. 2 ................................. H10005 16 Electrode Holder Adjust Screw .................... 1 ................................. M31402 17 Washer, Locking, split ring ........................... 1 ................................. H10019 18 Nut, Locking, analytical gap adjustment pin 1 ................................. H10031 19 Electrode Holder Contact Rod ..................... 1 ................................. M31403 20 Screw, Set ................................................... 1 ................................. H10076 21 Nut, Thumb, knurled .................................... 2 ................................. H10045 22 Washer, Locking, o-star ................................ 1 ................................. H10092 23 Electrode Holder Gaping Lever ................... 1 ................................. M31501 24 Screw Slotted Set M4x20 DIN427 ................ 1 ................................. M31502 25 Knob Ball D=15/M4 Blk ............................... 1 ................................. M31503 26 Electrode Holder Bottom Plate ..................... 1 ................................. M31601 27 Screw, Cap ................................................... 2 ................................. H10005 28 Dowel pin DIN7-m6 M3x20 ZnST ................ 1 ................................. M31602 29 Spring OD=5 L=29.5 .................................... 1 ................................. M31603
24 October 2007 / version 3.1
184 | Chapter 8 Assembly Parts List
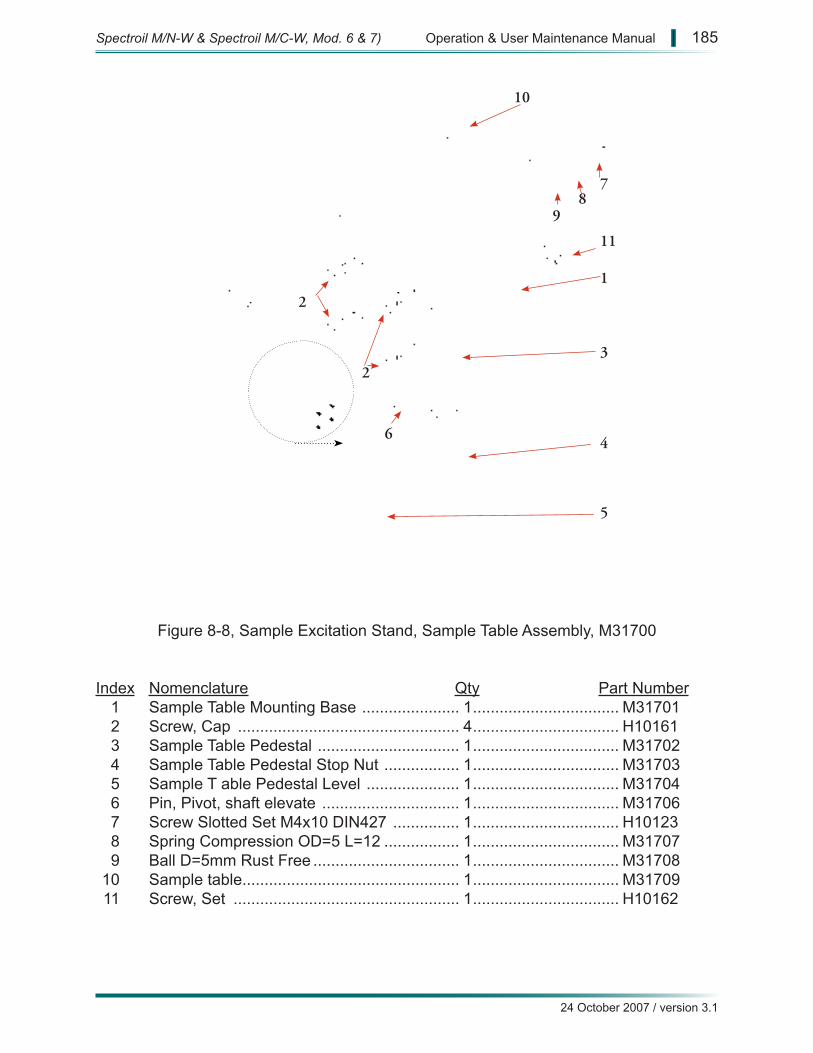
1
2
3
4
5
6
78
9
10
11
2
Figure 8-8, Sample Excitation Stand, Sample Table Assembly, M31700
Index Nomenclature Qty Part Number 1 Sample Table Mounting Base ...................... 1 ................................. M31701 2 Screw, Cap .................................................. 4 ................................. H10161 3 Sample Table Pedestal ................................ 1 ................................. M31702 4 Sample Table Pedestal Stop Nut ................. 1 ................................. M31703 5 Sample T able Pedestal Level ..................... 1 ................................. M31704 6 Pin, Pivot, shaft elevate ............................... 1 ................................. M31706 7 Screw Slotted Set M4x10 DIN427 ............... 1 ................................. H10123 8 Spring Compression OD=5 L=12 ................. 1 ................................. M31707 9 Ball D=5mm Rust Free ................................. 1 ................................. M31708 10 Sample table................................................. 1 ................................. M31709 11 Screw, Set ................................................... 1 ................................. H10162
24 October 2007 / version 3.1
Spectroil M/N-W & Spectroil M/C-W, Mod. 6 & 7) Operation & User Maintenance Manual | 185
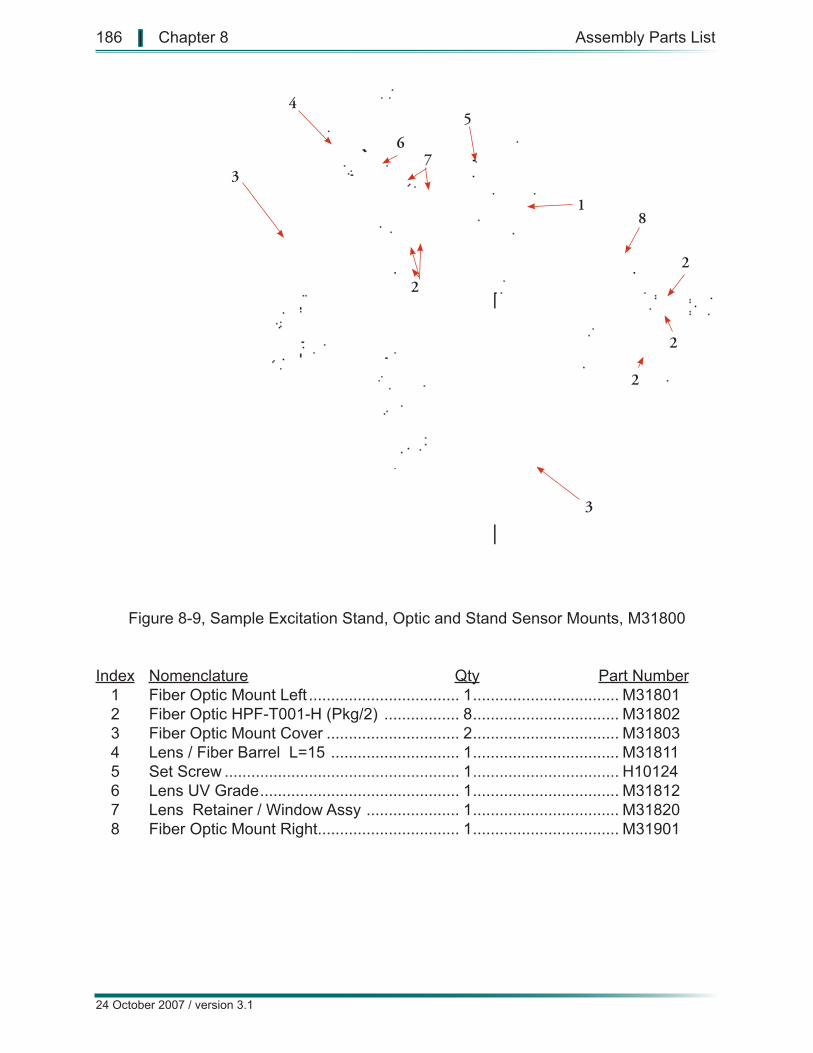
1
2
3
45
67
8
20 21 22 23
2
2
2
3
Figure 8-9, Sample Excitation Stand, Optic and Stand Sensor Mounts, M31800
Index Nomenclature Qty Part Number 1 Fiber Optic Mount Left .................................. 1 ................................. M31801 2 Fiber Optic HPF-T001-H (Pkg/2) ................. 8 ................................. M31802 3 Fiber Optic Mount Cover .............................. 2 ................................. M31803 4 Lens / Fiber Barrel L=15 ............................. 1 ................................. M31811 5 Set Screw ..................................................... 1 ................................. H10124 6 Lens UV Grade ............................................. 1 ................................. M31812 7 Lens Retainer / Window Assy ..................... 1 ................................. M31820 8 Fiber Optic Mount Right................................ 1 ................................. M31901
24 October 2007 / version 3.1
186 | Chapter 8 Assembly Parts List
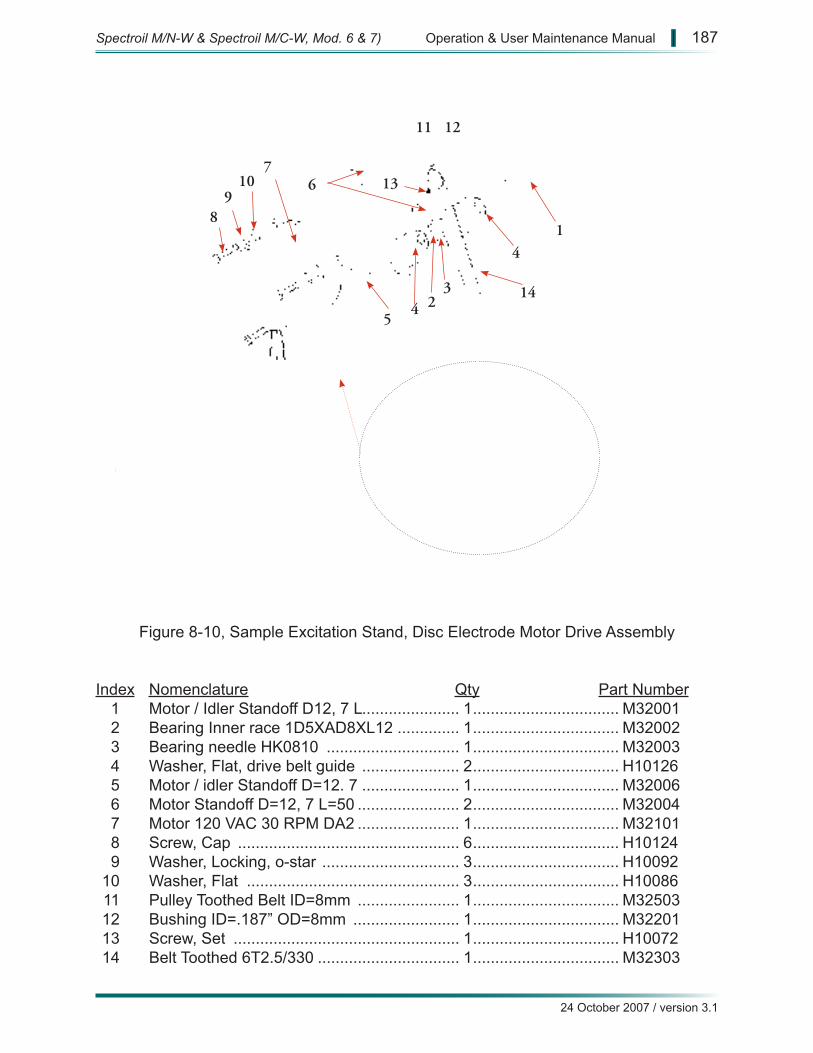
1
23
4
5
67
89
10
11 12
13
144
Figure 8-10, Sample Excitation Stand, Disc Electrode Motor Drive Assembly
Index Nomenclature Qty Part Number 1 Motor / Idler Standoff D12, 7 L...................... 1 ................................. M32001 2 Bearing Inner race 1D5XAD8XL12 .............. 1 ................................. M32002 3 Bearing needle HK0810 .............................. 1 ................................. M32003 4 Washer, Flat, drive belt guide ...................... 2 ................................. H10126 5 Motor / idler Standoff D=12. 7 ...................... 1 ................................. M32006 6 Motor Standoff D=12, 7 L=50 ....................... 2 ................................. M32004 7 Motor 120 VAC 30 RPM DA2 ....................... 1 ................................. M32101 8 Screw, Cap .................................................. 6 ................................. H10124 9 Washer, Locking, o-star ............................... 3 ................................. H10092 10 Washer, Flat ................................................ 3 ................................. H10086 11 Pulley Toothed Belt ID=8mm ....................... 1 ................................. M32503 12 Bushing ID=.187” OD=8mm ........................ 1 ................................. M32201 13 Screw, Set ................................................... 1 ................................. H10072 14 Belt Toothed 6T2.5/330 ................................ 1 ................................. M32303
24 October 2007 / version 3.1
Spectroil M/N-W & Spectroil M/C-W, Mod. 6 & 7) Operation & User Maintenance Manual | 187
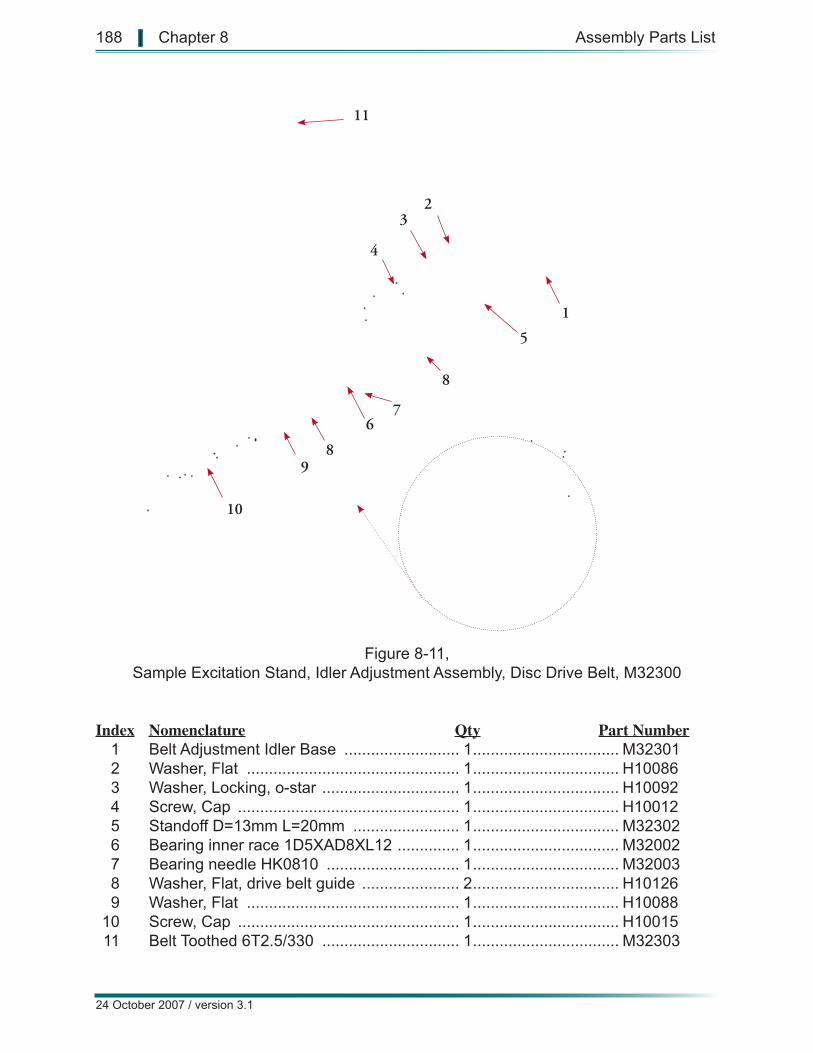
1
23
4
5
67
8
9
10
11
20 21 22 23
8
Figure 8-11,Sample Excitation Stand, Idler Adjustment Assembly, Disc Drive Belt, M32300
Index Nomenclature Qty Part Number 1 Belt Adjustment Idler Base .......................... 1 ................................. M32301 2 Washer, Flat ................................................ 1 ................................. H10086 3 Washer, Locking, o-star ............................... 1 ................................. H10092 4 Screw, Cap .................................................. 1 ................................. H10012 5 Standoff D=13mm L=20mm ........................ 1 ................................. M32302 6 Bearing inner race 1D5XAD8XL12 .............. 1 ................................. M32002 7 Bearing needle HK0810 .............................. 1 ................................. M32003 8 Washer, Flat, drive belt guide ...................... 2 ................................. H10126 9 Washer, Flat ................................................ 1 ................................. H10088 10 Screw, Cap .................................................. 1 ................................. H10015 11 Belt Toothed 6T2.5/330 ............................... 1 ................................. M32303
24 October 2007 / version 3.1
188 | Chapter 8 Assembly Parts List
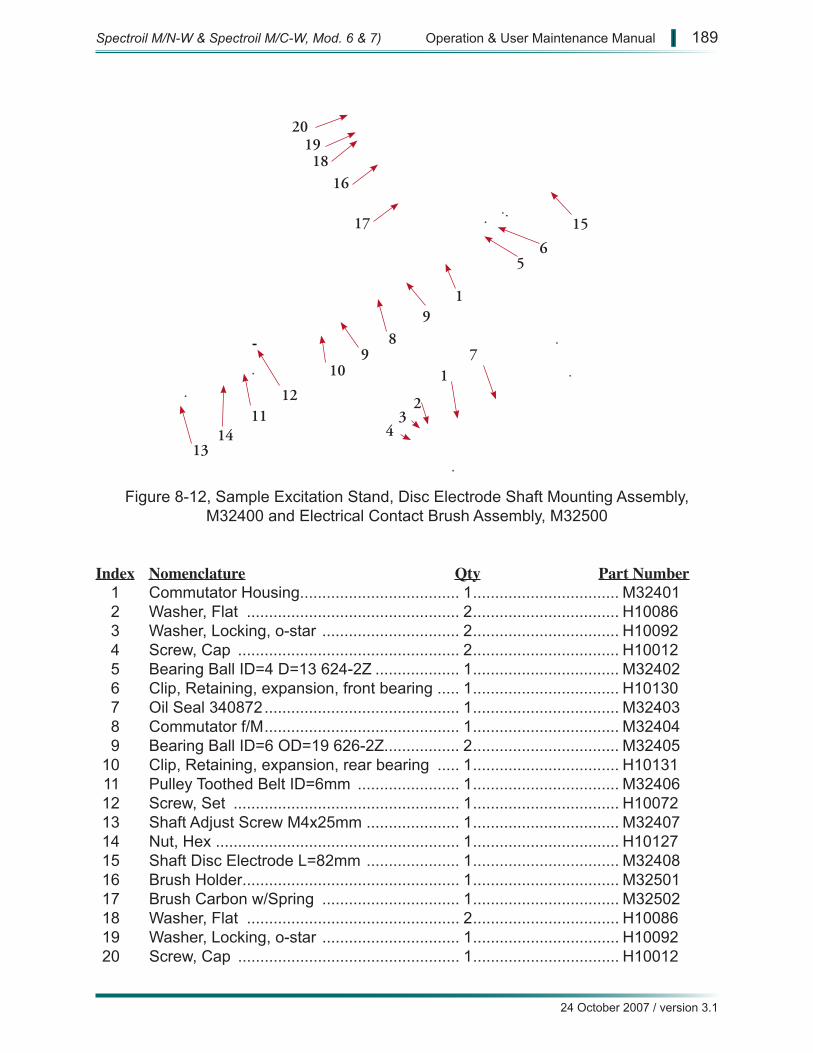
1
23
4
56
78
9
10
1112
1314
15
16
17
1819
20
91
Figure 8-12, Sample Excitation Stand, Disc Electrode Shaft Mounting Assembly, M32400 and Electrical Contact Brush Assembly, M32500
Index Nomenclature Qty Part Number 1 Commutator Housing.................................... 1 ................................. M32401 2 Washer, Flat ................................................ 2 ................................. H10086 3 Washer, Locking, o-star ............................... 2 ................................. H10092 4 Screw, Cap .................................................. 2 ................................. H10012 5 Bearing Ball ID=4 D=13 624-2Z ................... 1 ................................. M32402 6 Clip, Retaining, expansion, front bearing ..... 1 ................................. H10130 7 Oil Seal 340872 ............................................ 1 ................................. M32403 8 Commutator f/M ............................................ 1 ................................. M32404 9 Bearing Ball ID=6 OD=19 626-2Z................. 2 ................................. M32405 10 Clip, Retaining, expansion, rear bearing ..... 1 ................................. H10131 11 Pulley Toothed Belt ID=6mm ....................... 1 ................................. M32406 12 Screw, Set ................................................... 1 ................................. H10072 13 Shaft Adjust Screw M4x25mm ..................... 1 ................................. M32407 14 Nut, Hex ....................................................... 1 ................................. H10127 15 Shaft Disc Electrode L=82mm ..................... 1 ................................. M32408 16 Brush Holder................................................. 1 ................................. M32501 17 Brush Carbon w/Spring ............................... 1 ................................. M32502 18 Washer, Flat ................................................ 2 ................................. H10086 19 Washer, Locking, o-star ............................... 1 ................................. H10092 20 Screw, Cap .................................................. 1 ................................. H10012
24 October 2007 / version 3.1
Spectroil M/N-W & Spectroil M/C-W, Mod. 6 & 7) Operation & User Maintenance Manual | 189
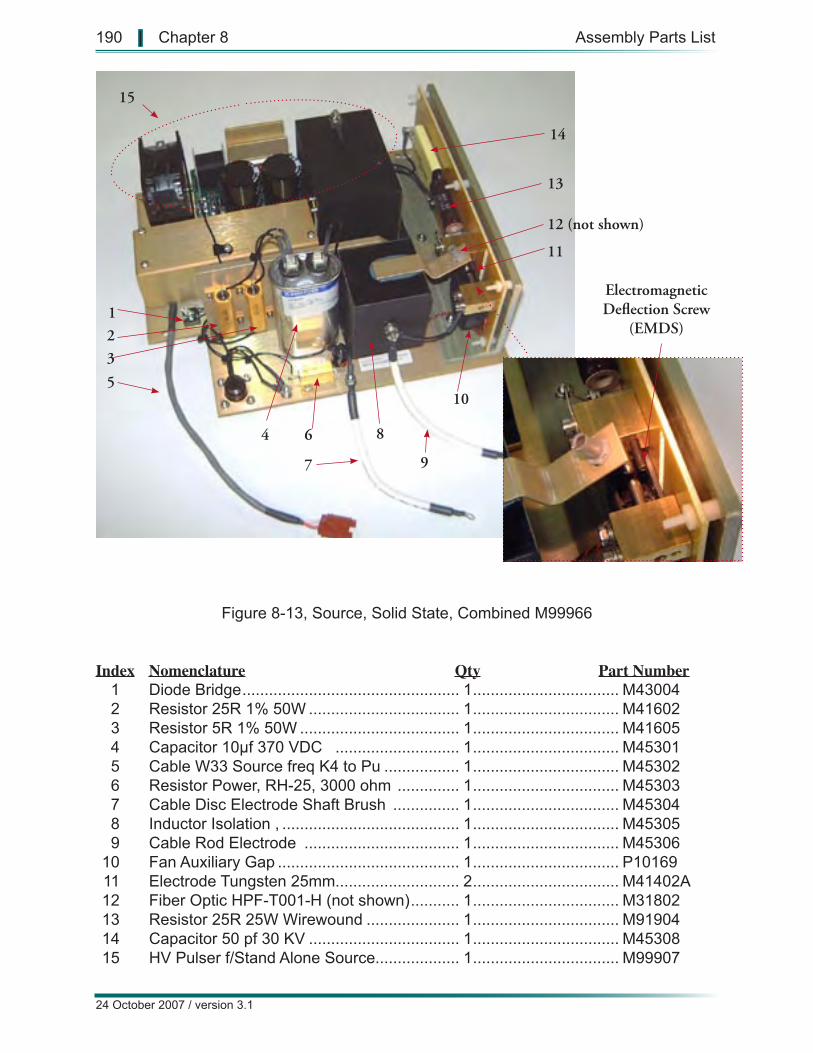
123
4
5
6
7
8
9
10
11
12 (not shown)
13
14
15
Electromagnetic Deflection Screw
(EMDS)
Figure 8-13, Source, Solid State, Combined M99966
Index Nomenclature Qty Part Number 1 Diode Bridge ................................................. 1 ................................. M43004 2 Resistor 25R 1% 50W .................................. 1 ................................. M41602 3 Resistor 5R 1% 50W .................................... 1 ................................. M41605 4 Capacitor 10µf 370 VDC ............................ 1 ................................. M45301 5 Cable W33 Source freq K4 to Pu ................. 1 ................................. M45302 6 Resistor Power, RH-25, 3000 ohm .............. 1 ................................. M45303 7 Cable Disc Electrode Shaft Brush ............... 1 ................................. M45304 8 Inductor Isolation , ........................................ 1 ................................. M45305 9 Cable Rod Electrode ................................... 1 ................................. M45306 10 Fan Auxiliary Gap ......................................... 1 ................................. P10169 11 Electrode Tungsten 25mm............................ 2 ................................. M41402A 12 Fiber Optic HPF-T001-H (not shown) ........... 1 ................................. M31802 13 Resistor 25R 25W Wirewound ..................... 1 ................................. M91904 14 Capacitor 50 pf 30 KV .................................. 1 ................................. M45308 15 HV Pulser f/Stand Alone Source................... 1 ................................. M99907
24 October 2007 / version 3.1
190 | Chapter 8 Assembly Parts List
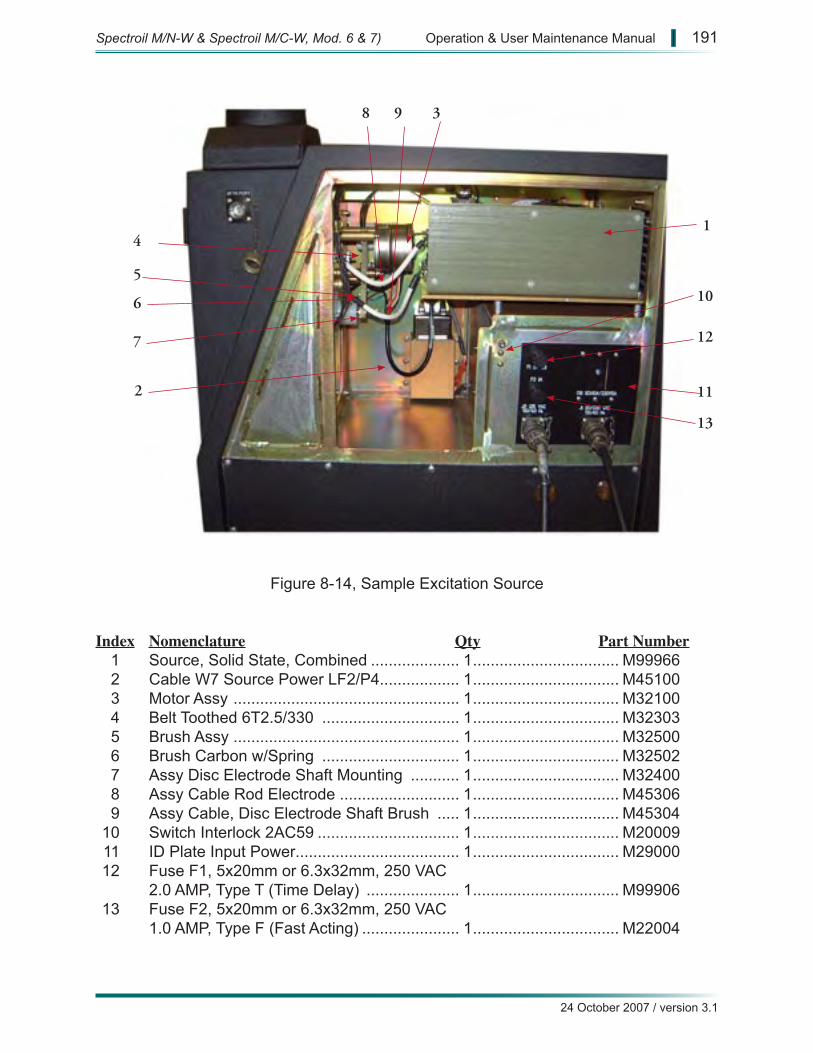
9
10
11
12
13
1
2
3
4
5
6
7
8
Figure 8-14, Sample Excitation Source
Index Nomenclature Qty Part Number 1 Source, Solid State, Combined .................... 1 ................................. M99966 2 Cable W7 Source Power LF2/P4.................. 1 ................................. M45100 3 Motor Assy ................................................... 1 ................................. M32100 4 Belt Toothed 6T2.5/330 ............................... 1 ................................. M32303 5 Brush Assy ................................................... 1 ................................. M32500 6 Brush Carbon w/Spring ............................... 1 ................................. M32502 7 Assy Disc Electrode Shaft Mounting ........... 1 ................................. M32400 8 Assy Cable Rod Electrode ........................... 1 ................................. M45306 9 Assy Cable, Disc Electrode Shaft Brush ..... 1 ................................. M45304 10 Switch Interlock 2AC59 ................................ 1 ................................. M20009 11 ID Plate Input Power..................................... 1 ................................. M29000 12 Fuse F1, 5x20mm or 6.3x32mm, 250 VAC 2.0 AMP, Type T (Time Delay) ..................... 1 ................................. M99906 13 Fuse F2, 5x20mm or 6.3x32mm, 250 VAC 1.0 AMP, Type F (Fast Acting) ...................... 1 ................................. M22004
24 October 2007 / version 3.1
Spectroil M/N-W & Spectroil M/C-W, Mod. 6 & 7) Operation & User Maintenance Manual | 191
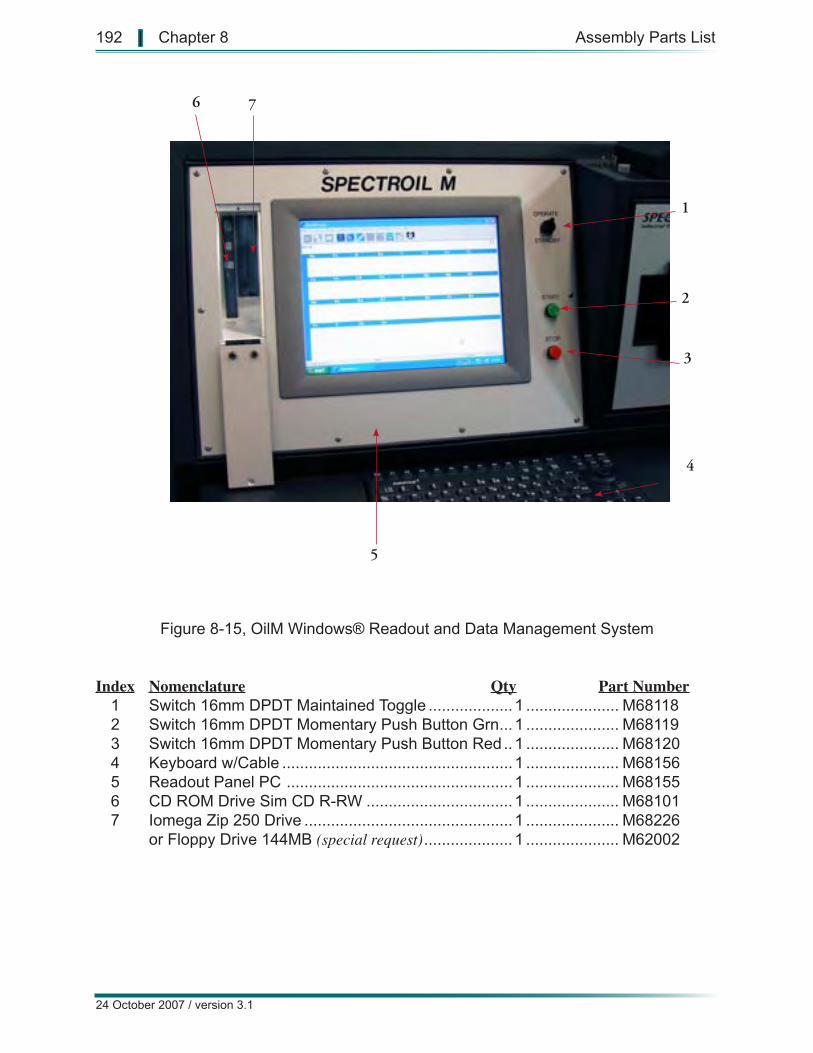
1
2
3
4
5
6 7
Figure 8-15, OilM Windows® Readout and Data Management System
Index Nomenclature Qty Part Number 1 Switch 16mm DPDT Maintained Toggle ................... 1 ..................... M68118 2 Switch 16mm DPDT Momentary Push Button Grn ... 1 ..................... M68119 3 Switch 16mm DPDT Momentary Push Button Red .. 1 ..................... M68120 4 Keyboard w/Cable ....................................................1 ..................... M68156 5 Readout Panel PC ...................................................1 ..................... M68155 6 CD ROM Drive Sim CD R-RW ................................. 1 ..................... M68101 7 Iomega Zip 250 Drive ............................................... 1 ..................... M68226 or Floppy Drive 144MB (special request) .................... 1 ..................... M62002
24 October 2007 / version 3.1
192 | Chapter 8 Assembly Parts List
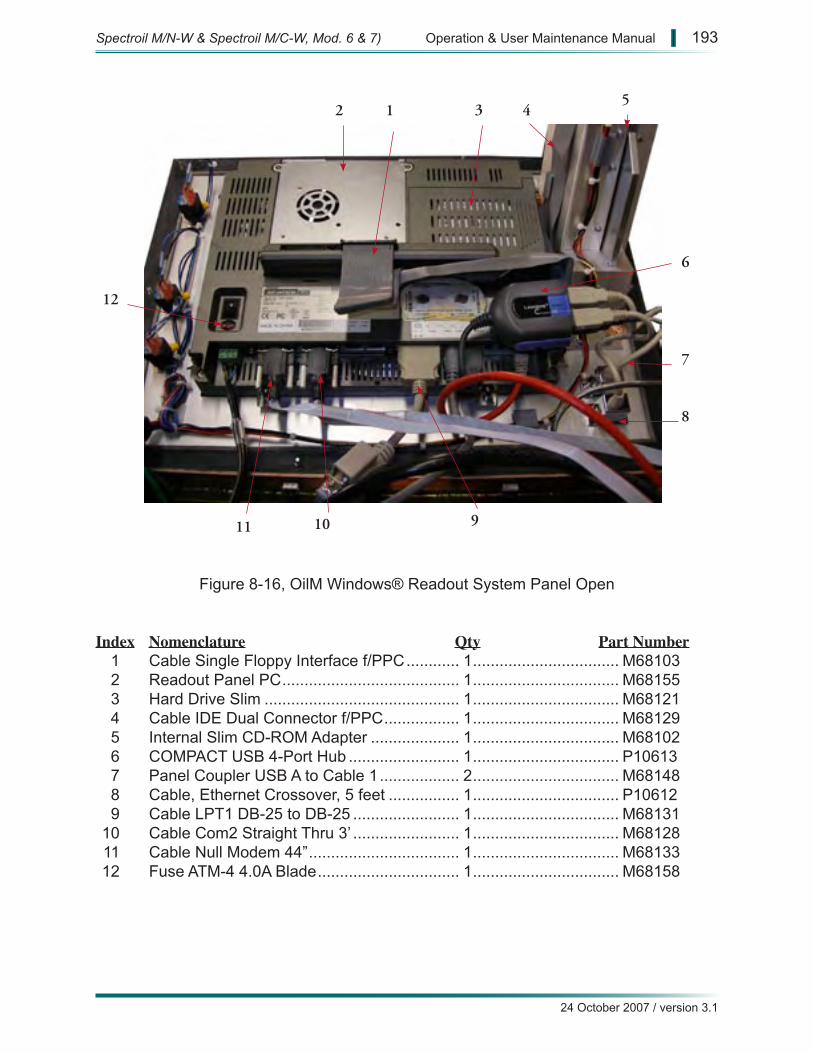
12
91011
12 3 45
6
7
8
Figure 8-16, OilM Windows® Readout System Panel Open
Index Nomenclature Qty Part Number 1 Cable Single Floppy Interface f/PPC ............ 1 ................................. M68103 2 Readout Panel PC ........................................ 1 ................................. M68155 3 Hard Drive Slim ............................................ 1 ................................. M68121 4 Cable IDE Dual Connector f/PPC ................. 1 ................................. M68129 5 Internal Slim CD-ROM Adapter .................... 1 ................................. M68102 6 COMPACT USB 4-Port Hub ......................... 1 ................................. P10613 7 Panel Coupler USB A to Cable 1 .................. 2 ................................. M68148 8 Cable, Ethernet Crossover, 5 feet ................ 1 ................................. P10612 9 Cable LPT1 DB-25 to DB-25 ........................ 1 ................................. M68131 10 Cable Com2 Straight Thru 3’ ........................ 1 ................................. M68128 11 Cable Null Modem 44” .................................. 1 ................................. M68133 12 Fuse ATM-4 4.0A Blade ................................ 1 ................................. M68158
24 October 2007 / version 3.1
Spectroil M/N-W & Spectroil M/C-W, Mod. 6 & 7) Operation & User Maintenance Manual | 193
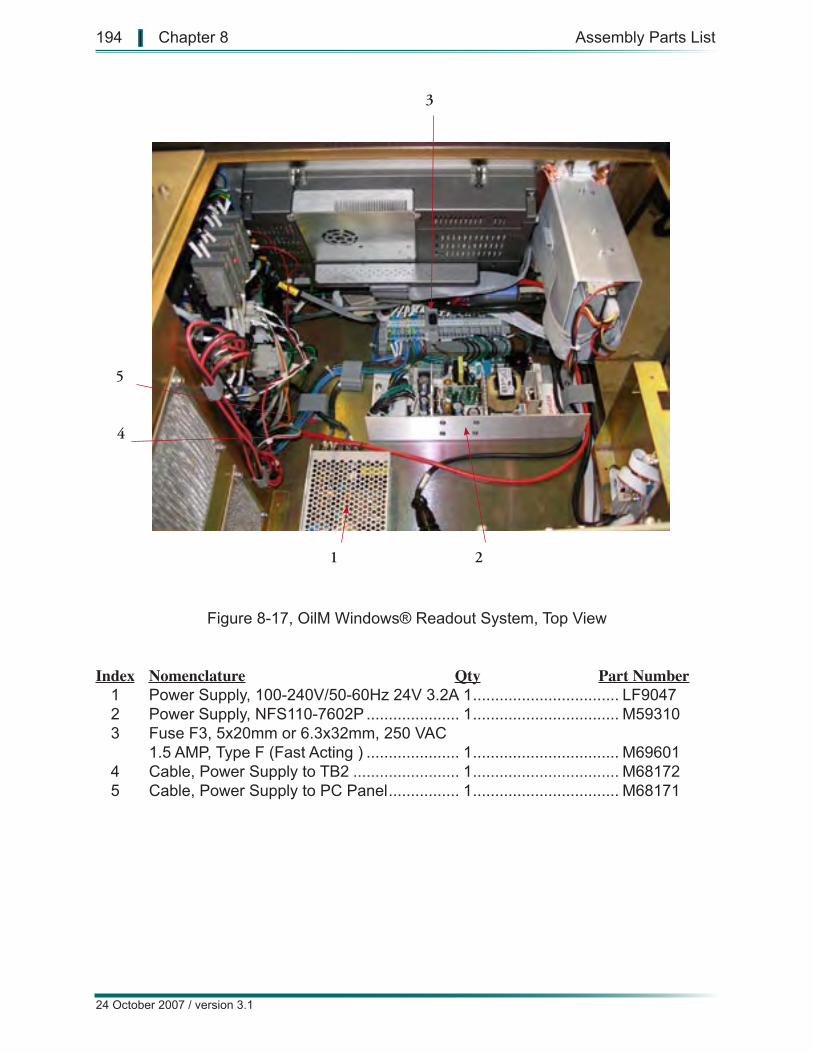
1 2
3
4
5
Figure 8-17, OilM Windows® Readout System, Top View
Index Nomenclature Qty Part Number 1 Power Supply, 100-240V/50-60Hz 24V 3.2A 1 ................................. LF9047 2 Power Supply, NFS110-7602P ..................... 1 ................................. M59310 3 Fuse F3, 5x20mm or 6.3x32mm, 250 VAC 1.5 AMP, Type F (Fast Acting ) ..................... 1 ................................. M69601 4 Cable, Power Supply to TB2 ........................ 1 ................................. M68172 5 Cable, Power Supply to PC Panel ................ 1 ................................. M68171
24 October 2007 / version 3.1
194 | Chapter 8 Assembly Parts List
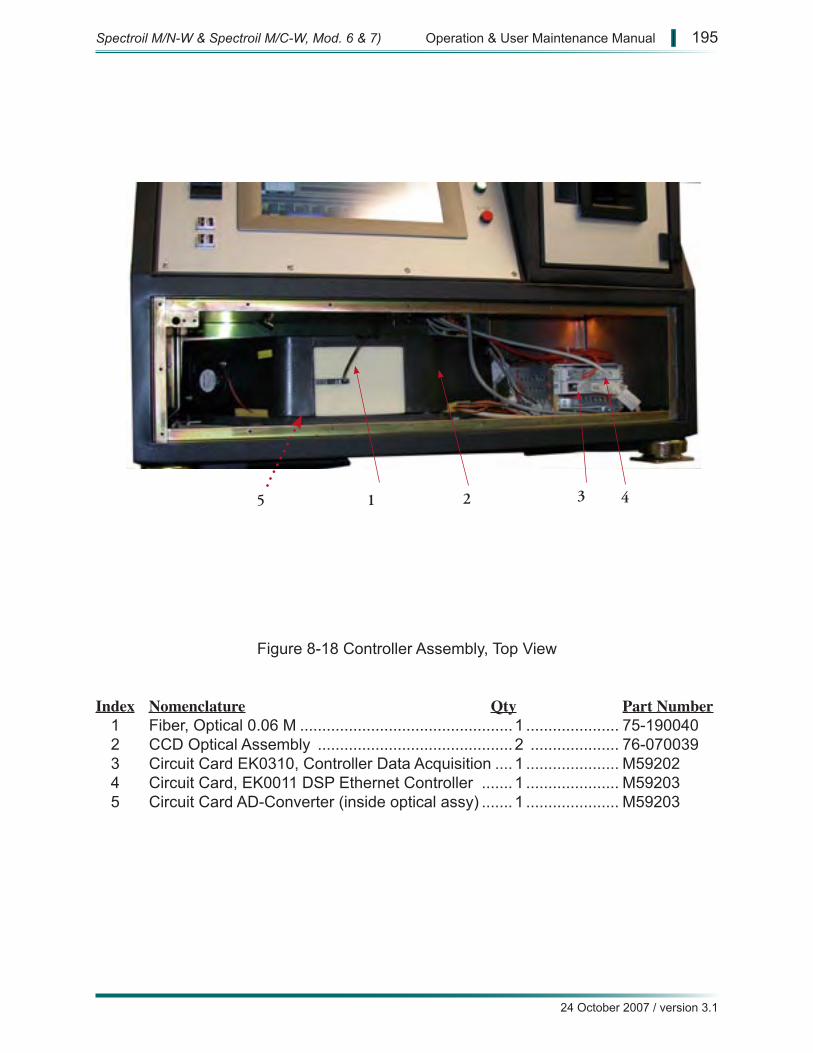
1 2 3 45
Figure 8-18 Controller Assembly, Top View
Index Nomenclature Qty Part Number 1 Fiber, Optical 0.06 M ................................................ 1 ..................... 75-190040 2 CCD Optical Assembly ............................................ 2 .................... 76-070039 3 Circuit Card EK0310, Controller Data Acquisition .... 1 ..................... M59202 4 Circuit Card, EK0011 DSP Ethernet Controller ....... 1 ..................... M59203 5 Circuit Card AD-Converter (inside optical assy) ....... 1 ..................... M59203
24 October 2007 / version 3.1
Spectroil M/N-W & Spectroil M/C-W, Mod. 6 & 7) Operation & User Maintenance Manual | 195
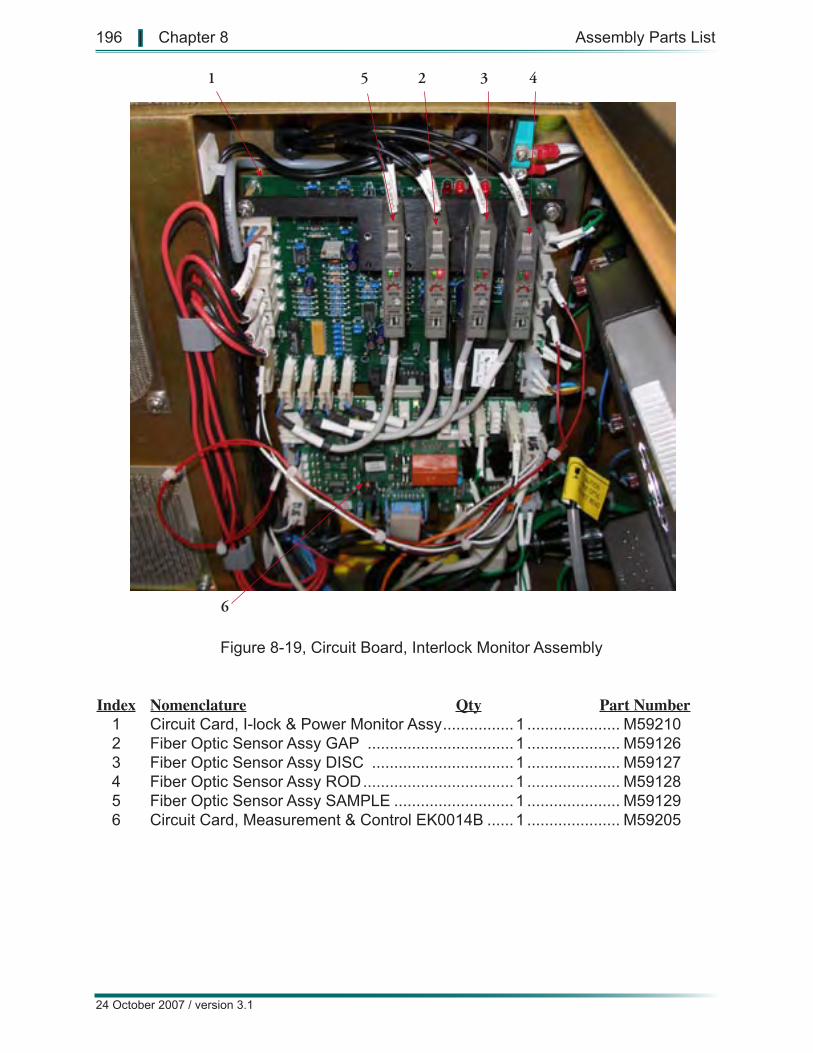
1 2 3 45
6
Figure 8-19, Circuit Board, Interlock Monitor Assembly
Index Nomenclature Qty Part Number 1 Circuit Card, I-lock & Power Monitor Assy ................ 1 ..................... M59210 2 Fiber Optic Sensor Assy GAP ................................. 1 ..................... M59126 3 Fiber Optic Sensor Assy DISC ................................ 1 ..................... M59127 4 Fiber Optic Sensor Assy ROD .................................. 1 ..................... M59128 5 Fiber Optic Sensor Assy SAMPLE ........................... 1 ..................... M59129 6 Circuit Card, Measurement & Control EK0014B ...... 1 ..................... M59205
24 October 2007 / version 3.1
196 | Chapter 8 Assembly Parts List
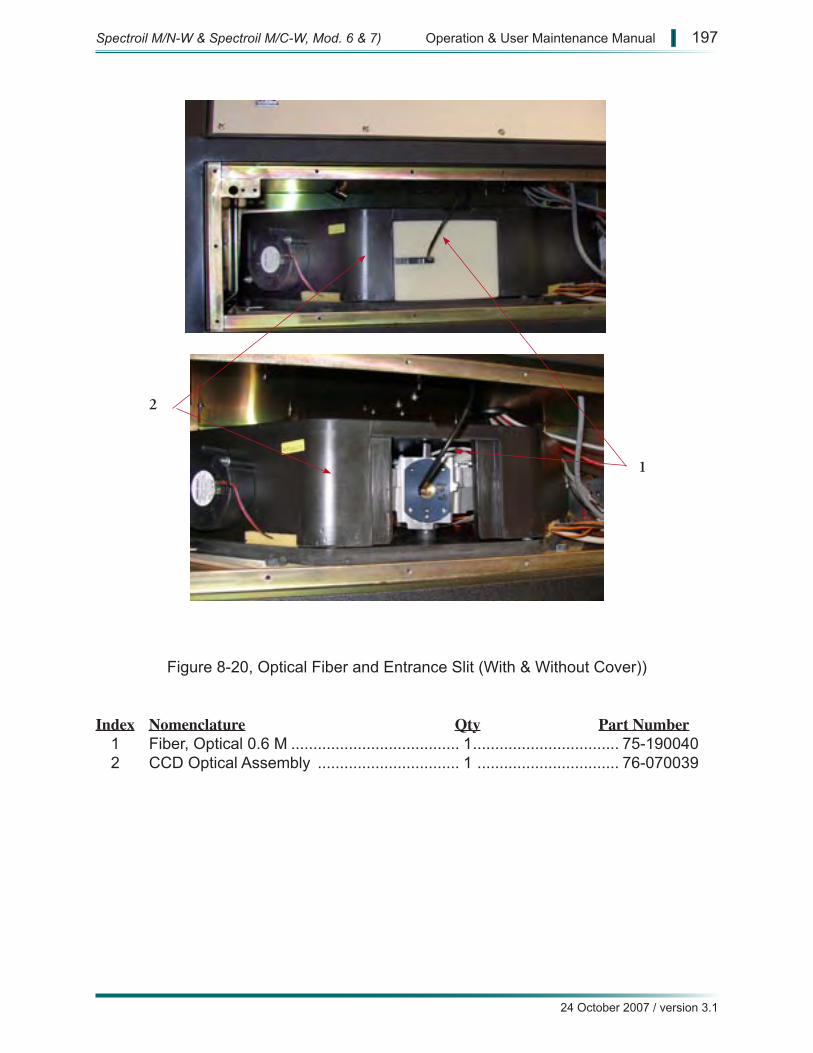
1
2
Figure 8-23 a and b, Optical Profile Knob Assembly, Outside and Internal ViewsFigure 8-20, Optical Fiber and Entrance Slit (With & Without Cover))
Index Nomenclature Qty Part Number 1 Fiber, Optical 0.6 M ...................................... 1 ................................. 75-190040 2 CCD Optical Assembly ................................ 1 ................................ 76-070039
24 October 2007 / version 3.1
Spectroil M/N-W & Spectroil M/C-W, Mod. 6 & 7) Operation & User Maintenance Manual | 197
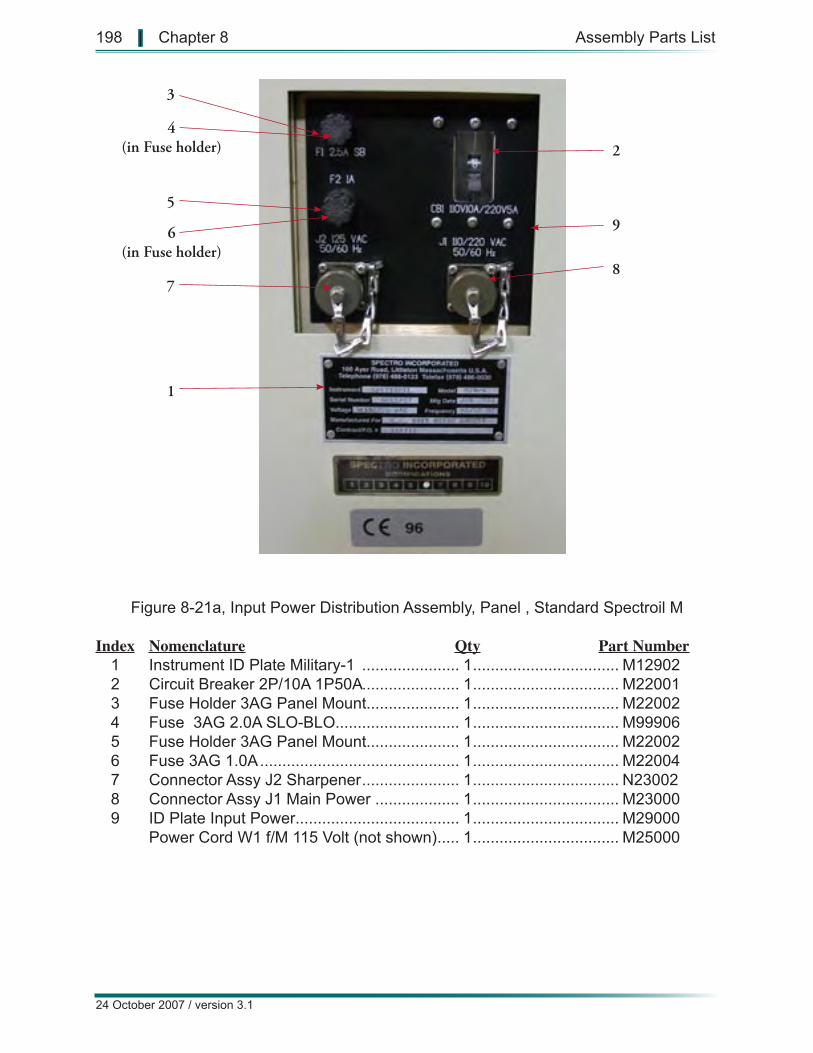
9
1
2
3
4(in Fuse holder)
5
78
6(in Fuse holder)
Figure 8-21a, Input Power Distribution Assembly, Panel , Standard Spectroil M
Index Nomenclature Qty Part Number 1 Instrument ID Plate Military-1 ...................... 1 ................................. M12902 2 Circuit Breaker 2P/10A 1P50A...................... 1 ................................. M22001 3 Fuse Holder 3AG Panel Mount..................... 1 ................................. M22002 4 Fuse 3AG 2.0A SLO-BLO............................ 1 ................................. M99906 5 Fuse Holder 3AG Panel Mount..................... 1 ................................. M22002 6 Fuse 3AG 1.0A ............................................. 1 ................................. M22004 7 Connector Assy J2 Sharpener ...................... 1 ................................. N23002 8 Connector Assy J1 Main Power ................... 1 ................................. M23000 9 ID Plate Input Power..................................... 1 ................................. M29000 Power Cord W1 f/M 115 Volt (not shown) ..... 1 ................................. M25000
24 October 2007 / version 3.1
198 | Chapter 8 Assembly Parts List
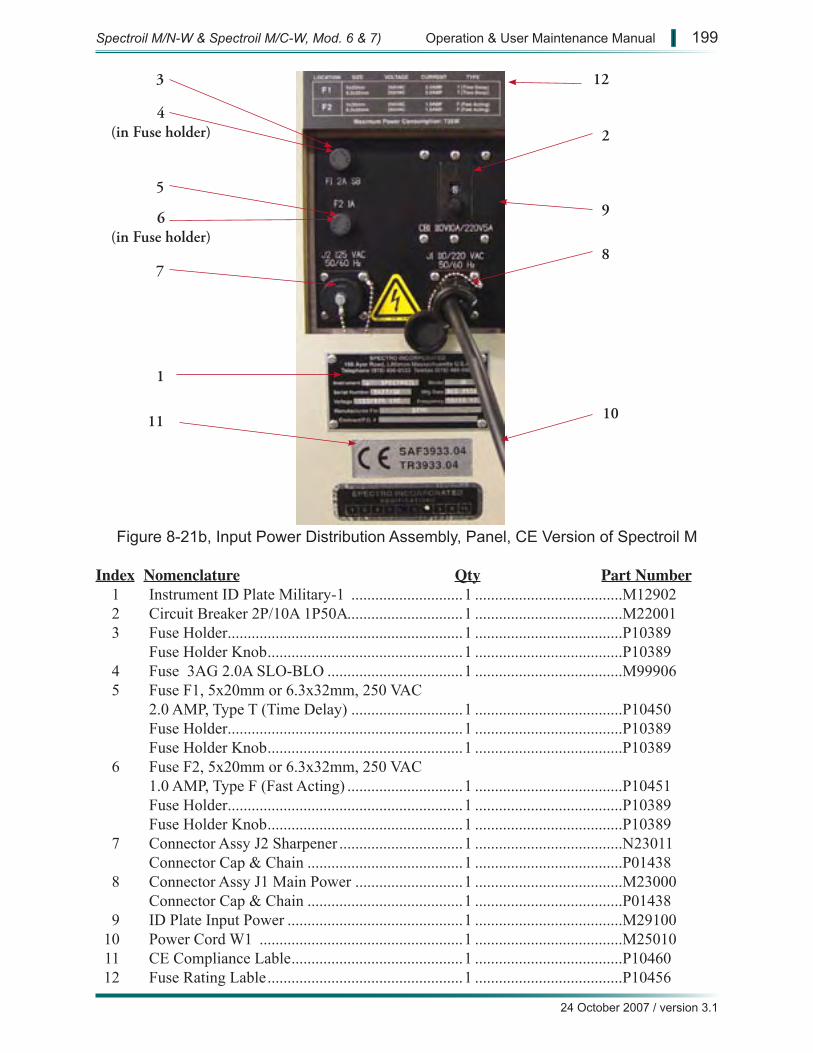
9
10
1
2
3
4(in Fuse holder)
5
78
6(in Fuse holder)
11
12
Figure 8-21b, Input Power Distribution Assembly, Panel, CE Version of Spectroil M
Index Nomenclature Qty Part Number 1 Instrument ID Plate Military-1 ............................1 .....................................M12902 2 Circuit Breaker 2P/10A 1P50A .............................1 .....................................M22001 3 Fuse Holder ...........................................................1 .....................................P10389 Fuse Holder Knob .................................................1 .....................................P10389 4 Fuse 3AG 2.0A SLO-BLO ..................................1 .....................................M99906 5 Fuse F1, 5x20mm or 6.3x32mm, 250 VAC 2.0 AMP, Type T (Time Delay) ............................1 .....................................P10450 Fuse Holder ...........................................................1 .....................................P10389 Fuse Holder Knob .................................................1 .....................................P10389 6 Fuse F2, 5x20mm or 6.3x32mm, 250 VAC 1.0 AMP, Type F (Fast Acting) .............................1 .....................................P10451 Fuse Holder ...........................................................1 .....................................P10389 Fuse Holder Knob .................................................1 .....................................P10389 7 Connector Assy J2 Sharpener ...............................1 .....................................N23011 Connector Cap & Chain .......................................1 .....................................P01438 8 Connector Assy J1 Main Power ...........................1 .....................................M23000 Connector Cap & Chain .......................................1 .....................................P01438 9 ID Plate Input Power ............................................1 .....................................M29100 10 Power Cord W1 ...................................................1 .....................................M25010 11 CE Compliance Lable ...........................................1 .....................................P10460 12 Fuse Rating Lable .................................................1 .....................................P10456
24 October 2007 / version 3.1
Spectroil M/N-W & Spectroil M/C-W, Mod. 6 & 7) Operation & User Maintenance Manual | 199
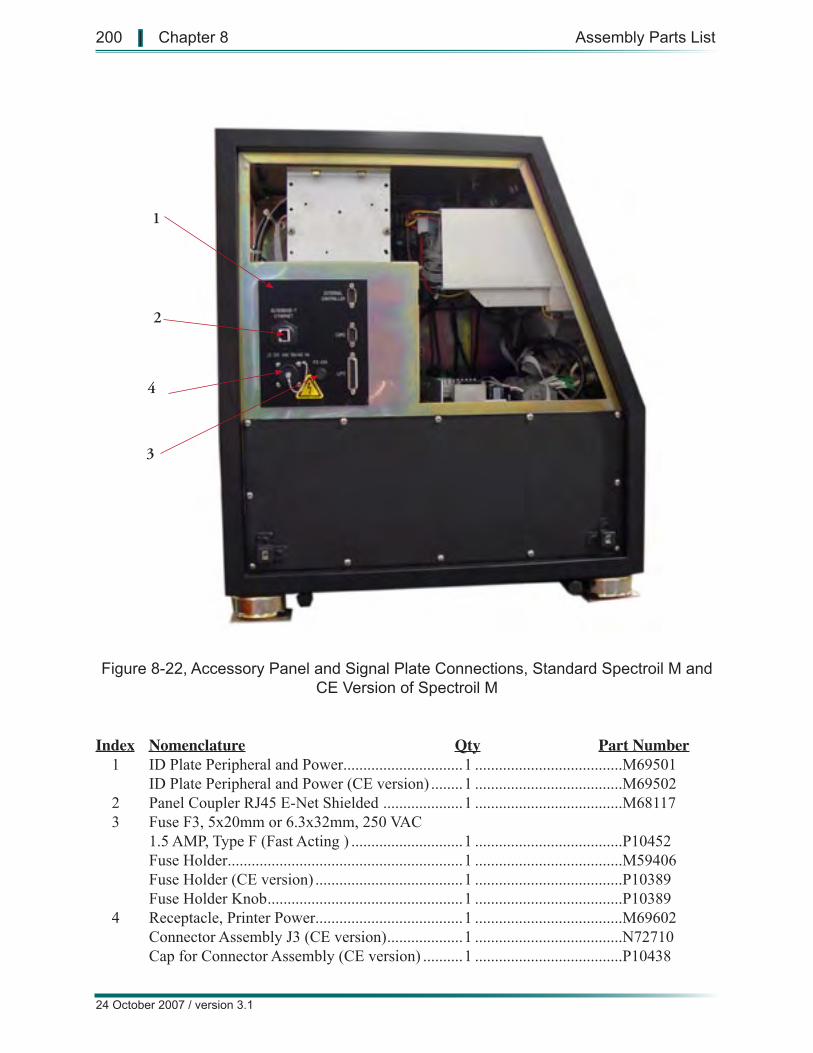
1
2
3
4
Figure 8-22, Accessory Panel and Signal Plate Connections, Standard Spectroil M and CE Version of Spectroil M
Index Nomenclature Qty Part Number 1 ID Plate Peripheral and Power ..............................1 .....................................M69501 ID Plate Peripheral and Power (CE version) ........1 .....................................M69502 2 Panel Coupler RJ45 E-Net Shielded ....................1 .....................................M68117 3 Fuse F3, 5x20mm or 6.3x32mm, 250 VAC 1.5 AMP, Type F (Fast Acting ) ............................1 .....................................P10452 Fuse Holder ...........................................................1 .....................................M59406 Fuse Holder (CE version) .....................................1 .....................................P10389 Fuse Holder Knob .................................................1 .....................................P10389 4 Receptacle, Printer Power .....................................1 .....................................M69602 Connector Assembly J3 (CE version) ...................1 .....................................N72710 Cap for Connector Assembly (CE version) ..........1 .....................................P10438
24 October 2007 / version 3.1
200 | Chapter 8 Assembly Parts List
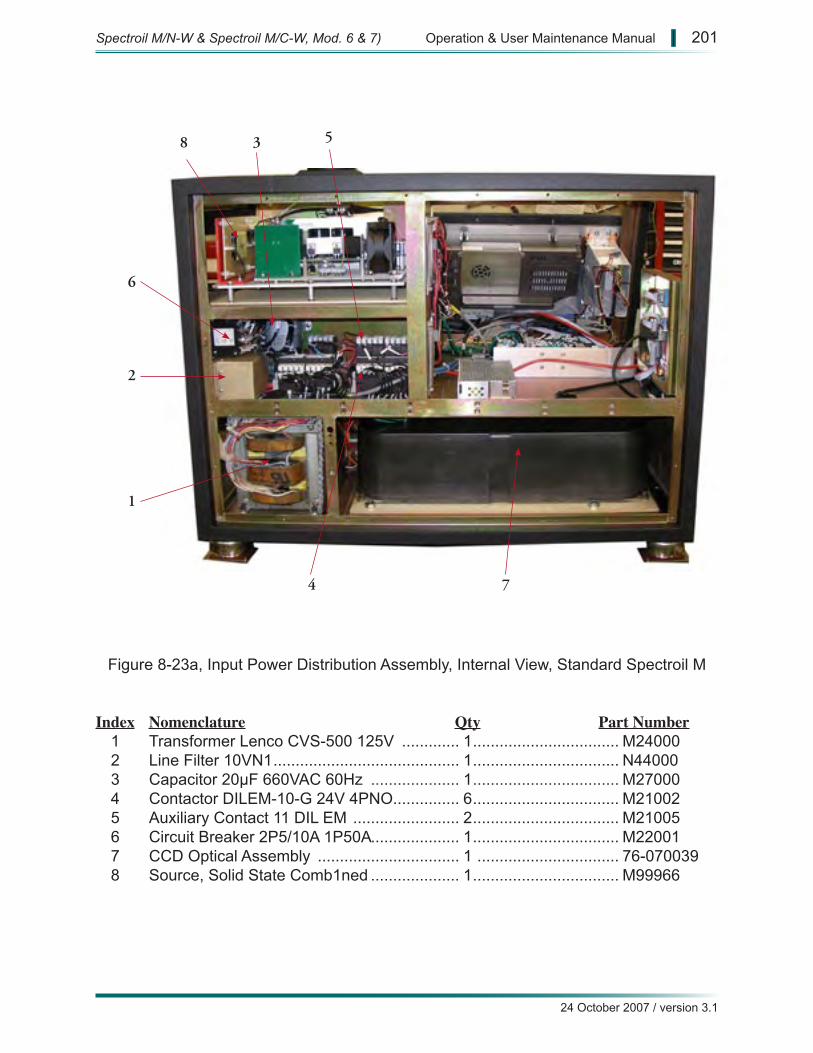
8 3
1
2
4
5
6
7
Figure 8-23a, Input Power Distribution Assembly, Internal View, Standard Spectroil M
Index Nomenclature Qty Part Number 1 Transformer Lenco CVS-500 125V ............. 1 ................................. M24000 2 Line Filter 10VN1 .......................................... 1 ................................. N44000 3 Capacitor 20µF 660VAC 60Hz .................... 1 ................................. M27000 4 Contactor DILEM-10-G 24V 4PNO............... 6 ................................. M21002 5 Auxiliary Contact 11 DIL EM ........................ 2 ................................. M21005 6 Circuit Breaker 2P5/10A 1P50A.................... 1 ................................. M22001 7 CCD Optical Assembly ................................ 1 ................................ 76-070039 8 Source, Solid State Comb1ned .................... 1 ................................. M99966
24 October 2007 / version 3.1
Spectroil M/N-W & Spectroil M/C-W, Mod. 6 & 7) Operation & User Maintenance Manual | 201
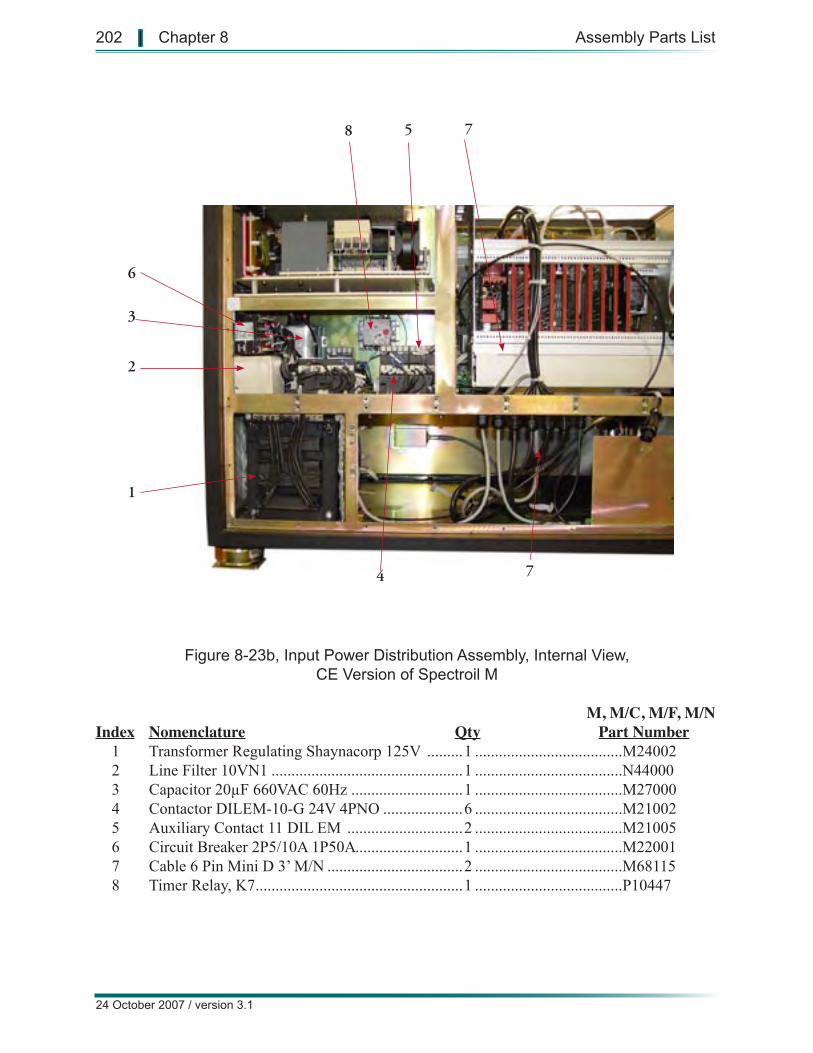
1
2
3
4
5
6
7
8 7
Figure 8-23b, Input Power Distribution Assembly, Internal View, CE Version of Spectroil M
M, M/C, M/F, M/NIndex Nomenclature Qty Part Number 1 Transformer Regulating Shaynacorp 125V .........1 .....................................M24002 2 Line Filter 10VN1 ................................................1 .....................................N44000 3 Capacitor 20µF 660VAC 60Hz ............................1 .....................................M27000 4 Contactor DILEM-10-G 24V 4PNO ....................6 .....................................M21002 5 Auxiliary Contact 11 DIL EM .............................2 .....................................M21005 6 Circuit Breaker 2P5/10A 1P50A ...........................1 .....................................M22001 7 Cable 6 Pin Mini D 3’ M/N ..................................2 .....................................M68115 8 Timer Relay, K7 ....................................................1 .....................................P10447
24 October 2007 / version 3.1
202 | Chapter 8 Assembly Parts List

9.0 OPERATIONAL AND MAINTENANCE ILLUSTRATIONS
9.1 INTRODUCTION
This section contains Spectroil M/N-W, and Spectroil M/C-W schematic diagrams and illus-trations to assist with operational maintenance procedures.
Chapter 9
Operational and
Maintenance Illustrations
Spectroil M/N-W & Spectroil M/C-W, (Mod. 6 & 7) Operation & User Maintenance Manual | 203
24 October 2007 / version 3.1
9.2 ILLUSTRATIONS
The following diagrams are provided in this section:
Title Section#Simplified Block Diagram 9.2.1Interconnection Wiring Block Diagram 9.2.2Input Power Distribution Block Diagram 9.2.3Input Power Distribution Diagram 9.2.4Placement of Power Switching Contactor Assembly 9.2.5Regulating Power Transformer Assembly Wiring 9.2.6Sample Stand Block Diagram 9.2.7Excitation Source Block Diagram 9.2.8Excitation Source with DC Capability for RFS Analysis Block Diagram 9.2.9Excitation Source / Sample Stand Schematic Diagram 9.2.10Excitation Source for RFS Analysis / Sample Stand Schematic Diagram 9.2.11Control Panel Assembly Block Diagram 9.2.12Control Panel Assembly Schematic Diagram 9.2.13Connector Position for M59205 Measurement & Control Circuit Card 9.2.14Connector Position for M59210 Interlock & Power Monitor Circuit Card 9.2.15Terminal Board 2 Wiring Diagram 9.2.16Computer Controller Block Diagram 9.2.17Computer Controller Wiring Diagram 9.2.18Polychromator Optic Block Diagram 9.2.19External Data Transmission Cable for External Computer with 9 Pin Serial Port 9.2.20External Data Transmission Cable for External Computer with 25 Pin Serial Port 9.2.21Spectroil M Dimensions and Mounting Details 9.2.22
204 | Chapter 9 Operational and Maintenance Illustrations
24 October 2007 / version 3.1

Drawing being revised, contact Spectro Inc. for latest version or an update to this manual
9.2.1 Simplified Block Diagram
Spectroil M/N-W & Spectroil M/C-W, (Mod. 6 & 7) Operation & User Maintenance Manual | 205
24 October 2007 / version 3.1

Drawing being revised, contact Spectro Inc. for latest version or an update to this manual
9.2.2 Interconnection Wiring Block Diagram
206 | Chapter 9 Operational and Maintenance Illustrations
24 October 2007 / version 3.1
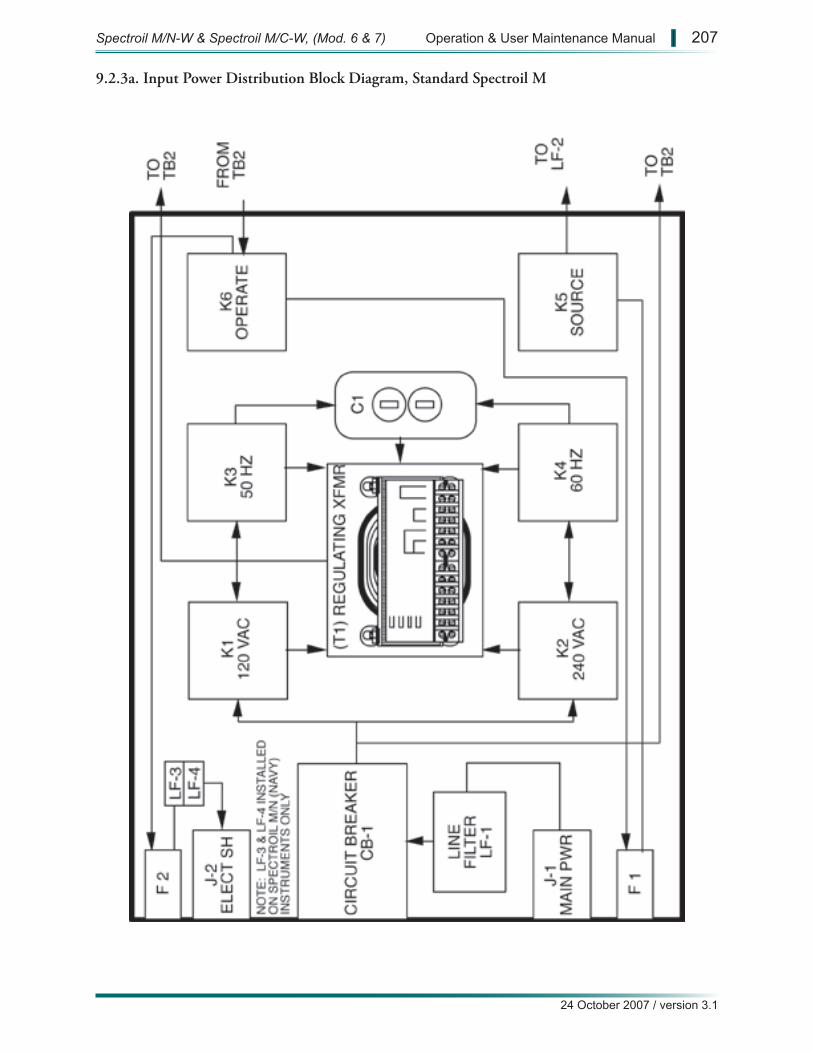
9.2.3a. Input Power Distribution Block Diagram, Standard Spectroil M
Spectroil M/N-W & Spectroil M/C-W, (Mod. 6 & 7) Operation & User Maintenance Manual | 207
24 October 2007 / version 3.1
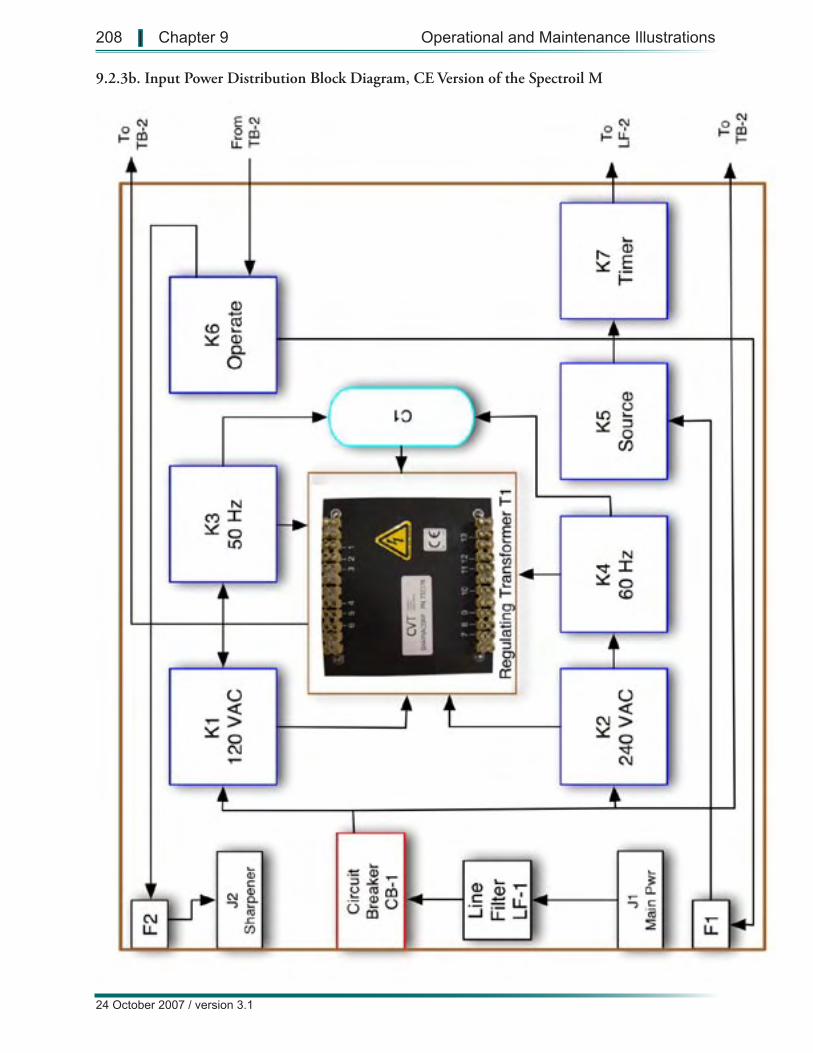
9.2.3b. Input Power Distribution Block Diagram, CE Version of the Spectroil M
208 | Chapter 9 Operational and Maintenance Illustrations
24 October 2007 / version 3.1
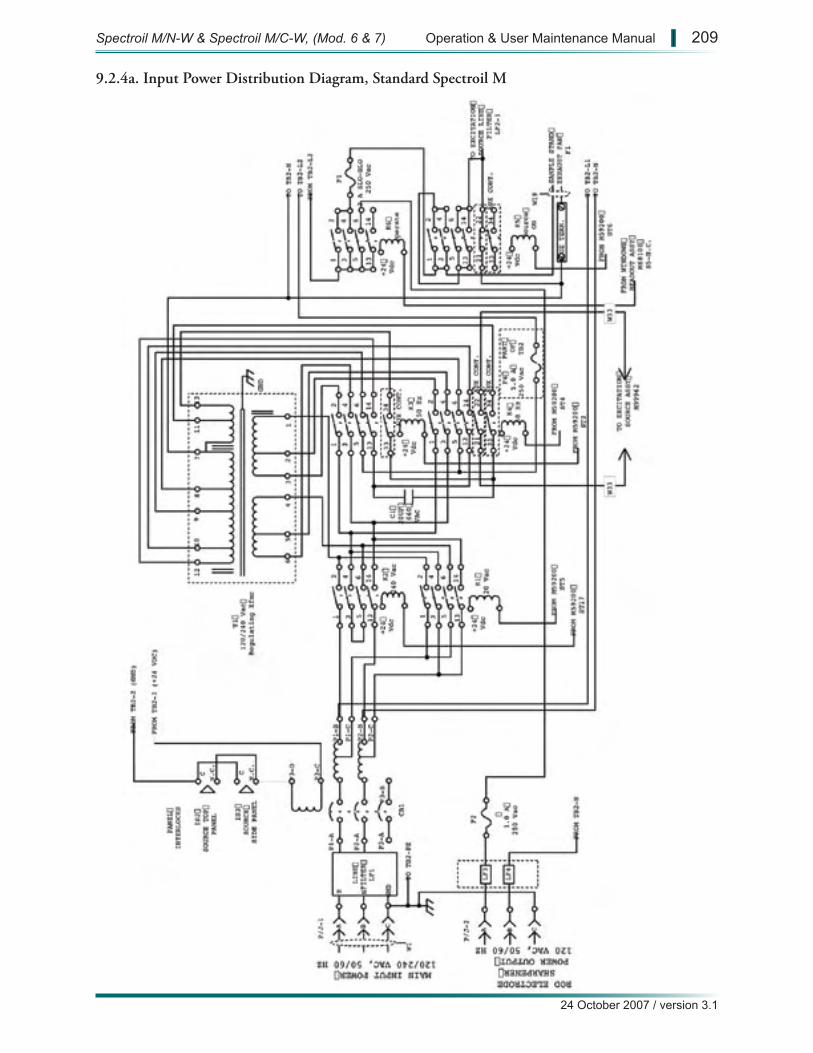
9.2.4a. Input Power Distribution Diagram, Standard Spectroil M
Spectroil M/N-W & Spectroil M/C-W, (Mod. 6 & 7) Operation & User Maintenance Manual | 209
24 October 2007 / version 3.1
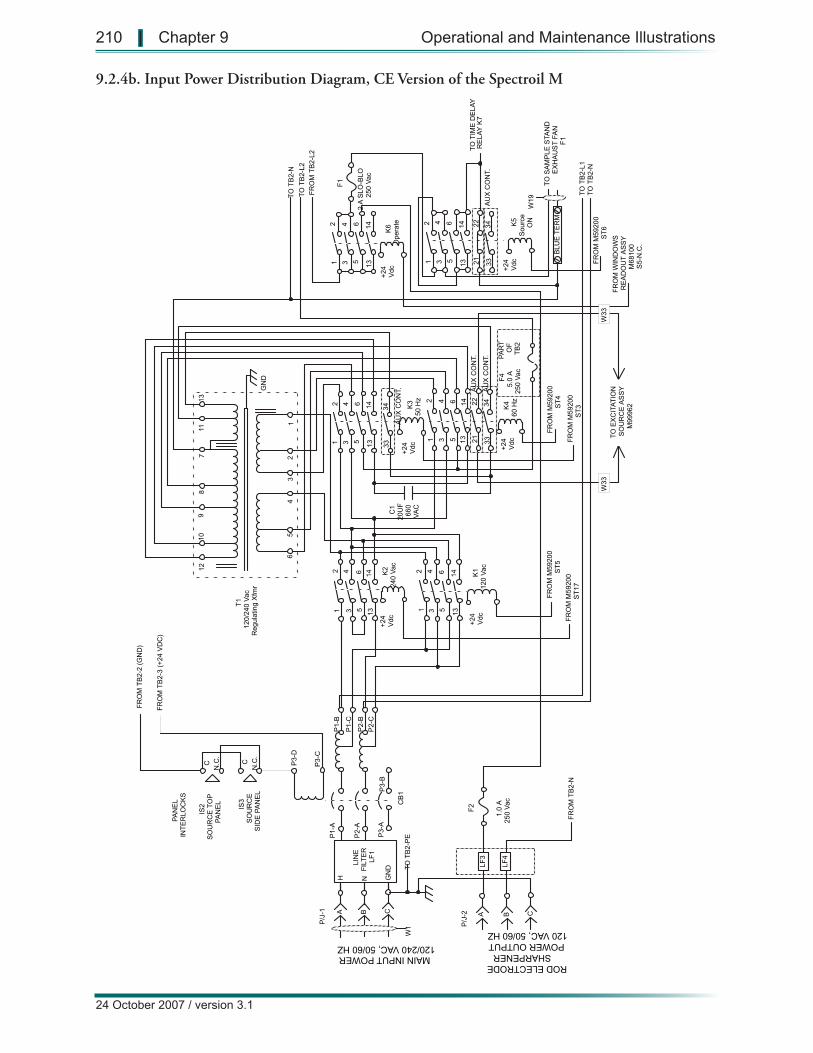
3 5 13
4 6 14
21 31 5 13
2 4 6 14K2
240
Vac
K1
120
Vac
31 5
2 4 6
1314 K4
60 H
z
31 5 13
2 4 6 14K3
50 H
z
3334
3334
C1
20U
F66
0V
AC
31 5 13
2 4 6 14 K6
Ope
rate
+24
Vdc
+24
Vdc
+24
Vdc
+24
Vdc +24
Vdc
12
34
56
78
910
1211
13
GN
D
T1
120/
240
Vac
Reg
ulat
ing
Xfm
r
31 5 13
2 4 6 14 K5
Sou
rce
ON
+24
Vdc
250
Vac
P1-
A
P2-
A
P3-
A
P1-
B
P2-
B
P3-
B
P1-
C
P2-
C
P3-
C
P3-
D
TO
TIM
E D
ELA
Y R
ELA
Y K
7
TO
SA
MP
LE S
TAN
DE
XH
AU
ST
FA
NF
1
FR
OM
TB
2-2
(GN
D)
FR
OM
TB
2-3
(+24
VD
C)
TO
TB
2-P
E
CN
.C.
C
N.C
.
IS2
SO
UR
CE
TO
PP
AN
EL
IS3
SO
UR
CE
SID
E P
AN
EL
PA
NE
LIN
TE
RLO
CK
S
TO
TB
2-L2
FR
OM
TB
2-L2
TO
TB
2-N
PA
RT
OF
TB
2
BLU
E T
ER
M.
W19
TO
TB
2-L1
TO
TB
2-N
AU
X C
ON
T.
AU
X C
ON
T.
FR
OM
TB
2-N
B C
LIN
EF
ILT
ER
LF1
NH
P/J
-1 A B CG
ND
W1 P
/J-2 A
FR
OM
M59
200
ST
6
FR
OM
WIN
DO
WS
RE
AD
OU
T A
SS
YM
6810
0S
5-N
.C.
F4
5.0
A25
0 V
ac
FR
OM
M59
200
ST
4
FR
OM
M59
200
ST
3
FR
OM
M59
200
ST
5
FR
OM
M59
200
ST
17
F2
1.0
A25
0 V
ac
MAIN INPUT POWER120/240 VAC, 50/60 HZ
ROD ELECTRODESHARPENER
POWER OUTPUT120 VAC, 50/60 HZ
F1
2 A
SLO
-BLO
LF3
LF4
CB
1
2122
AU
X C
ON
T.
T
O E
XC
ITA
TIO
N
SO
UR
CE
AS
SY
M
9996
2
W33
W33
3334
AU
X C
ON
T.
2122
9.2.4b. Input Power Distribution Diagram, CE Version of the Spectroil M
210 | Chapter 9 Operational and Maintenance Illustrations
24 October 2007 / version 3.1
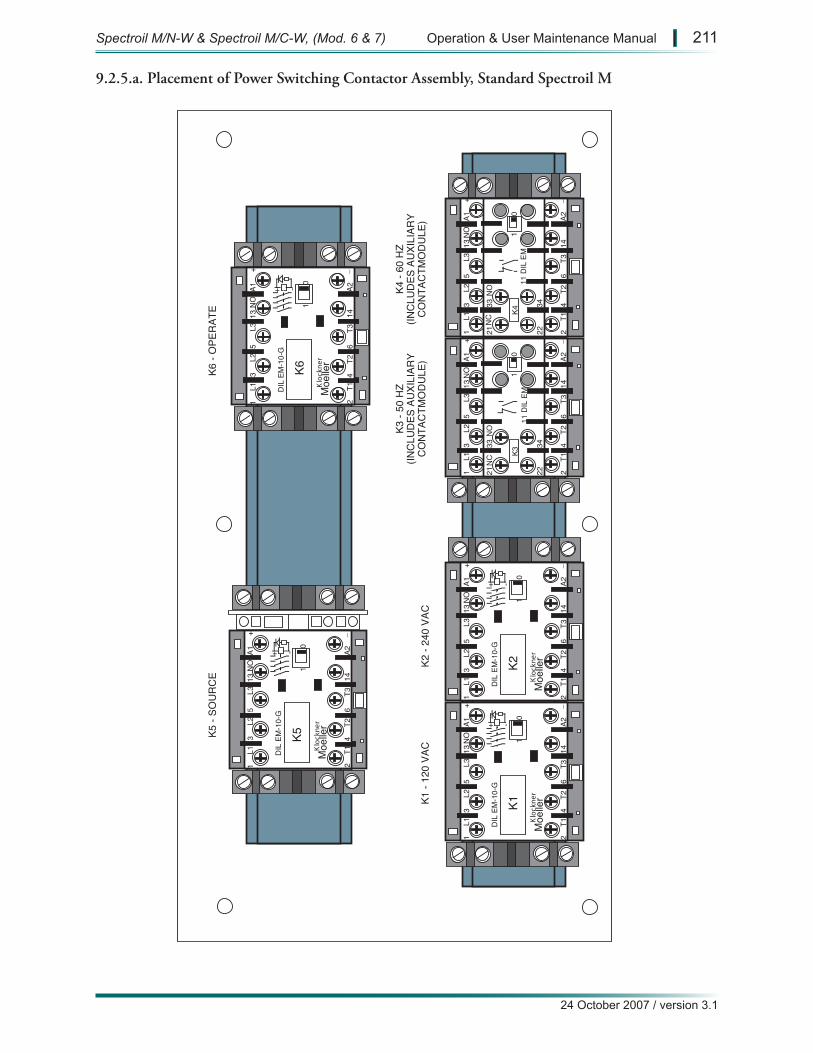
L11
3L2
5L3
13N
OA1
+
T12
4T2
6T3
14A2
_
01
+ -D
IL E
M-1
0-G
Moe
ller
NC
2133
NO
2234
11 D
IL E
M0
1
L11
3L2
5L3
13N
OA1
+
T12
4T2
6T3
14A2
_
01
+ -D
IL E
M-1
0-G
Moe
ller
NC
2133
NO
2234
01
L11
3L2
5L3
13N
OA1
+
T12
4T2
6T3
14A2
_
01
+ -D
IL E
M-1
0-G
Moe
ller
L11
3L2
5L3
13N
OA1
+
T12
4T2
6T3
14A2
_
01
+ -D
IL E
M-1
0-G
Moe
ller
K1K2
K3K4
L11
3L2
5L3
13N
OA1
+
T12
4T2
6T3
14A2
_
01
+ -D
IL E
M-1
0-G
Moe
ller
K6
L11
3L2
5L3
13N
OA1
+
T12
4T2
6T3
14A2
_
01
+ -D
IL E
M-1
0-G
Moe
ller
K5K5 -
SOU
RC
EK6
- O
PER
ATE
K1 -
120
VAC
K2 -
240
VAC
K3 -
50 H
Z(IN
CLU
DES
AU
XILI
ARY
CO
NTA
CTM
OD
ULE
)
K4 -
60 H
Z(IN
CLU
DES
AU
XILI
ARY
CO
NTA
CTM
OD
ULE
)
11 D
IL E
M
9.2.5.a. Placement of Power Switching Contactor Assembly, Standard Spectroil M
Spectroil M/N-W & Spectroil M/C-W, (Mod. 6 & 7) Operation & User Maintenance Manual | 211
24 October 2007 / version 3.1
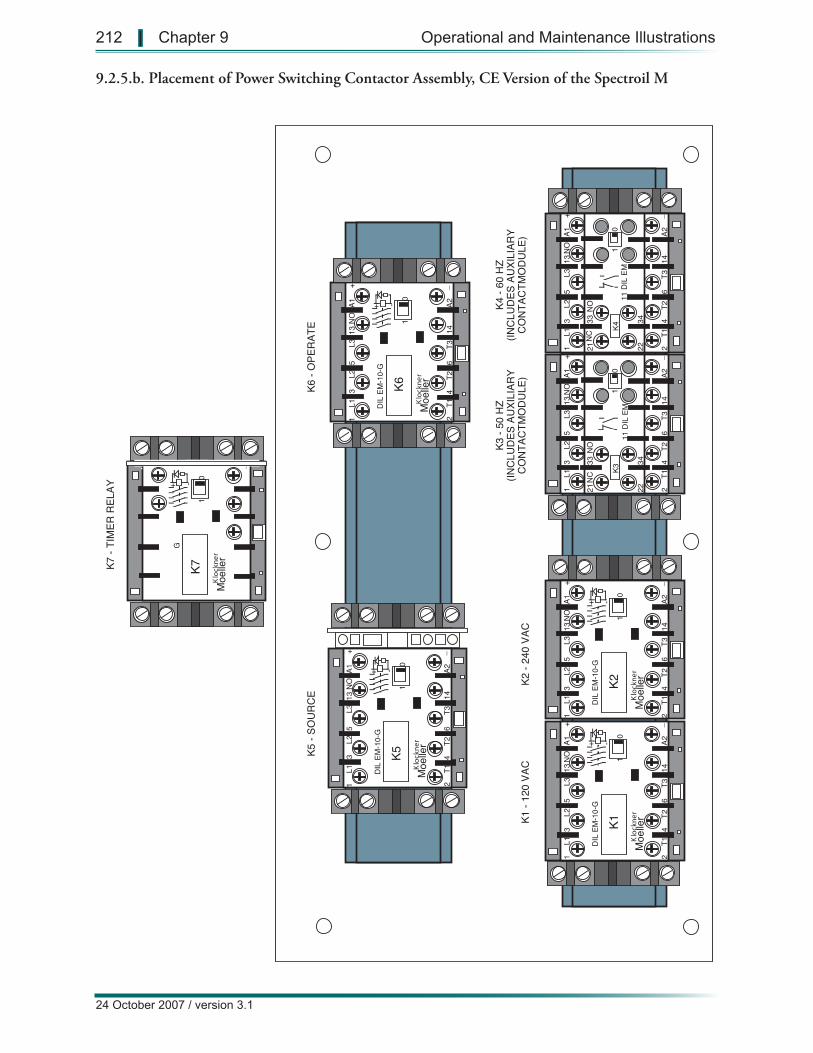
L11
3L2
5L3
13N
OA1
+
T12
4T2
6T3
14A2
_
01
+ -D
IL E
M-1
0-G
Moe
ller
NC
2133
NO
2234
11 D
IL E
M0
1
L11
3L2
5L3
13N
OA1
+
T12
4T2
6T3
14A2
_
01
+ -D
IL E
M-1
0-G
Moe
ller
NC
2133
NO
2234
01
L11
3L2
5L3
13N
OA1
+
T12
4T2
6T3
14A2
_
01
+ -D
IL E
M-1
0-G
Moe
ller
L11
3L2
5L3
13N
OA1
+
T12
4T2
6T3
14A2
_
01
+ -D
IL E
M-1
0-G
Moe
ller
K1K2
K3K4
L11
3L2
5L3
13N
OA1
+
T12
4T2
6T3
14A2
_
01
+ -D
IL E
M-1
0-G
Moe
ller
K6
L11
3L2
5L3
13N
OA1
+
T12
4T2
6T3
14A2
_
01
+ -D
IL E
M-1
0-G
Moe
ller
K5K5 -
SOU
RC
E
_
01
+ -G
Moe
ller
K7K7 -
TIM
ER R
ELAY
K6 -
OPE
RAT
E
K1 -
120
VAC
K2 -
240
VAC
K3 -
50 H
Z(IN
CLU
DES
AU
XILI
ARY
CO
NTA
CTM
OD
ULE
)
K4 -
60 H
Z(IN
CLU
DES
AU
XILI
ARY
CO
NTA
CTM
OD
ULE
)
11 D
IL E
M
9.2.5.b. Placement of Power Switching Contactor Assembly, CE Version of the Spectroil M
212 | Chapter 9 Operational and Maintenance Illustrations
24 October 2007 / version 3.1
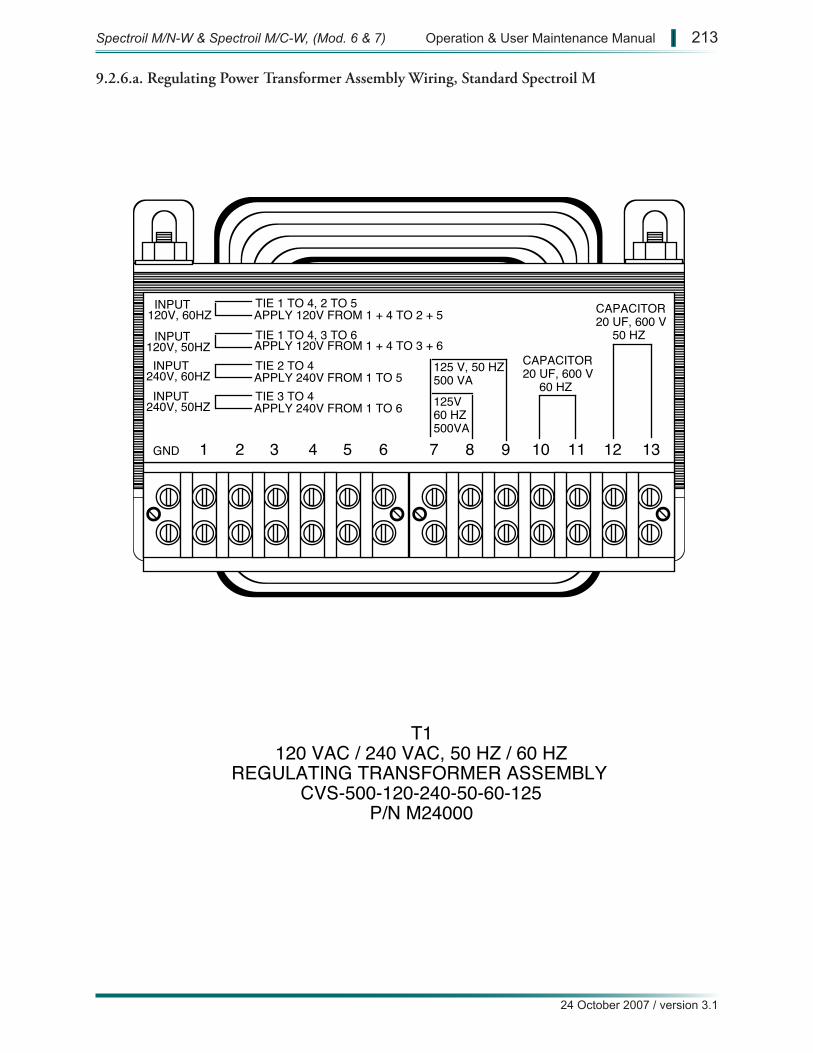
GND 1 2 3 4 5 6 7 8 9 10 11 12 13
INPUT120V, 60HZ
TIE 1 TO 4, 2 TO 5APPLY 120V FROM 1 + 4 TO 2 + 5
INPUT120V, 50HZ
TIE 1 TO 4, 3 TO 6APPLY 120V FROM 1 + 4 TO 3 + 6
INPUT240V, 60HZ
TIE 2 TO 4APPLY 240V FROM 1 TO 5
INPUT240V, 50HZ
TIE 3 TO 4APPLY 240V FROM 1 TO 6
125 V, 50 HZ500 VA125V60 HZ500VA
CAPACITOR20 UF, 600 V 60 HZ
CAPACITOR20 UF, 600 V 50 HZ
T1120 VAC / 240 VAC, 50 HZ / 60 HZ
REGULATING TRANSFORMER ASSEMBLYCVS-500-120-240-50-60-125
P/N M24000
9.2.6.a. Regulating Power Transformer Assembly Wiring, Standard Spectroil M
Spectroil M/N-W & Spectroil M/C-W, (Mod. 6 & 7) Operation & User Maintenance Manual | 213
24 October 2007 / version 3.1
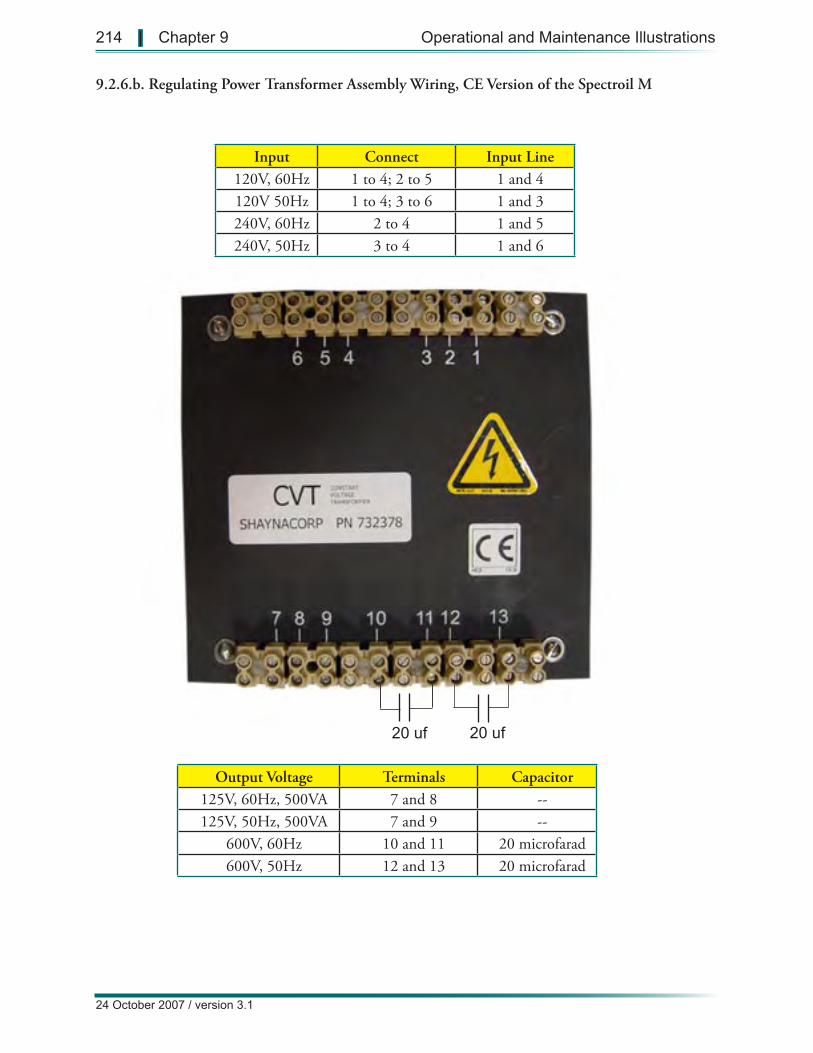
Input Connect Input Line120V, 60Hz 1 to 4; 2 to 5 1 and 4120V 50Hz 1 to 4; 3 to 6 1 and 3240V, 60Hz 2 to 4 1 and 5240V, 50Hz 3 to 4 1 and 6
Output Voltage Terminals Capacitor125V, 60Hz, 500VA 7 and 8 --125V, 50Hz, 500VA 7 and 9 --
600V, 60Hz 10 and 11 20 microfarad600V, 50Hz 12 and 13 20 microfarad
20 uf 20 uf
9.2.6.b. Regulating Power Transformer Assembly Wiring, CE Version of the Spectroil M
214 | Chapter 9 Operational and Maintenance Illustrations
24 October 2007 / version 3.1
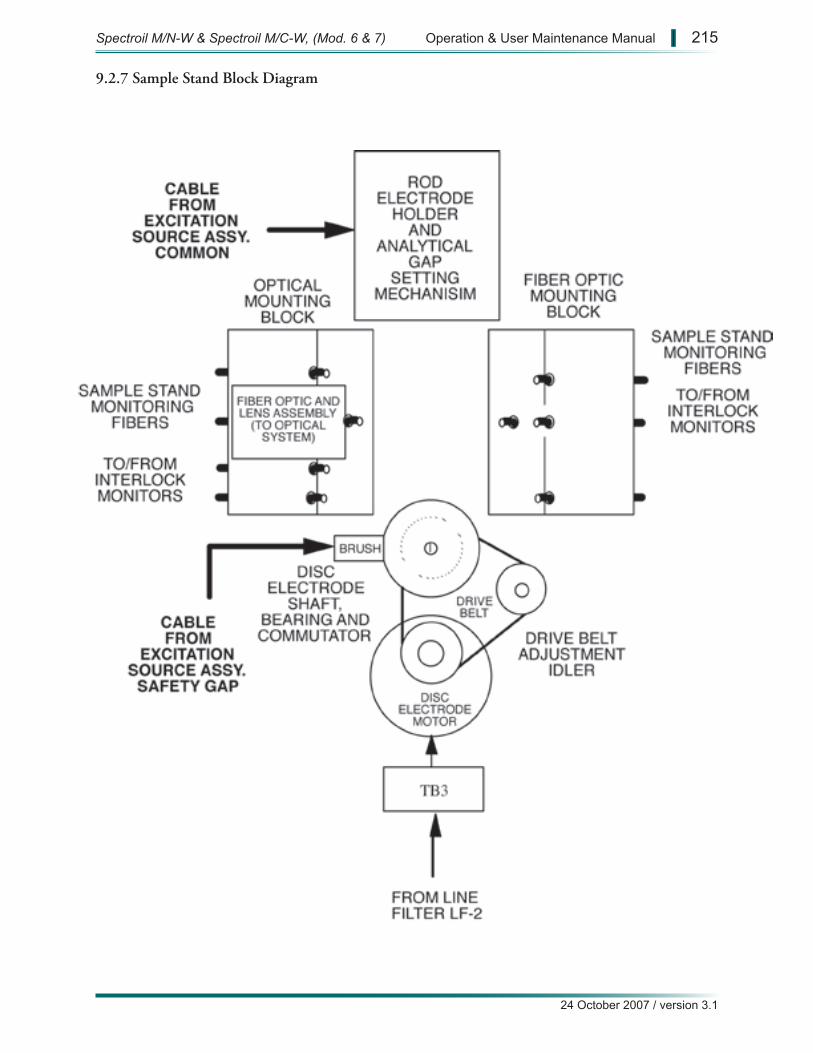
9.2.7 Sample Stand Block Diagram
Spectroil M/N-W & Spectroil M/C-W, (Mod. 6 & 7) Operation & User Maintenance Manual | 215
24 October 2007 / version 3.1
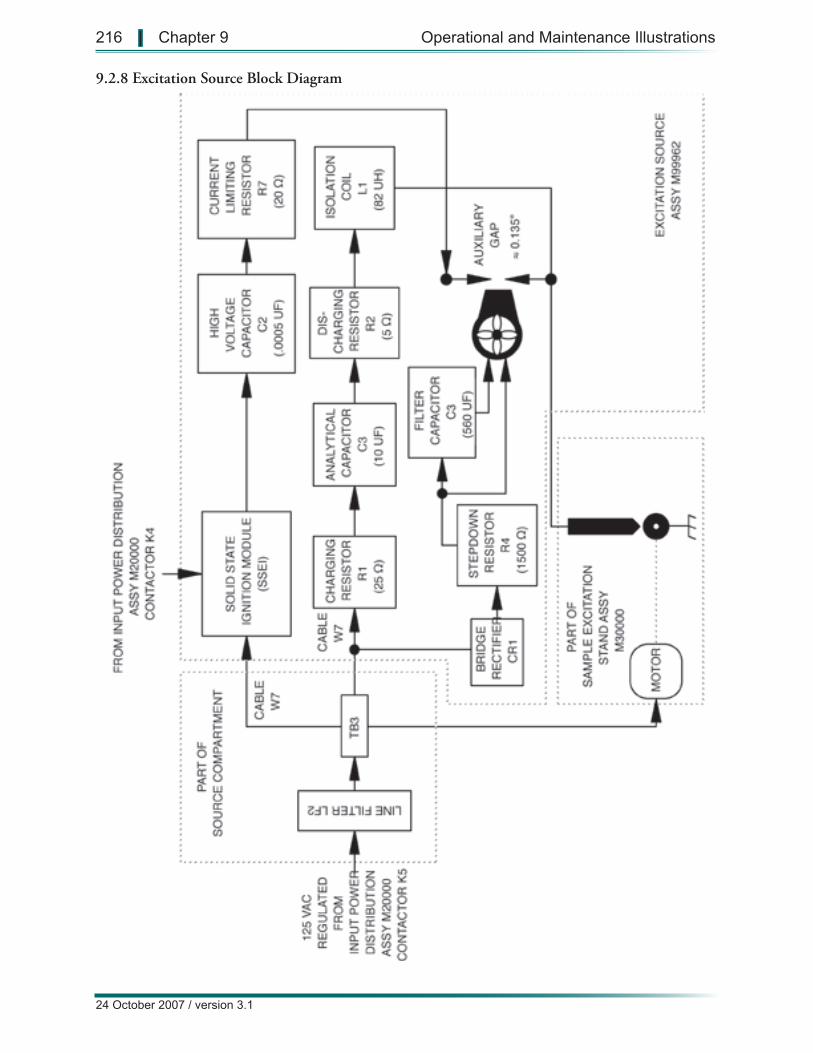
9.2.8 Excitation Source Block Diagram
216 | Chapter 9 Operational and Maintenance Illustrations
24 October 2007 / version 3.1
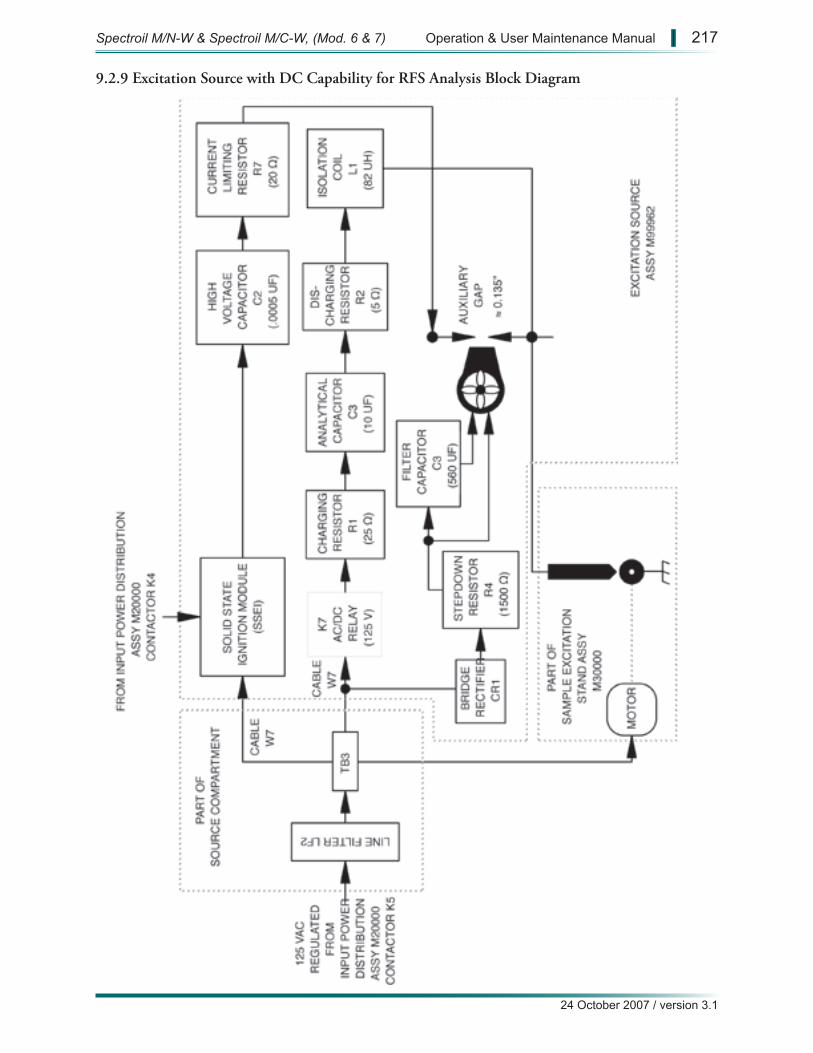
9.2.9 Excitation Source with DC Capability for RFS Analysis Block Diagram
Spectroil M/N-W & Spectroil M/C-W, (Mod. 6 & 7) Operation & User Maintenance Manual | 217
24 October 2007 / version 3.1
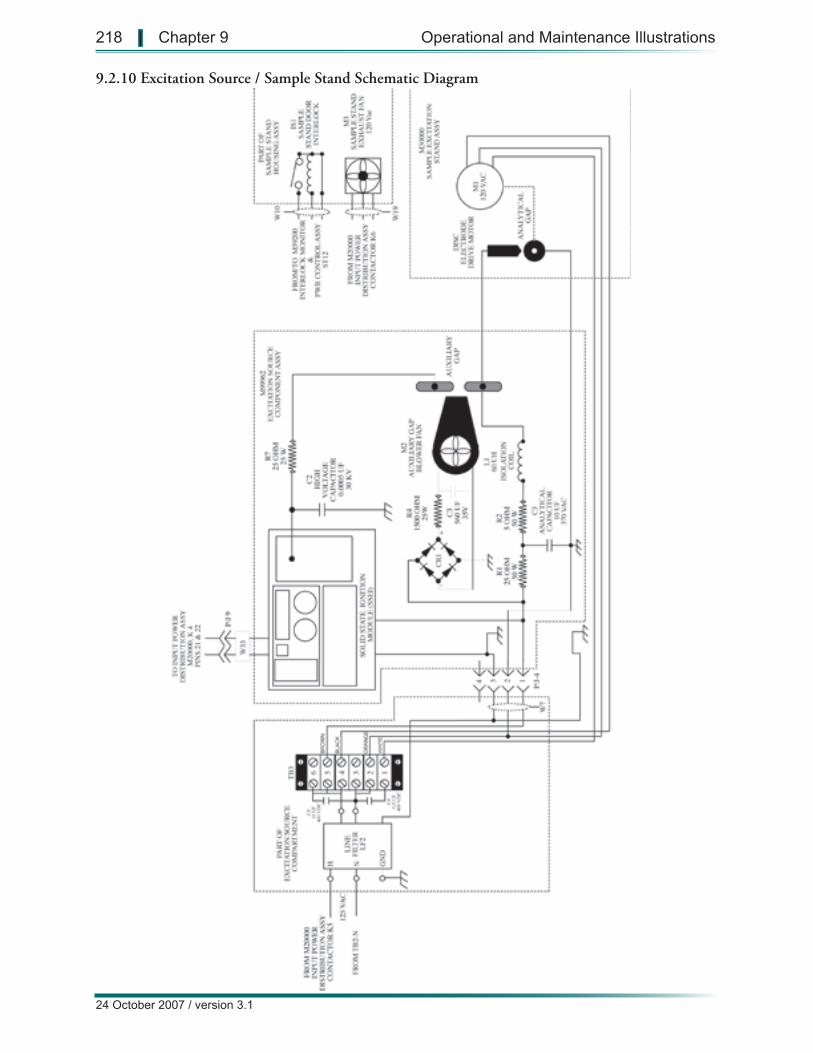
9.2.10 Excitation Source / Sample Stand Schematic Diagram
218 | Chapter 9 Operational and Maintenance Illustrations
24 October 2007 / version 3.1
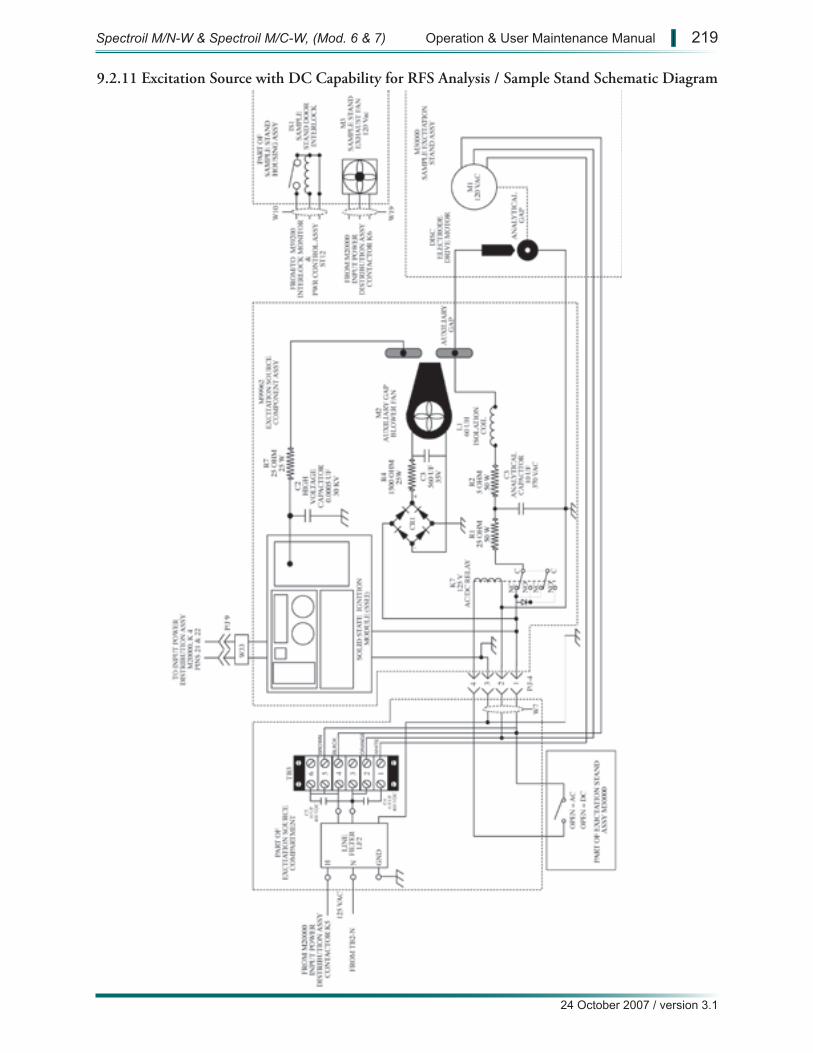
9.2.11 Excitation Source with DC Capability for RFS Analysis / Sample Stand Schematic Diagram
Spectroil M/N-W & Spectroil M/C-W, (Mod. 6 & 7) Operation & User Maintenance Manual | 219
24 October 2007 / version 3.1
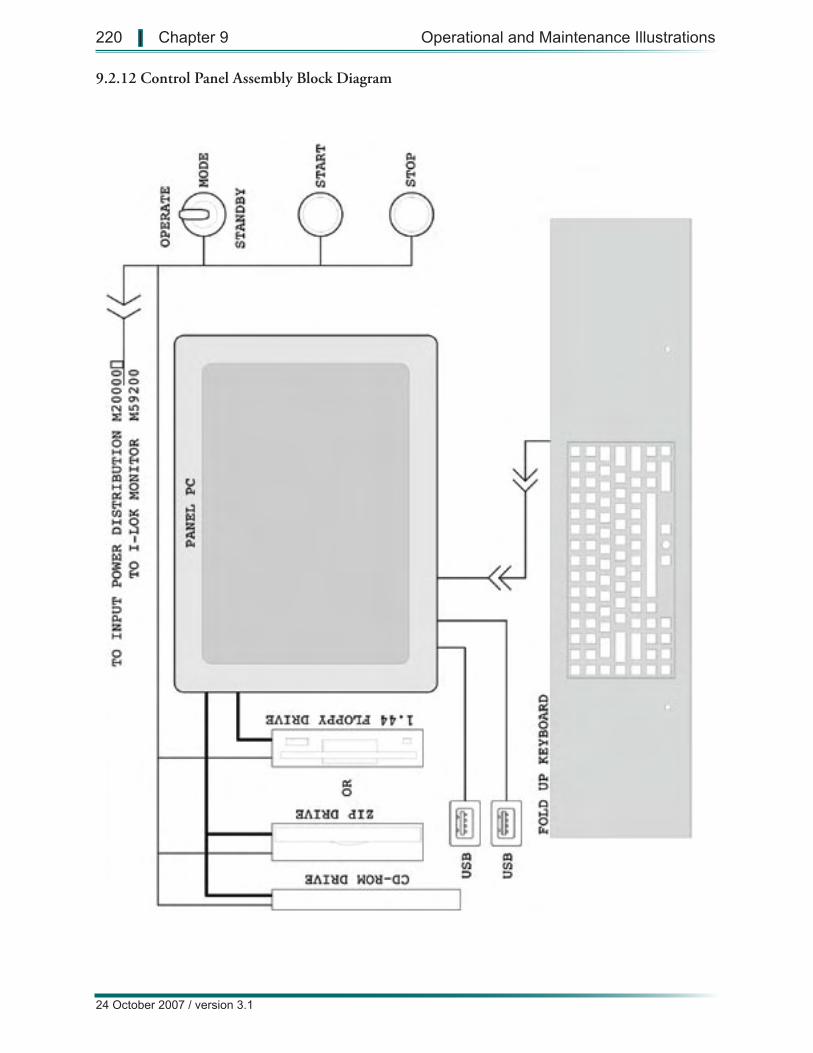
9.2.12 Control Panel Assembly Block Diagram
220 | Chapter 9 Operational and Maintenance Illustrations
24 October 2007 / version 3.1

Drawing being revised, contact Spectro Inc. for latest version or an update to this manual
9.2.13 Control Panel Assembly Schematic Diagram
Spectroil M/N-W & Spectroil M/C-W, (Mod. 6 & 7) Operation & User Maintenance Manual | 221
24 October 2007 / version 3.1
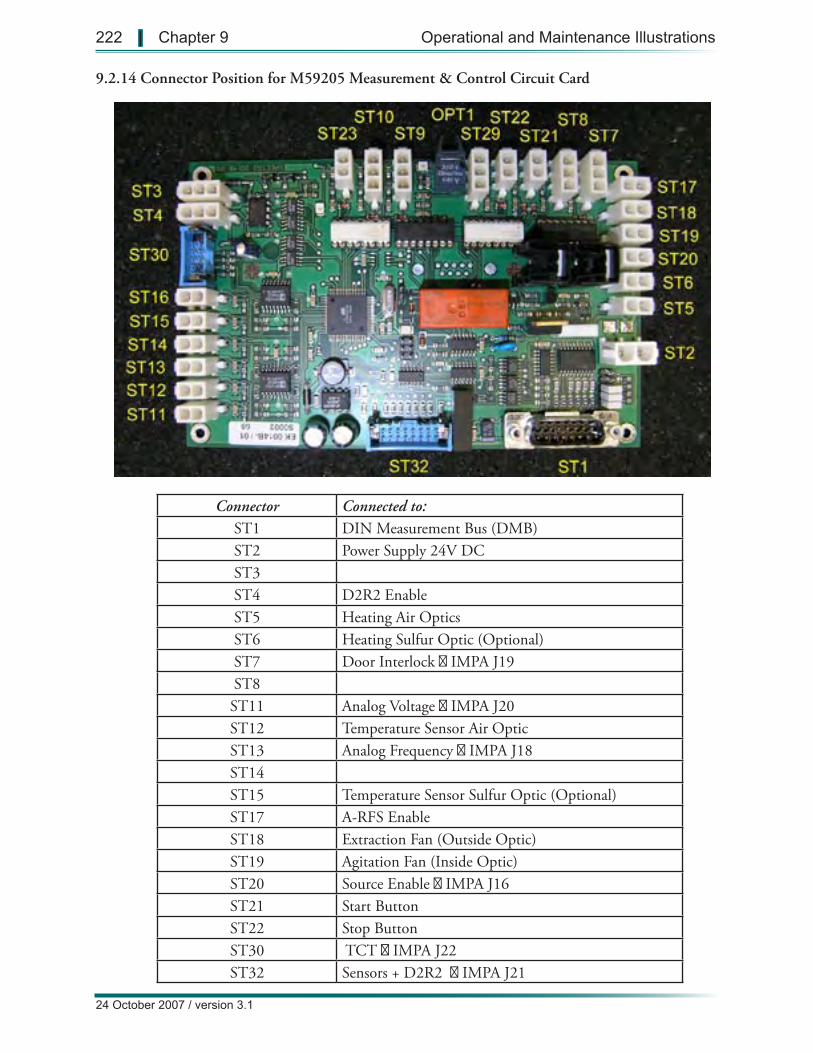
9.2.14 Connector Position for M59205 Measurement & Control Circuit Card
Connector Connected to:ST1 DIN Measurement Bus (DMB)ST2 Power Supply 24V DCST3ST4 D2R2 EnableST5 Heating Air OpticsST6 Heating Sulfur Optic (Optional)ST7 Door Interlock ← IMPA J19 ST8ST11 Analog Voltage ← IMPA J20ST12 Temperature Sensor Air OpticST13 Analog Frequency ← IMPA J18ST14ST15 Temperature Sensor Sulfur Optic (Optional)ST17 A-RFS EnableST18 Extraction Fan (Outside Optic)ST19 Agitation Fan (Inside Optic)ST20 Source Enable → IMPA J16ST21 Start ButtonST22 Stop ButtonST30 TCT ← IMPA J22 ST32 Sensors + D2R2 ← IMPA J21
222 | Chapter 9 Operational and Maintenance Illustrations
24 October 2007 / version 3.1
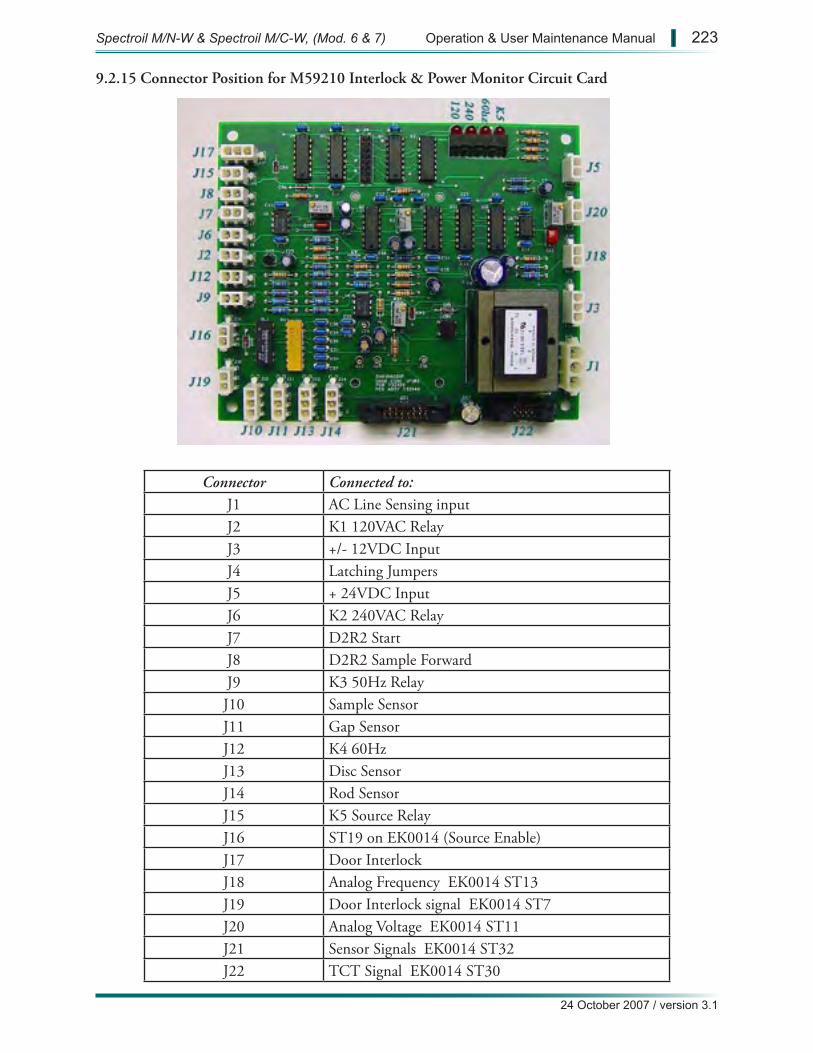
9.2.15 Connector Position for M59210 Interlock & Power Monitor Circuit Card
Connector Connected to:J1 AC Line Sensing inputJ2 K1 120VAC RelayJ3 +/- 12VDC InputJ4 Latching JumpersJ5 + 24VDC InputJ6 K2 240VAC RelayJ7 D2R2 StartJ8 D2R2 Sample ForwardJ9 K3 50Hz RelayJ10 Sample Sensor J11 Gap SensorJ12 K4 60HzJ13 Disc SensorJ14 Rod SensorJ15 K5 Source RelayJ16 ST19 on EK0014 (Source Enable)J17 Door InterlockJ18 Analog Frequency EK0014 ST13J19 Door Interlock signal EK0014 ST7J20 Analog Voltage EK0014 ST11J21 Sensor Signals EK0014 ST32J22 TCT Signal EK0014 ST30
Spectroil M/N-W & Spectroil M/C-W, (Mod. 6 & 7) Operation & User Maintenance Manual | 223
24 October 2007 / version 3.1
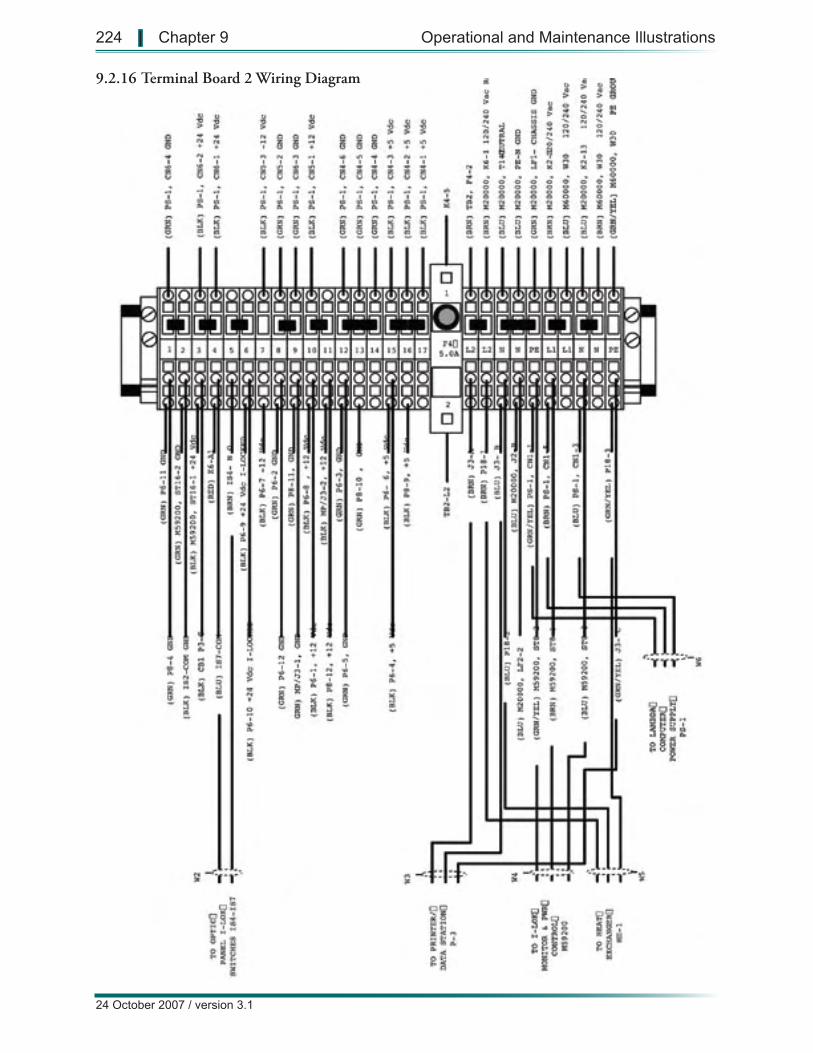
9.2.16 Terminal Board 2 Wiring Diagram
224 | Chapter 9 Operational and Maintenance Illustrations
24 October 2007 / version 3.1

Drawing being revised, contact Spectro Inc. for latest version or an update to this manual
9.2.17 Computer Controller Block Diagram
Spectroil M/N-W & Spectroil M/C-W, (Mod. 6 & 7) Operation & User Maintenance Manual | 225
24 October 2007 / version 3.1

Drawing being revised, contact Spectro Inc. for latest version or an update to this manual
9.2.18 Computer Controller Wiring Diagram
226 | Chapter 9 Operational and Maintenance Illustrations
24 October 2007 / version 3.1

Drawing being revised, contact Spectro Inc. for latest version or an update to this manual
9.2.19 Polychromator Optic Block Diagram
Spectroil M/N-W & Spectroil M/C-W, (Mod. 6 & 7) Operation & User Maintenance Manual | 227
24 October 2007 / version 3.1
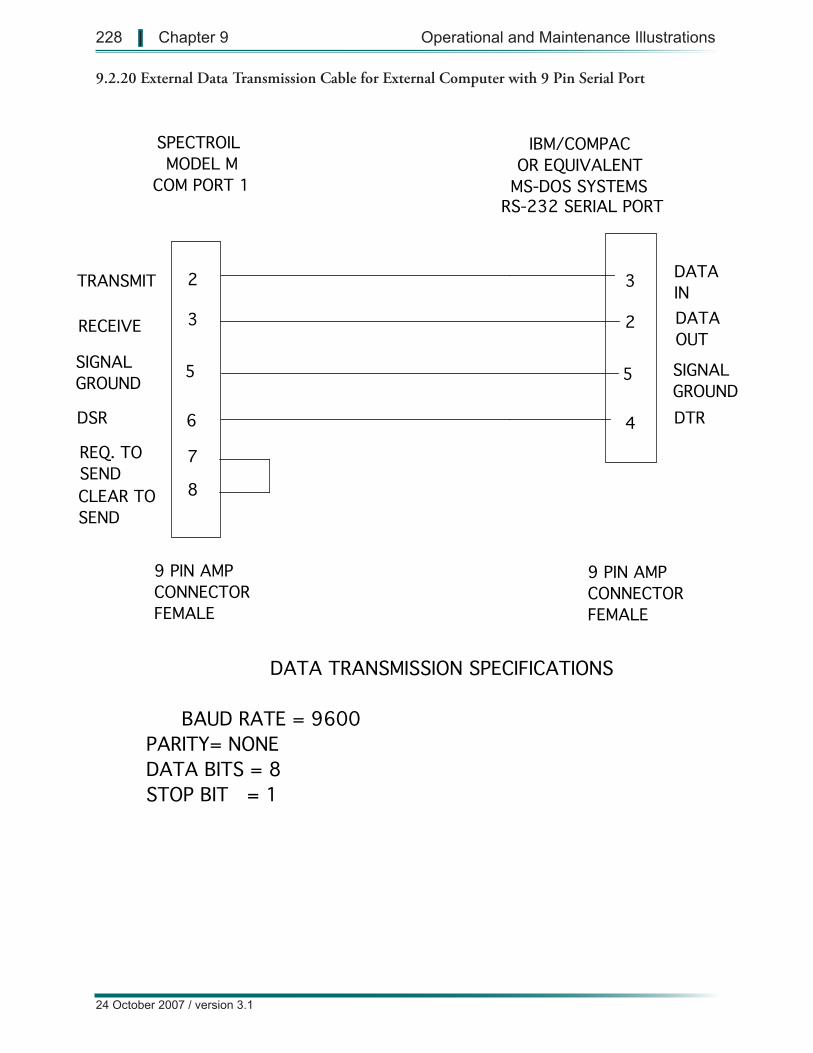
SPECTROILMODEL M
COM PORT 1
2
6
TRANSMIT 3
4
9 PIN AMPCONNECTORFEMALE
9 PIN AMPCONNECTORFEMALE
DATA TRANSMISSION SPECIFICATIONS
BAUD RATE = 9600 PARITY= NONE DATA BITS = 8 STOP BIT = 1
CLEAR TO SEND
5 5
REQ. TOSEND
3RECEIVE
DSR
2 DATAOUT
DATAIN
IBM/COMPACOR EQUIVALENT
MS-DOS SYSTEMSRS-232 SERIAL PORT
DTR
7
8
SIGNALGROUND
SIGNALGROUND
9.2.20 External Data Transmission Cable for External Computer with 9 Pin Serial Port
228 | Chapter 9 Operational and Maintenance Illustrations
24 October 2007 / version 3.1

9.2.21 External Data Transmission Cable for External Computer with 25 Pin Serial Port
Spectroil M/N-W & Spectroil M/C-W, (Mod. 6 & 7) Operation & User Maintenance Manual | 229
24 October 2007 / version 3.1
SPECTROILMODEL M
COM PORT 1
2
6
TRANSMIT 2
20
25 PIN AMPCONNECTORFEMALE
9 PIN AMPCONNECTORFEMALE
DATA TRANSMISSION SPECIFICATIONS
BAUD RATE = 9600 START BIT = 1 DATA BITS = 8 STOP BIT = 1
CLEAR TO SEND
5 7REQ. TOSEND
3RECEIVE
DSR
3 DATAOUT
DATAIN
IBM/COMPACOR EQUIVALENT
MS-DOS SYSTEMSRS-232 SERIAL PORT
DTR
7
8
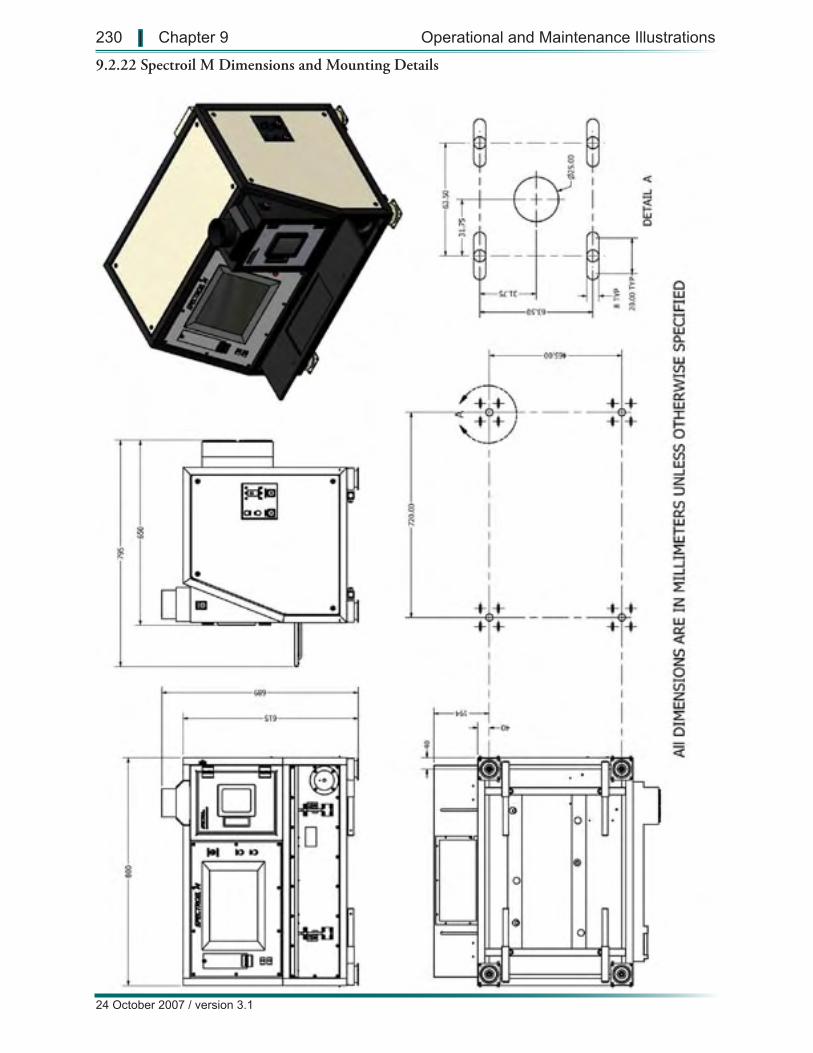
9.2.22 Spectroil M Dimensions and Mounting Details
230 | Chapter 9 Operational and Maintenance Illustrations
24 October 2007 / version 3.1