Embed Size (px)
Citation preview

Intern. 1. Envtmn. Awl. Chrm. Vol. 78(3-4), pp. 353-365 Reprints available W U y fmm the publisher Photocopying permined by license only
0 Moo OPA (Ovaseas Publishen Association) Amsterdam N.V. Published by license
under the Gordon and Breach Science Publishen imprint. Printed in Malaysia
SPECTROPHOTOMETRIC DETERMINATION OF PHENOLS AND CYANIDES AFI'ER
DISTILLATION FROM NATURAL WATERS
MICHAEL K. SOFONIOU~, GEORGE A. ZACHARIADIS~*,
ARISTIDIS N. ANTHEMIDISa and THEMISTOCLIS A. KOUIMTZISb
'Laboratory of Analytical Chemistry and bLuboratory of Environmental Pollution Con- trol, Arisiotle University of Thessaloniki, 54006 Thessaloniki, Greece
(Received I5 OcioieG 1999; Infinal form 22 March, 2000)
Total phenols were determined by molecular spectmphotometry, after distillation, complexation with Caminoantipyrine and extraction into chloroform. Cyanides were also determined spectrophotomet- rically after distillation from the acidified samples, and complexation in moderate acidic solution with barbituric acid. The dynamic ranges were 0 - 100 pg L-' for total phenols and 0 - 30 pg L-' for cyanides. The above methods were applied in the analysis of river, lake and stream waters collected from Northern Greece. The seasonal and spatial variation of concentrations was evaluated by two-way ANOVA. Background levels (4 - 12 pg L-' for total phenols and 0.3 - 3 pg L-' for cya- nides), were found in almost all surface waters, with some exceptions.
Keywords: Phenols; cyanides; distillation; spectrophotometry; natural waters
INTRODUCTION
The release of phenols and cyanides in the environment, caused by human activ- ities, is of great concern, because both types of compounds have widespread uses in agriculture and industry. Furthermore, many of the phenolic substances and some metal cyanide complexes appear to be very persistent in the aquatic envi- ronment, although some phenols are more rapidly biodegraded when trapped in sediments.
Phenols have been used in manufacture of polymers, antioxidants, dyes, drugs, pesticides, petroleum additives, and wood preservatives. In the form of chloroph- enols, they are detected in the effluents from sewage chlorination plants, wood
* Corresponding author. Fax: +30-31-997719, E-mail: [email protected]
353
Downloaded By: [HEAL-Link Consortium] At: 09:06 19 October 2008

354 MICHAEL K. SOFONIOU et ul.
and paper industries, petroleum refineries, hydrocarbon production units, as well as in a large number of chemical industries 1'- 'I.
Cyanide compounds have been used in metal finishing processes and during heat treatment process in steel production. They are constituents of wastes from electroplating plants, cooling tower blowdown, gas scrub waters, coke plants, and blast furnace operations [31. They form stable complexes with Fe, Cd, Cu, which are perhaps more toxic to organisms than equal concentrations of NaCN [41.
The industrial treatment of waste waters for phenol removal, includes ozona- tion, chlorination, superchlorination, or adsorption in activated carbon. Alkaline chlorination is also the common treatment for cyanide removal from industrial wastewater. By this process, cyanides are easily oxidized by chlorine or ozone to less toxic CNO-, and furthermore to N2 13]. In general, non-substituted phenol, monochlorophenols and alkylphenols are oxidized by molecular oxygen, even in the natural aquatic environment, whereas, highly substituted chlorinated phenols and nitrophenols are more resistant to oxidation under natural environmental conditions ['I.
On the other hand, the pollution of drinking water, either of ground or stream origin by cyanides, consists a severe health hazard because of cyanides' toxicity, high solubility, mobility, and similar behavior to C1- and NO,. Toxicity of cya- nides is due to the well-known reaction of liberation of HCN from acidic media [51.
The legislation of European Union [61, concerning dangerous substances dis- charged into the aquatic environment, requires that the maximum admissible concentration of total phenols in drinking water, should be 0.5 pg L-'. In natural and bathing water this level changes to 5 pg L-'. However, concentrations up to 900 pg L-' have been encountered in heavily polluted rivers [7981. In addition, US EPAS list of priority pollutants includes eleven phenolic compounds, such as 4-chloro-3-methylphenol, 2-chlorophenol, 2,4-dichlorophenol, 2,4-dimethylphe- nol, 2-nitrophenol, trichlorophenols (TCP), pentachlorophenols (PCP), etc. [91. Many studies have concluded that chlorinated phenolic substances are signifi- cantly more toxic than non-substituted phenols to most aquatic organisms. For most fishes, the tolerance levels are described by LD5, = 1 - 10 pg L-' for phe- nol, and LD50 = 0.01 - 1 pg L-' for polychlorinated phenols. The bioaccummu- lation in food chain, as well as the adverse effect of the chlorinated phenols on odor and taste of potable water, have been reported ['I. The permissible level of cyanides in drinking water, according to EU directive is 50 pg L-' [''I.
As a consequence, the environmental pollution studies of natural rivers are increasingly dealing with the analysis of such compounds. A great number of very efficient analytical techniques are available today, either for trace analysis
Downloaded By: [HEAL-Link Consortium] At: 09:06 19 October 2008
SPECTROPHOTOMETRIC DETERMINATION 355
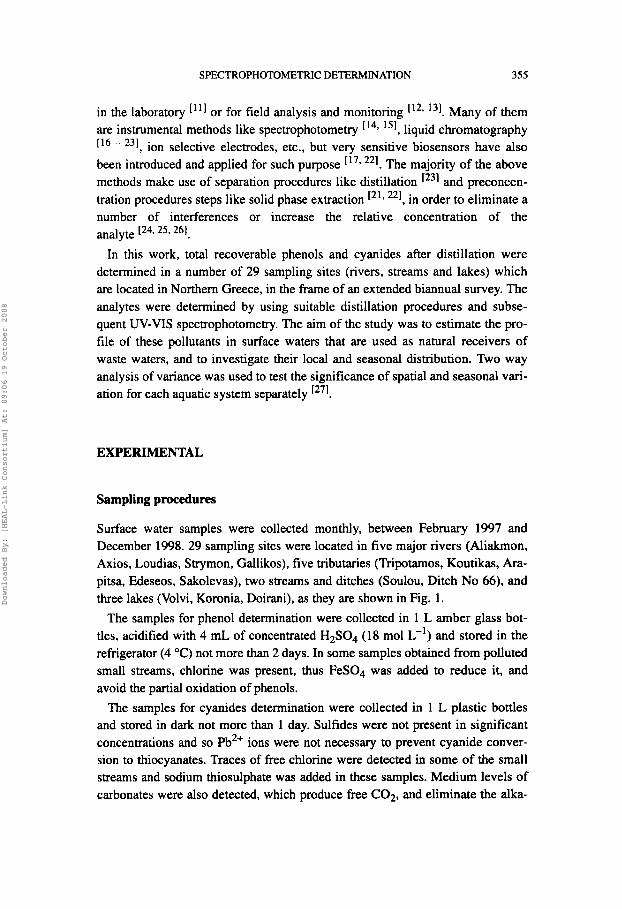
in the laboratory [ l I 1 or for field analysis and monitoring [12, 13] . Man yofthem are instrumental methods like spectrophotometry [14, 15], liquid chromatography [16 - 231, ion selective electrodes, etc., but very sensitive biosensors have also been introduced and applied for such purpose [17, 221. The majority of the above methods make use of separation procedures like distillation [231 and preconcen- tration procedures steps like solid phase extraction [21i 221, in order to eliminate a number of interferences or increase the relative concentration of the analyte I24.25.261
In this work, total recoverable phenols and cyanides after distillation were determined in a number of 29 sampling sites (rivers, streams and lakes) which are located in Northern Greece, in the frame of an extended biannual survey. The analytes were determined by using suitable distillation procedures and subse- quent UV-VIS spectrophotometry. The aim of the study was to estimate the pro- file of these pollutants in surface waters that are used as natural receivers of waste waters, and to investigate their local and seasonal distribution. Two way analysis of variance was used to test the significance of spatial and seasonal vari- ation for each aquatic system separately [271.
EXPERIMENTAL
Sampling procedures
Surface water samples were collected monthly, between February 1997 and December 1998. 29 sampling sites were located in five major rivers (Aliakmon, Axios, Loudias, Strymon, Gallikos), five tributaries (Tripotamos, Koutikas, Ara- pitsa, Edeseos, Sakolevas), two streams and ditches (Soulou, Ditch No 66), and three lakes (Volvi, Koronia, Doirani), as they are shown in Fig. 1.
The samples for phenol determination were collected in 1 L amber glass bot- tles, acidified with 4 mL of concentrated H2SO4 (18 mol L-') and stored in the refrigerator (4 "C) not more than 2 days. In some samples obtained from polluted small streams, chlorine was present, thus FeS04 was added to reduce it, and avoid the partial oxidation of phenols.
The samples for cyanides determination were collected in 1 L plastic bottles and stored in dark not more than 1 day. Sulfides were not present in significant concentrations and so Pb2+ ions were not necessary to prevent cyanide conver- sion to thiocyanates. Traces of free chlorine were detected in some of the small streams and sodium thiosulphate was added in these samples. Medium levels of carbonates were also detected, which produce free C02, and eliminate the alka-
Downloaded By: [HEAL-Link Consortium] At: 09:06 19 October 2008

356 MICHAEL K. SOFONIOU et al.
FIGURE 1 Map of Northern Greece, showing the studied area and the locations of the sampling sites
line strength of the NaOH trap. Thus, Ca(OH)2 was added for sample preserva- tion until pH = 12, instead of NaOH, in order to trap C032- as CaCO,. The carbonate precipitate was then filtered, and cyanides were determined in the fil- trate. However, by this procedure some kinds of insoluble cyanide substances are excluded from subsequent determination.
Reagents and solutions
All chemicals were of analytical reagent grade (Merck (Darmstadt, Germany), unless stated otherwise. All standard and sample solutions were made up with double de-ionized water.
Stock phenol solution was prepared by dissolving 1 g of accurately weighed phenol in 1 L of freshly boiled and cooled distilled water. From this solution, standard solutions were prepared by appropriate dilutions with the same type of water, with final concentration ranging between 0 and 200 pg L-',
Buffer solution with pH = 10.0 for phenols, was prepared by dissolving 70 g NH4Cl in water and adding suitable amount of NH40H in 1 L of distilled water. Solutions containing 2.0g of 4-aminoantipyrine (Sigma) in 100 mL distilled water and 8.0g K3Fe(CN)6 (Sigma) in 100 mL distilled water were prepared daily, as complexing reagents for phenol extraction into chloroform and subse- quent spectrophotometric determination.
Downloaded By: [HEAL-Link Consortium] At: 09:06 19 October 2008

SPECTROPHOTOMETRIC DETERMINATION 351
Stock cyanides solution was prepared by dissolving 1 g of accurately weighed potassium cyanide in boiled and cooled distilled water. Dilute standard solutions were prepared by appropriate dilutions of the stock, in order to obtain a series of standards with concentrations ranging between 0 - 50 pg L-'.
The absorber solution in the trap for cyanide collection was 0.04mol L-' NaOH. The solution of MgC1, (Riedel de Haan) contained 510 g L-'. Buffer solution with pH = 5.0 was prepared by dissolving 820 g CH3COONa-3H20 in a small amount of water, adding a suitable amount of glacial CH3COOH and dilut- ing to 1 L with distilled water. Solutions containing 1.0 g chloramine T (Riedel de Haan) in 100 mL distilled water, and 15.0 g barbituric acid (Sigma) with 75 mL pyridine in 250 mL dilute hydrochloric acid, were prepared fresh daily, as complexing reagents.
Steam - distillation and spectrophotometric determination of phenols
The analytical procedure was similar to that recommended by ASTM r241 and APHA [251 with the modifications described below. An aliquot of 300 mL of the sample was transferred in a round bottom flask and a side condenser was fitted to the flask. The solution was heated by a mantle until 275 mL of distillate were collected. Addition of some 50 mL of distilled water in the flask was followed, to finish the steam-distillation until 300 mL of total distillate volume was collected.
This procedure ensures the maximum distillation of volatile phenols, even of a number of chlorine-substituted ones. The distillate was transferred quantitatively to a separation funnel, 10 mL of the ammonium buffer were added, followed by 2 mL of 4-aminoantipyrine and 2 mL of femcyanide solution. After exactly 10 min of colour development, the yellow complex formed, was finally extracted into 20 mL of chloroform, by shaking the separatory funnel 20 times twice. The organic layer was dried by passing through anhydrous Na2S04, and the absorb- ance of the extract was measured at 460 nm using a 4-cm cell against reagent blank, with a Varian DMS 100s double beam W-VIS spectrophotometer.
A series of standard solutions was analyzed by exactly the same procedure yielding the calibration curve. The recovery was tested on a mixed sample, which was separated in different portions, and to these portions, known amounts of phenols were added.
Reflw - distillation and spectrophotometric determination of cyanides
The analytical procedure was based on that recommended by ASTM [261 and APHA r251 with some modifications. A volume of 250 mL of the sample was
Downloaded By: [HEAL-Link Consortium] At: 09:06 19 October 2008

358 MICHAEL K. SOFONIOU et al.
transferred in round bottom flask with a side thistle tube for reagent additions, and a vertical condenser was fitted to the flask. The absorber trap, with gas dis- persion tube inside, was fitted at the top of the condenser and vacuum was applied to the trap. The trap consisted from 15 mL of 0.04 M NaOH.
The solution was heated by a mantle for one hour and the liberated HCN was collected to the alkaline solution. 25 mL of the MgC12 solution were added as catalyst during the acidic distillation, in order to destroy complex ferrous and other stable metal complex cyanides and to form easily destructible magnesium cyanide. Finally, 25 mL of 9 mol L-' H2S04 were added in the flask to acidify the solution.
The pH of the absorber solution was adjusted to 4.5 - 5.0 by addition of 1 mL acetate buffer. In order to determine even the amenable to chlorination cyanides, chloramine T reagent was added before colour development. Cyanides were determined by development of the violet complex with barbituric acid and pyrid- ine, exactly 8 min after addition of 1 mL of this reagent. The absorbance was measured at 578 nm with a 4-cm cell against reagent blank, using a Varian DMS 100s double beam UV-VIS spectrophotometer. A series of standard solutions was analyzed by the same procedure and the calibration curve obtained was used for the calculation of unknown concentrations. The recovery was tested on a mixed sample, which was separated in different portions, and to these portions, known amounts of cyanides were added.
RESULTS AND DISCUSSION
Determination of total phenols
The calibration curve obtained by a series of aqueous standards of phenol was linear up to 100 pg L-', although the next curved part showed also good repro- ducibility. The regression equation was:
A = 0.048 + 0.0106[plienol]
and the correlation coefficient was r = 0.9981. Recovery tests were tried on five samples of double distilled water, which were
spiked with phenol at final concentration 20 pg L-'. The mean recovery was found to be 91%, while the detection limit, calculated using the 3s criterion, was 1 pg L-'. The repeatability, as expressed by relative standard deviation of these analyses was = 6.3 %, and the reproducibility between days was less than 10 %. This precision could be achieved by keeping identical time intervals for mixing of reagents, colour development and solvent extraction.
Downloaded By: [HEAL-Link Consortium] At: 09:06 19 October 2008

SPECTROPHOTOMETRIC DETERMINATION 359
In Table I, the seasonal means (each seasonal mean value was calculated from 6 months) in each site and also the overall biannual means (from 24 months) were listed. The overall biannual mean value for each sampling station is pre- sented together with the relative standard deviation (sr) observed. It can be seen that, in all three lakes, the lower concentrations were appeared during autumn. River Tripotamos, which is a tributary of Aliakmon, was found to permanently contain higher concentrations of phenols. The majority of the other studied rivers are found to contain background levels (4 - 12 pg L-') and the overall relative standard deviation ranged between 5 - 15 %. This low variation proved that the major portion of total phenolic load is of natural origin (e.g. degradation of lignin).
TABLE I Seasonal (3 months x 2 years) and overall (24 months) mean values of phenols (pg L-I) in sampling stations
Seasonu1 mean Overall code Name /Type
Winter Spring Summer Auiumn Mean IWs,
1
2
3
4
5
6
7
8
9
10
1 1
12
13
14
15
16
17
18
Ditch 66 I Stream
Ditch 66 I Stream
Aliakmon / River
Aliakmon I River
Aliakmon I River
Aliakmon I River
Tripotamos I River
Koutikas / River
Arapitsa I River
Fdeseos I River
Soulou I stream
Soulou I stream
Sakolevas I River
Axios I River
Axios I River
Axios / River
Gallikos / River
Gallikos I River
11.1
15.4
9.1
13.4
12.2
12.4
18.2
9.3
13.1
11.2
10.2
13.5
10.8
10.9
9.8
11.8
11.3
11.6
10.5
10.4
7.3
9.8
11.4
9.6
26.4
7.3
10.1
12.9
9.5
11.5
12.1
13.0
11.7
10.0
9.4
7.2
10.1
12.2
9.6
15.8
12.4
12.7
21.7
12.8
13.6
13.6
15.8
15.3
11.9
8.2
12.9
13.9
-
20.8
11.3
11.2
8.0
14.1
9.4
10.2
12.2
11.1
11.6
9.9
14.8
13.0
9.5
9.3
8.1
9.2
9.9
13.8
10.8
12.2
8.5
13.3
11.3
11.2
19.4
10.2
12.0
11.9
12.6
13.3
11.1
10.4
10.7
11.2
10.2
11.9
8.6
11.1
10.8
11.7
10.5
14.0
13.9
18.0
16.3
12.5
15.0
8.9
9.5
11.3
12.0
14.4
10.7
14.0
Downloaded By: [HEAL-Link Consortium] At: 09:06 19 October 2008

360 MICHAEL K. SOFONIOU et al.
Seasonal mean Overall code Name / v p e
Winter Spring Summer Autumn Mean lOOs,
20
21
22
23
24
25
BA
BD
DO1
KA
KD
Loudias /River
Loudias / River
Loudias / River
Strymon / River
Strymon / River
Strymon / River
Volvi / Lake
Volvi / Lake
Doirani / Lake
Koronia / Lake
Koronia I Lake
10.6 13.5 15.6 11.1 12.8
13.1 13.0 20.4 13.0 15.0
10.1 12.6 16.9 9.7 12.4
10.5 6.8 14.9 14.7 11.7
12.4 11.1 12.0 11.6 11.8
17.4 9.4 13.2 12.6 13.2
11.8 9.3 7.9 6.3 8.2
11.6 8.7 6.3 4.1 6.9
13.9 13.3 4.5 5.9 8.0
18.2 12.3 17.0 8.2 13.2
11.5 12.5 15.3 6.2 12.3
11.9
13.1
9.9
12.9
9.2
8.5
16.7
15.9
22.4
16.1
15.4
Correlation analysis was applied separately for each group of sampling sites. The correlation matrix of the raw data was consisted from all Pearson’s correla- tion coefficients calculated between the sampling sites of each specific sampling region. It was proved that not good correlation exists between the sampling sites, even in the same river. Poor correlation ( r = 0.7 - 0.9) was observed only in three cases, namely Aliakmon, Loudias and Axios. However it is worth to mention, that these rivers have sufficiently high flow rate throughout the year, thus many chemical parameters show significant correlation along the river. This is not true for tributaries and streams.
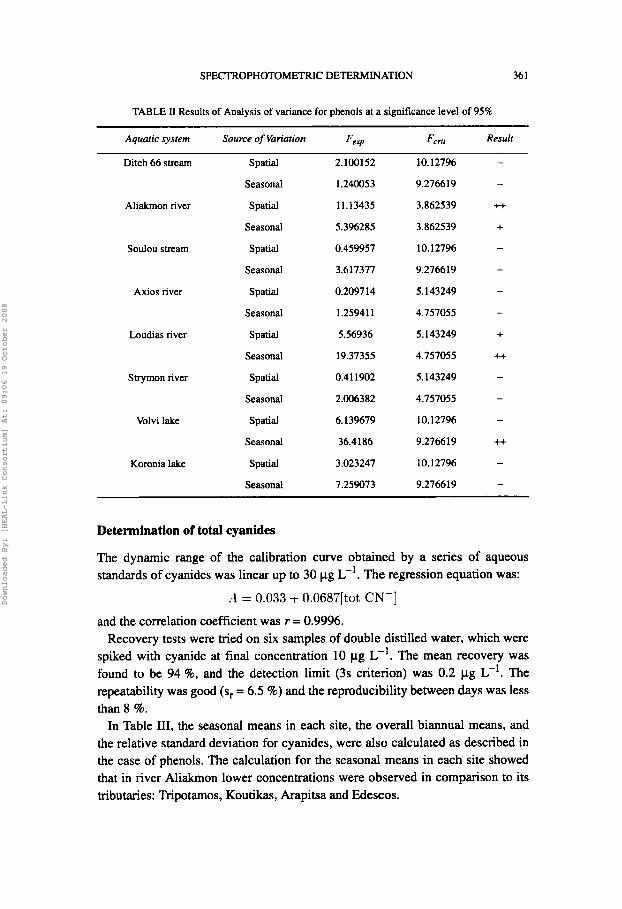
The results of two-way analysis of variance (ANOVA) performed for each group of sampling sites are listed in Table 11. The columns corresponded to sea- sonal means and the rows to the sampling sites along the specified group. The experimental values of Fratio (F,,,), were compared to critical ones (F,.& for 95 I significance level. Not significant effect is expressed with minus symbol (-) while significant effect is symbolized with the plus symbol (+). The results, showed that, for rivers Alialanon and Loudias, both seasonal and local variations were significant. For the majority of other sampling sites no significant variation was observed. However, in almost all sampling regions, the seasonal variation was an order of magnitude greater than the spatial variation. This is caused to the fact that these two rivers receive increased amounts of land drainage, thus a sig- nificant variation of phenolic compounds is expected.
Downloaded By: [HEAL-Link Consortium] At: 09:06 19 October 2008
SPECTROPHOTOMETRIC DETERh4IN ATION 36 1
TABLE I1 Results of Analysis of variance for phenols at a significance level of 95%
Aquatic system Source of Variation F w Fcrir Result
Ditch 66 smam
Aliakmon river
Soulou smam
Axios river
Loudias river
Strymon river
Volvi lake
Koronia lake
Spatial
Seasonal
Spatial
Seasonal
Spatial
Seasonal
Spatial
Seasonal
Spatial
Seasonal
Spatial
Seasonal
Spatial
Seasonal
Spatial
Seasonal
2.100152
1.240053
11.13435
5.396285
0.459957
3.617377
0.209714
1.25941 1
5.56936
19.37355
0.411902
2.006382
6.139679
36.4186
3.023247
7.259073
10.12796
9.276619
3.862539
3.862539
10.12796
9.276619
5.143249
4.757055
5.143249
4.757055
5.143249
4.757055
10.12796
9.276619
10.12796
9.276619
Determination of total cyanides
The dynamic range of the calibration curve obtained by a series of aqueous standards of cyanides was linear up to 30 pg L-'. The regression equation was:
A = 0.033 + 0.0687[tot CN-]
and the correlation coefficient was r = 0.9996. Recovery tests were med on six samples of double distilled water, which were
spiked with cyanide at final concentration 10 pg L-I. The mean recovery was found to be 94 %, and the detection limit (3s criterion) was 0.2 pg L-'. The repeatability was good (s, = 6.5 %) and the reproducibility between days was less than 8 %.
In Table HI, the seasonal means in each site, the overall biannual means, and the relative standard deviation for cyanides, were also calculated as described in the case of phenols. The calculation for the seasonal means in each site showed that in river Aliakmon lower concentrations were observed in comparison to its tributaries: Tripotamos, Koutikas, Arapitsa and Edeseos.
Downloaded By: [HEAL-Link Consortium] At: 09:06 19 October 2008

362 MICHAEL K. SOFONIOU et al.
TABLE III Seasonal (3 months x 2 years) and overall (24 months) mean values of cyanides (pg L-') in sampling stations
code
1
2
3
4
5
6
7
8
9
10
11
12
13
14
15
16
17
18
20
21
22
23
24
25
BA
BD
DO1
KA
KD
Name /Type
Ditch 66 I Stream
Ditch 66 I Stream
Aliakmon I River
Aliakmon I River
Aliakmon I River
Aliakmon I River
Tripotamos I River
Koutikas I River
Arapitsa I River
Fdeseos I River
Soulou I seeam
Soulou I stream
Sakolevas I River
Axios I River
Axios I River
Axios I River
Gallikos I River
Gallikos I River
Loudias I River
Loudias I River
Loudias I River
Strymon I River
Strymon I River
Strymon I River
Volvi I Lake
Volvi I Lake
Doirani I Lake
Koronia I Lake
Koronia I Lake
Seasonal mean Overall
Winter Spring Summer
2.7 3.1 2.9
4.2 9.3 7.0
1.1 2.4 1.1
2.6 0.9 1.9
3.2 1.3 3.4
2.0 3.0 3.9
2.7 5.1 5.3
2.0 5.8 3.2
3.4 2.9 4.5
4.0 10.9 5 .O
13.8 21.7 16.5
31.4 26.7 23.1
1.8 4.9 3.6
5.9 4.4 2.2
1.7 1.5 2.4
1.3 1.4 2.4
4.9 8.5 -
1.3 3.1 1.9
4.2 3.6 3.6
4.4 3.8 2.8
5.1 4.0 5.9
1.6 1.1 0.8
1.4 3.8 1.8
3.5 4.9 2.4
1 .o 0.9 1 .o 0.7 1.1 0.8
1.2 0.8 1 .o 1.3 10.2 1.6
0.5 1.1 1.5
Autumn
3.4
5.0
1.3
1.4
2.8
2.4
10.8
6.7
5.2
5.5
8.8
11.1
3.1
6.5
3.1
1.7
5.4
1.6
6.1
5.4
4.5
0.7
6.7
6.4
1.9
1.8
1.4
1.2
2.3
Mean lOOs,
3.0 11.0
6.5 14.2
1.5 24.0
1.7 14.7
2.6 17.7
2.8 12.1
6.2 22.6
4.5 18.0
4.0 11.5
6.2 17.7
15.2 11.9
22.7 20.1
3.4 19.1
4.8 25.4
2.2 21.4
1.7 11.2
6.6 31.8
2.2 18.2
4.4 11.6
4.1 12.4
4.8 13.8
1.0 17.0
3.4 22.4
4.3 12.8
1.2 18.3
1.2 16.7
1.1 17.3
4.7 74.0
1.3 19.2
Downloaded By: [HEAL-Link Consortium] At: 09:06 19 October 2008

SPECTROPHOMMETRIC DETERMINATION 363
These tributaries as well as Ditch 66 receive industrial wastewater's from neighboring medium sized industries. The group of Aliakmon sampling sites showed low concentrations near to the origins of the river (sampling sites 3 and 4). On the other hand, Soulou stream, which receives effluents from a large power station, was found to permanently contain higher concentrations of cya- nides ranging between 8 - 32 pg L-'. Rivers Axios, Loudias and Strymon had the same levels of cyanides (C 5 pg L-I) as well as the three lakes studied. The biannual relative standard deviation was high, ranging between 10 - 35 %. Con- centration levels for total cyanides between 0.5 - 3 pg L-'are considered as background levels.
The correlation analysis of the raw data, among the sampling sites of each spe- cific region, proved that all Pearson's correlation coefficients were not significant (r c 0.6).
TABLE IV Results of Analysis of variance for cyanides at a significance level of 95%
Aquaric system Source of Variation Fcxp Fcri, Resulr
Ditch 66 stream
Aliakmon river
Soulou stream
Axios river
Loudias river
Strymon river
Volvi lake
Koronia lake
Spatial
Seasonal
Spatial
Seasonal
Spatial
Seasonal
spatial
Seasonal
Spatial
Seasonal
Spatial
Seasonal
Spatial
Seasonal
spatial
Seasonal
9.17061
1.11472 1
2.516492
0.505525
5.552209
3.626352
6.978468
0.810181
0.603 126
1.432943
5.912339
2.530087
0.739726
16.36986
0.901715
0.871974
10.127%
9.276619
3.862539
3.862539
10.127%
9.2766 19
5.143249
4.757055
5.143249
4.757055
5.143249
4.757055
10.12796
9.276619
10.127%
9.276619
The results of two-way analysis of variance performed for each group of sam- pling sites are listed in Table IV. The experimental ratios of estimated variances
Downloaded By: [HEAL-Link Consortium] At: 09:06 19 October 2008

364 MICHAEL K. SOFONIOU er al.
(Fexp) were tested to critical values (Fcrit), for significance level 95 7%. The results listed in Table IV, showed that for rivers Axios and Strymon the local var- iations were significant, although the seasonal ones were not. For the majority of other rivers, streams and lakes no significant variation was observed. In addition, a rough estimation of the spatial variations was greater than the seasonal ones for each aquatic system.
CONCLUSIONS
The ASTM recommended spectrophotometric methods for determination of total phenols and cyanides were used, modified for lower samples volumes, with very good performance for river, stream and lake water samples. The level of total phenol concentration was low to medium (< 15 pg L-') in all sampling regions, with minor exceptions. These levels are common at non-polluted rivers and lakes. The effect of the season was greater than that of the site, along the rivers or lakes, although in the majority of the studied regions, this effect was not signifi- cant at 95 % probability. The level of cyanide concentration was relatively low (< 7 pg L-') in almost all sampling regions, with one exception, and the effect of the sampling site was greater than that of the season. The level of total cyanides were similar to these reported from not heavily polluted areas.
Acknowledgements This research is part of a national project which is financially supported by the Greek Ministry of the Environment.
References [l] J.W. Moore and S . Ramamoorthy, O ~ u n i c Chemicals in Narural Waters (Springer-Verlag,
New York, 1984) pp. 141 - 167. [2] A. Waggot and A.B. Wheatland, Proceedings of the 2" International Symposium on Aquatic
Pollutants, Amsterdam, The Netherlands. September (1977). [3] EN. Kemmer, The Nalco Wuter Handbook (McGraw-Hill, New York, 1988) 2" ed pp. 22.13-
22.14. [4] P. Doudoroff, Toxicify to fish of cyanides and related compounds, A review @PA 600/3-76-
038, USEPA, Duluth, Minnesota, 1976). [5] P. Doudoroff, G. Leduc and C.R. Schneider, 7 ' h . s . Amer: Fish. SOC, 95, 116-121 (1966). [6] Directives: 76/160,76/464, European Union. [7] A. Yasuhara, H. Shiraishi, M. Tsujl and T. Okuno, Environ. Sci. Technol, 15,570-573 (1981). [8] G. Jungclaus, V. Lopez-Avilla and R. Hites, Environ. Sci. Technol, 12.88-96 (1978). [9] USEPA (1984). United States Environmental Protection Agency, Method 604, Federal Regis-
ter, October 26 1984, Phenols, Part WI, 40 CFR, pp. 58. [lo] Directive W 7 8 , European Union. [ll] J.W. Williams, Handbook ofAnion Determinution. (Butterworths, London 1979) pp. 70 - 85. [12] J. Besombes, S. Cosnier, P. Labbe and G. Reverdy, Anal. Chim Acra, 311,255-263 (1995). [13] M.T. Galceran and 0. Jauregui. Anal. Chim Acra, 304,75-84 (1995).
Downloaded By: [HEAL-Link Consortium] At: 09:06 19 October 2008

SPECTROPHOTOMETRIC DETERMINATION 365
[14] A.V. Lopez-Gomez and J. Martinez-Calatayud, Analyst, 123,2103-2104 (1998). [15] E. Miralles, D. Prat, R. Compaiio and M. Granados, Analyst, 123,217-220 (1998). [16] K. Sumiyoshi, T. Yagi and H. Nakamura, J. Chromarogr., 690.77432 (1995). [17] K. Stein and JU. Hain, Mikmchim Acta, 118.93-101 (1995). [18] J. Slobodnik, A.J.H. Louter, J.J. Vreuls, 1. Liskaand U.A.Th. Brinkman,./. Chromarogr: A, 768,
239-218 (1997). [19] 0. Jauregui and M.T. Galceran, Anal. Chim Acra, 340, 191-199 (1997). [20] S. Angelino and M.C. Gennano, Anal. Chim. Acta, 346,61-71 (1997). [21] Y. Wu and S. Huang, J. Chromatogr: A, 835, 127-135 (1999). [22] E. Burestedt, J. Emneus, L. Gorton, G. Markovarga, E. Dominguez, F. Ortega, A. Varvaez, H.
Irth, M. Lutz, D. Puig and D. Barcelo, Chromatographin, 41,207-215 (1995). 1231 S. Dupeyron, M. Astruc and M. Marbach, Analusis, 23,474476 (1995). 1241 American Society for Testing and Materials (ASTM), Annual Book of ASTM Standards, 11.02
Water (n); Designation D 1783-91. Standard Test Methods for Phenols (1992). [25] American Public Health Association Standard Methods for the Examination of Waters and
Wastewaters, Phenols, Cyanide, (APHA, Washington, USA 1985) 16* ed pp. 5-36 to 5-39. [26] American Society for Testing and Materials (ASTM), Annual Book of ASTM Standards, 11.02
Water (11); Designation D 203691. Standard Test Methods for Cyanides in Water (1992). [27] D.L. Massart, A. Dijkstra and L. Kaufman, Evaluation and Optimization ofLaborarory Merh-
ods andAnalytica1 Procedures, (Elsevier, Amsterdam 1978) pp. 118 - 125.
Downloaded By: [HEAL-Link Consortium] At: 09:06 19 October 2008