Embed Size (px)
Citation preview

This article was downloaded by: [University of Saskatchewan Library]On: 09 May 2012, At: 10:26Publisher: Taylor & FrancisInforma Ltd Registered in England and Wales Registered Number: 1072954 Registeredoffice: Mortimer House, 37-41 Mortimer Street, London W1T 3JH, UK
International Reviews in PhysicalChemistryPublication details, including instructions for authors andsubscription information:http://www.tandfonline.com/loi/trpc20
Spectroscopy and dynamics of hydrideradical van der Waals complexesMichael C. Heaven aa Department of Chemistry, Emory University, Atlanta, GA 30322,USA
Available online: 22 Feb 2007
To cite this article: Michael C. Heaven (2005): Spectroscopy and dynamics of hydride radical vander Waals complexes, International Reviews in Physical Chemistry, 24:3-4, 375-420
To link to this article: http://dx.doi.org/10.1080/01442350500353092
PLEASE SCROLL DOWN FOR ARTICLE
Full terms and conditions of use: http://www.tandfonline.com/page/terms-and-conditions
This article may be used for research, teaching, and private study purposes. Anysubstantial or systematic reproduction, redistribution, reselling, loan, sub-licensing,systematic supply, or distribution in any form to anyone is expressly forbidden.
The publisher does not give any warranty express or implied or make any representationthat the contents will be complete or accurate or up to date. The accuracy of anyinstructions, formulae, and drug doses should be independently verified with primarysources. The publisher shall not be liable for any loss, actions, claims, proceedings,demand, or costs or damages whatsoever or howsoever caused arising directly orindirectly in connection with or arising out of the use of this material.

International Reviews in Physical Chemistry,Vol. 24, Nos. 3–4, July–December 2005, 375–420
Spectroscopy and dynamics of hydride radical
van der Waals complexes
MICHAEL C. HEAVEN*
Department of Chemistry, Emory University, Atlanta, GA 30322, USA
(Received 16 August 2005; in final form 13 September 2005)
Spectroscopic and theoretical studies of hydride radical–rare gas atom complexes (Rg–HX)are reviewed. This family of van der Waals molecules is of interest as they can be used toexplore the characteristics of the long-range forces associated with open-shell species. Orbitallydegenerate states of HX radicals have an electronic anisotropy that results in van der Waalsinteractions that are qualitatively different from those exhibited by the corresponding closed-shell systems. Rg–HX complexes, where X is a first- or second-row p-block element, revealsystematic trends where the anisotropic components of the physical interactions aredetermined by the electronic orbital configuration. Radicals in �, � and � states with singlet,doublet and triplet spin multiplicities have been examined. When Rg¼He, Ne or Ar theinteraction potential energy surfaces can be predicted using high-level ab initio methods.Theoretical studies have established the methods and basis sets that are capable of providingan accurate description of the long-range forces for open-shell molecules. Clusters consistingof an HX molecule with multiple rare gas atoms are model systems for studies of solvatedradicals. Potential energy surfaces derived from the binary clusters are being used to constructapproximate potentials for Rgn–HX clusters. The equilibrium structures and vibrationaldynamics predicted for these systems show that solvated radicals exhibit unique properties.
Contents PAGE
1. Introduction 376
2. Experimental methods 377
3. Theoretical considerations 378
4. Binary complexes 3844.1. BH–Ar and AlH–Ar 3844.2. CH–Rg complexes (Rg¼He, Ne and Ar) 3864.3. NH–Rg complexes (Rg¼He, Ne and Ar) 3974.4. OH–Rg and SH–Rg complexes 407
*Email: [email protected]
International Reviews in Physical Chemistry
ISSN 0144–235X print/ISSN 1366–591X online � 2005 Taylor & Francis
http://www.tandf.co.uk/journals
DOI: 10.1080/01442350500353092
Dow
nloa
ded
by [
Uni
vers
ity o
f Sa
skat
chew
an L
ibra
ry]
at 1
0:26
09
May
201
2

5. Complexes of HX radicals with multiple Rg atoms 413
6. Conclusions and future directions 417
Acknowledgements 418
References 418
1. Introduction
The long-range interactions between a radical and a closed-shell molecule or atomare of interest from a number of perspectives. If the interaction leads to a chemicalreaction, the long-range forces can influence the approach of the reactants to thetransition state and the energy partitioning as the products depart. The ClþHDreaction provides a dramatic example of the influence that the attractive van derWaals forces can exert on reaction dynamics. Skouteris et al. [1] have shown thatthe propensity to form DCl at near-threshold collision energies cannot be correctlymodelled without considering the van der Waals region of the potential energy surfaces.The outcome of an inelastic collision will also be determined by the details of theintermolecular forces. Due to the coupling of electronic and nuclear degrees of freedomin these events, collisional energy transfer involving open-shell molecules is a richerand more complex phenomenon than the closed-shell equivalent [2–7]. The key tounderstanding reactive and inelastic collision dynamics is knowledge of the interactionpotentials. Consequently, a great deal of experimental and theoretical effort hasbeen directed towards the determination of potential energy surfaces for prototypicalcollision pairs. Investigations of the interactions between diatomic radicals and raregas atoms have proved to be particularly fruitful as these systems are both experi-mentally convenient and theoretically tractable. From the experimental side, there aretwo complementary methods used to probe potential energy surfaces. These are stateresolved measurements of inelastic collision dynamics and spectroscopic studies ofvan der Waals molecules. The present review is focused on the latter, and is furtherrestricted to the topic of diatomic hydride radicals (HX) interacting with rare gasatoms (Rg). This family of complexes provides valuable insights concerning thecharacteristic properties of long-range forces associated with open-shell molecules.Although these are not reactive systems, the rare gas atoms act as useful probes of theway in which a particular radical responds in physical interactions (e.g. the influenceof polarizability, dispersion interactions, exchange repulsion, etc.). For example, studiesof CH(X )þHe interactions have provided a framework for understanding the long-range component of CH(X )þH2 collisions [7, 8]. Theoretical potential energy surfacesfor Rg–HX pairs can be calculated using high-level ab initio electronic structuremethods. The techniques used to compute accurate long-range potentials for open-shellsystems are being thoroughly examined and refined through the studies of Rg–HXcomplexes. Additional interest in HeþHX interactions has been stimulated by tworecent developments. The first is the work on the spectroscopy and dynamics ofmolecules and atoms trapped in large He droplets [9–11]. HX radicals are an excellentchoice for studies of pre-reactive complexes and low-temperature reaction dynamics
376 M. C. Heaven
Dow
nloa
ded
by [
Uni
vers
ity o
f Sa
skat
chew
an L
ibra
ry]
at 1
0:26
09
May
201
2

in this medium. Secondly, it has been recognized that HX radicals may be cooled toultra-low temperatures using magneto-optical traps [12]. One scheme for trap loadinginvolves 3He buffer gas cooling [13]. The applicability of this approach is criticallydependent on the details of the He–HX potential energy surfaces [14, 15].
Studies of HX radicals clustered with multiple rare gas atoms are also consideredin this review. These clusters are models systems for solvated radicals and knowledgeof their properties facilitates the interpretation of the spectroscopy and dynamicalbehaviour of HX radicals trapped in rare gas solids. Once the potential energy surfacesfor a Rg–HX pair are known, data for clusters that contain multiple rare gas atomscan be used to examine the many-body forces that contribute to the potential energyof the composite system. This progression has been demonstrated in an elegant seriesof experimental and theoretical studies for closed-shell Arn–HF clusters [16–21]. Theissue of non-additive forces for open-shell complexes has yet to be addressed in sucha detailed and systematic fashion. There are interesting subtleties for the open-shellRgn–HX complexes that are unique. For example, Xu et al. [22] have drawn attentionto the fact that even the basic sum of pair-potentials model is non-additive if theradical is in an orbitally degenerate electronic state.
Recent reviews concerning open-shell complexes include the work by Kim and Meyeron Rg–NO [23], Wheeler et al. on OH–H2 [24] and Carter et al. [25] on Rg–HXcomplexes with Rg¼Ne, Ar, and Kr and X¼O or S. The electronic structuremethods used to calculate the properties of open-shell complexes have been reviewedby Chalasinski et al. [8, 26] The present review is mostly concerned with recent progresson the Rg–HX complexes, but the results have been organized to illustrate periodictrends. Hence a discussion of earlier work is included where relevant. The organizationof this review is as follows. The next two sections present brief summaries of thetechniques used to observe Rg–HX complexes, the models used to analyse the spectra,and the methods for refining potential energy surfaces through direct fitting to spectro-scopic data. The results for binary Rg–HX are presented in section 4. These havebeen organized in order of the periodic group for X. Within each subgroup the orderof the discussion is somewhat chronological, often starting with the Ar complexesas these are generally the most heavily studied. Section 5 describes work on the clusterswith multiple rare gas atoms. Although there is very little experimental data for thistopic, the intriguing dynamical behaviour predicted by large-scale theoretical calcula-tions is of interest in its own right, and should stimulate further experimental studiesof these clusters.
2. Experimental methods
Rg–HX complexes are generated in low-temperature supersonic expansions [27]. Theradicals are obtained using photolysis or electric discharge dissociation of a stableprecursor molecule (e.g. OH from photolysis of HO–NO2 or discharge fragmentationof H2O [28, 29]). In most instances the radical fragments are created in the highgas density region of the expansion, and they cool and form complexes as theexpansion evolves. However, Mackenzie et al. [30, 31] have observed SH–Ar whenSH2–Arn�2 complexes were photodissociated under near collision-free conditions.Relatively low number densities of complexes are formed by these methods,
Hydride radical van der Waals complexes 377
Dow
nloa
ded
by [
Uni
vers
ity o
f Sa
skat
chew
an L
ibra
ry]
at 1
0:26
09
May
201
2
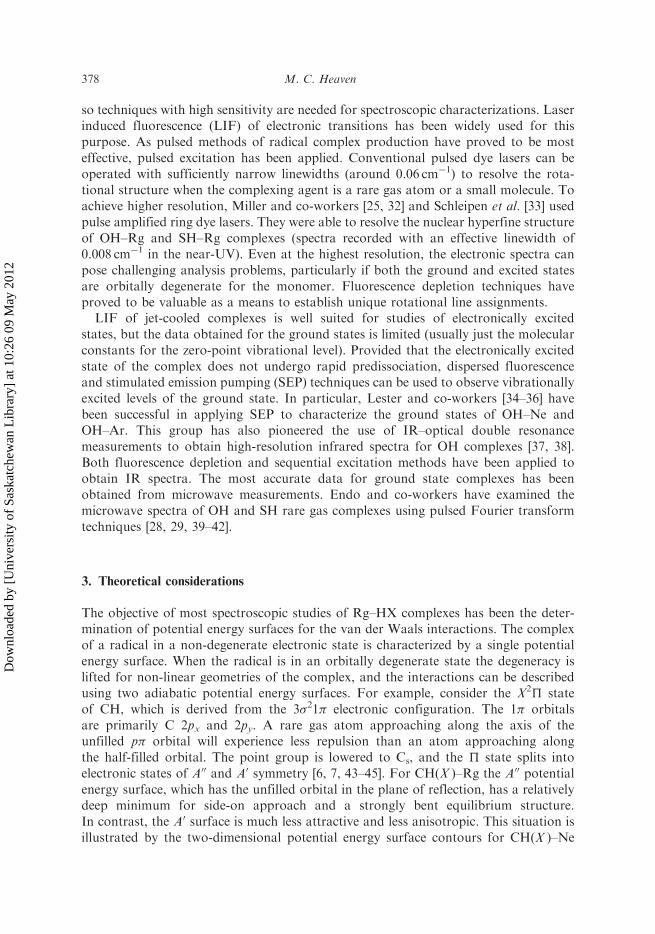
so techniques with high sensitivity are needed for spectroscopic characterizations. Laserinduced fluorescence (LIF) of electronic transitions has been widely used for thispurpose. As pulsed methods of radical complex production have proved to be mosteffective, pulsed excitation has been applied. Conventional pulsed dye lasers can beoperated with sufficiently narrow linewidths (around 0.06 cm�1) to resolve the rota-tional structure when the complexing agent is a rare gas atom or a small molecule. Toachieve higher resolution, Miller and co-workers [25, 32] and Schleipen et al. [33] usedpulse amplified ring dye lasers. They were able to resolve the nuclear hyperfine structureof OH–Rg and SH–Rg complexes (spectra recorded with an effective linewidth of0.008 cm�1 in the near-UV). Even at the highest resolution, the electronic spectra canpose challenging analysis problems, particularly if both the ground and excited statesare orbitally degenerate for the monomer. Fluorescence depletion techniques haveproved to be valuable as a means to establish unique rotational line assignments.
LIF of jet-cooled complexes is well suited for studies of electronically excitedstates, but the data obtained for the ground states is limited (usually just the molecularconstants for the zero-point vibrational level). Provided that the electronically excitedstate of the complex does not undergo rapid predissociation, dispersed fluorescenceand stimulated emission pumping (SEP) techniques can be used to observe vibrationallyexcited levels of the ground state. In particular, Lester and co-workers [34–36] havebeen successful in applying SEP to characterize the ground states of OH–Ne andOH–Ar. This group has also pioneered the use of IR–optical double resonancemeasurements to obtain high-resolution infrared spectra for OH complexes [37, 38].Both fluorescence depletion and sequential excitation methods have been applied toobtain IR spectra. The most accurate data for ground state complexes has beenobtained from microwave measurements. Endo and co-workers have examined themicrowave spectra of OH and SH rare gas complexes using pulsed Fourier transformtechniques [28, 29, 39–42].
3. Theoretical considerations
The objective of most spectroscopic studies of Rg–HX complexes has been the deter-mination of potential energy surfaces for the van der Waals interactions. The complexof a radical in a non-degenerate electronic state is characterized by a single potentialenergy surface. When the radical is in an orbitally degenerate state the degeneracy islifted for non-linear geometries of the complex, and the interactions can be describedusing two adiabatic potential energy surfaces. For example, consider the X2� stateof CH, which is derived from the 3�21� electronic configuration. The 1� orbitalsare primarily C 2px and 2py. A rare gas atom approaching along the axis of theunfilled p� orbital will experience less repulsion than an atom approaching alongthe half-filled orbital. The point group is lowered to Cs, and the � state splits intoelectronic states of A00 and A0 symmetry [6, 7, 43–45]. For CH(X )–Rg the A00 potentialenergy surface, which has the unfilled orbital in the plane of reflection, has a relativelydeep minimum for side-on approach and a strongly bent equilibrium structure.In contrast, the A0 surface is much less attractive and less anisotropic. This situation isillustrated by the two-dimensional potential energy surface contours for CH(X )–Ne
378 M. C. Heaven
Dow
nloa
ded
by [
Uni
vers
ity o
f Sa
skat
chew
an L
ibra
ry]
at 1
0:26
09
May
201
2

shown in figure 1. For these plots, and throughout the following discussion of Rg–HXcomplexes, Jacobi coordinates have been employed. These are defined by r, theH–X distance, R, the distance between Rg and the HX centre of mass, and,� the angle between r and R. The linear complex with Rg bound to the H atom sideof the diatom corresponds to � ¼ 0�.
As discussed in the following sections, the p� orbital occupation exerts a stronginfluence on the equilibrium structures of Rg–HX complexes. Electronic structurecalculations indicate that this is primarily an exchange repulsion effect for Rg¼He
R/a
uR
/au
q/degrees
Figure 1. Contour plots of the ab initio potential energy surfaces for CH(X 2�)–Ne. The energies of selectedcontours are indicated in cm�1 units, relative to the CH(X 2�)þNe dissociation asymptote. The upper andlower traces correspond to states of A00 and A0 reflection symmetry, respectively. The contour lines forthe A00 surface are drawn at 5 cm�1 intervals, while those for the A0 surface are spaced by 2 cm�1.
Hydride radical van der Waals complexes 379
Dow
nloa
ded
by [
Uni
vers
ity o
f Sa
skat
chew
an L
ibra
ry]
at 1
0:26
09
May
201
2

through Kr. When an empty p� orbital is available, potential energy surfaces thatare qualitatively similar to those of figure 1 are encountered. Configurations withtwo or more electrons in the p� orbitals usually produce surfaces with linear minima.The typical form for surfaces of this type is illustrated in figure 2 by the contourdiagrams for the A2� state of CH–Ne, which is derived from the 3�1�2 configuration.
Spectroscopic data for triatomic complexes cannot be inverted to determine thepotential energy surfaces. While the RKR inversion procedure provides a direct pathfrom the spectroscopic constants to the potential energy curve for a diatomic molecule,there is no equivalent transformation for a polyatomic system. Instead, model surfacesare tested and refined through forward convolution. There is a close interplay betweentheory and experiment here, as the guidance provided by theoretical calculations isoften needed to achieve a satisfactory analysis of the spectrum. There are a numberof useful approximations that simplify the task of calculating the properties of Rg–HXsystems. First is the decoupling of H–X vibrational motion from the soft van der Waalsmotions. As the HX vibrational frequencies are much greater than the frequenciesof the van der Waals bending and stretching modes, it is reasonable to consider two-dimensional Rg–HX potential energy surfaces with the H–X distance frozen at thevibrationally averaged value. The Hamiltonian for Rg–HX complexes can then bewritten as [46–49]
H ¼ Tþ Vþ h ð1Þ
where T is the intermolecular nuclear kinetic, V is the interaction potential energysurface (or surfaces) and h is the Hamiltonian operator for the diatom. The kineticenergy operator consists of two parts: the radial stretch and the end-over-end rotation,
T ¼ �@2
2�@R2þ
J� j� �22�R2
ð2Þ
(in atomic units) where � is the reduced mass of the complex, J is the total angularmomentum of the complex and j is the angular momentum of the diatom. Once thevibrational motion of H–X has been factored out, it is possible to work with just theroto-electronic part of h using vibrationally averaged values for the molecularconstants. To a first approximation the reduced form of h can then be written as
h ¼ aSO L � sþ b j� L � s� �2
ð3Þ
where L is the electronic angular momentum operator, s is the spin operator, aSO isthe spin–orbit coupling constant and b is the diatomic rotational constant. Thebound energy levels for a given potential energy surface (or pair of surfaces) can befound by variational calculations or solution of the close coupling equationsusing a suitable set of basis functions. For the complexes considered here, modelcalculations show that the diatom is not strongly perturbed by the interaction with
380 M. C. Heaven
Dow
nloa
ded
by [
Uni
vers
ity o
f Sa
skat
chew
an L
ibra
ry]
at 1
0:26
09
May
201
2

the Rg partner. Consequently, the diatomic quantum numbers provide useful statelabels for the complex. Following the convention of Dubernet et al. [46] and others,the properties of the HX radical are designated using lower case quantum labels, whileupper case labels are given for states of the entire complex. The most useful quantumlabels are collected and defined in table 1.
High-level ab initio calculations are used to obtain the first estimates for the potentialenergy surfaces. Two-dimensional potentials are generated for a grid of �i and Ri values.The grids may be evenly spaced or distributed over quadrature points. Note that
R/a
u
q/degrees
R/a
u
Figure 2. Contour plots of the ab initio potential energy surfaces for CH(A2�)–Ne. The energies of selectedcontours are indicated in cm�1 units, relative to the CH(A2�)þNe dissociation asymptote. The contourlines are drawn at 5 cm�1 intervals. The upper and lower traces correspond to states of A0 and A00 reflectionsymmetry, respectively.
Hydride radical van der Waals complexes 381
Dow
nloa
ded
by [
Uni
vers
ity o
f Sa
skat
chew
an L
ibra
ry]
at 1
0:26
09
May
201
2

ab initio calculations for orbitally degenerate states yield the adiabatic A0 and A00
potential energy surfaces described above. This is not the best representation for most
dynamical calculations. As discussed by Alexander [4], it is more convenient to express
the potential energy surfaces in terms of the diabatic average Vave ¼ VA0 þ VA00ð Þ=2and difference Vdiff ¼ �1ð Þ
l VA0 � VA00ð Þ=2 potentials. For the difference potential,
l¼ 1, 2, 3, . . . indicates the spatial symmetry of the diatomic electronic state, �, �, �,
etc. Spline fits, interpolations, or quadrature techniques may then be used in calcu-
lating matrix elements of the potential energy surfaces. Numerical solutions of the
Hamiltonian given by equation (1) may be simplified by expanding the potential
energy surfaces in terms of Legendre polynomials. This permits the use of analytical
expressions for the angular components of the potential energy matrix elements. The
average and difference potentials are represented by the expressions [46–48]
Vave R, �ð Þ ¼Xlmax
l¼0
Vl0 Rð ÞPl0 cos �ð Þ ð4Þ
and
Vdiff R, �ð Þ ¼Xlmax
l�m
Vlm Rð ÞPlm cos �ð Þ ð5Þ
where Vl0(R) and Vlm(R) are radially dependent expansion coefficients, Pl0 are the
regular Legendre polynomials and Plm are the associated Legendre polynomials with
m ¼ 2l.
Table 1. Definitions of quantum number labels for open-shell triatomic complexes.
Quantumnumber Description
Definitions for the diatoma
� H–X vibration.l projection of electronic orbital angular momentum along the diatomic axis.s spin angular momentum.� projection of s on the diatomic axis.r rotational angular momentum.b
n sum of orbital and rotational angular momentum (rþ k).j total angular momentum of diatom.! projection of j on the diatomic axis (rþ k).
Definitions for the complexa
�c Rg–HX stretching vibration.L end-over-end rotational angular momentum of the complex.N sum of orbital and rotational angular momentum (Lþ n).K projection of n on the body-fixed axis.c
P projection of j on the body-fixed axis.c
J total angular momentum.
aBoldface type is used to designate vector quantities.br is used for both the rotational angular momentum and the Jacobi coordinate. Theappropriate definition is apparent from the context of use.cFor large anisotropies the projection of the angular momentum along R remainsreasonably well defined, but n or j are no longer useful quantum numbers.
382 M. C. Heaven
Dow
nloa
ded
by [
Uni
vers
ity o
f Sa
skat
chew
an L
ibra
ry]
at 1
0:26
09
May
201
2
If all of the terms in the Hamiltonian defined by equation (1) are retained, largematrices are required to obtain converged energy levels. Eliminating the off-diagonal
elements that arise from the ðJ� j Þ2 term of equation (2) can considerably reduce the
size of the matrices [47]. This is most easily seen by considering the calculation withbody-fixed basis functions, where the projection of the diatomic angular momentum
on the R-axis is given by P or K (see table 1). The J � j part of this operator mixesbasis states with different values of P or K (this is often referred to as a Coriolis
interaction) [50]. Provided that the interacting pair of P or K states are not too close
in energy, the interaction is weak and may be neglected by eliminating the off-diagonalmatrix elements of J � j (centrifugal decoupling (CD) approximation).
So far we have simplified the eigenvalue problem by uncoupling the diatomic
vibrational motion and eliminating the Coriolis term. Uncoupling of the radial andangular motions also proves to be a relatively good approximation in many instances.
This is accomplished by constructing ‘adiabatic bender’ potentials [47]. Single-point
energies are generated by diagonalizing the Hamiltonian matrix with the radialcoordinate frozen. Calculations repeated at a series of R-values define one-dimensional
potentials that are suitably averaged over the angular motions. Energy levels for the
complex are then found by solution of the radial Hamiltonian for each adiabatic benderpotential. Apart from their utility in low-cost exploratory calculations, the adiabatic
bender potentials are of value as they often yield physical insights concerning the
energy level structure of the complex. Dubernet et al. [46] took this process a stepfurther by considering the solutions of equation (1) with both r and R frozen. Effective
one-dimensional angular potentials were examined and a series of correlation diagramswere developed for the bending/internal rotation energy levels for complexes in 2�, 1�,2� and 3� states. The evolution of the energy levels was followed as a function of
the ratio V20/b, where b is the diatomic rotational constant. The effect of breakingthe symmetry of the anisotropy by including a V10 term was also explored. Dubernet
et al.’s [46] correlation diagrams provide insights that have greatly facilitated the
understanding and interpretation of the bending energy level structures. Anothervaluable component of this study was a formal discussion of angular momentum
coupling in open-shell complexes. Dubernet et al. [46] defined limiting coupling cases
labelled A, B and C that are analogous to Hund’s coupling cases a, b and c for linearmolecules.
Manageably sized ab initio calculations are not presently capable of producing
van der Waals potential energy surfaces that can accurately reproduce spectroscopicdata. Hence, the theoretical potential energy surfaces need to be adjusted in order
to obtain quantitative agreement between the observed and calculated energy level
patterns. To facilitate this process, analytical representations of the surfaces aregenerated. There are several options for the method used to fit potential energy
surfaces. For some of the earliest studies of OH–Rg complexes, a flexible potential
energy function was developed by Bowman et al. [51, 52]. This was defined bygeneralized Morse function fits to radial cuts through the potential at �¼ 0, 90 and
180�. Angle-dependent switching functions were used to construct the entire surfacefrom these cuts. The approach favoured by Alexander, Dagdigian and co-workers
[44, 47, 53–55] involves fitting fixed angle (�i) slices through the potential to obtain
unique sets of radial parameters for each cut. Hutson [56] has defined potentials
Hydride radical van der Waals complexes 383
Dow
nloa
ded
by [
Uni
vers
ity o
f Sa
skat
chew
an L
ibra
ry]
at 1
0:26
09
May
201
2

where the parameters of the radial functions are expanded in terms of low-orderpolynomials of the angle �. Alternatively, fixed radius angular cuts through the surfacecan be fitted to associated Legendre polynomial expansions to obtain values of Vl0ðRiÞ
and VlmðRiÞ for the i-th radial distance. These pointwise potentials are then fittedto standard expressions such as Morse or generalized Morse functions [57, 58].
Ab initio calculations for Rg–HX complexes typically underestimate the bindingenergy and overestimate the Rg–HX equilibrium bond length. Apart from thesedefects, the qualitative shape of the surface is usually correct. The theoretical potentialscan be significantly improved by scaling (to adjust the bond energy) and translationalong the R-coordinate (to adjust the rotational constants). Several schemes have beendevised that permit systematic scaling and translation of a reference potential energysurface [40, 41, 44, 47, 59, 60].
4. Binary complexes
4.1. BH–Ar and AlH–Ar
LIF spectra for the A1�–X1�þ transition of BH–Ar were reported by Hwang et al. [61].The radical was produced by 193 nm photolysis of diborane. Twelve sharp bandsof BH–Ar were found in association with the monomer 0–0 band. The origin bandwas red-shifted from the monomer parent line by 84 cm�1, which defines the differencein the binding energies D0
0 �D000. Diffuse bands were seen at energies more than
92 cm�1 above the origin. Rotational analyses were carried out for 10 of the sharpbands. Assignment of the vibronic structure was guided by the theoretical calculationsof Alexander et al. [47]. Ab initio potential energy surfaces were calculated using amulti-reference configuration interaction method (MR–CI(D)) with a quadruple zeta
quality basis set (avqz-f ). The full counterpoise (CP) correction was applied. Thepotential energy surfaces yielded bent equilibrium structures for the ground andexcited states (the equilibrium coordinates and well depths are listed in table 2). Thiswas consistent with the fact that the ground and excited states are derived from the3�2 and 3�1� configurations, so that approach of the Ar atom along the axis of anunfilled p� orbital is possible for both states. The pronounced differences in the VA0 andVA00 potential energy surfaces of BH(A)–Ar are evident from the stationary point datapresented in table 2. Bound state calculations showed that the ab initio surfaces weretoo shallow, with Re values that were too large [47]. For example, the calcu-lated properties of BH(X )–Ar were D0¼ 29 and B0¼ 0.103 cm�1, as compared to theobserved values of D0¼ 92 and B0¼ 0.133 cm�1. Scaling of the ground state potentialby a factor of approximately 1.6 and inward translation along R by 0.5 au improvedthe predicted ground state properties (D0¼ 69 and B0¼ 0.123 cm�1), but it was evidentthat larger changes in the potential would be needed to achieve quantitative agree-ment with the experimental results. Moderate adjustment of the A state potentialsproduced much better agreement with the spectroscopic data. Scaling by a factor ofapproximately 1.6 and inward shifting by about 0.3 au yielded predicted constants ofD0¼ 174 and B0¼ 0.164 cm�1, as compared to the measured values of D0¼ 176 andB0¼ 0.167 cm�1.
384 M. C. Heaven
Dow
nloa
ded
by [
Uni
vers
ity o
f Sa
skat
chew
an L
ibra
ry]
at 1
0:26
09
May
201
2

The bending/internal rotation energy level structure of BH(A)–Ar is of particularinterest. This structure is most easily understood by examining the correlation diagramsof Dubernet et al. [46] and the adiabatic bender potentials. Alexander et al. [47] haveshown that the adiabatic bender model is a very good approximation for BH(A)–Ar.Their curves for the modified potential energy surfaces are shown in figure 3. All ofthe rotationally resolved bands were attributed to upper levels that correlated with theBH(A1�, j¼ 1)þAr dissociation asymptote. The interaction with the Ar atom split thej¼ 1 level of the diatom into states with P0 ¼ 0�, 1l, 1u, and 0þ (in ascending energyorder). Here, and in the following sections, the subscripts l and u are used to distinguishthe lower and upper energy components of the two states for a given j parent statethat have the same value for P. This convention is not applied to the P¼ 0 statesas they are differentiated by their symmetry properties (given as the þ/� superscript).The transition from the zero-point level of BH(X )–Ar (P¼ 0þ) to the lowest energylevel of BH(A)–Ar (P¼ 0–) was not observed as it is electric-dipole forbidden.Transitions to the P¼ 1l, 1u and 0þ states were identified in the spectrum. Note that the1l curve in figure 3 is much deeper than the 1u and 0þ curves, and that the Re value for 1lis smaller. These trends were clearly reflected by the molecular constants observed forthese states. Alexander et al. [47] were able to show that the P¼ 0� and 1l statesbehaved as if they belonged to the deeply bound VA00 potential energy surface, while theweakly bound P0 ¼ 1u and 0þ states were associated with correlated motions on bothVA0 and VA00.
Dagdigian, Alexander and co-workers [55, 62] also characterized the AlH–Arcomplex via the 0–0 band of the A1�–X1�þ transition. For the experimental studyAlH was generated by multiphoton dissociation of trimethylaluminum at 193 nm.Rotationally resolved spectra were recorded for 14 bands that exhibited sharp lines.
Table 2. Stationary point data for BH–Ar and AlH–Ar complexes.
Surface De/cm�1 �e Re/au Reference
BH(X1�)–ArV, ab initio 125 74.0 6.70 [47]V, modified 198 74.5 6.22 [47]
BH(A1�)–ArVA0, ab initio 85 0.0 8.02 [47]VA0, ab initio 69 125.0 7.98 [47]VA00, ab initio 183 89.5 6.22 [47]VA0, modified 128 0.0 7.76 [47]VA0, modified 112 139.0 7.64 [47]VA00, modified 280 88.5 5.97 [47]
AlH(X1�)–ArV, ab initio 154.7 72.7 7.17 [55]V, modified 211.5 72.6 6.88 [55]
AlH(A1�)–ArVA0, ab initio 80.4 0.0 9.25 [55]VA0, ab initio 76.7 150.9 8.51 [55]VA00, ab initio 198.2 80.8 6.86 [55]VA0, modified 130 0.0 8.90 [55]VA0, modified 125.4 152.5 8.19 [55]VA00, modified 321.2 80.5 6.54 [55]
Hydride radical van der Waals complexes 385
Dow
nloa
ded
by [
Uni
vers
ity o
f Sa
skat
chew
an L
ibra
ry]
at 1
0:26
09
May
201
2

Several diffuse bands were also reported. As expected, the properties of AlH–Ar werevery similar to those of BH–Ar. Ab initio potential energy surfaces for AlH(A, X )–Arwere calculated using the same level of theory that had been applied to BH–Ar(MR–CI(D)/avqz–fþCP). The resulting surfaces had the same qualitative featuresas those of BH–Ar, as can be seen from the stationary point data given in table 2,the primary difference being that the potential wells for AlH–Ar were deeper. Tomake bound state predictions that could be compared with the experimental data, theab initio potentials were modified by increasing the well depths (by a factor of 1.6)and translating inward by approximately 0.3 au. Close coupling calculations with themodified potentials gave results that were in good agreement with the spectroscopicobservations. The measured ground state constants of D0¼ 124 and B0¼ 0.0687 cm�1
were reproduced to within the experimental uncertainty. For the A state the calculatedconstants for P¼ 1l (D0¼ 234 and B0¼ 0.0794 cm�1) were close to the experimentalvalues (D0¼ 220 and B0¼ 0.0785 cm�1). Transitions from an excited level of theground state were observed in the AlH–Ar spectrum, which permitted furtherevaluation of the theoretical models. The lower excited level was assigned as P¼ 1l,j¼ 1, located approximately 7 cm�1 above the P¼ 0þ zero-point level. The theoreticalcalculations for both BH(A)–Ar and AlH(A)–Ar predicted that the lowest energystate would be P¼ 0�, but this could not be verified for BH(A)–Ar due to the opticalselection rules. The transition from P¼ 1l to P¼ 0� is allowed, and this was observedfor AlH–Ar. In accordance with theory, the P¼ 0� level was found below P¼ 1l. TheAlH–Ar spectrum also contained transitions from excited state levels that correlatedwith the j¼ 2 and 3 dissociation asymptotes. Overall, the theoretical calculationswere successful in reproducing the ro-vibronic structure of AlH–Ar.
4.2. CH–Rg complexes (Rg^He, Ne and Ar)
The spectroscopy and dynamics of the CH radical have been studied extensively. Muchof the interest has been driven by the importance of CH in combustion, atmospheric
R/au
7.5 8.55.5 6.5
Ene
rgy/
cm−1
Figure 3. Radial adiabatic bender curves for BH(A1�)–Ar calculated for the modified potential energysurface of Alexander et al. [47] for an effective angular momentum of L¼ 1. The P¼ 0, 1, and 2 potentialcurves associated with the monomer j¼ 1, 2, 3, and 4 levels are shown. This figure is reproduced withpermission from reference [47].
386 M. C. Heaven
Dow
nloa
ded
by [
Uni
vers
ity o
f Sa
skat
chew
an L
ibra
ry]
at 1
0:26
09
May
201
2
chemistry, and astrophysics. CH has also proved to be a very useful prototype forstudies of the inelastic collision dynamics of an open-shell molecule. A variety of
spectroscopic techniques can be used to detect CH in the X2�, A2� or B2�� states,
which facilitates comparisons of the dynamics for states with differing values forthe axial projection of the electronic orbital angular momentum. From a theoretical
perspective, the collisions of CH with rare gas atoms present the most tractablemodel systems [63–66]. To date, collisional energy transfer processes have been
characterized for CH(X )þHe [7], CH(X )þAr [67, 68], CH(A)þHe [69, 70], CH(A)þAr
[69–72], CH(B)þHe [69, 70] and CH(B)þAr [69, 70, 73]. Potential energy surfaceshave been calculated for most of these combinations, and all show van der Waals
minima at long-range.The CH(X )–He complex has not been observed, but the potential energy surfaces
for the CH(X )þHe interaction were calculated for use in quantum inelastic scattering
calculations. Wagner et al. [43] generated the VA0 and VA00 surfaces using CAS–SCF
calculations with the avtz basis set. The X2� state of CH is derived from the 3�21�electronic configuration, so the interactions with a rare gas atom were equivalent to
those described above for BH(A1�). Hence the VA00 surface exhibited a van der Waals
minimum for the bent geometry (with a well depth of about 30 cm�1), while the VA0
surface was more repulsive and less anisotropic. Wagner et al. [43] presented an
interesting discussion of model potentials for CH(X )þHe. They noted that the
traditional pair-potential model using nuclear centres alone could not represent thebreaking of the orbital degeneracy that occurs for non-linear approach geometries.
To incorporate this effect they proposed a model with three different terms forthe CþHe interaction to describe approach along the px, py and pz orbitals of the
C atom. This model successfully reproduced the main features of the ab initio potentials.
Inelastic scattering calculations using the ab initio surfaces correctly predicted theobserved propensities for population of levels of A00 and A0 symmetry in upward and
downward rotational energy transfer, respectively (for low values of j). The primary
focus of the study by Wagner et al. [43] was on characterization of the repulsiveregions of the CH(X )þHe potentials. Cybulski et al. [45] revisited this problem using
methods that were better suited to treatment of the long-range interactions. They used
the UMP4 method as this could be used to decompose the van der Waals forces in termsof various contributing interactions. The well-tempered basis sets of Hunzinaga,
augmented by f, d and mid-bond functions, were used. The qualitative propertiesof the surfaces of Cybulski et al. [45] were in agreement with the results of Wagner
et al. [43]. As expected, the larger and more flexible basis set yielded deeper wells.
The global minimum for the A00 surface was De¼ 73.5 cm�1. Stationary point datafor the potentials of Cybulski et al. [45] are given in table 3.
The interactions between CH(X ) and Ne or Ar are sufficiently strong that the binary
complexes are relatively easily formed at low temperatures. Multiphoton dissociation
of Br3CH has been used as the source of the radical in studies of the complexes. TheA–X and B–X transitions of CH–Rg have been examined. Both excited states are
derived from the 3�1�2 configuration. CH–Ar was first observed via the B2�––X2�
transition. Lemire et al. [74] reported 12 bands of the complex associated with the
monomer 0–0 transition, and 11 bands associated with 1–0. The rotational structures
of eight bands were analysed. From these data, Lemire et al. [74] concluded that the
Hydride radical van der Waals complexes 387
Dow
nloa
ded
by [
Uni
vers
ity o
f Sa
skat
chew
an L
ibra
ry]
at 1
0:26
09
May
201
2

equilibrium geometry was bent for the ground state and linear for the B state. The
rotational levels of the ground state resembled those of a molecule in a 2� state
with a modest spin–rotation splitting (i.e. levels primarily characterized by the integer
quantum number N). All of the complex bands were blue-shifted relative to the
monomer parent transitions. This, taken with the red-degraded rotational structures
of the bands, indicated that the van der Waals bond was weakened and lengthened by
electronic excitation. McQuaid et al. [75] reported a brief study of the CD–Ar bands
associated with the monomer 1–0 transition. Overall the results were consistent with
the observations for CH–Ar.A detailed theoretical study of the CH–Ar B–X system was carried out by Alexander
et al. [44]. Two-dimensional ab initio potential energy surfaces were calculated using
MR–CI(D)/avqz–fþCP. The ground state potentials were qualitatively the same as
those described above for CH(X )–He, but more deeply bound. The equilibrium
Table 3. Stationary point data for CH–Rg complexes.
Surface De/cm�1 �e Re/au Reference
CH(X2�)–HeVA0, ab initio 12 0 7.5 [45]VA0, ab initio 12 140 7.5 [45]VA00, ab initio 73.5 100 5 [45]
CH(X2�)–NeVA0, ab initio 24 21 7.64 [58]VA0, ab initio 24 180 7.62 [58]VA00, ab initio 68 76.2 5.79 [58]
CH(A2�)–NeV, ab initio 43 0 7.11 [58]V, ab initio 26 180 6.82 [58]V, modified 65 0 6.64 [58]V, modified 39 180 6.35 [58]
CH(B2�)–NeV, ab initio 36 0 7.5 [78]V, ab initio 29 180 7.26 [78]
CH(X2�)–ArVA0, ab initio 60 51.5 7.65 [44]VA0, ab initio 60 180 7.76 [44]VA00, ab initio 212 83.5 5.85 [44]VA0, modified 78 53 7.41 [44]VA0, modified 76 180 7.56 [44]VA00, modified 268 84 5.64 [44]
CH(A2�)–ArV, ab initio 110.6 0 7.39 [57]V, ab initio 75.9 180 6.99 [57]V, modified 165.3 0 7.32 [57]V, modified 141.8 180 7.2 [57]
CH(B2�)–ArV, ab initio 133 0 7.33 [44]V, ab initio 87 150 7.17 [44]V, modified 180 0 7.06 [44]V, modified 119 150.5 6.9 [44]
388 M. C. Heaven
Dow
nloa
ded
by [
Uni
vers
ity o
f Sa
skat
chew
an L
ibra
ry]
at 1
0:26
09
May
201
2

structure for the VA00 surface of CH(X )–Ar was bent (�e¼ 83.5�) with a well depthof 212 cm�1. In contrast, the well depth of the VA00 surface was 60 cm�1. Promotion
of a second electron into the p� orbitals resulted in a potential energy surface for the
B state where the global minimum (De¼ 133 cm�1) was for the linear CH–Ar complex.Stationary points for the potential energy surfaces of CH–Ar are listed in table 3. The
ab initio calculations correctly predicted the equilibrium structures for the X and B statecomplexes and the weaker van der Waals bond for the electronically excited state.
Modified potentials were used in bound state calculations, in order to obtain results
that would be closer to the experimental data. The properties of the modified surfacesare also presented in table 3. An important point concerning the bound state
calculations is that they were made with the assumption that the diatomic spin–orbit
coupling constant for the ground state (aSO¼ 27.9 cm�1) was not influenced by theinteraction with the Ar atom. The bond energy of CH(X )–Ar was predicted to be
D0¼ 131.8 cm�1, which was slightly lower than the experimental lower bound of
D0>161 cm�1. The rotational constant for the zero-point level calculated from thehR�2i expectation value was B0¼ 0.167 cm�1, as compared to the measured value of
B0¼ 0.174(4) cm�1. Better agreement was obtained when the rotational constant wasderived from the calculated results using the method applied to the experimental data.
Fitting of the calculated energy levels for a range of J values to a rigid-rotor model
yields an effective constant of B0¼ 0.173 cm�1. Furthermore, the rigid rotor modelwas clearly consistent with energy levels governed by the integer case (B) quantum
number N. As for BH(A)–Ar, the most deeply bound states of CH(X )–Ar were
consistent with motion on the VA00 potential. Evidently the electrostatic splitting of the� state orbital energies dominates over the spin–orbit interaction.
Lemire et al. [74] assigned the B state energy levels accessed by the lowest energy
transitions as (00, 0), (10, 0), and (00, 1), where the labels are (nK, vc). The onset ofbands with homogeneously broadened features provided a lower bound for the
dissociation energy of D0>80 cm�1. The dissociation energy and rotational constants
predicted using the modified potential energy surface were in good agreement withexperiment (e.g. D0(calc)¼ 88.5, B0(calc)¼ 0.116, B0(exp)¼ 0.113 cm�1). The vibronic
assignments of Lemire et al. [74] were confirmed and the (00, 2) band was identified.
However, many of the observed bands remain unassigned, as unambiguous correlationsbetween these features and the calculated energy levels could not be established.
Alexander et al. [44] speculated that calculations based on a full three-dimensionalpotential energy surface may be needed to advance the interpretation of the B–X
spectrum.The A2�–X2� transition of CH/D–Ar has been examined by Komissarov et al. [76]
and Kerenskaya et al. [57]. The vibronic structure of the spectrum was dominated byprogressions in the van der Waals stretch (vc¼ 0–3) combined with excited bending
levels. Seven bands of CH–Ar and five bands of CD–Ar were rotationally resolved
and analysed. Like the B–X system, the A–X bands were blue-shifted relative tomonomer with red-degraded rotational structure. Again this was indicative of a
weaker van der Waals bond for the excited state. The rotational energy levels forCH/D–Ar were well represented by a rigid-rotor model with half-integer quantum
numbers (EROT¼BJ(Jþ 1)). This was initially surprising, given the rather small
spin–orbit coupling constant for CH(A) of aSO¼ –1.1 cm�1. All levels of the monomer
Hydride radical van der Waals complexes 389
Dow
nloa
ded
by [
Uni
vers
ity o
f Sa
skat
chew
an L
ibra
ry]
at 1
0:26
09
May
201
2

conform to the Hund’s case (b) limit. However, for CH(A)–Ar the rotational constants
are �0.11 cm�1, yielding a ratio for aSO/B above 9 which tends towards the case (A)
coupling scheme of Dubernet et al. [46] (under the assumption that the spin–orbit
interaction is unchanged by the van der Waals interaction).Theoretical calculations were carried out to analyse the A state energy levels
and develop realistic empirical potential energy surfaces. Two-dimensional ab initio
surfaces were calculated using MR–CI(D)/avqzþCP. Contour plots of these surfaces
are shown in figure 2 and the stationary point data are given in table 3. The VA0 and VA00
surfaces were found to be very similar. This was expected as the A0 and A00 symmetry
components of the � state correspond to �x�x0–�y�y0 and �x�y0–�y�x0 orbital
occupations, both of which have cylindrically symmetric electron density distributions.
The maximum difference between the surfaces, for a curve that followed the mini-
mum energy path from �¼ 0 to 180�, was 8 cm�1, with VA0<VA00. This splitting
cannot be explained by simple electrostatic considerations. The effect is quantum
mechanical, having to do with the mixing of configurations through electron
correlation. The accuracy of the repulsive region of these potentials was verified by
Kind et al. [63], who used the ab initio results to model CH(A)þAr collisional energy
transfer data.The energy level structure arising from the interaction of CH(A) with Ar is congested.
Due to the small spin–orbit interaction, the j¼ 3/5 and 5/2 levels of n¼ 2 are close
in energy for the free diatom. The interaction with a rare gas atom splits these levels
into four and six P-states, respectively (where each ‘state’ is a pair of parity doublets).
An approximate picture of the splittings for CH(A)–Ar is shown in figure 4, where
interleaving of the manifolds arising from j¼ 3/2 and 5/2 is evident. In order to
correlate this structure with the observed spectrum it was essential to determine which
of these bending/hindered rotor states would be optically active. The transition was
subject to the �P¼ 0, �1 selection rule. As the ground state has a well-defined value
of P¼ 1/2, transitions to the P¼ 5/2 levels would not be observable. Explicit treat-
ment of the transition intensities was required to make further progress with spectral
n=2
j=3/2
j=5/2
A2∆
CH CH-Ar
1/2*1/2
1/21/2
3/25/2
3/2*3/23/2
5/2
P
Figure 4. Energy level diagram showing the correlations between the lowest rotational levels of CH(A 2�)and the internal rotation levels of CH(A2�)–Ar. The levels marked with asterisks are active in the A–Xspectrum.
390 M. C. Heaven
Dow
nloa
ded
by [
Uni
vers
ity o
f Sa
skat
chew
an L
ibra
ry]
at 1
0:26
09
May
201
2

assignment. The first calculations used the modified CH(X )–Ar potential energysurfaces from ref. [44] and the ab initio surfaces for CH(A)–Ar. A spectral simulationderived from this calculation is compared with the experimental data in figure 5(middle and upper traces, respectively), where it can be seen that the qualitative featuresof the spectrum were reproduced. However, the quantitative differences in the energylevel spacings showed that the potentials were not sufficiently deep. An empiricalform for the average potential was generated by adjusting the expansion coefficientsof equation (4) to fit the observed energy level spacings. A key element of this processwas the ability to track the relative intensities of the simulated spectrum as the potentialwas modified. The simulation for the optimized potential is shown in the lower traceof figure 5. The predicted energy level spacings were in good agreement with theexperimental results for both CH(A)–Ar and CD(A)–Ar. The dissociation energy forCH(A)–Ar could not be estimated from the spectrum as the origin band was notobserved. Instead, the data provided a lower bound for the binding energy for thefirst observed state of >70 cm�1. The empirical potential yielded 72.4 cm�1 for thisinterval and a bond dissociation energy of D0¼ 93.9 cm�1 for the P¼ 5/2 zero-pointlevel. A satisfactory fit to the rotational constants was obtained by translating thepotentials inward by 0.47 au. Stationary point data for the modified potentials are givenin table 3.
The intensity distribution of the A–X spectrum was a matter of interest in its ownright. Of the eight bending/hindered rotor states from n¼ 2 that could be accessedby �P allowed transitions, just two dominated the spectrum. Asterisks in figure 4indicate the specific levels. The reason why the two lowest energy P<5/2 states werenot active in the spectrum could be seen by examining the angular probabilitydistributions
Dð�Þ ¼
Z 10
�ðR, �Þ�� ��2R2dR ð6Þ
where �ðR, �Þ is an eigenfunction of equation 1. Angular probability distributionsfor states with vc¼ 0, J¼ 3/2 are presented in figure 6. These plots show that thewavefunctions for the two lowest energy states (labelled 1 and 2) are locatedin the linear minima. As the ground state has a bent equilibrium geometry, theFranck–Condon overlap with these linear states is poor, resulting in weak transitions.The remaining distributions correspond to bent states, so it is not obvious from the D(�)curves why the �3 and �8 states are particularly favoured. This preference isdetermined by the phase relationships among the basis set expansion coefficients.
The isotope shift for CH/D–Ar is a second point of interest. The lowest energybands of the A–X system are blue-shifted, relative to the monomer transitions,by 98 cm�1 (CH–Ar) and 122 cm�1 (CD–Ar). The calculations predict an isotope shiftof 2 cm�1 for the upper state level involved, which implies that the ground statezero-point energies must differ by 26 cm�1. Calculation of the ground state isotopeshift using the potentials of Alexander et al. [44] gives 17 cm�1. This relatively largeisotope effect is a consequence of the strongly anisotropic VA00 potential energy surface.The discrepancy between the experimental and calculated shift is probably due toa combination of errors in the depth and anisotropy of the ground state potentials.
Hydride radical van der Waals complexes 391
Dow
nloa
ded
by [
Uni
vers
ity o
f Sa
skat
chew
an L
ibra
ry]
at 1
0:26
09
May
201
2

23340 23380 23420
Energy/cm−1
Ab initio
Scaled
Observed
Figure 5. Comparison of experimental and simulated spectra for the A2�–X 2� transition of CH–Ar. Uppertrace: low-resolution experimental spectrum from reference [76]; middle trace: simulated spectrum generatedfrom the ab initio potential energy surfaces (T¼ 4.0K); lower trace: simulated spectrum generated from theadjusted potential energy surfaces of reference [57].
392 M. C. Heaven
Dow
nloa
ded
by [
Uni
vers
ity o
f Sa
skat
chew
an L
ibra
ry]
at 1
0:26
09
May
201
2

Studies of the B–X system of CH/D–Ne were carried out by Basinger et al. [77]. Thero-vibrational structure of CH(B)–Ne clearly reflected the nearly free internal rotationof CH within the complex. Transitions to levels with n¼ 0, 1, and 2 were readilyidentified. Figure 7 shows the observed transitions for vc¼ 0, and their relationship tothe transitions of free CH. The B state potential was just deep enough to support onebound level with vc¼ 1 (n¼ 0, K¼ 0). The K¼ 0 and 1 components of n¼ 1 were bothabove the dissociation asymptote, and the K¼ 0 rotational levels were measurablybroadened by rotational predissociation. Features associated with n¼ 2 were alsohomogeneously broadened. Fluorescence depletion (FD) measurements were used todemonstrate that the n¼ 0 and 2 levels of the complex were accessed from the groundstate zero-point level, while the n¼ 1 states were accessed from an excited level ofthe ground state. As indicated in figure 7, this was due to the diatomic parity beinglargely conserved in the complex. The separation of the ground state P¼ 1/2þ and 1/2�
pair was estimated to be 5 cm�1. Rotational constants of B0(1/2þ)¼ 0.177 and
B0(1/2�)¼ 0.167 cm�1 were determined. Due to the high laser power used to record the
0.0
0.5
1.0
1.5
2.0
2.5
3.0
3.5
4.0
0 45 90 135 180
J=3/2−
q/degree
Y3Y5
Y6
Y2
Y7
Y8
P=3/2
P=1/2
∫|Ψ(R
,θ)|
2 dR
Y4
Y1
Figure 6. Angular probability distributions for CH(A2�, n¼ 2)–Ar. This plot shows the data for theeight lowest energy levels with J¼ 1.5�.
Hydride radical van der Waals complexes 393
Dow
nloa
ded
by [
Uni
vers
ity o
f Sa
skat
chew
an L
ibra
ry]
at 1
0:26
09
May
201
2
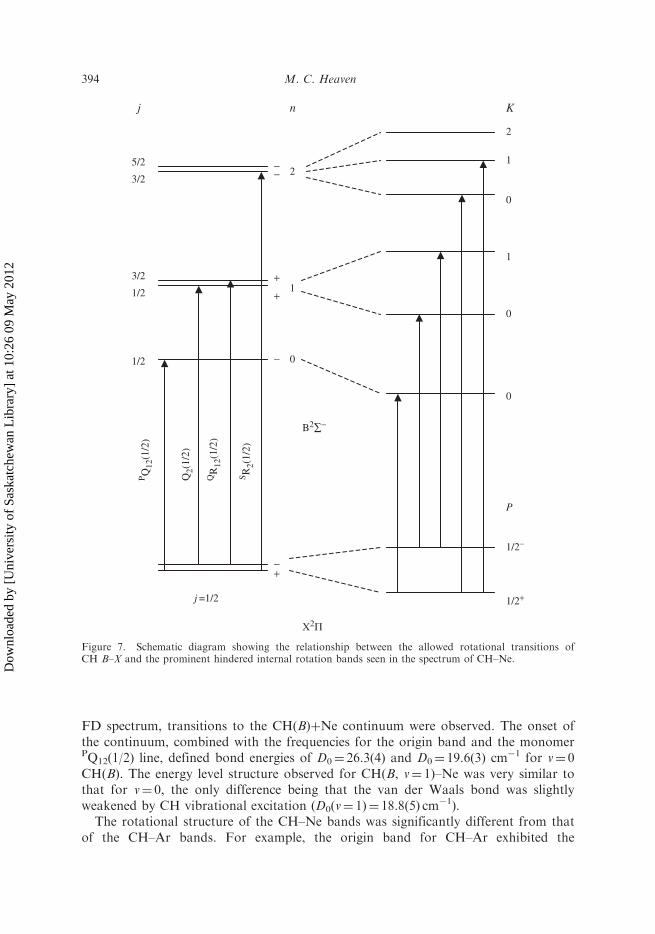
FD spectrum, transitions to the CH(B)þNe continuum were observed. The onset ofthe continuum, combined with the frequencies for the origin band and the monomerPQ12(1/2) line, defined bond energies of D0¼ 26.3(4) and D0¼ 19.6(3) cm�1 for v¼ 0CH(B). The energy level structure observed for CH(B, v¼ 1)–Ne was very similar tothat for v¼ 0, the only difference being that the van der Waals bond was slightlyweakened by CH vibrational excitation (D0(v¼ 1)¼ 18.8(5) cm�1).
The rotational structure of the CH–Ne bands was significantly different from thatof the CH–Ar bands. For example, the origin band for CH–Ar exhibited the
2
1
0
1
0
0
−−
+
+
−
−+
1/2+
1/2−
P
K
0
1
2
n
j =1/2
P Q12
(1/2
)
Q2(
1/2)
QR
12(1
/2)
S R2(
1/2)
B2∑−
X2Π
1/2
1/2
3/2
3/2
5/2
j
Figure 7. Schematic diagram showing the relationship between the allowed rotational transitions ofCH B–X and the prominent hindered internal rotation bands seen in the spectrum of CH–Ne.
394 M. C. Heaven
Dow
nloa
ded
by [
Uni
vers
ity o
f Sa
skat
chew
an L
ibra
ry]
at 1
0:26
09
May
201
2

characteristics of a 2�–2� transition, while that of CH–Ne was consistent with 2�–2�line-strengths. The rotational energy levels of the ground state were governed by
half-integer rotational quantum numbers. These observations seem to suggest a linear
geometry for CH(X )–Ne, but theoretical calculations show that the equilibriumgeometry is bent.
Ab initio potential energy surfaces for CH–Ne were generated for the ground
state and the excited states derived from the 3�1�2 configuration (X2�, A2�, B2�� andC2�þ) (state-averaged CASSCF, MRCI/ avqzþCP [58]). Stationary point data for
the X, A and B state surfaces are listed in table 3. Bound state calculations for the
X state were carried out for the unmodified potentials. These predicted a bonddissociation energy of 15.5 cm�1, a P¼ 1/2þ to 1/2– interval of 1.4 cm�1 and rotational
constants B0(1/2þ)¼ 0.142, B0(1/2
�)¼ 0.136 cm�1. Qualitative details such asE(1/2þ)<E(1/2�), B0(1/2
þ)>B0(1/2�) and the case A angular momentum coupling
were correctly reproduced. The quantitative discrepancies indicated that the well
depths of the potential surfaces needed to be increased by a factor of approximately1.7 and the surfaces should be translated inward along R by 0.7 au. Bound state
calculations for the B state potential have not been carried out, but the quantitative
details of the surface are in agreement with the spectroscopic data (linear equilibriumgeometry with V20 as the dominant component of the surface anisotropy). Note also
that the ab initio calculations correctly predicted that De(B)<De(X, A00).
The A–X system of CH–Ne was particularly congested and difficult to analyse.LIF spectra recorded at a resolution of 0.06 cm�1 could not be assigned using the
conventional combination differences approach. FD techniques were applied in order
to obtain interpretable data. For these experiments a probe laser was fixed on anassigned rotational line of the B–X system. The depletion laser was then tuned through
A–X bands, inducing a drop in the B–X fluorescence intensity whenever a transition
from the probe-selected lower level was encountered. By this means the transitionsfrom a single rotational level of the ground state could be isolated. An example of
the FD spectrum connected with the J¼ 1/2 level of the ground state is shown in
figure 8. FD spectra were recorded for all J levels in the range from 1/2 to 9/2.Transitions to the eight states from n¼ 2 with P¼ 1/2 and 3/2 were identified. This
was responsible for the complexity of the spectrum and contrasted with the situationfor CH(A)–Ar, where only two of these states were optically active. The stick spectrum
in the centre of figure 8 (trace b) shows the energy levels predicted from the ab initio
potentials. The qualitative energy level pattern predicted by the calculations wascorrect, and the energy ordering of the hindered rotor states was the same as that
shown in figure 4 for CH(A)–Ar. Clearly the spacings of the predicted bands (figure 8b)
were underestimated, indicating the usual problem with underestimation of the welldepth. To fit the experimental data the average potential energy surface was modified
by increasing the V00 and V20 terms of equation (4) by a factor of 1.5. The stick
spectrum from the adjusted potential, shown as trace c in figure 8, was in excellentagreement with the observed band structures. The angular probability distributions
for the wavefunctions of the modified potential were similar to those shown in figure 6for CH(A)–Ar, but more delocalized. The probability distributions for the ground
state provided the key to understanding the different intensity distributions of CH–Ne
versus CH–Ar A–X band systems. The ground state wavefunction for CH(X )–Ne is far
Hydride radical van der Waals complexes 395
Dow
nloa
ded
by [
Uni
vers
ity o
f Sa
skat
chew
an L
ibra
ry]
at 1
0:26
09
May
201
2

more delocalized than that of CH(X )–Ar, permitting favourable overlap with thewavefunctions for all levels of CH(A)–Ne (vc¼ 0) that could be accessed by �P allowedtransitions. The probability distribution plots for CH(A)–Ne also explain why thelowest energy bright state (P¼ 3/2 near 23 250 cm�1 in figure 8) stands apart fromthe remainder of the vc¼ 0 hindered rotor levels. This state, and the lowest energyP¼ 5/2 state, are localized near the global minimum of the potential. All other statesare delocalized to the extent that they have appreciable probability densities in theregion of the barrier that separates the two linear minima. The binding energy ofthe lowest P¼ 3/2 state was predicted to be 23.1 cm�1 in agreement with the measuredvalue of 23.0 cm�1.
Energy/cm−1
P=3/2 P=1/2
Figure 8. Comparisons of theoretically predicted energy level patterns with the fluorescence depletionspectrum obtained by monitoring transitions from the J¼ 1/2e rotational level of the ground state. Thecalculated positions of the R and Q lines are given by solid and broken lines. Stick spectra (b) and (c) wereobtained using ab initio and scaled potential energy surfaces, respectively. P-assignments for the observedtransitions are given below the experimental spectrum (trace a).
396 M. C. Heaven
Dow
nloa
ded
by [
Uni
vers
ity o
f Sa
skat
chew
an L
ibra
ry]
at 1
0:26
09
May
201
2

Inward translation of the scaled potential energy surfaces by 0.47 au yieldedagreement between the observed and calculated rotational constants [58]. In com-paring the results it was important to include the effects of Coriolis coupling, as thevarious P-states were not widely separated. There was a marked difference betweenconstants obtained from hR�2i expectation values and those derived by fitting toJ-dependent energies. For example, the measured constant for the highest energyP¼ 1/2 (vc¼ 0) state was 0.185 cm�1. The values calculated from hR�2i and energylevel fitting were 0.125 and 0.185 cm�1, respectively.
Comparing the properties of CH(A)–Rg and CH(B)–Rg complexes it is apparentthat, for a given Rg, the potential energy surfaces are very similar for the two electronicstates. This supports the notion that the shapes and depths of the potentials areprimarily governed by the orbital occupation. In this context it is worth noting thatthe ab initio potential energy surface for CH(C2�þ)–Ne is also very similar to thesurfaces of the A and B states [78]. When the properties of CH–Rg complexesare compared with those of other open-shell Rg–HX systems there is one curiousanomaly. Electronic excitation of CH–Rg weakens the van der Waals bond whileBH–Rg, NH–Rg and OH–Rg complexes all show the opposite trend. Ab initiocalculations successfully predict shallower potentials for the 3�1�2 excited states ofCH–Rg, but the origin of the effect is not obvious. Decomposition of the CH–Rgexcited state interactions into components such as dispersion, dipole–induced-dipoleand exchange repulsion should provide insights concerning this behaviour.
4.3. NH–Rg complexes (Rg^He, Ne and Ar)
NH–Rg complexes provide another opportunity for studies of the van der Waalsinteractions involving multiple electronic states that are derived from a commonelectronic configuration, with the additional dimension of allowing comparisons ofthe properties of states with triplet and singlet spin multiplicity. The ground and low-lying electronic states of NH, X3��, a1� and b1�þ, are derived from the 3�21�2
configuration. The excited states that are readily observed by LIF are A3� and c1�,derived from the 3�1�3 configuration. Potential energy surfaces for several NH–Rgsystems have been reported. One of the earliest high-level theoretical studies wascarried out by Jansen and Hess [79], who mapped the surfaces for the X, a, and bstates of NH–Ar. They used CASSCF calculations, combined with an averagecoupled-pair functional treatment of electron correlation. Counterpoise and self-consistency corrections were applied. With a filled 3� orbital and two p� electronsthe NH(X )–Ar potential energy surface was found to have a rather low barrier tointernal rotation, with a bent equilibrium structure (�e¼ 63�, De¼ 75 cm�1). Thepotential energy surfaces for the a and b states had minima for the linear configurations,with the same general properties as the CH(A)–Ne surfaces shown in figure 2.The dissociation energies were De(a)¼ 80 and De(b)¼ 85 cm�1. For the reasonsdiscussed above for CH(A)–Rg, the difference potential for NH(a)–Ar was muchsmaller than the average potential. The dominant isotropic component of theinteraction energy (V00(R)) was comparable for all three electronic states. Morerecently, Kendall et al. [80] used UMP4 calculations with large basis sets (avtz andWTdf, both augmented with mid-bond functions) to generate a more accurate surface
Hydride radical van der Waals complexes 397
Dow
nloa
ded
by [
Uni
vers
ity o
f Sa
skat
chew
an L
ibra
ry]
at 1
0:26
09
May
201
2

for NH(X )–Ar. Their surface was similar to that of Jansen and Hess [79], but moredeeply bound (De¼ 100.3 cm�1). Stationary point data for the potential energy surfaces
of NH–Ar are collected in table 4. Kendall et al. [80] used the diffusion Monte Carlo
technique to predict the properties of the NH(X )–Ar zero-point level. This yieldeda bond energy of D0¼ 71.5 cm�1 and an angular probability distribution that indicated
nearly free internal rotation of NH(X ).To date, there are no experimental data for the NH(X )–Ar complex. In part this
is due to the fact that most photolytic sources of NH have high branching fractions
for production of the radical in the metastable a1� state. Consequently, Randall
et al. [81] observed the c–a band system of NH–Ar using 193 nm photolysis of HNCOto generate NH(a). Fourteen bands of the complex were observed in association with
the monomer 0–0 transition. The lowest energy bands were red-shifted, indicatinga stronger van der Waals bond for the excited state. A full theoretical treatment of
the spectrum was required before the vibronic structure could be assigned. Yang
et al. [53] calculated the potential energy surfaces for NH(c)–Ar at the MRCI(D)/avqzlevel of theory, including the CP corrections. Consistent with the 3�1�3 orbital
occupation, the surfaces had minima for the linear geometries, with a dissociation
energy of De¼ 361 cm�1. The difference potential for NH(c)–Ar was significant, but notnearly as large as the difference potentials of BH(A1�)–Ar or CH(X2�)–Ar. This was
expected, as the charge distribution for �3 is more symmetrical than that for a singly
occupied p� electron. Prior to prediction of the NH–Ar c–a spectrum, Yanget al. [53] scaled and shifted the ab initio potentials (see table 4 for details of the
modified potentials). Bound state calculations for NH(a)–Ar produced manifolds ofclosely spaced levels. The j¼ 2 level of the monomer gives rise to states with P¼ 2l, 0
þ,
1l, 0�, 1u, and 2u, with the first three states separated by just 4.1 cm�1. This congested
structure was the result of the weak anisotropy of the NH(a)–Ar potentials. The boundlevels of NH(c)–Ar correlate with the monomer j¼ 1 and 2 levels. The former correlates
with the P¼ 1l, 0þ, 1u, and 0� states of the complex. Yang et al. [53] noted that the
adiabatic bender potentials for the 0þ and 0– states were equivalent to motions onthe VA0 and VA00 surfaces, respectively. This was similar to the situation encountered for
BH(A1�)–Ar, but the energy ordering of the states was inverted as the VA0 surface
is more attractive for the �3 orbital occupation. The adiabatic bender curves for theP¼ 1l and 1u states were indicative of motions that sampled both potentials. Using
the calculated results, Yang et al. [53] were able to provide vibronic assignmentsfor eleven bands of the c–a system. Rotational analyses of three of these bands provided
clear evidence that transitions from the P00 ¼ 2l, 1l and 0þ states contributed to the
spectrum. The Coriolis coupling between these bands was examined using a per-turbation theory approach. To reproduce the observed state rotational energy level
pattern, Yang et al. [53] found that they had to decrease the energy spacings between
the 2l, 1l and 0þ states, which implied that the true potential energy surfaces areeven less anisotropic than the theoretical surfaces. Comparing the calculated
dissociation energies (D0(a)¼ 95, D0(c)¼ 292 cm�1) with the experimental lower
bounds (D0(a)>127, D0(c)>309 cm�1), they concluded that further deepening ofthe modified potentials would be justified.
Theoretical and experimental studies of the c–a system of NH/D–Ne were carried
out by Kerenskaya et al. [82]. One of the issues investigated in this work was the validity
398 M. C. Heaven
Dow
nloa
ded
by [
Uni
vers
ity o
f Sa
skat
chew
an L
ibra
ry]
at 1
0:26
09
May
201
2
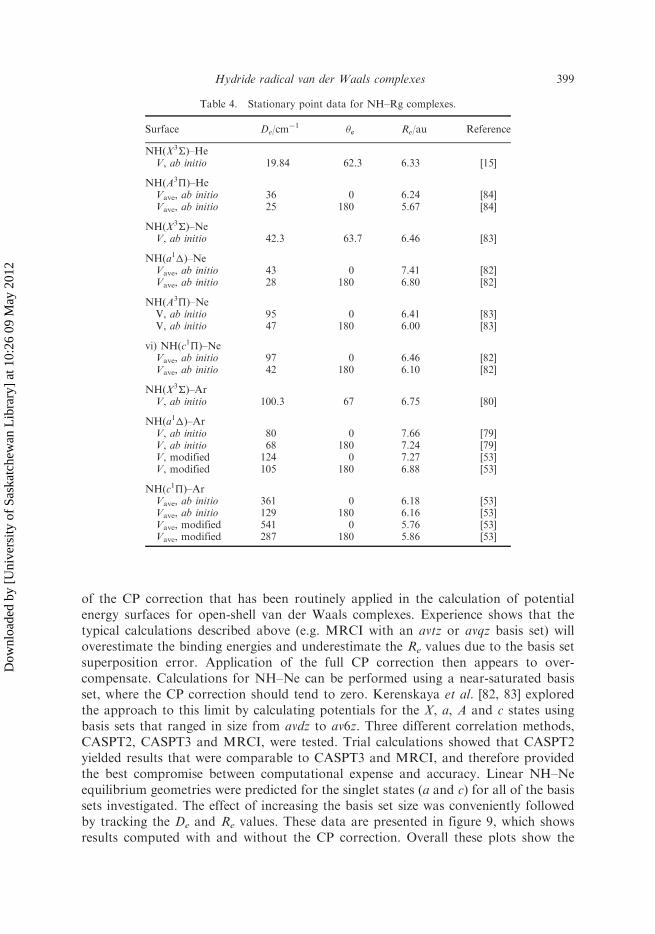
of the CP correction that has been routinely applied in the calculation of potentialenergy surfaces for open-shell van der Waals complexes. Experience shows that thetypical calculations described above (e.g. MRCI with an avtz or avqz basis set) willoverestimate the binding energies and underestimate the Re values due to the basis setsuperposition error. Application of the full CP correction then appears to over-compensate. Calculations for NH–Ne can be performed using a near-saturated basisset, where the CP correction should tend to zero. Kerenskaya et al. [82, 83] exploredthe approach to this limit by calculating potentials for the X, a, A and c states usingbasis sets that ranged in size from avdz to av6z. Three different correlation methods,CASPT2, CASPT3 and MRCI, were tested. Trial calculations showed that CASPT2yielded results that were comparable to CASPT3 and MRCI, and therefore providedthe best compromise between computational expense and accuracy. Linear NH–Neequilibrium geometries were predicted for the singlet states (a and c) for all of the basissets investigated. The effect of increasing the basis set size was conveniently followedby tracking the De and Re values. These data are presented in figure 9, which showsresults computed with and without the CP correction. Overall these plots show the
Table 4. Stationary point data for NH–Rg complexes.
Surface De/cm�1 �e Re/au Reference
NH(X3�)–HeV, ab initio 19.84 62.3 6.33 [15]
NH(A3�)–HeVave, ab initio 36 0 6.24 [84]Vave, ab initio 25 180 5.67 [84]
NH(X3�)–NeV, ab initio 42.3 63.7 6.46 [83]
NH(a1�)–NeVave, ab initio 43 0 7.41 [82]Vave, ab initio 28 180 6.80 [82]
NH(A3�)–NeV, ab initio 95 0 6.41 [83]V, ab initio 47 180 6.00 [83]
vi) NH(c1�)–NeVave, ab initio 97 0 6.46 [82]Vave, ab initio 42 180 6.10 [82]
NH(X3�)–ArV, ab initio 100.3 67 6.75 [80]
NH(a1�)–ArV, ab initio 80 0 7.66 [79]V, ab initio 68 180 7.24 [79]V, modified 124 0 7.27 [53]V, modified 105 180 6.88 [53]
NH(c1�)–ArVave, ab initio 361 0 6.18 [53]Vave, ab initio 129 180 6.16 [53]Vave, modified 541 0 5.76 [53]Vave, modified 287 180 5.86 [53]
Hydride radical van der Waals complexes 399
Dow
nloa
ded
by [
Uni
vers
ity o
f Sa
skat
chew
an L
ibra
ry]
at 1
0:26
09
May
201
2

anticipated trends. The uncorrected De values were always larger than the CP correctedvalues, and the two appeared to converge for the largest basis set. Similarly, theuncorrected Re values converged towards the CP corrected values. Note also that theCP correction worked well for the smaller basis set calculations. A surprising aspect
−250
−200
De/
cm−1
−150
−100
−50
0
50
avdz avtz avqz av5z av6z
5.5
6.0
6.5
7.0
7.5
8.0
avdz avtz avqz av5z av6z
Basis set
Re/a
u
c-State, uncorrecteda-Sate, uncorrectedc-State, CP correcteda-State, CP corrected
Figure 9. Basis set convergence properties of ab initio calculations for NH(a 1�)–Ne. Counterpoise (CP)corrected and uncorrected binding energies and equilibrium distances, computed with truncated avdz toav6z basis sets.
400 M. C. Heaven
Dow
nloa
ded
by [
Uni
vers
ity o
f Sa
skat
chew
an L
ibra
ry]
at 1
0:26
09
May
201
2

of figure 9 was the rather erratic shape of the De and Re curves, which precludedasymptotic extrapolation of the results to the complete basis set limit. Similarly
erratic trends have been observed in attempts to perform basis set extrapolations
for Ne–HF and Ar–HF [59].Two-dimensional potential energy surfaces for the X, a, A and c states were
calculated using the CASPT2/av6z combination without the CP correction (stationary
point data given in table 4). Contour diagrams for the A00 surfaces of the singlet
states are shown in figure 10. The effect of electronic excitation on the well depth and
anisotropy of the van der Waals interaction is readily apparent here. Bound statecalculations were used to predict the characteristics of the c–a band system. The stable
states of NH(a)–Ne, P¼ 2l, 0þ, 1l, 0
–, 1u, and 2u, correlate with j¼ 2. Due to the nearly
isotropic potential energy surface, the zero-point levels for these six states fell withina 7 cm�1 energy interval. Based on these results it was expected that two or three of
the lowest energy P states would be populated under the conditions typically used
to observe Rg–HX complexes. Calculated values for the bond energy and rotational
constant were D0¼ 20.4 cm�1 and B0¼ 0.111 cm�1 (including the Coriolis effect).Adiabatic bender curves for NH(c)–Ne are shown in figure 11, where the stable
bound states correlate with j¼ 1 (P¼ 1l, 0þ, 1u, 0
�). States correlating with j>1 were
unstable with respect to rotational predissociation. As compared to NH(a)–Ne, the P
states of NH(c)–Ne were more widely separated due to the greater anisotropy of theexcited state surfaces. Consequently, the rotational energy levels were less influenced by
Coriolis coupling than those of the a state. Calculated values for the binding energy
and zero-point rotational constant (P¼ 1l) were D0¼ 29.6 and B0¼ 0.147 cm�1. The
large zero-point energy for NH(c)–Ne of 67 cm�1, which is 2/3 of the well depth,resulted from the steep rise of the potential in the vicinity of the global minimum. The
energy of the zero-point level is close to the barrier to internal rotation at 70 cm�1,
so NH(c) is essentially a free rotor for all bound states. Calculations for the a and c
states of ND–Ne yielded bound state predictions that were not much different fromthose obtained for NH–Ne. For example, deuteration increased the binding energy
for the c state by just 2.6 cm�1.Experimental studies of NH/D–Ne utilized photolysis of both HNCO and NH3 to
generate NH(a). Photolysis of ND3 was used to obtain ND(a). Spectra were recordedin the vicinity of the monomer c–a 0–0 transition [82]. In accordance with the
theoretical prediction, the rotational levels of the monomer were reflected in the spec-
trum of the complex. Bands of NH–Ne were observed in association with the monomerP(2), Q(2) and R(2) lines. As the bands associated with Q(2) and R(2) were broadened
by predissociation, the focus of the spectroscopic work to date has been on the stable
states associated with j¼ 1. These formed a compact group of at least twelve bands
contained within a 45 cm�1 interval. Partial rotational resolution was achieved forsix features. Band contour analyses indicated that transitions from the P¼ 2l and 1lstates contributed to the spectrum. Comparisons with the theoretical results were
used to propose assignments for the seven lowest energy bands. Lower bounds for
the binding energies of D0(a)>19.8 and D0(c)>42.4 were established. Surprisingly,the rotational constants derived from the experimental data were smaller than the
calculated values. Scaling of the latter by factors of 0.8 (a) and 0.7 (c) yielded
respectable simulations of the rotational band contours.
Hydride radical van der Waals complexes 401
Dow
nloa
ded
by [
Uni
vers
ity o
f Sa
skat
chew
an L
ibra
ry]
at 1
0:26
09
May
201
2

0 30 60 90 120 150 1805.5
6
6.5
7
7.5
8
8.5
9
9.5
5.5
6
6.5
7
7.5
8
8.5
9
9.5
A′′
A′′
R/a
uR
/au
0 30 60 90 120 150 180
q/degrees
q/degrees
Figure 10. Contour plots of the potential energy surfaces for NH–Ne. The upper panel shows the A00 surfacefor NH(a1�)–Ne. The contours are drawn from the linear NH–Ne geometry contour at �41 cm�1 with4 cm�1 intervals. The lower panel shows the A00 potential energy surface for NH(c1�)–Ne. The contoursare drawn from the linear NH–Ne geometry contour at �94 cm�1 with 6 cm�1 intervals.
402 M. C. Heaven
Dow
nloa
ded
by [
Uni
vers
ity o
f Sa
skat
chew
an L
ibra
ry]
at 1
0:26
09
May
201
2

The experimental data for NH–Ne indicated that the errors in the ab initio potentialenergy surfaces for the a state were relatively small. The dissociation energy was in goodagreement with the experimental lower bound. Calculated rotational constants forthe P¼ 2l and 1l levels of j¼ 2 were appreciably larger than the constants derivedfrom the band contour models. However, this does not necessarily imply that the Re
value had been underestimated. These constants are strongly influenced by Coriolismixing with the other low-lying states. Reducing the splitting between the variousj¼ 2 states would bring the effective constants into agreement with the results ofthe contour analyses. This points to possible errors in the anisotropy of the surfaces.The discrepancies for the c state surfaces were more significant and somewhat unusual.The measured upper bound for the dissociation energy was greater than the calculatedvalue by a factor of 1.4. As this is too large to be a zero-point effect it shows that thetheoretical potentials were too shallow. Contrary to the usual trend, the rotationalconstants were overestimated. This could not be accounted for by Coriolis effectsand clearly indicated that the theoretical potentials needed to be translated out alongthe R axis by 0.4 au. Despite these discrepancies, the theoretical results for the singletstates of NH–Ne indicated that the CP correction was not the source of the errors. Thecalculations for NH(X )–Ne described below indicate that part of the problem comesfrom incomplete recovery of the correlation energy. Recent calculations also show thatimproved results are obtained when the basis sets are augmented by the inclusionof mid-bond functions.
Spectra for the A3�–X3�� transition of NH–Rg (Rg¼He, Ne) provided the firstexperimental data for complexes involving a radical in a 3� state [83, 84]. The rotationand spin–orbit coupling constants for NH(A), v¼ 0, are b¼ 16.32 and aSO¼�34.6 cm�1. The low rotational levels are intermediate between Hund’s couplingcases (a) and (b), but close enough to case (a) that ! is a useful quantum number.
Ene
rgy/
cm−1
R/au
Figure 11. Adiabatic bender potentials for NH(c1�)–Ne for an effective angular momentum of L¼ 1.For clarity the dashed curves correspond to P¼ 0 and the solid curves to P¼ 1.
Hydride radical van der Waals complexes 403
Dow
nloa
ded
by [
Uni
vers
ity o
f Sa
skat
chew
an L
ibra
ry]
at 1
0:26
09
May
201
2

Following the usual convention, the three spin components are labelled F1, F2, and F3,and for low values of j these are approximately 3�2,
3�1 and3�0. For example, the F1,
j¼ 2 level is given, in terms of pure case (a) basis functions, by the superposition
0:899j3�2i � 0:412j3�1i � 0:150j3�0i. Note that the energy ordering is !¼ 2<1<0as the spin–orbit coupling constant is negative. NH/D(X )–Ne was produced using
photolysis of NH3/ND3 as the radical source. Under jet-cooled conditions the A–X,0–0 band of the monomer shows three strong rotational lines originating from the X
state n¼ 0, j¼ 1 level. These are the R11(1), Q21(1) and P31(1) lines which terminate
on the upper state F1, j¼ 2, F2, j¼ 1 and F3, j¼ 0 levels, respectively. Bands of theNH/D–Ne complex were observed in groups around these rotational lines. This pattern
indicated that the ro-vibronic structure of NH(A) was mostly preserved in the com-
plex (e.g. nearly free internal rotation with no apparent quenching of the spin–orbitcoupling). Sharp rotational structure was observed for two complex features that
were close to the monomer R11(1) line (bands 1 and 2) and one band associated with
Q21(1) (band 3). The rotational structures of bands 1 and 3 were well resolved andreadily assigned to P0 ¼ 2–P00 ¼ 1 and P0 ¼ 0––P00 ¼ 0� transitions, respectively. The spin
splitting of the 3�� ground state was not resolved. Band 2 was a congested overlappingof at least four vibronic transitions. On close examination of band 3 it could be seen
that the lines were perceptibly broadened by predissociation. The complex features
above the Q21(1) line did not show resolvable structure due to rapid predissociation.Upper bounds for the bond energies of D0(A)<40.4 and D0(X )<28.0 cm�1 were
based on the onset of predissociation.The CASPT2/av6z calculations for NH(X )–Ne predicted a linear equili-
brium geometry [83], which was suspicious, as the highest level calculations for
NH(X )–Ar [80] and NH(X )–He [15] predicted bent equilibrium structures. The
CASPT2/av6z surface was weakly anisotropic, such that small errors could have adramatic effect on the angular location of the minimum. To test the robustness of
this result, further calculations were carried out using the more accurate RCCSD(T)
method [83]. For all basis sets larger than avdz this method predicted a bent equilibriumgeometry, with a Jacobi angle near 60�. Additional improvements were achieved by
adding mid-bond functions to the basis set (RCCSD(T)/av6z–BFþCP). Compared to
the CASPT2/av6z results, RCCSD(T)/av6z–BFþCP did not change the well depthsignificantly, but the equilibrium angle shifted to 63.7� and the Re value contracted
from 7.36 to 6.46 au. Bound state calculations for the RCCSD(T)/av6z–BFþCPpotential predicted a bond energy of D0(X )¼ 23.5 cm�1 and rotational energy levels
that were governed by the end-over-end rotational quantum number L. The spin
splitting was of the order of 0.01 cm�1, which is well below the resolution of theavailable spectra. The calculated bond energy was within the experimental upper
bound, and the rotational constant, B0¼ 0.147 cm�1, was on the edge of the error range
for the measured constant B0¼ 0.149(2) cm�1.Energy levels for NH(A)–Ne were calculated using the CASPT2/av6z surfaces.
Adiabatic bender curves for states correlating with the lowest energy levels of NH(A)
are shown in figure 12. Bands 1, 2 and 3 of the A–X spectrum could be assigned byinspection of this figure. Band 1 terminated on the well-separated P0 ¼ 2l, F1 state
while the closely spaced P0 ¼ 1l, 0�, 2u and 1u states were responsible for the congested
structure of band 2. Band 3 is assigned to the P0 ¼ 0–, j¼ 1, F2 level, which, consistent
404 M. C. Heaven
Dow
nloa
ded
by [
Uni
vers
ity o
f Sa
skat
chew
an L
ibra
ry]
at 1
0:26
09
May
201
2

with the observed line broadening, lies above the NH(A, j¼ 2, F1)þNe dissociationlimit. The calculated binding energy for P¼ 2l, F1 of D0(A)¼ 30.6 cm�1 was below theexperimental upper bound, and the rotational constants were in reasonably goodagreement with the observed values. The calculations correctly predicted that theP0 ¼ 0�, F2 state has the largest rotational constant.
0
50
j=0, F3
6 8 10 12−50
0
50
Ene
rgy
/cm
−1
0
R/au
−50
j=1, F2
j=1, F1
j=1, F2
j=2, F1
j=0, F3
P=0+
P=1
P=2
P=0−
P=1
P=2
Figure 12. Adiabatic bender potentials for NH(A)–Ne. The upper and lower panels show states of þ and �parity, respectively. These curves were calculated for total angular momentum J¼ 2. The dissociationasymptotes are labelled by the NH angular momentum ( j ) and the spin–orbit component.
Hydride radical van der Waals complexes 405
Dow
nloa
ded
by [
Uni
vers
ity o
f Sa
skat
chew
an L
ibra
ry]
at 1
0:26
09
May
201
2

Given that the A and c states of NH arise from a common configuration, it wassurprising to find that ab initio potentials determined at the same level of theory
were not of equivalent quality when evaluated against the experimental data. Thetheoretical surfaces for the two electronic states are very similar, in keeping with the
expectation that they are primarily determined by dispersion and repulsive exchangeforces. The experimental data indicate more substantial differences. In future work
it will be of interest to see if this behaviour can be reproduced using methods thatare more sophisticated in their treatment of the correlation energy.
Recent work on the NH(X )þHe interaction potential has been stimulated by the
recognition that NH(X ) is a promising candidate for studies of ultra-cold molecules.The large rotational constant and magnetic moment of NH(X ) are well suited for
techniques that entail 3He buffer gas loading followed by evaporative cooling in
a magnetic trap [85]. For the radicals to remain in the trap it is essential that thecross-section for Zeeman relaxation induced by collisions with He be extremely
small. This cross-section has not been measured, but theoretical calculations [14, 15]indicate that it is a factor of at least 104 smaller than the elastic cross-section
at temperatures in the range 0.5–1K. The reliability of this prediction is criticallydependent upon the accuracy of the theoretical NH(X )–He potential energy surface.
Krems et al. [14] and Cybulski et al. [15] calculated a two-dimensional potential energysurface for NH(X )þHe (RCCSD(T)/avqz–BFþCP). The equilibrium parameters
of this surface were �e¼ 62.3�, Re¼ 6.33 au and De¼ 19.84 cm�1. Bound state calcu-
lations showed that only the zero-point level was stable, with a binding energy ofD0¼ 4.4 cm�1. The rotational energies followed the expression EROT¼B0L(Lþ1)
with a rotational constant of 0.321 cm�1. The spin splitting was below 0.01 cm�1
and levels with L>3 were predicted to be unbound. Kerenskaya et al. [84] observed
the NH–He complex using the A–X transition, hence the NH(A)þHe potentialenergy surfaces were also of interest. Jonas and Staemmler [86] calculated the A
state potentials using the correlated electron pair approximation with an augmented,triple zeta quality basis set and CP corrections. Although the focus of this study
was on the repulsive regions of the potentials, they noted that there were van derWaals minima for the linear geometries, with a well depth of De¼ 21 cm�1 for
NH–He. Jonas and Staemmler [86] estimated that the De value from their calcula-
tions would be too small by a factor of 2. Their potentials were used by Neitschet al. [87] to predict inelastic scattering cross-sections for NH(A)þHe collisions.
Kerenskaya et al. [84] used CASPT2/av6z calculations to better characterize theattractive regions of the potentials. The resulting surfaces were deeper (De¼ 40 cm�1)
than those of Jonas and Staemmler [86] with a shorter equilibrium bonddistance (Re¼ 6.24 versus 6.6 au). Further details are given in table 4. Despite the
fact that De(A) was twice the depth of De(X), bound state calculations with thenew A state potentials yielded a binding energy of D0(A)¼3.3 cm
�1 that was less
than that of the ground state. The steep anisotropy of the potentials in the vicinity of
the global minimum was partly responsible for this unusually large zero-pointenergy. The calculated zero-point rotational constant for the P¼ 2l state was
0.303 cm�1. Adiabatic bender curves for NH(A)–He were qualitatively the same asthose shown in figure 12 for NH(A)–Ne, with the same energy ordering for the various
P states.
406 M. C. Heaven
Dow
nloa
ded
by [
Uni
vers
ity o
f Sa
skat
chew
an L
ibra
ry]
at 1
0:26
09
May
201
2

Kerenskaya et al. [84] obtained NH(X )–He complexes by photolysis of NH3 ina He free-jet expansion. Source pressures in excess of 25 atm were needed to achieveconditions where viable concentrations of the complex could be generated. The complexwas observed in association with the monomer 0–0 and 1–0 transitions. Bandsterminating on the P0 ¼ 2l and 1l states were observed near the monomer R11(1) line.At higher energy a P0 ¼ 0��P00 ¼ 0� band was found on the low-frequency side ofthe monomer Q21(1) line. The lines of this band were broadened by spin–orbitpredissociation. The lifetime of the J¼ 1 level for v¼ 0 was approximately 30 ps.Transitions to or from rotational levels with L>3 were not observed. Dissociationlimits could not be extracted from the spectra, but the difference between the upperand lower state binding energies of D0(A)�D0(X )¼ 0.6 cm�1 was defined. Takenwith the theoretical value for D0(X ) this yields a value of 5.0 cm�1 for D0(A). Thediscrepancy with the theoretical value can be readily accounted for by small errorsin the anisotropy of the A state potentials. A second indication that the anisotropyshould be decreased was given by the interval between the P¼ 1l and 2l states.The measured value for this spacing was 1.3 cm�1 while the calculations predicted2.2 cm�1. The experimental value for the rotational constant of NH(X )–He wasB0¼ 0.334(2) cm�1. This was larger than the effective rotational constant derived fromthe theoretical calculations of Cybulski et al. [15]. Average bond distances, estimatedfrom the relationship hR�2i�1=2 ¼
ffiffiffiffiffiffiffiffiffiffiffiffiffiffiffi�h2=2�B
pwere 7.71 au (theory) and 7.56 au (exp),
which suggests that Re may be slightly overestimated by the ab initio calculations.Detection of NH(X )–He demonstrated that a bound state of the complex exists
and the rotational constant data indicated that the potential energy surface of Cybulskiet al. [15] is reasonably accurate. However, Cybulski et al. [15] have shown that thecalculated Zeeman relaxation cross-sections are extremely sensitive to the details ofthe potential. Further calculations preformed at even higher levels of theory may beneeded to confirm convergence of the results for the Zeeman relaxation cross-sections.
4.4. OH–Rg and SH–Rg complexes
The OH–Rg complexes are the most extensively studied family of open-shell van derWaals molecules [25, 88]. While the data for SH–Rg complexes are not as complete,they have also been the focus of a good number of studies. A comprehensive reviewof the spectroscopic and theoretical work for the complexes of OH and SH withRg¼Ne, Ar and Kr has been provided by Carter et al. [25]. This covers work pub-lished before the year 2000. In the following I will summarize the progress made from2000 onwards.
The larger part of the experimental data for OH–Rg complexes has been derivedfrom studies of the A2�þ�X2� transition. As electronic excitation results in asubstantial change in the interaction potential, LIF spectra for OH–Rg complexesaccess a wide range of vibrationally excited levels of the A state. These data havebeen used to generate empirically refined potential energy surfaces. These exhibitminima for the linear geometries, with the global minimum for OH–Rg. The bestavailable potentials for OH(A)–Ne, Ar, and Kr are still those described by Carteret al. [25] (see table 5). Recent progress for the A-state complexes includes theoreticalstudies of OH(A)–He and OH(A)–Ne, and experimental observations of OH–He.
Hydride radical van der Waals complexes 407
Dow
nloa
ded
by [
Uni
vers
ity o
f Sa
skat
chew
an L
ibra
ry]
at 1
0:26
09
May
201
2

Lee et al. [89] calculated ab initio potential energy surfaces for the A and X states ofOH–He and OH–Ne. They used the RCCSD(T) method with avtz and avqz basissets. Mid-bond functions were included and the CP correction was applied. Bound
state calculations for OH(A)–Ne using the ab initio potential gave results that werein reasonable agreement with the experimental data, but the vibrational intervals
were systematically underestimated. Better agreement was obtained for the rotationalconstants. Lee et al. [89] found that the prediction of the vibrational energies wasoptimized when the potential was scaled by a factor of 1.12. The ab initio potential
for OH(A)–He had the same qualitative form as the potentials for other OH(A)–Rgcomplexes. The global minimum was located at De¼ 121.9 cm�1, Re¼ 5.28 au. Bound
state calculations for OH(A)–He yielded a binding energy of D0¼ 7.12 cm�1 anda rotational constant of B0¼ 0.3695 cm�1.
Calculations for OH(X )–He predicted that the complex should be bound by 6 cm�1.Han and Heaven [90] recently verified the existence of a stable OH–He complex
using the A–X bands. Transitions from the ground state P¼ 3/2þ, J¼ 3/2 level tolevels associated with OH(A), n¼ 0, 1 and 2, were observed. The OH–He origin bandwas red-shifted from the monomer P1(3/2) parent line by 1.6 cm�1. Unfortunately
the rotational structure of this band was obscured by the very intense monomer line.
Table 5. Stationary point data for OH–Rg complexes.
Surface De/cm�1 �e Re/au Reference
OH(X2�)–HeVA0, ab initio 30.02 68.6 5.7 [89]VA0, ab initio 27.06 0 6.55 [89]VA00, ab initio 27.06 0 6.55 [89]VA00, ab initio 21.79 180 6.09 [89]
OH(A2�)–HeV, ab initio 121.9 0 5.28 [89]V, ab initio 51 180 5.13 [89]
OH(X2�)–NeVA0, ab initio 56.65 69.8 5.84 [89]VA0, ab initio 53.46 0 6.58 [89]VA00, ab initio 53.46 0 6.58 [89]VA00, ab initio 44.66 180 6.16 [89]
iv) OH(A2�)–NeV, ab initio 229.8 0 5.43 [89]V, ab initio 83.9 180 5.42 [89]
OH(X2�)–ArVA0, ab initio 147.3 0 7.08 [93]VA00, ab initio 147.3 0 7.08 [93]VA00, ab initio 95.5 180 6.7 [93]
OH(A2�)–ArV, empirical 1096.4 0 5.35 [25]V, empirical 938.6 180 4.2 [25]
OH(A2�)–KrV, empirical 2418.4 0 5.24 [25]V, empirical 1900 180 4.16 [25]
408 M. C. Heaven
Dow
nloa
ded
by [
Uni
vers
ity o
f Sa
skat
chew
an L
ibra
ry]
at 1
0:26
09
May
201
2

The OH–He features associated with the n¼ 1 rotational state are shown in figure 13.A similar pattern of complex features, flanking the monomer R1(3/2) line, was observedfor n¼ 2. The features associated with n¼ 1 and 2 were scattering resonances thatwere well above the OH(A, n¼ 0)þHe dissociation asymptote. The ab initio potentialof Lee et al. [89] was used to calculate the resonance energies and widths. Resonanceswith angular momentum N¼ 0, 1, 2, and 3 were predicted for n¼ 1. The patternof energy intervals for these resonances indicated that K was a well-defined quantumnumber. The K¼ 0 resonances had greater widths than those for K¼ 1. This wasexpected as K¼ 0 corresponds to rotation of OH in the triatomic plane, where thecoupling between the angular and radial motions will be the strongest. The calculatedresonances are compared with the experimental spectrum in figure 13. Overall theagreement is good, but the overestimation of the spacing between the K¼ 0 and K¼ 1groups suggests that the anisotropy of the potential energy surface should be reduced.Calculated resonances for the n¼ 2 group were also in reasonable agreement with theobservations. K was not a good quantum number for this group, mostly due to theCoriolis interactions between the zeroth-order K¼ 0, 1, and 2 states. The energies ofthe OH–He transitions, relative to the monomer lines, were consistent with the bindingenergies calculated by Lee et al. [89]. One interesting fact of OH–He is the predictionthat electronic excitation increases the De from 30 to 122 cm�1, while the D0 valueincreases by just 1.1 cm�1 (1.6 cm�1 observed). This is the consequence of an unusually
32460.0 32470.0 32480.0 32490.0
Energy/cm−1
Inte
nsity
1 2 3 N
Q1(3/2)+QP21(3/2)
K=1
exp.
calc.
0 1 2N
K=0
Figure 13. LIF spectrum and scattering resonance simulation for the A–X transition of OH–He. Theupper trace shows the spectral features of OH–He associated with the n¼ 1 rotational level of OH(A).The intense line in the centre of this spectrum is from the monomer. The lower trace is a simulationof the OH–He spectrum derived from scattering resonance calculations.
Hydride radical van der Waals complexes 409
Dow
nloa
ded
by [
Uni
vers
ity o
f Sa
skat
chew
an L
ibra
ry]
at 1
0:26
09
May
201
2

large zero-point energy effect in the excited state. Simulation of the spectrumsupports this interpretation. A shallower potential surface for OH(A)–He, modified
in a way that permits the reduction of De while maintaining D0, would not have suffi-
cient anisotropy at long range to produce the splittings seen in the resonance structures.In general, the experimental data for the X2� states of OH–Rg complexes are more
limited than those available for the A states. Hence our knowledge of the potential
energy surfaces is more heavily dependent on ab initio calculations. The most extensivedata are for OH(X )–Ne and OH(X )–Ar, where vibrationally excited levels have
been characterized using dispersed fluorescence and SEP techniques [34–36]. Additional
data for OH(X )–Ar are available from microwave measurements and a high-resolutionIR study of bands associated with the OH fundamental [37]. Initially, theoretical
calculations for OH(X )–Ne and OH(X )–Ar predicted linear equilibrium geometriesfor both the A0 and A00 surfaces [25, 88]. More recent studies, carried out with higher-
level methods and larger basis sets, show that the A0 potentials for He and Ne
favour bent configurations (see table 5; note that the half-filled p� orbital of OH(X ) isin the molecular plane for the A0 surface and the field orbital is in-plane for A00). Lee
et al. [89, 91] evaluated the quality of their OH(X )–Ne potentials by calculating
vibrational energies, rotational constants and scattering resonances. The results werecompared with the experimental data and calculations performed using the potential
energy surfaces of Yang et al. [54]. The bound state energies and rotational constants
were close to the experimental values for both sets of potentials, provided that theCoriolis mixing was taken into account. Although the potentials of Lee et al. [89]
were quite similar to those of Yang et al. [54], the degree of rotor basis state mixingfor the potentials was significantly different. Lee et al. [89] found that both the
Coriolis operator and the difference potential induced considerable mixing of the
various zeroth-order P states, while P remained as a good quantum number whenthe potentials of Yang et al. [54] were used. Conflicting predictions for the energy
ordering of the P¼ 3/2– and 1/2þ states was one consequence of these differences.
Since the P¼ 3/2� state has not been observed, the true ordering is not yet known.Scattering resonance calculations for OH(X )–Ne yielded similar insights [91]. While
the potentials of Yang et al. [54] and Lee et al. [89] both gave respectable agree-
ment with the measured resonance energies they differed in their predictions for theresonance lifetimes. Due to details of the state mixings, the lifetimes of Lee et al. [91]
were shorter and showed strong dependencies on the nominal value of P and the parity.Curiously, neither of the model potential sets could reproduce the magnitude of the
increase of the resonance lifetimes that accompanied excitation of the van der Waals
stretch. From these studies it was evident that the scattering resonances providea very exacting test of the quality of the potential energy surfaces.
Empirically adjusted potential energy surfaces for OH(X )–Ar were reported in 1993
by Dubernet and Hutson [92]. These surfaces were successful in fitting nearly all of
the experimental data available at that time. The one unresolved problem was withthe parity splittings for the P¼ 3/2þ and 1/2þ states. Dubernet and Hutson [92] found
that the ratio of the measured parity splittings could not be obtained with any realisticadjustment of the potentials. This anomaly has since been resolved by Bonn et al. [37],
who have corrected the experimental value for the P¼ 1/2þ parity splitting constant.
In this work, high-resolution IR spectra were recorded for transitions to the P¼ 3/2þ
410 M. C. Heaven
Dow
nloa
ded
by [
Uni
vers
ity o
f Sa
skat
chew
an L
ibra
ry]
at 1
0:26
09
May
201
2

and 1/2þ states of OH(X, v¼ 1)–Ar. The parity splitting constant for the P¼ 1/2þ
state was found to be about three times larger than that derived from the partially
resolved SEP spectrum. Bonn et al. [37] successfully reinterpreted the SEP data using
the revised value for the parity splitting constant. Concurrent with the experimentalwork, Klos et al. [93] calculated new ab initio surfaces for OH(X )–Ar using the
UMP4 method with an avtz–BF basis and CP corrections. The global minimum of theA0 surface was found to be linear (De¼ 147.3 cm�1) but this surface also supported
a local minimum for a bent geometry (De¼ 135.5 cm�1, �e¼ 75.1�) and a saddle point
at �¼ 180�. The A0 surface had the usual linear minima, separated by a saddle pointnear �¼ 105� (see table 5). Bound states calculated from these surfaces were in very
good agreement with the experimental results, including the P¼ 1/2þ parity splitting.
The only notable discrepancy was overestimation of the P¼ 3/2þ–1/2þ interval (10.8versus 9.2 cm�1), indicative of a small error in the anisotropy of the average potential.
Carter et al. [25] reviewed the spectroscopic data for SH/D–Ne, Ar, and Kr com-
plexes that had been derived from LIF and dispersed fluorescence studies. Empiricalpotential energy surfaces were fitted to these data. Guided by the results for
OH–Rg complexes, the potentials were constructed with global minima for the linear
SH–Rg geometry. During the past few years the characterization of SH–Rg complexeshas been advanced by a variety of theoretical calculations, and detailed studies
of SH(X )–Rg using microwave techniques. An unexpected general trend was the
discovery that the potential energy surfaces for the ground state complexes havelinear Rg–SH(X ) equilibrium structures. However, the anisotropies of the surfaces are
so weak that the vibrationally averaged structures for the zero-point levels favour theSH–Rg geometry.
Ab initio surfaces for the X and A states of He–SH and Ne–SH were calculated by
Cybulski et al. (RCCSD(T)/avtz–BFþCP) [94]. The stationary points for these
surfaces are listed in table 6. The A0 surfaces exhibited secondary minima for bentconfigurations and saddle points for linear SH–He/Ne, while the A00 surfaces had two
linear minima. The binding energies for SH–He, D0(X )¼ 6.2 cm�1, D0(A)¼ 6.8 cm�1
were found to be similar to those for OH–He. The SH–He complex has not beenobserved to date. The potential energy surfaces for SH(X )–Ne were evaluated
against the experimental data derived from studies of the A–X transition. Cybulskiet al. [94] found that their surfaces yielded rotational constants that were in good
agreement with the experimental values, and the binding energy of D0¼ 31.7 cm�1 was
within the experimental error limits. The fit to the bound vibrational energies wasrespectable, but not quite as good. The dispersed fluorescence data also contained
transitions to scattering resonances above the SH(X, !¼ 3/2, j¼ 3/2)þNe dissociation
limit. Lee and McCoy [91] showed that their surfaces could also reproduce theresonance energies. In comparing the properties of SH(X )–Ne with OH(X )–Ne, Lee
and McCoy [91] noted that the state mixing induced by the difference potential was
less important for SH–Ne. This was a consequence of the larger spin–orbit interactionof SH(X ). Suma et al. [40] recorded microwave spectra for SH(X )–Ne and used the
results to refine the ground state potentials. Their reference potentials were obtainedfrom ab initio calculations that were carried out at the same level of theory as the
work of Cybulski et al. [94]. To fit the microwave data the average potential was
adjusted by a slight inward translation and small corrections to the anisotropy that
Hydride radical van der Waals complexes 411
Dow
nloa
ded
by [
Uni
vers
ity o
f Sa
skat
chew
an L
ibra
ry]
at 1
0:26
09
May
201
2

lessened the energy difference between the linear minima. In addition to giving an
excellent fit to the microwave data, the adjusted potentials yielded energies for vibra-
tionally excited levels and scattering resonances that were in good agreement with the
dispersed fluorescence data. This unusual circumstance, where microwave data for
the zero-point level could be used to define the properties of the potentials at locations
far from the equilibrium geometry, was a consequence of the large-amplitude motion
associated with this level.Sumiyoshi and Endo [41] carried out a similar study of the microwave spectrum of
SH(X )–Ar. Two methods of analysis were employed. First, the microwave transitions
were fitted using a traditional effective Hamiltonian. Interesting details of the constants
determined by this approach included a negative centrifugal distortion constant and
a significantly reduced value for the leading hyperfine coupling constant (as compared
Table 6. Stationary point data for SH–Rg complexes.
Surface De/cm�1 �e Re/au Reference
SH(X2�)–HeVA0, ab initio 25.97 54.4 6.88 [94]VA0, ab initio 25.27 180 6.79 [94]VA00, ab initio 25.27 180 6.79 [94]VA00, ab initio 21.16 0 7.8 [94]
SH(A2�)–HeV, ab initio 49.3 0 7.09 [94]V, ab initio 69.97 180 5.66 [94]
SH(X2�)–NeVA0, ab initio 57 57.2 6.83 [94]VA0, ab initio 54.27 180 6.79 [94]VA00, ab initio 54.27 180 6.79 [94]VA00, ab initio 45.75 0 7.75 [94]Vave, modified 53.13 180 6.75 [40]Vave, modified 48.26 0 7.71 [40]
SH(A2�)–NeV, ab initio 103.2 0 7.04 [94]V, ab initio 107.9 180 5.98 [94]
SH(X2�)–ArVave, ab initio 121.66 0 8.12 [41]Vave, ab initio 123.67 180 7.26 [41]Vave, modified 115.81 34.2 7.74 [41]Vave, modified 121.59 180 7.16 [41]
SH(A2�)–ArV, ab initio 742.5 0 6.42 [95]V, ab initio 673.7 180 5.316 [95]V, empirical 877.2 0 6.46 [25]
SH(X2�)–KrVave, ab initio 160.5 41.4 7.89 [40]Vave, ab initio 163.8 180 7.41 [40]Vave, modified 160.4 46.8 7.76 [25]Vave, modified 167.5 180 7.37 [25]
SH(A2�)–KrV, empirical 1706.2 0 6.17 [25]
412 M. C. Heaven
Dow
nloa
ded
by [
Uni
vers
ity o
f Sa
skat
chew
an L
ibra
ry]
at 1
0:26
09
May
201
2

to free SH). The second approach was to fit empirically adjusted potential surfacesto the data. The reference potential for this process was obtained from ab initiocalculations (RCCSD(T)/avqzþCP). The initial form for the average potential hadlinear minima with well depths of De(0
�)¼ 115 cm�1 and 124 cm�1 (180�). The fittedpotential was less deep by 2 cm�1 for �¼ 180�, but the critical adjustment was reductionof the well depth and anisotropy of the potential near �¼ 0� (De(0
�)¼ 108 cm�1). Thesechanges were needed to reproduce the negative centrifugal distortion constant. Theleading term of the difference potential was reduced by 15%. The fitted potentialsreproduced the hyperfine splittings of the spectrum using the unmodified hyperfineconstants for free SH. Hence it was shown that the smaller constant obtained fromthe fit to the effective Hamiltonian was influenced by vibrational averaging, ratherthan a tangible perturbation of the SH electronic structure.
Ab initio calculations for SH(A)–Ar were reported recently by Hirst et al. [95](RCCSD(T)/av5zþCP). Details of this surface are given in table 6. The rotationalconstants and binding energy (D0¼ 446.7 cm�1) were in agreement with the experi-mental data, while the vibrational intervals were underestimated by about 5%. Allof the observed levels of SH(A)–Ar have been assigned to states that are localizedin the �¼ 0� well, and this was confirmed by Hirst et al. [95]. However, they alsofound that several bound states were supported by the �¼ 180� well. They discussedthe possibility that electronic predissociation of the latter may have precluded theobservation of these states in previous experiments, where the detection of long-livedfluorescence was used to discriminate against the monomer spectrum.
The microwave spectrum of SH(X )–Kr was recorded by Suma et al. [40]. The datawere analysed by direct fitting of the potential energy surfaces. Potentials obtainedfrom CCSD(T)/avqzþBFþCP calculations were used for the initial estimate. Theaverage potential for SH–Kr was a little different from those for –Ne and –Ar in thatthe secondary minimum corresponded to a bent configuration with � near 50�. Thewell depths for the linear minima were De(0
�)¼ 156 cm�1 and De(180�)¼ 164 cm�1
(calculated). Differences between the average ab initio surface and the fitted potentialwere most noticeable near the linear minima. The well depth at 0� was decreased by3 cm�1 while that at 180� was increased by 3 cm�1. The leading term of the differencepotential was decreased by 5% and the surfaces translated inwards by 0.04 au.Vibrationally excited levels of SH(X )–Kr have not yet been observed, and Suma et al.[40] did not report predictions for these levels based on their adjusted potentials.
5. Complexes of HX radicals with multiple Rg atoms
Open-shell molecules interacting with small clusters of rare gas atoms provide usefulmodel systems for studies of the solvation of radicals, the energy level structuresassociated with solvated radicals, and the relative importance of many-body effectsin determining the potential energy surfaces for clusters with multiple interactingpartners. The experimental data for Rgn–HX clusters are rather sparse at present. Thefrequencies for A–X vibronic bands of the OH/D–Nen complexes with n¼ 2� 4 werereported by Lin et al. [96]. Miller and co-workers [97] recorded rotationally resolvedelectronic spectra for OH/D–Ne2, but the analysis of these data has not been completed.
Hydride radical van der Waals complexes 413
Dow
nloa
ded
by [
Uni
vers
ity o
f Sa
skat
chew
an L
ibra
ry]
at 1
0:26
09
May
201
2

Large CH–Arn clusters (n� 50) have been observed in association with the A–Xtransition [98]. Despite the lack of data, there have been a number of interestingtheoretical studies of Rgn–HX complexes. This work has been stimulated by theavailability of good-quality potential energy surfaces for the binary complexes, andit parallels the extensive studies of closed-shell Rgn–HX complexes that have beencarried out in recent years [16–21].
A model for the interaction of a molecule in a 2� state interacting with multiplerare gas atoms has been developed by Xu et al. [22, 99, 100] They represent thecomponents of the potential energy surfaces that arise from the Rg–HX interactionsin terms of the matrix
VRgHX ¼VI VII
V�II Vi
� �ð7Þ
where
VI ¼ �lh jV �lj i ¼Xnk¼1
Vave Rk, �kð Þ ð8Þ
VII ¼ �lh jV lj i ¼Xnk¼1
VdiffðRk, �kÞ expð�2li�kÞ ð9Þ
and Rk, �k and �k are the polar coordinates for the k-th atom. To obtain the completepotentials the pairwise interactions between the Rg atoms and the spin–orbit inter-action energies are added to the diagonal elements of equation (7), and the resultingmatrix is diagonalized. Xu et al. [100] first applied this model to CH(X )–Arn complexeswith n¼ 2–15. Simulated annealing and Newton–Raphson minimization techniqueswere used to locate minimum energy structures. The structure for the CH–Ar2 complexwas found to be dramatically different from the structures of closed-shell Ar2–HXclusters or the open-shell Ar2–NO(2�) complex. In the latter the Ar atoms form adimer that interacts with HX or NO. However, CH(X )–Ar2 has a planar equilibriumstructure with the Ar atoms on either side of the C atom. This configuration losesthe stabilization energy from the Ar–Ar interaction, but this is more than offset by theenergy gained by allowing both Ar atoms to approach along the axis of the emptyp� orbital, thereby accessing the deepest minimum of the Ar–CH potential energysurface. This stable CH–Ar2 unit has a strong influence on the structures of thecomplexes with n¼ 3 and 5–11. While the analogous closed-shell complexes hadthe form of HX interacting with a Rgn cluster, the interaction with CH distorted theRgn cluster to incorporate the stable CH–Ar2 structure (the energy advantage ofmaking a tetrahedral Ar4 cluster wins out for n¼ 4). For n¼ 12–15 the minimumenergy structures preserved the CH–Ar2 motif, but this unit was found at the surfaceof the cluster as this minimizes the disruption of the remaining Ar–Ar interactions.This study clearly demonstrated that the factors influencing the solvation of an
414 M. C. Heaven
Dow
nloa
ded
by [
Uni
vers
ity o
f Sa
skat
chew
an L
ibra
ry]
at 1
0:26
09
May
201
2

open-shell molecule can be qualitatively different from those that govern closed-shellsystems. The insights gained from the calculations of Xu et al. [100] also shed
light on the opposing spectral shifts observed for CH–Arn clusters and matrix
isolated CH. As described in the section on binary clusters, the electronic origin bandfor the A–X transition of CH–Ar is blue-shifted relative to that of the monomer.
Burroughs et al. [98] found that the cluster spectrum remained blue-shifted as the clustersize was increased (the largest clusters examined were estimated to contain about 50Ar
atoms). However, the A–X transition of CH isolated in a solid Ar matrix was red-
shifted relative to free CH by 31 cm�1. The B–X transition also shows a blue-shiftfor CH–Ar and a red-shift in an Ar matrix [98]. In part, these opposing trends can
be understood in terms of the stabilization of the ground state. By placing the CH
on the outer surface, the CH–Arn clusters can adopt structures that maximize theattractive interaction with the empty p� orbital, and minimize repulsive interactions
with the half-filled orbital. In the matrix, CH is embedded in the rare gas solid and
the lattice opposes the symmetry-breaking optimization of the solvent cage. Thiswill destabilize CH(X ) in the matrix, thereby contributing to the observed red-shift.
OH(X2�)–Arn clusters with n¼ 2–15 were examined by Xu et al. [99]. Their study
offers an interesting contrast to the work on CH–Arn as the equilibrium structurefor the binary complex is linear, and the magnitude of the spin–orbit coupling constant
for OH is larger than that for CH (�139 cm�1 versus 28 cm�1). The OH(X )–Arncluster geometries were found to be similar to those of Arn–HCl. For n<10 theycorresponded to symmetric Arnþ1 clusters, with one of the Ar’s replaced by OH. For
example, the lowest energy form of OH–Ar4 could be derived from the trigonalbipyramid form of Ar5 by substituting OH for one of the equatorial Ar’s (C2v
symmetry). The next lowest energy structure was obtained by substituting for one of the
axial Ar atoms (C3v symmetry). High-symmetry structures were predicted, indicatingthat the moderately large spin–orbit interaction of OH had suppressed the expected
Jahn–Teller distortion. An abrupt change in the structure occurred for n¼ 10, where the
OH was located inside an incomplete icosahedral cage. The addition of further Aratoms completed the cage and began the formation of a second solvation sphere. In
contrast to the behaviour of CH in Ar, OH could be incorporated within a symmetric
cage due to the smaller difference potential and stronger spin–orbit coupling.Having located the minimum energy structures for OH(X )–Arn, Xu et al. [22] went
on to examine the quantized vibrational states of the clusters with n¼ 4–12 using large-
scale variational calculations. To reduce the problem to manageable dimensions, the Arcage was frozen. The OH centre of mass and polar angles were treated as free variables
(five-dimensional motion on two potential energy surfaces). The evolution of the OH
bending and translation energy levels was followed as a function of cluster size. Asexpected, the smaller clusters exhibited splittings of the various P states that were
qualitatively similar to the pattern for OH(X )–Ar. The vibrational frequencies for the
translational modes increased with the cluster size. The incorporation of OH inside thecluster at n¼ 10 had a dramatic effect on the energy levels of the bending mode.
Demonstrating a beautiful complementarity, the bending levels for the n¼ 10 and 11clusters were inverted forms of the patterns for OH–Ar2 and OH–Ar. Here the atoms
missing from the icosahedral cage acted as holes in an otherwise symmetric
environment. Symmetry dictates that the spatial degeneracy of the OH j-levels should
Hydride radical van der Waals complexes 415
Dow
nloa
ded
by [
Uni
vers
ity o
f Sa
skat
chew
an L
ibra
ry]
at 1
0:26
09
May
201
2

not be broken is an icosahedral cage. The calculations were essentially inagreement with this expectation, but small splittings were predicted as the rigid cage
from the cluster optimization was slightly distorted. The frequency in the translation
mode was about 60 cm�1 for the closed cage. Xu et al. [22] noted that the rigid cage
model would not be successful for CH(X )–Arn as the distortion of the cage caused bythe empty p� orbital would need to be able to follow the CH for motions involving
internal rotation.Theoretical studies of SH(A)–Nen and OH(A)–Nen have been carried out by Lee et al.
[101–103]. As the radicals are in the orbitally non-degenerate 2�þ state, these clusterscan be treated as closed-shell systems to a good approximation. In their first papers on
this problem, Lee et al. [102, 103] examined SH(A)–Nen and OH(A)–Nen clusters with
n¼ 1–4 to evaluate the suitability of adiabatic diffusion Monte Carlo (ADMC) methodsfor calculations of the bound state properties. The advantage of this method is that it
has favourable computational scaling for the treatment of moderately large systems.
The disadvantage is that it is difficult to treat vibrationally excited levels using ADMC
as prior knowledge of the nodal surfaces of the wavefunctions is required.The equilibrium structures of SH(A)–Nen and OH(A)–Nen clusters were determined
for additive pair-potential models that used empirical potential energy surfaces for the
SH(A)–Ne and OH(A)–Ne interactions. The minimum-energy structures were
consistent with the HX moiety interacting with a symmetric Nen cluster. For n¼ 2the T-shaped Ne2–HX complexes with the H atom pointing towards the mid-point
of the Ne–Ne bond (C2v symmetry) were lowest in energy. The next two isomers
were linear Ne–HX–Ne and NeNe–HX. The global minimum for Ne3–HX was the
tetrahedral-like structure (C3v symmetry) with T-shaped Ne2–HS–Ne (C2v) as thenext most stable structure. The complexes for n¼ 4 yielded different equilibrium
structures for SH and OH. Both were based on a Ne5 trigonal bipyramid with one of
the equatorial Ne’s replaced by the HX group. However, for SH–Ne4 the H atom
points towards the mid-point of the remaining equatorial Ne’s (C2v) while for OH theH atom points towards one of the facets of the trigonal bipyramid (Cs symmetry).
The next lowest energy isomer for both SH and OH was the bipyramid with sub-
stitution of one of the axial Ne’s (C3v).ADMC calculations for the vibrational ground states of the clusters showed that
the zero-point energies were always a substantial fraction of the classical dissociation
energy for HX–Nen!HXþnNe. The factor (De�D0)/De was greater than 0.4 for all
of the clusters examined. From analyses of the wavefunctions and rotational constants,Lee et al. [101, 103] were able to show that the average structures for the zero-point
levels were close to those of the global minimum energy structures, despite the fact
that the barriers between low-lying minima were below the zero-point energies.
Calculations for vibrationally excited levels of Ne2–HX were reported. For the Ne2–SHcomplex the five vibrational modes of the T-shaped isomer were characterized. Similar
results were obtained for Ne2–OH, with one interesting difference. Calculations for
the OH in-plane bending fundamental exhibited convergence problems that were traced
to the existence of a nearby state belonging to an excited bending level of the linearNe–HO–Ne isomer. Variational calculations for SH–Ne2 and OH–Ne2 were used
to evaluate the validity of the ADMC results. Lee et al. [102] determined the energies
of the first 25 vibrational levels of both complexes. Good agreement between the
416 M. C. Heaven
Dow
nloa
ded
by [
Uni
vers
ity o
f Sa
skat
chew
an L
ibra
ry]
at 1
0:26
09
May
201
2

variational energies and those from ADMC was obtained for the zero-point energiesand the fundamentals for the T-shaped isomers. Vibrational progressions belongingto other distinguishable isomers were also predicted by the variational calculations.These included the levels of the two linear isomers (Ne–HX–Ne and NeNe–HX) andan unusual combination state with an average structure that was L-shaped. The densityof states for the Ne2–HX complexes was found to be of the order of one vibrationalstate per waveneumber. Fortunately, the spectroscopic data indicate that very few ofthese modes are active in the A–X spectra, so it has been possible to obtain well-resolveddata. The rich dynamical behaviour expected of the Ne2–HX complexes is sufficientlyintriguing to justify the additional efforts that will be needed to assign the existingdata and extend the spectroscopic characterization of these complexes.
6. Conclusions and future directions
Extensive experimental and theoretical studies of the Rg–HX complexes have provideda clear picture of the factors that govern the interaction potential energy surfacesand the ro-vibronic energy level patterns that develop from the coupling of theelectronic and nuclear degrees of freedom. It is apparent that the interaction forcesare predominantly physical in nature, even when the radical is in an electronicallyexcited valence state. Consequently, the general characteristics of the potential energysurfaces are determined by the physical properties of the radical. The electronicconfiguration of the radical is a particularly important factor, to the extent that thetopologies of the potential energy surfaces, and the relative magnitude of the differencepotential for orbitally degenerate states, can be anticipated from knowledge of theorbital occupation. One example of this trend is the observation that the electronicstates of an Rg–HX complex that are derived from a common electronic configurationhave very similar potential energy surfaces.
Current ab initio electronic structure methods are capable of predicting good-quality potential energy surfaces for the ground and electronically excited states ofRg–HX complexes. However, it is essential that the calculations be carried out usinga sophisticated treatment of the correlation energy, a large basis set, and correctionsfor the basis set superposition errors. RCCSD(T) calculations with basis sets thatinclude mid-bond functions have been very successful. Bound state calculations usingthese surfaces yield predictions that are close enough to the observed spectral patternsthat they can be used to establish reliable assignments. Small adjustments of thepotentials typically yield energy level spacings and rotational constants that reproducethe experimental results. For some of the Rg–HX complexes reported here the analysesof the spectra are incomplete because the correlations between the theoreticallypredicted energy levels and the observed transitions were ambiguous. It is probablethat most of these problems could be traced to the use of electronic structure calcu-lations that were not of sufficient accuracy, and that further progress could bemade by recomputing the potentials using higher-level methods with larger basissets. Ground state potential energy surfaces derived by fitting to microwave dataappear to be accurate, but there are few examples where the ability of these surfacesto predict vibrationally excited levels can be tested against experimental data.
Hydride radical van der Waals complexes 417
Dow
nloa
ded
by [
Uni
vers
ity o
f Sa
skat
chew
an L
ibra
ry]
at 1
0:26
09
May
201
2

Further measurements using SEP and high-resolution IR techniques are neededto develop and validate the ground state potentials. Note that the conclusion thatRg–HX radical complexes are physically bound is based on data for the complexeswhere Rg¼He through Kr. There is evidence from matrix isolation [104] and gasphase emission spectroscopy [105] that indicates chemical bonding for OH–Xe (similarmatrix evidence exists for chemically bound Xe–CN [106] and Xe–C2 [107]). It ispossible that several of the Xe–HX complexes will exhibit incipient chemical bonds.
Now that accurate potential energy surfaces are becoming available for manyRg–HX pairs, the foundation has been laid for studies of clusters that containmultiple rare gas atoms. Although this topic has not received much attention from theexperimentalists, it is evident that spectroscopic studies of larger clusters are feasibleusing established techniques. The fact that hydride radicals still emit fluorescencewhen trapped in rare gas solids shows that non-radiative relaxation processes willnot preclude the application of techniques that rely on LIF detection. Hence the clusterscan be characterized using electronic spectroscopy and UV–IR double resonance.Theoretical methods for treatment of the dynamics of Rgn–HX clusters are beingdeveloped and the results of calculations for CH–Arn and OH–Rgn complexesshow that the properties of open-shell clusters are qualitatively different from thoseof their closed-shell counterparts. Future studies of the Rgn–HX clusters shouldprovide detailed insights concerning the way in which an inert solvent cage influencesthe properties of a reactive molecular fragment. Eventually it is hoped that the resultsfrom such studies will facilitate the transfer of our extensive knowledge of gas-phasereaction dynamics to the problems of reactions occurring in solution.
Acknowledgements
Thanks go to Drs Galina Kerenskaya, Anatoly Komissarov, Alexey Kaledin, JiandeHan and Udo Schnupf for their contributions to the Rg–HX studies carried outat Emory University. Support from the National Science Foundation (grant CHE-0213313) for the Emory component of the research described here is gratefullyacknowledged.
References
[1] D. Skouteris, D. E. Manolopoulos, W. Bian, H.-J. Werner, L.-H. Lai, and K. Liu, Science 286,
1713 (1999).[2] P. J. Dagdigian, Advanced Series phys. Chem. 6, 315 (1995).[3] P. J. Dagdigian, Ann. Rev. phys. Chem. 48, 95 (1997).[4] M. H. Alexander, Chem. Phys. 92, 337 (1985).[5] M. H. Alexander and G. C. Corey, J. chem. Phys. 84, 100 (1986).[6] P. J. Dagdigian, M. H. Alexander, and K. Liu, J. chem. Phys. 91, 839 (1989).[7] K. Liu, R. G. Macdonald, and A. F. Wagner, Int. Rev. phys. Chem. 9, 187 (1990).[8] G. Chalasinski and M. M. Szczesniak, Chem. Rev. 100, 4227 (2000).[9] J. M. Merrit, J. Kupper, and R. E. Miller, Phys. Chem. chem. Phys. 7, 67 (2005).
[10] J. Kupper, J. M. Merritt, and R. E. Miller, J. chem. Phys. 117, 647 (2002).[11] J. P. Toennies and A. F. Vilesov, Angewandte Chemie, International Edition 43, 2622 (2004).[12] S. Y. T. van de Meerakker, P. H. M. Smeets, N. Vanhaecke, R. T. Jongma, and G. Meijer, Phys. Rev.
Lett. 94, 023004 (2005).
418 M. C. Heaven
Dow
nloa
ded
by [
Uni
vers
ity o
f Sa
skat
chew
an L
ibra
ry]
at 1
0:26
09
May
201
2
[13] D. Egorov, W. C. Campbell, B. Friedrich, S. E. Maxwell, E. Tsikata, L. D. van Buuren, and J. M. Doyle,Eur. Phys. J. D 31, 307 (2004).
[14] R. V. Krems, H. R. Sadeghpour, A. Dalgarno, D. Zgid, J. Klos, and G. Chalasinski, Phys. Rev. A:Atomic, Molecular, and Optical Physics 68, 051401/1 (2003).
[15] H. Cybulski, R. V. Krems, H. R. Sadeghpour, A. Dalgarno, J. Klos, G. C. Groenenboom, A. van derAvoird, D. Zgid, and G. Chalasinski, J. chem. Phys. 122, 094307 (2005).
[16] A. Ernesti and J. M. Hutson, Phys. Rev. A: Atomic, Molecular, and Optical Physics 51, 239 (1995).[17] Z. Bacic, J. Chem. Soc. 93, 1459 (1997).[18] J. M. Hutson, S. Liu, J. W. Moskowitz, and Z. Bacic, J. chem. Phys. 111, 8378 (1999).[19] M. Xu, H. Jiang, and Z. Bacic, J. chem. Phys. 121, 11045 (2004).[20] A. McIlroy, R. Lascola, C. M. Lovejoy, and D. J. Nesbitt, J. phys. Chem. 95, 2636 (1991).[21] K. Nauta and R. E. Miller, J. chem. Phys. 115, 10138 (2001).[22] M. Xu, Z. Bacic, and J. M. Hutson, J. chem. Phys. 117, 4787 (2002).[23] Y. Kim and H. Meyer, Int. Rev. phys. Chem. 20, 219 (2001).[24] M. D. Wheeler, D. T. Anderson, and M. I. Lester, Int. Rev. phys. Chem. 19, 501 (2000).[25] C. C. Carter, H. S. Lee, A. B. McCoy, and T. A. Miller, J. mol. Struct. 525, 1 (2000).[26] J. Klos, M. M. Szczesniak, and G. Chalasinski, Int. Rev. phys. Chem. 23, 541 (2004).[27] M. C. Heaven, Ann. Rev. phys. Chem. 43, 283 (1992).[28] Y. Endo, H. Kohguchi, and Y. Ohshima, Faraday Discuss. 97, 341 (1994).[29] Y. Ohshima, M. Lida, and Y. Endo, J. chem. Phys. 95, 7001 (1991).[30] S. R. Mackenzie, O. Votava, J. R. Fair, and D. J. Nesbitt, J. chem. Phys. 105, 11360 (1996).[31] S. R. Mackenzie, O. Votava, J. R. Fair, and D. J. Nesbitt, J. chem. Phys. 110, 5149 (1999).[32] B. C. Chang, L. Yu, D. Cullin, B. Rehfuss, J. Williamson, T. A. Miller, W. M. Fawzy, X. Zheng, S. Fei,
and M. C. Heaven, J. chem. Phys. 95, 7086 (1991).[33] J. Schleipen, L. Nemes, and J. J. ter Meulen, Chem. Phys. Lett. 175, 56 (1990).[34] M. I. Lester, W. H. Green, Jr., C. Chakravarty, and D. C. Clary, Advanced Series phys. Chem. 4,
659 (1995).[35] C.-C. Chuang, P. M. Andrews, and M. I. Lester, J. chem. Phys. 103, 3418 (1995).[36] M. T. Berry, R. A. Loomis, L. C. Giancarlo, and M. I. Lester, J. chem. Phys. 96, 7890 (1992).[37] R. T. Bonn, M. D. Wheeler, and M. I. Lester, J. chem. Phys. 112, 4942 (2000).[38] D. T. Anderson, R. L. Schwartz, M. W. Todd, and M. I. Lester, J. chem. Phys. 109, 3461 (1998).[39] Y. Ohshima, K. Sato, Y. Sumiyoshi, and Y. Endo, J. Am. Chem. Soc. 127, 1108 (2005).[40] K. Suma, Y. Sumiyoshi, and Y. Endo, J. chem. Phys. 120, 6935 (2004).[41] Y. Sumiyoshi, Y. Endo, and Y. Ohshima, J. chem. Phys. 113, 10121 (2000).[42] Y. Sumiyoshi, Y. Endo, and Y. Ohshima, J. mol. Spectrosc. 222, 22 (2003).[43] A. F. Wagner, T. H. Dunning, and R. A. Kok, J. chem. Phys. 100, 1326 (1994).[44] M. H. Alexander, S. Gregurick, P. J. Dagdigian, G. W. Lemire, M. J. McQuaid, and R. C. Sausa,
J. chem. Phys. 101, 4547 (1994).[45] S. Cybulski, G. Chalasinski, and M. M. Szczesniak, J. chem. Phys. 105, 9525 (1996).[46] M. L. Dubernet, D. Flower, and J. M. Hutson, J. chem. Phys. 94, 7602 (1991).[47] M. H. Alexander, S. Gregurick, and P. J. Dagdigian, J. chem. Phys. 101, 2887 (1994).[48] C. Chakravarty and D. C. Clary, J. chem. Phys. 94, 4149 (1990).[49] W. H. Green, Jr., and M. I. Lester, J. chem. Phys. 96, 2573 (1992).[50] M. L. Dubernet, P. A. Tuckey, and J. M. Hutson, Chem. phys. Lett. 193, 355 (1992).[51] U. Schnupf, J. M. Bowman, and M. C. Heaven, Chem. phys. Lett. 189, 487 (1992).[52] J. M. Bowman, B. Gazdy, P. Schafer, and M. C. Heaven, J. phys. Chem. 94, 2226 (1990).[53] M. Yang, M. H. Alexander, C.-C. Chuang, R. W. Randall, and M. I. Lester, J. chem. Phys. 103,
905 (1995).[54] M. Yang and M. H. Alexander, J. chem. Phys. 103, 3400 (1995).[55] M. Yang, M. H. Alexander, S. Gregurick, and P. J. Dagdigian, J. chem. Phys. 102, 2413 (1995).[56] J. M. Hutson, J. chem. Phys. 91, 4448 (1989).[57] G. Kerenskaya, A. L. Kaledin, and M. C. Heaven, J. chem. Phys. 115, 2123 (2001).[58] G. Kerenskaya, U. Schnupf, W. H. Basinger, and M. C. Heaven, J. chem. Phys. 123, 054304 (2005).[59] M. Meuwly and J. M. Hutson, J. chem. Phys. 110, 8338 (1999).[60] M. M. Law and J. M. Hutson, Comp. Phys. Comm. 102, 252 (1997).[61] E. Hwang and P. J. Dagdigian, J. chem. Phys. 101, 2903 (1994).[62] E. Hwang and P. J. Dagdigian, J. chem. Phys. 102, 2426 (1995).[63] M. Kind, F. Stuhl, Y.-R. Tzeng, M. H. Alexander, and P. J. Dagdigian, J. chem. Phys. 114, 4479 (2001).[64] B. Nizamov and P. J. Dagdigian, J. phys. Chem. A 107, 2256 (2003).[65] M. H. Alexander, W. R. Kearney, and A. F. Wagner, J. chem. Phys. 100, 1338 (1994).[66] M. H. Alexander and P. J. Dagdigian, J. chem. Phys. 101, 7468 (1994).[67] S. M. Ball, G. Hancock, and M. R. Heal, J. Chem. Soc. Faraday Trans. 90, 1467 (1994).
Hydride radical van der Waals complexes 419
Dow
nloa
ded
by [
Uni
vers
ity o
f Sa
skat
chew
an L
ibra
ry]
at 1
0:26
09
May
201
2

[68] S. M. Ball, G. Hancock, and M. R. Heal, J. Chem. Soc. Faraday Trans. 90, 523 (1994).[69] G. Richmond, M. L. Costen, and K. G. McKendrick, J. phys. Chem. A 109, 542 (2005).[70] C.-C. Wang, Y.-P. Chen, T.-L. Chin, H.-Y. Huang, and K.-C. Lin, J. chem. Phys. 112, 10204 (2000).[71] J. L. Cooper and J. C. Whitehead, J. Chem. Soc., Faraday Trans. 89, 1287 (1993).[72] H. J. Crichton, C. Murray, and K. G. McKendrick, Phys. Chem. chem. Phys. 4, 5768 (2002).[73] J. L. Cooper and J. C. Whitehead, J. phys. Chem. 98, 8274 (1994).[74] G. W. Lemire, M. J. McQuaid, A. J. Kotlar, and R. C. Sausa, J. chem. Phys. 99, 91 (1993).[75] M. J. McQuaid, G. W. Lemire, and R. C. Sausa, Chem. phys. Lett. 210, 350 (1993).[76] A. V. Komissarov and M. C. Heaven, J. chem. Phys. 113, 1775 (2000).[77] W. H. Basinger, W. G. Lawrence, and M. C. Heaven, J. chem. Phys. 103, 7218 (1995).[78] Schnupf, U. 1995. Ab initio study of triatomic open shell van der Waals complexes. PhD Thesis, Emory
University, Atlanta.[79] G. Jansen and B. A. Hess, Chem. phys. Lett. 192, 21 (1992).[80] R. A. Kendall, G. Chalasinski, J. Klos, R. Bukowski, M. W. Severson, M. M. Szczesniak, and S.
M. Cybulski, J. chem. Phys. 108, 3235 (1998).[81] R. W. Randall, C.-C. Chuang, and M. I. Lester, Chem. phys. Lett. 200, 113 (1992).[82] G. Kerenskaya, U. Schnupf, and M. C. Heaven, J. chem. Phys. 119, 8424 (2003).[83] G. Kerenskaya, U. Schnupf, M. C. Heaven, A. van der Avoird, and G. C. Groenenboom, Phys. Chem.
chem. Phys. 7, 846 (2005).[84] G. Kerenskaya, U. Schnupf, M. C. Heaven, and A. van der Avoird, J. chem. Phys. 121, 7549 (2004).[85] S. Y. T. van de Meerakker, R. T. Jongma, H. L. Bethlem, and G. Meijer, Phys. Rev. A 64,
041401/1 (2001).[86] R. Jonas and V. Staemmler, Z. Phys. D. Atoms, Molecules and Clusters 14, 143 (1989).[87] L. Neitsch, F. Stuhl, P. J. Dagdigian, and M. H. Alexander, J. chem. Phys. 104, 1325 (1996).[88] M. C. Heaven, J. phys. Chem. 97, 8567 (1993).[89] H.-S. Lee, A. B. McCoy, R. R. Toczylowski, and S. M. Cybulski, J. chem. Phys. 113, 5736 (2000).[90] J. Han and M. C. Heaven, J. chem. Phys. 123, 064307 (2005).[91] H.-S. Lee and A. B. McCoy, Phys. Chem. chem. Phys. 4, 1564 (2002).[92] M. L. Dubernet and J. M. Hutson, J. chem. Phys. 99, 7477 (1993).[93] J. Klos, G. Chalasinski, M. T. Berry, R. A. Kendall, R. Burcl, M. M. Szczesniak, and S. M. Cybulski,
J. chem. Phys. 112, 4952 (2000).[94] S. M. Cybulski, R. R. Toczylowski, H.-S. Lee, and A. B. McCoy, J. chem. Phys. 113, 9549 (2000).[95] D. M. Hurst, R. J. Doyle, and S. R. Mckenzie, Phys. Chem. chem. Phys. 6, 5463 (2004).[96] Y. Lin, S. Fei, X. Zheng, and M. C. Heaven, J. chem. Phys. 96, 5020 (1992).[97] Miller, T. A. private communication.[98] A. Burroughs and M. C. Heaven, J. phys. Chem. A 104, 3842 (2000).[99] M. Xu, Z. Bacic, and J. M. Hutson, J. chem. Phys. 117, 4777 (2002).
[100] M. Xu, Z. Bacic, and J. M. Hutson, Faraday Discuss 118, 405 (2001).[101] H.-S. Lee, J. M. Herbert, and A. B. McCoy, J. chem. Phys. 111, 9203 (1999).[102] H.-S. Lee and A. B. McCoy, J. chem. Phys. 116, 9677 (2002).[103] H.-S. Lee and A. B. McCoy, J. chem. Phys. 114, 10278 (2001).[104] J. Goodman and L. E. Brus, J. chem. Phys. 67, 4858 (1977).[105] H. M. R. Hutchinson, Chem. phys. Lett. 54, 359 (1978).[106] A. Thoma, G. Schallmoser, A. M. Smith, B. E. Wurfel, and V. E. Bondybey, J. chem. Phys. 100,
5387 (1994).[107] M. Frankowski, A. M. Smith-Gicklhorn, and V. E. Bondybey, Can. J. Chem. 82, 837 (2004).
420 M. C. Heaven
Dow
nloa
ded
by [
Uni
vers
ity o
f Sa
skat
chew
an L
ibra
ry]
at 1
0:26
09
May
201
2