Embed Size (px)
Citation preview
Spectroscopy of giants and supergiants!
Maria Bergemann MPIA Heidelberg"
Spectroscopy of (cool) giants and supergiants!
Maria Bergemann MPIA Heidelberg"
Outline!
• Motivation – why do spectroscopy of giant stars?"
• Spectroscopy – state-of-the-art in modeling and observations"
• Simulations – predictive power of theory"• Conclusions – forthcoming instruments:
what can we expect with ‘giants’ like E-ELT?"
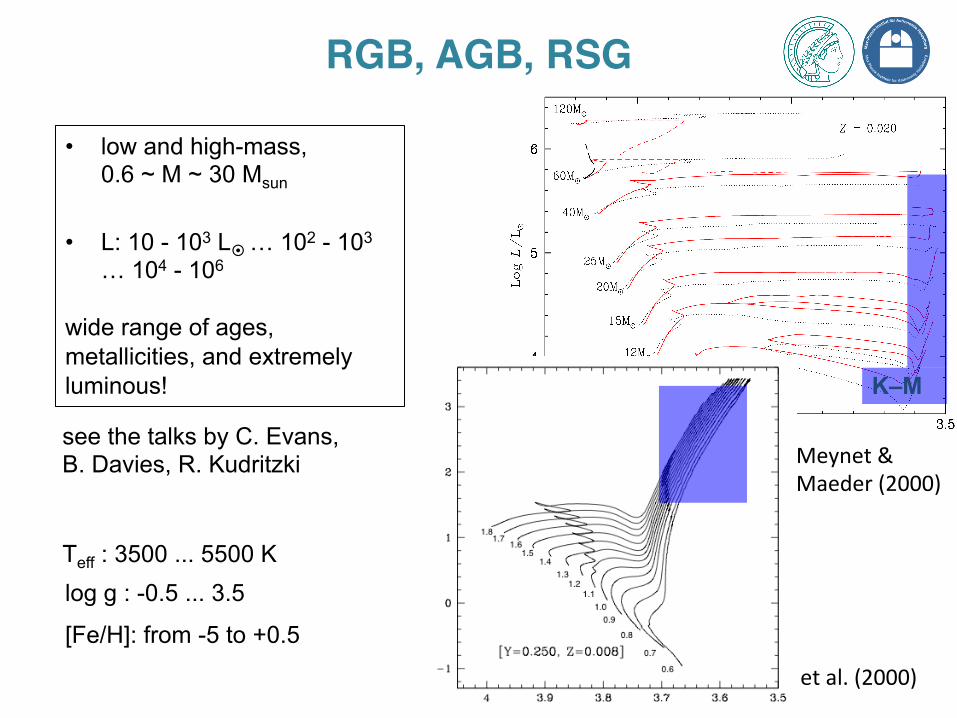
RGB, AGB, RSG!
log L/L S
un
Salasnich et al. (2000)
• low and high-mass, 0.6 ~ M ~ 30 Msun
• L: 10 - 103 L¤ … 102 - 103 … 104 - 106
wide range of ages, metallicities, and extremely luminous! K–M
Meynet & Maeder (2000)
see the talks by C. Evans, B. Davies, R. Kudritzki
Teff : 3500 ... 5500 K log g : -0.5 ... 3.5
[Fe/H]: from -5 to +0.5
Plume – mass loss
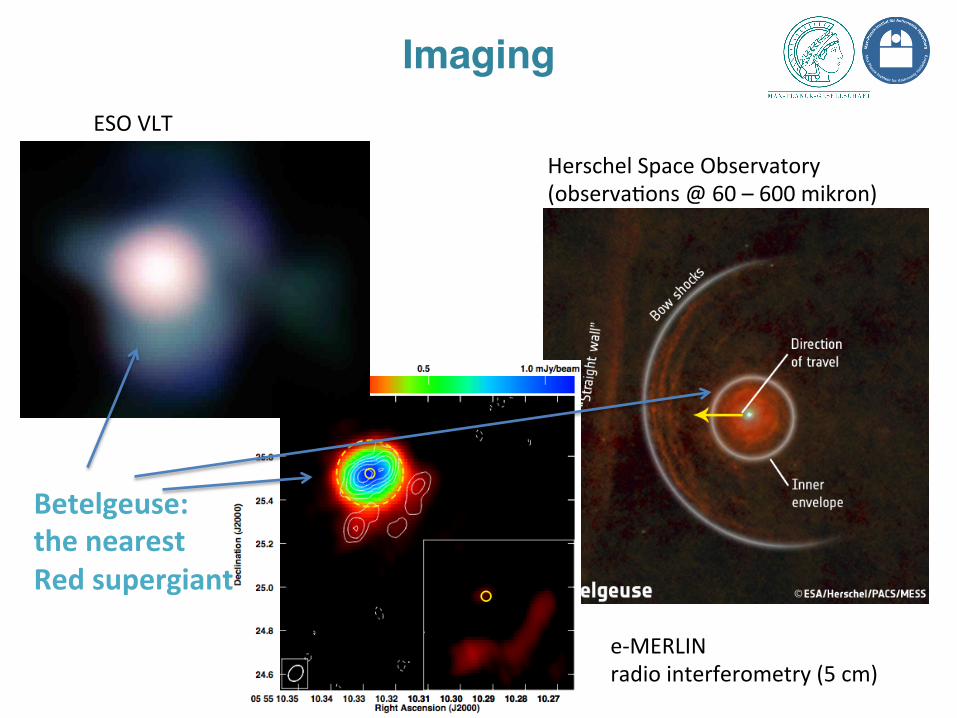
ESO VLT
Herschel Space Observatory (observaCons @ 60 – 600 mikron)
Bow shocks
e-‐MERLIN radio interferometry (5 cm)
Betelgeuse: the nearest Red supergiant
Imaging!
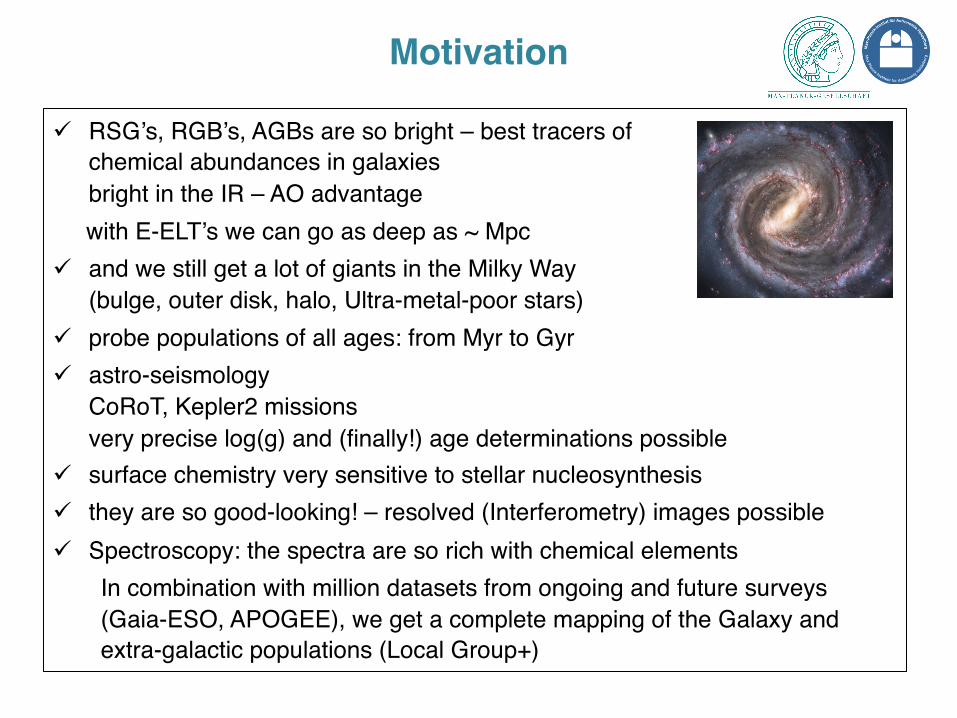
Motivation!
ü RSG’s, RGB’s, AGBs are so bright – best tracers ofchemical abundances in galaxiesbright in the IR – AO advantage"
with E-ELT’s we can go as deep as ~ Mpc "ü and we still get a lot of giants in the Milky Way
(bulge, outer disk, halo, Ultra-metal-poor stars)"ü probe populations of all ages: from Myr to Gyr"ü astro-seismology
CoRoT, Kepler2 missionsvery precise log(g) and (finally!) age determinations possible"
ü surface chemistry very sensitive to stellar nucleosynthesis"ü they are so good-looking! – resolved (Interferometry) images possible"ü Spectroscopy: the spectra are so rich with chemical elements"
In combination with million datasets from ongoing and future surveys (Gaia-ESO, APOGEE), we get a complete mapping of the Galaxy and extra-galactic populations (Local Group+)"
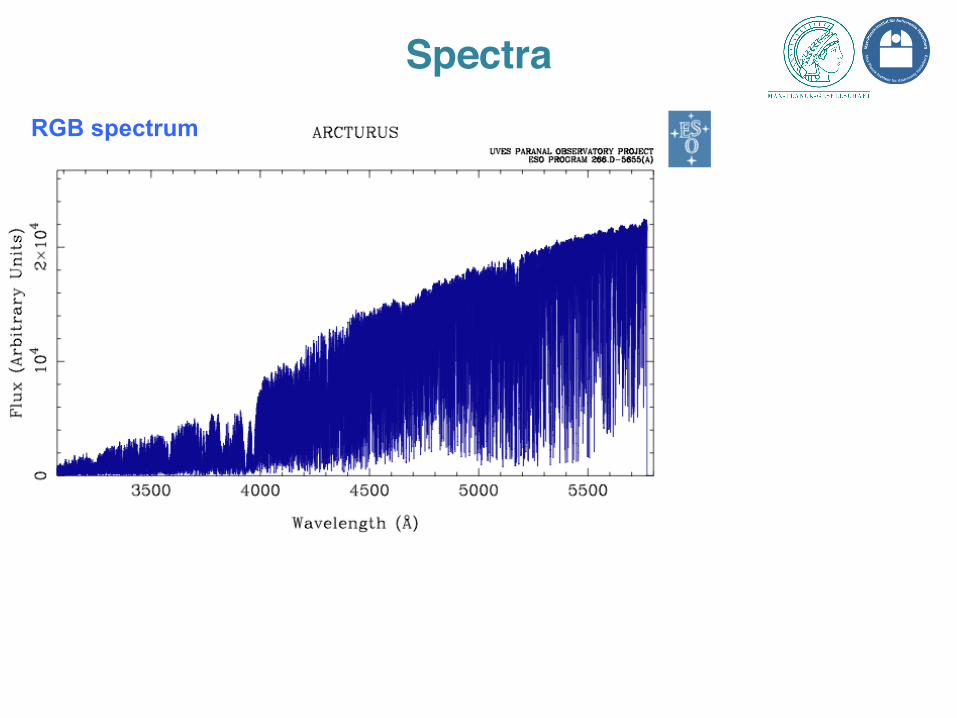
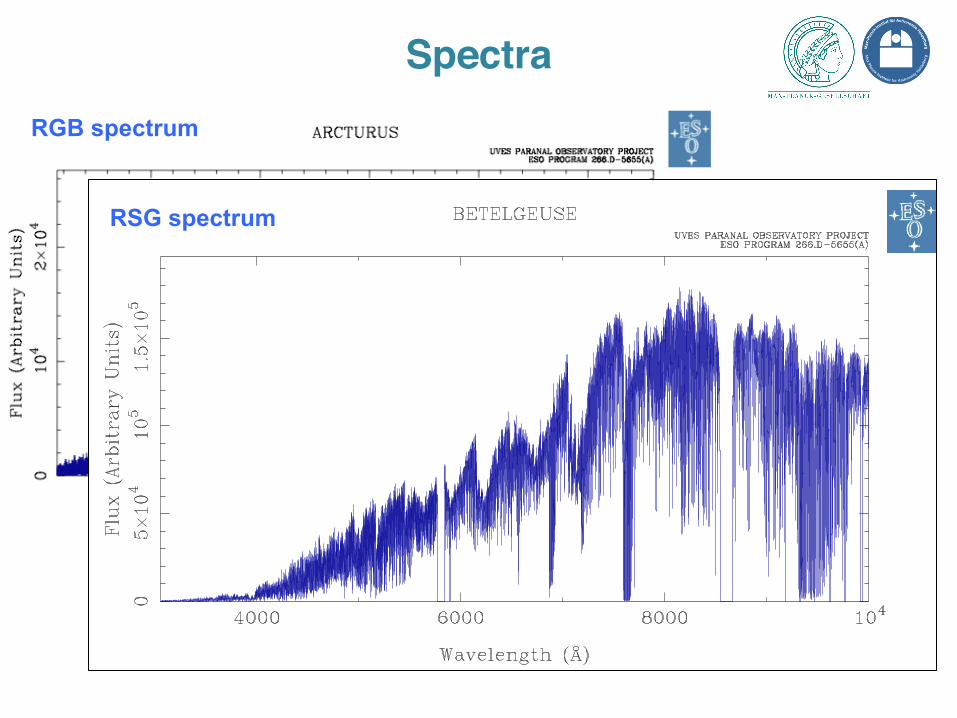
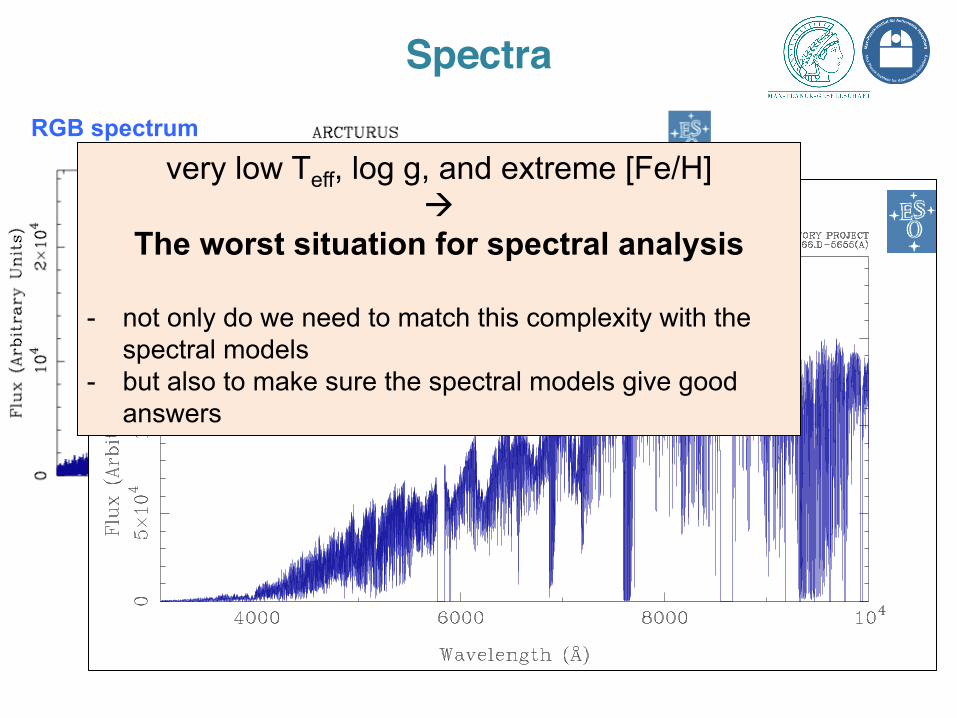
RGB spectrum
Spectra!
Kervella et al. (2009)
RGB spectrum
Spectra!
Kervella et al. (2009)
RSG spectrum
RGB spectrum
Spectra!
Kervella et al. (2009)
RSG spectrum
very low Teff, log g, and extreme [Fe/H] à
The worst situation for spectral analysis
- not only do we need to match this complexity with the spectral models
- but also to make sure the spectral models give good answers
Kervella et al. (2009)
1. Molecular opacities (+ a ‘forest’ of other parasitic spectral features) 2. Asymmetric shapes with ‘hot spots’ and mass loss 3. MOLsphere, Dust
Deviations from hydrostatic equilibrium and giant convective cells 4. Deviations from local thermodynamic equilibrium (NLTE) 5. Chromospheres
Atmospheres of giants!
Kervella et al. (2009)
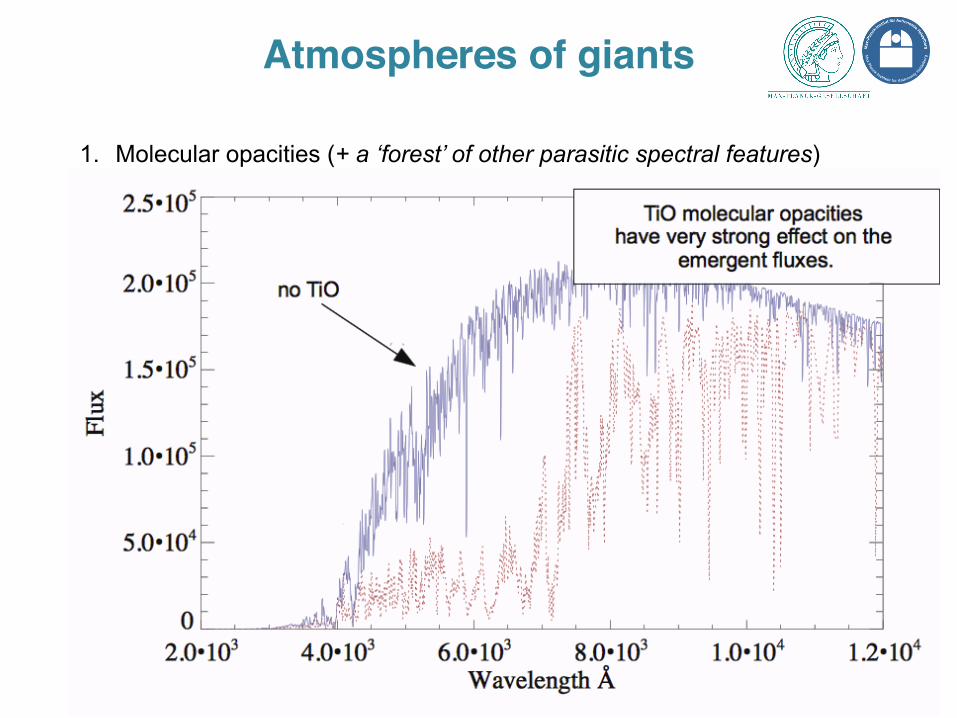
Atmospheres of giants!
with TiO
1. Molecular opacities (+ a ‘forest’ of other parasitic spectral features) 2. Asymmetric shapes with ‘hot spots’ and mass loss 3. MOLsphere (H2O, SiO) 4. Deviations from hydrostatic equilibrium and giant convective cells 5. Deviations from local thermodynamic equilibrium (NLTE) 6. Chromospheres
Kervella et al. (2009)
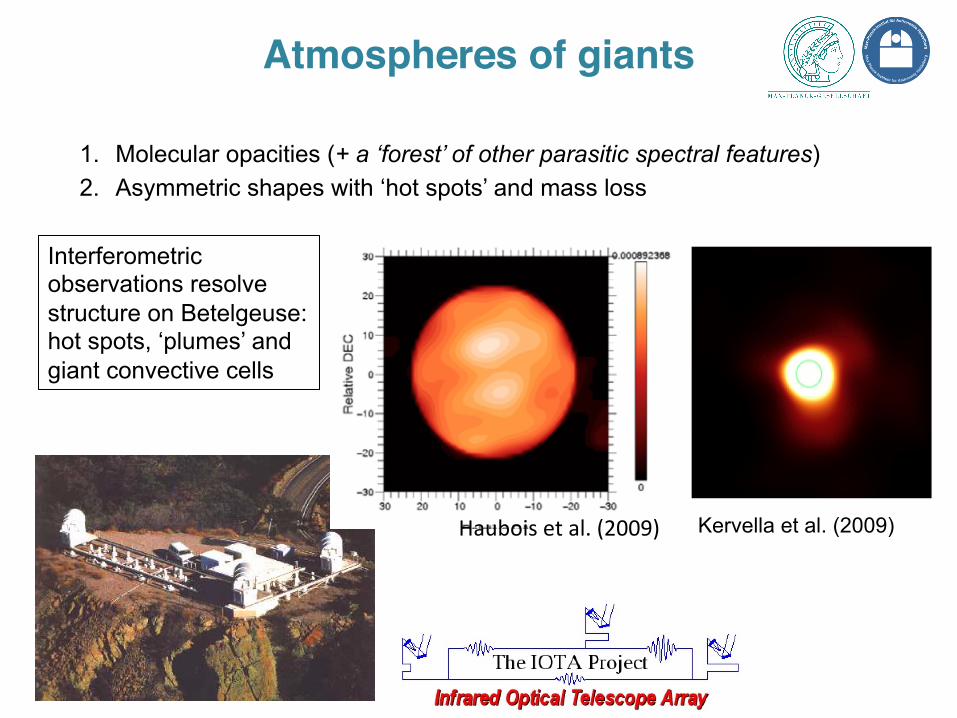
Atmospheres of giants!
1. Molecular opacities (+ a ‘forest’ of other parasitic spectral features) 2. Asymmetric shapes with ‘hot spots’ and mass loss 3. MOLsphere (H2O, SiO) 4. Deviations from hydrostatic equilibrium and giant convective cells 5. Deviations from local thermodynamic equilibrium (NLTE) 6. Chromospheres
Interferometric observations resolve structure on Betelgeuse: hot spots, ‘plumes’ and giant convective cells
Kervella et al. (2009) Haubois et al. (2009)
Kervella et al. (2009)
Atmospheres of giants!
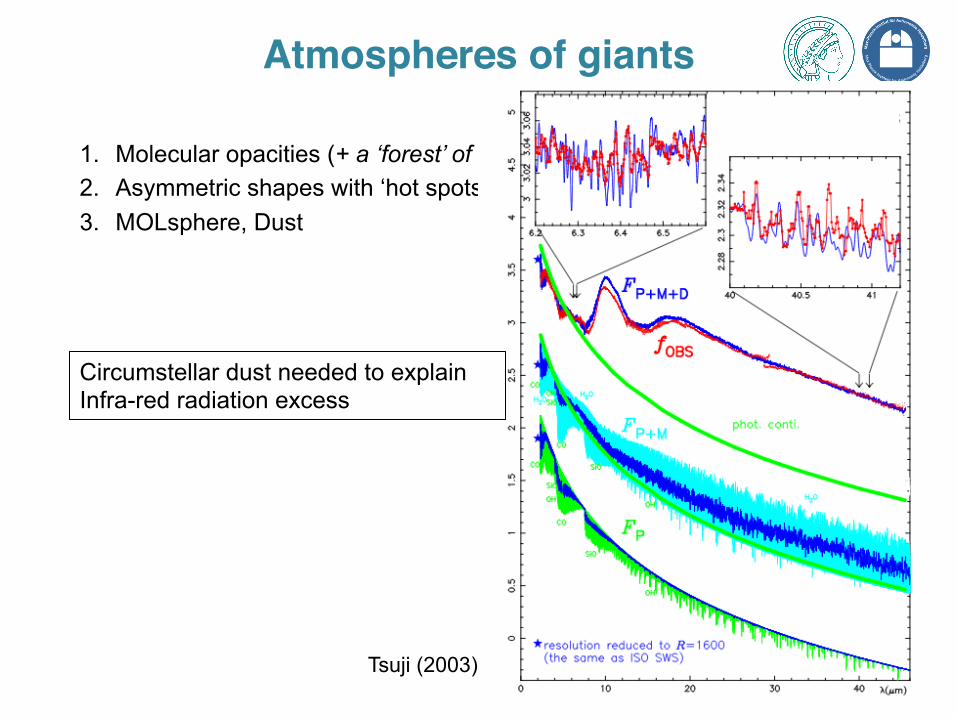
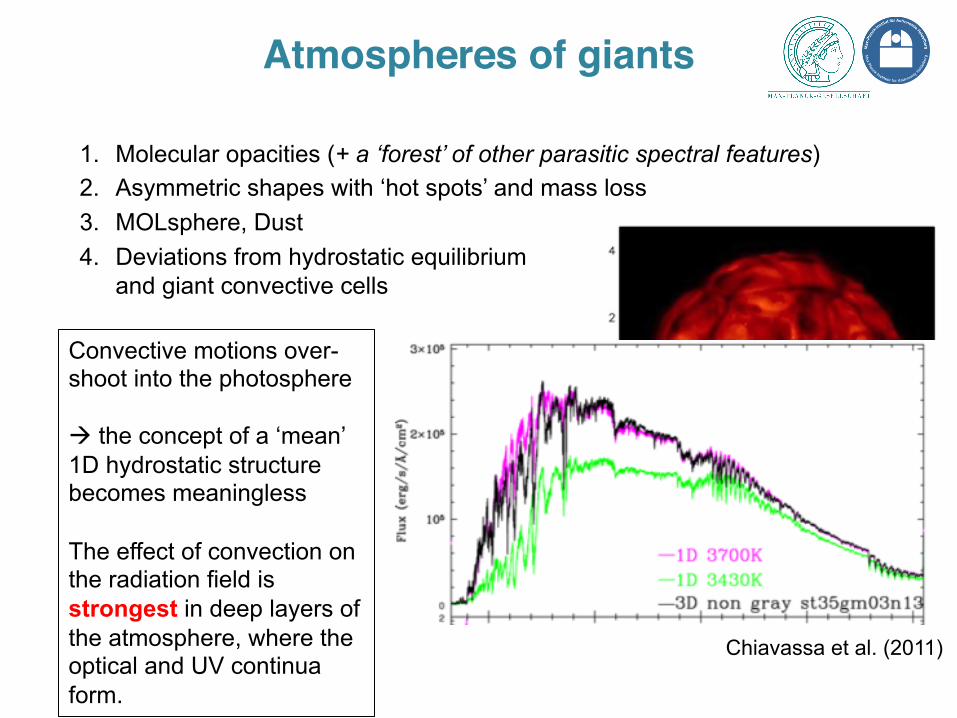
1. Molecular opacities (+ a ‘forest’ of other parasitic spectral features) 2. Asymmetric shapes with ‘hot spots’ and mass loss 3. MOLsphere, Dust 4. Deviations from hydrostatic equilibrium and giant convective cells 5. Deviations from local thermodynamic equilibrium (NLTE) 6. Chromospheres
Tsuji (2003)
Circumstellar dust needed to explain Infra-red radiation excess
Atmospheres of giants!
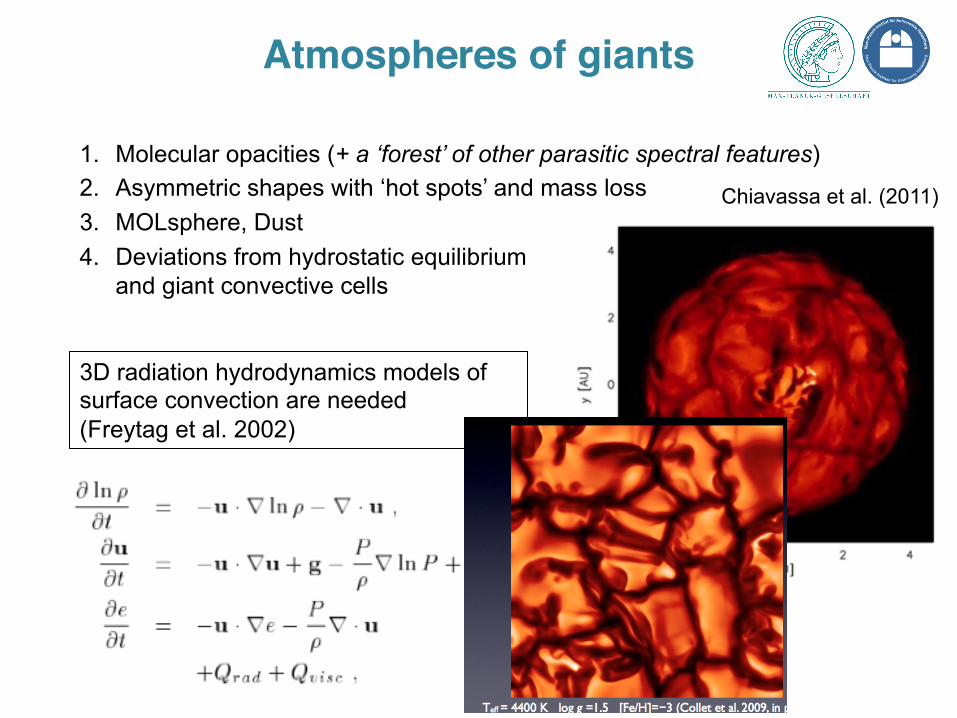
1. Molecular opacities (+ a ‘forest’ of other parasitic spectral features) 2. Asymmetric shapes with ‘hot spots’ and mass loss 3. MOLsphere, Dust 4. Deviations from hydrostatic equilibrium
and giant convective cells 5. Deviations from local thermodynamic equilibrium (NLTE) 6. Chromospheres 3D radiation hydrodynamics models of surface convection are needed (Freytag et al. 2002)
Chiavassa et al. (2011)
1. Molecular opacities (+ a ‘forest’ of other parasitic spectral features) 2. Asymmetric shapes with ‘hot spots’ and mass loss 3. MOLsphere, Dust 4. Deviations from hydrostatic equilibrium
and giant convective cells 5. Deviations from local thermodynamic equilibrium (NLTE) 6. Chromospheres
Kervella et al. (2009)
Atmospheres of giants!
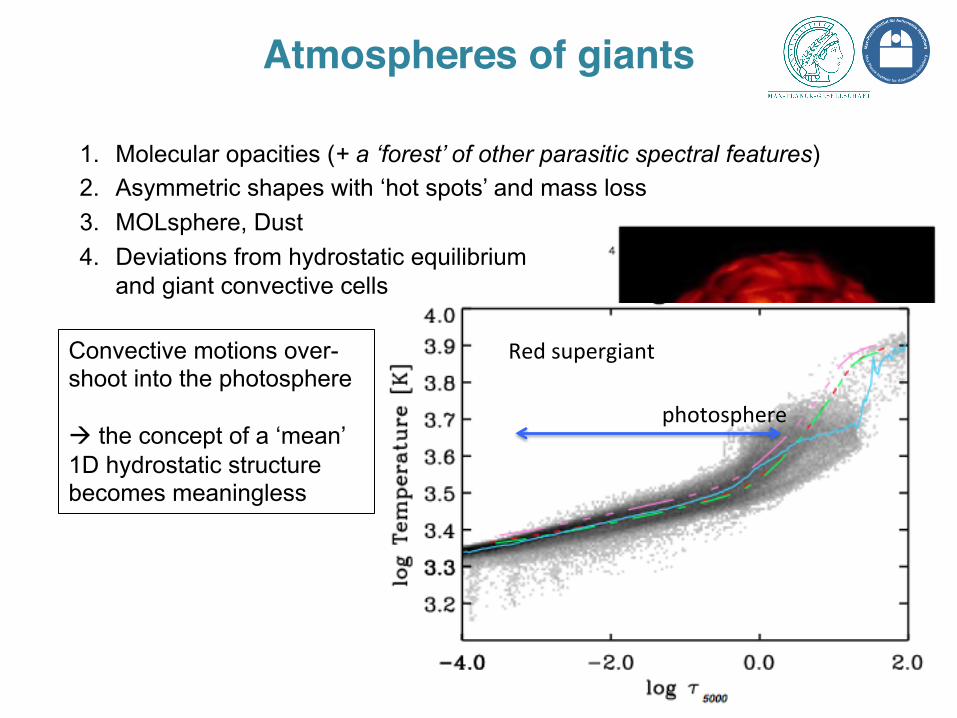
Convective motions over-shoot into the photosphere à the concept of a ‘mean’ 1D hydrostatic structure becomes meaningless
photosphere
Red supergiant
1. Molecular opacities (+ a ‘forest’ of other parasitic spectral features) 2. Asymmetric shapes with ‘hot spots’ and mass loss 3. MOLsphere, Dust 4. Deviations from hydrostatic equilibrium
and giant convective cells 5. Deviations from local thermodynamic equilibrium (NLTE) 6. Chromospheres
Kervella et al. (2009)
Atmospheres of giants!
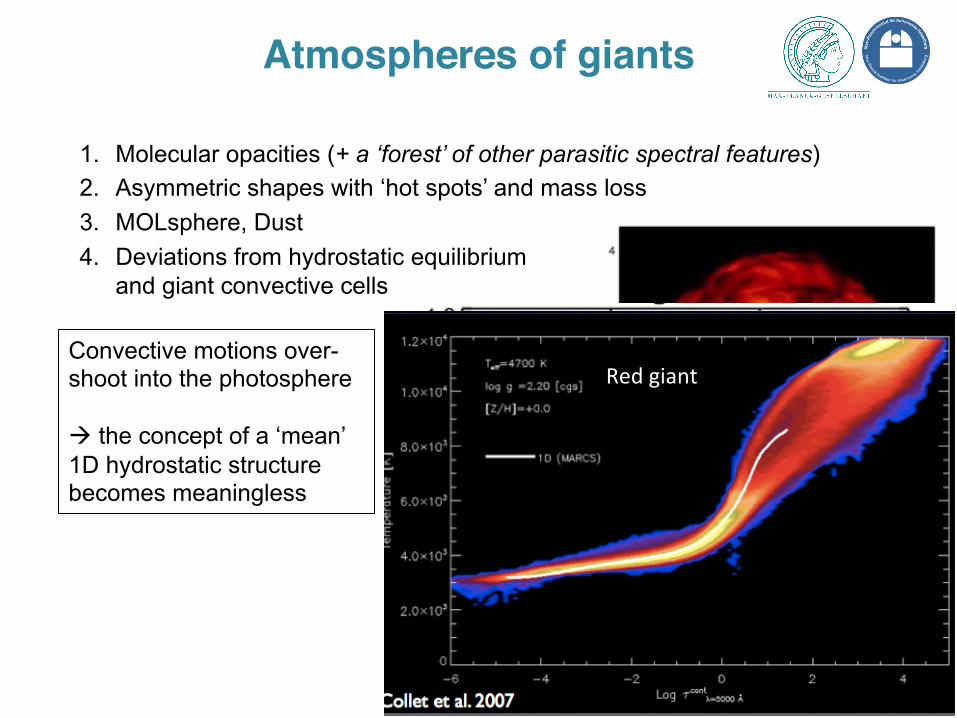
Convective motions over-shoot into the photosphere à the concept of a ‘mean’ 1D hydrostatic structure becomes meaningless
photosphere
Red giant
1. Molecular opacities (+ a ‘forest’ of other parasitic spectral features) 2. Asymmetric shapes with ‘hot spots’ and mass loss 3. MOLsphere, Dust 4. Deviations from hydrostatic equilibrium
and giant convective cells 5. Deviations from local thermodynamic equilibrium (NLTE) 6. Chromospheres
Kervella et al. (2009)
Atmospheres of giants!
Convective motions over-shoot into the photosphere à the concept of a ‘mean’ 1D hydrostatic structure becomes meaningless The effect of convection on the radiation field is strongest in deep layers of the atmosphere, where the optical and UV continua form.
photosphere
Chiavassa et al. (2011)
Kervella et al. (2009)
1. Molecular opacities (+ a ‘forest’ of other parasitic spectral features) 2. Asymmetric shapes with ‘hot spots’ and mass loss 3. MOLsphere, Dust 4. Deviations from hydrostatic equilibrium
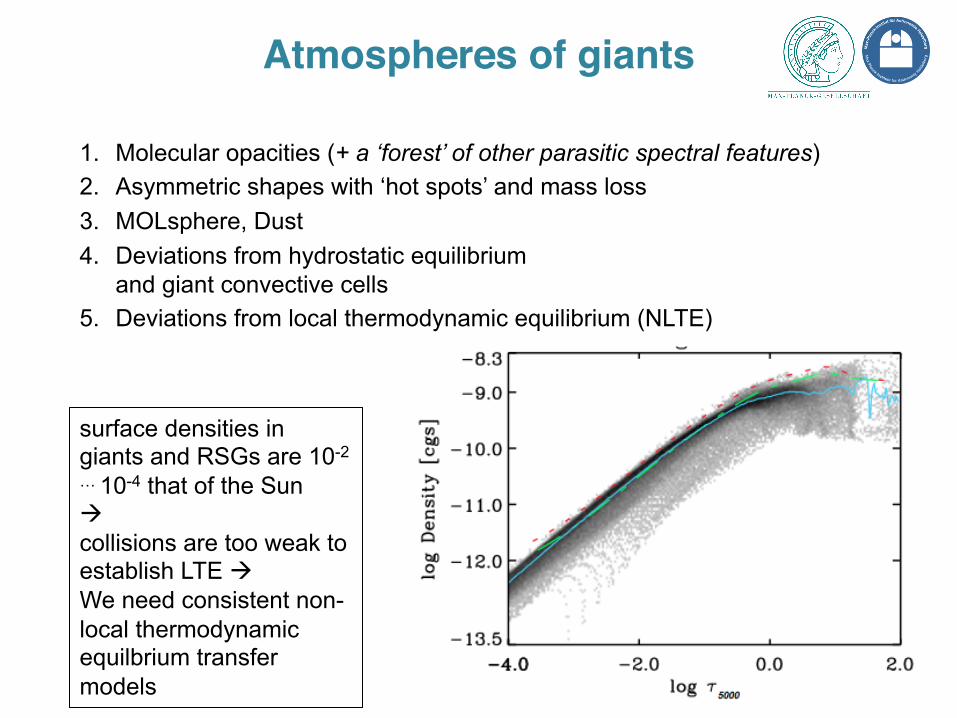
and giant convective cells 5. Deviations from local thermodynamic equilibrium (NLTE)
Atmospheres of giants!
Kervella et al. (2009)
surface densities in giants and RSGs are 10-2
… 10-4 that of the Sun à collisions are too weak to establish LTE à We need consistent non-local thermodynamic equilbrium transfer models
Kervella et al. (2009)
1. Molecular opacities (+ a ‘forest’ of other parasitic spectral features) 2. Asymmetric shapes with ‘hot spots’ and mass loss 3. MOLsphere (H2O, SiO) 4. Deviations from hydrostatic equilibrium
and giant convective cells 5. Deviations from local thermodynamic equilibrium (NLTE)
Atmospheres of giants!
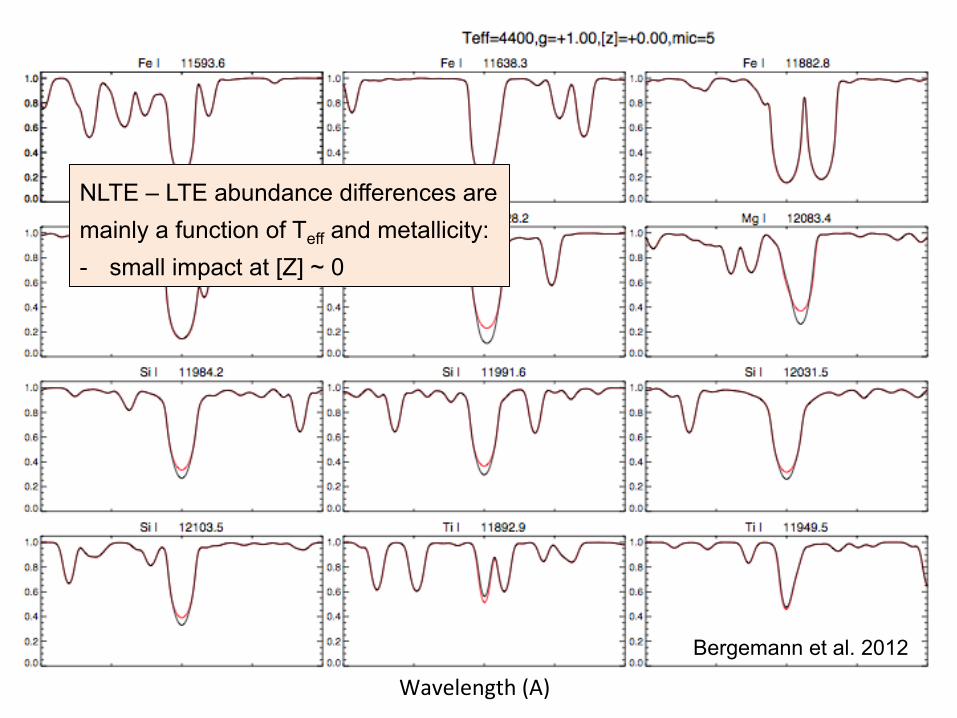
NLTE abundance corrections are mainly a function of Teff and metallicity
NLTE – LTE abundance differences are mainly a function of Teff and metallicity: - small impact at [Z] ~ 0
Bergemann et al. 2012
Wavelength (A)
Kervella et al. (2009)
1. Molecular opacities (+ a ‘forest’ of other parasitic spectral features) 2. Asymmetric shapes with ‘hot spots’ and mass loss 3. MOLsphere (H2O, SiO) 4. Deviations from hydrostatic equilibrium
and giant convective cells 5. Deviations from local thermodynamic equilibrium (NLTE)
Atmospheres of giants!
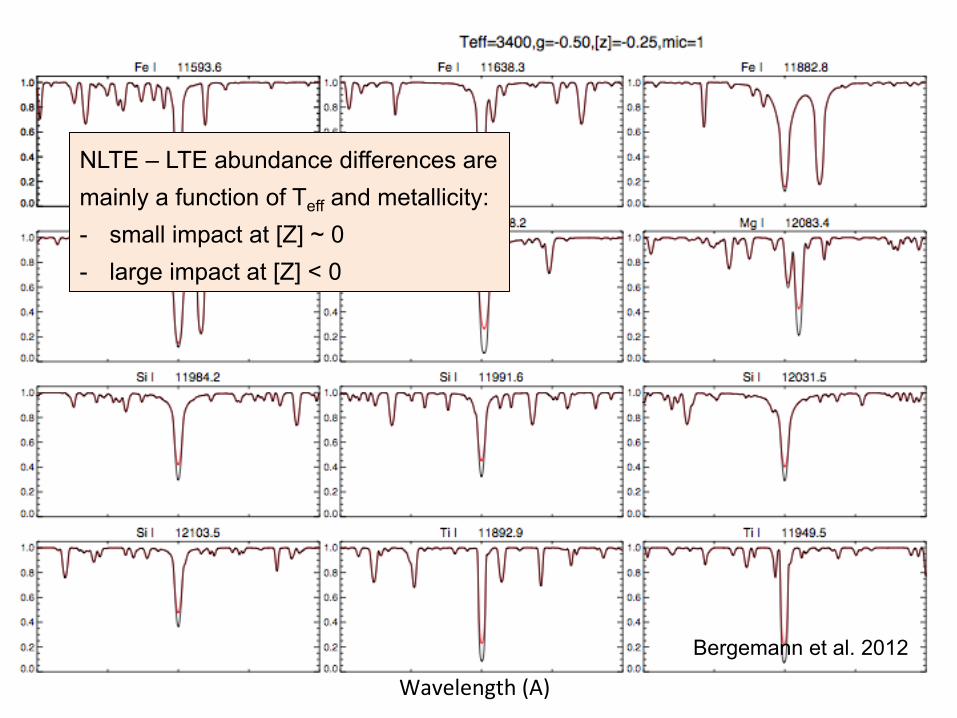
NLTE abundance corrections are mainly a function of Teff and metallicity
NLTE – LTE abundance differences are mainly a function of Teff and metallicity: - small impact at [Z] ~ 0 - large impact at [Z] < 0
Bergemann et al. 2012
Wavelength (A)
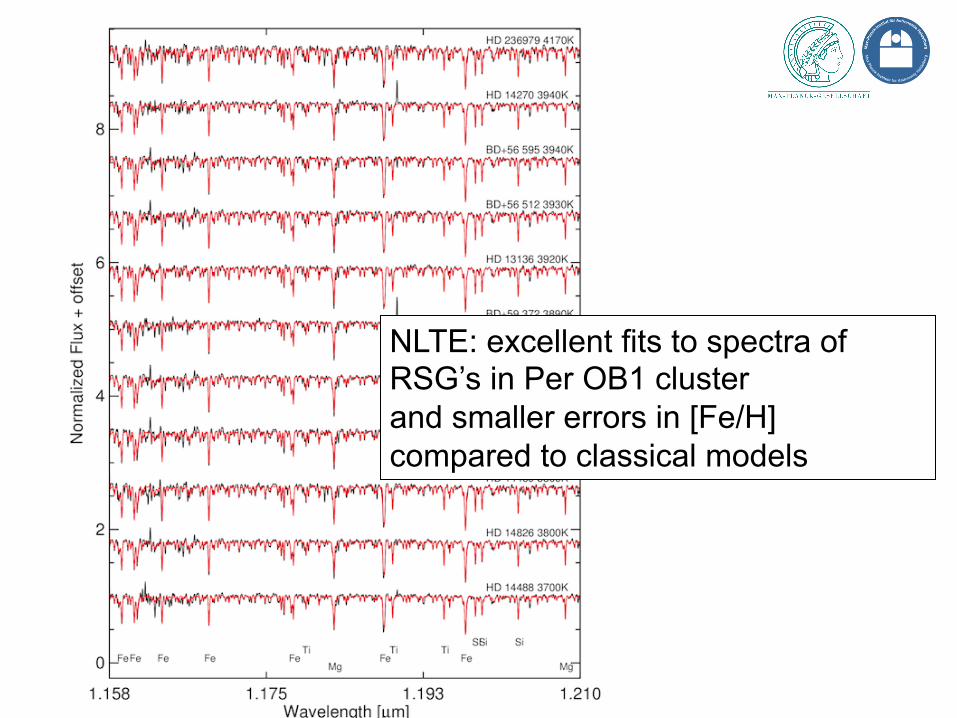
NLTE: excellent fits to spectra of RSG’s in Per OB1 cluster and smaller errors in [Fe/H] compared to classical models
Kervella et al. (2009)
Models and their predictive power!
Models and their predictive power!
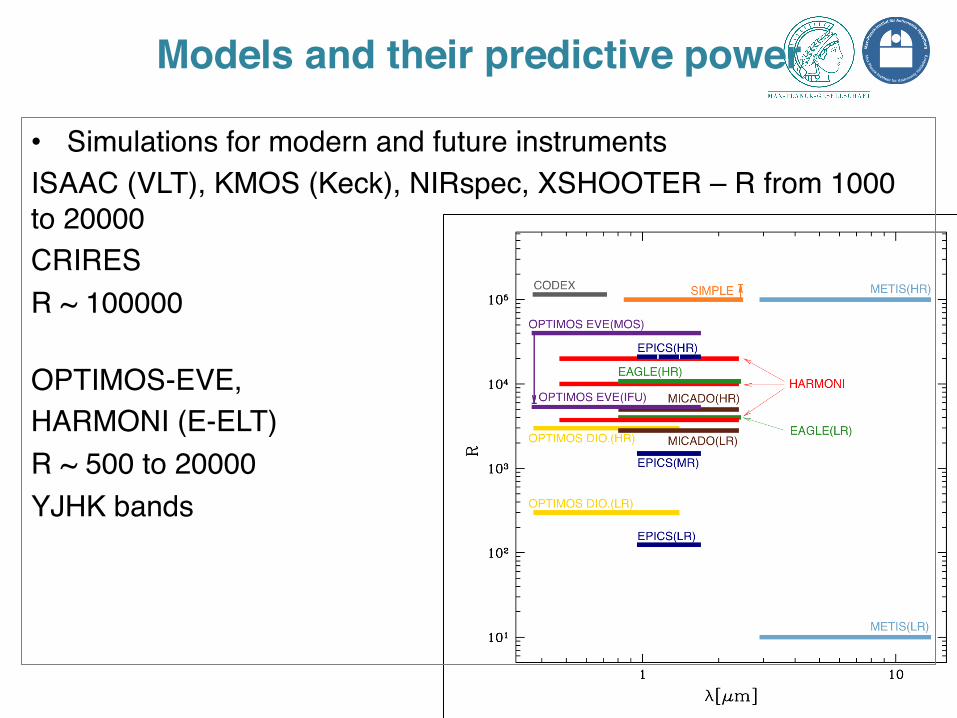
• Simulations for modern and future instruments"ISAAC (VLT), KMOS (Keck), NIRspec, XSHOOTER – R from 1000 to 20000"CRIRES"R ~ 100000 "OPTIMOS-EVE,"HARMONI (E-ELT)"R ~ 500 to 20000"YJHK bands""
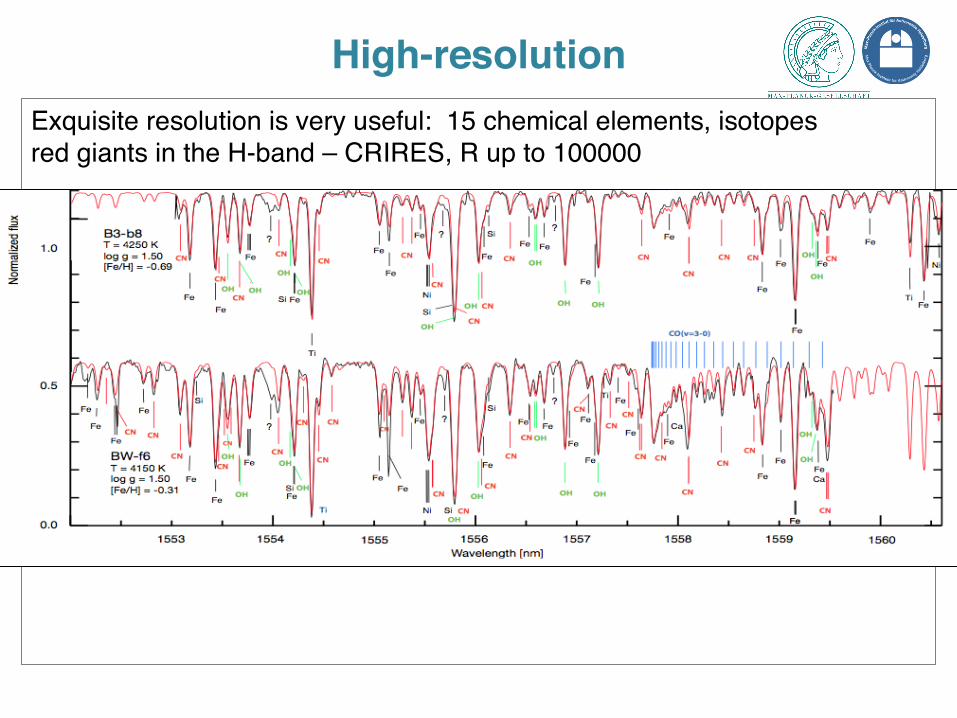
High-resolution!Exquisite resolution is very useful: 15 chemical elements, isotopesred giants in the H-band – CRIRES, R up to 100000"
Simulations!
1. S/N 100, Res = 20000 2. S/N 30, Res = 6000 3. S/N 10, Res = 3000
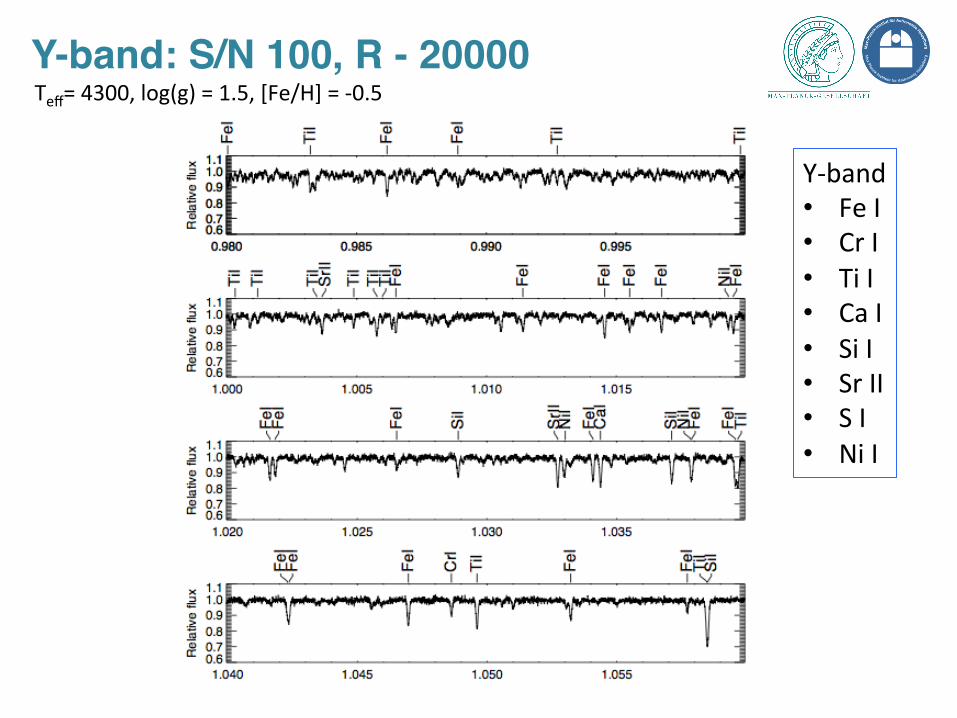
Y-band: S/N 100, R - 20000!
Y-‐band • Fe I • Cr I • Ti I • Ca I • Si I • Sr II • S I • Ni I
Teff= 4300, log(g) = 1.5, [Fe/H] = -‐0.5
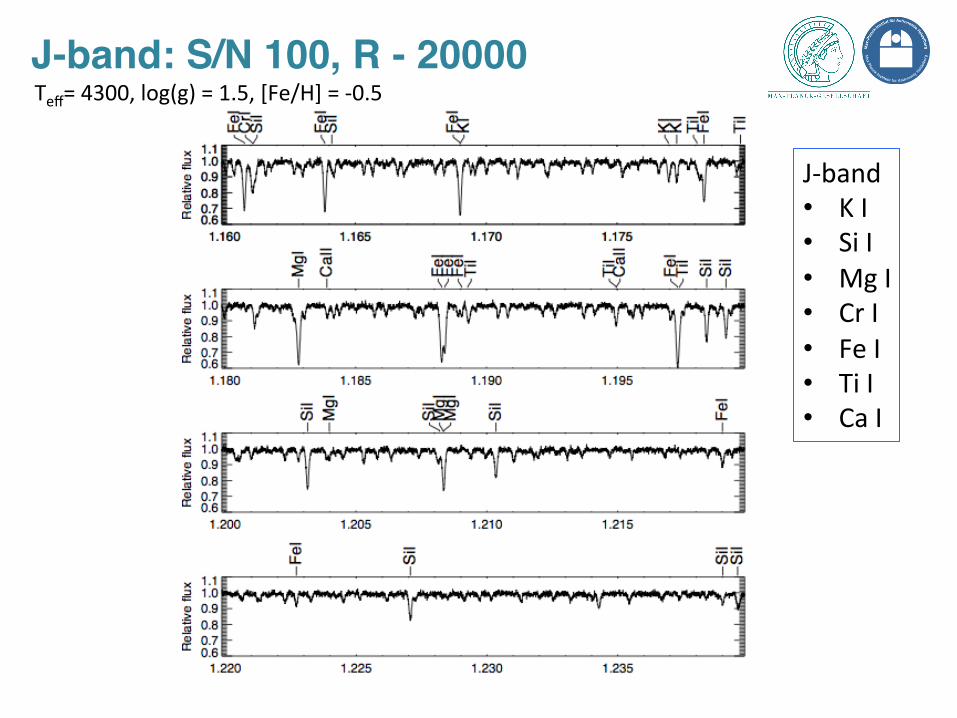
J-band: S/N 100, R - 20000!
J-‐band • K I • Si I • Mg I • Cr I • Fe I • Ti I • Ca I
Teff= 4300, log(g) = 1.5, [Fe/H] = -‐0.5
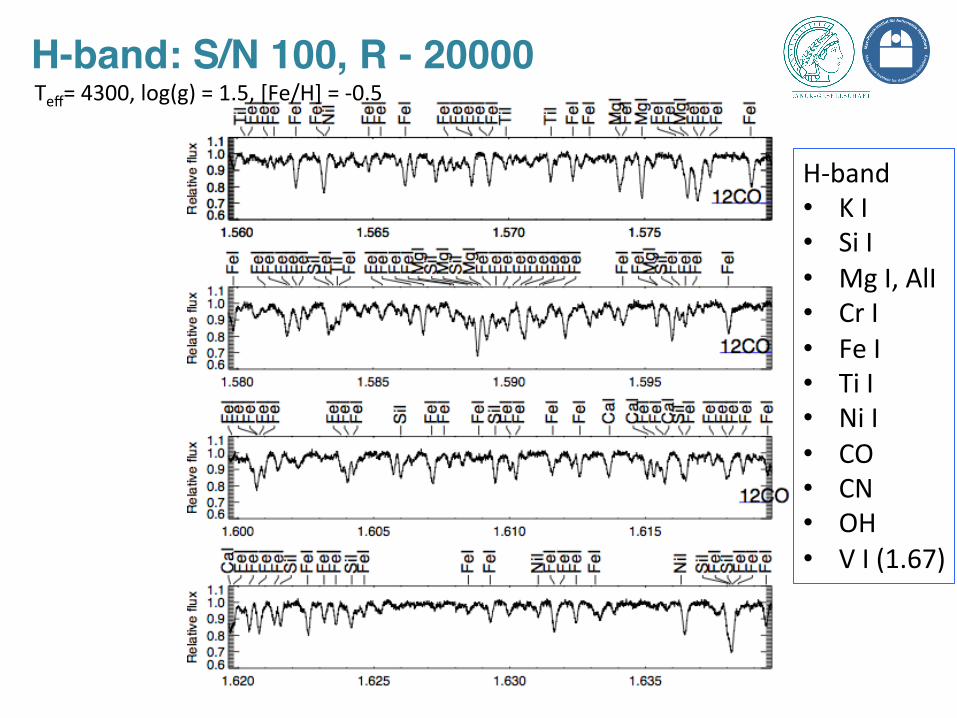
H-band: S/N 100, R - 20000!
H-‐band • K I • Si I • Mg I, AlI • Cr I • Fe I • Ti I • Ni I • CO • CN • OH • V I (1.67)
Teff= 4300, log(g) = 1.5, [Fe/H] = -‐0.5
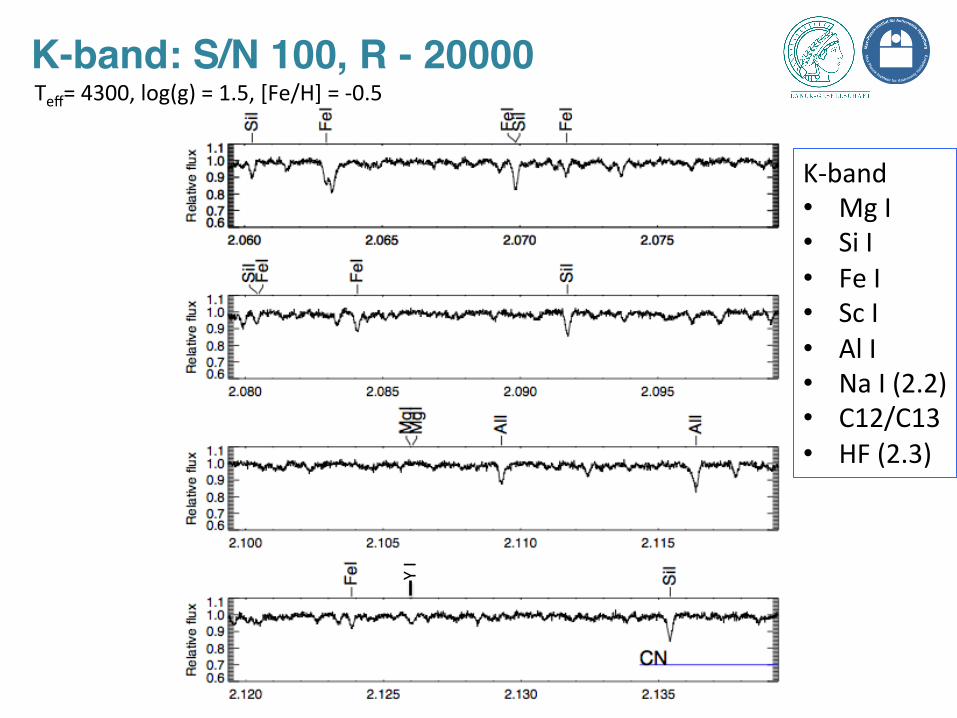
K-band: S/N 100, R - 20000!
K-‐band • Mg I • Si I • Fe I • Sc I • Al I • Na I (2.2) • C12/C13 • HF (2.3)
Y I
Teff= 4300, log(g) = 1.5, [Fe/H] = -‐0.5
Simulations!
1. S/N 100, Res = 20000 2. S/N 30, Res = 6000 3. S/N 10, Res = 3000
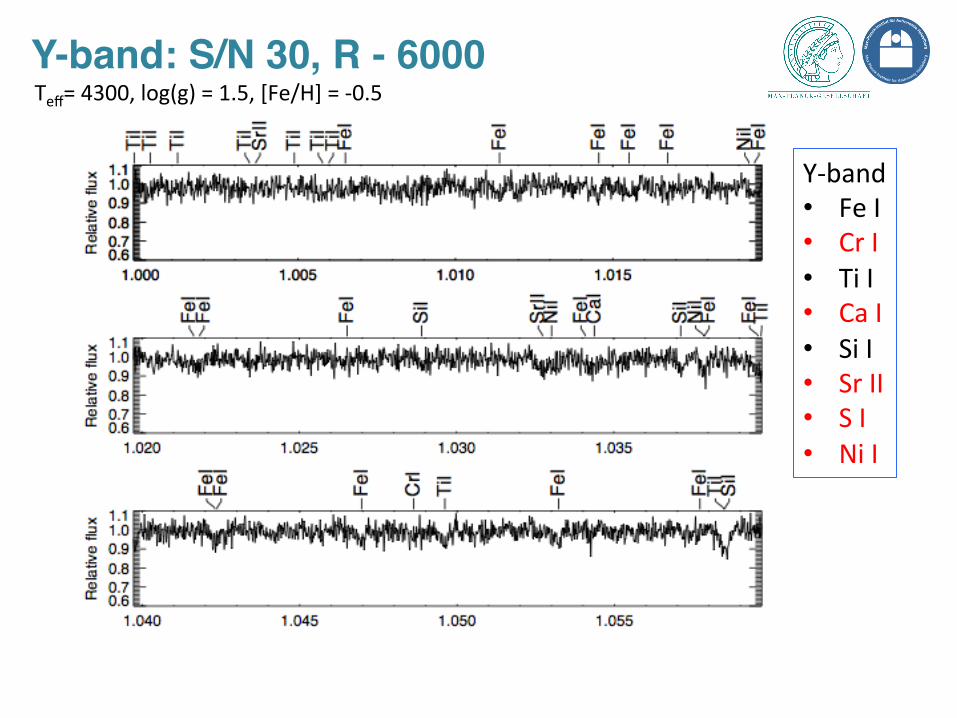
Y-band: S/N 30, R - 6000!
Y-‐band • Fe I • Cr I • Ti I • Ca I • Si I • Sr II • S I • Ni I
Teff= 4300, log(g) = 1.5, [Fe/H] = -‐0.5
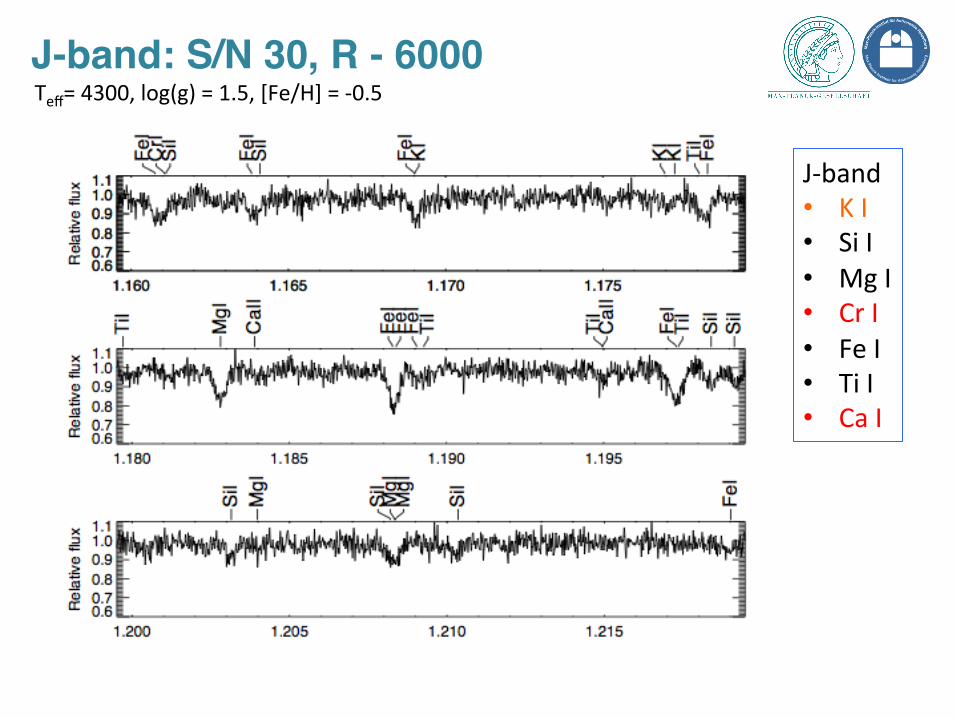
J-band: S/N 30, R - 6000!
J-‐band • K I • Si I • Mg I • Cr I • Fe I • Ti I • Ca I
Teff= 4300, log(g) = 1.5, [Fe/H] = -‐0.5
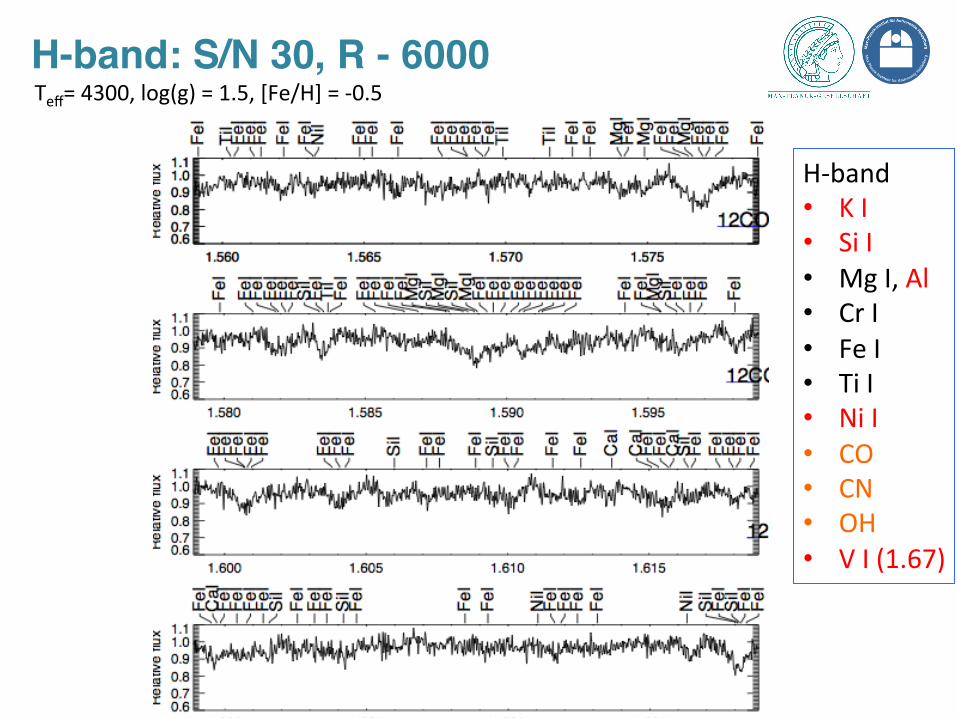
H-band: S/N 30, R - 6000!
H-‐band • K I • Si I • Mg I, Al • Cr I • Fe I • Ti I • Ni I • CO • CN • OH • V I (1.67)
Teff= 4300, log(g) = 1.5, [Fe/H] = -‐0.5
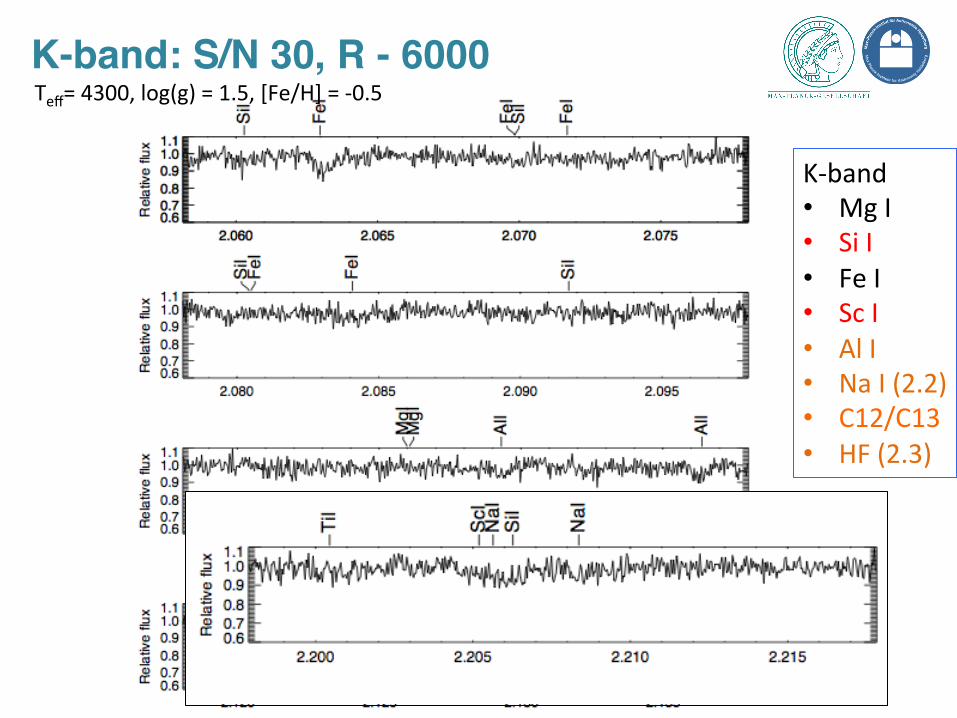
K-band: S/N 30, R - 6000!
K-‐band • Mg I • Si I • Fe I • Sc I • Al I • Na I (2.2) • C12/C13 • HF (2.3)
Y I
Teff= 4300, log(g) = 1.5, [Fe/H] = -‐0.5
Simulations!
1. S/N 100, Res = 20000 2. S/N 30, Res = 6000 3. S/N 10, Res = 3000
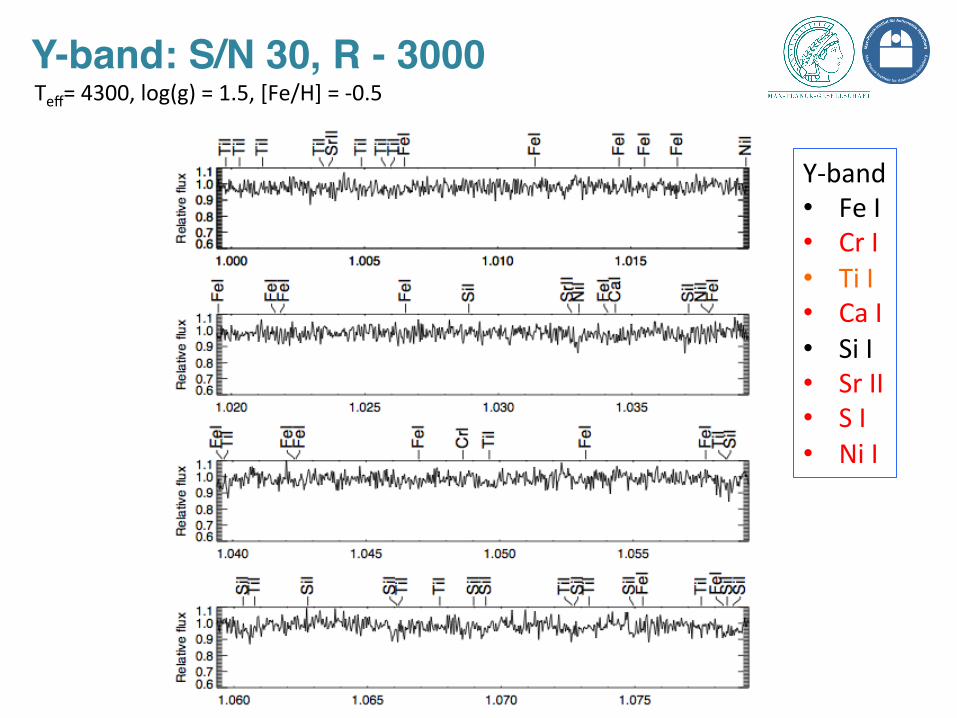
Y-band: S/N 30, R - 3000!
Y-‐band • Fe I • Cr I • Ti I • Ca I • Si I • Sr II • S I • Ni I
Teff= 4300, log(g) = 1.5, [Fe/H] = -‐0.5
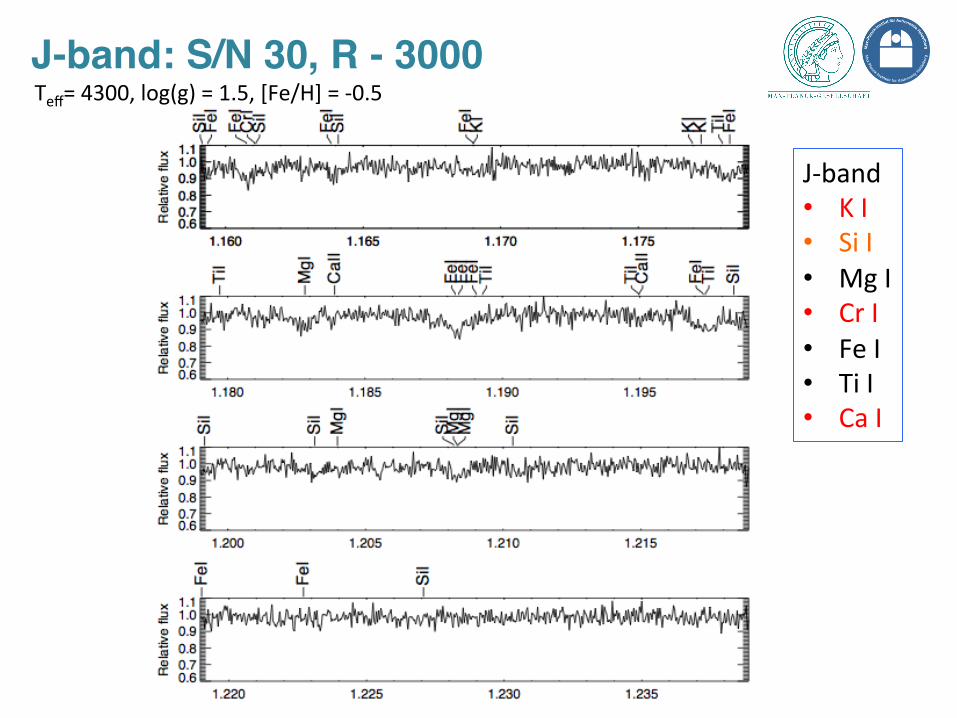
J-band: S/N 30, R - 3000!
J-‐band • K I • Si I • Mg I • Cr I • Fe I • Ti I • Ca I
Teff= 4300, log(g) = 1.5, [Fe/H] = -‐0.5
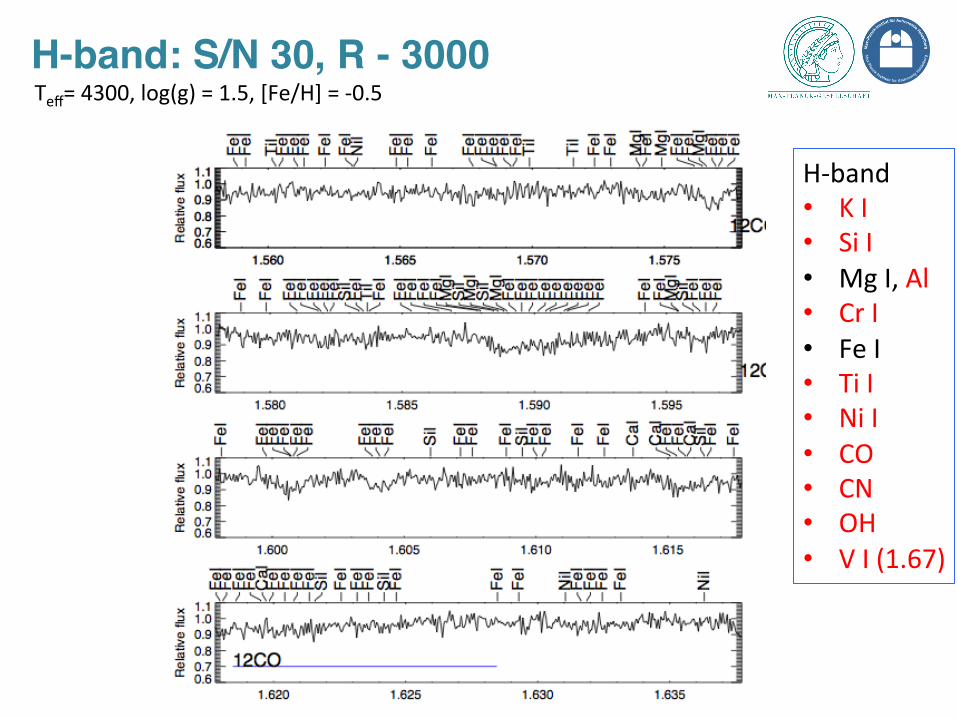
H-band: S/N 30, R - 3000!
H-‐band • K I • Si I • Mg I, Al • Cr I • Fe I • Ti I • Ni I • CO • CN • OH • V I (1.67)
Teff= 4300, log(g) = 1.5, [Fe/H] = -‐0.5
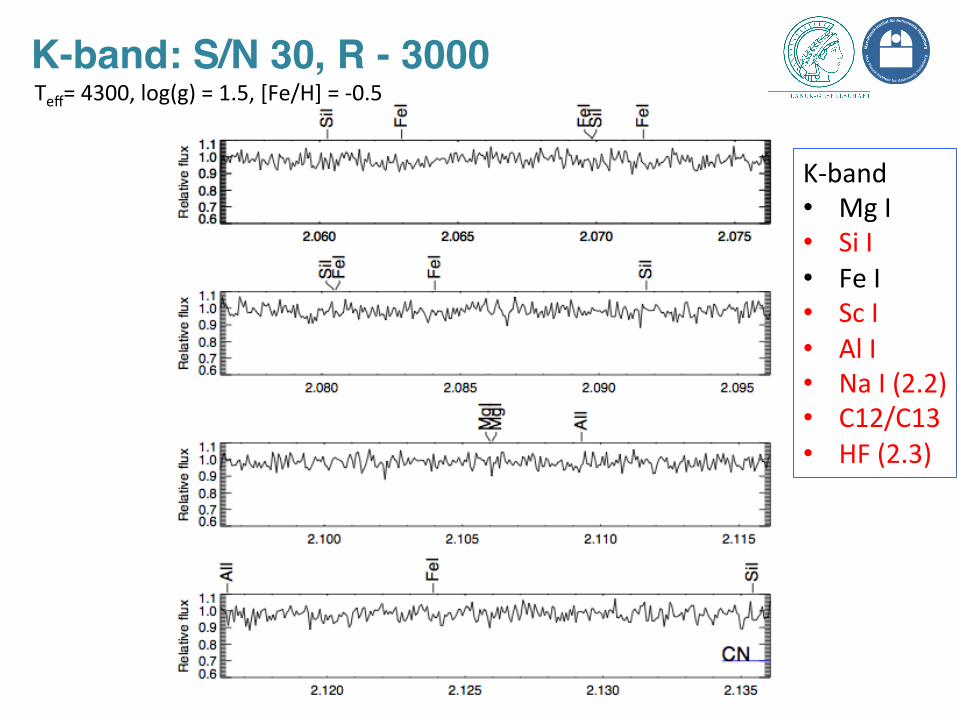
K-band: S/N 30, R - 3000!
K-‐band • Mg I • Si I • Fe I • Sc I • Al I • Na I (2.2) • C12/C13 • HF (2.3)
Teff= 4300, log(g) = 1.5, [Fe/H] = -‐0.5
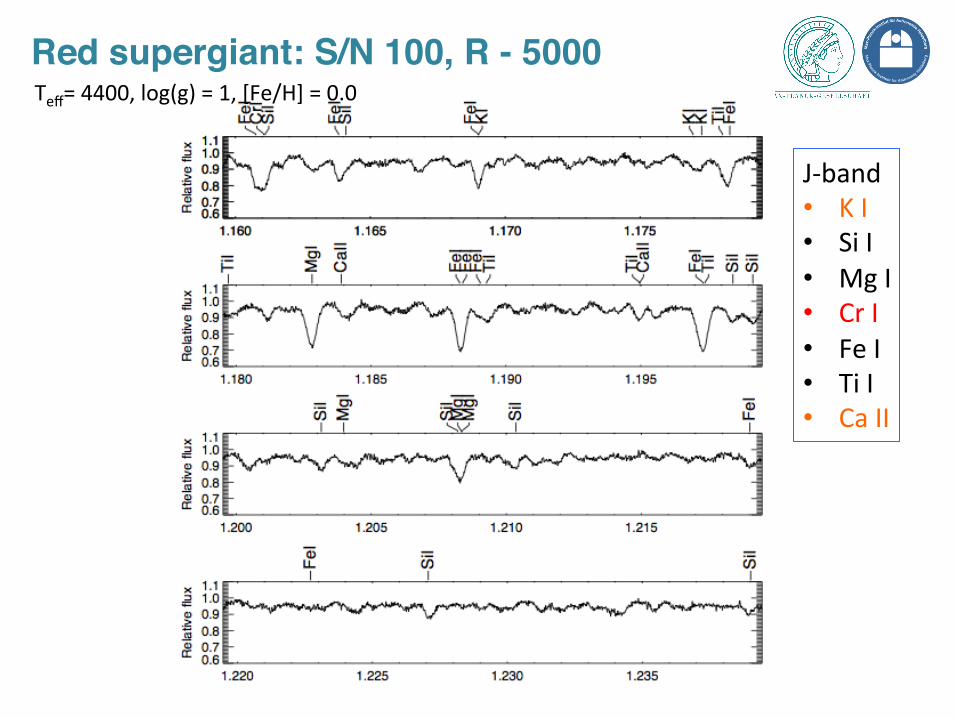
Red supergiant: S/N 100, R - 5000!
J-‐band • K I • Si I • Mg I • Cr I • Fe I • Ti I • Ca II
Teff= 4400, log(g) = 1, [Fe/H] = 0.0
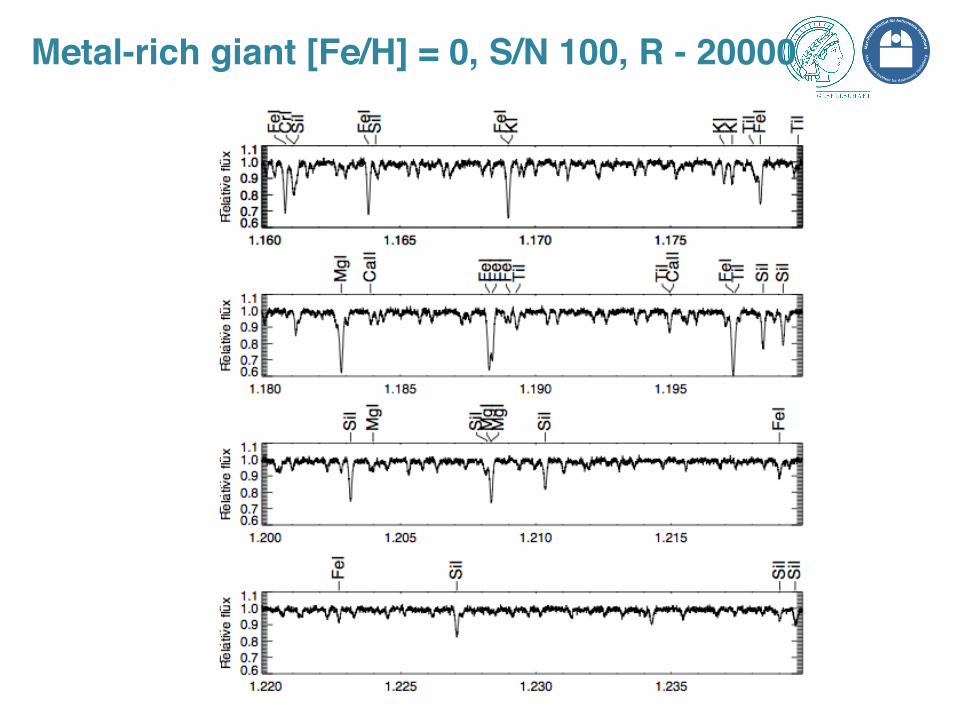
Metal-rich giant [Fe/H] = 0, S/N 100, R - 20000!
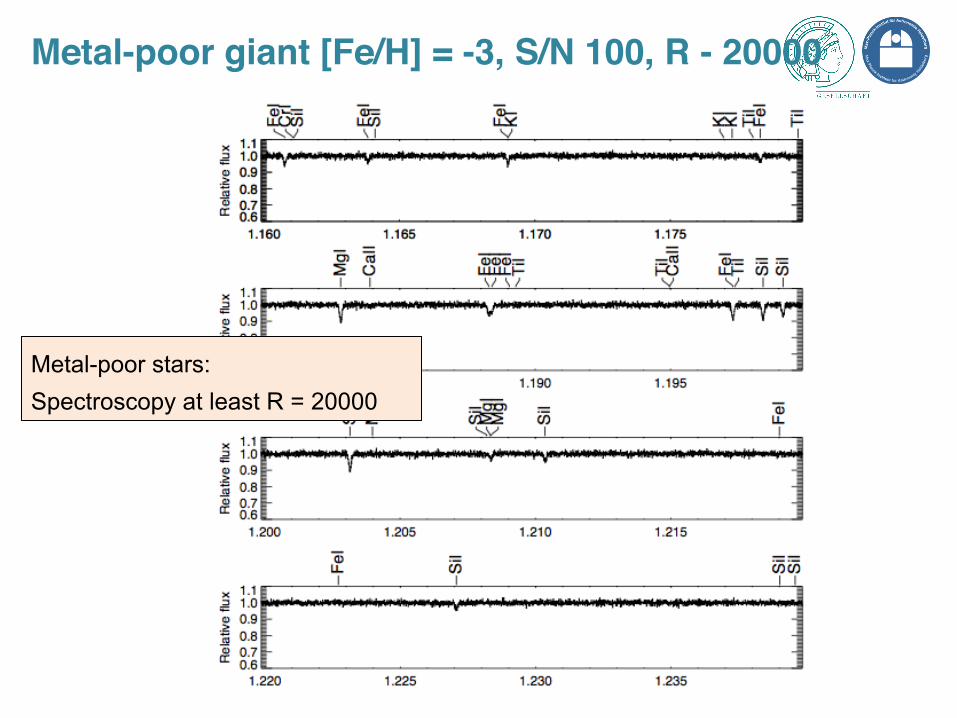
Metal-poor giant [Fe/H] = -3, S/N 100, R - 20000!
Metal-poor stars: Spectroscopy at least R = 20000
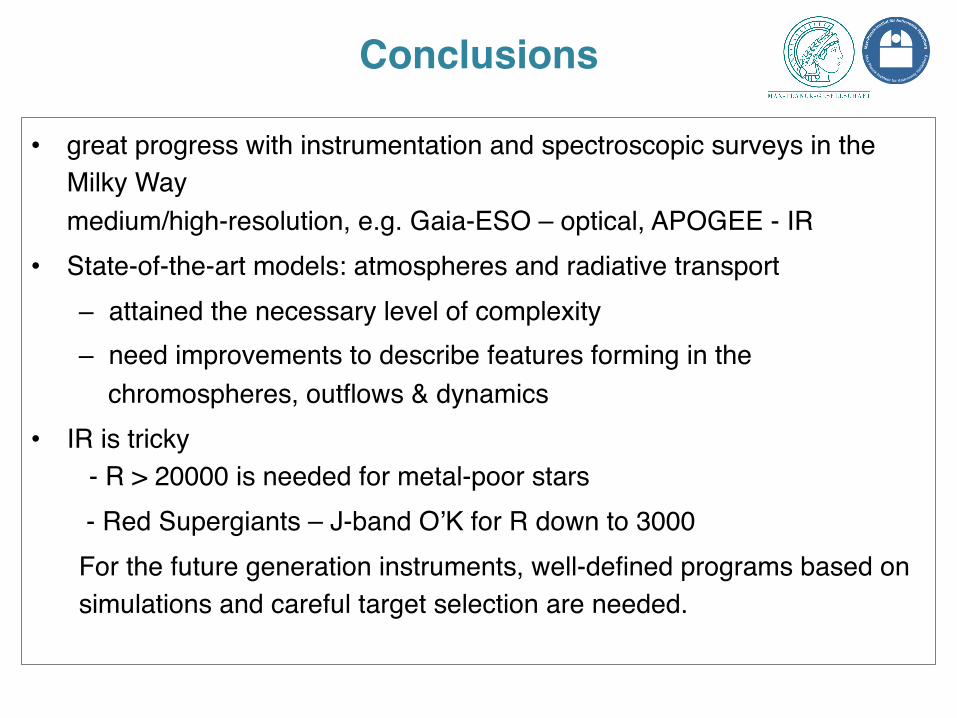
Conclusions!
• great progress with instrumentation and spectroscopic surveys in the Milky Waymedium/high-resolution, e.g. Gaia-ESO – optical, APOGEE - IR"
• State-of-the-art models: atmospheres and radiative transport"– attained the necessary level of complexity"– need improvements to describe features forming in the
chromospheres, outflows & dynamics"• IR is tricky
- R > 20000 is needed for metal-poor stars" - Red Supergiants – J-band O’K for R down to 3000"For the future generation instruments, well-defined programs based on simulations and careful target selection are needed."
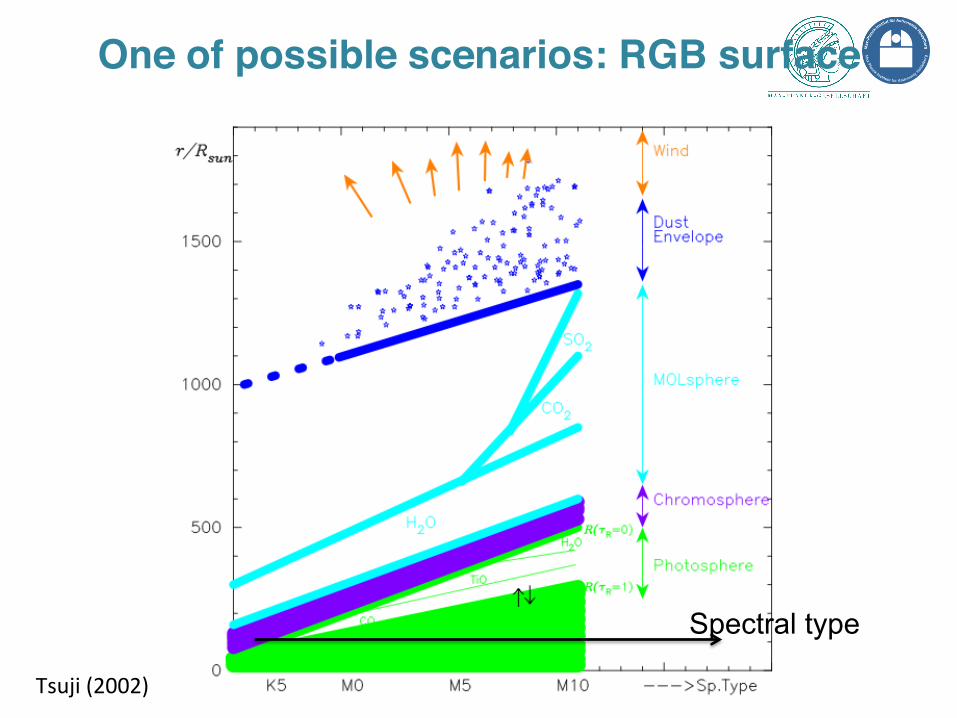
Spectral type
Tsuji (2002)
One of possible scenarios: RGB surface!
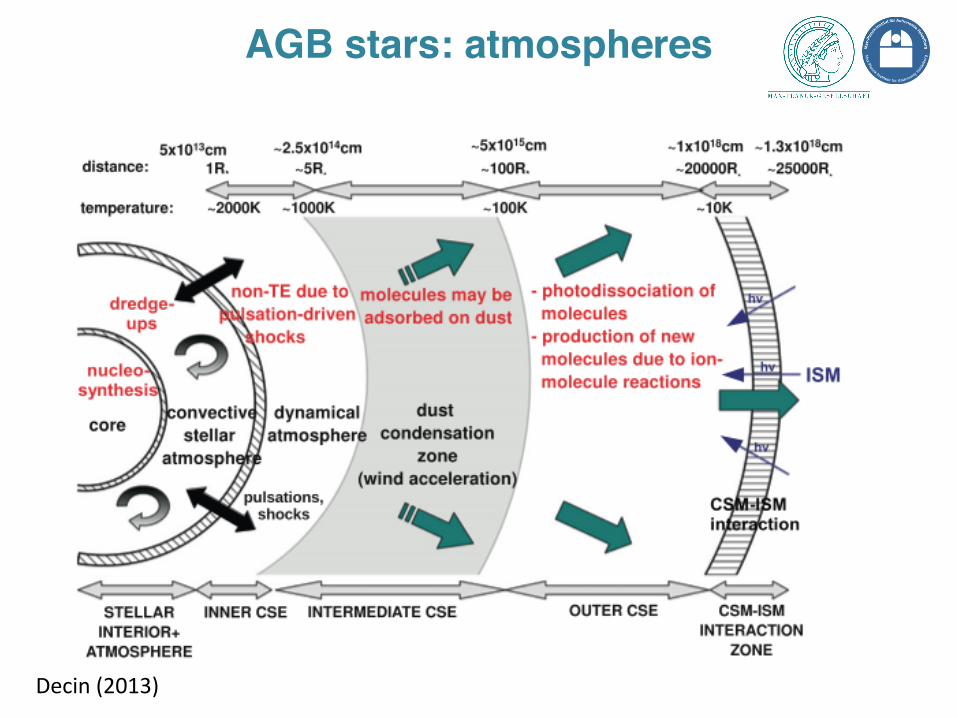
AGB stars: atmospheres!
Decin (2013)
Kervella et al. (2009)
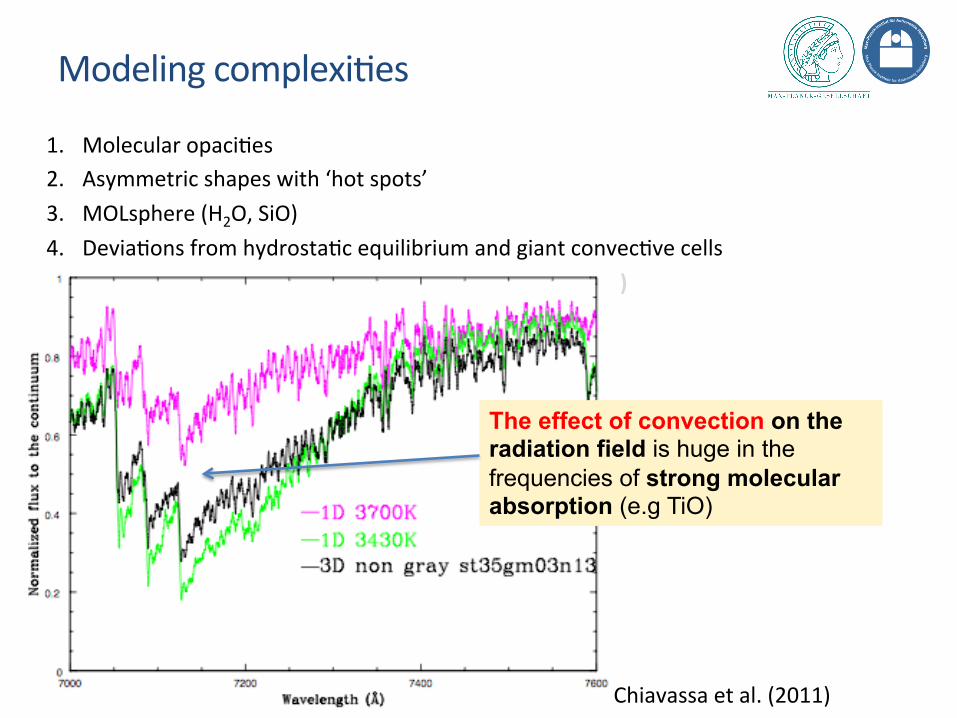
1. Molecular opaciCes 2. Asymmetric shapes with ‘hot spots’ 3. MOLsphere (H2O, SiO) 4. DeviaCons from hydrostaCc equilibrium and giant convecCve cells 5. DeviaCons from local thermodynamic equilibrium (LTE)
Modeling complexiCes
The effect of convection on the radiation field is huge in the frequencies of strong molecular absorption (e.g TiO)
Chiavassa et al. (2011)
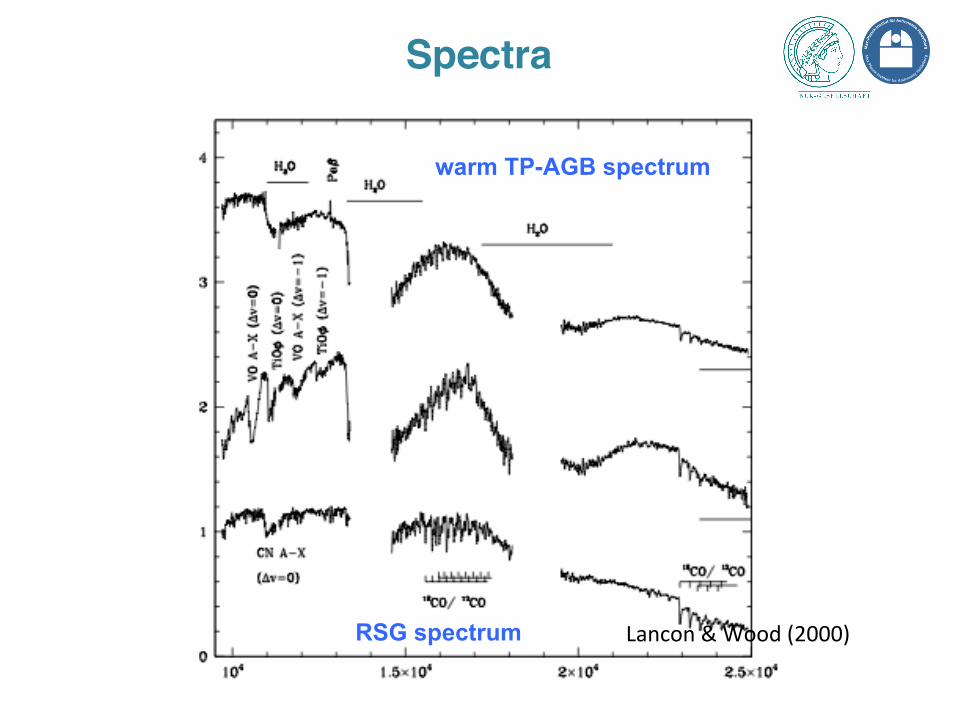
RSG spectrum
warm TP-AGB spectrum
Lancon & Wood (2000)
Spectra!